UNITED STATES
SECURITIES AND EXCHANGE COMMISSION
Washington, D.C. 20549
FORM N-CSR
CERTIFIED SHAREHOLDER REPORT OF REGISTERED
MANAGEMENT INVESTMENT COMPANIES
Investment Company Act file number 811-173
DODGE & COX FUNDS
(Exact name of registrant as specified in charter)
555 California Street, 40th Floor
San Francisco, CA 94104
(Address of principal executive offices) (Zip code)
Thomas M. Mistele, Esq.
555 California Street, 40th Floor
San Francisco, CA 94104
(Name and address of agent for service)
Registrant’s telephone number, including area code: 415-981-1710
Date of fiscal year end: DECEMBER 31, 2012
Date of reporting period: DECEMBER 31, 2012
Form N-CSR is to be used by management investment companies to file reports with the Commission not later than 10 days after the transmission to stockholders of any report that is required to be transmitted to stockholders under Rule 30e-1 under the Investment Company Act of 1940 (17 CFR 270.30e-1). The Commission may use the information provided on Form N-CSR in its regulatory, disclosure review, inspection, and policymaking roles.
A registrant is required to disclose the information specified by Form N-CSR, and the Commission will make this information public. A registrant is not required to respond to the collection of information contained in Form N-CSR unless the Form displays a currently valid Office of Management and Budget (“OMB”) control number. Please direct comments concerning the accuracy of the information collection burden estimate and any suggestions for reducing the burden to Secretary, Securities and Exchange Commission, 450 Fifth Street, NW, Washington, DC 20549-0609. The OMB has reviewed this collection of information under the clearance requirements of 44 U.S.C. ss. 3507.
ITEM 1. REPORTS TO STOCKHOLDERS.
The following are the December 31, 2012 annual reports for the Dodge & Cox Funds, a Delaware statutory trust, consisting of five series: Dodge & Cox Stock Fund, Dodge & Cox Global Stock Fund, Dodge & Cox International Stock Fund, Dodge & Cox Balanced Fund and Dodge & Cox Income Fund. The reports of each series were transmitted to their respective shareholders on February 21, 2013.
| | | | |
 | | | |  |
www.dodgeandcox.com
For Fund literature, transactions, and account
information, please visit the Funds’ website.
or write or call:
DODGE & COX FUNDS
c/o Boston Financial Data Services
P.O. Box 8422
Boston, Massachusetts 02266-8422
(800) 621-3979
INVESTMENT MANAGER
Dodge & Cox
555 California Street, 40th Floor
San Francisco, California 94104
(415) 981-1710
This report is submitted for the general information of the shareholders of the Fund. The report is not authorized for distribution to prospective investors in the Fund unless it is accompanied by a current prospectus.
This report reflects our views, opinions, and portfolio holdings as of December 31, 2012, the end of the reporting period. Any such views are subject to change at any time based upon market or other conditions and Dodge & Cox disclaims any responsibility to update such views. These views may not be relied on as investment advice and, because investment decisions for a Dodge & Cox Fund are based on numerous factors, may not be relied on as an indication of trading intent on behalf of any Dodge & Cox Fund.
12/12 SF AR  Printed on recycled paper
Annual Report
December 31, 2012
Stock Fund
ESTABLISHED 1965
TICKER: DODGX
TO OUR SHAREHOLDERS
The Dodge & Cox Stock Fund had a total return of 11.1% for the six months ending December 31, 2012, compared to a return of 5.9% for the S&P 500. For 2012, the Fund had a total return of 22.0%, compared to 16.0% for the S&P 500. At year end, the Fund had net assets of $39.8 billion with a cash position of 1.0%.
MARKET COMMENTARY
During 2012, global equity markets appreciated significantly. The year was marked by considerable volatility as investors reacted to uncertainty about broad macroeconomic and political issues, including the U.S. presidential election and “fiscal cliff,” ongoing challenges in the Eurozone, slowing economic growth in China, and social unrest in the Middle East and Africa. And yet, it was an excellent year for U.S. equities as all sectors of the S&P 500 registered positive returns, and the S&P 500 never dipped into negative territory. Contributing factors included low interest rates, strong corporate balance sheets, reasonable earnings growth, and rising dividends. The U.S. economy, despite its challenges, is also relatively healthy compared to many other developed countries around the world. Residential housing is no longer a drag on growth, auto sales are strong, and consumer confidence reached a multi-year high in November. With current valuations (14 times 2012 earnings for the S&P 500)(a) still reasonable, we remain optimistic about the long-term outlook for potential equity returns.
INVESTMENT STRATEGY
As investors on your behalf, we are constantly weighing what we are buying (company fundamentals) with what we are paying (valuation) for each investment opportunity. A great company can be a poor investment if we pay too much. In addition, every investment has a range of outcomes, and it is impossible to know what will happen in the future. As a result, we strive to purchase securities that are inexpensive enough to allow for what could potentially go wrong, and to avoid paying too much for what could go right.
A low valuation often signals that investors are concerned about the company’s fundamentals. We believe
bottom-up research is the best way to identify whether a company’s long-term outlook is appropriately incorporated into its stock price. Through meetings with management, competitors, customers, and suppliers, our global industry analysts build an in-depth understanding of individual companies. In addition, our analysts work closely with our fixed income team to evaluate potential downside risks and each company’s level of access to capital; this collaboration provides an advantage, especially when a company is under stress. Furthermore, we assess corporate governance to understand how our interests align with those of key stakeholders.
Our global analysts advocate equity investment ideas within a team decision-making process. This team-based approach broadens our knowledge base and tests our conviction. Our collective judgment and experience, which have been built over decades, are key to constructing the portfolio. Recognizing that it is often impossible to time the bottom (or top) of the market, we are patient and often move incrementally as we revisit and retest our thinking.
We think it is important to have a long-term investment horizon because short-term market movements can be driven by unpredictable investor sentiment, whereas the true value of a company tends to be reflected over time. Using a three- to five-year horizon, we look to identify companies that have attractive valuations and potential catalysts for their fundamental value to be recognized by investors. We think like long-term owners of a business and, hence, portfolio turnover in the Fund has been low relative to most active mutual fund managers (the Fund’s average holding period has been seven years).
Finding Value in the Technology Sector
As a result of our intensive fundamental research on individual companies, one major theme that has emerged is the Fund’s substantial investment in Information Technology (Tech) companies. Our in-depth research and selection of diverse companies in this sector has led to a Tech weighting in the Fund of 21.2% at year end, compared to 19.1% for the S&P 500. These 21 holdings represent an array of software, hardware, internet, and
PAGE 1 § DODGE & COX STOCK FUND
services companies, all trading at what we believe are attractive valuations in relation to their earnings and cash flow potential over the next three to five years. The Tech sector of the S&P 500 appears to be valued near a twenty-year low, especially in the software area, relative to free cash flow.
The majority of the Fund’s Tech holdings are industry leaders that generate healthy free cash flows, which they are using to repurchase shares, pay dividends, repay debt, and/or pursue mergers and acquisitions. For example,(b) more mature companies such as Hewlett-Packard (HP) and Xerox have reduced their cost structures and diversified into technology services in recent years through acquisitions (HP bought Electronic Data Systems and Xerox acquired Affiliated Computer Services). While shares of HP performed poorly last year, the company’s significantly depressed valuation appears to reflect overly pessimistic expectations about HP’s growth prospects and profits. In spite of the headlines regarding two large write-offs, HP was solidly profitable on a free cash flow basis in 2012. Xerox and HP are valued at only six and four times forward earnings, respectively.
In contrast to mature companies like HP and Xerox, the Fund also holds eBay and Google, which are profitable, growing rapidly, and investing in further expansion. This dichotomy between “value” and “growth” companies highlights our flexibility; we are willing to look beyond depressed valuations and consider companies with above-average growth potential that are trading at reasonable valuations. Google, a 1.0% holding, was the largest new purchase in the Fund during 2012. Its dominant competitive position in internet search advertising is complemented by a push into display advertising (e.g., on YouTube and Google Maps) and other web-based businesses. Although it does not sell at a depressed level relative to the overall market, we believe Google’s valuation at 16 times forward earnings does not reflect its strong growth potential.
Another theme within Tech for the Fund is an overweight position in Software. We find that enterprise software has high customer switching costs and high recurring revenue, which tend to mitigate risk over our three- to five-year investment horizon. The largest Fund holding in this area is Microsoft (a 2.6% position). The
stock lagged in 2012, but we remain impressed with the durability of the company’s Windows and Office suite of products as well as the growth coming from its Server and Tools division. Furthermore, Microsoft has a huge installed base of customers and launched an enhanced version of its Windows operating system last year. Other software investments highlight the diverse nature of the Fund’s holdings: Symantec (security), Adobe Systems (creative publishing and digital marketing), BMC Software (mainframe and distributed computing tools), and Synopsys and Cadence Design Systems (both electronic design automation for semiconductors). A majority of these companies produce annual free cash flow equal to or greater than 8% of their equity market capitalizations. We believe that this strong cash generation can provide downside protection for shareholders. While all of the Fund’s Tech holdings face the risk of technological obsolescence, each company is investing in opportunities for long-term growth to maintain its competitive position.
While Tech is an important area in the Fund, the portfolio remains well-diversified. Other areas of emphasis include Financials (e.g., Capital One and Wells Fargo), Pharmaceuticals (e.g., Merck and Sanofi), and Media (e.g., Comcast and Time Warner).
IN CLOSING
Despite steady investor withdrawals from U.S. equity mutual funds and inflows into bond funds in recent years, we remain optimistic about the long-term return potential for equities. Even after a strong year for stocks in 2012, the S&P 500 was trading at 13 times forward earnings, which was still modestly below its long-term average multiple. Technological innovation continues to drive global demand for all kinds of new products and services. Emerging markets continue to grow faster than developed markets, creating millions of new middle class and affluent consumers. And the U.S. economy continues to recover from the 2008-2009 global financial crisis and ensuing recession. Unemployment is stubbornly high, but declining, and the private sector workforce is growing. Banks are in much better financial condition, providing a foundation for more lending to consumers and businesses. Interest rates are near historic lows and inflation is modest.
DODGE & COX STOCK FUND §PAGE 2
We believe there is a good chance that equity returns will be higher than bond returns in the next five years. In fact, the dividend yield alone for the S&P 500 at year end (2.3%) exceeded the yield on the Barclays U.S. Aggregate Bond Index (1.7%). We are also enthusiastic about the long-term prospects for the Fund’s holdings, due to the fact that they trade at a discount (11 times forward earnings) to the S&P 500 and have strong earnings growth potential.
Thank you for your continued confidence in our firm. As always, we welcome your comments and questions.
For the Board of Trustees,
| | |
 | |  |
Kenneth E. Olivier, Chairman and President | | Charles F. Pohl, Senior Vice President |
January 29, 2013
| (a) | | Unless otherwise specified, all weightings and characteristics are as of December 31, 2012. |
| (b) | | The use of specific examples does not imply that they are more attractive investments than the Fund’s other holdings. |
ANNUAL PERFORMANCE REVIEW
Key Contributors to Relative Results
| | § | | The Financials sector was the best performing of the market. Strong relative results for the Fund’s holdings in this sector (up 40% compared to up 29% for the S&P 500 sector) and an average overweight position (21% versus 14%) helped results. Notable contributors included Bank of America (up 110%), Goldman Sachs (up 43%), and Capital One (up 38%). | |
| | § | | Strong relative results for the Fund’s holdings in the Consumer Discretionary sector (up 38% compared to up 24% for the S&P 500 sector) and an average overweight position (16% versus 11%) contributed to results. Comcast (up 61%), News Corp. (up 44%), and Time Warner (up 36%) were especially strong. | |
| | § | | Sprint Nextel (up 142%) was a standout performer in the Telecommunication Services sector. | |
| | § | | Additional contributors included eBay (up 68%) and Sanofi (up 35%). | |
Key Detractors from Relative Results
| | § | | The Fund’s holdings in the Information Technology sector (up 8% compared to up 15% for the S&P 500 sector) hurt relative results. Hewlett-Packard (down 43%) was the biggest detractor. Nokia (down 13%) and Xerox (down 12%) were also weak. | |
| | § | | The Fund’s holdings in the Energy sector (down 6% compared to up 5% for the S&P 500 sector) hindered results. Occidental Petroleum (down 16%) and Baker Hughes (down 15%) declined. | |
| | § | | Additional detractors included J.C. Penney (down 42% from date of purchase) and Sony (down 37%). | |
PAGE 3 § DODGE & COX STOCK FUND
KEY CHARACTERISTICS OF DODGE & COX
Independent Organization
Dodge & Cox is one of the largest privately owned investment managers in the world. We remain committed to independence, with a goal of providing the highest quality investment management service to our existing clients.
Over 80 Years of Investment Experience
Dodge & Cox was founded in 1930. We have a stable and well-qualified team of investment professionals, most of whom have spent their entire careers at Dodge & Cox.
Experienced Investment Team
The Investment Policy Committee, which is the decision-making body for the Stock Fund, is a nine-member committee with an average tenure at Dodge & Cox of 27 years.
One Business with a Single Research Office
Dodge & Cox manages domestic, international, and global equity, fixed income, and balanced investments, operating from one office in San Francisco.
Consistent Investment Approach
Our team decision-making process involves thorough, bottom-up fundamental analysis of each investment.
Long-Term Focus and Low Expenses
We invest with a three- to five-year investment horizon, which has historically resulted in low turnover relative to our peers. We manage Funds that maintain low expense ratios.
DODGE & COX STOCK FUND §PAGE 4
GROWTH OF $10,000 OVER 10 YEARS
FOR AN INVESTMENT MADE ON DECEMBER 31, 2002
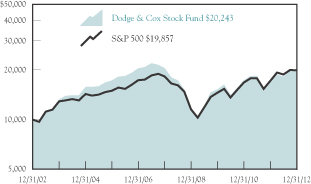
AVERAGE ANNUAL TOTAL RETURN
FOR PERIODS ENDED DECEMBER 31, 2012
| | | | | | | | | | | | | | | | |
| | | 1 Year | | | 5 Years | | | 10 Years | | | 20 Years | |
Dodge & Cox Stock Fund | | | 22.01 | % | | | -0.23 | % | | | 7.31 | % | | | 10.67 | % |
S&P 500 | | | 15.99 | | | | 1.66 | | | | 7.10 | | | | 8.22 | |
Returns represent past performance and do not guarantee future results. Investment return and share price will fluctuate with market conditions, and investors may have
a gain or loss when shares are sold. Fund performance changes over time and currently may be significantly lower than stated. Performance is updated and published monthly. Visit the Fund’s website at www.dodgeandcox.com or call 800-621-3979 for current performance figures.
The Fund’s total returns include the reinvestment of dividend and capital gain distributions, but have not been adjusted for any income taxes payable by shareholders on these distributions or on Fund share redemptions. Index returns include dividends but, unlike Fund returns, do not reflect fees or expenses. The S&P 500 Index is a market capitalization-weighted index of 500 large-capitalization stocks commonly used to represent the U.S. equity market.
S&P 500® is a trademark of The McGraw-Hill Companies, Inc.
Risks: The Fund is subject to stock market risk, meaning stocks in the Fund may decline in value for extended periods due to the financial prospects of individual companies, or due to general market and economic conditions. Please read the prospectus and summary prospectus for specific details regarding the Fund’s risk profile.
FUND EXPENSE EXAMPLE
As a Fund shareholder, you incur ongoing Fund costs, including management fees and other Fund expenses. All mutual funds have ongoing costs, sometimes referred to as operating expenses. The following example shows ongoing costs of investing in the Fund and can help you understand these costs and compare them with those of other mutual funds. The example assumes a $1,000 investment held for the six months indicated.
ACTUAL EXPENSES
The first line of the table below provides information about actual account values and expenses based on the Fund’s actual returns. You may use the information in this line, together with your account balance, to estimate the expenses that you paid over the period. Simply divide your account value by $1,000 (for example, an $8,600 account value divided by $1,000 = 8.6), then multiply the result by the number in the first line under the heading “Expenses Paid During Period” to estimate the expenses you paid on your account during this period.
HYPOTHETICAL EXAMPLE FOR COMPARISON WITH OTHER MUTUAL FUNDS
Information on the second line of the table can help you compare ongoing costs of investing in the Fund with those of other mutual funds. This information may not be used to estimate the actual ending account balance or expenses you paid during the period. The hypothetical “Ending Account Value” is based on the actual expense ratio of the Fund and an assumed 5% annual rate of return before expenses (not the Fund’s actual return). The amount under the heading “Expense Paid During the Period” shows the hypothetical expenses your account would have incurred under this scenario. You can compare this figure with the 5% hypothetical examples that appear in shareholder reports of other mutual funds.
| | | | | | | | | | | | |
Six Months Ended
December 31, 2012 | | Beginning Account Value
7/1/2012 | | | Ending Account Value
12/31/2012 | | | Expenses Paid
During Period* | |
Based on Actual Fund Return | | $ | 1,000.00 | | | $ | 1,111.00 | | | $ | 2.75 | |
Based on Hypothetical 5% Yearly Return | | | 1,000.00 | | | | 1,022.53 | | | | 2.63 | |
| * | Expenses are equal to the Fund’s annualized expense ratio of 0.52%, multiplied by the average account value over the period, multiplied by 184/366 (to reflect the one-half year period). |
The expenses shown in the table highlight ongoing costs only and do not reflect any transactional fees or account maintenance fees. While other mutual funds may charge such fees, please note that the Fund does not charge transaction fees (e.g., redemption fees, sales loads) or universal account maintenance fees (e.g., small account fees).
PAGE 5 § DODGE & COX STOCK FUND
| | | | |
| FUND INFORMATION | | | December 31, 2012 | |
| | | | |
| GENERAL INFORMATION | | | |
Net Asset Value Per Share | | | $121.90 | |
Total Net Assets (billions) | | | $39.8 | |
Expense Ratio | | | 0.52% | |
Portfolio Turnover Rate | | | 11% | |
30-Day SEC Yield(a) | | | 1.54% | |
Fund Inception | | | 1965 | |
No sales charges or distribution fees | | | | |
Investment Manager: Dodge & Cox, San Francisco. Managed by the Investment Policy Committee, whose nine members’ average tenure at Dodge & Cox is 27 years.
| | | | | | | | |
| PORTFOLIO CHARACTERISTICS | | Fund | | | S&P 500 | |
Number of Stocks | | | 75 | | | | 500 | |
Median Market Capitalization (billions) | | | $18 | | | | $13 | |
Weighted Average Market
Capitalization (billions) | | | $80 | | | | $107 | |
Price-to-Earnings Ratio(b) | | | 11.0x | | | | 13.3x | |
Foreign Stocks not in the S&P 500(c) | | | 16.4% | | | | 0.0% | |
| | | | |
| TEN LARGEST HOLDINGS (%)(d) | | Fund | |
Capital One Financial Corp. | | | 4.3 | |
Comcast Corp. | | | 3.9 | |
Wells Fargo & Co. | | | 3.8 | |
Sanofi (France) | | | 3.3 | |
Merck & Co., Inc. | | | 3.1 | |
Novartis AG (Switzerland) | | | 3.0 | |
Time Warner, Inc. | | | 3.0 | |
General Electric Co. | | | 2.9 | |
GlaxoSmithKline PLC (United Kingdom) | | | 2.8 | |
Pfizer, Inc. | | | 2.7 | |
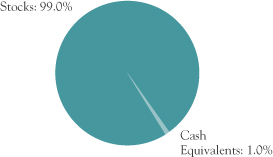
ASSET ALLOCATION
| | | | | | | | |
| SECTOR DIVERSIFICATION (%) | | Fund | | | S&P 500 | |
Financials | | | 22.0 | | | | 15.6 | |
Information Technology | | | 21.2 | | | | 19.1 | |
Health Care | | | 18.6 | | | | 12.0 | |
Consumer Discretionary | | | 15.3 | | | | 11.6 | |
Industrials | | | 6.7 | | | | 10.1 | |
Energy | | | 6.5 | | | | 11.0 | |
Telecommunication Services | | | 3.4 | | | | 3.1 | |
Materials | | | 3.4 | | | | 3.5 | |
Consumer Staples | | | 1.9 | | | | 10.6 | |
Utilities | | | 0.0 | | | | 3.4 | |
| (a) | SEC Yield is an annualization of the Fund’s total net investment income per share for the 30-day period ended on the last day of the month. |
| (b) | Price-to-earnings (P/E) ratios are calculated using 12-month forward earnings estimates from third-party sources. |
| (c) | Foreign stocks are U.S. dollar denominated. |
| (d) | The Fund’s portfolio holdings are subject to change without notice. The mention of specific securities is not a recommendation to buy, sell, or hold any particular security and is not indicative of Dodge & Cox’s current or future trading activity. |
DODGE & COX STOCK FUND §PAGE 6
| | | | |
| PORTFOLIO OF INVESTMENTS | | | December 31, 2012 | |
| | | | | | | | |
| COMMON STOCKS: 99.0% | | | | | | |
| | |
| | | SHARES | | | VALUE | |
| CONSUMER DISCRETIONARY: 15.3% | | | | | |
CONSUMER DURABLES & APPAREL: 0.8% | | | | | |
NVR, Inc.(a) | | | 88,200 | | | $ | 81,144,000 | |
Panasonic Corp. ADR(b) (Japan) | | | 25,925,097 | | | | 157,365,339 | |
Sony Corp. ADR(b) (Japan) | | | 7,474,942 | | | | 83,719,350 | |
| | | | | | | | |
| | | | | | | 322,228,689 | |
MEDIA: 12.7% | | | | | | | | |
Comcast Corp., Class A | | | 41,749,097 | | | | 1,560,581,246 | |
DISH Network Corp., Class A(a) | | | 7,123,253 | | | | 259,286,409 | |
Liberty Global, Inc., Series A(a) | | | 738,710 | | | | 46,531,343 | |
Liberty Global, Inc., Series C(a) | | | 964,153 | | | | 56,643,989 | |
McGraw-Hill Companies, Inc. | | | 4,097,400 | | | | 224,004,858 | |
News Corp., Class A | | | 36,254,326 | | | | 925,935,486 | |
Time Warner Cable, Inc. | | | 8,307,310 | | | | 807,387,459 | |
Time Warner, Inc. | | | 24,732,732 | | | | 1,182,966,571 | |
| | | | | | | | |
| | | | | | | 5,063,337,361 | |
RETAILING: 1.8% | | | | | | | | |
CarMax, Inc.(a) | | | 4,960,350 | | | | 186,211,539 | |
J. C. Penney Co., Inc.(a),(c) | | | 10,933,700 | | | | 215,503,227 | |
Liberty Interactive, Series A(a) | | | 14,690,075 | | | | 289,100,676 | |
| | | | | | | | |
| | | | | | | 690,815,442 | |
| | | | | | | | |
| | | | | | | 6,076,381,492 | |
| CONSUMER STAPLES: 1.9% | | | | | | | | |
FOOD & STAPLES RETAILING: 1.4% | | | | | |
Wal-Mart Stores, Inc. | | | 7,958,650 | | | | 543,018,690 | |
| |
FOOD, BEVERAGE & TOBACCO: 0.5% | | | | | |
Unilever PLC ADR(b) (United Kingdom) | | | 5,623,600 | | | | 217,745,792 | |
| | | | | | | | |
| | | | | | | 760,764,482 | |
| ENERGY: 6.5% | | | | | | | | |
Baker Hughes, Inc. | | | 14,220,450 | | | | 580,763,178 | |
Chevron Corp. | | | 3,444,280 | | | | 372,464,439 | |
Occidental Petroleum Corp. | | | 8,883,000 | | | | 680,526,630 | |
Schlumberger, Ltd.(b) (Curacao/United States) | | | 13,601,845 | | | | 942,471,840 | |
| | | | | | | | |
| | | | | | | 2,576,226,087 | |
| FINANCIALS: 22.0% | | | | | | | | |
BANKS: 6.1% | | | | | | | | |
BB&T Corp. | | | 11,454,144 | | | | 333,430,132 | |
HSBC Holdings PLC ADR(b) (United Kingdom) | | | 5,310,329 | | | | 281,819,160 | |
SunTrust Banks, Inc. | | | 10,942,233 | | | | 310,212,306 | |
Wells Fargo & Co. | | | 43,934,841 | | | | 1,501,692,865 | |
| | | | | | | | |
| | | | | | | 2,427,154,463 | |
DIVERSIFIED FINANCIALS: 13.7% | | | | | | | | |
Bank of America Corp. | | | 76,113,300 | | | | 882,914,280 | |
Bank of New York Mellon Corp. | | | 34,644,224 | | | | 890,356,557 | |
Capital One Financial Corp.(c) | | | 29,207,211 | | | | 1,691,973,733 | |
| | | | | | | | |
| | |
| | | SHARES | | | VALUE | |
Charles Schwab Corp. | | | 53,202,700 | | | $ | 763,990,772 | |
Credit Suisse Group AG ADR(b) (Switzerland) | | | 2,347,206 | | | | 57,647,379 | |
Goldman Sachs Group, Inc. | | | 7,042,600 | | | | 898,354,056 | |
JPMorgan Chase & Co. | | | 5,766,200 | | | | 253,539,814 | |
Legg Mason, Inc. | | | 1,238,701 | | | | 31,859,390 | |
| | | | | | | | |
| | | | | | | 5,470,635,981 | |
INSURANCE: 2.2% | | | | | | | | |
AEGON NV(b) (Netherlands) | | | 63,685,517 | | | | 410,134,730 | |
Genworth Financial, Inc., Class A(a) | | | 21,875,157 | | | | 164,282,429 | |
Metlife, Inc. | | | 9,461,600 | | | | 311,665,104 | |
| | | | | | | | |
| | | | | | | 886,082,263 | |
| | | | | | | | |
| | | | | | | 8,783,872,707 | |
| HEALTH CARE: 18.6% | | | | | | | | |
HEALTH CARE EQUIPMENT & SERVICES: 1.4% | |
Boston Scientific Corp.(a) | | | 56,840,400 | | | | 325,695,492 | |
Medtronic, Inc. | | | 5,571,500 | | | | 228,542,930 | |
| | | | | | | | |
| | | | | | | 554,238,422 | |
PHARMACEUTICALS, BIOTECHNOLOGY & LIFE SCIENCES: 17.2% | | | | | |
GlaxoSmithKline PLC ADR(b) (United Kingdom) | | | 25,671,200 | | | | 1,115,927,064 | |
Merck & Co., Inc. | | | 30,195,800 | | | | 1,236,216,052 | |
Novartis AG ADR(b) (Switzerland) | | | 18,974,700 | | | | 1,201,098,510 | |
Pfizer, Inc. | | | 42,220,364 | | | | 1,058,886,729 | |
Roche Holding AG ADR(b) (Switzerland) | | | 18,491,600 | | | | 933,825,800 | |
Sanofi ADR(b) (France) | | | 28,003,029 | | | | 1,326,783,514 | |
| | | | | | | | |
| | | | | | | 6,872,737,669 | |
| | | | | | | | |
| | | | | | | 7,426,976,091 | |
| INDUSTRIALS: 6.7% | | | | | | | | |
CAPITAL GOODS: 3.6% | | | | | | | | |
General Electric Co. | | | 55,466,775 | | | | 1,164,247,607 | |
Koninklijke Philips Electronics NV(b) (Netherlands) | | | 10,049,121 | | | | 266,703,672 | |
| | | | | | | | |
| | | | | | | 1,430,951,279 | |
COMMERCIAL & PROFESSIONAL SERVICES: 0.7% | |
ADT Corp. | | | 2,545,137 | | | | 118,323,419 | |
Pitney Bowes, Inc. | | | 1,286,630 | | | | 13,689,743 | |
Tyco International, Ltd.(b) (Switzerland) | | | 5,090,275 | | | | 148,890,544 | |
| | | | | | | | |
| | | | | | | 280,903,706 | |
TRANSPORTATION: 2.4% | | | | | | | | |
FedEx Corp. | | | 10,340,099 | | | | 948,393,880 | |
| | | | | | | | |
| | | | | | | 2,660,248,865 | |
| | |
| PAGE 7 § DODGE & COX STOCK FUND | | See accompanying Notes to Financial Statements |
| | | | |
| PORTFOLIO OF INVESTMENTS | | | December 31, 2012 | |
| | | | | | | | |
| COMMON STOCKS (continued) | |
| | |
| | | SHARES | | | VALUE | |
| INFORMATION TECHNOLOGY: 21.2% | | | | | |
SEMICONDUCTORS & SEMICONDUCTOR EQUIPMENT: 0.8% | |
Maxim Integrated Products, Inc.(c) | | | 10,236,900 | | | $ | 300,964,860 | |
| | |
SOFTWARE & SERVICES: 12.1% | | | | | | | | |
Adobe Systems, Inc.(a) | | | 13,491,841 | | | | 508,372,569 | |
Amdocs, Ltd.(b)
(Guernsey/United States) | | | 5,713,100 | | | | 194,188,269 | |
AOL, Inc.(a),(c) | | | 4,697,054 | | | | 139,079,769 | |
BMC Software, Inc.(a),(c) | | | 7,402,540 | | | | 293,584,736 | |
Cadence Design Systems, Inc.(a),(c) | | | 11,971,800 | | | | 161,739,018 | |
Computer Sciences Corp.(c) | | | 8,982,762 | | | | 359,759,618 | |
Compuware Corp.(a),(c) | | | 14,549,712 | | | | 158,155,370 | |
eBay, Inc.(a) | | | 10,883,100 | | | | 555,255,762 | |
Google, Inc., Class A(a) | | | 541,700 | | | | 384,265,729 | |
Microsoft Corp. | | | 38,945,500 | | | | 1,041,013,215 | |
Symantec Corp.(a) | | | 33,751,300 | | | | 634,861,953 | |
Synopsys, Inc.(a),(c) | | | 12,694,669 | | | | 404,198,261 | |
| | | | | | | | |
| | | | | | | 4,834,474,269 | |
TECHNOLOGY, HARDWARE & EQUIPMENT: 8.3% | |
Corning, Inc. | | | 18,321,300 | | | | 231,214,806 | |
Dell, Inc. | | | 14,085,800 | | | | 142,689,154 | |
Hewlett-Packard Co. | | | 69,610,995 | | | | 991,956,679 | |
Molex, Inc. | | | 2,364,500 | | | | 64,621,785 | |
Molex, Inc., Class A | | | 8,924,930 | | | | 199,204,437 | |
NetApp, Inc.(a) | | | 14,332,000 | | | | 480,838,600 | |
Nokia Corp. ADR(b) (Finland) | | | 61,286,400 | | | | 242,081,280 | |
TE Connectivity, Ltd.(b) (Switzerland) | | | 13,853,975 | | | | 514,259,552 | |
Xerox Corp.(c) | | | 65,746,682 | �� | | | 448,392,371 | |
| | | | | | | | |
| | | | | | | 3,315,258,664 | |
| | | | | | | | |
| | | | | | | 8,450,697,793 | |
| MATERIALS: 3.4% | | | | | | | | |
Celanese Corp., Series A(c) | | | 9,280,071 | | | | 413,241,562 | |
Domtar Corp. | | | 672,149 | | | | 56,137,884 | |
Dow Chemical Co. | | | 17,300,289 | | | | 559,145,341 | |
Vulcan Materials Co.(c) | | | 6,045,225 | | | | 314,653,961 | |
| | | | | | | | |
| | | | | | | 1,343,178,748 | |
| TELECOMMUNICATION SERVICES: 3.4% | |
Sprint Nextel Corp.(a),(c) | | | 183,015,570 | | | | 1,037,698,282 | |
Vodafone Group PLC ADR(b) (United Kingdom) | | | 13,363,300 | | | | 336,621,527 | |
| | | | | | | | |
| | | | | | | 1,374,319,809 | |
| | | | | | | | |
TOTAL COMMON STOCKS
(Cost $35,084,778,066) | | | | | | $ | 39,452,666,074 | |
| | | | | | | | |
| SHORT-TERM INVESTMENTS: 0.9% | |
| | |
| | | PAR VALUE | | | VALUE | |
MONEY MARKET FUND: 0.1% | | | | | |
SSgA U.S. Treasury Money Market Fund | | $ | 39,312,013 | | | $ | 39,312,013 | |
| |
REPURCHASE AGREEMENT: 0.8% | | | | | |
Fixed Income Clearing Corporation(d) 0.11%, dated 12/31/12, due 1/2/13, maturity value $327,309,000 | | | 327,307,000 | | | | 327,307,000 | |
| | | | | | | | |
TOTAL SHORT-TERM INVESTMENTS
(Cost $366,619,013) | | | | | | $ | 366,619,013 | |
| | | | | | | | |
TOTAL INVESTMENTS
(Cost $35,451,397,079) | | | 99.9 | % | | $ | 39,819,285,087 | |
| | |
OTHER ASSETS LESS LIABILITIES | | | 0.1 | % | | | 22,062,485 | |
| | | | | | | | |
| NET ASSETS | | | 100.0 | % | | $ | 39,841,347,572 | |
| | | | | | | | |
| (b) | Security denominated in U.S. dollars |
| (c) | See Note 8 regarding holdings of 5% voting securities |
| (d) | Repurchase agreement is collateralized by U.S. Treasury Note 0.25%, 4/30/14. Total collateral value is 333,856,800. |
In determining a company’s country designation, the Fund generally references the country of incorporation. In cases where the Fund considers the country of incorporation to be a “jurisdiction of convenience” chosen primarily for tax purposes, the Fund uses the country designation of an appropriate broad-based market index. In that circumstance, two countries are listed—the country of incorporation and the country designated by an appropriate index, respectively.
ADR: American Depositary Receipt
| | |
| See accompanying Notes to Financial Statements | | DODGE & COX STOCK FUND §PAGE 8 |
| | | | |
STATEMENT OF ASSETS AND LIABILITIES | |
| |
| | | December 31, 2012 | |
ASSETS: | | | | |
Investments, at value | | | | |
Unaffiliated issuers (cost $30,750,688,820) | | $ | 35,166,786,121 | |
Affiliated issuers (cost $4,700,708,259) | | | 4,652,498,966 | |
| | | | |
| | | 39,819,285,087 | |
Cash | | | 19,408 | |
Receivable for investments sold | | | 35,689,863 | |
Receivable for Fund shares sold | | | 129,504,171 | |
Dividends and interest receivable | | | 71,373,534 | |
Prepaid expenses and other assets | | | 249,653 | |
| | | | |
| | | 40,056,121,716 | |
| | | | |
LIABILITIES: | | | | |
Payable for investments purchased | | | 36,998,892 | |
Payable for Fund shares redeemed | | | 159,650,443 | |
Management fees payable | | | 16,931,537 | |
Accrued expenses | | | 1,193,272 | |
| | | | |
| | | 214,774,144 | |
| | | | |
NET ASSETS | | $ | 39,841,347,572 | |
| | | | |
NET ASSETS CONSIST OF: | | | | |
Paid in capital | | $ | 38,748,636,393 | |
Undistributed net investment income | | | 5,179,760 | |
Accumulated net realized loss | | | (3,280,356,589 | ) |
Net unrealized appreciation | | | 4,367,888,008 | |
| | | | |
| | $ | 39,841,347,572 | |
| | | | |
Fund shares outstanding (par value $0.01 each, unlimited shares authorized) | | | 326,839,589 | |
Net asset value per share | | | $121.90 | |
|
STATEMENT OF OPERATIONS | |
| |
| | | Year Ended December 31, 2012 | |
INVESTMENT INCOME: | | | | |
Dividends (net of foreign taxes of $20,799,908) | | | | |
Unaffiliated issuers | | $ | 842,715,226 | |
Affiliated issuers | | | 38,223,809 | |
Interest | | | 181,465 | |
| | | | |
| | | 881,120,500 | |
| | | | |
EXPENSES: | | | | |
Management fees | | | 196,296,447 | |
Custody and fund accounting fees | | | 901,790 | |
Transfer agent fees | | | 3,861,240 | |
Professional services | | | 142,584 | |
Shareholder reports | | | 940,502 | |
Registration fees | | | 234,955 | |
Trustees' fees | | | 190,500 | |
Miscellaneous | | | 2,105,284 | |
| | | | |
| | | 204,673,302 | |
| | | | |
NET INVESTMENT INCOME | | | 676,447,198 | |
| | | | |
REALIZED AND UNREALIZED GAIN ON INVESTMENTS: | | | | |
Net realized gain | | | | |
Unaffiliated issuers | | | 2,644,480,223 | |
Affiliated issuers | | | 270,764,550 | |
Net change in unrealized appreciation/depreciation | | | 4,107,467,284 | |
| | | | |
Net realized and unrealized gain | | | 7,022,712,057 | |
| | | | |
NET INCREASE IN NET ASSETS
FROM OPERATIONS | | $ | 7,699,159,255 | |
| | | | |
| | | | | | | | |
STATEMENT OF CHANGES IN NET ASSETS | |
| | |
| | | Year Ended
December 31, 2012 | | | Year Ended
December 31, 2011 | |
OPERATIONS: | | | | | | | | |
Net investment income | | $ | 676,447,198 | | | $ | 664,516,079 | |
Net realized gain | | | 2,915,244,773 | | | | 512,064,516 | |
Net change in unrealized appreciation/depreciation | | | 4,107,467,284 | | | | (2,850,476,884 | ) |
| | | | | | | | |
| | | 7,699,159,255 | | | | (1,673,896,289 | ) |
| | | | | | | | |
| | |
DISTRIBUTIONS TO SHAREHOLDERS FROM: | | | | | | | | |
Net investment income | | | (677,796,823 | ) | | | (664,086,748 | ) |
Net realized gain | | | — | | | | — | |
| | | | | | | | |
Total distributions | | | (677,796,823 | ) | | | (664,086,748 | ) |
| | | | | | | | |
| | |
FUND SHARE TRANSACTIONS: | | | | | | | | |
Proceeds from sale of shares | | | 5,342,166,537 | | | | 5,006,315,221 | |
Reinvestment of distributions | | | 631,503,635 | | | | 625,800,158 | |
Cost of shares redeemed | | | (9,716,062,236 | ) | | | (9,769,356,748 | ) |
| | | | | | | | |
Net decrease from Fund
share transactions | | | (3,742,392,064 | ) | | | (4,137,241,369 | ) |
| | | | | | | | |
Total increase (decrease) in net assets | | | 3,278,970,368 | | | | (6,475,224,406 | ) |
| | |
NET ASSETS: | | | | | | | | |
Beginning of year | | | 36,562,377,204 | | | | 43,037,601,610 | |
| | | | | | | | |
End of year (including undistributed net investment income of $5,179,760 and $6,529,385, respectively) | | $ | 39,841,347,572 | | | $ | 36,562,377,204 | |
| | | | | | | | |
| | |
SHARE INFORMATION: | | | | | | | | |
Shares sold | | | 47,112,087 | | | | 46,452,278 | |
Distributions reinvested | | | 5,518,679 | | | | 5,991,930 | |
Shares redeemed | | | (85,519,079 | ) | | | (92,083,372 | ) |
| | | | | | | | |
Net decrease in shares outstanding | | | (32,888,313 | ) | | | (39,639,164 | ) |
| | | | | | | | |
| | |
| PAGE 9 § DODGE & COX STOCK FUND | | See accompanying Notes to Financial Statements |
NOTES TO FINANCIAL STATEMENTS
NOTE 1—ORGANIZATION AND SIGNIFICANT ACCOUNTING POLICIES
Dodge & Cox Stock Fund (the “Fund”) is one of the series constituting the Dodge & Cox Funds (the “Trust” or the “Funds”). The Trust is organized as a Delaware statutory trust and is registered under the Investment Company Act of 1940, as amended, as a diversified, open-end management investment company. The Fund commenced operations on January 4, 1965, and seeks long-term growth of principal and income. Risk considerations and investment strategies of the Fund are discussed in the Fund’s Prospectus.
The financial statements have been prepared in conformity with accounting principles generally accepted in the United States of America, which require the use of estimates and assumptions by management. Actual results may differ from those estimates. Significant accounting policies are as follows:
Security valuation The Fund’s net assets are valued as of the close of trading on the New York Stock Exchange (NYSE), generally 4:00 p.m. Eastern Time, each day that the NYSE is open for business. Listed securities are valued at market, using the official quoted close price or the last sale of the day at the close of the NYSE or, if not available, at the mean between the exchange listed bid and ask prices. A security that is listed or traded on more than one exchange is valued at the quotation on the exchange determined to be the primary market for such security. Security values are not discounted based on the size of the Fund’s position. Securities for which market quotations are not readily available are valued at fair value as determined in good faith by or under the direction of the Board of Trustees. Short-term securities are valued at amortized cost, which approximates current value. All securities held by the Fund are denominated in U.S. dollars.
Security transactions, investment income, expenses, and distributions Security transactions are recorded on the trade date. Realized gains and losses on securities sold are determined on the basis of identified cost.
Dividend income and corporate action transactions are recorded on the ex-dividend date, or when the Fund first learns of the dividend/corporate action if the ex-dividend date has passed. Withholding taxes on foreign dividends have been provided for in accordance with the
Fund’s understanding of the applicable country’s tax rules and rates. Non-cash dividends included in dividend income, if any, are recorded at the fair market value of the securities received. Dividends characterized as return of capital are recorded as a reduction of cost of investments and/or realized gain. Interest income is recorded on the accrual basis.
Expenses are recorded on the accrual basis. Most expenses of the Trust can be directly attributed to a specific series. Expenses which cannot be directly attributed are allocated among the Funds in the Trust based on relative net assets or other expense methodologies determined by the nature of the expense.
Distributions to shareholders are recorded on the ex-dividend date.
Repurchase agreements The Fund enters into repurchase agreements, secured by U.S. government or agency securities, which involve the purchase of securities from a counterparty with a simultaneous commitment to resell the securities at an agreed-upon date and price. It is the Fund’s policy that its custodian take possession of the underlying collateral securities, the fair value of which exceeds the principal amount of the repurchase transaction, including accrued interest, at all times. In the event of default by the counterparty, the Fund has the contractual right to liquidate the collateral securities and to apply the proceeds in satisfaction of the obligation.
Indemnification Under the Trust’s organizational documents, its officers and trustees are indemnified against certain liabilities arising out of the performance of their duties to the Trust. In addition, in the normal course of business the Trust enters into contracts that provide general indemnities to other parties. The Trust’s maximum exposure under these arrangements is unknown as this would involve future claims that may be made against the Trust that have not yet occurred.
NOTE 2—VALUATION MEASUREMENTS
Various inputs are used in determining the value of the Fund’s investments. These inputs are summarized in the three broad levels listed below.
| § | | Level 1: Quoted prices in active markets for identical securities |
DODGE & COX STOCK FUND §PAGE 10
NOTES TO FINANCIAL STATEMENTS
| § | | Level 2: Other significant observable inputs (including quoted prices for similar securities, market indices, interest rates, credit risk, etc.) |
| § | | Level 3: Significant unobservable inputs (including Fund management’s assumptions in determining the fair value of investments) |
The inputs or methodology used for valuing securities are not necessarily an indication of the risk associated with investing in those securities.
The following is a summary of the inputs used to value the Fund’s holdings as of December 31, 2012:
| | | | | | | | |
| Security Classification(a) | | LEVEL 1
(Quoted Prices) | | | LEVEL 2
(Other Significant
Observable Inputs) | |
Common Stocks(b) | | $ | 39,452,666,074 | | | $ | — | |
Money Market Fund | | | 39,312,013 | | | | — | |
Repurchase Agreement | | | — | | | | 327,307,000 | |
| | | | | | | | |
Total | | $ | 39,491,978,087 | | | $ | 327,307,000 | |
| | | | | | | | |
| | | | | | | | | |
| (a) | There were no transfers between Level 1 and Level 2 during the year ended December 31, 2012. There were no Level 3 securities at December 31, 2012 and 2011, and there were no transfers to Level 3 during the year. |
| (b) | All common stocks held in the Fund are Level 1 securities. For a detailed break-out of common stocks by major industry classification, please refer to the Portfolio of Investments. |
NOTE 3—RELATED PARTY TRANSACTIONS
Management fees Under a written agreement approved by a unanimous vote of the Board of Trustees, the Fund pays an annual management fee of 0.50% of the Fund’s average daily net assets to Dodge & Cox, investment manager of the Fund. The agreement further provides that Dodge & Cox shall waive its fee to the extent that such fee plus all other ordinary operating expenses of the Fund exceed 0.75% of the average daily net assets for the year.
Fund officers and trustees All officers and three of the trustees of the Trust are officers or employees of Dodge & Cox. The Trust pays a fee only to those trustees who are not affiliated with Dodge & Cox.
NOTE 4—INCOME TAX INFORMATION AND DISTRIBUTIONS TO SHAREHOLDERS
A provision for federal income taxes is not required since the Fund intends to continue to qualify as a regulated investment company under Subchapter M of the Internal Revenue Code and distribute all of its taxable income to
shareholders. Distributions are determined in accordance with income tax regulations, and such amounts may differ from net investment income and realized gains for financial reporting purposes. Financial reporting records are adjusted for permanent book/tax differences at year end to reflect tax character.
Book/tax differences are primarily due to differing treatments of wash sales, in-kind redemptions, and net short-term realized gain (loss). During the year, the Fund recognized net realized gains of $274,042,734 from the delivery of appreciated securities in an in-kind redemption transaction. For federal income tax purposes, this gain is not recognized as taxable income to the Fund and therefore will not be distributed to shareholders. At December 31, 2012, the cost of investments for federal income tax purposes was $35,499,382,848.
Distributions during the years ended December 31, 2012 and 2011, were characterized as follows for federal income tax purposes:
| | | | | | | | |
| | | Year Ended
December 31, 2012 | | | Year Ended December 31, 2011 | |
Ordinary income | | | $677,796,823 | | | | $664,086,748 | |
| | | ($1.975 per share) | | | | ($1.754 per share) | |
| | |
Long-term capital gain | | | — | | | | — | |
At December 31, 2012, the tax basis components of distributable earnings were as follows:
| | | | |
Unrealized appreciation | | $ | 7,886,563,602 | |
Unrealized depreciation | | | (3,566,661,363 | ) |
| | | | |
Net unrealized appreciation | | | 4,319,902,239 | |
Undistributed ordinary income | | | 5,179,760 | |
Capital loss carryforward(a) | | | (3,232,370,820 | ) |
| (a) | Represents accumulated capital loss as of December 31, 2012, which may be carried forward to offset future capital gains. During 2012, the Fund utilized $2,621,362,756 of the capital loss carryforward. If not utilized, the remaining capital loss carryforward will expire in 2017. |
Under the Regulated Investment Company Modernization Act of 2010, capital losses incurred by the Fund after January 1, 2011, will not be subject to expiration. In addition, such losses must be utilized prior to the losses incurred in the years preceding enactment. (The Fund had net capital gains in 2011 and 2012.)
PAGE 11 § DODGE & COX STOCK FUND
NOTES TO FINANCIAL STATEMENTS
Fund management has reviewed the tax positions for open periods (three years and four years, respectively, from filing the Fund’s Federal and State tax returns) as applicable to the Fund, and has determined that no provision for income tax is required in the Fund’s financial statements.
NOTE 5—LOAN FACILITIES
Pursuant to an exemptive order issued by the Securities and Exchange Commission (SEC), the Fund may participate in an interfund lending facility (Facility). The Facility allows the Fund to borrow money from or loan money to the Funds. Loans under the Facility are made for temporary or emergency purposes, such as to fund shareholder redemption requests. Interest on borrowings is the average of the current repurchase agreement rate and the bank loan rate. There was no activity in the Facility during the period.
All Funds in the Trust participate in a $500 million committed credit facility (Line of Credit) with State Street Bank and Trust Company, to be utilized for temporary or emergency purposes to fund shareholder redemptions or for other short-term liquidity purposes. The maximum amount available to the Fund is $250 million. Each Fund pays an annual commitment fee on its pro-rata portion of the Line of Credit. The Fund’s commitment fee for the year ended December 31, 2012, amounted to $166,025 and is reflected as a Miscellaneous Expense in the Statement of Operations. Interest on borrowings is charged at the prevailing rate. There were no borrowings on the Line of Credit during the period.
NOTE 6—PURCHASES AND SALES OF INVESTMENTS
For the year ended December 31, 2012, purchases and sales of securities, other than short-term securities, aggregated $4,330,658,454 and $8,246,372,055, respectively.
NOTE 7—ACCOUNTING PRONOUNCEMENTS
Effective January 1, 2013, the Fund will adopt Accounting Standards Update (ASU) No. 2011-11, Balance Sheet (Topic 210): Disclosures about Offsetting Assets and Liabilities and ASU No. 2013-01, Balance Sheet (Topic 210): Clarifying the Scope of Disclosures about Offsetting Assets and Liabilities. These amendments to Topic 210 require enhanced disclosures about offsetting of financial assets and liabilities, including derivative instruments, to enable investors to understand the effect of these arrangements on a fund’s financial position. Management believes the adoption of these ASUs will not have a material impact on the Fund’s financial statements.
NOTE 8—SUBSEQUENT EVENTS
Fund management has determined that no material events or transactions occurred subsequent to December 31, 2012, and through the date of the Fund’s financial statements issuance, which require additional disclosure in the Fund’s financial statements.
DODGE & COX STOCK FUND §PAGE 12
NOTES TO FINANCIAL STATEMENTS
NOTE 9—HOLDINGS OF 5% VOTING SECURITIES
Each of the companies listed below was considered to be an affiliate of the Fund because the Fund owned 5% or more of the company’s voting securities during all or part of the year ended December 31, 2012. Purchase and sale transactions and dividend income earned during the period on these securities were as follows:
| | | | | | | | | | | | | | | | | | | | | | | | |
| | | Shares at
Beginning of Period | | | Additions | | | Reductions | | | Shares at
End of Period | | | Dividend
Income(a) | | | Value at
End of Period | |
AOL, Inc. | | | 8,439,054 | | | | — | | | | (3,742,000 | ) | | | 4,697,054 | | | $ | — | (b) | | $ | 139,079,769 | |
BMC Software, Inc. | | | 8,250,140 | | | | — | | | | (847,600 | ) | | | 7,402,540 | | | | — | (b) | | | — | (c) |
Cadence Design Systems, Inc. | | | 19,448,500 | | | | — | | | | (7,476,700 | ) | | | 11,971,800 | | | | — | (b) | | | — | (c) |
Capital One Financial Corp. | | | 30,180,911 | | | | — | | | | (973,700 | ) | | | 29,207,211 | | | | 5,995,582 | | | | 1,691,973,733 | |
Celanese Corp., Series A | | | 4,602,003 | | | | 4,777,468 | | | | (99,400 | ) | | | 9,280,071 | | | | 1,983,416 | | | | 413,241,562 | |
Computer Sciences Corp. | | | 8,996,552 | | | | 122,810 | | | | (136,600 | ) | | | 8,982,762 | | | | 7,268,170 | | | | 359,759,618 | |
Compuware Corp. | | | 15,838,112 | | | | — | | | | (1,288,400 | ) | | | 14,549,712 | | | | — | (b) | | | 158,155,370 | |
J.C. Penney Co., Inc. | | | — | | | | 11,100,000 | | | | (166,300 | ) | | | 10,933,700 | | | | — | (b) | | | — | (c) |
Maxim Integrated Products, Inc. | | | 17,296,400 | | | | — | | | | (7,059,500 | ) | | | 10,236,900 | | | | 11,559,972 | | | | — | (c) |
Sprint Nextel Corp. | | | 135,934,139 | | | | 50,224,931 | | | | (3,143,500 | ) | | | 183,015,570 | | | | — | (b) | | | 1,037,698,282 | |
Synopsys, Inc. | | | 13,695,769 | | | | — | | | | (1,001,100 | ) | | | 12,694,669 | | | | — | (b) | | | 404,198,261 | |
Vulcan Materials Co. | | | 7,942,625 | | | | — | | | | (1,897,400 | ) | | | 6,045,225 | | | | 269,657 | | | | — | (c) |
Xerox Corp. | | | 62,009,582 | | | | 5,000,000 | | | | (1,262,900 | ) | | | 65,746,682 | | | | 11,147,012 | | | | 448,392,371 | |
| | | | | | | | | | | | | | | | | | | | | | | | |
| | | | | | | | | | | | | | | | | | $ | 38,223,809 | | | $ | 4,652,498,966 | |
| | | | | | | | | | | | | | | | | | | | | | | | |
| | | | | | | | | | | | | | | | | | | | | | | | | |
| (a) | Net of foreign taxes, if any |
| (c) | Company was not an affiliate at period end |
PAGE 13 § DODGE & COX STOCK FUND
FINANCIAL HIGHLIGHTS
| | | | | | | | | | | | | | | | | | | | |
SELECTED DATA AND RATIOS (for a share outstanding throughout each year) | | Year Ended December 31, | |
| | | 2012 | | | 2011 | | | 2010 | | | 2009 | | | 2008 | |
| | | | |
Net asset value, beginning of year | | | $101.64 | | | | $107.76 | | | | $96.14 | | | | $74.37 | | | | $138.26 | |
Income from investment operations: | | | | | | | | | | | | | | | | | | | | |
Net investment income | | | 1.98 | | | | 1.76 | | | | 1.23 | | | | 1.15 | | | | 1.91 | |
Net realized and unrealized gain (loss) | | | 20.26 | | | | (6.13 | ) | | | 11.62 | | | | 21.82 | | | | (59.83 | ) |
| | | | |
Total from investment operations | | | 22.24 | | | | (4.37 | ) | | | 12.85 | | | | 22.97 | | | | (57.92 | ) |
| | | | |
Distributions to shareholders from: | | | | | | | | | | | | | | | | | | | | |
Net investment income | | | (1.98 | ) | | | (1.75 | ) | | | (1.23 | ) | | | (1.20 | ) | | | (1.84 | ) |
Net realized gain | | | — | | | | — | | | | — | | | | — | | | | (4.13 | ) |
| | | | |
Total distributions | | | (1.98 | ) | | | (1.75 | ) | | | (1.23 | ) | | | (1.20 | ) | | | (5.97 | ) |
| | | | |
Net asset value, end of year | | | $121.90 | | | | $101.64 | | | | $107.76 | | | | $96.14 | | | | $74.37 | |
| | | | |
Total return | | | 22.01 | % | | | (4.08 | )% | | | 13.48 | % | | | 31.27 | % | | | (43.31 | )% |
Ratios/supplemental data: | | | | | | | | | | | | | | | | | | | | |
Net assets, end of year (millions) | | | $39,841 | | | | $36,562 | | | | $43,038 | | | | $39,991 | | | | $32,721 | |
Ratio of expenses to average net assets | | | 0.52 | % | | | 0.52 | % | | | 0.52 | % | | | 0.52 | % | | | 0.52 | % |
Ratio of net investment income to average net assets | | | 1.72 | % | | | 1.62 | % | | | 1.25 | % | | | 1.42 | % | | | 1.75 | % |
Portfolio turnover rate | | | 11 | % | | | 16 | % | | | 12 | % | | | 18 | % | | | 31 | % |
See accompanying Notes to Financial Statements
REPORT OF INDEPENDENT REGISTERED PUBLIC ACCOUNTING FIRM
To the Trustees of Dodge & Cox Funds and Shareholders of Dodge & Cox Stock Fund
In our opinion, the accompanying statement of assets and liabilities, including the portfolio of investments, and the related statements of operations and of changes in net assets and the financial highlights present fairly, in all material respects, the financial position of Dodge & Cox Stock Fund (the “Fund”, one of the series constituting Dodge & Cox Funds) at December 31, 2012, the results of its operations for the year then ended, the changes in its net assets for each of the two years in the period then ended and the financial highlights for each of the five years in the period then ended, in conformity with accounting principles generally accepted in the United States of America. These financial statements and financial highlights (hereafter referred to as “financial statements”) are the responsibility of the Fund’s management; our responsibility is to express an opinion on these financial statements based on our audits. We conducted our audits of these financial statements in accordance with the standards of the Public Company Accounting Oversight Board (United States). Those standards require that we plan and perform the audit to obtain reasonable assurance about whether the financial statements are free of material misstatement. An audit includes examining, on a test basis, evidence supporting the amounts and disclosures in the financial statements, assessing the accounting principles used and significant estimates made by management, and evaluating the overall financial statement presentation. We believe that our audits, which included confirmation of securities at December 31, 2012, by correspondence with the custodian and brokers, provide a reasonable basis for our opinion.
PricewaterhouseCoopers LLP
San Francisco, California
February 20, 2013
DODGE & COX STOCK FUND §PAGE 14
SPECIAL 2012 TAX INFORMATION (unaudited)
The following information is provided pursuant to provisions of the Internal Revenue Code:
The Fund designates up to a maximum amount of $901,710,279 of its distributions paid to shareholders in 2012 as qualified dividends (treated for federal income tax purposes in the hands of shareholders as taxable at a maximum rate of 15%).
For shareholders that are corporations, the Fund designates 87% of its ordinary dividends paid to shareholders in 2012 as dividends from domestic corporations eligible for the corporate dividends received deduction, provided that the shareholder otherwise satisfies applicable requirements to claim that deduction.
BOARD APPROVAL OF FUNDS’ INVESTMENT MANAGEMENT AGREEMENTS AND MANAGEMENT FEES
(unaudited)
The Board of Trustees is responsible for overseeing the performance of the Dodge & Cox Funds’ investment manager and determining whether to continue the Investment Management Agreements between the Funds and Dodge & Cox each year (the “Agreements”). At a meeting of the Board of Trustees of the Trust held on December 12, 2012, the Trustees, by a unanimous vote (including a separate vote of those Trustees who are not “interested persons” (as defined in the Investment Company Act of 1940) (the “Independent Trustees”)), approved the renewal of the Agreements for an additional one-year term through December 31, 2013. During the course of the year, the Board received a wide variety of materials relating to the services provided by Dodge & Cox and the performance of each of the Funds.
INFORMATION RECEIVED
In advance of the meeting, the Board, including each of the Independent Trustees, requested, received, and reviewed materials relating to the Agreements and the services provided by Dodge & Cox. The Independent Trustees retained Morningstar® to prepare an independent expense and performance summary for each Fund and comparable funds managed by other advisers identified by Morningstar. The Morningstar materials included information regarding advisory fee rates, expense ratios,
and transfer agency, custodial, and distribution expenses, as well as appropriate performance comparisons to a Fund’s peer group and an index or combination of indices. The Morningstar materials also included a comparison of expenses of various share classes offered by comparable funds.
The materials reviewed by the Board contained information concerning, among other things, Dodge & Cox’s profitability, financial results and condition, advisory fee revenue, and separate account advisory fee schedules. The Board additionally considered the Funds’ brokerage commissions, turnover rates, sales and redemption data and the significant investment that Dodge & Cox makes in research used in managing the Funds. The Board received and reviewed a memorandum summarizing information provided throughout the year regarding Dodge & Cox’s services to the Funds as well as information regarding (i) the different fees, services, costs, and risks associated with separate accounts managed by Dodge & Cox as compared to the Dodge & Cox Funds; (ii) the differences in performance between the Funds and separately managed accounts; and (iii) Fund shares subscription and redemption activity. Throughout the process of reviewing the services provided by Dodge & Cox and preparing for the meeting, the Independent Trustees found Dodge & Cox to be open, forthright, detailed, and very helpful in answering questions about all issues.
The Board received copies of the Agreements and a memorandum from the independent legal counsel to the Independent Trustees discussing the factors generally regarded as appropriate to consider in evaluating advisory arrangements. The Trust’s Contract Review Committee, consisting solely of Independent Trustees, met with the independent legal counsel on November 1, 2012, and again on December 12, 2012, to discuss whether to renew the Agreements. The Board, including the Independent Trustees, subsequently concluded that the existing Agreements are fair and reasonable and voted to approve the Agreements.
In considering the Agreements, the Board, including the Independent Trustees, did not identify any single factor or particular information as all-important or controlling. In reaching the decision to approve the
PAGE 15 § DODGE & COX STOCK FUND
Agreements, the Board considered several factors, discussed below, to be key factors and reached the conclusions described below.
NATURE, QUALITY, AND EXTENT OF THE SERVICES
The Board considered that Dodge & Cox provides a wide range of services to the Funds in addition to portfolio management and that the quality of these services has been excellent in all respects. The extensive nature of services provided by Dodge & Cox has been documented in materials provided to the Board and in presentations made to the Board throughout the year. In particular, the Board considered the nature, quality, and extent of portfolio management, administrative, and shareholder services performed by Dodge & Cox. With regard to portfolio management services, the Board considered Dodge & Cox’s established long-term history of care and conscientiousness in the management of the Funds; its demonstrated consistency in investment approach and depth; the background and experience of the Dodge & Cox Investment Policy Committee, International Investment Policy Committee, Global Investment Policy Committee, Fixed Income Investment Policy Committee, and research analysts responsible for managing the Funds; its methods for assessing the regulatory and investment climate in various jurisdictions; Dodge & Cox’s overall high level of attention to its core investment management function; and its commitment to the Funds and their shareholders.
In the area of administrative and shareholder services, the Board considered the excellent quality of Dodge & Cox’s work in areas such as compliance, legal services, trading, proxy voting, oversight of the Funds’ transfer agent and custodian, tax compliance, and shareholder communication through its website and other means. The Board also noted Dodge & Cox’s diligent disclosure policy, its favorable compliance record, and its reputation as a trusted, shareholder-friendly mutual fund family.
In addition, the Board considered that Dodge & Cox manages approximately $120 billion in Fund assets with fewer professionals than most comparable funds, and that on average these professionals have more experience and longer tenure than investment professionals at comparable
funds. The Board also noted that Dodge & Cox is an investment research-oriented firm with no other business endeavors to distract management’s attention from its research efforts, and that its investment professionals adhere to a consistent investment approach across the Funds. The Board further considered the favorable stewardship and “Gold” analyst ratings awarded to each of the Funds by Morningstar. The Board concluded that it was satisfied with the nature, extent, and quality of investment management and other services provided to the Funds by Dodge & Cox.
INVESTMENT PERFORMANCE
The Board considered short-term and long-term investment performance for each Fund (including periods of outperformance or underperformance) as compared to both relevant indices and the performance of such Fund’s peer group. The Board also reviewed recent performance in the context of long-term investment goals. The Board noted that each Fund’s short-term (one-year) performance relative to its benchmark and peer group had improved since the previous year’s review. The Board determined after extensive review and inquiry that Dodge & Cox’s historic, long-term, team-oriented bottom up investment approach remains consistent and that Dodge & Cox continues to be distinguished by its integrity, transparency, and independence.
The Board considered that the performance of the Funds is the result of a team-oriented investment management process that emphasizes a long-term investment horizon, comprehensive independent research, price discipline, and focus. The Board also considered that the investment performance delivered by Dodge & Cox to the Funds appeared to be consistent with the relevant performance delivered for other (non-fund) clients of Dodge & Cox. The Board concluded that Dodge & Cox has delivered favorable long-term performance for Fund investors consistent with the long-term investment strategies being pursued by the Funds.
COSTS AND ANCILLARY BENEFITS
Costs of Services to Funds: Fees and Expenses. The Board considered each Fund’s management fee rate and expense ratio relative to similar mutual funds and relative to management fees charged by Dodge & Cox to other
DODGE & COX STOCK FUND §PAGE 16
clients. In particular, the Board considered that the Funds continue to be substantially below their peer group median in expense ratios and management fee rates and that many media and industry reports specifically comment on the low expense ratios of the Funds, which have been a defining characteristic of the Funds for many years. The Board also evaluated the operating structures of the Funds and Dodge & Cox, noting that the Funds do not charge front-end sales commissions or distribution fees, and Dodge & Cox bears, among other things, the significant cost of third party research, reimbursement for recordkeeping and administrative costs to third-party retirement plan administrators, and administrative and office overhead. The Board noted that expenses are well below industry averages. The Board also considered that the Funds receive numerous administrative, regulatory compliance, and shareholder support services from Dodge & Cox without any additional administrative fee and the fact that the Funds have relatively low transaction costs and portfolio turnover rates. The Board reviewed Morningstar data showing that the few peer group funds with lower expense ratios often have other share classes with significantly higher expense ratios.
The Board reviewed information regarding the fee rates Dodge & Cox charges to separate accounts that have investment programs similar to those of the Funds, including instances where separate account fees are lower than Fund fees. The Board considered differences in the nature and scope of services Dodge & Cox provides to the Funds as compared to separate accounts, differences in regulatory, litigation, and other risks as between mutual funds and separate accounts, and certain characteristics of the market for institutional separate account management services. The Board further noted that, with respect to non-U.S. funds sponsored and managed by Dodge & Cox that are comparable to the Funds in many respects, the fee rates charged by Dodge & Cox are the same as or higher than the fee rates charged to the Funds. After consideration of these matters, the Board concluded that the overall costs incurred by the Funds for the services they receive (including the management fee paid to Dodge & Cox) are reasonable and that the fees are acceptable based upon the qualifications, experience, reputation, and performance of Dodge & Cox and the low overall expense ratios of the Funds.
Profitability and Costs of Services to Dodge & Cox; “Fall-out” Benefits. The Board reviewed reports of Dodge & Cox’s financial position, profitability, and estimated overall value, and considered Dodge & Cox’s overall profitability within its context as a private, employee-owned S-Corporation and relative to the favorable services provided. The Board noted that net revenues for 2012 are projected to decrease slightly from 2011. The Board noted in particular that Dodge & Cox’s profits are not generated by high fee rates, but reflect an extraordinarily streamlined, efficient, and focused business approach toward investment management. The Board recognized the importance of Dodge & Cox’s profitability—which is derived solely from management fees and does not include other business ventures—to maintain its independence, stability, company culture and ethics, and management continuity. The Board also considered that the compensation/profit structure at Dodge & Cox is vital for remaining independent and facilitating retention of its management and investment professionals.
The Board considered potential “fall-out” benefits (including the receipt of research from unaffiliated brokers) that Dodge & Cox might receive as a result of its association with the Funds and determined that they are not significant. The Board also noted the extent of additional administrative services performed by Dodge & Cox for the Funds, and that the magnitude of costs and risks borne by Dodge & Cox in rendering advisory services to the Funds (including risks in the regulatory compliance, securities valuation, and investment management processes) are continuing to increase. The Board concluded that the profitability of Dodge & Cox’s relationship with the Funds (including fall-out benefits) was fair and reasonable.
THE BENEFIT OF ECONOMIES OF SCALE
The Board considered whether there have been economies of scale with respect to the management of each Fund, whether the Funds have appropriately benefited from any economies of scale, and whether the management fee rate is reasonable in relation to the Fund assets and any economies of scale that may exist. In the Board’s view, any consideration of economies of scale must take account of the Funds’ low fee structure and the
PAGE 17 § DODGE & COX STOCK FUND
considerable efficiencies of the Funds’ organization and fee structure that has been realized by shareholders from the time of each Fund’s inception (i.e., from the first dollar). The Board noted that Dodge & Cox has shared economies of scale by adding or enhancing services to the Funds over time, and that the internal costs of providing investment management, up-to-date technology, administrative, and compliance services to the Funds are continuing to increase. For example, Dodge & Cox has increased its global research staff and investment resources over the years to address the increased complexity of investing in multinational and non-U.S. companies. In addition, Dodge & Cox has made substantial expenditures in other staff and infrastructure to enable it to integrate credit and equity analyses and to be able to implement its strategy in a more effective and secure manner. The Board determined that the Funds provide access for small investors to high quality investment management at a relatively low cost. The Board’s decision to renew the Agreements was made after consideration of economies of scale and review of peer group fund expense ratios and historical expense ratio patterns for the Funds. The Board concluded that the current Dodge & Cox fee structure is fair and reasonable and adequately shares economies of scale that may exist.
CONCLUSION
Based on their evaluation of all material factors and assisted by the advice of independent legal counsel to the Independent Trustees, the Board, including the Independent Trustees, concluded that the advisory fee structure was fair and reasonable, that each Fund was paying a competitive fee for the services provided, that the scope and quality of Dodge & Cox’s services has provided substantial value for Fund shareholders over the long term, and that approval of the Agreements was in the best interests of each Fund and its shareholders.
FUND HOLDINGS
The Fund provides a complete list of its holdings four times each fiscal year, as of the end of each quarter. The Fund files the lists with the Securities and Exchange Commission (SEC) on Form N-CSR (second and fourth quarters) and Form N-Q (first and third quarters). Shareholders may view the Fund’s Forms N-CSR and N-Q on the SEC’s website at www.sec.gov. Forms N-CSR and N-Q may also be reviewed and copied at the SEC’s Public Reference Room in Washington, DC. Information regarding the operations of the Public Reference Room may be obtained by calling 202-942-8090 (direct) or 800-732-0330 (general SEC number). A list of the Fund’s quarter-end holdings is also available at www.dodgeandcox.com on or about 15 days following each quarter end and remains available on the website until the list is updated in the subsequent quarter.
PROXY VOTING
For a free copy of the Fund’s proxy voting policies and procedures, please call 800-621-3979, visit the Fund’s website at www.dodgeandcox.com, or visit the SEC’s website at www.sec.gov. Information regarding how the Fund voted proxies relating to portfolio securities during the most recent 12-month period ending June 30 is also available at www.dodgeandcox.com or at www.sec.gov.
HOUSEHOLD MAILINGS
The Fund routinely mails shareholder reports and summary prospectuses to shareholders and, on occasion, proxy statements. In order to reduce the volume of mail, when possible, only one copy of these documents will be sent to shareholders who are part of the same family and share the same residential address.
If you have a direct account with the Funds and you do not want the mailing of shareholder reports and summary prospectuses combined with other members in your household, contact the Funds at 800-621-3979. Your request will be implemented within 30 days.
DODGE & COX STOCK FUND §PAGE 18
DODGE & COX FUNDS—EXECUTIVE OFFICER & TRUSTEE INFORMATION
| | | | | | |
Name (Age) and
Address* | | Position with Trust (Year of Election or
Appointment) | | Principal Occupation During Past 5 Years | | Other Directorships Held by Trustees |
| INTERESTED TRUSTEES AND OFFICERS |
| Kenneth E. Olivier (60) | | Chairman, President, and Trustee (Trustee since 2005) | | Chairman (since 2011), Chief Executive Officer (since 2010), President (until 2011), and Director of Dodge & Cox; Portfolio Manager and member of Investment Policy Committee (IPC) | | — |
| Dana M. Emery (51) | | Senior Vice President and Trustee (Trustee since 1993) | | Co-President (since 2011), Executive Vice President (until March 2011), and Director of Dodge & Cox; Director of Fixed Income, Portfolio Manager, and member of Fixed Income Investment Policy Committee (FIIPC) | | — |
| John A. Gunn (69) | | Trustee (Trustee since 1985) | | Chairman Emeritus (since 2011), Chairman (2007-2011), Chief Executive Officer (2007-2010), and Director of Dodge & Cox; Portfolio Manager and member of IPC, Global Investment Policy Committee (GIPC) (since 2008), International Investment Policy Committee (IIPC), and FIIPC (until 2008) | | — |
| Charles F. Pohl (54) | | Senior Vice President (Officer since 2004) | | Co-President (since 2011), Senior Vice President (until 2011), and Director of Dodge & Cox; Chief Investment Officer (since 2007), Director of Credit Research, Portfolio Manager, Investment Analyst, and member of IPC, GIPC (since 2008), IIPC (since 2007), and FIIPC | | — |
| Diana S. Strandberg (53) | | Senior Vice President (Officer since 2006) | | Senior Vice President (since 2011), Vice President (until 2011), and Director (since 2011) of Dodge & Cox; Director of International Equity (since 2009), Portfolio Manager, Investment Analyst, and member of IPC, GIPC (since 2008), and IIPC | | — |
| David H. Longhurst (55) | | Treasurer (Officer since 2006) | | Vice President (since 2008) and Assistant Treasurer (since 2007) of Dodge & Cox; Fund Administration and Accounting Senior Manager (until 2007) | | — |
| Thomas M. Mistele (59) | | Secretary (Officer since 1998) | | Chief Operating Officer, Director, Secretary, Senior Counsel (since 2011), and General Counsel (until 2011) of Dodge & Cox | | — |
| Katherine M. Primas (37) | | Chief Compliance Officer (Officer since 2009) | | Chief Compliance Officer (since 2008) and Associate Chief Compliance Officer of Dodge & Cox (until 2008) | | — |
| INDEPENDENT TRUSTEES |
| L. Dale Crandall (71) | | Trustee (Since 1999) | | President, Piedmont Corporate Advisors, Inc. (since 2003); President, Kaiser Foundation Health Plan, Inc. and Kaiser Foundation Hospitals (2000-2002); Senior Vice President—Finance and Administration & CFO, Kaiser Foundation Health Plan, Inc. and Kaiser Foundation Hospitals (1998-2000) | | Director, Ansell Limited (medical equipment and supplies) (2002-present); Director, Coventry Health Care, Inc. (managed health care) (2004-present); Bridgepoint Education, Inc. (education services) (2008-present) |
| Thomas A. Larsen (63) | | Trustee (Since 2002) | | Senior Counsel of Arnold & Porter LLP (law firm) (since 2012); Director of Howard, Rice, Nemerovski, Canady, Falk & Rabkin (1977-2011) | | — |
| Ann Mather (52) | | Trustee (Since 2011) | | CFO, Pixar Animation Studios (1999-2004) | | Director, Google, Inc. (internet information services) (2005-present); Director, Glu Mobile, Inc. (multimedia software) (2005-present); Director, Netflix, Inc. (video services) (2010-present); Director, MoneyGram International, Inc. (business services) (2010-present); Director, Solazyme Inc. (renewable oils) (since 2011) |
| Robert B. Morris III (60) | | Trustee (Since 2011) | | Advisory Director, The Presidio Group (previously Presidio Financial Partners) (since 2005) | | — |
| John B. Taylor (66) | | Trustee (Since 2005) (and 1998-2001) | | Professor of Economics, Stanford University; Senior Fellow, Hoover Institution; Under Secretary for International Affairs, United States Treasury (2001-2005) | | — |
| * | | The address for each Officer and Trustee is 555 California Street, 40th Floor, San Francisco, California 94104. Each Officer and Trustee oversees all five series in the Dodge & Cox Funds complex and serves for an indefinite term. |
Additional information about the Trust’s Trustees and Officers is available in the Trust’s Statement of Additional Information (SAI). You can get a free copy of the SAI by visiting the Funds’ website at www.dodgeandcox.com or calling
1-800-621-3979.
PAGE 19 § DODGE & COX STOCK FUND
| | | | |
| | | | |
www.dodgeandcox.com
For Fund literature, transactions, and account information, please visit the Funds’ website.
or write or call:
DODGE & COX FUNDS
c/o Boston Financial Data Services
P.O. Box 8422
Boston, Massachusetts 02266-8422
(800) 621-3979
INVESTMENT MANAGER
Dodge & Cox
555 California Street, 40th Floor
San Francisco, California 94104
(415) 981-1710
This report is submitted for the general information of the shareholders of the Fund. The report is not authorized for distribution to prospective investors in the Fund unless it is accompanied by a current prospectus.
This report reflects our views, opinions, and portfolio holdings as of December 31, 2012, the end of the reporting period. Any such views are subject to change at any time based upon market or other conditions and Dodge & Cox disclaims any responsibility to update such views. These views may not be relied on as investment advice and, because investment decisions for a Dodge & Cox Fund are based on numerous factors, may not be relied on as an indication of trading intent on behalf of any Dodge & Cox Fund.
12/12 GSF AR Printed on recycled paper
Annual Report
December 31, 2012
Global Stock
Fund
ESTABLISHED 2008
TICKER: DODWX
TO OUR SHAREHOLDERS
The Dodge & Cox Global Stock Fund had a total return of 13.8% for the six months ending December 31, 2012, compared to a return of 9.4% for the MSCI World Index. For 2012, the Fund had a total return of 21.1%, compared to 15.8% for the MSCI World. At year end, the Fund had net assets of $2.7 billion with a cash position of 1.6%.
MARKET COMMENTARY
The past year was marked by considerable volatility as investors responded to uncertainty about broad macroeconomic issues, including the fate of the Eurozone, slowing economic growth in China, and the U.S. “fiscal cliff.” And yet, global equity markets appreciated significantly during 2012. Even the areas of the market that were of greatest concern appreciated: MSCI European Financials Index (up 33%), MSCI China Index (up 23%), and MSCI Europe Index (up 19%). We remain optimistic about the long-term outlook for potential equity returns. Company fundamentals remain strong, with robust corporate balance sheets and cash flows. Emerging markets continue to advance, as does technological innovation. And valuations are attractive, with the MSCI World trading at 15 times trailing earnings,(a) compared to a 10-year average of 17 times.
INVESTMENT STRATEGY
As investors, we are constantly weighing what we are buying (company fundamentals) with what we are paying (valuation). A great company can be a terrible investment if you pay too much. Every investment also has a range of outcomes. For these reasons, we strive to purchase securities that are inexpensive enough to allow for what could potentially go wrong, while not paying too much for what could go right.
Our investment professionals accomplish this through intensive, fundamental research and a team-based decision making process. This approach broadens our knowledge base and informs our decision making. Our collective judgment and experience, built over decades, is key to constructing the portfolio. In 2012, the Fund’s performance in three areas—Financials, Pharmaceuticals, and Media—illustrated the merits of this investment approach.
Financials
The Fund’s holdings in Financials experienced strong performance for the year, up 40% compared to a 29% increase in the MSCI World. This recovery occurred despite the fact that many of the concerns that arose during the financial crisis still remain: a low interest rate environment, uncertain regulatory changes, and ongoing litigation and writedowns. However, many companies in the sector stood to benefit from their stronger franchises, solid management, higher capital ratios, and cleaner balance sheets—all amidst a reduced field of competitors. These fundamentals, when weighed against low valuations, made them attractive investment opportunities. For these reasons, the Fund was overweight in Financials during 2012, and remained overweight at year end (24.8% versus 20.3%). The sector experienced severe volatility throughout the crisis, and indeed, may again. We continue to evaluate evolving risks against valuation levels, with the companies’ long-term prospects in mind.
Pharmaceuticals Industry
The Fund was also overweight in Pharmaceuticals (13.7% versus 6.7%). The industry started outperforming in 2011, with improvements in drug pipelines and better top-line growth. Valuations continued to increase in 2012.
As valuations rebounded, we have used some of the profits to fund other investments. However, we still see long-term investment opportunity and remain overweight in the industry due to low relative valuations and attractive growth prospects. The Fund’s Pharmaceuticals holdings traded at approximately 11 times forward earnings with a 3.8% dividend yield. These companies also derive approximately 20 to 30 percent of their revenues from emerging markets, a business that is growing at double-digit rates. Per capita consumption of drugs is low in most emerging markets, and governments and consumers have demonstrated a tendency to allocate more spending to health care as consumer purchasing power increases.
Media Industry
Media, a third area of emphasis in the Fund (7.2% versus 2.6%), also finished the year with strong performance (up
PAGE 1 § DODGE & COX GLOBAL STOCK FUND
43% versus up 34%). Company valuations in this area of the economy became increasingly attractive around 2009, amid a deep cyclical decline in advertising spending. The Fund’s Media holdings are in durable, subscription-based franchises, with valuable assets that generate strong cash flows. The cable holdings, in particular, are benefiting from their infrastructure lead to gain share in growing broadband markets. The Fund also has investments in companies with large growth potential in emerging markets such as Mexico, China, and Africa.
FINDING OPPORTUNITIES
We continue to find opportunity within Technology, Media, and Telecommunications (TMT) where valuations are depressed. One such example(b) is Sprint Nextel (2.0% of the Fund), a position initiated in the first quarter. After the company announced poor performance and a significant commitment to purchase iPhones, its valuation declined. Combined with a sizeable debt load and need to increase capital expenditures, concerns about access to capital began to surface. Looking at Sprint Nextel’s balance sheet and the value of its non-financial assets (spectrum and subscriber base), the company appeared to provide adequate security for a lender or other investor. The core franchise also had the potential for significant margin expansion. Operating performance subsequently improved, and Softbank announced a $20 billion investment, helping to validate the value of Sprint Nextel’s assets and franchise. Sprint Nextel appreciated 104% in 2012, from the time of the Fund’s initial investment.
Hewlett-Packard (HP) is another good example of the kind of opportunity we are seeing in TMT. HP is an industry leader, with leading market shares in several major technology businesses. It generates healthy free cash flows, which can be used to repurchase shares, pay dividends, repay debt, and/or pursue strategic mergers and acquisitions. While shares of HP performed poorly last year, the company’s significantly depressed valuation appears to reflect overly pessimistic expectations about HP’s growth prospects and profits.
IN CLOSING
While the world economy could continue to experience volatility and face headwinds, we are optimistic about the
prospects for continued global growth, driven in large part by the growth contributed by emerging markets. The Firm remains committed to identifying the individual companies that stand to benefit from global growth or a recovery, and investing in them at attractive valuations on behalf of our investors. Markets can be difficult to predict over the short term; as a result, we encourage shareholders to remain focused on the long term.
Thank you for your continued confidence in our firm. As always, we welcome your comments and questions.
For the Board of Trustees,
| | |
| | |
Kenneth E. Olivier, Chairman and President | | Charles F. Pohl Senior Vice President |
January 29, 2013
| (a) | | Unless otherwise specified, all weightings and characteristics are as of December 31, 2012. |
| (b) | | The use of specific examples does not imply that they are more attractive investments than the Fund’s other holdings. |
DODGE & COX GLOBAL STOCK FUND §PAGE 2
ANNUAL PERFORMANCE REVIEW
Key Contributors to Relative Results
| | § | | The Fund’s average overweight position (25% versus 19%) and holdings in the Financials sector (up 40% versus up 29% for the MSCI World sector) had a positive impact. Bank of America (up 110%), Aegon (up 65%), and Barclays (up 60%) were strong performers. | |
| | § | | The Fund’s holdings in the Materials sector (up 42% versus up 11% for the MSCI World sector) helped results. Lafarge (up 82%) was a notable contributor. | |
| | § | | The Fund’s average overweight position (17% versus 10%) and holdings in the Health Care sector (up 22% versus up 17% for the MSCI World sector) also contributed. Bayer (up 51%) helped performance. | |
| | § | | Additional contributors included AOL (up 128%), Sprint Nextel (up 104% since date of purchase), and Naspers (up 47%). | |
Key Detractors from Relative Results
| | § | | The Fund’s overweight position and holdings in the Information Technology sector (flat versus up 13% for the MSCI World sector) detracted from results. Hewlett-Packard (down 43%), Nintendo (down 22%), and Nokia (down 17%) were notable detractors. | |
| | § | | The Fund’s holdings in the Consumer Discretionary sector (up 21% versus up 24% for the MSCI World sector) hindered results. J.C. Penney (down 42% since date of purchase) and Yamaha Motor (down 13%) hurt performance. | |
| | § | | Nidec (down 35% since date of purchase) was an additional detractor. | |
KEY CHARACTERISTICS OF DODGE & COX
Independent Organization
Dodge & Cox is one of the largest privately owned investment managers in the world. We remain committed to independence, with a goal of providing the highest quality investment management service to our existing clients.
Over 80 Years of Investment Experience
Dodge & Cox was founded in 1930. We have a stable and well-qualified team of investment professionals, most of whom have spent their entire careers at Dodge & Cox.
Experienced Investment Team
The Global Investment Policy Committee, which is the decision-making body for the Global Stock Fund, is a seven-member committee with an average tenure at Dodge & Cox of 21 years.
One Business with a Single Research Office
Dodge & Cox manages domestic, international, and global equity, fixed income, and balanced investments, operating from one office in San Francisco.
Consistent Investment Approach
Our team decision-making process involves thorough, bottom-up fundamental analysis of each investment.
Long-Term Focus and Low Expenses
We invest with a three- to five-year investment horizon, which has historically resulted in low turnover relative to our peers. We manage Funds that maintain low expense ratios.
PAGE 3 § DODGE & COX GLOBAL STOCK FUND
GROWTH OF $10,000 SINCE INCEPTION
FOR AN INVESTMENT MADE ON MAY 1, 2008
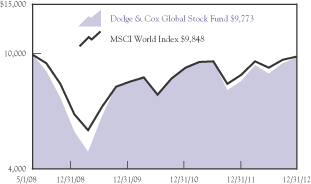
AVERAGE ANNUAL TOTAL RETURN
FOR PERIODS ENDED DECEMBER 31, 2012
| | | | | | | | | | | | |
| | | 1 Year | | | 3 Years | | | Since
Inception
(5/1/08) | |
Dodge & Cox Global Stock Fund | | | 21.11 | % | |
| 6.80
| %
| | | -0.49 | % |
MSCI World Index | | | 15.84 | | |
| 6.93
|
| | | -0.33 | |
Returns represent past performance and do not guarantee future results. Investment return and share price will fluctuate with market conditions, and investors may have a gain or loss when shares are sold. Fund performance changes over time and currently may be significantly
lower than stated. Performance is updated and published monthly. Visit the Fund’s website at www.dodgeandcox.com or call 800-621-3979 for current performance figures.
The Fund’s total returns include the reinvestment of dividend and capital gain distributions, but have not been adjusted for any income taxes payable by shareholders on these distributions or on Fund share redemptions. Index returns include dividends but, unlike Fund returns, do not reflect fees or expenses. The MSCI World Index is a broad-based, unmanaged equity market index aggregated from 24 developed market country indices, including the United States. MSCI makes no express or implied warranties or representations and shall have no liability whatsoever with respect to any MSCI data contained herein. The MSCI data may not be further redistributed or used as a basis for other indices or any securities or financial products. This report is not approved, reviewed, or produced by MSCI.
MSCI World is a service mark of MSCI Barra.
Risks: The Fund is subject to stock market risk, meaning stocks in the Fund may decline in value for extended periods due to the financial prospects of individual companies, or due to general market and economic conditions. Investing in non-U.S. securities may entail risk due to foreign economic and political developments; this risk may be increased when investing in emerging markets. Please read the prospectus and summary prospectus for specific details regarding the Fund’s risk profile.
FUND EXPENSE EXAMPLE
As a Fund shareholder, you incur ongoing Fund costs, including management fees and other Fund expenses. All mutual funds have ongoing costs, sometimes referred to as operating expenses. The following example shows ongoing costs of investing in the Fund and can help you understand these costs and compare them with those of other mutual funds. The example assumes a $1,000 investment held for the six months indicated.
ACTUAL EXPENSES
The first line of the table below provides information about actual account values and expenses based on the Fund’s actual returns. You may use the information in this line, together with your account balance, to estimate the expenses that you paid over the period. Simply divide your account value by $1,000 (for example, an $8,600 account value divided by $1,000 = 8.6), then multiply the result by the number in the first line under the heading “Expenses Paid During Period” to estimate the expenses you paid on your account during this period.
HYPOTHETICAL EXAMPLE FOR COMPARISON WITH OTHER MUTUAL FUNDS
Information on the second line of the table can help you compare ongoing costs of investing in the Fund with those of other mutual funds. This information may not be used to estimate the actual ending account balance or expenses you paid during the period. The hypothetical “Ending Account Value” is based on the actual expense ratio of the Fund and an assumed 5% annual rate of return before expenses (not the Fund’s actual return). The amount under the heading “Expense Paid During the Period” shows the hypothetical expenses your account would have incurred under this scenario. You can compare this figure with the 5% hypothetical examples that appear in shareholder reports of other mutual funds.
| | | | | | | | | | | | |
Six Months Ended December 31, 2012 | | Beginning Account Value
7/1/2012 | | | Ending Account Value
12/31/2012 | | | Expenses Paid During Period* | |
Based on Actual Fund Return | | $ | 1,000.00 | | | $ | 1,138.40 | | | $ | 3.46 | |
Based on Hypothetical 5% Yearly Return | | | 1,000.00 | | | | 1,021.90 | | | | 3.27 | |
| * | Expenses are equal to the Fund’s annualized expense ratio of 0.64%, multiplied by the average account value over the period, multiplied by 184/366 (to reflect the one-half year period). |
The expenses shown in the table highlight ongoing costs only and do not reflect any transactional fees or account maintenance fees. While other mutual funds may charge such fees, please note that the Fund does not charge transaction fees (e.g., redemption fees, sales loads) or universal account maintenance fees (e.g., small account fees).
DODGE & COX GLOBAL STOCK FUND §PAGE 4
| | | | |
| FUND INFORMATION | | | December 31, 2012 | |
| | | | |
| GENERAL INFORMATION | | | |
Net Asset Value Per Share | | | $8.99 | |
Total Net Assets (billions) | | | $2.7 | |
Expense Ratio | | | 0.65% | |
Portfolio Turnover Rate | | | 12% | |
30-Day SEC Yield(a) | | | 1.88% | |
Fund Inception | | | 2008 | |
No sales charges or distribution fees | | | | |
Investment Manager: Dodge & Cox, San Francisco. Managed by the Global Investment Policy Committee, whose seven members’ average tenure at Dodge & Cox is 21 years.
| | | | | | | | |
| PORTFOLIO CHARACTERISTICS | | Fund | | | MSCI
World | |
Number of Stocks | | | 95 | | | | 1,610 | |
Median Market Capitalization (billions) | | | $22 | | | | $9 | |
Weighted Average Market
Capitalization (billions) | | | $67 | | | | $76 | |
Price-to-Earnings Ratio(b) | | | 10.6x | | | | 12.5x | |
Countries Represented | | | 20 | | | | 24 | |
Emerging Markets (Brazil, China, India, Mexico, South Africa, Turkey) | | | 10.0% | | | | 0.0% | |
| | | | |
| TEN LARGEST HOLDINGS (%)(c) | | Fund | |
Sanofi (France) | | | 2.9 | |
Hewlett-Packard Co. (United States) | | | 2.7 | |
Roche Holding AG (Switzerland) | | | 2.6 | |
Microsoft Corp. (United States) | | | 2.5 | |
Wells Fargo & Co. (United States) | | | 2.2 | |
Lafarge SA (France) | | | 2.1 | |
Novartis AG (Switzerland) | | | 2.1 | |
GlaxoSmithKline PLC (United Kingdom) | | | 2.1 | |
Sprint Nextel Corp. (United States) | | | 2.0 | |
Naspers, Ltd. (South Africa) | | | 2.0 | |
ASSET ALLOCATION
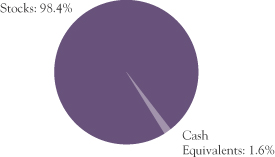
| | | | | | | | |
| REGION DIVERSIFICATION (%)(d) | | Fund | | | MSCI
World | |
United States | | | 43.5 | | | | 52.5 | |
Europe (excluding United Kingdom) | | | 29.9 | | | | 18.3 | |
United Kingdom | | | 9.4 | | | | 9.6 | |
Japan | | | 6.1 | | | | 8.5 | |
Latin America | | | 4.5 | | | | 0.0 | |
Africa/Middle East | | | 3.3 | | | | 0.2 | |
Pacific (excluding Japan) | | | 1.7 | | | | 6.0 | |
Canada | | | 0.0 | | | | 4.9 | |
| | | | | | | | |
| SECTOR DIVERSIFICATION (%) | | Fund | | | MSCI
World | |
Financials | | | 24.8 | | | | 20.3 | |
Information Technology | | | 16.0 | | | | 11.9 | |
Health Care | | | 14.4 | | | | 10.5 | |
Consumer Discretionary | | | 11.9 | | | | 11.1 | |
Industrials | | | 8.1 | | | | 11.0 | |
Telecommunication Services | | | 8.0 | | | | 3.8 | |
Materials | | | 6.4 | | | | 7.0 | |
Energy | | | 6.1 | | | | 10.3 | |
Consumer Staples | | | 2.7 | | | | 10.6 | |
Utilities | | | 0.0 | | | | 3.5 | |
| (a) | SEC Yield is an annualization of the Fund’s total net investment income per share for the 30-day period ended on the last day of the month. |
| (b) | Price-to-earnings (P/E) ratios are calculated using 12-month forward earnings estimates from third-party sources. |
| (c) | The Fund’s portfolio holdings are subject to change without notice. The mention of specific securities is not a recommendation to buy, sell, or hold any particular security and is not indicative of Dodge & Cox’s current or future trading activity. |
| (d) | The Fund may classify a company in a different category than the MSCI World. The Fund generally classifies a company based on its country of incorporation, but may designate a different country in certain circumstances. |
PAGE 5 § DODGE & COX GLOBAL STOCK FUND
| | | | |
| PORTFOLIO OF INVESTMENTS | | | December 31, 2012 | |
| | | | | | | | |
| COMMON STOCKS: 96.9% | | | | | | |
| | |
| | | SHARES | | | VALUE | |
| CONSUMER DISCRETIONARY: 11.9% | |
AUTOMOBILES & COMPONENTS: 2.2% | |
Bayerische Motoren Werke AG (Germany) | | | 202,400 | | | $ | 19,519,861 | |
Mahindra & Mahindra, Ltd. (India) | | | 655,100 | | | | 11,247,192 | |
Yamaha Motor Co., Ltd. (Japan) | | | 2,578,200 | | | | 28,578,334 | |
| | | | | | | | |
| | | | | | | 59,345,387 | |
CONSUMER DURABLES & APPAREL: 1.3% | |
Li Ning Co., Ltd.(a)
(Cayman Islands/China) | | | 13,637,800 | | | | 9,035,686 | |
Panasonic Corp. (Japan) | | | 3,684,440 | | | | 22,386,699 | |
Sony Corp. (Japan) | | | 241,800 | | | | 2,705,613 | |
| | | | | | | | |
| | | | | | | 34,127,998 | |
MEDIA: 7.2% | |
Comcast Corp., Class A (United States) | | | 1,090,600 | | | | 40,766,628 | |
DISH Network Corp., Class A(a) (United States) | | | 256,300 | | | | 9,329,320 | |
Grupo Televisa SAB ADR (Mexico) | | | 934,100 | | | | 24,828,378 | |
Naspers, Ltd. (South Africa) | | | 846,600 | | | | 54,396,467 | |
Television Broadcasts, Ltd. (Hong Kong) | | | 2,523,100 | | | | 18,938,947 | |
Time Warner Cable, Inc. (United States) | | | 269,271 | | | | 26,170,448 | |
Time Warner, Inc. (United States) | | | 412,466 | | | | 19,728,249 | |
| | | | | | | | |
| | | | | | | 194,158,437 | |
RETAILING: 1.2% | |
J. C. Penney Co., Inc.(a) (United States) | | | 1,157,000 | | | | 22,804,470 | |
Liberty Interactive, Series A(a) (United States) | | | 482,357 | | | | 9,492,786 | |
| | | | | | | | |
| | | | | | | 32,297,256 | |
| | | | | | | | |
| | | | | | | 319,929,078 | |
| CONSUMER STAPLES: 2.7% | |
FOOD & STAPLES RETAILING: 0.5% | |
Wal-Mart Stores, Inc. (United States) | | | 197,600 | | | | 13,482,248 | |
|
FOOD, BEVERAGE & TOBACCO: 2.2% | |
Anadolu Efes Biracilik ve Malt Sanayii AS (Turkey) | | | 1,602,600 | | | | 23,128,455 | |
Diageo PLC ADR (United Kingdom) | | | 112,800 | | | | 13,150,224 | |
Unilever PLC (United Kingdom) | | | 616,700 | | | | 23,408,587 | |
| | | | | | | | |
| | | | | | | 59,687,266 | |
| | | | | | | | |
| | | | | | | 73,169,514 | |
| ENERGY: 4.7% | |
Baker Hughes, Inc. (United States) | | | 642,387 | | | | 26,235,085 | |
Occidental Petroleum Corp. (United States) | | | 405,725 | | | | 31,082,592 | |
Royal Dutch Shell PLC ADR (United Kingdom) | | | 373,580 | | | | 25,758,341 | |
Schlumberger, Ltd.
(Curacao/United States) | | | 642,100 | | | | 44,491,109 | |
| | | | | | | | |
| | | | | | | 127,567,127 | |
| | | | | | | | |
| | |
| | | SHARES | | | VALUE | |
| FINANCIALS: 24.7% | |
BANKS: 9.0% | |
Banco Santander SA (Spain) | | | 3,343,079 | | | $ | 26,955,528 | |
Barclays PLC (United Kingdom) | | | 11,003,400 | | | | 47,516,889 | |
BB&T Corp. (United States) | | | 534,200 | | | | 15,550,562 | |
HSBC Holdings PLC (United Kingdom) | | | 2,568,162 | | | | 27,163,011 | |
Mitsubishi UFJ Financial Group, Inc. (Japan) | | | 2,197,200 | | | | 11,823,440 | |
Standard Chartered PLC (United Kingdom) | | | 1,051,683 | | | | 26,658,762 | |
SunTrust Banks, Inc. (United States) | | | 413,795 | | | | 11,731,088 | |
UniCredit SPA(a) (Italy) | | | 2,984,199 | | | | 14,736,248 | |
Wells Fargo & Co. (United States) | | | 1,747,773 | | | | 59,738,881 | |
| | | | | | | | |
| | | | | | | 241,874,409 | |
DIVERSIFIED FINANCIALS: 11.0% | |
Bank of America Corp. (United States) | | | 3,760,300 | | | | 43,619,480 | |
Bank of New York Mellon Corp. (United States) | | | 1,814,400 | | | | 46,630,080 | |
Capital One Financial Corp. (United States) | | | 751,900 | | | | 43,557,567 | |
Charles Schwab Corp. (United States) | | | 3,353,300 | | | | 48,153,388 | |
Credit Suisse Group AG (Switzerland) | | | 2,076,416 | | | | 52,100,055 | |
Goldman Sachs Group, Inc. (United States) | | | 339,200 | | | | 43,268,352 | |
Haci Omer Sabanci Holding AS (Turkey) | | | 3,344,188 | | | | 18,484,826 | |
| | | | | | | | |
| | | | | | | 295,813,748 | |
INSURANCE: 4.1% | |
AEGON NV (Netherlands) | | | 7,268,833 | | | | 46,322,889 | |
Dai-ichi Life Insurance Co., Ltd. (Japan) | | | 10,300 | | | | 14,492,562 | |
Swiss Life Holding AG (Switzerland) | | | 70,600 | | | | 9,422,545 | |
Swiss Re AG (Switzerland) | | | 545,300 | | | | 39,798,316 | |
| | | | | | | | |
| | | | | | | 110,036,312 | |
REAL ESTATE: 0.6% | |
BR Malls Participacoes SA (Brazil) | | | 703,600 | | | | 9,321,289 | |
Hang Lung Group, Ltd. (Hong Kong) | | | 1,327,500 | | | | 7,605,055 | |
| | | | | | | | |
| | | | | | | 16,926,344 | |
| | | | | | | | |
| | | | | | | 664,650,813 | |
| HEALTH CARE: 14.4% | |
HEALTH CARE EQUIPMENT & SERVICES: 0.7% | |
Boston Scientific Corp.(a) (United States) | | | 1,520,200 | | | | 8,710,746 | |
Medtronic, Inc. (United States) | | | 221,200 | | | | 9,073,624 | |
| | | | | | | | |
| | | | | | | 17,784,370 | |
PHARMACEUTICALS, BIOTECHNOLOGY & LIFE
SCIENCES: 13.7% | |
Bayer AG (Germany) | | | 494,520 | | | | 46,960,868 | |
GlaxoSmithKline PLC (United Kingdom) | | | 1,022,100 | | | | 22,191,410 | |
GlaxoSmithKline PLC ADR (United Kingdom) | | | 782,100 | | | | 33,997,887 | |
Merck & Co., Inc. (United States) | | | 1,088,000 | | | | 44,542,720 | |
| | |
| See accompanying Notes to Financial Statements | | DODGE & COX GLOBAL STOCK FUND §PAGE 6 |
| | | | |
| PORTFOLIO OF INVESTMENTS | | | December 31, 2012 | |
| | | | | | | | |
| COMMON STOCKS (continued) | |
| | |
| | | SHARES | | | VALUE | |
Novartis AG (Switzerland) | | | 278,700 | | | $ | 17,644,919 | |
Novartis AG ADR (Switzerland) | | | 609,700 | | | | 38,594,010 | |
Pfizer, Inc. (United States) | | | 692,000 | | | | 17,355,360 | |
Roche Holding AG (Switzerland) | | | 345,800 | | | | 70,448,072 | |
Sanofi (France) | | | 824,862 | | | | 78,225,965 | |
| | | | | | | | |
| | | | | | | 369,961,211 | |
| | | | | | | | |
| | | | | | | 387,745,581 | |
| INDUSTRIALS: 8.1% | |
CAPITAL GOODS: 6.7% | |
General Electric Co. (United States) | | | 1,936,700 | | | | 40,651,333 | |
Koninklijke Philips Electronics NV (Netherlands) | | | 1,356,213 | | | | 36,384,892 | |
Mitsubishi Electric Corp. (Japan) | | | 2,706,700 | | | | 23,037,925 | |
Nidec Corp. (Japan) | | | 529,900 | | | | 30,985,820 | |
Schneider Electric SA (France) | | | 567,978 | | | | 42,361,806 | |
Wienerberger AG (Austria) | | | 899,280 | | | | 8,284,553 | |
| | | | | | | | |
| | | | | | | 181,706,329 | |
COMMERCIAL & PROFESSIONAL SERVICES: 0.2% | |
Tyco International, Ltd. (Switzerland) | | | 149,900 | | | | 4,384,575 | |
|
TRANSPORTATION: 1.2% | |
FedEx Corp. (United States) | | | 351,700 | | | | 32,257,924 | |
| | | | | | | | |
| | | | | | | 218,348,828 | |
| INFORMATION TECHNOLOGY: 16.0% | |
SOFTWARE & SERVICES: 8.8% | |
Adobe Systems, Inc.(a) (United States) | | | 705,254 | | | | 26,573,971 | |
Amdocs, Ltd. (Guernsey/United States) | | | 353,219 | | | | 12,005,914 | |
AOL, Inc.(a) (United States) | | | 540,769 | | | | 16,012,170 | |
eBay, Inc.(a) (United States) | | | 431,700 | | | | 22,025,334 | |
Google, Inc., Class A(a) (United States) | | | 44,900 | | | | 31,850,713 | |
Microsoft Corp. (United States) | | | 2,503,700 | | | | 66,923,901 | |
Nintendo Co., Ltd. (Japan) | | | 279,400 | | | | 29,812,044 | |
Symantec Corp.(a) (United States) | | | 1,057,200 | | | | 19,885,932 | |
Synopsys, Inc.(a) (United States) | | | 346,800 | | | | 11,042,112 | |
| | | | | | | | |
| | | | | | | 236,132,091 | |
TECHNOLOGY, HARDWARE & EQUIPMENT: 7.2% | |
Corning, Inc. (United States) | | | 1,000,700 | | | | 12,628,834 | |
Hewlett-Packard Co. (United States) | | | 5,148,400 | | | | 73,364,700 | |
NetApp, Inc.(a) (United States) | | | 871,300 | | | | 29,232,115 | |
Nokia Oyj (Finland) | | | 6,458,425 | | | | 25,398,389 | |
TE Connectivity, Ltd. (Switzerland) | | | 574,115 | | | | 21,311,149 | |
Telefonaktiebolaget LM Ericsson (Sweden) | | | 1,594,288 | | | | 16,035,769 | |
Xerox Corp. (United States) | | | 2,569,500 | | | | 17,523,990 | |
| | | | | | | | |
| | | | | | | 195,494,946 | |
| | | | | | | | |
| | | | | | | 431,627,037 | |
| MATERIALS: 6.4% | |
Akzo Nobel NV (Netherlands) | | | 312,038 | | | | 20,590,459 | |
Celanese Corp., Series A (United States) | | | 712,600 | | | | 31,732,078 | |
Cemex SAB de CV ADR(a) (Mexico) | | | 1,312,639 | | | | 12,955,747 | |
| | | | | | | | |
| | |
| | | SHARES | | | VALUE | |
Domtar Corp. (United States) | | | 262,716 | | | $ | 21,942,040 | |
Dow Chemical Co. (United States) | | | 496,000 | | | | 16,030,720 | |
Duratex SA (Brazil) | | | 1,816,600 | | | | 13,272,323 | |
Lafarge SA (France) | | | 883,995 | | | | 56,644,759 | |
| | | | | | | | |
| | | | | | | 173,168,126 | |
| TELECOMMUNICATION SERVICES: 8.0% | |
America Movil SAB de CV, Series L (Mexico) | | | 21,172,000 | | | | 24,388,346 | |
Bharti Airtel, Ltd. (India) | | | 34,800 | | | | 202,440 | |
Millicom International Cellular SA SDR (Luxembourg) | | | 394,000 | | | | 34,244,993 | |
MTN Group, Ltd. (South Africa) | | | 1,612,100 | | | | 33,883,952 | |
Sprint Nextel Corp.(a) (United States) | | | 9,605,600 | | | | 54,463,752 | |
Telecom Italia SPA-RSP (Italy) | | | 31,300,504 | | | | 24,768,169 | |
Telefonica SA (Spain) | | | 255,460 | | | | 3,468,824 | |
Telekom Austria AG (Austria) | | | 955,114 | | | | 7,227,616 | |
Vodafone Group PLC (United Kingdom) | | | 13,333,000 | | | | 33,530,710 | |
| | | | | | | | |
| | | | | | | 216,178,802 | |
| | | | | | | | |
TOTAL COMMON STOCKS
(Cost $2,375,347,877) | | | | | | $ | 2,612,384,906 | |
|
| PREFERRED STOCKS: 1.5% | |
| ENERGY: 1.4% | |
Petroleo Brasileiro SA ADR (Brazil) | | | 1,871,100 | | | | 36,112,230 | |
|
| FINANCIALS: 0.1% | |
DIVERSIFIED FINANCIALS: 0.1% | |
Credit Suisse Group V, Ltd.(b) (Guernsey/Switzerland) | | | 2,469 | | | | 3,711,666 | |
| | | | | | | | |
TOTAL PREFERRED STOCKS
(Cost $45,309,671) | | | | | | $ | 39,823,896 | |
| | |
| PAGE 7 § DODGE & COX GLOBAL STOCK FUND | | See accompanying Notes to Financial Statements |
| | | | |
| PORTFOLIO OF INVESTMENTS | | | December 31, 2012 | |
| | | | | | | | |
| SHORT-TERM INVESTMENTS: 1.3% | |
| | |
| | | PAR VALUE | | | VALUE | |
MONEY MARKET FUND: 0.1% | |
SSgA U.S. Treasury Money Market Fund | | $ | 2,656,902 | | | $ | 2,656,902 | |
|
REPURCHASE AGREEMENT: 1.2% | |
Fixed Income Clearing Corporation(c)
0.11%, dated 12/31/12, due 1/2/13, maturity value $32,587,199 | | | 32,587,000 | | | | 32,587,000 | |
| | | | | | | | |
TOTAL SHORT-TERM INVESTMENTS
(Cost $35,243,902) | | | $ | 35,243,902 | |
| | | | | | | | |
TOTAL INVESTMENTS
(Cost $2,455,901,450) | | | 99.7 | % | | $ | 2,687,452,704 | |
| | |
OTHER ASSETS LESS LIABILITIES | | | 0.3 | % | | | 7,264,447 | |
| | | | | | | | |
| NET ASSETS | | | 100.0 | % | | $ | 2,694,717,151 | |
| | | | | | | | |
| (b) | Subordinated Mandatory and Contingent Convertible Securities (MACCS) received through a rights offering on July 31, 2012. The MACCS will be mandatorily converted into Credit Suisse Group AG shares on March 29, 2013. Each MACCS has a principal amount of CHF 1,000 and bears interest equivalent to a rate of 4% per annum, payable upon conversion of the MACCS. This security (0.1% of net assets) is deemed to be illiquid by Dodge & Cox, investment manager, pursuant to procedures approved by the Board of Trustees. |
| (c) | Repurchase agreement is collateralized by U.S. Treasury Note 0.25%, 4/3014. Total collateral value is $33,241,500. |
In determining a company’s country designation, the Fund generally references the country of incorporation. In cases where the Fund considers the country of incorporation to be a “jurisdiction of convenience” chosen primarily for tax purposes, the Fund uses the country designation of an appropriate broad-based market index. In that circumstance, two countries are listed—the country of incorporation and the country designated by an appropriate index, respectively.
ADR: American Depositary Receipt
SDR: Swedish Depository Receipt
Forward Foreign Currency Contracts
As of December 31, 2012, open forward foreign currency contracts are summarized as follows:
| | | | | | | | | | | | |
| | | | | Contract Amount | | | | |
| Counterparty | | Settlement
Date | | Receive
U.S.
Dollar | | Deliver
Foreign
Currency | | | Unrealized
Appreciation | |
| Contracts to sell Japanese Yen: | | | | | |
| Deutsche Bank | | 1/23/2013 | | 6,061,524 | | | 480,000,000 | | | $ | 520,307 | |
| UBS | | 1/23/2013 | | 6,183,668 | | | 490,000,000 | | | | 527,009 | |
| Barclays | | 3/6/2013 | | 5,485,363 | | | 450,000,000 | | | | 288,724 | |
| | | | | | | | | | | | |
| | | | | | | | | | $ | 1,336,040 | |
| | | | | | | | | | | | |
| | | | | | | | | | | | | |
| | |
| See accompanying Notes to Financial Statements | | DODGE & COX GLOBAL STOCK FUND §PAGE 8 |
| | | | |
STATEMENT OF ASSETS AND LIABILITIES | |
| |
| | | December 31, 2012 | |
ASSETS: | | | | |
Investments, at value (cost $2,455,901,450) | | $ | 2,687,452,704 | |
Cash denominated in foreign currency (cost $443) | | | 446 | |
Receivable for investments sold | | | 727,477 | |
Unrealized appreciation on foreign currency contracts | | | 1,336,040 | |
Receivable for Fund shares sold | | | 3,012,271 | |
Dividends and interest receivable | | | 4,665,586 | |
Prepaid expenses and other assets | | | 13,357 | |
| | | | |
| | | 2,697,207,881 | |
| | | | |
LIABILITIES: | | | | |
Payable for Fund shares redeemed | | | 951,038 | |
Management fees payable | | | 1,342,132 | |
Accrued expenses | | | 197,560 | |
| | | | |
| | | 2,490,730 | |
| | | | |
NET ASSETS | | $ | 2,694,717,151 | |
| | | | |
NET ASSETS CONSIST OF: | | | | |
Paid in capital | | $ | 2,461,863,960 | |
Undistributed net investment income | | | 305,276 | |
Accumulated net realized loss | | | (357,864 | ) |
Net unrealized appreciation | | | 232,905,779 | |
| | | | |
| | $ | 2,694,717,151 | |
| | | | |
Fund shares outstanding (par value $0.01 each, unlimited shares authorized) | | | 299,715,343 | |
Net asset value per share | | | $8.99 | |
| |
STATEMENT OF OPERATIONS | | | | |
| |
| | | Year Ended
December 31, 2012 | |
INVESTMENT INCOME: | | | | |
Dividends (net of foreign taxes of $2,853,329) | | $ | 56,786,099 | |
Interest | | | 70,254 | |
| | | | |
| | | 56,856,353 | |
| | | | |
EXPENSES: | | | | |
Management fees | | | 13,233,494 | |
Custody and fund accounting fees | | | 226,862 | |
Transfer agent fees | | | 242,958 | |
Professional services | | | 154,341 | |
Shareholder reports | | | 34,220 | |
Registration fees | | | 150,335 | |
Trustees’ fees | | | 190,500 | |
Miscellaneous | | | 76,523 | |
| | | | |
| | | 14,309,233 | |
| | | | |
NET INVESTMENT INCOME | | | 42,547,120 | |
| | | | |
REALIZED AND UNREALIZED GAIN: | | | | |
Net realized gain (net of foreign taxes of $83,097) | | | | |
Investments | | | 45,961,491 | |
Foreign currency transactions | | | 1,133,844 | |
Net change in unrealized appreciation/depreciation | | | | |
Investments | | | 333,522,857 | |
Foreign currency transactions | | | 816,103 | |
| | | | |
Net realized and unrealized gain | | | 381,434,295 | |
| | | | |
NET INCREASE IN NET ASSETS
FROM OPERATIONS | | $ | 423,981,415 | |
| | | | |
| | | | | | | | |
STATEMENT OF CHANGES IN NET ASSETS | |
| | |
| | | Year Ended
December 31, 2012
| | | Year Ended
December 31, 2011
| |
OPERATIONS: | | | | | | | | |
Net investment income | | $ | 42,547,120 | | | $ | 37,205,930 | |
Net realized gain | | | 47,095,335 | | | | 81,109,924 | |
Net change in unrealized appreciation/depreciation | | | 334,338,960 | | | | (358,037,218 | ) |
| | | | | | | | |
| | | 423,981,415 | | | | (239,721,364 | ) |
| | | | | | | | |
| | |
DISTRIBUTIONS TO SHAREHOLDERS FROM: | | | | | | | | |
Net investment income | | | (42,084,059 | ) | | | (35,098,359 | ) |
Net realized gain | | | (48,458,943 | ) | | | (12,720,210 | ) |
| | | | | | | | |
Total distributions | | | (90,543,002 | ) | | | (47,818,569 | ) |
| | | | | | | | |
| | |
FUND SHARE TRANSACTIONS: | | | | | | | | |
Proceeds from sale of shares | | | 761,898,134 | | | | 625,171,940 | |
Reinvestment of distributions | | | 87,874,010 | | | | 46,192,193 | |
Cost of shares redeemed | | | (363,483,545 | ) | | | (325,573,001 | ) |
| | | | | | | | |
Net increase from Fund
share transactions | | | 486,288,599 | | | | 345,791,132 | |
| | | | | | | | |
Total increase in net assets | | | 819,727,012 | | | | 58,251,199 | |
| | |
NET ASSETS: | | | | | | | | |
Beginning of year | | | 1,874,990,139 | | | | 1,816,738,940 | |
| | | | | | | | |
End of year (including undistributed net investment income of $305,276 and $88,406, respectively) | | $ | 2,694,717,151 | | | $ | 1,874,990,139 | |
| | | | | | | | |
| | |
SHARE INFORMATION: | | | | | | | | |
Shares sold | | | 88,250,537 | | | | 72,510,079 | |
Distributions reinvested | | | 9,742,130 | | | | 6,102,007 | |
Shares redeemed | | | (42,378,520 | ) | | | (38,661,666 | ) |
| | | | | | | | |
Net increase in shares outstanding | | | 55,614,147 | | | | 39,950,420 | |
| | | | | | | | |
| | |
| PAGE 9 § DODGE & COX GLOBAL STOCK FUND | | See accompanying Notes to Financial Statements |
NOTES TO FINANCIAL STATEMENTS
NOTE 1—ORGANIZATION AND SIGNIFICANT ACCOUNTING POLICIES
Dodge & Cox Global Stock Fund (the “Fund”) is one of the series constituting the Dodge & Cox Funds (the “Trust” or the “Funds”). The Trust is organized as a Delaware statutory trust and is registered under the Investment Company Act of 1940, as amended, as a diversified, open-end management investment company. The Fund commenced operations on May 1, 2008, and seeks long-term growth of principal and income. The Fund invests primarily in a diversified portfolio of U.S. and foreign stocks. Foreign investing, especially in developing countries, has special risks such as currency and market volatility and political and social instability. These and other risk considerations are discussed in the Fund’s Prospectus.
The financial statements have been prepared in conformity with accounting principles generally accepted in the United States of America, which require the use of estimates and assumptions by management. Actual results may differ from those estimates. Significant accounting policies are as follows:
Security valuation The Fund’s net assets are valued as of the close of trading on the New York Stock Exchange (NYSE), generally 4:00 p.m. Eastern Time, each day that the NYSE is open for business. Listed securities are valued at market, using the official quoted close price or the last sale on the date of determination or, if not available, at the mean between the exchange listed bid and ask prices. A security that is listed or traded on more than one exchange is valued at the quotation on the exchange determined to be the primary market for such security. Security values are not discounted based on the size of the Fund’s position. Short-term securities are valued at amortized cost, which approximates current value.
Investments initially valued in currencies other than the U.S. dollar are converted to the U.S. dollar using prevailing exchange rates. As a result, the Fund’s net asset value per share (NAV) may be affected by changes in the value of currencies in relation to the U.S. dollar.
If market quotations are not readily available or if a security’s value has materially changed after the close of the security’s primary market but before the close of trading on the NYSE, the security is valued at fair value as determined in good faith by or under the direction of the Board of Trustees. The Fund may use fair value pricing in
calculating its NAV when, for example, (i) the primary market for a security is closed or if trading of a security is suspended or limited, (ii) the Fund determines that the price provided by a pricing service is inaccurate or unreliable, or (iii) the Fund determines that a significant event affecting the value of a security has occurred before the close of the NYSE but after the close of the security’s primary market. An event is considered significant if there is both an affirmative expectation that the security’s value will materially change in response to the event and a reasonable basis exists for quantifying a resulting change in value. Because trading in securities on most non-U.S. exchanges is normally completed before the close of the NYSE, the value of foreign securities can change by the time the Fund calculates its NAV. To address these changes, the Fund may utilize adjustment factors provided by an independent pricing service to systematically value foreign securities at fair value. These adjustment factors are based on statistical analyses of subsequent movements and changes in securities indices, specific security prices, and exchange rates in foreign markets. When fair value pricing is employed, the prices of securities used by the Fund to calculate its net asset value may differ from quoted or published prices for the same securities. In addition, fair values may not reflect the price that the Fund could obtain for a security if it were to dispose of that security at the time of pricing.
Security transactions, investment income, expenses, and distributions Security transactions are recorded on the trade date. Realized gains and losses on securities sold are determined on the basis of identified cost.
Dividend income and corporate action transactions are recorded on the ex-dividend date, or when the Fund first learns of the dividend/corporate action if the ex-dividend date has passed. Non-cash dividends included in dividend income, if any, are recorded at the fair market value of the securities received. Dividends characterized as return of capital are recorded as a reduction of cost of investments and/or realized gain. Interest income is recorded on the accrual basis.
Expenses are recorded on the accrual basis. Most expenses of the Trust can be directly attributed to a specific series. Expenses which cannot be directly attributed are allocated among the Funds in the Trust based on relative net assets or other expense methodologies determined by the nature of the expense.
DODGE & COX GLOBAL STOCK FUND §PAGE 10
NOTES TO FINANCIAL STATEMENTS
Distributions to shareholders are recorded on the ex-dividend date.
Repurchase agreements The Fund enters into repurchase agreements, secured by U.S. government or agency securities, which involve the purchase of securities from a counterparty with a simultaneous commitment to resell the securities at an agreed-upon date and price. It is the Fund’s policy that its custodian take possession of the underlying collateral securities, the fair value of which exceeds the principal amount of the repurchase transaction, including accrued interest, at all times. In the event of default by the counterparty, the Fund has the contractual right to liquidate the collateral securities and to apply the proceeds in satisfaction of the obligation.
Foreign taxes The Fund is subject to foreign taxes which may be imposed by certain countries in which the Fund invests. The Fund endeavors to record foreign taxes based on applicable foreign tax law. Withholding taxes are incurred on certain foreign dividends and are accrued at the time the associated dividend is recorded. The Fund files withholding tax reclaims in certain jurisdictions to recover a portion of amounts previously withheld. The Fund records a reclaim receivable based on, among other things, a jurisdiction’s legal obligation to pay reclaims as well as payment history and market convention. In consideration of recent decisions rendered by European courts, the Fund has filed for additional reclaims related to prior years. However, a corresponding receivable amount has not yet been recorded because there is no historical precedent for collecting such reclaims and the amount, if any, that the Fund might recover is uncertain. Such amounts, if and when received, could result in an increase in the Fund’s net asset value per share.
Capital gains taxes are incurred upon disposition of certain foreign securities. Capital gains taxes on appreciated securities are accrued as unrealized losses and are reflected as realized losses upon the sale of the related security. Currency taxes may be incurred when the Fund purchases certain foreign currencies related to securities transactions and are recorded as realized losses on foreign currency transactions.
Forward foreign currency contracts A forward foreign currency contract represents an obligation to purchase or sell a specific foreign currency at a future date and at a price set at the time of the contract. Losses from these transactions may arise from unfavorable changes in
currency values or if the counterparties do not perform under a contract’s terms.
The values of the forward foreign currency contracts are adjusted daily based on the applicable exchange rate of the underlying currency. Changes in the value of open contracts are recorded as unrealized appreciation or depreciation in the Statement of Operations. When the forward contract is closed, the Fund records a realized gain or loss in the Statement of Operations equal to the difference between the value at the time the contract was opened and the value at the time it was closed.
During the year, the Fund maintained foreign currency contracts to hedge foreign currency risks associated with portfolio investments denominated in Japanese Yen and Swiss Francs. These forward foreign currency contracts had U.S. dollar total values of approximately 1% of net assets during the year.
Foreign currency translation The books and records of the Funds are maintained in U.S. dollars. Foreign currency amounts are translated into U.S. dollars at the prevailing exchange rates of such currencies against the U.S. dollar. The market value of investment securities and other assets and liabilities are translated at the exchange rate as of the valuation date. Purchases and sales of investment securities, income, and expenses are translated at the exchange rate prevailing on the transaction date.
Reported realized and unrealized gain (loss) on investments include foreign currency gain (loss) related to investment transactions.
Reported realized and unrealized gain (loss) on foreign currency transactions include the following: holding/disposing of foreign currency and forward foreign currency contracts, the difference between the trade and settlement dates on securities transactions, the difference between the accrual and payment dates on dividends, and currency losses on the purchase of foreign currency in certain countries that impose taxes on such transactions.
Indemnification Under the Trust’s organizational documents, its officers and trustees are indemnified against certain liabilities arising out of the performance of their duties to the Trust. In addition, in the normal course of business the Trust enters into contracts that provide general indemnities to other parties. The Trust’s maximum exposure under these arrangements is unknown as this would involve future claims that may be made against the Trust that have not yet occurred.
PAGE 11 § DODGE & COX GLOBAL STOCK FUND
NOTES TO FINANCIAL STATEMENTS
NOTE 2—VALUATION MEASUREMENTS
Various inputs are used in determining the value of the Fund’s investments and other financial instruments. These inputs are summarized in the three broad levels listed below.
| § | | Level 1: Quoted prices in active markets for identical securities |
| § | | Level 2: Other significant observable inputs (including quoted prices for similar securities, market indices, interest rates, credit risk, etc.) |
| § | | Level 3: Significant unobservable inputs (including Fund management’s assumptions in determining the fair value of investments) |
The inputs or methodology used for valuing securities are not necessarily an indication of the risk associated with investing in those securities.
The following is a summary of the inputs used to value the Fund’s holdings as of December 31, 2012:
| | | | | | | | |
| Security Classification(a) | | LEVEL 1
(Quoted Prices) | | | LEVEL 2
(Other Significant
Observable Inputs) | |
Securities | | | | | | | | |
Common Stocks | | | | | | | | |
Consumer Discretionary | | $ | 153,120,279 | | | $ | 166,808,799 | |
Consumer Staples | | | 26,632,472 | | | | 46,537,042 | |
Energy | | | 127,567,127 | | | | — | |
Financials | | | 312,249,398 | | | | 352,401,415 | |
Health Care | | | 152,274,347 | | | | 235,471,234 | |
Industrials | | | 77,293,832 | | | | 141,054,996 | |
Information Technology | | | 360,380,835 | | | | 71,246,202 | |
Materials | | | 82,660,585 | | | | 90,507,541 | |
Telecommunication Services | | | 78,852,098 | | | | 137,326,704 | |
Preferred Stocks | | | | | | | | |
Energy | | | 36,112,230 | | | | — | |
Financials | | | — | | | | 3,711,666 | |
Short-term Investments | | | | | | | | |
Money Market Fund | | | 2,656,902 | | | | — | |
Repurchase Agreement | | | — | | | | 32,587,000 | |
| | | | | | | | |
Total Securities | | $ | 1,409,800,105 | | | $ | 1,277,652,599 | |
| | | | | | | | |
Other Financial Instruments | | | | | | | | |
Forward Foreign Currency Contracts | | $ | — | | | $ | 1,336,040 | (b) |
| | | | | | | | | |
| (a) | Transfers during the period between Level 1 and Level 2 relate to the use of systematic fair valuation. On days when systematic fair valuation is used, securities whose primary market closes before the NYSE are classified as Level 2. There were no Level 3 securities at December 31, 2012 and 2011, and there were no transfers to Level 3 during the year. |
| (b) | Represents net unrealized appreciation on forward foreign currency contracts. |
NOTE 3—RELATED PARTY TRANSACTIONS
Management fees Under a written agreement approved by a unanimous vote of the Board of Trustees, the Fund pays an annual management fee of 0.60% of the Fund’s average daily net assets to Dodge & Cox, investment manager of the Fund.
Fund officers and trustees All officers and three of the trustees of the Trust are officers or employees of Dodge & Cox. The Trust pays a fee only to those trustees who are not affiliated with Dodge & Cox.
NOTE 4—INCOME TAX INFORMATION AND DISTRIBUTIONS TO SHAREHOLDERS
A provision for federal income taxes is not required since the Fund intends to qualify as a regulated investment company under Subchapter M of the Internal Revenue Code and distribute all of its taxable income to shareholders. Distributions are determined in accordance with income tax regulations, and such amounts may differ from net investment income and realized gains for financial reporting purposes. Financial reporting records are adjusted for permanent book/tax differences at year end to reflect tax character.
Book/tax differences are primarily due to differing treatments of wash sales, net short-term realized gain (loss) on investments, foreign capital gain taxes, and foreign currency realized gain (loss). At December 31, 2012, the cost of investments for federal income tax purposes was $2,466,517,298.
Distributions during the years ended December 31, 2012 and 2011, were characterized as follows for federal income tax purposes:
| | | | | | | | |
| | | Year Ended December 31, 2012 | | | Year Ended December 31, 2011 | |
Ordinary income | | | $43,399,487 | | | | $35,098,359 | |
| | | ($0.150 per share) | | | | ($0.149 per share) | |
| | |
Long-term capital gain | | | $47,143,515 | | | | $12,720,210 | |
| | | ($0.162 per share) | | | | ($0.054 per share) | |
DODGE & COX GLOBAL STOCK FUND §PAGE 12
NOTES TO FINANCIAL STATEMENTS
At December 31, 2012, the tax basis components of distributable earnings were as follows:
| | | | |
Unrealized appreciation | | $ | 452,492,220 | |
Unrealized depreciation | | | (231,556,814 | ) |
| | | | |
Net unrealized appreciation | | | 220,935,406 | |
Undistributed ordinary income | | | 365,710 | |
Undistributed long-term capital gain | | | 11,533,589 | |
Under the Regulated Investment Company Modernization Act of 2010, capital losses incurred by the Fund after January 1, 2011, will not be subject to expiration. In addition, such losses must be utilized prior to the losses incurred in the years preceding enactment. (The Fund had net capital gains in 2011 and 2012.)
Fund management has reviewed the tax positions for open periods (three years and four years, respectively, from filing the Fund’s Federal and State tax returns) as applicable to the Fund, and has determined that no provision for income tax is required in the Fund’s financial statements.
NOTE 5—LOAN FACILITIES
Pursuant to an exemptive order issued by the Securities and Exchange Commission (SEC), the Fund may participate in an interfund lending facility (Facility). The Facility allows the Fund to borrow money from or loan money to the Funds. Loans under the Facility are made for temporary or emergency purposes, such as to fund shareholder redemption requests. Interest on borrowings is the average of the current repurchase agreement rate and the bank loan rate. There was no activity in the Facility during the period.
All the Funds in the Trust participate in a $500 million committed credit facility (Line of Credit) with State Street Bank and Trust Company, to be utilized for temporary or emergency purposes to fund shareholder redemptions or for other short-term liquidity purposes. The maximum amount available to the Fund is $250 million. Each Fund pays an annual commitment fee on its pro-rata portion of the Line of Credit. The Fund’s commitment fee for the year ended December 31, 2012, amounted to $8,899 and is reflected as a Miscellaneous
Expense in the Statement of Operations. Interest on borrowings is charged at the prevailing rate. There were no borrowings on the Line of Credit during the period.
NOTE 6—PURCHASES AND SALES OF INVESTMENTS
For the year ended December 31, 2012, purchases and sales of securities, other than short-term securities, aggregated $711,572,310 and $268,888,715, respectively.
NOTE 7—ACCOUNTING PRONOUNCEMENTS
Effective January 1, 2013, the Fund will adopt Accounting Standards Update (ASU) No. 2011-11, Balance Sheet (Topic 210): Disclosures about Offsetting Assets and Liabilities and ASU No. 2013-01, Balance Sheet (Topic 210): Clarifying the Scope of Disclosures about Offsetting Assets and Liabilities. These amendments to Topic 210 require enhanced disclosures about offsetting of financial assets and liabilities, including derivative instruments, to enable investors to understand the effect of these arrangements on a fund’s financial position. Management believes the adoption of these ASUs will not have a material impact on the Fund’s financial statements.
NOTE 8—SUBSEQUENT EVENTS
Fund management has determined that no material events or transactions occurred subsequent to December 31, 2012, and through the date of the Fund’s financial statements issuance, which require additional disclosure in the Fund’s financial statements.
PAGE 13 § DODGE & COX GLOBAL STOCK FUND
FINANCIAL HIGHLIGHTS
| | | | | | | | | | | | | | | | | | | | |
SELECTED DATA AND RATIOS (for a share outstanding throughout the period) | | Year Ended December 31, | | |
May 1, 2008 (inception)
through December 31, | |
| | | 2012 | | | 2011 | | | 2010 | | | 2009 | | | 2008 | |
| | | | |
Net asset value, beginning of period | | | $7.68 | | | | $8.90 | | | | $7.91 | | | | $5.34 | | | | $10.00 | |
Income from investment operations: | | | | | | | | | | | | | | | | | | | | |
Net investment income | | | 0.15 | | | | 0.16 | | | | 0.08 | | | | 0.06 | | | | 0.04 | |
Net realized and unrealized gain (loss) | | | 1.48 | | | | (1.18 | ) | | | 0.99 | | | | 2.57 | | | | (4.66 | ) |
| | | | |
Total from investment operations | | | 1.63 | | | | (1.02 | ) | | | 1.07 | | | | 2.63 | | | | (4.62 | ) |
| | | | |
Distributions to shareholders from: | | | | | | | | | | | | | | | | | | | | |
Net investment income | | | (0.15 | ) | | | (0.15 | ) | | | (0.08 | ) | | | (0.06 | ) | | | (0.04 | ) |
Net realized gain | | | (0.17 | ) | | | (0.05 | ) | | | — | | | | — | | | | — | |
| | | | |
Total distributions | | | (0.32 | ) | | | (0.20 | ) | | | (0.08 | ) | | | (0.06 | ) | | | (0.04 | ) |
| | | | |
Net asset value, end of period | | | $8.99 | | | | $7.68 | | | | $8.90 | | | | $7.91 | | | | $ 5.34 | |
| | | | |
Total return | | | 21.11 | % | | | (11.39 | )% | | | 13.51 | % | | | 49.18 | % | | | (46.21 | )% |
Ratios/supplemental data: | | | | | | | | | | | | | | | | | | | | |
Net assets, end of period (millions) | | | $2,695 | | | | $1,875 | | | | $1,817 | | | | $914 | | | | $468 | |
Ratio of expenses to average net assets | | | 0.65 | % | | | 0.66 | % | | | 0.69 | % | | | 0.74 | % | | | 0.87 | %(a) |
Ratio of net investment income to average net assets | | | 1.93 | % | | | 1.94 | % | | | 1.19 | % | | | 1.09 | % | | | 1.39 | %(a) |
Portfolio turnover rate | | | 12 | % | | | 19 | % | | | 14 | % | | | 20 | % | | | 10 | % |
See accompanying Notes to Financial Statements
REPORT OF INDEPENDENT REGISTERED PUBLIC ACCOUNTING FIRM
To the Trustees of Dodge & Cox Funds and Shareholders of Dodge & Cox Global Stock Fund
In our opinion, the accompanying statement of assets and liabilities, including the portfolio of investments, and the related statements of operations and of changes in net assets and the financial highlights present fairly, in all material respects, the financial position of Dodge & Cox Global Stock Fund (the “Fund”, one of the series constituting Dodge & Cox Funds) at December 31, 2012, the results of its operations for the year then ended, the changes in its net assets for each of the two years in the period then ended and the financial highlights for the periods presented in conformity with accounting principles generally accepted in the United States of America. These financial statements and financial highlights (hereafter referred to as “financial statements”) are the responsibility of the Fund’s management; our responsibility is to express an opinion on these financial statements based on our audits. We conducted our audits of these financial statements in accordance with the standards of the Public Company Accounting Oversight Board (United States). Those standards require that we plan and perform the audit to obtain reasonable assurance about whether the financial statements are free of material misstatement. An audit includes examining, on a test basis, evidence supporting the amounts and disclosures in the financial statements, assessing the accounting principles used and significant estimates made by management, and evaluating the overall financial statement presentation. We believe that our audits, which included confirmation of securities at December 31, 2012, by correspondence with the custodian and brokers, provide a reasonable basis for our opinion.
PricewaterhouseCoopers LLP
San Francisco, California
February 20, 2013
DODGE & COX GLOBAL STOCK FUND §PAGE 14
SPECIAL 2012 TAX INFORMATION
(unaudited)
The following information is provided pursuant to provisions of the Internal Revenue Code:
In 2012, the Fund elected to pass through to shareholders foreign source income of $42,342,989 and foreign taxes paid of $2,936,426.
The Fund designates up to a maximum of $58,401,318 of its distributions paid to shareholders in 2012 as qualified dividends (treated for federal income tax purposes in the hands of shareholders as taxable at a maximum rate of 15%).
For shareholders that are corporations, the Fund designates 39% of its ordinary dividends paid to shareholders in 2012 as dividends from domestic corporations eligible for the corporate dividends received deduction, provided that the shareholder otherwise satisfies applicable requirements to claim that deduction.
BOARD APPROVAL OF FUNDS’ INVESTMENT MANAGEMENT AGREEMENTS AND MANAGEMENT FEES (unaudited)
The Board of Trustees is responsible for overseeing the performance of the Dodge & Cox Funds’ investment manager and determining whether to continue the Investment Management Agreements between the Funds and Dodge & Cox each year (the “Agreements”). At a meeting of the Board of Trustees of the Trust held on December 12, 2012, the Trustees, by a unanimous vote (including a separate vote of those Trustees who are not “interested persons” (as defined in the Investment Company Act of 1940) (the “Independent Trustees”)), approved the renewal of the Agreements for an additional one-year term through December 31, 2013. During the course of the year, the Board received a wide variety of materials relating to the services provided by Dodge & Cox and the performance of each of the Funds.
INFORMATION RECEIVED
In advance of the meeting, the Board, including each of the Independent Trustees, requested, received, and reviewed materials relating to the Agreements and the services provided by Dodge & Cox. The Independent Trustees retained Morningstar® to prepare an independent
expense and performance summary for each Fund and comparable funds managed by other advisers identified by Morningstar. The Morningstar materials included information regarding advisory fee rates, expense ratios, and transfer agency, custodial, and distribution expenses, as well as appropriate performance comparisons to a Fund’s peer group and an index or combination of indices. The Morningstar materials also included a comparison of expenses of various share classes offered by comparable funds.
The materials reviewed by the Board contained information concerning, among other things, Dodge & Cox’s profitability, financial results and condition, advisory fee revenue, and separate account advisory fee schedules. The Board additionally considered the Funds’ brokerage commissions, turnover rates, sales and redemption data and the significant investment that Dodge & Cox makes in research used in managing the Funds. The Board received and reviewed a memorandum summarizing information provided throughout the year regarding Dodge & Cox’s services to the Funds as well as information regarding (i) the different fees, services, costs, and risks associated with separate accounts managed by Dodge & Cox as compared to the Dodge & Cox Funds; (ii) the differences in performance between the Funds and separately managed accounts; and (iii) Fund shares subscription and redemption activity. Throughout the process of reviewing the services provided by Dodge & Cox and preparing for the meeting, the Independent Trustees found Dodge & Cox to be open, forthright, detailed, and very helpful in answering questions about all issues.
The Board received copies of the Agreements and a memorandum from the independent legal counsel to the Independent Trustees discussing the factors generally regarded as appropriate to consider in evaluating advisory arrangements. The Trust’s Contract Review Committee, consisting solely of Independent Trustees, met with the independent legal counsel on November 1, 2012, and again on December 12, 2012, to discuss whether to renew the Agreements. The Board, including the Independent Trustees, subsequently concluded that the existing Agreements are fair and reasonable and voted to approve the Agreements.
PAGE 15 § DODGE & COX GLOBAL STOCK FUND
In considering the Agreements, the Board, including the Independent Trustees, did not identify any single factor or particular information as all-important or controlling. In reaching the decision to approve the Agreements, the Board considered several factors, discussed below, to be key factors and reached the conclusions described below.
NATURE, QUALITY, AND EXTENT OF THE SERVICES
The Board considered that Dodge & Cox provides a wide range of services to the Funds in addition to portfolio management and that the quality of these services has been excellent in all respects. The extensive nature of services provided by Dodge & Cox has been documented in materials provided to the Board and in presentations made to the Board throughout the year. In particular, the Board considered the nature, quality, and extent of portfolio management, administrative, and shareholder services performed by Dodge & Cox. With regard to portfolio management services, the Board considered Dodge & Cox’s established long-term history of care and conscientiousness in the management of the Funds; its demonstrated consistency in investment approach and depth; the background and experience of the Dodge & Cox Investment Policy Committee, International Investment Policy Committee, Global Investment Policy Committee, Fixed Income Investment Policy Committee, and research analysts responsible for managing the Funds; its methods for assessing the regulatory and investment climate in various jurisdictions; Dodge & Cox’s overall high level of attention to its core investment management function; and its commitment to the Funds and their shareholders.
In the area of administrative and shareholder services, the Board considered the excellent quality of Dodge & Cox’s work in areas such as compliance, legal services, trading, proxy voting, oversight of the Funds’ transfer agent and custodian, tax compliance, and shareholder communication through its website and other means. The Board also noted Dodge & Cox’s diligent disclosure policy, its favorable compliance record, and its reputation as a trusted, shareholder-friendly mutual fund family.
In addition, the Board considered that Dodge & Cox manages approximately $120 billion in Fund assets with fewer professionals than most comparable funds, and that on average these professionals have more experience and longer tenure than investment professionals at comparable funds. The Board also noted that Dodge & Cox is an investment research-oriented firm with no other business endeavors to distract management’s attention from its research efforts, and that its investment professionals adhere to a consistent investment approach across the Funds. The Board further considered the favorable stewardship and “Gold” analyst ratings awarded to each of the Funds by Morningstar. The Board concluded that it was satisfied with the nature, extent, and quality of investment management and other services provided to the Funds by Dodge & Cox.
INVESTMENT PERFORMANCE
The Board considered short-term and long-term investment performance for each Fund (including periods of outperformance or underperformance) as compared to both relevant indices and the performance of such Fund’s peer group. The Board also reviewed recent performance in the context of long-term investment goals. The Board noted that each Fund’s short-term (one-year) performance relative to its benchmark and peer group had improved since the previous year’s review. The Board determined after extensive review and inquiry that Dodge & Cox’s historic, long-term, team-oriented bottom up investment approach remains consistent and that Dodge & Cox continues to be distinguished by its integrity, transparency, and independence.
The Board considered that the performance of the Funds is the result of a team-oriented investment management process that emphasizes a long-term investment horizon, comprehensive independent research, price discipline, and focus. The Board also considered that the investment performance delivered by Dodge & Cox to the Funds appeared to be consistent with the relevant performance delivered for other (non-fund) clients of Dodge & Cox. The Board concluded that Dodge & Cox has delivered favorable long-term performance for Fund investors consistent with the long-term investment strategies being pursued by the Funds.
DODGE & COX GLOBAL STOCK FUND §PAGE 16
COSTS AND ANCILLARY BENEFITS
Costs of Services to Funds: Fees and Expenses. The Board considered each Fund’s management fee rate and expense ratio relative to similar mutual funds and relative to management fees charged by Dodge & Cox to other clients. In particular, the Board considered that the Funds continue to be substantially below their peer group median in expense ratios and management fee rates and that many media and industry reports specifically comment on the low expense ratios of the Funds, which have been a defining characteristic of the Funds for many years. The Board also evaluated the operating structures of the Funds and Dodge & Cox, noting that the Funds do not charge front-end sales commissions or distribution fees, and Dodge & Cox bears, among other things, the significant cost of third party research, reimbursement for recordkeeping and administrative costs to third-party retirement plan administrators, and administrative and office overhead. The Board noted that expenses are well below industry averages. The Board also considered that the Funds receive numerous administrative, regulatory compliance, and shareholder support services from Dodge & Cox without any additional administrative fee and the fact that the Funds have relatively low transaction costs and portfolio turnover rates. The Board reviewed Morningstar data showing that the few peer group funds with lower expense ratios often have other share classes with significantly higher expense ratios.
The Board reviewed information regarding the fee rates Dodge & Cox charges to separate accounts that have investment programs similar to those of the Funds, including instances where separate account fees are lower than Fund fees. The Board considered differences in the nature and scope of services Dodge & Cox provides to the Funds as compared to separate accounts, differences in regulatory, litigation, and other risks as between mutual funds and separate accounts, and certain characteristics of the market for institutional separate account management services. The Board further noted that, with respect to non-U.S. funds sponsored and managed by Dodge & Cox that are comparable to the Funds in many respects, the fee rates charged by Dodge & Cox are the same as or higher than the fee rates charged to the Funds. After consideration of these matters, the Board concluded that
the overall costs incurred by the Funds for the services they receive (including the management fee paid to Dodge & Cox) are reasonable and that the fees are acceptable based upon the qualifications, experience, reputation, and performance of Dodge & Cox and the low overall expense ratios of the Funds.
Profitability and Costs of Services to Dodge & Cox; “Fall-out” Benefits. The Board reviewed reports of Dodge & Cox’s financial position, profitability, and estimated overall value, and considered Dodge & Cox’s overall profitability within its context as a private, employee-owned S-Corporation and relative to the favorable services provided. The Board noted that net revenues for 2012 are projected to decrease slightly from 2011. The Board noted in particular that Dodge & Cox’s profits are not generated by high fee rates, but reflect an extraordinarily streamlined, efficient, and focused business approach toward investment management. The Board recognized the importance of Dodge & Cox’s profitability—which is derived solely from management fees and does not include other business ventures—to maintain its independence, stability, company culture and ethics, and management continuity. The Board also considered that the compensation/profit structure at Dodge & Cox is vital for remaining independent and facilitating retention of its management and investment professionals.
The Board considered potential “fall-out” benefits (including the receipt of research from unaffiliated brokers) that Dodge & Cox might receive as a result of its association with the Funds and determined that they are not significant. The Board also noted the extent of additional administrative services performed by Dodge & Cox for the Funds, and that the magnitude of costs and risks borne by Dodge & Cox in rendering advisory services to the Funds (including risks in the regulatory compliance, securities valuation, and investment management processes) are continuing to increase. The Board concluded that the profitability of Dodge & Cox’s relationship with the Funds (including fall-out benefits) was fair and reasonable.
THE BENEFIT OF ECONOMIES OF SCALE
The Board considered whether there have been economies of scale with respect to the management of
PAGE 17 § DODGE & COX GLOBAL STOCK FUND
each Fund, whether the Funds have appropriately benefited from any economies of scale, and whether the management fee rate is reasonable in relation to the Fund assets and any economies of scale that may exist. In the Board’s view, any consideration of economies of scale must take account of the Funds’ low fee structure and the considerable efficiencies of the Funds’ organization and fee structure that has been realized by shareholders from the time of each Fund’s inception (i.e., from the first dollar). The Board noted that Dodge & Cox has shared economies of scale by adding or enhancing services to the Funds over time, and that the internal costs of providing investment management, up-to-date technology, administrative, and compliance services to the Funds are continuing to increase. For example, Dodge & Cox has increased its global research staff and investment resources over the years to address the increased complexity of investing in multinational and non-U.S. companies. In addition, Dodge & Cox has made substantial expenditures in other staff and infrastructure to enable it to integrate credit and equity analyses and to be able to implement its strategy in a more effective and secure manner. The Board determined that the Funds provide access for small investors to high quality investment management at a relatively low cost. The Board’s decision to renew the Agreements was made after consideration of economies of scale and review of peer group fund expense ratios and historical expense ratio patterns for the Funds. The Board concluded that the current Dodge & Cox fee structure is fair and reasonable and adequately shares economies of scale that may exist.
CONCLUSION
Based on their evaluation of all material factors and assisted by the advice of independent legal counsel to the Independent Trustees, the Board, including the Independent Trustees, concluded that the advisory fee structure was fair and reasonable, that each Fund was paying a competitive fee for the services provided, that the scope and quality of Dodge & Cox’s services has provided substantial value for Fund shareholders over the long term, and that approval of the Agreements was in the best interests of each Fund and its shareholders.
FUND HOLDINGS
The Fund provides a complete list of its holdings four times each fiscal year, as of the end of each quarter. The Fund files the lists with the Securities and Exchange Commission (SEC) on Form N-CSR (second and fourth quarters) and Form N-Q (first and third quarters). Shareholders may view the Fund’s Forms N-CSR and N-Q on the SEC’s website at www.sec.gov. Forms N-CSR and N-Q may also be reviewed and copied at the SEC’s Public Reference Room in Washington, DC. Information regarding the operations of the Public Reference Room may be obtained by calling 202-942-8090 (direct) or 800-732-0330 (general SEC number). A list of the Fund’s quarter-end holdings is also available at www.dodgeandcox.com on or about 15 days following each quarter end and remains available on the website until the list is updated in the subsequent quarter.
PROXY VOTING
For a free copy of the Fund’s proxy voting policies and procedures, please call 800-621-3979, visit the Fund’s website at www.dodgeandcox.com, or visit the SEC’s website at www.sec.gov. Information regarding how the Fund voted proxies relating to portfolio securities during the most recent 12-month period ending June 30 is also available at www.dodgeandcox.com or at www.sec.gov.
HOUSEHOLD MAILINGS
The Fund routinely mails shareholder reports and summary prospectuses to shareholders and, on occasion, proxy statements. In order to reduce the volume of mail, when possible, only one copy of these documents will be sent to shareholders who are part of the same family and share the same residential address.
If you have a direct account with the Funds and you do not want the mailing of shareholder reports and summary prospectuses combined with other members in your household, contact the Funds at 800-621-3979. Your request will be implemented within 30 days.
DODGE & COX GLOBAL STOCK FUND §PAGE 18
DODGE & COX FUNDS—EXECUTIVE OFFICER & TRUSTEE INFORMATION
| | | | | | |
Name (Age) and
Address* | | Position with Trust (Year of Election or
Appointment) | | Principal Occupation During Past 5 Years | | Other Directorships Held by Trustees |
| INTERESTED TRUSTEES AND OFFICERS |
| Kenneth E. Olivier (60) | | Chairman, President, and Trustee (Trustee since 2005) | | Chairman (since 2011), Chief Executive Officer (since 2010), President (until 2011), and Director of Dodge & Cox; Portfolio Manager and member of Investment Policy Committee (IPC) | | — |
| Dana M. Emery (51) | | Senior Vice President and Trustee (Trustee since 1993) | | Co-President (since 2011), Executive Vice President (until March 2011), and Director of Dodge & Cox; Director of Fixed Income, Portfolio Manager, and member of Fixed Income Investment Policy Committee (FIIPC) | | — |
| John A. Gunn (69) | | Trustee (Trustee since 1985) | | Chairman Emeritus (since 2011), Chairman (2007-2011), Chief Executive Officer (2007-2010), and Director of Dodge & Cox; Portfolio Manager and member of IPC, Global Investment Policy Committee (GIPC) (since 2008), International Investment Policy Committee (IIPC), and FIIPC (until 2008) | | — |
| Charles F. Pohl (54) | | Senior Vice President (Officer since 2004) | | Co-President (since 2011), Senior Vice President (until 2011), and Director of Dodge & Cox; Chief Investment Officer (since 2007), Director of Credit Research, Portfolio Manager, Investment Analyst, and member of IPC, GIPC (since 2008), IIPC (since 2007), and FIIPC | | — |
| Diana S. Strandberg (53) | | Senior Vice President (Officer since 2006) | | Senior Vice President (since 2011), Vice President (until 2011), and Director (since 2011) of Dodge & Cox; Director of International Equity (since 2009), Portfolio Manager, Investment Analyst, and member of IPC, GIPC (since 2008), and IIPC | | — |
| David H. Longhurst (55) | | Treasurer (Officer since 2006) | | Vice President (since 2008) and Assistant Treasurer (since 2007) of Dodge & Cox; Fund Administration and Accounting Senior Manager (until 2007) | | — |
| Thomas M. Mistele (59) | | Secretary (Officer since 1998) | | Chief Operating Officer, Director, Secretary, Senior Counsel (since 2011), and General Counsel (until 2011) of Dodge & Cox | | — |
| Katherine M. Primas (37) | | Chief Compliance Officer (Officer since 2009) | | Chief Compliance Officer (since 2008) and Associate Chief Compliance Officer of Dodge & Cox (until 2008) | | — |
| INDEPENDENT TRUSTEES |
| L. Dale Crandall (71) | | Trustee (Since 1999) | | President, Piedmont Corporate Advisors, Inc. (since 2003); President, Kaiser Foundation Health Plan, Inc. and Kaiser Foundation Hospitals (2000-2002); Senior Vice President—Finance and Administration & CFO, Kaiser Foundation Health Plan, Inc. and Kaiser Foundation Hospitals (1998-2000) | | Director, Ansell Limited (medical equipment and supplies) (2002-present); Director, Coventry Health Care, Inc. (managed health care) (2004-present); Bridgepoint Education, Inc. (education services) (2008-present) |
| Thomas A. Larsen (63) | | Trustee (Since 2002) | | Senior Counsel of Arnold & Porter LLP (law firm) (since 2012); Director of Howard, Rice, Nemerovski, Canady, Falk & Rabkin (1977-2011) | | — |
| Ann Mather (52) | | Trustee (Since 2011) | | CFO, Pixar Animation Studios (1999-2004) | | Director, Google, Inc. (internet information services) (2005-present); Director, Glu Mobile, Inc. (multimedia software) (2005-present); Director, Netflix, Inc. (video services) (2010-present); Director, MoneyGram International, Inc. (business services) (2010-present); Director, Solazyme Inc. (renewable oils) (since 2011) |
| Robert B. Morris III (60) | | Trustee (Since 2011) | | Advisory Director, The Presidio Group (previously Presidio Financial Partners) (since 2005) | | — |
| John B. Taylor (66) | | Trustee (Since 2005) (and 1998-2001) | | Professor of Economics, Stanford University; Senior Fellow, Hoover Institution; Under Secretary for International Affairs, United States Treasury (2001-2005) | | — |
| * | | The address for each Officer and Trustee is 555 California Street, 40th Floor, San Francisco, California 94104. Each Officer and Trustee oversees all five series in the Dodge & Cox Funds complex and serves for an indefinite term. |
Additional information about the Trust’s Trustees and Officers is available in the Trust’s Statement of Additional Information (SAI). You can get a free copy of the SAI by visiting the Funds’ website at www.dodgeandcox.com or calling
1-800-621-3979.
PAGE 19 § DODGE & COX GLOBAL STOCK FUND
| | | | |
| | | | |
www.dodgeandcox.com
For Fund literature, transactions, and account information, please visit the Funds’ website.
or write or call:
DODGE & COX FUNDS
c/o Boston Financial Data Services
P.O. Box 8422
Boston, Massachusetts 02266-8422
(800) 621-3979
INVESTMENT MANAGER
Dodge & Cox
555 California Street, 40th Floor
San Francisco, California 94104
(415) 981-1710
This report is submitted for the general information of the shareholders of the Fund. The report is not authorized for distribution to prospective investors in the Fund unless it is accompanied by a current prospectus.
This report reflects our views, opinions, and portfolio holdings as of December 31, 2012, the end of the reporting period. Any such views are subject to change at any time based upon market or other conditions and Dodge & Cox disclaims any responsibility to update such views. These views may not be relied on as investment advice and, because investment decisions for a Dodge & Cox Fund are based on numerous factors, may not be relied on as an indication of trading intent on behalf of any Dodge & Cox Fund.
12/12 ISF AR Printed on recycled paper
Annual Report
December 31, 2012
International Stock Fund
ESTABLISHED 2001
TICKER: DODFX
TO OUR SHAREHOLDERS
The Dodge & Cox International Stock Fund had a total return of 17.2% for the six months ending December 31, 2012, compared to a return of 14.0% for the MSCI EAFE (Europe, Australasia, Far East) Index. For 2012, the Fund had a total return of 21.0%, compared to 17.3% for the MSCI EAFE. At year end, the Fund had net assets of $40.6 billion with a cash position of 1.3%.
MARKET COMMENTARY
During 2012, global equity markets significantly appreciated in both U.S.-dollar and local currency terms. The past year was marked by considerable volatility as investors responded to uncertainty about broad macroeconomic issues, including the fate of the Eurozone, slowing economic growth in China, and the U.S. “fiscal cliff.” And yet, markets were strong—even the areas that were of greatest concern appreciated: MSCI Europe Index (up 19%), MSCI European Financials Index (up 33%), and MSCI China Index (up 23%). Company fundamentals remain strong with robust corporate balance sheets and cash flows. Furthermore, valuations are low. At year end, the MSCI EAFE was trading at 12 times forward earnings with a dividend yield of 3.4%.
INVESTMENT STRATEGY
As investors, we are constantly weighing what we are buying (company fundamentals) with what we are paying (valuation) for each investment opportunity. A great company can be a terrible investment if you pay too much. Every investment has a range of outcomes, and it is impossible to know what will happen in the future. As a result, we want to purchase securities that are inexpensive enough to embed what could potentially go wrong, while also not paying too much for what could go right.
A low valuation often signals that investors are concerned about the company’s fundamentals. We believe bottom-up research is the best way to identify whether a company’s long-term fundamentals are appropriately incorporated into its stock price. Through meetings with management, competitors, customers, and suppliers, our global industry analysts build an in-depth understanding of individual companies. Our equity analysts work with our fixed income team to evaluate potential downside and
access to capital; this collaboration provides an advantage, especially when a company is under stress. Furthermore, we keenly focus on governance to understand how our interests align with those of key stakeholders.
Our global equity analysts advocate investment ideas within a team decision-making process. This team-based approach provides checks and balances, tests our conviction, and broadens our knowledge base over time. Our collective judgment and experience, which have been built over decades, are key to constructing the portfolio. Recognizing that it is often impossible to time the bottom (or top) of the market, we are patient and often move incrementally to revisit and retest our thinking.
We think it is important to have a long-term investment horizon because short-term market movements can be driven by unpredictable investor sentiment, whereas the true value of a company tends to be reflected over time. Using a three- to five-year horizon, we look to identify companies that have attractive valuations and potential drivers for their fundamental value to be recognized by investors. We think like long-term owners of a business and, hence, have had low turnover in the Fund (the Fund’s average holding period has been seven years).
As a result of our investment framework, the Fund is overweight in three areas of the market that we believe are particularly compelling: Technology, Media, and Telecom (28.7% of the Fund compared to 10.8% for the MSCI EAFE)(a), European Financials (18.3% compared to 13.4% for the MSCI EAFE), and the Pharmaceuticals industry (15.5% of the Fund compared to 8.2% for the MSCI EAFE).
Technology, Media, and Telecom (TMT)
During the year, the Fund added to several TMT holdings that we believe have attractive long-term growth prospects in relation to their valuation. One such example(b) is Millicom International Cellular (incorporated in Luxembourg), a 1.0% position in the Fund. The company is a wireless telecommunication operator that provides prepaid cellular services to more than 30 million customers in 13 emerging market countries, primarily in Latin America and Africa.
PAGE 1 § DODGE & COX INTERNATIONAL STOCK FUND
Increased economic development and rising personal incomes are augmenting demand for communication services in these regions. Millicom has strong cash flows and attractive returns on capital with a multiple of 14 times forward earnings.
Among the Fund’s holdings in the Information Technology sector, there are a handful of investments marked by high uncertainty and a wide range of potential investment outcomes. As a result, these companies are trading at exceptionally low valuations. For example, Nokia, a 1.3% position in the Fund, traded at 0.3 times sales and 2.6 times R&D spending at year end. Nokia is the world’s second largest manufacturer of mobile telephones with sales in more than 150 countries. We acknowledge that the company is facing serious headwinds and has lost market share in mobile devices due to fierce competition and a lack of smartphone offerings; investors are understandably skeptical about Nokia’s prospects. However, there is also evidence that Nokia has long-term investment merit. First, the management team has a strong sense of urgency and understands change needs to occur. They are implementing a restructuring plan designed to improve revenue growth, profitability, and free cash flow generation. Second, Nokia has partnered with Microsoft to use the Windows Mobile operating system, which should help Nokia compete more effectively in the high-end smartphone market. Third, we believe Nokia has sufficient resources to bridge the company’s long-term transition.
European Financials
Investing when there is a high degree of uncertainty and a wide range of outcomes can yield outsized investment returns, as is illustrated by our additions to the Fund’s holdings in European Financials during 2012. The Fund is now significantly overweight in European Financials.
As we discussed in our Semi-Annual Report, investor concerns about the outlook for the Eurozone caused European bank share prices to come under pressure and valuations were quite low—typically 50 to 70 percent of book value. Yet, fundamentals had improved for many banks and included more stable funding and healthier capital ratios.
Financials was the best performing sector of the market in 2012, with European Financials particularly strong (MSCI European Financials Index up 33%). The
share price recovery occurred as investors’ fears about the Eurozone receded; yet, issues remain and include slow economic growth, a low interest rate environment, regulatory changes, and the possibility of fines and litigation. If we had waited for complete visibility on all issues, we would have missed this sizeable investment opportunity. We believe the Fund’s European Financials holdings remain attractive investment opportunities when we weigh valuation against long-term fundamentals.
Pharmaceuticals Industry
The Fund has been overweight in Pharmaceuticals since 2007, which turned out to be a few years early in hindsight. Our persistence in adding resulted in a significant overweight position in the industry when it started outperforming in 2011. Since share prices have recently increased substantially, we have used some of the profits to fund other investments.
We still see long-term investment opportunity and remain overweight in the industry due to low relative valuations and attractive growth prospects. The Fund’s Pharmaceuticals holdings traded at approximately 11 times forward earnings with a 3.5% dividend yield. Drug approvals are coming through the research pipeline, and top-line growth is materializing. Moreover, the Fund’s Pharmaceuticals holdings derive approximately 20 to 30 percent of their revenues from emerging markets, which are collectively growing at double-digit rates. Per capita consumption of drugs is low in most emerging markets, and governments and consumers have demonstrated a tendency to allocate more spending to health care as consumer purchasing power increases.
IN CLOSING
Despite current economic uncertainties, we are highly enthusiastic about the long-term prospects for equities. Global equity markets are trading at attractive valuations, which more than embed present concerns in our opinion. Our bottom-up research is the foundation, our long-term horizon provides the framework, and our team decision-making process enables us to maintain conviction in the midst of investor pessimism. Using this approach, we have identified long-term investment opportunities and are excited about the prospects for the Fund’s holdings. Acknowledging that markets could continue to be volatile
DODGE & COX INTERNATIONAL STOCK FUND §PAGE 2
over the short term, we encourage shareholders to remain focused on the long term.
Thank you for your continued confidence in our firm. As always, we welcome your comments and questions.
For the Board of Trustees,
| | |
| |  |
Kenneth E. Olivier, Chairman and President | | Diana S. Strandberg, Senior Vice President |
January 29, 2013
| (a) | | Unless otherwise specified, all weightings and characteristics are as of December 31, 2012. |
| (b) | | The use of specific examples does not imply that they are more attractive investments than the Fund’s other holdings. |
ANNUAL PERFORMANCE REVIEW
Key Contributors to Relative Results
| | § | | The Fund’s holdings in the Materials sector (up 55% versus up 14% for the MSCI EAFE sector), especially holdings in the Construction Materials industry and the Fund’s underweight position in the Metals & Mining industry, helped results. Notable contributors included Cemex (up 90%), Lafarge (up 82%), and Lanxess (up 70%). | |
| | § | | The best performing sector of the market was Financials. The Fund’s holdings in this sector (up 41% compared to up 33% for the MSCI EAFE sector) aided results, especially holdings in Europe, the United Kingdom, and emerging markets. Yapi Kredi (up 105%), Sabanci Holding (up 94%), Aegon (up 65%), and Barclays (up 60%) were among the notable contributors. | |
| | § | | The Fund’s average overweight position (16% versus 10%) and holdings in the Health Care sector (up 23% compared to up 17% for the MSCI EAFE sector) contributed to results. Bayer (up 51%) and Sanofi (up 32%) were especially strong. | |
| | § | | Additional contributors included Naspers (up 47%), Schneider Electric (up 41%), and Philips Electronics (up 30%). | |
Key Detractors from Relative Results
| | § | | The Fund’s overweight position and holdings in the Information Technology sector (down 10% compared to up 8% for the MSCI EAFE sector) significantly hindered performance. Hewlett-Packard (down 43%), Nintendo (down 22%), and Nokia (down 17%) were particularly weak. | |
| | § | | Additional detractors included Nidec (down 32%) and Mitsubishi Electric (down 11%). | |
PAGE 3 § DODGE & COX INTERNATIONAL STOCK FUND
KEY CHARACTERISTICS OF DODGE & COX
Independent Organization
Dodge & Cox is one of the largest privately owned investment managers in the world. We remain committed to independence, with a goal of providing the highest quality investment management service to our existing clients.
Over 80 Years of Investment Experience
Dodge & Cox was founded in 1930. We have a stable and well-qualified team of investment professionals, most of whom have spent their entire careers at Dodge & Cox.
Experienced Investment Team
The International Investment Policy Committee, which is the decision-making body for the International Stock Fund, is a nine-member committee with an average tenure at Dodge & Cox of 22 years.
One Business with a Single Research Office
Dodge & Cox manages domestic, international, and global equity, fixed income, and balanced investments, operating from one office in San Francisco.
Consistent Investment Approach
Our team decision-making process involves thorough, bottom-up fundamental analysis of each investment.
Long-Term Focus and Low Expenses
We invest with a three- to five-year investment horizon, which has historically resulted in low turnover relative to our peers. We manage Funds that maintain low expense ratios.
DODGE & COX INTERNATIONAL STOCK FUND §PAGE 4
GROWTH OF $10,000 SINCE INCEPTION
FOR AN INVESTMENT MADE ON DECEMBER 31, 2002
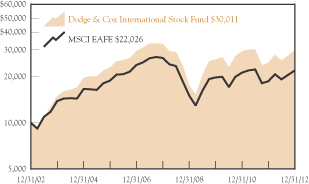
AVERAGE ANNUAL TOTAL RETURN
FOR PERIODS ENDED DECEMBER 31, 2012
| | | | | | | | | | | | | | | | |
| | | 1 Year | | | 3 Years | | | 5 Years | | | 10 Years | |
Dodge & Cox International
Stock Fund | | | 21.03 | % | | | 4.96 | % | | | -1.89 | % | | | 11.63 | % |
MSCI EAFE | | | 17.32 | | | | 3.56 | | | | -3.69 | | | | 8.21 | |
Returns represent past performance and do not guarantee future results. Investment return and share price will fluctuate with market conditions, and investors may have a gain or loss when shares are sold. Fund performance changes over time and currently may be significantly lower than stated. Performance is updated and published
monthly. Visit the Fund’s website at www.dodgeandcox.com or call 800-621-3979 for current performance figures.
The Fund’s total returns include the reinvestment of dividend and capital gain distributions, but have not been adjusted for any income taxes payable by shareholders on these distributions or on Fund share redemptions. Index returns include dividends but, unlike Fund returns, do not reflect fees or expenses. The MSCI EAFE (Europe, Australasia, Far East) Index is a broad-based, unmanaged equity market index aggregated from 22 developed market country indices, excluding the United States. MSCI makes no express or implied warranties or representations and shall have no liability whatsoever with respect to any MSCI data contained herein. The MSCI data may not be further redistributed or used as a basis for other indices or any securities or financial products. This report is not approved, reviewed, or produced by MSCI.
MSCI EAFE is a service mark of MSCI Barra.
Risks: The Fund is subject to stock market risk, meaning stocks in the Fund may decline in value for extended periods due to the financial prospects of individual companies, or due to general market and economic conditions. Investing in non-U.S. securities may entail risk due to foreign economic and political developments; this risk may be increased when investing in emerging markets. Please read the prospectus and summary prospectus for specific details regarding the Fund’s risk profile.
FUND EXPENSE EXAMPLE
As a Fund shareholder, you incur ongoing Fund costs, including management fees and other Fund expenses. All mutual funds have ongoing costs, sometimes referred to as operating expenses. The following example shows ongoing costs of investing in the Fund and can help you understand these costs and compare them with those of other mutual funds. The example assumes a $1,000 investment held for the six months indicated.
ACTUAL EXPENSES
The first line of the table below provides information about actual account values and expenses based on the Fund’s actual returns. You may use the information in this line, together with your account balance, to estimate the expenses that you paid over the period. Simply divide your account value by $1,000 (for example, an $8,600 account value divided by $1,000 = 8.6), then multiply the result by the number in the first line under the heading “Expenses Paid During Period” to estimate the expenses you paid on your account during this period.
HYPOTHETICAL EXAMPLE FOR COMPARISON WITH OTHER MUTUAL FUNDS
Information on the second line of the table can help you compare ongoing costs of investing in the Fund with those of other mutual funds. This information may not be used to estimate the actual ending account balance or expenses you paid during the period. The hypothetical “Ending Account Value” is based on the actual expense ratio of the Fund and an assumed 5% annual rate of return before expenses (not the Fund’s actual return). The amount under the heading “Expense Paid During the Period” shows the hypothetical expenses your account would have incurred under this scenario. You can compare this figure with the 5% hypothetical examples that appear in shareholder reports of other mutual funds.
| | | | | | | | | | | | |
Six Months Ended December 31, 2012 | | Beginning Account Value
7/1/2012 | | | Ending Account Value
12/31/2012 | | | Expenses Paid During Period* | |
Based on Actual Fund Return | | $ | 1,000.00 | | | $ | 1,171.50 | | | $ | 3.48 | |
Based on Hypothetical 5% Yearly Return | | | 1,000.00 | | | | 1,021.93 | | | | 3.24 | |
| * | Expenses are equal to the Fund’s annualized expense ratio of 0.64%, multiplied by the average account value over the period, multiplied by 184/366 (to reflect the one-half year period). |
The expenses shown in the table highlight ongoing costs only and do not reflect any transactional fees or account maintenance fees. While other mutual funds may charge such fees, please note that the Fund does not charge transaction fees (e.g., redemption fees, sales loads) or universal account maintenance fees (e.g., small account fees).
PAGE 5 § DODGE & COX INTERNATIONAL STOCK FUND
| | | | |
| FUND INFORMATION | | | December 31, 2012 | |
| | | | |
| GENERAL INFORMATION | | | |
Net Asset Value Per Share | | | $34.64 | |
Total Net Assets (billions) | | | $40.6 | |
Expense Ratio | | | 0.64% | |
Portfolio Turnover Rate | | | 10% | |
30-Day SEC Yield(a) | | | 2.19% | |
Fund Inception | | | 2001 | |
No sales charges or distribution fees | | | | |
Investment Manager: Dodge & Cox, San Francisco. Managed by the International Investment Policy Committee, whose nine members’ average tenure at Dodge & Cox is 22 years.
| | | | | | | | |
| PORTFOLIO CHARACTERISTICS | | Fund | | | MSCI
EAFE | |
Number of Stocks | | | 90 | | | | 909 | |
Median Market Capitalization (billions) | | | $16 | | | | $7 | |
Weighted Average Market
Capitalization (billions) | | | $61 | | | | $53 | |
Price-to-Earnings Ratio(b) | | | 10.8x | | | | 12.1x | |
Countries Represented | | | 24 | | | | 22 | |
Emerging Markets (Brazil, China, India, Indonesia, Mexico, South Africa, Thailand, Turkey, United Arab Emirates) | | | 17.0% | | | | 0.0% | |
| | | | |
| TEN LARGEST HOLDINGS (%)(c) | | Fund | |
Naspers, Ltd. (South Africa) | | | 4.0 | |
Sanofi (France) | | | 3.7 | |
Roche Holding AG (Switzerland) | | | 3.7 | |
Lafarge SA (France) | | | 3.4 | |
Koninklijke Philips Electronics NV (Netherlands) | | | 3.0 | |
Novartis AG (Switzerland) | | | 2.8 | |
GlaxoSmithKline PLC (United Kingdom) | | | 2.7 | |
HSBC Holdings PLC (United Kingdom) | | | 2.7 | |
Bayer AG (Germany) | | | 2.7 | |
Credit Suisse Group AG (Switzerland) | | | 2.6 | |
ASSET ALLOCATION
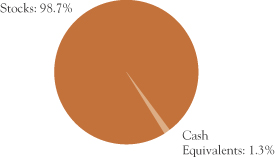
| | | | | | | | |
| REGION DIVERSIFICATION (%)(d) | | Fund | | | MSCI
EAFE | |
Europe (excluding United Kingdom) | | | 47.8 | | | | 42.8 | |
United Kingdom | | | 17.9 | | | | 22.6 | |
Japan | | | 11.7 | | | | 20.0 | |
Africa/Middle East | | | 7.1 | | | | 0.5 | |
United States | | | 5.5 | | | | 0.0 | |
Latin America | | | 4.8 | | | | 0.0 | |
Pacific (excluding Japan) | | | 3.9 | | | | 14.1 | |
| | | | | | | | |
| SECTOR DIVERSIFICATION (%) | | Fund | | | MSCI
EAFE | |
Financials | | | 25.2 | | | | 24.7 | |
Health Care | | | 15.5 | | | | 9.8 | |
Consumer Discretionary | | | 12.9 | | | | 10.7 | |
Information Technology | | | 11.5 | | | | 4.3 | |
Industrials | | | 9.1 | | | | 12.6 | |
Telecommunication Services | | | 8.5 | | | | 4.9 | |
Materials | | | 8.2 | | | | 9.8 | |
Energy | | | 5.4 | | | | 7.7 | |
Consumer Staples | | | 2.4 | | | | 11.6 | |
Utilities | | | 0.0 | | | | 3.9 | |
| (a) | | SEC Yield is an annualization of the Fund’s total net investment income per share for the 30-day period ended on the last day of the month. |
| (b) | | Price-to-earnings (P/E) ratios are calculated using 12-month forward earnings estimates from third-party sources. |
| (c) | | The Fund’s portfolio holdings are subject to change without notice. The mention of specific securities is not a recommendation to buy, sell, or hold any particular security and is not indicative of Dodge & Cox’s current or future trading activity. |
| (d) | | The Fund may classify a company in a different category than the MSCI EAFE. The Fund generally classifies a company based on its country of incorporation, but may designate a different country in certain circumstances. |
DODGE & COX INTERNATIONAL STOCK FUND §PAGE 6
| | | | |
| PORTFOLIO OF INVESTMENTS | | | December 31, 2012 | |
| | | | | | | | |
| COMMON STOCKS: 97.6% | | | | | | |
| | |
| | | SHARES | | | VALUE | |
| CONSUMER DISCRETIONARY: 12.9% | |
AUTOMOBILES & COMPONENTS: 3.7% | |
Bayerische Motoren Werke AG (Germany) | | | 6,201,400 | | | $ | 598,075,435 | |
Honda Motor Co., Ltd. (Japan) | | | 300,000 | | | | 11,057,524 | |
Honda Motor Co., Ltd. ADR (Japan) | | | 6,758,400 | | | | 249,655,296 | |
Mahindra & Mahindra, Ltd. (India) | | | 3,772,581 | | | | 64,770,177 | |
NGK Spark Plug Co., Ltd.(b) (Japan) | | | 16,720,000 | | | | 222,197,863 | |
Yamaha Motor Co., Ltd.(b) (Japan) | | | 30,430,000 | | | | 337,304,591 | |
| | | | | | | | |
| | | | | | | 1,483,060,886 | |
CONSUMER DURABLES & APPAREL: 1.3% | |
Corporacion Geo SAB de CV, Series B(a),(b) (Mexico) | | | 50,305,400 | | | | 58,842,642 | |
Li Ning Co., Ltd.(a)
(Cayman Islands/China) | | | 51,843,900 | | | | 34,349,031 | |
Panasonic Corp. (Japan) | | | 64,080,534 | | | | 389,354,050 | |
Sony Corp. (Japan) | | | 5,548,028 | | | | 62,079,462 | |
| | | | | | | | |
| | | | | | | 544,625,185 | |
CONSUMER SERVICES: 0.4% | |
Accor SA (France) | | | 4,958,051 | | | | 177,848,002 | |
|
MEDIA: 7.5% | |
Grupo Televisa SAB ADR (Mexico) | | | 19,680,592 | | | | 523,110,135 | |
Liberty Global, Inc., Series A(a) (United States) | | | 2,481,805 | | | | 156,328,897 | |
Liberty Global, Inc., Series C(a) (United States) | | | 3,274,971 | | | | 192,404,546 | |
Naspers, Ltd.(b) (South Africa) | | | 25,160,895 | | | | 1,616,659,335 | |
News Corp., Class A (United States) | | | 11,612,792 | | | | 296,590,708 | |
Television Broadcasts, Ltd.(b) (Hong Kong) | | | 34,015,100 | | | | 255,324,875 | |
| | | | | | | | |
| | | | | | | 3,040,418,496 | |
| | | | | | | | |
| | | | | | | 5,245,952,569 | |
| CONSUMER STAPLES: 2.4% | |
FOOD, BEVERAGE & TOBACCO: 2.4% | |
Anadolu Efes Biracilik ve Malt Sanayii AS(b) (Turkey) | | | 24,488,440 | | | | 353,413,070 | |
Diageo PLC ADR (United Kingdom) | | | 1,750,100 | | | | 204,026,658 | |
Unilever PLC (United Kingdom) | | | 11,000,000 | | | | 417,536,015 | |
| | | | | | | | |
| | | | | | | 974,975,743 | |
HOUSEHOLD & PERSONAL PRODUCTS: 0.0%(e) | |
Aderans Co., Ltd.(a),(b) (Japan) | | | 182,300 | | | | 2,408,625 | |
| | | | | | | | |
| | | | | | | 977,384,368 | |
| ENERGY: 4.5% | |
Royal Dutch Shell PLC ADR (United Kingdom) | | | 11,069,270 | | | | 763,226,167 | |
Schlumberger, Ltd.
(Curacao/United States) | | | 11,052,217 | | | | 765,808,116 | |
Total SA (France) | | | 5,868,600 | | | | 303,744,304 | |
| | | | | | | | |
| | | | | | | 1,832,778,587 | |
| | | | | | | | |
| | |
| | | SHARES | | | VALUE | |
| FINANCIALS: 25.0% | |
BANKS: 15.1% | |
Banco Santander SA (Spain) | | | 50,330,159 | | | $ | 405,816,320 | |
Barclays PLC (United Kingdom) | | | 237,066,217 | | | | 1,023,742,588 | |
BNP Paribas SA (France) | | | 3,700,000 | | | | 208,558,473 | |
Erste Group Bank AG(a) (Austria) | | | 3,700,000 | | | | 118,309,469 | |
HSBC Holdings PLC (United Kingdom) | | | 103,154,921 | | | | 1,091,051,978 | |
ICICI Bank, Ltd. (India) | | | 3,718,675 | | | | 78,312,204 | |
Kasikornbank PCL Foreign (Thailand) | | | 82,212,627 | | | | 521,981,076 | |
Lloyds Banking Group PLC(a) (United Kingdom) | | | 412,000,000 | | | | 330,126,450 | |
Mitsubishi UFJ Financial Group, Inc. (Japan) | | | 58,099,900 | | | | 312,643,659 | |
Standard Bank Group, Ltd. (South Africa) | | | 25,862,295 | | | | 365,947,338 | |
Standard Chartered PLC (United Kingdom) | | | 26,294,877 | | | | 666,540,082 | |
UniCredit SPA(a) (Italy) | | | 123,651,788 | | | | 610,603,864 | |
Yapi ve Kredi Bankasi AS(a) (Turkey) | | | 133,779,068 | | | | 391,087,371 | |
| | | | | | | | |
| | | | | | | 6,124,720,872 | |
DIVERSIFIED FINANCIALS: 4.1% | |
Credit Suisse Group AG (Switzerland) | | | 42,183,520 | | | | 1,058,440,945 | |
Deutsche Boerse AG (Germany) | | | 3,750,000 | | | | 228,884,907 | |
Haci Omer Sabanci Holding AS (Turkey) | | | 63,602,354 | | | | 351,558,709 | |
| | | | | | | | |
| | | | | | | 1,638,884,561 | |
INSURANCE: 4.4% | |
AEGON NV (Netherlands) | | | 87,459,612 | | | | 557,363,450 | |
Dai-ichi Life Insurance Co., Ltd. (Japan) | | | 152,693 | | | | 214,845,903 | |
Swiss Life Holding AG (Switzerland) | | | 1,520,000 | | | | 202,864,996 | |
Swiss Re AG (Switzerland) | | | 11,291,868 | | | | 824,128,613 | |
| | | | | | | | |
| | | | | | | 1,799,202,962 | |
REAL ESTATE: 1.4% | |
BR Malls Participacoes SA (Brazil) | | | 14,789,100 | | | | 195,925,917 | |
Hang Lung Group, Ltd. (Hong Kong) | | | 51,625,500 | | | | 295,755,005 | |
Hang Lung Properties, Ltd. (Hong Kong) | | | 15,464,000 | | | | 62,002,994 | |
| | | | | | | | |
| | | | | | | 553,683,916 | |
| | | | | | | | |
| | | | | | | 10,116,492,311 | |
| HEALTH CARE: 15.5% | |
PHARMACEUTICALS, BIOTECHNOLOGY & LIFE
SCIENCES: 15.5% | |
Bayer AG (Germany) | | | 11,405,350 | | | | 1,083,080,838 | |
GlaxoSmithKline PLC (United Kingdom) | | | 10,770,000 | | | | 233,833,757 | |
GlaxoSmithKline PLC ADR (United Kingdom) | | | 19,853,749 | | | | 863,042,469 | |
| | |
| PAGE 7 § DODGE & COX INTERNATIONAL STOCK FUND | | See accompanying Notes to Financial Statements |
| | | | |
| PORTFOLIO OF INVESTMENTS | | | December 31, 2012 | |
| | | | | | | | |
| COMMON STOCKS (continued) | |
| | |
| | | SHARES | | | VALUE | |
Novartis AG (Switzerland) | | | 1,350,000 | | | $ | 85,470,544 | |
Novartis AG ADR (Switzerland) | | | 16,305,000 | | | | 1,032,106,500 | |
Roche Holding AG (Switzerland) | | | 7,250,400 | | | | 1,477,087,048 | |
Sanofi (France) | | | 15,924,120 | | | | 1,510,167,339 | |
| | | | | | | | |
| | | | | | | 6,284,788,495 | |
| INDUSTRIALS: 9.1% | |
CAPITAL GOODS: 8.2% | |
Compagnie de Saint-Gobain SA (France) | | | 1,784,591 | | | | 76,360,114 | |
Koninklijke Philips Electronics NV (Netherlands) | | | 44,610,796 | | | | 1,196,831,913 | |
Mitsubishi Electric Corp. (Japan) | | | 102,589,800 | | | | 873,187,325 | |
Nexans SA(b) (France) | | | 1,690,258 | | | | 76,858,002 | |
Nidec Corp. (Japan) | | | 4,674,200 | | | | 273,323,117 | |
Schneider Electric SA (France) | | | 9,534,546 | | | | 711,120,114 | |
Wienerberger AG(b) (Austria) | | | 12,250,041 | | | | 112,852,632 | |
| | | | | | | | |
| | | | | | | 3,320,533,217 | |
COMMERCIAL & PROFESSIONAL SERVICES: 0.6% | |
ADT Corp. (United States) | | | 2,179,460 | | | | 101,323,095 | |
Tyco International, Ltd. (Switzerland) | | | 5,158,920 | | | | 150,898,410 | |
| | | | | | | | |
| | | | | | | 252,221,505 | |
TRANSPORTATION: 0.3% | |
DP World, Ltd. (United Arab Emirates) | | | 7,314,562 | | | | 85,580,376 | |
TNT Express NV (Netherlands) | | | 1,406,099 | | | | 15,905,802 | |
| | | | | | | | |
| | | | | | | 101,486,178 | |
| | | | | | | | |
| | | | | | | 3,674,240,900 | |
| INFORMATION TECHNOLOGY: 11.5% | |
SEMICONDUCTORS & SEMICONDUCTOR EQUIPMENT: 1.3% | |
Infineon Technologies AG(b) (Germany) | | | 66,288,456 | | | | 537,915,818 | |
|
SOFTWARE & SERVICES: 1.7% | |
Amdocs, Ltd. (Guernsey/United States) | | | 6,200,000 | | | | 210,738,000 | |
Nintendo Co., Ltd. (Japan) | | | 4,303,000 | | | | 459,131,088 | |
| | | | | | | | |
| | | | | | | 669,869,088 | |
TECHNOLOGY, HARDWARE & EQUIPMENT: 8.5% | |
Brother Industries, Ltd.(b) (Japan) | | | 22,885,100 | | | | 246,914,705 | |
Fujifilm Holdings Corp. (Japan) | | | 10,544,400 | | | | 212,380,967 | |
Fujitsu, Ltd. (Japan) | | | 100,723,000 | | | | 422,902,806 | |
Hewlett-Packard Co. (United States) | | | 35,390,200 | | | | 504,310,350 | |
Kyocera Corp. (Japan) | | | 5,133,900 | | | | 465,547,962 | |
Nokia Oyj (Finland) | | | 136,229,200 | | | | 535,734,684 | |
TE Connectivity, Ltd. (Switzerland) | | | 12,270,462 | | | | 455,479,549 | |
Telefonaktiebolaget LM Ericsson (Sweden) | | | 61,122,200 | | | | 614,783,191 | |
| | | | | | | | |
| | | | | | | 3,458,054,214 | |
| | | | | | | | |
| | | | | | | 4,665,839,120 | |
| | | | | | | | |
| | |
| | | SHARES | | | VALUE | |
| MATERIALS: 8.2% | | | | | | | | |
Akzo Nobel NV (Netherlands) | | | 4,286,253 | | | $ | 282,837,078 | |
BHP Billiton PLC (United Kingdom) | | | 18,501,354 | | | | 650,128,352 | |
Cemex SAB de CV ADR(a) (Mexico) | | | 24,965,789 | | | | 246,412,337 | |
Duratex SA (Brazil) | | | 13,460,246 | | | | 98,342,365 | |
Lafarge SA(b) (France) | | | 21,344,291 | | | | 1,367,702,546 | |
Lanxess AG(b) (Germany) | | | 4,299,784 | | | | 376,044,512 | |
Linde AG (Germany) | | | 820,205 | | | | 143,035,094 | |
Norsk Hydro ASA (Norway) | | | 34,026,190 | | | | 173,341,268 | |
| | | | | | | | |
| | | | | | | 3,337,843,552 | |
| TELECOMMUNICATION SERVICES: 8.5% | |
America Movil SAB de CV, Series L (Mexico) | | | 382,200,000 | | | | 440,261,947 | |
Bharti Airtel, Ltd. (India) | | | 18,268,629 | | | | 106,272,973 | |
Millicom International Cellular SA SDR (Luxembourg) | | | 4,427,494 | | | | 384,821,066 | |
MTN Group, Ltd. (South Africa) | | | 39,020,300 | | | | 820,148,853 | |
PT Telekomunikasi Indonesia TBK (Indonesia) | | | 102,505,700 | | | | 96,447,851 | |
PT Telekomunikasi Indonesia TBK ADR (Indonesia) | | | 2,306,621 | | | | 85,229,646 | |
Telecom Italia SPA (Italy) | | | 201,500,000 | | | | 182,140,038 | |
Telecom Italia SPA-RSP (Italy) | | | 241,023,245 | | | | 190,722,316 | |
Telefonica SA (Spain) | | | 3,493,082 | | | | 47,431,635 | |
Telekom Austria AG (Austria) | | | 12,767,576 | | | | 96,615,829 | |
Vodafone Group PLC (United Kingdom) | | | 396,250,000 | | | | 996,515,713 | |
| | | | | | | | |
| | | | | | | 3,446,607,867 | |
| | | | | | | | |
TOTAL COMMON STOCKS
(Cost $39,713,281,387) | | | | | | $ | 39,581,927,769 | |
|
| PREFERRED STOCK 1.1% | |
| ENERGY: 0.9% | | | | | | | | |
Petroleo Brasileiro SA ADR (Brazil) | | | 19,216,000 | | | | 370,868,800 | |
|
| FINANCIALS: 0.2% | |
DIVERSIFIED FINANCIALS: 0.2% | |
Credit Suisse Group V, Ltd.(c) (Guernsey/Switzerland) | | | 52,556 | | | | 79,007,817 | |
| | | | | | | | |
TOTAL PREFERRED STOCKS
(Cost $421,221,145) | | | | | | $ | 449,876,617 | |
| | |
| See accompanying Notes to Financial Statements | | DODGE & COX INTERNATIONAL STOCK FUND §PAGE 8 |
| | | | |
| PORTFOLIO OF INVESTMENTS | | | December 31, 2012 | |
| | | | | | | | |
|
| SHORT-TERM INVESTMENTS: 1.1% | |
| | |
| | | PAR VALUE | | | VALUE | |
MONEY MARKET FUND: 0.1% | |
SSgA U.S. Treasury Money Market Fund | | $ | 40,195,422 | | | $ | 40,195,422 | |
|
REPURCHASE AGREEMENT: 1.0% | |
Fixed Income Clearing Corporation(d)
0.11%, dated 12/31/12, due 1/2/13, maturity value $404,841,474 | | | 404,839,000 | | | | 404,839,000 | |
| | | | | | | | |
TOTAL SHORT-TERM INVESTMENTS
(Cost $445,034,422) | | | $ | 445,034,422 | |
| | | | | | | | |
TOTAL INVESTMENTS
(Cost $40,579,536,954) | | | 99.8 | % | | $ | 40,476,838,808 | |
| | | | | | | | |
OTHER ASSETS LESS LIABILITIES | | | 0.2 | % | | | 79,351,885 | |
| | | | | | | | |
| NET ASSETS | | | 100.0 | % | | $ | 40,556,190,693 | |
| | | | | | | | |
| (b) | See Note 8 regarding holdings of 5% voting securities |
| (c) | Subordinated Mandatory and Contingent Convertible Securities (MACCS) received through a rights offering on July 31, 2012. The MACCS will be mandatorily converted into Credit Suisse Group AG shares on March 29, 2013. Each MACCS has a principal amount of CHF 1,000 and bears interest equivalent to a rate of 4% per annum, payable upon conversion of the MACCS. This security (0.2% of net assets) is deemed to be illiquid by Dodge & Cox, investment manager, pursuant to procedures approved by the Board of Trustees. |
| (d) | Repurchase agreement is collateralized by U.S. Treasury Note 0.25%-1.25%, 4/15/14-4/30/14. Total collateral value is $412,936,388. |
In determining a company’s country designation, the Fund generally references the country of incorporation. In cases where the Fund considers the country of incorporation to be a “jurisdiction of convenience” chosen primarily for tax purposes, the Fund uses the country designation of an appropriate broad-based market index. In that circumstance, two countries are listed—the country of incorporation and the country designated by an appropriate index, respectively.
ADR: American Depositary Receipt
NVDR: Non-Voting Depositary Receipt
SDR: Swedish Depository Receipt
Forward Foreign Currency Contracts
As of December 31, 2012, open forward foreign currency contracts are summarized as follows:
| | | | | | | | | | | | |
| | | | | Contract Amount | | | | |
| Counterparty | | Settlement
Date | | Receive U.S. Dollar | | Deliver Foreign Currency | | | Unrealized
Appreciation | |
Contracts to sell Japanese Yen: | |
| Deutsche Bank | | 1/23/2013 | | 252,563,520 | | | 20,000,000,000 | | | $ | 21,679,471 | |
| UBS | | 1/23/2013 | | 257,442,485 | | | 20,400,000,000 | | | | 21,940,756 | |
| Barclays | | 3/6/2013 | | 237,699,073 | | | 19,500,000,000 | | | | 12,511,385 | |
| | | | | | | | | | | | |
| | | | | | | | | | $ | 56,131,612 | |
| | | | | | | | | | | | |
| | | | | | | | | | | | | |
| | |
| PAGE 9 § DODGE & COX INTERNATIONAL STOCK FUND | | See accompanying Notes to Financial Statements |
| | | | |
STATEMENT OF ASSETS AND LIABILITIES | |
| |
| | | December 31, 2012 | |
ASSETS: | | | | |
Investments, at value | | | | |
Unaffiliated issuers (cost $36,146,046,632) | | $ | 35,268,221,287 | |
Affiliated issuers (cost $4,433,490,322) | | | 5,208,617,521 | |
| | | | |
| | | 40,476,838,808 | |
Cash denominated in foreign currency
(cost $2,552,157) | | | 2,553,240 | |
Receivable for investments sold | | | 57,017,192 | |
Unrealized appreciation on foreign currency contracts | | | 56,131,612 | |
Receivable for Fund shares sold | | | 73,799,718 | |
Dividends and interest receivable | | | 80,759,413 | |
Prepaid expenses and other assets | | | 238,215 | |
| | | | |
| | | 40,747,338,198 | |
| | | | |
LIABILITIES: | | | | |
Payable for investments purchased | | | 26,157,507 | |
Payable for Fund shares redeemed | | | 142,045,798 | |
Management fees payable | | | 20,399,881 | |
Accrued expenses | | | 2,544,319 | |
| | | | |
| | | 191,147,505 | |
| | | | |
NET ASSETS | | $ | 40,556,190,693 | |
| | | | |
NET ASSETS CONSIST OF: | | | | |
Paid in capital | | $ | 47,215,944,615 | |
Undistributed net investment income | | | 7,563,230 | |
Accumulated net realized loss | | | (6,620,785,464 | ) |
Net unrealized depreciation | | | (46,531,688 | ) |
| | | | |
| | $ | 40,556,190,693 | |
| | | | |
Fund shares outstanding (par value $0.01 each, unlimited shares authorized) | | | 1,170,912,413 | |
Net asset value per share | | | $34.64 | |
|
STATEMENT OF OPERATIONS | |
| |
| | | Year Ended
December 31, 2012 | |
INVESTMENT INCOME: | | | | |
Dividends (net of foreign taxes of $78,491,561) | | | | |
Unaffiliated issuers | | $ | 1,053,461,133 | |
Affiliated issuers | | | 66,830,225 | |
Interest | | | 1,212,721 | |
| | | | |
| | | 1,121,504,079 | |
| | | | |
EXPENSES: | | | | |
Management fees | | | 227,863,650 | |
Custody and fund accounting fees | | | 4,887,733 | |
Transfer agent fees | | | 6,502,123 | |
Professional services | | | 251,720 | |
Shareholder reports | | | 1,165,200 | |
Registration fees | | | 202,330 | |
Trustees’ fees | | | 190,500 | |
Miscellaneous | | | 1,697,600 | |
| | | | |
| | | 242,760,856 | |
| | | | |
NET INVESTMENT INCOME | | | 878,743,223 | |
| | | | |
REALIZED AND UNREALIZED GAIN: | | | | |
Net realized gain (net of foreign taxes of $4,085,256) | | | | |
Investments in unaffiliated issuers | | | 1,065,874,019 | |
Investments in affiliated issuers | | | 125,627,769 | |
Foreign currency transactions | | | 28,526,626 | |
Net change in unrealized appreciation/depreciation | | | | |
Investments (including net decrease in accrued foreign capital gain tax of $26,523,074) | | | 5,107,712,370 | |
Foreign currency transactions | | | 44,043,735 | |
| | | | |
Net realized and unrealized gain | | | 6,371,784,519 | |
| | | | |
NET INCREASE IN NET ASSETS
FROM OPERATIONS | | $ | 7,250,527,742 | |
| | | | |
| | | | | | | | |
STATEMENT OF CHANGES IN NET ASSETS | |
| | |
| | | Year Ended
December 31, 2012 | | | Year Ended
December 31, 2011 | |
OPERATIONS: | | | | | | | | |
Net investment income | | $ | 878,743,223 | | | $ | 942,899,856 | |
Net realized gain | | | 1,220,028,414 | | | | 1,191,103,633 | |
Net change in unrealized appreciation/depreciation | | | 5,151,756,105 | | | | (9,288,886,801 | ) |
| | | | | | | | |
| | | 7,250,527,742 | | | | (7,154,883,312 | ) |
| | | | | | | | |
| | |
DISTRIBUTIONS TO SHAREHOLDERS FROM: | | | | | | | | |
Net investment income | | | (865,782,642 | ) | | | (922,003,327 | ) |
Net realized gain | | | — | | | | — | |
| | | | | | | | |
Total distributions | | | (865,782,642 | ) | | | (922,003,327 | ) |
| | | | | | | | |
| | |
FUND SHARE TRANSACTIONS: | | | | | | | | |
Proceeds from sale of shares | | | 6,188,958,946 | | | | 8,672,373,099 | |
Reinvestment of distributions | | | 744,920,426 | | | | 791,899,770 | |
Cost of shares redeemed | | | (8,685,963,235 | ) | | | (8,870,305,644 | ) |
| | | | | | | | |
Net increase (decrease) from Fund share transactions | | | (1,752,083,863 | ) | | | 593,967,225 | |
| | | | | | | | |
Total increase (decrease) in
net assets | | | 4,632,661,237 | | | | (7,482,919,414 | ) |
| | |
NET ASSETS: | | | | | | | | |
Beginning of year | | | 35,923,529,456 | | | | 43,406,448,870 | |
| | | | | | | | |
End of year (including undistributed net investment income of $7,563,230 and $3,255,825, respectively) | | $ | 40,556,190,693 | | | $ | 35,923,529,456 | |
| | | | | | | | |
| | |
SHARE INFORMATION: | | | | | | | | |
Shares sold | | | 194,599,589 | | | | 255,279,422 | |
Distributions reinvested | | | 21,566,891 | | | | 27,372,961 | |
Shares redeemed | | | (273,859,180 | ) | | | (269,547,993 | ) |
| | | | | | | | |
Net increase (decrease) in shares outstanding | | | (57,692,700 | ) | | | 13,104,390 | |
| | | | | | | | |
| | |
| See accompanying Notes to Financial Statements | | DODGE & COX INTERNATIONAL STOCK FUND §PAGE 10 |
NOTES TO FINANCIAL STATEMENTS
NOTE 1—ORGANIZATION AND SIGNIFICANT ACCOUNTING POLICIES
Dodge & Cox International Stock Fund (the “Fund”) is one of the series constituting the Dodge & Cox Funds (the “Trust” or the “Funds”). The Trust is organized as a Delaware statutory trust and is registered under the Investment Company Act of 1940, as amended, as a diversified, open-end management investment company. The Fund commenced operations on May 1, 2001, and seeks long-term growth of principal and income. The Fund invests primarily in a diversified portfolio of foreign stocks. Foreign investing, especially in developing countries, has special risks such as currency and market volatility and political and social instability. These and other risk considerations are discussed in the Fund’s Prospectus.
The financial statements have been prepared in conformity with accounting principles generally accepted in the United States of America, which require the use of estimates and assumptions by management. Actual results may differ from those estimates. Significant accounting policies are as follows:
Security valuation The Fund’s net assets are valued as of the close of trading on the New York Stock Exchange (NYSE), generally 4:00 p.m. Eastern Time, each day that the NYSE is open for business. Listed securities are valued at market, using the official quoted close price or the last sale on the date of determination or, if not available, at the mean between the exchange listed bid and ask prices. A security that is listed or traded on more than one exchange is valued at the quotation on the exchange determined to be the primary market for such security. Security values are not discounted based on the size of the Fund’s position. Short-term securities are valued at amortized cost which approximates current value.
Investments initially valued in currencies other than the U.S. dollar are converted to the U.S. dollar using prevailing exchange rates. As a result, the Fund’s net asset value per share (NAV) may be affected by changes in the value of currencies in relation to the U.S. dollar.
If market quotations are not readily available or if a security’s value has materially changed after the close of the security’s primary market but before the close of trading on the NYSE, the security is valued at fair value as
determined in good faith by or under the direction of the Board of Trustees. The Fund may use fair value pricing in calculating its NAV when, for example, (i) the primary market for a security is closed or if trading of a security is suspended or limited, (ii) the Fund determines that the price provided by a pricing service is inaccurate or unreliable, or (iii) the Fund determines that a significant event affecting the value of a security has occurred before the close of the NYSE but after the close of the security’s primary market. An event is considered significant if there is both an affirmative expectation that the security’s value will materially change in response to the event and a reasonable basis exists for quantifying a resulting change in value. Because trading in securities on most non-U.S. exchanges is normally completed before the close of the NYSE, the value of foreign securities can change by the time the Fund calculates its NAV. To address these changes, the Fund may utilize adjustment factors provided by an independent pricing service to systematically value foreign securities at fair value. These adjustment factors are based on statistical analyses of subsequent movements and changes in securities indices, specific security prices, and exchange rates in foreign markets. When fair value pricing is employed, the prices of securities used by the Fund to calculate its net asset value may differ from quoted or published prices for the same securities. In addition, fair values may not reflect the price that the Fund could obtain for a security if it were to dispose of that security at the time of pricing.
Security transactions, investment income, expenses, and distributions Security transactions are recorded on the trade date. Realized gains and losses on securities sold are determined on the basis of identified cost.
Dividend income and corporate action transactions are recorded on the ex-dividend date, or when the Fund first learns of the dividend/corporate action if the ex-dividend date has passed. Non-cash dividends included in dividend income, if any, are recorded at the fair market value of the securities received. Dividends characterized as return of capital are recorded as a reduction of cost of investments and/or realized gain. Interest income is recorded on the accrual basis.
PAGE 11 § DODGE & COX INTERNATIONAL STOCK FUND
NOTES TO FINANCIAL STATEMENTS
Expenses are recorded on the accrual basis. Most expenses of the Trust can be directly attributed to a specific series. Expenses which cannot be directly attributed are allocated among the Funds in the Trust based on relative net assets or other expense methodologies determined by the nature of the expense.
Distributions to shareholders are recorded on the ex-dividend date.
Repurchase agreements The Fund enters into repurchase agreements, secured by U.S. government or agency securities, which involve the purchase of securities from a counterparty with a simultaneous commitment to resell the securities at an agreed-upon date and price. It is the Fund’s policy that its custodian take possession of the underlying collateral securities, the fair value of which exceeds the principal amount of the repurchase transaction, including accrued interest, at all times. In the event of default by the counterparty, the Fund has the contractual right to liquidate the collateral securities and to apply the proceeds in satisfaction of the obligation.
Foreign taxes The Fund is subject to foreign taxes which may be imposed by certain countries in which the Fund invests. The Fund endeavors to record foreign taxes based on applicable foreign tax law. Withholding taxes are incurred on certain foreign dividends and are accrued at the time the associated dividend is recorded. The Fund files withholding tax reclaims in certain jurisdictions to recover a portion of amounts previously withheld. The Fund records a reclaim receivable based on, among other things, a jurisdiction’s legal obligation to pay reclaims as well as payment history and market convention. In consideration of recent decisions rendered by European courts, the Fund has filed for additional reclaims related to prior years. However, a corresponding receivable amount has not yet been recorded because there is no historical precedent for collecting such reclaims and the amount, if any, that the Fund might recover is uncertain. Such amounts, if and when received, could result in an increase in the Fund’s net asset value per share.
Capital gains taxes are incurred upon disposition of certain foreign securities. Capital gains taxes on appreciated securities are accrued as unrealized losses and are reflected as realized losses upon the sale of the related
security. Currency taxes may be incurred when the Fund purchases certain foreign currencies related to securities transactions and are recorded as realized losses on foreign currency transactions.
Forward foreign currency contracts A forward foreign currency contract represents an obligation to purchase or sell a specific foreign currency at a future date and at a price set at the time of the contract. Losses from these transactions may arise from unfavorable changes in currency values or if the counterparties do not perform under a contract’s terms.
The values of the forward foreign currency contracts are adjusted daily based on the applicable exchange rate of the underlying currency. Changes in the value of open contracts are recorded as unrealized appreciation or depreciation in the Statement of Operations. When the forward contract is closed, the Fund records a realized gain or loss in the Statement of Operations equal to the difference between the value at the time the contract was opened and the value at the time it was closed.
During the year, the Fund maintained foreign currency contracts to hedge foreign currency risks associated with portfolio investments denominated in Japanese Yen and Swiss Francs. These forward foreign currency contracts had U.S. dollar total values ranging from 1% to 3% of net assets.
Foreign currency translation The books and records of the Funds are maintained in U.S. dollars. Foreign currency amounts are translated into U.S. dollars at the prevailing exchange rates of such currencies against the U.S. dollar. The market value of investment securities and other assets and liabilities are translated at the exchange rate as of the valuation date. Purchases and sales of investment securities, income, and expenses are translated at the exchange rate prevailing on the transaction date.
Reported realized and unrealized gain (loss) on investments include foreign currency gain (loss) related to investment transactions.
Reported realized and unrealized gain (loss) on foreign currency transactions include the following: holding/disposing of foreign currency and forward foreign currency contracts, the difference between the trade and
DODGE & COX INTERNATIONAL STOCK FUND §PAGE 12
NOTES TO FINANCIAL STATEMENTS
settlement dates on securities transactions, the difference between the accrual and payment dates on dividends, and currency losses on the purchase of foreign currency in certain countries that impose taxes on such transactions.
Indemnification Under the Trust’s organizational documents, its officers and trustees are indemnified against certain liabilities arising out of the performance of their duties to the Trust. In addition, in the normal course of business the Trust enters into contracts that provide general indemnities to other parties. The Trust’s maximum exposure under these arrangements is unknown as this would involve future claims that may be made against the Trust that have not yet occurred.
NOTE 2—VALUATION MEASUREMENTS
Various inputs are used in determining the value of the Fund’s investments and other financial instruments. These inputs are summarized in the three broad levels listed below.
| § | | Level 1: Quoted prices in active markets for identical securities |
| § | | Level 2: Other significant observable inputs (including quoted prices for similar securities, market indices, interest rates, credit risk, etc.) |
| § | | Level 3: Significant unobservable inputs (including Fund management’s assumptions in determining the fair value of investments) |
The inputs or methodology used for valuing securities are not necessarily an indication of the risk associated with investing in those securities.
The following is a summary of the inputs used to value the Fund’s holdings as of December 31, 2012:
| | | | | | | | |
| Security Classification(a) | | LEVEL 1
(Quoted Prices) | | | LEVEL 2
(Other Significant
Observable Inputs) | |
Securities | | | | | | | | |
Common Stocks | | | | | | | | |
Consumer Discretionary | | $ | 1,476,932,224 | | | $ | 3,769,020,345 | |
Consumer Staples | | | 204,026,658 | | | | 773,357,710 | |
Energy | | | 1,529,034,283 | | | | 303,744,304 | |
Financials | | | — | | | | 10,116,492,311 | |
Health Care | | | 1,895,148,969 | | | | 4,389,639,526 | |
Industrials | | | 337,801,881 | | | | 3,336,439,019 | |
Information Technology | | | 1,170,527,899 | | | | 3,495,311,221 | |
Materials | | | 246,412,337 | | | | 3,091,431,215 | |
Telecommunication Services | | | 525,491,593 | | | | 2,921,116,274 | |
Preferred Stocks | | | | | | | | |
Energy | | | 370,868,800 | | | | — | |
Financials | | | — | | | | 79,007,817 | |
Short-term Investments | | | | | | | | |
Money Market Fund | | | 40,195,422 | | | | — | |
Repurchase Agreement | | | — | | | | 404,839,000 | |
| | | | | | | | |
Total Securities | | $ | 7,796,440,066 | | | $ | 32,680,398,742 | |
| | | | | | | | |
Other Financial Instruments | | | | | | | | |
Forward Foreign Currency Contracts | | $ | — | | | $ | 56,131,612 | (b) |
| | | | | | | | | |
| (a) | Transfers during the period between Level 1 and Level 2 relate to the use of systematic fair valuation. On days when systematic fair valuation is used, securities whose primary market closes before the NYSE are classified as Level 2. There were no Level 3 securities at December 31, 2012 and 2011, and there were no transfers to Level 3 during the year. |
| (b) | Represents net unrealized appreciation on forward foreign currency contracts. |
NOTE 3—RELATED PARTY TRANSACTIONS
Management fees Under a written agreement approved by a unanimous vote of the Board of Trustees, the Fund pays an annual management fee of 0.60% of the Fund’s average daily net assets to Dodge & Cox, investment manager of the Fund.
Fund officers and trustees All officers and three of the trustees of the Trust are officers or employees of Dodge & Cox. The Trust pays a fee only to those trustees who are not affiliated with Dodge & Cox.
PAGE 13 § DODGE & COX INTERNATIONAL STOCK FUND
NOTES TO FINANCIAL STATEMENTS
NOTE 4—INCOME TAX INFORMATION AND DISTRIBUTIONS TO SHAREHOLDERS
A provision for federal income taxes is not required since the Fund intends to continue to qualify as a regulated investment company under Subchapter M of the Internal Revenue Code and distribute all of its taxable income to shareholders. Distributions are determined in accordance with income tax regulations, and such amounts may differ from net investment income and realized gains for financial reporting purposes. Financial reporting records are adjusted for permanent book/tax differences at year end to reflect tax character.
Book/tax differences are primarily due to differing treatments of wash sales, net short-term realized gain (loss) on investments, foreign capital gain taxes, and foreign currency realized gain (loss). At December 31, 2012, the cost of investments for federal income tax purposes was $40,644,237,814.
Distributions during the years ended December 31, 2012 and 2011, were characterized as follows for federal income tax purposes.
| | | | | | | | |
| | | Year Ended December 31, 2012 | | | Year Ended
December 31, 2011 | |
Ordinary income | | | $865,782,642 | | | | $922,003,327 | |
| | | ($0.747 per share) | | | | ($0.759 per share) | |
| | |
Long-term capital gain | | | — | | | | — | |
At December 31, 2012, the tax basis components of distributable earnings were as follows:
| | | | |
Unrealized appreciation | | $ | 7,615,055,279 | |
Unrealized depreciation | | | (7,782,454,284 | ) |
| | | | |
Net unrealized depreciation | | | (167,399,005 | ) |
Undistributed ordinary income | | | 7,563,230 | |
Capital loss carryforward(a) | | | (6,499,952,993 | ) |
| (a) | Represents accumulated capital loss as of December 31, 2012, which may be carried forward to offset future capital gains. During 2012, the Fund utilized $1,220,709,266 of the capital loss carryforward. If not utilized, the capital loss carryforward expires as follows: |
| | | | |
Expiring in 2017 | | $ | 5,379,832,764 | |
Expiring in 2018 | | | 1,120,120,229 | |
| | | | |
| | $ | 6,499,952,993 | |
| | | | |
Under the Regulated Investment Company Modernization Act of 2010, capital losses incurred by the Fund after January 1, 2011, will not be subject to expiration. In addition, such losses must be utilized prior to the losses incurred in the years preceding enactment. (The Fund had net capital gains in 2011 and 2012.)
Fund management has reviewed the tax positions for open periods (three years and four years, respectively, from filing the Fund’s Federal and State tax returns) as applicable to the Fund, and has determined that no provision for income tax is required in the Fund’s financial statements.
NOTE 5—LOAN FACILITIES
Pursuant to an exemptive order issued by the Securities and Exchange Commission (SEC), the Fund may participate in an interfund lending facility (Facility). The Facility allows the Fund to borrow money from or loan money to the Funds. Loans under the Facility are made for temporary or emergency purposes, such as to fund shareholder redemption requests. Interest on borrowings is the average of the current repurchase agreement rate and the bank loan rate. There was no activity in the Facility during the period.
All Funds in the Trust participate in a $500 million committed credit facility (Line of Credit) with State Street Bank and Trust Company, to be utilized for temporary or emergency purposes to fund shareholder redemptions or for other short-term liquidity purposes. The maximum amount available to the Fund is $250 million. Each Fund pays an annual commitment fee on its pro-rata portion of the Line of Credit. The Fund’s commitment fee for the year ended December 31, 2012, amounted to $155,445 and is reflected as a Miscellaneous Expense in the Statement of Operations. Interest on borrowings is charged at the prevailing rate. There were no borrowings on the Line of Credit during the period.
NOTE 6—PURCHASES AND SALES OF INVESTMENTS
For the year ended December 31, 2012, purchases and sales of securities, other than short-term securities, aggregated $3,678,744,968 and $5,490,936,933 respectively.
DODGE & COX INTERNATIONAL STOCK FUND §PAGE 14
NOTES TO FINANCIAL STATEMENTS
NOTE 7—ACCOUNTING PRONOUNCEMENTS
Effective January 1, 2013, the Fund will adopt Accounting Standards Update (ASU) No. 2011-11, Balance Sheet (Topic 210): Disclosures about Offsetting Assets and Liabilities and ASU No. 2013-01, Balance Sheet (Topic 210): Clarifying the Scope of Disclosures about Offsetting Assets and Liabilities. These amendments to Topic 210 require enhanced disclosures about offsetting of financial assets and liabilities, including derivative instruments, to enable investors to understand the effect of these arrangements on a fund’s financial position. Management believes the adoption of these ASUs will not have a material impact on the Fund’s financial statements.
NOTE 8—SUBSEQUENT EVENTS
Fund management has determined that no material events or transactions occurred subsequent to December 31, 2012, and through the date of the Fund’s financial statements issuance, which require additional disclosure in the Fund’s financial statements.
NOTE 9—HOLDINGS OF 5% VOTING SECURITIES
Each of the companies listed below was considered to be an affiliate of the Fund because the Fund owned 5% or more of the company’s voting securities during all or part of the year ended December 31, 2012. Purchase and sale transactions and dividend income earned during the period on these securities were as follows:
| | | | | | | | | | | | | | | | | | | | | | | | |
| | | Shares at
Beginning of Period | | | Additions | | | Reductions | | | Shares at
End of Period | | | Dividend
Income(a) | | | Value at End of Period | |
Aderans Co., Ltd (Japan) | | | 3,417,400 | | | | — | | | | (3,235,100 | ) | | | 182,300 | | | $ | — | (b) | | $ | — | (c) |
Anadolu Efes Biracilik ve Malt Sanayii AS (Turkey) | | | 25,888,440 | | | | — | | | | (1,400,000 | ) | | | 24,488,440 | | | | 5,154,851 | | | | — | (c) |
Brother Industries, Ltd. (Japan) | | | 22,885,100 | | | | — | | | | — | | | | 22,885,100 | | | | 6,366,429 | | | | 246,914,705 | |
Corporacion Geo SAB de CV,
Series B (Mexico) | | | 50,305,400 | | | | — | | | | — | | | | 50,305,400 | | | | — | (b) | | | 58,842,642 | |
Infineon Technologies AG (Germany) | | | 62,194,266 | | | | 5,000,000 | | | | (905,810 | ) | | | 66,288,456 | | | | 9,791,494 | | | | 537,915,818 | |
Lafarge SA (France) | | | 16,454,291 | | | | 5,090,000 | | | | (200,000 | ) | | | 21,344,291 | | | | 11,619,287 | | | | 1,367,702,546 | |
Lanxess AG (Germany) | | | 4,839,784 | | | | — | | | | (540,000 | ) | | | 4,299,784 | | | | 4,455,200 | | | | 376,044,512 | |
Naspers, Ltd. (South Africa) | | | 27,360,895 | | | | — | | | | (2,200,000 | ) | | | 25,160,895 | | | | 9,419,144 | | | | 1,616,659,335 | |
NGK Spark Plug Co., Ltd. (Japan) | | | 16,720,000 | | | | — | | | | — | | | | 16,720,000 | | | | 4,263,741 | | | | 222,197,863 | |
Nexans SA (France) | | | 1,391,332 | | | | 298,926 | | | | — | | | | 1,690,258 | | | | 1,654,999 | | | | 76,858,002 | |
Television Broadcasts, Ltd. (Hong Kong) | | | 35,625,100 | | | | — | | | | (1,610,000 | ) | | | 34,015,100 | | | | 10,674,816 | | | | 255,324,875 | |
Wienerberger AG (Austria) | | | 11,254,341 | | | | 995,700 | | | | — | | | | 12,250,041 | | | | 1,466,497 | | | | 112,852,632 | |
Yamaha Motor Co., Ltd. (Japan) | | | 27,230,000 | | | | 3,200,000 | | | | — | | | | 30,430,000 | | | | 1,963,767 | | | | 337,304,591 | |
| | | | | | | | | | | | | | | | | | | | | | | | |
| | | | | | | | | | | | | | | | | | $ | 66,8330,225 | | | $ | 5,208,617,521 | |
| | | | | | | | | | | | | | | | | | | | | | | | |
| | | | | | | | | | | | | | | | | | | | | | | | | |
| (a) | Net of foreign taxes, if any |
| (c) | Company was not an affiliate at period end |
PAGE 15 § DODGE & COX INTERNATIONAL STOCK FUND
FINANCIAL HIGHLIGHTS
| | | | | | | | | | | | | | | | | | | | |
SELECTED DATA AND RATIOS (for a share outstanding throughout each year) | | Year Ended December 31, | |
| | | 2012 | | | 2011 | | | 2010 | | | 2009 | | | 2008 | |
| | | | |
Net asset value, beginning of year | | | $29.24 | | | | $35.71 | | | | $31.85 | | | | $21.90 | | | | $46.02 | |
Income from investment operations: | | | | | | | | | | | | | | | | | | | | |
Net investment income | | | 0.76 | | | | 0.78 | | | | 0.51 | | | | 0.41 | | | | 0.97 | |
Net realized and unrealized gain (loss) | | | 5.39 | | | | (6.49 | ) | | | 3.85 | | | | 9.98 | | | | (22.57 | ) |
| | | | |
Total from investment operations | | | 6.15 | | | | (5.71 | ) | | | 4.36 | | | | 10.39 | | | | (21.60 | ) |
| | | | |
Distributions to shareholders from: | | | | | | | | | | | | | | | | | | | | |
Net investment income | | | (0.75 | ) | | | (0.76 | ) | | | (0.50 | ) | | | (0.44 | ) | | | (0.94 | ) |
Net realized gain | | | — | | | | — | | | | — | | | | — | | | | (1.58 | ) |
| | | | |
Total distributions | | | (0.75 | ) | | | (0.76 | ) | | | (0.50 | ) | | | (0.44 | ) | | | (2.52 | ) |
| | | | |
Net asset value, end of year | | | $34.64 | | | | $29.24 | | | | $35.71 | | | | $31.85 | | | | $21.90 | |
| | | | |
Total return | | | 21.03 | % | | | (15.97 | )% | | | 13.69 | % | | | 47.46 | % | | | (46.68 | )% |
Ratios/supplemental data: | | | | | | | | | | | | | | | | | | | | |
Net assets, end of year (millions) | | | $40,556 | | | | $35,924 | | | | $43,406 | | | | $36,748 | | | | $25,020 | |
Ratio of expenses to average net assets | | | 0.64 | % | | | 0.64 | % | | | 0.65 | % | | | 0.65 | % | | | 0.64 | % |
Ratio of net investment income to average net assets | | | 2.31 | % | | | 2.23 | % | | | 1.58 | % | | | 1.58 | % | | | 2.37 | % |
Portfolio turnover rate | | | 10 | % | | | 16 | % | | | 15 | % | | | 21 | % | | | 35 | % |
See accompanying Notes to Financial Statements
DODGE & COX INTERNATIONAL STOCK FUND §PAGE 16
REPORT OF INDEPENDENT REGISTERED PUBLIC ACCOUNTING FIRM
To the Trustees of Dodge & Cox Funds and Shareholders of Dodge & Cox International Stock Fund
In our opinion, the accompanying statement of assets and liabilities, including the portfolio of investments, and the related statements of operations and of changes in net assets and the financial highlights present fairly, in all material respects, the financial position of Dodge & Cox International Stock Fund (the “Fund”, one of the series constituting Dodge & Cox Funds) at December 31, 2012, the results of its operations for the year then ended, the changes in its net assets for each of the two years in the period then ended and the financial highlights for each of the five years in the period then ended, in conformity with accounting principles generally accepted in the United States of America. These financial statements and financial highlights (hereafter referred to as “financial statements”) are the responsibility of the Fund’s management; our responsibility is to express an opinion on these financial statements based on our audits. We conducted our audits of these financial statements in accordance with the standards of the Public Company Accounting Oversight Board (United States). Those standards require that we plan and perform the audit to obtain reasonable assurance about whether the financial statements are free of material misstatement. An audit includes examining, on a test basis, evidence supporting the amounts and disclosures in the financial statements, assessing the accounting principles used and significant estimates made by management, and evaluating the overall financial statement presentation. We believe that our audits, which included confirmation of securities at December 31, 2012, by correspondence with the custodian and brokers, provide a reasonable basis for our opinion.
PricewaterhouseCoopers LLP
San Francisco, California
February 20, 2013
PAGE 17 § DODGE & COX INTERNATIONAL STOCK FUND
SPECIAL 2012 TAX INFORMATION
(unaudited)
The following information is provided pursuant to provisions of the Internal Revenue Code:
In 2012, the Fund elected to pass through to shareholders foreign source income of $1,209,781,865 and foreign taxes paid of $82,576,817.
The Fund designates up to a maximum of $1,176,537,669 of its distributions paid to shareholders in 2012 as qualified dividends (treated for federal income tax purposes in the hands of shareholders as taxable at a maximum rate of 15%).
For shareholders that are corporations, the Fund designates 2% of its ordinary dividends paid to shareholders in 2012 as dividends from domestic corporations eligible for the corporate dividends received deduction, provided that the shareholder otherwise satisfies applicable requirements to claim that deduction.
BOARD APPROVAL OF FUNDS’ INVESTMENT MANAGEMENT AGREEMENTS AND MANAGEMENT FEES
(unaudited)
The Board of Trustees is responsible for overseeing the performance of the Dodge & Cox Funds’ investment manager and determining whether to continue the Investment Management Agreements between the Funds and Dodge & Cox each year (the “Agreements”). At a meeting of the Board of Trustees of the Trust held on December 12, 2012, the Trustees, by a unanimous vote (including a separate vote of those Trustees who are not “interested persons” (as defined in the Investment Company Act of 1940) (the “Independent Trustees”)), approved the renewal of the Agreements for an additional one-year term through December 31, 2013. During the course of the year, the Board received a wide variety of materials relating to the services provided by Dodge & Cox and the performance of each of the Funds.
INFORMATION RECEIVED
In advance of the meeting, the Board, including each of the Independent Trustees, requested, received, and reviewed materials relating to the Agreements and the services provided by Dodge & Cox. The Independent Trustees retained Morningstar® to prepare an independent
expense and performance summary for each Fund and comparable funds managed by other advisers identified by Morningstar. The Morningstar materials included information regarding advisory fee rates, expense ratios, and transfer agency, custodial, and distribution expenses, as well as appropriate performance comparisons to a Fund’s peer group and an index or combination of indices. The Morningstar materials also included a comparison of expenses of various share classes offered by comparable funds.
The materials reviewed by the Board contained information concerning, among other things, Dodge & Cox’s profitability, financial results and condition, advisory fee revenue, and separate account advisory fee schedules. The Board additionally considered the Funds’ brokerage commissions, turnover rates, sales and redemption data and the significant investment that Dodge & Cox makes in research used in managing the Funds. The Board received and reviewed a memorandum summarizing information provided throughout the year regarding Dodge & Cox’s services to the Funds as well as information regarding (i) the different fees, services, costs, and risks associated with separate accounts managed by Dodge & Cox as compared to the Dodge & Cox Funds; (ii) the differences in performance between the Funds and separately managed accounts; and (iii) Fund shares subscription and redemption activity. Throughout the process of reviewing the services provided by Dodge & Cox and preparing for the meeting, the Independent Trustees found Dodge & Cox to be open, forthright, detailed, and very helpful in answering questions about all issues.
The Board received copies of the Agreements and a memorandum from the independent legal counsel to the Independent Trustees discussing the factors generally regarded as appropriate to consider in evaluating advisory arrangements. The Trust’s Contract Review Committee, consisting solely of Independent Trustees, met with the independent legal counsel on November 1, 2012, and again on December 12, 2012, to discuss whether to renew the Agreements. The Board, including the Independent Trustees, subsequently concluded that the existing Agreements are fair and reasonable and voted to approve the Agreements.
DODGE & COX INTERNATIONAL STOCK FUND §PAGE 18
In considering the Agreements, the Board, including the Independent Trustees, did not identify any single factor or particular information as all-important or controlling. In reaching the decision to approve the Agreements, the Board considered several factors, discussed below, to be key factors and reached the conclusions described below.
NATURE, QUALITY, AND EXTENT OF THE SERVICES
The Board considered that Dodge & Cox provides a wide range of services to the Funds in addition to portfolio management and that the quality of these services has been excellent in all respects. The extensive nature of services provided by Dodge & Cox has been documented in materials provided to the Board and in presentations made to the Board throughout the year. In particular, the Board considered the nature, quality, and extent of portfolio management, administrative, and shareholder services performed by Dodge & Cox. With regard to portfolio management services, the Board considered Dodge & Cox’s established long-term history of care and conscientiousness in the management of the Funds; its demonstrated consistency in investment approach and depth; the background and experience of the Dodge & Cox Investment Policy Committee, International Investment Policy Committee, Global Investment Policy Committee, Fixed Income Investment Policy Committee, and research analysts responsible for managing the Funds; its methods for assessing the regulatory and investment climate in various jurisdictions; Dodge & Cox’s overall high level of attention to its core investment management function; and its commitment to the Funds and their shareholders.
In the area of administrative and shareholder services, the Board considered the excellent quality of Dodge & Cox’s work in areas such as compliance, legal services, trading, proxy voting, oversight of the Funds’ transfer agent and custodian, tax compliance, and shareholder communication through its website and other means. The Board also noted Dodge & Cox’s diligent disclosure policy, its favorable compliance record, and its reputation as a trusted, shareholder-friendly mutual fund family.
In addition, the Board considered that Dodge & Cox manages approximately $120 billion in Fund assets with fewer professionals than most comparable funds, and that on average these professionals have more experience and longer tenure than investment professionals at comparable funds. The Board also noted that Dodge & Cox is an investment research-oriented firm with no other business endeavors to distract management’s attention from its research efforts, and that its investment professionals adhere to a consistent investment approach across the Funds. The Board further considered the favorable stewardship and “Gold” analyst ratings awarded to each of the Funds by Morningstar. The Board concluded that it was satisfied with the nature, extent, and quality of investment management and other services provided to the Funds by Dodge & Cox.
INVESTMENT PERFORMANCE
The Board considered short-term and long-term investment performance for each Fund (including periods of outperformance or underperformance) as compared to both relevant indices and the performance of such Fund’s peer group. The Board also reviewed recent performance in the context of long-term investment goals. The Board noted that each Fund’s short-term (one-year) performance relative to its benchmark and peer group had improved since the previous year’s review. The Board determined after extensive review and inquiry that Dodge & Cox’s historic, long-term, team-oriented bottom up investment approach remains consistent and that Dodge & Cox continues to be distinguished by its integrity, transparency, and independence.
The Board considered that the performance of the Funds is the result of a team-oriented investment management process that emphasizes a long-term investment horizon, comprehensive independent research, price discipline, and focus. The Board also considered that the investment performance delivered by Dodge & Cox to the Funds appeared to be consistent with the relevant performance delivered for other (non-fund) clients of Dodge & Cox. The Board concluded that Dodge & Cox has delivered favorable long-term performance for Fund investors consistent with the long-term investment strategies being pursued by the Funds.
PAGE 19 § DODGE & COX INTERNATIONAL STOCK FUND
COSTS AND ANCILLARY BENEFITS
Costs of Services to Funds: Fees and Expenses. The Board considered each Fund’s management fee rate and expense ratio relative to similar mutual funds and relative to management fees charged by Dodge & Cox to other clients. In particular, the Board considered that the Funds continue to be substantially below their peer group median in expense ratios and management fee rates and that many media and industry reports specifically comment on the low expense ratios of the Funds, which have been a defining characteristic of the Funds for many years. The Board also evaluated the operating structures of the Funds and Dodge & Cox, noting that the Funds do not charge front-end sales commissions or distribution fees, and Dodge & Cox bears, among other things, the significant cost of third party research, reimbursement for recordkeeping and administrative costs to third-party retirement plan administrators, and administrative and office overhead. The Board noted that expenses are well below industry averages. The Board also considered that the Funds receive numerous administrative, regulatory compliance, and shareholder support services from Dodge & Cox without any additional administrative fee and the fact that the Funds have relatively low transaction costs and portfolio turnover rates. The Board reviewed Morningstar data showing that the few peer group funds with lower expense ratios often have other share classes with significantly higher expense ratios.
The Board reviewed information regarding the fee rates Dodge & Cox charges to separate accounts that have investment programs similar to those of the Funds, including instances where separate account fees are lower than Fund fees. The Board considered differences in the nature and scope of services Dodge & Cox provides to the Funds as compared to separate accounts, differences in regulatory, litigation, and other risks as between mutual funds and separate accounts, and certain characteristics of the market for institutional separate account management services. The Board further noted that, with respect to non-U.S. funds sponsored and managed by Dodge & Cox that are comparable to the Funds in many respects, the fee rates charged by Dodge & Cox are the same as or higher than the fee rates charged to the Funds. After consideration of these matters, the Board concluded that the overall costs incurred by the Funds for the services
they receive (including the management fee paid to Dodge & Cox) are reasonable and that the fees are acceptable based upon the qualifications, experience, reputation, and performance of Dodge & Cox and the low overall expense ratios of the Funds.
Profitability and Costs of Services to Dodge & Cox; “Fall-out” Benefits. The Board reviewed reports of Dodge & Cox’s financial position, profitability, and estimated overall value, and considered Dodge & Cox’s overall profitability within its context as a private, employee-owned S-Corporation and relative to the favorable services provided. The Board noted that net revenues for 2012 are projected to decrease slightly from 2011. The Board noted in particular that Dodge & Cox’s profits are not generated by high fee rates, but reflect an extraordinarily streamlined, efficient, and focused business approach toward investment management. The Board recognized the importance of Dodge & Cox’s profitability—which is derived solely from management fees and does not include other business ventures—to maintain its independence, stability, company culture and ethics, and management continuity. The Board also considered that the compensation/profit structure at Dodge & Cox is vital for remaining independent and facilitating retention of its management and investment professionals.
The Board considered potential “fall-out” benefits (including the receipt of research from unaffiliated brokers) that Dodge & Cox might receive as a result of its association with the Funds and determined that they are not significant. The Board also noted the extent of additional administrative services performed by Dodge & Cox for the Funds, and that the magnitude of costs and risks borne by Dodge & Cox in rendering advisory services to the Funds (including risks in the regulatory compliance, securities valuation, and investment management processes) are continuing to increase. The Board concluded that the profitability of Dodge & Cox’s relationship with the Funds (including fall-out benefits) was fair and reasonable.
THE BENEFIT OF ECONOMIES OF SCALE
The Board considered whether there have been economies of scale with respect to the management of each Fund, whether the Funds have appropriately
DODGE & COX INTERNATIONAL STOCK FUND §PAGE 20
benefited from any economies of scale, and whether the management fee rate is reasonable in relation to the Fund assets and any economies of scale that may exist. In the Board’s view, any consideration of economies of scale must take account of the Funds’ low fee structure and the considerable efficiencies of the Funds’ organization and fee structure that has been realized by shareholders from the time of each Fund’s inception (i.e., from the first dollar). The Board noted that Dodge & Cox has shared economies of scale by adding or enhancing services to the Funds over time, and that the internal costs of providing investment management, up-to-date technology, administrative, and compliance services to the Funds are continuing to increase. For example, Dodge & Cox has increased its global research staff and investment resources over the years to address the increased complexity of investing in multinational and non-U.S. companies. In addition, Dodge & Cox has made substantial expenditures in other staff and infrastructure to enable it to integrate credit and equity analyses and to be able to implement its strategy in a more effective and secure manner. The Board determined that the Funds provide access for small investors to high quality investment management at a relatively low cost. The Board’s decision to renew the Agreements was made after consideration of economies of scale and review of peer group fund expense ratios and historical expense ratio patterns for the Funds. The Board concluded that the current Dodge & Cox fee structure is fair and reasonable and adequately shares economies of scale that may exist.
CONCLUSION
Based on their evaluation of all material factors and assisted by the advice of independent legal counsel to the Independent Trustees, the Board, including the Independent Trustees, concluded that the advisory fee structure was fair and reasonable, that each Fund was paying a competitive fee for the services provided, that the scope and quality of Dodge & Cox’s services has provided substantial value for Fund shareholders over the
long term, and that approval of the Agreements was in the best interests of each Fund and its shareholders.
FUND HOLDINGS
The Fund provides a complete list of its holdings four times each fiscal year, as of the end of each quarter. The Fund files the lists with the Securities and Exchange Commission (SEC) on Form N-CSR (second and fourth quarters) and Form N-Q (first and third quarters). Shareholders may view the Fund’s Forms N-CSR and N-Q on the SEC’s website at www.sec.gov. Forms N-CSR and N-Q may also be reviewed and copied at the SEC’s Public Reference Room in Washington, DC. Information regarding the operations of the Public Reference Room may be obtained by calling 202-942-8090 (direct) or 800-732-0330 (general SEC number). A list of the Fund’s quarter-end holdings is also available at www.dodgeandcox.com on or about 15 days following each quarter end and remains available on the website until the list is updated in the subsequent quarter.
PROXY VOTING
For a free copy of the Fund’s proxy voting policies and procedures, please call 800-621-3979, visit the Fund’s website at www.dodgeandcox.com, or visit the SEC’s website at www.sec.gov. Information regarding how the Fund voted proxies relating to portfolio securities during the most recent 12-month period ending June 30 is also available at www.dodgeandcox.com or at www.sec.gov.
HOUSEHOLD MAILINGS
The Fund routinely mails shareholder reports and summary prospectuses to shareholders and, on occasion, proxy statements. In order to reduce the volume of mail, when possible, only one copy of these documents will be sent to shareholders who are part of the same family and share the same residential address.
If you have a direct account with the Funds and you do not want the mailing of shareholder reports and summary prospectuses combined with other members in your household, contact the Funds at 800-621-3979. Your request will be implemented within 30 days.
PAGE 21 § DODGE & COX INTERNATIONAL STOCK FUND
THIS PAGE INTENTIONALLY LEFT BLANK
DODGE & COX INTERNATIONAL STOCK FUND §PAGE 22
DODGE & COX FUNDS—EXECUTIVE OFFICER & TRUSTEE INFORMATION
| | | | | | |
Name (Age) and
Address* | | Position with Trust (Year of Election or
Appointment) | | Principal Occupation During Past 5 Years | | Other Directorships Held by Trustees |
| INTERESTED TRUSTEES AND OFFICERS |
| Kenneth E. Olivier (60) | | Chairman, President, and Trustee (Trustee since 2005) | | Chairman (since 2011), Chief Executive Officer (since 2010), President (until 2011), and Director of Dodge & Cox; Portfolio Manager and member of Investment Policy Committee (IPC) | | — |
| Dana M. Emery (51) | | Senior Vice President and Trustee (Trustee since 1993) | | Co-President (since 2011), Executive Vice President (until March 2011), and Director of Dodge & Cox; Director of Fixed Income, Portfolio Manager, and member of Fixed Income Investment Policy Committee (FIIPC) | | — |
| John A. Gunn (69) | | Trustee (Trustee since 1985) | | Chairman Emeritus (since 2011), Chairman (2007-2011), Chief Executive Officer (2007-2010), and Director of Dodge & Cox; Portfolio Manager and member of IPC, Global Investment Policy Committee (GIPC) (since 2008), International Investment Policy Committee (IIPC), and FIIPC (until 2008) | | — |
| Charles F. Pohl (54) | | Senior Vice President (Officer since 2004) | | Co-President (since 2011), Senior Vice President (until 2011), and Director of Dodge & Cox; Chief Investment Officer (since 2007), Director of Credit Research, Portfolio Manager, Investment Analyst, and member of IPC, GIPC (since 2008), IIPC (since 2007), and FIIPC | | — |
| Diana S. Strandberg (53) | | Senior Vice President (Officer since 2006) | | Senior Vice President (since 2011), Vice President (until 2011), and Director (since 2011) of Dodge & Cox; Director of International Equity (since 2009), Portfolio Manager, Investment Analyst, and member of IPC, GIPC (since 2008), and IIPC | | — |
| David H. Longhurst (55) | | Treasurer (Officer since 2006) | | Vice President (since 2008) and Assistant Treasurer (since 2007) of Dodge & Cox; Fund Administration and Accounting Senior Manager (until 2007) | | — |
| Thomas M. Mistele (59) | | Secretary (Officer since 1998) | | Chief Operating Officer, Director, Secretary, Senior Counsel (since 2011), and General Counsel (until 2011) of Dodge & Cox | | — |
| Katherine M. Primas (37) | | Chief Compliance Officer (Officer since 2009) | | Chief Compliance Officer (since 2008) and Associate Chief Compliance Officer of Dodge & Cox (until 2008) | | — |
| INDEPENDENT TRUSTEES |
| L. Dale Crandall (71) | | Trustee (Since 1999) | | President, Piedmont Corporate Advisors, Inc. (since 2003); President, Kaiser Foundation Health Plan, Inc. and Kaiser Foundation Hospitals (2000-2002); Senior Vice President—Finance and Administration & CFO, Kaiser Foundation Health Plan, Inc. and Kaiser Foundation Hospitals (1998-2000) | | Director, Ansell Limited (medical equipment and supplies) (2002-present); Director, Coventry Health Care, Inc. (managed health care) (2004-present); Bridgepoint Education, Inc. (education services) (2008-present) |
| Thomas A. Larsen (63) | | Trustee (Since 2002) | | Senior Counsel of Arnold & Porter LLP (law firm) (since 2012); Director of Howard, Rice, Nemerovski, Canady, Falk & Rabkin (1977-2011) | | — |
| Ann Mather (52) | | Trustee (Since 2011) | | CFO, Pixar Animation Studios (1999-2004) | | Director, Google, Inc. (internet information services) (2005-present); Director, Glu Mobile, Inc. (multimedia software) (2005-present); Director, Netflix, Inc. (video services) (2010-present); Director, MoneyGram International, Inc. (business services) (2010-present); Director, Solazyme Inc. (renewable oil) (since 2011) |
| Robert B. Morris III (60) | | Trustee (Since 2011) | | Advisory Director, The Presidio Group (previously Presidio Financial Partners) (since 2005) | | — |
| John B. Taylor (66) | | Trustee (Since 2005) (and 1998-2001) | | Professor of Economics, Stanford University; Senior Fellow, Hoover Institution; Under Secretary for International Affairs, United States Treasury (2001-2005) | | — |
| * | | The address for each Officer and Trustee is 555 California Street, 40th Floor, San Francisco, California 94104. Each Officer and Trustee oversees all five series in the Dodge & Cox Funds complex and serves for an indefinite term. |
Additional information about the Trust’s Trustees and Officers is available in the Trust’s Statement of Additional Information (SAI). You can get a free copy of the SAI by visiting the Funds’ website at www.dodgeandcox.com or calling
1-800-621-3979.
PAGE 23 § DODGE & COX INTERNATIONAL STOCK FUND
| | | | |
| | | | |
www.dodgeandcox.com
For Fund literature, transactions, and account information, please visit the Funds’ website.
or write or call:
DODGE & COX FUNDS
c/o Boston Financial Data Services
P.O. Box 8422
Boston, Massachusetts 02266-8422
(800) 621-3979
INVESTMENT MANAGER
Dodge & Cox
555 California Street, 40th Floor
San Francisco, California 94104
(415) 981-1710
This report is submitted for the general information of the shareholders of the Fund. The report is not authorized for distribution to prospective investors in the Fund unless it is accompanied by a current prospectus.
This report reflects our views, opinions, and portfolio holdings as of December 31, 2012, the end of the reporting period. Any such views are subject to change at any time based upon market or other conditions and Dodge & Cox disclaims any responsibility to update such views. These views may not be relied on as investment advice and, because investment decisions for a Dodge & Cox Fund are based on numerous factors, may not be relied on as an indication of trading intent on behalf of any Dodge & Cox Fund.
12/12 BF AR Printed on recycled paper
Annual Report
December 31, 2012
Balanced Fund
ESTABLISHED 1931
TICKER: DODBX
TO OUR SHAREHOLDERS
The Dodge & Cox Balanced Fund had a total return of 9.2% for the six months ending December 31, 2012, compared to 4.3% for the Combined Index(a) (a 60/40 blend of stocks and fixed income securities). For 2012, the Fund had a total return of 18.3%, compared to 11.3% for the Combined Index. At year end, the Fund’s net assets of $12.2 billion were invested in 72.9% common stocks, 25.3% fixed income securities, and 1.8% cash.
MARKET COMMENTARY
During 2012, global equity markets appreciated significantly. In spite of considerable volatility during the year as investors reacted to uncertainty about broad macroeconomic and political issues, it was an excellent year for U.S. equities as all sectors of the S&P 500 registered positive returns. Contributing factors included low interest rates, strong corporate balance sheets, reasonable earnings growth, and rising dividends. The U.S. economy, despite its challenges, is relatively healthy compared to many other developed countries around the world. With current valuations still reasonable (14 times 2012 earnings for the S&P 500)(b), we remain optimistic about the long-term outlook for potential equity returns.
In fixed income, investment-grade corporate bonds generated a 9.8%(c) annual return, the highest since 2009. Conversely, the U.S. Treasury sector returned just 2.0% in 2012, reflecting extremely low yields for the sector and superior return opportunities elsewhere. Within the Corporate sector, returns from Financial Institutions (14.7% return) strongly outpaced those of the Industrials (7.6%) and Utility (7.5%) sub-sectors. Agency-guaranteed mortgage-backed securities(d) (MBS) returned 2.6% as a sector, though there was considerable variability in returns within the MBS universe. Lower-coupon MBS outperformed higher coupons as changes to the Home Affordable Refinance Program (HARP) simplified the refinancing process and led to higher prepayment rates for higher coupon MBS.
INVESTMENT STRATEGY
We continue to set the Fund’s asset allocation based on our three- to five-year outlook for the Fund’s equity and fixed income holdings, which favors equities. In fact, the
dividend yield for the S&P 500 at year end (2.3%) was higher than the 10-year U.S. Treasury note yield of 1.8%. We are enthusiastic about the long-term prospects for the holdings in the equity portfolio due to the fact that they trade at a discount (11 times forward earnings) to the S&P 500 and have strong earnings growth potential. Accordingly, the Fund maintains a high weighting in equities.
Equity Strategy
The equity portfolio continues to maintain substantial investments in Information Technology (Tech) companies. Our in-depth research and selection of diverse companies in this sector has led to a Tech weighting in the equity portfolio of 21.6%, compared to 19.1% for the S&P 500. These 21 holdings represent an array of software, hardware, internet, and services companies, all trading at what we believe are attractive valuations in relation to their earnings and cash flow potential over the next three to five years. The Tech sector of the S&P 500 appears to be valued near a 20-year low relative to free cash flow, especially in the software area.
The majority of the equity portfolio’s Tech holdings are industry leaders that generate healthy free cash flows that are being used to repurchase shares, pay dividends, repay debt, and/or pursue mergers and acquisitions. For example,(e) more mature companies such as Hewlett-Packard (HP) and Xerox have reduced their cost structures and diversified into technology services in recent years through acquisitions. While shares of HP performed poorly last year, the company’s significantly depressed valuation appears to reflect overly pessimistic expectations about HP’s growth prospects and profits. In spite of the headlines regarding two large write-offs, HP was solidly profitable on a free cash flow basis in 2012. Xerox and HP are valued at only six and four times forward earnings, respectively.
In contrast to mature companies like HP and Xerox, the portfolio also holds eBay and Google, which are profitable, growing rapidly, and investing in further expansion. This dichotomy between “value” and “growth” companies highlights our flexibility. We are willing to look beyond depressed valuations and consider companies
PAGE 1 § DODGE & COX BALANCED FUND
with above-average growth potential that are trading at reasonable valuations. Google, a 1.0% holding, was the largest new purchase in the equity portfolio during 2012. Its dominant competitive position in internet search advertising is complemented by a push into display advertising (e.g., on YouTube and Google Maps) and other web-based businesses. Although it does not sell at a depressed level relative to the overall market, we believe Google’s valuation at 16 times forward earnings does not reflect its strong growth potential.
While Tech is an important area in the equity portfolio, the Fund’s equity holdings remain well diversified. Other areas of emphasis include Financials (e.g., Capital One and Wells Fargo), Pharmaceuticals (e.g., Merck and Sanofi), and Media (e.g., Comcast and Time Warner).
Fixed Income Strategy
Given the low level of yields available in the investment grade bond market, we have positioned the fixed income portfolio with an effective duration that is 73% of the Barclays U.S. Aggregate Bond Index’s duration, the same as a year ago. We believe this defensive positioning vis-à-vis interest rate risk remains prudent. The general level of interest rates is near historic lows (e.g., 1.7% yield for the Barclays Aggregate Bond Index), and Treasury securities with maturities under ten years offer negative real (inflation-adjusted) yields. These levels do not seem sustainable over our investment horizon given the reasonably solid footing of the U.S. economy, the current accommodative U.S. and global monetary policies, and investors’ need for positive, inflation-adjusted returns. In addition, we believe this positioning is appropriate from a risk-reward perspective: with today’s low rates, it would take only a modest uptick in rates over a one-year timeframe to overwhelm earned income and produce a negative return. For example, the 10-year Treasury would need to rise by just 20 bps to create a negative annual return over the next year, and the 30-year Treasury by only 13 bps.
Nevertheless, we continue to see ample long-term opportunity among the portfolio’s corporate holdings. Informing our view is the combination of stronger corporate credit profiles and the attractive incremental yield above Treasuries (e.g., the Fund’s corporate holdings yielded over 3.4%, compared to under 1.2% for a similar-duration Treasury).
Agency MBS. The fixed income portfolio’s biggest strategy shift during 2012 was in the MBS sector, where we reduced the portfolio’s weighting from 42% at the beginning of the year to 30% at year end. Almost all of this reduction occurred in the first half of the year as we identified changes to U.S. mortgage financing policy that could meaningfully increase the prepayment rates of a portion of the portfolio’s holdings.
The timing of the reduction worked well, as the portfolio’s MBS returned 1.6% in the first half of the year and 0.6% for the second half. The remaining MBS in the portfolio continue to provide incremental yield, relative duration stability, high credit quality, and long-term return prospects that we believe are better than short-duration investment alternatives.
Corporates. More than 80% of the portfolio’s absolute return in 2012 was generated by holdings within the Corporate sector. Corporate yield premiums in the Barclays U.S. Aggregate began the year at 234 basis points(f) (bps) above Treasuries and contracted to 141 bps by year end. This rally was driven partly by improvements in corporate fundamentals but mostly by a significant change in market sentiment. The repricing of corporate bond risk was most pronounced among lower-rated, bank, and European-domiciled holdings where valuations had declined substantially in the uncertain market environment of late 2011. These are also areas where we have built significant positions over time. The portfolio’s corporate holdings as a whole returned 15.0% in 2012, compared to less than 9.8% for the Barclays Corporate Index.
We reduced the portfolio’s 54% corporate weighting by five percentage points in the second half of 2012, as we selectively trimmed certain holdings after a period of strong performance. We also identified a number of interesting investments in securities of non-U.S. issuers, including Petrobras, Korean Import-Export Bank, and Lloyds (since sold).
IN CLOSING
We remain optimistic about the long-term return potential for equities and have weighted the Fund’s holdings accordingly. Even after a strong year for stocks in 2012, the S&P 500 was trading at 13 times forward earnings, which was still modestly below its long-term average multiple. Technological innovation continues to drive global demand for new products and services.
DODGE & COX BALANCED FUND §PAGE 2
Emerging markets continue to grow faster than developed markets, creating millions of new middle class and affluent consumers. And the U.S. economy continues to recover from the 2008-2009 global financial crisis and ensuing recession. In contrast, with Treasury rates near historic lows and credit spreads normalizing, future total returns for fixed income securities seem likely to be dependent upon market yields, which are quite low.
Thank you for your continued confidence in our firm. As always, we welcome your comments and questions.
For the Board of Trustees,
| | |
| | 
|
Kenneth E. Olivier, Chairman and President | | Dana M. Emery, Senior Vice President |
January 29, 2013
| (a) | | The Combined Index reflects an unmanaged portfolio (rebalanced monthly) of 60% of the S&P 500 Index, which is a market capitalization-weighted index of 500 large-capitalization stocks commonly used to represent the U.S. equity market, and 40% of the Barclays U.S. Aggregate Bond Index (Barclays U.S. Agg), which is a widely recognized, unmanaged index of U.S. dollar-denominated, investment-grade, taxable fixed income securities. |
| (b) | | Unless otherwise specified, all weightings and characteristics are as of December 31, 2012. |
| (c) | | Sector returns as calculated and reported by Barclays. |
| (d) | | The U.S. Government does not guarantee the Fund’s shares, yield, or net asset value. The agency guarantee (by, for example, Ginnie Mae, Fannie Mae, or Freddie Mac) does not eliminate market risk. |
| (e) | | The use of specific examples does not imply that they are more attractive investments than the Fund’s other holdings. |
| (f) | | One basis point (bps) is equal to 1/100th of 1%. |
Risks: The Fund is subject to stock market risk, meaning stocks in the Fund may decline in value for extended periods due to the financial prospects of individual companies, or due to general market and economic conditions. The Fund also invests in individual bonds whose yields and market values fluctuate, so that your investment may be worth more or less than its original cost. Bond investments are subject to interest rate risk, credit risk, and prepayment risk, all of which could have adverse effects on the value of the Fund. A low interest rate environment creates an elevated risk of future negative returns. Please read the prospectus and summary prospectus for specific details regarding the Fund’s risk profile.
ANNUAL PERFORMANCE REVIEW
EQUITY PORTFOLIO
| | § | | The Financials sector was the best performing of the market. Strong relative results for the portfolio’s holdings in this sector (up 40% compared to up 29% for the S&P 500 sector) and an average overweight position (21% versus 14%) helped results. Notable contributors included Bank of America (up 110%), Goldman Sachs (up 43%), and Capital One (up 38%). | |
| | § | | Strong relative results for the portfolio’s holdings in the Consumer Discretionary sector (up 37% compared to up 24% for the S&P 500 sector) and an average overweight position (16% versus 11%) contributed to results. Comcast (up 61%), News Corp. (up 44%), and Time Warner (up 36%) were especially strong. | |
| | § | | The portfolio’s holdings in the Information Technology sector (up 7% compared to up 15% for the S&P 500 sector) hurt relative results. Hewlett-Packard (down 43%) was the biggest detractor. Nokia (down 13%) and Xerox (down 12%) were also weak. | |
| | § | | Relative returns in the Energy sector (down 6% compared to up 5% for the S&P 500 sector) hindered results. Occidental Petroleum (down 16%) and Baker Hughes (down 15%) declined. | |
FIXED INCOME PORTFOLIO
| | § | | The portfolio’s substantial overweight to corporate bonds (and to Financial Institutions in particular) strongly benefited relative returns. | |
| | § | | Many of the portfolio’s financial sector and lower-rated corporate holdings performed extremely well, including AIG, Bank of America, HSBC, Royal Bank of Scotland, SLM Corp., Sprint Nextel, and Telecom Italia, among others. | |
| | § | | The portfolio’s taxable municipal holdings performed extremely well in 2012. | |
PAGE 3 § DODGE & COX BALANCED FUND
KEY CHARACTERISTICS OF DODGE & COX
Independent Organization
Dodge & Cox is one of the largest privately owned investment managers in the world. We remain committed to independence, with a goal of providing the highest quality investment management service to our existing clients.
Over 80 Years of Investment Experience
Dodge & Cox was founded in 1930. We have a stable and well-qualified team of investment professionals, most of whom have spent their entire careers at Dodge & Cox.
Experienced Investment Team
The Investment Policy Committee, which is the decision-making body for the equity portion of the Balanced Fund, is a nine-member committee with an average tenure at Dodge & Cox of 26 years. The Fixed Income Investment Policy Committee, which is the decision-making body for the Fixed Income portion of the Balanced Fund, is a ten-member committee with an average tenure of 17 years.
One Business with a Single Research Office
Dodge & Cox manages domestic, international, and global equity, fixed income, and balanced investments, operating from one office in San Francisco.
Consistent Investment Approach
Our team decision-making process involves thorough, bottom-up fundamental analysis of each investment.
Long-Term Focus and Low Expenses
We invest with a three- to five-year investment horizon, which has historically resulted in low turnover relative to our peers. We manage Funds that maintain low expense ratios.
DODGE & COX BALANCED FUND §PAGE 4
GROWTH OF $10,000 OVER 10 YEARS
FOR AN INVESTMENT MADE ON DECEMBER 31, 2002
AVERAGE ANNUAL TOTAL RETURN
FOR PERIODS ENDED DECEMBER 31, 2012
| | | | | | | | | | | | | | | | |
| | | 1 Year | | | 5 Years | | | 10 Years | | | 20 Years | |
| | | | | | | | | | | | | | | | |
Dodge & Cox Balanced Fund | | | 18.32 | % | | | 2.18 | % | | | 6.85 | % | | | 9.37 | % |
Combined Index(a) | | | 11.30 | | | | 3.81 | | | | 6.62 | | | | 7.77 | |
S&P 500 | | | 15.99 | | | | 1.66 | | | | 7.10 | | | | 8.22 | |
Barclays U.S. Aggregate
Bond Index (Barclays U.S. Agg) | | | 4.23 | | | | 5.96 | | | | 5.19 | | | | 6.34 | |
Returns represent past performance and do not guarantee future results. Investment return and share price will fluctuate with market conditions, and investors may have a gain or loss when shares are sold. Fund performance changes over time and currently may be significantly lower than stated. Performance is updated and published monthly. Visit the Fund’s website at www.dodgeandcox.com or call 800-621-3979 for current performance figures.
The Fund’s total returns include the reinvestment of dividend and capital gain distributions, but have not been adjusted for any income taxes payable by shareholders on these distributions or on Fund share redemptions. Index returns include dividends and/or interest income but, unlike Fund returns, do not reflect fees or expenses.
Standard & Poor’s, Standard & Poor’s 500, and S&P 500® are trademarks of The McGraw-Hill Companies, Inc. Barclays® is a trademark of Barclays Bank PLC.
| (a) | The Combined Index reflects an unmanaged portfolio (rebalanced monthly) of 60% of the S&P 500 Index, which is a market capitalization-weighted index of 500 large-capitalization stocks commonly used to represent the U.S. equity market, and 40% of the Barclays U.S. Aggregate Bond Index (Barclays U.S. Agg), which is a widely recognized, unmanaged index of U.S. dollar-denominated, investment-grade, taxable fixed income securities. The Fund may, however, invest up to 75% of its total assets in stocks. |
FUND EXPENSE EXAMPLE
As a Fund shareholder, you incur ongoing Fund costs, including management fees and other Fund expenses. All mutual funds have ongoing costs, sometimes referred to as operating expenses. The following example shows ongoing costs of investing in the Fund and can help you understand these costs and compare them with those of other mutual funds. The example assumes a $1,000 investment held for the six months indicated.
ACTUAL EXPENSES
The first line of the table below provides information about actual account values and expenses based on the Fund’s actual returns. You may use the information in this line, together with your account balance, to estimate the expenses that you paid over the period. Simply divide your account value by $1,000 (for example, an $8,600 account value divided by $1,000 = 8.6), then multiply the result by the number in the first line under the heading “Expenses Paid During Period” to estimate the expenses you paid on your account during this period.
HYPOTHETICAL EXAMPLE FOR COMPARISON WITH OTHER MUTUAL FUNDS
Information on the second line of the table can help you compare ongoing costs of investing in the Fund with those of other mutual funds. This information may not be used to estimate the actual ending account balance or expenses you paid during the period. The hypothetical “Ending Account Value” is based on the actual expense ratio of the Fund and an assumed 5% annual rate of return before expenses (not the Fund’s actual return). The amount under the heading “Expense Paid During the Period” shows the hypothetical expenses your account would have incurred under this scenario. You can compare this figure with the 5% hypothetical examples that appear in shareholder reports of other mutual funds.
| | | | | | | | | | | | |
Six Months Ended
December 31, 2012 | | Beginning Account Value
7/1/2012 | | | Ending Account Value
12/31/2012 | | | Expenses Paid
During Period* | |
Based on Actual Fund Return | | $ | 1,000.00 | | | $ | 1,091.80 | | | $ | 2.81 | |
Based on Hypothetical 5% Yearly Return | | | 1,000.00 | | | | 1,022.45 | | | | 2.72 | |
| * | | Expenses are equal to the Fund’s annualized expense ratio of 0.53%, multiplied by the average account value over the period, multiplied by 184/366 (to reflect the one-half year period). |
The expenses shown in the table highlight ongoing costs only and do not reflect any transactional fees or account maintenance fees. While other mutual funds may charge such fees, please note that the Fund does not charge transaction fees (e.g., redemption fees, sales loads) or universal account maintenance fees (e.g., small account fees).
PAGE 5 § DODGE & COX BALANCED FUND
| | | | |
| FUND INFORMATION | | | December 31, 2012 | |
| | | | |
| GENERAL INFORMATION | | | |
Net Asset Value Per Share | | | $78.06 | |
Total Net Assets (billions) | | | $12.2 | |
30-Day SEC Yield(a) | | | 1.76% | |
Expense Ratio | | | 0.53% | |
Portfolio Turnover Rate | | | 16% | |
Fund Inception | | | 1931 | |
No sales charges or distribution fees | | | | |
Investment Manager: Dodge & Cox, San Francisco. Managed by the Investment Policy Committee, whose nine members’ average tenure at Dodge & Cox is 27 years, and by the Fixed Income Investment Policy Committee, whose ten members’ average tenure is 17 years. | |
| | | | |
| STOCK PORTFOLIO (72.9%) | | Fund | |
Number of Stocks | | | 74 | |
Median Market Capitalization (billions) | |
| $19
|
|
Price-to-Earnings Ratio(b) | | | 11.0x | |
Foreign Stocks not in the S&P 500(c) | | | 12.3% | |
| | | | |
| SECTOR DIVERSIFICATION (%) (FIVE LARGEST) | |
Financials | | | 16.8 | |
Information Technology | | | 15.8 | |
Health Care | | | 13.4 | |
Consumer Discretionary | | | 10.9 | |
Energy | | | 5.0 | |
| | | | |
| TEN LARGEST STOCKS (%)(d) | | | |
Capital One Financial Corp. | | | 2.9 | |
Comcast Corp. | | | 2.8 | |
Wells Fargo & Co. | | | 2.7 | |
Sanofi (France) | | | 2.5 | |
Novartis AG (Switzerland) | | | 2.2 | |
Time Warner, Inc. | | | 2.2 | |
Merck & Co., Inc. | | | 2.2 | |
General Electric Co. | | | 2.1 | |
GlaxoSmithKline PLC (United Kingdom) | | | 2.0 | |
Sprint Nextel Corp. | | | 1.9 | |
ASSET ALLOCATION
| | | | |
| FIXED INCOME PORTFOLIO (25.3%) | | Fund | |
Number of Fixed Income Securities | | | 261 | |
Effective Maturity (years)(e) | | | 7.3 | |
Effective Duration (years)(f) | | | 3.7 | |
| | | | |
| SECTOR DIVERSIFICATION (%) | | | |
U.S. Treasury(e) | | | 2.8 | |
Government-Related | | | 2.3 | |
Mortgage-Related | | | 7.6 | |
Corporate | | | 12.3 | |
Asset-Backed | | | 0.3 | |
| | | | |
| CREDIT QUALITY (%)(g) | | | |
U.S. Government & U.S. Agency/MBS(e) | | | 10.7 | |
Aaa | | | 0.3 | |
Aa | | | 0.8 | |
A | | | 3.9 | |
Baa | | | 7.1 | |
Ba | | | 1.6 | |
B | | | 0.9 | |
| | | | |
| FIVE LARGEST CORPORATE ISSUERS (%)(d) | | | |
Bank of America Corp. | | | 0.7 | |
Citigroup, Inc. | | | 0.6 | |
Burlington Northern Santa Fe, LLC | | | 0.5 | |
Macy’s, Inc. | | | 0.5 | |
Dow Chemical Co. | | | 0.5 | |
| (a) | SEC Yield is an annualization of the Fund’s total net investment income per share for the 30-day period ended on the last day of the month. |
| (b) | Price-to-earnings (P/E) ratio is calculated using 12-month forward earnings estimates from third-party sources. |
| (c) | Foreign stocks are U.S. dollar denominated. |
| (d) | The Fund’s portfolio holdings are subject to change without notice. The mention of specific securities is not a recommendation to buy, sell, or hold any particular security and is not indicative of Dodge & Cox’s current or future trading activity. |
| (e) | Data as presented excludes the effect of the Fund’s short position in 10-year Treasury futures contracts (notional value = 4.0% of the Fund’s net assets). If exposure to Treasury futures contracts had been included, the effective maturity would be 1.1 years lower. |
| (f) | Data as presented includes the effect of Treasury futures contracts. |
| (g) | The credit quality distribution shown for the Fund is based on the middle of Moody’s, Standard & Poor’s, and Fitch ratings, which is the methodology used by Barclays in constructing its indices. If a security is rated by only two agencies, the lower of the two ratings is used. Please note the Fund applies the highest of Moody’s, Standard & Poor’s, and Fitch ratings to comply with the quality requirements stated in its prospectus. The credit quality of the investments in the portfolio does not apply to the stability or safety of the Fund or its shares. |
DODGE & COX BALANCED FUND §PAGE 6
| | | | |
| PORTFOLIO OF INVESTMENTS | | | December 31, 2012 | |
| | | | | | | | |
| COMMON STOCKS: 72.9% | | | | | | |
| | |
| | | SHARES | | | VALUE | |
| CONSUMER DISCRETIONARY: 10.9% | |
CONSUMER DURABLES & APPAREL: 0.5% | |
Panasonic Corp. ADR(b) (Japan) | | | 6,621,899 | | | $ | 40,194,927 | |
Sony Corp. ADR(b) (Japan) | | | 1,887,225 | | | | 21,136,920 | |
| | | | | | | | |
| | | | | | | 61,331,847 | |
MEDIA: 9.2% | |
Comcast Corp., Class A | | | 9,305,174 | | | | 347,827,404 | |
DISH Network Corp., Class A(a) | | | 1,533,682 | | | | 55,826,025 | |
Liberty Global, Inc., Series A(a) | | | 158,521 | | | | 9,985,238 | |
Liberty Global, Inc., Series C(a) | | | 232,368 | | | | 13,651,620 | |
McGraw-Hill Companies, Inc. | | | 825,337 | | | | 45,121,174 | |
News Corp., Class A | | | 7,992,500 | | | | 204,128,450 | |
Time Warner Cable, Inc. | | | 1,783,883 | | | | 173,375,588 | |
Time Warner, Inc. | | | 5,633,666 | | | | 269,458,245 | |
| | | | | | | | |
| | | | | | | 1,119,373,744 | |
RETAILING: 1.2% | |
CarMax, Inc.(a) | | | 851,000 | | | | 31,946,540 | |
J. C. Penney Co., Inc.(a) | | | 2,750,000 | | | | 54,202,500 | |
Liberty Interactive, Series A(a) | | | 3,139,650 | | | | 61,788,312 | |
| | | | | | | | |
| | | | | | | 147,937,352 | |
| | | | | | | | |
| | | | | | | 1,328,642,943 | |
| CONSUMER STAPLES: 1.4% | |
FOOD & STAPLES RETAILING: 1.1% | |
Wal-Mart Stores, Inc. | | | 1,931,900 | | | | 131,813,537 | |
|
FOOD, BEVERAGE & TOBACCO: 0.3% | |
Unilever PLC ADR(b) (United Kingdom) | | | 927,400 | | | | 35,908,928 | |
| | | | | | | | |
| | | | | | | 167,722,465 | |
| ENERGY: 5.0% | | | | | | | | |
Baker Hughes, Inc. | | | 3,462,079 | | | | 141,391,306 | |
Chevron Corp. | | | 708,579 | | | | 76,625,733 | |
Occidental Petroleum Corp. | | | 2,069,600 | | | | 158,552,056 | |
Schlumberger, Ltd.
(Curacao/United States)(b) | | | 3,321,521 | | | | 230,148,190 | |
| | | | | | | | |
| | | | | | | 606,717,285 | |
| FINANCIALS: 16.8% | |
BANKS: 4.3% | |
BB&T Corp. | | | 2,429,584 | | | | 70,725,190 | |
HSBC Holdings PLC ADR(b) (United Kingdom) | | | 970,561 | | | | 51,507,672 | |
SunTrust Banks, Inc. | | | 2,494,490 | | | | 70,718,792 | |
Wells Fargo & Co. | | | 9,788,506 | | | | 334,571,135 | |
| | | | | | | | |
| | | | | | | 527,522,789 | |
DIVERSIFIED FINANCIALS: 10.6% | |
Bank of America Corp. | | | 18,085,600 | | | | 209,792,960 | |
Bank of New York Mellon Corp. | | | 8,739,800 | | | | 224,612,860 | |
Capital One Financial Corp. | | | 6,132,659 | | | | 355,264,936 | |
Charles Schwab Corp. | | | 13,199,900 | | | | 189,550,564 | |
Credit Suisse Group AG ADR(b) (Switzerland) | | | 757,658 | | | | 18,608,080 | |
| | | | | | | | |
| | |
| | | SHARES | | | VALUE | |
Goldman Sachs Group, Inc. | | | 1,750,000 | | | $ | 223,230,000 | |
JPMorgan Chase & Co. | | | 1,669,900 | | | | 73,425,503 | |
Legg Mason, Inc. | | | 215,790 | | | | 5,550,119 | |
| | | | | | | | |
| | | | | | | 1,300,035,022 | |
INSURANCE: 1.9% | |
AEGON NV(b) (Netherlands) | | | 16,684,996 | | | | 107,451,374 | |
Genworth Financial, Inc., Class A(a) | | | 6,904,200 | | | | 51,850,542 | |
Metlife, Inc. | | | 2,100,000 | | | | 69,174,000 | |
| | | | | | | | |
| | | | | | | 228,475,916 | |
| | | | | | | | |
| | | | | | | 2,056,033,727 | |
| HEALTH CARE: 13.4% | |
HEALTH CARE EQUIPMENT & SERVICES: 1.0% | |
Boston Scientific Corp.(a) | | | 12,338,300 | | | | 70,698,459 | |
Medtronic, Inc. | | | 1,360,200 | | | | 55,795,404 | |
| | | | | | | | |
| | | | | | | 126,493,863 | |
PHARMACEUTICALS, BIOTECHNOLOGY & LIFE
SCIENCES: 12.4% | |
GlaxoSmithKline PLC ADR(b) (United Kingdom) | | | 5,720,600 | | | | 248,674,482 | |
Merck & Co., Inc. | | | 6,441,975 | | | | 263,734,457 | |
Novartis AG ADR(b) (Switzerland) | | | 4,270,000 | | | | 270,291,000 | |
Pfizer, Inc. | | | 8,481,217 | | | | 212,708,922 | |
Roche Holding AG ADR(b) (Switzerland) | | | 4,340,000 | | | | 219,170,000 | |
Sanofi ADR(b) (France) | | | 6,295,165 | | | | 298,264,918 | |
| | | | | | | | |
| | | | | | | 1,512,843,779 | |
| | | | | | | | |
| | | | | | | 1,639,337,642 | |
| INDUSTRIALS: 4.8% | |
CAPITAL GOODS: 2.5% | |
General Electric Co. | | | 12,358,200 | | | | 259,398,618 | |
Koninklijke Philips Electronics NV(b) (Netherlands) | | | 1,860,995 | | | | 49,390,807 | |
| | | | | | | | |
| | | | | | | 308,789,425 | |
COMMERCIAL & PROFESSIONAL SERVICES: 0.5% | |
ADT Corp. | | | 587,717 | | | | 27,322,963 | |
Pitney Bowes, Inc. | | | 362,662 | | | | 3,858,724 | |
Tyco International, Ltd.(b) (Switzerland) | | | 1,175,434 | | | | 34,381,445 | |
| | | | | | | | |
| | | | | | | 65,563,132 | |
TRANSPORTATION: 1.8% | |
FedEx Corp. | | | 2,364,554 | | | | 216,876,893 | |
| | | | | | | | |
| | | | | | | 591,229,450 | |
| INFORMATION TECHNOLOGY: 15.8% | |
SEMICONDUCTORS & SEMICONDUCTOR EQUIPMENT: 0.5% | |
Maxim Integrated Products, Inc. | | | 1,887,300 | | | | 55,486,620 | |
|
SOFTWARE & SERVICES: 8.9% | |
Adobe Systems, Inc.(a) | | | 3,079,597 | | | | 116,039,215 | |
Amdocs, Ltd.(b)
(Guernsey/United States) | | | 1,406,700 | | | | 47,813,733 | |
| | |
| PAGE 7 § DODGE & COX BALANCED FUND | | See accompanying Notes to Financial Statements |
| | | | |
| PORTFOLIO OF INVESTMENTS | | | December 31, 2012 | |
| | | | | | | | |
| COMMON STOCKS (continued) | |
| | |
| | | SHARES | | | VALUE | |
AOL, Inc.(a) | | | 959,074 | | | $ | 28,398,181 | |
BMC Software, Inc.(a) | | | 1,646,560 | | | | 65,302,570 | |
Cadence Design Systems, Inc.(a) | | | 1,945,700 | | | | 26,286,407 | |
Computer Sciences Corp. | | | 1,783,232 | | | | 71,418,442 | |
Compuware Corp.(a) | | | 3,345,888 | | | | 36,369,802 | |
eBay, Inc.(a) | | | 2,275,000 | | | | 116,070,500 | |
Google, Inc., Class A(a) | | | 131,000 | | | | 92,927,470 | |
Microsoft Corp. | | | 8,694,900 | | | | 232,414,677 | |
Symantec Corp.(a) | | | 8,684,000 | | | | 163,346,040 | |
Synopsys, Inc.(a) | | | 2,835,100 | | | | 90,269,584 | |
| | | | | | | | |
| | | | | | | 1,086,656,621 | |
TECHNOLOGY, HARDWARE & EQUIPMENT: 6.4% | |
Corning, Inc. | | | 5,285,000 | | | | 66,696,700 | |
Dell, Inc. | | | 3,800,000 | | | | 38,494,000 | |
Hewlett-Packard Co. | | | 15,550,412 | | | | 221,593,371 | |
Molex, Inc. | | | 151,600 | | | | 4,143,228 | |
Molex, Inc., Class A | | | 2,269,828 | | | | 50,662,561 | |
NetApp, Inc.(a) | | | 3,308,985 | | | | 111,016,447 | |
Nokia Corp. ADR(b) (Finland) | | | 16,040,260 | | | | 63,359,027 | |
TE Connectivity, Ltd.(b) (Switzerland) | | | 3,090,536 | | | | 114,720,696 | |
Xerox Corp. | | | 16,745,150 | | | | 114,201,923 | |
| | | | | | | | |
| | | | | | | 784,887,953 | |
| | | | | | | | |
| | | | | | | 1,927,031,194 | |
| MATERIALS: 2.3% | |
Celanese Corp., Series A | | | 2,245,960 | | | | 100,012,599 | |
Domtar Corp. | | | 153,391 | | | | 12,811,216 | |
Dow Chemical Co. | | | 3,634,354 | | | | 117,462,321 | |
Vulcan Materials Co. | | | 1,116,189 | | | | 58,097,638 | |
| | | | | | | | |
| | | | | | | 288,383,774 | |
| TELECOMMUNICATION SERVICES: 2.5% | |
Sprint Nextel Corp.(a) | | | 41,674,100 | | | | 236,292,147 | |
Vodafone Group PLC ADR(b) (United Kingdom) | | | 2,756,898 | | | | 69,446,261 | |
| | | | | | | | |
| | | | | | | 305,738,408 | |
TOTAL COMMON STOCKS
(Cost $7,864,970,429) | | | | | | $ | 8,910,836,888 | |
|
| FIXED INCOME SECURITIES: 25.3% | |
| | |
| | | PAR VALUE | | | VALUE | |
| U.S. TREASURY: 2.8% | |
U.S. Treasury Note | | | | | | | | |
0.625%, 1/31/13 | | $ | 16,600,000 | | | $ | 16,606,491 | |
0.375%, 7/31/13 | | | 85,100,000 | | | | 85,219,650 | |
0.75%, 8/15/13 | | | 62,200,000 | | | | 62,433,250 | |
0.25%, 10/31/13 | | | 55,000,000 | | | | 55,034,375 | |
0.25%, 11/30/13 | | | 61,000,000 | | | | 61,035,746 | |
0.25%, 1/31/14 | | | 66,450,000 | | | | 66,491,531 | |
| | | | | | | | |
| | | | | | | 346,821,043 | |
| | | | | | | | |
| | |
| | | PAR VALUE | | | VALUE | |
| GOVERNMENT-RELATED: 2.3% | |
FEDERAL AGENCY: 0.3% | |
Arkansas Dev. Fin. Auth. GNMA Guaranteed Bonds | | | | | | | | |
9.75%, 11/15/14 | | $ | 155,762 | | | $ | 158,087 | |
Small Business Administration — 504 Program | |
Series 96-20L, 6.70%, 12/1/16 | | | 411,760 | | | | 438,386 | |
Series 97-20F, 7.20%, 6/1/17 | | | 651,423 | | | | 717,791 | |
Series 97-20I, 6.90%, 9/1/17 | | | 1,000,791 | | | | 1,083,781 | |
Series 98-20D, 6.15%, 4/1/18 | | | 911,155 | | | | 991,806 | |
Series 98-20I, 6.00%, 9/1/18 | | | 791,395 | | | | 860,896 | |
Series 99-20F, 6.80%, 6/1/19 | | | 845,422 | | | | 938,569 | |
Series 00-20D, 7.47%, 4/1/20 | | | 2,248,062 | | | | 2,549,449 | |
Series 00-20E, 8.03%, 5/1/20 | | | 1,047,877 | | | | 1,194,895 | |
Series 00-20G, 7.39%, 7/1/20 | | | 1,516,078 | | | | 1,701,418 | |
Series 00-20I, 7.21%, 9/1/20 | | | 1,153,435 | | | | 1,294,544 | |
Series 01-20E, 6.34%, 5/1/21 | | | 2,646,948 | | | | 2,945,208 | |
Series 01-20G, 6.625%, 7/1/21 | | | 3,006,634 | | | | 3,362,766 | |
Series 03-20J, 4.92%, 10/1/23 | | | 9,398,215 | | | | 10,460,626 | |
Series 07-20F, 5.71%, 6/1/27 | | | 6,791,917 | | | | 7,935,741 | |
| | | | | | | | |
| | | | | | | 36,633,963 | |
FOREIGN AGENCY: 0.2% | |
Export-Import Bank of Korea(b) (South Korea)
4.00%, 1/11/17 | | | 15,000,000 | | | | 16,265,115 | |
Petroleo Brasileiro SA(b) (Brazil) | | | | | | | | |
5.375%, 1/27/21 | | | 11,725,000 | | | | 13,200,240 | |
| | | | | | | | |
| | | | | | | 29,465,355 | |
LOCAL AUTHORITY: 1.8% | |
California Taxable General Obligation | | | | | | | | |
7.50%, 4/1/34 | | | 28,825,000 | | | | 40,088,369 | |
7.55%, 4/1/39 | | | 23,350,000 | | | | 33,666,030 | |
7.30%, 10/1/39 | | | 17,000,000 | | | | 23,556,900 | |
7.625%, 3/1/40 | | | 5,500,000 | | | | 7,945,850 | |
Illinois Taxable General Obligation | | | | | | | | |
4.961%, 3/1/16 | | | 1,900,000 | | | | 2,081,089 | |
5.365%, 3/1/17 | | | 26,055,000 | | | | 29,210,781 | |
5.665%, 3/1/18 | | | 19,800,000 | | | | 22,557,942 | |
Los Angeles Unified School District Taxable General Obligation | | | | | | | | |
6.758%, 7/1/34 | | | 19,000,000 | | | | 25,361,010 | |
New Jersey State Turnpike Authority Revenue Bonds | | | | | | | | |
7.102%, 1/1/41 | | | 22,075,000 | | | | 31,817,360 | |
| | | | | | | | |
| | | | | | | 216,285,331 | |
| | | | | | | | |
| | | | | | | 282,384,649 | |
| MORTGAGE-RELATED: 7.6% | |
FEDERAL AGENCY CMO & REMIC: 1.7% | |
Dept. of Veterans Affairs | | | | | | | | |
Trust 1995-1A 1, 7.223%, 2/15/25 | | | 604,569 | | | | 708,740 | |
Trust 1995-2C 3A, 8.793%, 6/15/25 | | | 285,607 | | | | 351,578 | |
| | |
| See accompanying Notes to Financial Statements | | DODGE & COX BALANCED FUND §PAGE 8 |
| | | | |
| PORTFOLIO OF INVESTMENTS | | | December 31, 2012 | |
| | | | | | | | |
| FIXED INCOME SECURITIES (continued) | |
| | |
| | | PAR VALUE | | | VALUE | |
Fannie Mae | | | | | | | | |
Trust 2001-T5 A3, 7.50%, 6/19/30 | | $ | 891,627 | | | $ | 1,083,948 | |
Trust 2002-33 A1, 7.00%, 6/25/32 | | | 2,787,268 | | | | 3,264,375 | |
Trust 2002-86, 6.00%, 8/25/32 | | | 2,783,588 | | | | 2,888,643 | |
Trust 2005-W4 1A2, 6.50%, 8/25/35 | | | 12,489,348 | | | | 14,649,955 | |
Trust 2009-66 ET, 6.00%, 5/25/39 | | | 23,226,463 | | | | 25,214,834 | |
Trust 2001-T7 A1, 7.50%, 2/25/41 | | | 2,585,604 | | | | 2,912,018 | |
Trust 2001-T4 A1, 7.50%, 7/25/41 | | | 2,384,316 | | | | 2,846,640 | |
Trust 2001-T8 A1, 7.50%, 7/25/41 | | | 2,547,448 | | | | 2,781,657 | |
Trust 2001-W3 A, 7.00%, 9/25/41 | | | 2,132,883 | | | | 2,524,350 | |
Trust 2001-T10 A2, 7.50%, 12/25/41 | | | 2,451,162 | | | | 2,872,923 | |
Trust 2002-W6 2A1, 6.595%, 6/25/42 | | | 2,573,925 | | | | 2,923,169 | |
Trust 2002-W8 A2, 7.00%, 6/25/42 | | | 2,995,986 | | | | 3,440,797 | |
Trust 2003-W2 1A1, 6.50%, 7/25/42 | | | 5,079,280 | | | | 6,124,148 | |
Trust 2003-W2 1A2, 7.00%, 7/25/42 | | | 2,037,844 | | | | 2,485,720 | |
Trust 2003-W4 4A, 7.233%, 10/25/42 | | | 3,317,067 | | | | 3,901,003 | |
Trust 2004-T1 1A2, 6.50%, 1/25/44 | | | 3,493,878 | | | | 4,186,134 | |
Trust 2004-W2 5A, 7.50%, 3/25/44 | | | 8,821,761 | | | | 10,805,272 | |
Trust 2004-W8 3A, 7.50%, 6/25/44 | | | 1,292,338 | | | | 1,527,052 | |
Trust 2009-11 MP, 7.00%, 3/25/49 | | | 27,192,747 | | | | 30,922,694 | |
Freddie Mac | | | | | | | | |
Series 2100 GS, 6.50%, 12/15/13 | | | 267,843 | | | | 272,284 | |
Series 1078 GZ, 6.50%, 5/15/21 | | | 386,433 | | | | 422,172 | |
Series (GN) 16 PK, 7.00%, 8/25/23 | | | 4,737,838 | | | | 5,526,465 | |
Series T-48 1A4, 5.538%, 7/25/33 | | | 43,823,962 | | | | 49,666,748 | |
Series T-051 1A, 6.50%, 9/25/43 | | | 288,658 | | | | 328,358 | |
Series T-59 1A1, 6.50%, 10/25/43 | | | 16,209,736 | | | | 18,989,771 | |
| | | | | | | | |
| | | | | | | 203,621,448 | |
FEDERAL AGENCY MORTGAGE PASS-THROUGH: 5.9% | |
Fannie Mae, 15 Year | | | | | | | | |
4.00%, 2/1/27 | | | 89,219,752 | | | | 95,564,573 | |
6.00%, 7/1/16-3/1/22 | | | 16,535,799 | | | | 17,707,359 | |
6.50%, 12/1/14-11/1/18 | | | 20,473,083 | | | | 21,966,624 | |
7.00%, 11/1/18 | | | 1,601,667 | | | | 1,736,907 | |
7.50%, 9/1/15-8/1/17 | | | 7,740,706 | | | | 8,225,335 | |
Fannie Mae, 20 Year | | | | | | | | |
6.50%, 1/1/22-10/1/26 | | | 7,031,447 | | | | 7,909,919 | |
Fannie Mae, 30 Year | | | | | | | | |
5.50%, 7/1/33-8/1/37 | | | 51,316,918 | | | | 56,161,820 | |
6.00%, 9/1/36-3/1/40 | | | 75,897,871 | | | | 84,307,706 | |
6.50%, 12/1/28-8/1/39 | | | 105,367,173 | | | | 119,131,241 | |
7.00%, 4/1/37-8/1/37 | | | 27,738,649 | | | | 31,988,591 | |
Fannie Mae, Hybrid ARM | | | | | | | | |
2.156%, 1/1/35 | | | 5,262,813 | | | | 5,586,330 | |
2.194%, 9/1/34 | | | 3,372,355 | | | | 3,601,818 | |
2.329%, 12/1/34 | | | 3,907,599 | | | | 4,056,856 | |
2.575%, 1/1/35 | | | 2,343,548 | | | | 2,479,248 | |
2.621%, 8/1/35 | | | 3,574,122 | | | | 3,789,957 | |
4.86%, 8/1/38 | | | 10,180,687 | | | | 10,824,488 | |
Fannie Mae, Multifamily DUS | | | | | | | | |
Pool 555728, 4.021%, 8/1/13 | | | 292,658 | | | | 294,255 | |
Pool 555162, 4.82%, 1/1/13 | | | 737,025 | | | | 737,672 | |
| | | | | | | | |
| | |
| | | PAR VALUE | | | VALUE | |
Pool 555316, 4.844%, 2/1/13 | | $ | 246,576 | | | $ | 246,296 | |
Pool 735387, 4.907%, 4/1/15 | | | 5,260,089 | | | | 5,686,613 | |
Pool 555148, 5.026%, 1/1/13 | | | 366,526 | | | | 365,496 | |
Pool 555806, 5.144%, 10/1/13 | | | 1,678,980 | | | | 1,696,545 | |
Pool 461628, 5.32%, 4/1/14 | | | 7,335,836 | | | | 7,571,996 | |
Pool 462086, 5.355%, 11/1/15 | | | 19,048,805 | | | | 20,884,894 | |
Freddie Mac, 30 Year
6.00%, 2/1/39 | | | 11,730,931 | | | | 12,848,937 | |
Freddie Mac, Hybrid ARM | | | | | | | | |
2.709%, 4/1/37 | | | 4,709,129 | | | | 4,903,348 | |
2.985%, 5/1/34 | | | 5,776,426 | | | | 6,169,623 | |
4.723%, 10/1/38 | | | 7,576,039 | | | | 8,103,035 | |
5.607%, 2/1/38 | | | 13,137,239 | | | | 13,942,816 | |
5.871%, 7/1/38 | | | 1,957,200 | | | | 2,099,662 | |
5.976%, 9/1/37 | | | 4,812,465 | | | | 5,211,274 | |
Freddie Mac Gold, 15 Year | | | | | | | | |
4.50%, 9/1/26 | | | 33,208,256 | | | | 35,333,758 | |
6.00%, 2/1/18 | | | 2,283,795 | | | | 2,438,922 | |
6.50%, 7/1/14-3/1/18 | | | 9,278,021 | | | | 9,887,996 | |
7.00%, 4/1/15 | | | 1,745 | | | | 1,773 | |
7.75%, 7/25/21 | | | 722,370 | | | | 830,578 | |
Freddie Mac Gold, 20 Year
6.50%, 10/1/26 | | | 11,454,629 | | | | 12,771,532 | |
Freddie Mac Gold, 30 Year | | | | | | | | |
6.00%, 2/1/38-11/1/39 | | | 37,642,313 | | | | 41,055,967 | |
6.50%, 9/1/18-4/1/33 | | | 18,084,933 | | | | 20,550,595 | |
7.00%, 11/1/37-9/1/38 | | | 24,806,607 | | | | 28,456,080 | |
7.47%, 3/17/23 | | | 155,882 | | | | 180,318 | |
Ginnie Mae, 30 Year | | | | | | | | |
7.50%, 11/15/24-10/15/25 | | | 1,790,015 | | | | 2,061,548 | |
7.97%, 4/15/20-1/15/21 | | | 936,225 | | | | 1,079,026 | |
| | | | | | | | |
| | | | | | | 720,449,327 | |
PRIVATE LABEL CMO & REMIC: 0.0%(e) | |
Union Planters Mortgage Finance Corp.
Series 2000-1 A1, 7.70%, 12/25/24 | | | 1,413,920 | | | | 1,533,605 | |
| | | | | | | | |
| | | | | | | 925,604,380 | |
| ASSET-BACKED: 0.3% | |
CREDIT CARD: 0.2% | |
Chase Issuance Trust
Series 2012-A8, 0.54%, 10/16/17 | | | 31,000,000 | | | | 30,972,689 | |
|
STUDENT LOAN: 0.1% | |
SLM Student Loan Trust
Series 2012-E A2A, 2.09%, 6/15/45(d) | | | 7,775,000 | | | | 7,857,306 | |
| | | | | | | | |
| | | | | | | 38,829,995 | |
| CORPORATE: 12.3% | |
FINANCIALS: 5.1% | |
Ally Financial, Inc.
4.50%, 2/11/14 | | | 43,330,000 | | | | 44,575,737 | |
American International Group, Inc. | | | | | | | | |
4.25%, 9/15/14 | | | 4,750,000 | | | | 5,003,645 | |
8.25%, 8/15/18 | | | 20,485,000 | | | | 26,914,955 | |
| | |
| PAGE 9 § DODGE & COX BALANCED FUND | | See accompanying Notes to Financial Statements |
| | | | |
| PORTFOLIO OF INVESTMENTS | | | December 31, 2012 | |
| | | | | | | | |
| FIXED INCOME SECURITIES (continued) | |
| | |
| | | PAR VALUE | | | VALUE | |
Bank of America Corp. | | | | | | | | |
5.30%, 3/15/17 | | $ | 37,540,000 | | | $ | 42,221,613 | |
6.625%, 5/23/36(c) | | | 33,500,000 | | | | 37,548,240 | |
Boston Properties, Inc. | | | | | | | | |
5.625%, 4/15/15 | | | 5,900,000 | | | | 6,479,002 | |
5.875%, 10/15/19 | | | 7,960,000 | | | | 9,493,377 | |
5.625%, 11/15/20 | | | 3,850,000 | | | | 4,554,535 | |
3.85%, 2/1/23 | | | 7,800,000 | | | | 8,193,775 | |
Capital One Financial Corp.
6.75%, 9/15/17 | | | 25,085,000 | | | | 30,635,784 | |
CIGNA Corp. | | | | | | | | |
7.65%, 3/1/23 | | | 9,525,000 | | | | 12,361,116 | |
7.875%, 5/15/27 | | | 12,675,000 | | | | 16,685,481 | |
8.30%, 1/15/33 | | | 8,845,000 | | | | 11,473,112 | |
Citigroup, Inc. | | | | | | | | |
6.125%, 11/21/17 | | | 45,475,000 | | | | 54,122,390 | |
7.875%, 10/30/40(c) | | | 20,528,200 | | | | 22,860,204 | |
Equity Residential
4.625%, 12/15/21 | | | 12,500,000 | | | | 14,080,163 | |
General Electric Co. | | | | | | | | |
5.50%, 1/8/20 | | | 32,095,000 | | | | 37,991,205 | |
4.375%, 9/16/20 | | | 8,475,000 | | | | 9,458,490 | |
4.625%, 1/7/21 | | | 3,350,000 | | | | 3,799,892 | |
Health Net, Inc.
6.375%, 6/1/17 | | | 10,250,000 | | | | 10,877,813 | |
HSBC Holdings PLC(b) (United Kingdom) | | | | | | | | |
5.10%, 4/5/21 | | | 3,625,000 | | | | 4,280,694 | |
6.50%, 5/2/36 | | | 25,990,000 | | | | 32,471,386 | |
6.50%, 9/15/37 | | | 8,940,000 | | | | 11,158,810 | |
JPMorgan Chase & Co.
8.75%, 9/1/30(c) | | | 23,042,000 | | | | 31,708,119 | |
Legg Mason, Inc.
6.00%, 5/21/19(d) | | | 14,375,000 | | | | 15,497,069 | |
Royal Bank of Scotland Group PLC(b) (United Kingdom) | | | | | | | | |
4.375%, 3/16/16 | | | 7,900,000 | | | | 8,547,879 | |
5.625%, 8/24/20 | | | 13,250,000 | | | | 15,382,906 | |
6.125%, 1/11/21 | | | 5,155,000 | | | | 6,228,152 | |
6.125%, 12/15/22 | | | 14,100,000 | | | | 14,882,296 | |
SLM Corp. | | | | | | | | |
6.00%, 1/25/17 | | | 14,285,000 | | | | 15,463,512 | |
8.45%, 6/15/18 | | | 15,550,000 | | | | 18,193,500 | |
Unum Group | | | | | | | | |
7.19%, 2/1/28 | | | 8,305,000 | | | | 9,569,079 | |
7.25%, 3/15/28 | | | 2,030,000 | | | | 2,386,982 | |
6.75%, 12/15/28 | | | 11,368,000 | | | | 13,215,948 | |
Wells Fargo & Co.
6.00%, 11/15/17 | | | 13,695,000 | | | | 16,422,715 | |
| | | | | | | | |
| | | | | | | 624,739,576 | |
INDUSTRIALS: 7.2% | |
AT&T, Inc. | | | | | | | | |
6.55%, 2/15/39 | | | 5,500,000 | | | | 7,227,622 | |
5.35%, 9/1/40 | | | 18,000,000 | | | | 20,961,864 | |
| | | | | | | | |
| | |
| | | PAR VALUE | | | VALUE | |
Boston Scientific Corp. | | | | | | | | |
6.25%, 11/15/15 | | $ | 1,055,000 | | | $ | 1,188,695 | |
6.40%, 6/15/16 | | | 24,811,000 | | | | 28,519,500 | |
Burlington Northern Santa Fe, LLC(g) | | | | | | | | |
8.251%, 1/15/21 | | | 967,526 | | | | 1,177,426 | |
4.967%, 4/1/23 | | | 8,977,507 | | | | 10,032,661 | |
5.72%, 1/15/24 | | | 11,691,064 | | | | 13,701,555 | |
5.342%, 4/1/24 | | | 12,674,199 | | | | 14,535,068 | |
5.629%, 4/1/24 | | | 19,566,681 | | | | 22,713,239 | |
Canadian Pacific Railway Ltd.(b) (Canada)
5.75%, 1/15/42 | | | 4,850,000 | | | | 5,913,746 | |
Comcast Corp. | | | | | | | | |
6.30%, 11/15/17 | | | 5,865,000 | | | | 7,194,977 | |
5.875%, 2/15/18 | | | 4,475,000 | | | | 5,392,603 | |
6.45%, 3/15/37 | | | 4,998,000 | | | | 6,413,374 | |
6.95%, 8/15/37 | | | 1,700,000 | | | | 2,305,312 | |
Cox Communications, Inc. | | | | | | | | |
5.50%, 10/1/15 | | | 4,705,000 | | | | 5,283,362 | |
5.875%, 12/1/16(d) | | | 24,570,000 | | | | 28,682,920 | |
3.25%, 12/15/22(d) | | | 2,900,000 | | | | 2,990,648 | |
CSX Corp.
9.75%, 6/15/20 | | | 5,231,000 | | | | 7,389,760 | |
Dillard’s, Inc. | | | | | | | | |
7.13%, 8/1/18 | | | 3,606,000 | | | | 4,020,690 | |
7.875%, 1/1/23 | | | 8,660,000 | | | | 9,482,700 | |
7.75%, 7/15/26 | | | 50,000 | | | | 52,625 | |
7.75%, 5/15/27 | | | 540,000 | | | | 562,950 | |
7.00%, 12/1/28 | | | 15,135,000 | | | | 15,248,513 | |
Dow Chemical Co. | | | | | | | | |
8.55%, 5/15/19 | | | 21,553,000 | | | | 29,098,188 | |
7.375%, 11/1/29 | | | 15,330,000 | | | | 20,332,828 | |
9.40%, 5/15/39 | | | 4,890,000 | | | | 8,051,057 | |
Eaton Corp. PLC(b) (Ireland) | | | | | | | | |
1.50%, 11/2/17(d) | | | 2,885,000 | | | | 2,890,894 | |
2.75%, 11/2/22(d) | | | 7,500,000 | | | | 7,476,855 | |
Enel SPA(b) (Italy)
6.80%, 9/15/37(d) | | | 7,525,000 | | | | 7,859,863 | |
FedEx Corp. | | | | | | | | |
8.00%, 1/15/19 | | | 6,965,000 | | | | 9,172,933 | |
6.72%, 7/15/23 | | | 12,692,545 | | | | 15,293,444 | |
Ford Motor Credit Co.(g) | | | | | | | | |
5.625%, 9/15/15 | | | 23,250,000 | | | | 25,459,541 | |
5.75%, 2/1/21 | | | 25,200,000 | | | | 29,013,415 | |
HCA, Inc. | | | | | | | | |
6.75%, 7/15/13 | | | 4,600,000 | | | | 4,715,000 | |
5.75%, 3/15/14 | | | 200,000 | | | | 209,000 | |
6.375%, 1/15/15 | | | 10,375,000 | | | | 11,217,969 | |
6.50%, 2/15/16 | | | 20,430,000 | | | | 22,217,625 | |
Hewlett-Packard Co.
3.30%, 12/9/16 | | | 14,955,000 | | | | 15,222,530 | |
Lafarge SA(b) (France) | | | | | | | | |
6.20%, 7/9/15(d) | | | 4,600,000 | | | | 5,018,345 | |
6.50%, 7/15/16 | | | 32,945,000 | | | | 36,816,037 | |
| | |
| See accompanying Notes to Financial Statements | | DODGE & COX BALANCED FUND §PAGE 10 |
| | | | |
| PORTFOLIO OF INVESTMENTS | | | December 31, 2012 | |
| | | | | | | | |
| FIXED INCOME SECURITIES (continued) | |
| | |
| | | PAR VALUE | | | VALUE | |
Liberty Media Corp. | | | | | | | | |
8.50%, 7/15/29 | | $ | 9,462,000 | | | $ | 10,242,615 | |
8.25%, 2/1/30 | | | 7,291,000 | | | | 7,947,190 | |
Macy’s, Inc.
6.90%, 1/15/32 | | | 49,699,000 | | | | 59,674,266 | |
News Corp. | | | | | | | | |
6.15%, 3/1/37 | | | 11,000,000 | | | | 13,499,915 | |
6.65%, 11/15/37 | | | 1,638,000 | | | | 2,116,612 | |
Norfolk Southern Corp.
9.75%, 6/15/20 | | | 7,224,000 | | | | 10,281,442 | |
Reed Elsevier PLC(b) (United Kingdom)
8.625%, 1/15/19 | | | 22,475,000 | | | | 28,979,130 | |
Sprint Nextel Corp. | | | | | | | | |
6.00%, 12/1/16 | | | 17,100,000 | | | | 18,596,250 | |
6.90%, 5/1/19 | | | 4,225,000 | | | | 4,605,250 | |
Telecom Italia SPA(b) (Italy) | | | | | | | | |
6.175%, 6/18/14 | | | 5,661,000 | | | | 5,966,694 | |
4.95%, 9/30/14 | | | 8,850,000 | | | | 9,239,400 | |
6.999%, 6/4/18 | | | 5,150,000 | | | | 5,886,450 | |
7.175%, 6/18/19 | | | 15,450,000 | | | | 17,929,725 | |
Time Warner Cable, Inc. | | | | | | | | |
8.75%, 2/14/19 | | | 20,265,000 | | | | 27,340,727 | |
8.25%, 4/1/19 | | | 16,145,000 | | | | 21,484,749 | |
Time Warner, Inc. | | | | | | | | |
7.625%, 4/15/31 | | | 26,950,000 | | | | 37,101,580 | |
7.70%, 5/1/32 | | | 8,080,000 | | | | 11,297,270 | |
Union Pacific Corp. | | | | | | | | |
5.866%, 7/2/30 | | | 30,213,352 | | | | 36,082,873 | |
6.176%, 1/2/31 | | | 10,697,413 | | | | 13,165,699 | |
Vulcan Materials Co. | | | | | | | | |
6.50%, 12/1/16 | | | 5,250,000 | | | | 5,788,125 | |
7.50%, 6/15/21 | | | 10,825,000 | | | | 12,340,500 | |
Xerox Corp. | | | | | | | | |
6.35%, 5/15/18 | | | 28,585,000 | | | | 32,967,109 | |
5.625%, 12/15/19 | | | 11,115,000 | | | | 12,418,345 | |
| | | | | | | | |
| | | | | | | 876,009,250 | |
| | | | | | | | |
| | | | | | | 1,500,748,826 | |
| | | | | | | | |
TOTAL FIXED INCOME SECURITIES
(Cost $2,783,498,584) | | | $ | 3,094,388,893 | |
|
| SHORT-TERM INVESTMENTS: 1.4% | |
MONEY MARKET FUND: 0.1% | |
SSgA U.S. Treasury Money Market Fund | | | 12,198,445 | | | | 12,198,445 | |
|
REPURCHASE AGREEMENT: 1.3% | |
Fixed Income Clearing Corporation(f)
0.11%, dated 12/31/12, due 1/2/13, maturity value $154,696,945 | | | 154,696,000 | | | | 154,696,000 | |
| | | | | | | | |
TOTAL SHORT-TERM INVESTMENTS
(Cost $166,894,445) | | | $ | 166,894,445 | |
| | | | | | | | |
| | | | | | | | |
| | |
| | | PAR VALUE | | | VALUE | |
TOTAL INVESTMENTS
(Cost $10,815,363,458) | | | 99.6 | % | | $ | 12,172,120,226 | |
| | |
OTHER ASSETS LESS LIABILITIES | | | 0.4 | % | | | 45,184,233 | |
| | | | | | | | |
| NET ASSETS | | | 100.0 | % | | $ | 12,217,304,459 | |
| | | | | | | | |
| (b) | Security denominated in U.S. dollars |
| (c) | Cumulative preferred security |
| (d) | Security exempt from registration under Rule 144A of the Securities Act of 1933. The security may be resold in transactions exempt from registration, normally to qualified institutional buyers. As of December 31, 2012, all such securities in total represented $78,273,900 or 0.6% of net assets. These securities have been deemed liquid by Dodge & Cox, investment manager, pursuant to procedures approved by the Fund’s Board of Trustees. |
| (f) | Repurchase agreement is collateralized by Fannie Mae 2.50%-2.70%, 3/28/22-9/13/22; U.S. Treasury Note 0.25%-2.125%, 4/30/14-12/31/15. Total collateral value is $157,792,551. |
| (g) | Subsidiary (see below) |
In determining a company’s country designation, the Fund generally references the country of incorporation. In cases where the Fund considers the country of incorporation to be a “jurisdiction of convenience” chosen primarily for tax purposes, the Fund uses the country designation of an appropriate broad-based market index. In that circumstance, two countries are listed—the country of incorporation and the country designated by an appropriate index, respectively.
Fixed income securities are grouped by parent company unless otherwise noted. Actual securities may be issued by the listed parent company or one of its subsidiaries.
ADR: American Depositary Receipt
ARM: Adjustable Rate Mortgage
CMO: Collateralized Mortgage Obligation
DUS: Delegated Underwriting and Servicing
REMIC: Real Estate Mortgage Investment Conduit
FUTURES CONTRACTS
| | | | | | | | | | | | |
| Description | | Number of
Contracts | | Expiration
Date | | Notional
Amount | | | Unrealized
Appreciation | |
| 10 Year U.S. Treasury Note – Short Position | | 3,640 | | Mar 2013 | | $ | (483,323,750 | ) | | $ | 1,611,071 | |
| | |
| PAGE 11 § DODGE & COX BALANCED FUND | | See accompanying Notes to Financial Statements |
| | | | |
STATEMENT OF ASSETS AND LIABILITIES | |
| |
| | | December 31, 2012 | |
ASSETS: | | | | |
Investments, at value (cost $10,815,363,458) | | $ | 12,172,120,226 | |
Cash held at broker | | | 3,012,148 | |
Receivable for investments sold | | | 18,217,322 | |
Receivable for Fund shares sold | | | 7,709,779 | |
Receivable from broker for futures variation margin | | | 1,617,514 | |
Dividends and interest receivable | | | 46,863,068 | |
Prepaid expenses and other assets | | | 80,051 | |
| | | | |
| | | 12,249,620,108 | |
| | | | |
LIABILITIES: | | | | |
Payable for Fund shares redeemed | | | 26,071,349 | |
Management fees payable | | | 5,248,141 | |
Accrued expenses | | | 996,159 | |
| | | | |
| | | 32,315,649 | |
| | | | |
NET ASSETS | | $ | 12,217,304,459 | |
| | | | |
NET ASSETS CONSIST OF: | | | | |
Paid in capital | | $ | 11,873,438,670 | |
Undistributed net investment income | | | 2,236,023 | |
Accumulated net realized loss | | | (1,016,744,517 | ) |
Net unrealized appreciation | | | 1,358,374,283 | |
| | | | |
| | $ | 12,217,304,459 | |
| | | | |
Fund shares outstanding (par value $0.01 each, unlimited shares authorized) | | | 156,508,791 | |
Net asset value per share | | | $78.06 | |
|
STATEMENT OF OPERATIONS | |
| |
| | | Year Ended December 31, 2012 | |
INVESTMENT INCOME: | | | | |
Dividends (net of foreign taxes of $5,016,118) | | $ | 208,998,598 | |
Interest | | | 132,896,267 | |
| | | | |
| | | 341,894,865 | |
| | | | |
EXPENSES: | | | | |
Management fees | | | 62,346,463 | |
Custody and fund accounting fees | | | 669,961 | |
Transfer agent fees | | | 2,319,683 | |
Professional services | | | 142,584 | |
Shareholder reports | | | 295,920 | |
Registration fees | | | 131,432 | |
Trustees’ fees | | | 190,500 | |
Miscellaneous | | | 552,183 | |
| | | | |
| | | 66,648,726 | |
| | | | |
NET INVESTMENT INCOME | | | 275,246,139 | |
| | | | |
REALIZED AND UNREALIZED
GAIN (LOSS): | | | | |
Net realized gain (loss) | | | | |
Investments | | | 1,096,687,680 | |
Treasury futures contracts | | | (19,063,592 | ) |
Net change in unrealized appreciation/depreciation | | | | |
Investments | | | 740,641,735 | |
Treasury futures contracts | | | 5,653,933 | |
| | | | |
Net realized and unrealized gain | | | 1,823,919,756 | |
| | | | |
NET INCREASE IN NET ASSETS FROM OPERATIONS | | $ | 2,099,165,895 | |
| | | | |
| | | | | | | | |
STATEMENT OF CHANGES IN NET ASSETS | |
| | |
| | | Year Ended
December 31, 2012 | | | Year Ended
December 31, 2011 | |
OPERATIONS: | | | | | | | | |
Net investment income | | $ | 275,246,139 | | | $ | 315,122,657 | |
Net realized gain | | | 1,077,624,088 | | | | 185,598,017 | |
Net change in unrealized appreciation/depreciation | | | 746,295,668 | | | | (690,775,619 | ) |
| | | | | | | | |
| | | 2,099,165,895 | | | | (190,054,945 | ) |
| | | | | | | | |
| |
DISTRIBUTIONS TO SHAREHOLDERS FROM: | | | | | |
Net investment income | | | (275,763,170 | ) | | | (316,115,114 | ) |
Net realized gain | | | — | | | | — | |
| | | | | | | | |
Total distributions | | | (275,763,170 | ) | | | (316,115,114 | ) |
| | | | | | | | |
| | |
FUND SHARE TRANSACTIONS: | | | | | | | | |
Proceeds from sale of shares | | | 943,080,584 | | | | 1,229,782,857 | |
Reinvestment of distributions | | | 262,462,160 | | | | 298,241,031 | |
Cost of shares redeemed | | | (3,032,125,676 | ) | | | (3,650,564,512 | ) |
| | | | | | | | |
Net decrease from Fund share transactions | | | (1,826,582,932 | ) | | | (2,122,540,624 | ) |
| | | | | | | | |
Total decrease in net assets | | | (3,180,207 | ) | | | (2,628,710,683 | ) |
| | |
NET ASSETS: | | | | | | | | |
Beginning of year | | | 12,220,484,666 | | | | 14,849,195,349 | |
| | | | | | | | |
End of year (including undistributed net investment income of $2,236,023 and $2,753,054, respectively) | | $ | 12,217,304,459 | | | $ | 12,220,484,666 | |
| | | | | | | | |
| |
SHARE INFORMATION: | | | | | |
Shares sold | | | 12,767,972 | | | | 17,433,979 | |
Distributions reinvested | | | 3,526,509 | | | | 4,340,712 | |
Shares redeemed | | | (40,973,081 | ) | | | (52,048,379 | ) |
| | | | | | | | |
Net decrease in shares outstanding | | | (24,678,600 | ) | | | (30,273,688 | ) |
| | | | | | | | |
| | |
| See accompanying Notes to Financial Statements | | DODGE & COX BALANCED FUND §PAGE 12 |
NOTES TO FINANCIAL STATEMENTS
NOTE 1—ORGANIZATION AND SIGNIFICANT ACCOUNTING POLICIES
Dodge & Cox Balanced Fund (the “Fund”) is one of the series constituting the Dodge & Cox Funds (the “Trust” or the “Funds”). The Trust is organized as a Delaware statutory trust and is registered under the Investment Company Act of 1940, as amended, as a diversified, open-end management investment company. The Fund commenced operations on June 26, 1931, and seeks regular income, conservation of principal, and an opportunity for long-term growth of principal and income. Risk considerations and investment strategies of the Fund are discussed in the Fund’s Prospectus.
The financial statements have been prepared in conformity with accounting principles generally accepted in the United States of America, which require the use of estimates and assumptions by management. Actual results may differ from those estimates. Significant accounting policies are as follows:
Security valuation The Fund’s net assets are valued as of the close of trading on the New York Stock Exchange (NYSE), generally 4:00 p.m. Eastern Time, each day that the NYSE is open for business. Stocks are valued at the official quoted close price or the last sale of the day at the close of the NYSE or, if not available, at the mean between the exchange-listed bid and ask prices. A security that is listed or traded on more than one exchange is valued at the quotation on the exchange determined to be the primary market for such security. Fixed income securities are priced on the basis of valuations furnished by independent pricing services which utilize both dealer-supplied valuations and pricing models. Under certain circumstances, fixed income securities that are not valued by pricing services are temporarily valued by the investment manager utilizing both dealer-supplied valuations and pricing models. Pricing models may consider quoted prices for similar securities, interest rates, prepayment speeds, and credit risk. Futures contracts are valued daily at the closing settlement price on the exchange. Security values are not discounted based on the size of the Fund’s position. Securities for which market quotations are not readily available are valued at fair value as determined in good faith by or under the direction of
the Board of Trustees. Short-term securities are valued at amortized cost which approximates current value. All securities held by the Fund are denominated in U.S. dollars.
Security transactions, investment income, expenses, and distributions Security transactions are recorded on the trade date. Realized gains and losses on securities sold are determined on the basis of identified cost.
Dividend income and corporate action transactions are recorded on the ex-dividend date, or when the Fund first learns of the dividend/corporate action if the ex-dividend date has passed. Withholding taxes on foreign dividends have been provided for in accordance with the Fund’s understanding of the applicable country’s tax rules and rates. Non-cash dividends included in dividend income, if any, are recorded at the fair market value of the securities received. Dividends characterized as return of capital are recorded as a reduction of cost of investments and/or realized gain.
Interest income is recorded on the accrual basis. Interest income includes coupon interest, amortization of premium and accretion of discount on debt securities, and gain/loss on paydowns of mortgage-backed securities. The ability of the issuers of the debt securities held by the Fund to meet their obligations may be affected by economic developments in a specific industry, state, or region. Debt obligations may be placed on non-accrual status and related interest income may be reduced by ceasing current accruals and writing off interest receivables when the collection of all or a portion of interest has become doubtful. A debt obligation is removed from non-accrual status when the issuer resumes interest payments or when collectibility of interest is reasonably assured.
Expenses are recorded on the accrual basis. Most expenses of the Trust can be directly attributed to a specific series. Expenses which cannot be directly attributed are allocated among the Funds in the Trust based on relative net assets or other expense methodologies determined by the nature of the expense.
Distributions to shareholders are recorded on the ex-dividend date.
PAGE 13 § DODGE & COX BALANCED FUND
NOTES TO FINANCIAL STATEMENTS
Repurchase agreements The Fund enters into repurchase agreements, secured by U.S. government or agency securities, which involve the purchase of securities from a counterparty with a simultaneous commitment to resell the securities at an agreed-upon date and price. It is the Fund’s policy that its custodian take possession of the underlying collateral securities, the fair value of which exceeds the principal amount of the repurchase transaction, including accrued interest, at all times. In the event of default by the counterparty, the Fund has the contractual right to liquidate the collateral securities and to apply the proceeds in satisfaction of the obligation.
Treasury Futures Contracts Futures contracts involve an obligation to purchase or sell (depending on whether the Fund has entered a long or short futures contract, respectively) an asset at a future date, at a price set at the time of the contract. Upon entering into a futures contract, the Fund is required to deposit an amount of cash or liquid assets (referred to as initial margin) in a segregated account with the clearing broker. Subsequent payments (referred to as variation margin) to and from the clearing broker are made on a daily basis based on changes in the market value of futures contracts. Futures are traded publicly and their market value changes daily. Changes in the market value of open futures contracts are recorded as unrealized appreciation or depreciation in the Statement of Operations. Realized gains and losses on futures contracts are recorded in the Statement of Operations at the closing or expiration of futures contracts. Cash deposited with a broker as initial margin is recorded on the Statement of Assets and Liabilities. A receivable and/or payable to brokers for daily variation margin is also recorded on the Statement of Assets and Liabilities.
Investments in futures contracts may include certain risks, which may be different from, and potentially greater than, those of the underlying securities. To the extent the Fund uses Treasury futures, it is exposed to additional volatility and potential losses resulting from leverage.
The Fund has entered into short Treasury futures contracts to assist with the management of the portfolio’s interest rate exposure. During the year ended December 31, 2012, the Fund remained consistently invested in short Treasury futures contracts. These Treasury futures contracts had notional values ranging from 3% to 5% of net assets.
Indemnification Under the Trust’s organizational documents, its officers and trustees are indemnified against certain liabilities arising out of the performance of their duties to the Trust. In addition, in the normal course of business the Trust enters into contracts that provide general indemnities to other parties. The Trust’s maximum exposure under these arrangements is unknown as this would involve future claims that may be made against the Trust that have not yet occurred.
NOTE 2—VALUATION MEASUREMENTS
Various inputs are used in determining the value of the Fund’s investments. These inputs are summarized in the three broad levels listed below.
| § | | Level 1: Quoted prices in active markets for identical securities |
| § | | Level 2: Other significant observable inputs (including quoted prices for similar securities, market indices, interest rates, credit risk, etc.) |
| § | | Level 3: Significant unobservable inputs (including Fund management’s assumptions in determining the fair value of investments) |
The inputs or methodology used for valuing securities are not necessarily an indication of the risk associated with investing in those securities.
DODGE & COX BALANCED FUND §PAGE 14
NOTES TO FINANCIAL STATEMENTS
The following is a summary of the inputs used to value the Fund’s holdings as of December 31, 2012:
| | | | | | | | |
| Classification(a) | | LEVEL 1
(Quoted Prices) | | | LEVEL 2
(Other Significant
Observable Inputs) | |
Securities | | | | | | | | |
Common Stocks(b) | | $ | 8,910,836,888 | | | $ | — | |
Fixed Income Securities | | | | | | | | |
U.S. Treasury | | | 346,821,043 | | | | — | |
Government-Related | | | — | | | | 282,384,649 | |
Mortgage-Related | | | — | | | | 925,604,380 | |
Asset-Backed | | | — | | | | 38,829,995 | |
Corporate | | | — | | | | 1,500,748,826 | |
Short-term Investments | | | | | | | | |
Money Market Fund | | | 12,198,445 | | | | — | |
Repurchase Agreement | | | — | | | | 154,696,000 | |
| | | | | | | | |
| | | | | | | | |
Total Securities | | $ | 9,269,856,376 | | | $ | 2,902,263,850 | |
| | | | | | | | |
Other Financial Instruments | | | | | | | | |
Treasury Futures Contracts | | $ | 1,611,071 | (c) | | $ | — | |
| | | | | | | | | |
| (a) | There were no transfers between Level 1 and Level 2 during the year ended December 31, 2012. There were no Level 3 securities at December 31, 2012 and 2011, and there were no transfers to Level 3 during the year. |
| (b) | All common stocks held in the Fund are Level 1 securities. For a detailed break-out of common stocks by major industry classification, please refer to the Portfolio of Investments. |
| (c) | Represents unrealized appreciation on Treasury futures contracts. |
NOTE 3—RELATED PARTY TRANSACTIONS
Management fees Under a written agreement approved by a unanimous vote of the Board of Trustees, the Fund pays an annual management fee of 0.50% of the Fund’s average daily net assets to Dodge & Cox, investment manager of the Fund.
Fund officers and trustees All officers and three of the trustees of the Trust are officers or employees of Dodge & Cox. The Trust pays a fee only to those trustees who are not affiliated with Dodge & Cox.
NOTE 4—INCOME TAX INFORMATION AND DISTRIBUTIONS TO SHAREHOLDERS
A provision for federal income taxes is not required since the Fund intends to continue to qualify as a regulated investment company under Subchapter M of the Internal
Revenue Code and distribute all of its taxable income to shareholders. Distributions are determined in accordance with income tax regulations, and such amounts may differ from net investment income and realized gains for financial reporting purposes. Financial reporting records are adjusted for permanent book/tax differences at year end to reflect tax character.
Book/tax differences are primarily due to differing treatments of wash sales, net short-term realized gain (loss), and Treasury futures contracts. At December 31, 2012, the cost of investments for federal income tax purposes was $10,825,792,636.
Distributions during the years ended December 31, 2012 and 2011, were characterized as follows for federal income tax purposes:
| | | | | | | | |
| | | Year Ended
December 31, 2012 | | | Year Ended
December 31, 2011 | |
Ordinary income | | | $275,763,170 | | | | $316,115,114 | |
| | | ($1.655 per share) | | | | ($1.620 per share) | |
| | |
Long-term capital gain | | | — | | | | — | |
At December 31, 2012, the tax basis components of distributable earnings were as follows:
| | | | |
Unrealized appreciation | | $ | 2,127,095,580 | |
Unrealized depreciation | | | (780,767,990 | ) |
| | | | |
Net unrealized appreciation | | | 1,346,327,590 | |
Undistributed ordinary income | | | 2,236,023 | |
Capital loss carryforward(a) | | | (1,004,697,824 | ) |
| (a) | Represents accumulated capital loss as of December 31, 2012, which may be carried forward to offset future capital gains. During 2012, the Fund utilized $1,080,412,179 of the capital loss carryforward. If not utilized, the remaining capital loss carryforward will expire in 2017. |
Under the Regulated Investment Company Modernization Act of 2010, capital losses incurred by the Fund after January 1, 2011, will not be subject to expiration. In addition, such losses must be utilized prior to the losses incurred in the years preceding enactment. (The Fund had net capital gains in 2011 and 2012.)
Fund management has reviewed the tax positions for open periods (three years and four years, respectively, from filing the Fund’s Federal and State tax returns) as applicable to the Fund, and has determined that no provision for income tax is required in the Fund’s financial statements.
PAGE 15 § DODGE & COX BALANCED FUND
NOTES TO FINANCIAL STATEMENTS
NOTE 5—LOAN FACILITIES
Pursuant to an exemptive order issued by the Securities and Exchange Commission (SEC), the Fund may participate in an interfund lending facility (Facility). The Facility allows the Fund to borrow money from or loan money to the Funds. Loans under the Facility are made for temporary or emergency purposes, such as to fund shareholder redemption requests. Interest on borrowings is the average of the current repurchase agreement rate and the bank loan rate. There was no activity in the Facility during the period.
All Funds in the Trust participate in a $500 million committed credit facility (Line of Credit) with State Street Bank and Trust Company, to be utilized for temporary or emergency purposes to fund shareholder redemptions or for other short-term liquidity purposes. The maximum amount available to the Fund is $250 million. Each Fund pays an annual commitment fee on its pro-rata portion of the Line of Credit. The Fund’s commitment fee for the year ended December 31, 2012, amounted to $51,734 and is reflected as a Miscellaneous Expense in the Statement of Operations. Interest on borrowings is charged at the prevailing rate. There were no borrowings on the Line of Credit during the period.
NOTE 6—PURCHASES AND SALES OF INVESTMENTS
For the year ended December 31, 2012, purchases and sales of securities, other than short-term securities and
U.S. government securities, aggregated $1,303,227,438 and $3,210,897,854 respectively. For the year ended December 31, 2012, purchases and sales of U.S. government securities aggregated $687,514,678 and $617,357,654, respectively.
NOTE 7—ACCOUNTING PRONOUNCEMENTS
Effective January 1, 2013, the Fund will adopt Accounting Standards Update (ASU) No. 2011-11, Balance Sheet (Topic 210): Disclosures about Offsetting Assets and Liabilities and ASU No. 2013-01, Balance Sheet (Topic 210): Clarifying the Scope of Disclosures about Offsetting Assets and Liabilities. These amendments to Topic 210 require enhanced disclosures about offsetting of financial assets and liabilities, including derivative instruments, to enable investors to understand the effect of these arrangements on a fund’s financial position. Management believes the adoption of these ASUs will not have a material impact on the Fund’s financial statements.
NOTE 8—SUBSEQUENT EVENTS
Fund management has determined that no material events or transactions occurred subsequent to December 31, 2012, and through the date of the Fund’s financial statements issuance, which require additional disclosure in the Fund’s financial statements.
DODGE & COX BALANCED FUND §PAGE 16
FINANCIAL HIGHLIGHTS
| | | | | | | | | | | | | | | | | | | | |
SELECTED DATA AND RATIOS (for a share outstanding throughout each year) | | Year Ended December 31, | |
| | | 2012 | | | 2011 | | | 2010 | | | 2009 | | | 2008 | |
| | | | |
Net asset value, beginning of year | | | $67.45 | | | | $70.22 | | | | $64.03 | | | | $51.26 | | | | $81.00 | |
Income from investment operations: | | | | | | | | | | | | | | | | | | | | |
Net investment income | | | 1.65 | | | | 1.62 | | | | 1.41 | | | | 1.46 | | | | 1.99 | |
Net realized and unrealized gain (loss) | | | 10.62 | | | | (2.77 | ) | | | 6.30 | | | | 12.82 | | | | (28.44 | ) |
| | | | |
Total from investment operations | | | 12.27 | | | | (1.15 | ) | | | 7.71 | | | | 14.28 | | | | (26.45 | ) |
| | | | |
Distributions to shareholders from: | | | | | | | | | | | | | | | | | | | | |
Net investment income | | | (1.66 | ) | | | (1.62 | ) | | | (1.52 | ) | | | (1.51 | ) | | | (1.95 | ) |
Net realized gain | | | — | | | | — | | | | — | | | | — | | | | (1.34 | ) |
| | | | |
Total distributions | | | (1.66 | ) | | | (1.62 | ) | | | (1.52 | ) | | | (1.51 | ) | | | (3.29 | ) |
| | | | |
Net asset value, end of year | | | $78.06 | | | | $67.45 | | | | $70.22 | | | | $64.03 | | | | $51.26 | |
| | | | |
Total return | | | 18.32 | % | | | (1.66 | )% | | | 12.23 | % | | | 28.37 | % | | | (33.57 | )% |
Ratios/supplemental data: | | | | | | | | | | | | | | | | | | | | |
Net assets, end of year (millions) | | | $12,217 | | | | $12,220 | | | | $14,849 | | | | $15,448 | | | | $14,676 | |
Ratio of expenses to average net assets | | | 0.53 | % | | | 0.53 | % | | | 0.53 | % | | | 0.53 | % | | | 0.53 | % |
Ratio of net investment income to average net assets | | | 2.21 | % | | | 2.26 | % | | | 2.13 | % | | | 2.61 | % | | | 2.85 | % |
Portfolio turnover rate | | | 16 | % | | | 19 | % | | | 12 | % | | | 19 | % | | | 27 | % |
See accompanying Notes to Financial Statements
PAGE 17 § DODGE & COX BALANCED FUND
REPORT OF INDEPENDENT REGISTERED PUBLIC ACCOUNTING FIRM
To the Trustees of Dodge & Cox Funds and Shareholders of Dodge & Cox Balanced Fund
In our opinion, the accompanying statement of assets and liabilities, including the portfolio of investments, and the related statements of operations and of changes in net assets and the financial highlights present fairly, in all material respects, the financial position of Dodge & Cox Balanced Fund (the “Fund”, one of the series constituting Dodge & Cox Funds) at December 31, 2012, the results of its operations for the year then ended, the changes in its net assets for each of the two years in the period then ended and the financial highlights for each of the five years in the period then ended, in conformity with accounting principles generally accepted in the United States of America. These financial statements and financial highlights (hereafter referred to as “financial statements”) are the responsibility of the Fund’s management; our responsibility is to express an opinion on these financial statements based on our audits. We conducted our audits of these financial statements in accordance with the standards of the Public Company Accounting Oversight Board (United States). Those standards require that we plan and perform the audit to obtain reasonable assurance about whether the financial statements are free of material misstatement. An audit includes examining, on a test basis, evidence supporting the amounts and disclosures in the financial statements, assessing the accounting principles used and significant estimates made by management, and evaluating the overall financial statement presentation. We believe that our audits, which included confirmation of securities at December 31, 2012, by correspondence with the custodian and brokers, provide a reasonable basis for our opinion.
PricewaterhouseCoopers LLP
San Francisco, California
February 20, 2013
DODGE & COX BALANCED FUND §PAGE 18
SPECIAL 2012 TAX INFORMATION
(unaudited)
The following information is provided pursuant to provisions of the Internal Revenue Code:
The Fund designates $212,346,701 of its distributions paid to shareholders in 2012 as qualified dividends (treated for federal income tax purposes in the hands of shareholders as taxable at a maximum rate of 15%).
For shareholders that are corporations, the Fund designates 50% of its ordinary dividends paid to shareholders in 2012 as dividends from domestic corporations eligible for the corporate dividends received deduction, provided that the shareholder otherwise satisfies applicable requirements to claim that deduction.
BOARD APPROVAL OF FUNDS’ INVESTMENT MANAGEMENT AGREEMENTS AND MANAGEMENT FEES
(unaudited)
The Board of Trustees is responsible for overseeing the performance of the Dodge & Cox Funds’ investment manager and determining whether to continue the Investment Management Agreements between the Funds and Dodge & Cox each year (the “Agreements”). At a meeting of the Board of Trustees of the Trust held on December 12, 2012, the Trustees, by a unanimous vote (including a separate vote of those Trustees who are not “interested persons” (as defined in the Investment Company Act of 1940) (the “Independent Trustees”)), approved the renewal of the Agreements for an additional one-year term through December 31, 2013. During the course of the year, the Board received a wide variety of materials relating to the services provided by Dodge & Cox and the performance of each of the Funds.
INFORMATION RECEIVED
In advance of the meeting, the Board, including each of the Independent Trustees, requested, received, and reviewed materials relating to the Agreements and the services provided by Dodge & Cox. The Independent Trustees retained Morningstar® to prepare an independent expense and performance summary for each Fund and comparable funds managed by other advisers identified by Morningstar. The Morningstar materials included information regarding advisory fee rates, expense ratios,
and transfer agency, custodial, and distribution expenses, as well as appropriate performance comparisons to a Fund’s peer group and an index or combination of indices. The Morningstar materials also included a comparison of expenses of various share classes offered by comparable funds.
The materials reviewed by the Board contained information concerning, among other things, Dodge & Cox’s profitability, financial results and condition, advisory fee revenue, and separate account advisory fee schedules. The Board additionally considered the Funds’ brokerage commissions, turnover rates, sales and redemption data and the significant investment that Dodge & Cox makes in research used in managing the Funds. The Board received and reviewed a memorandum summarizing information provided throughout the year regarding Dodge & Cox’s services to the Funds as well as information regarding (i) the different fees, services, costs, and risks associated with separate accounts managed by Dodge & Cox as compared to the Dodge & Cox Funds; (ii) the differences in performance between the Funds and separately managed accounts; and (iii) Fund shares subscription and redemption activity. Throughout the process of reviewing the services provided by Dodge & Cox and preparing for the meeting, the Independent Trustees found Dodge & Cox to be open, forthright, detailed, and very helpful in answering questions about all issues.
The Board received copies of the Agreements and a memorandum from the independent legal counsel to the Independent Trustees discussing the factors generally regarded as appropriate to consider in evaluating advisory arrangements. The Trust’s Contract Review Committee, consisting solely of Independent Trustees, met with the independent legal counsel on November 1, 2012, and again on December 12, 2012, to discuss whether to renew the Agreements. The Board, including the Independent Trustees, subsequently concluded that the existing Agreements are fair and reasonable and voted to approve the Agreements.
In considering the Agreements, the Board, including the Independent Trustees, did not identify any single factor or particular information as all-important or controlling. In reaching the decision to approve the
PAGE 19 § DODGE & COX BALANCED FUND
Agreements, the Board considered several factors, discussed below, to be key factors and reached the conclusions described below.
NATURE, QUALITY, AND EXTENT OF THE SERVICES
The Board considered that Dodge & Cox provides a wide range of services to the Funds in addition to portfolio management and that the quality of these services has been excellent in all respects. The extensive nature of services provided by Dodge & Cox has been documented in materials provided to the Board and in presentations made to the Board throughout the year. In particular, the Board considered the nature, quality, and extent of portfolio management, administrative, and shareholder services performed by Dodge & Cox. With regard to portfolio management services, the Board considered Dodge & Cox’s established long-term history of care and conscientiousness in the management of the Funds; its demonstrated consistency in investment approach and depth; the background and experience of the Dodge & Cox Investment Policy Committee, International Investment Policy Committee, Global Investment Policy Committee, Fixed Income Investment Policy Committee, and research analysts responsible for managing the Funds; its methods for assessing the regulatory and investment climate in various jurisdictions; Dodge & Cox’s overall high level of attention to its core investment management function; and its commitment to the Funds and their shareholders.
In the area of administrative and shareholder services, the Board considered the excellent quality of Dodge & Cox’s work in areas such as compliance, legal services, trading, proxy voting, oversight of the Funds’ transfer agent and custodian, tax compliance, and shareholder communication through its website and other means. The Board also noted Dodge & Cox’s diligent disclosure policy, its favorable compliance record, and its reputation as a trusted, shareholder-friendly mutual fund family.
In addition, the Board considered that Dodge & Cox manages approximately $120 billion in Fund assets with fewer professionals than most comparable funds, and that on average these professionals have more experience and longer tenure than investment professionals at comparable
funds. The Board also noted that Dodge & Cox is an investment research-oriented firm with no other business endeavors to distract management’s attention from its research efforts, and that its investment professionals adhere to a consistent investment approach across the Funds. The Board further considered the favorable stewardship and “Gold” analyst ratings awarded to each of the Funds by Morningstar. The Board concluded that it was satisfied with the nature, extent, and quality of investment management and other services provided to the Funds by Dodge & Cox.
INVESTMENT PERFORMANCE
The Board considered short-term and long-term investment performance for each Fund (including periods of outperformance or underperformance) as compared to both relevant indices and the performance of such Fund’s peer group. The Board also reviewed recent performance in the context of long-term investment goals. The Board noted that each Fund’s short-term (one-year) performance relative to its benchmark and peer group had improved since the previous year’s review. The Board determined after extensive review and inquiry that Dodge & Cox’s historic, long-term, team-oriented bottom up investment approach remains consistent and that Dodge & Cox continues to be distinguished by its integrity, transparency, and independence.
The Board considered that the performance of the Funds is the result of a team-oriented investment management process that emphasizes a long-term investment horizon, comprehensive independent research, price discipline, and focus. The Board also considered that the investment performance delivered by Dodge & Cox to the Funds appeared to be consistent with the relevant performance delivered for other (non-fund) clients of Dodge & Cox. The Board concluded that Dodge & Cox has delivered favorable long-term performance for Fund investors consistent with the long-term investment strategies being pursued by the Funds.
COSTS AND ANCILLARY BENEFITS
Costs of Services to Funds: Fees and Expenses. The Board considered each Fund’s management fee rate and expense ratio relative to similar mutual funds and relative to management fees charged by Dodge & Cox to other
DODGE & COX BALANCED FUND §PAGE 20
clients. In particular, the Board considered that the Funds continue to be substantially below their peer group median in expense ratios and management fee rates and that many media and industry reports specifically comment on the low expense ratios of the Funds, which have been a defining characteristic of the Funds for many years. The Board also evaluated the operating structures of the Funds and Dodge & Cox, noting that the Funds do not charge front-end sales commissions or distribution fees, and Dodge & Cox bears, among other things, the significant cost of third party research, reimbursement for recordkeeping and administrative costs to third-party retirement plan administrators, and administrative and office overhead. The Board noted that expenses are well below industry averages. The Board also considered that the Funds receive numerous administrative, regulatory compliance, and shareholder support services from Dodge & Cox without any additional administrative fee and the fact that the Funds have relatively low transaction costs and portfolio turnover rates. The Board reviewed Morningstar data showing that the few peer group funds with lower expense ratios often have other share classes with significantly higher expense ratios.
The Board reviewed information regarding the fee rates Dodge & Cox charges to separate accounts that have investment programs similar to those of the Funds, including instances where separate account fees are lower than Fund fees. The Board considered differences in the nature and scope of services Dodge & Cox provides to the Funds as compared to separate accounts, differences in regulatory, litigation, and other risks as between mutual funds and separate accounts, and certain characteristics of the market for institutional separate account management services. The Board further noted that, with respect to non-U.S. funds sponsored and managed by Dodge & Cox that are comparable to the Funds in many respects, the fee rates charged by Dodge & Cox are the same as or higher than the fee rates charged to the Funds. After consideration of these matters, the Board concluded that the overall costs incurred by the Funds for the services they receive (including the management fee paid to Dodge & Cox) are reasonable and that the fees are acceptable based upon the qualifications, experience, reputation, and performance of Dodge & Cox and the low overall expense ratios of the Funds.
Profitability and Costs of Services to Dodge & Cox; “Fall-out” Benefits. The Board reviewed reports of Dodge & Cox’s financial position, profitability, and estimated overall value, and considered Dodge & Cox’s overall profitability within its context as a private, employee-owned S-Corporation and relative to the favorable services provided. The Board noted that net revenues for 2012 are projected to decrease slightly from 2011. The Board noted in particular that Dodge & Cox’s profits are not generated by high fee rates, but reflect an extraordinarily streamlined, efficient, and focused business approach toward investment management. The Board recognized the importance of Dodge & Cox’s profitability—which is derived solely from management fees and does not include other business ventures—to maintain its independence, stability, company culture and ethics, and management continuity. The Board also considered that the compensation/profit structure at Dodge & Cox is vital for remaining independent and facilitating retention of its management and investment professionals.
The Board considered potential “fall-out” benefits (including the receipt of research from unaffiliated brokers) that Dodge & Cox might receive as a result of its association with the Funds and determined that they are not significant. The Board also noted the extent of additional administrative services performed by Dodge & Cox for the Funds, and that the magnitude of costs and risks borne by Dodge & Cox in rendering advisory services to the Funds (including risks in the regulatory compliance, securities valuation, and investment management processes) are continuing to increase. The Board concluded that the profitability of Dodge & Cox’s relationship with the Funds (including fall-out benefits) was fair and reasonable.
THE BENEFIT OF ECONOMIES OF SCALE
The Board considered whether there have been economies of scale with respect to the management of each Fund, whether the Funds have appropriately benefited from any economies of scale, and whether the management fee rate is reasonable in relation to the Fund assets and any economies of scale that may exist. In the Board’s view, any consideration of economies of scale must take account of the Funds’ low fee structure and the
PAGE 21 § DODGE & COX BALANCED FUND
considerable efficiencies of the Funds’ organization and fee structure that has been realized by shareholders from the time of each Fund’s inception (i.e., from the first dollar). The Board noted that Dodge & Cox has shared economies of scale by adding or enhancing services to the Funds over time, and that the internal costs of providing investment management, up-to-date technology, administrative, and compliance services to the Funds are continuing to increase. For example, Dodge & Cox has increased its global research staff and investment resources over the years to address the increased complexity of investing in multinational and non-U.S. companies. In addition, Dodge & Cox has made substantial expenditures in other staff and infrastructure to enable it to integrate credit and equity analyses and to be able to implement its strategy in a more effective and secure manner. The Board determined that the Funds provide access for small investors to high quality investment management at a relatively low cost. The Board’s decision to renew the Agreements was made after consideration of economies of scale and review of peer group fund expense ratios and historical expense ratio patterns for the Funds. The Board concluded that the current Dodge & Cox fee structure is fair and reasonable and adequately shares economies of scale that may exist.
CONCLUSION
Based on their evaluation of all material factors and assisted by the advice of independent legal counsel to the Independent Trustees, the Board, including the Independent Trustees, concluded that the advisory fee structure was fair and reasonable, that each Fund was paying a competitive fee for the services provided, that the scope and quality of Dodge & Cox’s services has provided substantial value for Fund shareholders over the long term, and that approval of the Agreements was in the best interests of each Fund and its shareholders.
FUND HOLDINGS
The Fund provides a complete list of its holdings four times each fiscal year, as of the end of each quarter. The Fund files the lists with the SEC on Form N-CSR (second and fourth quarters) and Form N-Q (first and third quarters). Shareholders may view the Fund’s Forms N-CSR and N-Q on the SEC’s website at www.sec.gov. Forms N-CSR and N-Q may also be reviewed and copied at the SEC’s Public Reference Room in Washington, DC. Information regarding the operations of the Public Reference Room may be obtained by calling 202-942-8090 (direct) or 800-732-0330 (general SEC number). A list of the Fund’s quarter-end holdings is also available at www.dodgeandcox.com on or about 15 days following each quarter end and remains available on the website until the list is updated in the subsequent quarter.
PROXY VOTING
For a free copy of the Fund’s proxy voting policies and procedures, please call 800-621-3979, visit the Fund’s website at www.dodgeandcox.com, or visit the SEC’s website at www.sec.gov. Information regarding how the Fund voted proxies relating to portfolio securities during the most recent 12-month period ending June 30 is also available at www.dodgeandcox.com or at www.sec.gov.
HOUSEHOLD MAILINGS
The Fund routinely mails shareholder reports and summary prospectuses to shareholders and, on occasion, proxy statements. In order to reduce the volume of mail, when possible, only one copy of these documents will be sent to shareholders who are part of the same family and share the same residential address.
If you have a direct account with the Funds and you do not want the mailing of shareholder reports and summary prospectuses combined with other members in your household, contact the Funds at 800-621-3979. Your request will be implemented within 30 days.
DODGE & COX BALANCED FUND §PAGE 22
DODGE & COX FUNDS—EXECUTIVE OFFICER & TRUSTEE INFORMATION
| | | | | | |
Name (Age) and
Address* | | Position with Trust (Year of Election or
Appointment) | | Principal Occupation During Past 5 Years | | Other Directorships Held by Trustees |
| INTERESTED TRUSTEES AND OFFICERS |
| Kenneth E. Olivier (60) | | Chairman, President, and Trustee (Trustee since 2005) | | Chairman (since 2011), Chief Executive Officer (since 2010), President (until 2011), and Director of Dodge & Cox; Portfolio Manager and member of Investment Policy Committee (IPC) | | — |
| Dana M. Emery (51) | | Senior Vice President and Trustee (Trustee since 1993) | | Co-President (since 2011), Executive Vice President (until March 2011), and Director of Dodge & Cox; Director of Fixed Income, Portfolio Manager, and member of Fixed Income Investment Policy Committee (FIIPC) | | — |
| John A. Gunn (69) | | Trustee (Trustee since 1985) | | Chairman Emeritus (since 2011), Chairman (2007-2011), Chief Executive Officer (2007-2010), and Director of Dodge & Cox; Portfolio Manager and member of IPC, Global Investment Policy Committee (GIPC) (since 2008), International Investment Policy Committee (IIPC), and FIIPC (until 2008) | | — |
| Charles F. Pohl (54) | | Senior Vice President (Officer since 2004) | | Co-President (since 2011), Senior Vice President (until 2011), and Director of Dodge & Cox; Chief Investment Officer (since 2007), Director of Credit Research, Portfolio Manager, Investment Analyst, and member of IPC, GIPC (since 2008), IIPC (since 2007), and FIIPC | | — |
| Diana S. Strandberg (53) | | Senior Vice President (Officer since 2006) | | Senior Vice President (since 2011), Vice President (until 2011), and Director (since 2011) of Dodge & Cox; Director of International Equity (since 2009), Portfolio Manager, Investment Analyst, and member of IPC, GIPC (since 2008), and IIPC | | — |
| David H. Longhurst (55) | | Treasurer (Officer since 2006) | | Vice President (since 2008) and Assistant Treasurer (since 2007) of Dodge & Cox; Fund Administration and Accounting Senior Manager (until 2007) | | — |
| Thomas M. Mistele (59) | | Secretary (Officer since 1998) | | Chief Operating Officer, Director, Secretary, Senior Counsel (since 2011), and General Counsel (until 2011) of Dodge & Cox | | — |
| Katherine M. Primas (37) | | Chief Compliance Officer (Officer since 2009) | | Chief Compliance Officer (since 2008) and Associate Chief Compliance Officer of Dodge & Cox (until 2008) | | — |
| INDEPENDENT TRUSTEES |
| L. Dale Crandall (71) | | Trustee (Since 1999) | | President, Piedmont Corporate Advisors, Inc. (since 2003); President, Kaiser Foundation Health Plan, Inc. and Kaiser Foundation Hospitals (2000-2002); Senior Vice President—Finance and Administration & CFO, Kaiser Foundation Health Plan, Inc. and Kaiser Foundation Hospitals (1998-2000) | | Director, Ansell Limited (medical equipment and supplies) (2002-present); Director, Coventry Health Care, Inc. (managed health care) (2004-present); Bridgepoint Education, Inc. (education services) (2008-present) |
| Thomas A. Larsen (63) | | Trustee (Since 2002) | | Senior Counsel of Arnold & Porter LLP (law firm) (since 2012); Director of Howard, Rice, Nemerovski, Canady, Falk & Rabkin (1977-2011) | | — |
| Ann Mather (52) | | Trustee (Since 2011) | | CFO, Pixar Animation Studios (1999-2004) | | Director, Google, Inc. (internet information services) (2005-present); Director, Glu Mobile, Inc. (multimedia software) (2005-present); Director, Netflix, Inc. (video services) (2010-present); Director, MoneyGram International, Inc. (business services) (2010-present); Director, Solazyme Inc. (renewable oils) (since 2011) |
| Robert B. Morris III (60) | | Trustee (Since 2011) | | Advisory Director, The Presidio Group (previously Presidio Financial Partners) (since 2005) | | — |
| John B. Taylor (66) | | Trustee (Since 2005) (and 1998-2001) | | Professor of Economics, Stanford University; Senior Fellow, Hoover Institution; Under Secretary for International Affairs, United States Treasury (2001-2005) | | — |
| * | | The address for each Officer and Trustee is 555 California Street, 40th Floor, San Francisco, California 94104. Each Officer and Trustee oversees all five series in the Dodge & Cox Funds complex and serves for an indefinite term. |
Additional information about the Trust’s Trustees and Officers is available in the Trust’s Statement of Additional Information (SAI). You can get a free copy of the SAI by visiting the Funds’ website at www.dodgeandcox.com or calling
1-800-621-3979.
PAGE 23 § DODGE & COX BALANCED FUND
| | | | |
| | | | |
www.dodgeandcox.com
For Fund literature, transactions, and account
information, please visit the Funds’ website.
or write or call:
DODGE & COX FUNDS
c/o Boston Financial Data Services
P.O. Box 8422
Boston, Massachusetts 02266-8422
(800) 621-3979
INVESTMENT MANAGER
Dodge & Cox
555 California Street, 40th Floor
San Francisco, California 94104
(415) 981-1710
This report is submitted for the general information of the shareholders of the Fund. The report is not authorized for distribution to prospective investors in the Fund unless it is accompanied by a current prospectus.
This report reflects our views, opinions, and portfolio holdings as of December 31, 2012, the end of the reporting period. Any such views are subject to change at any time based upon market or other conditions and Dodge & Cox disclaims any responsibility to update such views. These views may not be relied on as investment advice and, because investment decisions for a Dodge & Cox Fund are based on numerous factors, may not be relied on as an indication of trading intent on behalf of any Dodge & Cox Fund.
12/12 IF AR Printed on recycled paper
Annual Report
December 31, 2012
Income Fund
ESTABLISHED 1989
TICKER: DODIX
TO OUR SHAREHOLDERS
The Dodge & Cox Income Fund had a total return of 3.5% for the six months ending December 31, 2012, compared to a return of 1.8% for the Barclays U.S. Aggregate Bond Index (Barclays U.S. Aggregate). For 2012, the Fund had a total return of 7.9%, compared to 4.2% for the Barclays U.S. Aggregate. At year end, the Fund had net assets of $26.5 billion with a cash position of 2.0%.
MARKET COMMENTARY
The resilient U.S. economy and accommodative actions by U.S. and European policymakers increased investor confidence during 2012. This confidence drove demand for risk assets such as investment-grade corporate bonds (9.8% return)(a) and equities (16.0% S&P 500 return), both of which posted their highest annual returns since 2009. Conversely, the U.S. Treasury sector returned just 2.0% in 2012, reflecting extremely low yields for the sector and superior return opportunities elsewhere. Within the Corporate sector, returns from Financial Institutions (14.7% return) strongly outpaced those of the Industrials (7.6%) and Utility (7.5%) sub-sectors. Companies continued to tap the new issue market, resulting in a record year for new investment-grade corporate bond issuance. Agency-guaranteed mortgage-backed securities(b) (MBS) returned 2.6% as a sector, although there was considerable variability in returns within the MBS universe. Lower-coupon MBS outperformed higher coupons as changes to the Home Affordable Refinance Program (HARP) simplified the refinancing process and led to higher prepayment rates among higher coupon MBS. The majority of the MBS universe remained vulnerable to refinancing with mortgage rates near historic lows.
The U.S. economy grew modestly (2.2% estimated 2012 GDP growth), and both the U.S. labor and housing markets appeared to be experiencing long-awaited recoveries. The unemployment rate declined to a nearly four-year low of 7.8%, and the housing sector transitioned from a drag to a contributor to U.S. GDP growth. The Federal Reserve continued to utilize “extraordinary actions” throughout the year (e.g., “QE3,” “Operation Twist”) to drive down long-term interest rates and also
offered greater policy transparency through the announcement of target thresholds (e.g., 6.5% unemployment rate or higher; 2.5% inflation rate or lower) for maintaining its accommodative policies. Congress reached a last-minute deal to avert the most contractionary elements of the U.S. “fiscal cliff,” but early 2013 will bring fresh wrangling over the U.S. budget and the debt ceiling.
INVESTMENT STRATEGY
The Fund generated strong performance in 2012 in both absolute and relative terms. The seeds for this performance result were planted well before the year began, as we took advantage of significant market dislocations in 2011 and earlier to establish or add to many Fund holdings at attractive entry points. The changes we made to Fund strategy in the second half of 2011 and in 2012, combined with the longstanding key themes in the Fund, meant it was well positioned for the vastly improved market environment that followed.
Then, as now, we relied on the key elements of our investment approach, namely in-depth fundamental security-level research conducted by our experienced investment team, a long-term investment perspective, and a focus on relative value within and across sectors. These fundamental tenets—the hallmarks of Dodge & Cox—are critical in challenging market environments. Taken together, they provide the necessary confidence for us to make investments in areas where market pricing suggests greater relative risk; however, we often view these moments as offering compelling long-term opportunity. In the following sections, we describe a number of these portfolio themes and the incremental adjustments we made to Fund strategy in response to changes in investment fundamentals and/or relative valuations.
Reduction to MBS Portfolio—Declining Fundamentals, Higher Valuations
We made the biggest strategy shift in the MBS sector, reducing the Fund’s weighting from 41% at the beginning of the year to 29% at year end. Almost all of this reduction occurred in the first half of the year as we identified changes to U.S. mortgage financing policy that could
PAGE 1 § DODGE & COX INCOME FUND
meaningfully increase the prepayment rates (a key risk facing MBS investors) of a portion of the Fund’s holdings.
The Fund’s MBS, all Agency-guaranteed, generally have higher coupons and shorter durations(c) than those within the Barclays U.S. Aggregate; in addition, many of the Fund’s MBS have lower loan balances, and others have more challenged borrower credit profiles such as high loan-to-value ratios and low credit scores. From 2008 through the end of 2011, characteristics associated with this latter group provided significant prepayment protection because these borrowers were unable to refinance. As a result, the Fund was able to benefit from the above-market coupons of these MBS for a longer period. Recent policy changes, however, substantially weakened this protection. At the same time, given Fed policy to purchase the vast majority of new origination and other MBS, prices on all MBS remained high; this provided us with an opportunity to reduce the Fund’s MBS weighting significantly.
The remaining MBS in the Fund continue to fulfill an important portfolio role, which is to provide incremental yield, relative duration stability, high credit quality, and long-term return prospects that we believe are better than short-duration investment alternatives.
Higher Corporate Bond Valuations, But Opportunities Remain
More than 75% of the Fund’s absolute return in 2012—and the majority of its relative return—was generated by holdings within the Corporate sector. Corporate yield premiums in the Barclays U.S. Aggregate began the year at 234 basis points(d) (bps) above Treasuries and contracted to 141 bps by year end. This rally was driven partly by improvements in corporate fundamentals (which were already strong given improved profit margins, stronger liquidity, and lower leverage), but mostly by a significant change in market sentiment. The actions by central banks and policymakers in the United States and Europe fostered market confidence and created a greater willingness to invest in riskier assets (and a disincentive to invest in low yielding, less risky assets). The repricing of corporate bond risk was most pronounced among lower-rated, bank, and European-domiciled holdings, where
valuations had declined substantially in the uncertain market environment of late 2011. These are also areas where we have built significant Fund positions over time. The Fund’s corporate holdings in aggregate returned 14.2% in 2012, compared to 9.8% for the Barclays Corporate Index.
Although the Fund’s corporate weighting, 47% at year end, did not change meaningfully, we made a number of adjustments to Fund strategy throughout 2012. We reduced the Fund’s bank weighting by about two percentage points in the second half of 2012 through a combination of market sales and direct sales back to several UK bank issuers (tender offers announced by Barclays, Lloyds, and Royal Bank of Scotland) at high prices. After doubling the Fund’s bank weighting over the past five years (to 12% in mid-2012), we used these opportunities to reduce the magnitude of our overweight position after strong performance. We also identified a number of interesting investments(e) in securities of non-U.S. issuers in 2012, including Petrobras and Korean Import-Export Bank, among others. Our team of global industry analysts, a critical shared resource for the equity and fixed income investment teams, plays an essential role in our investment process. This integration opens up the opportunity set considerably, creating an important advantage in the current low-yielding market environment.
Corporate yield premiums narrowed considerably in 2012, but we continue to see ample long-term opportunity among the Fund’s corporate holdings. Informing our view is the combination of stronger corporate credit profiles and the attractive incremental yield above Treasuries (e.g., the Fund’s corporate holdings yielded 3.1% at year-end, compared to 1.0% for a similar-duration Treasury). Of course, downside risk analysis becomes ever more important in a low-yielding market environment such as this. We believe this type of environment plays to our strengths as an organization. Our investment team analyzes the creditworthiness of the Fund’s corporate holdings, continuously asking “what can go wrong?” Our downside scenario will typically assume an adverse macroeconomic backdrop, declining profitability, and constrained access to the capital markets, among other
DODGE & COX INCOME FUND §PAGE 2
company-specific scenarios. In addition, the Fund’s corporate holdings are well diversified, with 53 corporate issuers spanning over 15 distinct industries and 10 countries.
Low Interest Rates = Play Good Defense
We have positioned the Fund with an effective duration that is 72% of the Barclays U.S. Aggregate’s duration, down from 78% a year ago. We believe this defensive positioning vis-à-vis interest rate risk remains prudent. The general level of interest rates is near historic lows—for example, the yield on the Barclays U.S. Aggregate is near an all-time low of 1.7%, and Treasury securities with maturities under ten years offer negative real (inflation-adjusted) yields. These levels do not seem sustainable over our investment horizon given the reasonably solid footing of the U.S. economy, accommodative U.S. and global monetary policies that have been in place for several years, and investors’ need for positive, inflation-adjusted returns. In addition, we believe this positioning is appropriate from a risk-reward perspective: with today’s low rates, it would take only a modest uptick in rates over a one-year timeframe to overwhelm earned income and produce a negative return. For example, the 10-year Treasury would need to rise by just 20 bps to create a negative annual return over the next year, and the 30-year Treasury by only 13 bps.
The Fund is positioned defensively in other ways as well. For example, the Fund has a far greater proportion of securities maturing in the next three years than the Barclays U.S. Aggregate. In addition, many of the Fund’s MBS should produce substantial monthly cash flow, and their durations should remain relatively stable in a rising rate environment.
IN CLOSING
While we are very pleased to have delivered a strong return for Fund shareholders in 2012, we advise you to temper your near-term total return expectations. With
Treasury rates still near historic lows and much less compelling valuations for non-Government sectors, future total returns seem likely to be dependent upon market yields, which are quite low. Notwithstanding the challenged return prospects in the near term, we believe bonds play an important role in an investment portfolio. Bonds provide diversification, liquidity, income, and downside protection—vital characteristics for any diversified portfolio.
Thank you for your continued confidence in our firm. As always, we welcome your comments and questions.
For the Board of Trustees,
| | |
| |
|
Kenneth E. Olivier, Chairman and President | | Dana M. Emery, Senior Vice President |
January 29, 2013
| (a) | | Sector returns as calculated and reported by Barclays. |
| (b) | | The U.S. Government does not guarantee the Fund’s shares, yield, or net asset value. The agency guarantee (by, for example, Ginnie Mae, Fannie Mae, or Freddie Mac) does not eliminate market risk. |
| (c) | | Duration is the measure of a bond’s (or bond portfolio’s) price sensitivity to changes in interest rates. |
| (d) | | One basis point (bps) is equal to 1/100th of 1%. |
| (e) | | The use of specific examples does not imply that they are more attractive investments than the Fund’s other holdings. |
Risks: The Fund invests in individual bonds whose yields and market values fluctuate, so that your investment may be worth more or less than its original cost. Bond investments are subject to interest rate risk, credit risk, and prepayment risk, all of which could have adverse effects on the value of the Fund. A low interest rate environment creates an elevated risk of future negative returns. Please read the prospectus and summary prospectus for specific details regarding the Fund’s risk profile.
PAGE 3 § DODGE & COX INCOME FUND
ANNUAL PERFORMANCE REVIEW
Key Contributors to Relative Results
| | § | | The Fund’s substantial overweight to corporate bonds (and in particular the large overweight to Financial Institutions) strongly benefited relative returns. | |
| | § | | Many of the Fund’s Financial sector and lower-rated corporate holdings performed extremely well, including AIG, Bank of America, Citigroup floating-rate notes, HSBC, Royal Bank of Scotland, SLM Corp., Sprint Nextel, and Telecom Italia, among others. | |
| | § | | The Fund’s nominal yield advantage added to relative returns. | |
| | § | | The Fund’s taxable municipal holdings performed extremely well in 2012. | |
Key Detractors from Relative Results
| | § | | The Fund’s Agency MBS holdings outpaced short-maturity Treasuries in 2012 but lagged the returns of comparable-duration credit securities as well as lower-coupon MBS. | |
KEY CHARACTERISTICS OF DODGE & COX
Independent Organization
Dodge & Cox is one of the largest privately owned investment managers in the world. We remain committed to independence, with a goal of providing the highest quality investment management service to our existing clients.
Over 80 Years of Investment Experience
Dodge & Cox was founded in 1930. We have a stable and well-qualified team of investment professionals, most of whom have spent their entire careers at Dodge & Cox.
Experienced Investment Team
The Fixed Income Investment Policy Committee, which is the decision-making body for the Income Fund, is a ten-member committee with an average tenure at Dodge & Cox of 17 years.
One Business with a Single Research Office
Dodge & Cox manages domestic, international, and global equity, fixed income, and balanced investments, operating from one office in San Francisco.
Consistent Investment Approach
Our team decision-making process involves thorough, bottom-up fundamental analysis of each investment.
Long-Term Focus and Low Expenses
We invest with a three- to five-year investment horizon, which has historically resulted in low turnover relative to our peers. We manage Funds that maintain low expense ratios.
DODGE & COX INCOME FUND §PAGE 4
GROWTH OF $10,000 OVER 10 YEARS
FOR AN INVESTMENT MADE ON DECEMBER 31, 2002

AVERAGE ANNUAL TOTAL RETURN
FOR PERIODS ENDED DECEMBER 31, 2012
| | | | | | | | | | | | | | | | |
| | | 1 Year | | | 5 Years | | | 10 Years | | | 20 Years | |
| | | | | | | | | | | | | | | | |
Dodge & Cox Income Fund | | | 7.94 | % | | | 7.00 | % | | | 5.64 | % | | | 6.79 | % |
Barclays U.S. Aggregate
Bond Index (Barclays U.S. Agg) | | | 4.23 | | | | 5.96 | | | | 5.19 | | | | 6.34 | |
Returns represent past performance and do not guarantee future results. Investment return and share price will fluctuate with market conditions, and investors may have a gain or loss when shares are sold. Fund performance changes over time and currently may be significantly lower than stated. Performance is updated and published monthly. Visit the Fund’s website at www.dodgeandcox.com or call 800-621-3979 for current performance figures.
The Fund’s total returns include the reinvestment of dividend and capital gain distributions, but have not been adjusted for any income taxes payable by shareholders on these distributions or on Fund share redemptions. Index returns include interest income but, unlike Fund returns, do not reflect fees or expenses. The Barclays U.S. Aggregate Bond Index (Barclays U.S. Agg) is a widely recognized, unmanaged index of U.S. dollar-denominated, investment-grade, taxable fixed income securities.
Barclays® is a trademark of Barclays Bank PLC.
FUND EXPENSE EXAMPLE
As a Fund shareholder, you incur ongoing Fund costs, including management fees and other Fund expenses. All mutual funds have ongoing costs, sometimes referred to as operating expenses. The following example shows ongoing costs of investing in the Fund and can help you understand these costs and compare them with those of other mutual funds. The example assumes a $1,000 investment held for the six months indicated.
ACTUAL EXPENSES
The first line of the table below provides information about actual account values and expenses based on the Fund’s actual returns. You may use the information in this line, together with your account balance, to estimate the expenses that you paid over the period. Simply divide your account value by $1,000 (for example, an $8,600 account value divided by $1,000 = 8.6), then multiply the result by the number in the first line under the heading “Expenses Paid During Period” to estimate the expenses you paid on your account during this period.
HYPOTHETICAL EXAMPLE FOR COMPARISON WITH OTHER MUTUAL FUNDS
Information on the second line of the table can help you compare ongoing costs of investing in the Fund with those of other mutual funds. This information may not be used to estimate the actual ending account balance or expenses you paid during the period. The hypothetical “Ending Account Value” is based on the actual expense ratio of the Fund and an assumed 5% annual rate of return before expenses (not the Fund’s actual return). The amount under the heading “Expense Paid During the Period” shows the hypothetical expenses your account would have incurred under this scenario. You can compare this figure with the 5% hypothetical examples that appear in shareholder reports of other mutual funds.
| | | | | | | | | | | | |
Six Months Ended December 31, 2012 | | Beginning Account Value
7/1/2012 | | | Ending Account Value
12/31/2012 | | | Expenses Paid
During Period* | |
Based on Actual Fund Return | | $ | 1,000.00 | | | $ | 1,034.90 | | | $ | 2.19 | |
Based on Hypothetical 5% Yearly Return | | | 1,000.00 | | | | 1,022.99 | | | | 2.17 | |
| * | | Expenses are equal to the Fund’s annualized expense ratio of 0.43%, multiplied by the average account value over the period, multiplied by 184/366 (to reflect the one-half year period). |
The expenses shown in the table highlight ongoing costs only and do not reflect any transactional fees or account maintenance fees. While other mutual funds may charge such fees, please note that the Fund does not charge transaction fees (e.g., redemption fees, sales loads) or universal account maintenance fees (e.g., small account fees).
PAGE 5 § DODGE & COX INCOME FUND
| | | | |
| FUND INFORMATION | | | December 31, 2012 | |
| | | | |
| GENERAL INFORMATION | | | |
Net Asset Value Per Share | | | $13.86 | |
Total Net Assets (billions) | | | $26.5 | |
30-Day SEC Yield(a) | | | 2.15% | |
Expense Ratio | | | 0.43% | |
Portfolio Turnover Rate | | | 26% | |
Fund Inception | | | 1989 | |
No sales charges or distribution fees | | | | |
Investment Manager: Dodge & Cox, San Francisco. Managed by the Fixed Income Investment Policy Committee, whose ten members’ average tenure at Dodge & Cox is 17 years.
| | | | | | | | |
| PORTFOLIO CHARACTERISTICS | | Fund | | | Barclays U.S. Agg | |
Number of Fixed Income Securities | | | 686 | | | | 8,079 | |
Effective Maturity (years)(b) | | | 6.6 | | | | 7.0 | |
Effective Duration (years)(c) | | | 3.7 | | | | 5.1 | |
| | | | |
| FIVE LARGEST CORPORATE ISSUERS (%)(d) | | Fund | |
Bank of America Corp. | | | 2.5 | |
Citigroup, Inc. | | | 2.3 | |
Time Warner, Inc. | | | 1.8 | |
Ford Motor Credit Co. | | | 1.7 | |
Dow Chemical Co. | | | 1.7 | |
| | | | | | | | |
| CREDIT QUALITY (%)(e) | | Fund | | | Barclays U.S. Agg | |
U.S. Government & U.S. Agency/MBS(b) | | | 42.5 | | | | 70.9 | |
Aaa | | | 1.2 | | | | 3.8 | |
Aa | | | 2.2 | | | | 3.5 | |
A | | | 17.3 | | | | 11.0 | |
Baa | | | 26.9 | | | | 10.8 | |
Ba | | | 4.5 | | | | 0.0 | |
B | | | 3.4 | | | | 0.0 | |
Cash Equivalents | | | 2.0 | | | | 0.0 | |
ASSET ALLOCATION
| | | | | | | | |
| SECTOR DIVERSIFICATION (%) | | Fund | | | Barclays U.S. Agg | |
U.S. Treasury(b) | | | 12.7 | | | | 36.4 | |
Government-Related | | | 8.7 | | | | 10.3 | |
Mortgage-Related | | | 28.9 | | | | 29.6 | |
Corporate | | | 46.5 | | | | 21.5 | |
Asset-Backed/Commercial
Mortgage-Backed(f) | | | 1.2 | | | | 2.2 | |
Cash Equivalents | | | 2.0 | | | | 0.0 | |
| | | | | | | | |
| MATURITY DIVERSIFICATION (%) | | Fund | | | Barclays U.S. Agg | |
0-1 Years to Maturity | | | 8.5 | | | | 0.0 | |
1-5 | | | 52.4 | | | | 57.8 | |
5-10(b) | | | 23.8 | | | | 29.4 | |
10-15 | | | 0.5 | | | | 1.5 | |
15-20 | | | 5.1 | | | | 1.7 | |
20-25 | | | 4.9 | | | | 2.4 | |
25 and Over | | | 4.8 | | | | 7.2 | |
| (a) | | SEC Yield is an annualization of the Fund’s total net investment income per share for the 30-day period ended on the last day of the month. |
| (b) | | Data as presented excludes the effect of the Fund’s short position in 10-year Treasury futures contracts (notional value = 7.8% of the Fund’s net assets). If exposure to Treasury futures contracts had been included, the effective maturity would be 0.5 years lower. |
| (c) | | Data as presented includes the effect of Treasury futures contracts. |
| (d) | | The Fund’s portfolio holdings are subject to change without notice. The mention of specific securities is not a recommendation to buy, sell, or hold any particular security and is not indicative of Dodge & Cox’s current or future trading activity. |
| (e) | | The credit quality distributions shown for the Fund and the Index are based on the middle of Moody’s, Standard & Poor’s, and Fitch ratings, which is the methodology used by Barclays in constructing its indices. If a security is rated by only two agencies, the lower of the two ratings is used. Please note the Fund applies the highest of Moody’s, Standard & Poor’s, and Fitch ratings to comply with the quality requirements stated in its prospectus. On that basis, the Fund held 72.8% in securities rated A- or better and 7.5% in securities rated below investment grade. The credit quality of the investments in the portfolio does not apply to the stability or safety of the Fund or its shares. |
| (f) | | Commercial mortgage-backed securities are a component of the Barclays U.S. Agg but are not currently held by the Fund. |
DODGE & COX INCOME FUND §PAGE 6
| | | | |
| PORTFOLIO OF INVESTMENTS | | | December 31, 2012 | |
| | | | | | | | |
| FIXED INCOME SECURITIES: 98.0% | |
| | |
| | | PAR VALUE | | | VALUE | |
| U.S. TREASURY: 12.7% | | | | | | | | |
U.S. Treasury Note | | | | | | | | |
0.625%, 1/31/13 | | $ | 55,710,000 | | | $ | 55,731,783 | |
0.625%, 2/28/13 | | | 196,360,000 | | | | 196,528,673 | |
0.625%, 4/30/13 | | | 147,980,000 | | | | 148,240,149 | |
0.375%, 7/31/13 | | | 201,605,000 | | | | 201,888,457 | |
0.75%, 8/15/13 | | | 299,540,000 | | | | 300,663,275 | |
0.50%, 10/15/13 | | | 301,675,000 | | | | 302,452,718 | |
0.25%, 10/31/13 | | | 303,285,000 | | | | 303,474,553 | |
0.25%, 1/31/14 | | | 300,100,000 | | | | 300,287,562 | |
0.25%, 4/30/14 | | | 397,060,000 | | | | 397,230,736 | |
1.00%, 5/15/14 | | | 365,000,000 | | | | 368,906,595 | |
0.25%, 6/30/14 | | | 400,000,000 | | | | 400,156,400 | |
0.125%, 7/31/14 | | | 400,000,000 | | | | 399,328,000 | |
| | | | | | | | |
| | | | | | | 3,374,888,901 | |
| GOVERNMENT-RELATED: 8.7% | | | | | |
FEDERAL AGENCY: 0.9% | | | | | | | | |
Arkansas Dev. Fin. Auth. GNMA Guaranteed Bonds
9.75%, 11/15/14 | | | 19,389 | | | | 19,679 | |
Small Business Administration — 504 Program | |
Series 93-20B, 7.00%, 2/1/13 | | | 25,214 | | | | 25,389 | |
Series 93-20C, 6.50%, 3/1/13 | | | 129,893 | | | | 131,268 | |
Series 93-20D, 6.75%, 4/1/13 | | | 31,175 | | | | 31,630 | |
Series 93-20E, 6.55%, 5/1/13 | | | 177,919 | | | | 181,326 | |
Series 93-20F, 6.65%, 6/1/13 | | | 43,161 | | | | 44,196 | |
Series 93-20L, 6.30%, 12/1/13 | | | 143,011 | | | | 146,703 | |
Series 94-20A, 6.50%, 1/1/14 | | | 220,087 | | | | 224,753 | |
Series 94-20D, 7.70%, 4/1/14 | | | 45,859 | | | | 47,370 | |
Series 94-20E, 7.75%, 5/1/14 | | | 241,750 | | | | 250,872 | |
Series 94-20F, 7.60%, 6/1/14 | | | 138,299 | | | | 143,424 | |
Series 94-20G, 8.00%, 7/1/14 | | | 165,629 | | | | 171,884 | |
Series 94-20H, 7.95%, 8/1/14 | | | 83,331 | | | | 86,386 | |
Series 94-20I, 7.85%, 9/1/14 | | | 67,263 | | | | 69,586 | |
Series 94-20K, 8.65%, 11/1/14 | | | 90,376 | | | | 94,605 | |
Series 94-20L, 8.40%, 12/1/14 | | | 55,577 | | | | 58,219 | |
Series 95-20A, 8.50%, 1/1/15 | | | 41,918 | | | | 44,411 | |
Series 95-20C, 8.10%, 3/1/15 | | | 87,422 | | | | 91,076 | |
Series 97-20E, 7.30%, 5/1/17 | | | 188,524 | | | | 202,772 | |
Series 97-20H, 6.80%, 8/1/17 | | | 44,665 | | | | 48,172 | |
Series 97-20J, 6.55%, 10/1/17 | | | 447,780 | | | | 485,009 | |
Series 97-20L, 6.55%, 12/1/17 | | | 19,852 | | | | 21,654 | |
Series 98-20B, 6.15%, 2/1/18 | | | 63,075 | | | | 68,374 | |
Series 98-20C, 6.35%, 3/1/18 | | | 1,645,340 | | | | 1,792,151 | |
Series 98-20H, 6.15%, 8/1/18 | | | 729,506 | | | | 794,464 | |
Series 98-20L, 5.80%, 12/1/18 | | | 419,238 | | | | 457,541 | |
Series 99-20C, 6.30%, 3/1/19 | | | 430,936 | | | | 477,541 | |
Series 99-20E, 6.30%, 5/1/19 | | | 11,037 | | | | 12,233 | |
Series 99-20G, 7.00%, 7/1/19 | | | 1,079,051 | | | | 1,193,484 | |
Series 99-20I, 7.30%, 9/1/19 | | | 314,575 | | | | 350,544 | |
Series 00-20C, 7.625%, 3/1/20 | | | 23,253 | | | | 25,765 | |
Series 00-20G, 7.39%, 7/1/20 | | | 16,083 | | | | 18,050 | |
Series 01-20G, 6.625%, 7/1/21 | | | 3,625,508 | | | | 4,054,945 | |
| | | | | | | | |
| FIXED INCOME SECURITIES: 98.0% | |
| | |
| | | PAR VALUE | | | VALUE | |
Series 01-20L, 5.78%, 12/1/21 | | $ | 8,324,943 | | | $ | 9,234,093 | |
Series 02-20A, 6.14%, 1/1/22 | | | 60,174 | | | | 66,859 | |
Series 02-20L, 5.10%, 12/1/22 | | | 2,468,738 | | | | 2,745,049 | |
Series 03-20G, 4.35%, 7/1/23 | | | 156,822 | | | | 171,856 | |
Series 04-20L, 4.87%, 12/1/24 | | | 3,657,755 | | | | 4,120,532 | |
Series 05-20B, 4.625%, 2/1/25 | | | 5,399,434 | | | | 6,036,915 | |
Series 05-20D, 5.11%, 4/1/25 | | | 262,851 | | | | 295,877 | |
Series 05-20E, 4.84%, 5/1/25 | | | 9,306,985 | | | | 10,424,430 | |
Series 05-20G, 4.75%, 7/1/25 | | | 9,361,501 | | | | 10,421,000 | |
Series 05-20H, 5.11%, 8/1/25 | | | 116,494 | | | | 130,635 | |
Series 05-20I, 4.76%, 9/1/25 | | | 10,202,560 | | | | 11,388,385 | |
Series 06-20A, 5.21%, 1/1/26 | | | 11,380,000 | | | | 12,786,184 | |
Series 06-20B, 5.35%, 2/1/26 | | | 3,309,446 | | | | 3,773,166 | |
Series 06-20C, 5.57%, 3/1/26 | | | 15,830,664 | | | | 18,188,993 | |
Series 06-20G, 6.07%, 7/1/26 | | | 28,083,752 | | | | 32,395,145 | |
Series 06-20H, 5.70%, 8/1/26 | | | 221,190 | | | | 254,522 | |
Series 06-20I, 5.54%, 9/1/26 | | | 480,194 | | | | 551,001 | |
Series 06-20J, 5.37%, 10/1/26 | | | 9,156,501 | | | | 10,486,367 | |
Series 06-20L, 5.12%, 12/1/26 | | | 7,244,299 | | | | 8,155,603 | |
Series 07-20A, 5.32%, 1/1/27 | | | 15,092,843 | | | | 17,356,092 | |
Series 07-20C, 5.23%, 3/1/27 | | | 24,128,573 | | | | 27,320,646 | |
Series 07-20D, 5.32%, 4/1/27 | | | 24,428,433 | | | | 28,090,033 | |
Series 07-20G, 5.82%, 7/1/27 | | | 16,171,034 | | | | 18,729,993 | |
| | | | | | | | |
| | | | | | | 244,988,852 | |
FOREIGN AGENCY: 1.1% | | | | | | | | |
Export-Import Bank of Korea(c) (South Korea)
4.00%, 1/11/17 | | | 147,770,000 | | | | 160,233,069 | |
Petroleo Brasileiro SA(c) (Brazil) | | | | | | | | |
5.75%, 1/20/20 | | | 29,370,000 | | | | 33,433,516 | |
5.375%, 1/27/21 | | | 84,465,000 | | | | 95,092,386 | |
| | | | | | | | |
| | | | | | | 288,758,971 | |
LOCAL AUTHORITY: 6.7% | | | | | | | | |
California Taxable General Obligation | | | | | | | | |
5.25%, 4/1/14 | | | 15,470,000 | | | | 16,308,783 | |
6.20%, 3/1/19 | | | 6,305,000 | | | | 7,602,317 | |
6.20%, 10/1/19 | | | 19,860,000 | | | | 24,206,758 | |
7.50%, 4/1/34 | | | 144,405,000 | | | | 200,831,254 | |
7.55%, 4/1/39 | | | 257,273,000 | | | | 370,936,211 | |
7.30%, 10/1/39 | | | 113,875,000 | | | | 157,796,587 | |
7.625%, 3/1/40 | | | 54,405,000 | | | | 78,598,904 | |
7.60%, 11/1/40 | | | 25,235,000 | | | | 36,865,054 | |
Illinois Taxable General Obligation | | | | | | | | |
4.961%, 3/1/16 | | | 54,805,000 | | | | 60,028,465 | |
5.365%, 3/1/17 | | | 187,320,000 | | | | 210,008,198 | |
5.665%, 3/1/18 | | | 166,930,000 | | | | 190,181,680 | |
Los Angeles Unified School District Taxable General Obligation | | | | | | | | |
5.75%, 7/1/34 | | | 1,830,000 | | | | 2,194,060 | |
6.758%, 7/1/34 | | | 133,845,000 | | | | 178,654,968 | |
New Jersey State Turnpike Authority Revenue Bonds 7.102%, 1/1/41 | | | 159,460,000 | | | | 229,834,482 | |
| | |
| PAGE 7 § DODGE & COX INCOME FUND | | See accompanying Notes to Financial Statements |
| | | | |
PORTFOLIO OF INVESTMENTS | | | December 31, 2012 | |
| | | | | | | | |
| FIXED INCOME SECURITIES: 98.0% | |
| | |
| | | PAR VALUE | | | VALUE | |
New Valley Generation V
4.929%, 1/15/21 | | $ | 443,229 | | | $ | 512,077 | |
| | | | | | | | |
| | | | | | | 1,764,559,798 | |
| | | | | | | | |
| | | | | | | 2,298,307,621 | |
| MORTGAGE-RELATED: 28.9% | | | | | |
FEDERAL AGENCY CMO & REMIC: 3.5% | | | | | |
Dept. of Veterans Affairs | | | | | | | | |
Trust 1995-2D 4A, 9.293%, 5/15/25 | | | 197,799 | | | | 238,766 | |
Trust 1997-2Z, 7.50%, 6/15/27 | | | 16,023,944 | | | | 19,104,355 | |
Trust 1998-2 2A PT,
8.772%, 8/15/27 | | | 56,589 | | | | 68,956 | |
Trust 1998-1 1A, 8.218%, 3/15/28 | | | 436,035 | | | | 512,187 | |
Fannie Mae | | | | | | | | |
Trust 1998-58 PX, 6.50%, 9/25/28 | | | 897,800 | | | | 1,025,480 | |
Trust 1998-58 PC, 6.50%, 10/25/28 | | | 4,983,844 | | | | 5,695,776 | |
Trust 2001 T-5 A2,
6.991%, 2/19/30 | | | 70,983 | | | | 84,381 | |
Trust 2001-T5 A3, 7.50%, 6/19/30 | | | 340,751 | | | | 414,250 | |
Trust 2001-69 PQ, 6.00%, 12/25/31 | | | 5,965,863 | | | | 6,736,927 | |
Trust 2002-33 A1, 7.00%, 6/25/32 | | | 3,337,780 | | | | 3,909,121 | |
Trust 2002-69 Z, 5.50%, 10/25/32 | | | 984,001 | | | | 1,104,090 | |
Trust 2008-24 GD, 6.50%, 3/25/37 | | | 9,639,437 | | | | 10,585,560 | |
Trust 2009-53 QM, 5.50%, 5/25/39 | | | 15,653,517 | | | | 17,004,885 | |
Trust 2009-40 TB, 6.00%, 6/25/39 | | | 26,730,192 | | | | 29,641,829 | |
Trust 2001-T3 A1, 7.50%, 11/25/40 | | | 186,562 | | | | 210,550 | |
Trust 2010-123 WT,
7.00%, 11/25/40 | | | 138,673,134 | | | | 156,509,966 | |
Trust 2001-T7 A1, 7.50%, 2/25/41 | | | 81,262 | | | | 91,521 | |
Trust 2001-T4 A1, 7.50%, 7/25/41 | | | 2,924,912 | | | | 3,492,058 | |
Trust 2001-T10 A1,
7.00%, 12/25/41 | | | 4,046,533 | | | | 4,685,720 | |
Trust 2002-T12 A3, 7.50%, 5/25/42 | | | 70,321 | | | | 84,989 | |
Trust 2002-90 A1, 6.50%, 6/25/42 | | | 7,333,346 | | | | 8,619,226 | |
Trust 2002-W6 2A1,
6.595%, 6/25/42 | | | 4,715,123 | | | | 5,354,894 | |
Trust 2002-W8 A2, 7.00%, 6/25/42 | | | 2,409,255 | | | | 2,766,954 | |
Trust 2003-W2 1A2,
7.00%, 7/25/42 | | | 12,895,232 | | | | 15,729,333 | |
Trust 2003-W4 3A,
6.831%, 10/25/42 | | | 4,721,490 | | | | 5,518,487 | |
Trust 2003-07 A1, 6.50%, 12/25/42 | | | 6,340,078 | | | | 7,376,706 | |
Trust 2003-W1 1A1,
6.176%, 12/25/42 | | | 9,324,283 | | | | 11,329,470 | |
Trust 2003-W1 2A,
6.947%, 12/25/42 | | | 4,503,073 | | | | 5,468,090 | |
Trust 2012-133 HF,
0.56%, 12/25/42 | | | 70,212,276 | | | | 70,515,804 | |
Trust 2012-134 FT,
0.56%, 12/25/42 | | | 96,223,743 | | | | 96,662,716 | |
Trust 2012-148 LF, 0.51%, 1/25/43 | | | 85,798,000 | | | | 86,040,122 | |
Trust 2004-T1 1A2, 6.50%, 1/25/44 | | | 4,441,748 | | | | 5,321,810 | |
Trust 2004-W2 2A2, 7.00%, 2/25/44 | | | 198,914 | | | | 234,468 | |
Trust 2004-W2 5A, 7.50%, 3/25/44 | | | 14,054,597 | | | | 17,214,674 | |
| | | | | | | | |
| FIXED INCOME SECURITIES: 98.0% | |
| | |
| | | PAR VALUE | | | VALUE | |
Trust 2004-W8 3A, 7.50%, 6/25/44 | | $ | 9,183,356 | | | $ | 10,851,228 | |
Trust 2005-W1 1A3,
7.00%, 10/25/44 | | | 10,347,759 | | | | 12,595,634 | |
Trust 2001-79 BA, 7.00%, 3/25/45 | | | 1,281,712 | | | | 1,502,493 | |
Trust 2006-W1 1A1,
6.50%, 12/25/45 | | | 1,032,625 | | | | 1,219,128 | |
Trust 2006-W1 1A2,
7.00%, 12/25/45 | | | 7,290,456 | | | | 8,658,095 | |
Trust 2006-W1 1A3,
7.50%, 12/25/45 | | | 122,131 | | | | 147,175 | |
Trust 2006-W1 1A4,
8.00%, 12/25/45 | | | 8,528,863 | | | | 10,467,874 | |
Trust 2007-W10 1A, 6.23%, 8/25/47 | | | 36,606,061 | | | | 42,693,246 | |
Trust 2007-W10 2A, 6.24%, 8/25/47 | | | 10,795,676 | | | | 12,573,562 | |
Freddie Mac | | | | | | | | |
Series 2456 CJ, 6.50%, 6/15/32 | | | 615,213 | | | | 685,281 | |
Series 3312 AB, 6.50%, 6/15/32 | | | 10,095,761 | | | | 11,434,590 | |
Series T-41 2A, 6.52%, 7/25/32 | | | 220,297 | | | | 248,914 | |
Series T-48 1A, 6.16%, 7/25/33 | | | 4,461,686 | | | | 5,295,393 | |
Series 4091 JF, 0.709%, 6/15/41 | | | 35,776,307 | | | | 36,224,405 | |
Series 4120 YF, 0.559%, 10/15/42 | | | 108,848,912 | | | | 109,266,348 | |
Series 4122 FP, 0.609%, 10/15/42 | | | 57,291,053 | | | | 57,593,664 | |
Series T-051 1A, 6.50%, 9/25/43 | | | 98,144 | | | | 111,642 | |
| | | | | | | | |
| | | | | | | 920,922,793 | |
|
FEDERAL AGENCY MORTGAGE PASS-THROUGH: 25.4% | |
Fannie Mae, 10 Year
6.00%, 11/1/16 | | | 3,017,123 | | | | 3,167,002 | |
Fannie Mae, 15 Year | | | | | | | | |
4.00%, 7/1/26 - 2/1/27 | | | 199,175,554 | | | | 213,344,128 | |
5.00%, 9/1/25 | | | 243,988,670 | | | | 264,465,939 | |
5.50%, 1/1/18 - 1/1/25 | | | 575,403,642 | | | | 622,878,668 | |
6.00%, 7/1/16 - 3/1/23 | | | 258,763,510 | | | | 280,701,542 | |
6.50%, 12/1/14 - 12/1/19 | | | 37,214,072 | | | | 39,906,492 | |
7.00%, 9/1/14 - 11/1/17 | | | 84,757 | | | | 89,437 | |
7.50%, 11/1/14 - 8/1/17 | | | 2,679,068 | | | | 2,848,981 | |
Fannie Mae, 20 Year | | | | | | | | |
6.00%, 2/1/28 | | | 14,461,321 | | | | 15,823,369 | |
6.50%, 4/1/19 - 10/1/24 | | | 17,730,765 | | | | 19,741,511 | |
Fannie Mae, 30 Year | | | | | | | | |
5.50%, 2/1/33 - 9/1/39 | | | 735,906,395 | | | | 807,746,212 | |
6.00%, 11/1/28 - 6/1/40 | | | 620,588,786 | | | | 687,212,784 | |
6.50%, 12/1/32 - 8/1/39 | | | 447,761,152 | | | | 499,343,159 | |
7.00%, 4/1/32 - 12/1/37 | | | 336,109,677 | | | | 386,725,207 | |
Fannie Mae, Hybrid ARM | | | | | | | | |
1.992%, 8/1/34 | | | 4,341,267 | | | | 4,548,105 | |
2.194%, 1/1/35 | | | 5,366,625 | | | | 5,573,794 | |
2.22%, 9/1/34 | | | 6,605,736 | | | | 6,898,579 | |
2.268%, 8/1/34 | | | 1,513,695 | | | | 1,613,666 | |
2.281%, 12/1/36 | | | 7,233,266 | | | | 7,678,301 | |
2.30%, 10/1/33 | | | 5,574,419 | | | | 5,934,907 | |
2.32%, 11/1/35 | | | 4,728,033 | | | | 4,944,989 | |
2.422%, 10/1/34 | | | 5,167,975 | | | | 5,449,338 | |
2.485%, 7/1/35 | | | 3,803,925 | | | | 3,989,864 | |
| | |
| See accompanying Notes to Financial Statements | | DODGE & COX INCOME FUND §PAGE 8 |
| | | | |
PORTFOLIO OF INVESTMENTS | |
| December 31, 2012
|
|
| | | | | | | | |
| FIXED INCOME SECURITIES: 98.0% | |
| | |
| | | PAR VALUE | | | VALUE | |
2.489%, 4/1/35 | | $ | 6,904,755 | | | $ | 7,359,861 | |
2.499%, 7/1/35 | | | 3,917,315 | | | | 4,106,569 | |
2.526%, 8/1/35 | | | 5,481,106 | | | | 5,812,712 | |
2.576%, 8/1/35 | | | 15,083,812 | | | | 15,994,879 | |
2.604%, 7/1/35 | | | 4,209,902 | | | | 4,471,811 | |
2.615%, 12/1/35 - 1/1/36 | | | 13,989,369 | | | | 14,846,616 | |
2.636%, 1/1/37 | | | 7,219,892 | | | | 7,684,677 | |
2.717%, 10/1/35 | | | 7,143,817 | | | | 7,612,023 | |
2.725%, 11/1/36 | | | 6,172,849 | | | | 6,553,159 | |
2.748%, 7/1/34 - 1/1/36 | | | 15,152,501 | | | | 16,126,663 | |
2.759%, 7/1/35 | | | 3,728,442 | | | | 3,964,244 | |
2.807%, 6/1/35 | | | 2,725,214 | | | | 2,902,053 | |
2.867%, 10/1/35 | | | 4,394,878 | | | | 4,694,137 | |
2.872%, 8/1/35 | | | 10,254,417 | | | | 10,966,267 | |
2.877%, 1/1/35 | | | 2,434,408 | | | | 2,606,060 | |
2.89%, 9/1/35 | | | 6,667,458 | | | | 7,125,831 | |
3.031%, 2/1/37 | | | 14,826,131 | | | | 15,888,569 | |
4.462%, 10/1/38 | | | 17,632,261 | | | | 18,794,283 | |
4.507%, 10/1/38 | | | 6,965,936 | | | | 7,437,528 | |
5.005%, 4/1/38 | | | 4,356,681 | | | | 4,686,549 | |
5.017%, 5/1/38 | | | 11,447,449 | | | | 12,317,985 | |
5.074%, 10/1/38 | | | 10,257,800 | | | | 11,047,880 | |
5.284%, 9/1/38 | | | 1,997,039 | | | | 2,150,071 | |
5.416%, 7/1/36 | | | 896,681 | | | | 947,410 | |
5.541%, 8/1/37 | | | 3,880,885 | | | | 4,186,713 | |
5.602%, 4/1/37 | | | 3,555,646 | | | | 3,838,100 | |
5.806%, 12/1/36 | | | 6,707,983 | | | | 7,287,219 | |
5.84%, 11/1/37 | | | 8,107,352 | | | | 8,791,220 | |
Fannie Mae, Multifamily DUS | | | | | | | | |
Pool 555728, 4.021%, 8/1/13 | | | 178,847 | | | | 179,822 | |
Pool 760744, 4.75%, 3/1/15 | | | 13,305,000 | | | | 14,230,541 | |
Pool 555162, 4.82%, 1/1/13 | | | 751,392 | | | | 752,051 | |
Pool 555317, 4.823%, 4/1/13 | | | 9,953 | | | | 9,961 | |
Pool 555290, 4.827%, 2/1/13 | | | 49,451 | | | | 49,492 | |
Pool 555191, 4.854%, 2/1/13 | | | 2,239,089 | | | | 2,241,058 | |
Pool 735745, 4.992%, 1/1/17 | | | 186,152 | | | | 198,307 | |
Pool 555806, 5.144%, 10/1/13 | | | 61,767 | | | | 62,413 | |
Pool 745629, 5.16%, 1/1/18 | | | 361,740 | | | | 396,522 | |
Pool 462084, 5.275%, 11/1/15 | | | 55,361 | | | | 59,794 | |
Pool 888559, 5.424%, 6/1/17 | | | 34,420,757 | | | | 39,122,688 | |
Pool 888381, 5.508%, 4/1/17 | | | 642,291 | | | | 721,758 | |
Pool 888015, 5.54%, 11/1/16 | | | 42,141,433 | | | | 46,970,939 | |
Pool 745936, 6.086%, 8/1/16 | | | 855,411 | | | | 972,889 | |
Freddie Mac, 30 Year | | | | | | | | |
5.50%, 9/1/34 - 1/1/35 | | | 21,848,052 | | | | 23,745,379 | |
6.00%, 5/1/38 - 2/1/39 | | | 122,250,987 | | | | 133,514,153 | |
6.50%, 10/1/37 | | | 173,808 | | | | 197,812 | |
Freddie Mac, Hybrid ARM | | | | | | | | |
1.795%, 1/1/36 | | | 5,498,229 | | | | 5,748,482 | |
2.25%, 4/1/35 | | | 2,446,460 | | | | 2,601,341 | |
2.339%, 8/1/36 | | | 6,143,323 | | | | 6,544,709 | |
2.375%, 2/1/34 - 2/1/35 | | | 14,293,233 | | | | 14,953,478 | |
2.379%, 1/1/36 | | | 18,153,260 | | | | 19,220,695 | |
2.53%, 1/1/35 | | | 4,747,064 | | | | 4,995,951 | |
2.599%, 3/1/37 | | | 10,021,483 | | | | 10,572,528 | |
| | | | | | | | |
| FIXED INCOME SECURITIES: 98.0% | |
| | |
| | | PAR VALUE | | | VALUE | |
2.614%, 1/1/36 | | $ | 7,362,544 | | | $ | 7,845,338 | |
2.631%, 7/1/37 | | | 18,275,835 | | | | 19,455,803 | |
2.657%, 5/1/37 | | | 8,593,324 | | | | 9,158,592 | |
2.709%, 4/1/37 | | | 2,946,196 | | | | 3,067,707 | |
2.716%, 1/1/37 | | | 7,255,881 | | | | 7,761,002 | |
2.718%, 10/1/35 | | | 7,365,273 | | | | 7,850,634 | |
2.805%, 3/1/35 | | | 3,071,893 | | | | 3,274,828 | |
2.808%, 8/1/35 | | | 4,302,323 | | | | 4,575,638 | |
2.833%, 4/1/37 | | | 5,593,539 | | | | 5,812,525 | |
2.902%, 9/1/33 | | | 17,095,150 | | | | 18,216,793 | |
2.92%, 8/1/34 | | | 2,845,979 | | | | 3,010,678 | |
2.944%, 9/1/35 | | | 8,201,061 | | | | 8,767,184 | |
2.96%, 4/1/36 | | | 10,405,800 | | | | 11,115,421 | |
2.995%, 8/1/35 | | | 6,470,308 | | | | 6,924,991 | |
3.53%, 2/1/38 | | | 17,180,499 | | | | 18,398,484 | |
4.356%, 6/1/38 | | | 11,850,082 | | | | 12,641,590 | |
4.723%, 10/1/38 | | | 3,731,411 | | | | 3,990,972 | |
4.854%, 4/1/38 | | | 22,003,858 | | | | 23,591,675 | |
4.937%, 4/1/38 | | | 17,854,693 | | | | 19,093,955 | |
5.009%, 6/1/38 | | | 6,157,481 | | | | 6,538,436 | |
5.017%, 11/1/34 | | | 5,437,067 | | | | 5,855,897 | |
5.172%, 10/1/38 | | | 8,843,754 | | | | 9,463,412 | |
5.844%, 1/1/38 | | | 5,447,425 | | | | 5,906,692 | |
6.115%, 12/1/36 | | | 4,809,386 | | | | 5,206,786 | |
6.259%, 10/1/37 | | | 4,127,076 | | | | 4,510,744 | |
Freddie Mac Gold, 10 Year
6.00%, 9/1/16 | | | 1,271,434 | | | | 1,357,797 | |
Freddie Mac Gold, 15 Year | | | | | | | | |
4.00%, 10/1/26 - 5/1/27 | | | 458,419,890 | | | | 484,645,327 | |
5.50%, 10/1/20 - 12/1/24 | | | 34,646,034 | | | | 37,656,663 | |
6.00%, 8/1/16 - 11/1/23 | | | 80,338,576 | | | | 87,987,869 | |
6.50%, 7/1/14 - 9/1/18 | | | 11,138,374 | | | | 11,964,063 | |
Freddie Mac Gold, 20 Year | | | | | | | | |
5.50%, 11/1/23 | | | 17,374,251 | | | | 18,904,782 | |
6.00%, 7/1/25 - 12/1/27 | | | 87,361,753 | | | | 95,138,425 | |
6.50%, 7/1/21 - 10/1/26 | | | 9,663,019 | | | | 10,774,896 | |
Freddie Mac Gold, 30 Year | | | | | | | | |
5.50%, 3/1/34 - 12/1/38 | | | 408,712,284 | | | | 443,198,958 | |
6.00%, 2/1/33 - 5/1/40 | | | 664,948,657 | | | | 725,229,131 | |
6.50%, 5/1/17 - 10/1/38 | | | 104,217,138 | | | | 116,308,331 | |
7.00%, 4/1/31 - 11/1/38 | | | 17,122,146 | | | | 19,902,058 | |
7.90%, 2/17/21 | | | 948,273 | | | | 1,018,425 | |
Ginnie Mae, 30 Year | | | | | | | | |
7.00%, 5/15/28 | | | 786,198 | | | | 921,097 | |
7.50%, 9/15/17 - 5/15/25 | | | 2,860,271 | | | | 3,251,555 | |
7.80%, 6/15/20 - 1/15/21 | | | 756,887 | | | | 869,799 | |
7.85%, 1/15/21 - 10/15/21 | | | 16,829 | | | | 17,394 | |
8.00%, 9/15/20 | | | 14,195 | | | | 16,323 | |
| | | | | | | | |
| | | | | | | 6,730,088,496 | |
PRIVATE LABEL CMO & REMIC: 0.0%(f) | |
GSMPS Mortgage Loan Trust(b)
Series 2004-4 1A4, 8.50%, 6/25/34 | | | 7,034,200 | | | | 8,142,502 | |
| | | | | | | | |
| | | | | | | 7,659,153,791 | |
| | |
| PAGE 9 § DODGE & COX INCOME FUND | | See accompanying Notes to Financial Statements |
| | | | |
PORTFOLIO OF INVESTMENTS | |
| December 31, 2012
|
|
| | | | | | | | |
| FIXED INCOME SECURITIES: 98.0% | |
| | |
| | | PAR VALUE | | | VALUE | |
| ASSET-BACKED: 1.2% | |
CREDIT CARD: 1.0% | |
Chase Issuance Trust
Series 2012-A8, 0.54%, 10/16/17 | | $ | 257,060,000 | | | $ | 256,833,530 | |
STUDENT LOAN: 0.2% | |
SLM Student Loan Trust | | | | | | | | |
Series 2007-3 A2, 0.325%, 10/25/17 | | | 4,724,316 | | | | 4,716,266 | |
Series 2012-B A2, 3.48%, 10/15/30(b) | | | 17,190,000 | | | | 18,339,667 | |
Series 2012-C A2, 3.31%, 10/15/46(b) | | | 42,361,000 | | | | 44,938,921 | |
| | | | | | | | |
| | | | | | | 67,994,854 | |
| | | | | | | | |
| | | | | | | 324,828,384 | |
| CORPORATE: 46.5% | |
FINANCIALS: 20.2% | |
Ally Financial, Inc.
4.50%, 2/11/14 | | | 313,773,000 | | | | 322,793,974 | |
American International Group, Inc. | | | | | | | | |
4.25%, 9/15/14 | | | 43,680,000 | | | | 46,012,468 | |
8.25%, 8/15/18 | | | 132,195,000 | | | | 173,689,160 | |
6.40%, 12/15/20 | | | 38,510,000 | | | | 47,783,131 | |
Bank of America Corp. | | | | | | | | |
5.30%, 3/15/17 | | | 103,820,000 | | | | 116,767,392 | |
7.625%, 6/1/19 | | | 252,706,000 | | | | 323,355,269 | |
6.625%, 5/23/36(a) | | | 197,073,000 | | | | 220,887,893 | |
Boston Properties, Inc. | | | | | | | | |
5.625%, 4/15/15 | | | 34,820,000 | | | | 38,237,096 | |
5.00%, 6/1/15 | | | 17,274,000 | | | | 18,870,774 | |
3.70%, 11/15/18 | | | 28,790,000 | | | | 31,282,103 | |
5.875%, 10/15/19 | | | 48,349,000 | | | | 57,662,726 | |
5.625%, 11/15/20 | | | 55,220,000 | | | | 65,325,039 | |
4.125%, 5/15/21 | | | 17,710,000 | | | | 19,247,830 | |
3.85%, 2/1/23 | | | 9,615,000 | | | | 10,100,404 | |
Capital One Financial Corp. | | | | | | | | |
6.75%, 9/15/17 | | | 124,870,000 | | | | 152,501,109 | |
4.75%, 7/15/21 | | | 96,575,000 | | | | 111,366,620 | |
CIGNA Corp. | | | | | | | | |
8.50%, 5/1/19 | | | 75,436,000 | | | | 99,202,036 | |
4.00%, 2/15/22 | | | 39,970,000 | | | | 43,669,080 | |
7.65%, 3/1/23 | | | 6,372,000 | | | | 8,269,295 | |
7.875%, 5/15/27 | | | 29,445,000 | | | | 38,761,655 | |
8.30%, 1/15/33 | | | 7,955,000 | | | | 10,318,667 | |
6.15%, 11/15/36 | | | 84,889,000 | | | | 103,488,689 | |
5.375%, 2/15/42 | | | 19,550,000 | | | | 22,761,400 | |
Citigroup, Inc. | | | | | | | | |
4.75%, 5/19/15 | | | 28,300,000 | | | | 30,508,419 | |
6.125%, 11/21/17 | | | 190,033,000 | | | | 226,169,105 | |
2.01%, 5/15/18 | | | 170,635,000 | | | | 170,935,258 | |
7.875%, 10/30/40(a) | | | 178,926,725 | | | | 199,252,801 | |
Equity Residential
4.625%, 12/15/21 | | | 76,190,000 | | | | 85,821,407 | |
General Electric Co. | | | | | | | | |
5.625%, 5/1/18 | | | 14,685,000 | | | | 17,438,937 | |
5.50%, 1/8/20 | | | 178,320,000 | | | | 211,079,346 | |
4.375%, 9/16/20 | | | 64,515,000 | | | | 72,001,708 | |
| | | | | | | | |
| FIXED INCOME SECURITIES: 98.0% | |
| | |
| | | PAR VALUE | | | VALUE | |
4.625%, 1/7/21 | | $ | 16,970,000 | | | $ | 19,249,003 | |
4.65%, 10/17/21 | | | 59,745,000 | | | | 68,171,196 | |
Health Net, Inc.
6.375%, 6/1/17 | | | 82,782,000 | | | | 87,852,398 | |
HSBC Holdings PLC(c)
(United Kingdom) | | | | | | | | |
5.10%, 4/5/21 | | | 52,505,000 | | | | 62,002,157 | |
9.30%, 6/1/21 | | | 100,000 | | | | 136,878 | |
6.50%, 5/2/36 | | | 133,016,000 | | | | 166,187,530 | |
6.50%, 9/15/37 | | | 107,722,000 | | | | 134,457,415 | |
JPMorgan Chase & Co. | | | | | | | | |
4.95%, 3/25/20 | | | 49,315,000 | | | | 57,200,518 | |
4.35%, 8/15/21 | | | 106,482,000 | | | | 119,072,112 | |
4.50%, 1/24/22 | | | 25,415,000 | | | | 28,750,388 | |
8.75%, 9/1/30(a) | | | 45,848,000 | | | | 63,091,479 | |
Legg Mason, Inc.
6.00%, 5/21/19(b) | | | 150,425,000 | | | | 162,166,724 | |
Royal Bank of Scotland Group PLC(c) (United Kingdom) | | | | | | | | |
4.375%, 3/16/16 | | | 57,675,000 | | | | 62,404,927 | |
5.625%, 8/24/20 | | | 81,572,000 | | | | 94,702,971 | |
6.125%, 1/11/21 | | | 89,735,000 | | | | 108,415,763 | |
6.125%, 12/15/22 | | | 115,930,000 | | | | 122,362,028 | |
SLM Corp. | | | | | | | | |
6.00%, 1/25/17 | | | 128,830,000 | | | | 139,458,475 | |
8.45%, 6/15/18 | | | 132,624,000 | | | | 155,170,080 | |
Travelers Cos., Inc. | | | | | | | | |
5.50%, 12/1/15 | | | 14,092,000 | | | | 15,949,889 | |
6.25%, 6/20/16 | | | 43,840,000 | | | | 51,529,755 | |
5.75%, 12/15/17 | | | 35,330,000 | | | | 42,907,614 | |
3.90%, 11/1/20 | | | 19,660,000 | | | | 22,207,739 | |
Unum Group | | | | | | | | |
6.85%, 11/15/15(b) | | | 20,890,000 | | | | 23,635,280 | |
7.19%, 2/1/28 | | | 11,400,000 | | | | 13,135,160 | |
7.25%, 3/15/28 | | | 25,195,000 | | | | 29,625,616 | |
6.75%, 12/15/28 | | | 8,182,000 | | | | 9,512,041 | |
WellPoint, Inc. | | | | | | | | |
5.00%, 12/15/14 | | | 15,425,000 | | | | 16,659,987 | |
5.25%, 1/15/16 | | | 136,583,000 | | | | 152,206,047 | |
5.875%, 6/15/17 | | | 16,166,000 | | | | 19,187,151 | |
7.00%, 2/15/19 | | | 69,438,000 | | | | 86,405,731 | |
Wells Fargo & Co. | | | | | | | | |
6.00%, 11/15/17 | | | 85,295,000 | | | | 102,283,717 | |
5.625%, 12/11/17 | | | 15,000 | | | | 17,891 | |
5.75%, 2/1/18 | | | 35,840,000 | | | | 42,937,825 | |
| | | | | | | | |
| | | | | | | 5,374,614,276 | |
INDUSTRIALS: 26.3% | | | | | | | | |
AT&T, Inc. | | | | | | | | |
8.00%, 11/15/31 | | | 157,155,000 | | | | 237,826,433 | |
5.35%, 9/1/40 | | | 9,035,000 | | | | 10,521,691 | |
BHP Billiton, Ltd.(c) (Australia)
5.50%, 4/1/14 | | | 48,830,000 | | | | 51,866,689 | |
Boston Scientific Corp. | | | | | | | | |
5.45%, 6/15/14 | | | 69,758,000 | | | | 74,161,892 | |
| | |
| See accompanying Notes to Financial Statements | | DODGE & COX INCOME FUND §PAGE 10 |
| | | | |
| PORTFOLIO OF INVESTMENTS | |
| December 31, 2012
|
|
| | | | | | | | |
| FIXED INCOME SECURITIES: 98.0% | |
| | |
| | | PAR VALUE | | | VALUE | |
6.25%, 11/15/15 | | $ | 14,685,000 | | | $ | 16,545,957 | |
6.40%, 6/15/16 | | | 110,474,000 | | | | 126,986,549 | |
6.00%, 1/15/20 | | | 15,635,000 | | | | 18,237,493 | |
Burlington Northern Santa Fe, LLC(e) | | | | | | | | |
4.30%, 7/1/13 | | | 7,723,000 | | | | 7,866,076 | |
4.875%, 1/15/15 | | | 13,010,000 | | | | 14,054,833 | |
4.70%, 10/1/19 | | | 76,160,000 | | | | 87,793,973 | |
7.57%, 1/2/21 | | | 16,845,825 | | | | 19,942,383 | |
8.251%, 1/15/21 | | | 6,043,175 | | | | 7,354,212 | |
4.10%, 6/1/21 | | | 5,875,000 | | | | 6,552,811 | |
3.05%, 9/1/22 | | | 7,125,000 | | | | 7,363,381 | |
5.943%, 1/15/23 | | | 99,091 | | | | 109,383 | |
5.72%, 1/15/24 | | | 20,554,392 | | | | 24,089,094 | |
5.342%, 4/1/24 | | | 7,037,723 | | | | 8,071,025 | |
5.629%, 4/1/24 | | | 29,246,839 | | | | 33,950,083 | |
5.996%, 4/1/24 | | | 54,166,947 | | | | 64,042,714 | |
Canadian Pacific Railway Ltd.(c) (Canada)
5.75%, 1/15/42 | | | 43,379,000 | | | | 52,893,273 | |
Comcast Corp. | | | | | | | | |
5.85%, 11/15/15 | | | 24,975,000 | | | | 28,426,645 | |
5.90%, 3/15/16 | | | 41,160,000 | | | | 47,290,123 | |
6.50%, 1/15/17 | | | 41,310,000 | | | | 49,821,636 | |
6.30%, 11/15/17 | | | 16,275,000 | | | | 19,965,600 | |
5.875%, 2/15/18 | | | 68,855,000 | | | | 82,973,787 | |
5.70%, 5/15/18 | | | 2,645,000 | | | | 3,179,991 | |
6.45%, 3/15/37 | | | 3,280,000 | | | | 4,208,857 | |
6.95%, 8/15/37 | | | 38,159,000 | | | | 51,746,123 | |
6.40%, 5/15/38 | | | 12,440,000 | | | | 15,894,824 | |
Consolidated Rail Corp.
6.76%, 5/25/15 | | | 128,393 | | | | 135,721 | |
Covidien PLC(c) (Ireland)
6.00%, 10/15/17 | | | 32,105,000 | | | | 38,887,470 | |
Cox Communications, Inc. | | | | | | | | |
5.45%, 12/15/14 | | | 15,055,000 | | | | 16,418,757 | |
5.50%, 10/1/15 | | | 150,000 | | | | 168,439 | |
5.875%, 12/1/16(b) | | | 76,860,000 | | | | 89,726,057 | |
9.375%, 1/15/19(b) | | | 141,844,000 | | | | 195,030,110 | |
3.25%, 12/15/22(b) | | | 9,000,000 | | | | 9,281,322 | |
CSX Corp. | | | | | | | | |
8.375%, 10/15/14 | | | 41,974 | | | | 46,591 | |
9.75%, 6/15/20 | | | 10,162,000 | | | | 14,355,715 | |
6.251%, 1/15/23 | | | 18,435,478 | | | | 22,232,081 | |
Dillard’s, Inc. | | | | | | | | |
7.13%, 8/1/18 | | | 23,610,000 | | | | 26,325,150 | |
7.875%, 1/1/23 | | | 275,000 | | | | 301,125 | |
7.75%, 7/15/26 | | | 21,211,000 | | | | 22,324,578 | |
7.75%, 5/15/27 | | | 12,868,000 | | | | 13,414,890 | |
7.00%, 12/1/28 | | | 28,490,000 | | | | 28,703,675 | |
Dow Chemical Co. | | | | | | | | |
8.55%, 5/15/19 | | | 127,813,000 | | | | 172,557,264 | |
7.375%, 11/1/29 | | | 49,274,000 | | | | 65,354,192 | |
9.40%, 5/15/39 | | | 123,768,000 | | | | 203,775,720 | |
Eaton Corp. PLC(c) (Ireland) | | | | | | | | |
| | | | | | | | |
| FIXED INCOME SECURITIES: 98.0% | |
| | |
| | | PAR VALUE | | | VALUE | |
1.50%, 11/2/17(b) | | $ | 22,800,000 | | | $ | 22,846,580 | |
2.75%, 11/2/22(b) | | | 62,320,000 | | | | 62,127,680 | |
Enel SPA(c) (Italy) | | | | | | | | |
6.80%, 9/15/37(b) | | | 22,600,000 | | | | 23,605,700 | |
6.00%, 10/7/39(b) | | | 15,000,000 | | | | 14,525,205 | |
FedEx Corp. | | | | | | | | |
7.375%, 1/15/14 | | | 22,265,000 | | | | 23,792,201 | |
8.00%, 1/15/19 | | | 18,220,000 | | | | 23,995,813 | |
6.72%, 7/15/23 | | | 19,184,964 | | | | 23,116,259 | |
7.65%, 7/15/24 | | | 2,329,702 | | | | 2,880,513 | |
Ford Motor Credit Co.(e) | | | | | | | | |
5.625%, 9/15/15 | | | 180,560,000 | | | | 197,719,339 | |
5.75%, 2/1/21 | | | 202,486,000 | | | | 233,127,396 | |
4.25%, 9/20/22 | | | 29,150,000 | | | | 30,822,773 | |
HCA, Inc. | | | | | | | | |
6.25%, 2/15/13 | | | 66,053,000 | | | | 66,383,265 | |
6.75%, 7/15/13 | | | 80,771,000 | | | | 82,790,275 | |
5.75%, 3/15/14 | | | 63,956,000 | | | | 66,834,020 | |
6.375%, 1/15/15 | | | 40,055,000 | | | | 43,309,469 | |
6.50%, 2/15/16 | | | 119,646,000 | | | | 130,115,025 | |
Hewlett-Packard Co. | | | | | | | | |
6.125%, 3/1/14 | | | 114,415,000 | | | | 120,274,993 | |
3.30%, 12/9/16 | | | 91,260,000 | | | | 92,892,550 | |
Lafarge SA(c) (France) | | | | | | | | |
6.20%, 7/9/15(b) | | | 152,315,000 | | | | 166,167,216 | |
6.50%, 7/15/16 | | | 122,686,000 | | | | 137,101,605 | |
Liberty Media Corp. | | | | | | | | |
8.50%, 7/15/29 | | | 12,025,000 | | | | 13,017,063 | |
8.25%, 2/1/30 | | | 29,062,000 | | | | 31,677,580 | |
Macy’s, Inc. | | | | | | | | |
7.875%, 7/15/15 | | | 42,450,000 | | | | 49,436,376 | |
5.90%, 12/1/16 | | | 16,951,000 | | | | 19,917,662 | |
6.65%, 7/15/24 | | | 39,806,000 | | | | 48,933,924 | |
7.00%, 2/15/28 | | | 26,205,000 | | | | 31,895,127 | |
6.70%, 9/15/28 | | | 27,145,000 | | | | 31,558,044 | |
6.90%, 4/1/29 | | | 51,112,000 | | | | 61,668,059 | |
6.90%, 1/15/32 | | | 53,035,000 | | | | 63,679,846 | |
6.70%, 7/15/34 | | | 84,962,000 | | | | 101,057,541 | |
6.375%, 3/15/37 | | | 27,311,000 | | | | 32,876,463 | |
News Corp. | | | | | | | | |
6.20%, 12/15/34 | | | 7,510,000 | | | | 9,095,721 | |
6.40%, 12/15/35 | | | 29,320,000 | | | | 36,396,353 | |
6.15%, 3/1/37 | | | 29,480,000 | | | | 36,179,772 | |
6.65%, 11/15/37 | | | 12,525,000 | | | | 16,184,717 | |
6.15%, 2/15/41 | | | 30,075,000 | | | | 38,092,484 | |
Nordstrom, Inc. | | | | | | | | |
6.75%, 6/1/14 | | | 43,370,000 | | | | 47,046,952 | |
6.25%, 1/15/18 | | | 16,585,000 | | | | 20,106,891 | |
6.95%, 3/15/28 | | | 12,760,000 | | | | 16,801,296 | |
Norfolk Southern Corp. | | | | | | | | |
7.70%, 5/15/17 | | | 28,855,000 | | | | 36,422,079 | |
9.75%, 6/15/20 | | | 13,893,000 | | | | 19,772,990 | |
Pfizer, Inc. | | | | | | | | |
5.50%, 2/1/14 | | | 38,610,000 | | | | 40,703,434 | |
| | |
| PAGE 11 § DODGE & COX INCOME FUND | | See accompanying Notes to Financial Statements |
| | | | |
| PORTFOLIO OF INVESTMENTS | |
| December 31, 2012
|
|
| | | | | | | | |
| FIXED INCOME SECURITIES: 98.0% | |
| | |
| | | PAR VALUE | | | VALUE | |
5.50%, 2/15/16 | | $ | 54,360,000 | | | $ | 62,088,959 | |
5.45%, 4/1/17 | | | 62,173,000 | | | | 73,453,607 | |
6.20%, 3/15/19 | | | 35,253,000 | | | | 44,558,946 | |
Reed Elsevier PLC(c) (United Kingdom) | | | | | | | | |
7.75%, 1/15/14 | | | 6,170,000 | | | | 6,606,972 | |
8.625%, 1/15/19 | | | 127,995,000 | | | | 165,035,985 | |
Roche Holding AG(c) (Switzerland)
6.00%, 3/1/19(b) | | | 17,665,000 | | | | 21,989,268 | |
Sprint Nextel Corp. | | | | | | | | |
6.00%, 12/1/16 | | | 119,570,000 | | | | 130,032,375 | |
6.90%, 5/1/19 | | | 47,565,000 | | | | 51,845,850 | |
Telecom Italia SPA(c) (Italy) | | | | | | | | |
5.25%, 11/15/13 | | | 42,879,000 | | | | 44,058,173 | |
6.175%, 6/18/14 | | | 58,048,000 | | | | 61,182,592 | |
4.95%, 9/30/14 | | | 63,039,000 | | | | 65,812,716 | |
6.999%, 6/4/18 | | | 34,416,000 | | | | 39,337,488 | |
7.175%, 6/18/19 | | | 78,830,000 | | | | 91,482,215 | |
Time Warner Cable, Inc. | | | | | | | | |
8.75%, 2/14/19 | | | 82,229,000 | | | | 110,940,078 | |
8.25%, 4/1/19 | | | 184,969,000 | | | | 246,145,092 | |
5.00%, 2/1/20 | | | 8,275,000 | | | | 9,634,872 | |
4.00%, 9/1/21 | | | 4,120,000 | | | | 4,522,380 | |
Time Warner, Inc. | | | | | | | | |
7.625%, 4/15/31 | | | 183,403,000 | | | | 252,487,609 | |
7.70%, 5/1/32 | | | 155,613,000 | | | | 217,574,518 | |
Union Pacific Corp. | | | | | | | | |
5.375%, 5/1/14 | | | 6,991,000 | | | | 7,410,488 | |
4.875%, 1/15/15 | | | 10,544,000 | | | | 11,401,934 | |
6.85%, 1/2/19 | | | 4,697,109 | | | | 5,280,793 | |
6.70%, 2/23/19 | | | 5,189,532 | | | | 5,929,728 | |
7.60%, 1/2/20 | | | 1,738,728 | | | | 2,088,997 | |
6.125%, 2/15/20 | | | 46,885,000 | | | | 58,713,429 | |
4.163%, 7/15/22 | | | 24,992,000 | | | | 28,270,800 | |
6.061%, 1/17/23 | | | 13,563,777 | | | | 15,178,589 | |
4.698%, 1/2/24 | | | 4,971,841 | | | | 5,543,520 | |
5.082%, 1/2/29 | | | 9,679,926 | | | | 11,146,413 | |
5.866%, 7/2/30 | | | 50,181,100 | | | | 59,929,737 | |
6.176%, 1/2/31 | | | 37,125,735 | | | | 45,692,005 | |
Vulcan Materials Co. | | | | | | | | |
6.50%, 12/1/16 | | | 34,100,000 | | | | 37,595,250 | |
7.50%, 6/15/21 | | | 87,800,000 | | | | 100,092,000 | |
Xerox Corp. | | | | | | | | |
8.25%, 5/15/14 | | | 34,145,000 | | | | 37,244,888 | |
6.40%, 3/15/16 | | | 72,142,000 | | | | 81,294,656 | |
7.20%, 4/1/16 | | | 25,751,000 | | | | 29,571,753 | |
6.75%, 2/1/17 | | | 63,394,000 | | | | 73,733,054 | |
2.95%, 3/15/17 | | | 1,125,000 | | | | 1,154,276 | |
6.35%, 5/15/18 | | | 107,007,000 | | | | 123,411,280 | |
5.625%, 12/15/19 | | | 67,177,000 | | | | 75,054,175 | |
| | | | | | | | |
| | | | | | | 6,974,252,099 | |
| | | | | | | | |
| | | | | | | 12,348,866,375 | |
| | | | | | | | |
TOTAL FIXED INCOME SECURITIES
(Cost $23,738,791,844) | | | $ | 26,006,045,072 | |
| | | | | | | | |
| SHORT-TERM INVESTMENTS: 1.0% | |
| | |
| | | PAR VALUE | | | VALUE | |
MONEY MARKET FUND: 0.1% | | | | | | | | |
SSgA U.S. Treasury Money Market Fund | | $ | 26,540,655 | | | $ | 26,540,655 | |
| |
REPURCHASE AGREEMENT: 0.9% | | | | | |
Fixed Income Clearing Corporation(d) 0.11%, dated 12/31/12, due 1/2/13, maturity value $234,586,434 | | | 234,585,000 | | | | 234,585,000 | |
| | | | | | | | |
| |
TOTAL SHORT-TERM INVESTMENTS
(Cost $261,125,655) | | | $ | 261,125,655 | |
| | | | | | | | |
| | |
TOTAL INVESTMENTS
(Cost $23,999,917,499) | | | 99.0 | % | | $ | 26,267,170,727 | |
| | |
OTHER ASSETS LESS LIABILITIES | | | 1.0 | % | | | 271,380,367 | |
| | | | | | | | |
| NET ASSETS | | | 100.0 | % | | $ | 26,538,551,094 | |
| | | | | | | | |
| (a) | Cumulative preferred security |
| (b) | Security exempt from registration under Rule 144A of the Securities Act of 1933. The security may be resold in transactions exempt from registration, normally to qualified institutional buyers. As of December 31, 2012, all such securities in total represented $862,522,232 or 3.3% of net assets. These securities have been deemed liquid by Dodge & Cox, investment manager, pursuant to procedures approved by the Fund’s Board of Trustees. |
| (c) | Security denominated in U.S. dollars |
| (d) | Repurchase agreement is collateralized by U.S. Treasury Note 0.25%, 4/30/14. Total collateral value is $239,278,725. |
| (e) | Subsidiary (see below) |
Fixed income securities are grouped by parent company unless otherwise noted. Actual securities may be issued by the listed parent company or one of its subsidiaries.
ARM: Adjustable Rate Mortgage
CMO: Collateralized Mortgage Obligation
DUS: Delegated Underwriting and Servicing
REMIC: Real Estate Mortgage Investment Conduit
FUTURES CONTRACTS
| | | | | | | | | | | | |
| Description | | Number of
Contracts | | Expiration
Date | | Notional
Amount | | | Unrealized
Appreciation | |
| 10 Year U.S. Treasury Note – Short Position | | 15,572 | | Mar 2013 | | $ | (2,067,669,625 | ) | | $ | 6,892,198 | |
| | |
| See accompanying Notes to Financial Statements | | DODGE & COX INCOME FUND §PAGE 12 |
| | | | |
STATEMENT OF ASSETS AND LIABILITIES | |
| |
| | | December 31, 2012 | |
ASSETS: | | | | |
Investments, at value (cost $23,999,917,499) | | $ | 26,267,170,727 | |
Cash held at broker | | | 12,886,047 | |
Receivable for investments sold | | | 8,705,642 | |
Receivable for Fund shares sold | | | 47,993,679 | |
Receivable from broker for futures variation margin | | | 6,919,761 | |
Interest receivable | | | 241,496,154 | |
Prepaid expenses and other assets | | | 162,433 | |
| | | | |
| | | 26,585,334,443 | |
| | | | |
LIABILITIES: | | | | |
Payable for Fund shares redeemed | | | 36,268,807 | |
Management fees payable | | | 8,978,707 | |
Accrued expenses | | | 1,535,835 | |
| | | | |
| | | 46,783,349 | |
| | | | |
NET ASSETS | | $ | 26,538,551,094 | |
| | | | |
NET ASSETS CONSIST OF: | | | | |
Paid in capital | | $ | 24,660,652,380 | |
Undistributed net investment income | | | 6,666,525 | |
Accumulated net realized loss | | | (402,940,800 | ) |
Net unrealized appreciation | | | 2,274,172,989 | |
| | | | |
| | $ | 26,538,551,094 | |
| | | | |
Fund shares outstanding (par value $0.01 each, unlimited shares authorized) | | | 1,915,154,587 | |
Net asset value per share | | | $13.86 | |
|
STATEMENT OF OPERATIONS | |
| |
| | | Year Ended
December 31, 2012 | |
INVESTMENT INCOME: | | | | |
Dividends | | $ | 13,328,095 | |
Interest | | | 990,792,595 | |
| | | | |
| | | 1,004,120,690 | |
| | | | |
EXPENSES: | | | | |
Management fees | | | 101,872,398 | |
Custody and fund accounting fees | | | 446,306 | |
Transfer agent fees | | | 4,715,215 | |
Professional services | | | 142,583 | |
Shareholder reports | | | 1,057,286 | |
Registration fees | | | 442,790 | |
Trustees’ fees | | | 190,500 | |
Miscellaneous | | | 301,164 | |
| | | | |
| | | 109,168,242 | |
| | | | |
NET INVESTMENT INCOME | | | 894,952,448 | |
| | | | |
REALIZED AND UNREALIZED
GAIN (LOSS): | | | | |
Net realized gain (loss) | | | | |
Investments | | | 199,946,013 | |
Treasury futures contracts | | | (75,340,973 | ) |
Net change in unrealized appreciation/depreciation | | | | |
Investments | | | 875,218,679 | |
Treasury futures contracts | | | 20,050,997 | |
| | | | |
Net realized and unrealized gain | | | 1,019,874,716 | |
| | | | |
NET INCREASE IN NET ASSETS
FROM OPERATIONS | | | $1,914,827,164 | |
| | | | |
| | | | | | | | |
STATEMENT OF CHANGES IN NET ASSETS | |
| | |
| | | Year Ended
December 31, 2012 | | | Year Ended
December 31, 2011 | |
OPERATIONS: | | | | | | | | |
Net investment income | | $ | 894,952,448 | | | $ | 968,527,697 | |
Net realized gain (loss) | | | 124,605,040 | | | | (15,483,410 | ) |
Net change in unrealized appreciation/depreciation | | | 895,269,676 | | | | 123,878,447 | |
| | | | | | | | |
| | | 1,914,827,164 | | | | 1,076,922,734 | |
| | | | | | | | |
| | |
DISTRIBUTIONS TO SHAREHOLDERS FROM: | | | | | | | | |
Net investment income | | | (896,923,748 | ) | | | (970,846,088 | ) |
Net realized gain | | | — | | | | — | |
| | | | | | | | |
Total distributions | | | (896,923,748 | ) | | | (970,846,088 | ) |
| | | | | | | | |
| | |
FUND SHARE TRANSACTIONS: | | | | | | | | |
Proceeds from sale of shares | | | 6,763,162,980 | | | | 6,655,820,213 | |
Reinvestment of distributions | | | 733,665,789 | | | | 810,130,084 | |
Cost of shares redeemed | | | (6,027,397,028 | ) | | | (5,902,091,793 | ) |
| | | | | | | | |
Net increase from Fund
share transactions | | | 1,469,431,741 | | | | 1,563,858,504 | |
| | | | | | | | |
Total increase in net assets | | | 2,487,335,157 | | | | 1,669,935,150 | |
| | |
NET ASSETS: | | | | | | | | |
Beginning of year | | | 24,051,215,937 | | | | 22,381,280,787 | |
| | | | | | | | |
End of year (including undistributed net investment income of $6,666,525 and $8,637,825, respectively) | | $ | 26,538,551,094 | | | $ | 24,051,215,937 | |
| | | | | | | | |
| | |
SHARE INFORMATION: | | | | | | | | |
Shares sold | | | 492,596,832 | | | | 497,177,426 | |
Distributions reinvested | | | 53,579,893 | | | | 60,983,342 | |
Shares redeemed | | | (439,406,933 | ) | | | (441,183,941 | ) |
| | | | | | | | |
Net increase in shares outstanding | | | 106,769,792 | | | | 116,976,827 | |
| | | | | | | | |
| | |
| PAGE 13 § DODGE & COX INCOME FUND | | See accompanying Notes to Financial Statements |
NOTES TO FINANCIAL STATEMENTS
NOTE 1—ORGANIZATION AND SIGNIFICANT ACCOUNTING POLICIES
Dodge & Cox Income Fund (the “Fund”) is one of the series constituting the Dodge & Cox Funds (the “Trust” or the “Funds”). The Trust is organized as a Delaware statutory trust and is registered under the Investment Company Act of 1940, as amended, as a diversified, open-end management investment company. The Fund commenced operations on January 3, 1989, and seeks high and stable current income consistent with long-term preservation of capital. Risk considerations and investment strategies of the Fund are discussed in the Fund’s Prospectus.
The financial statements have been prepared in conformity with accounting principles generally accepted in the United States of America, which require the use of estimates and assumptions by management. Actual results may differ from those estimates. Significant accounting policies are as follows:
Security valuation The Fund’s net assets are valued as of the close of trading on the New York Stock Exchange (NYSE), generally 4:00 p.m. Eastern Time, each day that the NYSE is open for business. Fixed income securities are priced on the basis of valuations furnished by independent pricing services which utilize both dealer-supplied valuations and pricing models. Under certain circumstances, fixed income securities that are not valued by pricing services are temporarily valued by the investment manager utilizing both dealer-supplied valuations and pricing models. Pricing models may consider quoted prices for similar securities, interest rates, prepayment speeds, and credit risk. Futures contracts are valued daily at the closing settlement price on the exchange. Security values are not discounted based on the size of the Fund’s position. Securities for which market quotations are not readily available are valued at fair value as determined in good faith by or under the direction of the Board of Trustees. Short-term securities are valued at amortized cost which approximates current value. All securities held by the Fund are denominated in U.S. dollars.
Security transactions, investment income, expenses, and distributions Security transactions are recorded on the trade date. Realized gains and losses on securities sold are determined on the basis of identified cost.
Interest income is recorded on the accrual basis. Interest income includes coupon interest, amortization of premium and accretion of discount on debt securities, and gain/loss on paydowns of mortgage-backed securities. The ability of the issuers of the debt securities held by the Fund to meet their obligations may be affected by economic developments in a specific industry, state, or region. Debt obligations may be placed on non-accrual status and related interest income may be reduced by ceasing current accruals and writing off interest receivables when the collection of all or a portion of interest has become doubtful. A debt obligation is removed from non-accrual status when the issuer resumes interest payments or when collectibility of interest is reasonably assured.
Expenses are recorded on the accrual basis. Most expenses of the Trust can be directly attributed to a specific series. Expenses which cannot be directly attributed are allocated among the Funds in the Trust based on relative net assets or other expense methodologies determined by the nature of the expense.
Distributions to shareholders are recorded on the ex-dividend date.
Repurchase agreements The Fund enters into repurchase agreements, secured by U.S. government or agency securities, which involve the purchase of securities from a counterparty with a simultaneous commitment to resell the securities at an agreed-upon date and price. It is the Fund’s policy that its custodian take possession of the underlying collateral securities, the fair value of which exceeds the principal amount of the repurchase transaction, including accrued interest, at all times. In the event of default by the counterparty, the Fund has the contractual right to liquidate the securities and to apply the proceeds in satisfaction of the obligation.
Treasury Futures Contracts Futures contracts involve an obligation to purchase or sell (depending on whether the Fund has entered a long or short futures contract, respectively) an asset at a future date, at a price set at the time of the contract. Upon entering into a
DODGE & COX INCOME FUND §PAGE 14
NOTES TO FINANCIAL STATEMENTS
futures contract, the Fund is required to deposit an amount of cash or liquid assets (referred to as initial margin) in a segregated account with the clearing broker. Subsequent payments (referred to as variation margin) to and from the clearing broker are made on a daily basis based on changes in the market value of futures contracts. Futures are traded publicly and their market value changes daily. Changes in the market value of open futures contracts are recorded as unrealized appreciation or depreciation in the Statement of Operations. Realized gains and losses on futures contracts are recorded in the Statement of Operations at the closing or expiration of futures contracts. Cash deposited with a broker as initial margin is recorded on the Statement of Assets and Liabilities. A receivable and/or payable to brokers for daily variation margin is also recorded on the Statement of Assets and Liabilities.
Investments in futures contracts may include certain risks, which may be different from, and potentially greater than, those of the underlying securities. To the extent the Fund uses Treasury futures, it is exposed to additional volatility and potential losses resulting from leverage.
The Fund has entered into short Treasury futures contracts to assist with the management of the portfolio’s interest rate exposure. During the year ended December 31, 2012, the Fund remained consistently invested in short Treasury futures contracts. These Treasury futures contracts had notional values ranging from 6% to 11% of net assets.
Indemnification Under the Trust’s organizational documents, its officers and trustees are indemnified against certain liabilities arising out of the performance of their duties to the Trust. In addition, in the normal course of business the Trust enters into contracts that provide general indemnities to other parties. The Trust’s maximum exposure under these arrangements is unknown as this would involve future claims that may be made against the Trust that have not yet occurred.
NOTE 2—VALUATION MEASUREMENTS
Various inputs are used in determining the value of the Fund’s investments. These inputs are summarized in the three broad levels listed below.
| § | | Level 1: Quoted prices in active markets for identical securities |
| § | | Level 2: Other significant observable inputs (including quoted prices for similar securities, market indices, interest rates, credit risk, etc.) |
| § | | Level 3: Significant unobservable inputs (including Fund management’s assumptions in determining the fair value of investments) |
The inputs or methodology used for valuing securities are not necessarily an indication of the risk associated with investing in those securities.
The following is a summary of the inputs used to value the Fund’s holdings as of December 31, 2012:
| | | | | | | | |
| Classification(a) | | LEVEL 1
(Quoted Prices) | | | LEVEL 2
(Other Significant
Observable Inputs) | |
Securities | | | | | | | | |
Fixed Income Securities | | | | | | | | |
U.S. Treasury | | $ | 3,374,888,901 | | | $ | — | |
Government-Related | | | — | | | | 2,298,307,621 | |
Mortgage-Related | | | — | | | | 7,659,153,791 | |
Asset-Backed | | | — | | | | 324,828,384 | |
Corporate | | | — | | | | 12,348,866,375 | |
Short-term Investments | | | | | | | | |
Money Market Fund | | | 26,540,655 | | | | — | |
Repurchase Agreement | | | — | | | | 234,585,000 | |
| | | | | | | | |
Total Securities | | $ | 3,401,429,556 | | | $ | 22,865,741,171 | |
| | | | | | | | |
Other Financial
Instruments | | | | | | | | |
Treasury Futures Contracts | | $ | 6,892,198 | (b) | | $ | — | |
| | | | | | | | | |
| (a) | There were no transfers between Level 1 and Level 2 during the year ended December 31, 2012. There were no Level 3 securities at December 31, 2012 and 2011, and there were no transfers to Level 3 during the year. |
| (b) | Represents unrealized appreciation on Treasury futures contracts. |
PAGE 15 § DODGE & COX INCOME FUND
NOTES TO FINANCIAL STATEMENTS
NOTE 3—RELATED PARTY TRANSACTIONS
Management fees Under a written agreement approved by a unanimous vote of the Board of Trustees, the Fund pays an annual management fee of 0.50% of the Fund’s average daily net assets up to $100 million and 0.40% of the Fund’s average daily net assets in excess of $100 million to Dodge & Cox, investment manager of the Fund. The agreement further provides that Dodge & Cox shall waive its fee to the extent that such fee plus all other ordinary operating expenses of the Fund exceed 1% of the average daily net assets for the year.
Fund officers and trustees All officers and three of the trustees of the Trust are officers or employees of Dodge & Cox. The Trust pays a fee only to those trustees who are not affiliated with Dodge & Cox.
NOTE 4—INCOME TAX INFORMATION AND DISTRIBUTIONS TO SHAREHOLDERS
A provision for federal income taxes is not required since the Fund intends to continue to qualify as a regulated investment company under Subchapter M of the Internal Revenue Code and distribute all of its taxable income to shareholders. Distributions are determined in accordance with income tax regulations, and such amounts may differ from net investment income and realized gains for financial reporting purposes. Financial reporting records are adjusted for permanent book/tax differences at year end to reflect tax character.
Book/tax differences are primarily due to differing treatments of wash sales, in-kind redemptions, net short-term realized gain (loss), and Treasury futures contracts. During the year, the Fund recognized net realized gains of $55,212,915 from the delivery of appreciated securities in an in-kind redemption transaction. For federal income tax purposes, this gain is not recognized as taxable income to the Fund and therefore will not be distributed to shareholders. At December 31, 2012, the cost of investments for federal income tax purposes was $23,999,918,108.
Distributions during the years ended December 31, 2012 and 2011, were characterized as follows for federal income tax purposes:
| | | | | | | | |
| | | Year Ended December 31, 2012 | | | Year Ended December 31, 2011 | |
Ordinary income | | | $896,923,748 | | | | $970,846,088 | |
| | | ($0.484 per share) | | | | ($0.551 per share) | |
Long-term capital gain | | | — | | | | — | |
At December 31, 2012, the tax basis components of distributable earnings were as follows:
| | | | |
Unrealized appreciation | | $ | 2,280,459,419 | |
Unrealized depreciation | | | (13,206,798 | ) |
| | | | |
Net unrealized appreciation | | | 2,267,252,621 | |
Undistributed ordinary income | | | 6,666,525 | |
Capital loss carryforward(a) | | | (396,020,432 | ) |
| (a) | Represents accumulated capital loss as of December 31, 2012, which may be carried forward to offset future capital gains. During 2012, the Fund utilized $89,443,121 of the capital loss carryforward and $32,528,048 expired unutilized. If not utilized, the remaining capital loss carryforward will expire as follows: |
| | | | |
Expiring in 2013 | | $ | 19,963,019 | |
Expiring in 2014 | | | 39,482,767 | |
Expiring in 2017 | | | 174,777,813 | |
Expiring in 2018 | | | 117,611,247 | |
No expiration | | | | |
Short-term | | | 44,185,586 | |
Long-term | | | — | |
| | | | |
| | $ | 396,020,432 | |
| | | | |
Under the Regulated Investment Company Modernization Act of 2010, capital losses incurred by the Fund after January 1, 2011, will not be subject to expiration. In addition, such losses must be utilized prior to the losses incurred in the years preceding enactment.
Fund management has reviewed the tax positions for open periods (three years and four years, respectively, from filing the Fund’s Federal and State tax returns) as applicable to the Fund, and has determined that no provision for income tax is required in the Fund’s financial statements.
DODGE & COX INCOME FUND §PAGE 16
NOTES TO FINANCIAL STATEMENTS
NOTE 5—LOAN FACILITIES
Pursuant to an exemptive order issued by the Securities and Exchange Commission (SEC), the Fund may participate in an interfund lending facility (Facility). The Facility allows the Fund to borrow money from or loan money to the Funds. Loans under the Facility are made for temporary or emergency purposes, such as to fund shareholder redemption requests. Interest on borrowings is the average of the current repurchase agreement rate and the bank loan rate. There was no activity in the Facility during the period.
All Funds in the Trust participate in a $500 million committed credit facility (Line of Credit) with State Street Bank and Trust Company, to be utilized for temporary or emergency purposes to fund shareholder redemptions or for other short-term liquidity purposes. The maximum amount available to the Fund is $250 million. Each Fund pays an annual commitment fee on its pro-rata portion of the Line of Credit. The Fund’s commitment fee for the twelve months ended December 31, 2012, amounted to $105,219 and is reflected as a Miscellaneous Expense in the Statement of Operations. Interest on borrowings is charged at the prevailing rate. There were no borrowings on the Line of Credit during the period.
NOTE 6—PURCHASES AND SALES OF INVESTMENTS
For the year ended December 31, 2012, purchases and sales of securities, other than short-term securities and
U.S. government securities, aggregated $2,097,906,692 and $1,539,381,875, respectively. For the year ended December 31, 2012, purchases and sales of U.S. government securities aggregated $6,945,881,262 and $5,733,840,625, respectively.
NOTE 7—ACCOUNTING PRONOUNCEMENTS
Effective January 1, 2013, the Fund will adopt Accounting Standards Update (ASU) No. 2011-11, Balance Sheet (Topic 210): Disclosures about Offsetting Assets and Liabilities and ASU No. 2013-01, Balance Sheet (Topic 210): Clarifying the Scope of Disclosures about Offsetting Assets and Liabilities. These amendments to Topic 210 require enhanced disclosures about offsetting of financial assets and liabilities, including derivative instruments, to enable investors to understand the effect of these arrangements on a fund’s financial position. Management believes the adoption of these ASUs will not have a material impact on the Fund’s financial statements.
NOTE 8—SUBSEQUENT EVENTS
Fund management has determined that no material events or transactions occurred subsequent December 31, 2012, and through the date of the Fund’s financial statements issuance, which require additional disclosure in the Fund’s financial statements.
PAGE 17 § DODGE & COX INCOME FUND
FINANCIAL HIGHLIGHTS
| | | | | | | | | | | | | | | | | | | | |
SELECTED DATA AND RATIOS (for a share outstanding throughout each year) | | Year Ended December 31, | |
| | | 2012 | | | 2011 | | | 2010 | | | 2009 | | | 2008 | |
| | | | |
Net asset value, beginning of year | | | $13.30 | | | | $13.23 | | | | $12.96 | | | | $11.79 | | | | $12.51 | |
Income from investment operations: | | | | | | | | | | | | | | | | | | | | |
Net investment income | | | 0.48 | | | | 0.55 | | | | 0.57 | | | | 0.65 | | | | 0.68 | |
Net realized and unrealized gain (loss) | | | 0.56 | | | | 0.07 | | | | 0.35 | | | | 1.20 | | | | (0.72 | ) |
| | | | |
Total from investment operations | | | 1.04 | | | | 0.62 | | | | 0.92 | | | | 1.85 | | | | (0.04 | ) |
| | | | |
Distributions to shareholders from: | | | | | | | | | | | | | | | | | | | | |
Net investment income | | | (0.48 | ) | | | (0.55 | ) | | | (0.65 | ) | | | (0.68 | ) | | | (0.68 | ) |
Net realized gain | | | — | | | | — | | | | — | | | | — | | | | — | |
| | | | |
Total distributions | | | (0.48 | ) | | | (0.55 | ) | | | (0.65 | ) | | | (0.68 | ) | | | (0.68 | ) |
| | | | |
Net asset value, end of year | | | $13.86 | | | | $13.30 | | | | $13.23 | | | | $12.96 | | | | $11.79 | |
| | | | |
Total return | | | 7.94 | % | | | 4.76 | % | | | 7.17 | % | | | 16.05 | % | | | (0.29 | )% |
Ratios/supplemental data: | | | | | | | | | | | | | | | | | | | | |
Net assets, end of year (millions) | | | $26,539 | | | | $24,051 | | | | $22,381 | | | | $19,254 | | | | $13,808 | |
Ratio of expenses to average net assets | | | 0.43 | % | | | 0.43 | % | | | 0.43 | % | | | 0.43 | % | | | 0.43 | % |
Ratio of net investment income to average net assets | | | 3.52 | % | | | 4.12 | % | | | 4.26 | % | | | 5.29 | % | | | 5.40 | % |
Portfolio turnover rate | | | 26 | % | | | 27 | % | | | 28 | % | | | 20 | % | | | 24 | % |
See accompanying Notes to Financial Statements
REPORT OF INDEPENDENT REGISTERED PUBLIC ACCOUNTING FIRM
To the Trustees of Dodge & Cox Funds and Shareholders of Dodge & Cox Income Fund
In our opinion, the accompanying statement of assets and liabilities, including the portfolio of investments, and the related statements of operations and of changes in net assets and the financial highlights present fairly, in all material respects, the financial position of Dodge & Cox Income Fund (the “Fund”, one of the series constituting Dodge & Cox Funds) at December 31, 2012, the results of its operations for the year then ended, the changes in its net assets for each of the two years in the period then ended and the financial highlights for each of the five years in the period then ended, in conformity with accounting principles generally accepted in the United States of America. These financial statements and financial highlights (hereafter referred to as “financial statements”) are the responsibility of the Fund’s management; our responsibility is to express an opinion on these financial statements based on our audits. We conducted our audits of these financial statements in accordance with the standards of the Public Company Accounting Oversight Board (United States). Those standards require that we plan and perform the audit to obtain reasonable assurance about whether the financial statements are free of material misstatement. An audit includes examining, on a test basis, evidence supporting the amounts and disclosures in the financial statements, assessing the accounting principles used and significant estimates made by management, and evaluating the overall financial statement presentation. We believe that our audits, which included confirmation of securities at December 31, 2012, by correspondence with the custodian and brokers, provide a reasonable basis for our opinion.
PricewaterhouseCoopers LLP
San Francisco, California
February 20, 2013
DODGE & COX INCOME FUND §PAGE 18
BOARD APPROVAL OF FUNDS’ INVESTMENT MANAGEMENT AGREEMENTS AND MANAGEMENT FEES
(unaudited)
The Board of Trustees is responsible for overseeing the performance of the Dodge & Cox Funds’ investment manager and determining whether to continue the Investment Management Agreements between the Funds and Dodge & Cox each year (the “Agreements”). At a meeting of the Board of Trustees of the Trust held on December 12, 2012, the Trustees, by a unanimous vote (including a separate vote of those Trustees who are not “interested persons” (as defined in the Investment Company Act of 1940) (the “Independent Trustees”)), approved the renewal of the Agreements for an additional one-year term through December 31, 2013. During the course of the year, the Board received a wide variety of materials relating to the services provided by Dodge & Cox and the performance of each of the Funds.
INFORMATION RECEIVED
In advance of the meeting, the Board, including each of the Independent Trustees, requested, received, and reviewed materials relating to the Agreements and the services provided by Dodge & Cox. The Independent Trustees retained Morningstar® to prepare an independent expense and performance summary for each Fund and comparable funds managed by other advisers identified by Morningstar. The Morningstar materials included information regarding advisory fee rates, expense ratios, and transfer agency, custodial, and distribution expenses, as well as appropriate performance comparisons to a Fund’s peer group and an index or combination of indices. The Morningstar materials also included a comparison of expenses of various share classes offered by comparable funds.
The materials reviewed by the Board contained information concerning, among other things, Dodge & Cox’s profitability, financial results and condition, advisory fee revenue, and separate account advisory fee schedules. The Board additionally considered the Funds’ brokerage commissions, turnover rates, sales and redemption data and the significant investment that Dodge & Cox makes in research used in managing the Funds. The Board received and reviewed a memorandum
summarizing information provided throughout the year regarding Dodge & Cox’s services to the Funds as well as information regarding (i) the different fees, services, costs, and risks associated with separate accounts managed by Dodge & Cox as compared to the Dodge & Cox Funds; (ii) the differences in performance between the Funds and separately managed accounts; and (iii) Fund shares subscription and redemption activity. Throughout the process of reviewing the services provided by Dodge & Cox and preparing for the meeting, the Independent Trustees found Dodge & Cox to be open, forthright, detailed, and very helpful in answering questions about all issues.
The Board received copies of the Agreements and a memorandum from the independent legal counsel to the Independent Trustees discussing the factors generally regarded as appropriate to consider in evaluating advisory arrangements. The Trust’s Contract Review Committee, consisting solely of Independent Trustees, met with the independent legal counsel on November 1, 2012, and again on December 12, 2012, to discuss whether to renew the Agreements. The Board, including the Independent Trustees, subsequently concluded that the existing Agreements are fair and reasonable and voted to approve the Agreements.
In considering the Agreements, the Board, including the Independent Trustees, did not identify any single factor or particular information as all-important or controlling. In reaching the decision to approve the Agreements, the Board considered several factors, discussed below, to be key factors and reached the conclusions described below.
NATURE, QUALITY, AND EXTENT OF THE SERVICES
The Board considered that Dodge & Cox provides a wide range of services to the Funds in addition to portfolio management and that the quality of these services has been excellent in all respects. The extensive nature of services provided by Dodge & Cox has been documented in materials provided to the Board and in presentations made to the Board throughout the year. In particular, the Board considered the nature, quality, and extent of portfolio management, administrative, and shareholder
PAGE 19 § DODGE & COX INCOME FUND
services performed by Dodge & Cox. With regard to portfolio management services, the Board considered Dodge & Cox’s established long-term history of care and conscientiousness in the management of the Funds; its demonstrated consistency in investment approach and depth; the background and experience of the Dodge & Cox Investment Policy Committee, International Investment Policy Committee, Global Investment Policy Committee, Fixed Income Investment Policy Committee, and research analysts responsible for managing the Funds; its methods for assessing the regulatory and investment climate in various jurisdictions; Dodge & Cox’s overall high level of attention to its core investment management function; and its commitment to the Funds and their shareholders.
In the area of administrative and shareholder services, the Board considered the excellent quality of Dodge & Cox’s work in areas such as compliance, legal services, trading, proxy voting, oversight of the Funds’ transfer agent and custodian, tax compliance, and shareholder communication through its website and other means. The Board also noted Dodge & Cox’s diligent disclosure policy, its favorable compliance record, and its reputation as a trusted, shareholder-friendly mutual fund family.
In addition, the Board considered that Dodge & Cox manages approximately $120 billion in Fund assets with fewer professionals than most comparable funds, and that on average these professionals have more experience and longer tenure than investment professionals at comparable funds. The Board also noted that Dodge & Cox is an investment research-oriented firm with no other business endeavors to distract management’s attention from its research efforts, and that its investment professionals adhere to a consistent investment approach across the Funds. The Board further considered the favorable stewardship and “Gold” analyst ratings awarded to each of the Funds by Morningstar. The Board concluded that it was satisfied with the nature, extent, and quality of investment management and other services provided to the Funds by Dodge & Cox.
INVESTMENT PERFORMANCE
The Board considered short-term and long-term investment performance for each Fund (including periods
of outperformance or underperformance) as compared to both relevant indices and the performance of such Fund’s peer group. The Board also reviewed recent performance in the context of long-term investment goals. The Board noted that each Fund’s short-term (one-year) performance relative to its benchmark and peer group had improved since the previous year’s review. The Board determined after extensive review and inquiry that Dodge & Cox’s historic, long-term, team-oriented bottom up investment approach remains consistent and that Dodge & Cox continues to be distinguished by its integrity, transparency, and independence.
The Board considered that the performance of the Funds is the result of a team-oriented investment management process that emphasizes a long-term investment horizon, comprehensive independent research, price discipline, and focus. The Board also considered that the investment performance delivered by Dodge & Cox to the Funds appeared to be consistent with the relevant performance delivered for other (non-fund) clients of Dodge & Cox. The Board concluded that Dodge & Cox has delivered favorable long-term performance for Fund investors consistent with the long-term investment strategies being pursued by the Funds.
COSTS AND ANCILLARY BENEFITS
Costs of Services to Funds: Fees and Expenses. The Board considered each Fund’s management fee rate and expense ratio relative to similar mutual funds and relative to management fees charged by Dodge & Cox to other clients. In particular, the Board considered that the Funds continue to be substantially below their peer group median in expense ratios and management fee rates and that many media and industry reports specifically comment on the low expense ratios of the Funds, which have been a defining characteristic of the Funds for many years. The Board also evaluated the operating structures of the Funds and Dodge & Cox, noting that the Funds do not charge front-end sales commissions or distribution fees, and Dodge & Cox bears, among other things, the significant cost of third party research, reimbursement for recordkeeping and administrative costs to third-party retirement plan administrators, and administrative and office overhead. The Board noted that expenses are well
DODGE & COX INCOME FUND §PAGE 20
below industry averages. The Board also considered that the Funds receive numerous administrative, regulatory compliance, and shareholder support services from Dodge & Cox without any additional administrative fee and the fact that the Funds have relatively low transaction costs and portfolio turnover rates. The Board reviewed Morningstar data showing that the few peer group funds with lower expense ratios often have other share classes with significantly higher expense ratios.
The Board reviewed information regarding the fee rates Dodge & Cox charges to separate accounts that have investment programs similar to those of the Funds, including instances where separate account fees are lower than Fund fees. The Board considered differences in the nature and scope of services Dodge & Cox provides to the Funds as compared to separate accounts, differences in regulatory, litigation, and other risks as between mutual funds and separate accounts, and certain characteristics of the market for institutional separate account management services. The Board further noted that, with respect to non-U.S. funds sponsored and managed by Dodge & Cox that are comparable to the Funds in many respects, the fee rates charged by Dodge & Cox are the same as or higher than the fee rates charged to the Funds. After consideration of these matters, the Board concluded that the overall costs incurred by the Funds for the services they receive (including the management fee paid to Dodge & Cox) are reasonable and that the fees are acceptable based upon the qualifications, experience, reputation, and performance of Dodge & Cox and the low overall expense ratios of the Funds.
Profitability and Costs of Services to Dodge & Cox; “Fall-out” Benefits. The Board reviewed reports of Dodge & Cox’s financial position, profitability, and estimated overall value, and considered Dodge & Cox’s overall profitability within its context as a private, employee-owned S-Corporation and relative to the favorable services provided. The Board noted that net revenues for 2012 are projected to decrease slightly from 2011. The Board noted in particular that Dodge & Cox’s profits are not generated by high fee rates, but reflect an extraordinarily streamlined, efficient, and focused business approach toward investment management. The Board recognized the importance of Dodge & Cox’s
profitability—which is derived solely from management fees and does not include other business ventures—to maintain its independence, stability, company culture and ethics, and management continuity. The Board also considered that the compensation/profit structure at Dodge & Cox is vital for remaining independent and facilitating retention of its management and investment professionals.
The Board considered potential “fall-out” benefits (including the receipt of research from unaffiliated brokers) that Dodge & Cox might receive as a result of its association with the Funds and determined that they are not significant. The Board also noted the extent of additional administrative services performed by Dodge & Cox for the Funds, and that the magnitude of costs and risks borne by Dodge & Cox in rendering advisory services to the Funds (including risks in the regulatory compliance, securities valuation, and investment management processes) are continuing to increase. The Board concluded that the profitability of Dodge & Cox’s relationship with the Funds (including fall-out benefits) was fair and reasonable.
THE BENEFIT OF ECONOMIES OF SCALE
The Board considered whether there have been economies of scale with respect to the management of each Fund, whether the Funds have appropriately benefited from any economies of scale, and whether the management fee rate is reasonable in relation to the Fund assets and any economies of scale that may exist. In the Board’s view, any consideration of economies of scale must take account of the Funds’ low fee structure and the considerable efficiencies of the Funds’ organization and fee structure that has been realized by shareholders from the time of each Fund’s inception (i.e., from the first dollar). The Board noted that Dodge & Cox has shared economies of scale by adding or enhancing services to the Funds over time, and that the internal costs of providing investment management, up-to-date technology, administrative, and compliance services to the Funds are continuing to increase. For example, Dodge & Cox has increased its global research staff and investment resources over the years to address the increased complexity of investing in multinational and non-U.S. companies. In
PAGE 21 § DODGE & COX INCOME FUND
addition, Dodge & Cox has made substantial expenditures in other staff and infrastructure to enable it to integrate credit and equity analyses and to be able to implement its strategy in a more effective and secure manner. The Board determined that the Funds provide access for small investors to high quality investment management at a relatively low cost. The Board’s decision to renew the Agreements was made after consideration of economies of scale and review of peer group fund expense ratios and historical expense ratio patterns for the Funds. The Board concluded that the current Dodge & Cox fee structure is fair and reasonable and adequately shares economies of scale that may exist.
CONCLUSION
Based on their evaluation of all material factors and assisted by the advice of independent legal counsel to the Independent Trustees, the Board, including the Independent Trustees, concluded that the advisory fee structure was fair and reasonable, that each Fund was paying a competitive fee for the services provided, that the scope and quality of Dodge & Cox’s services has provided substantial value for Fund shareholders over the long term, and that approval of the Agreements was in the best interests of each Fund and its shareholders.
FUND HOLDINGS
The Fund provides a complete list of its holdings four times each fiscal year, as of the end of each quarter. The Fund files the lists with the Securities and Exchange Commission (SEC) on Form N-CSR (second and fourth quarters) and Form N-Q (first and third quarters). Shareholders may view the Fund’s Forms N-CSR and N-Q
on the SEC’s website at www.sec.gov. Forms N-CSR and N-Q may also be reviewed and copied at the SEC’s Public Reference Room in Washington, DC. Information regarding the operations of the Public Reference Room may be obtained by calling 202-942-8090 (direct) or 800-732-0330 (general SEC number). A list of the Fund’s quarter-end holdings is also available at www.dodgeandcox.com on or about 15 days following each quarter end and remains available on the web site until the list is updated in the subsequent quarter.
PROXY VOTING
For a free copy of the Fund’s proxy voting policies and procedures, please call 800-621-3979, visit the Fund’s website at www.dodgeandcox.com, or visit the SEC’s website at www.sec.gov. Information regarding how the Fund voted proxies relating to portfolio securities during the most recent 12-month period ending June 30 is also available at www.dodgeandcox.com or at www.sec.gov.
HOUSEHOLD MAILINGS
The Fund routinely mails shareholder reports and summary prospectuses to shareholders and, on occasion, proxy statements. In order to reduce the volume of mail, when possible, only one copy of these documents will be sent to shareholders who are part of the same family and share the same residential address.
If you have a direct account with the Funds and you do not want the mailing of shareholder reports and summary prospectuses combined with other members in your household, contact the Funds at 800-621-3979. Your request will be implemented within 30 days
DODGE & COX INCOME FUND §PAGE 22
DODGE & COX FUNDS—EXECUTIVE OFFICER & TRUSTEE INFORMATION
| | | | | | |
Name (Age) and
Address* | | Position with Trust (Year of Election or
Appointment) | | Principal Occupation During Past 5 Years | | Other Directorships Held by Trustees |
| INTERESTED TRUSTEES AND OFFICERS |
| Kenneth E. Olivier (60) | | Chairman, President, and Trustee (Trustee since 2005) | | Chairman (since 2011), Chief Executive Officer (since 2010), President (until 2011), and Director of Dodge & Cox; Portfolio Manager and member of Investment Policy Committee (IPC) | | — |
| Dana M. Emery (51) | | Senior Vice President and Trustee (Trustee since 1993) | | Co-President (since 2011), Executive Vice President (until March 2011), and Director of Dodge & Cox; Director of Fixed Income, Portfolio Manager, and member of Fixed Income Investment Policy Committee (FIIPC) | | — |
| John A. Gunn (69) | | Trustee (Trustee since 1985) | | Chairman Emeritus (since 2011), Chairman (2007-2011), Chief Executive Officer (2007-2010), and Director of Dodge & Cox; Portfolio Manager and member of IPC, Global Investment Policy Committee (GIPC) (since 2008), International Investment Policy Committee (IIPC), and FIIPC (until 2008) | | — |
| Charles F. Pohl (54) | | Senior Vice President (Officer since 2004) | | Co-President (since 2011), Senior Vice President (until 2011), and Director of Dodge & Cox; Chief Investment Officer (since 2007), Director of Credit Research, Portfolio Manager, Investment Analyst, and member of IPC, GIPC (since 2008), IIPC (since 2007), and FIIPC | | — |
| Diana S. Strandberg (53) | | Senior Vice President (Officer since 2006) | | Senior Vice President (since 2011), Vice President (until 2011), and Director (since 2011) of Dodge & Cox; Director of International Equity (since 2009), Portfolio Manager, Investment Analyst, and member of IPC, GIPC (since 2008), and IIPC | | — |
| David H. Longhurst (55) | | Treasurer (Officer since 2006) | | Vice President (since 2008) and Assistant Treasurer (since 2007) of Dodge & Cox; Fund Administration and Accounting Senior Manager (until 2007) | | — |
| Thomas M. Mistele (59) | | Secretary (Officer since 1998) | | Chief Operating Officer, Director, Secretary, Senior Counsel (since 2011), and General Counsel (until 2011) of Dodge & Cox | | — |
| Katherine M. Primas (37) | | Chief Compliance Officer (Officer since 2009) | | Chief Compliance Officer (since 2008) and Associate Chief Compliance Officer of Dodge & Cox (until 2008) | | — |
| INDEPENDENT TRUSTEES |
| L. Dale Crandall (71) | | Trustee (Since 1999) | | President, Piedmont Corporate Advisors, Inc. (since 2003); President, Kaiser Foundation Health Plan, Inc. and Kaiser Foundation Hospitals (2000-2002); Senior Vice President—Finance and Administration & CFO, Kaiser Foundation Health Plan, Inc. and Kaiser Foundation Hospitals (1998-2000) | | Director, Ansell Limited (medical equipment and supplies) (2002-present); Director, Coventry Health Care, Inc. (managed health care) (2004-present); Bridgepoint Education, Inc. (education services) (2008-present) |
| Thomas A. Larsen (63) | | Trustee (Since 2002) | | Senior Counsel of Arnold & Porter LLP (law firm) (since 2012); Director of Howard, Rice, Nemerovski, Canady, Falk & Rabkin (1977-2011) | | — |
| Ann Mather (52) | | Trustee (Since 2011) | | CFO, Pixar Animation Studios (1999-2004) | | Director, Google, Inc. (internet information services) (2005-present); Director, Glu Mobile, Inc. (multimedia software) (2005-present); Director, Netflix, Inc. (video services) (2010-present); Director, MoneyGram International, Inc. (business services) (2010-present); Director, Solazyme Inc. (renewable oils) (since 2011) |
| Robert B. Morris III (60) | | Trustee (Since 2011) | | Advisory Director, The Presidio Group (previously Presidio Financial Partners) (since 2005) | | — |
| John B. Taylor (66) | | Trustee (Since 2005) (and 1998-2001) | | Professor of Economics, Stanford University; Senior Fellow, Hoover Institution; Under Secretary for International Affairs, United States Treasury (2001-2005) | | — |
| * | | The address for each Officer and Trustee is 555 California Street, 40th Floor, San Francisco, California 94104. Each Officer and Trustee oversees all five series in the Dodge & Cox Funds complex and serves for an indefinite term. |
Additional information about the Trust’s Trustees and Officers is available in the Trust’s Statement of Additional Information (SAI). You can get a free copy of the SAI by visiting the Funds’ website at www.dodgeandcox.com or calling
1-800-621-3979.
PAGE 23 § DODGE & COX INCOME FUND
ITEM 2. CODE OF ETHICS.
A code of ethics, as defined in Item 2 of Form N-CSR, adopted by the registrant and applicable to the registrant’s principal executive officer and principal financial officer was in effect during the entire period covered by this report. A copy of the code of ethics as revised December 15, 2008 is filed as an exhibit to this Form N-CSR. No substantive amendments were approved or waivers were granted to this code of ethics during the period covered by this report.
ITEM 3. AUDIT COMMITTEE FINANCIAL EXPERT.
The Board of Trustees of the registrant has determined that L. Dale Crandall, Ann Mather, and Robert B. Morris III, members of the registrant’s Audit and Compliance Committee, are each an “audit committee financial expert” and are “independent,” as defined in Item 3 of Form N-CSR.
ITEM 4. PRINCIPAL ACCOUNTANT FEES AND SERVICES.
(a) – (d) Aggregate fees billed to the registrant for the fiscal years ended December 31, 2012 and December 31, 2011 for professional services rendered by the registrant’s principal accountant were as follows:
| | | | | | | | |
| | | 2012 | | | 2011 | |
(a) Audit Fees | | $ | 256,300 | | | $ | 246,500 | |
(b) Audit-Related Fees | | | — | | | | — | |
(c) Tax Fees | | | 176,900 | | | | 177,550 | * |
(d) All Other Fees | | | — | | | | — | |
| * | Amount ultimately billed for tax services rendered in 2011 was less than the estimated amount disclosed in the previous filing of Form N-CSR. |
Audit fees include amounts related to the audit of the registrant’s annual financial statements and services normally provided by the accountant in connection with statutory and regulatory filings. Tax fees include amounts related to tax advice and tax return preparation, compliance, and reviews.
(e)(1) The registrant’s Audit and Compliance Committee has adopted policies and procedures (“Policies”) which require the registrant’s Audit and Compliance Committee to pre-approve all audit and non-audit services provided by the principal accountant to the registrant. The policies also require the Audit and Compliance Committee to pre-approve any engagement of the principal accountant to provide non-audit services to the registrant’s investment adviser, if the services directly impact the registrant’s operations and financial reporting. The Policies do not apply in the case of audit services that the principal accountant provides to the registrant’s adviser. If a service (other than the engagement of the principal accountant to audit the registrant’s financial statements) is required to be pre-approved under the Policies between regularly scheduled Audit and Compliance Committee meetings, pre-approval may be authorized by a designated Audit and Compliance Committee member with ratification at the next scheduled Audit and Compliance Committee meeting.
(e)(2) No services included in (b) – (d) above were approved pursuant to paragraph (c)(7)(i)(C) of Rule 2-01 of Regulation S-X.
(f) Less than 50% of the hours expended on the principal accountant’s engagement to audit the registrant’s financial statements for the most recent fiscal year were attributed to work performed by persons other than the principal accountant’s full-time, permanent employees.
(g) For the fiscal years ended December 31, 2012 and December 31, 2011, the aggregate fees billed by the registrant’s principal accountant for non-audit services rendered to the registrant, for non-audit services rendered to the registrant’s investment adviser, and for non-audit services rendered to entities controlled by the adviser were $686,200 and $650,700, respectively.
(h) All non-audit services described under (g) above that were not pre-approved by the registrant’s Audit and Compliance Committee were considered by the registrant’s Audit and Compliance Committee and found to be compatible with maintaining the principal accountant’s independence.
ITEM 5. AUDIT COMMITTEE OF LISTED REGISTRANTS.
Not applicable.
ITEM 6. SCHEDULE OF INVESTMENTS.
Not applicable. The complete schedule of investments is included in Item 1 of this Form N-CSR.
ITEM 7. DISCLOSURE OF PROXY VOTING POLICIES AND PROCEDURES FOR CLOSED-END MANAGEMENT INVESTMENT COMPANIES.
Not applicable.
ITEM 8. PORTFOLIO MANAGERS OF CLOSED-END MANAGEMENT INVESTMENT COMPANIES.
Not applicable.
ITEM 9. PURCHASES OF EQUITY SECURITIES BY CLOSED-END MANAGEMENT INVESTMENT COMPANY AND AFFILIATED PURCHASERS.
Not applicable.
ITEM 10. SUBMISSION OF MATTERS TO A VOTE OF SECURITY HOLDERS.
The registrant has adopted the following procedures by which shareholders may recommend nominees to the registrant’s Board of Trustees.
1. The shareholder must submit any such recommendation in writing to the registrant to the attention of the Secretary at the address of the principal executive offices of the registrant. The shareholder’s recommendation is then considered by the registrant’s Nominating Committee.
2. The shareholder recommendation must include:
(i) A statement in writing setting forth (a) the name, date of birth, business address and residence address of the person recommended by the shareholder (the “candidate”); and (b) whether the recommending shareholder believes that the candidate is or will be an “interested person” of the registrant (as defined in the Investment Company Act of 1940) and, if not an “interested person,” information regarding the candidate that will be sufficient for the registrant to make such determination and, if applicable, similar information regarding whether the candidate would satisfy the standards for independence of a Board member under listing standards of the New York Stock Exchange or other applicable securities exchange.
(ii) The written and manually signed consent of the candidate to be named as a nominee and to serve as a Trustee if elected;
(iii) The recommending shareholder’s name as it appears on the registrant’s books and the number of all shares of the registrant owned beneficially and of record by the recommending shareholder (as evidenced to the Nominating Committee’s satisfaction by a recent brokerage or account statement); and
(iv) A description of all arrangements or understandings between the recommending shareholder and the candidate and any other person or persons (including their names) pursuant to which the recommendation is being made by the recommending shareholder.
In addition, the Nominating Committee may require the candidate to furnish such other information as it may reasonably require or deem necessary to determine the eligibility of such candidate to serve on the Board or to satisfy applicable law and information regarding the candidate that would be required to be disclosed if the candidate were a nominee in a proxy statement or other filing required to be made in connection with solicitation of proxies for election of Trustees.
ITEM 11. CONTROLS AND PROCEDURES.
(a) An evaluation was performed within 90 days of the filing of this report, under the supervision and with the participation of the registrant’s management, including the principal executive officer and principal financial officer, of the effectiveness of the design and operation of the registrant’s disclosure controls and procedures. Based on that evaluation, the principal executive officer and principal financial officer concluded that the registrant’s disclosure controls and procedures were effective.
(b) The registrant’s principal executive officer and principal financial officer are aware of no changes in the registrant’s internal control over financial reporting that occurred during the second fiscal quarter of the period covered by this report that has materially affected, or is reasonably likely to materially affect, the registrant’s internal control over financial reporting.
ITEM 12. EXHIBITS.
(a)(1) The registrant’s code of ethics pursuant to Item 2 of Form N-CSR is attached. (EX.99A)
(a)(2) Certifications pursuant to Section 302 of the Sarbanes-Oxley Act of 2002 are attached. (EX.99B)
(a)(3) Not applicable.
(b) Certifications pursuant to Section 906 of the Sarbanes-Oxley Act of 2002 are attached. (EX.99C)
SIGNATURES
Pursuant to the requirements of the Securities Exchange Act of 1934 and the Investment Company Act of 1940, the registrant has duly caused this report to be signed on its behalf by the undersigned, thereunto duly authorized.
Dodge & Cox Funds
| | |
| By | | /s/ Kenneth E. Olivier |
| | Kenneth E. Olivier |
| | Chairman – Principal Executive Officer |
Date February 27, 2013
Pursuant to the requirements of the Securities Exchange Act of 1934 and the Investment Company Act of 1940, this report has been signed below by the following persons on behalf of the registrant and in the capacities and on the dates indicated.
Dodge & Cox Funds
| | |
| By | | /s/ Kenneth E. Olivier |
| | Kenneth E. Olivier |
| | Chairman – Principal Executive Officer |
| | |
| By | | /s/ David H. Longhurst |
| | David H. Longhurst |
| | Treasurer – Principal Financial Officer |
Date February 27, 2013