UNITED STATES
SECURITIES AND EXCHANGE COMMISSION
Washington, D.C. 20549
FORM N-CSR
CERTIFIED SHAREHOLDER REPORT OF REGISTERED MANAGEMENT INVESTMENT COMPANIES
Investment Company Act file number 811-173
DODGE & COX FUNDS
(Exact name of registrant as specified in charter)
| | |
| 555 California Street, 40th Floor | | |
| San Francisco, CA | | 94104 |
| (Address of principal executive offices) | | (Zip code) |
Thomas M. Mistele, Esq.
555 California Street, 40th Floor
San Francisco, CA 94104
(Name and address of agent for service)
Registrant’s telephone number, including area code: 415-981-1710
Date of fiscal year end: DECEMBER 31, 2006
Date of reporting period: DECEMBER 31, 2006
Form N-CSR is to be used by management investment companies to file reports with the Commission not later than 10 days after the transmission to stockholders of any report that is required to be transmitted to stockholders under Rule 30e-1 under the Investment Company Act of 1940 (17 CFR 270.30e-1). The Commission may use the information provided on Form N-CSR in its regulatory, disclosure review, inspection, and policymaking roles.
A registrant is required to disclose the information specified by Form N-CSR, and the Commission will make this information public. A registrant is not required to respond to the collection of information contained in Form N-CSR unless the Form displays a currently valid Office of Management and Budget (“OMB”) control number. Please direct comments concerning the accuracy of the information collection burden estimate and any suggestions for reducing the burden to Secretary, Securities and Exchange Commission, 450 Fifth Street, NW, Washington, DC 20549-0609. The OMB has reviewed this collection of information under the clearance requirements of 44 U.S.C. ss. 3507.
TO OUR SHAREHOLDERS
It is not often one has the opportunity to recognize a colleague who has contributed to an organization for close to four decades, so we begin this year’s annual letter to shareholders with a warm farewell to Harry Hagey, who retired from Dodge & Cox on December 31, 2006. Harry joined Dodge & Cox 39 years ago as a security analyst, and served as the firm’s Chairman for the past 14 years and Chief Executive Officer between 1992 and 2005. He served as the firm’s fourth Chairman—the firm’s founder, E. Morris Cox, Peter Avenali and Joe Fee came before him. He also succeeded Peter Avenali as Chairman of the Dodge & Cox Funds.
Harry’s greatest legacy is the importance he placed on Dodge & Cox’s culture, specifically: strong ethics (i.e., placing our clients’ interests ahead of our own), the firm’s employee ownership structure, respect for each client and employee, and the absence of a marketing mindset. Harry ingrained these important tenets into all of us over his years here, and he helped develop our team of 59 investment professionals (who have an average tenure at the firm of 10 years), including our Investment Policy Committee whose nine members now have an average tenure at Dodge & Cox of 21 years.
We greatly appreciate Harry’s leadership and many years of hard work on behalf of the firm and its clients. We will miss his warm personality and camaraderie, and we wish him well in his future endeavors. Effective January 1, 2007, John A. Gunn was appointed Chairman of the firm and of the Dodge & Cox Funds. John has been with Dodge & Cox since 1972, and also serves as the firm’s CEO.
2006 PERFORMANCE REVIEW
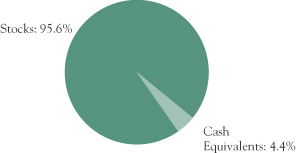
We are pleased to report that 2006 was the seventh consecutive year in which the Stock Fund outperformed the Standard & Poor’s 500 Index (S&P 500). The Fund returned 18.5% in 2006 compared to 15.8% for the S&P 500. At year end, the Fund had net assets of $66.2 billion, including a cash position of 4.4%.
Persistence and a long-term investment horizon are key components of our investment approach. In 2005,
our persistence was tested by the Fund’s Media stocks, which were among the Fund’s weakest performers. Persistence was rewarded in 2006, as these companies, which produce and/or deliver entertainment, data and telecommunication services, were some of the year’s strongest performers. For example, Comcast, which lost 22% in 2005, returned 63% in 2006; it was the Fund’s largest contributor and is now its largest holding. News Corp. (up 39%), Time Warner (up 26%) and the wireless telephone service provider, Vodafone (up 36%), were also strong contributors. Cable companies like Time Warner and Comcast are now competing directly with telecommunication services companies. The Fund has a higher weighting than the S&P 500 in Media (11% versus 3%), and a lower weighting in Telecommunication Services (2% versus 4% for the S&P 500). This higher weighting in Media helped the Fund’s performance relative to the S&P 500 in 2006, while the lower weighting in Telecommunications hurt.
The Fund’s Information Technology holdings, which were up 22% in aggregate versus 9% for those in the S&P 500, continued to contribute to the Fund’s relative returns in 2006. Standouts include the Fund’s second largest holding, Hewlett-Packard (up 45%) and a smaller position in BMC Software (up 57%). Information Technology stocks now comprise 14.6% of the Fund compared to 15.1% of the S&P 500. However, the Fund’s Technology holdings generally have much lower valuations than those in the S&P 500—as of year end the Fund’s Technology stocks were valued at an average price-to-sales (P/S) ratio of 0.9 times, while those in the S&P 500 traded at an average P/S of 2.6 times.
Detractors from the Fund’s relative performance included three of the Fund’s Japanese technology-related companies, Sony (up 6%), Matsushita (up 5%) and Hitachi (down 6%), which are not a part of the S&P 500 and lagged its return. Capital One Financial (down 11%) was the Fund’s single largest detractor for the year.
As always, we manage the Fund using a three-to-five year investment horizon, and encourage shareholders to focus on this longer time period.
| | | | |
| PAGE | | 1 n DODGE & COX STOCK FUND | | |
LOOKING FORWARD
Technological innovation and the spread of free market economic principles are facilitating the continued integration of the global economy and rapid expansion of the developing world. While there will undoubtedly be bumps in the road along the way, we don’t see these trends ending any time soon. Integration and growth in the global economy have had a profound impact on the companies in our investment universe, and consequently on how we conduct research at Dodge & Cox. For instance, 38 of the Fund’s U.S.-domiciled companies have at least 25% of their sales coming from overseas. These 38 U.S. companies represent 48% of the Fund’s assets. Some are also leaders in technological innovation (e.g., Motorola—70% of sales overseas, Hewlett-Packard—65%, Sun Microsystems—59%, Avaya—42%, Dell—35% and FedEx—25%), which are helping fuel the global expansion. Additionally, another 17% of the Fund is invested in 18 companies that are based outside the U.S. (all of which are traded on U.S. exchanges in U.S. dollars).
As U.S. companies have been increasing their sales internationally, we too have been expanding our research effort over the past ten years to include a global perspective. In fact, the decision to start our International Stock Fund in 2001 was made in part to improve our overall research effort for the benefit of all of our current clients—including the shareholders of the Stock Fund. Each of our 20 research analysts take a global view when covering their industries, and is responsible for making investment recommendations to the teams managing all four of the Dodge & Cox Funds.
IN CLOSING
We conclude with a thought about the future. While we remain optimistic about the long-term prospects for the world economy and confident in our ability to continue to implement our investment approach, the past seven years (roughly since the peak of the technology-led market bubble) have been exceptional for the Stock Fund compared to the broad market. Since the end of 1999, the Fund has returned an annualized 12.8% per year compared to 1.1% per year for the S&P 500. Over this time period, what were lower valuation stocks (primarily in the
Industrial, Materials and Energy sectors) have significantly outperformed what turned out to be overvalued stocks (primarily in the Information Technology, Media, Telecommunications and Health Care sectors).
Today, with valuations across all sectors of the market much more homogeneous, the possibility of the Fund outperforming the S&P 500 by such a wide margin going forward is remote. Indeed, outperforming the S&P 500 at all given this valuation landscape will be a formidable challenge. Moreover, we would like to remind shareholders that equity returns have historically been volatile; stock prices go up and down, and investors could lose money. Regardless of what happens in the near term, our team at Dodge & Cox will continue to focus on our three-to-five year investment horizon and work hard to uncover attractive opportunities.
Thank you for your continued confidence in our firm as a shareholder of the Dodge & Cox Stock Fund. As always, we welcome your comments and questions.
For the Board of Trustees,
| | |
 | | 
|
John A. Gunn, Chairman | | Kenneth E. Olivier, President |
February 9, 2007
| | | | | | |
| | DODGE & COX STOCK FUND n | | PAGE | | 2 |
A Message from Former Chairman Harry Hagey
On October 1, 1967, I began my career at Dodge & Cox. At that time, Dodge & Cox was a small independent regional investment counseling firm working with individuals, pension funds and endowment funds. In addition, the firm managed two small no-load mutual funds: the Dodge & Cox Balanced Fund and the Dodge & Cox Stock Fund. After 39 wonderful years at this firm, I am now retiring. I want to take this opportunity to first thank you, our mutual fund shareholders for the trust you have placed in our firm over the years; second, to thank all of my associates with whom I have had the pleasure of working; and finally, to provide you with my thoughts on the current status of the firm and my optimistic outlook for its future.
Let me summarize what I think are the key components that make Dodge & Cox a successful money management firm. First and most importantly, ethical considerations are paramount. We have an excellent reputation, and we work hard to maintain it. When making decisions about how we manage our firm, we always start by asking what is in the best interests of our current clients.
Second, we are in the single business of providing continuous high quality investment management service to our existing clients and shareholders. We decided a long time ago that we are not in business to provide a series of financial products to the investment marketplace. Through a team-oriented, long-term approach, our investment objective is to first preserve and then enhance the future purchasing power of our clients’ wealth over the long term. Over the years, I have often reminded my associates that there are literally millions of individuals counting on us.
A third important ingredient is our employees. We insist on a respect for each individual employee as well as for the entire firm. We work within a collegial environment with the goal of having all of our people think as owners, not just as employees. Our working environment has led to low employee turnover, which in turn, has created stability and continuity over the years.
Finally, with regard to the firm, probably the most important characteristic is our independence. We only report to the Fund’s shareholders, our clients and to ourselves. Ownership of Dodge & Cox is limited to the firm’s active employees, thus I have sold (at book value) my interest in Dodge & Cox back to the firm so my shares will now be available to those coming after me.
As for the future of Dodge & Cox, I am extremely optimistic. We have a deep and talented investment team across the board: domestic equity, international equity and fixed-income. I leave Dodge & Cox today as strong as it has ever been in our 76-year history. I have complete confidence that John Gunn, Ken Olivier, Dana Emery and others will act as responsible stewards of the firm’s unique culture.
On a personal note, the only investment options in the Dodge & Cox retirement plan are the Dodge & Cox Funds, so my own retirement assets have benefited from the Funds’ past results. I look forward to continuing on as a long-term shareholder of the Dodge & Cox Funds.
Thanks again for the confidence you have placed in our firm over the years.
Sincerely,

Harry R. Hagey
| | | | |
| PAGE | | 3 n DODGE & COX STOCK FUND | | |
| | |
GROWTH OF $10,000 OVER 10 YEARS FOR AN INVESTMENT MADE ON DECEMBER 31, 1996 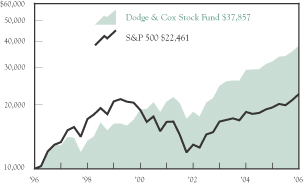
AVERAGE ANNUAL TOTAL RETURN FOR PERIODS ENDED DECEMBER 31, 2006 | | Past performance does not guarantee future results. Investment return and share price will fluctuate with market conditions, and investors may have a gain or loss when shares are sold. Mutual fund performance changes over time and currently may be significantly lower than stated above. Performance is updated and published monthly. Visit the Fund’s web site at www.dodgeandcox.com or call 1-800-621-3979 for current performance figures. The Fund’s total returns include the reinvestment of dividend and capital gain distributions, but have not been adjusted for any income taxes payable by shareholders on these distributions. The Standard & Poor’s 500 (S&P 500) is a broad-based unmanaged measure of common stocks. Index returns include dividends and/or interest income and, unlike Fund returns, do not reflect fees or expenses. Standard & Poor’s, Standard & Poor’s 500, and S&P 500® are trademarks of The McGraw-Hill Companies, Inc. |
| | | | | | | | | | | | |
| | | 1 Year | | | 5 Years | | | 10 Years | | | 20 Years | |
Dodge & Cox Stock Fund | | 18.54 | % | | 12.84 | % | | 14.23 | % | | 14.81 | % |
S&P 500 | | 15.79 | | | 6.18 | | | 8.42 | | | 11.80 | |
FUND EXPENSE EXAMPLE
As a Fund shareholder, you incur ongoing Fund costs, including management fees and other Fund expenses. All mutual funds have ongoing costs, sometimes referred to as operating expenses. The following example shows ongoing costs of investing in the Fund and can help you understand these costs and compare them with those of other mutual funds. The example assumes a $1,000 investment held for the six months indicated.
ACTUAL EXPENSES
The first line of the table below provides information about actual account values and expenses based on the Fund’s actual returns. You may use the information in this line, together with your account balance, to estimate the expenses that you paid over the period. Simply divide your account value by $1,000 (for example, an $8,600 account value divided by $1,000 = 8.6), then multiply the result by the number in the first line under the heading “Expenses Paid During Period” to estimate the expenses you paid on your account during this period.
HYPOTHETICAL EXAMPLE FOR COMPARISON WITH OTHER MUTUAL FUNDS
Information on the second line of the table can help you compare ongoing costs of investing in the Fund with those of other mutual funds. This information may not be used to estimate the actual ending account balance or expenses you paid during the period. The hypothetical “Ending Account Value” is based on the actual expense ratio of the Fund and an assumed 5% annual rate of return before expenses (not the Fund’s actual return). The amount under the heading “Expense Paid During the Period” shows the hypothetical expenses your account would have incurred under this scenario. You can compare this figure with the 5% hypothetical examples that appear in shareholder reports of other mutual funds.
| | | | | | | | | |
Six Months Ended
December 31, 2006 | | Beginning Account
Value 7/1/2006 | | Ending Account
Value 12/31/2006 | | Expenses Paid
During Period* |
Based on Actual Fund Return | | $ | 1,000.00 | | $ | 1,116.60 | | $ | 2.74 |
Based on Hypothetical 5% Yearly Return | | | 1,000.00 | | | 1,022.61 | | | 2.62 |
| * | | Expenses are equal to the Fund’s annualized six-month expense ratio of 0.51%, multiplied by the average account value over the period, multiplied by 184/365 (to reflect the one-half year period). |
The expenses shown in the table highlight ongoing costs only and do not reflect any transactional fees or account maintenance fees. While other mutual funds may charge such fees, please note that the Fund does not charge transaction fees (e.g., redemption fees, sales loads) or universal account maintenance fees (e.g., small account fees).
| | | | | | |
| | DODGE & COX STOCK FUND n | | PAGE | | 4 |
FUND INFORMATION | December 31, 2006 |
GENERAL INFORMATION
| | |
Net Asset Value Per Share | | $153.46 |
Total Net Assets (billions) | | $66.2 |
2006 Expense Ratio | | 0.52% |
2006 Portfolio Turnover Rate | | 14% |
30-Day SEC Yield(a) | | 1.26% |
Fund Inception | | 1965 |
No sales charges or distribution fees | | |
Investment Manager: Dodge & Cox, San Francisco. Managed by the Investment Policy Committee, whose nine members’ average tenure at Dodge & Cox is 21 years.
| | | | |
| PORTFOLIO CHARACTERISTICS | | FUND | | S&P 500 |
Number of Stocks | | 85 | | 500 |
Median Market Capitalization (billions) | | $26 | | $13 |
Weighted Average Market Capitalization (billions) | | $77 | | $103 |
Price-to-Earnings Ratio(b) | | 15.5x | | 15.3x |
Foreign Stocks(c) (% of Fund) | | 17.1% | | 0.0% |
| | | |
| TEN LARGEST HOLDINGS(d) | | | |
Comcast Corp. Class A | | 3.9 | % |
Hewlett-Packard Co. | | 3.7 | |
News Corp. Class A | | 3.0 | |
Time Warner, Inc. | | 2.8 | |
Pfizer, Inc. | | 2.8 | |
Wal-Mart Stores, Inc. | | 2.8 | |
Chevron Corp. | | 2.7 | |
Sanofi-Aventis ADR (France) | | 2.6 | |
Sony Corp. ADR (Japan) | | 2.6 | |
McDonald’s Corp. | | 2.5 | |
ASSET ALLOCATION
| | | | | | |
| SECTOR DIVERSIFICATION | | FUND | | | S&P 500 | |
Consumer Discretionary | | 22.2 | % | | 10.6 | % |
Information Technology | | 14.6 | | | 15.1 | |
Health Care | | 14.5 | | | 12.0 | |
Financials | | 13.9 | | | 22.3 | |
Energy | | 9.0 | | | 10.0 | |
Industrials | | 8.7 | | | 10.8 | |
Materials | | 5.2 | | | 3.0 | |
Consumer Staples | | 4.3 | | | 9.3 | |
Telecommunication Services | | 2.1 | | | 3.5 | |
Utilities | | 1.1 | | | 3.4 | |
(a) | | SEC Yield is an annualization of the Fund’s total net investment income per share for the 30-day period ended on the last day of the month. |
(b) | | Price-to-earnings (P/E) ratio is calculated using 12-month forward consensus earnings estimates. |
(c) | | Foreign stocks are U.S. dollar-denominated. |
(d) | | The Fund’s portfolio holdings are subject to change without notice. The mention of specific securities is not a recommendation or solicitation for any person to buy, sell or hold any particular security. |
| | | | |
| PAGE | | 5 n DODGE & COX STOCK FUND | | |
| | |
| PORTFOLIO OF INVESTMENTS | | December 31, 2006 |
| | | | | |
| COMMON STOCKS: 95.6% |
| | |
| | | SHARES | | VALUE |
| CONSUMER DISCRETIONARY: 22.2% |
| AUTOMOBILES & COMPONENTS: 0.5% | | | |
Honda Motor Co., Ltd. ADR(b) (Japan) | | 9,050,300 | | $ | 357,848,862 |
| | | | | |
| CONSUMER DURABLES & APPAREL: 5.9% |
Koninklijke Philips Electronics NV(b) (Netherlands) | | 8,600,000 | | | 323,188,000 |
Matsushita Electric Industrial Co., Ltd. ADR(b) (Japan) | | 69,064,700 | | | 1,387,509,823 |
Nike, Inc., Class B | | 3,625,000 | | | 358,983,750 |
Sony Corp. ADR(b) (Japan) | | 39,417,700 | | | 1,688,260,091 |
Thomson ADR(b) (France) | | 6,586,000 | | | 128,558,720 |
| | | | | |
| | | | | 3,886,500,384 |
| CONSUMER SERVICES: 2.5% |
McDonald’s Corp. | | 36,733,900 | | | 1,628,413,787 |
| | | | | |
| MEDIA: 11.0% |
Comcast Corp., Class A(a) | | 60,418,191 | | | 2,557,502,025 |
EchoStar Communications Corp.(a) | | 8,239,670 | | | 313,354,650 |
Interpublic Group of Companies, Inc.(a),(c) | | 27,499,200 | | | 336,590,208 |
Liberty Capital, Series A(a) | | 2,396,380 | | | 234,797,313 |
News Corp., Class A | | 91,295,238 | | | 1,961,021,712 |
Time Warner, Inc. | | 86,628,400 | | | 1,886,766,552 |
| | | | | |
| | | | | 7,290,032,460 |
| RETAILING: 2.3% |
Federated Department Stores, Inc. | | 11,119,006 | | | 423,967,699 |
Gap, Inc. | | 24,753,600 | | | 482,695,200 |
Genuine Parts Co.(c) | | 8,931,300 | | | 423,611,559 |
Liberty Interactive, Series A(a) | | 8,853,900 | | | 190,978,623 |
| | | | | |
| | | | | 1,521,253,081 |
| | | | | |
| | | | | 14,684,048,574 |
| CONSUMER STAPLES: 4.3% |
| FOOD & STAPLES RETAILING: 2.8% |
Wal-Mart Stores, Inc. | | 39,498,900 | | | 1,824,059,202 |
| | | | | |
| FOOD, BEVERAGE & TOBACCO: 1.0% |
Unilever NV(b) (Netherlands) | | 24,511,700 | | | 667,943,825 |
| | | | | |
| HOUSEHOLD & PERSONAL PRODUCTS: 0.5% |
Avon Products, Inc. | | 10,466,000 | | | 345,796,640 |
| | | | | |
| | | | | 2,837,799,667 |
| ENERGY: 9.0% |
Baker Hughes, Inc. | | 11,503,300 | | | 858,836,378 |
Chevron Corp. | | 24,196,971 | | | 1,779,203,278 |
ConocoPhillips | | 11,735,800 | | | 844,390,810 |
Exxon Mobil Corp. | | 9,203,500 | | | 705,264,205 |
Occidental Petroleum Corp. | | 10,277,800 | | | 501,864,974 |
Royal Dutch Shell PLC ADR(b) (United Kingdom) | | 10,407,864 | | | 740,519,523 |
Schlumberger, Ltd. | | 8,028,664 | | | 507,090,418 |
| | | | | |
| | | | | 5,937,169,586 |
| | | | | |
| |
| | |
| | | SHARES | | VALUE |
| FINANCIALS: 13.9% |
| BANKS: 3.1% |
Wachovia Corp. | | 28,295,214 | | $ | 1,611,412,437 |
Wells Fargo & Co. | | 12,061,000 | | | 428,889,160 |
| | | | | |
| | | | | 2,040,301,597 |
| DIVERSIFIED FINANCIALS: 3.5% |
Capital One Financial Corp. | | 13,183,778 | | | 1,012,777,826 |
Citigroup, Inc. | | 23,574,600 | | | 1,313,105,220 |
| | | | | |
| | | | | 2,325,883,046 |
| INSURANCE: 6.4% |
Aegon NV(b) (Netherlands) | | 35,594,301 | | | 674,512,004 |
Chubb Corp. | | 11,446,600 | | | 605,639,606 |
Genworth Financial, Inc., Class A | | 8,845,000 | | | 302,587,450 |
Loews Corp. | | 15,436,000 | | | 640,130,920 |
MBIA, Inc. | | 2,993,176 | | | 218,681,439 |
Safeco Corp. | | 5,545,000 | | | 346,839,750 |
St. Paul Travelers Companies, Inc. | | 22,745,350 | | | 1,221,197,841 |
UnumProvident Corp. | | 11,719,700 | | | 243,535,366 |
| | | | | |
| | | | | 4,253,124,376 |
| REAL ESTATE: 0.9% |
Equity Office Properties Trust(c) | | 12,381,900 | | | 596,436,123 |
| | | | | |
| | | | | 9,215,745,142 |
| HEALTH CARE: 14.5% |
| HEALTH CARE EQUIPMENT & SERVICES: 4.8% |
Becton, Dickinson & Co. | | 4,210,850 | | | 295,391,128 |
Cardinal Health, Inc.(c) | | 24,264,150 | | | 1,563,339,184 |
Health Management Associates, Inc.(c) | | 15,303,200 | | | 323,050,552 |
WellPoint, Inc.(a) | | 12,780,700 | | | 1,005,713,283 |
| | | | | |
| | | | | 3,187,494,147 |
| PHARMACEUTICALS & BIOTECHNOLOGY: 9.7% |
Bristol-Myers Squibb Co. | | 21,145,650 | | | 556,553,508 |
GlaxoSmithKline PLC ADR(b) (United Kingdom) | | 14,663,800 | | | 773,662,088 |
Pfizer, Inc. | | 71,009,345 | | | 1,839,142,035 |
Sanofi-Aventis ADR(b) (France) | | 37,579,000 | | | 1,735,022,430 |
Schering-Plough Corp. | | 19,939,600 | | | 471,372,144 |
Thermo Fisher Scientific, Inc.(a),(c) | | 9,111,300 | | | 412,650,777 |
Wyeth | | 12,139,900 | | | 618,163,708 |
| | | | | |
| | | | | 6,406,566,690 |
| | | | | |
| | | | | 9,594,060,837 |
| INDUSTRIALS: 8.7% |
| CAPITAL GOODS: 4.0% |
American Power Conversion Corp.(c) | | 13,409,652 | | | 410,201,255 |
General Electric Co. | | 17,100,000 | | | 636,291,000 |
Masco Corp. | | 12,908,500 | | | 385,576,895 |
Tyco International, Ltd. | | 31,065,500 | | | 944,391,200 |
Volvo AB ADR(b) (Sweden) | | 3,751,400 | | | 258,171,348 |
| | | | | |
| | | | | 2,634,631,698 |
| | | | | | |
| See accompanying Notes to Financial Statements | | DODGE & COX STOCK FUND n | | PAGE | | 6 |
| | |
| PORTFOLIO OF INVESTMENTS | | December 31, 2006 |
| | | | | |
| COMMON STOCKS (continued) |
| | |
| | | SHARES | | VALUE |
| COMMERCIAL SERVICES & SUPPLIES: 0.7% |
Pitney Bowes, Inc. | | 9,412,850 | | $ | 434,779,541 |
| | | | | |
| TRANSPORTATION: 4.0% | | |
FedEx Corp. | | 11,756,300 | | | 1,276,969,306 |
Union Pacific Corp.(c) | | 15,120,650 | | | 1,391,402,213 |
| | | | | |
| | | | | 2,668,371,519 |
| | | | | |
| | | | | 5,737,782,758 |
| INFORMATION TECHNOLOGY: 14.6% |
| SOFTWARE & SERVICES: 3.7% | | |
BMC Software, Inc.(a),(c) | | 10,876,500 | | | 350,223,300 |
Computer Sciences Corp.(a),(c) | | 12,858,900 | | | 686,279,493 |
Compuware Corp.(a),(c) | | 19,312,600 | | | 160,873,958 |
EBay, Inc.(a) | | 9,921,098 | | | 298,327,417 |
Electronic Data Systems Corp.(c) | | 34,711,300 | | | 956,296,315 |
| | | | | |
| | | | | 2,452,000,483 |
| TECHNOLOGY, HARDWARE & EQUIPMENT: 10.9% |
Avaya, Inc.(a),(c) | | 31,094,924 | | | 434,707,038 |
Dell, Inc.(a) | | 28,739,033 | | | 721,062,338 |
Hewlett-Packard Co. | | 59,785,534 | | | 2,462,566,145 |
Hitachi, Ltd. ADR(b) (Japan) | | 10,339,800 | | | 644,789,928 |
Kyocera Corp. ADR(b) (Japan) | | 61,400 | | | 5,826,246 |
Motorola, Inc. | | 50,722,100 | | | 1,042,846,376 |
NCR Corp.(a) | | 7,220,300 | | | 308,740,028 |
Nortel Networks Corp.(a),(b) (Canada) | | 3,182,149 | | | 85,058,843 |
Sun Microsystems, Inc.(a) | | 83,364,900 | | | 451,837,758 |
Xerox Corp.(a),(c) | | 63,334,900 | | | 1,073,526,555 |
| | | | | |
| | | | | 7,230,961,255 |
| | | | | |
| | | | | 9,682,961,738 |
| MATERIALS: 5.2% |
Akzo Nobel NV ADR(b),(c) (Netherlands) | | 12,807,223 | | | 779,575,664 |
Alcoa, Inc. | | 8,360,683 | | | 250,904,097 |
Cemex SAB de CV ADR(b) (Mexico) | | 6,000,000 | | | 203,280,000 |
Dow Chemical Co. | | 33,089,980 | | | 1,321,613,801 |
International Paper Co. | | 7,673,400 | | | 261,662,940 |
Nova Chemicals Corp.(b),(c) (Canada) | | 4,740,470 | | | 132,259,113 |
Rohm and Haas Co. | | 9,162,100 | | | 468,366,552 |
| | | | | |
| | | | | 3,417,662,167 |
| TELECOMMUNICATION SERVICES: 2.1% |
Sprint Nextel Corp. | | 37,000,000 | | | 698,930,000 |
Vodafone Group PLC ADR(b) (United Kingdom) | | 25,799,637 | | | 716,713,916 |
| | | | | |
| | | | | 1,415,643,916 |
| UTILITIES: 1.1% |
Duke Energy Corp. | | 14,083,600 | | | 467,716,356 |
FirstEnergy Corp. | | 4,474,700 | | | 269,824,410 |
| | | | | |
| | | | | 737,540,766 |
| | | | | |
TOTAL COMMON STOCKS (Cost $44,711,425,489) | | | 63,260,415,151 |
| | | | | |
| | | | | | | | |
| SHORT-TERM INVESTMENTS: 4.5% | |
| | |
| | | PAR VALUE | | | VALUE | |
SSgA Prime Money Market Fund | | $ | 63,615,990 | | | $ | 63,615,990 | |
State Street Repurchase Agreement 4.40%, 1/2/07, maturity value $1,884,901,057 (collateralized by U.S. Treasury Securities, value $1,921,675,344, 3.50%-8.125%, 6/30/08-8/15/25) | | | 1,883,980,000 | | | | 1,883,980,000 | |
U.S. Treasury Bills | | | | | | | | |
1/4/07 | | | 225,000,000 | | | | 224,910,375 | |
1/11/07 | | | 150,000,000 | | | | 149,801,875 | |
1/18/07 | | | 150,000,000 | | | | 149,663,542 | |
2/1/07 | | | 100,000,000 | | | | 99,597,000 | |
3/29/07 | | | 225,000,000 | | | | 222,381,844 | |
4/5/07 | | | 225,000,000 | | | | 222,182,937 | |
| | | | | | | | |
TOTAL SHORT-TERM INVESTMENTS
(Cost $3,016,133,563) | | | | 3,016,133,563 | |
| | | | | | | | |
TOTAL INVESTMENTS
(Cost $47,727,559,052) | | | 100.1 | % | | | 66,276,548,714 | |
OTHER ASSETS, LESS LIABILITIES | | | (0.1 | %) | | | (91,542,745 | ) |
| | | | | | | | |
TOTAL NET ASSETS | | | 100.0 | % | | $ | 66,185,005,969 | |
| | | | | | | | |
(b) | | Security issued by a foreign entity, denominated in U.S. dollars |
(c) | | See Note 6 regarding holdings of 5% voting securities |
ADR: American Depository Receipt
| | | | |
| PAGE | | 7 n DODGE & COX STOCK FUND | | See accompanying Notes to Financial Statements |
STATEMENT OF ASSETS AND LIABILITIES
| | | |
| |
| | | December 31, 2006 |
| ASSETS: | | | |
Investments, at value | | | |
Unaffiliated issuers (cost $41,860,195,839) | | $ | 58,034,187,971 |
Affiliated issuers (cost $5,867,363,213) | | | 8,242,360,743 |
| | | |
| | | 66,276,548,714 |
Receivable for investments sold | | | 12,278,073 |
Receivable for Fund shares sold | | | 158,347,018 |
Dividends and interest receivable | | | 79,072,550 |
Prepaid expenses and other assets | | | 285,405 |
| | | |
| | | 66,526,531,760 |
| | | |
| LIABILITIES: | | | |
Payable for investments purchased | | | 207,008,468 |
Payable for Fund shares redeemed | | | 104,251,297 |
Management fees payable | | | 28,008,136 |
Accrued expenses | | | 2,257,890 |
| | | |
| | | 341,525,791 |
| | | |
| NET ASSETS | | $ | 66,185,005,969 |
| | | |
| NET ASSETS CONSIST OF: | | | |
Paid in capital | | $ | 47,155,224,331 |
Undistributed net investment income | | | 17,897,360 |
Undistributed net realized gain on investments | | | 462,894,616 |
Net unrealized appreciation on investments | | | 18,548,989,662 |
| | | |
| | $ | 66,185,005,969 |
| | | |
Fund shares outstanding (par value $0.01 each, unlimited shares authorized) | | | 431,292,690 |
Net asset value per share | | | $153.46 |
|
| STATEMENT OF OPERATIONS |
| | | Year Ended
December 31, 2006 |
| INVESTMENT INCOME: | | | |
Dividends (net of foreign taxes of $15,774,039) | | | |
Unaffiliated issuers | | $ | 926,167,606 |
Affiliated issuers | | | 95,238,561 |
Interest | | | 147,445,426 |
| | | |
| | | 1,168,851,593 |
| | | |
| EXPENSES: | | | |
Management fees | | | 293,203,489 |
Custody and fund accounting fees | | | 817,752 |
Transfer agent fees | | | 5,691,729 |
Professional services | | | 79,160 |
Shareholder reports | | | 2,383,526 |
Registration fees | | | 631,651 |
Trustees’ fees | | | 167,500 |
Miscellaneous | | | 356,855 |
| | | |
| | | 303,331,662 |
| | | |
| NET INVESTMENT INCOME | | | 865,519,931 |
| | | |
REALIZED AND UNREALIZED GAIN
ON INVESTMENTS: |
Net realized gain | | | |
Unaffiliated issuers | | | 2,154,293,941 |
Affiliated issuers | | | 1,055,073,324 |
Net change in unrealized appreciation | | | 5,995,600,442 |
| | | |
Net realized and unrealized gain | | | 9,204,967,707 |
| | | |
NET INCREASE IN NET ASSETS
FROM OPERATIONS | | $ | 10,070,487,638 |
| | | |
STATEMENT OF CHANGES IN NET ASSETS
| | | | | | | | |
| | |
| | | Year Ended December 31, 2006 | | | Year Ended December 31, 2005 | |
| OPERATIONS: | | | | | | | | |
Net investment income | | $ | 865,519,931 | | | $ | 605,010,646 | |
Net realized gain | | | 3,209,367,265 | | | | 1,130,060,343 | |
Net change in unrealized appreciation | | | 5,995,600,442 | | | | 2,657,836,787 | |
| | | | | | | | |
Net increase in net assets from operations | | | 10,070,487,638 | | | | 4,392,907,776 | |
| | | | | | | | |
| |
DISTRIBUTIONS TO SHAREHOLDERS FROM: | | | | | |
Net investment income | | | (850,295,361 | ) | | | (611,260,756 | ) |
Net realized gain | | | (2,847,558,997 | ) | | | (1,222,133,564 | ) |
| | | | | | | | |
Total distributions | | | (3,697,854,358 | ) | | | (1,833,394,320 | ) |
| | | | | | | | |
| | |
FUND SHARE TRANSACTIONS: | | | | | | | | |
Proceeds from sale of shares | | | 10,571,607,422 | | | | 9,806,907,602 | |
Reinvestment of distributions | | | 3,483,584,887 | | | | 1,700,707,781 | |
Cost of shares redeemed | | | (6,427,028,935 | ) | | | (5,149,262,920 | ) |
| | | | | | | | |
Net increase from Fund share transactions | | | 7,628,163,374 | | | | 6,358,352,463 | |
| | | | | | | | |
Total increase in net assets | | | 14,000,796,654 | | | | 8,917,865,919 | |
| | |
| NET ASSETS: | | | | | | | | |
Beginning of year | | | 52,184,209,315 | | | | 43,266,343,396 | |
| | | | | | | | |
End of year (including undistributed net investment income of $17,897,360 and $2,672,790, respectively) | | $ | 66,185,005,969 | | | $ | 52,184,209,315 | |
| | | | | | | | |
| | |
| SHARE INFORMATION: | | | | | | | | |
Shares sold | | | 71,830,464 | | | | 74,426,365 | |
Distributions reinvested | | | 22,836,316 | | | | 12,641,751 | |
Shares redeemed | | | (43,682,824 | ) | | | (39,005,611 | ) |
| | | | | | | | |
Net increase in shares outstanding | | | 50,983,956 | | | | 48,062,505 | |
| | | | | | | | |
| | | | | | |
| See accompanying Notes to Financial Statements | | DODGE & COX STOCK FUND n | | PAGE | | 8 |
NOTES TO FINANCIAL STATEMENTS
NOTE 1—ORGANIZATION AND SIGNIFICANT ACCOUNTING POLICIES
Dodge & Cox Stock Fund (the “Fund”) is one of the series constituting the Dodge & Cox Funds (the “Trust” or the “Funds”). The Trust is organized as a Delaware statutory trust and is registered under the Investment Company Act of 1940, as amended, as a diversified, open-end management investment company. The Fund commenced operations on January 4, 1965, and seeks long-term growth of principal and income. Risk considerations and investment strategies of the Fund are discussed in the Fund’s Prospectus. The Fund is closed to new investors.
The financial statements have been prepared in conformity with accounting principles generally accepted in the United States of America, which require the use of estimates and assumptions by management. Significant accounting policies are as follows:
Security valuation The Fund’s net assets are valued as of the close of trading on the New York Stock Exchange (NYSE), generally 4:00 p.m. Eastern Time, each day that the NYSE is open for business. Stocks are valued at the official quoted close price or the last sale of the day at the close of the NYSE or, if not available, at the mean between the exchange listed bid and ask prices for the day. A security that is listed or traded on more than one exchange is valued at the quotation on the exchange determined to be the primary market for such security. Security values are not discounted based on the size of the Fund’s position. Securities for which market quotations are not readily available are valued at fair value as determined in good faith by or at the direction of the Board of Trustees. Short-term securities are valued at amortized cost which approximates current value. All securities held by the Fund are denominated in U.S. dollars.
Security transactions, investment income, expenses, and distributions Security transactions are recorded on the trade date. Realized gains and losses on securities sold are determined on the basis of identified cost.
Dividend income and corporate action transactions are recorded on the ex-dividend date, except for certain dividends or corporate actions from foreign securities where the ex-dividend date may have passed, which are
recorded as soon as the Fund is informed of the ex-dividend date. Withholding taxes on foreign dividends have been provided for in accordance with the Fund’s understanding of the applicable country’s tax rules and rates. Non-cash dividends included in dividend income, if any, are recorded at the fair market value of the securities received. Distributions received in excess of income are recorded as a reduction of cost of investments and/or realized gain. The Fund may estimate the character of distributions received from Real Estate Investment Trusts (“REITs”). Interest income is recorded on the accrual basis.
Expenses are recorded on the accrual basis. Most expenses of the Trust can be directly attributed to a specific series. Expenses which cannot be directly attributed are apportioned among the Funds in the Trust.
Distributions to shareholders are recorded on the ex-dividend date.
Repurchase agreements The Fund may enter into repurchase agreements secured by U.S. government securities which involve the purchase of securities from a counterparty with a simultaneous commitment to resell the securities at an agreed-upon date and price. It is the Fund’s policy that its custodian take possession of the underlying collateral securities, the fair value of which exceeds the principal amount of the repurchase transaction, including accrued interest, at all times. In the event of default by the counterparty, the Fund has the contractual right to liquidate the securities and to apply the proceeds in satisfaction of the obligation.
NOTE 2—RELATED PARTY TRANSACTIONS
Management fees Under a written agreement approved by a unanimous vote of the Board of Trustees, the Fund pays an annual management fee of 0.50% of the Fund’s average daily net assets to Dodge & Cox, investment manager of the Fund. The agreement further provides that Dodge & Cox shall waive its fee to the extent that such fee plus all other ordinary operating expenses of the Fund exceed 0.75% of the average daily net assets for the year.
Fund officers and trustees All officers and three of the trustees of the Trust are officers or employees of Dodge & Cox. The Trust pays a fee only to those trustees who are not affiliated with Dodge & Cox.
| | | | |
| PAGE | | 9 n DODGE & COX STOCK FUND | | |
NOTES TO FINANCIAL STATEMENTS
Indemnification Under the Trust’s organizational documents, its officers and trustees are indemnified against certain liabilities arising out of the performance of their duties to the Trust. In addition, in the normal course of business the Trust enters into contracts that provide general indemnities to other parties. The Trust’s maximum exposure under these arrangements is unknown as this would involve future claims that may be made against the Trust that have not yet occurred.
NOTE 3—INCOME TAX INFORMATION
A provision for federal income taxes is not required since the Fund intends to continue to qualify as a regulated investment company under Subchapter M of the Internal Revenue Code and distribute all of its taxable income to shareholders. Distributions are determined in accordance with income tax regulations, which may differ from net investment income and realized gains for financial reporting purposes. Financial reporting records are adjusted for permanent book/tax differences to reflect tax character. Financial records are not adjusted for temporary differences.
Book/tax differences are primarily due to differing treatments of net short-term realized gain. At December 31, 2006, the cost of investments for federal income tax purposes was equal to the cost for financial reporting purposes.
Distributions during the year ended December 31, 2006 and 2005 were characterized as follows for federal income tax purposes:
| | | | |
| | | 2006 | | 2005 |
Ordinary income | | $952,202,374 | | $697,551,960 |
| | ($2.367 per share) | | ($1.941 per share) |
| | |
Long-term capital gain | | $2,745,651,984 | | $1,135,842,360 |
| | ($6.663 per share) | | ($3.094 per share) |
At December 31, 2006, the tax basis components of distributable earnings were as follows:
| | | | |
Unrealized appreciation | | $ | 18,637,037,433 | |
Unrealized depreciation | | | (88,047,771 | ) |
| | | | |
Net unrealized appreciation | | | 18,548,989,662 | |
Undistributed ordinary income | | | 63,362,945 | |
Undistributed long-term capital gain | | | 417,429,031 | |
NOTE 4—PURCHASES AND SALES OF INVESTMENTS
For the year ended December 31, 2006, purchases and sales of securities, other than short-term securities, aggregated $12,153,934,290 and $7,856,174,279, respectively.
NOTE 5—ACCOUNTING PRONOUNCEMENTS
In July 2006, the Financial Accounting Standards Board (FASB) issued Interpretation 48, “Accounting for Uncertainty in Income Taxes” (FIN 48). FIN 48 clarifies the accounting for income taxes by prescribing the minimum recognition threshold a tax position must meet before being recognized in the financial statements. FIN 48 is effective for the Fund beginning June 29, 2007. The impact to the Fund’s financial statements, if any, has not yet been determined.
In September 2006, FASB issued “Statement of Financial Accounting Standards No. 157, Fair Value Measurements” (SFAS 157). SFAS 157 is effective for the Fund beginning January 1, 2008. It defines fair value, establishes a framework for measuring fair value and expands disclosures about fair value measurements. Management is currently evaluating the impact the adoption of SFAS 157 will have on the Fund’s financial statement disclosures.
| | | | | | |
| | DODGE & COX STOCK FUND n | | PAGE | | 10 |
NOTES TO FINANCIAL STATEMENTS
NOTE 6—HOLDINGS OF 5% VOTING SECURITIES
Each of the companies listed below is considered to be an affiliate of the Fund because the Fund owned 5% or more of the company’s voting securities during the year ended December 31, 2006. Transactions during the year in securities of affiliated companies were as follows:
| | | | | | | | | | | | | | | | | |
| | | Shares at
Beginning of Year | | Additions | | Reductions | | | Shares at
End of Year | | Dividend
Income(a) | | | Value at
End of Year | |
Akzo Nobel NV ADR (Netherlands) | | 16,294,523 | | 4,500 | | (3,491,800 | ) | | 12,807,223 | | $ | 16,566,335 | | | $ | — | (c) |
American Power Conversion Corp. | | 6,347,281 | | 7,062,371 | | — | | | 13,409,652 | | | 4,117,084 | | | | 410,201,255 | |
Avaya, Inc. | | 31,552,500 | | 13,800 | | (471,376 | ) | | 31,094,924 | | | — | (b) | | | 434,707,038 | |
BMC Software, Inc. | | 15,440,000 | | 5,500 | | (4,569,000 | ) | | 10,876,500 | | | — | (b) | | | 350,223,300 | |
Cardinal Health, Inc. | | 20,444,350 | | 3,819,800 | | | | | 24,264,150 | | | 7,136,858 | | | | 1,563,339,184 | |
Computer Sciences Corp. | | 12,853,900 | | 5,000 | | — | | | 12,858,900 | | | — | (b) | | | 686,279,493 | |
Compuware Corp. | | 19,297,600 | | 15,000 | | — | | | 19,312,600 | | | — | (b) | | | 160,873,958 | |
Dillard's, Inc., Class A | | 5,161,600 | | — | | (5,161,600 | ) | | — | | | 138,245 | | | | — | (c) |
Electronic Data Systems Corp. | | 34,697,300 | | 14,000 | | — | | | 34,711,300 | | | 6,940,860 | | | | 956,296,315 | |
Engelhard Corp. | | 8,265,600 | | — | | (8,265,600 | ) | | — | | | 991,872 | | | | — | (c) |
Equity Office Properties Trust | | 23,332,200 | | 9,000 | | (10,959,300 | ) | | 12,381,900 | | | 13,512,046 | | | | — | (c) |
Fluor Corp. | | 4,362,050 | | — | | (4,362,050 | ) | | — | | | — | | | | — | (c) |
Genuine Parts Co. | | 8,926,300 | | 5,000 | | — | | | 8,931,300 | | | 12,053,880 | | | | 423,611,559 | |
HCA, Inc. | | 20,475,800 | | 3,409,000 | | (23,884,800 | ) | | — | | | 10,663,672 | | | | — | (c) |
Health Management Associates, Inc. | | — | | 15,303,200 | | — | | | 15,303,200 | | | 2,262,024 | | | | 323,050,552 | |
Interpublic Group of Companies, Inc. | | 17,478,300 | | 10,020,900 | | — | | | 27,499,200 | | | — | (b) | | | 336,590,208 | |
Nova Chemicals Corp. (Canada) | | 4,737,970 | | 2,500 | | — | | | 4,740,470 | | | 1,423,882 | | | | 132,259,113 | |
Thermo Fisher Scientific, Inc. | | 8,906,800 | | 204,500 | | — | | | 9,111,300 | | | — | (b) | | | — | (c) |
Union Pacific Corp. | | 14,815,250 | | 305,400 | | — | | | 15,120,650 | | | 17,901,540 | | | | 1,391,402,213 | |
Whirlpool Corp. | | 3,558,750 | | — | | (3,558,750 | ) | | — | | | 1,530,263 | | | | — | (c) |
Xerox Corp. | | 64,118,600 | | 27,000 | | (810,700 | ) | | 63,334,900 | | | — | (b) | | | 1,073,526,555 | |
| | | | | | | | | | | | | | | | | |
| | | | | | | | | | | $ | 95,238,561 | | | $ | 8,242,360,743 | |
| | | | | | | | | | | | | | | | | |
(a) | | Net of foreign taxes, if any |
(c) | | Company was not an affiliate at the end of the year |
| | | | |
| PAGE | | 11 n DODGE & COX STOCK FUND | | |
FINANCIAL HIGHLIGHTS
| | | | | | | | | | | | | | | |
SELECTED DATA AND RATIOS (for a share outstanding throughout each year) | | Year Ended December 31, | |
| | | 2006 | | | 2005 | | | 2004 | | | 2003 | | | 2002 | |
Net asset value, beginning of year | | $137.22 | | | $130.22 | | | $113.78 | | | $ 88.05 | | | $100.51 | |
Income from investment operations: | | | | | | | | | | | | | | | |
Net investment income | | 2.15 | | | 1.68 | | | 1.54 | | | 1.60 | | | 1.53 | |
Net realized and unrealized gain (loss) | | 23.12 | | | 10.36 | | | 20.08 | | | 26.59 | | | (12.06 | ) |
| | | | | | | | | | | | | | | |
Total from investment operations | | 25.27 | | | 12.04 | | | 21.62 | | | 28.19 | | | (10.53 | ) |
| | | | | | | | | | | | | | | |
Distributions to shareholders from: | | | | | | | | | | | | | | | |
Net investment income | | (2.12 | ) | | (1.70 | ) | | (1.53 | ) | | (1.62 | ) | | (1.51 | ) |
Net realized gain | | (6.91 | ) | | (3.34 | ) | | (3.65 | ) | | (0.84 | ) | | (0.42 | ) |
| | | | | | | | | | | | | | | |
Total distributions | | (9.03 | ) | | (5.04 | ) | | (5.18 | ) | | (2.46 | ) | | (1.93 | ) |
| | | | | | | | | | | | | | | |
Net asset value, end of year | | $153.46 | | | $137.22 | | | $130.22 | | | $113.78 | | | $ 88.05 | |
| | | | | | | | | | | | | | | |
Total return | | 18.54 | % | | 9.36 | % | | 19.16 | % | | 32.35 | % | | (10.52 | )% |
Ratios/supplemental data: | | | | | | | | | | | | | | | |
Net assets, end of year (millions) | | $66,185 | | | $52,184 | | | $43,266 | | | $29,437 | | | $14,036 | |
Ratios of expenses to average net assets | | 0.52 | % | | 0.52 | % | | 0.53 | % | | 0.54 | % | | 0.54 | % |
Ratios of net investment income to average net assets | | 1.48 | % | | 1.29 | % | | 1.32 | % | | 1.72 | % | | 1.74 | % |
Portfolio turnover rate | | 14 | % | | 12 | % | | 11 | % | | 8 | % | | 13 | % |
See accompanying Notes to Financial Statements.
REPORT OF INDEPENDENT REGISTERED PUBLIC ACCOUNTING FIRM
To the Trustees of Dodge & Cox Funds and Shareholders of Dodge & Cox Stock Fund
In our opinion, the accompanying statement of assets and liabilities, including the portfolio of investments, and the related statements of operations and of changes in net assets and the financial highlights present fairly, in all material respects, the financial position of the Dodge & Cox Stock Fund (the “Fund”, one of the series constituting Dodge & Cox Funds) at December 31, 2006, the results of its operations for the year then ended, the changes in its net assets for each of the two years in the period then ended and the financial highlights for each of the five years in the period then ended, in conformity with accounting principles generally accepted in the United States of America. These financial statements and financial highlights (hereafter referred to as “financial statements”) are the responsibility of the Fund’s management; our responsibility is to express an opinion on these financial statements based on our audits. We conducted our audits of these financial statements in accordance with the standards of the Public Company Accounting Oversight Board (United States). Those standards require that we plan and perform the audit to obtain reasonable assurance about whether the financial statements are free of material misstatement. An audit includes examining, on a test basis, evidence supporting the amounts and disclosures in the financial statements, assessing the accounting principles used and significant estimates made by management, and evaluating the overall financial statement presentation. We believe that our audits, which included confirmation of securities at December 31, 2006 by correspondence with the custodian and brokers, provide a reasonable basis for our opinion.
PricewaterhouseCoopers LLP
San Francisco, California
February 9, 2007
| | | | | | |
| | DODGE & COX STOCK FUND n | | PAGE | | 12 |
SPECIAL 2006 TAX INFORMATION (unaudited)
The following information is provided pursuant to provisions of the Internal Revenue Code:
The Fund designates up to a maximum amount of $1,007,797,883 of its distributions paid to shareholders in 2006 as qualified dividends (treated for federal income tax purposes in the hands of shareholders as taxable at a maximum rate of 15%).
For shareholders that are corporations, the Fund designates 68% of its ordinary dividends (including short-term gains) paid to shareholders in 2006 as dividends from domestic corporations eligible for the corporate dividends received deduction, provided that the shareholder otherwise satisfies applicable requirements to claim that deduction.
BOARD APPROVAL OF FUNDS’ INVESTMENT MANAGEMENT AGREEMENTS AND MANAGEMENT FEES (unaudited)
The Board of Trustees is responsible for overseeing the performance of the Dodge & Cox Funds’ investment manager and determining whether to continue the Investment Management Agreements between the Funds and Dodge & Cox each year (the “Agreements”). At a meeting of the Board of Trustees of the Trust held on December 14, 2006, the Trustees, by a unanimous vote (including a separate vote of those Trustees who are not “interested persons” (as defined in the Investment Company Act of 1940) (the “Independent Trustees”)), approved the renewal of the Agreements for an additional one-year term through December 31, 2007. During the course of the year, the Board received a wide variety of materials relating to the services provided by Dodge & Cox and the performance of the Funds.
INFORMATION RECEIVED
In advance of the meeting, the Board, including each of the Independent Trustees, requested, received and reviewed materials relating to the Agreements. The Independent Trustees retained Morningstar® to prepare an independent expense and performance summary for each Fund and comparable funds managed by other advisers identified by Morningstar®. The Morningstar® materials
included information regarding advisory fee rates, expense ratios, and transfer agency, custodial and distribution expenses, as well as performance comparisons to an appropriate index or combination of indices. The materials reviewed by the Board also included information concerning Dodge & Cox’s profitability, financial results and condition, including advisory fee revenue and separate account advisory fee schedules. The Board additionally considered the Funds’ brokerage commissions, turnover rates and sales and redemption data for the Funds, including “soft dollar” payments made for research benefiting the Funds and other accounts managed by Dodge & Cox, and brokerage commissions and expenses paid by Dodge & Cox. Other aspects of Dodge & Cox’s services to the Funds which were reviewed included compliance and supervision of third-party service providers (e.g., custodian, fund accountant, transfer agent and state registration administrator), shareholder servicing, accounting and administrative services, web services, the character of non-advisory services, the record of compliance with the Funds’ investment policies and restrictions and the Funds’ Code of Ethics, investment management staffing and biographies, information furnished to investors and shareholders (including the Funds’ prospectus, Statement of Additional Information, shareholder reports, and quarterly reports), and third-party retirement plan administrator reimbursements by Dodge & Cox for the same periods.
The Board received copies of the Agreements and a memorandum from the Independent Legal Counsel to the Independent Trustees, discussing the factors generally regarded as appropriate to consider in evaluating advisory arrangements. The Trust’s Governance Committee, consisting solely of Independent Trustees, met with the Independent Legal Counsel on November 28, 2006 and again on December 14, 2006 to discuss whether to renew the Agreements. The Board, including the Independent Trustees, subsequently concluded that the existing Agreements are fair and reasonable and voted to approve the Agreements.
In considering the Agreements, the Board, including the Independent Trustees, did not identify any single factor or particular information as all-important or controlling. In reaching the decision to approve the
| | | | |
| PAGE | | 13 n DODGE & COX STOCK FUND | | |
Agreements, the Board, which was advised by Independent Legal Counsel, considered the following factors, among others, and reached the conclusions described below.
NATURE, QUALITY, AND EXTENT OF THE SERVICES
The Board considered the nature, quality and extent of portfolio management, administrative and shareholder services performed by Dodge & Cox, including: Dodge & Cox’s established long-term history of care and conscientiousness in the management of the Funds; demonstrated consistency in investment approach and depth, background and experience of the Dodge & Cox Investment Policy Committee, International Investment Policy Committee, Fixed Income Investment Policy Committee and research analysts responsible for managing the Funds; Dodge & Cox’s organizational structure; frequent favorable recognition of Dodge & Cox and the Funds in the media and industry publications; Dodge & Cox’s performance in the areas of compliance, administration and shareholder communication and services, supervision of Fund operations and general oversight of other service providers; favorable peer group comparisons of expense ratios, management fee comparisons, expenses (e.g., transfer agent, custody and other fees and expenses) and asset comparisons and performance and risk summaries prepared independently by Morningstar® and favorable fiduciary grade and “Star” rankings by Morningstar®. The Board also acknowledged Dodge & Cox’s decision to close its institutional equity and balanced separate account business to new accounts and had previously voted, at the recommendation of Dodge & Cox, to close the Stock and Balanced Funds to control the pace of growth. The Board also acknowledged that the services provided by Dodge & Cox are extensive in nature and that Dodge & Cox consistently delivered a high level of service. The Board concluded that it was satisfied with the nature, extent and quality of investment management and other services provided to the Funds by Dodge & Cox.
INVESTMENT PERFORMANCE
The Board considered short-term and long-term investment performance for each Fund (including periods
of outperformance or underperformance) as compared to both relevant indices and the performance of such Fund’s peer group. The performance information prepared by Morningstar® and Dodge & Cox demonstrated to the Board a consistent pattern of favorable performance for investors and, in most instances, the Funds have outperformed their peer groups for short and long-term periods. The Board considered that the performance of the Funds is the result of an investment management process that emphasizes a long-term investment horizon, independence, comprehensive research, price discipline and focus. The Board also noted that the strong investment performance delivered by Dodge & Cox to the Funds appeared to be consistent with the performance delivered for other (non-fund) clients of Dodge & Cox. The Board concluded that Dodge & Cox delivers favorable performance for Fund investors consistent with the long-term investment strategies being pursued by the Funds.
COSTS AND ANCILLARY BENEFITS
Costs of Services to Funds: Fees and Expenses. The Board considered each Fund’s management fee rates and expense ratios relative to industry averages for similar mutual funds and relative to management fees charged by Dodge & Cox to other (non-fund) clients. The Board evaluated the operating structures of the Funds and Dodge & Cox, including the following: Dodge & Cox has a centralized focus on investment management operations and derives revenue solely from management fees; its outsourcing of non-advisory support services to unaffiliated third-party service providers is efficient and less costly to investors; Dodge & Cox does not charge front-end sales commissions or distribution fees and bears all distribution-related costs as well as reimbursements to third-party retirement plan administrators; the Funds receive numerous administrative, regulatory compliance, and shareholder support services from Dodge & Cox without any additional administrative fee; and the fact that the Funds have relatively low transaction costs and portfolio turnover rates. The Board noted that the Funds are substantially below peer group averages in expense ratios and management fee rates. The Board also noted that the range of services under the Agreements is much more
| | | | | | |
| | DODGE & COX STOCK FUND n | | PAGE | | 14 |
extensive than under Dodge & Cox’s separate advisory (non-fund) client agreements, and considered that, when coupled with the greater risks and regulatory burdens associated with the high profile mutual fund business, there is reasonable justification for differences in fee rates charged between the two lines of business. The Board concluded that costs incurred by the Funds for the services they receive (including the management fee paid to Dodge & Cox) are reasonable and that the fees are acceptable based upon the qualifications, experience, reputation and performance of Dodge & Cox and the low overall expense ratios of the Funds.
Profitability and Costs of Services to Dodge & Cox; “Fall-out” Benefits. The Board reviewed reports of Dodge & Cox’s financial position, profitability and estimated overall value, and they considered Dodge & Cox’s overall profitability within its context as a private, employee-owned S-Corporation and relative to the favorable services provided. The Board considered recent increases to Dodge & Cox’s gross revenues, and noted the importance of Dodge & Cox’s profitability—which is derived solely from management fees and does not include other business ventures—to maintain its independence, company culture and ethics, and management continuity. They noted that Dodge & Cox’s profitability is enhanced due to its efficient internal business model, and that the compensation/profit structure at Dodge & Cox is vital for remaining independent and facilitating retention of its management and investment professionals. They also noted that Dodge & Cox has voluntarily limited growth of assets by closing the Stock and Balanced Funds to new investors and by not taking on new equity and balanced institutional separate account clients. The Board noted that these actions were financially disadvantageous to Dodge & Cox, but illustrated a commitment to act in the best interest of existing Fund shareholders and separate account clients. The Board considered potential “fall-out” benefits (including the receipt of research from unaffiliated brokers) that Dodge & Cox might receive in its association with the Funds. The Board also noted the extent of additional administrative services performed by Dodge & Cox for the Funds, and that the magnitude of costs and risks borne by Dodge & Cox in rendering advisory services to the Funds (including risks in the
compliance, securities valuation and investment management processes) are continuing to increase. The Board concluded that the profitability of Dodge & Cox’s relationship with the Funds (including fall-out benefits) was fair and reasonable.
THE BENEFIT OF ECONOMIES OF SCALE
The Board considered whether there have been economies of scale with respect to the management of each Fund, whether the Funds have appropriately benefited from any economies of scale, and whether the management fee rate is reasonable in relation to the Fund assets and any economies of scale that may exist. The Board noted that the considerable efficiencies of the Funds’ organization and fee structure have been realized by shareholders at the outset of their investment (i.e., from the first dollar), as a result of management fee rates that start lower than industry and many peer group averages and management fees and overall expense ratios that are lower than averages for peer group funds with approximately the same level of assets. Shareholders also realize efficiencies from the outset of their investment due to organizational efficiencies derived from Dodge & Cox’s investment management process and the avoidance of distribution and marketing structures whose costs would ultimately be borne by the Funds. The Board noted that Dodge & Cox’s internal costs of providing investment management, administrative and compliance services to the Funds are continuing to increase. The Board’s decision to renew the Agreements was made after consideration of economies of scale and review of comparable fund expense ratios and historical expense ratio patterns for the Funds. Their review also included consideration of the desirability of adding breakpoints to the Funds’ fee schedules. The Board concluded that the current Dodge & Cox fee structure is fair and reasonable and adequately reflects economies of scale.
CONCLUSION
Based on their evaluation of all material factors and assisted by the advice of Independent Legal Counsel to the Independent Trustees, the Board, including the Independent Trustees, concluded that the advisory fee structure was fair and reasonable, that each Fund was
| | | | |
| PAGE | | 15 n DODGE & COX STOCK FUND | | |
paying a competitive fee for the services provided, that the scope and quality of Dodge & Cox’s services has provided substantial value for Fund shareholders over the long term, and that approval of the Agreements was in the best interests of each Fund and its shareholders.
FUND HOLDINGS
The Fund provides a complete list of its holdings four times each fiscal year, as of the end of each quarter. The lists appear in the Fund’s First Quarter, Semi-Annual, Third Quarter and Annual Reports to shareholders. The Fund files the lists with the Securities and Exchange Commission (SEC) on Form N-CSR (second and fourth quarters) and Form N-Q (first and third quarters). Shareholders may view the Fund’s Forms N-CSR and N-Q on the SEC’s website at www.sec.gov. Forms N-CSR and N-Q may also be reviewed and copied at the SEC’s Public
Reference Room in Washington, DC. Information regarding the operations of the Public Reference Room may be obtained by 1-202-942-8090 (direct) or 1-800-732-0330 (general SEC number). A complete list of the Fund’s quarter-end holdings is also available at www.dodgeandcox.com on or about 15 days following each quarter end and remains available on the web site until the list is updated in the subsequent quarter.
PROXY VOTING
For a free copy of the Fund’s proxy voting policies and procedures, please call 1-800-621-3979, visit the Fund’s web site at www.dodgeandcox.com or visit the SEC’s web site at www.sec.gov. Information regarding how the Fund voted proxies relating to portfolio securities during the most recent 12-month period ending June 30 is also available at www.dodgeandcox.com or at www.sec.gov.
| | | | | | |
| | DODGE & COX STOCK FUND n | | PAGE | | 16 |
THIS PAGE INTENTIONALLY LEFT BLANK
| | | | |
| PAGE | | 17 n DODGE & COX STOCK FUND | | |
THIS PAGE INTENTIONALLY LEFT BLANK
| | | | | | |
| | DODGE & COX STOCK FUND n | | PAGE | | 18 |
DODGE & COX FUNDS—EXECUTIVE OFFICER & TRUSTEE INFORMATION
| | | | | | |
Name (Age) and
Address* | | Position with Trust
(Year of Election or
Appointment) | | Principal Occupation During Past 5 Years | | Other Directorships Held by Trustees |
| INTERESTED TRUSTEES & OFFICERS |
John A. Gunn (63) | | Chairman and Trustee
(Trustee since 1985) | | Chairman (since 2007), Chief Executive Officer (since 2005) and Director of Dodge & Cox, Portfolio Manager and member of Investment Policy Committee (IPC), Fixed Income Investment Policy Committee (FIIPC) and International Investment Policy Committee (IIPC) | | — |
Kenneth E. Olivier (54) | | President and Trustee
(Trustee since 2005) | | President (since 2005) and Director of Dodge & Cox, Portfolio Manager and member of IPC | | — |
Dana M. Emery (45) | | Vice President and Trustee (Trustee since 1993) | | Executive Vice President (since 2005) and Director of Dodge & Cox, Manager of the Fixed Income Department, Portfolio Manager and member of FIIPC | | — |
| Katherine Herrick Drake (52) | | Vice President (Since 1993) | | Vice President of Dodge & Cox, Portfolio Manager | | — |
| Diana S. Strandberg (47) | | Vice President
(Since 2005) | | Vice President of Dodge & Cox, Portfolio Manager and member of IPC and IIPC | | |
John M. Loll (40) | | Assistant
Treasurer and Assistant Secretary (Since 2000) | | Vice President and Treasurer of Dodge & Cox | | — |
David H. Longhurst (49) | | Treasurer (Since 2006) | | Fund Administration and Accounting Senior Manager of Dodge & Cox (since 2004); Vice President, Treasurer, Controller and Secretary of Safeco Mutual Funds, Safeco Asset Management Company, Safeco Services, Safeco Securities, and Safeco Investment Services (2000-2004) | | — |
| Thomas M. Mistele (53) | | Secretary and Assistant Treasurer (Since 2000) | | Chief Operating Officer (since 2004), Director (since 2005), Secretary and General Counsel of Dodge & Cox | | — |
| Marcia P. Venegas (38) | | Chief Compliance Officer
(Since 2004) | | Chief Compliance Officer of Dodge & Cox (since 2005), Compliance Officer of Dodge & Cox (2003-2004); Compliance and Business Risk Manager of Deutsche Asset Management, Australia Limited (1999-2001) | | — |
| INDEPENDENT TRUSTEES |
William F. Ausfahl (66) | | Trustee (Since 2002) | | CFO, The Clorox Co. (1982-1997); Director, The Clorox Co. (1984-1997) | | — |
L. Dale Crandall (65) | | Trustee (Since 1999) | | President, Kaiser Foundation Health Plan, Inc. and Kaiser Foundation Hospitals (2000-2002); Senior Vice President—Finance and Administration & CFO, Kaiser Foundation Health Plan, Inc. and Kaiser Foundation Hospitals (1998-2000) | | Director, Union BanCal Corporation (bank holding company) and Union Bank of California (commercial bank) (2001-Present); Director, Covad Communications Group (broadband communications services) (2002-Present); Director, Ansell Limited (medical equipment and supplies) (2002-Present); Director, BEA Systems, Inc. (software and programming) (2003-Present); Director, Coventry Health Care, Inc. (managed healthcare) (2004-Present) |
Thomas A. Larsen (57) | | Trustee (Since 2002) | | Director in Howard, Rice, Nemerovski, Canady, Falk & Rabkin (law firm) | | — |
John B. Taylor (61) | | Trustee (Since 2005) | | Professor of Economics, Stanford University; Senior Fellow, Hoover Institution; Under Secretary for International Affairs, United States Treasury (2001-2005) | | — |
Will C. Wood (67) | | Trustee (Since 1992) | | Principal, Kentwood Associates, Financial Advisers | | Director, Banco Latinoamericano de Exportaciones S.A. (Latin American Foreign Trade Bank) (1999-Present) |
| * | | The address for each Officer and Trustee is 555 California Street, 40th Floor, San Francisco, California 94104. Each Officer and Trustee oversees all four series in the Dodge & Cox Funds complex and serves for an indefinite term. |
Additional information about the Trust’s Trustees and Officers is available in the Trust’s Statement of Additional Information (SAI). You can get a free copy of the SAI by visiting the Funds’ website at www.dodgeandcox.com or calling 1-800-621-3979.
| | | | |
| PAGE | | 19 n DODGE & COX STOCK FUND | | |

International Stock Fund
www.dodgeandcox.com
For Fund literature, transactions and account
information, please visit the Funds’ web site.
or write or call:
DODGE & COX FUNDS
c/o Boston Financial Data Services
P.O. Box 8422
Boston, Massachusetts 02266-8422
(800) 621-3979
INVESTMENT MANAGER
Dodge & Cox
555 California Street, 40th Floor
San Francisco, California 94104
(415) 981-1710
This report is submitted for the general information of the shareholders of the Fund. The report is not authorized for distribution to prospective investors in the Fund unless it is accompanied by a current prospectus.
This report reflects our views, opinions and portfolio holdings as of December 31, 2006, the end of the reporting period. Any such views are subject to change at any time based upon market or other conditions and Dodge & Cox disclaims any responsibility to update such views. These views may not be relied on as investment advice and, because investment decisions for a Dodge & Cox Fund are based on numerous factors, may not be relied on as an indication of trading intent on behalf of any Dodge & Cox Fund.
12/06 ISF AR  Printed on recycled paper

2006
Annual Report
December 31, 2006
International Stock Fund
ESTABLISHED 2001
TO OUR SHAREHOLDERS
It is not often one has the opportunity to recognize a colleague who has contributed to an organization for close to four decades, so we begin this year’s annual letter to shareholders with a warm farewell to Harry Hagey, who retired from Dodge & Cox on December 31, 2006. Harry joined Dodge & Cox 39 years ago as a security analyst, and served as the firm’s Chairman for the past 14 years and Chief Executive Officer between 1992 and 2005. He served as the firm’s fourth Chairman—the firm’s founder, E. Morris Cox, Peter Avenali and Joe Fee came before him. He also succeeded Peter Avenali as Chairman of the Dodge & Cox Funds.
Harry’s greatest legacy is the importance he placed on Dodge & Cox’s culture, specifically: strong ethics (i.e., placing our clients’ interests ahead of our own), the firm’s employee ownership structure, respect for each client and employee, and the absence of a marketing mindset. Harry ingrained these important tenets into all of us over his years here, and he helped develop our team of 59 investment professionals (who have an average tenure at the firm of 10 years), including our International Investment Policy Committee whose nine members now have an average tenure at Dodge & Cox of 17 years.
We greatly appreciate Harry’s leadership and many years of hard work on behalf of the firm and its clients. We will miss his warm personality and camaraderie, and we wish him well in his future endeavors. Effective January 1, 2007, John A. Gunn was appointed Chairman of the firm and of the Dodge & Cox Funds. John has been with Dodge & Cox since 1972, and also serves as the firm’s CEO.
2006 PERFORMANCE REVIEW
The Dodge & Cox International Stock Fund had a total return of 28.0% for the year ended December 31, 2006, compared to a total return of 26.4% for the Morgan Stanley Capital International Europe, Australasia, Far East Index (MSCI EAFE) benchmark. At year end, the Fund had net assets of $30.9 billion and a cash position of 5.5%.
Capital markets across the world, with the exception of Japan, appreciated significantly during the year, fueled by strong earnings growth. Returns were assisted further by a weak U.S. dollar.
For the year, the International Stock Fund performed well on an absolute basis and relative to the MSCI EAFE. The following factors were major contributors to performance:
| n | | The Fund’s investments in the Energy sector averaged a total return of 38% compared to 17% for the MSCI EAFE Energy sector. Notable performers included Norsk Hydro and Petroleo Brasileiro, which both returned 51% during the year. |
| n | | The Fund’s investments in the Industrials sector averaged a total return of 48% compared to 25% for the MSCI EAFE Industrials sector. Notable performers included Nexans (up 174%), Sulzer (up 117%) and Volvo (up 51%). |
| n | | The Fund’s investments in Japan helped performance relative to the benchmark, averaging a total return of 11% compared to 6% for the MSCI EAFE Japan region. Notable performers included Honda (up 39%), Mediceo Paltac (up 32%) and Brother Industries (up 30%). |
| n | | Investments in the emerging markets appreciated, with Latin America particularly strong (up 60%). |
The Fund’s overweight position in Consumer Electronics and Information Technology, which were weak sectors of the market, detracted from performance relative to the benchmark. Notable underperformers included Hitachi (down 7%) and Seiko Epson (down 2%). Other weak performers were LG.Philips (down 30%) and Thomson (down 5%).
For the year ended December 31, 2006, changes in foreign currencies had a positive effect on the Fund’s performance. As a reminder, depreciation of the U.S. dollar generally increases returns from international investments, as those international investments appreciate in value in dollar terms. Appreciation of the U.S. dollar generally has the opposite effect.
THOUGHTS ON ASSET GROWTH
We thought it would be helpful to discuss how we approach investing in light of the rapid growth in assets and the number of new Fund shareholders. Since Dodge & Cox was founded more than 75 years ago, our mission has been to serve our current clients well. Neither
| | | | |
| PAGE | | 1 n DODGE & COX INTERNATIONAL STOCK FUND | | |
the pace of asset growth nor the size of the Fund has altered our approach to investing, characterized by:
| n | | A long-term investment horizon that allows us to look beyond short-term concerns and to think as part owners of the companies in which we invest. This framework forces us to focus on the risks and opportunities facing a company over the next three-to-five years. As the Fund grows in size, a one percentage point holding in the Fund, for example, is a larger percentage of that company than it once was. As a result, it may take us longer to build or liquidate a given position. However, as long-term investors, we have never relied on the ability to move quickly into or out of holdings as an ingredient of our strategy. |
| n | | A valuation discipline that often leads us to research companies where market expectations of future earnings and cash flows are low. We have often found compelling investment opportunities created by overly pessimistic investors, especially in response to short-term developments. |
| n | | An independent research effort that is the cornerstone of our approach. In our experience, market coverage can be fickle and very short term in nature. Often, research coverage declines when a company is most appealing to us. Our team of 20 global industry research analysts, evaluating individual investment opportunities, enables us to maintain a high-energy research effort regardless of market sentiment. |
| n | | A team decision-making process that benefits from the collective judgment of the group. Team decision making helps us maintain our patience and persistence, especially when market sentiment turns against us. In addition, investment professionals typically spend their entire careers at Dodge & Cox, and we think the accumulation of investment experience and industry knowledge benefits the Fund’s shareholders. |
Importantly, our approach has allowed us to accommodate the Fund’s rapid growth in an orderly way, and we remain confident in our ability to find attractive investment opportunities. The investment universe outside the United States is vast: over half of the world’s market capitalization is composed of companies domiciled abroad. The Fund invests primarily in medium-to-large capitalization international companies, which include
roughly 3,000 companies comprising $20 trillion in market capitalization.
That said, the Fund’s shareholders can consider our track record in managing rapid growth. For example, we closed the Dodge & Cox Stock and Balanced Funds to new investors in 2004. By closing these funds preemptively we were able to allow current investors to continue to invest without impairing our ability to manage these Funds. We will continue our vigilance on this issue and, if necessary, be just as preemptive with the International Stock Fund.
IN CLOSING
Over the past 36 years, earnings growth and dividend yield have been the largest contributors to international equity returns. Recent returns have been powered largely by double-digit growth in earnings and currency gains.
We have repeatedly cautioned Fund shareholders that the high level of past returns is unlikely to be sustained going forward. Market valuations on a price-to-earnings basis appear reasonable, dividend yields are in-line with historic ranges, and currency changes remain difficult to forecast. Going forward, we believe earnings growth will be more in line with nominal GDP growth, as corporate profitability is already quite high compared to past levels. The combination of these factors suggests more modest returns going forward.
Thank you for your continued confidence in the Dodge & Cox International Stock Fund. As always, we welcome your comments and questions.
For the Board of Trustees,
| | |
 | |  |
John A. Gunn, Chairman | | Diana S. Strandberg, Vice President |
February 9, 2007
Risks of International Investing: Foreign investing, especially in developing countries, has special risks such as currency and market volatility and political and social instability. These and other risk considerations are discussed in the Fund’s prospectus.
| | | | | | |
| | DODGE & COX INTERNATIONAL STOCK FUND n | | PAGE | | 2 |
A Message from Former Chairman Harry Hagey
On October 1, 1967, I began my career at Dodge & Cox. At that time, Dodge & Cox was a small independent regional investment counseling firm working with individuals, pension funds and endowment funds. In addition, the firm managed two small no-load mutual funds: the Dodge & Cox Balanced Fund and the Dodge & Cox Stock Fund. After 39 wonderful years at this firm, I am now retiring. I want to take this opportunity to first thank you, our mutual fund shareholders for the trust you have placed in our firm over the years; second, to thank all of my associates with whom I have had the pleasure of working; and finally, to provide you with my thoughts on the current status of the firm and my optimistic outlook for its future.
Let me summarize what I think are the key components that make Dodge & Cox a successful money management firm. First and most importantly, ethical considerations are paramount. We have an excellent reputation, and we work hard to maintain it. When making decisions about how we manage our firm, we always start by asking what is in the best interests of our current clients.
Second, we are in the single business of providing continuous high quality investment management service to our existing clients and shareholders. We decided a long time ago that we are not in business to provide a series of financial products to the investment marketplace. Through a team-oriented, long-term approach, our investment objective is to first preserve and then enhance the future purchasing power of our clients’ wealth over the long term. Over the years, I have often reminded my associates that there are literally millions of individuals counting on us.
A third important ingredient is our employees. We insist on a respect for each individual employee as well as for the entire firm. We work within a collegial environment with the goal of having all of our people think as owners, not just as employees. Our working environment has led to low employee turnover, which in turn, has created stability and continuity over the years.
Finally, with regard to the firm, probably the most important characteristic is our independence. We only report to the Fund’s shareholders, our clients and to ourselves. Ownership of Dodge & Cox is limited to the firm’s active employees, thus I have sold my interest in Dodge & Cox back to the firm (at book value) so my shares will now be available to those coming after me.
As for the future of Dodge & Cox, I am extremely optimistic. We have a deep and talented investment team across the board: domestic equity, international equity and fixed-income. I leave Dodge & Cox today as strong as it has ever been in our 76-year history. I have complete confidence that John Gunn, Ken Olivier, Dana Emery and others will act as responsible stewards of the firm’s unique culture.
On a personal note, the only investment options in the Dodge & Cox retirement plan are the Dodge & Cox Funds, so my own retirement assets have benefited from the Funds’ past results. I look forward to continuing on as a long-term shareholder of the Dodge & Cox Funds.
Thanks again for the confidence you have placed in our firm over the years.
Sincerely,

Harry R. Hagey
| | | | |
| PAGE | | 3 n DODGE & COX INTERNATIONAL STOCK FUND | | |
| | |
GROWTH OF $10,000 SINCE INCEPTION FOR AN INVESTMENT MADE ON APRIL 30, 2001 
AVERAGE ANNUAL TOTAL RETURN FOR PERIODS ENDING DECEMBER 31, 2006 | | Past performance does not guarantee future results. Investment return and share price will fluctuate with market conditions, and investors may have a gain or loss when shares are sold. Mutual fund performance changes over time and currently may be significantly lower than stated above. Performance is updated and published monthly. Visit the Fund’s web site at www.dodgeandcox.com or call 1-800-621-3979 for current performance figures. * Expense reimbursements were paid by Dodge & Cox from the Fund’s inception through June 30, 2003 to maintain operating expenses at 0.90%. Accordingly, without the expense reimbursements, the Fund’s returns prior to June 30, 2003 would have been lower. The Fund’s total returns include the reinvestment of dividend and capital gain distributions, but have not been adjusted for any income taxes payable on these distributions. The Morgan Stanley Capital International Europe, Australasia, Far East Index (MSCI EAFE) is a widely recognized benchmark of the world’s stock markets, excluding the United States. Index returns include dividends and, unlike Fund returns, do not reflect fees or expenses. Morgan Stanley®, Morgan Stanley Capital International, and EAFE® are trademarks of Morgan Stanley. |
| | | | | | | | | | | | |
| | | 1 Year | | | 3 Years | | | 5 Years | | | Since
Inception
(5/1/01) | |
Dodge & Cox International Stock Fund | | 28.00 | % | | 25.56 | % | | 20.77 | %* | | 16.60 | %* |
MSCI EAFE | | 26.35 | | | 19.93 | | | 14.98 | | | 9.93 | |
FUND EXPENSE EXAMPLE
As a Fund shareholder, you incur ongoing Fund costs, including management fees and other Fund expenses. All mutual funds have ongoing costs, sometimes referred to as operating expenses. The following example shows ongoing costs of investing in the Fund and can help you understand these costs and compare them with those of other mutual funds. The example assumes a $1,000 investment held for the six months indicated.
ACTUAL EXPENSES
The first line of the table below provides information about actual account values and expenses based on the Fund’s actual returns. You may use the information in this line, together with your account balance, to estimate the expenses that you paid over the period. Simply divide your account value by $1,000 (for example, an $8,600 account value divided by $1,000 = 8.6), then multiply the result by the number in the first line under the heading “Expenses Paid During Period” to estimate the expenses you paid on your account during this period.
HYPOTHETICAL EXAMPLE FOR COMPARISON WITH OTHER MUTUAL FUNDS
Information on the second line of the table can help you compare ongoing costs of investing in the Fund with those of other mutual funds. This information may not be used to estimate the actual ending account balance or expenses you paid during the period. The hypothetical “Ending Account Value” is based on the actual expense ratio of the Fund and an assumed 5% annual rate of return before expenses (not the Fund’s actual return). The amount under the heading “Expense Paid During the Period” shows the hypothetical expenses your account would have incurred under this scenario. You can compare this figure with the 5% hypothetical examples that appear in shareholder reports of other mutual funds.
| | | | | | | | | |
Six Months Ended December 31, 2006 | | Beginning Account Value 7/1/2006 | | Ending Account Value 12/31/2006 | | Expenses Paid During Period† |
Based on Actual Fund Return | | $ | 1,000.00 | | $ | 1,150.90 | | $ | 3.56 |
Based on Hypothetical 5% Yearly Return | | | 1,000.00 | | | 1,021.90 | | | 3.34 |
| † | | Expenses are equal to the Fund’s annualized six-month expense ratio of 0.66%, multiplied by the average account value over the period, multiplied by 184/365 (to reflect the one-half year period). |
The expenses shown in the table highlight ongoing costs only and do not reflect any transactional fees or account maintenance fees. While other mutual funds may charge such fees, please note that the Fund does not charge transaction fees (e.g., redemption fees, sales loads) or universal account maintenance fees (e.g., small account fees).
| | | | | | |
| | DODGE & COX INTERNATIONAL STOCK FUND n | | PAGE | | 4 |
FUND INFORMATION December 31, 2006
GENERAL INFORMATION
| | |
Net Asset Value Per Share | | $43.66 |
Total Net Assets (billions) | | $30.9 |
2006 Expense Ratio | | 0.66% |
2006 Portfolio Turnover Rate | | 9% |
30-Day SEC Yield(a) | | 1.37% |
Fund Inception Date | | May 1, 2001 |
| No sales charges or distribution fees | | |
Investment Manager: Dodge & Cox, San Francisco. Managed by the International Investment Policy Committee, whose nine members’ average tenure at Dodge & Cox is 17 years.
| | | | | | |
| PORTFOLIO CHARACTERISTICS | | FUND | | | MSCI
EAFE | |
Number of Stocks | | 82 | | | 1,164 | |
Median Market Capitalization (billions) | | $15 | | | $6 | |
Weighted Average Market Capitalization (billions) | | $57 | | | $58 | |
Price-to-Earnings Ratio(b) | | 13.9x | | | 14.2x | |
Countries Represented | | 21 | | | 22 | |
Emerging Markets (Brazil, Israel, Mexico, South Africa, South Korea, Thailand, Turkey) | | 14.9 | % | | 0.0 | % |
| | | |
| TEN LARGEST HOLDINGS(c) | | | |
Sanofi-Aventis (France) | | 3.3 | % |
Hitachi, Ltd. (Japan) | | 2.5 | |
Credit Suisse Group (Switzerland) | | 2.5 | |
News Corp. Class A (United States) | | 2.4 | |
Matsushita Electric Industrial Co., Ltd. (Japan) | | 2.4 | |
HSBC Holdings PLC (United Kingdom) | | 2.3 | |
Nokia Oyj (Finland) | | 2.2 | |
Tesco PLC (United Kingdom) | | 2.2 | |
Infineon Technologies AG (Germany) | | 2.2 | |
Royal Bank of Scotland Group PLC (United Kingdom) | | 2.1 | |
ASSET ALLOCATION
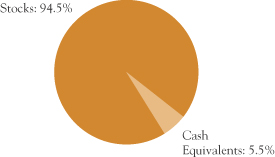
| | | | | | |
| REGION DIVERSIFICATION | | FUND | | | MSCI
EAFE | |
Europe (excluding United Kingdom) | | 34.7 | % | | 45.3 | % |
Japan | | 20.5 | | | 22.6 | |
United Kingdom | | 15.7 | | | 23.7 | |
Latin America | | 7.8 | | | 0.0 | |
Pacific (excluding Japan) | | 7.3 | | | 8.4 | |
United States | | 4.3 | | | 0.0 | |
Africa | | 1.8 | | | 0.0 | |
Canada | | 1.4 | | | 0.0 | |
Middle East | | 1.0 | | | 0.0 | |
| | | | | | |
| SECTOR DIVERSIFICATION | | FUND | | | MSCI
EAFE | |
Financials | | 21.5 | % | | 29.9 | % |
Consumer Discretionary | | 14.3 | | | 11.9 | |
Information Technology | | 12.3 | | | 5.6 | |
Materials | | 11.9 | | | 8.4 | |
Energy | | 8.6 | | | 7.2 | |
Industrials | | 8.1 | | | 11.1 | |
Consumer Staples | | 7.5 | | | 7.8 | |
Health Care | | 6.1 | | | 7.0 | |
Telecommunication Services | | 3.5 | | | 5.5 | |
Utilities | | 0.7 | | | 5.6 | |
(a) | | SEC Yield is an annualization of the Fund’s total net investment income per share for the 30-day period ended on the last day of the month. |
(b) | | Price-to-earnings (P/E) ratio is calculated using 12-month forward consensus earnings estimates. |
(c) | | The Fund’s portfolio holdings are subject to change without notice. The mention of specific securities is not a recommendation or solicitation for any person to buy, sell or hold any particular security. |
| | | | |
| PAGE | | 5 n DODGE & COX INTERNATIONAL STOCK FUND | | |
PORTFOLIO OF INVESTMENTS | December 31, 2006 |
| | | | | |
| COMMON STOCKS: 91.4% |
| | |
| | | SHARES | | VALUE |
| CONSUMER DISCRETIONARY: 14.3% |
| AUTOMOBILES & COMPONENTS: 1.9% |
Honda Motor Co., Ltd. ADR(b) (Japan) | | 15,230,800 | | $ | 602,225,832 |
| | | | | |
| CONSUMER DURABLES & APPAREL: 8.4% |
Consorcio Ara SA de CV(c) (Mexico) | | 22,105,000 | | | 150,395,029 |
Corporacion Geo SA de CV,
Series B(a),(c) (Mexico) | | 42,105,400 | | | 210,858,293 |
Koninklijke Philips Electronics NV (Netherlands) | | 7,375,000 | | | 278,139,508 |
Matsushita Electric Industrial Co., Ltd. (Japan) | | 37,291,000 | | | 744,221,882 |
Sony Corp. (Japan) | | 13,737,600 | | | 588,729,549 |
Thomson(c) (France) | | 15,784,838 | | | 308,592,669 |
Yamaha Corp.(c) (Japan) | | 14,851,000 | | | 314,478,552 |
| | | | | |
| | | | | 2,595,415,482 |
| MEDIA: 4.0% |
Grupo Televisa SA de CV ADR(b) (Mexico) | | 17,731,720 | | | 478,933,757 |
News Corp., Class A (United States) | | 34,773,192 | | | 746,928,164 |
| | | | | |
| | | | | 1,225,861,921 |
| | | | | |
| | | | | 4,423,503,235 |
| CONSUMER STAPLES: 7.0% |
| FOOD & STAPLES RETAILING: 2.1% |
Tesco PLC (United Kingdom) | | 84,365,379 | | | 668,183,382 |
| | | | | |
| FOOD, BEVERAGE & TOBACCO: 4.2% |
Anadolu Efes Biracilik ve Malt Sanayii AS (Turkey) | | 763,645 | | | 23,602,592 |
Cott Corp.(a),(b),(c) (Canada) | | 3,830,800 | | | 54,818,748 |
Fomento Economico Mexicano SA de CV ADR(b) (Mexico) | | 2,714,058 | | | 314,179,354 |
Nestle SA (Switzerland) | | 1,461,000 | | | 519,173,574 |
Tiger Brands, Ltd. (South Africa) | | 7,552,043 | | | 184,137,077 |
Unilever NV(b) (Netherlands) | | 7,451,700 | | | 203,058,825 |
| | | | | |
| | | | | 1,298,970,170 |
| HOUSEHOLD & PERSONAL PRODUCTS: 0.7% |
Aderans Co., Ltd.(c) (Japan) | | 3,005,100 | | | 74,619,306 |
Avon Products, Inc. (United States) | | 4,150,000 | | | 137,116,000 |
| | | | | |
| | | | | 211,735,306 |
| | | | | |
| | | | | 2,178,888,858 |
| | | | | |
| |
| | |
| | | SHARES | | VALUE |
| ENERGY: 6.7% |
Norsk Hydro ASA ADR(b) (Norway) | | 14,710,500 | | $ | 451,171,035 |
Royal Dutch Shell PLC ADR(b)
(United Kingdom) | | 8,368,400 | | | 592,399,036 |
Schlumberger, Ltd. (United States) | | 7,083,000 | | | 447,362,280 |
Total SA (France) | | 8,102,000 | | | 584,484,263 |
| | | | | |
| | | | | 2,075,416,614 |
| FINANCIALS: 20.8% |
| BANKS: 14.1% |
DBS Group Holdings, Ltd. (Singapore) | | 29,042,000 | | | 427,937,539 |
Grupo Financiero Banorte SA (Mexico) | | 43,834,600 | | | 171,394,382 |
HSBC Holdings PLC
(United Kingdom) | | 39,699,200 | | | 723,676,248 |
Kasikornbank PCL Foreign (Thailand) | | 65,756,700 | | | 115,932,123 |
Kasikornbank PCL NVDR (Thailand) | | 60,787,500 | | | 105,456,453 |
Kookmin Bank ADR(b) (South Korea) | | 5,158,700 | | | 415,997,568 |
Mitsubishi UFJ Financial Group ADR(b) (Japan) | | 49,166,500 | | | 612,122,925 |
Royal Bank of Scotland Group PLC (United Kingdom) | | 16,800,972 | | | 655,623,617 |
Shinsei Bank, Ltd.(c) (Japan) | | 74,153,000 | | | 436,175,791 |
Standard Bank Group, Ltd.
(South Africa) | | 26,964,776 | | | 363,336,731 |
Standard Chartered PLC
(United Kingdom) | | 11,155,000 | | | 325,875,177 |
| | | | | |
| | | | | 4,353,528,554 |
| DIVERSIFIED FINANCIALS: 2.5% |
Credit Suisse Group (Switzerland) | | 10,915,000 | | | 763,646,902 |
| | | | | |
| INSURANCE: 4.2% |
Aegon NV (Netherlands) | | 13,823,868 | | | 263,503,986 |
Converium Holdings AG(c) (Switzerland) | | 8,918,646 | | | 119,671,614 |
Standard Life PLC(a) (United Kingdom) | | 13,925,343 | | | 80,638,704 |
Swiss Life Holding (Switzerland) | | 1,100,000 | | | 275,564,218 |
Swiss Reinsurance (Switzerland) | | 6,715,795 | | | 570,994,142 |
| | | | | |
| | | | | 1,310,372,664 |
| | | | | |
| | | | | 6,427,548,120 |
| | | | | | |
| See accompanying Notes to Financial Statements | | DODGE & COX INTERNATIONAL STOCK FUND n | | PAGE | | 6 |
| | |
| PORTFOLIO OF INVESTMENTS | | December 31, 2006 |
| | | | | |
| COMMON STOCKS (continued) |
| | |
| | | SHARES | | VALUE |
| HEALTH CARE: 6.1% |
| HEALTH CARE EQUIPMENT & SERVICES: 0.8% |
Mediceo Paltac Holdings Co., Ltd.(c) (Japan) | | 13,559,700 | | $ | 256,939,822 |
| | | | | |
| PHARMACEUTICALS & BIOTECHNOLOGY: 5.3% |
GlaxoSmithKline PLC ADR(b) (United Kingdom) | | 11,717,200 | | | 618,199,472 |
Sanofi-Aventis (France) | | 10,930,500 | | | 1,009,295,100 |
| | | | | |
| | | | | 1,627,494,572 |
| | | | | |
| | | | | 1,884,434,394 |
| INDUSTRIALS: 8.1% |
| CAPITAL GOODS: 3.8% |
Nexans SA(c) (France) | | 1,866,440 | | | 238,988,049 |
Sulzer AG(c) (Switzerland) | | 10,600 | | | 12,065,819 |
Toto, Ltd.(c) (Japan) | | 28,657,000 | | | 287,039,570 |
Volvo AB, Series B (Sweden) | | 8,411,600 | | | 579,330,758 |
Wienerberger AG (Austria) | | 1,206,362 | | | 71,660,623 |
| | | | | |
| | | | | 1,189,084,819 |
| TRANSPORTATION: 4.3% |
Central Japan Railway Co. (Japan) | | 51,050 | | | 527,637,494 |
Nippon Yusen Kabushiki Kaisha (Japan) | | 46,143,000 | | | 337,333,809 |
TNT NV (Netherlands) | | 10,775,249 | | | 463,413,640 |
| | | | | |
| | | | | 1,328,384,943 |
| | | | | |
| | | | | 2,517,469,762 |
| INFORMATION TECHNOLOGY: 12.3% |
|
| SEMICONDUCTORS & SEMICONDUCTOR EQUIPMENT: 2.2% |
Infineon Technologies AG(a),(c) (Germany) | | 47,027,800 | | | 663,004,281 |
| | | | | |
| TECHNOLOGY, HARDWARE & EQUIPMENT: 10.1% |
Brother Industries, Ltd.(c) (Japan) | | 19,244,000 | | | 260,510,768 |
Canon, Inc. (Japan) | | 2,222,000 | | | 125,098,945 |
Epcos AG(a),(c) (Germany) | | 5,828,100 | | | 116,554,768 |
Hitachi, Ltd. (Japan) | | 123,818,000 | | | 772,009,210 |
Kyocera Corp. (Japan) | | 663,300 | | | 62,537,087 |
LG.Philips LCD Co., Ltd. ADR(a),(b) (South Korea) | | 20,103,200 | | | 302,955,224 |
Nokia Oyj (Finland) | | 33,512,500 | | | 684,807,015 |
Nortel Networks Corp.(a),(b) (Canada) | | 12,746,827 | | | 340,722,686 |
Oce NV(c) (Netherlands) | | 8,018,524 | | | 131,146,335 |
Seiko Epson Corp.(c) (Japan) | | 13,406,900 | | | 326,145,754 |
| | | | | |
| | | | | 3,122,487,792 |
| | | | | |
| | | | | 3,785,492,073 |
| | | | | |
| |
| | |
| | | SHARES | | VALUE |
| MATERIALS: 11.9% |
Akzo Nobel NV (Netherlands) | | 3,936,100 | | $ | 240,100,193 |
Arkema(a),(c) (France) | | 3,400,263 | | | 174,737,988 |
BASF AG (Germany) | | 5,360,400 | | | 522,562,349 |
Bayer AG (Germany) | | 7,577,000 | | | 406,682,120 |
BHP Billiton, Ltd. (Australia) | | 3,785,078 | | | 75,590,117 |
Cemex SAB de CV ADR(b) (Mexico) | | 4,250,000 | | | 143,990,000 |
Imperial Chemical Industries PLC (United Kingdom) | | 45,795,762 | | | 405,300,003 |
Lafarge SA (France) | | 3,321,025 | | | 494,067,718 |
Lanxess AG(a) (Germany) | | 4,092,359 | | | 229,482,013 |
Makhteshim-Agan Industries, Ltd.(c) (Israel) | | 29,459,809 | | | 167,183,543 |
Nova Chemicals Corp. (Canada) | | 1,587,900 | | | 44,253,955 |
Rinker Group, Ltd. (Australia) | | 31,118,565 | | | 443,370,129 |
Yara International ASA (Norway) | | 14,268,710 | | | 324,382,481 |
| | | | | |
| | | | | 3,671,702,609 |
| TELECOMMUNICATION SERVICES: 3.5% |
Bezeq Israeli Telecommunication Corp., Ltd. (Israel) | | 88,500,000 | | | 143,615,658 |
KT Corp. ADR(b) (South Korea) | | 14,958,400 | | | 379,195,440 |
Vodafone Group PLC ADR(b) (United Kingdom) | | 20,396,562 | | | 566,616,493 |
| | | | | |
| | | | | 1,089,427,591 |
| UTILITIES: 0.7% |
Centrica PLC (United Kingdom) | | 30,061,936 | | | 208,663,298 |
| | | | | |
| | | | | 208,663,298 |
| | | | | |
TOTAL COMMON STOCKS (Cost $22,475,844,237) | | | 28,262,546,554 |
| | | | | |
|
| PREFERRED STOCKS: 3.1% |
| CONSUMER STAPLES: 0.5% |
| FOOD & STAPLES RETAILING: 0.5% |
Sadia SA ADR(b) (Brazil) | | 4,372,900 | | | 149,072,161 |
| | | | | |
| | | | | 149,072,161 |
| ENERGY: 1.9% | | |
Petroleo Brasileiro SA ADR(b) (Brazil) | | 4,626,000 | | | 429,107,760 |
Ultrapar Participacoes SA ADR(b) (Brazil) | | 6,819,785 | | | 156,855,055 |
| | | | | |
| | | | | 585,962,815 |
| FINANCIALS: 0.7% |
| BANKS: 0.7% |
Uniao de Bancos Brasileiros SA GDR(b) (Brazil) | | 2,316,500 | | | 215,341,840 |
| | | | | |
| | | | | 215,341,840 |
| | | | | |
TOTAL PREFERRED STOCKS (Cost $453,625,770) | | | 950,376,816 |
| | | | | |
| | | | |
| PAGE | | 7 n DODGE & COX INTERNATIONAL STOCK FUND | | See accompanying Notes to Financial Statements |
PORTFOLIO OF INVESTMENTS | December 31, 2006 |
| | | | | | | |
| SHORT-TERM INVESTMENTS: 5.0% |
| | |
| | | PAR VALUE | | | VALUE |
SSgA Prime Money Market Fund | | $ | 29,847,769 | | | $ | 29,847,769 |
State Street Repurchase Agreement 4.40%, 1/2/07, maturity value $1,229,107,603 (collateralized by U.S. Treasury Securities, value $1,253,086,423, 3.50%-8.875%, 8/15/09-8/15/25) | | | 1,228,507,000 | | | | 1,228,507,000 |
U.S. Treasury Bills | | | | | | | |
1/11/07 | | | 100,000,000 | | | | 99,867,917 |
1/18/07 | | | 100,000,000 | | | | 99,775,695 |
2/1/07 | | | 75,000,000 | | | | 74,697,750 |
| | | | | | | |
TOTAL SHORT-TERM INVESTMENTS
(Cost $1,532,696,131) | | | | 1,532,696,131 |
| | | | | | | |
TOTAL INVESTMENTS
(Cost $24,462,166,138) | | | 99.5 | % | | | 30,745,619,501 |
OTHER ASSETS, LESS LIABILITIES | | | 0.5 | % | | | 153,718,122 |
| | | | | | | |
| TOTAL NET ASSETS | | | 100.0 | % | | $ | 30,899,337,623 |
| | | | | | | |
(b) | | Security issued by a foreign entity, denominated in U.S. Dollars |
(c) | | See Note 6 regarding holdings of 5% voting securities |
ADR: American Depository Receipt
GDR: Global Depository Receipt
NVDR: Non Voting Depository Receipt
| | | | | | |
| See accompanying Notes to Financial Statements | | DODGE & COX INTERNATIONAL STOCK FUND n | | PAGE | | 8 |
STATEMENT OF ASSETS AND LIABILITIES
| | | |
| | | December 31, 2006 |
| ASSETS: | | | |
Investments, at value | | | |
Unaffiliated issuers (cost $21,059,126,256) | | $ | 26,453,758,621 |
Affiliated issuers (cost $3,403,039,882) | | | 4,291,860,880 |
| | | |
| | | 30,745,619,501 |
Cash denominated in foreign currency (cost $38) | | | 38 |
Receivable for investments sold | | | 19,766,958 |
Receivable for Fund shares sold | | | 192,388,440 |
Dividends and interest receivable | | | 70,013,283 |
Prepaid expenses and other assets | | | 97,972 |
| | | |
| | | 31,027,886,192 |
| | | |
| LIABILITIES: | | | |
Payable for investments purchased | | | 78,635,248 |
Payable for Fund shares redeemed | | | 31,640,840 |
Management fees payable | | | 15,273,151 |
Accrued foreign capital gain tax | | | 629,493 |
Accrued expenses | | | 2,369,837 |
| | | |
| | | 128,548,569 |
| | | |
| NET ASSETS | | $ | 30,899,337,623 |
| | | |
| NET ASSETS CONSIST OF: | | | |
Paid in capital | | $ | 24,406,485,445 |
Undistributed net investment income | | | 10,334,196 |
Undistributed net realized gain on investments | | | 199,754,271 |
Net unrealized appreciation on investments (net of accrued foreign capital gain tax of $629,493) | | | 6,282,763,711 |
| | | |
| | $ | 30,899,337,623 |
| | | |
Fund shares outstanding (par value $0.01 each, unlimited shares authorized) | | | 707,780,171 |
Net asset value per share | | | $43.66 |
|
| STATEMENT OF OPERATIONS |
| | | Year Ended
December 31, 2006 |
| INVESTMENT INCOME: | | | |
Dividends (net of foreign taxes of $41,190,428) | | | |
Unaffiliated issuers | | $ | 442,776,897 |
Affiliated issuers | | | 41,065,703 |
Interest | | | 52,437,415 |
| | | |
| | | 536,280,015 |
| | | |
| EXPENSES: | | | |
Management fees | | | 129,669,391 |
Custody and fund accounting fees | | | 4,744,988 |
Transfer agent fees | | | 5,301,873 |
Professional services | | | 102,818 |
Shareholder reports | | | 1,491,491 |
Registration fees | | | 1,011,899 |
Trustees’ fees | | | 167,500 |
Miscellaneous | | | 75,357 |
| | | |
| | | 142,565,317 |
| | | |
| NET INVESTMENT INCOME | | | 393,714,698 |
| | | |
REALIZED AND UNREALIZED GAIN ON INVESTMENTS: |
Net realized gain | | | |
Investments in unaffiliated issuers | | | 365,254,644 |
Investments in affiliated issuers | | | 227,899,801 |
Foreign currency transactions | | | 1,159,451 |
Net change in unrealized appreciation (including net decrease in accrued foreign capital gain tax of $2,557,501) | | | 4,368,035,130 |
| | | |
Net realized and unrealized gain | | | 4,962,349,026 |
| | | |
NET INCREASE IN NET ASSETS
FROM OPERATIONS | | $ | 5,356,063,724 |
| | | |
STATEMENT OF CHANGES IN NET ASSETS
| | | | | | | | |
| | | Year Ended
December 31, 2006 | | | Year Ended
December 31, 2005 | |
| OPERATIONS: | | | | | | | | |
Net investment income | | $ | 393,714,698 | | | $ | 130,392,600 | |
Net realized gain | | | 594,313,896 | | | | 168,969,892 | |
Net change in unrealized appreciation | | | 4,368,035,130 | | | | 1,234,968,504 | |
| | | | | | | | |
Net increase in net assets from operations | | | 5,356,063,724 | | | | 1,534,330,996 | |
| | | | | | | | |
| |
DISTRIBUTIONS TO SHAREHOLDERS FROM: | | | | | |
Net investment income | | | (385,150,238 | ) | | | (132,300,734 | ) |
Net realized gain | | | (422,290,813 | ) | | | (142,355,951 | ) |
| | | | | | | | |
Total distributions | | | (807,441,051 | ) | | | (274,656,685 | ) |
| | | | | | | | |
| |
FUND SHARE
TRANSACTIONS: | | | | | |
Proceeds from sale of shares | | | 14,647,193,582 | | | | 8,778,424,267 | |
Reinvestment of distributions | | | 724,233,070 | | | | 246,458,696 | |
Cost of shares redeemed | | | (2,377,956,549 | ) | | | (1,130,242,133 | ) |
| | | | | | | | |
Net increase from Fund share transactions | | | 12,993,470,103 | | | | 7,894,640,830 | |
| | | | | | | | |
Total increase in net assets | | | 17,542,092,776 | | | | 9,154,315,141 | |
| | |
| NET ASSETS: | | | | | | | | |
Beginning of year | | | 13,357,244,847 | | | | 4,202,929,706 | |
| | | | | | | | |
End of year (including undistributed net investment income of $10,334,196 and $1,769,736, respectively) | | $ | 30,899,337,623 | | | $ | 13,357,244,847 | |
| | | | | | | | |
| |
| SHARE INFORMATION: | | | | | |
Shares sold | | | 370,106,951 | | | | 272,160,308 | |
Distributions reinvested | | | 16,603,234 | | | | 7,035,645 | |
Shares redeemed | | | (60,274,819 | ) | | | (35,007,666 | ) |
| | | | | | | | |
Net increase in shares outstanding | | | 326,435,366 | | | | 244,188,287 | |
| | | | | | | | |
| | | | |
| PAGE | | 9 n DODGE & COX INTERNATIONAL STOCK FUND | | See accompanying Notes to Financial Statements |
NOTES TO FINANCIAL STATEMENTS
NOTE 1—ORGANIZATION AND SIGNIFICANT ACCOUNTING POLICIES
Dodge & Cox International Stock Fund (the “Fund”) is one of the series constituting the Dodge & Cox Funds (the “Trust” or the “Funds”). The Trust is organized as a Delaware statutory trust and is registered under the Investment Company Act of 1940, as amended, as a diversified, open-end management investment company. The Fund commenced operations on May 1, 2001, and seeks long-term growth of principal and income, and the Fund invests primarily in a diversified portfolio of foreign stocks. Foreign investing, especially in developing countries, has special risks such as currency and market volatility and political and social instability. These and other risk considerations are discussed in the Fund’s Prospectus.
The financial statements have been prepared in conformity with accounting principles generally accepted in the United States of America, which require the use of estimates and assumptions by management. Significant accounting policies are as follows:
Security valuation The Fund’s net assets are valued as of the close of trading on the New York Stock Exchange (NYSE), generally 4:00 p.m. Eastern Time, each day that the NYSE is open for business. Listed securities are valued at market, using as a price the official quoted close price or the last sale on the date of determination on the principal exchange on which such securities are traded or, if not available, at the mean between the exchange listed bid and ask prices for the day. A security that is listed or traded on more than one exchange is valued at the quotation on the exchange determined to be the primary market for such security. Security values are not discounted based on the size of the Fund’s position. Short-term securities are valued at amortized cost which approximates current value.
Investments initially valued in currencies other than the U.S. dollar are converted to the U.S. dollar using prevailing exchange rates. As a result, the Fund’s net asset value (NAV) may be affected by changes in the value of currencies in relation to the U.S. dollar.
If market quotations are not readily available or if a security’s value has materially changed after the close of
the security’s primary market but before the close of trading on the NYSE, the security is valued at fair value as determined in good faith by or at the direction of the Board of Trustees. The Fund may use fair value pricing in calculating its NAV when, for example, (i) the primary market for a security is closed or if trading of a security is suspended or limited, (ii) the Fund determines that the price provided by a pricing service is inaccurate or unreliable, or (iii) the Fund determines that a significant event affecting the value of a security has occurred before the close of the NYSE but after the close of the security’s primary market. An event is considered significant if there is both an affirmative expectation that the security’s value will change in response to the event and a reasonable basis for quantifying a resulting change in value. For securities that do not trade during NYSE hours, fair value determinations are based on analyses of market movements after the close of those securities’ primary markets, and include reviews of developments in foreign markets, the performance of U.S. securities markets, and the performance of instruments trading in U.S. markets that represent foreign securities and baskets of foreign securities. Pricing services are used to obtain closing market prices and to compute certain fair value adjustments utilizing computerized pricing models. When fair value pricing is employed, the prices of securities used by the Fund to calculate its net asset value may differ from quoted or published prices for the same securities. In addition, fair values may not reflect the price that the Fund could obtain for a security if it were to dispose of that security at the time of pricing.
Foreign currency translation The Fund’s accounting records are maintained in U.S. dollars. The market values of foreign securities, currency holdings, and other assets and liabilities are translated into U.S. dollars at the prevailing rates of exchange at the end of each business day. Purchases and sales of securities, income receipts, and expenses are translated into U.S. dollars at the exchange rate in effect on the transaction date. Realized foreign currency gains and losses may arise from sales and maturities of foreign currency contracts, sales of foreign currencies, the difference between the amount of
| | | | | | |
| | DODGE & COX INTERNATIONAL STOCK FUND n | | PAGE | | 10 |
NOTES TO FINANCIAL STATEMENTS
net investment income accrued and the U.S. dollar amount actually received, and from currency gains and losses between trade and settlement date on security transactions. The effects of exchange rate changes on investment securities are included with realized and unrealized gain (loss) on investments.
Foreign currency contracts When the Fund purchases or sells foreign securities, it may enter into foreign exchange contracts to minimize foreign exchange risk from the trade date to the settlement date of the transaction. Losses from these transactions may arise from changes in the value of the foreign currency or if the counterparties do not perform under the contract’s terms.
Security transactions, investment income, expenses, and distributions Security transactions are recorded on the trade date. Realized gains and losses on securities sold are determined on the basis of identified cost.
Dividend income and corporate action transactions are recorded on the ex-dividend date, except for certain dividends or corporate actions from foreign securities where the ex-dividend date may have passed, which are recorded as soon as the Fund is informed of the ex-dividend date. Withholding taxes on foreign dividends have been provided for in accordance with the Fund’s understanding of the applicable country’s tax rules and rates. Non-cash dividends included in dividend income, if any, are recorded at the fair market value of the securities received. Distributions received in excess of income are recorded as a reduction of cost of investments and/or realized gain. Interest income is recorded on the accrual basis.
Expenses are recorded on the accrual basis. Most expenses of the Trust can be directly attributed to a specific series. Expenses which cannot be directly attributed are apportioned among the Funds in the Trust.
Distributions to shareholders are recorded on the ex-dividend date.
Repurchase agreements The Fund may enter into repurchase agreements secured by U.S. government securities which involve the purchase of securities from a counterparty with a simultaneous commitment to resell the securities at an agreed-upon date and price. It is the
Fund’s policy that its custodian take possession of the underlying collateral securities, the fair value of which exceeds the principal amount of the repurchase transaction, including accrued interest, at all times. In the event of default by the counterparty, the Fund has the contractual right to liquidate the securities and to apply the proceeds in satisfaction of the obligation.
NOTE 2—RELATED PARTY TRANSACTIONS
Management fees Under a written agreement approved by a unanimous vote of the Board of Trustees, the Fund pays an annual management fee of 0.60% of the Fund’s average daily net assets to Dodge & Cox, investment manager of the Fund.
Fund officers and trustees All officers and three of the trustees of the Trust are officers or employees of Dodge & Cox. The Trust pays a fee only to those trustees who are not affiliated with Dodge & Cox.
Indemnification Under the Trust’s organizational documents, its officers and trustees are indemnified against certain liabilities arising out of the performance of their duties to the Trust. In addition, in the normal course of business the Trust enters into contracts that provide general indemnities to other parties. The Trust’s maximum exposure under these arrangements is unknown as this would involve future claims that may be made against the Trust that have not yet occurred.
NOTE 3—INCOME TAX INFORMATION AND DISTRIBUTIONS TO SHAREHOLDERS
A provision for federal income taxes is not required since the Fund intends to continue to qualify as a regulated investment company under Subchapter M of the Internal Revenue Code and distribute all of its taxable income to shareholders. Distributions are determined in accordance with income tax regulations, which may differ from net investment income and realized gains for financial reporting purposes. Financial reporting records are adjusted for permanent book/tax differences to reflect tax character. Financial records are not adjusted for temporary differences.
Certain foreign countries impose a tax on capital gains which is accrued by the Fund based on unrealized
| | | | |
| PAGE | | 11 n DODGE & COX INTERNATIONAL STOCK FUND | | |
NOTES TO FINANCIAL STATEMENTS
appreciation, if any, on affected securities. The tax is paid when the gain is realized.
Book/tax differences are primarily due to differing treatments of net short-term realized gain and foreign currency realized gain (loss). At December 31, 2006, the cost of investments for federal income tax purposes was equal to the cost for financial reporting purposes.
Distributions during the year ended December 31, 2006 and 2005 were characterized as follows for federal income tax purposes:
| | | | |
| | | 2006 | | 2005 |
Ordinary income | | $485,133,441 | | $145,983,315 |
| | ($0.709 per share) | | ($0.394 per share) |
| | |
Long-term capital gain | | $322,307,610 | | $128,673,370 |
| | ($0.471 per share) | | ($0.347 per share) |
At December 31, 2006, the tax basis components of distributable earnings were as follows:
| | | | |
Unrealized appreciation | | $ | 6,491,750,888 | |
Unrealized depreciation | | | (208,987,177 | ) |
| | | | |
Net unrealized appreciation | | | 6,282,763,711 | |
Undistributed ordinary income | | | 14,690,244 | |
Undistributed long-term capital gain | | | 196,527,931 | |
Deferred loss* | | | (1,129,708 | ) |
| * | | Represents net realized loss incurred between November 1, 2006 and December 31, 2006. As permitted by tax regulations, the Fund has elected to treat this loss as arising in 2007. |
NOTE 4—PURCHASES AND SALES OF INVESTMENTS
For the year ended December 31, 2006, purchases and sales of securities, other than short-term securities, aggregated $13,527,736,922 and $1,791,832,792, respectively.
NOTE 5—ACCOUNTING PRONOUNCEMENTS
In July 2006, the Financial Accounting Standards Board (FASB) issued Interpretation 48, “Accounting for Uncertainty in Income Taxes” (FIN 48). FIN 48 clarifies the accounting for income taxes by prescribing the minimum recognition threshold a tax position must meet before being recognized in the financial statements. FIN 48 is effective for the Fund beginning June 29, 2007. The impact to the Fund’s financial statements, if any, has not yet been determined.
In September 2006, FASB issued “Statement of Financial Accounting Standards No. 157, Fair Value Measurements” (SFAS 157). SFAS 157 is effective for the Fund beginning January 1, 2008. It defines fair value, establishes a framework for measuring fair value and expands disclosures about fair value measurements. Management is currently evaluating the impact the adoption of SFAS 157 will have on the Fund’s financial statement disclosures.
| | | | | | |
| | DODGE & COX INTERNATIONAL STOCK FUND n | | PAGE | | 12 |
NOTES TO FINANCIAL STATEMENTS
NOTE 6—HOLDINGS OF 5% VOTING SECURITIES
Each of the companies listed below is considered to be an affiliate of the Fund because the Fund owned 5% or more of the company’s voting securities during the year ended December 31, 2006. Transactions during the year in securities of affiliated companies were as follows:
| | | | | | | | | | | | | | | | | |
| | | Shares at
Beginning of Year | | Additions | | Reductions | | | Shares at
End of Year | | Dividend
Income(a) | | | Value at
End of Year | |
Aderans Co., Ltd. (Japan) | | 2,733,200 | | 271,900 | | — | | | 3,005,100 | | $ | 1,019,683 | | | $ | 74,619,306 | |
Arkema (France) | | — | | 3,400,263 | | — | | | 3,400,263 | | | — | (b) | | $ | 174,737,988 | |
Brother Industries, Ltd. (Japan) | | 19,244,000 | | — | | — | | | 19,244,000 | | | 2,141,882 | | | | 260,510,768 | |
Consorcio Ara SA de CV (Mexico) | | 20,679,800 | | 1,425,200 | | — | | | 22,105,000 | | | 7,163,631 | | | | 150,395,029 | |
Converium Holdings AG (Switzerland) | | 8,918,646 | | — | | — | | | 8,918,646 | | | 594,787 | | | | 119,671,614 | |
Corporacion Geo SA de CV, Series B (Mexico) | | 42,105,400 | | — | | — | | | 42,105,400 | | | — | (b) | | | 210,858,293 | |
Cott Corp. (Canada) | | — | | 4,285,100 | | (454,300 | ) | | 3,830,800 | | | — | (b) | | | 54,818,748 | |
Elior (France) | | 6,958,147 | | 1,307,812 | | (8,265,959 | ) | | — | | | 1,271,406 | | | | — | (c) |
Epcos AG (Germany) | | 2,796,500 | | 3,031,600 | | — | | | 5,828,100 | | | — | (b) | | | 116,554,768 | |
Infineon Technologies AG (Germany) | | 20,500,000 | | 26,527,800 | | — | | | 47,027,800 | | | — | (b) | | | 663,004,281 | |
Makhteshim-Agan Industries, Ltd. (Israel) | | 19,300,000 | | 10,159,809 | | — | | | 29,459,809 | | | 3,023,794 | | | | 167,183,543 | |
Mediceo Paltac Holdings Co., Ltd. (Japan) | | 8,459,700 | | 5,100,000 | | | | | 13,559,700 | | | 1,156,101 | | | | 256,939,822 | |
Nexans SA (France) | | 1,616,440 | | 250,000 | | — | | | 1,866,440 | | | 1,853,699 | | | | 238,988,049 | |
Oce NV (Netherlands) | | 6,718,524 | | 1,300,000 | | — | | | 8,018,524 | | | 4,491,827 | | | | 131,146,335 | |
Seiko Epson Corp. (Japan) | | 9,254,100 | | 4,173,100 | | (20,300 | ) | | 13,406,900 | | | 3,276,203 | | | | 326,145,754 | |
Shinsei Bank, Ltd. (Japan) | | 46,715,000 | | 27,438,000 | | | | | 74,153,000 | | | 1,557,633 | | | | 436,175,791 | |
Sulzer AG (Switzerland) | | 290,121 | | — | | (279,521 | ) | | 10,600 | | | 2,708,752 | | | | — | (c) |
Thomson (France) | | 8,240,015 | | 7,544,823 | | — | | | 15,784,838 | | | 5,305,021 | | | | 308,592,669 | |
Toto, Ltd. (Japan) | | 15,654,000 | | 13,003,000 | | — | | | 28,657,000 | | | 2,835,180 | | | | 287,039,570 | |
Yamaha Corp. (Japan) | | 10,576,000 | | 8,275,000 | | (4,000,000 | ) | | 14,851,000 | | | 2,666,104 | | | | 314,478,552 | |
| | | | | | | | | | | | | | | | | |
| | | | | | | | | | | $ | 41,065,703 | | | $ | 4,291,860,880 | |
| | | | | | | | | | | | | | | | | |
(a) | | Net of foreign taxes, if any |
(c) | | Company was not an affiliate at the end of the year |
| | | | |
| PAGE | | 13 n DODGE & COX INTERNATIONAL STOCK FUND | | |
FINANCIAL HIGHLIGHTS
| | | | | | | | | | | | | | | |
SELECTED DATA AND RATIOS (for a share outstanding throughout each period) | | Year Ended December 31, | |
| | | 2006 | | | 2005 | | | 2004 | | | 2003 | | | 2002 | |
Net asset value, beginning of year | | $35.03 | | | $30.64 | | | $23.48 | | | $15.81 | | | $18.42 | |
Income from investment operations: | | | | | | | | | | | | | | | |
Net investment income | | 0.57 | | | 0.33 | | | 0.26 | | | 0.14 | | | 0.13 | |
Net realized and unrealized gain (loss) | | 9.24 | | | 4.80 | | | 7.36 | | | 7.67 | | | (2.55 | ) |
| | | |
Total from investment operations | | 9.81 | | | 5.13 | | | 7.62 | | | 7.81 | | | (2.42 | ) |
| | | |
Distributions to shareholders from: | | | | | | | | | | | | | | | |
Net investment income | | (0.56 | ) | | (0.35 | ) | | (0.24 | ) | | (0.14 | ) | | (0.13 | ) |
Net realized gain | | (0.62 | ) | | (0.39 | ) | | (0.22 | ) | | — | | | (0.06 | ) |
| | | |
Total distributions | | (1.18 | ) | | (0.74 | ) | | (0.46 | ) | | (0.14 | ) | | (0.19 | ) |
| | | |
Net asset value, end of year | | $43.66 | | | $35.03 | | | $30.64 | | | $23.48 | | | $15.81 | |
| | | |
Total return | | 28.00 | % | | 16.74 | % | | 32.46 | % | | 49.42 | %† | | (13.11 | )%† |
Ratios/supplemental data: | | | | | | | | | | | | | | | |
Net assets, end of year (millions) | | $30,899 | | | $13,357 | | | $4,203 | | | $655 | | | $117 | |
Ratios of expenses to average net assets | | 0.66 | % | | 0.70 | % | | 0.77 | % | | 0.82 | % | | 0.90 | % |
Ratio of expenses to average net assets,
before reimbursement by investment manager | | 0.66 | % | | 0.70 | % | | 0.77 | % | | 0.84 | % | | 1.03 | % |
Ratios of net investment income to average net assets | | 1.82 | % | | 1.54 | % | | 1.90 | % | | 1.53 | % | | 1.30 | % |
Portfolio turnover rate | | 9 | % | | 7 | % | | 6 | % | | 11 | % | | 12 | % |
| † | | Expense reimbursements were paid by Dodge & Cox from the Fund’s inception through June 30, 2003 to maintain operating expenses at 0.90%. Accordingly, without the expense reimbursements, the Fund’s returns prior to June 30, 2003 would have been lower. |
See accompanying Notes to Financial Statements
REPORT OF INDEPENDENT REGISTERED PUBLIC ACCOUNTING FIRM
To the Trustees of Dodge & Cox Funds and Shareholders of Dodge & Cox International Stock Fund
In our opinion, the accompanying statement of assets and liabilities, including the portfolio of investments, and the related statements of operations and of changes in net assets and the financial highlights present fairly, in all material respects, the financial position of the Dodge & Cox International Stock Fund (the “Fund”, one of the series constituting Dodge & Cox Funds) at December 31, 2006, the results of its operations for the year then ended, the changes in its net assets for each of the two years in the period then ended and the financial highlights for each of the five years in the period then ended, in conformity with accounting principles generally accepted in the United States of America. These financial statements and financial highlights (hereafter referred to as “financial statements”) are the responsibility of the Fund’s management; our responsibility is to express an opinion on these financial statements based on our audits. We conducted our audits of these financial statements in accordance with the standards of the Public Company Accounting Oversight Board (United States). Those standards require that we plan and perform the audit to obtain reasonable assurance about whether the financial statements are free of material misstatement. An audit includes examining, on a test basis, evidence supporting the amounts and disclosures in the financial statements, assessing the accounting principles used and significant estimates made by management, and evaluating the overall financial statement presentation. We believe that our audits, which included confirmation of securities at December 31, 2006 by correspondence with the custodian and brokers, provide a reasonable basis for our opinion.
PricewaterhouseCoopers LLP
San Francisco, California
February 9, 2007
| | | | | | |
| | DODGE & COX INTERNATIONAL STOCK FUND n | | PAGE | | 14 |
SPECIAL 2006 TAX INFORMATION (unaudited)
The following information is provided pursuant to provisions of the Internal Revenue Code:
In 2006, the Fund has elected to pass through to shareholders foreign source income of $516,434,362 and foreign taxes paid of $41,190,428.
The Fund designates up to a maximum of $511,642,531 of its distributions paid to shareholders in 2006 as qualified dividends (treated for federal income tax purposes in the hands of shareholders as taxable at a maximum rate of 15%).
For shareholders that are corporations, the Fund designates 1% of its ordinary dividends (including short-term gains) paid to shareholders in 2006 as dividends from domestic corporations eligible for the corporate dividends received deduction, provided that the shareholder otherwise satisfies applicable requirements to claim that deduction.
BOARD APPROVAL OF FUNDS’ INVESTMENT MANAGEMENT AGREEMENTS AND MANAGEMENT FEES (unaudited)
The Board of Trustees is responsible for overseeing the performance of the Dodge & Cox Funds’ investment manager and determining whether to continue the Investment Management Agreements between the Funds and Dodge & Cox each year (the “Agreements”). At a meeting of the Board of Trustees of the Trust held on December 14, 2006, the Trustees, by a unanimous vote (including a separate vote of those Trustees who are not “interested persons” (as defined in the Investment Company Act of 1940) (the “Independent Trustees”)), approved the renewal of the Agreements for an additional one-year term through December 31, 2007. During the course of the year, the Board received a wide variety of materials relating to the services provided by Dodge & Cox and the performance of the Funds.
INFORMATION RECEIVED
In advance of the meeting, the Board, including each of the Independent Trustees, requested, received and reviewed materials relating to the Agreements. The
Independent Trustees retained Morningstar® to prepare an independent expense and performance summary for each Fund and comparable funds managed by other advisers identified by Morningstar®. The Morningstar® materials included information regarding advisory fee rates, expense ratios, and transfer agency, custodial and distribution expenses, as well as performance comparisons to an appropriate index or combination of indices. The materials reviewed by the Board also included information concerning Dodge & Cox’s profitability, financial results and condition, including advisory fee revenue and separate account advisory fee schedules. The Board additionally considered the Funds’ brokerage commissions, turnover rates and sales and redemption data for the Funds, including “soft dollar” payments made for research benefiting the Funds and other accounts managed by Dodge & Cox, and brokerage commissions and expenses paid by Dodge & Cox. Other aspects of Dodge & Cox’s services to the Funds which were reviewed included compliance and supervision of third-party service providers (e.g., custodian, fund accountant, transfer agent and state registration administrator), shareholder servicing, accounting and administrative services, web services, the character of non-advisory services, the record of compliance with the Funds’ investment policies and restrictions and the Funds’ Code of Ethics, investment management staffing and biographies, information furnished to investors and shareholders (including the Funds’ prospectus, Statement of Additional Information, shareholder reports, and quarterly reports), and third-party retirement plan administrator reimbursements by Dodge & Cox for the same periods.
The Board received copies of the Agreements and a memorandum from the Independent Legal Counsel to the Independent Trustees, discussing the factors generally regarded as appropriate to consider in evaluating advisory arrangements. The Trust’s Governance Committee, consisting solely of Independent Trustees, met with the Independent Legal Counsel on November 28, 2006 and again on December 14, 2006 to discuss whether to renew the Agreements. The Board, including the Independent Trustees, subsequently concluded that the existing Agreements are fair and reasonable and voted to approve the Agreements.
| | | | |
| PAGE | | 15 n DODGE & COX INTERNATIONAL STOCK FUND | | |
In considering the Agreements, the Board, including the Independent Trustees, did not identify any single factor or particular information as all-important or controlling. In reaching the decision to approve the Agreements, the Board, which was advised by Independent Legal Counsel, considered the following factors, among others, and reached the conclusions described below.
NATURE, QUALITY, AND EXTENT OF THE SERVICES
The Board considered the nature, quality and extent of portfolio management, administrative and shareholder services performed by Dodge & Cox, including: Dodge & Cox’s established long-term history of care and conscientiousness in the management of the Funds; demonstrated consistency in investment approach and depth, background and experience of the Dodge & Cox Investment Policy Committee, International Investment Policy Committee, Fixed Income Investment Policy Committee and research analysts responsible for managing the Funds; Dodge & Cox’s organizational structure; frequent favorable recognition of Dodge & Cox and the Funds in the media and industry publications; Dodge & Cox’s performance in the areas of compliance, administration and shareholder communication and services, supervision of Fund operations and general oversight of other service providers; favorable peer group comparisons of expense ratios, management fee comparisons, expenses (e.g., transfer agent, custody and other fees and expenses) and asset comparisons and performance and risk summaries prepared independently by Morningstar® and favorable fiduciary grade and “Star” rankings by Morningstar®. The Board also acknowledged Dodge & Cox’s decision to close its institutional equity and balanced separate account business to new accounts and had previously voted, at the recommendation of Dodge & Cox, to close the Stock and Balanced Funds to control the pace of growth. The Board also acknowledged that the services provided by Dodge & Cox are extensive in nature and that Dodge & Cox consistently delivered a high level of service. The Board concluded that it was satisfied with the nature, extent and quality of investment management and other services provided to the Funds by Dodge & Cox.
INVESTMENT PERFORMANCE
The Board considered short-term and long-term investment performance for each Fund (including periods of outperformance or underperformance) as compared to both relevant indices and the performance of such Fund’s peer group. The performance information prepared by Morningstar® and Dodge & Cox demonstrated to the Board a consistent pattern of favorable performance for investors and, in most instances, the Funds have outperformed their peer groups for short and long-term periods. The Board considered that the performance of the Funds is the result of an investment management process that emphasizes a long-term investment horizon, independence, comprehensive research, price discipline and focus. The Board also noted that the strong investment performance delivered by Dodge & Cox to the Funds appeared to be consistent with the performance delivered for other (non-fund) clients of Dodge & Cox. The Board concluded that Dodge & Cox delivers favorable performance for Fund investors consistent with the long-term investment strategies being pursued by the Funds.
COSTS AND ANCILLARY BENEFITS
Costs of Services to Funds: Fees and Expenses. The Board considered each Fund’s management fee rates and expense ratios relative to industry averages for similar mutual funds and relative to management fees charged by Dodge & Cox to other (non-fund) clients. The Board evaluated the operating structures of the Funds and Dodge & Cox, including the following: Dodge & Cox has a centralized focus on investment management operations and derives revenue solely from management fees; its outsourcing of non-advisory support services to unaffiliated third-party service providers is efficient and less costly to investors; Dodge & Cox does not charge front-end sales commissions or distribution fees and bears all distribution-related costs as well as reimbursements to third-party retirement plan administrators; the Funds receive numerous administrative, regulatory compliance, and shareholder support services from Dodge & Cox without any additional administrative fee; and the fact that the Funds have relatively low transaction costs and portfolio turnover rates. The Board noted that the Funds
| | | | | | |
| | DODGE & COX INTERNATIONAL STOCK FUND n | | PAGE | | 16 |
are substantially below peer group averages in expense ratios and management fee rates. The Board also noted that the range of services under the Agreements is much more extensive than under Dodge & Cox’s separate advisory (non-fund) client agreements, and considered that, when coupled with the greater risks and regulatory burdens associated with the high profile mutual fund business, there is reasonable justification for differences in fee rates charged between the two lines of business. The Board concluded that costs incurred by the Funds for the services they receive (including the management fee paid to Dodge & Cox) are reasonable and that the fees are acceptable based upon the qualifications, experience, reputation and performance of Dodge & Cox and the low overall expense ratios of the Funds.
Profitability and Costs of Services to Dodge & Cox; “Fall-out” Benefits. The Board reviewed reports of Dodge & Cox’s financial position, profitability and estimated overall value, and they considered Dodge & Cox’s overall profitability within its context as a private, employee-owned S-Corporation and relative to the favorable services provided. The Board considered recent increases to Dodge & Cox’s gross revenues, and noted the importance of Dodge & Cox’s profitability—which is derived solely from management fees and does not include other business ventures—to maintain its independence, company culture and ethics, and management continuity. They noted that Dodge & Cox’s profitability is enhanced due to its efficient internal business model, and that the compensation/profit structure at Dodge & Cox is vital for remaining independent and facilitating retention of its management and investment professionals. They also noted that Dodge & Cox has voluntarily limited growth of assets by closing the Stock and Balanced Funds to new investors and by not taking on new equity and balanced institutional separate account clients. The Board noted that these actions were financially disadvantageous to Dodge & Cox, but illustrated a commitment to act in the best interest of existing Fund shareholders and separate account clients. The Board considered potential “fall-out” benefits (including the receipt of research from unaffiliated brokers) that Dodge & Cox might receive in its association with the Funds. The Board also noted the extent of additional administrative services performed by
Dodge & Cox for the Funds, and that the magnitude of costs and risks borne by Dodge & Cox in rendering advisory services to the Funds (including risks in the compliance, securities valuation and investment management processes) are continuing to increase. The Board concluded that the profitability of Dodge & Cox’s relationship with the Funds (including fall-out benefits) was fair and reasonable.
THE BENEFIT OF ECONOMIES OF SCALE
The Board considered whether there have been economies of scale with respect to the management of each Fund, whether the Funds have appropriately benefited from any economies of scale, and whether the management fee rate is reasonable in relation to the Fund assets and any economies of scale that may exist. The Board noted that the considerable efficiencies of the Funds’ organization and fee structure have been realized by shareholders at the outset of their investment (i.e., from the first dollar), as a result of management fee rates that start lower than industry and many peer group averages and management fees and overall expense ratios that are lower than averages for peer group funds with approximately the same level of assets. Shareholders also realize efficiencies from the outset of their investment due to organizational efficiencies derived from Dodge & Cox’s investment management process and the avoidance of distribution and marketing structures whose costs would ultimately be borne by the Funds. The Board noted that Dodge & Cox’s internal costs of providing investment management, administrative and compliance services to the Funds are continuing to increase. The Board’s decision to renew the Agreements was made after consideration of economies of scale and review of comparable fund expense ratios and historical expense ratio patterns for the Funds. Their review also included consideration of the desirability of adding breakpoints to the Funds’ fee schedules. The Board concluded that the current Dodge & Cox fee structure is fair and reasonable and adequately reflects economies of scale.
CONCLUSION
Based on their evaluation of all material factors and assisted by the advice of Independent Legal Counsel to
| | | | |
| PAGE | | 17 n DODGE & COX INTERNATIONAL STOCK FUND | | |
the Independent Trustees, the Board, including the Independent Trustees, concluded that the advisory fee structure was fair and reasonable, that each Fund was paying a competitive fee for the services provided, that the scope and quality of Dodge & Cox’s services has provided substantial value for Fund shareholders over the long term, and that approval of the Agreements was in the best interests of each Fund and its shareholders.
FUND’S HOLDINGS
The Fund provides a complete list of its holdings four times each fiscal year, as of the end of each quarter. The lists appear in the Fund’s First Quarter, Semi-Annual, Third Quarter and Annual Reports to shareholders. The Fund files the lists with the Securities and Exchange Commission (SEC) on Form N-CSR (second and fourth quarters) and Form N-Q (first and third quarters). Shareholders may view the Fund’s Forms N-CSR and N-Q on the SEC’s website at www.sec.gov. Forms N-CSR and
N-Q may also be reviewed and copied at the SEC’s Public Reference Room in Washington, DC. Information regarding the operations of the Public Reference Room may be obtained by 1-202-942-8090 (direct) or 1-800-732-0330 (general SEC number). A complete list of the Fund’s quarter-end holdings is also available at www.dodgeandcox.com on or about 15 days following each quarter end and remains available on the web site until the list is updated in the subsequent quarter.
PROXY VOTING
For a free copy of the Fund’s proxy voting policies and procedures, please call 1-800-621-3979, visit the Fund’s web site at www.dodgeandcox.com or visit the SEC’s web site at www.sec.gov. Information regarding how the Fund voted proxies relating to portfolio securities during the most recent 12-month period ending June 30 is also available at www.dodgeandcox.com or at www.sec.gov.
| | | | | | |
| | DODGE & COX INTERNATIONAL STOCK FUND n | | PAGE | | 18 |
DODGE & COX FUNDS—EXECUTIVE OFFICER & TRUSTEE INFORMATION
| | | | | | |
Name (Age) and
Address* | | Position with Trust
(Year of Election or
Appointment) | | Principal Occupation During Past 5 Years | | Other Directorships Held by Trustees |
| INTERESTED TRUSTEES & OFFICERS |
John A. Gunn (63) | | Chairman and Trustee
(Trustee since 1985) | | Chairman (since 2007), Chief Executive Officer (since 2005) and Director of Dodge & Cox, Portfolio Manager and member of Investment Policy Committee (IPC), Fixed Income Investment Policy Committee (FIIPC) and International Investment Policy Committee (IIPC) | | — |
Kenneth E. Olivier (54) | | President and Trustee (Trustee since 2005) | | President (since 2005) and Director of Dodge & Cox, Portfolio Manager and member of IPC | | — |
Dana M. Emery (45) | | Vice President and Trustee (Trustee since 1993) | | Executive Vice President (since 2005) and Director of Dodge & Cox, Manager of the Fixed Income Department, Portfolio Manager and member of FIIPC | | — |
| Katherine Herrick Drake (52) | | Vice President (Since 1993) | | Vice President of Dodge & Cox, Portfolio Manager | | — |
| Diana S. Strandberg (47) | | Vice President
(Since 2005) | | Vice President of Dodge & Cox, Portfolio Manager and member of IPC and IIPC | | |
John M. Loll (40) | | Assistant Treasurer
and Assistant Secretary (Since 2000) | | Vice President and Treasurer of Dodge & Cox | | — |
| David H. Longhurst (49) | | Treasurer (Since 2006) | | Fund Administration and Accounting Senior Manager of Dodge & Cox (since 2004); Vice President, Treasurer, Controller and Secretary of Safeco Mutual Funds, Safeco Asset Management Company, Safeco Services, Safeco Securities, and Safeco Investment Services (2000-2004) | | — |
| Thomas M. Mistele (53) | | Secretary and Assistant Treasurer (Since 2000) | | Chief Operating Officer (since 2004), Director (since 2005), Secretary and General Counsel of Dodge & Cox | | — |
| Marcia P. Venegas (38) | | Chief Compliance Officer
(Since 2004) | | Chief Compliance Officer of Dodge & Cox (since 2005), Compliance Officer of Dodge & Cox (2003-2004); Compliance and Business Risk Manager of Deutsche Asset Management, Australia Limited (1999-2001) | | — |
| INDEPENDENT TRUSTEES |
William F. Ausfahl (66) | | Trustee (Since 2002) | | CFO, The Clorox Co. (1982-1997); Director, The Clorox Co. (1984-1997) | | — |
L. Dale Crandall (65) | | Trustee (Since 1999) | | President, Kaiser Foundation Health Plan, Inc. and Kaiser Foundation Hospitals (2000-2002); Senior Vice President—Finance and Administration & CFO, Kaiser Foundation Health Plan, Inc. and Kaiser Foundation Hospitals (1998-2000) | | Director, Union BanCal Corporation (bank holding company) and Union Bank of California (commercial bank) (2001-Present); Director, Covad Communications Group (broadband communications services) (2002-Present); Director, Ansell Limited (medical equipment and supplies) (2002-Present); Director, BEA Systems, Inc. (software and programming) (2003-Present); Director, Coventry Health Care, Inc. (managed healthcare) (2004-Present) |
Thomas A. Larsen (57) | | Trustee (Since 2002) | | Director in Howard, Rice, Nemerovski, Canady, Falk & Rabkin (law firm) | | — |
John B. Taylor (61) | | Trustee (Since 2005) | | Professor of Economics, Stanford University; Senior Fellow, Hoover Institution; Under Secretary for International Affairs, United States Treasury (2001-2005) | | — |
Will C. Wood (67) | | Trustee (Since 1992) | | Principal, Kentwood Associates, Financial Advisers | | Director, Banco Latinoamericano de Exportaciones S.A. (Latin American Foreign Trade Bank) (1999-Present) |
| * | | The address for each Officer and Trustee is 555 California Street, 40th Floor, San Francisco, California 94104. Each Officer and Trustee oversees all four series in the Dodge & Cox Funds complex and serves for an indefinite term. |
Additional information about the Trust’s Trustees and Officers is available in the Trust’s Statement of Additional Information (SAI). You can get a free copy of the SAI by visiting the Fund’s website at www.dodgeandcox.com or calling 1-800-621-3979.
| | | | |
| PAGE | | 19 n DODGE & COX INTERNATIONAL STOCK FUND | | |


Balanced Fund
ESTABLISHED 1931
(Closed to New Investors)
Annual Report
December 31, 2006
2006
Balanced Fund
www.dodgeandcox.com
For Fund literature, transactions and account
information, please visit the Funds’ web site.
or write or call:
DODGE & COX FUNDS
c/o Boston Financial Data Services
P.O. Box 8422
Boston, Massachusetts 02266-8422
(800) 621-3979
INVESTMENT MANAGER
Dodge & Cox
555 California Street, 40th Floor
San Francisco, California 94104
(415) 981-1710
This report is submitted for the general information of the shareholders of the Fund. The report is not authorized for distribution to prospective investors in the Fund unless it is accompanied by a current prospectus.
This report reflects our views, opinions and portfolio holdings as of December 31, 2006, the end of the reporting period. Any such views are subject to change at any time based upon market or other conditions and Dodge & Cox disclaims any responsibility to update such views. These views may not be relied on as investment advice and, because investment decisions for a Dodge & Cox Fund are based on numerous factors, may not be relied on as an indication of trading intent on behalf of any Dodge & Cox Fund.
12/06 BF AR  Printed on recycled paper
TO OUR SHAREHOLDERS
It is not often one has the opportunity to recognize a colleague who has contributed to an organization for close to four decades, so we begin this year’s annual letter to shareholders with a warm farewell to Harry Hagey, who retired from Dodge & Cox on December 31, 2006. Harry joined Dodge & Cox 39 years ago as a security analyst, and served as the firm’s Chairman for the past 14 years and Chief Executive Officer between 1992 and 2005. He served as the firm’s fourth Chairman—the firm’s founder, E. Morris Cox, Peter Avenali and Joe Fee preceded him. He also succeeded Peter Avenali as Chairman of the Dodge & Cox Funds.
Harry’s greatest legacy is the importance he placed on Dodge & Cox’s culture, specifically: strong ethics (i.e., placing our clients’ interests ahead of our own), the firm’s employee ownership structure, respect for each client and employee, and the absence of a marketing mindset. Harry ingrained these important tenets into all of us over his years here, and he helped develop our team of 59 investment professionals (who have an average tenure at the firm of 10 years), including our expanded Investment Policy Committee, which oversees the Balanced Fund and whose twelve members now have an average tenure at Dodge & Cox of 20 years.
We greatly appreciate Harry’s leadership and many years of hard work on behalf of the firm and its clients. We will miss his warm personality and camaraderie, and we wish him well in his future endeavors. Effective January 1, 2007, John Gunn was appointed Chairman of the firm and of the Dodge & Cox Funds. John has been with Dodge & Cox since 1972, and also serves as the firm’s CEO.
2006 PERFORMANCE REVIEW
We are pleased to report that 2006 was the eighth consecutive year in which the Balanced Fund outperformed the Combined Index1. The Fund returned 13.8% in 2006 compared to 11.1% for the Combined Index. At year end, the Fund’s net assets of $27.5 billion were invested in 64.2% stocks, 30.7% fixed-income securities and 5.1% cash equivalents.
The Fund’s strong performance relative to the Combined Index in 2006 was driven by both the equity
and fixed-income portfolios. The equity portfolio’s total return exceeded that of the Standard & Poor’s 500 Index (S&P 500). Specifically, the equity portfolio’s Consumer Discretionary stocks (up 28%) outpaced those in the S&P 500 (up 17%). The portfolio also had a higher weighting than the market in this sector which enhanced returns. Comcast (up 63%), the portfolio’s largest holding, made the largest single contribution to return. The portfolio’s Information Technology stocks (up 22%) also outpaced their S&P 500 counterparts (up 9%). Detractors from the equity portfolio’s performance relative to the S&P 500 included three of its Japanese technology-related holdings: Sony (up 6%), Matsushita (up 5%) and Hitachi (down 6%). Capital One Financial (down 11%) was the portfolio’s single largest detractor for the year.
With regards to the fixed-income portfolio, the primary sources of its outperformance of the Lehman Brothers Aggregate Bond Index (LBAG) in 2006 included: 1) strong performance from investments in Ford Motor Credit, GMAC, and Xerox (offset somewhat by weak performance from HCA); 2) the portfolio’s shorter-than-benchmark duration2; 3) strong performance from the portfolio’s mortgage-backed securities (MBS); and 4) the portfolio’s overweight positions in the Corporate and MBS sectors, which outperformed comparable Treasuries.
As always, we manage the Fund using a three-to-five year investment horizon, and encourage shareholders to focus on this longer time period.
INVESTMENT STRATEGY
With regards to equity strategy, technological innovation and the spread of free market economic principles are facilitating the continued integration of the global economy and rapid expansion of the developing world. Integration and growth in the global economy have had a profound impact on the companies in our investment universe, and consequently on how we conduct research at Dodge & Cox. For instance, 38 of the equity portfolio’s U.S.-domiciled companies (which represent 47% of the equity portfolio) have at least 25% of their sales coming from overseas. Additionally, another 17% of the equity portfolio is invested in 18 companies that are based outside the U.S. We have been expanding our research
| | | | |
| PAGE | | 1 n DODGE & COX BALANCED FUND | | |
effort over the past ten years to include a global perspective. In fact, the decision to start our International Stock Fund in 2001 was made in part to improve our overall research effort for the benefit of our current clients. Each of our 20 research analysts take a global view when covering their industries, and is responsible for making investment recommendations to the teams managing all four of the Dodge & Cox Funds.
With regards to the fixed-income portfolio, the low level of nominal interest rates seems to incorporate expectations for slowing inflation. Over the intermediate term, we expect continued U.S. economic growth given the health of the corporate sector, tight labor markets, rising incomes and other influences. Against this backdrop, we believe that headline inflation, despite recent declines due to receding energy prices, is unlikely to decline further, and core inflation (excluding food and energy) is likely to remain above the Federal Reserve’s comfort zone. Furthermore, nominal rates on U.S. Treasuries from 2-30 years lie within approximately 5 basis points (1 basis point equals 1/100 of 1%) of 4.75%, offering quite modest return possibilities at all maturity points (particularly among longer-duration securities) after factoring in our expectations for inflation. As such, we have maintained the portfolio’s shorter relative duration positioning (3.8 years versus 4.5 years for the LBAG as of year end). As always, we seek ways to add to the portfolio’s yield and total return potential through our in-depth security-specific research efforts.
LOOKING FORWARD
While we remain optimistic about the long-term prospects for the world economy and confident in our ability to continue to implement our investment approach, the past
seven years (roughly since the peak of the technology-led market bubble) have been exceptional for the Balanced Fund compared to the Combined Index. Since the end of 1999, the Fund has returned an annualized 11.2% per year compared to 3.5% for the Combined Index. This outperformance was fueled primarily by the Fund’s equity portfolio, which provided an average annualized return of close to 13% since the end of 1999, compared to 1.1% per year for the S&P 500. Over this time period, what were lower valuation stocks (primarily in the Industrial, Materials and Energy sectors) have significantly outperformed what turned out to be overvalued stocks (primarily in the Information Technology, Media, Telecommunications and Health Care sectors). Today, with valuations across all sectors of the market much more homogeneous, the possibility of the equity portfolio outperforming the S&P 500 by such a wide margin going forward is remote. Indeed, outperforming the S&P 500 at all given this valuation landscape will be a formidable challenge. Moreover, we would like to remind shareholders that equity returns have historically been volatile; stock prices go up and down, and investors could lose money.
Historical volatility in the equity markets supports a balanced approach to investing. For instance, in 2002 (the last year U.S. equity returns were negative) the S&P 500 returned -22% and the Balanced Fund’s equity portfolio returned -10%. The Balanced Fund, however, lost only 3% of its value because its fixed-income portfolio that year returned over 11%. With bonds now yielding around 5%, our expectations for fixed-income returns today are more modest. At the same time, we continue to believe fixed-income securities play a vital role in capital preservation and income generation.
| | | | | | |
| | DODGE & COX BALANCED FUND n | | PAGE | | 2 |
Finally, because we do not believe it is possible to consistently time such divergences in asset class returns, we do not change the Fund’s asset allocation between stocks, bonds and cash dramatically year-to-year, let alone quarter-to-quarter. The Fund’s current asset allocation of 64.2% in stocks and 35.8% in bonds and cash reflects our belief that the outlook for stocks over the next three-to-five years is potentially more attractive than the outlook for fixed-income securities. Regardless of what happens in the near term, our team at Dodge & Cox will continue to focus on our three-to-five year investment horizon and work hard to uncover attractive opportunities.
Thank you for your continued confidence in our firm as a shareholder of the Dodge & Cox Balanced Fund. As always, we welcome your comments and questions.
For the Board of Trustees,
| | |

| | 
|
John A. Gunn, Chairman | | Kenneth E. Olivier, President |
February 9, 2007
1 | | The Combined Index reflects an unmanaged portfolio of 60% of the Standard & Poor’s 500 Index (S&P 500) and 40% of the Lehman Brothers Aggregate Bond Index (LBAG). The Fund may, however, invest up to 75% of its total assets in stocks. |
2 | | Duration is a measure of a bond’s price sensitivity to changes in interest rates. |
GROWTH OF $10,000 OVER 10 YEARS
FOR AN INVESTMENT MADE ON DECEMBER 31, 1996
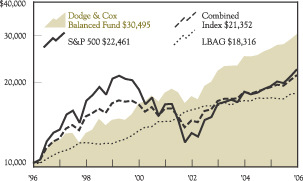
AVERAGE ANNUAL TOTAL RETURN
FOR PERIODS ENDED DECEMBER 31, 2006
| | | | | | | | | | | | |
| | | 1 Year | | | 5 Years | | | 10 Years | | | 20 Years | |
| | | | | | | | | | | | |
Dodge & Cox Balanced Fund | | 13.84 | % | | 10.68 | % | | 11.79 | % | | 12.47 | % |
Combined Index | | 11.11 | | | 5.98 | | | 7.88 | | | 10.30 | |
S&P 500 | | 15.79 | | | 6.18 | | | 8.42 | | | 11.80 | |
Lehman Brothers Aggregate
Bond Index (LBAG) | | 4.33 | | | 5.06 | | | 6.24 | | | 7.35 | |
Past performance does not guarantee future results. Investment return and share price will fluctuate with market conditions, and investors may have a gain or loss when shares are sold. Mutual fund performance changes over time and currently may be significantly lower than stated above. Performance is updated and published monthly. Visit the Fund’s web site at www.dodgeandcox.com or call 1-800-621-3979 for current performance figures.
The Fund’s total returns include the reinvestment of dividend and capital gain distributions, but have not been adjusted for any income taxes payable by shareholders on these distributions. Index returns include dividends and/or interest income and, unlike Fund returns, do not reflect fees or expenses.
Lehman Brothers® is a trademark of Lehman Brothers, Inc.; Standard & Poor’s, Standard & Poor’s 500, and S&P 500® are trademarks of The McGraw-Hill Companies, Inc.
| | | | |
| PAGE | | 3 n DODGE & COX BALANCED FUND | | |
A Message from Former Chairman Harry Hagey
On October 1, 1967, I began my career at Dodge & Cox. At that time, Dodge & Cox was a small independent regional investment counseling firm working with individuals, pension funds and endowment funds. In addition, the firm managed two small no-load mutual funds: the Dodge & Cox Balanced Fund and the Dodge & Cox Stock Fund. After 39 wonderful years at this firm, I am now retiring. I want to take this opportunity to first thank you, our mutual fund shareholders for the trust you have placed in our firm over the years; second, to thank all of my associates with whom I have had the pleasure of working; and finally, to provide you with my thoughts on the current status of the firm and my optimistic outlook for its future.
Let me summarize what I think are the key components that make Dodge & Cox a successful money management firm. First and most importantly, ethical considerations are paramount. We have an excellent reputation, and we work hard to maintain it. When making decisions about how we manage our firm, we always start by asking what is in the best interests of our current clients.
Second, we are in the single business of providing continuous high quality investment management service to our existing clients and shareholders. We decided a long time ago that we are not in business to provide a series of financial products to the investment marketplace. Through a team-oriented, long-term approach, our investment objective is to first preserve and then enhance the future purchasing power of our clients’ wealth over the long term. Over the years, I have often reminded my associates that there are literally millions of individuals counting on us.
A third important ingredient is our employees. We insist on a respect for each individual employee as well as for the entire firm. We work within a collegial environment with the goal of having all of our people think as owners, not just as employees. Our working environment has led to low employee turnover, which in turn, has created stability and continuity over the years.
Finally, with regard to the firm, probably the most important characteristic is our independence. We only report to the Fund’s shareholders, our clients and to ourselves. Ownership of Dodge & Cox is limited to the firm’s active employees, thus I have sold my interest in Dodge & Cox back to the firm (at book value) so my shares will now be available to those coming after me.
As for the future of Dodge & Cox, I am extremely optimistic. We have a deep and talented investment team across the board: domestic equity, international equity and fixed-income. I leave Dodge & Cox today as strong as it has ever been in our 76-year history. I have complete confidence that John Gunn, Ken Olivier, Dana Emery and others will act as responsible stewards of the firm’s unique culture.
On a personal note, the only investment options in the Dodge & Cox retirement plan are the Dodge & Cox Funds, so my own retirement assets have benefited from the Funds’ past results. I look forward to continuing on as a long-term shareholder of the Dodge & Cox Funds.
Thanks again for the confidence you have placed in our firm over the years.
Sincerely,

Harry R. Hagey
| | | | | | |
| | DODGE & COX BALANCED FUND n | | PAGE | | 4 |
FUND EXPENSE EXAMPLE
As a Fund shareholder, you incur ongoing Fund costs, including management fees and other Fund expenses. All mutual funds have ongoing costs, sometimes referred to as operating expenses. The following example shows ongoing costs of investing in the Fund and can help you understand these costs and compare them with those of other mutual funds. The example assumes a $1,000 investment held for the six months indicated.
ACTUAL EXPENSES
The first line of the table below provides information about actual account values and expenses based on the Fund’s actual returns. You may use the information in this line, together with your account balance, to estimate the expenses that you paid over the period. Simply divide your account value by $1,000 (for example, an $8,600 account value divided by $1,000 = 8.6), then multiply the result by the number in the first line under the heading “Expenses Paid During Period” to estimate the expenses you paid on your account during this period.
HYPOTHETICAL EXAMPLE FOR COMPARISON WITH OTHER MUTUAL FUNDS
Information on the second line of the table can help you compare ongoing costs of investing in the Fund with those of other mutual funds. This information may not be used to estimate the actual ending account balance or expenses you paid during the period. The hypothetical “Ending Account Value” is based on the actual expense ratio of the Fund and an assumed 5% annual rate of return before expenses (not the Fund’s actual return). The amount under the heading “Expense Paid During the Period” shows the hypothetical expenses your account would have incurred under this scenario. You can compare this figure with the 5% hypothetical examples that appear in shareholder reports of other mutual funds.
| | | | | | | | | |
Six Months Ended
December 31, 2006 | | Beginning Account
Value 7/1/2006 | | Ending Account
Value 12/31/2006 | | Expenses Paid
During Period* |
Based on Actual Fund Return | | $ | 1,000.00 | | $ | 1,093.90 | | $ | 2.73 |
Based on Hypothetical 5% Yearly Return | | | 1,000.00 | | | 1,022.60 | | | 2.63 |
| * | | Expenses are equal to the Fund’s annualized six-month expense ratio of 0.52%, multiplied by the average account value over the period, multiplied by 184/365 (to reflect the one-half year period). |
The expenses shown in the table highlight ongoing costs only and do not reflect any transactional fees or account maintenance fees. While other mutual funds may charge such fees, please note that the Fund does not charge transaction fees (e.g., redemption fees, sales loads) or universal account maintenance fees (e.g., small account fees).
| | | | |
| PAGE | | 5 n DODGE & COX BALANCED FUND | | |
| | |
| FUND INFORMATION | | December 31, 2006 |
| | |
| GENERAL INFORMATION | | |
Net Asset Value Per Share | | $87.08 |
Total Net Assets (billions) | | $27.5 |
30-Day SEC Yield(a) | | 2.53% |
2006 Expense Ratio | | 0.52% |
2006 Portfolio Turnover Rate | | 20% |
Fund Inception | | 1931 |
| No sales charges or distribution fees | | |
Investment Manager: Dodge & Cox, San Francisco. Managed by the Investment Policy Committee, whose nine members’ average tenure at Dodge & Cox is 21 years, and by the Fixed Income Investment Policy Committee, whose nine members’ average tenure is 17 years.
| | | |
| STOCK PORTFOLIO (64.2% OF FUND) | | | |
Number of Stocks | | 85 | |
Median Market Capitalization (billions) | | $26 | |
Price-to-Earnings Ratio(b) | | 15.4x | |
Foreign Stocks(c) (% of Fund) | | 11.3% | |
| |
| FIVE LARGEST SECTORS | | | |
Consumer Discretionary | | 14.9 | % |
Information Technology | | 9.9 | |
Health Care | | 9.7 | |
Financials | | 9.5 | |
Energy | | 6.1 | |
| | |
| FIXED-INCOME PORTFOLIO (30.7% OF FUND) |
Number of Fixed-Income Securities | | 310 |
Average Maturity | | 6.1 years |
Effective Duration | | 3.8 years |
| | | |
| |
| CREDIT QUALITY(e) | | | |
U.S. Government & Government Related | | 20.0 | % |
Aaa | | 0.0 | (f) |
Aa | | 0.9 | |
A | | 1.8 | |
Baa | | 4.6 | |
Ba | | 1.6 | |
B | | 1.1 | |
Caa | | 0.7 | |
| |
Average Quality | | Aa | |
ASSET ALLOCATION
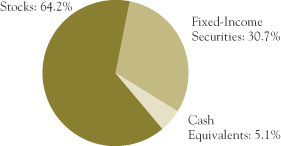
| | | |
| TEN LARGEST STOCK HOLDINGS(d) | | | |
Comcast Corp. Class A | | 2.6 | % |
Hewlett-Packard Co. | | 2.4 | |
News Corp. Class A | | 2.0 | |
Pfizer, Inc. | | 1.8 | |
Chevron Corp. | | 1.8 | |
Time Warner, Inc. | | 1.8 | |
Wachovia Corp. | | 1.8 | |
McDonald’s Corp. | | 1.8 | |
Wal-Mart Stores, Inc. | | 1.7 | |
Sanofi-Aventis ADR (France) | | 1.7 | |
| | | |
| SECTOR DIVERSIFICATION | | | |
U.S. Treasury & Government Related | | 6.0 | % |
Mortgage-Related Securities | | 14.1 | |
Corporate | | 10.6 | |
| | | |
|
FIVE LARGEST CORPORATE FIXED-INCOME ISSUERS(d) | |
Ford Motor Credit Co. | | 0.9 | % |
Time Warner, Inc. (AOL Time Warner) | | 0.7 | |
GMAC, LLC | | 0.7 | |
HCA, Inc. | | 0.6 | |
Xerox Corp. | | 0.6 | |
(a) | | SEC Yield is an annualization of the Fund’s total net investment income per share for the 30-day period ended on the last day of the month. |
(b) | | Price-to-earnings (P/E) ratio is calculated using 12-month forward consensus earnings estimates. |
(c) | | Foreign stocks are U.S. dollar-denominated. |
(d) | | The Fund’s portfolio holdings are subject to change without notice. The mention of specific securities is not a recommendation or solicitation for any person to buy, sell or hold any particular security. |
(e) | | The Fund’s credit quality ratings are from Moody’s Investor Services. If no Moody’s rating is available, the Standard & Poor’s rating is reported. If unrated, the investment manager determines a comparable rating, which is included in the portfolio breakdown. The LBAG’s credit quality ratings are from Lehman Brothers and reference Moody’s, Standard & Poor’s and Fitch ratings. The LBAG’s methodology for calculating average credit quality differs from that used by the Fund. Applying the LBAG methodology, the Fund’s average credit quality would be AA. The credit quality of the investments in the portfolio does not apply to the stability or safety of the Fund or its shares. |
| | | | | | |
| | DODGE & COX BALANCED FUND n | | PAGE | | 6 |
| | |
| PORTFOLIO OF INVESTMENTS | | December 31, 2006 |
| | | | | |
| COMMON STOCKS: 64.2% |
| | |
| | | SHARES | | VALUE |
| CONSUMER DISCRETIONARY: 14.9% |
| AUTOMOBILES & COMPONENTS: 0.4% | | | |
Honda Motor Co., Ltd. ADR(b) (Japan) | | 2,863,300 | | $ | 113,214,882 |
| | | | | |
| CONSUMER DURABLES & APPAREL: 3.8% |
Koninklijke Philips Electronics NV(b) (Netherlands) | | 2,400,000 | | | 90,192,000 |
Matsushita Electric Industrial Co., Ltd. ADR(b) (Japan) | | 18,808,200 | | | 377,856,738 |
Nike, Inc., Class B | | 1,007,000 | | | 99,723,210 |
Sony Corp. ADR(b) (Japan) | | 10,493,600 | | | 449,440,888 |
Thomson ADR(b) (France) | | 1,900,000 | | | 37,088,000 |
| | | | | |
| | | 1,054,300,836 |
| CONSUMER SERVICES: 1.8% |
McDonald’s Corp. | | 10,869,850 | | | 481,860,450 |
| | | | | |
| MEDIA: 7.2% |
Comcast Corp., Class A(a) | | 16,681,716 | | | 706,137,038 |
EchoStar Communications Corp.(a) | | 2,345,365 | | | 89,194,231 |
Interpublic Group of Companies, Inc.(a) | | 6,817,000 | | | 83,440,080 |
Liberty Capital, Series A(a) | | 683,129 | | | 66,932,980 |
News Corp., Class A | | 25,007,900 | | | 537,169,692 |
Time Warner, Inc. | | 22,784,600 | | | 496,248,588 |
| | | | | |
| | | 1,979,122,609 |
| RETAILING: 1.7% |
Federated Department Stores, Inc. | | 3,448,272 | | | 131,482,611 |
Gap, Inc. | | 7,002,800 | | | 136,554,600 |
Genuine Parts Co. | | 2,945,750 | | | 139,716,923 |
Liberty Interactive, Series A(a) | | 2,697,300 | | | 58,180,761 |
| | | | | |
| | | 465,934,895 |
| | | | | |
| | | 4,094,433,672 |
| CONSUMER STAPLES: 2.7% |
| FOOD & STAPLES RETAILING: 1.7% |
Wal-Mart Stores, Inc. | | 10,243,300 | | | 473,035,594 |
| | | | | |
| FOOD, BEVERAGE & TOBACCO: 0.7% |
Unilever NV(b) (Netherlands) | | 6,863,500 | | | 187,030,375 |
| | | | | |
| HOUSEHOLD & PERSONAL PRODUCTS: 0.3% |
Avon Products, Inc. | | 2,767,700 | | | 91,444,808 |
| | | | | |
| | | 751,510,777 |
| ENERGY: 6.1% |
Baker Hughes, Inc. | | 3,202,117 | | | 239,070,055 |
Chevron Corp. | | 6,786,802 | | | 499,033,551 |
ConocoPhillips | | 3,431,100 | | | 246,867,645 |
Exxon Mobil Corp. | | 2,500,000 | | | 191,575,000 |
Occidental Petroleum Corp. | | 2,925,000 | | | 142,827,750 |
Royal Dutch Shell PLC ADR(b) (United Kingdom) | | 3,116,127 | | | 221,712,436 |
Schlumberger, Ltd. | | 2,236,821 | | | 141,277,615 |
| | | | | |
| | | 1,682,364,052 |
| | | | | |
| |
| | |
| | | SHARES | | VALUE |
| FINANCIALS: 9.5% |
| BANKS: 2.2% |
Wachovia Corp. | | 8,489,661 | | $ | 483,486,194 |
Wells Fargo & Co. | | 3,121,900 | | | 111,014,764 |
| | | | | |
| | | 594,500,958 |
| DIVERSIFIED FINANCIALS: 2.3% |
Capital One Financial Corp. | | 3,640,800 | | | 279,686,256 |
Citigroup, Inc. | | 6,480,900 | | | 360,986,130 |
| | | | | |
| | | 640,672,386 |
| INSURANCE: 4.4% |
Aegon NV(b) (Netherlands) | | 9,988,470 | | | 189,281,506 |
Chubb Corp. | | 3,384,224 | | | 179,059,292 |
Genworth Financial, Inc., Class A | | 2,448,000 | | | 83,746,080 |
Loews Corp. | | 4,230,700 | | | 175,447,129 |
MBIA, Inc. | | 805,168 | | | 58,825,574 |
Safeco Corp. | | 1,410,200 | | | 88,208,010 |
St. Paul Travelers Companies, Inc. | | 6,652,900 | | | 357,194,201 |
UnumProvident Corp. | | 3,795,400 | | | 78,868,412 |
| | | | | |
| | | 1,210,630,204 |
| REAL ESTATE: 0.6% |
Equity Office Properties Trust | | 3,456,000 | | | 166,475,520 |
| | | | | |
| | | 2,612,279,068 |
| HEALTH CARE: 9.7% |
| HEALTH CARE EQUIPMENT & SERVICES: 3.2% |
Becton, Dickinson & Co. | | 1,317,900 | | | 92,450,685 |
Cardinal Health, Inc. | | 6,491,400 | | | 418,240,902 |
Health Management Associates, Inc. | | 3,900,000 | | | 82,329,000 |
WellPoint, Inc.(a) | | 3,673,000 | | | 289,028,370 |
| | | | | |
| | | 882,048,957 |
| PHARMACEUTICALS & BIOTECHNOLOGY: 6.5% |
Bristol-Myers Squibb Co. | | 6,050,550 | | | 159,250,476 |
GlaxoSmithKline PLC ADR(b)
(United Kingdom) | | 3,975,400 | | | 209,742,104 |
Pfizer, Inc. | | 19,436,367 | | | 503,401,905 |
Sanofi-Aventis ADR(b) (France) | | 9,850,000 | | | 454,774,500 |
Schering-Plough Corp. | | 5,527,150 | | | 130,661,826 |
Thermo Fisher Scientific, Inc.(a) | | 3,335,850 | | | 151,080,647 |
Wyeth | | 3,366,800 | | | 171,437,456 |
| | | | | |
| | | 1,780,348,914 |
| | | | | |
| | | 2,662,397,871 |
| INDUSTRIALS: 5.8% |
| CAPITAL GOODS: 2.6% |
American Power Conversion Corp. | | 3,504,720 | | | 107,209,385 |
General Electric Co. | | 4,700,000 | | | 174,887,000 |
Masco Corp. | | 3,151,000 | | | 94,120,370 |
Tyco International, Ltd. | | 8,265,600 | | | 251,274,240 |
Volvo AB ADR(b) (Sweden) | | 1,029,700 | | | 70,863,954 |
| | | | | |
| | | 698,354,949 |
| | | | |
| PAGE | | 7 n DODGE & COX BALANCED FUND | | See accompanying Notes to Financial Statements |
| | |
| PORTFOLIO OF INVESTMENTS | | December 31, 2006 |
| | | | | |
| COMMON STOCKS (continued) |
| | |
| | | SHARES | | VALUE |
| COMMERCIAL SERVICES & SUPPLIES: 0.4% |
Pitney Bowes, Inc. | | 2,606,650 | | $ | 120,401,163 |
| | | | | |
| TRANSPORTATION: 2.8% |
FedEx Corp. | | 3,290,250 | | | 357,386,955 |
Union Pacific Corp. | | 4,373,700 | | | 402,467,874 |
| | | | | |
| | | 759,854,829 |
| | | | | |
| | | 1,578,610,941 |
| INFORMATION TECHNOLOGY: 9.9% |
| SOFTWARE & SERVICES: 2.6% |
BMC Software, Inc.(a) | | 2,996,000 | | | 96,471,200 |
Computer Sciences Corp.(a) | | 3,916,400 | | | 209,018,268 |
Compuware Corp.(a) | | 6,938,700 | | | 57,799,371 |
EBay, Inc.(a) | | 2,637,100 | | | 79,297,597 |
Electronic Data Systems Corp. | | 10,083,700 | | | 277,805,935 |
| | | | | |
| | | 720,392,371 |
| TECHNOLOGY, HARDWARE & EQUIPMENT: 7.3% |
Avaya, Inc.(a) | | 9,335,100 | | | 130,504,698 |
Dell, Inc.(a) | | 8,057,900 | | | 202,172,711 |
Hewlett-Packard Co. | | 16,207,331 | | | 667,579,964 |
Hitachi, Ltd. ADR(b) (Japan) | | 2,690,000 | | | 167,748,400 |
Kyocera Corp. ADR(b) (Japan) | | 16,700 | | | 1,584,663 |
Motorola, Inc. | | 13,349,502 | | | 274,465,761 |
NCR Corp.(a) | | 2,162,500 | | | 92,468,500 |
Nortel Networks Corp.(a),(b) (Canada) | | 823,630 | | | 22,015,630 |
Sun Microsystems, Inc.(a) | | 22,671,200 | | | 122,877,904 |
Xerox Corp.(a) | | 17,990,950 | | | 304,946,603 |
| | | | | |
| | | 1,986,364,834 |
| | | | | |
| | | 2,706,757,205 |
| MATERIALS: 3.5% |
Akzo Nobel NV ADR(b) (Netherlands) | | 3,527,051 | | | 214,691,594 |
Alcoa, Inc. | | 2,275,650 | | | 68,292,257 |
Cemex SAB de CV ADR(b) (Mexico) | | 1,700,000 | | | 57,596,000 |
Dow Chemical Co. | | 8,620,259 | | | 344,293,144 |
International Paper Co. | | 2,372,900 | | | 80,915,890 |
Nova Chemicals Corp.(b) (Canada) | | 1,442,870 | | | 40,256,073 |
Rohm and Haas Co. | | 2,810,700 | | | 143,682,984 |
| | | | | |
| | | | | 949,727,942 |
| TELECOMMUNICATION SERVICES: 1.4% |
Sprint Nextel Corp. | | 10,020,000 | | | 189,277,800 |
Vodafone Group PLC ADR(b) (United Kingdom) | | 6,825,350 | | | 189,608,223 |
| | | | | |
| | | | | 378,886,023 |
| UTILITIES: 0.7% |
Duke Energy Corp. | | 3,787,200 | | | 125,772,912 |
FirstEnergy Corp. | | 1,245,100 | | | 75,079,530 |
| | | | | |
| | | | | 200,852,442 |
| | | | | |
TOTAL COMMON STOCKS
(Cost $11,952,966,436) | | | 17,617,819,993 |
| | | | | |
| | | | | | |
| FIXED-INCOME SECURITIES: 30.7% |
| | |
| | | PAR VALUE | | VALUE |
| U.S. TREASURY AND GOVERNMENT RELATED: 6.0% |
| U.S. TREASURY: 5.1% |
U.S. Treasury Notes | | | | | | |
3.125%, 1/31/07 | | $ | 400,000,000 | | $ | 399,422,000 |
2.75%, 8/15/07 | | | 150,000,000 | | | 147,914,100 |
3.375%, 2/15/08 | | | 200,000,000 | | | 196,507,800 |
3.75%, 5/15/08 | | | 350,000,000 | | | 344,640,800 |
3.625%, 7/15/09 | | | 307,000,000 | | | 298,905,331 |
| | | | | | |
| | | | | | 1,387,390,031 |
| GOVERNMENT RELATED: 0.9% |
Arkansas Dev. Fin. Auth. GNMA | | | | | | |
Guaranteed Bonds 9.75%, 11/15/14 | | | 3,657,924 | | | 3,931,537 |
Small Business Administration — 504 Program | | | |
Series 96-20L, 6.70%, 12/1/16 | | | 2,460,245 | | | 2,536,506 |
Series 97-20F, 7.20%, 6/1/17 | | | 3,917,016 | | | 4,078,264 |
Series 97-20I, 6.90%, 9/1/17 | | | 5,756,773 | | | 5,961,450 |
Series 98-20D, 6.15%, 4/1/18 | | | 6,917,441 | | | 7,075,175 |
Series 98-20I, 6.00%, 9/1/18 | | | 3,462,514 | | | 3,532,828 |
Series 99-20F, 6.80%, 6/1/19 | | | 4,980,012 | | | 5,183,573 |
Series 00-20D, 7.47%, 4/1/20 | | | 13,318,359 | | | 14,038,777 |
Series 00-20E, 8.03%, 5/1/20 | | | 5,554,523 | | | 5,965,255 |
Series 00-20G, 7.39%, 7/1/20 | | | 9,020,457 | | | 9,501,172 |
Series 00-20I, 7.21%, 9/1/20 | | | 5,866,617 | | | 6,188,097 |
Series 01-20E, 6.34%, 5/1/21 | | | 12,479,904 | | | 12,923,135 |
Series 01-20G, 6.625%, 7/1/21 | | | 10,734,390 | | | 11,214,068 |
Series 03-20J, 4.92%, 10/1/23 | | | 20,787,892 | | | 20,502,343 |
Series 05-20F, 4.57%, 6/1/25 | | | 44,319,113 | | | 42,549,203 |
Series 05-20K, 5.36%, 11/1/25 | | | 36,813,122 | | | 37,010,106 |
Series 06-20D, 5.64%, 4/1/26 | | | 51,123,725 | | | 52,223,994 |
| | | | | | |
| | | 244,415,483 |
| | | | | | |
| | | 1,631,805,514 |
| MORTGAGE-RELATED SECURITIES: 14.1% |
| FEDERAL AGENCY CMO & REMIC: 1.3% |
Dept. of Veterans Affairs | | | | | | |
Trust 1995-1A 1, 7.213%, 2/15/25 | | | 1,334,278 | | | 1,382,054 |
Trust 1995-2C 3A, 8.793%, 6/15/25 | | | 710,837 | | | 768,194 |
Fannie Mae | | | | | | |
Trust 1992-4H, 7.50%, 2/25/07 | | | 16,340 | | | 16,298 |
SMBS I-1, 6.50%, 4/1/09 | | | 33,702 | | | 33,703 |
Trust 2003-37 HA, 5.00%, 7/25/13 | | | 4,073,704 | | | 4,060,266 |
Trust (GN) 1994-13J, 7.00%, 6/17/22 | | | 9,910 | | | 9,887 |
Trust 1993-207 G, 6.15%, 4/25/23 | | | 3,271,924 | | | 3,275,406 |
Trust 2002-73 PM, 5.00%, 12/25/26 | | | 19,801,543 | | | 19,687,640 |
Trust 2002-33 A1, 7.00%, 6/25/32 | | | 5,819,773 | | | 5,997,548 |
Trust 2005-W4 1A2, 6.50%, 8/25/35 | | | 37,268,552 | | | 37,772,352 |
Trust 2001-T7 A1, 7.50%, 2/25/41 | | | 5,658,647 | | | 5,858,486 |
Trust 2001-T8 A1, 7.50%, 7/25/41 | | | 6,177,812 | | | 6,397,925 |
Trust 2001-W3 A, 7.00%, 9/25/41 | | | 2,356,099 | | | 2,414,222 |
Trust 2002-W6 2A1, 7.00%, 6/25/42 | | | 5,848,747 | | | 6,025,599 |
Trust 2002-W8 A2, 7.00%, 6/25/42 | | | 6,401,121 | | | 6,573,406 |
Trust 2003-W2 1A1, 6.50%, 7/25/42 | | | 12,274,195 | | | 12,506,649 |
| | | | | | |
| See accompanying Notes to Financial Statements | | DODGE & COX BALANCED FUND n | | PAGE | | 8 |
| | |
| PORTFOLIO OF INVESTMENTS | | December 31, 2006 |
| | | | | | |
| FIXED-INCOME SECURITIES (continued) |
| | |
| | | PAR VALUE | | VALUE |
Trust 2003-W2 1A2, 7.00%, 7/25/42 | | $ | 4,952,009 | | $ | 5,062,040 |
Trust 2003-W4 4A, 7.50%, 10/25/42 | | | 7,457,419 | | | 7,737,139 |
Trust 2004-T1 1A2, 6.50%, 1/25/44 | | | 11,001,061 | | | 11,248,987 |
Trust 2004-W2 5A, 7.50%, 3/25/44 | | | 28,214,038 | | | 29,500,717 |
Freddie Mac | | | | | | |
Series 1236 H, 7.25%, 4/15/07 | | | 109,371 | | | 109,405 |
Series 1512 I, 6.50%, 5/15/08 | | | 944,436 | | | 941,802 |
Series 2100 GS, 6.50%, 12/15/13 | | | 9,396,862 | | | 9,589,604 |
Series 2430 UC, 6.00%, 9/15/16 | | | 15,895,695 | | | 15,996,229 |
Series 1078 GZ, 6.50%, 5/15/21 | | | 1,259,297 | | | 1,276,864 |
Series (GN) 16 PK, 7.00%, 8/25/23 | | | 14,407,788 | | | 14,868,205 |
Series 2550 QP, 5.00%, 3/15/26 | | | 7,980,651 | | | 7,954,824 |
Series T-48 1A4, 5.538%, 7/25/33 | | | 92,378,711 | | | 91,864,993 |
Series T-051 1A, 6.50%, 9/25/43 | | | 590,105 | | | 600,084 |
Series T-59 1A1, 6.50%, 10/25/43 | | | 36,715,121 | | | 37,477,914 |
| | | | | | |
| | | 347,008,442 |
| FEDERAL AGENCY MORTGAGE PASS-THROUGH: 12.8% |
Fannie Mae, 10 Year | | | | | | |
6.00%, 1/1/12-10/1/14 | | | 33,208,124 | | | 33,474,041 |
Fannie Mae, 15 Year | | | | | | |
5.50%, 1/1/14-12/1/19 | | | 266,540,679 | | | 267,584,843 |
6.00%, 12/1/13-6/1/19 | | | 533,715,971 | | | 541,954,328 |
6.50%, 1/1/13-11/1/18 | | | 192,301,600 | | | 196,941,421 |
7.00%, 12/1/07-11/1/18 | | | 19,454,475 | | | 20,011,454 |
7.50%, 9/1/15-8/1/17 | | | 63,331,877 | | | 65,695,995 |
Fannie Mae, 20 Year | | | | | | |
5.50%, 1/1/23 | | | 18,855,147 | | | 18,768,942 |
6.50%, 1/1/22-10/1/26 | | | 35,025,617 | | | 35,833,220 |
Fannie Mae, 30 Year | | | | | | |
5.00%, 3/1/34 | | | 265,824,129 | | | 257,139,421 |
5.50%, 6/1/33 | | | 58,963,393 | | | 58,362,340 |
6.00%, 4/1/35-6/1/35 | | | 404,418,798 | | | 408,015,384 |
6.50%, 12/1/32 | | | 214,832,100 | | | 219,935,825 |
7.50%, 9/1/07-7/1/19 | | | 148,053 | | | 149,618 |
8.00%, 1/1/09 | | | 71,679 | | | 72,314 |
Fannie Mae, Hybrid ARM | | | | | | |
3.852%, 6/1/34 | | | 65,453,183 | | | 64,121,895 |
4.44%, 7/1/33 | | | 32,202,833 | | | 31,583,591 |
4.762%, 1/1/35 | | | 12,356,723 | | | 12,320,514 |
4.784%, 3/1/35 | | | 22,168,506 | | | 21,988,272 |
4.853%, 8/1/35 | | | 12,917,607 | | | 12,887,735 |
5.037%, 7/1/35 | | | 146,514,525 | | | 145,630,132 |
5.061%, 7/1/35 | | | 56,758,352 | | | 56,449,766 |
5.315%, 1/1/36 | | | 61,019,221 | | | 60,988,331 |
Fannie Mae Multifamily DUS | | | | | | |
Pool 555728, 4.019%, 8/1/13 | | | 422,460 | | | 397,861 |
Pool 555162, 4.835%, 1/1/13 | | | 17,619,659 | | | 17,323,841 |
Pool 555316, 4.874%, 2/1/13 | | | 5,882,984 | | | 5,797,427 |
Pool 760762, 4.89%, 4/1/12 | | | 16,115,000 | | | 15,782,413 |
Pool 735387, 4.925%, 4/1/15 | | | 13,919,348 | | | 13,699,170 |
Pool 555148, 4.975%, 1/1/13 | | | 4,722,371 | | | 4,674,315 |
| | | | | | |
| |
| | |
| | | PAR VALUE | | VALUE |
Pool 555806, 5.092%, 10/1/13 | | $ | 3,674,790 | | $ | 3,655,625 |
Pool 461628, 5.32%, 4/1/14 | | | 10,558,868 | | | 10,621,035 |
Pool 462086, 5.355%, 11/1/15 | | | 28,675,910 | | | 28,953,111 |
Pool 545316, 5.636%, 12/1/11 | | | 5,150,071 | | | 5,230,995 |
Pool 323350, 5.65%, 11/1/08 | | | 1,999,635 | | | 1,999,066 |
Pool 545387, 5.897%, 1/1/12 | | | 6,075,312 | | | 6,235,796 |
Pool 545258, 5.939%, 11/1/11 | | | 1,052,556 | | | 1,080,418 |
Pool 380735, 5.965%, 10/1/08 | | | 16,383,018 | | | 16,448,565 |
Pool 545685, 6.016%, 4/1/12 | | | 30,400,376 | | | 31,229,961 |
Pool 323492, 6.02%, 1/1/09 | | | 4,313,268 | | | 4,336,498 |
Freddie Mac, 30 Year | | | | | | |
8.00%, 2/1/08-11/1/10 | | | 95,662 | | | 96,239 |
8.25%, 2/1/17 | | | 9,724 | | | 9,783 |
8.75%, 5/1/10 | | | 29,613 | | | 30,352 |
Freddie Mac Gold, 15 Year | | | | | | |
5.50%, 8/1/14-1/1/17 | | | 34,609,545 | | | 34,746,555 |
6.00%, 10/1/13-10/1/18 | | | 168,158,000 | | | 170,646,965 |
6.50%, 7/1/14-3/1/18 | | | 74,179,096 | | | 75,755,186 |
7.00%, 5/1/08-4/1/15 | | | 2,500,969 | | | 2,530,323 |
7.75%, 7/25/21 | | | 1,473,529 | | | 1,541,313 |
Freddie Mac Gold, 20 Year 6.50%, 12/1/26 | | | 67,134,862 | | | 68,526,008 |
Freddie Mac Gold, 30 Year | | | | | | |
5.00%, 8/1/33 | | | 102,563,072 | | | 99,370,797 |
6.50%, 9/1/18-4/1/33 | | | 126,329,044 | | | 129,291,402 |
7.47%, 3/17/23 | | | 425,489 | | | 440,801 |
8.50%, 1/1/23 | | | 70,879 | | | 74,540 |
Freddie Mac Gold, Hybrid ARM | | | | | | |
3.809%, 5/1/34 | | | 23,404,410 | | | 22,810,462 |
4.801%, 10/1/35 | | | 33,848,181 | | | 33,571,030 |
4.844%, 5/1/35 | | | 105,418,376 | | | 103,656,638 |
5.397%, 11/1/35 | | | 64,370,750 | | | 64,515,256 |
Ginnie Mae, 30 Year | | | | | | |
7.50%, 1/15/08-10/15/25 | | | 5,363,973 | | | 5,577,664 |
7.97%, 4/15/20-1/15/21 | | | 2,450,672 | | | 2,585,517 |
| | | | | | |
| | | | | | 3,513,152,310 |
| PRIVATE LABEL CMO & REMIC SECURITIES: 0.0%(e) |
Union Planters Mortgage Finance Corp. | | | | | | |
7.70%, 12/25/24 | | | 4,479,819 | | | 4,624,986 |
| | | | | | |
| | | | | | 3,864,785,738 |
| | | | |
| PAGE | | 9 n DODGE & COX BALANCED FUND | | See accompanying Notes to Financial Statements |
| | |
| PORTFOLIO OF INVESTMENTS | | December 31, 2006 |
| | | | | | |
| FIXED-INCOME SECURITIES (continued) |
| | |
| | | PAR VALUE | | VALUE |
| CORPORATE: 10.6% |
| FINANCIALS: 2.7% |
BankAmerica Capital II(c)
8.00%, 12/15/26, callable | | $ | 17,355,000 | | $ | 18,068,134 |
BankAmerica Capital VI(c)
5.625%, 3/8/35 | | | 10,000,000 | | | 9,466,230 |
BankAmerica Capital XI(c)
6.625%, 5/23/36 | | | 15,000,000 | | | 16,187,760 |
Boston Properties, Inc. | | | | | | |
6.25%, 1/15/13 | | | 49,070,000 | | | 51,068,376 |
5.625%, 4/15/15 | | | 29,500,000 | | | 29,605,020 |
5.00%, 6/1/15 | | | 2,890,000 | | | 2,778,163 |
CIGNA Corp. | | | | | | |
7.00%, 1/15/11 | | | 14,705,000 | | | 15,452,955 |
6.375%, 10/15/11 | | | 17,820,000 | | | 18,437,374 |
7.65%, 3/1/23 | | | 9,745,000 | | | 10,989,212 |
7.875%, 5/15/27 | | | 12,970,000 | | | 15,304,470 |
8.30%, 1/15/33 | | | 9,050,000 | | | 10,937,948 |
Citicorp Capital I(c) | | | | | | |
7.933%, 2/15/27, callable 2007 | | | 16,440,000 | | | 17,117,312 |
EOP Operating Limited Partnership(f) | | | | | | |
8.10%, 8/1/10 | | | 10,000,000 | | | 11,018,630 |
7.00%, 7/15/11 | | | 40,675,000 | | | 44,017,631 |
6.75%, 2/15/12 | | | 19,933,000 | | | 21,527,082 |
5.875%, 1/15/13 | | | 41,205,000 | | | 43,187,043 |
4.75%, 3/15/14 | | | 15,000,000 | | | 14,859,450 |
HSBC Holdings PLC
6.50%, 5/2/36 | | | 23,000,000 | | | 24,742,710 |
JPMorgan Chase (Bank One) Capital III(c)
8.75%, 9/1/30 | | | 28,187,000 | | | 36,977,201 |
Kaupthing Bank
7.125%, 5/19/16(d) | | | 65,000,000 | | | 68,943,940 |
Safeco Corp. | | | | | | |
4.875%, 2/1/10 | | | 15,131,000 | | | 14,966,692 |
7.25%, 9/1/12 | | | 13,672,000 | | | 14,777,901 |
St. Paul Travelers Companies, Inc. | | | | | | |
8.125%, 4/15/10 (St. Paul) | | | 19,885,000 | | | 21,568,583 |
5.00%, 3/15/13 (Travelers) | | | 10,250,000 | | | 10,004,789 |
5.50%, 12/1/15 | | | 9,160,000 | | | 9,124,725 |
6.25%, 6/20/16 | | | 22,000,000 | | | 23,099,076 |
UnumProvident Corp. | | | | | | |
7.625%, 3/1/11 | | | 15,330,000 | | | 16,316,930 |
6.85%, 11/15/15(d) (Unum Finance PLC) | | | 10,200,000 | | | 10,604,909 |
7.19%, 2/1/28 (Unum) | | | 8,500,000 | | | 8,431,082 |
7.25%, 3/15/28 (Provident Companies) | | | 12,130,000 | | | 12,715,418 |
6.75%, 12/15/28 (Unum) | | | 27,430,000 | | | 27,381,778 |
7.375%, 6/15/32 | | | 19,470,000 | | | 20,777,936 |
Wellpoint, Inc.
5.25%, 1/15/16 | | | 72,210,000 | | | 70,786,380 |
| | | | | | |
| | | | | | 741,242,840 |
| | | | | | |
| |
| | |
| | | PAR VALUE | | VALUE |
| INDUSTRIALS: 7.0% |
AT&T Corp.
8.00%, 11/15/31 | | $ | 97,500,000 | | $ | 120,966,105 |
Comcast Corp. | | | | | | |
5.30%, 1/15/14 | | | 63,050,000 | | | 61,754,764 |
5.85%, 11/15/15 | | | 26,500,000 | | | 26,537,683 |
5.90%, 3/15/16 | | | 22,880,000 | | | 22,945,254 |
6.50%, 1/15/17 | | | 27,500,000 | | | 28,696,855 |
Cox Communications, Inc. | | | | | | |
5.45%, 12/15/14 | | | 75,530,000 | | | 73,583,818 |
5.50%, 10/1/15 | | | 15,265,000 | | | 14,790,381 |
5.875%, 12/1/16(d) | | | 17,145,000 | | | 17,023,391 |
Dillard’s, Inc. | | | | | | |
6.30%, 2/15/08 | | | 6,000,000 | | | 6,007,500 |
7.85%, 10/1/12 | | | 14,000,000 | | | 14,700,000 |
7.13%, 8/1/18 | | | 10,831,000 | | | 10,749,768 |
7.875%, 1/1/23 | | | 8,860,000 | | | 8,992,900 |
7.75%, 7/15/26 | | | 50,000 | | | 50,000 |
7.75%, 5/15/27 | | | 550,000 | | | 550,000 |
7.00%, 12/1/28 | | | 15,486,000 | | | 14,789,130 |
Dow Chemical Co. | | | | | | |
4.027%, 9/30/09(d) | | | 33,950,000 | | | 32,645,064 |
6.00%, 10/1/12 | | | 5,800,000 | | | 5,959,245 |
7.375%, 11/1/29 | | | 35,170,000 | | | 40,651,526 |
Electronic Data Systems Corp.
6.50%, 8/1/13 | | | 33,880,000 | | | 34,108,148 |
Federated Department Stores, Inc. (May Department Stores Co.) | | | | | | |
7.625%, 8/15/13 | | | 5,900,000 | | | 6,398,945 |
7.45%, 10/15/16 | | | 9,300,000 | | | 10,035,574 |
6.90%, 1/15/32 | | | 54,484,000 | | | 55,330,790 |
6.70%, 7/15/34 | | | 13,025,000 | | | 12,847,482 |
Ford Motor Credit Co. | | | | | | |
7.375%, 2/1/11 | | | 120,535,000 | | | 119,322,779 |
7.25%, 10/25/11 | | | 118,160,000 | | | 115,710,780 |
GMAC, LLC | | | | | | |
7.75%, 1/19/10 | | | 6,145,000 | | | 6,431,756 |
6.875%, 9/15/11 | | | 173,670,000 | | | 178,132,972 |
HCA, Inc. | | | | | | |
8.75%, 9/1/10 | | | 27,750,000 | | | 28,929,375 |
7.875%, 2/1/11 | | | 23,798,000 | | | 23,857,495 |
6.95%, 5/1/12 | | | 14,090,000 | | | 13,350,275 |
6.30%, 10/1/12 | | | 11,400,000 | | | 10,431,000 |
6.25%, 2/15/13 | | | 47,740,000 | | | 42,249,900 |
6.75%, 7/15/13 | | | 27,400,000 | | | 24,591,500 |
5.75%, 3/15/14 | | | 20,420,000 | | | 16,948,600 |
6.50%, 2/15/16 | | | 22,000,000 | | | 18,535,000 |
Hess Corp. (Amerada Hess)
7.875%, 10/1/29 | | | 26,780,000 | | | 31,260,080 |
Hewlett-Packard Co.
5.50%, 7/1/07 | | | 21,210,000 | | | 21,233,183 |
Lafarge SA
6.50%, 7/15/16 | | | 27,590,000 | | | 28,807,271 |
| | | | | | |
| See accompanying Notes to Financial Statements | | DODGE & COX BALANCED FUND n | | PAGE | | 10 |
PORTFOLIO OF INVESTMENTS | December 31, 2006 |
| | | | | | |
| FIXED-INCOME SECURITIES (continued) |
| | |
| | | PAR VALUE | | VALUE |
Liberty Media Corp. | | | | | | |
8.50%, 7/15/29 | | $ | 32,630,000 | | $ | 32,808,029 |
4.00%, 11/15/29, exchangeable | | | 18,975,000 | | | 12,665,812 |
8.25%, 2/1/30 | | | 18,875,000 | | | 18,501,803 |
3.75%, 2/15/30, exchangeable | | | 35,755,000 | | | 21,989,325 |
Lockheed Martin Corp. | | | | | | |
7.65%, 5/1/16 | | | 18,500,000 | | | 21,344,578 |
7.75%, 5/1/26 | | | 8,500,000 | | | 10,353,697 |
6.15%, 9/1/36 | | | 7,000,000 | | | 7,354,473 |
Raytheon Co.
6.75%, 8/15/07 | | | 20,476,000 | | | 20,626,806 |
Time Warner, Inc. (AOL Time Warner) | | | | | | |
7.625%, 4/15/31 | | | 101,940,000 | | | 113,883,392 |
7.70%, 5/1/32 | | | 79,490,000 | | | 89,688,011 |
Wyeth | | | | | | |
5.50%, 3/15/13 | | | 24,500,000 | | | 24,658,515 |
5.50%, 2/1/14 | | | 70,724,000 | | | 71,086,885 |
5.50%, 2/15/16 | | | 10,665,000 | | | 10,679,440 |
Xerox Corp. | | | | | | |
7.125%, 6/15/10 | | | 18,425,000 | | | 19,346,250 |
6.875%, 8/15/11 | | | 135,655,000 | | | 142,607,319 |
6.40%, 3/15/16 | | | 10,000,000 | | | 10,212,500 |
| | | | | | |
| | | 1,927,713,124 |
| TRANSPORTATION: 0.9% |
Burlington Northern Santa Fe Railway | | | |
4.30%, 7/1/13 | | | 7,320,000 | | | 6,883,896 |
8.251%, 1/15/21 | | | 1,413,117 | | | 1,646,748 |
4.967%, 4/1/23 | | | 14,632,839 | | | 14,336,882 |
5.72%, 1/15/24 | | | 27,550,000 | | | 28,068,070 |
5.629%, 4/1/24 | | | 31,540,000 | | | 31,891,119 |
5.342%, 4/1/24 | | | 20,600,000 | | | 20,557,789 |
Consolidated Rail Corp. 6.76%, 5/25/15 | | | 3,649,423 | | | 3,832,295 |
CSX Transportation, Inc. 9.75%, 6/15/20 | | | 5,351,000 | | | 7,149,899 |
FedEx Corp.
6.72%, 1/15/22 | | | 5,545,032 | | | 5,939,561 |
Norfolk Southern Corp. | | | | | | |
7.70%, 5/15/17 | | | 13,000,000 | | | 15,119,117 |
9.75%, 6/15/20 | | | 7,389,000 | | | 9,955,473 |
Union Pacific Corp. | | | | | | |
6.125%, 1/15/12 | | | 15,720,000 | | | 16,194,665 |
6.50%, 4/15/12 | | | 3,550,000 | | | 3,728,146 |
5.375%, 5/1/14 | | | 2,935,000 | | | 2,914,035 |
4.875%, 1/15/15 | | | 8,320,000 | | | 7,973,672 |
6.33%, 1/2/20 | | | 36,315,663 | | | 37,866,705 |
5.866%, 7/2/30 | | | 36,924,000 | | | 38,032,089 |
| | | | | | |
| | | | | | 252,090,161 |
| | | | | | |
| | | | | | 2,921,046,125 |
| | | | | | |
TOTAL FIXED-INCOME SECURITIES
(Cost $8,368,719,948) | | | 8,417,637,377 |
| | | | | | |
| | | | | | | |
| SHORT-TERM INVESTMENTS: 4.9% |
| | |
| | | PAR VALUE | | | VALUE |
SSgA Prime Money Market Fund | | $ | 26,443,828 | | | $ | 26,443,828 |
State Street Repurchase Agreement 4.40%, 1/2/07, maturity value $710,886,375 (collateralized by U.S. Treasury Securities, value $724,753,904, 6.25% -7.625%, 8/15/23 - 8/15/25) | | | 710,539,000 | | | | 710,539,000 |
U.S. Treasury Bills | | | | | | | |
1/4/07 | | | 200,000,000 | | | | 199,920,177 |
1/11/07 | | | 100,000,000 | | | | 99,867,917 |
1/18/07 | | | 100,000,000 | | | | 99,775,694 |
2/1/07 | | | 100,000,000 | | | | 99,597,000 |
3/29/07 | | | 75,000,000 | | | | 74,127,281 |
4/5/07 | | | 50,000,000 | | | | 49,373,986 |
| | | | | | | |
TOTAL SHORT-TERM INVESTMENTS
(Cost $1,359,644,883) | | | | 1,359,644,883 |
| | | | | | | |
TOTAL INVESTMENTS
(Cost $21,681,331,267) | | | 99.8 | % | | | 27,395,102,253 |
OTHER ASSETS, LESS LIABILITIES | | | 0.2 | % | | | 62,702,002 |
| | | | | | | |
TOTAL NET ASSETS | | | 100.0 | % | | $ | 27,457,804,255 |
| | | | | | | |
(b) | | Security issued by a foreign entity, denominated in U.S. dollars. |
(c) | | Cumulative preferred security |
(d) | | Security exempt from registration under Rule 144A of the Securities Act of 1933. The security may be resold in transactions exempt from registration, normally to qualified institutional buyers. As of December 31, 2006, all such securities in total represented $129,217,304 or 0.5% of total net assets. |
(f) | | EOP Operating LP is the operating partnership of Equity Office Properties Trust. |
When two issuers are identified, the first name refers to the acquirer/successor obligor or guarantor, and the second name (within the parentheses) refers to the original issuer of the instrument.
ADR: American Depository Receipt
ARM: Adjustable Rate Mortgage
CMO: Collateralized Mortgage Obligation
REMIC: Real Estate Mortgage Investment Conduit
| | | | |
| PAGE | | 11 n DODGE & COX BALANCED FUND | | See accompanying Notes to Financial Statements |
STATEMENT OF ASSETS AND LIABILITIES
| | | |
| |
| | | December 31, 2006 |
| ASSETS: | | | |
Investments, at value (cost $21,681,331,267) | | $ | 27,395,102,253 |
Receivable for investments sold | | | 5,406,457 |
Receivable for paydowns on
mortgage-backed securities | | | 2,559,955 |
Receivable for Fund shares sold | | | 37,141,328 |
Dividends and interest receivable | | | 116,808,064 |
Prepaid expenses and other assets | | | 124,399 |
| | | |
| | | 27,557,142,456 |
| | | |
| LIABILITIES: | | | |
Payable for investments purchased | | | 60,932,155 |
Payable for Fund shares redeemed | | | 26,255,746 |
Management fees payable | | | 11,635,964 |
Accrued expenses | | | 514,336 |
| | | |
| | | 99,338,201 |
| | | |
| NET ASSETS | | $ | 27,457,804,255 |
| | | |
| NET ASSETS CONSIST OF: | | | |
Paid in capital | | $ | 21,584,776,541 |
Undistributed net investment income | | | 6,332,329 |
Undistributed net realized gain on investments | | | 152,924,399 |
Net unrealized appreciation on investments | | | 5,713,770,986 |
| | | |
| | $ | 27,457,804,255 |
| | | |
Fund shares outstanding (par value
$0.01 each, unlimited shares authorized) | | | 315,299,741 |
Net asset value per share | | | $87.08 |
|
| STATEMENT OF OPERATIONS |
| |
| | | Year Ended
December 31, 2006 |
| INVESTMENT INCOME: | | | |
Dividends (net of foreign taxes of $4,531,226) | | $ | 289,217,037 |
Interest | | | 478,822,616 |
| | | |
| | | 768,039,653 |
| | | |
| EXPENSES: | | | |
Management fees | | | 126,124,944 |
Custody and fund accounting fees | | | 397,091 |
Transfer agent fees | | | 3,386,981 |
Professional services | | | 90,802 |
Shareholder reports | | | 1,083,068 |
Registration fees | | | 241,310 |
Trustees’ fees | | | 167,500 |
Miscellaneous | | | 168,857 |
| | | |
| | | 131,660,553 |
| | | |
| NET INVESTMENT INCOME | | | 636,379,100 |
| | | |
REALIZED AND UNREALIZED GAIN
ON INVESTMENTS: | | | |
Net realized gain | | | 1,120,034,743 |
Net change in unrealized appreciation | | | 1,552,806,112 |
| | | |
Net realized and unrealized gain | | | 2,672,840,855 |
| | | |
NET INCREASE IN NET ASSETS FROM
OPERATIONS | | $ | 3,309,219,955 |
| | | |
STATEMENT OF CHANGES IN NET ASSETS
| | | | | | | | |
| | |
| | | Year Ended
December 31, 2006 | | | Year Ended
December 31, 2005 | |
| OPERATIONS: | | | | | | | | |
Net investment income | | $ | 636,379,100 | | | $ | 484,455,297 | |
Net realized gain | | | 1,120,034,743 | | | | 380,394,201 | |
Net change in unrealized appreciation | | | 1,552,806,112 | | | | 614,634,805 | |
| | | | | | | | |
Net increase in net assets from operations | | | 3,309,219,955 | | | | 1,479,484,303 | |
| | | | | | | | |
| | | | | | | | |
| |
DISTRIBUTIONS TO SHAREHOLDERS FROM: | | | | | |
Net investment income | | | (653,483,566 | ) | | | (521,701,708 | ) |
Net realized gain | | | (969,143,303 | ) | | | (378,288,293 | ) |
| | | | | | | | |
Total distributions | | | (1,622,626,869 | ) | | | (899,990,001 | ) |
| | | | | | | | |
| | |
FUND SHARE TRANSACTIONS: | | | | | | | | |
Proceeds from sale of shares | | | 3,661,818,984 | | | | 4,371,007,401 | |
Reinvestment of distributions | | | 1,554,510,730 | | | | 863,011,478 | |
Cost of shares redeemed | | | (3,056,236,439 | ) | | | (2,943,041,611 | ) |
| | | | | | | | |
Net increase from Fund share transactions | | | 2,160,093,275 | | | | 2,290,977,268 | |
| | | | | | | | |
Total increase in net assets | | | 3,846,686,361 | | | | 2,870,471,570 | |
| | |
| NET ASSETS: | | | | | | | | |
Beginning of year | | | 23,611,117,894 | | | | 20,740,646,324 | |
| | | | | | | | |
End of year (including undistributed net investment income of $6,332,329 and $1,855,600, respectively) | | $ | 27,457,804,255 | | | $ | 23,611,117,894 | |
| | | | | | | | |
| | |
| SHARE INFORMATION: | | | | | | | | |
Shares sold | | | 42,976,777 | | | | 54,872,290 | |
Distributions reinvested | | | 17,977,977 | | | | 10,731,145 | |
Shares redeemed | | | (35,942,189 | ) | | | (36,701,989 | ) |
| | | | | | | | |
Net increase in shares outstanding | | | 25,012,565 | | | | 28,901,446 | |
| | | | | | | | |
| | | | | | |
| See accompanying Notes to Financial Statements | | DODGE & COX BALANCED FUND n | | PAGE | | 12 |
NOTES TO FINANCIAL STATEMENTS
NOTE 1—ORGANIZATION AND SIGNIFICANT ACCOUNTING POLICIES
Dodge & Cox Balanced Fund (the “Fund”) is one of the series constituting the Dodge & Cox Funds (the “Trust” or the “Funds”). The Trust is organized as a Delaware statutory trust and is registered under the Investment Company Act of 1940, as amended, as a diversified, open-end management investment company. The Fund commenced operations on June 26, 1931, and seeks regular income, conservation of principal and an opportunity for long-term growth of principal and income. Risk considerations and investment strategies of the Fund are discussed in the Fund’s Prospectus. The Fund is closed to new investors.
The financial statements have been prepared in conformity with accounting principles generally accepted in the United States of America, which require the use of estimates and assumptions by management. Significant accounting policies are as follows:
Security valuation The Fund’s net assets are valued as of the close of trading on the New York Stock Exchange (NYSE), generally 4:00 p.m. Eastern Time, each day that the NYSE is open for business. Stocks are valued at the official quoted close price or the last sale of the day at the close of the NYSE or, if not available, at the mean between the exchange-listed bid and ask prices for the day. A security that is listed or traded on more than one exchange is valued at the quotation on the exchange determined to be the primary market for such security. Fixed-income securities with original maturities of one year or more are priced on the basis of valuations furnished by pricing services which utilize both dealer-supplied valuations and computerized pricing models. Under certain circumstances, fixed-income securities that are not valued by pricing services are temporarily valued by the investment manager utilizing both dealer-supplied valuations and computerized pricing models. Valuations of fixed-income securities take into account appropriate factors such as institutional-size trading markets in similar groups of securities, yield, quality, coupon rate, maturity, type of issue, trading characteristics and other market data and do not rely exclusively upon exchange or over-the-
counter listed prices. Security values are not discounted based on the size of the Fund’s position. Securities for which market quotations are not readily available are valued at fair value as determined in good faith by or at the direction of the Board of Trustees. Short-term securities are valued at amortized cost which approximates current value. All securities held by the Fund are denominated in U.S. dollars.
Security transactions, investment income, expenses, and distributions Security transactions are recorded on the trade date. Realized gains and losses on securities sold are determined on the basis of identified cost.
Dividend income and corporate action transactions are recorded on the ex-dividend date, except for certain dividends or corporate actions from foreign securities where the ex-dividend date may have passed, which are recorded as soon as the Fund is informed of the ex-dividend date. Withholding taxes on foreign dividends have been provided for in accordance with the Fund’s understanding of the applicable country’s tax rules and rates. Non-cash dividends included in dividend income, if any, are recorded at the fair market value of the securities received. Distributions received in excess of income are recorded as a reduction of cost of investments and/or realized gain. The Fund may estimate the character of distributions received from Real Estate Investment Trusts (“REITs”).
Interest income is recorded on the accrual basis. Interest income includes coupon interest, amortization of premium and accretion of discount on debt securities, and gains and losses on paydowns of mortgage-backed securities. The ability of the issuers of the debt securities held by the Fund to meet their obligations may be affected by economic developments in a specific industry, state or region. Debt obligations may be placed on non-accrual status and related interest income may be reduced by ceasing current accruals and writing off interest receivables when the collection of all or a portion of interest has become doubtful. A debt obligation is removed from non-accrual status when the issuer resumes interest payments or when collectibility of interest is reasonably assured.
| | | | |
| PAGE | | 13 n DODGE & COX BALANCED FUND | | |
NOTES TO FINANCIAL STATEMENTS
Expenses are recorded on the accrual basis. Most expenses of the Trust can be directly attributed to a specific series. Expenses which cannot be directly attributed are apportioned among the Funds in the Trust.
Distributions to shareholders are recorded on the ex-dividend date.
Repurchase agreements The Fund may enter into repurchase agreements secured by U.S. government securities which involve the purchase of securities from a counterparty with a simultaneous commitment to resell the securities at an agreed-upon date and price. It is the Fund’s policy that its custodian take possession of the underlying collateral securities, the fair value of which exceeds the principal amount of the repurchase transaction, including accrued interest, at all times. In the event of default by the counterparty, the Fund has the contractual right to liquidate the securities and to apply the proceeds in satisfaction of the obligation.
NOTE 2—RELATED PARTY TRANSACTIONS
Management fees Under a written agreement approved by a unanimous vote of the Board of Trustees, the Fund pays an annual management fee of 0.50% of the Fund’s average daily net assets to Dodge & Cox, investment manager of the Fund.
Fund officers and trustees All officers and three of the trustees of the Trust are officers or employees of Dodge & Cox. The Trust pays a fee only to those trustees who are not affiliated with Dodge & Cox.
Indemnification Under the Trust’s organizational documents, its officers and trustees are indemnified against certain liabilities arising out of the performance of their duties to the Trust. In addition, in the normal course of business the Trust enters into contracts that provide general indemnities to other parties. The Trust’s maximum exposure under these arrangements is unknown as this would involve future claims that may be made against the Trust that have not yet occurred.
NOTE 3—INCOME TAX INFORMATION AND DISTRIBUTIONS TO SHAREHOLDERS
A provision for federal income taxes is not required since the Fund intends to continue to qualify as a regulated
investment company under Subchapter M of the Internal Revenue Code and distribute all of its taxable income to shareholders. Distributions are determined in accordance with income tax regulations, which may differ from net investment income and realized gains for financial reporting purposes. Financial reporting records are adjusted for permanent book/tax differences to reflect tax character. Financial records are not adjusted for temporary differences.
Book/tax differences are primarily due to differing treatments of net short-term realized gain and paydown loss. At December 31, 2006, the cost of investments for federal income tax purposes was equal to the cost for financial reporting purposes.
Distributions during the year ended December 31, 2006 and 2005 were characterized as follows for federal income tax purposes:
| | | | |
| | | 2006 | | 2005 |
Ordinary income | | $677,362,327 | | $528,868,924 |
| | ($2.279 per share) | | ($1.866 per share) |
| | |
Long-term capital gain | | $945,264,542 | | $371,121,077 |
| | ($3.124 per share) | | ($1.294 per share) |
At December 31, 2006, the tax basis components of distributable earnings were as follows:
| | | | |
Unrealized appreciation | | $ | 5,806,522,962 | |
Unrealized depreciation | | | (92,751,976 | ) |
| | | | |
Net unrealized appreciation | | | 5,713,770,986 | |
Undistributed ordinary income | | | 12,994,926 | |
Undistributed long-term capital gain | | | 146,261,802 | |
NOTE 4—PURCHASES AND SALES OF INVESTMENTS
For the year ended December 31, 2006, purchases and sales of securities, other than short-term securities and U.S. government securities, aggregated $3,703,480,567 and $2,986,041,532, respectively. For the year ended December 31, 2006, purchases and sales of U.S. government securities aggregated $2,242,561,755 and $2,231,108,980, respectively.
| | | | | | |
| | DODGE & COX BALANCED FUND n | | PAGE | | 14 |
NOTES TO FINANCIAL STATEMENTS
NOTE 5—ACCOUNTING PRONOUNCEMENTS
In July 2006, the Financial Accounting Standards Board (FASB) issued Interpretation 48, “Accounting for Uncertainty in Income Taxes” (FIN 48). FIN 48 clarifies the accounting for income taxes by prescribing the minimum recognition threshold a tax position must meet before being recognized in the financial statements. FIN 48 is effective for the Fund beginning June 29, 2007. The impact to the Fund’s financial statements, if any, has not yet been determined.
In September 2006, FASB issued “Statement of Financial Accounting Standards No. 157, Fair Value Measurements” (SFAS 157). SFAS 157 is effective for the Fund beginning January 1, 2008. It defines fair value, establishes a framework for measuring fair value and expands disclosures about fair value measurements. Management is currently evaluating the impact the adoption of SFAS 157 will have on the Fund’s financial statement disclosures.
| | | | |
| PAGE | | 15 n DODGE & COX BALANCED FUND | | |
FINANCIAL HIGHLIGHTS
| | | | | | | | | | | | | | | |
SELECTED DATA AND RATIOS (for a share outstanding throughout each year) | | Year Ended December 31, | |
| | | 2006 | | | 2005 | | | 2004 | | | 2003 | | | 2002 | |
Net asset value, beginning of year | | $81.34 | | | $79.35 | | | $73.04 | | | $60.75 | | | $65.42 | |
Income from investment operations: | | | | | | | | | | | | | | | |
Net investment income | | 2.21 | | | 1.84 | | | 1.60 | | | 1.66 | | | 1.89 | |
Net realized and unrealized gain (loss) | | 8.93 | | | 3.31 | | | 7.99 | | | 12.96 | | | (3.80 | ) |
| | | |
Total from investment operations | | 11.14 | | | 5.15 | | | 9.59 | | | 14.62 | | | (1.91 | ) |
| | | |
Distributions to shareholders from: | | | | | | | | | | | | | | | |
Net investment income | | (2.20 | ) | | (1.84 | ) | | (1.60 | ) | | (1.66 | ) | | (1.88 | ) |
Net realized gain | | (3.20 | ) | | (1.32 | ) | | (1.68 | ) | | (0.67 | ) | | (0.88 | ) |
| | | |
Total distributions | | (5.40 | ) | | (3.16 | ) | | (3.28 | ) | | (2.33 | ) | | (2.76 | ) |
| | | |
Net asset value, end of year | | $87.08 | | | $81.34 | | | $79.35 | | | $73.04 | | | $60.75 | |
| | | |
Total return | | 13.84 | % | | 6.59 | % | | 13.31 | % | | 24.44 | % | | (2.94 | )% |
Ratios/supplemental data: | | | | | | | | | | | | | | | |
Net assets, end of year (millions) | | $27,458 | | | $23,611 | | | $20,741 | | | $13,196 | | | $7,885 | |
Ratios of expenses to average net assets | | 0.52 | % | | 0.53 | % | | 0.54 | % | | 0.54 | % | | 0.53 | % |
Ratios of net investment income to average net assets | | 2.52 | % | | 2.15 | % | | 1.97 | % | | 2.40 | % | | 3.05 | % |
Portfolio turnover rate | | 20 | % | | 18 | % | | 18 | % | | 19 | % | | 25 | % |
See accompanying Notes to Financial Statements
REPORT OF INDEPENDENT REGISTERED PUBLIC ACCOUNTING FIRM
To the Trustees of Dodge & Cox Funds and Shareholders of Dodge & Cox Balanced Fund
In our opinion, the accompanying statement of assets and liabilities, including the portfolio of investments, and the related statements of operations and of changes in net assets and the financial highlights present fairly, in all material respects, the financial position of the Dodge & Cox Balanced Fund (the “Fund”, one of the series constituting Dodge & Cox Funds) at December 31, 2006, the results of its operations for the year then ended, the changes in its net assets for each of the two years in the period then ended and the financial highlights for each of the five years in the period then ended, in conformity with accounting principles generally accepted in the United States of America. These financial statements and financial highlights (hereafter referred to as “financial statements”) are the responsibility of the Fund’s management; our responsibility is to express an opinion on these financial statements based on our audits. We conducted our audits of these financial statements in accordance with the standards of the Public Company Accounting Oversight Board (United States). Those standards require that we plan and perform the audit to obtain reasonable assurance about whether the financial statements are free of material misstatement. An audit includes examining, on a test basis, evidence supporting the amounts and disclosures in the financial statements, assessing the accounting principles used and significant estimates made by management, and evaluating the overall financial statement presentation. We believe that our audits, which included confirmation of securities at December 31, 2006 by correspondence with the custodian and brokers, provide a reasonable basis for our opinion.
PricewaterhouseCoopers LLP
San Francisco, California
February 9, 2007
| | | | | | |
| | DODGE & COX BALANCED FUND n | | PAGE | | 16 |
SPECIAL 2006 TAX INFORMATION (unaudited)
The following information is provided pursuant to provisions of the Internal Revenue Code:
The Fund designates $285,176,398 of its distributions paid to shareholders in 2006 as qualified dividends (treated for federal income tax purposes in the hands of shareholders as taxable at a maximum rate of 15%).
For shareholders that are corporations, the Fund designates 28% of its ordinary dividends (including short-term gains) paid to shareholders in 2006 as dividends from domestic corporations eligible for the corporate dividends received deduction, provided that the shareholder otherwise satisfies applicable requirements to claim that deduction.
BOARD APPROVAL OF FUNDS’ INVESTMENT MANAGEMENT AGREEMENTS AND MANAGEMENT FEES (unaudited)
The Board of Trustees is responsible for overseeing the performance of the Dodge & Cox Funds’ investment manager and determining whether to continue the Investment Management Agreements between the Funds and Dodge & Cox each year (the “Agreements”). At a meeting of the Board of Trustees of the Trust held on December 14, 2006, the Trustees, by a unanimous vote (including a separate vote of those Trustees who are not “interested persons” (as defined in the Investment Company Act of 1940) (the “Independent Trustees”)), approved the renewal of the Agreements for an additional one-year term through December 31, 2007. During the course of the year, the Board received a wide variety of materials relating to the services provided by Dodge & Cox and the performance of the Funds.
INFORMATION RECEIVED
In advance of the meeting, the Board, including each of the Independent Trustees, requested, received and reviewed materials relating to the Agreements. The Independent Trustees retained Morningstar® to prepare an independent expense and performance summary for each Fund and comparable funds managed by other advisers identified by Morningstar®. The Morningstar® materials
included information regarding advisory fee rates, expense ratios, and transfer agency, custodial and distribution expenses, as well as performance comparisons to an appropriate index or combination of indices. The materials reviewed by the Board also included information concerning Dodge & Cox’s profitability, financial results and condition, including advisory fee revenue and separate account advisory fee schedules. The Board additionally considered the Funds’ brokerage commissions, turnover rates and sales and redemption data for the Funds, including “soft dollar” payments made for research benefiting the Funds and other accounts managed by Dodge & Cox, and brokerage commissions and expenses paid by Dodge & Cox. Other aspects of Dodge & Cox’s services to the Funds which were reviewed included compliance and supervision of third-party service providers (e.g., custodian, fund accountant, transfer agent and state registration administrator), shareholder servicing, accounting and administrative services, web services, the character of non-advisory services, the record of compliance with the Funds’ investment policies and restrictions and the Funds’ Code of Ethics, investment management staffing and biographies, information furnished to investors and shareholders (including the Funds’ prospectus, Statement of Additional Information, shareholder reports, and quarterly reports), and third-party retirement plan administrator reimbursements by Dodge & Cox for the same periods.
The Board received copies of the Agreements and a memorandum from the Independent Legal Counsel to the Independent Trustees, discussing the factors generally regarded as appropriate to consider in evaluating advisory arrangements. The Trust’s Governance Committee, consisting solely of Independent Trustees, met with the Independent Legal Counsel on November 28, 2006 and again on December 14, 2006 to discuss whether to renew the Agreements. The Board, including the Independent Trustees, subsequently concluded that the existing Agreements are fair and reasonable and voted to approve the Agreements.
In considering the Agreements, the Board, including the Independent Trustees, did not identify any single factor or particular information as all-important or controlling. In reaching the decision to approve the
| | | | |
| PAGE | | 17 n DODGE & COX BALANCED FUND | | |
Agreements, the Board, which was advised by Independent Legal Counsel, considered the following factors, among others, and reached the conclusions described below.
NATURE, QUALITY, AND EXTENT OF THE SERVICES
The Board considered the nature, quality and extent of portfolio management, administrative and shareholder services performed by Dodge & Cox, including: Dodge & Cox’s established long-term history of care and conscientiousness in the management of the Funds; demonstrated consistency in investment approach and depth, background and experience of the Dodge & Cox Investment Policy Committee, International Investment Policy Committee, Fixed Income Investment Policy Committee and research analysts responsible for managing the Funds; Dodge & Cox’s organizational structure; frequent favorable recognition of Dodge & Cox and the Funds in the media and industry publications; Dodge & Cox’s performance in the areas of compliance, administration and shareholder communication and services, supervision of Fund operations and general oversight of other service providers; favorable peer group comparisons of expense ratios, management fee comparisons, expenses (e.g., transfer agent, custody and other fees and expenses) and asset comparisons and performance and risk summaries prepared independently by Morningstar® and favorable fiduciary grade and “Star” rankings by Morningstar®. The Board also acknowledged Dodge & Cox’s decision to close its institutional equity and balanced separate account business to new accounts and had previously voted, at the recommendation of Dodge & Cox, to close the Stock and Balanced Funds to control the pace of growth. The Board also acknowledged that the services provided by Dodge & Cox are extensive in nature and that Dodge & Cox consistently delivered a high level of service. The Board concluded that it was satisfied with the nature, extent and quality of investment management and other services provided to the Funds by Dodge & Cox.
INVESTMENT PERFORMANCE
The Board considered short-term and long-term investment performance for each Fund (including periods
of outperformance or underperformance) as compared to both relevant indices and the performance of such Fund’s peer group. The performance information prepared by Morningstar® and Dodge & Cox demonstrated to the Board a consistent pattern of favorable performance for investors and, in most instances, the Funds have outperformed their peer groups for short and long-term periods. The Board considered that the performance of the Funds is the result of an investment management process that emphasizes a long-term investment horizon, independence, comprehensive research, price discipline and focus. The Board also noted that the strong investment performance delivered by Dodge & Cox to the Funds appeared to be consistent with the performance delivered for other (non-fund) clients of Dodge & Cox. The Board concluded that Dodge & Cox delivers favorable performance for Fund investors consistent with the long-term investment strategies being pursued by the Funds.
COSTS AND ANCILLARY BENEFITS
Costs of Services to Funds: Fees and Expenses. The Board considered each Fund’s management fee rates and expense ratios relative to industry averages for similar mutual funds and relative to management fees charged by Dodge & Cox to other (non-fund) clients. The Board evaluated the operating structures of the Funds and Dodge & Cox, including the following: Dodge & Cox has a centralized focus on investment management operations and derives revenue solely from management fees; its outsourcing of non-advisory support services to unaffiliated third-party service providers is efficient and less costly to investors; Dodge & Cox does not charge front-end sales commissions or distribution fees and bears all distribution-related costs as well as reimbursements to third-party retirement plan administrators; the Funds receive numerous administrative, regulatory compliance, and shareholder support services from Dodge & Cox without any additional administrative fee; and the fact that the Funds have relatively low transaction costs and portfolio turnover rates. The Board noted that the Funds are substantially below peer group averages in expense ratios and management fee rates. The Board also noted that the range of services under the Agreements is much more extensive than under Dodge & Cox’s separate
| | | | | | |
| | DODGE & COX BALANCED FUND n | | PAGE | | 18 |
advisory (non-fund) client agreements, and considered that, when coupled with the greater risks and regulatory burdens associated with the high profile mutual fund business, there is reasonable justification for differences in fee rates charged between the two lines of business. The Board concluded that costs incurred by the Funds for the services they receive (including the management fee paid to Dodge & Cox) are reasonable and that the fees are acceptable based upon the qualifications, experience, reputation and performance of Dodge & Cox and the low overall expense ratios of the Funds.
Profitability and Costs of Services to Dodge & Cox; “Fall-out” Benefits. The Board reviewed reports of Dodge & Cox’s financial position, profitability and estimated overall value, and they considered Dodge & Cox’s overall profitability within its context as a private, employee-owned S-Corporation and relative to the favorable services provided. The Board considered recent increases to Dodge & Cox’s gross revenues, and noted the importance of Dodge & Cox’s profitability—which is derived solely from management fees and does not include other business ventures—to maintain its independence, company culture and ethics, and management continuity. They noted that Dodge & Cox’s profitability is enhanced due to its efficient internal business model, and that the compensation/profit structure at Dodge & Cox is vital for remaining independent and facilitating retention of its management and investment professionals. They also noted that Dodge & Cox has voluntarily limited growth of assets by closing the Stock and Balanced Funds to new investors and by not taking on new equity and balanced institutional separate account clients. The Board noted that these actions were financially disadvantageous to Dodge & Cox, but illustrated a commitment to act in the best interest of existing Fund shareholders and separate account clients. The Board considered potential “fall-out” benefits (including the receipt of research from unaffiliated brokers) that Dodge & Cox might receive in its association with the Funds. The Board also noted the extent of additional administrative services performed by Dodge & Cox for the Funds, and that the magnitude of costs and risks borne by Dodge & Cox in rendering advisory services to the Funds (including risks in the compliance, securities valuation and investment
management processes) are continuing to increase. The Board concluded that the profitability of Dodge & Cox’s relationship with the Funds (including fall-out benefits) was fair and reasonable.
THE BENEFIT OF ECONOMIES OF SCALE
The Board considered whether there have been economies of scale with respect to the management of each Fund, whether the Funds have appropriately benefited from any economies of scale, and whether the management fee rate is reasonable in relation to the Fund assets and any economies of scale that may exist. The Board noted that the considerable efficiencies of the Funds’ organization and fee structure have been realized by shareholders at the outset of their investment (i.e., from the first dollar), as a result of management fee rates that start lower than industry and many peer group averages and management fees and overall expense ratios that are lower than averages for peer group funds with approximately the same level of assets. Shareholders also realize efficiencies from the outset of their investment due to organizational efficiencies derived from Dodge & Cox’s investment management process and the avoidance of distribution and marketing structures whose costs would ultimately be borne by the Funds. The Board noted that Dodge & Cox’s internal costs of providing investment management, administrative and compliance services to the Funds are continuing to increase. The Board’s decision to renew the Agreements was made after consideration of economies of scale and review of comparable fund expense ratios and historical expense ratio patterns for the Funds. Their review also included consideration of the desirability of adding breakpoints to the Funds’ fee schedules. The Board concluded that the current Dodge & Cox fee structure is fair and reasonable and adequately reflects economies of scale.
CONCLUSION
Based on their evaluation of all material factors and assisted by the advice of Independent Legal Counsel to the Independent Trustees, the Board, including the Independent Trustees, concluded that the advisory fee structure was fair and reasonable, that each Fund was paying a competitive fee for the services provided, that
| | | | |
| PAGE | | 19 n DODGE & COX BALANCED FUND | | |
the scope and quality of Dodge & Cox’s services has
provided substantial value for Fund shareholders over the long term, and that approval of the Agreements was in the best interests of each Fund and its shareholders.
FUND HOLDINGS
The Fund provides a complete list of its holdings four times each fiscal year, as of the end of each quarter. The lists appear in the Fund’s First Quarter, Semi-Annual, Third Quarter and Annual Reports to shareholders. The Fund files the lists with the Securities and Exchange Commission (SEC) on Form N-CSR (second and fourth quarters) and Form N-Q (first and third quarters). Shareholders may view the Fund’s Forms N-CSR and N-Q on the SEC’s website at www.sec.gov. Forms N-CSR and N-Q may also be reviewed and copied at the SEC’s Public Reference Room in Washington, DC. Information
regarding the operations of the Public Reference Room may be obtained by 1-202-942-8090 (direct) or 1-800-732-0330 (general SEC number). A complete list of the Fund’s quarter-end holdings is also available at www.dodgeandcox.com on or about 15 days following each quarter end and remains available on the web site until the list is updated in the subsequent quarter.
PROXY VOTING
For a free copy of the Fund’s proxy voting policies and procedures, please call 1-800-621-3979, visit the Fund’s web site at www.dodgeandcox.com or visit the SEC’s web site at www.sec.gov. Information regarding how the Fund voted proxies relating to portfolio securities during the most recent 12-month period ending June 30 is also available at www.dodgeandcox.com or at www.sec.gov.
| | | | | | |
| | DODGE & COX BALANCED FUND n | | PAGE | | 20 |
THIS PAGE INTENTIONALLY LEFT BLANK
| | | | |
| PAGE | | 21 n DODGE & COX BALANCED FUND | | |
THIS PAGE INTENTIONALLY LEFT BLANK
| | | | | | |
| | DODGE & COX BALANCED FUND n | | PAGE | | 22 |
DODGE & COX FUNDS—EXECUTIVE OFFICER & TRUSTEE INFORMATION
| | | | | | |
Name (Age) and
Address* | | Position with Trust
(Year of Election or
Appointment) | | Principal Occupation During Past 5 Years | | Other Directorships Held by Trustees |
| INTERESTED TRUSTEES & OFFICERS |
John A. Gunn (63) | | Chairman and Trustee
(Trustee since 1985) | | Chairman (since 2007), Chief Executive Officer (since 2005) and Director of Dodge & Cox, Portfolio Manager and member of Investment Policy Committee (IPC), Fixed Income Investment Policy Committee (FIIPC) and International Investment Policy Committee (IIPC) | | — |
Kenneth E. Olivier (54) | | President and Trustee (Trustee since 2005) | | President (since 2005) and Director of Dodge & Cox, Portfolio Manager and member of IPC | | — |
Dana M. Emery (45) | | Vice President and Trustee (Trustee since 1993) | | Executive Vice President (since 2005) and Director of Dodge & Cox, Manager of the Fixed Income Department, Portfolio Manager and member of FIIPC | | — |
| Katherine Herrick Drake (52) | | Vice President (Since 1993) | | Vice President of Dodge & Cox, Portfolio Manager | | — |
| Diana S. Strandberg (47) | | Vice President
(Since 2005) | | Vice President of Dodge & Cox, Portfolio Manager and member of IPC and IIPC | | |
John M. Loll (40) | | Assistant Treasurer and Assistant Secretary (Since 2000) | | Vice President and Treasurer of Dodge & Cox | | — |
| David H. Longhurst (49) | | Treasurer (since 2006 ) | | Fund Administration and Accounting Senior Manager of Dodge & Cox (since 2004); Vice President, Treasurer, Controller and Secretary of Safeco Mutual Funds, Safeco Asset Management Company, Safeco Services, Safeco Securities, and Safeco Investment Services (2000-2004) | | — |
| Thomas M. Mistele (53) | | Secretary and Assistant Treasurer (Since 2000) | | Chief Operating Officer (since 2004), Director (since 2005), Secretary and General Counsel of Dodge & Cox | | — |
| Marcia P. Venegas (38) | | Chief Compliance Officer
(Since 2004) | | Chief Compliance Officer of Dodge & Cox (since 2005), Compliance Officer of Dodge & Cox (2003-2004); Compliance and Business Risk Manager of Deutsche Asset Management, Australia Limited (1999-2001) | | — |
| INDEPENDENT TRUSTEES |
William F. Ausfahl (66) | | Trustee (Since 2002) | | CFO, The Clorox Co. (1982-1997); Director, The Clorox Co. (1984-1997) | | — |
L. Dale Crandall (65) | | Trustee (Since 1999) | | President, Kaiser Foundation Health Plan, Inc. and Kaiser Foundation Hospitals (2000-2002); Senior Vice President—Finance and Administration & CFO, Kaiser Foundation Health Plan, Inc. and Kaiser Foundation Hospitals (1998-2000) | | Director, Union BanCal Corporation (bank holding company) and Union Bank of California (commercial bank) (2001-Present); Director, Covad Communications Group (broadband communications services) (2002-Present); Director, Ansell Limited (medical equipment and supplies) (2002-Present); Director, BEA Systems, Inc. (software and programming) (2003-Present); Director, Coventry Health Care, Inc. (managed healthcare) (2004-Present) |
Thomas A. Larsen (57) | | Trustee (Since 2002) | | Director in Howard, Rice, Nemerovski, Canady, Falk & Rabkin (law firm) | | — |
John B. Taylor (61) | | Trustee (Since 2005) | | Professor of Economics, Stanford University; Senior Fellow, Hoover Institution; Under Secretary for International Affairs, United States Treasury (2001-2005) | | — |
Will C. Wood (67) | | Trustee (Since 1992) | | Principal, Kentwood Associates, Financial Advisers | | Director, Banco Latinoamericano de Exportaciones S.A. (Latin American Foreign Trade Bank) (1999-Present) |
| * | | The address for each Officer and Trustee is 555 California Street, 40th Floor, San Francisco, California 94104. Each Officer and Trustee oversees all four series in the Dodge & Cox Funds complex and serves for an indefinite term. |
Additional information about the Trust’s Trustees and Officers is available in the Trust’s Statement of Additional Information (SAI). You can get a free copy of the SAI by visiting the Fund’s website at www.dodgeandcox.com or calling 1-800-621-3979.
| | | | |
| PAGE | | 23 n DODGE & COX BALANCED FUND | | |

Income Fund
www.dodgeandcox.com
For Fund literature, transactions and account
information, please visit the Funds’ web site.
or write or call:
DODGE & COX FUNDS
c/o Boston Financial Data Services
P.O. Box 8422
Boston, Massachusetts 02266-8422
(800) 621-3979
INVESTMENT MANAGER
Dodge & Cox
555 California Street, 40th Floor
San Francisco, California 94104
(415) 981-1710
This report is submitted for the general information of the shareholders of the Fund. The report is not authorized for distribution to prospective investors in the Fund unless it is accompanied by a current prospectus.
This report reflects our views, opinions and portfolio holdings as of December 31, 2006, the end of the reporting period. Any such views are subject to change at any time based upon market or other conditions and Dodge & Cox disclaims any responsibility to update such views. These views may not be relied on as investment advice and, because investment decisions for a Dodge & Cox Fund are based on numerous factors, may not be relied on as an indication of trading intent on behalf of any Dodge & Cox Fund.
12/06 IF AR  Printed on recycled paper

Annual Report
December 31, 2006
Income Fund
ESTABLISHED 1989
TO OUR SHAREHOLDERS
It is not often one has the opportunity to recognize a colleague who has contributed to an organization for close to four decades, so we begin this year’s annual letter to shareholders with a warm farewell to Harry Hagey, who retired from Dodge & Cox on December 31, 2006. Harry joined Dodge & Cox 39 years ago as a security analyst, and served as the firm’s Chairman for the past 14 years and Chief Executive Officer between 1992 and 2005. He served as the firm’s fourth Chairman—the firm’s founder, E. Morris Cox, Peter Avenali and Joe Fee came before him. He also succeeded Peter Avenali as Chairman of the Dodge & Cox Funds.
Harry’s greatest legacy is the importance he placed on Dodge & Cox’s culture, specifically: strong ethics (i.e., placing our clients’ interests ahead of our own), the firm’s employee ownership structure, respect for each client and employee, and the absence of a marketing mindset. Harry ingrained these important tenets into all of us over his years here, and he helped develop our team of 59 investment professionals (who have an average tenure at the firm of 10 years), including our Fixed Income Investment Policy Committee whose nine members have an average tenure at Dodge & Cox of 17 years.
We greatly appreciate Harry’s leadership and many years of hard work on behalf of the firm and its clients. We will miss his warm personality and camaraderie, and we wish him well in his future endeavors. Effective January 1, 2007, John A. Gunn was appointed Chairman of the firm and of the Dodge & Cox Funds. John has been with Dodge & Cox since 1972, and also serves as the firm’s CEO.
2006 PERFORMANCE REVIEW
The Income Fund had a total return of 5.3% in 2006, compared to 4.3% for the Lehman Aggregate Bond Index (LBAG). At year end, the Fund had net assets of $12.0 billion, including a cash position of 3.5%.
The Fund’s total return of 5.3% can be primarily attributed to income earned over the course of the year, supplemented to a small degree by price appreciation from certain lower-rated Corporate holdings. Bond yields trended higher in the first half of the year as economic growth continued to be strong and inflation rose. As the deceleration of the residential property market became
apparent, and energy prices crested, interest rates changed course and generally fell over the second half of 2006. Despite the second half declines, year end U.S. Treasury rates were still higher than where they started the year. Nevertheless, they remain quite low, especially in comparison to inflation. For example, the U.S. Treasury 10-year note had a 4.7% yield at year-end and core inflation (excludes volatile food and energy prices) was 2.6%. Corporate securities enjoyed a favorable year in 2006, benefiting from a reasonably strong economy, healthy profits and investor appetite for their debt. Mortgage-Backed Securities (MBS) had a good year as well, providing strong relative performance in the wake of stable prepayments and rising relative valuations.
The Fund had a solid year of relative performance, outpacing the LBAG by nearly 1%. As is typical for the Fund, the sources of that relative performance were many and varied, including strategies related to sector weightings, issue selection, duration1 position and yield advantage. For example, the Fund featured an overweight of the MBS sector throughout 2006, in particular since the second quarter. We made the decision in early 2006 to add to the Fund’s holdings of specific MBS (thus raising the overall weighting of that sector) as we judged the return prospects of certain types of MBS to be quite favorable to other short-maturity alternatives, like U.S. Treasuries, over our extended investment horizon. The strong performance of MBS for all of 2006, due to a combination of higher income and relative price appreciation, combined with the overweight position to benefit relative performance.
The Fund also featured a sizable overweighting of Corporate securities, also adding to the Fund’s relative performance. In the Corporate sector, returns often diverge widely between issuers, something that is obscured when viewing returns for the sector as a whole. Given the importance of “issuer selection,” we deploy a considerable amount of our resources in the effort to identify specific corporate issuers whose securities have the potential to outpace the broad corporate market over our investment horizon.
These “issuer selection” decisions were generally favorable for the Fund in 2006. For example, the Fund’s
| | | | |
| PAGE | | 1 n DODGE & COX INCOME FUND | | |
significant holdings of GMAC and Ford Motor Credit Corporation (together 4.5% of the Fund), returned approximately 20% each. Both of these entities, the financing arms of their struggling automobile parent companies, took concrete steps in 2006 to shore up their credit profiles. Strong, if less extraordinary, performance came from the Fund’s holdings of Dillard’s, Xerox, Equity Office Properties and UnumProvident Corporation. On the negative side, a leveraged buy out of HCA Corp., whose bonds represented nearly a 2% position in the Fund, resulted in significant price declines in their bonds, detracting from relative performance (total returns between –5% and –8%, depending on maturity). In aggregate, however, the specific Corporate securities that the Fund holds outpaced the return of the Lehman corporate sector, providing a significant source of incremental return.
The Fund also benefited from its higher relative yield—a by-product of the aforementioned overweighting of the higher-yielding Corporate and Mortgage-Backed Securities sectors—which added approximately 40 basis points (1 basis point equals 1/100 of 1%) of income relative to the LBAG benchmark. Furthermore, the Fund is positioned with less exposure to interest rate changes (a defensive duration posture) than the LBAG. As interest rates rose year-over-year, this positioning resulted in lower price declines, on average, for the Fund’s holdings.
PORTFOLIO STRATEGY
We manage the Fund for the long term, seeking to provide our investors a relatively high and stable yield, along with opportunities to capture relative price appreciation. Over many years, we have found that our biggest allies in the pursuit of these goals are our independent research capabilities and the patience and discipline that are part and parcel of our extended investment horizon.
In this regard, 2006 was a typical year. Many of the biggest positive contributors to the year’s results—for example, the holdings of GMAC and Ford Motor Credit and the defensive duration posture—were initiated well before 2006, and have severely tested our patience in the interim. Successful implementation of a long-term investment strategy relies on this patience as well as constant vigilance. We must continually ask ourselves
whether an investment continues to be an attractive risk/reward proposition given its current valuation and what we know about it today. Sometimes, our review of new information and pricing leads us to conclude that a fundamental change to the investment thesis has occurred, and we make a change in the Fund’s exposure. Many times, however, we conclude that the new information does not fundamentally alter the investment’s prospects over our longer-term investment horizon, and no change is made. Our independent, fundamental research is critical in making this determination.
Looking forward, we believe that the MBS sector continues to be an attractive place to invest in the 2-10 year maturity sector of the bond market. The U.S. Agency-guaranteed mortgage-backed securities that the Fund holds offer attractive incremental yield (between 0.5% and 1.5%) relative to U.S. Treasuries and other highly rated securities. They do, however, feature some uncertainty about the timing of their repayment because of the prepayment option that the underlying mortgage borrower holds. This prepayment option is the analytic target of our MBS research capabilities. Specifically, we strive to identify situations, resulting from borrower constraints, program characteristics, loan details, or combinations thereof, that provide favorable trade-offs between the potential risks embodied by the prepayment option (specifically, cash flow timing issues) and the securities’ prospective performance. A recent example would be our purchase of certain types of “Hybrid ARM” securities (detailed in the Fund’s third quarter shareholder letter). The Fund currently features a 43% weighting in MBS, approximately 8% higher than the LBAG weighting.
We also continue to find interesting opportunities for investment in the Corporate sector. At year end, the Fund had a 31% weighting in this sector, with exposure to 37 separate issuers. The Fund typically features between 25 and 40 different corporate issuers—far fewer than the 546 issuers represented in the LBAG. A look at the many different industries that are represented by the Fund’s Corporate holdings attests to the broad economic diversification we are still able to achieve from a smaller set of issuers. Nevertheless, we consciously seek a certain degree of concentration in the Fund’s Corporate holdings.
| | | | | | |
| | DODGE & COX INCOME FUND n | | PAGE | | 2 |
For one, we want to have a thorough understanding of every Corporate issuer in the Fund, a task that is substantially more achievable with a portfolio of 37 issuers than with a significantly larger number. In addition, we prefer position sizes that are sufficiently large such that future, issuer-specific performance is likely to have a measurable impact on the Fund’s performance. Our team of 20 industry analysts, who follow companies for our U.S. and international equity strategies, provide us with invaluable knowledge on the state of the industries and companies that they follow. This gives us the confidence to, for example, make investments in unpopular industries or stick with an investment that may be temporarily depressed.
LOOKING FORWARD
Over the intermediate term, we expect continued U.S. economic growth given the health of the corporate sector, tight labor markets, rising incomes, and other influences. Against this backdrop, we believe that headline inflation, despite recent declines due to receding energy prices, is unlikely to decline further, and core inflation (excluding food and energy) is likely to remain above the Federal Reserve’s comfort zone. Furthermore, nominal rates on U.S. Treasuries from 2-30 years lie within approximately 5 basis points of 4.75%, offering quite modest return
possibilities at all maturity points (particularly among longer-duration securities) after factoring in our expectations for inflation. Therefore, we continue to position the Fund’s duration shorter than that of the LBAG (3.6 years versus 4.5 years for the LBAG at year end).
As always, we seek to add to the portfolio’s yield and total return potential through our in-depth, security-specific research efforts, all within the context of a well-diversified, high average quality portfolio.
Thank you for your continued confidence in our firm as a shareholder of the Dodge & Cox Income Fund. As always, we welcome your comments and questions.
For the Board of Trustees,
| | |

| | 
|
John A. Gunn, Chairman | | Dana M. Emery, Vice President |
February 9, 2007
1 | | Duration is a measure of price sensitivity to changes in interest rates. |
| | | | |
| PAGE | | 3 n DODGE & COX INCOME FUND | | |
A Message from Former Chairman Harry Hagey
On October 1, 1967, I began my career at Dodge & Cox. At that time, Dodge & Cox was a small independent regional investment counseling firm working with individuals, pension funds and endowment funds. In addition, the firm managed two small no-load mutual funds: the Dodge & Cox Balanced Fund and the Dodge & Cox Stock Fund. After 39 wonderful years at this firm, I am now retiring. I want to take this opportunity to first thank you, our mutual fund shareholders for the trust you have placed in our firm over the years; second, to thank all of my associates with whom I have had the pleasure of working; and finally, to provide you with my thoughts on the current status of the firm and my optimistic outlook for its future.
Let me summarize what I think are the key components that make Dodge & Cox a successful money management firm. First and most importantly, ethical considerations are paramount. We have an excellent reputation, and we work hard to maintain it. When making decisions about how we manage our firm, we always start by asking what is in the best interests of our current clients.
Second, we are in the single business of providing continuous high quality investment management service to our existing clients and shareholders. We decided a long time ago that we are not in business to provide a series of financial products to the investment marketplace. Through a team-oriented, long-term approach, our investment objective is to first preserve and then enhance the future purchasing power of our clients’ wealth over the long term. Over the years, I have often reminded my associates that there are literally millions of individuals counting on us.
A third important ingredient is our employees. We insist on a respect for each individual employee as well as for the entire firm. We work within a collegial environment with the goal of having all of our people think as owners, not just as employees. Our working environment has led to low employee turnover, which in turn, has created stability and continuity over the years.
Finally, with regard to the firm, probably the most important characteristic is our independence. We only report to the Fund’s shareholders, our clients and to ourselves. Ownership of Dodge & Cox is limited to the firm’s active employees, thus I have sold my interest in Dodge & Cox back to the firm (at book value) so my shares will now be available to those coming after me.
As for the future of Dodge & Cox, I am extremely optimistic. We have a deep and talented investment team across the board: domestic equity, international equity and fixed-income. I leave Dodge & Cox today as strong as it has ever been in our 76-year history. I have complete confidence that John Gunn, Ken Olivier, Dana Emery and others will act as responsible stewards of the firm’s unique culture.
On a personal note, the only investment options in the Dodge & Cox retirement plan are the Dodge & Cox Funds, so my own retirement assets have benefited from the Funds’ past results. I look forward to continuing on as a long-term shareholder of the Dodge & Cox Funds.
Thanks again for the confidence you have placed in our firm over the years.
Sincerely,

Harry R. Hagey
| | | | | | |
| | DODGE & COX INCOME FUND n | | PAGE | | 4 |
| | |
GROWTH OF $10,000 OVER 10 YEARS FOR AN INVESTMENT MADE ON DECEMBER 31, 1996 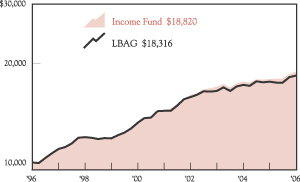
AVERAGE ANNUAL TOTAL RETURN FOR PERIODS ENDED DECEMBER 31, 2006 | | Past performance does not guarantee future results. Investment return and share price will fluctuate with market conditions, and investors may have a gain or loss when shares are sold. Mutual fund performance changes over time and currently may be significantly lower than stated above. Performance is updated and published monthly. Visit the Fund’s web site at www.dodgeandcox.com or call 1-800-621-3979 for current performance figures. The Fund’s total returns include the reinvestment of dividend and capital gain distributions, but have not been adjusted for any income taxes payable by shareholders on these distributions. The Lehman Brothers Aggregate Bond Index is an unmanaged index of investment-grade fixed-income securities. Index returns include dividends and/or interest income and, unlike Fund returns, do not reflect fees or expenses. Lehman Brothers® is a trademark of Lehman Brothers, Inc. |
| | | | | | | | | |
| | | 1 Year | | | 5 Years | | | 10 Years | |
| | | | | | | | | |
Dodge & Cox Income Fund | | 5.30 | % | | 5.48 | % | | 6.52 | % |
Lehman Brothers
Aggregate Bond Index (LBAG) | | 4.33 | | | 5.06 | | | 6.24 | |
FUND EXPENSE EXAMPLE
As a Fund shareholder, you incur ongoing Fund costs, including management fees and other Fund expenses. All mutual funds have ongoing costs, sometimes referred to as operating expenses. The following example shows ongoing costs of investing in the Fund and can help you understand these costs and compare them with those of other mutual funds. The example assumes a $1,000 investment held for the six months indicated.
ACTUAL EXPENSES
The first line of the table below provides information about actual account values and expenses based on the Fund’s actual returns. You may use the information in this line, together with your account balance, to estimate the expenses that you paid over the period. Simply divide your account value by $1,000 (for example, an $8,600 account value divided by $1,000 = 8.6), then multiply the result by the number in the first line under the heading “Expenses Paid During Period” to estimate the expenses you paid on your account during this period.
HYPOTHETICAL EXAMPLE FOR COMPARISON WITH OTHER MUTUAL FUNDS
Information on the second line of the table can help you compare ongoing costs of investing in the Fund with those of other mutual funds. This information may not be used to estimate the actual ending account balance or expenses you paid during the period. The hypothetical “Ending Account Value” is based on the actual expense ratio of the Fund and an assumed 5% annual rate of return before expenses (not the Fund’s actual return). The amount under the heading “Expense Paid During the Period” shows the hypothetical expenses your account would have incurred under this scenario. You can compare this figure with the 5% hypothetical examples that appear in shareholder reports of other mutual funds.
| | | | | | | | | |
Six Months Ended December 31, 2006 | | Beginning Account
Value 7/1/2006 | | Ending Account
Value 12/31/2006 | | Expenses Paid
During Period* |
Based on Actual Fund Return | | $ | 1,000.00 | | $ | 1,052.20 | | $ | 2.26 |
Based on Hypothetical 5% Yearly Return | | | 1,000.00 | | | 1,023.00 | | | 2.23 |
| * | | Expenses are equal to the Fund’s annualized six-month expense ratio of 0.44%, multiplied by the average account value over the period, multiplied by 184/365 (to reflect the one-half year period). |
The expenses shown in the table highlight ongoing costs only and do not reflect any transactional fees or account maintenance fees. While other mutual funds may charge such fees, please note that the Fund does not charge transaction fees (e.g., redemption fees, sales loads) or universal account maintenance fees (e.g., small account fees).
| | | | |
| PAGE | | 5 n DODGE & COX INCOME FUND | | |
| | |
| FUND INFORMATION | | December 31, 2006 |
GENERAL INFORMATION
| | |
Net Asset Value Per Share | | $12.57 |
Total Net Assets (billions) | | $12.0 |
30-Day SEC Yield(a) | | 5.11% |
2006 Expense Ratio | | 0.44% |
2006 Portfolio Turnover Rate | | 30% |
Fund Inception | | 1989 |
No sales charges or distribution fees | | |
Investment Manager: Dodge & Cox, San Francisco. Managed by the Fixed Income Investment Policy Committee, whose nine members’ average tenure at Dodge & Cox is 17 years, and by the Investment Policy Committee, whose 12 members’ (for fixed-income decisions) average tenure at Dodge & Cox is 20 years.
| | | | |
| PORTFOLIO CHARACTERISTICS | | FUND | | LBAG |
Number of Fixed-Income Securities | | 396 | | 7,134 |
Average Maturity (years) | | 5.7 | | 7.0 |
Effective Duration (years) | | 3.6 | | 4.5 |
| | | |
| FIVE LARGEST CORPORATE ISSUERS(c) | | | |
Ford Motor Credit Co. | | 2.5 | % |
Time Warner, Inc. (AOL Time Warner) | | 2.2 | |
GMAC, LLC | | 2.0 | |
Xerox Corp. | | 1.8 | |
HCA, Inc. | | 1.6 | |
| | | | | | |
| CREDIT QUALITY(d) | | FUND | | | LBAG | |
U.S. Government &
Government Related | | 65.1 | % | | 70.8 | % |
Aaa | | 1.1 | | | 8.1 | |
Aa | | 2.5 | | | 5.0 | |
A | | 5.3 | | | 8.7 | |
Baa | | 13.0 | | | 7.4 | |
Ba | | 4.6 | | | 0.0 | |
B | | 3.3 | | | 0.0 | |
Caa | | 1.6 | | | 0.0 | |
Cash Equivalents | | 3.5 | | | 0.0 | |
Average Quality | | Aa | | | AA+ | |
ASSET ALLOCATION
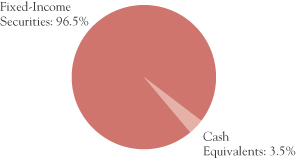
| | | | | | |
| SECTOR DIVERSIFICATION | | FUND | | | LBAG | |
U.S. Treasury & Government Related | | 22.5 | % | | 35.7 | % |
Mortgage-Related Securities | | 42.7 | | | 35.1 | |
Asset-Backed Securities/CMBS(b) | | 0.7 | | | 6.1 | |
Corporate | | 30.6 | | | 19.4 | |
Non-Corporate Yankee | | 0.0 | | | 3.7 | |
Cash Equivalents | | 3.5 | | | 0.0 | |
| | | | | | |
| MATURITY DIVERSIFICATION | | FUND | | | LBAG | |
0-1 Years to Maturity | | 13.2 | % | | 0.0 | % |
1-5 | | 56.2 | | | 45.4 | |
5-10 | | 19.7 | | | 42.8 | |
10-15 | | 1.7 | | | 3.3 | |
15-20 | | 1.1 | | | 2.2 | |
20-25 | | 5.6 | | | 3.2 | |
25 and Over | | 2.5 | | | 3.1 | |
(a) | | SEC Yield is an annualization of the Fund’s total net investment income per share for the 30-day period ended on the last day of the month. |
(b) | | CMBS refers to commercial mortgage-backed securities, which are a component of the LBAG but not currently held by the Fund. |
(c) | | The Fund’s portfolio holdings are subject to change without notice. The mention of specific securities is not a recommendation or solicitation for any person to buy, sell or hold any particular security. |
(d) | | The Fund’s credit quality ratings are from Moody’s Investor Services. If no Moody’s rating is available, the Standard & Poor’s rating is reported. If unrated, the investment manager determines a comparable rating, which is included in the portfolio breakdown. The LBAG’s credit quality ratings are from Lehman Brothers and reference Moody’s, Standard & Poor’s and Fitch ratings. The LBAG’s methodology for calculating average credit quality differs from that used by the Fund. Applying the LBAG methodology, the Fund’s average credit quality would be AA. The credit quality of the investments in the portfolio does not apply to the stability or safety of the Fund or its shares. |
| | | | | | |
| | DODGE & COX INCOME FUND n | | PAGE | | 6 |
| | |
| PORTFOLIO OF INVESTMENTS | | December 31, 2006 |
| | | | | | |
| FIXED-INCOME SECURITIES: 96.5% |
| | |
| | | PAR VALUE | | VALUE |
| U.S. TREASURY AND GOVERNMENT RELATED: 22.5% |
| U.S. TREASURY: 19.9% |
U.S. Treasury Notes | | | | | | |
3.125%, 1/31/07 | | $ | 300,000,000 | | $ | 299,566,500 |
6.625%, 5/15/07 | | | 340,000,000 | | | 341,899,240 |
3.00%, 11/15/07 | | | 475,000,000 | | | 466,854,700 |
3.125%, 10/15/08 | | | 125,000,000 | | | 121,391,625 |
3.25%, 1/15/09 | | | 400,000,000 | | | 388,124,800 |
3.625%, 7/15/09 | | | 335,000,000 | | | 326,167,055 |
3.375%, 9/15/09 | | | 450,000,000 | | | 434,583,900 |
| | | | | | |
| | | | | | 2,378,587,820 |
| GOVERNMENT RELATED: 2.6% |
Small Business Administration – 504 Program | | | |
Series 91-20K, 8.25%, 11/1/11 | | | 341,426 | | | 355,420 |
Series 92-20B, 8.10%, 2/1/12 | | | 324,950 | | | 337,747 |
Series 92-20C, 8.20%, 3/1/12 | | | 941,879 | | | 981,116 |
Series 92-20D, 8.20%, 4/1/12 | | | 496,482 | | | 517,700 |
Series 92-20G, 7.60%, 7/1/12 | | | 1,081,193 | | | 1,119,651 |
Series 92-20H, 7.40%, 8/1/12 | | | 814,842 | | | 842,257 |
Series 92-20I, 7.05%, 9/1/12 | | | 962,256 | | | 990,595 |
Series 92-20J, 7.00%, 10/1/12 | | | 1,368,586 | | | 1,408,799 |
Series 92-20K, 7.55%, 11/1/12 | | | 1,343,359 | | | 1,394,594 |
Series 92-20L, 7.45%, 12/1/12 | | | 616,057 | | | 639,141 |
Series 93-20B, 7.00%, 2/1/13 | | | 999,776 | | | 1,029,648 |
Series 93-20C, 6.50%, 3/1/13 | | | 3,252,039 | | | 3,326,427 |
Series 93-20D, 6.75%, 4/1/13 | | | 1,175,808 | | | 1,207,848 |
Series 93-20E, 6.55%, 5/1/13 | | | 3,967,766 | | | 4,065,455 |
Series 93-20F, 6.65%, 6/1/13 | | | 1,158,670 | | | 1,189,577 |
Series 93-20L, 6.30%, 12/1/13 | | | 2,107,839 | | | 2,153,459 |
Series 94-20A, 6.50%, 1/1/14 | | | 2,610,553 | | | 2,672,272 |
Series 94-20D, 7.70%, 4/1/14 | | | 753,850 | | | 781,259 |
Series 94-20E, 7.75%, 5/1/14 | | | 2,314,683 | | | 2,420,456 |
Series 94-20F, 7.60%, 6/1/14 | | | 1,393,604 | | | 1,454,931 |
Series 94-20G, 8.00%, 7/1/14 | | | 1,033,767 | | | 1,081,717 |
Series 94-20H, 7.95%, 8/1/14 | | | 980,332 | | | 1,025,976 |
Series 94-20I, 7.85%, 9/1/14 | | | 1,238,197 | | | 1,295,054 |
Series 94-20K, 8.65%, 11/1/14 | | | 1,005,232 | | | 1,065,241 |
Series 94-20L, 8.40%, 12/1/14 | | | 917,105 | | | 969,304 |
Series 95-20A, 8.50%, 1/1/15 | | | 352,323 | | | 371,171 |
Series 95-20C, 8.10%, 3/1/15 | | | 811,034 | | | 851,546 |
Series 97-20E, 7.30%, 5/1/17 | | | 1,679,964 | | | 1,750,873 |
Series 97-20J, 6.55%, 10/1/17 | | | 2,344,576 | | | 2,413,927 |
Series 98-20C, 6.35%, 3/1/18 | | | 9,337,658 | | | 9,586,272 |
Series 98-20H, 6.15%, 8/1/18 | | | 3,300,259 | | | 3,377,330 |
Series 98-20L, 5.80%, 12/1/18 | | | 1,793,724 | | | 1,822,986 |
Series 99-20C, 6.30%, 3/1/19 | | | 2,266,447 | | | 2,330,409 |
Series 99-20G, 7.00%, 7/1/19 | | | 5,412,029 | | | 5,652,821 |
Series 99-20I, 7.30%, 9/1/19 | | | 1,713,591 | | | 1,803,057 |
Series 01-20G, 6.625%, 7/1/21 | | | 12,646,548 | | | 13,211,673 |
Series 01-20L, 5.78%, 12/1/21 | | | 28,564,958 | | | 29,145,184 |
Series 02-20L, 5.10%, 12/1/22 | | | 6,957,173 | | | 6,931,566 |
Series 04-20L, 4.87%, 12/1/24 | | | 8,083,358 | | | 7,921,771 |
Series 05-20B, 4.625%, 2/1/25 | | | 10,872,449 | | | 10,499,742 |
Series 05-20C, 4.95%, 3/1/25 | | | 7,421,198 | | | 7,262,020 |
| | | | | | |
| |
| | |
| | | PAR VALUE | | VALUE |
Series 05-20E, 4.84%, 5/1/25 | | $ | 21,130,174 | | $ | 20,643,187 |
Series 05-20G, 4.75%, 7/1/25 | | | 18,953,101 | | | 18,414,592 |
Series 05-20I, 4.76%, 9/1/25 | | | 22,372,144 | | | 21,726,126 |
Series 06-20A, 5.21%, 1/1/26 | | | 21,969,697 | | | 21,912,622 |
Series 06-20B, 5.35%, 2/1/26 | | | 6,325,406 | | | 6,354,895 |
Series 06-20C, 5.57%, 3/1/26 | | | 32,698,327 | | | 33,210,988 |
Series 06-20G, 6.07%, 7/1/26 | | | 23,890,000 | | | 24,870,288 |
Series 06-20J, 5.37%, 10/1/26 | | | 18,580,000 | | | 18,666,295 |
Series 06-20L, 5.12%, 12/1/26 | | | 14,328,000 | | | 14,168,224 |
| | | | | | |
| | | | | | 319,225,209 |
| | | | | | |
| | | | | | 2,697,813,029 |
| MORTGAGE-RELATED SECURITIES: 42.7% |
| FEDERAL AGENCY CMO & REMIC: 3.3% |
Dept. of Veterans Affairs | | | | | | |
Trust 1995-2D 4A, 9.293%, 5/15/25 | | | 479,320 | | | 506,893 |
Trust 1997-2Z, 7.50%, 6/15/27 | | | 36,228,938 | | | 37,804,198 |
Trust 1998-1 1A, 8.183%, 10/15/27 | | | 1,263,025 | | | 1,325,988 |
Fannie Mae | | | | | | |
Trust 1994-72 J, 6.00%, 6/25/23 | | | 8,283,514 | | | 8,298,857 |
Trust 1998-58 PX, 6.50%, 9/25/28 | | | 3,334,497 | | | 3,426,544 |
Trust 1998-58 PC, 6.50%, 10/25/28 | | | 18,926,520 | | | 19,436,859 |
Trust 2002-33 A1, 7.00%, 6/25/32 | | | 6,612,468 | | | 6,814,458 |
Trust 2001-T4 A1, 7.50%, 7/25/41 | | | 5,589,001 | | | 5,791,559 |
Trust 2001-T10 A1, 7.00%, 12/25/41 | | | 8,860,262 | | | 9,102,536 |
Trust 2002-90 A1, 6.50%, 6/25/42 | | | 12,076,176 | | | 12,328,900 |
Trust 2002-W6 2A1, 7.00%, 6/25/42 | | | 10,440,482 | | | 10,756,176 |
Trust 2002-W8 A2, 7.00%, 6/25/42 | | | 5,147,532 | | | 5,286,077 |
Trust 2003-W2 1A2, 7.00%, 7/25/42 | | | 32,011,354 | | | 32,722,630 |
Trust 2003-W4 3A, 7.00%, 10/25/42 | | | 9,393,569 | | | 9,663,210 |
Trust 2003-07 A1, 6.50%, 12/25/42 | | | 13,319,129 | | | 13,570,785 |
Trust 2003-W1 1A1, 6.50%, 12/25/42 | | | 19,734,822 | | | 20,076,102 |
Trust 2003-W1 2A, 7.50%, 12/25/42 | | | 8,917,712 | | | 9,270,665 |
Trust 2004-W2 5A, 7.50%, 3/25/44 | | | 44,610,613 | | | 46,645,044 |
Trust 2004-W8 3A, 7.50%, 6/25/44 | | | 25,089,898 | | | 26,219,242 |
Trust 2005-W1 1A3, 7.00%, 10/25/44 | | | 21,398,960 | | | 22,165,482 |
Trust 2001-79 BA, 7.00%, 3/25/45 | | | 2,900,114 | | | 2,983,978 |
Trust 2006-W1 1A1, 6.50%, 12/25/45 | | | 3,017,086 | | | 3,087,326 |
Trust 2006-W1 1A2, 7.00%, 12/25/45 | | | 20,136,907 | | | 20,890,591 |
Trust 2006-W1 1A3, 7.50%, 12/25/45 | | | 321,936 | | | 338,457 |
Trust 2006-W1 1A4, 8.00%, 12/25/45 | | | 24,123,826 | | | 25,649,040 |
Freddie Mac | | | | | | |
Series 1565 G, 6.00%, 8/15/08 | | | 1,483,764 | | | 1,483,113 |
Series 1601 PJ, 6.00%, 10/15/08 | | | 7,143,027 | | | 7,139,740 |
Series (GN) 37 I, 6.00%, 6/17/22 | | | 99,033 | | | 98,809 |
Series 2439 LG, 6.00%, 9/15/30 | | | 11,301,908 | | | 11,337,426 |
Series T-48 1A, 7.107%, 7/25/33 | | | 9,071,960 | | | 9,372,385 |
Ginnie Mae 7.25%, 7/16/28 | | | 3,615,533 | | | 3,672,009 |
| | | | | | |
| | | | | | 387,265,079 |
| FEDERAL AGENCY MORTGAGE PASS-THROUGH: 39.3% |
Fannie Mae, 10 Year | | | | | | |
6.00%, 11/1/16 | | | 24,253,995 | | | 24,618,371 |
Fannie Mae, 15 Year | | | | | | |
5.50%, 9/1/14-12/1/18 | | | 321,398,484 | | | 322,350,725 |
6.00%, 4/1/13-12/1/20 | | | 721,029,114 | | | 731,836,383 |
6.50%, 11/1/12-11/1/18 | | | 214,314,737 | | | 219,524,087 |
| | | | |
| PAGE | | 7 n DODGE & COX INCOME FUND | | See accompanying Notes to Financial Statements |
| | |
| PORTFOLIO OF INVESTMENTS | | December 31, 2006 |
| | | | | | |
| FIXED-INCOME SECURITIES (continued) |
| | |
| | | PAR VALUE | | VALUE |
7.00%, 7/1/08-12/1/11 | | $ | 1,942,520 | | $ | 1,977,731 |
7.50%, 11/1/14-8/1/17 | | | 22,119,095 | | | 22,941,299 |
8.00%, 8/1/10 | | | 14,864 | | | 14,909 |
Fannie Mae, 20 Year | | | | | | |
6.50%, 4/1/19-10/1/24 | | | 71,718,772 | | | 73,599,971 |
Fannie Mae, 30 Year | | | | | | |
4.50%, 8/1/33-11/1/33 | | | 131,373,243 | | | 123,463,005 |
5.00%, 3/1/34 | | | 206,920,230 | | | 200,159,964 |
5.50%, 5/1/34 | | | 206,987,997 | | | 204,878,030 |
6.00%, 3/1/33-7/1/35 | | | 792,712,721 | | | 799,778,960 |
6.50%, 12/1/32-1/1/34 | | | 204,520,084 | | | 209,378,829 |
7.00%, 4/1/32 | | | 4,238,308 | | | 4,365,654 |
7.50%, 9/1/07 | | | 36,644 | | | 36,666 |
8.00%, 1/1/12-8/1/22 | | | 210,191 | | | 215,146 |
Fannie Mae, Hybrid ARM | | | | | | |
4.218%, 9/1/34 | | | 21,807,859 | | | 21,498,804 |
4.50%, 1/1/35-7/1/35 | | | 98,202,316 | | | 97,007,423 |
4.607%, 10/1/34 | | | 26,002,522 | | | 25,657,506 |
4.682%, 1/1/36 | | | 46,135,822 | | | 45,594,476 |
4.689%, 8/1/35 | | | 21,882,158 | | | 21,597,517 |
4.71%, 8/1/34 | | | 5,903,550 | | | 5,864,579 |
4.753%, 7/1/35 | | | 18,884,161 | | | 18,658,216 |
4.772%, 10/1/35 | | | 34,368,186 | | | 34,054,156 |
4.786%, 1/1/36 | | | 39,651,723 | | | 39,344,953 |
4.788%, 7/1/35 | | | 20,557,663 | | | 20,347,179 |
4.813%, 8/1/35 | | | 56,035,299 | | | 55,544,057 |
4.888%, 12/1/35 | | | 22,145,269 | | | 22,045,637 |
4.901%, 10/1/35 | | | 18,560,694 | | | 18,421,630 |
5.004%, 9/1/35 | | | 25,553,601 | | | 25,430,432 |
5.041%, 7/1/35 | | | 141,033,936 | | | 140,201,809 |
5.048%, 4/1/35 | | | 31,308,233 | | | 31,380,492 |
Fannie Mae Multifamily DUS | | | | | | |
Pool 760744, 4.75%, 3/1/15 | | | 13,590,000 | | | 13,149,949 |
Pool 555162, 4.835%, 1/1/13 | | | 17,242,095 | | | 16,952,616 |
Pool 555191, 4.843%, 2/1/13 | | | 19,422,879 | | | 19,101,060 |
Pool 555172, 5.579%, 12/1/12 | | | 3,639,456 | | | 3,696,403 |
Pool 545987, 5.881%, 9/1/12 | | | 25,371,952 | | | 26,125,412 |
Pool 545685, 6.016%, 4/1/12 | | | 28,959,026 | | | 29,749,279 |
Pool 545708, 6.056%, 5/1/12 | | | 2,546,969 | | | 2,628,281 |
Pool 545547, 6.088%, 3/1/12 | | | 13,217,448 | | | 13,654,274 |
Pool 545209, 6.144%, 10/1/11 | | | 26,480,426 | | | 27,340,768 |
Pool 545059, 6.224%, 5/1/11 | | | 22,735,088 | | | 23,478,022 |
Pool 545179, 6.259%, 9/1/11 | | | 18,302,484 | | | 18,977,378 |
Pool 323822, 6.374%, 7/1/09 | | | 3,404,196 | | | 3,466,299 |
Pool 160329, 7.15%, 10/1/15 | | | 221,275 | | | 236,738 |
Freddie Mac, 30 Year | | | | | | |
7.50%, 10/1/08 | | | 2,493 | | | 2,497 |
8.00%, 1/1/08-5/1/09 | | | 6,104 | | | 6,108 |
Freddie Mac Gold, 10 Year | | | | | | |
6.00%, 9/1/16 | | | 12,841,721 | | | 13,027,381 |
Freddie Mac Gold, 15 Year | | | | | | |
5.50%, 11/1/13-10/1/20 | | | 177,539,766 | | | 177,751,038 |
6.00%, 4/1/13-2/1/19 | | | 146,751,624 | | | 148,877,732 |
6.50%, 2/1/11-9/1/18 | | | 80,900,887 | | | 82,785,789 |
7.00%, 11/1/08-3/1/12 | | | 1,784,580 | | | 1,828,632 |
| | | | | | |
| |
| | |
| | | PAR VALUE | | VALUE |
Freddie Mac Gold, 20 Year | | | | | | |
5.50%, 11/1/23 | | $ | 79,494,739 | | $ | 79,160,455 |
6.50%, 7/1/21-12/1/26 | | | 54,468,849 | | | 55,620,576 |
Freddie Mac Gold, 30 Year | | | | | | |
6.50%, 5/1/17-12/1/32 | | | 48,080,689 | | | 49,206,937 |
7.00%, 4/1/31 | | | 25,080,777 | | | 25,885,477 |
7.90%, 2/17/21 | | | 3,017,345 | | | 3,164,260 |
Freddie Mac Gold, Hybrid ARM | | | | | | |
4.142%, 1/1/35 | | | 18,093,448 | | | 17,768,275 |
4.163%, 3/1/35 | | | 12,293,063 | | | 11,975,730 |
4.311%, 8/1/34 | | | 15,558,443 | | | 15,265,477 |
4.405%, 9/1/35 | | | 34,434,473 | | | 33,856,193 |
4.512%, 4/1/35 | | | 9,890,740 | | | 9,754,141 |
4.588%, 4/1/36 | | | 42,920,000 | | | 42,275,342 |
4.691%, 8/1/35 | | | 18,756,088 | | | 18,505,489 |
4.738%, 8/1/35 | | | 21,377,636 | | | 21,089,215 |
4.871%, 10/1/35 | | | 26,287,689 | | | 26,120,697 |
4.889%, 1/1/36 | | | 25,197,690 | | | 25,005,662 |
5.142%, 1/1/36 | | | 75,263,168 | | | 75,171,021 |
Ginnie Mae, 15 Year | | | | | | |
7.00%, 4/15/09 | | | 521,631 | | | 526,685 |
Ginnie Mae, 30 Year | | | | | | |
7.00%, 5/15/28 | | | 2,363,397 | | | 2,441,618 |
7.50%, 9/15/17-5/15/25 | | | 7,963,092 | | | 8,290,640 |
7.80%, 6/15/20-1/15/21 | | | 2,126,000 | | | 2,229,204 |
| | | | | | |
| | | | | | 4,707,937,346 |
| PRIVATE LABEL CMO & REMIC SECURITIES: 0.1% |
GSMPS Mortgage Loan Trust, | | | | | | |
Series 2004-4 1A4 8.50%, 6/25/34(b) | | | 14,869,923 | | | 15,678,877 |
| | | | | | |
| | | | | | 5,110,881,302 |
| ASSET-BACKED SECURITIES: 0.7% |
| STUDENT LOAN: 0.7% |
SLM Student Loan Trust | | | | | | |
Series 06-7 A2, 5.367%, 10/25/16 | | | 44,107,000 | | | 44,091,571 |
Series 06-8 A2, 5.412%, 10/25/16 | | | 35,000,000 | | | 34,985,300 |
| | | | | | |
| | | | | | 79,076,871 |
| CORPORATE: 30.6% |
| FINANCIALS: 7.8% |
BankAmerica Capital II(a) | | | | | | |
8.00%, 12/15/26, callable | | | 14,550,000 | | | 15,147,874 |
BankAmerica Capital VI(a) | | | | | | |
5.625%, 3/8/35 | | | 21,450,000 | | | 20,305,063 |
BankAmerica Capital XI(a) | | | | | | |
6.625%, 5/23/36 | | | 10,015,000 | | | 10,808,028 |
Boston Properties, Inc. | | | | | | |
6.25%, 1/15/13 | | | 50,211,000 | | | 52,255,843 |
5.625%, 4/15/15 | | | 34,360,000 | | | 34,482,322 |
5.00%, 6/1/15 | | | 15,309,000 | | | 14,716,572 |
CIGNA Corp. | | | | | | |
7.00%, 1/15/11 | | | 13,565,000 | | | 14,254,970 |
6.375%, 10/15/11 | | | 28,755,000 | | | 29,751,217 |
7.65%, 3/1/23 | | | 3,547,000 | | | 3,999,870 |
7.875%, 5/15/27 | | | 27,615,000 | | | 32,585,424 |
8.30%, 1/15/33 | | | 7,375,000 | | | 8,913,521 |
| | | | | | |
| See accompanying Notes to Financial Statements | | DODGE & COX INCOME FUND n | | PAGE | | 8 |
| | |
| PORTFOLIO OF INVESTMENTS | | December 31, 2006 |
| | | | | | |
| FIXED-INCOME SECURITIES (continued) |
| | |
| | | PAR VALUE | | VALUE |
Citicorp Capital I(a) | | | | | | |
7.933%, 2/15/27, callable 2007 | | $ | 12,000,000 | | $ | 12,494,388 |
Citicorp Capital II(a) | | | | | | |
8.015%, 2/15/27, callable 2007 | | | 10,300,000 | | | 10,729,356 |
EOP Operating Limited Partnership(c) | | | | | | |
7.00%, 7/15/11 | | | 40,350,000 | | | 43,665,923 |
5.875%, 1/15/13 | | | 38,000,000 | | | 39,827,876 |
4.75%, 3/15/14 | | | 83,690,000 | | | 82,905,825 |
HSBC Holdings PLC | | | | | | |
6.50%, 5/2/36 | | | 27,625,000 | | | 29,718,146 |
JPMorgan Chase (Bank One) Capital III(a) 8.75%, 9/1/30 | | | 26,140,000 | | | 34,291,837 |
JPMorgan Chase Capital XVII(a) | | | | | | |
5.85%, 8/1/35 | | | 22,090,000 | | | 21,506,183 |
Kaupthing Bank | | | | | | |
7.125%, 5/19/16(b) | | | 76,250,000 | | | 80,876,545 |
Safeco Corp. | | | | | | |
4.875%, 2/1/10 | | | 15,150,000 | | | 14,985,486 |
7.25%, 9/1/12 | | | 18,022,000 | | | 19,479,764 |
St. Paul Travelers Companies, Inc. | | | |
8.125%, 4/15/10 (St. Paul) | | | 21,575,000 | | | 23,401,669 |
5.00%, 3/15/13 (Travelers) | | | 16,295,000 | | | 15,905,175 |
5.50%, 12/1/15 | | | 11,220,000 | | | 11,176,792 |
6.25%, 6/20/16 | | | 26,000,000 | | | 27,298,908 |
UnumProvident Corp. | | | | | | |
7.625%, 3/1/11 | | | 20,786,000 | | | 22,124,182 |
6.85%, 11/15/15(b) (Unum Finance PLC) | | | 11,700,000 | | | 12,164,455 |
7.19%, 2/1/28 (Unum) | | | 11,640,000 | | | 11,545,623 |
7.25%, 3/15/28 (Provident Companies) | | | 23,905,000 | | | 25,058,703 |
6.75%, 12/15/28 (Unum) | | | 13,005,000 | | | 12,982,137 |
7.375%, 6/15/32 | | | 29,670,000 | | | 31,663,142 |
Wellpoint, Inc. | | | | | | |
6.375%, 1/15/12 | | | 7,662,000 | | | 7,977,153 |
5.00%, 12/15/14 | | | 15,610,000 | | | 15,112,821 |
5.25%, 1/15/16 | | | 84,510,000 | | | 82,843,885 |
| | | | | | |
| | | | | | 926,956,678 |
| INDUSTRIALS: 20.0% |
AT&T Corp. 8.00%, 11/15/31 | | | 117,190,000 | | | 145,395,055 |
Comcast Corp. | | | | | | |
5.30%, 1/15/14 | | | 74,765,000 | | | 73,229,103 |
5.85%, 11/15/15 | | | 24,860,000 | | | 24,895,351 |
5.90%, 3/15/16 | | | 33,775,000 | | | 33,871,326 |
6.50%, 1/15/17 | | | 35,795,000 | | | 37,352,870 |
Cox Communications, Inc. | | | | | | |
5.45%, 12/15/14 | | | 104,870,000 | | | 102,167,815 |
5.875%, 12/1/16(b) | | | 40,090,000 | | | 39,805,642 |
Dillard’s, Inc. | | | | | | |
6.625%, 11/15/08 | | | 4,985,000 | | | 5,034,850 |
7.13%, 8/1/18 | | | 24,015,000 | | | 23,834,887 |
7.75%, 7/15/26 | | | 21,666,000 | | | 21,666,000 |
7.75%, 5/15/27 | | | 12,803,000 | | | 12,803,000 |
7.00%, 12/1/28 | | | 28,825,000 | | | 27,527,875 |
| | | | | | |
| |
| | |
| | | PAR VALUE | | VALUE |
Dow Chemical Co. | | | | | | |
4.027%, 9/30/09(b) | | $ | 54,087,000 | | $ | 52,008,058 |
6.00%, 10/1/12 | | | 9,875,000 | | | 10,146,128 |
7.375%, 11/1/29 | | | 29,514,000 | | | 34,113,993 |
Electronic Data Systems Corp. | | | | | | |
6.50%, 8/1/13 | | | 42,375,000 | | | 42,660,353 |
Federated Department Stores, Inc.
(May Department Stores Co.) | | | |
7.625%, 8/15/13 | | | 7,155,000 | | | 7,760,077 |
6.70%, 9/15/28 | | | 20,550,000 | | | 20,156,139 |
6.90%, 1/15/32 | | | 15,465,000 | | | 15,705,357 |
6.70%, 7/15/34 | | | 12,360,000 | | | 12,191,546 |
Ford Motor Credit Co. | | | | | | |
5.80%, 1/12/09 | | | 30,250,000 | | | 29,700,751 |
7.375%, 10/28/09 | | | 10,100,000 | | | 10,121,513 |
7.375%, 2/1/11 | | | 62,765,000 | | | 62,133,772 |
7.25%, 10/25/11 | | | 206,330,000 | | | 202,053,192 |
General Electric Co. | | | | | | |
5.00%, 2/1/13 | | | 34,994,000 | | | 34,605,602 |
GMAC, LLC 6.875%, 9/15/11 | | | 227,980,000 | | | 233,838,630 |
HCA, Inc. | | | | | | |
8.75%, 9/1/10 | | | 54,595,000 | | | 56,915,287 |
7.875%, 2/1/11 | | | 33,850,000 | | | 33,934,625 |
6.25%, 2/15/13 | | | 39,655,000 | | | 35,094,675 |
6.75%, 7/15/13 | | | 29,063,000 | | | 26,084,042 |
5.75%, 3/15/14 | | | 28,700,000 | | | 23,821,000 |
6.50%, 2/15/16 | | | 19,690,000 | | | 16,588,825 |
Hess Corp. (Amerada Hess) | | | | | | |
7.875%, 10/1/29 | | | 33,870,000 | | | 39,536,180 |
Hewlett-Packard Co. | | | | | | |
5.50%, 7/1/07 | | | 35,945,000 | | | 35,984,288 |
Lafarge SA 6.50%, 7/15/16 | | | 34,100,000 | | | 35,604,492 |
Liberty Media Corp. | | | | | | |
8.50%, 7/15/29 | | | 19,985,000 | | | 20,094,038 |
4.00%, 11/15/29, exchangeable | | | 25,500,000 | | | 17,021,250 |
8.25%, 2/1/30 | | | 57,310,000 | | | 56,176,867 |
3.75%, 2/15/30, exchangeable | | | 38,385,000 | | | 23,606,775 |
Lockheed Martin Corp. | | | | | | |
7.65%, 5/1/16 | | | 15,025,000 | | | 17,335,259 |
6.15%, 9/1/36 | | | 16,684,000 | | | 17,528,861 |
Raytheon Co. | | | | | | |
6.75%, 8/15/07 | | | 6,756,000 | | | 6,805,758 |
6.55%, 3/15/10 | | | 10,150,000 | | | 10,516,374 |
7.20%, 8/15/27 | | | 4,905,000 | | | 5,711,922 |
Time Warner, Inc. (AOL Time Warner) | | | | | | |
7.625%, 4/15/31 | | | 119,983,000 | | | 134,040,328 |
7.70%, 5/1/32 | | | 110,459,000 | | | 124,630,116 |
Wyeth | | | | | | |
5.50%, 3/15/13 | | | 10,275,000 | | | 10,341,479 |
5.50%, 2/1/14 | | | 110,465,000 | | | 111,031,796 |
5.50%, 2/15/16 | | | 15,000,000 | | | 15,020,310 |
| | | | |
| PAGE | | 9 n DODGE & COX INCOME FUND | | See accompanying Notes to Financial Statements |
| | |
| PORTFOLIO OF INVESTMENTS | | December 31, 2006 |
| | | | | | |
| FIXED-INCOME SECURITIES (continued) |
| | |
| | | PAR VALUE | | VALUE |
Xerox Corp. | | | | | | |
9.75%, 1/15/09 | | $ | 28,850,000 | | $ | 31,158,000 |
7.125%, 6/15/10 | | | 77,825,000 | | | 81,716,250 |
6.875%, 8/15/11 | | | 52,550,000 | | | 55,243,187 |
6.40%, 3/15/16 | | | 22,810,000 | | | 23,294,712 |
7.20%, 4/1/16 | | | 17,646,000 | | | 18,859,163 |
| | | | | | |
| | | | | | 2,398,474,744 |
| TRANSPORTATION: 2.8% |
Burlington Northern Santa Fe Railway | | | | | | |
4.30%, 7/1/13 | | | 7,883,000 | | | 7,413,355 |
4.875%, 1/15/15 | | | 4,335,000 | | | 4,158,210 |
7.57%, 1/2/21 | | | 11,843,053 | | | 13,281,511 |
8.251%, 1/15/21 | | | 1,148,158 | | | 1,337,983 |
5.72%, 1/15/24 | | | 33,375,000 | | | 34,002,607 |
5.629%, 4/1/24 | | | 47,000,000 | | | 47,523,227 |
5.342%, 4/1/24 | | | 11,075,000 | | | 11,052,306 |
CSX Transportation, Inc. | | | | | | |
9.75%, 6/15/20 | | | 10,272,000 | | | 13,725,241 |
FedEx Corp. 6.72%, 1/15/22 | | | 7,921,474 | | | 8,485,087 |
Norfolk Southern Corp. | | | | | | |
7.70%, 5/15/17 | | | 29,475,000 | | | 34,279,690 |
9.75%, 6/15/20 | | | 14,188,000 | | | 19,116,017 |
Union Pacific Corp. | | | | | | |
6.50%, 4/15/12 | | | 12,337,000 | | | 12,956,095 |
5.375%, 5/1/14 | | | 22,886,000 | | | 22,722,525 |
4.875%, 1/15/15 | | | 10,564,000 | | | 10,124,263 |
6.85%, 1/2/19 | | | 7,865,770 | | | 8,369,336 |
6.70%, 2/23/19 | | | 11,893,540 | | | 12,579,322 |
7.60%, 1/2/20 | | | 1,768,602 | | | 1,994,275 |
4.698%, 1/2/24 | | | 6,186,943 | | | 5,897,641 |
5.082%, 1/2/29 | | | 10,923,461 | | | 10,488,849 |
5.866%, 7/2/30 | | | 52,960,000 | | | 54,549,330 |
| | | | | | |
| | | | | | 334,056,870 |
| | | | | | |
| | | | | | 3,659,488,292 |
| | | | | | |
TOTAL FIXED-INCOME SECURITIES
(Cost $11,492,224,891) | | | 11,547,259,494 |
| | | | | | |
| | | | | | | | |
| SHORT-TERM INVESTMENTS: 3.6% | |
| | |
| | | PAR VALUE | | | VALUE | |
SSgA Prime Money Market Fund | | $ | 11,843,696 | | | $ | 11,843,696 | |
State Street Repurchase Agreement 4.40%, 1/2/07, maturity value $422,923,662 (collateralized by U.S. Treasury Securities, value $431,175,250, 5.00%%, 7/31/08) | | | 422,717,000 | | | | 422,717,000 | |
| | | | | | | | |
TOTAL SHORT-TERM INVESTMENTS (Cost $434,560,696) | | | | 434,560,696 | |
| | | | | | | | |
TOTAL INVESTMENTS (Cost $11,926,785,587) | | | 100.1 | % | | | 11,981,820,190 | |
OTHER ASSETS, LESS LIABILITIES | | | (0.1 | %) | | | (10,103,357 | ) |
| | | | | | | | |
TOTAL NET ASSETS | | | 100.0 | % | | $ | 11,971,716,833 | |
| | | | | | | | |
(a) | | Cumulative preferred security |
(b) | | Security exempt from registration under Rule 144A of the Securities Act of 1933. The security may be resold in transactions exempt from registration, normally to qualified institutional buyers. As of December 31, 2006, all such securities in total represented $200,533,577 or 1.7% of total net assets. |
(c) | | EOP Operating LP is the operating partnership of Equity Office Properties Trust. |
When two issuers are identified, the first name refers to the acquirer/successor obligor or guarantor, and the second name (within the parentheses) refers to the original issuer of the instruments.
ARM: Adjustable Rate Mortgage
CMO: Collateralized Mortgage Obligation
REMIC: Real Estate Mortgage Investment Conduit
| | | | | | |
| See accompanying Notes to Financial Statements | | DODGE & COX INCOME FUND n | | PAGE | | 10 |
STATEMENT OF ASSETS AND LIABILITIES
| | | | |
|
| December 31, 2006 | |
| ASSETS: | |
Investments, at value (cost $11,926,785,587) | | $ | 11,981,820,190 | |
Receivable for paydowns on mortgage-backed securities | | | 2,311,429 | |
Receivable for Fund shares sold | | | 26,919,066 | |
Interest receivable | | | 124,402,095 | |
Prepaid expenses and other assets | | | 51,650 | |
| | | | |
| | | 12,135,504,430 | |
| | | | |
| LIABILITIES: | | | | |
Payable for investments purchased | | | 97,758,417 | |
Payable for Fund shares redeemed | | | 61,224,429 | |
Management fees payable | | | 4,049,504 | |
Accrued expenses | | | 755,247 | |
| | | | |
| | | 163,787,597 | |
| | | | |
| NET ASSETS | | $ | 11,971,716,833 | |
| | | | |
| NET ASSETS CONSIST OF: | | | | |
Paid in capital | | $ | 12,015,853,510 | |
Undistributed net investment income | | | 6,896,143 | |
Accumulated undistributed net realized loss on investments | | | (106,067,423 | ) |
Net unrealized appreciation on investments | | | 55,034,603 | |
| | | | |
| | $ | 11,971,716,833 | |
| | | | |
Fund shares outstanding (par value $0.01 each, unlimited shares authorized) | | | 952,460,248 | |
Net asset value per share | | | $12.57 | |
|
| STATEMENT OF OPERATIONS | |
| | | Year Ended
December 31, 2006 | |
| INVESTMENT INCOME: | | | | |
Interest | | $ | 550,206,717 | |
| | | | |
| EXPENSES: | | | | |
Management fees | | | 42,320,134 | |
Custody and fund accounting fees | | | 194,537 | |
Transfer agent fees | | | 2,393,275 | |
Professional services | | | 89,172 | |
Shareholder reports | | | 681,566 | |
Registration fees | | | 395,817 | |
Trustees’ fees | | | 167,500 | |
Miscellaneous | | | 67,955 | |
| | | | |
| | | 46,309,956 | |
| | | | |
| NET INVESTMENT INCOME | | | 503,896,761 | |
| | | | |
REALIZED AND UNREALIZED GAIN (LOSS)
ON INVESTMENTS: | |
Net realized loss | | | (3,533,509 | ) |
Net change in unrealized appreciation/depreciation | | | 66,417,029 | |
| | | | |
Net realized and unrealized gain | | | 62,883,520 | |
| | | | |
| NET INCREASE IN NET ASSETS FROM OPERATIONS | | $ | 566,780,281 | |
| | | | |
| | | | | | | | |
STATEMENT OF CHANGES IN NET ASSETS | |
| | |
| | | Year Ended
December 31, 2006 | | | Year Ended December 31, 2005 | |
| OPERATIONS: | | | | | | | | |
Net investment income | | $ | 503,896,761 | | | $ | 353,678,523 | |
Net realized gain (loss) | | | (3,533,509 | ) | | | 20,155,850 | |
Net change in unrealized appreciation/depreciation | | | 66,417,029 | | | | (200,036,683 | ) |
| | | | | | | | |
Net increase in net assets from operations | | | 566,780,281 | | | | 173,797,690 | |
| | | | | | | | |
| | |
| DISTRIBUTIONS TO SHAREHOLDERS FROM: | | | | | | | | |
Net investment income | | | (532,395,799 | ) | | | (390,586,222 | ) |
Net realized gain | | | — | | | | — | |
| | | | | | | | |
Total distributions | | | (532,395,799 | ) | | | (390,586,222 | ) |
| | | | | | | | |
| |
FUND SHARE
TRANSACTIONS: | | | | | |
Proceeds from sale of shares | | | 4,115,697,531 | | | | 3,244,793,643 | |
Reinvestment of distributions | | | 453,075,083 | | | | 334,969,730 | |
Cost of shares redeemed | | | (2,241,206,234 | ) | | | (1,623,405,388 | ) |
| | | | | | | | |
Net increase from Fund share transactions | | | 2,327,566,380 | | | | 1,956,357,985 | |
| | | | | | | | |
Total increase in net assets | | | 2,361,950,862 | | | | 1,739,569,453 | |
| | |
| NET ASSETS: | | | | | | | | |
Beginning of year | | | 9,609,765,971 | | | | 7,870,196,518 | |
| | | | | | | | |
End of year (including undistributed net investment income of $6,896,144 and $6,670,694, respectively) | | $ | 11,971,716,833 | | | $ | 9,609,765,971 | |
| | | | | | | | |
| | |
| SHARE INFORMATION: | | | | | | | | |
Shares sold | | | 328,751,052 | | | | 254,312,934 | |
Distributions reinvested | | | 36,459,332 | | | | 26,493,475 | |
Shares redeemed | | | (179,356,904 | ) | | | (127,349,477 | ) |
| | | | | | | | |
Net increase in shares outstanding | | | 185,853,480 | | | | 153,456,932 | |
| | | | | | | | |
| | | | |
| PAGE | | 11 n DODGE & COX INCOME FUND | | See accompanying Notes to Financial Statements |
NOTES TO FINANCIAL STATEMENTS
NOTE 1—ORGANIZATION AND SIGNIFICANT ACCOUNTING POLICIES
Dodge & Cox Income Fund (the “Fund”) is one of the series constituting the Dodge & Cox Funds (the “Trust” or the “Funds”). The Trust is organized as a Delaware statutory trust and is registered under the Investment Company Act of 1940, as amended, as a diversified, open-end management investment company. The Fund commenced operations on January 3, 1989, and seeks high and stable current income consistent with long-term preservation of capital. Risk considerations and investment strategies of the Fund are discussed in the Fund’s Prospectus.
The financial statements have been prepared in conformity with accounting principles generally accepted in the United States of America, which require the use of estimates and assumptions by management. Significant accounting policies are as follows:
Security valuation The Fund’s net assets are valued as of the close of trading on the New York Stock Exchange (NYSE), generally 4:00 p.m. Eastern Time, each day that the NYSE is open for business. Fixed-income securities with original maturities of one year or more are priced on the basis of valuations furnished by pricing services which utilize both dealer-supplied valuations and computerized pricing models. Under certain circumstances, fixed-income securities that are not valued by pricing services are temporarily valued by the investment manager utilizing both dealer-supplied valuations and computerized pricing models. Valuations of fixed-income securities take into account appropriate factors such as institutional-size trading markets in similar groups of securities, yield, quality, coupon rate, maturity, type of issue, trading characteristics and other market data and do not rely exclusively upon exchange or over-the-counter listed prices. Security values are not discounted based on the size of the Fund’s position. Securities for which market quotations are not readily available are valued at fair value as determined in good faith by or at the direction of the Board of Trustees. Short-term securities are valued at amortized cost which approximates current value. All securities held by the Fund are denominated in U.S. dollars.
Security transactions, investment income, expenses, and distributions Security transactions are recorded on the trade date. Realized gains and losses on securities sold are determined on the basis of identified cost.
Interest income is recorded on the accrual basis. Interest income includes coupon interest, amortization of premium and accretion of discount on debt securities, and gains and losses on paydowns of mortgage-backed securities. The ability of the issuers of the debt securities held by the Fund to meet their obligations may be affected by economic developments in a specific industry, state or region. Debt obligations may be placed on non-accrual status and related interest income may be reduced by ceasing current accruals and writing off interest receivables when the collection of all or a portion of interest has become doubtful. A debt obligation is removed from non-accrual status when the issuer resumes interest payments or when collectibility of interest is reasonably assured.
Expenses are recorded on the accrual basis. Most expenses of the Trust can be directly attributed to a specific series. Expenses which cannot be directly attributed are apportioned among the Funds in the Trust.
Distributions to shareholders are recorded on the ex-dividend date.
Repurchase agreements The Fund may enter into repurchase agreements secured by U.S. government securities which involve the purchase of securities from a counterparty with a simultaneous commitment to resell the securities at an agreed-upon date and price. It is the Fund’s policy that its custodian take possession of the underlying collateral securities, the fair value of which exceeds the principal amount of the repurchase transaction, including accrued interest, at all times. In the event of default by the counterparty, the Fund has the contractual right to liquidate the securities and to apply the proceeds in satisfaction of the obligation.
NOTE 2—RELATED PARTY TRANSACTIONS
Management fees Under a written agreement approved by a unanimous vote of the Board of Trustees, the Fund pays an annual management fee of 0.50% of the Fund’s average daily net assets up to $100 million and 0.40% of the Fund’s average daily net assets in excess of $100
| | | | | | |
| | DODGE & COX INCOME FUND n | | PAGE | | 12 |
NOTES TO FINANCIAL STATEMENTS
million to Dodge & Cox, investment manager of the Fund. The agreement further provides that Dodge & Cox shall waive its fee to the extent that such fee plus all other ordinary operating expenses of the Fund exceed 1% of the average daily net assets for the year.
Fund officers and trustees All officers and three of the trustees of the Trust are officers or employees of Dodge & Cox. The Trust pays a fee only to those trustees who are not affiliated with Dodge & Cox.
Indemnification Under the Trust’s organizational documents, its officers and trustees are indemnified against certain liabilities arising out of the performance of their duties to the Trust. In addition, in the normal course of business the Trust enters into contracts that provide general indemnities to other parties. The Trust’s maximum exposure under these arrangements is unknown as this would involve future claims that may be made against the Trust that have not yet occurred.
NOTE 3—INCOME TAX INFORMATION AND DISTRIBUTIONS TO SHAREHOLDERS
A provision for federal income taxes is not required since the Fund intends to continue to qualify as a regulated investment company under Subchapter M of the Internal Revenue Code and distribute all of its taxable income to shareholders. Distributions are determined in accordance with income tax regulations, which may differ from net investment income and realized gains for financial reporting purposes. Financial reporting records are adjusted for permanent book/tax differences to reflect tax character. Financial records are not adjusted for temporary differences.
Book/tax differences are primarily due to differing treatments of net short-term realized gain and paydown loss. At December 31, 2006, the cost of investments for federal income tax purposes was equal to the cost for financial reporting purposes.
Distributions during the year ended December 31, 2006 and 2005 were characterized as follows for federal income tax purposes:
| | | | |
| | | 2006 | | 2005 |
Ordinary income | | $532,395,799 | | $390,586,222 |
| | ($0.616 per share) | | ($0.550 per share) |
| | |
Long-term capital gain | | — | | — |
At December 31, 2006, the tax basis components of distributable earnings were as follows:
| | | | |
Unrealized appreciation | | $ | 153,336,213 | |
Unrealized depreciation | | | (98,301,610 | ) |
| | | | |
Net unrealized appreciation | | | 55,034,603 | |
Undistributed ordinary income | | | 6,896,143 | |
Capital loss carryforward† | | | (106,067,423 | ) |
| † | | Represents accumulated capital loss which may be carried forward to offset future capital gains. This carryforward expires as follows: |
| | | |
Expiring in 2011 | | $ | 14,093,589 |
Expiring in 2012 | | | 32,528,048 |
Expiring in 2013 | | | 19,963,019 |
Expiring in 2014 | | | 39,482,767 |
| | | |
| | $ | 106,067,423 |
| | | |
NOTE 4—PURCHASES AND SALES OF INVESTMENTS
For the year ended December 31, 2006, purchases and sales of securities, other than short-term securities and U.S. government securities, aggregated $1,291,086,014 and $455,876,273, respectively. For the year ended December 31, 2006, purchases and sales of U.S. government securities aggregated $4,150,453,654 and $2,788,640,531, respectively.
NOTE 5—ACCOUNTING PRONOUNCEMENTS
In July 2006, the Financial Accounting Standards Board (FASB) issued Interpretation 48, “Accounting for Uncertainty in Income Taxes” (FIN 48). FIN 48 clarifies the accounting for income taxes by prescribing the minimum recognition threshold a tax position must meet before being recognized in the financial statements. FIN 48 is effective for the Fund beginning June 29, 2007. The impact to the Fund’s financial statements, if any, has not yet been determined.
In September 2006, FASB issued “Statement of Financial Accounting Standards No. 157, Fair Value Measurements” (SFAS 157). SFAS 157 is effective for the Fund beginning January 1, 2008. It defines fair value, establishes a framework for measuring fair value and expands disclosures about fair value measurements. Management is currently evaluating the impact the adoption of SFAS 157 will have on the Fund’s financial statement disclosures.
| | | | |
| PAGE | | 13 n DODGE & COX INCOME FUND | | |
FINANCIAL HIGHLIGHTS
| | | | | | | | | | | | | | | |
SELECTED DATA AND RATIOS (for a share outstanding throughout each year) | | Year Ended December 31, | |
| | | 2006 | | | 2005 | | | 2004 | | | 2003 | | | 2002 | |
Net asset value, beginning of year | | $12.54 | | | $12.84 | | | $12.92 | | | $12.77 | | | $12.20 | |
Income from investment operations: | | | | | | | | | | | | | | | |
Net investment income | | 0.61 | | | 0.55 | | | 0.54 | | | 0.60 | | | 0.66 | |
Net realized and unrealized gain (loss) | | 0.04 | | | (0.30 | ) | | (0.08 | ) | | 0.15 | | | 0.62 | |
| | | | | | | | | | | | | | | |
Total from investment operations | | 0.65 | | | 0.25 | | | 0.46 | | | 0.75 | | | 1.28 | |
| | | | | | | | | | | | | | | |
Distributions to shareholders from: | | | | | | | | | | | | | | | |
Net investment income | | (0.62 | ) | | (0.55 | ) | | (0.54 | ) | | (0.60 | ) | | (0.66 | ) |
Net realized gain | | — | | | — | | | — | | | — | | | (0.05 | ) |
| | | | | | | | | | | | | | | |
Total distributions | | (0.62 | ) | | (0.55 | ) | | (0.54 | ) | | (0.60 | ) | | (0.71 | ) |
| | | | | | | | | | | | | | | |
Net asset value, end of year | | $12.57 | | | $12.54 | | | $12.84 | | | $12.92 | | | $12.77 | |
| | | | | | | | | | | | | | | |
Total return | | 5.30 | % | | 1.98 | % | | 3.64 | % | | 5.97 | % | | 10.75 | % |
Ratios/supplemental data: | | | | | | | | | | | | | | | |
Net assets, end of year (millions) | | $11,972 | | | $9,610 | | | $7,870 | | | $5,697 | | | $3,405 | |
Ratios of expenses to average net assets | | 0.44 | % | | 0.44 | % | | 0.44 | % | | 0.45 | % | | 0.45 | % |
Ratios of net investment income to average net assets | | 4.77 | % | | 3.99 | % | | 3.61 | % | | 3.93 | % | | 5.38 | % |
Portfolio turnover rate | | 30 | % | | 24 | % | | 30 | % | | 41 | % | | 31 | % |
See accompanying Notes to Financial Statements
REPORT OF INDEPENDENT REGISTERED PUBLIC ACCOUNTING FIRM
To the Trustees of Dodge & Cox Funds and Shareholders of Dodge & Cox Income Fund
In our opinion, the accompanying statement of assets and liabilities, including the portfolio of investments, and the related statements of operations and of changes in net assets and the financial highlights present fairly, in all material respects, the financial position of the Dodge & Cox Income Fund (the “Fund”, one of the series constituting Dodge & Cox Funds) at December 31, 2006, the results of its operations for the year then ended, the changes in its net assets for each of the two years in the period then ended and the financial highlights for each of the five years in the period then ended, in conformity with accounting principles generally accepted in the United States of America. These financial statements and financial highlights (hereafter referred to as “financial statements”) are the responsibility of the Fund’s management; our responsibility is to express an opinion on these financial statements based on our audits. We conducted our audits of these financial statements in accordance with the standards of the Public Company Accounting Oversight Board (United States). Those standards require that we plan and perform the audit to obtain reasonable assurance about whether the financial statements are free of material misstatement. An audit includes examining, on a test basis, evidence supporting the amounts and disclosures in the financial statements, assessing the accounting principles used and significant estimates made by management, and evaluating the overall financial statement presentation. We believe that our audits, which included confirmation of securities at December 31, 2006 by correspondence with the custodian and brokers, provide a reasonable basis for our opinion.
PricewaterhouseCoopers LLP
San Francisco, California
February 9, 2007
| | | | | | |
| | DODGE & COX INCOME FUND n | | PAGE | | 14 |
BOARD APPROVAL OF FUNDS’ INVESTMENT MANAGEMENT AGREEMENTS AND MANAGEMENT FEES (unaudited)
The Board of Trustees is responsible for overseeing the performance of the Dodge & Cox Funds’ investment manager and determining whether to continue the Investment Management Agreements between the Funds and Dodge & Cox each year (the “Agreements”). At a meeting of the Board of Trustees of the Trust held on December 14, 2006, the Trustees, by a unanimous vote (including a separate vote of those Trustees who are not “interested persons” (as defined in the Investment Company Act of 1940) (the “Independent Trustees”)), approved the renewal of the Agreements for an additional one-year term through December 31, 2007. During the course of the year, the Board received a wide variety of materials relating to the services provided by Dodge & Cox and the performance of the Funds.
INFORMATION RECEIVED
In advance of the meeting, the Board, including each of the Independent Trustees, requested, received and reviewed materials relating to the Agreements. The Independent Trustees retained Morningstar® to prepare an independent expense and performance summary for each Fund and comparable funds managed by other advisers identified by Morningstar®. The Morningstar® materials included information regarding advisory fee rates, expense ratios, and transfer agency, custodial and distribution expenses, as well as performance comparisons to an appropriate index or combination of indices. The materials reviewed by the Board also included information concerning Dodge & Cox’s profitability, financial results and condition, including advisory fee revenue and separate account advisory fee schedules. The Board additionally considered the Funds’ brokerage commissions, turnover rates and sales and redemption data for the Funds, including “soft dollar” payments made for research benefiting the Funds and other accounts managed by Dodge & Cox, and brokerage commissions and expenses paid by Dodge & Cox. Other aspects of Dodge & Cox’s services to the Funds which were reviewed included compliance and supervision of third-party service
providers (e.g., custodian, fund accountant, transfer agent and state registration administrator), shareholder servicing, accounting and administrative services, web services, the character of non-advisory services, the record of compliance with the Funds’ investment policies and restrictions and the Funds’ Code of Ethics, investment management staffing and biographies, information furnished to investors and shareholders (including the Funds’ prospectus, Statement of Additional Information, shareholder reports, and quarterly reports), and third-party retirement plan administrator reimbursements by Dodge & Cox for the same periods.
The Board received copies of the Agreements and a memorandum from the Independent Legal Counsel to the Independent Trustees, discussing the factors generally regarded as appropriate to consider in evaluating advisory arrangements. The Trust’s Governance Committee, consisting solely of Independent Trustees, met with the Independent Legal Counsel on November 28, 2006 and again on December 14, 2006 to discuss whether to renew the Agreements. The Board, including the Independent Trustees, subsequently concluded that the existing Agreements are fair and reasonable and voted to approve the Agreements.
In considering the Agreements, the Board, including the Independent Trustees, did not identify any single factor or particular information as all-important or controlling. In reaching the decision to approve the Agreements, the Board, which was advised by Independent Legal Counsel, considered the following factors, among others, and reached the conclusions described below.
NATURE, QUALITY, AND EXTENT OF THE SERVICES
The Board considered the nature, quality and extent of portfolio management, administrative and shareholder services performed by Dodge & Cox, including: Dodge & Cox’s established long-term history of care and conscientiousness in the management of the Funds; demonstrated consistency in investment approach and depth, background and experience of the Dodge & Cox Investment Policy Committee, International Investment Policy Committee, Fixed Income Investment Policy
| | | | |
| PAGE | | 15 n DODGE & COX INCOME FUND | | |
Committee and research analysts responsible for managing the Funds; Dodge & Cox’s organizational structure; frequent favorable recognition of Dodge & Cox and the Funds in the media and industry publications; Dodge & Cox’s performance in the areas of compliance, administration and shareholder communication and services, supervision of Fund operations and general oversight of other service providers; favorable peer group comparisons of expense ratios, management fee comparisons, expenses (e.g., transfer agent, custody and other fees and expenses) and asset comparisons and performance and risk summaries prepared independently by Morningstar® and favorable fiduciary grade and “Star” rankings by Morningstar®. The Board also acknowledged Dodge & Cox’s decision to close its institutional equity and balanced separate account business to new accounts and had previously voted, at the recommendation of Dodge & Cox, to close the Stock and Balanced Funds to control the pace of growth. The Board also acknowledged that the services provided by Dodge & Cox are extensive in nature and that Dodge & Cox consistently delivered a high level of service. The Board concluded that it was satisfied with the nature, extent and quality of investment management and other services provided to the Funds by Dodge & Cox.
INVESTMENT PERFORMANCE
The Board considered short-term and long-term investment performance for each Fund (including periods of outperformance or underperformance) as compared to both relevant indices and the performance of such Fund’s peer group. The performance information prepared by Morningstar® and Dodge & Cox demonstrated to the Board a consistent pattern of favorable performance for investors and, in most instances, the Funds have outperformed their peer groups for short and long-term periods. The Board considered that the performance of the Funds is the result of an investment management process that emphasizes a long-term investment horizon, independence, comprehensive research, price discipline and focus. The Board also noted that the strong investment performance delivered by Dodge & Cox to the Funds appeared to be consistent with the performance delivered for other (non-fund) clients of Dodge & Cox.
The Board concluded that Dodge & Cox delivers favorable performance for Fund investors consistent with the long-term investment strategies being pursued by the Funds.
COSTS AND ANCILLARY BENEFITS
Costs of Services to Funds: Fees and Expenses. The Board considered each Fund’s management fee rates and expense ratios relative to industry averages for similar mutual funds and relative to management fees charged by Dodge & Cox to other (non-fund) clients. The Board evaluated the operating structures of the Funds and Dodge & Cox, including the following: Dodge & Cox has a centralized focus on investment management operations and derives revenue solely from management fees; its outsourcing of non-advisory support services to unaffiliated third-party service providers is efficient and less costly to investors; Dodge & Cox does not charge front-end sales commissions or distribution fees and bears all distribution-related costs as well as reimbursements to third-party retirement plan administrators; the Funds receive numerous administrative, regulatory compliance, and shareholder support services from Dodge & Cox without any additional administrative fee; and the fact that the Funds have relatively low transaction costs and portfolio turnover rates. The Board noted that the Funds are substantially below peer group averages in expense ratios and management fee rates. The Board also noted that the range of services under the Agreements is much more extensive than under Dodge & Cox’s separate advisory (non-fund) client agreements, and considered that, when coupled with the greater risks and regulatory burdens associated with the high profile mutual fund business, there is reasonable justification for differences in fee rates charged between the two lines of business. The Board concluded that costs incurred by the Funds for the services they receive (including the management fee paid to Dodge & Cox) are reasonable and that the fees are acceptable based upon the qualifications, experience, reputation and performance of Dodge & Cox and the low overall expense ratios of the Funds.
Profitability and Costs of Services to Dodge & Cox; “Fall-out” Benefits. The Board reviewed reports of Dodge & Cox’s financial position, profitability and estimated overall value, and they considered Dodge &
| | | | | | |
| | DODGE & COX INCOME FUND n | | PAGE | | 16 |
Cox’s overall profitability within its context as a private, employee-owned S-Corporation and relative to the favorable services provided. The Board considered recent increases to Dodge & Cox’s gross revenues, and noted the importance of Dodge & Cox’s profitability—which is derived solely from management fees and does not include other business ventures—to maintain its independence, company culture and ethics, and management continuity. They noted that Dodge & Cox’s profitability is enhanced due to its efficient internal business model, and that the compensation/profit structure at Dodge & Cox is vital for remaining independent and facilitating retention of its management and investment professionals. They also noted that Dodge & Cox has voluntarily limited growth of assets by closing the Stock and Balanced Funds to new investors and by not taking on new equity and balanced institutional separate account clients. The Board noted that these actions were financially disadvantageous to Dodge & Cox, but illustrated a commitment to act in the best interest of existing Fund shareholders and separate account clients. The Board considered potential “fall-out” benefits (including the receipt of research from unaffiliated brokers) that Dodge & Cox might receive in its association with the Funds. The Board also noted the extent of additional administrative services performed by Dodge & Cox for the Funds, and that the magnitude of costs and risks borne by Dodge & Cox in rendering advisory services to the Funds (including risks in the compliance, securities valuation and investment management processes) are continuing to increase. The Board concluded that the profitability of Dodge & Cox’s relationship with the Funds (including fall-out benefits) was fair and reasonable.
THE BENEFIT OF ECONOMIES OF SCALE
The Board considered whether there have been economies of scale with respect to the management of each Fund, whether the Funds have appropriately benefited from any economies of scale, and whether the management fee rate is reasonable in relation to the Fund assets and any economies of scale that may exist. The Board noted that the considerable efficiencies of the Funds’ organization and fee structure have been realized by shareholders at the outset of their investment (i.e.,
from the first dollar), as a result of management fee rates that start lower than industry and many peer group averages and management fees and overall expense ratios that are lower than averages for peer group funds with approximately the same level of assets. Shareholders also realize efficiencies from the outset of their investment due to organizational efficiencies derived from Dodge & Cox’s investment management process and the avoidance of distribution and marketing structures whose costs would ultimately be borne by the Funds. The Board noted that Dodge & Cox’s internal costs of providing investment management, administrative and compliance services to the Funds are continuing to increase. The Board’s decision to renew the Agreements was made after consideration of economies of scale and review of comparable fund expense ratios and historical expense ratio patterns for the Funds. Their review also included consideration of the desirability of adding breakpoints to the Funds’ fee schedules. The Board concluded that the current Dodge & Cox fee structure is fair and reasonable and adequately reflects economies of scale.
CONCLUSION
Based on their evaluation of all material factors and assisted by the advice of Independent Legal Counsel to the Independent Trustees, the Board, including the Independent Trustees, concluded that the advisory fee structure was fair and reasonable, that each Fund was paying a competitive fee for the services provided, that the scope and quality of Dodge & Cox’s services has provided substantial value for Fund shareholders over the long term, and that approval of the Agreements was in the best interests of each Fund and its shareholders.
| | | | |
| PAGE | | 17 n DODGE & COX INCOME FUND | | |
FUND HOLDINGS
The Fund provides a complete list of its holdings four times each fiscal year, as of the end of each quarter. The lists appear in the Fund’s First Quarter, Semi-Annual, Third Quarter and Annual Reports to shareholders. The Fund files the lists with the Securities and Exchange Commission (SEC) on Form N-CSR (second and fourth quarters) and Form N-Q (first and third quarters). Shareholders may view the Funds’ Forms N-CSR and N-Q on the SEC’s website at www.sec.gov. Forms N-CSR and N-Q may also be reviewed and copied at the SEC’s Public Reference Room in Washington, DC. Information regarding the operations of the Public Reference Room may be obtained by 1-202-942-8090 (direct) or
1-800-732-0330 (general SEC number). A complete list of the Fund’s quarter-end holdings is also available at www.dodgeandcox.com on or about 15 days following each quarter end and remains available on the web site until the list is updated in the subsequent quarter.
PROXY VOTING
For a free copy of the Fund’s proxy voting policies and procedures, please call 1-800-621-3979, visit the Fund’s web site at www.dodgeandcox.com or visit the SEC’s web site at www.sec.gov. Information regarding how the Fund voted proxies relating to portfolio securities during the most recent 12-month period ending June 30 is also available at www.dodgeandcox.com or at www.sec.gov.
| | | | | | |
| | DODGE & COX INCOME FUND n | | PAGE | | 18 |
DODGE & COX FUNDS—EXECUTIVE OFFICER & TRUSTEE INFORMATION
| | | | | | |
Name (Age) and
Address* | | Position with Trust
(Year of Election or
Appointment) | | Principal Occupation During Past 5 Years | | Other Directorships Held by Trustees |
| INTERESTED TRUSTEES & OFFICERS |
John A. Gunn (63) | | Chairman and Trustee
(Trustee since 1985) | | Chairman (since 2007), Chief Executive Officer (since 2005) and Director of Dodge & Cox, Portfolio Manager and member of Investment Policy Committee (IPC), Fixed Income Investment Policy Committee (FIIPC) and International Investment Policy Committee (IIPC) | | — |
Kenneth E. Olivier (54) | | President and Trustee
(Trustee since 2005) | | President (since 2005) and Director of Dodge & Cox, Portfolio Manager and member of IPC | | — |
Dana M. Emery (45) | | Vice President and Trustee (Trustee since 1993) | | Executive Vice President (since 2005) and Director of Dodge & Cox, Manager of the Fixed Income Department, Portfolio Manager and member of FIIPC | | — |
| Katherine Herrick Drake (52) | | Vice President (Since 1993) | | Vice President of Dodge & Cox, Portfolio Manager | | — |
| Diana S. Strandberg (47) | | Vice President
(Since 2005) | | Vice President of Dodge & Cox, Portfolio Manager and member of IPC and IIPC | | |
John M. Loll (40) | | Assistant Treasurer and Assistant Secretary (Since 2000) | | Vice President and Treasurer of Dodge & Cox | | — |
| David H. Longhurst (49) | | Treasurer
(Since 2006) | | Fund Administration and Accounting Senior Manager of Dodge & Cox (since 2004); Vice President, Treasurer, Controller and Secretary of Safeco Mutual Funds, Safeco Asset Management Company, Safeco Services, Safeco Securities, and Safeco Investment Services (2000-2004) | | — |
| Thomas M. Mistele (53) | | Secretary and Assistant Treasurer (Since 2000) | | Chief Operating Officer (since 2004), Director (since 2005), Secretary and General Counsel of Dodge & Cox | | — |
| Marcia P. Venegas (38) | | Chief Compliance Officer
(Since 2004) | | Chief Compliance Officer of Dodge & Cox (since 2005), Compliance Officer of Dodge & Cox (2003-2004); Compliance and Business Risk Manager of Deutsche Asset Management, Australia Limited (1999-2001) | | — |
| INDEPENDENT TRUSTEES |
William F. Ausfahl (66) | | Trustee (Since 2002) | | CFO, The Clorox Co. (1982-1997); Director, The Clorox Co. (1984-1997) | | — |
L. Dale Crandall (65) | | Trustee (Since 1999) | | President, Kaiser Foundation Health Plan, Inc. and Kaiser Foundation Hospitals (2000-2002); Senior Vice President—Finance and Administration & CFO, Kaiser Foundation Health Plan, Inc. and Kaiser Foundation Hospitals (1998-2000) | | Director, Union BanCal Corporation (bank holding company) and Union Bank of California (commercial bank) (2001-Present); Director, Covad Communications Group (broadband communications services) (2002-Present); Director, Ansell Limited (medical equipment and supplies) (2002-Present); Director, BEA Systems, Inc. (software and programming) (2003-Present); Director, Coventry Health Care, Inc. (managed healthcare) (2004-Present) |
Thomas A. Larsen (57) | | Trustee (Since 2002) | | Director in Howard, Rice, Nemerovski, Canady, Falk & Rabkin (law firm) | | — |
John B. Taylor (61) | | Trustee (Since 2005) | | Professor of Economics, Stanford University; Senior Fellow, Hoover Institution; Under Secretary for International Affairs, United States Treasury (2001-2005) | | — |
Will C. Wood (67) | | Trustee (Since 1992) | | Principal, Kentwood Associates, Financial Advisers | | Director, Banco Latinoamericano de Exportaciones S.A. (Latin American Foreign Trade Bank) (1999-Present) |
| * | | The address for each Officer and Trustee is 555 California Street, 40th Floor, San Francisco, California 94104. Each Officer and Trustee oversees all four series in the Dodge & Cox Funds complex and serves for an indefinite term. |
Additional information about the Trust’s Trustees and Officers is available in the Trust’s Statement of Additional Information (SAI). You can get a free copy of the SAI by visiting the Fund’s website at www.dodgeandcox.com or calling 1-800-621-3979.
| | | | |
| PAGE | | 19 n DODGE & COX INCOME FUND | | |
A code of ethics, as defined in Item 2 of Form N-CSR, adopted by the registrant and applicable to the registrant’s principal executive officer and principal financial officer, is filed as an exhibit to this Form N-CSR. No substantive amendments were approved or waivers were granted to this code of ethics during the period covered by this report.
| ITEM 3. | AUDIT COMMITTEE FINANCIAL EXPERT. |
The Board of Trustees of the registrant has determined that William F. Ausfahl and L. Dale Crandall, members of the registrant’s Audit and Compliance Committee, are each an “audit committee financial expert” and are “independent,” as defined in Item 3 of Form N-CSR.
| ITEM 4. | PRINCIPAL ACCOUNTANT FEES AND SERVICES. |
(a) – (d) Aggregate fees billed to the registrant for the fiscal years ended December 31, 2006 and December 31, 2005 for professional services rendered by the registrant’s principal accountant were as follows:
| | | | | | |
| | | 2006 | | 2005 |
Audit Fees | | $ | 179,550 | | $ | 179,550 |
Audit-Related Fees | | | 19,030 | | | 18,000 |
Tax Fees | | | 66,450 | | | 58,000 |
All Other Fees | | | — | | | — |
Audit fees include amounts related to the audit of the registrant’s annual financial statements and services normally provided by the accountant in connection with statutory and regulatory filings. Audit-related fees include the performance of agreed-upon procedures related to the registrant’s semi-annual financial statements and internal controls. Tax fees include amounts related to tax advice and tax return preparation, compliance, and reviews.
(e)(1) The registrant’s Audit and Compliance Committee has adopted policies and procedures (“Policies”) which require the registrant’s Audit and Compliance Committee to pre-approve all audit and non-audit services provided by the principal accountant to the registrant. The policies also require the Audit and Compliance Committee to pre-approve any engagement of the principal accountant to provide non-audit services to the registrant’s investment adviser, if the services directly impact the registrant’s operations and controls. The Policies do not apply in the case of audit services that the principal accountant provides to the registrant’s adviser. If a service (other than the engagement of the principal accountant to audit the registrant’s financial statements) is required to be pre-approved under the Policies between regularly scheduled Audit and Compliance Committee meetings, pre-approval may be authorized by a designated Audit and Compliance Committee member with ratification at the next scheduled Audit and Compliance Committee meeting.
(e)(2) No services included in (b) – (d) above were approved pursuant to paragraph (c)(7)(i)(C) of Rule 2-01 of Regulation S-X.
(f) Less than 50 percent of the hours expended on the principal accountant’s engagement to audit the registrant’s financial statements for the most recent fiscal year were attributed to work performed by persons other than the principal accountant’s full-time, permanent employees.
(g) For the fiscal years ended December 31, 2006 and December 31, 2005, the aggregate fees billed by the registrant’s principal accountant for non-audit services rendered to the registrant, for non-audit services rendered to the registrant’s investment adviser, and for non-audit services rendered to entities controlled by the adviser were $428,000 and $181,000, respectively.
(h) All non-audit services described under (g) above that were not pre-approved by the registrant’s Audit and Compliance Committee were considered by the registrant’s Audit and Compliance Committee and found to be compatible with maintaining the principal accountant’s independence.
| ITEM 5. | AUDIT COMMITTEE OF LISTED REGISTRANTS. |
Not applicable.
| ITEM 6. | SCHEDULE OF INVESTMENTS. |
Not applicable. The complete schedule of investments is included in Item 1 of this Form N-CSR.
| ITEM 7. | DISCLOSURE OF PROXY VOTING POLICIES AND PROCEDURES FOR CLOSED-END MANAGEMENT INVESTMENT COMPANIES. |
Not applicable.
| ITEM 8. | PORTFOLIO MANAGERS OF CLOSED-END MANAGEMENT INVESTMENT COMPANIES. |
Not applicable.
| ITEM 9. | PURCHASES OF EQUITY SECURITIES BY CLOSED-END MANAGEMENT INVESTMENT COMPANY AND AFFILIATED PURCHASERS. |
Not applicable.
| ITEM 10. | SUBMISSION OF MATTERS TO A VOTE OF SECURITY HOLDERS. |
The registrant has adopted the following procedures by which shareholders may recommend nominees to the registrant’s Board of Trustees.
1. The shareholder must submit any such recommendation in writing to the registrant to the attention of the Secretary at the address of the principal executive offices of the registrant. The shareholder’s recommendation is then considered by the registrant’s Nominating Committee.
2. The shareholder recommendation must include:
(i) A statement in writing setting forth (a) the name, date of birth, business address and residence address of the person recommended by the shareholder (the “candidate”); and (b) whether the recommending shareholder believes that the candidate is or will be an “interested person” of the registrant (as defined in the Investment Company Act of 1940) and, if not an “interested person,” information regarding the candidate that will be sufficient for the registrant to make such determination and, if applicable, similar information regarding whether the candidate would satisfy the standards for independence of a Board member under listing standards of the New York Stock Exchange or other applicable securities exchange.
(ii) The written and manually signed consent of the candidate to be named as a nominee and to serve as a Trustee if elected;
(iii) The recommending shareholder’s name as it appears on the registrant’s books and the number of all shares of the registrant owned beneficially and of record by the recommending shareholder (as evidenced to the Nominating Committee’s satisfaction by a recent brokerage or account statement); and
(iv) A description of all arrangements or understandings between the recommending shareholder and the candidate and any other person or persons (including their names) pursuant to which the recommendation is being made by the recommending shareholder.
In addition, the Nominating Committee may require the candidate to furnish such other information as it may reasonably require or deem necessary to determine the eligibility of such candidate to serve on the Board or to satisfy applicable law and information regarding the candidate that would be required to be disclosed if the candidate were a nominee in a proxy statement or other filing required to be made in connection with solicitation of proxies for election of Trustees.
| ITEM 11. | CONTROLS AND PROCEDURES. |
(a) An evaluation was performed within 90 days of the filing of this report, under the supervision and with the participation of the registrant’s management, including the principal executive officer and principal financial officer, of the effectiveness of the design and operation of the registrant’s disclosure controls and procedures. Based on that evaluation, the principal executive officer and principal financial officer concluded that the registrant’s disclosure controls and procedures were effective.
(b) The registrant‘s principal executive officer and principal financial officer are aware of no changes in the registrant‘s internal control over financial reporting that occurred during the second fiscal quarter of the period covered by this report that has materially affected, or is reasonably likely to materially affect, the registrant’s internal control over financial reporting.
(a)(1) The registrant‘s code of ethics pursuant to Item 2 of Form N-CSR is attached. (EX.99A)
(a)(2) Certifications pursuant to Section 302 of the Sarbanes-Oxley Act of 2002 are attached. (EX.99B)
(a)(3) Not applicable.
(b) Certifications pursuant to Section 906 of the Sarbanes-Oxley Act of 2002 are attached. (EX.99C)
SIGNATURES
Pursuant to the requirements of the Securities Exchange Act of 1934 and the Investment Company Act of 1940, the registrant has duly caused this report to be signed on its behalf by the undersigned, thereunto duly authorized.
| | |
| DODGE & COX FUNDS |
| |
| By | | /S/ JOHN A. GUNN |
| | John A. Gunn Chairman – Principal Executive Officer |
Date February 23, 2007
Pursuant to the requirements of the Securities Exchange Act of 1934 and the Investment Company Act of 1940, this report has been signed below by the following persons on behalf of the registrant and in the capacities and on the dates indicated.
| | |
| DODGE & COX FUNDS |
| |
| By | | /S/ JOHN A. GUNN |
| | John A. Gunn Chairman – Principal Executive Officer |
| | |
| |
| By | | /S/ DAVID H. LONGHURST |
| | David H. Longhurst Treasurer – Principal Financial Officer |
Date February 23, 2007