UNITED STATES
SECURITIES AND EXCHANGE COMMISSION
Washington, D.C. 20549
FORM N-CSR
CERTIFIED SHAREHOLDER REPORT OF REGISTERED
MANAGEMENT INVESTMENT COMPANIES
Investment Company Act file number 811-173
DODGE & COX FUNDS
(Exact name of registrant as specified in charter)
| | |
555 California Street, 40th Floor San Francisco, CA | | 94104 |
| (Address of principal executive offices) | | (Zip code) |
Thomas M. Mistele, Esq.
555 California Street, 40th Floor
San Francisco, CA 94104
(Name and address of agent for service)
Registrant’s telephone number, including area code: 415-981-1710
Date of fiscal year end: DECEMBER 31, 2005
Date of reporting period: DECEMBER 31, 2005
Form N-CSR is to be used by management investment companies to file reports with the Commission not later than 10 days after the transmission to stockholders of any report that is required to be transmitted to stockholders under Rule 30e-1 under the Investment Company Act of 1940 (17 CFR 270.30e-1). The Commission may use the information provided on Form N-CSR in its regulatory, disclosure review, inspection, and policymaking roles.
A registrant is required to disclose the information specified by Form N-CSR, and the Commission will make this information public. A registrant is not required to respond to the collection of information contained in Form N-CSR unless the Form displays a currently valid Office of Management and Budget (“OMB”) control number. Please direct comments concerning the accuracy of the information collection burden estimate and any suggestions for reducing the burden to Secretary, Securities and Exchange Commission, 450 Fifth Street, NW, Washington, DC 20549-0609. The OMB has reviewed this collection of information under the clearance requirements of 44 U.S.C. ss. 3507.
ITEM 1. REPORTS TO STOCKHOLDERS.
The following are the December 31, 2005 annual reports for the Dodge & Cox Funds, a Delaware statutory trust, consisting of four series: Dodge & Cox Stock Fund, Dodge & Cox International Stock Fund, Dodge & Cox Balanced Fund and Dodge & Cox Income Fund. The reports of each series were transmitted to their respective shareholders on February 21, 2006.

Stock Fund
Established 1965
(Closed to New Investors)

41st Annual Report
December 31, 2005
2005
Stock Fund
www.dodgeandcox.com
For Fund literature, transactions and account
information, please visit the Funds’ web site.
or write or call:
Dodge & Cox Funds
c/o Boston Financial Data Services
P.O. Box 8422
Boston, Massachusetts 02266-8422
(800) 621-3979
Investment Manager
Dodge & Cox
555 California Street, 40th Floor
San Francisco, California 94104
(415) 981-1710
This report is submitted for the general information of the shareholders of the Fund. The report is not authorized for distribution to prospective investors in the Fund unless it is accompanied by a current prospectus.
This report reflects our views, opinions and portfolio holdings as of December 31, 2005, the end of the reporting period. Any such views are subject to change at any time based upon market or other conditions and Dodge & Cox disclaims any responsibility to update such views. These views may not be relied on as investment advice and, because investment decisions for a Dodge & Cox Fund are based on numerous factors, may not be relied on as an indication of trading intent on behalf of any Dodge & Cox Fund.
12/05 SF AR  Printed on recycled paper
To Our Shareholders
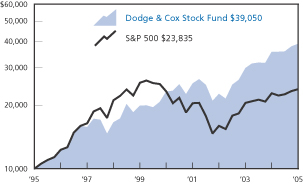
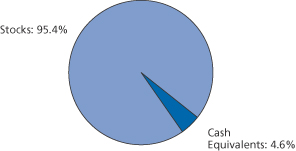
We are pleased to report that 2005 was the sixth consecutive year that the Dodge & Cox Stock Fund outperformed the Standard & Poor’s 500 (S&P 500) Index. For 2005, the Fund returned 9.4% compared to 4.9% for the S&P 500. At year end, the Fund had net assets of $52.2 billion with a cash position of 4.6%.
The table on page two shows the Fund’s longer-term results compared to the S&P 500. As we have written in past letters, the Fund’s favorable five-year annualized return of 11.0%, versus 0.6% for the S&P 500, is largely the product of decisions made to avoid the “growth” stock speculation that reached its crescendo in the spring of 2000. The ten-year annualized return incorporates the late 1990s when the Fund underperformed the S&P 500 as growth stock valuations ascended.
As investors in the Fund, you should understand that while we are cautiously optimistic about the potential for the Fund’s current investments, we do not expect these favorable long-term returns relative to the S&P 500 to be repeated.
Looking Back
During the late 1990s, investors were concerned about weak global demand for commodities and other industrial goods. As a result, the Fund was able to become a part owner of a number of Energy, Materials, and Industrials businesses at discount prices. In contrast, fascination with the internet led other investors to bid up valuations of Technology and Telecommunications stocks. At the peak of the internet stock mania in December 1999, the Fund had 27% of its assets invested in Energy and Materials stocks.
Energy stocks in particular have been strong contributors to the Fund’s recent performance. In 2005, as the price for a barrel of oil rose from $43 to $61, the Fund’s Energy holdings were up over 30% as a group (e.g., Amerada Hess up 56%, Unocal up 55% and ConocoPhillips up 37%). Over the past couple of years, as investors have become more optimistic about the continued strong global demand for oil and commodities and energy company valuations have risen, we have found what we believe to be more compelling opportunities in other areas of the market. As a consequence, we have been reducing the Fund’s exposure to Energy and Materials stocks, which now represent just under 15% of the Fund.
The Fund’s performance also benefited from its Technology holdings, which were up 11% as a group (e.g., Hewlett-Packard up 38% and Motorola up 32%) compared to 1% for the S&P 500 sector. Other holdings contributing to the Fund’s 2005 return included Rio Tinto (up 57%), WellPoint (up 39%) and HCA (up 28%).
On a negative note, as we detailed last quarter, we sold the Fund’s investment in Delphi (at a loss of 96% of its value from the beginning of 2005) after the company filed for bankruptcy in early October. Delphi illustrates that we do make mistakes, although we continually strive to learn from them. Delphi also illustrates the importance of portfolio diversification, as no single investment’s poor performance weighs too heavily on total results.
Looking Forward
Over the past six years the investment landscape has changed, and we now face a new set of opportunities. We are encouraged about the road ahead because 1) the range of valuations in the equity market has compressed dramatically, meaning investors no longer have to pay large premiums to own companies with attractive long-term growth prospects; and 2) the global economy continues to expand rapidly, meaning millions of consumers, particularly from the developing world, are gaining more purchasing power.
As valuations within the equity market have narrowed, we have made new investments, one stock at a time, in areas that were once considered “growth” segments of the market: Technology, Media, Telecommunications and Healthcare. As of year end, 39% of the Fund was invested in these industries, compared to only 16% six years ago. Valuations moved lower during 2005 in many Media and Pharmaceutical stocks, and the Fund’s investments in these areas were particularly weak. For instance, Comcast was down 22%, News Corp. was down 16%, Time Warner was down 10%, and Pfizer was down 11%. We continue to believe the long-term prospects for these companies are favorable, and we added to the Fund’s holdings as the share price decreased in value throughout the year.
As the global economy continues to integrate and an increasing number of countries adopt free-market capitalistic policies, it becomes less important where a company is domiciled and more important where a company competes. Moreover, U.S.-based companies are becoming increasingly dependent on the global economy for growth. For example, 37 of the Fund’s U.S.-based holdings, representing over 40% of the Fund, derive at least one-quarter of their revenues from outside of North America. A global research perspective is paramount. Over the past ten years we have dramatically increased our coverage of foreign companies, and in 2001 established our International Stock Fund, confirming our investment team’s global view. In addition to the U.S. companies with foreign sales, 18% of the Fund is now invested in 15 multinational companies based outside the U.S.
While the investment landscape has changed over the past six years, Dodge & Cox has not. The nine people on our Investment Policy
| | |
| 1 / Dodge & Cox Stock Fund | | |
Committee who manage the Fund have an average tenure at Dodge & Cox of 23 years, and employ the same investment philosophy our firm has used since the 1930s. Our Investment Policy Committee and our team of 20 global industry analysts manage the Fund by first asking a basic question: Do we want to become part owner of a company for the next three-to-five years, given its current price and our assessment of the probable cash flow and earnings growth over the long term?
Our optimism about the new opportunities presented by the expanding global economy and by lower valuations in former “growth” stocks is tempered somewhat by the fact that most companies are operating very efficiently as evidenced by historically high profit margins. Profitability tends to be cyclical, so there is a risk that margins will eventually decrease. The potential for higher inflation and interest rates also gives us pause, but we are optimistic that, while there will undoubtedly be potholes along the way, over the long-term the Fund is well positioned. In our rapidly changing and increasingly complex world, we will continue our efforts to uncover attractive investment opportunities.
In Closing
We welcome back John Taylor as an Independent Trustee of the Dodge & Cox Funds. Mr. Taylor was elected at the Special Meeting of Shareholders on December 2nd and previously served on the Board from January 1998 until March 2001, prior to his 2001 appointment as Under Secretary of the U.S. Treasury for International Affairs.
We are also pleased to announce that on December 31st, John Gunn became Chief Executive Officer of Dodge & Cox. Harry Hagey, the firm’s Chairman and Chief Executive Officer since 1992, will continue to serve as Chairman of the Board and as a member of the Investment Policy Committee until his retirement at the end of 2006. Also on December 31st, longstanding Dodge & Cox employees Ken Olivier and Dana Emery were named the firm’s President and Executive Vice President, respectively.
Thank you for the continued confidence you have placed in our firm as a shareholder of the Stock Fund. As always, we welcome your comments and questions.
For the Board of Trustees,
| | |
 | | 
|
| |
| Harry R. Hagey, Chairman | | John A. Gunn, President |
February 16, 2006
Growth of $10,000 Over 10 Years
For an investment made on December 31, 1995
Average Annual Total Return
for periods ended December 31, 2005
| | | | | | | | | | | | |
| | | 1 Year | | | 5 Years | | | 10 Years | | | 20 Years | |
Dodge & Cox Stock Fund | | 9.36 | % | | 11.03 | % | | 14.59 | % | | 14.81 | % |
S&P 500 | | 4.92 | | | 0.55 | | | 9.08 | | | 11.94 | |
Past performance does not guarantee future results. Investment return and share price will fluctuate with market conditions, and investors may have a gain or loss when shares are sold. Mutual fund performance changes over time and currently may be significantly lower than stated above. Performance is updated and published monthly. Visit the Fund’s web site at www.dodgeandcox.com or call 1-800-621-3979 for current performance figures.
The Fund’s total returns include the reinvestment of dividend and capital gain distributions, but have not been adjusted for any income taxes payable by shareholders on these distributions. The Standard & Poor’s 500 (S&P 500) is a broad-based unmanaged measure of common stocks. Index returns include dividends and/or interest income and, unlike Fund returns, do not reflect fees or expenses.
Standard & Poor’s, Standard & Poor’s 500, and S&P 500® are trademarks of The McGraw-Hill Companies, Inc.
| | |
| | | Dodge & Cox Stock Fund / 2 |
Fund Expense Example
As a Fund shareholder, you incur ongoing Fund costs, including management fees and other Fund expenses. All mutual funds have ongoing costs, sometimes referred to as operating expenses.
The following example shows ongoing costs of investing in the Fund and can help you understand these costs and compare them with those of other mutual funds. The example assumes a $1,000 investment held for the six months indicated.
Actual Expenses
The first line of the table below provides information about actual account values and expenses based on the Fund’s actual returns. You may use the information in this line, together with your account balance, to estimate the expenses that you paid over the period. Simply divide your account value by $1,000 (for example, an $8,600 account value divided by $1,000 = 8.6), then multiply the result by the number in the first line under the heading “Expenses Paid During Period” to estimate the expenses you paid on your account during this period.
Hypothetical Example for Comparison with Other Mutual Funds
Information on the second line of the table can help you compare ongoing costs of investing in the Fund with those of other mutual funds. This information may not be used to estimate the actual ending account balance or expenses you paid during the period. The hypothetical “Ending Account Value” is based on the actual expense ratio of the Fund and an assumed 5% annual rate of return before expenses (not the Fund’s actual return). The amount under the heading “Expense Paid During the Period” shows the hypothetical expenses your account would have incurred under this scenario. You can compare this figure with the 5% hypothetical examples that appear in shareholder reports of other mutual funds.
| | | | | | | | | |
Six Months Ended
December 31, 2005 | | Beginning Account
Value 7/1/2005 | | Ending Account
Value 12/31/2005 | | Expenses Paid
During Period* |
Based on Actual Fund Return | | $ | 1,000.00 | | $ | 1,086.40 | | $ | 2.71 |
Based on Hypothetical 5% Yearly Return | | | 1,000.00 | | | 1,022.60 | | | 2.63 |
| * | | Expenses are equal to the Fund’s annualized six-month expense ratio of 0.52%, multiplied by the average account value over the period, multiplied by 184/365 (to reflect the one-half year period). |
The expenses shown in the table highlight ongoing costs only and do not reflect any transactional costs or account maintenance fees. While other mutual funds may charge such fees, please note that the Fund does not charge transaction fees (e.g., redemption fees, sales loads) or universal account maintenance fees (e.g., small account fees).
| | |
| 3 / Dodge & Cox Stock Fund | | |
Fund Information | December 31, 2005 |
General Information
| | |
Net Asset Value Per Share | | $137.22 |
Total Net Assets (millions) | | $52,184 |
2005 Expense Ratio | | 0.52% |
2005 Portfolio Turnover | | 12% |
30-Day SEC Yield1 | | 1.24% |
Fund Inception | | 1965 |
Investment Manager: Dodge & Cox, San Francisco. Managed by the Investment Policy Committee, whose nine members’ average tenure at Dodge & Cox is 23 years.
| | | | |
| Stock Characteristics | | Fund | | S&P 500 |
Number of Stocks | | 86 | | 500 |
Median Market Capitalization (billions) | | $20 | | $11 |
Weighted-Avg. Market Capitalization (billions) | | $53 | | $90 |
Price-to-Earnings Ratio2 | | 15.0x | | 15.4x |
Price-to-Book Value Ratio | | 2.0x | | 2.8x |
Foreign Stocks3 (% of Fund) | | 17.7% | | 0.0% |
| | | |
| Ten Largest Holdings4 | | % of Fund | |
Hewlett-Packard Co. | | 3.6 | |
Sony Corp. ADR (Japan) | | 2.8 | |
Comcast Corp. Class A | | 2.7 | |
Cardinal Health, Inc. | | 2.7 | |
News Corp. Class A | | 2.6 | |
Time Warner, Inc. | | 2.5 | |
McDonald’s Corp. | | 2.4 | |
Matsushita Electric Industrial Co., Ltd. ADR (Japan) | | 2.3 | |
Pfizer, Inc. | | 2.3 | |
FedEx Corp. | | 2.3 | |
Asset Allocation
| | | | | | |
| Sector Diversification | | Fund | | | S&P 500 | |
Consumer Discretionary | | 20.0 | % | | 10.8 | % |
Financials | | 17.8 | | | 21.3 | |
Health Care | | 15.7 | | | 13.3 | |
Information Technology | | 13.9 | | | 15.1 | |
Energy | | 7.8 | | | 9.3 | |
Materials | | 6.9 | | | 3.0 | |
Industrials | | 6.9 | | | 11.3 | |
Consumer Staples | | 3.7 | | | 9.5 | |
Utilities | | 1.7 | | | 3.4 | |
Telecommunication Services | | 1.0 | | | 3.0 | |
| 1 | | SEC Yield is an annualization of the Fund’s total net investment income per share for the 30-day period ended on the last day of the month. |
| 2 | | The Fund’s price-to-earnings (P/E) ratio is calculated using Dodge & Cox’s estimated forward earnings and excludes extraordinary items. The S&P 500’s P/E ratio is calculated by Standard & Poor’s and uses an aggregated estimate of forward earnings. |
| 3 | | Foreign stocks are U.S. dollar-denominated. |
| 4 | | The Fund’s portfolio holdings are subject to change without notice. The mention of specific securities is not a recommendation or solicitation for any person to buy, sell or hold any particular security. |
| | |
| | | Dodge & Cox Stock Fund / 4 |
Portfolio of Investments | December 31, 2005 |
| | | | | |
| COMMON STOCKS: 95.4% |
| | |
| | | SHARES | | VALUE |
| CONSUMER DISCRETIONARY: 20.0% |
| AUTOMOBILES & COMPONENTS: 0.4% |
Honda Motor Co., Ltd. ADR(b) (Japan) | | 8,146,800 | | $ | 236,012,796 |
| | | | |
|
|
| CONSUMER DURABLES & APPAREL: 6.4% |
Matsushita Electric Industrial Co., Ltd. ADR(b) (Japan) | | 62,940,700 | | | 1,219,790,766 |
Sony Corp. ADR(b) (Japan) | | 36,255,200 | | | 1,479,212,160 |
Thomson ADR(b) (France) | | 6,184,000 | | | 129,492,960 |
VF Corp. | | 3,457,200 | | | 191,321,448 |
Whirlpool Corp.(c) | | 3,558,750 | | | 298,080,900 |
| | | | |
|
|
| | | | | | 3,317,898,234 |
| CONSUMER SERVICES: 2.4% |
McDonald’s Corp. | | 36,718,900 | | | 1,238,161,308 |
| | | | |
|
|
| MEDIA: 8.7% |
Comcast Corp. Class A(a) | | 54,998,130 | | | 1,427,751,455 |
Discovery Holdings Co. Series A(a) | | 3,339,960 | | | 50,600,394 |
Interpublic Group of Companies, Inc.(a) | | 17,478,300 | | | 168,665,595 |
Liberty Media Corp. Series A(a) | | 33,399,600 | | | 262,854,852 |
News Corp. Class A | | 85,465,238 | | | 1,328,984,451 |
Time Warner, Inc. | | 73,800,400 | | | 1,287,078,976 |
| | | | |
|
|
| | | | | | 4,525,935,723 |
| RETAILING: 2.1% |
Dillard’s, Inc. Class A(c) | | 5,161,600 | | | 128,110,912 |
Federated Department Stores, Inc. | | 5,556,973 | | | 368,594,019 |
Gap, Inc. | | 12,344,900 | | | 217,764,036 |
Genuine Parts Co.(c) | | 8,926,300 | | | 392,043,096 |
| | | | |
|
|
| | | | | | 1,106,512,063 |
| | | | |
|
|
| | | | | | 10,424,520,124 |
| CONSUMER STAPLES: 3.7% |
| FOOD & STAPLES RETAILING: 2.0% |
Wal-Mart Stores, Inc. | | 22,400,000 | | | 1,048,320,000 |
| | | | |
|
|
| FOOD, BEVERAGE & TOBACCO: 1.7% |
Unilever NV(b) (Netherlands) | | 12,675,300 | | | 870,159,345 |
| | | | |
|
|
| | | | | | 1,918,479,345 |
| ENERGY: 7.8% |
Amerada Hess Corp. | | 2,699,400 | | | 342,337,908 |
Baker Hughes, Inc. | | 9,687,850 | | | 588,827,523 |
Chevron Corp. | | 18,988,305 | | | 1,077,966,075 |
ConocoPhillips | | 11,452,100 | | | 666,283,178 |
Occidental Petroleum Corp. | | 5,137,200 | | | 410,359,536 |
Royal Dutch Shell PLC ADR(b)
(United Kingdom) | | 10,407,864 | | | 671,619,464 |
Schlumberger, Ltd. | | 3,160,600 | | | 307,052,290 |
| | | | |
|
|
| | | | | | 4,064,445,974 |
| | | | | |
| | |
| | | SHARES | | VALUE |
| FINANCIALS: 17.8% |
| BANKS: 3.7% |
Golden West Financial Corp. | | 8,871,200 | | $ | 585,499,200 |
Wachovia Corp. | | 18,149,200 | | | 959,366,712 |
Wells Fargo & Co. | | 6,028,000 | | | 378,739,240 |
| | | | |
|
|
| | | | | | 1,923,605,152 |
| DIVERSIFIED FINANCIALS: 4.8% |
Capital One Financial Corp. | | 11,992,500 | | | 1,036,152,000 |
CIT Group, Inc. | | 5,381,200 | | | 278,638,536 |
Citigroup, Inc. | | 15,165,600 | | | 735,986,568 |
JPMorgan Chase & Co. | | 11,282,328 | | | 447,795,598 |
| | | | |
|
|
| | | | | | 2,498,572,702 |
| INSURANCE: 7.3% |
Aegon NV(b) (Netherlands) | | 34,471,146 | | | 562,569,103 |
Chubb Corp. | | 5,721,050 | | | 558,660,533 |
Genworth Financial, Inc. Class A | | 8,842,000 | | | 305,756,360 |
Loews Corp. | | 7,495,800 | | | 710,976,630 |
MBIA, Inc. | | 1,761,600 | | | 105,977,856 |
Safeco Corp. | | 5,043,000 | | | 284,929,500 |
St. Paul Travelers Companies, Inc. | | 22,736,350 | | | 1,015,632,754 |
UnumProvident Corp. | | 11,712,700 | | | 266,463,925 |
| | | | |
|
|
| | | | | | 3,810,966,661 |
| REAL ESTATE: 2.0% |
Equity Office Properties Trust(c) | | 23,332,200 | | | 707,665,626 |
Equity Residential Properties Trust | | 8,810,600 | | | 344,670,672 |
| | | | |
|
|
| | | | | | 1,052,336,298 |
| | | | |
|
|
| | | | | | 9,285,480,813 |
| HEALTH CARE: 15.7% |
| HEALTH CARE EQUIPMENT & SERVICES: 7.4% |
Becton, Dickinson & Co. | | 4,209,350 | | | 252,897,748 |
Cardinal Health, Inc. | | 20,444,350 | | | 1,405,549,062 |
HCA, Inc.(c) | | 20,475,800 | | | 1,034,027,900 |
Thermo Electron Corp.(a),(c) | | 8,906,800 | | | 268,361,884 |
WellPoint, Inc.(a) | | 11,576,200 | | | 923,664,998 |
| | | | |
|
|
| | | | | | 3,884,501,592 |
| PHARMACEUTICALS & BIOTECHNOLOGY: 8.3% |
Bristol-Myers Squibb Co. | | 12,480,150 | | | 286,793,847 |
GlaxoSmithKline PLC ADR(b) (United Kingdom) | | 13,158,300 | | | 664,230,984 |
Pfizer, Inc. | | 51,884,325 | | | 1,209,942,459 |
Sanofi-Aventis ADR(b) (France) | | 23,568,500 | | | 1,034,657,150 |
Schering-Plough Corp. | | 30,442,000 | | | 634,715,700 |
Wyeth | | 10,835,400 | | | 499,186,878 |
| | | | |
|
|
| | | | | | 4,329,527,018 |
| | | | |
|
|
| | | | | | 8,214,028,610 |
| | |
| 5 / Dodge & Cox Stock Fund | | See accompanying Notes to Financial Statements |
Portfolio of Investments | December 31, 2005 |
| | | | | |
| COMMON STOCKS (continued) |
| | |
| | | SHARES | | VALUE |
| INDUSTRIALS: 6.9% |
| CAPITAL GOODS: 1.8% |
AB Volvo ADR(b) (Sweden) | | 3,349,900 | | $ | 157,713,292 |
American Power Conversion Corp. | | 6,347,281 | | | 139,640,182 |
Fluor Corp.(c) | | 4,362,050 | | | 337,011,983 |
Masco Corp. | | 9,481,600 | | | 286,249,504 |
| | | | |
|
|
| | | | | | 920,614,961 |
| COMMERCIAL SERVICES & SUPPLIES: 0.5% |
Pitney Bowes, Inc. | | 6,793,850 | | | 287,040,163 |
| | | | |
|
|
| TRANSPORTATION: 4.6% |
FedEx Corp. | | 11,551,800 | | | 1,194,340,602 |
Union Pacific Corp.(c) | | 14,815,250 | | | 1,192,775,777 |
| | | | |
|
|
| | | | | | 2,387,116,379 |
| | | | |
|
|
| | | | | | 3,594,771,503 |
| INFORMATION TECHNOLOGY: 13.9% |
| SEMICONDUCTORS & SEMICONDUCTOR EQUIPMENT: 0.3% |
Freescale Semiconductor, Inc. Class A(a) | | 5,964,300 | | | 150,240,717 |
Freescale Semiconductor, Inc. Class B(a) | | 1,616,547 | | | 40,688,488 |
| | | | |
|
|
| | | | | | 190,929,205 |
| SOFTWARE & SERVICES: 3.8% |
BMC Software, Inc.(a),(c) | | 15,440,000 | | | 316,365,600 |
Computer Sciences Corp.(a),(c) | | 12,853,900 | | | 650,921,496 |
Compuware Corp.(a),(c) | | 19,297,600 | | | 173,099,472 |
Electronic Data Systems Corp.(c) | | 34,697,300 | | | 834,123,092 |
| | | | |
|
|
| | | | | | 1,974,509,660 |
| TECHNOLOGY, HARDWARE & EQUIPMENT: 9.8% |
Avaya, Inc.(a),(c) | | 31,552,500 | | | 336,665,175 |
Hewlett-Packard Co. | | 65,824,063 | | | 1,884,542,924 |
Hitachi, Ltd. ADR(b) (Japan) | | 3,998,800 | | | 269,519,120 |
Lexmark International, Inc.(a) | | 140,400 | | | 6,294,132 |
Motorola, Inc. | | 37,178,200 | | | 839,855,538 |
NCR Corp.(a) | | 7,401,000 | | | 251,189,940 |
Sun Microsystems, Inc.(a) | | 139,300,000 | | | 583,667,000 |
Xerox Corp.(a),(c) | | 64,118,600 | | | 939,337,490 |
| | | | |
|
|
| | | | | | 5,111,071,319 |
| | | | |
|
|
| | | | | | 7,276,510,184 |
| MATERIALS: 6.9% |
Akzo Nobel NV ADR(b),(c) (Netherlands) | | 16,294,523 | | | 750,851,620 |
Alcoa, Inc. | | 7,858,583 | | | 232,378,299 |
Dow Chemical Co. | | 23,579,914 | | | 1,033,271,831 |
Engelhard Corp.(c) | | 8,265,600 | | | 249,207,840 |
International Paper Co. | | 6,920,900 | | | 232,611,449 |
Lubrizol Corp. | | 265,283 | | | 11,521,241 |
Nova Chemicals Corp.(b),(c) (Canada) | | 4,737,970 | | | 158,248,198 |
Rio Tinto PLC ADR(b) (United Kingdom) | | 2,919,481 | | | 533,651,932 |
Rohm and Haas Co. | | 8,563,600 | | | 414,649,512 |
| | | | |
|
|
| | | | | | 3,616,391,922 |
| | | | | | | |
| | |
| | | SHARES | | | VALUE |
| TELECOMMUNICATION SERVICES: 1.0% |
Vodafone Group PLC ADR(b) (United Kingdom) | | | 23,046,300 | | | $ | 494,804,061 |
| | | | | | |
|
|
| | | | | | | | 494,804,061 |
| UTILITIES: 1.7% |
Duke Energy Corp. | | | 23,845,700 | | | | 654,564,465 |
FirstEnergy Corp. | | | 4,472,700 | | | | 219,117,573 |
| | | | | | |
|
|
| | | | | | | | 873,682,038 |
| | | | | | |
|
|
TOTAL COMMON STOCKS (Cost $37,209,725,354) | | | | 49,763,114,574 |
| | | | | | |
|
|
|
| SHORT-TERM INVESTMENTS: 4.4% |
| | |
| | | PAR VALUE | | | VALUE |
SSgA Prime Money Market Fund | | $ | 261,861,954 | | | $ | 261,861,954 |
State Street Repurchase Agreement 3.10%, 1/3/06, maturity value $819,927,322 (collateralized by U.S. Treasury Securities, value $836,042,650, 4.125%, 8/15/08) | | | 819,645,000 | | | | 819,645,000 |
U.S. Treasury Bills | | | | | | | |
1/19/06 | | | 300,000,000 | | | | 299,477,812 |
2/9/06 | | | 125,000,000 | | | | 124,513,516 |
3/2/06 | | | 325,000,000 | | | | 322,964,479 |
3/9/06 | | | 175,000,000 | | | | 173,741,191 |
4/13/06 | | | 300,000,000 | | | | 296,630,813 |
| | | | | | |
|
|
TOTAL SHORT-TERM INVESTMENTS (Cost $2,298,834,765) | | | | 2,298,834,765 |
| | | | | | |
|
|
TOTAL INVESTMENTS
(Cost $39,508,560,119) | | | 99.8 | % | | | 52,061,949,339 |
OTHER ASSETS LESS LIABILITIES | | | 0.2 | % | | | 122,259,976 |
| | |
|
|
| |
|
|
TOTAL NET ASSETS | | | 100.0 | % | | $ | 52,184,209,315 |
| | |
|
|
| |
|
|
| (b) | | Foreign security denominated in U.S. dollars |
| (c) | | See Note 5 regarding holdings of 5% voting securities |
ADR: American Depository Receipt
| | |
| See accompanying Notes to Financial Statements | | Dodge & Cox Stock Fund / 6 |
Statement of Assets and Liabilities
| | | |
| |
| | | December 31, 2005
|
| Assets: | | | |
Investments, at value | | | |
Unaffiliated issuers (cost $33,038,641,308) | | $ | 44,502,178,650 |
Affiliated issuers (cost $6,469,918,811) | | | 7,559,770,689 |
| | |
|
|
| | | | 52,061,949,339 |
Receivable for investments sold | | | 36,844,183 |
Receivable for Fund shares sold | | | 112,396,489 |
Dividends and interest receivable | | | 52,735,862 |
Prepaid expenses and other assets | | | 261,179 |
| | |
|
|
| | | | 52,264,187,052 |
| | |
|
|
| Liabilities: | | | |
Payable for Fund shares redeemed | | | 55,898,173 |
Management fees payable | | | 22,177,275 |
Accrued expenses | | | 1,902,289 |
| | |
|
|
| | | | 79,977,737 |
| | |
|
|
| Net Assets | | $ | 52,184,209,315 |
| | |
|
|
| Net Assets Consist of: | | | |
Paid in capital | | $ | 39,527,060,957 |
Undistributed net investment income | | | 2,672,790 |
Undistributed net realized gain on investments | | | 101,086,348 |
Net unrealized appreciation on investments | | | 12,553,389,220 |
| | |
|
|
| | | $ | 52,184,209,315 |
| | |
|
|
Fund shares outstanding (par value $0.01 each, unlimited shares authorized) | | | 380,308,734 |
Net asset value per share | | | $137.22 |
| |
| Statement of Operations | | | |
| | | Year Ended
December 31, 2005 |
| Investment Income: | | | |
Dividends (net of foreign taxes of $17,377,537) | | | |
Unaffiliated issuers | | $ | 615,225,931 |
Affiliated issuers | | | 161,282,916 |
Interest | | | 73,469,831 |
| | |
|
|
| | | | 849,978,678 |
| | |
|
|
| Expenses: | | | |
Management fees | | | 235,198,282 |
Custody and fund accounting fees | | | 679,627 |
Transfer agent fees | | | 5,602,494 |
Professional services | | | 93,972 |
Shareholder reports | | | 2,095,449 |
Registration fees | | | 830,810 |
Trustees’ fees | | | 118,625 |
Miscellaneous | | | 348,773 |
| | |
|
|
| | | | 244,968,032 |
| | |
|
|
| Net Investment Income | | | 605,010,646 |
| | |
|
|
| Realized and Unrealized Gain on Investments: | | | |
Net realized gain | | | |
Unaffiliated issuers | | | 1,126,279,762 |
Affiliated issuers | | | 3,780,581 |
Net change in unrealized appreciation | | | 2,657,836,787 |
| | |
|
|
Net realized and unrealized gain | | | 3,787,897,130 |
| | |
|
|
| Net Increase in Net Assets from Operations | | $ | 4,392,907,776 |
| | |
|
|
Statement of Changes in Net Assets
| | | | | | | | |
| | |
| | | Year Ended December 31, 2005 | | | Year Ended December 31, 2004 | |
| Operations: | | | | | | | | |
Net investment income | | $ | 605,010,646 | | | $ | 474,852,317 | |
Net realized gain | | | 1,130,060,343 | | | | 1,417,766,177 | |
Net change in unrealized appreciation | | | 2,657,836,787 | | | | 4,726,648,936 | |
| | |
|
|
| |
|
|
|
Net increase in net assets from operations | | | 4,392,907,776 | | | | 6,619,267,430 | |
| | |
|
|
| |
|
|
|
| | |
| Distributions to Shareholders from: | | | | | | | | |
Net investment income | | | (611,260,756 | ) | | | (469,055,741 | ) |
Net realized gain | | | (1,222,133,564 | ) | | | (1,173,587,700 | ) |
| | |
|
|
| |
|
|
|
Total distributions | | | (1,833,394,320 | ) | | | (1,642,643,441 | ) |
| | |
|
|
| |
|
|
|
| | |
| Fund Share Transactions | | | | | | | | |
Proceeds from sale of shares | | | 9,806,907,602 | | | | 11,863,567,462 | |
Reinvestment of distributions | | | 1,700,707,781 | | | | 1,513,787,692 | |
Cost of shares redeemed | | | (5,149,262,920 | ) | | | (4,524,858,539 | ) |
| | |
|
|
| |
|
|
|
Net increase from Fund share transactions | | | 6,358,352,463 | | | | 8,852,496,615 | |
| | |
|
|
| |
|
|
|
Total increase in net assets | | | 8,917,865,919 | | | | 13,829,120,604 | |
| | |
| Net Assets: | | | | | | | | |
Beginning of year | | | 43,266,343,396 | | | | 29,437,222,792 | |
| | |
|
|
| |
|
|
|
End of year (including undistributed net investment income of $2,672,790 and $8,922,900, respectively) | | $ | 52,184,209,315 | | | $ | 43,266,343,396 | |
| | |
|
|
| |
|
|
|
| | |
| Share Information: | | | | | | | | |
Shares sold | | | 74,426,365 | | | | 99,334,591 | |
Distributions reinvested | | | 12,641,751 | | | | 11,920,322 | |
Shares redeemed | | | (39,005,611 | ) | | | (37,725,900 | ) |
| | |
|
|
| |
|
|
|
Net increase in shares outstanding | | | 48,062,505 | | | | 73,529,013 | |
| | |
|
|
| |
|
|
|
| | |
| 7 / Dodge & Cox Stock Fund | | See accompanying Notes to Financial Statements |
Notes to Financial Statements
Note 1 — Organization and Significant Accounting Policies
Dodge & Cox Stock Fund (the “Fund”) is one of the series constituting the Dodge & Cox Funds (the “Trust” or the “Funds”). The Trust is organized as a Delaware statutory trust and is registered under the Investment Company Act of 1940, as amended, as a diversified, open-end management investment company. The Fund commenced operations on January 4, 1965, and seeks long-term growth of principal and income. Risk considerations and investment strategies of the Fund are discussed in the Fund’s Prospectus. The Fund is closed to new investors.
The financial statements have been prepared in conformity with accounting principles generally accepted in the United States of America, which require the use of estimates and assumptions by management. Significant accounting policies are as follows:
Security valuation. The Fund’s net assets are valued as of the close of trading on the New York Stock Exchange (NYSE), generally 4:00 p.m. Eastern Time, each day that the NYSE is open for business. Stocks are valued at the official quoted close price or the last sale of the day at the close of the NYSE or, if not available, at the mean between the exchange listed bid and ask prices for the day. A security that is listed or traded on more than one exchange is valued at the quotation on the exchange determined to be the primary market for such security. Security values are not discounted based on the size of the Fund’s position. Securities for which market quotations are not readily available are valued at fair value as determined in good faith by or at the direction of the Board of Trustees. Short-term securities are valued at amortized cost which approximates current value. All securities held by the Fund are denominated in U.S. dollars.
Security transactions, investment income, expenses, and distributions. Security transactions are recorded on the trade date. Realized gains and losses on securities sold are determined on the basis of identified cost.
Dividend income and corporate action transactions are recorded on the ex-dividend date, except for certain dividends or corporate actions from foreign securities where the ex-dividend date may have passed, which are recorded as soon as the Fund is informed of the
ex-dividend date. Withholding taxes on foreign dividends have been provided for in accordance with the Fund’s understanding of the applicable country’s tax rules and rates. Non-cash dividends included in dividend income, if any, are recorded at the fair market value of the securities received. Distributions received in excess of income are recorded as a reduction of cost of investments and/or realized gain. The Fund may estimate the character of distributions received from Real Estate Investment Trusts (“REITs”). Interest income is recorded on the accrual basis.
Expenses are recorded on the accrual basis. Most expenses of the Trust can be directly attributed to a specific series. Expenses which cannot be directly attributed are apportioned among the Funds in the Trust.
Distributions to shareholders are recorded on the ex-dividend date.
Repurchase agreements. The Fund may enter into repurchase agreements secured by U.S. government securities which involve the purchase of securities from a counterparty with a simultaneous commitment to resell the securities at an agreed-upon date and price. It is the Fund’s policy that its custodian take possession of the underlying collateral securities, the fair value of which exceeds the principal amount of the repurchase transaction, including accrued interest, at all times. In the event of default by the counterparty, the Fund has the contractual right to liquidate the securities and to apply the proceeds in satisfaction of the obligation.
Note 2 — Related Party Transactions
Management fees. Under a written agreement, the Fund pays an annual management fee of 0.50% of the Fund’s average daily net assets to Dodge & Cox, investment manager of the Fund. The agreement further provides that Dodge & Cox shall waive its fee to the extent that such fee plus all other ordinary operating expenses of the Fund exceed 0.75% of the average daily net assets for the year.
Fund officers and trustees. All officers and four of the trustees of the Trust are officers or employees of Dodge & Cox. The Trust pays a fee only to those trustees who are not affiliated with Dodge & Cox.
Indemnification. Under the Trust’s organizational documents, its officers and trustees are indemnified against certain liabilities
| | |
| | | Dodge & Cox Stock Fund / 8 |
Notes to Financial Statements (continued)
arising out of the performance of their duties to the Trust. In addition, in the normal course of business the Trust enters into contracts that provide general indemnities to other parties. The Trust’s maximum exposure under these arrangements is unknown as this would involve future claims that may be made against the Trust that have not yet occurred.
Note 3 — Income Tax Information
A provision for federal income taxes is not required since the Fund intends to continue to qualify as a regulated investment company under Subchapter M of the Internal Revenue Code and distribute all of its taxable income to shareholders.
Distributions are determined in accordance with income tax regulations, which may differ from net investment income and realized gains for financial reporting purposes. Financial reporting records are adjusted for permanent book/tax differences to reflect tax character. Financial records are not adjusted for temporary differences.
Book/tax differences are primarily due to differing treatment of net short-term realized gain and in-kind redemptions. At December 31, 2005, the cost of investments for federal income tax purposes was equal to the cost for financial reporting purposes.
In 2005, the Fund recognized net realized gain of $65,978,762 from the delivery of appreciated securities in an in-kind redemption
transaction. For federal income tax purposes, this gain is not recognized as taxable income to the Fund and therefore will not be distributed to shareholders.
Distributions during the year ended December 31, 2005 were characterized as follows for federal income tax purposes:
| | | |
Ordinary income ($1.941 per share) | | $ | 697,551,960 |
Long-term capital gain ($3.094 per share) | | | 1,135,842,360 |
| | |
|
|
Total distributions ($5.035 per share) | | $ | 1,833,394,320 |
| | |
|
|
At December 31, 2005, the tax basis components of distributable earnings were as follows:
| | | | |
Unrealized appreciation | | $ | 12,861,038,449 | |
Unrealized depreciation | | | (307,649,229 | ) |
| | |
|
|
|
Net unrealized appreciation | | | 12,553,389,220 | |
Undistributed ordinary income | | | 2,668,828 | |
Undistributed long-term capital gain | | | 101,090,310 | |
Note 4 — Purchase and Sales of Investments
For the year ended December 31, 2005, purchases and sales of securities, other than short-term securities, aggregated $11,016,784,635 and $5,534,381,890, respectively.
| | |
| 9 / Dodge & Cox Stock Fund | | |
Notes to Financial Statements (continued)
Note 5 — Holdings of 5% Voting Securities
Each of the companies listed below is considered to be an affiliate of the Fund because the Fund owned 5% or more of the company’s voting securities during the year ended December 31, 2005. Transactions during the year in securities of affiliated companies were as follows:
| | | | | | | | | | | | | | | |
| | | | | | | | | | | | | | |
| | | Shares at
Beginning
of Year | | Additions | | Reductions | | | Shares at
End of
Year | | Dividend
Income 1 | | Value at
December 31,
2005 |
AT&T Corp. | | 52,008,200 | | — | | (52,008,200 | ) | | — | | $ | 15,069,444 | | $ | — 3 |
| | | | | | |
Akzo Nobel NV ADR (Netherlands) | | 18,186,723 | | — | | (1,892,200 | ) | | 16,294,523 | | | 20,155,058 | | | 750,851,620 |
| | | | | | |
Avaya, Inc. | | 12,229,400 | | 19,417,000 | | (93,900 | ) | | 31,552,500 | | | — 2 | | | 336,665,175 |
| | | | | | |
BMC Software, Inc. | | 11,787,600 | | 3,700,000 | | (47,600 | ) | | 15,440,000 | | | — 2 | | | 316,365,600 |
| | | | | | |
Computer Sciences Corp. | | 12,893,600 | | — | | (39,700 | ) | | 12,853,900 | | | — 2 | | | 650,921,496 |
| | | | | | |
Compuware Corp. | | 19,357,100 | | — | | (59,500 | ) | | 19,297,600 | | | — 2 | | | — 3 |
| | | | | | |
Delphi Corp. | | 36,051,632 | | — | | (36,051,632 | ) | | — | | | 1,622,323 | | | — 3 |
| | | | | | |
Dillard’s, Inc. Class A | | 5,177,500 | | — | | (15,900 | ) | | 5,161,600 | | | 827,128 | | | 128,110,912 |
| | | | | | |
Electronic Data Systems Corp. | | 33,204,400 | | 1,600,000 | | (107,100 | ) | | 34,697,300 | | | 6,870,170 | | | 834,123,092 |
| | | | | | |
Engelhard Corp. | | 6,266,100 | | 2,025,000 | | (25,500 | ) | | 8,265,600 | | | 3,850,608 | | | 249,207,840 |
| | | | | | |
Equity Office Properties Trust | | 22,260,300 | | 1,142,800 | | (70,900 | ) | | 23,332,200 | | | 46,221,100 | | | 707,665,626 |
| | | | | | |
Fluor Corp. | | 4,375,550 | | — | | (13,500 | ) | | 4,362,050 | | | 2,796,032 | | | 337,011,983 |
| | | | | | |
Genuine Parts Co. | | 8,953,800 | | — | | (27,500 | ) | | 8,926,300 | | | 11,175,062 | | | 392,043,096 |
| | | | | | |
HCA, Inc. | | 26,418,400 | | 200,000 | | (6,142,600 | ) | | 20,475,800 | | | 13,595,892 | | | — 3 |
| | | | | | |
May Department Stores Co. | | 17,894,400 | | — | | (17,894,400 | ) | | — | | | 13,138,909 | | | — 3 |
| | | | | | |
NOVA Chemicals Corp. (Canada) | | 4,752,570 | | — | | (14,600 | ) | | 4,737,970 | | | 1,321,223 | | | 158,248,198 |
| | | | | | |
Storage Technology Corp. | | 7,511,200 | | — | | (7,511,200 | ) | | — | | | — 2 | | | — 3 |
| | | | | | |
Thermo Electron Corp. | | 7,433,400 | | 1,500,000 | | (26,600 | ) | | 8,906,800 | | | — 2 | | | 268,361,884 |
| | | | | | |
Union Pacific Corp. | | 13,860,950 | | 1,000,000 | | (45,700 | ) | | 14,815,250 | | | 17,805,720 | | | 1,192,775,777 |
| | | | | | |
Whirlpool Corp. | | 4,388,050 | | — | | (829,300 | ) | | 3,558,750 | | | 6,834,247 | | | 298,080,900 |
| | | | | | |
Xerox Corp. | | 45,764,500 | | 18,552,000 | | (197,900 | ) | | 64,118,600 | | | — 2 | | | 939,337,490 |
| | | | | | | | | | | |
|
| |
|
|
| | | | | | | | | | | | $ | 161,282,916 | | $ | 7,559,770,689 |
| | | | | | | | | | | |
|
| |
|
|
| 1 | | Net of foreign taxes, if any |
| 3 | | Company was not an affiliate at the end of the year |
| | |
| | | Dodge & Cox Stock Fund / 10 |
Financial Highlights
| | | | | | | | | | | | | | | | | |
SELECTED DATA AND RATIOS
(for a share outstanding throughout each year) | | | | Year Ended December 31, | |
| | | | | 2005 | | | 2004 | | | 2003 | | | 2002 | | | 2001 | |
Net asset value, beginning of year | | | | $130.22 | | | $113.78 | | | $ 88.05 | | | $100.51 | | | $ 96.67 | |
| | | | | | |
Income from investment operations: | | | | | | | | | | | | | | | | | |
Net investment income | | | | 1.68 | | | 1.54 | | | 1.60 | | | 1.53 | | | 1.72 | |
Net realized and unrealized gain (loss) | | | | 10.36 | | | 20.08 | | | 26.59 | | | (12.06 | ) | | 7.05 | |
| | | | |
|
| |
|
| |
|
| |
|
| |
|
|
Total from investment operations | | | | 12.04 | | | 21.62 | | | 28.19 | | | (10.53 | ) | | 8.77 | |
| | | | |
|
| |
|
| |
|
| |
|
| |
|
|
Distributions to shareholders from: | | | | | | | | | | | | | | | | | |
Net investment income | | | | (1.70 | ) | | (1.53 | ) | | (1.62 | ) | | (1.51 | ) | | (1.73 | ) |
Net realized gain | | | | (3.34 | ) | | (3.65 | ) | | (0.84 | ) | | (0.42 | ) | | (3.20 | ) |
| | | | |
|
| |
|
| |
|
| |
|
| |
|
|
Total distributions | | | | (5.04 | ) | | (5.18 | ) | | (2.46 | ) | | (1.93 | ) | | (4.93 | ) |
| | | | |
|
| |
|
| |
|
| |
|
| |
|
|
Net asset value, end of year | | | | $137.22 | | | $130.22 | | | $113.78 | | | $ 88.05 | | | $100.51 | |
| | | | |
|
| |
|
| |
|
| |
|
| |
|
|
Total return | | | | 9.36 | % | | 19.16 | % | | 32.35 | % | | (10.52 | )% | | 9.33 | % |
Ratios/supplemental data: | | | | | | | | | | | | | | | | | |
Net assets, end of year (millions) | | | | $52,184 | | | $43,266 | | | $29,437 | | | $14,036 | | | $9,396 | |
Ratio of expenses to average net assets | | | | 0.52 | % | | 0.53 | % | | 0.54 | % | | 0.54 | % | | 0.54 | % |
Ratio of net investment income to average net assets | | | | 1.29 | % | | 1.32 | % | | 1.72 | % | | 1.74 | % | | 1.80 | % |
Portfolio turnover rate | | | | 12 | % | | 11 | % | | 8 | % | | 13 | % | | 10 | % |
See accompanying Notes to Financial Statements.
Report of Independent Registered Public Accounting Firm
To the Trustees of Dodge & Cox Funds and Shareholders of Dodge & Cox Stock Fund
In our opinion, the accompanying statement of assets and liabilities, including the portfolio of investments, and the related statements of operations and of changes in net assets and the financial highlights present fairly, in all material respects, the financial position of the Dodge & Cox Stock Fund (the “Fund”, one of the series constituting Dodge & Cox Funds) at December 31, 2005, the results of its operations for the year then ended, the changes in its net assets for each of the two years in the period then ended and the financial highlights for each of the five years in the period then ended, in conformity with accounting principles generally accepted in the United States of America. These financial statements and financial highlights (hereafter referred to as “financial statements”) are the responsibility of the Fund’s management; our responsibility is to express an opinion on these financial statements based on our audits. We conducted our audits of these financial statements in accordance with the standards of the Public Company Accounting Oversight Board (United States). Those standards require that we plan and perform the audit to obtain reasonable assurance about whether the financial statements are free of material misstatement. An audit includes examining, on a test basis, evidence supporting the amounts and disclosures in the financial statements, assessing the accounting principles used and significant estimates made by management, and evaluating the overall financial statement presentation. We believe that our audits, which included confirmation of securities at December 31, 2005 by correspondence with the custodian and brokers, provide a reasonable basis for our opinion.
PricewaterhouseCoopers LLP
San Francisco, California
February 16, 2006
| | |
| 11 / Dodge & Cox Stock Fund | | |
Special 2005 Tax Information (unaudited)
The following information is provided pursuant to provisions of the Internal Revenue Code:
The Fund designates up to a maximum amount of $747,084,048 of its distributions paid to shareholders in 2005 as qualified dividends (treated for federal income tax purposes in the hands of shareholders as taxable at a maximum rate of 15%).
For shareholders that are corporations, the Fund designates 82% of its ordinary dividends (including short-term gains) paid to shareholders in 2005 as dividends from domestic corporations eligible for the corporate dividends received deduction, provided that the shareholder otherwise satisfies applicable requirements to claim that deduction.
Shareholder Meeting Results (unaudited)
On December 2, 2005, a joint special meeting of shareholders of the Dodge & Cox Funds was held at which the nine Trustees and nominees identified below were elected. The following is a report of the total votes cast by the Funds’ shareholders:
PROPOSAL: Election of Trustees
| | | | | | |
| | | FOR | | WITHHELD | | TOTAL |
Trustees: | | | | | | |
1. William F. Ausfahl | | 1,184,162,195 | | 11,475,032 | | 1,195,637,227 |
2. L. Dale Crandall | | 1,186,779,006 | | 8,858,221 | | 1,195,637,227 |
3. Dana M. Emery | | 1,186,497,036 | | 9,140,191 | | 1,195,637,227 |
4. John A. Gunn | | 1,186,448,522 | | 9,188,705 | | 1,195,637,227 |
5. Harry R. Hagey | | 1,186,227,617 | | 9,409,610 | | 1,195,637,227 |
6. Thomas A. Larsen | | 1,159,731,462 | | 35,905,765 | | 1,195,637,227 |
7. Will C. Wood | | 1,187,752,504 | | 7,884,723 | | 1,195,637,227 |
| | | |
Nominees: | | | | | | |
8. Kenneth E. Olivier | | 1,158,621,330 | | 37,015,897 | | 1,195,637,227 |
9. John B. Taylor | | 1,187,597,104 | | 8,040,123 | | 1,195,637,227 |
Board Approval of Funds’ Investment Management Agreements and Management Fees (unaudited)
The Board of Trustees is responsible for overseeing the performance of the Dodge & Cox Funds’ investment manager and determining whether to continue the Investment Management Agreements between the Funds and Dodge & Cox each year (the “Agreements”). At a meeting of the Board of Trustees of the Trust
held on December 16, 2005, the Trustees, by a unanimous vote (including a separate vote of those Trustees who are not “interested persons” (as defined in the Investment Company Act of 1940) (the “Independent Trustees”)), approved the renewal of the Agreements for an additional one-year term through December 31, 2006. During the course of the year, the Board received a wide variety of materials relating to the services provided by Dodge & Cox and the performance of the Funds.
Information Received
In advance of the meeting, the Board, including each of the Independent Trustees, requested, received and reviewed materials relating to the Agreements. The Independent Trustees retained Morningstar® to prepare an independent expense and performance summary for each Fund and comparable funds managed by other advisers identified by Morningstar®. The Morningstar® materials included information regarding advisory fee rates, expense ratios, and transfer agency, custodial and distribution expenses, as well as performance comparisons to an appropriate index or combination of indices. The materials reviewed by the Board also included information concerning Dodge & Cox’s profitability, financial results and condition, including advisory fee revenue and separate account advisory fee schedules. The Board additionally considered the Funds’ brokerage commissions, turnover rates and sales and redemption data for the Funds, including “soft dollar” payments made for research benefiting the Funds and other accounts managed by Dodge & Cox, and brokerage commissions and expenses paid by Dodge & Cox. Other aspects of Dodge & Cox’s services to the Funds which were reviewed included compliance and supervision of third-party service providers (e.g., custodian, “blue sky” administrator, transfer agent and fund accountant), shareholder servicing, accounting and administrative services, web services, the character of non-advisory services, the record of compliance with the Funds’ investment policies and restrictions and the Funds’ Code of Ethics, investment management staffing and biographies, information furnished to investors and shareholders (including the Funds’ prospectus, Statement of Additional Information, shareholder reports, and quarterly reports), and third-party retirement plan administrator reimbursements by Dodge & Cox for the same periods.
The Board received a memorandum from the Independent Legal Counsel to the Independent Trustees, discussing the factors generally regarded as appropriate to consider in evaluating advisory arrangements and copies of the Agreements. The Trust’s Governance Committee, consisting solely of Independent Trustees, met with the Independent Legal Counsel on December 1, 2005 to discuss whether to renew the Agreements. The Board, including the
| | |
| | | Dodge & Cox Stock Fund / 12 |
Independent Trustees, subsequently concluded that the existing Agreements are fair and reasonable and voted to approve the Agreements.
In considering the Agreements, the Board, including the Independent Trustees, did not identify any single factor or particular information as all-important or controlling. In reaching the decision to approve the Agreements, the Board, which was advised by Independent Legal Counsel, considered the following factors, among others, and reached the conclusions described below.
Nature, Quality, and Extent of the Services
The Board considered the nature, quality and extent of portfolio management, administrative and shareholder services performed by Dodge & Cox, including: Dodge & Cox’s established long-term history of care and conscientiousness in the management of the Funds; demonstrated consistency in investment approach and depth, background and experience of the Dodge & Cox Investment Policy Committee, International Investment Policy Committee, Fixed Income Strategy Committee and research analysts responsible for managing the Funds; Dodge & Cox’s organizational structure; frequent favorable recognition of Dodge & Cox and the Funds in the media and industry publications; Dodge & Cox’s performance in the areas of compliance, administration and shareholder communication and services, supervision of Fund operations and general oversight of other service providers; favorable peer group comparisons of expense ratios, management fee comparisons, expenses (e.g., transfer agent, custody and other fees and expenses) and asset comparisons and performance and risk summaries prepared independently by Morningstar® and favorable fiduciary grade and “Star” rankings by Morningstar®. The Board also acknowledged Dodge & Cox’s decision to close its institutional equity and balanced separate account business and had previously voted, at the recommendation of Dodge & Cox, to close the Stock and Balanced Funds to control the pace of growth. The Board also acknowledged that the services provided by Dodge & Cox are extensive in nature and that Dodge & Cox consistently delivered a high level of service. The Board concluded that it was satisfied with the nature, extent and quality of investment management and other services provided to the Funds by Dodge & Cox.
Investment Performance
The Board considered short-term and long-term investment performance for each Fund (including periods of outperformance or underperformance) as compared to both relevant indices and the performance of such Fund’s peer group. While not dispositive in the
determination, performance information prepared by Morningstar® and Dodge & Cox demonstrated to the Board a consistent pattern of favorable performance for investors and, in most instances, the Funds have outperformed their peer groups for short and long-term periods. The Board also noted that the strong investment performance delivered by Dodge & Cox to the Funds appeared to be consistent with the performance delivered for other (non-Fund) clients of Dodge & Cox. The Board concluded that Dodge & Cox delivers favorable performance for Fund investors consistent with the long-term investment strategies being pursued by the Funds.
Costs and Ancillary Benefits
Costs of Services to Funds: Fees and Expenses. The Board considered each Fund’s management fee rates and expense ratios relative to industry averages for similar mutual funds and relative to management fees charged by Dodge & Cox to other (non-fund) clients. The Board evaluated the operating structures of the Funds and Dodge & Cox—which included a centralized focus on investment management operations, outsourcing of non-advisory support services to unaffiliated third-party service providers, avoiding the practice of charging front-end sales commissions or distribution fees, having Dodge & Cox pay for distribution-related costs and reimbursements to third-party retirement plan administrators, receiving numerous administrative, regulatory compliance, and shareholder support services from Dodge & Cox without any additional administrative fee, and achieving relatively low transaction costs and portfolio turnover rates. The Board noted that the Funds are substantially below peer group averages in expense ratios and management fee rates. The Board also noted that the range of services under the Agreements is much more extensive than under Dodge & Cox’s separate advisory (non-fund) client agreements, and that there are reasonable justifications for differences in fee rates charged between the two lines of business. The Board concluded that costs incurred by the Funds for the services it receives (including the management fee paid to Dodge & Cox) are reasonable and that the fees are acceptable based upon the qualifications, experience, reputation, and performance of Dodge & Cox and the low overall expense ratios of the Funds.
Profitability and Costs of Services to Dodge & Cox; “Fall-out” Benefits. The Board reviewed reports of Dodge & Cox’s financial position, profitability and estimated overall value, and they considered Dodge & Cox’s overall profitability within its context as a private, employee-owned S-Corporation and relative to the favorable services provided. The Board considered recent increases to Dodge & Cox’s gross revenues, and noted the importance of Dodge & Cox’s profitability—which is derived solely from management fees and
| | |
| 13 / Dodge & Cox Stock Fund | | |
does not include other business ventures—to maintain its independence, company culture and ethics, and management continuity. They noted that Dodge & Cox’s profitability is enhanced due to its efficient internal business model, and that the compensation/profit structure at Dodge & Cox is vital for remaining independent and facilitating retention of its management and investment professionals. They also noted that Dodge & Cox has voluntarily limited growth of assets by closing the Stock and Balanced Funds to new investors and by not taking on new equity and balanced separate account clients. The Board noted that these actions were financially disadvantageous to Dodge & Cox, but illustrated a commitment to act in the best interest of existing Fund shareholders and separate account clients. The Board considered potential “fall-out” benefits (including the receipt of research from unaffiliated brokers) that Dodge & Cox might receive in its association with the Funds, and they concluded that these benefits are reasonable in light of Dodge & Cox’s well established stand-alone separate account business. The Board also noted the extent of additional administrative services performed by Dodge & Cox for the Funds, and that the magnitude of costs and risks borne by Dodge & Cox in rendering advisory services to the Funds (including risks in the compliance, securities valuation and investment management processes) are increasing. The Board concluded that the profitability of Dodge & Cox’s relationship with the Funds (including fall-out benefits) was fair and reasonable.
The Benefit of Economies of Scale
The Board considered whether there have been economies of scale with respect to the management of each Fund, whether the Funds have appropriately benefited from any economies of scale, and whether the management fee rate is reasonable in relation to the Fund assets and any economies of scale that may exist. The Board noted that considerable efficiencies of the Funds’ organization and fee structure have been realized by shareholders at the outset of their investment (i.e., from the first dollar), such as management fee rates that start lower than industry and many peer group averages and management fees and overall expense ratios that are lower than averages for peer group funds with approximately the same level of assets. Shareholders also realize efficiencies from the outset of their investment due to organizational efficiencies involved with Dodge & Cox’s investment management process and with avoiding distribution and marketing structures whose costs would ultimately be borne by the Funds. The Board noted that Dodge & Cox’s internal costs of providing investment management, administrative, and compliance services to the Funds have increased. The Board’s decision to renew the Agreements was made
after consideration of economies of scale and review of comparable fund expense ratios and historical expense ratio patterns for the Funds. Their review also included consideration of the desirability of adding breakpoints to the Funds’ fee schedules. The Board concluded that the current Dodge & Cox fee structure is fair and reasonable and adequately reflect economies of scale.
Conclusion
Based on their evaluation of all material factors and assisted by the advice of Independent Legal Counsel to the Independent Trustees, the Board, including the Independent Trustees, concluded that the advisory fee structure was fair and reasonable, that each Fund was paying a competitive fee for the services provided, that the scope and quality of Dodge & Cox’s services has provided substantial value for Fund shareholders over the long-term, and that approval of the Agreements was in the best interests of each Fund and its shareholders.
Fund Holdings
The Fund provides a complete list of its holdings four times in each fiscal year, at the quarter-ends. The lists appear in the Fund’s First Quarter, Semi-Annual, Third Quarter and Annual Reports to shareholders. The Fund files the lists with the Securities and Exchange Commission (SEC) on Form N-CSR (second and fourth quarters) and Form N-Q (first and third quarters). Shareholders may view the Fund’s Forms N-CSR and N-Q on the SEC’s website at www.sec.gov. Forms N-CSR and N-Q may also be reviewed and copied at the SEC’s Public Reference Room in Washington, DC. Information regarding the operations of the Public Reference Room may be obtained by 1-202-942-8090 (direct) or 1-800-732-0330 (general SEC number). A complete list of the Fund’s quarter-end holdings are also available at www.dodgeandcox.com on or about 15 days following each quarter end.
Proxy Voting
For a free copy of the Fund’s proxy voting policies and procedures, please call 1-800-621-3979, visit www.dodgeandcox.com or the SEC’s web site at www.sec.gov. Information regarding how Dodge & Cox, on behalf of the Fund, voted proxies relating to the Fund’s portfolio securities for the most recent twelve-month period ending June 30 is also available at www.dodgeandcox.com or the SEC’s web site at www.sec.gov.
| | |
| | | Dodge & Cox Stock Fund / 14 |
Dodge & Cox Funds—Executive Officer & Trustee Information
| | | | | | |
Name (Age) and
Address* | | Position with Trust
(Year of Election or
Appointment) | | Principal Occupation During Past 5 Years | | Other Directorships Held by Trustees |
| Interested Trustees & Officers |
Harry R. Hagey (64) | | Chairman and Trustee (Trustee since 1975) | | Chairman and Director of Dodge & Cox, Portfolio Manager and member of Investment Policy Committee (IPC) | | — |
John A. Gunn (62) | | President and Trustee
(Trustee since 1985) | | Chief Executive Officer (since December, 2005), Chief Investment Officer and Director of Dodge & Cox, Portfolio Manager, and member of IPC, Fixed-Income Strategy Committee (FISC) and International Investment Policy Committee (IIPC) | | — |
Dana M. Emery (44) | | Vice President and Trustee (Trustee since 1993) | | Executive Vice President (since December, 2005) and Director of Dodge & Cox, Manager of the Fixed-Income Department, Portfolio Manager and member of IPC and FISC | | — |
Kenneth E. Olivier (53) | | Vice President and Trustee
(Trustee since 2005) | | President (since December, 2005) and Director of Dodge & Cox, Portfolio Manager and member of IPC | | — |
A. Horton Shapiro (66) | | Executive Vice President (Since 1998) | | Senior Vice President and Director of Dodge & Cox, Portfolio Manager | | — |
| Katherine Herrick Drake (51) | | Vice President (Since 1993) | | Vice President of Dodge & Cox, Portfolio Manager | | — |
| Diana S. Strandberg (46) | | Vice President
(Since 2005) | | Vice President of Dodge & Cox, Portfolio Manager and member of IPC and IIPC | | |
John M. Loll (39) | | Treasurer and Assistant Secretary (Since 2000) | | Vice President and Treasurer of Dodge & Cox | | — |
| Thomas M. Mistele (52) | | Secretary and Assistant Treasurer (Since 2000) | | Chief Operating Officer (since 2004), Director (since 2005), Secretary and General Counsel of Dodge & Cox | | — |
| Marcia P. Venegas (37) | | Chief Compliance Officer
(Since 2004) | | Chief Compliance Officer of Dodge & Cox (since 2005), Compliance Officer of Dodge & Cox (2003-2004); Compliance and Business Risk Manager of Deutsche Asset Management, Australia Limited (1999-2001) | | — |
| Independent Trustees |
William F. Ausfahl (65) | | Trustee (Since 2002) | | CFO, The Clorox Co. (1982-1997); Director, The Clorox Co. (1984-1997) | | — |
L. Dale Crandall (64) | | Trustee (Since 1999) | | President, Kaiser Foundation Health Plan, Inc. and Kaiser Foundation Hospitals (2000-2002); Senior Vice President—Finance and Administration & CFO, Kaiser Foundation Health Plan, Inc. and Kaiser Foundation Hospitals (1998-2000) | | Director, Union BanCal Corporation (bank holding company) and Union Bank of California (commercial bank) (2001-Present); Director, Covad Communications Group (broadband communications services) (2002-Present); Director, Ansell Limited (medical equipment and supplies) (2002-Present); Director, BEA Systems, Inc. (software and programming) (2003-Present); Director, Coventry Health Care, Inc. (managed healthcare) (2004-Present) |
Thomas A. Larsen (56) | | Trustee (Since 2002) | | Director in Howard, Rice, Nemerovski, Canady, Falk & Rabkin (law firm) | | — |
John B. Taylor (60) | | Trustee (Since 2005) | | Professor of Economics, Stanford University; Senior Fellow, Hoover Institution; Under Secretary for International Affairs, United States Treasury (2001-2005) | | — |
Will C. Wood (66) | | Trustee (Since 1992) | | Principal, Kentwood Associates, Financial Advisers | | Director, Banco Latinoamericano de Exportaciones S.A. (Latin American Foreign Trade Bank) (1999-Present) |
| * | | The address for each Officer and Trustee is 555 California Street, 40th Floor, San Francisco, California 94104. Each Officer and Trustee oversees all four series in the Dodge & Cox Funds complex and serves for an indefinite term. |
Additional information about the Trust’s Trustees is available in the Trust’s Statement of Additional Information (SAI). You can get a free copy of the SAI by contacting Dodge & Cox Funds at 1-800-621-3979.

International
Stock Fund
Established 2001

5th Annual Report
December 31, 2005
2005
International Stock Fund
www.dodgeandcox.com
For Fund literature, transactions and account
information, please visit the Funds’ web site.
or write or call:
Dodge & Cox Funds
c/o Boston Financial Data Services
P.O. Box 8422
Boston, Massachusetts 02266-8422
(800) 621-3979
Investment Manager
Dodge & Cox
555 California Street, 40th Floor
San Francisco, California 94104
(415) 981-1710
This report is submitted for the general information of the shareholders of the Fund. The report is not authorized for distribution to prospective investors in the Fund unless it is accompanied by a current prospectus.
This report reflects our views, opinions and portfolio holdings as of December 31, 2005, the end of the reporting period. Any such views are subject to change at any time based upon market or other conditions and Dodge & Cox disclaims any responsibility to update such views. These views may not be relied on as investment advice and, because investment decisions for a Dodge & Cox Fund are based on numerous factors, may not be relied on as an indication of trading intent on behalf of any Dodge & Cox Fund.
12/05 ISF AR  Printed on recycled paper

To Our Shareholders
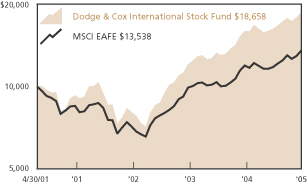
The Dodge & Cox International Stock Fund had a total return of 16.7% in 2005, compared to a total return of 13.5% for the Morgan Stanley Capital International Europe, Australasia, Far East Index (MSCI EAFE) benchmark. Since inception on May 1, 2001 through year end, the Fund had an annualized total return of 14.3% compared to 6.7% for the MSCI EAFE. The table on page two shows the Fund’s long-term results compared to the MSCI EAFE. At year end, the Fund had net assets of $13.4 billion and a cash position of 6.3%.
Performance Review
For the year, the Fund performed well on an absolute basis and relative to the MSCI EAFE. The following factors were major contributors to performance.
| • | | The Fund’s investments in the Energy sector averaged a total return of 39% compared to 18% for the MSCI EAFE Energy sector. Notable performers included Petroleo Brasileiro and Schlumberger, which had total returns of 88% and 46%, respectively. |
| • | | The Fund’s investments in the Financials sector averaged a total return of 23% compared to 15% for the MSCI EAFE sector. Notable performers included three commercial banks: Uniao de Banco Brasileiros (up 106%) in Brazil, Kookmin Bank (up 91%) in South Korea, and Mitsubishi UFJ (up 36%) in Japan. |
| • | | Investments in the emerging markets were up with Latin America particularly strong (up 58%). |
In contrast, the Fund’s investments in the Information Technology sector hurt performance, returning -1% compared to 11% for the MSCI EAFE sector. The major detractor was Seiko Epson, a Japanese maker of printers and LCD screens, which was down 43% for the year. Shinsei Bank (down 15%) also hurt results for the year.
In 2005, changes in foreign currencies had an overall negative effect on the Fund’s performance. U.S. dollar appreciation against developed market currencies (e.g., the Euro and the Japanese Yen) was a significant performance headwind, but was slightly offset by dollar depreciation against emerging market currencies (e.g., the Brazilian Real and Korean Won). As always, we focus on the medium and long-term effects of currency changes on a company’s operations and finances, not on predicting short-term currency fluctuations.
Sticking to Our Disciplined Investment Approach
In evaluating investment opportunities for the Fund, we look for durable business franchises at low-to-reasonable valuations. We
seek companies that have good prospects for long-term earnings and cash-flow growth, and management teams working for the long-term shareholder. We have the opportunity to make these types of investments because our four-to-five year investment horizon allows us to look beyond short-term concerns which descend on even the best of companies. Short-term concerns about a company’s prospects can depress its valuation and may result in a long-term investment opportunity. Conversely, overly optimistic expectations about a company’s prospects can result in disappointing future returns.
During 2005, valuations for international equities continued to rise in recognition of higher profitability around the globe. The gap between the cheapest and most expensive companies in the market has also compressed.
We significantly reduced the Fund’s weightings in the Materials and Energy sectors during the year. Companies in these sectors had comprised approximately one-quarter of the portfolio and performed well due to large increases in the prices of oil, metals and other raw materials. For example, metals and mining companies Rio Tinto and BHP Billiton were up 59% and 41%, respectively, as prices for several metals and bulk commodities reached all-time highs. While we believe the long-term demand prospects for these companies’ products are attractive, expectations of continued high prices and robust demand growth appear to be factored into the valuations. Though we have reduced the Fund’s exposure to companies in these two areas, they still represented approximately 18% of the Fund at year end.
In contrast, we added to the Fund’s holdings in the Information Technology and Health Care sectors as valuations became more attractive. These additions significantly increased the Fund’s exposure to companies participating in areas of technological innovation and to companies benefiting from growth in the developing world. For example, we invested in Nokia, the world’s leading cell phone maker with market-leading positions in the developing world, as the valuation became attractive in 2005.
In addition, we raised the Fund’s positions in GlaxoSmithKline and Sanofi-Aventis—two of the three largest pharmaceutical companies in the world. These companies are trading at comparable valuations to their peers but have promising research pipelines with several drugs in the later stages of the FDA approval process. Sanofi-Aventis, for instance, has one of the best research and development portfolios in the industry, a new obesity drug that could be very successful, an impressive management team, and a global reach with about 15% of profits from the emerging markets. We discuss
| | |
| 1 / Dodge & Cox International Stock Fund | | |
the companies above to illustrate our investment approach, not because we believe they are more attractive than the Fund’s other holdings.
In Closing
The performance of the Fund and international equity markets has been exceptional over the past three years—on an annualized basis the Fund was up 32.2% and the MSCI EAFE was up 23.7%. We do not think this level of returns is sustainable and encourage shareholders to have more conservative expectations of future returns.
We welcome back John Taylor as an Independent Trustee of the Dodge & Cox Funds. Mr. Taylor was elected at the Special Meeting of Shareholders on December 2nd and previously served on the Board from January 1998 until March 2001, prior to his 2001 appointment as Under Secretary of the U.S. Treasury for International Affairs.
We are also pleased to announce that on December 31st, John Gunn became Chief Executive Officer of Dodge & Cox. Harry Hagey, the firm’s Chairman and Chief Executive Officer since 1992, will continue to serve as Chairman of the Board and as a member of the Investment Policy Committee until his retirement at the end of 2006. Also on December 31st, longstanding Dodge & Cox employees Ken Olivier and Dana Emery were named the firm’s President and Executive Vice President, respectively.
Thank you for the continued confidence you have placed in our firm as a shareholder of the International Stock Fund. As always, we welcome your comments and questions.
Sincerely,
| | |
 | |  |
Harry R. Hagey
Chairman February 16, 2006 | | Diana S. Strandberg Vice President |
Growth of $10,000 Since Inception
For an investment made on April 30, 2001
Average Annual Total Return
for periods ending December 31, 2005
| | | | | | | | | |
| | | 1 Year | | | 3 Years | | | Since
Inception
(5/1/01) | |
Dodge & Cox International Stock Fund | | 16.74 | % | | 32.20 | %* | | 14.29 | %* |
MSCI EAFE | | 13.54 | | | 23.68 | | | 6.70 | |
Past performance does not guarantee future results. Investment return and share price will fluctuate with market conditions, and investors may have a gain or loss when shares are sold. Mutual fund performance changes over time and currently may be significantly lower than stated above. Performance is updated and published monthly. Visit the Fund’s web site at www.dodgeandcox.com or call 1-800-621-3979 for current performance figures.
| * | | Expense reimbursements were paid by Dodge & Cox from the Fund’s inception through June 30, 2003 to maintain operating expenses at 0.90%. Accordingly, without the expense reimbursements, the Fund’s returns prior to June 30, 2003 would have been lower. |
The Fund’s total returns include the reinvestment of dividend and capital gain distributions, but have not been adjusted for any income taxes payable on these distributions. The Morgan Stanley Capital International Europe, Australasia, Far East Index (MSCI EAFE) is a widely recognized benchmark of the world’s stock markets, excluding the United States. Index returns include dividends and, unlike Fund returns, do not reflect fees or expenses.
Morgan Stanley®, Morgan Stanley Capital International, and EAFE® are trademarks of Morgan Stanley.
Risks of International Investing: Foreign investing, especially in developing countries,
has special risks such as currency and market volatility and political and social instability.
These and other risk considerations are
discussed in the Fund’s prospectus.
| | |
| | | Dodge & Cox International Stock Fund / 2 |
Fund Expense Example
As a Fund shareholder, you incur ongoing Fund costs, including management fees and other Fund expenses. All mutual funds have ongoing costs, sometimes referred to as operating expenses.
The following example shows ongoing costs of investing in the Fund and can help you understand these costs and compare them with those of other mutual funds. The example assumes a $1,000 investment held for the six months indicated.
Actual Expenses
The first line of the table below provides information about actual account values and expenses based on the Fund’s actual returns. You may use the information in this line, together with your account balance, to estimate the expenses that you paid over the period. Simply divide your account value by $1,000 (for example, an $8,600 account value divided by $1,000 = 8.6), then multiply the result by the number in the first line under the heading “Expenses Paid During Period” to estimate the expenses you paid on your account during this period.
Hypothetical Example for Comparison with Other Mutual Funds
Information on the second line of the table can help you compare ongoing costs of investing in the Fund with those of other mutual funds. This information may not be used to estimate the actual ending account balance or expenses you paid during the period. The hypothetical “Ending Account Value” is based on the actual expense ratio of the Fund and an assumed 5% annual rate of return before expenses (not the Fund’s actual return). The amount under the heading “Expense Paid During the Period” shows the hypothetical expenses your account would have incurred under this scenario. You can compare this figure with the 5% hypothetical examples that appear in shareholder reports of other mutual funds.
| | | | | | | | | |
Six Months Ended December 31, 2005 | | Beginning Account Value 7/1/2005 | | Ending Account Value 12/31/2005 | | Expenses Paid During Period* |
Based on Actual Fund Return | | $ | 1,000.00 | | $ | 1,147.60 | | $ | 3.72 |
Based on Hypothetical 5% Yearly Return | | | 1,000.00 | | | 1,021.74 | | | 3.50 |
| * | | Expenses are equal to the Fund’s annualized six-month expense ratio of 0.69%, multiplied by the average account value over the period, multiplied by 184/365 (to reflect the one-half year period). |
The expenses shown in the table highlight ongoing costs only and do not reflect any transactional costs or account maintenance fees. While other mutual funds may charge such fees, please note that the Fund does not charge transaction fees (e.g., redemption fees, sales loads) or universal account maintenance fees (e.g., small account fees).
| | |
| 3 / Dodge & Cox International Stock Fund | | |
Fund Information | December 31, 2005 |
General Information
| | |
Net Asset Value Per Share | | $35.03 |
Total Net Assets (millions) | | $13,357 |
2005 Expense Ratio | | 0.70% |
2005 Turnover Ratio | | 7% |
30-Day SEC Yield1 | | 1.28% |
Fund Inception Date | | May 1, 2001 |
Investment Manager: Dodge & Cox, San Francisco. Managed by the International Investment Policy Committee, whose seven members’ average tenure at Dodge & Cox is 17 years.
| | | | |
| Portfolio Characteristics | | Fund | | MSCI
EAFE |
Number of Stocks | | 74 | | 1,137 |
Median Market Capitalization (billions) | | $14 | | $3 |
Weighted-Avg. Market Capitalization (billions) | | $46 | | $46 |
Price-to-Earnings Ratio2 | | 15x | | 17x |
Price-to-Book Value Ratio | | 1.9x | | 2.4x |
Countries Represented | | 20 | | 21 |
Emerging Markets (Brazil, South Korea, Mexico, South Africa, Israel, Thailand) | | 13.9% | | 0.0% |
| | |
| Ten Largest Holdings3 | | % of Fund |
Sanofi-Aventis (France) | | 3.4 |
Sony Corp. (Japan) | | 3.0 |
News Corp. Class A (United States) | | 2.9 |
Royal Bank of Scotland Group PLC (United Kingdom) | | 2.7 |
Mitsubishi UFJ Financial Group ADR (Japan) | | 2.7 |
Matsushita Electric Industrial Co., Ltd. (Japan) | | 2.6 |
GlaxoSmithKline PLC ADR (United Kingdom) | | 2.6 |
Central Japan Railway Co. (Japan) | | 2.4 |
Vodafone Group PLC ADR (United Kingdom) | | 2.1 |
Shinsei Bank, Ltd. (Japan) | | 2.0 |
Asset Allocation
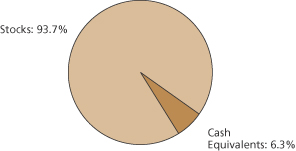
| | | | | | |
| Region Diversification | | Fund | | | MSCI
EAFE | |
Europe (excluding United Kingdom) | | 35.6 | % | | 42.5 | % |
Japan | | 24.0 | | | 25.6 | |
United Kingdom | | 12.2 | | | 24.0 | |
Pacific (excluding Japan) | | 7.6 | | | 7.9 | |
Latin America | | 7.5 | | | 0.0 | |
United States | | 4.7 | | | 0.0 | |
Africa | | 0.9 | | | 0.0 | |
Middle East | | 0.8 | | | 0.0 | |
Canada | | 0.4 | | | 0.0 | |
| | | | | | |
| Sector Diversification | | Fund | | | MSCI
EAFE | |
Financials | | 20.7 | % | | 28.5 | % |
Consumer Discretionary | | 18.0 | | | 12.3 | |
Information Technology | | 10.4 | | | 6.2 | |
Materials | | 10.1 | | | 8.0 | |
Health Care | | 8.2 | | | 7.9 | |
Energy | | 8.1 | | | 8.1 | |
Industrials | | 8.1 | | | 10.7 | |
Consumer Staples | | 5.2 | | | 7.8 | |
Telecommunication Services | | 3.7 | | | 5.6 | |
Utilities | | 1.2 | | | 4.9 | |
| 1 | | SEC Yield is an annualization of the Fund’s total net investment income per share for the 30-day period ended on the last day of the month. |
| 2 | | The Fund’s price-to-earnings (P/E) ratio is calculated using the most recent financial results and excludes extraordinary items. The MSCI EAFE’s P/E ratio is calculated by MSCI and includes negative earnings. |
| 3 | | The Fund’s portfolio holdings are subject to change without notice. The mention of specific securities is not a recommendation or solicitation for any person to buy, sell or hold any particular security. |
Dodge & Cox International Stock Fund / 4
Portfolio of Investments | December 31, 2005 |
| | | | | |
| COMMON STOCKS: 88.5% | | | | |
| | |
| | | SHARES | | VALUE |
| CONSUMER DISCRETIONARY: 18.0% |
| AUTOMOBILES & COMPONENTS: 1.7% |
Honda Motor Co., Ltd. ADR(b) (Japan) | | 8,104,000 | | $ | 234,772,880 |
| | | | |
|
|
| CONSUMER DURABLES & APPAREL: 11.4% |
AB Electrolux Series B (Sweden) | | 7,483,100 | | | 194,506,910 |
Consorcio Ara SA de CV(c) (Mexico) | | 20,679,800 | | | 90,440,696 |
Corporacion Geo SA de CV Series B(a),(c) (Mexico) | | 42,105,400 | | | 148,502,469 |
Matsushita Electric Industrial Co. Ltd. (Japan) | | 17,691,000 | | | 341,264,468 |
Sony Corp. (Japan) | | 9,726,500 | | | 397,521,771 |
Thomson (France) | | 8,240,015 | | | 172,669,748 |
Yamaha Corp.(c) (Japan) | | 10,576,000 | | | 175,855,649 |
| | | | |
|
|
| | | | | | 1,520,761,711 |
| CONSUMER SERVICES: 0.7% |
Elior(c) (France) | | 6,958,147 | | | 91,439,021 |
| | | | |
|
|
| MEDIA: 4.2% |
Grupo Television SA de CV ADR(b) (Mexico) | | 508,100 | | | 40,902,050 |
News Corp. Class A (United States) | | 24,542,492 | | | 381,635,751 |
VNU NV (Netherlands) | | 4,080,334 | | | 135,308,104 |
| | | | |
|
|
| | | | | | 557,845,905 |
| | | | |
|
|
| | | | | | 2,404,819,517 |
| CONSUMER STAPLES: 5.2% |
| FOOD, BEVERAGE & TOBACCO: 4.6% |
Fomento Economico Mexicano SA de CV ADR(b) (Mexico) | | 2,714,058 | | | 196,796,346 |
Nestle SA (Switzerland) | | 726,000 | | | 217,128,724 |
Tesco PLC (United Kingdom) | | 10,500,000 | | | 59,886,344 |
Tiger Brands, Ltd. (South Africa) | | 295,111 | | | 6,786,037 |
Unilever NV(b) (Netherlands) | | 1,943,900 | | | 133,448,735 |
| | | | |
|
|
| | | | | | 614,046,186 |
| HOUSEHOLD & PERSONAL PRODUCTS: 0.6% |
Aderans Co.(c) (Japan) | | 2,733,200 | | | 82,041,192 |
| | | | |
|
|
| | | | | | 696,087,378 |
| ENERGY: 6.3% |
Norsk Hydro ASA ADR(b) (Norway) | | 2,186,500 | | | 225,603,070 |
Royal Dutch Shell PLC ADR(b) (United Kingdom) | | 3,915,000 | | | 240,733,350 |
Schlumberger, Ltd. (United States) | | 2,450,000 | | | 238,017,500 |
Total SA (France) | | 538,500 | | | 135,283,887 |
| | | | |
|
|
| | | | | | 839,637,807 |
| FINANCIALS: 19.3% | | | | | |
| BANKS: 14.6% |
Banco Santander Central Hispano SA (Spain) | | 15,920,000 | | | 210,151,705 |
DBS Group Holdings, Ltd. (Singapore) | | 26,642,000 | | | 264,392,987 |
Kasikornbank PLC Foreign (Thailand) | | 35,399,400 | | | 64,715,539 |
Kasikornbank PLC NVDR (Thailand) | | 50,840,900 | | | 86,748,641 |
Kookmin Bank ADR(b) (South Korea) | | 1,947,900 | | | 145,527,609 |
| | | | | |
| | |
| | | SHARES | | VALUE |
Mitsubishi UFJ Financial Group ADR(b) (Japan) | | 26,597,400 | | $ | 364,118,406 |
Royal Bank of Scotland Group PLC (United Kingdom) | | 12,120,972 | | | 365,990,266 |
Shinsei Bank, Ltd. (Japan) | | 46,715,000 | | | 270,145,674 |
Standard Bank Group, Ltd. (South Africa) | | 10,096,234 | | | 120,963,335 |
Standard Chartered PLC (United Kingdom) | | 2,555,000 | | | 56,926,652 |
| | | | |
|
|
| | | | | | 1,949,680,814 |
| DIVERSIFIED FINANCIALS: 1.9% |
Credit Suisse Group (Switzerland) | | 4,795,000 | | | 244,484,609 |
| | | | |
|
|
| INSURANCE: 2.8% |
Aegon NV (Netherlands) | | 9,869,999 | | | 160,670,000 |
Converium Holdings AG(a),(c) (Switzerland) | | 8,918,646 | | | 98,413,581 |
Swiss Life Holding (Switzerland) | | 650,000 | | | 117,579,240 |
| | | | |
|
|
| | | | | | 376,662,821 |
| | | | |
|
|
| | | | | | 2,570,828,244 |
| HEALTH CARE: 6.9% |
| HEALTH CARE EQUIPMENT & SERVICES: 0.9% |
Mediceo Paltac Holdings Co., Ltd. (Japan) | | 8,459,700 | | | 122,446,330 |
| | | | |
|
|
| PHARMACEUTICALS & BIOTECHNOLOGY: 6.0% |
GlaxoSmithKline PLC ADR(b) (United Kingdom) | | 6,755,000 | | | 340,992,400 |
Sanofi-Aventis (France) | | 5,209,000 | | | 456,353,162 |
| | | | |
|
|
| | | | | | 797,345,562 |
| | | | |
|
|
| | | | | | 919,791,892 |
| INDUSTRIALS: 8.1% |
| CAPITAL GOODS: 4.6% |
AB Volvo Series B (Sweden) | | 4,686,600 | | | 220,924,123 |
CNH Global NV(b) (Netherlands) | | 1,958,720 | | | 36,314,669 |
Nexans(c) (France) | | 1,616,440 | | | 76,796,908 |
Sulzer AG(c) (Switzerland) | | 290,121 | | | 153,665,550 |
Toto, Ltd. (Japan) | | 15,654,000 | | | 132,335,931 |
| | | | |
|
|
| | | | | | 620,037,181 |
| TRANSPORTATION: 3.5% |
Central Japan Railway Co. (Japan) | | 34,050 | | | 326,251,749 |
TNT NV (Netherlands) | | 4,300,000 | | | 134,396,318 |
| | | | |
|
|
| | | | | | 460,648,067 |
| | | | |
|
|
| | | | | | 1,080,685,248 |
| INFORMATION TECHNOLOGY: 10.4% |
| SEMICONDUCTORS & SEMICONDUCTOR EQUIPMENT: 1.4% |
Infineon Technologies AG(a) (Germany) | | 20,500,000 | | | 187,606,699 |
| | | | |
|
|
| TECHNOLOGY, HARDWARE & EQUIPMENT: 9.0% |
Brother Industries, Ltd.(c) (Japan) | | 19,244,000 | | | 202,173,367 |
Canon, Inc. (Japan) | | 1,114,700 | | | 65,217,535 |
Epcos AG(a) (Germany) | | 2,796,500 | | | 36,617,183 |
Hitachi, Ltd. (Japan) | | 38,498,000 | | | 259,515,072 |
| | |
| 5 / Dodge & Cox International Stock Fund | | See accompanying Notes to Financial Statements |
Portfolio of Investments | December 31, 2005 |
| | | | | |
| COMMON STOCKS (continued) | | | | |
| | |
| | | SHARES | | VALUE |
LG Philips LCD Co., Ltd. ADR(a),(b) (South Korea) | | 5,500,000 | | $ | 118,030,000 |
Nokia Oyj (Finland) | | 10,212,500 | | | 186,799,427 |
Oce NV(c) (Netherlands) | | 6,718,524 | | | 96,959,991 |
Seiko Epson Corp. (Japan) | | 9,254,100 | | | 232,657,027 |
| | | | |
|
|
| | | | | | 1,197,969,602 |
| | | | |
|
|
| | | | | | 1,385,576,301 |
| MATERIALS: 10.1% |
Akzo Nobel NV (Netherlands) | | 2,141,100 | | | 99,239,303 |
BASF AG (Germany) | | 3,250,400 | | | 249,013,674 |
Bayer AG (Germany) | | 2,897,000 | | | 121,036,161 |
BHP Billiton, Ltd. (Australia) | | 3,785,078 | | | 63,127,644 |
Imperial Chemical Industries PLC (United Kingdom) | | 22,445,762 | | | 128,211,625 |
Lafarge (France) | | 2,466,725 | | | 221,947,018 |
Lanxess AG(a) (Germany) | | 2,844,700 | | | 90,796,968 |
Makhteshim-Agan Industries, Ltd. (Israel) | | 19,300,000 | | | 111,291,359 |
Nova Chemicals Corp. (Canada) | | 1,587,900 | | | 53,014,236 |
Rinker Group, Ltd. (Australia) | | 4,172,265 | | | 50,315,423 |
Rio Tinto PLC (United Kingdom) | | 1,884,400 | | | 86,078,083 |
Yara International ASA (Norway) | | 5,118,710 | | | 74,513,395 |
| | | | |
|
|
| | | | | | 1,348,584,889 |
| TELECOMMUNICATION SERVICES: 3.7% |
KT Corp. ADR(b) (South Korea) | | 10,388,400 | | | 223,870,020 |
Vodafone Group PLC ADR(b) (United Kingdom) | | 12,805,000 | | | 274,923,350 |
| | | | |
|
|
| | | | | | 498,793,370 |
| UTILITIES: 0.5% |
National Grid PLC (United Kingdom) | | 7,283,673 | | | 71,241,963 |
| | | | |
|
|
| | | | | | 71,241,963 |
| | | | |
|
|
TOTAL COMMON STOCKS (Cost $10,221,380,868) | | | 11,816,046,609 |
| | | | |
|
|
|
| PREFERRED STOCKS: 5.2% |
| CONSUMER STAPLES: 0.0%(d) |
| FOOD & STAPLES RETAILING: 0.0%(d) |
Sadia SA ADR(b) (Brazil) | | 153,000 | | | 4,467,600 |
| | | | |
|
|
| | | | | | 4,467,600 |
| ENERGY: 1.8% |
Petroleo Brasileiro SA ADR(b) (Brazil) | | 3,845,700 | | | 247,547,709 |
| | | | |
|
|
| | | | | | 247,547,709 |
| FINANCIALS: 1.4% |
| BANKS: 1.4% |
Uniao de Bancos Brasileiros SA GDR(b) (Brazil) | | 2,916,500 | | | 185,401,905 |
| | | | |
|
|
| | | | | | 185,401,905 |
| | | | | | | |
| | |
| | | SHARES | | | VALUE |
| HEALTH CARE: 1.3% |
| HEALTH CARE EQUIPMENT & SERVICES: 1.3% |
Fresenius Medical Care AG (Germany) | | | 1,892,275 | | | $ | 176,644,832 |
| | | | | | |
|
|
| | | | | | | | 176,644,832 |
| UTILITIES: 0.7% |
Ultrapar Participacoes SA ADR(b) (Brazil) | | | 6,338,785 | | | | 88,299,275 |
| | | | | | |
|
|
| | | | | | | | 88,299,275 |
| | | | | | |
|
|
TOTAL PREFERRED STOCKS (Cost $379,030,565) | | | | 702,361,321 |
| | | | | | |
|
|
|
| SHORT-TERM INVESTMENTS: 5.8% |
| | |
| | | PAR VALUE | | | VALUE |
SSgA Prime Money Market Fund | | $ | 66,650,438 | | | $ | 66,650,438 |
State Street Repurchase Agreement 3.10%, 1/3/06, maturity value $711,226,894 (collateralized by U.S. Treasury Securities, value $725,205,250, 4.125%, 8/15/08) | | | 710,982,000 | | | | 710,982,000 |
| | | | | | |
|
|
TOTAL SHORT-TERM INVESTMENTS (Cost $777,632,438) | | | | | | | 777,632,438 |
| | | | | | |
|
|
TOTAL INVESTMENTS
(Cost $11,378,043,871) | | | 99.5 | % | | | 13,296,040,368 |
OTHER ASSETS LESS LIABILITIES | | | 0.5 | % | | | 61,204,479 |
| | |
|
|
| |
|
|
TOTAL NET ASSETS | | | 100.0 | % | | $ | 13,357,244,847 |
| | |
|
|
| |
|
|
| (b) | | Foreign security denominated in U.S. dollars |
| (c) | | See Note 5 regarding holdings of 5% voting securities |
ADR: American Depository Receipt
GDR: Global Depository Receipt
NVDR: Non Voting Depository Receipt
| | |
| See accompanying Notes to Financial Statements | | Dodge & Cox International Stock Fund / 6 |
Statement of Assets and Liabilities
| | | | |
| |
| | | December 31, 2005 | |
| Assets: | | | | |
Investments, at value | | | | |
Unaffiliated issuers (cost $10,406,631,047) | | $ | 12,079,751,944 | |
Affiliated issuers (cost $971,412,824) | | | 1,216,288,424 | |
| | |
|
|
|
| | | | 13,296,040,368 | |
Cash denominated in foreign currency (cost $1,803,616) | | | 1,790,254 | |
Receivable for Fund shares sold | | | 58,026,494 | |
Dividends and interest receivable | | | 21,770,548 | |
Prepaid expenses and other assets | | | 42,160 | |
| | |
|
|
|
| | | | 13,377,669,824 | |
| | |
|
|
|
| Liabilities: | | | | |
Payable for investments purchased | | | 4,867,023 | |
Payable for Fund shares redeemed | | | 3,864,465 | |
Management fees payable | | | 6,588,074 | |
Accrued foreign capital gain tax | | | 3,186,994 | |
Accrued expenses | | | 1,918,421 | |
| | |
|
|
|
| | | | 20,424,977 | |
| | |
|
|
|
| Net Assets | | $ | 13,357,244,847 | |
| | |
|
|
|
| Net Assets Consist of: | | | | |
Paid in capital | | $ | 11,413,015,342 | |
Undistributed net investment income | | | 1,769,736 | |
Undistributed net realized gain on investments | | | 27,731,188 | |
Net unrealized appreciation on investments (net of accrued foreign capital gain tax of $3,186,994) | | | 1,914,728,581 | |
| | |
|
|
|
| | | $ | 13,357,244,847 | |
| | |
|
|
|
Fund shares outstanding (par value $0.01 each, unlimited shares authorized) | | | 381,344,805 | |
Net asset value per share | | | $35.03 | |
| Statement of Operations | | | | |
| | | Year ended
December 31, 2005 | |
| Investment Income: | | | | |
Dividends (net of foreign taxes of $16,261,901) | | | | |
Unaffiliated issuers | | $ | 166,768,720 | |
Affiliated issuers | | | 8,879,907 | |
Interest | | | 14,015,532 | |
| | |
|
|
|
| | | | 189,664,159 | |
| | |
|
|
|
| Expenses: | | | | |
Management fees | | | 50,874,481 | |
Custody and fund accounting fees | | | 2,712,251 | |
Transfer agent fees | | | 2,961,423 | |
Professional services | | | 105,391 | |
Shareholder reports | | | 963,263 | |
Registration fees | | | 1,510,852 | |
Trustees’ fees | | | 118,625 | |
Miscellaneous | | | 25,273 | |
| | |
|
|
|
| | | | 59,271,559 | |
| | |
|
|
|
| Net Investment Income | | | 130,392,600 | |
| | |
|
|
|
| Realized and Unrealized Gain (Loss) on Investments: | | | | |
Net realized gain (loss) | | | | |
Investments in unaffiliated issuers | | | 172,201,095 | |
Investments in affiliated issuers | | | — | |
Foreign currency transactions | | | (3,231,203 | ) |
Net change in unrealized appreciation (including net change of accrued foreign capital gain tax of $3,186,994) | | | 1,234,968,504 | |
| | |
|
|
|
Net realized and unrealized gain | | | 1,403,938,396 | |
| | |
|
|
|
| Net Increase in Net Assets from Operations | | $ | 1,534,330,996 | |
| | |
|
|
|
Statement of Changes in Net Assets
| | | | | | | | |
| | |
| | | Year Ended
December 31, 2005 | | | Year Ended
December 31, 2004 | |
| Operations: | | | | | | | | |
Net investment income | | $ | 130,392,600 | | | $ | 34,239,272 | |
Net realized gain | | | 168,969,892 | | | | 37,799,449 | |
Net change in unrealized appreciation | | | 1,234,968,504 | | | | 579,342,103 | |
| | |
|
|
| |
|
|
|
Net increase in net assets from operations | | | 1,534,330,996 | | | | 651,380,824 | |
| | |
|
|
| |
|
|
|
| Distributions to Shareholders from: | | | | | | | | |
Net investment income | | | (132,300,734 | ) | | | (32,093,476 | ) |
Net realized gain | | | (142,355,951 | ) | | | (27,805,906 | ) |
| | |
|
|
| |
|
|
|
Total distributions | | | (274,656,685 | ) | | | (59,899,382 | ) |
| | |
|
|
| |
|
|
|
| Fund Share Transactions: | | | | | | | | |
Proceeds from sale of shares | | | 8,778,424,267 | | | | 3,130,085,912 | |
Reinvestment of distributions | | | 246,458,696 | | | | 55,967,564 | |
Cost of shares redeemed | | | (1,130,242,133 | ) | | | (229,499,144 | ) |
| | |
|
|
| |
|
|
|
Net increase from Fund share transactions | | | 7,894,640,830 | | | | 2,956,554,332 | |
| | |
|
|
| |
|
|
|
Total increase in net assets | | | 9,154,315,141 | | | | 3,548,035,774 | |
| | |
| Net Assets: | | | | | | | | |
Beginning of year | | | 4,202,929,706 | | | | 654,893,932 | |
| | |
|
|
| |
|
|
|
End of year (including undistributed net investment income of $1,769,736 and $2,145,796, respectively) | | $ | 13,357,244,847 | | | $ | 4,202,929,706 | |
| | |
|
|
| |
|
|
|
| Share Information: | | | | | | | | |
Shares sold | | | 272,160,308 | | | | 116,358,049 | |
Distributions reinvested | | | 7,035,645 | | | | 1,836,809 | |
Shares redeemed | | | (35,007,666 | ) | | | (8,933,703 | ) |
| | |
|
|
| |
|
|
|
Net increase in shares outstanding | | | 244,188,287 | | | | 109,261,155 | |
| | |
|
|
| |
|
|
|
| | |
| 7 / Dodge & Cox International Stock Fund | | See accompanying Notes to Financial Statements |
Notes to Financial Statements
Note 1 — Organization and Significant Accounting Policies
Dodge & Cox International Stock Fund (the “Fund”) is one of the series constituting the Dodge & Cox Funds (the “Trust” or the “Funds”). The Trust is organized as a Delaware statutory trust and is registered under the Investment Company Act of 1940, as amended, as a diversified, open-end management investment company. The Fund’s predecessor, Dodge & Cox International Equity Fund, L.L.C. (the “LLC”), was organized on October 25, 1999 as a private investment company that converted into, and had the same investment manager as, the Fund. The Fund was capitalized on April 30, 2001 upon the transfer of assets from the LLC and commenced operations on May 1, 2001. The Fund seeks long-term growth of principal and income, and the Fund invests primarily in a diversified portfolio of foreign stocks. Foreign investing, especially in developing countries, has special risks such as currency and market volatility and political and social instability. These and other risk considerations are discussed in the Fund’s Prospectus.
The financial statements have been prepared in conformity with accounting principles generally accepted in the United States of America, which require the use of estimates and assumptions by management. Significant accounting policies are as follows:
Security valuation. The Fund’s net assets are valued as of the close of trading on the New York Stock Exchange (NYSE), generally 4:00 p.m. Eastern Time, each day that the NYSE is open for business. Listed securities are valued at market, using as a price the official quoted close price or the last sale on the date of determination on the principal exchange on which such securities are traded or, if not available, at the mean between the exchange listed bid and ask prices for the day. A security that is listed or traded on more than one exchange is valued at the quotation on the exchange determined to be the primary market for such security. Security values are not discounted based on the size of the Fund’s position. Short-term securities are valued at amortized cost which approximates current value. Foreign securities are converted to U.S. dollars using prevailing exchange rates.
If market quotations are not readily available or if a security’s value has materially changed after the close of the security’s primary market but before the close of trading on the NYSE, the security is valued at fair value as determined in good faith by or at the direction of the Board of Trustees. The Fund may use fair value pricing in calculating its NAV when, for example, (i) the primary
market for a security is closed or if trading of a security is suspended or limited, (ii) the Fund determines that the price provided by a pricing service is inaccurate or unreliable, or (iii) the Fund determines that a significant event affecting the value of a security has occurred before the close of the NYSE but after the close of the security’s primary market. An event is considered significant if there is both an affirmative expectation that the security’s value will change in response to the event and a reasonable basis for quantifying a resulting change in value. For securities that do not trade during NYSE hours, fair value determinations are based on analyses of market movements after the close of those securities’ primary markets, and include reviews of developments in foreign markets, the performance of U.S. securities markets, and the performance of instruments trading in U.S. markets that represent foreign securities and baskets of foreign securities. Pricing services are used to obtain closing market prices and to compute certain fair value adjustments utilizing computerized pricing models. When fair value pricing is employed, the prices of securities used by the Fund to calculate its net asset value may differ from quoted or published prices for the same securities.
Foreign currency translation. Assets (including investments) and liabilities denominated in a foreign currency are translated into U.S. dollars at the prevailing rates of exchange at the end of the reporting period. Purchases and sales of securities, income receipts, and expenses are translated into U.S. dollars at the exchange rate in effect on the transaction date. Realized foreign currency gains and losses may arise from sales and maturities of foreign currency contracts, sales of foreign currencies, the difference between the amount of net investment income accrued and the U.S. dollar amount actually received, and from currency gains and losses between trade and settlement date on security transactions. The effects of exchange rate changes on investment securities are included with the net realized and unrealized gain (loss) on investments.
Foreign currency contracts. When the Fund purchases or sells foreign securities, it may enter into foreign exchange contracts to minimize foreign exchange risk from the trade date to the settlement date of the transaction. Losses from these transactions may arise from changes in the value of the foreign currency or if the counterparties do not perform under the contract’s terms.
Security transactions, investment income, expenses, and distributions. Security transactions are recorded on the trade date. Realized gains and losses on securities sold are determined on the basis of identified cost.
| | |
| | | Dodge & Cox International Stock Fund / 8 |
Notes to Financial Statements (continued)
Dividend income and corporate action transactions are recorded on the ex-dividend date, except for certain dividends or corporate actions from foreign securities where the ex-dividend date may have passed, which are recorded as soon as the Fund is informed of the ex-dividend date. Withholding taxes on foreign dividends have been provided for in accordance with the Fund’s understanding of the applicable country’s tax rules and rates. Non-cash dividends included in dividend income, if any, are recorded at the fair market value of the securities received. Distributions received in excess of income are recorded as a reduction of cost of investments and/or realized gain. Interest income is recorded on the accrual basis.
Expenses are recorded on the accrual basis. Most expenses of the Trust can be directly attributed to a specific series. Expenses which cannot be directly attributed are apportioned among the Funds in the Trust.
Distributions to shareholders are recorded on the ex-dividend date.
Repurchase agreements. The Fund may enter into repurchase agreements secured by U.S. government securities which involve the purchase of securities from a counterparty with a simultaneous commitment to resell the securities at an agreed-upon date and price. It is the Fund’s policy that its custodian take possession of the underlying collateral securities, the fair value of which exceeds the principal amount of the repurchase transaction, including accrued interest, at all times. In the event of default by the counterparty, the Fund has the contractual right to liquidate the securities and to apply the proceeds in satisfaction of the obligation.
Note 2 — Related Party Transactions
Management fees. Under a written agreement, the Fund pays an annual management fee of 0.60% of the Fund’s average daily net assets to Dodge & Cox, investment manager of the Fund.
Fund officers and trustees. All officers and four of the trustees of the Trust are officers or employees of Dodge & Cox. The Trust pays a fee only to those trustees who are not affiliated with Dodge & Cox.
Indemnification. Under the Trust’s organizational documents, its officers and trustees are indemnified against certain liabilities arising out of the performance of their duties to the Trust. In addition, in the normal course of business the Trust enters into contracts that provide general indemnities to other parties. The Trust’s maximum exposure under these arrangements is unknown as this would involve future claims that may be made against the Trust that have not yet occurred.
Note 3 — Income Tax Information and Distributions to Shareholders
A provision for federal income taxes is not required since the Fund intends to continue to qualify as a regulated investment company under Subchapter M of the Internal Revenue Code and distribute all of its taxable income to shareholders. Distributions are determined in accordance with income tax regulations, which may differ from net investment income and realized gains for financial reporting purposes. Financial reporting records are adjusted for permanent book/tax differences to reflect tax character. Financial records are not adjusted for temporary differences.
Certain foreign countries impose a tax on capital gains which is accrued by the Fund based on unrealized appreciation, if any, on affected securities. The tax is paid when the gain is realized.
Book/tax differences are primarily due to differing treatments of net short-term realized gain and foreign currency realized gain (loss). At December 31, 2005, the cost of investments for federal income tax purposes was equal to the cost for financial reporting purposes.
Distributions during the year ended December 31, 2005 were characterized as follows for federal income tax purposes:
| | | |
Ordinary income ($.394 per share) | | $ | 145,983,315 |
Long-term capital gain ($.347 per share) | | | 128,673,370 |
| | |
|
|
Total distributions ($.741 per share) | | $ | 274,656,685 |
| | |
|
|
At December 31, 2005, the tax basis components of distributable earnings were as follows:
| | | | |
Unrealized appreciation | | $ | 2,098,881,677 | |
Unrealized depreciation | | | (184,153,096 | ) |
| | |
|
|
|
Net unrealized appreciation | | | 1,914,728,581 | |
Undistributed ordinary income | | | 7,068,992 | |
Undistributed long-term capital gain | | | 22,647,399 | |
Deferred loss* | | | (886,048 | ) |
| * | | Represents net realized loss incurred between November 1, 2005 and December 31, 2005. As permitted by tax regulations, the Fund has elected to treat this loss as arising in 2006. |
Note 4 — Purchase and Sales of Investments
For the year ended December 31, 2005, purchases and sales of securities, other than short-term securities, aggregated $7,817,237,678 and $580,485,696, respectively.
| | |
| 9 / Dodge & Cox International Stock Fund | | |
Notes to Financial Statements (continued)
Note 5 — Holdings of 5% Voting Securities
Each of the companies listed below is considered to be an affiliate of the Fund because the Fund owned 5% or more of the company’s voting securities during the year ended December 31, 2005. Transactions during the year in securities of affiliated companies were as follows:
| | | | | | | | | | | | | | |
| | | Shares at
Beginning
of Year | | Additions | | Reductions | | Shares at
End of
Year | | Dividend
Income 1 | | Value at
December 31, 2005 |
Aderans Co. (Japan) | | 2,233,200 | | 500,000 | | — | | 2,733,200 | | $ | 884,219 | | $ | 82,041,192 |
| | | | | | |
Brother Industries, Ltd. (Japan) | | 8,000,000 | | 11,244,000 | | — | | 19,244,000 | | | 1,647,103 | | | 202,173,367 |
| | | | | | |
Consorcio Ara SA de CV (Mexico) | | 18,217,700 | | 2,462,100 | | — | | 20,679,800 | | | 729,868 | | | 90,440,696 |
| | | | | | |
Converium Holdings AG (Switzerland) | | 4,233,328 | | 4,685,318 | | — | | 8,918,646 | | | — 2 | | | 98,413,581 |
| | | | | | |
Corporacion Geo SA de CV Series B (Mexico) | | 7,191,600 | | 34,913,800 | | — | | 42,105,400 | | | — 2 | | | 148,502,469 |
| | | | | | |
Elior (France) | | — | | 6,958,147 | | — | | 6,958,147 | | | 217,566 | | | 91,439,021 |
| | | | | | |
Nexans SA (France) | | 1,166,440 | | 450,000 | | — | | 1,616,440 | | | 897,514 | | | 76,796,908 |
| | | | | | |
Oce NV (Netherlands) | | 3,649,767 | | 3,068,757 | | — | | 6,718,524 | | | 3,316,445 | | | 96,959,991 |
| | | | | | |
Sulzer AG (Switzerland) | | 65,500 | | 224,621 | | — | | 290,121 | | | 721,794 | | | 153,665,550 |
| | | | | | |
Yamaha Corp. (Japan) | | — | | 10,576,000 | | — | | 10,576,000 | | | 465,398 | | | 175,855,649 |
| | | | | | | | | | |
|
| |
|
|
| | | | | | |
| | | | | | | | | | | $ | 8,879,907 | | $ | 1,216,288,424 |
| | | | | | | | | | |
|
| |
|
|
| 1 | | Net of foreign taxes, if any |
Financial Highlights
| | | | | | | | | | | | | | | | | | | |
SELECTED DATA AND RATIOS
(for a share outstanding throughout each period) | | | | Year Ended December 31, | | | | | May 1, 2001
through
December 31, | |
| | | | | 2005 | | | 2004 | | | 2003 | | | 2002 | | | | | 2001 | |
Net asset value, beginning of period | | | | $30.64 | | | $23.48 | | | $15.81 | | | $18.42 | | | | | $20.00 | |
| | | | | | | |
Income from investment operations: | | | | | | | | | | | | | | | | | | | |
Net investment income | | | | 0.33 | | | 0.26 | | | 0.14 | | | 0.13 | | | | | 0.14 | |
Net realized and unrealized gain (loss) | | | | 4.80 | | | 7.36 | | | 7.67 | | | (2.55 | ) | | | | (1.56 | ) |
| | | | |
|
|
Total from investment operations | | | | 5.13 | | | 7.62 | | | 7.81 | | | (2.42 | ) | | | | (1.42 | ) |
| | | | |
|
|
Distributions to shareholders from: | | | | | | | | | | | | | | | | | | | |
Net investment income | | | | (0.35 | ) | | (0.24 | ) | | (0.14 | ) | | (0.13 | ) | | | | (0.14 | ) |
Net realized gain | | | | (0.39 | ) | | (0.22 | ) | | — | | | (0.06 | ) | | | | (0.02 | ) |
| | | | |
|
|
Total distributions | | | | (0.74 | ) | | (0.46 | ) | | (0.14 | ) | | (0.19 | ) | | | | (0.16 | ) |
| | | | |
|
|
Net asset value, end of period | | | | $35.03 | | | $30.64 | | | $23.48 | | | $15.81 | | | | | $18.42 | |
| | | | |
|
|
Total return | | | | 16.74 | % | | 32.46 | % | | 49.42 | %† | | (13.11 | )%† | | | | (7.09 | )%† |
Ratios/supplemental data: | | | | | | | | | | | | | | | | | | | |
Net assets, end of period (millions) | | | | $13,357 | | | $4,203 | | | $655 | | | $117 | | | | | $25 | |
Ratio of expenses to average net assets | | | | 0.70 | % | | 0.77 | % | | 0.82 | % | | 0.90 | % | | | | 0.90 | %* |
Ratio of expenses to average net assets,
before reimbursement by investment manager | | | | 0.70 | % | | 0.77 | % | | 0.84 | % | | 1.03 | % | | | | 2.47 | %* |
Ratio of net investment income to average net assets | | | | 1.54 | % | | 1.90 | % | | 1.53 | % | | 1.30 | % | | | | 1.74 | %* |
Portfolio turnover rate | | | | 7 | % | | 6 | % | | 11 | % | | 12 | % | | | | 23 | % |
| † | | Expense reimbursements were paid by Dodge & Cox from the Fund’s inception through June 30, 2003 to maintain operating expenses at 0.90%. Accordingly, without the expense reimbursements, the Fund’s returns prior to June 30, 2003 would have been lower. |
| | |
| See accompanying Notes to Financial Statements | | Dodge & Cox International Stock Fund / 10 |
Report of Independent Registered Public Accounting Firm
To the Trustees of Dodge & Cox Funds and Shareholders of Dodge & Cox International Stock Fund
In our opinion, the accompanying statement of assets and liabilities, including the portfolio of investments, and the related statements of operations and of changes in net assets and the financial highlights present fairly, in all material respects, the financial position of the Dodge & Cox International Stock Fund (the “Fund”, one of the series constituting Dodge & Cox Funds) at December 31, 2005, the results of its operations for the year then ended, the changes in its net assets for each of the two years in the period then ended and the financial highlights for each of the periods presented, in conformity with accounting principles generally accepted in the United States of America. These financial statements and financial highlights (hereafter referred to as “financial statements”) are the responsibility of the Fund’s management; our responsibility is to express an opinion on these financial statements based on our audits. We conducted our audits of these financial statements in accordance with the standards of the Public Company Accounting Oversight Board (United States). Those standards require that we plan and perform the audit to obtain reasonable assurance about whether the financial statements are free of material misstatement. An audit includes examining, on a test basis, evidence supporting the amounts and disclosures in the financial statements, assessing the accounting principles used and significant estimates made by management, and evaluating the overall financial statement presentation. We believe that our audits, which included confirmation of securities at December 31, 2005 by correspondence with the custodian and brokers, provide a reasonable basis for our opinion.
PricewaterhouseCoopers LLP
San Francisco, California
February 16, 2006
| | |
| 11 / Dodge & Cox International Stock Fund | | |
Special 2005 Tax Information (unaudited)
The following information is provided pursuant to provisions of the Internal Revenue Code:
In 2005, the Fund has elected to pass through to shareholders foreign source income of $192,232,777 and foreign taxes paid of $16,904,412.
The Fund designates up to a maximum of $183,494,801 of its distributions paid to shareholders in 2005 as qualified dividends (treated for federal income tax purposes in the hands of shareholders as taxable at a maximum rate of 15%).
For shareholders that are corporations, the Fund designates 1% of its ordinary dividends (including short-term gains) paid to shareholders in 2005 as dividends from domestic corporations eligible for the corporate dividends received deduction, provided that the shareholder otherwise satisfies applicable requirements to claim that deduction.
Shareholder Meeting Results (unaudited)
On December 2, 2005, a joint special meeting of shareholders of the Dodge & Cox Funds was held at which the nine Trustees and nominees identified below were elected. The following is a report of the total votes cast by the Funds’ shareholders:
PROPOSAL: Election of Trustees
| | | | | | |
| | | FOR | | WITHHELD | | TOTAL |
Trustees: | | | | | | |
1. William F. Ausfahl | | 1,184,162,195 | | 11,475,032 | | 1,195,637,227 |
2. L. Dale Crandall | | 1,186,779,006 | | 8,858,221 | | 1,195,637,227 |
3. Dana M. Emery | | 1,186,497,036 | | 9,140,191 | | 1,195,637,227 |
4. John A. Gunn | | 1,186,448,522 | | 9,188,705 | | 1,195,637,227 |
5. Harry R. Hagey | | 1,186,227,617 | | 9,409,610 | | 1,195,637,227 |
6. Thomas A. Larsen | | 1,159,731,462 | | 35,905,765 | | 1,195,637,227 |
7. Will C. Wood | | 1,187,752,504 | | 7,884,723 | | 1,195,637,227 |
| | | |
Nominees: | | | | | | |
8. Kenneth E. Olivier | | 1,158,621,330 | | 37,015,897 | | 1,195,637,227 |
9. John B. Taylor | | 1,187,597,104 | | 8,040,123 | | 1,195,637,227 |
Board Approval of Funds’ Investment Management Agreements and Management Fees (unaudited)
The Board of Trustees is responsible for overseeing the performance of the Dodge & Cox Funds’ investment manager and determining whether to continue the Investment Management
Agreements between the Funds and Dodge & Cox each year (the “Agreements”). At a meeting of the Board of Trustees of the Trust held on December 16, 2005, the Trustees, by a unanimous vote (including a separate vote of those Trustees who are not “interested persons” (as defined in the Investment Company Act of 1940) (the “Independent Trustees”)), approved the renewal of the Agreements for an additional one-year term through December 31, 2006. During the course of the year, the Board received a wide variety of materials relating to the services provided by Dodge & Cox and the performance of the Funds.
Information Received
In advance of the meeting, the Board, including each of the Independent Trustees, requested, received and reviewed materials relating to the Agreements. The Independent Trustees retained Morningstar® to prepare an independent expense and performance summary for each Fund and comparable funds managed by other advisers identified by Morningstar®. The Morningstar® materials included information regarding advisory fee rates, expense ratios, and transfer agency, custodial and distribution expenses, as well as performance comparisons to an appropriate index or combination of indices. The materials reviewed by the Board also included information concerning Dodge & Cox’s profitability, financial results and condition, including advisory fee revenue and separate account advisory fee schedules. The Board additionally considered the Funds’ brokerage commissions, turnover rates and sales and redemption data for the Funds, including “soft dollar” payments made for research benefiting the Funds and other accounts managed by Dodge & Cox, and brokerage commissions and expenses paid by Dodge & Cox. Other aspects of Dodge & Cox’s services to the Funds which were reviewed included compliance and supervision of third-party service providers (e.g., custodian, “blue sky” administrator, transfer agent and fund accountant), shareholder servicing, accounting and administrative services, web services, the character of non-advisory services, the record of compliance with the Funds’ investment policies and restrictions and the Funds’ Code of Ethics, investment management staffing and biographies, information furnished to investors and shareholders (including the Funds’ prospectus, Statement of Additional Information, shareholder reports, and quarterly reports), and third-party retirement plan administrator reimbursements by Dodge & Cox for the same periods.
The Board received a memorandum from the Independent Legal Counsel to the Independent Trustees, discussing the factors generally regarded as appropriate to consider in evaluating advisory arrangements and copies of the Agreements. The Trust’s
| | |
| | | Dodge & Cox International Stock Fund / 12 |
Governance Committee, consisting solely of Independent Trustees, met with the Independent Legal Counsel on December 1, 2005 to discuss whether to renew the Agreements. The Board, including the Independent Trustees, subsequently concluded that the existing Agreements are fair and reasonable and voted to approve the Agreements.
In considering the Agreements, the Board, including the Independent Trustees, did not identify any single factor or particular information as all-important or controlling. In reaching the decision to approve the Agreements, the Board, which was advised by Independent Legal Counsel, considered the following factors, among others, and reached the conclusions described below.
Nature, Quality, and Extent of the Services
The Board considered the nature, quality and extent of portfolio management, administrative and shareholder services performed by Dodge & Cox, including: Dodge & Cox’s established long-term history of care and conscientiousness in the management of the Funds; demonstrated consistency in investment approach and depth, background and experience of the Dodge & Cox Investment Policy Committee, International Investment Policy Committee, Fixed Income Strategy Committee and research analysts responsible for managing the Funds; Dodge & Cox’s organizational structure; frequent favorable recognition of Dodge & Cox and the Funds in the media and industry publications; Dodge & Cox’s performance in the areas of compliance, administration and shareholder communication and services, supervision of Fund operations and general oversight of other service providers; favorable peer group comparisons of expense ratios, management fee comparisons, expenses (e.g., transfer agent, custody and other fees and expenses) and asset comparisons and performance and risk summaries prepared independently by Morningstar® and favorable fiduciary grade and “Star” rankings by Morningstar®. The Board also acknowledged Dodge & Cox’s decision to close its institutional equity and balanced separate account business and had previously voted, at the recommendation of Dodge & Cox, to close the Stock and Balanced Funds to control the pace of growth. The Board also acknowledged that the services provided by Dodge & Cox are extensive in nature and that Dodge & Cox consistently delivered a high level of service. The Board concluded that it was satisfied with the nature, extent and quality of investment management and other services provided to the Funds by Dodge & Cox.
Investment Performance
The Board considered short-term and long-term investment performance for each Fund (including periods of outperformance
or underperformance) as compared to both relevant indices and the performance of such Fund’s peer group. While not dispositive in the determination, performance information prepared by Morningstar® and Dodge & Cox demonstrated to the Board a consistent pattern of favorable performance for investors and, in most instances, the Funds have outperformed their peer groups for short and long-term periods. The Board also noted that the strong investment performance delivered by Dodge & Cox to the Funds appeared to be consistent with the performance delivered for other (non-Fund) clients of Dodge & Cox. The Board concluded that Dodge & Cox delivers favorable performance for Fund investors consistent with the long-term investment strategies being pursued by the Funds.
Costs and Ancillary Benefits
Costs of Services to Funds: Fees and Expenses. The Board considered each Fund’s management fee rates and expense ratios relative to industry averages for similar mutual funds and relative to management fees charged by Dodge & Cox to other (non-fund) clients. The Board evaluated the operating structures of the Funds and Dodge & Cox—which included a centralized focus on investment management operations, outsourcing of non-advisory support services to unaffiliated third-party service providers, avoiding the practice of charging front-end sales commissions or distribution fees, having Dodge & Cox pay for distribution-related costs and reimbursements to third-party retirement plan administrators, receiving numerous administrative, regulatory compliance, and shareholder support services from Dodge & Cox without any additional administrative fee, and achieving relatively low transaction costs and portfolio turnover rates. The Board noted that the Funds are substantially below peer group averages in expense ratios and management fee rates. The Board also noted that the range of services under the Agreements is much more extensive than under Dodge & Cox’s separate advisory (non-fund) client agreements, and that there are reasonable justifications for differences in fee rates charged between the two lines of business. The Board concluded that costs incurred by the Funds for the services it receives (including the management fee paid to Dodge & Cox) are reasonable and that the fees are acceptable based upon the qualifications, experience, reputation, and performance of Dodge & Cox and the low overall expense ratios of the Funds.
Profitability and Costs of Services to Dodge & Cox; “Fall-out” Benefits. The Board reviewed reports of Dodge & Cox’s financial position, profitability and estimated overall value, and they considered Dodge & Cox’s overall profitability within its context as a private, employee-owned S-Corporation and relative to the favorable
| | |
| 13 / Dodge & Cox International Stock Fund | | |
services provided. The Board considered recent increases to Dodge & Cox’s gross revenues, and noted the importance of Dodge & Cox’s profitability—which is derived solely from management fees and does not include other business ventures—to maintain its independence, company culture and ethics, and management continuity. They noted that Dodge & Cox’s profitability is enhanced due to its efficient internal business model, and that the compensation/profit structure at Dodge & Cox is vital for remaining independent and facilitating retention of its management and investment professionals. They also noted that Dodge & Cox has voluntarily limited growth of assets by closing the Stock and Balanced Funds to new investors and by not taking on new equity and balanced separate account clients. The Board noted that these actions were financially disadvantageous to Dodge & Cox, but illustrated a commitment to act in the best interest of existing Fund shareholders and separate account clients. The Board considered potential “fall-out” benefits (including the receipt of research from unaffiliated brokers) that Dodge & Cox might receive in its association with the Funds, and they concluded that these benefits are reasonable in light of Dodge & Cox’s well established stand-alone separate account business. The Board also noted the extent of additional administrative services performed by Dodge & Cox for the Funds, and that the magnitude of costs and risks borne by Dodge & Cox in rendering advisory services to the Funds (including risks in the compliance, securities valuation and investment management processes) are increasing. The Board concluded that the profitability of Dodge & Cox’s relationship with the Funds (including fall-out benefits) was fair and reasonable.
The Benefit of Economies of Scale
The Board considered whether there have been economies of scale with respect to the management of each Fund, whether the Funds have appropriately benefited from any economies of scale, and whether the management fee rate is reasonable in relation to the Fund assets and any economies of scale that may exist. The Board noted that considerable efficiencies of the Funds’ organization and fee structure have been realized by shareholders at the outset of their investment (i.e., from the first dollar), such as management fee rates that start lower than industry and many peer group averages and management fees and overall expense ratios that are lower than averages for peer group funds with approximately the same level of assets. Shareholders also realize efficiencies from the outset of their investment due to organizational efficiencies involved with Dodge & Cox’s investment management process and with avoiding distribution and marketing structures whose costs would ultimately be borne by the Funds. The Board noted that Dodge & Cox’s internal costs of providing investment management,
administrative, and compliance services to the Funds have increased. The Board’s decision to renew the Agreements was made after consideration of economies of scale and review of comparable fund expense ratios and historical expense ratio patterns for the Funds. Their review also included consideration of the desirability of adding breakpoints to the Funds’ fee schedules. The Board concluded that the current Dodge & Cox fee structure is fair and reasonable and adequately reflect economies of scale.
Conclusion
Based on their evaluation of all material factors and assisted by the advice of Independent Legal Counsel to the Independent Trustees, the Board, including the Independent Trustees, concluded that the advisory fee structure was fair and reasonable, that each Fund was paying a competitive fee for the services provided, that the scope and quality of Dodge & Cox’s services has provided substantial value for Fund shareholders over the long-term, and that approval of the Agreements was in the best interests of each Fund and its shareholders.
Fund’s Holdings
The Fund provides a complete list of its holdings four times in each fiscal year, at the quarter-ends. The lists appear in the Fund’s First Quarter, Semi-Annual, Third Quarter and Annual Reports to shareholders. The Fund files the lists with the Securities and Exchange Commission (SEC) on Form N-CSR (second and fourth quarters) and Form N-Q (first and third quarters). Shareholders may view the Fund’s Forms N-CSR and N-Q on the SEC’s website at www.sec.gov. Forms N-CSR and N-Q may also be reviewed and copied at the SEC’s Public Reference Room in Washington, DC. Information regarding the operations of the Public Reference Room may be obtained by 1-202-942-8090 (direct) or 1-800-732-0330 (general SEC number). A complete list of the Fund’s quarter-end holdings are also available at www.dodgeandcox.com on or about 15 days following each quarter end.
Proxy Voting
For a free copy of the Fund’s proxy voting policies and procedures, please call 1-800-621-3979, visit www.dodgeandcox.com or the SEC’s web site at www.sec.gov. Information regarding how Dodge & Cox, on behalf of the Fund, voted proxies relating to the Fund’s portfolio securities for the most recent twelve-month period ending June 30 is also available at www.dodgeandcox.com or the SEC’s web site at www.sec.gov.
| | |
| | | Dodge & Cox International Stock Fund / 14 |
Dodge & Cox Funds—Executive Officer & Trustee Information
| | | | | | |
Name (Age) and
Address* | | Position with Trust
(Year of Election or
Appointment) | | Principal Occupation During Past 5 Years | | Other Directorships Held by Trustees |
| Interested Trustees & Officers |
Harry R. Hagey (64) | | Chairman and Trustee (Trustee since 1975) | | Chairman and Director of Dodge & Cox, Portfolio Manager and member of Investment Policy Committee (IPC) | | — |
John A. Gunn (62) | | President and Trustee
(Trustee since 1985) | | Chief Executive Officer (since December, 2005), Chief Investment Officer and Director of Dodge & Cox, Portfolio Manager, and member of IPC, Fixed-Income Strategy Committee (FISC) and International Investment Policy Committee (IIPC) | | — |
Dana M. Emery (44) | | Vice President and Trustee (Trustee since 1993) | | Executive Vice President (since December, 2005) and Director of Dodge & Cox, Manager of the Fixed-Income Department, Portfolio Manager and member of IPC and FISC | | — |
Kenneth E. Olivier (53) | | Vice President and Trustee
(Trustee since 2005) | | President (since December, 2005) and Director of Dodge & Cox, Portfolio Manager and member of IPC | | — |
A. Horton Shapiro (66) | | Executive Vice President (Since 1998) | | Senior Vice President and Director of Dodge & Cox, Portfolio Manager | | — |
| Katherine Herrick Drake (51) | | Vice President (Since 1993) | | Vice President of Dodge & Cox, Portfolio Manager | | — |
| Diana S. Strandberg (46) | | Vice President
(Since 2005) | | Vice President of Dodge & Cox, Portfolio Manager and member of IPC and IIPC | | |
John M. Loll (39) | | Treasurer and Assistant Secretary (Since 2000) | | Vice President and Treasurer of Dodge & Cox | | — |
| Thomas M. Mistele (52) | | Secretary and Assistant Treasurer (Since 2000) | | Chief Operating Officer (since 2004), Director (since 2005), Secretary and General Counsel of Dodge & Cox | | — |
| Marcia P. Venegas (37) | | Chief Compliance Officer
(Since 2004) | | Chief Compliance Officer of Dodge & Cox (since 2005), Compliance Officer of Dodge & Cox (2003-2004); Compliance and Business Risk Manager of Deutsche Asset Management, Australia Limited (1999-2001) | | — |
| Independent Trustees |
William F. Ausfahl (65) | | Trustee (Since 2002) | | CFO, The Clorox Co. (1982-1997); Director, The Clorox Co. (1984-1997) | | — |
L. Dale Crandall (64) | | Trustee (Since 1999) | | President, Kaiser Foundation Health Plan, Inc. and Kaiser Foundation Hospitals (2000-2002); Senior Vice President—Finance and Administration & CFO, Kaiser Foundation Health Plan, Inc. and Kaiser Foundation Hospitals (1998-2000) | | Director, Union BanCal Corporation (bank holding company) and Union Bank of California (commercial bank) (2001-Present); Director, Covad Communications Group (broadband communications services) (2002-Present); Director, Ansell Limited (medical equipment and supplies) (2002-Present); Director, BEA Systems, Inc. (software and programming) (2003-Present); Director, Coventry Health Care, Inc. (managed healthcare) (2004-Present) |
Thomas A. Larsen (56) | | Trustee (Since 2002) | | Director in Howard, Rice, Nemerovski, Canady, Falk & Rabkin (law firm) | | — |
John B. Taylor (60) | | Trustee (Since 2005) | | Professor of Economics, Stanford University; Senior Fellow, Hoover Institution; Under Secretary for International Affairs, United States Treasury (2001-2005) | | — |
Will C. Wood (66) | | Trustee (Since 1992) | | Principal, Kentwood Associates, Financial Advisers | | Director, Banco Latinoamericano de Exportaciones S.A. (Latin American Foreign Trade Bank) (1999-Present) |
| * | | The address for each Officer and Trustee is 555 California Street, 40th Floor, San Francisco, California 94104. Each Officer and Trustee oversees all four series in the Dodge & Cox Funds complex and serves for an indefinite term. |
Additional information about the Trust’s Trustees is available in the Trust’s Statement of Additional Information (SAI). You can get a free copy of the SAI by contacting Dodge & Cox Funds at 1-800-621-3979.

Balanced Fund
Established 1931
(Closed to New Investors)

75th Annual Report
December 31, 2005
2005
Balanced Fund
www.dodgeandcox.com
For Fund literature, transactions and account
information, please visit the Funds’ web site.
or write or call:
Dodge & Cox Funds
c/o Boston Financial Data Services
P.O. Box 8422
Boston, Massachusetts 02266-8422
(800) 621-3979
Investment Manager
Dodge & Cox
555 California Street, 40th Floor
San Francisco, California 94104
(415) 981-1710
This report is submitted for the general information of the shareholders of the Fund. The report is not authorized for distribution to prospective investors in the Fund unless it is accompanied by a current prospectus.
This report reflects our views, opinions and portfolio holdings as of December 31, 2005, the end of the reporting period. Any such views are subject to change at any time based upon market or other conditions and Dodge & Cox disclaims any responsibility to update such views. These views may not be relied on as investment advice and, because investment decisions for a Dodge & Cox Fund are based on numerous factors, may not be relied on as an indication of trading intent on behalf of any Dodge & Cox Fund.
12/05 BF AR  Printed on recycled paper
To Our Shareholders
The Dodge & Cox Balanced Fund had a total return of 6.6% in 2005, compared to a total return of 4.0% for the Combined Index¹ benchmark. The table on page two shows the Fund’s longer-term results compared to the Combined Index. At year end, the Fund’s total assets of $23.6 billion were invested in 62.6% stocks, 33.4% fixed-income securities and 4.0% cash equivalents.
2005 Performance Review
The Fund’s equity holdings, which returned 10.3% (before Fund expenses), significantly outpaced the Standard & Poor’s 500’s (S&P 500) return of 4.9%, and drove the Fund’s overall strength versus the Combined Index. Specifically, the equity portfolio’s Information Technology stocks (e.g., Hewlett-Packard up 38%) were up 12% in aggregate, compared to 1% for the S&P 500 sector. Energy stocks (e.g., Unocal up 55%) were the largest contributors to the portfolio’s absolute performance, returning over 30% as a group, which was in line with the S&P 500’s sector return.
In contrast, the primary detractors from equity performance came from the portfolio’s Media stocks (e.g., Comcast down 22%). Also, as we detailed last quarter, Delphi was down 96% from the beginning of the year until we sold it (after the company filed for bankruptcy) in early October. Delphi illustrates that we do make mistakes, although we continually strive to learn from them. Delphi also illustrates the importance of portfolio diversification, as no single investment’s poor performance weighs too heavily on total results.
The U.S. bond market produced modest results in 2005 as price declines associated with generally rising interest rates reduced total returns. The Fund’s fixed-income portfolio returned 2.4% (before Fund expenses)— in line with the Lehman Brother’s Aggregate Bond Index’s (LBAG) 2.4% return for the year. The portfolio’s shorter-than-benchmark duration2 enhanced relative fixed-income returns in 2005 as short and intermediate interest rates rose. In addition, bonds issued by UnumProvident and AT&T performed well, as did the portfolio’s mortgage-backed securities (MBS). Conversely, investments in Ford Motor Credit Company (FMCC) and General Motors Acceptance Corp. (GMAC) bonds detracted from returns due to concerns about the financial health of their automotive parent companies.
Looking Back: The Case for a Balanced Portfolio
By investing in a balanced portfolio, an investor typically seeks the potential for capital appreciation, historically provided by stocks, as well as the relative price stability and higher income provided by bonds. Reviewing the past five years provides a case in point.
The Fund has returned an annualized 14.5% per year for the last three years and 9.9% per year for the last five years. These annualized returns mask the Fund’s year-to-year volatility (annual returns over the past five years have ranged from -2.9% to +24.4%). Also hidden in the Fund’s annualized returns are the
relative contributions made by the equity and fixed-income portfolios, which have varied as well. For example, over the last three years the Fund’s equity holdings have been the driving force behind its performance, returning over 20% per year on average. Equity returns during this period more than compensated for the lower returns from the Fund’s fixed-income holdings, which were up 5% per year. Conversely, in 2001 and 2002 the Fund’s fixed-income portfolio returned 11% per year while the equity portfolio was down slightly. These numbers point to the importance of both a long-term horizon and a balanced approach to investing.
Looking Forward
Over the past six years, the investment landscape has changed, and we now face a new set of opportunities. We are encouraged about the road ahead because 1) the range of valuations in the equity market has compressed dramatically, meaning investors no longer have to pay large premiums to own companies with attractive long-term growth prospects; and 2) the global economy continues to expand rapidly, meaning millions of consumers, particularly from the developing world, are gaining purchasing power. From the fixed-income perspective, the relentless rise in short and intermediate-term interest rates over the past two years has elevated the bond portfolio’s yield above 5%, leaving us somewhat more optimistic about the prospects for fixed-income returns than we have been in several years.
As valuations within the equity market have narrowed, we have made new investments, one stock at a time, in areas that were once considered “growth” segments of the market: Technology, Media, Telecommunications and Healthcare. Examples of the equity portfolio’s investments in this area include the aforementioned Hewlett-Packard and Comcast, as well as pharmaceutical concerns Pfizer, Sanofi-Aventis and GlaxoSmithKline.
As the global economy continues to integrate and an increasing number of countries adopt free-market capitalistic policies, it becomes less important where a company is domiciled and more important where a company competes. Moreover, U.S.-based companies are becoming increasingly dependent on the global economy for growth. For example, 37 of the equity portfolio’s U.S.-based holdings derive at least one-quarter of their revenues from outside of North America. A global research perspective is paramount. Over the past ten years we have dramatically increased our coverage of foreign companies, and in 2001 established our International Stock Fund, confirming our investment team’s global view. The equity portfolio now holds 15 multinational companies based outside the U.S.
In regards to the fixed income portfolio, we continue to be cautious about the outlook for longer-term U.S. Treasury bonds (10+ years to maturity), which currently offer a low yield and do not offer additional yield (i.e. extra income) relative to shorter maturities, despite their greater sensitivity to interest rate changes. The Fund’s fixed-income portfolio is underweight longer-term bonds in
| | |
| 1 / Dodge & Cox Balanced Fund | | |
general and, importantly, all such securities are Corporate bonds with yield premiums that should somewhat offset any negative price movements associated with rising rates. The Fund has no U.S. Treasuries with maturities greater than four years, and is positioned defensively with a duration of 3.3 years compared to 4.6 years for the LBAG. Given the rise in short to intermediate rates over the past two years, we have begun to trade some of the Fund’s shorter maturity bonds for intermediate maturity bonds, thereby reducing moderately the Fund’s defensive positioning.
Finally, given the wide range of returns between stocks and bonds over the past few years, investors may be tempted to try to pick next year’s top-returning asset class. We caution that this is extraordinarily difficult and often counterproductive. As long-term shareholders of the Fund know, we do not dramatically change the Fund’s asset allocation between stocks, bonds and cash quarter-to-quarter, let alone year-to-year. The Fund’s current allocation of 62.6% in stocks and 37.4% in bonds and cash reflects our belief that over the next three-to-five years the return potential for stocks is somewhat more attractive than for bonds. Furthermore, we believe a balanced approach to investing is particularly prudent today, as a mix of stocks and bonds should help cushion investors from the potholes we’ll undoubtedly experience down the road of a rapidly changing and increasingly global investment landscape.
In Closing
We welcome back John Taylor as an Independent Trustee of the Dodge & Cox Funds. Mr. Taylor was elected at the Special Meeting of Shareholders on December 2nd and previously served on the Board from January 1998 until March 2001, prior to his 2001 appointment as Under Secretary of the U.S. Treasury for International Affairs.
We are also pleased to announce that on December 31st, John Gunn became Chief Executive Officer of Dodge & Cox. Harry Hagey, the firm’s Chairman and Chief Executive Officer since 1992, will continue to serve as Chairman of the Board and as a member of the Investment Policy Committee until his retirement at the end of 2006. Also on December 31st, longstanding Dodge & Cox employees Ken Olivier and Dana Emery were named the firm’s President and Executive Vice President, respectively.
Thank you for the continued confidence you have placed in our firm as a shareholder of the Balanced Fund. As always, we welcome your comments and questions.
For the Board of Trustees,
| | |
 | | 
|
| |
| Harry R. Hagey, Chairman | | John A. Gunn, President |
February 16, 2006
Growth of $10,000 Over 10 Years
For an investment made on December 31, 1995
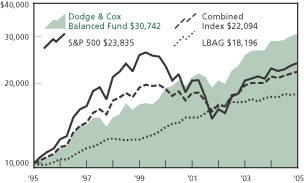
Average Annual Total Return
for periods ended December 31, 2005
| | | | | | | | | | | | |
| | | 1 Year | | | 5 Years | | | 10 Years | | | 20 Years | |
| | |
Dodge & Cox Balanced Fund | | 6.59 | % | | 9.93 | % | | 11.88 | % | | 12.71 | % |
Combined Index | | 4.00 | | | 2.99 | | | 8.25 | | | 10.62 | |
S&P 500 | | 4.92 | | | 0.55 | | | 9.08 | | | 11.94 | |
Lehman Brothers Aggregate Bond Index (LBAG) | | 2.43 | | | 5.87 | | | 6.16 | | | 7.88 | |
Past performance does not guarantee future results. Investment return and share price will fluctuate with market conditions, and investors may have a gain or loss when shares are sold. Mutual fund performance changes over time and currently may be significantly lower than stated above. Performance is updated and published monthly. Visit the Fund’s web site at www.dodgeandcox.com or call 1-800-621-3979 for current performance figures.
The Fund’s total returns include the reinvestment of dividend and capital gain distributions, but have not been adjusted for any income taxes payable by shareholders on these distributions. Index returns include dividends and/or interest income and, unlike Fund returns, do not reflect fees or expenses.
Lehman Brothers® is a trademark of Lehman Brothers, Inc.; Standard & Poor’s, Standard & Poor’s 500, and S&P 500® are trademarks of The McGraw-Hill Companies, Inc.
| 1 | | The Combined Index reflects an unmanaged portfolio of 60% of the Standard & Poor’s 500 Index (S&P 500) and 40% of the Lehman Brothers Aggregate Bond Index (LBAG). The Fund may, however, invest up to 75% of its total assets in stocks. |
| 2 | | Duration is a measure of a bond’s price sensitivity to changes in interest rates. |
| | |
| | | Dodge & Cox Balanced Fund / 2 |
Fund Expense Example
As a Fund shareholder, you incur ongoing Fund costs, including management fees and other Fund expenses. All mutual funds have ongoing costs, sometimes referred to as operating expenses.
The following example shows ongoing costs of investing in the Fund and can help you understand these costs and compare them with those of other mutual funds. The example assumes a $1,000 investment held for the six months indicated.
Actual Expenses
The first line of the table below provides information about actual account values and expenses based on the Fund’s actual returns. You may use the information in this line, together with your account balance, to estimate the expenses that you paid over the period. Simply divide your account value by $1,000 (for example, an $8,600 account value divided by $1,000 = 8.6), then multiply the result by the number in the first line under the heading “Expenses Paid During Period” to estimate the expenses you paid on your account during this period.
Hypothetical Example for Comparison with Other Mutual Funds
Information on the second line of the table can help you compare ongoing costs of investing in the Fund with those of other mutual funds. This information may not be used to estimate the actual ending account balance or expenses you paid during the period. The hypothetical “Ending Account Value” is based on the actual expense ratio of the Fund and an assumed 5% annual rate of return before expenses (not the Fund’s actual return). The amount under the heading “Expense Paid During the Period” shows the hypothetical expenses your account would have incurred under this scenario. You can compare this figure with the 5% hypothetical examples that appear in shareholder reports of other mutual funds.
| | | | | | | | | |
Six Months Ended
December 31, 2005 | | Beginning Account
Value 7/1/2005 | | Ending Account
Value 12/31/2005 | | Expenses Paid
During Period* |
Based on Actual Fund Return | | $ | 1,000.00 | | $ | 1,055.60 | | $ | 2.72 |
Based on Hypothetical 5% Yearly Return | | | 1,000.00 | | | 1,022.55 | | | 2.68 |
| * | | Expenses are equal to the Fund’s annualized six-month expense ratio of 0.53%, multiplied by the average account value over the period, multiplied by 184/365 (to reflect the one-half year period). |
The expenses shown in the table highlight ongoing costs only and do not reflect any transactional costs or account maintenance fees. While other mutual funds may charge such fees, please note that the Fund does not charge transaction fees (e.g., redemption fees, sales loads) or universal account maintenance fees (e.g., small account fees).
| | |
| 3 / Dodge & Cox Balanced Fund | | |
Fund Information | December 31, 2005 |
General Information
| | |
Net Asset Value Per Share | | $81.34 |
Total Net Assets (millions) | | $23,611 |
30-Day SEC Yield1 | | 2.46% |
2005 Expense Ratio | | 0.53% |
2005 Portfolio Turnover | | 18% |
Fund Inception | | 1931 |
Investment Manager: Dodge & Cox, San Francisco. Managed by the Investment Policy Committee, whose nine members’ average tenure at Dodge & Cox is 23 years (twelve members, 22 years average tenure for certain fixed-income decisions), and by the Fixed Income Strategy Committee, whose nine members’ average tenure is 16 years.
Stock Portfolio (62.6% of Fund)
| | |
Number of Stocks | | 86 |
Median Market Capitalization (billions) | | $20 |
Price-to-Earnings Ratio2 | | 15.1x |
Price-to-Book Value Ratio | | 2.0x |
Foreign Stocks3 (% of Fund) | | 11.4% |
| | |
| Five Largest Sectors | | % of Fund |
Consumer Discretionary | | 13.2 |
Financials | | 11.8 |
Health Care | | 10.2 |
Information Technology | | 9.2 |
Energy | | 5.1 |
Fixed-Income Portfolio (33.4% of Fund)
| | |
Number of Fixed-Income Securities | | 272 |
Average Maturity | | 5.2 years |
Effective Duration | | 3.3 years |
| |
| Credit Quality5 | | % of Fund |
U.S. Government & Government Agencies | | 23.3 |
Aaa | | 0.0 |
Aa | | 0.5 |
A | | 1.4 |
Baa | | 4.8 |
Ba | | 3.1 |
B | | 0.3 |
| |
Average Quality | | Aa |
Asset Allocation
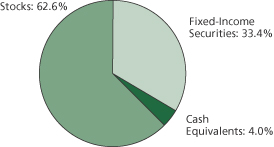
| | |
| Ten Largest Stock Holdings4 | | % of Fund |
Hewlett-Packard Co. | | 2.5 |
Cardinal Health, Inc. | | 1.8 |
Sony Corp. ADR (Japan) | | 1.8 |
Comcast Corp. Class A | | 1.7 |
McDonald’s Corp. | | 1.6 |
News Corp. Class A | | 1.6 |
Time Warner, Inc. | | 1.6 |
Matsushita Electric Industrial Co., Ltd. ADR (Japan) | | 1.5 |
Pfizer, Inc. | | 1.5 |
Union Pacific Corp.
| | 1.5
|
|
|
| Sector Diversification | | % of Fund |
U.S. Treasury & Government Agency | | 11.8 |
Mortgage-Related Securities | | 11.5 |
Corporate | | 10.1 |
| | |
| Five Largest Corporate Fixed-Income Issuers4 | | % of Fund |
GMAC | | 0.8 |
Ford Motor Credit Co. | | 0.8 |
Time Warner, Inc. | | 0.7 |
Xerox Corp. | | 0.7 |
AT&T Corp. | | 0.6 |
| 1 | | SEC Yield is an annualization of the Fund’s total net investment income per share for the 30-day period ended on the last day of the month. |
| 2 | | The Fund’s price-to-earnings (P/E) ratio is calculated using Dodge & Cox’s estimated forward earnings and excludes extraordinary items. |
| 3 | | Foreign stock are U.S. dollar-denominated. |
| 4 | | The Fund’s portfolio holdings are subject to change without notice. The mention of specific securities is not a recommendation or solicitation for any person to buy, sell or hold any particular security. |
| 5 | | Credit quality ratings are from Moody’s Investor Services. If no Moody’s rating is available, the Standard & Poor’s rating is reported. If unrated, the investment manager may determine a comparable rating, which is included in the portfolio breakdown. The credit quality of the investments in the portfolio does not apply to the stability or safety of the Fund. |
| | |
| | | Dodge & Cox Balanced Fund / 4 |
Portfolio of Investments | December 31, 2005 |
| | | | | |
| COMMON STOCKS: 62.6% | | | | |
| | |
| | | SHARES | | VALUE |
| CONSUMER DISCRETIONARY: 13.2% | | | |
| AUTOMOBILES & COMPONENTS: 0.3% | | | |
Honda Motor Co., Ltd. ADR(b) (Japan) | | 2,863,300 | | $ | 82,949,801 |
| | | | |
|
|
| CONSUMER DURABLES & APPAREL: 4.1% | | | |
Matsushita Electric Industrial Co., Ltd. ADR(b) (Japan) | | 18,348,200 | | | 355,588,116 |
Sony Corp. ADR(b) (Japan) | | 10,293,600 | | | 419,978,880 |
Thomson ADR(b) (France) | | 1,900,000 | | | 39,786,000 |
VF Corp. | | 1,051,700 | | | 58,201,078 |
Whirlpool Corp. | | 1,012,200 | | | 84,781,872 |
| | | | |
|
|
| | | | | | 958,335,946 |
| CONSUMER SERVICES: 1.6% | | | |
McDonald’s Corp. | | 11,329,850 | | | 382,042,542 |
| | | | |
|
|
| MEDIA: 5.6% | | | |
Comcast Corp. Class A(a) | | 15,631,716 | | | 405,799,347 |
Discovery Holdings Co. Series A(a) | | 1,028,920 | | | 15,588,138 |
Interpublic Group of Companies, Inc.(a) | | 5,196,500 | | | 50,146,225 |
Liberty Media Corp. Series A(a) | | 10,289,200 | | | 80,976,004 |
News Corp. Class A | | 24,507,900 | | | 381,097,845 |
Time Warner, Inc. | | 21,784,600 | | | 379,923,424 |
| | | | |
|
|
| | | | | | 1,313,530,983 |
| RETAILING: 1.6% | | | |
Dillard’s, Inc. Class A | | 1,461,500 | | | 36,274,430 |
Federated Department Stores, Inc. | | 1,724,136 | | | 114,361,941 |
Gap, Inc. | | 4,352,800 | | | 76,783,392 |
Genuine Parts Co. | | 3,335,750 | | | 146,506,140 |
| | | | |
|
|
| | | | | | 373,925,903 |
| | | | |
|
|
| | | | | | 3,110,785,175 |
| CONSUMER STAPLES: 2.4% | | | |
| FOOD & STAPLES RETAILING: 1.3% | | | |
Wal-Mart Stores, Inc. | | 6,400,000 | | | 299,520,000 |
| | | | |
|
|
| FOOD, BEVERAGE & TOBACCO: 1.1% | | | |
Unilever NV(b) (Netherlands) | | 3,890,400 | | | 267,075,960 |
| | | | |
|
|
| | | | | | 566,595,960 |
| ENERGY: 5.1% | | | |
Amerada Hess Corp. | | 777,000 | | | 98,539,140 |
Baker Hughes, Inc. | | 2,984,400 | | | 181,391,832 |
Chevron Corp. | | 5,336,802 | | | 302,970,250 |
ConocoPhillips | | 3,366,600 | | | 195,868,788 |
Occidental Petroleum Corp. | | 1,462,500 | | | 116,824,500 |
Royal Dutch Shell PLC ADR(b) (United Kingdom) | | 3,116,127 | | | 201,083,675 |
Schlumberger, Ltd. | | 1,050,000 | | | 102,007,500 |
| | | | |
|
|
| | | | | | 1,198,685,685 |
| FINANCIALS: 11.8% | | | |
| BANKS: 2.5% | | | |
Golden West Financial Corp. | | 3,025,700 | | | 199,696,200 |
Wachovia Corp. | | 5,309,500 | | | 280,660,170 |
Wells Fargo & Co. | | 1,560,950 | | | 98,074,488 |
| | | | |
|
|
| | | | | | 578,430,858 |
| | | | | |
| | |
| | | SHARES | | VALUE |
| DIVERSIFIED FINANCIALS: 3.1% | | | |
Capital One Financial Corp. | | 3,650,500 | | $ | 315,403,200 |
CIT Group, Inc. | | 1,524,400 | | | 78,933,432 |
Citigroup, Inc. | | 4,480,900 | | | 217,458,077 |
JPMorgan Chase & Co. | | 3,170,088 | | | 125,820,793 |
| | | | |
|
|
| | | | | | 737,615,502 |
| INSURANCE: 4.9% | | | |
Aegon NV(b) (Netherlands) | | 9,863,363 | | | 160,970,084 |
Chubb Corp. | | 1,784,612 | | | 174,267,362 |
Genworth Financial, Inc. Class A | | 2,570,000 | | | 88,870,600 |
Loews Corp. | | 2,241,500 | | | 212,606,275 |
MBIA, Inc. | | 562,750 | | | 33,855,040 |
Safeco Corp. | | 1,800,200 | | | 101,711,300 |
St. Paul Travelers Companies, Inc. | | 6,652,900 | | | 297,185,043 |
UnumProvident Corp. | | 3,795,400 | | | 86,345,350 |
| | | | |
|
|
| | | | | | 1,155,811,054 |
| REAL ESTATE: 1.3% | | | |
Equity Office Properties Trust | | 6,961,400 | | | 211,139,262 |
Equity Residential Properties Trust | | 2,367,300 | | | 92,608,776 |
| | | | |
|
|
| | | | | | 303,748,038 |
| | | | |
|
|
| | | | | | 2,775,605,452 |
| HEALTH CARE: 10.2% | | | |
| HEALTH CARE EQUIPMENT & SERVICES: 4.9% | | | |
Becton, Dickinson & Co. | | 1,317,900 | | | 79,179,432 |
Cardinal Health, Inc. | | 6,276,400 | | | 431,502,500 |
HCA, Inc. | | 5,903,800 | | | 298,141,900 |
Thermo Electron Corp.(a) | | 3,335,850 | | | 100,509,161 |
WellPoint, Inc.(a) | | 3,273,000 | | | 261,152,670 |
| | | | |
|
|
| | | | | | 1,170,485,663 |
| PHARMACEUTICALS & BIOTECHNOLOGY: 5.3% | | | |
Bristol-Myers Squibb Co. | | 3,539,650 | | | 81,341,157 |
GlaxoSmithKline PLC ADR(b) (United Kingdom) | | 3,875,400 | | | 195,630,192 |
Pfizer, Inc. | | 14,886,367 | | | 347,150,078 |
Sanofi-Aventis ADR(b) (France) | | 6,650,000 | | | 291,935,000 |
Schering-Plough Corp. | | 8,694,650 | | | 181,283,453 |
Wyeth | | 3,266,800 | | | 150,501,476 |
| | | | |
|
|
| | | | | | 1,247,841,356 |
| | | | |
|
|
| | | | | | 2,418,327,019 |
| INDUSTRIALS: 4.5% | | | |
| CAPITAL GOODS: 1.3% | | | |
AB Volvo ADR(b) (Sweden) | | 1,029,700 | | | 48,478,276 |
American Power Conversion Corp. | | 1,875,700 | | | 41,265,400 |
Fluor Corp. | | 1,840,300 | | | 142,181,578 |
Masco Corp. | | 2,459,000 | | | 74,237,210 |
| | | | |
|
|
| | | | | | 306,162,464 |
| COMMERCIAL SERVICES & SUPPLIES: 0.3% | | | |
Pitney Bowes, Inc. | | 1,862,750 | | | 78,701,188 |
| | | | |
|
|
| | |
| 5 / Dodge & Cox Balanced Fund | | See accompanying Notes to Financial Statements |
Portfolio of Investments | December 31, 2005 |
| | | | | |
| COMMON STOCKS (continued) | | | | |
| | |
| | | SHARES | | VALUE |
| TRANSPORTATION: 2.9% | | | |
FedEx Corp. | | 3,225,250 | | $ | 333,458,597 |
Union Pacific Corp. | | 4,273,700 | | | 344,075,587 |
| | | | |
|
|
| | | | | | 677,534,184 |
| | | | |
|
|
| | | | | | 1,062,397,836 |
| INFORMATION TECHNOLOGY: 9.2% | | | |
| SEMICONDUCTORS & SEMICONDUCTOR EQUIPMENT: 0.3% |
Freescale Semiconductor, Inc. Class A(a) | | 2,300,400 | | | 57,947,076 |
Freescale Semiconductor, Inc. Class B(a) | | 469,693 | | | 11,822,173 |
| | | | |
|
|
| | | | | | 69,769,249 |
| SOFTWARE & SERVICES: 2.5% | | | |
BMC Software, Inc.(a) | | 4,525,100 | | | 92,719,299 |
Computer Sciences Corp.(a) | | 3,916,400 | | | 198,326,496 |
Compuware Corp.(a) | | 6,938,700 | | | 62,240,139 |
Electronic Data Systems Corp. | | 10,083,700 | | | 242,412,148 |
| | | | |
|
|
| | | | | | 595,698,082 |
| TECHNOLOGY, HARDWARE & EQUIPMENT: 6.4% | | | |
Avaya, Inc.(a) | | 9,488,250 | | | 101,239,627 |
Hewlett-Packard Co. | | 20,651,431 | | | 591,250,470 |
Hitachi, Ltd. ADR(b) (Japan) | | 1,090,000 | | | 73,466,000 |
Lexmark International, Inc.(a) | | 69,500 | | | 3,115,685 |
Motorola, Inc. | | 10,500,600 | | | 237,208,554 |
NCR Corp.(a) | | 2,231,850 | | | 75,748,989 |
Sun Microsystems, Inc.(a) | | 40,000,000 | | | 167,600,000 |
Xerox Corp.(a) | | 18,304,050 | | | 268,154,332 |
| | | | |
|
|
| | | | | | 1,517,783,657 |
| | | | |
|
|
| | | | | | 2,183,250,988 |
| MATERIALS: 4.5% | | | |
Akzo Nobel NV ADR(b) (Netherlands) | | 4,717,551 | | | 217,384,750 |
Alcoa, Inc. | | 2,275,650 | | | 67,290,971 |
Dow Chemical Co. | | 6,670,259 | | | 292,290,749 |
Engelhard Corp. | | 2,354,500 | | | 70,988,175 |
International Paper Co. | | 2,372,900 | | | 79,753,169 |
Lubrizol Corp. | | 59,700 | | | 2,592,771 |
Nova Chemicals Corp.(b) (Canada) | | 1,442,870 | | | 48,191,858 |
Rio Tinto PLC ADR(b) (United Kingdom) | | 849,900 | | | 155,353,221 |
Rohm and Haas Co. | | 2,802,800 | | | 135,711,576 |
| | | | |
|
|
| | | | | | 1,069,557,240 |
| TELECOMMUNICATION SERVICES: 0.6% | | | |
Vodafone Group PLC ADR(b)
(United Kingdom) | | 6,800,400 | | | 146,004,588 |
| | | | |
|
|
| | | | | | 146,004,588 |
| UTILITIES: 1.1% | | | |
Duke Energy Corp. | | 6,762,300 | | | 185,625,135 |
FirstEnergy Corp. | | 1,300,100 | | | 63,691,899 |
| | | | |
|
|
| | | | | | 249,317,034 |
| | | | |
|
|
TOTAL COMMON STOCKS (Cost $10,613,370,903) | | | 14,780,526,977 |
| | | | |
|
|
| | | | | | |
| FIXED-INCOME SECURITIES: 33.4% | | |
| | |
| | | PAR VALUE | | VALUE |
| U.S. TREASURY AND GOVERNMENT AGENCY: 11.8% |
| U.S. TREASURY: 10.9% | | | |
U.S. Treasury Notes | | | | | | |
1.875%, 1/31/06 | | $ | 225,000,000 | | $ | 224,648,550 |
2.25%, 4/30/06 | | | 100,000,000 | | | 99,347,700 |
2.375%, 8/31/06 | | | 250,000,000 | | | 246,679,750 |
3.50%, 11/15/06 | | | 58,500,000 | | | 58,040,658 |
2.875%, 11/30/06 | | | 350,000,000 | | | 345,146,550 |
3.125%, 1/31/07 | | | 400,000,000 | | | 394,406,400 |
3.375%, 2/15/08 | | | 200,000,000 | | | 195,882,800 |
3.75%, 5/15/08 | | | 350,000,000 | | | 345,023,350 |
3.625%, 7/15/09 | | | 375,000,000 | | | 365,830,125 |
3.375%, 9/15/09 | | | 300,000,000 | | | 289,980,600 |
| | | | | |
|
|
| | | | | | | 2,564,986,483 |
| GOVERNMENT AGENCY: 0.9% | | | |
Arkansas Dev. Fin. Auth. GNMA Guaranteed Bonds 9.75% , 11/15/14 | | | 4,535,762 | | | 5,091,710 |
Small Business Administration (504) | | | | | | |
Series 96-20L, 6.70%, 12/1/16 | | | 3,074,558 | | | 3,192,365 |
Series 97-20F, 7.20%, 6/1/17 | | | 5,046,977 | | | 5,302,141 |
Series 97-20I, 6.90%, 9/1/17 | | | 6,750,916 | | | 7,047,486 |
Series 98-20D, 6.15%, 4/1/18 | | | 8,559,218 | | | 8,816,549 |
Series 98-20I, 6.00%, 9/1/18 | | | 4,263,660 | | | 4,383,787 |
Series 99-20F, 6.80%, 6/1/19 | | | 5,871,015 | | | 6,192,922 |
Series 00-20D, 7.47%, 4/1/20 | | | 15,894,338 | | | 17,001,333 |
Series 00-20E, 8.03%, 5/1/20 | | | 6,745,259 | | | 7,372,574 |
Series 00-20G, 7.39%, 7/1/20 | | | 11,770,441 | | | 12,588,153 |
Series 00-20I, 7.21%, 9/1/20 | | | 6,770,865 | | | 7,259,512 |
Series 01-20E, 6.34%, 5/1/21 | | | 15,058,676 | | | 15,816,113 |
Series 01-20G, 6.625%, 7/1/21 | | | 12,339,216 | | | 13,108,436 |
Series 03-20J, 4.92%, 10/1/23 | | | 23,342,865 | | | 23,229,564 |
Series 05-20F, 4.57%, 6/1/25 | | | 47,506,642 | | | 46,047,680 |
Series 05-20K, 5.36%, 11/1/25 | | | 38,326,000 | | | 38,898,276 |
| | | | | |
|
|
| | | | | | | 221,348,601 |
| | | | | |
|
|
| | | | | | | 2,786,335,084 |
| MORTGAGE-RELATED SECURITIES: 11.5% |
| FEDERAL AGENCY CMO & REMIC: 1.6% | | | |
Dept. of Veterans Affairs | | | | | | |
Trust-1995 1A 1, 7.211%, 2/15/25 | | | 1,604,565 | | | 1,681,500 |
Trust 1995-2C 3A, 8.793%, 6/15/25 | | | 938,263 | | | 1,018,512 |
Fannie Mae | | | | | | |
Trust 1992-4H, 7.50%, 2/25/07 | | | 531,921 | | | 536,055 |
SMBS I-1, 6.50%, 4/1/09 | | | 66,972 | | | 67,588 |
Trust 2003-37 HA, 5.00%, 7/25/13 | | | 50,577,645 | | | 50,504,758 |
Trust (GN) 1994-13J, 7.00%, 6/17/22 | | | 1,329,686 | | | 1,335,284 |
Trust 1993-207 G, 6.15%, 4/25/23 | | | 5,788,731 | | | 5,837,244 |
Trust 2002-73 PM, 5.00%, 12/25/26 | | | 38,326,123 | | | 38,231,868 |
Trust 2002-33 A1, 7.00%, 6/25/32 | | | 7,734,715 | | | 8,080,356 |
Trust 2001-T7 A1, 7.50%, 2/25/41 | | | 7,592,663 | | | 7,921,722 |
Trust 2001-T8 A1, 7.50%, 7/25/41 | | | 8,109,819 | | | 8,486,885 |
Trust 2001-W3 A, 7.00%, 9/25/41 | | | 3,213,510 | | | 3,310,792 |
Trust 2002-W6 2A1, 7.00%, 6/25/42 | | | 7,696,160 | | | 7,989,571 |
| | |
| See accompanying Notes to Financial Statements | | Dodge & Cox Balanced Fund / 6 |
Portfolio of Investments | December 31, 2005 |
| | | | | | |
| FIXED-INCOME SECURITIES (continued) | | |
| | |
| | | PAR VALUE | | VALUE |
Fannie Mae (continued) | | | | | | |
Trust 2002-W8 A2, 7.00%, 6/25/42 | | $ | 8,686,588 | | $ | 8,995,960 |
Trust 2003-W2 1A1, 6.50%, 7/25/42 | | | 16,841,564 | | | 17,285,833 |
Trust 2003-W2 1A2, 7.00%, 7/25/42 | | | 6,777,124 | | | 6,984,984 |
Trust 2003-W4 4A, 7.50%, 10/25/42 | | | 9,895,305 | | | 10,358,340 |
Trust 2004-T1 1A2, 6.50%, 1/25/44 | | | 14,289,684 | | | 14,723,876 |
Trust 2004-W2 5A, 7.50%, 3/25/44 | | | 38,848,793 | | | 40,961,763 |
Trust 2005-W4 1A2, 6.50%, 8/25/45 | | | 47,402,381 | | | 48,657,596 |
Freddie Mac | | | | | | |
Series 1236 H, 7.25%, 4/15/07 | | | 721,346 | | | 728,973 |
Series 1512 I, 6.50%, 5/15/08 | | | 2,093,402 | | | 2,110,381 |
Series 1539 PL, 6.50%, 5/15/08 | | | 1,085,872 | | | 1,090,816 |
Series 2547 HA, 5.00%, 8/15/12 | | | 5,200,909 | | | 5,193,098 |
Series 2100 GS, 6.50%, 12/15/13 | | | 12,517,853 | | | 12,898,412 |
Series 2430 UC, 6.00%, 9/15/16 | | | 21,873,200 | | | 22,227,305 |
Series 1078 GZ, 6.50%, 5/15/21 | | | 1,626,126 | | | 1,657,366 |
Series (GN) 16 PK, 7.00%, 8/25/23 | | | 18,311,831 | | | 18,841,845 |
Series 2550 QP, 5.00%, 3/15/26 | | | 25,027,492 | | | 24,962,123 |
Series T-051 1A, 6.50%, 9/25/43 | | | 843,257 | | | 862,231 |
| | | | | |
|
|
| | | | | | | 373,543,037 |
| FEDERAL AGENCY MORTGAGE PASS-THROUGH: 9.9% | | | |
Fannie Mae, 10 Year | | | | | | |
6.00%, 1/1/12 - 10/1/14 | | | 46,292,899 | | | 47,249,018 |
Fannie Mae, 15 Year | | | | | | |
5.50%, 1/1/14 - 12/1/19 | | | 343,640,653 | | | 346,353,291 |
6.00%, 12/1/13 - 7/1/20 | | | 705,469,013 | | | 720,907,620 |
6.50%, 1/1/13 - 2/1/19 | | | 258,344,208 | | | 265,729,028 |
7.00%, 12/1/07 - 11/1/18 | | | 30,942,282 | | | 32,126,870 |
7.50%, 9/1/15 - 8/1/17 | | | 87,163,324 | | | 91,659,909 |
Fannie Mae, 20 Year | | | | | | |
6.50%, 1/1/22 | | | 12,801,728 | | | 13,135,284 |
Fannie Mae, 30 Year | | | | | | |
6.50%, 12/1/32 | | | 270,099,007 | | | 277,641,686 |
7.50%, 9/1/07 - 7/1/19 | | | 451,558 | | | 459,420 |
8.00%, 1/1/09 | | | 153,565 | | | 157,364 |
Fannie Mae Multifamily DUS | | | | | | |
Pool 555728, 4.019%, 8/1/13 | | | 431,222 | | | 407,076 |
Pool 555162, 4.835%, 1/1/13 | | | 17,894,709 | | | 17,715,430 |
Pool 555316, 4.874%, 2/1/13 | | | 6,416,145 | | | 6,366,545 |
Pool 760762, 4.89%, 4/1/12 | | | 16,115,000 | | | 16,013,392 |
Pool 555148, 4.963%, 1/1/13 | | | 5,420,008 | | | 5,402,639 |
Pool 555806, 5.105%, 10/1/13 | | | 3,965,099 | | | 3,983,375 |
Pool 461628, 5.32%, 4/1/14 | | | 10,714,844 | | | 10,887,013 |
Pool 545316, 5.636%, 12/1/11 | | | 5,229,508 | | | 5,369,618 |
Pool 323350, 5.65%, 11/1/08 | | | 2,041,047 | | | 2,061,851 |
Pool 545387, 5.862%, 1/1/12 | | | 9,523,604 | | | 9,883,112 |
Pool 545258, 5.936%, 11/1/11 | | | 1,328,602 | | | 1,381,289 |
Pool 380735, 5.965%, 10/1/08 | | | 20,541,391 | | | 20,882,093 |
Pool 323492, 5.988%, 1/1/09 | | | 5,987,613 | | | 6,103,175 |
Pool 545685, 6.017%, 4/1/12 | | | 30,687,974 | | | 31,997,466 |
Freddie Mac, 30 Year | | | | | | |
7.25%, 1/1/08 | | | 357 | | | 360 |
8.00%, 2/1/08 - 11/1/10 | | | 296,939 | | | 302,767 |
| | | | | | |
| | |
| | | PAR VALUE | | VALUE |
Freddie Mac, 30 Year (continued) | | | | | | |
8.25%, 2/1/17 | | $ | 27,068 | | $ | 27,629 |
8.75%, 5/1/10 | | | 49,992 | | | 52,152 |
Freddie Mac Gold, 15 Year | | | | | | |
5.50%, 8/1/14 - 1/1/17 | | | 46,838,371 | | | 47,196,364 |
6.00%, 10/1/13 - 10/1/18 | | | 222,328,960 | | | 226,896,856 |
6.50%, 7/1/14 - 9/1/18 | | | 105,204,116 | | | 107,953,948 |
7.00%, 5/1/08 - 4/1/15 | | | 4,898,051 | | | 5,011,625 |
7.75%, 7/25/21 | | | 1,664,135 | | | 1,758,122 |
Freddie Mac Gold, 30 Year | | | | | | |
7.47%, 3/17/23 | | | 553,411 | | | 581,897 |
8.50%, 1/1/23 | | | 254,591 | | | 265,948 |
Ginnie Mae, 30 Year | | | | | | |
7.50%, 1/15/08 - 10/15/25 | | | 7,479,202 | | | 7,838,994 |
7.97%, 4/15/20 - 1/15/21 | | | 3,205,190 | | | 3,409,364 |
| | | | | |
|
|
| | | | | | | 2,335,169,590 |
| PRIVATE LABEL CMO & REMIC SECURITIES: 0.0%(e) | | | |
Union Planters Mortgage Finance Corp. | | | | | | |
7.70%, 12/25/24 | | | 5,826,562 | | | 6,058,908 |
| | | | | |
|
|
| | | | | | | 2,714,771,535 |
| CORPORATE: 10.1% |
| FINANCIALS: 1.9% | | | |
BankAmerica Capital II(c) | | | | | | |
8.00%, 12/15/26, callable 2006 | | | 17,355,000 | | | 18,432,555 |
BankAmerica Capital Trust VI(c) | | | | | | |
5.625%, 3/8/35 | | | 10,000,000 | | | 9,865,060 |
Boston Properties, Inc. | | | | | | |
6.25%, 1/15/13 | | | 44,290,000 | | | 46,462,469 |
5.625%, 4/15/15 | | | 29,500,000 | | | 29,813,526 |
5.00%, 6/1/15 | | | 2,890,000 | | | 2,783,269 |
Citicorp Capital Trust I(c) | | | | | | |
7.933%, 2/15/27, callable 2007 | | | 12,540,000 | | | 13,379,014 |
Citigroup, Inc. (First Nationwide)
10.00%, 10/1/06 | | | 4,945,000 | | | 5,123,742 |
EOP Operating Limited Partnership(f) | | | | | | |
8.10%, 8/1/10 | | | 10,000,000 | | | 11,044,800 |
7.00%, 7/15/11 | | | 29,675,000 | | | 31,762,428 |
6.75%, 2/15/12 | | | 19,933,000 | | | 21,153,577 |
5.875%, 1/15/13 | | | 41,205,000 | | | 41,891,722 |
4.75%, 3/15/14 | | | 15,000,000 | | | 14,174,850 |
JPMorgan Chase (Bank One) 6.50%, 2/1/06 | | | 12,275,000 | | | 12,291,313 |
JPMorgan Chase Capital III (Bank One)(c) 8.75%, 9/1/30 | | | 23,760,000 | | | 31,936,315 |
Safeco Corp. | | | | | | |
4.875%, 2/1/10 | | | 15,131,000 | | | 15,019,621 |
7.25%, 9/1/12 | | | 13,672,000 | | | 15,240,958 |
St. Paul Travelers Companies, Inc. | | | | | | |
8.125%, 4/15/10 | | | 19,885,000 | | | 22,081,537 |
5.00%, 3/15/13 | | | 10,250,000 | | | 10,081,551 |
UnumProvident Corp. | | | | | | |
7.625%, 3/1/11 | | | 29,875,000 | | | 32,220,397 |
6.85%, 11/15/15(d) | | | 10,200,000 | | | 10,624,606 |
| | |
| 7 / Dodge & Cox Balanced Fund | | See accompanying Notes to Financial Statements |
Portfolio of Investments | December 31, 2005 |
| | | | | | |
| FIXED-INCOME SECURITIES (continued) | | |
| | |
| | | PAR VALUE | | VALUE |
UnumProvident Corp. (continued) | | | | | | |
7.19%, 2/1/28 | | $ | 8,500,000 | | $ | 8,401,221 |
6.75%, 12/15/28 | | | 23,830,000 | | | 23,350,064 |
7.375%, 6/15/32 | | | 13,665,000 | | | 14,335,268 |
UnumProvident Corp. (Provident Companies, Inc.) 7.25%, 3/15/28 | | | 7,520,000 | | | 7,758,407 |
| | | | | |
|
|
| | | | | | | 449,228,270 |
| INDUSTRIALS: 7.8% | | | |
Amerada Hess Corp. 7.875%, 10/1/29 | | | 26,780,000 | | | 32,427,447 |
AT&T Corp. | | | | | | |
9.05%, 11/15/11 | | | 27,972,000 | | | 30,960,109 |
9.75%, 11/15/31 | | | 97,500,000 | | | 122,472,090 |
CIGNA Corp. | | | | | | |
7.00%, 1/15/11 | | | 14,705,000 | | | 15,850,872 |
6.375%, 10/15/11 | | | 17,820,000 | | | 18,894,920 |
7.65%, 3/1/23 | | | 9,745,000 | | | 11,426,665 |
7.875%, 5/15/27 | | | 12,157,000 | | | 14,873,798 |
8.30%, 1/15/33 | | | 9,050,000 | | | 11,473,970 |
Comcast Corp. | | | | | | |
5.30%, 1/15/14 | | | 63,050,000 | | | 61,855,076 |
5.85%, 11/15/15 | | | 26,500,000 | | | 26,842,406 |
Cox Communications, Inc. | | | | | | |
5.45%, 12/15/14 | | | 69,530,000 | | | 67,847,583 |
5.50%, 10/1/15 | | | 15,265,000 | | | 14,816,011 |
Dillard’s, Inc. | | | | | | |
7.375%, 6/1/06 | | | 25,275,000 | | | 25,432,969 |
6.30%, 2/15/08 | | | 6,000,000 | | | 6,015,000 |
7.85%, 10/1/12 | | | 14,000,000 | | | 14,560,000 |
7.13%, 8/1/18 | | | 4,956,000 | | | 4,757,760 |
7.875%, 1/1/23 | | | 6,860,000 | | | 6,722,800 |
7.00%, 12/1/28 | | | 10,983,000 | | | 10,186,733 |
Dow Chemical Co. | | | | | | |
4.027%, 9/30/09(d) | | | 33,950,000 | | | 32,712,251 |
6.00%, 10/1/12 | | | 5,800,000 | | | 6,095,667 |
7.375%, 11/1/29 | | | 30,170,000 | | | 36,349,450 |
Electronic Data Systems Corp. 6.50%, 8/1/13 | | | 44,885,000 | | | 46,128,898 |
Federated Department Stores, Inc.
(May Department Stores Co.) | | | | | | |
7.625%, 8/15/13 | | | 5,900,000 | | | 6,616,620 |
7.45%, 10/15/16 | | | 9,300,000 | | | 10,412,745 |
7.875%, 3/1/30 | | | 13,815,000 | | | 16,475,548 |
6.90%, 1/15/32 | | | 54,484,000 | | | 58,492,551 |
8.125%, 8/15/35, callable 2015 | | | 12,825,000 | | | 14,183,232 |
7.875%, 8/15/36, callable 2016 | | | 10,440,000 | | | 11,478,435 |
Ford Motor Credit Co. | | | | | | |
7.375%, 2/1/11 | | | 82,755,000 | | | 72,536,247 |
7.25%, 10/25/11 | | | 142,415,000 | | | 123,026,052 |
GMAC | | | | | | |
6.125%, 1/22/08 | | | 5,465,000 | | | 5,004,459 |
5.125%, 5/9/08 | | | 9,065,000 | | | 8,069,971 |
7.75%, 1/19/10 | | | 35,100,000 | | | 32,779,434 |
6.875%, 9/15/11 | | | 170,470,000 | | | 155,459,264 |
| | | | | | |
| | |
| | | PAR VALUE | | VALUE |
HCA, Inc. | | | | | | |
8.75%, 9/1/10 | | $ | 27,750,000 | | $ | 30,691,417 |
7.875%, 2/1/11 | | | 23,798,000 | | | 25,586,586 |
6.95%, 5/1/12 | | | 14,090,000 | | | 14,614,768 |
6.30%, 10/1/12 | | | 4,750,000 | | | 4,773,717 |
6.25%, 2/15/13 | | | 34,250,000 | | | 34,274,352 |
6.75%, 7/15/13 | | | 22,400,000 | | | 23,096,326 |
5.75%, 3/15/14 | | | 9,285,000 | | | 9,003,683 |
Health Net, Inc. 9.875%, 4/15/11 | | | 50,170,000 | | | 58,362,811 |
Hewlett-Packard Co. 5.50%, 7/1/07 | | | 21,210,000 | | | 21,381,377 |
International Paper Co. 5.25%, 4/1/16 | | | 24,500,000 | | | 23,286,735 |
Lockheed Martin Corp. | | | | | | |
7.65%, 5/1/16 | | | 18,500,000 | | | 22,039,475 |
7.75%, 5/1/26 | | | 8,500,000 | | | 10,620,096 |
8.50%, 12/1/29 | | | 7,000,000 | | | 9,540,776 |
Raytheon Co. 6.75%, 8/15/07 | | | 20,476,000 | | | 20,977,048 |
Time Warner, Inc. (AOL Time Warner) | | | | | | |
7.625%, 4/15/31 | | | 92,450,000 | | | 102,956,850 |
7.70%, 5/1/32 | | | 47,530,000 | | | 53,455,042 |
Wyeth | | | | | | |
5.50%, 3/15/13 | | | 24,500,000 | | | 24,837,316 |
5.50%, 2/1/14 | | | 63,950,000 | | | 64,778,344 |
Wyeth (American Home Products) 6.95%, 3/15/11 | | | 7,950,000 | | | 8,576,166 |
Xerox Corp. | | | | | | |
7.125%, 6/15/10 | | | 13,800,000 | | | 14,369,250 |
6.875%, 8/15/11 | | | 125,880,000 | | | 130,285,800 |
7.20%, 4/1/16 | | | 10,000,000 | | | 10,500,000 |
| | | | | |
|
|
| | | | | | | 1,851,244,968 |
| TRANSPORTATION: 0.4% | | | |
Burlington Northern Santa Fe Railway 4.967%, 4/1/23 | | | 12,065,000 | | | 12,026,633 |
Consolidated Rail Corp. | | | | | | |
6.76%, 5/25/15, callable 2005 | | | 4,173,701 | | | 4,399,457 |
CSX Transportation, Inc. 9.75%, 6/15/20 | | | 5,351,000 | | | 7,305,426 |
FedEx Corp. 6.72%, 1/15/22 | | | 5,769,389 | | | 6,301,384 |
Norfolk Southern Corp. 9.75%, 6/15/20 | | | 7,389,000 | | | 10,347,231 |
Union Pacific Corp. 6.33%, 1/2/20 | | | 39,275,930 | | | 41,357,161 |
| | | | | |
|
|
| | | | | | | 81,737,292 |
| | | | | |
|
|
| | | | | | | 2,382,210,530 |
| | | | | |
|
|
TOTAL FIXED-INCOME SECURITIES
(Cost $7,889,508,349) | | | | | | 7,883,317,149 |
| | | | | |
|
|
| | |
| See accompanying Notes to Financial Statements | | Dodge & Cox Balanced Fund / 8 |
Portfolio of Investments | December 31, 2005 |
| | | | | | | | |
| | |
| | | PAR VALUE | | | VALUE | |
| SHORT-TERM INVESTMENTS: 5.0% | | | | |
SSgA Prime Money Market Fund | | $ | 120,044,816 | | | $ | 120,044,816 | |
State Street Repurchase Agreement 3.10%, 1/3/06, maturity value $574,260,733 (collateralized by U.S. Treasury Securities, value $585,547,500, 4.125%, 8/15/08) | | | 574,063,000 | | | | 574,063,000 | |
U.S. Treasury Bills | | | | | | | | |
1/19/06 | | | 100,000,000 | | | | 99,823,750 | |
2/9/06 | | | 100,000,000 | | | | 99,610,813 | |
3/2/06 | | | 150,000,000 | | | | 149,039,375 | |
4/13/06 | | | 150,000,000 | | | | 148,319,125 | |
| | | | | | |
|
|
|
TOTAL SHORT-TERM INVESTMENTS (Cost $1,190,900,879) | | | | | | | 1,190,900,879 | |
| | | | | | |
|
|
|
TOTAL INVESTMENTS
(Cost $19,693,780,131) | | | 101.0 | % | | | 23,854,745,005 | |
OTHER ASSETS LESS LIABILITIES | | | (1.0 | %) | | | (243,627,111 | ) |
| | |
|
|
| |
|
|
|
TOTAL NET ASSETS | | | 100.0 | % | | $ | 23,611,117,894 | |
| | |
|
|
| |
|
|
|
| (b) | | Foreign security denominated in U.S. dollars |
| (c) | | Cumulative preferred security |
| (d) | | Security exempt from registration under Rule 144A of the Securities Act of 1933. The security may be resold in transactions exempt from registration, normally to qualified institutional buyers. As of December 31, 2005, all such securities in total represented $43,336,857 or 0.2% of total net assets. |
| (f) | | EOP Operating LP is the operating partnership of Equity Office Properties Trust. |
When two issuers are identified, the first name refers to the acquirer or successor obligor, and the second name (within the parentheses) refers to the original issuer of the instrument.
ADR: American Depository Receipt
CMO: Collateralized Mortgage Obligation
REMIC: Real Estate Mortgage Investment Conduit
| | |
| 9 / Dodge & Cox Balanced Fund | | See accompanying Notes to Financial Statements |
Statement of Assets and Liabilities
| | | |
| |
| | | December 31, 2005 |
| Assets: | | | |
Investments, at value
(cost $19,693,780,131) | | $ | 23,854,745,005 |
Receivable for investments sold | | | 205,049,689 |
Receivable for paydowns on
mortgage-backed securities | | | 33,063 |
Receivable for Fund shares sold | | | 23,072,295 |
Dividends and interest receivable | | | 101,553,972 |
Prepaid expenses and other assets | | | 126,851 |
| | |
|
|
| | | | 24,184,580,875 |
| | |
|
|
| Liabilities: | | | |
Payable for investments purchased | | | 220,511,491 |
Payable for Fund shares redeemed | | | 341,444,901 |
Management fees payable | | | 10,164,903 |
Accrued expenses | | | 1,341,686 |
| | |
|
|
| | | | 573,462,981 |
| | |
|
|
| Net Assets | | $ | 23,611,117,894 |
| | |
|
|
| Net Assets Consist of: | | | |
Paid in capital | | $ | 19,424,683,266 |
Undistributed net investment income | | | 1,855,600 |
Undistributed net realized gain on investments | | | 23,614,154 |
Net unrealized appreciation on investments | | | 4,160,964,874 |
| | |
|
|
| | | $ | 23,611,117,894 |
| | |
|
|
| | | | |
Fund shares outstanding (par value
$0.01 each, unlimited shares authorized) | | | 290,287,176 |
Net asset value per share | | | $81.34 |
| |
| Statement of Operations | | | |
| |
| | | Year Ended
December 31, 2005 |
| Investment Income: | | | |
Dividends (net of foreign taxes of $5,302,861) | | $ | 231,810,845 |
Interest | | | 372,042,028 |
| | |
|
|
| | | | 603,852,873 |
| | |
|
|
| Expenses: | | | |
Management fees | | | 112,502,736 |
Custody and fund accounting fees | | | 372,583 |
Transfer agent fees | | | 4,223,777 |
Professional services | | | 96,705 |
Shareholder reports | | | 1,515,785 |
Registration fees | | | 400,956 |
Trustees’ fees | | | 118,625 |
Miscellaneous | | | 166,409 |
| | |
|
|
| | | | 119,397,576 |
| | |
|
|
| Net Investment Income | | | 484,455,297 |
| | |
|
|
| Realized and Unrealized Gain on Investments: | | | |
Net realized gain | | | 380,394,201 |
Net change in unrealized appreciation | | | 614,634,805 |
| | |
|
|
Net realized and unrealized gain | | | 995,029,006 |
| | |
|
|
| Net Increase in Net Assets from Operations | | $ | 1,479,484,303 |
| | |
|
|
Statement of Changes in Net Assets
| | | | | | | | |
| | |
| | | Year Ended
December 31, 2005 | | | Year Ended
December 31, 2004 | |
| Operations: | | | | | | | | |
Net investment income | | $ | 484,455,297 | | | $ | 335,315,614 | |
Net realized gain | | | 380,394,201 | | | | 481,678,527 | |
Net change in unrealized appreciation | | | 614,634,805 | | | | 1,431,190,315 | |
| | |
|
|
| |
|
|
|
Net increase in net assets from operations | | | 1,479,484,303 | | | | 2,248,184,456 | |
| | |
|
|
| |
|
|
|
| | | | | | | | | |
| | |
Distributions to
Shareholders from: | | | | | | | | |
Net investment income | | | (521,701,708 | ) | | | (375,772,802 | ) |
Net realized gain | | | (378,288,293 | ) | | | (421,379,430 | ) |
| | |
|
|
| |
|
|
|
Total distributions | | | (899,990,001 | ) | | | (797,152,232 | ) |
| | |
|
|
| |
|
|
|
| | |
| Fund Share Transactions | | | | | | | | |
Proceeds from sale of shares | | | 4,371,007,401 | | | | 7,695,755,433 | |
Reinvestment of distributions | | | 863,011,478 | | | | 764,041,016 | |
Cost of shares redeemed | | | (2,943,041,611 | ) | | | (2,365,810,731 | ) |
| | |
|
|
| |
|
|
|
Net increase from Fund
share transactions | | | 2,290,977,268 | | | | 6,093,985,718 | |
| | |
|
|
| |
|
|
|
Total increase in net assets | | | 2,870,471,570 | | | | 7,545,017,942 | |
| | |
| Net Assets: | | | | | | | | |
Beginning of year | | | 20,740,646,324 | | | | 13,195,628,382 | |
| | |
|
|
| |
|
|
|
End of year (including undistributed net investment income of $1,855,600 and $2,707,898, respectively) | | $ | 23,611,117,894 | | | $ | 20,740,646,324 | |
| | |
|
|
| |
|
|
|
| | |
| Share Information: | | | | | | | | |
Shares sold | | | 54,872,290 | | | | 102,173,318 | |
Distributions reinvested | | | 10,731,145 | | | | 9,851,544 | |
Shares redeemed | | | (36,701,989 | ) | | | (31,310,833 | ) |
| | |
|
|
| |
|
|
|
Net increase in
shares outstanding | | | 28,901,446 | | | | 80,714,029 | |
| | |
|
|
| |
|
|
|
| | |
| See accompanying Notes to Financial Statements | | Dodge & Cox Balanced Fund / 10 |
Notes to Financial Statements
Note 1 — Organization and Significant Accounting Policies
Dodge & Cox Balanced Fund (the “Fund”) is one of the series constituting the Dodge & Cox Funds (the “Trust” or the “Funds”). The Trust is organized as a Delaware statutory trust and is registered under the Investment Company Act of 1940, as amended, as a diversified, open-end management investment company. The Fund commenced operations on June 26, 1931, and seeks regular income, conservation of principal and an opportunity for long-term growth of principal and income. Risk considerations and investment strategies of the Fund are discussed in the Fund’s Prospectus. The Fund is closed to new investors.
The financial statements have been prepared in conformity with accounting principles generally accepted in the United States of America, which require the use of estimates and assumptions by management. Significant accounting policies are as follows:
Security valuation. The Fund’s net assets are valued as of the close of trading on the New York Stock Exchange (NYSE), generally 4:00 p.m. Eastern Time, each day that the NYSE is open for business. Stocks are valued at market, using as a price the official quoted close price or the last sale of the day at the close of the NYSE or, if not available, at the mean between the exchange-listed bid and ask prices for the day. A security that is listed or traded on more than one exchange is valued at the quotation on the exchange determined to be the primary market for such security. Fixed-income securities with original maturities of one year or more are priced on the basis of valuations furnished by pricing services which utilize both dealer-supplied valuations and electronic data processing techniques. Under certain circumstances, fixed-income securities that are not valued by pricing services are temporarily valued by the investment manager utilizing both dealer-supplied valuations and electronic data processing techniques. Valuations of fixed-income securities take into account appropriate factors such as institutional-size trading markets in similar groups of securities, yield, quality, coupon rate, maturity, type of issue, trading characteristics and other market data and do not rely exclusively upon exchange or over-the-counter listed prices. Security values are not discounted based on the size of the Fund’s position. Securities for which market quotations are not readily available are valued at fair value as determined in good faith by or at the direction of the
Board of Trustees. Short-term securities are valued at amortized cost which approximates current value. All securities held by the Fund are denominated in U.S. dollars.
Security transactions, investment income, expenses, and distributions. Security transactions are recorded on the trade date. Realized gains and losses on securities sold are determined on the basis of identified cost.
Dividend income and corporate action transactions are recorded on the ex-dividend date, except for certain dividends or corporate actions from foreign securities where the ex-dividend date may have passed, which are recorded as soon as the Fund is informed of the ex-dividend date. Withholding taxes on foreign dividends have been provided for in accordance with the Fund’s understanding of the applicable country’s tax rules and rates. Non-cash dividends included in dividend income, if any, are recorded at the fair market value of the securities received. Distributions received in excess of income are recorded as a reduction of cost of investments and/or realized gain. The Fund may estimate the character of distributions received from Real Estate Investment Trusts (“REITs”).
Interest income is recorded on the accrual basis. Interest income includes coupon interest, amortization of premium and accretion of discount on debt securities, and gains and losses on paydowns of mortgage-backed securities. The ability of the issuers of the debt securities held by the Fund to meet their obligations may be affected by economic developments in a specific industry, state or region. Debt obligations may be placed on non-accrual status and related interest income may be reduced by ceasing current accruals and writing off interest receivables when the collection of all or a portion of interest has become doubtful based on consistently applied procedures. A debt obligation is removed from non-accrual status when the issuer resumes interest payments or when collectibility of interest is reasonably assured.
Expenses are recorded on the accrual basis. Most expenses of the Trust can be directly attributed to a specific series. Expenses which cannot be directly attributed are apportioned among the Funds in the Trust.
Distributions to shareholders are recorded on the ex-dividend date.
Repurchase agreements. The Fund may enter into repurchase agreements secured by U.S. government securities which involve the
| | |
| 11 / Dodge & Cox Balanced Fund | | |
Notes to Financial Statements (continued)
purchase of securities from a counterparty with a simultaneous commitment to resell the securities at an agreed-upon date and price. It is the Fund’s policy that its custodian take possession of the underlying collateral securities, the fair value of which exceeds the principal amount of the repurchase transaction, including accrued interest, at all times. In the event of default by the counterparty, the Fund has the contractual right to liquidate the securities and to apply the proceeds in satisfaction of the obligation.
Note 2 — Related Party Transactions
Management fees. Under a written agreement, the Fund pays an annual management fee of 0.50% of the Fund’s average daily net assets to Dodge & Cox, investment manager of the Fund.
Fund officers and trustees. All officers and four of the trustees of the Trust are officers or employees of Dodge & Cox. The Trust pays a fee only to those trustees who are not affiliated with Dodge & Cox.
Indemnification. Under the Trust’s organizational documents, its officers and trustees are indemnified against certain liabilities arising out of the performance of their duties to the Trust. In addition, in the normal course of business the Trust enters into contracts that provide general indemnities to other parties. The Trust’s maximum exposure under these arrangements is unknown as this would involve future claims that may be made against the Trust that have not yet occurred.
Note 3 — Income Tax Information and Distributions to Shareholders
A provision for federal income taxes is not required since the Fund intends to continue to qualify as a regulated investment company under Subchapter M of the Internal Revenue Code and distribute all of its taxable income to shareholders. Distributions are determined in accordance with income tax regulations, which may differ from
net investment income and realized gains for financial reporting purposes. Financial reporting records are adjusted for permanent book/tax differences to reflect tax character. Financial records are not adjusted for temporary differences.
Book/tax differences are primarily due to differing treatment of net short-term realized gain and paydown loss. At December 31, 2005, the cost of investments for federal income tax purposes was equal to the cost for financial reporting purposes.
Distributions during the year ended December 31, 2005 were characterized as follows for federal income tax purposes:
| | | |
Ordinary income ($1.866 per share) | | $ | 528,868,924 |
Long-term capital gain ($1.294 per share) | | | 371,121,077 |
| | |
|
|
Total distributions ($3.160 per share) | | $ | 899,990,001 |
| | |
|
|
At December 31, 2005, the tax basis components of distributable earnings were as follows:
| | | | |
Unrealized appreciation | | $ | 4,334,573,066 | |
Unrealized depreciation | | | (173,608,192 | ) |
| | |
|
|
|
Net unrealized appreciation | | | 4,160,964,874 | |
Undistributed ordinary income | | | 1,855,600 | |
Undistributed long-term capital gain | | | 23,614,154 | |
Note 4 — Purchase and Sales of Investments
For the year ended December 31, 2005, purchases and sales of securities, other than short-term securities and U.S. government securities, aggregated $3,909,742,779 and $2,047,388,942, respectively. For the year ended December 31, 2005, purchases and sales of U.S. government securities aggregated $4,266,223,442 and $3,373,718,117, respectively.
| | |
| | | Dodge & Cox Balanced Fund / 12 |
Financial Highlights
| | | | | | | | | | | | | | | | | |
SELECTED DATA AND RATIOS
(for a share outstanding throughout each year) | | | | Year Ended December 31, | |
| | | | | 2005 | | | 2004 | | | 2003 | | | 2002 | | | 2001 | |
Net asset value, beginning of year | | | | $79.35 | | | $73.04 | | | $60.75 | | | $65.42 | | | $63.42 | |
| | | | | | |
Income from investment operations: | | | | | | | | | | | | | | | | | |
Net investment income | | | | 1.84 | | | 1.60 | | | 1.66 | | | 1.89 | | | 2.12 | |
Net realized and unrealized gain (loss) | | | | 3.31 | | | 7.99 | | | 12.96 | | | (3.80 | ) | | 4.07 | |
| | | | |
|
|
Total from investment operations | | | | 5.15 | | | 9.59 | | | 14.62 | | | (1.91 | ) | | 6.19 | |
| | | | |
|
|
Distributions to shareholders from: | | | | | | | | | | | | | | | | | |
Net investment income | | | | (1.84 | ) | | (1.60 | ) | | (1.66 | ) | | (1.88 | ) | | (2.14 | ) |
Net realized gain | | | | (1.32 | ) | | (1.68 | ) | | (0.67 | ) | | (0.88 | ) | | (2.05 | ) |
| | | | |
|
|
Total distributions | | | | (3.16 | ) | | (3.28 | ) | | (2.33 | ) | | (2.76 | ) | | (4.19 | ) |
| | | | |
|
|
Net asset value, end of year | | | | $81.34 | | | $79.35 | | | $73.04 | | | $60.75 | | | $65.42 | |
| | | | |
|
|
Total return | | | | 6.59 | % | | 13.31 | % | | 24.44 | % | | (2.94 | )% | | 10.06 | % |
Ratios/supplemental data: | | | | | | | | | | | | | | | | | |
Net assets, end of year (millions) | | | | $23,611 | | | $20,741 | | | $13,196 | | | $7,885 | | | $6,040 | |
Ratio of expenses to average net assets | | | | 0.53 | % | | 0.54 | % | | 0.54 | % | | 0.53 | % | | 0.53 | % |
Ratio of net investment income to average net assets | | | | 2.15 | % | | 1.97 | % | | 2.40 | % | | 3.05 | % | | 3.28 | % |
Portfolio turnover rate | | | | 18 | % | | 18 | % | | 19 | % | | 25 | % | | 21 | % |
| | |
| 13 / Dodge & Cox Balanced Fund | | See accompanying Notes to Financial Statements |
Report of Independent Registered Public Accounting Firm
To the Trustees of Dodge & Cox Funds and Shareholders of Dodge & Cox Balanced Fund
In our opinion, the accompanying statement of assets and liabilities, including the portfolio of investments, and the related statements of operations and of changes in net assets and the financial highlights present fairly, in all material respects, the financial position of the Dodge & Cox Balanced Fund (the “Fund”, one of the series constituting Dodge & Cox Funds) at December 31, 2005, the results of its operations for the year then ended, the changes in its net assets for each of the two years in the period then ended and the financial highlights for each of the five years in the period then ended, in conformity with accounting principles generally accepted in the United States of America. These financial statements and financial highlights (hereafter referred to as “financial statements”) are the responsibility of the Fund’s management; our responsibility is to express an opinion on these financial statements based on our audits. We conducted our audits of these financial statements in accordance with the standards of the Public Company Accounting Oversight Board (United States). Those standards require that we plan and perform the audit to obtain reasonable assurance about whether the financial statements are free of material misstatement. An audit includes examining, on a test basis, evidence supporting the amounts and disclosures in the financial statements, assessing the accounting principles used and significant estimates made by management, and evaluating the overall financial statement presentation. We believe that our audits, which included confirmation of securities at December 31, 2005 by correspondence with the custodian and brokers, provide a reasonable basis for our opinion.
PricewaterhouseCoopers LLP
San Francisco, California
February 16, 2006
| | |
| | | Dodge & Cox Balanced Fund / 14 |
Special 2005 Tax Information (unaudited)
The following information is provided pursuant to provisions of the Internal Revenue Code:
The Fund designates $223,706,681 of its distributions paid to shareholders in 2005 as qualified dividends (treated for federal income tax purposes in the hands of shareholders as taxable at a maximum rate of 15%).
For shareholders that are corporations, the Fund designates 31% of its ordinary dividends (including short-term gains) paid to shareholders in 2005 as dividends from domestic corporations eligible for the corporate dividends received deduction, provided that the shareholder otherwise satisfies applicable requirements to claim that deduction.
Shareholder Meeting Results (unaudited)
On December 2, 2005, a joint special meeting of shareholders of the Dodge & Cox Funds was held at which the nine Trustees and nominees identified below were elected. The following is a report of the total votes cast by the Funds’ shareholders:
PROPOSAL: Election of Trustees
| | | | | | |
| | | FOR | | WITHHELD | | TOTAL |
Trustees: | | | | | | |
1. William F. Ausfahl | | 1,184,162,195 | | 11,475,032 | | 1,195,637,227 |
2. L. Dale Crandall | | 1,186,779,006 | | 8,858,221 | | 1,195,637,227 |
3. Dana M. Emery | | 1,186,497,036 | | 9,140,191 | | 1,195,637,227 |
4. John A. Gunn | | 1,186,448,522 | | 9,188,705 | | 1,195,637,227 |
5. Harry R. Hagey | | 1,186,227,617 | | 9,409,610 | | 1,195,637,227 |
6. Thomas A. Larsen | | 1,159,731,462 | | 35,905,765 | | 1,195,637,227 |
7. Will C. Wood | | 1,187,752,504 | | 7,884,723 | | 1,195,637,227 |
| | | |
Nominees: | | | | | | |
8. Kenneth E. Olivier | | 1,158,621,330 | | 37,015,897 | | 1,195,637,227 |
9. John B. Taylor | | 1,187,597,104 | | 8,040,123 | | 1,195,637,227 |
Board Approval of Funds’ Investment Management Agreements and Management Fees (unaudited)
The Board of Trustees is responsible for overseeing the performance of the Dodge & Cox Funds’ investment manager and determining whether to continue the Investment Management Agreements between the Funds and Dodge & Cox each year (the
“Agreements”). At a meeting of the Board of Trustees of the Trust held on December 16, 2005, the Trustees, by a unanimous vote (including a separate vote of those Trustees who are not “interested persons” (as defined in the Investment Company Act of 1940) (the “Independent Trustees”)), approved the renewal of the Agreements for an additional one-year term through December 31, 2006. During the course of the year, the Board received a wide variety of materials relating to the services provided by Dodge & Cox and the performance of the Funds.
Information Received
In advance of the meeting, the Board, including each of the Independent Trustees, requested, received and reviewed materials relating to the Agreements. The Independent Trustees retained Morningstar® to prepare an independent expense and performance summary for each Fund and comparable funds managed by other advisers identified by Morningstar®. The Morningstar® materials included information regarding advisory fee rates, expense ratios, and transfer agency, custodial and distribution expenses, as well as performance comparisons to an appropriate index or combination of indices. The materials reviewed by the Board also included information concerning Dodge & Cox’s profitability, financial results and condition, including advisory fee revenue and separate account advisory fee schedules. The Board additionally considered the Funds’ brokerage commissions, turnover rates and sales and redemption data for the Funds, including “soft dollar” payments made for research benefiting the Funds and other accounts managed by Dodge & Cox, and brokerage commissions and expenses paid by Dodge & Cox. Other aspects of Dodge & Cox’s services to the Funds which were reviewed included compliance and supervision of third-party service providers (e.g., custodian, “blue sky” administrator, transfer agent and fund accountant), shareholder servicing, accounting and administrative services, web services, the character of non-advisory services, the record of compliance with the Funds’ investment policies and restrictions and the Funds’ Code of Ethics, investment management staffing and biographies, information furnished to investors and shareholders (including the Funds’ prospectus, Statement of Additional Information, shareholder reports, and quarterly reports), and third-party retirement plan administrator reimbursements by Dodge & Cox for the same periods.
The Board received a memorandum from the Independent Legal Counsel to the Independent Trustees, discussing the factors generally regarded as appropriate to consider in evaluating advisory arrangements and copies of the Agreements. The Trust’s Governance Committee, consisting solely of Independent Trustees, met with the Independent Legal Counsel on December 1, 2005 to
| | |
| 15 / Dodge & Cox Balanced Fund | | |
discuss whether to renew the Agreements. The Board, including the Independent Trustees, subsequently concluded that the existing Agreements are fair and reasonable and voted to approve the Agreements.
In considering the Agreements, the Board, including the Independent Trustees, did not identify any single factor or particular information as all-important or controlling. In reaching the decision to approve the Agreements, the Board, which was advised by Independent Legal Counsel, considered the following factors, among others, and reached the conclusions described below.
Nature, Quality, and Extent of the Services
The Board considered the nature, quality and extent of portfolio management, administrative and shareholder services performed by Dodge & Cox, including: Dodge & Cox’s established long-term history of care and conscientiousness in the management of the Funds; demonstrated consistency in investment approach and depth, background and experience of the Dodge & Cox Investment Policy Committee, International Investment Policy Committee, Fixed Income Strategy Committee and research analysts responsible for managing the Funds; Dodge & Cox’s organizational structure; frequent favorable recognition of Dodge & Cox and the Funds in the media and industry publications; Dodge & Cox’s performance in the areas of compliance, administration and shareholder communication and services, supervision of Fund operations and general oversight of other service providers; favorable peer group comparisons of expense ratios, management fee comparisons, expenses (e.g., transfer agent, custody and other fees and expenses) and asset comparisons and performance and risk summaries prepared independently by Morningstar® and favorable fiduciary grade and “Star” rankings by Morningstar®. The Board also acknowledged Dodge & Cox’s decision to close its institutional equity and balanced separate account business and had previously voted, at the recommendation of Dodge & Cox, to close the Stock and Balanced Funds to control the pace of growth. The Board also acknowledged that the services provided by Dodge & Cox are extensive in nature and that Dodge & Cox consistently delivered a high level of service. The Board concluded that it was satisfied with the nature, extent and quality of investment management and other services provided to the Funds by Dodge & Cox.
Investment Performance
The Board considered short-term and long-term investment performance for each Fund (including periods of outperformance or
underperformance) as compared to both relevant indices and the performance of such Fund’s peer group. While not dispositive in the determination, performance information prepared by Morningstar® and Dodge & Cox demonstrated to the Board a consistent pattern of favorable performance for investors and, in most instances, the Funds have outperformed their peer groups for short and long-term periods. The Board also noted that the strong investment performance delivered by Dodge & Cox to the Funds appeared to be consistent with the performance delivered for other (non-Fund) clients of Dodge & Cox. The Board concluded that Dodge & Cox delivers favorable performance for Fund investors consistent with the long-term investment strategies being pursued by the Funds.
Costs and Ancillary Benefits
Costs of Services to Funds: Fees and Expenses. The Board considered each Fund’s management fee rates and expense ratios relative to industry averages for similar mutual funds and relative to management fees charged by Dodge & Cox to other (non-fund) clients. The Board evaluated the operating structures of the Funds and Dodge & Cox—which included a centralized focus on investment management operations, outsourcing of non-advisory support services to unaffiliated third-party service providers, avoiding the practice of charging front-end sales commissions or distribution fees, having Dodge & Cox pay for distribution-related costs and reimbursements to third-party retirement plan administrators, receiving numerous administrative, regulatory compliance, and shareholder support services from Dodge & Cox without any additional administrative fee, and achieving relatively low transaction costs and portfolio turnover rates. The Board noted that the Funds are substantially below peer group averages in expense ratios and management fee rates. The Board also noted that the range of services under the Agreements is much more extensive than under Dodge & Cox’s separate advisory (non-fund) client agreements, and that there are reasonable justifications for differences in fee rates charged between the two lines of business. The Board concluded that costs incurred by the Funds for the services it receives (including the management fee paid to Dodge & Cox) are reasonable and that the fees are acceptable based upon the qualifications, experience, reputation, and performance of Dodge & Cox and the low overall expense ratios of the Funds.
Profitability and Costs of Services to Dodge & Cox; “Fall-out” Benefits. The Board reviewed reports of Dodge & Cox’s financial position, profitability and estimated overall value, and they considered Dodge & Cox’s overall profitability within its context as a private, employee-owned S-Corporation and relative to the favorable services provided. The Board considered recent increases to Dodge
| | |
| | | Dodge & Cox Balanced Fund / 16 |
& Cox’s gross revenues, and noted the importance of Dodge & Cox’s profitability—which is derived solely from management fees and does not include other business ventures—to maintain its independence, company culture and ethics, and management continuity. They noted that Dodge & Cox’s profitability is enhanced due to its efficient internal business model, and that the compensation/profit structure at Dodge & Cox is vital for remaining independent and facilitating retention of its management and investment professionals. They also noted that Dodge & Cox has voluntarily limited growth of assets by closing the Stock and Balanced Funds to new investors and by not taking on new equity and balanced separate account clients. The Board noted that these actions were financially disadvantageous to Dodge & Cox, but illustrated a commitment to act in the best interest of existing Fund shareholders and separate account clients. The Board considered potential “fall-out” benefits (including the receipt of research from unaffiliated brokers) that Dodge & Cox might receive in its association with the Funds, and they concluded that these benefits are reasonable in light of Dodge & Cox’s well established stand-alone separate account business. The Board also noted the extent of additional administrative services performed by Dodge & Cox for the Funds, and that the magnitude of costs and risks borne by Dodge & Cox in rendering advisory services to the Funds (including risks in the compliance, securities valuation and investment management processes) are increasing. The Board concluded that the profitability of Dodge & Cox’s relationship with the Funds (including fall-out benefits) was fair and reasonable.
The Benefit of Economies of Scale
The Board considered whether there have been economies of scale with respect to the management of each Fund, whether the Funds have appropriately benefited from any economies of scale, and whether the management fee rate is reasonable in relation to the Fund assets and any economies of scale that may exist. The Board noted that considerable efficiencies of the Funds’ organization and fee structure have been realized by shareholders at the outset of their investment (i.e., from the first dollar), such as management fee rates that start lower than industry and many peer group averages and management fees and overall expense ratios that are lower than averages for peer group funds with approximately the same level of assets. Shareholders also realize efficiencies from the outset of their investment due to organizational efficiencies involved with Dodge & Cox’s investment management process and with avoiding distribution and marketing structures whose costs would ultimately be borne by the Funds. The Board noted that Dodge & Cox’s internal costs of providing investment management, administrative, and compliance services to the Funds have
increased. The Board’s decision to renew the Agreements was made after consideration of economies of scale and review of comparable fund expense ratios and historical expense ratio patterns for the Funds. Their review also included consideration of the desirability of adding breakpoints to the Funds’ fee schedules. The Board concluded that the current Dodge & Cox fee structure is fair and reasonable and adequately reflect economies of scale.
Conclusion
Based on their evaluation of all material factors and assisted by the advice of Independent Legal Counsel to the Independent Trustees, the Board, including the Independent Trustees, concluded that the advisory fee structure was fair and reasonable, that each Fund was paying a competitive fee for the services provided, that the scope and quality of Dodge & Cox’s services has provided substantial value for Fund shareholders over the long-term, and that approval of the Agreements was in the best interests of each Fund and its shareholders.
Fund Holdings
The Fund provides a complete list of its holdings four times in each fiscal year, at the quarter-ends. The lists appear in the Fund’s First Quarter, Semi-Annual, Third Quarter and Annual Reports to shareholders. The Fund files the lists with the Securities and Exchange Commission (SEC) on Form N-CSR (second and fourth quarters) and Form N-Q (first and third quarters). Shareholders may view the Fund’s Forms N-CSR and N-Q on the SEC’s website at www.sec.gov. Forms N-CSR and N-Q may also be reviewed and copied at the SEC’s Public Reference Room in Washington, DC. Information regarding the operations of the Public Reference Room may be obtained by 1-202-942-8090 (direct) or 1-800-732-0330 (general SEC number). A complete list of the Fund’s quarter-end holdings are also available at www.dodgeandcox.com on or about 15 days following each quarter end.
Proxy Voting
For a free copy of the Fund’s proxy voting policies and procedures, please call 1-800-621-3979, visit www.dodgeandcox.com or the SEC’s web site at www.sec.gov. Information regarding how Dodge & Cox, on behalf of the Fund, voted proxies relating to the Fund’s portfolio securities for the most recent twelve-month period ending June 30 is also available at www.dodgeandcox.com or the SEC’s web site at www.sec.gov.
| | |
| 17 / Dodge & Cox Balanced Fund | | |
THIS PAGE INTENTIONALLY LEFT BLANK
| | |
| | | Dodge & Cox Balanced Fund / 18 |
Dodge & Cox Funds—Executive Officer & Trustee Information
| | | | | | |
Name (Age) and
Address* | | Position with Trust
(Year of Election or
Appointment) | | Principal Occupation During Past 5 Years | | Other Directorships Held by Trustees |
| Interested Trustees & Officers |
Harry R. Hagey (64) | | Chairman and Trustee (Trustee since 1975) | | Chairman and Director of Dodge & Cox, Portfolio Manager and member of Investment Policy Committee (IPC) | | — |
John A. Gunn (62) | | President and Trustee
(Trustee since 1985) | | Chief Executive Officer (since December, 2005), Chief Investment Officer and Director of Dodge & Cox, Portfolio Manager, and member of IPC, Fixed-Income Strategy Committee (FISC) and International Investment Policy Committee (IIPC) | | — |
Dana M. Emery (44) | | Vice President and Trustee (Trustee since 1993) | | Executive Vice President (since December, 2005) and Director of Dodge & Cox, Manager of the Fixed-Income Department, Portfolio Manager and member of IPC and FISC | | — |
Kenneth E. Olivier (53) | | Vice President and Trustee
(Trustee since 2005) | | President (since December, 2005) and Director of Dodge & Cox, Portfolio Manager and member of IPC | | — |
A. Horton Shapiro (66) | | Executive Vice President (Since 1998) | | Senior Vice President and Director of Dodge & Cox, Portfolio Manager | | — |
| Katherine Herrick Drake (51) | | Vice President (Since 1993) | | Vice President of Dodge & Cox, Portfolio Manager | | — |
| Diana S. Strandberg (46) | | Vice President
(Since 2005) | | Vice President of Dodge & Cox, Portfolio Manager and member of IPC and IIPC | | |
John M. Loll (39) | | Treasurer and Assistant Secretary (Since 2000) | | Vice President and Treasurer of Dodge & Cox | | — |
| Thomas M. Mistele (52) | | Secretary and Assistant Treasurer (Since 2000) | | Chief Operating Officer (since 2004), Director (since 2005), Secretary and General Counsel of Dodge & Cox | | — |
| Marcia P. Venegas (37) | | Chief Compliance Officer
(Since 2004) | | Chief Compliance Officer of Dodge & Cox (since 2005), Compliance Officer of Dodge & Cox (2003-2004); Compliance and Business Risk Manager of Deutsche Asset Management, Australia Limited (1999-2001) | | — |
| Independent Trustees |
William F. Ausfahl (65) | | Trustee (Since 2002) | | CFO, The Clorox Co. (1982-1997); Director, The Clorox Co. (1984-1997) | | — |
L. Dale Crandall (64) | | Trustee (Since 1999) | | President, Kaiser Foundation Health Plan, Inc. and Kaiser Foundation Hospitals (2000-2002); Senior Vice President—Finance and Administration & CFO, Kaiser Foundation Health Plan, Inc. and Kaiser Foundation Hospitals (1998-2000) | | Director, Union BanCal Corporation (bank holding company) and Union Bank of California (commercial bank) (2001-Present); Director, Covad Communications Group (broadband communications services) (2002-Present); Director, Ansell Limited (medical equipment and supplies) (2002-Present); Director, BEA Systems, Inc. (software and programming) (2003-Present); Director, Coventry Health Care, Inc. (managed healthcare) (2004-Present) |
Thomas A. Larsen (56) | | Trustee (Since 2002) | | Director in Howard, Rice, Nemerovski, Canady, Falk & Rabkin (law firm) | | — |
John B. Taylor (60) | | Trustee (Since 2005) | | Professor of Economics, Stanford University; Senior Fellow, Hoover Institution; Under Secretary for International Affairs, United States Treasury (2001-2005) | | — |
Will C. Wood (66) | | Trustee (Since 1992) | | Principal, Kentwood Associates, Financial Advisers | | Director, Banco Latinoamericano de Exportaciones S.A. (Latin American Foreign Trade Bank) (1999-Present) |
| * | | The address for each Officer and Trustee is 555 California Street, 40th Floor, San Francisco, California 94104. Each Officer and Trustee oversees all four series in the Dodge & Cox Funds complex and serves for an indefinite term. |
Additional information about the Trust’s Trustees is available in the Trust’s Statement of Additional Information (SAI). You can get a free copy of the SAI by contacting Dodge & Cox Funds at 1-800-621-3979.

Income Fund
Established 1989

17th Annual Report
December 31, 2005
2005
Income Fund
www.dodgeandcox.com
For Fund literature, transactions and account
information, please visit the Funds’ web site.
or write or call:
Dodge & Cox Funds
c/o Boston Financial Data Services
P.O. Box 8422
Boston, Massachusetts 02266-8422
(800) 621-3979
Investment Manager
Dodge & Cox
555 California Street, 40th Floor
San Francisco, California 94104
(415) 981-1710
This report is submitted for the general information of the shareholders of the Fund. The report is not authorized for distribution to prospective investors in the Fund unless it is accompanied by a current prospectus.
This report reflects our views, opinions and portfolio holdings as of December 31, 2005, the end of the reporting period. Any such views are subject to change at any time based upon market or other conditions and Dodge & Cox disclaims any responsibility to update such views. These views may not be relied on as investment advice and, because investment decisions for a Dodge & Cox Fund are based on numerous factors, may not be relied on as an indication of trading intent on behalf of any Dodge & Cox Fund.

12/05 IF AR  Printed on recycled paper
To Our Shareholders
The Dodge & Cox Income Fund generated a total return of 2.0% in 2005, compared to a 2.4% return for the Lehman Brothers Aggregate Bond Index (LBAG). The table on page three shows the Fund’s longer-term results compared to the LBAG. At year end, the Fund’s net assets were $9.6 billion with a cash weighting of 2.9%.
The Fund and the U.S. bond market produced modest results in 2005 as price declines associated with generally rising interest rates reduced total returns. Similar to last year, the yield increases were most dramatic among short and intermediate-maturity securities, leaving the yield curve essentially flat (short-term and long-term U.S. Treasuries offering comparable yields) at year end. We are cautious about the outlook for longer-term bonds (10+ years to maturity)—U.S. Treasuries particularly—which have made an outsized contribution to fixed-income returns the past two years. Nevertheless, we believe the total return prospects for the Fund, while still modest, are more attractive than they have been in several years. The Fund’s yield-to-maturity was 5.32% at year end, considerably higher than at year end 2004 (4.14%) and year end 2003 (3.63%). Income and its reinvestment are the predominant contributors to long-term fixed-income returns; as such, a higher starting Fund yield should not only contribute significantly to the Fund’s return in the future, but would offset somewhat the negative price impact if long-term rates rise.
Economic and Market Commentary
Despite the effects of Hurricanes Katrina and Rita and significantly higher energy prices, the U.S. economy generated solid economic growth in 2005 as U.S. real GDP rose approximately 3.5%. The economy is in its fifth year of economic expansion, and GDP growth has been greater than 3% year-over-year for ten consecutive quarters. Additionally, the labor market remained strong: over two million jobs were created, the unemployment rate declined to 4.9%, and the pace of hiring appears to have recovered from the effects of the hurricanes. Moreover, the manufacturing and service sectors are solid, consumer optimism has risen, and corporate earnings and cash flow are robust.
Inflation, measured on a year-over-year basis, rose from 3.3% to 3.4% in 2005, though it surged to 4.7% in September due to record-high energy prices. Core inflation (ex-food and energy) was unchanged at 2.2%. The Federal Reserve increased the Federal Funds rate eight times in 2005 (in 0.25% increments) to 4.25% in
their efforts to re-establish a “neutral” rate that is neither overly stimulative nor restrictive. Recent Fed meeting minutes seem to indicate that they believe they are approaching that level.
Corporate profitability was strong in 2005, amid healthy corporate balance sheets and a solid economy. Despite these factors, corporate bond investors were not rewarded with strong relative performance. Corporate bond returns lagged as automobile sector weakness, individual company credit “events” and generally full valuations created conditions for underperformance. The initial catalyst for weak performance was the auto industry, as Ford and General Motors (GM) reported deteriorating sales beginning in early 2005, and their credit ratings were downgraded accordingly. By year end, the rating downgrades of both GM’s auto/mortgage financing subsidiary (GMAC) and Ford’s auto financing subsidiary (FMCC) resulted in these issuers exiting the investment grade-only Lehman Aggregate Index. GMAC securities recovered substantially in the second half of 2005 after GM announced that it is exploring the possible sale of a controlling interest in GMAC to a higher-rated strategic partner—such a move may restore GMAC’s investment grade rating. Other factors contributing to the Corporate sector’s subdued performance were fears of bondholder-unfriendly activities (e.g., leveraged stock buybacks, leveraged buyout risk) and concerns over potentially slowing economic growth given higher energy prices and a slowing housing market.
Mortgage-backed securities (MBS) performed generally in line with comparable short-to-intermediate-term Treasuries for the year, although they have underperformed since August as the rise in interest rates during that period spurred concern over poor relative price performance for MBS as prepayments slow.
2005 Performance Review
The Fund’s FMCC and GMAC holdings were the major source of relative underperformance: the Fund’s largest FMCC and GMAC investments returned -12.7% and -4.3%, respectively. Together these two issuers comprised 4.8% of the Fund at year end, up from 4.2% at the end of 2004. The Fund’s Time Warner holdings also performed poorly. Conversely, the Fund’s investments in bonds issued by UnumProvident, AT&T, Cigna, Federated (May Department Stores) and HCA fared well, as did the Fund’s MBS holdings. Finally, the Fund’s shorter-than-benchmark effective duration1 enhanced relative returns in 2005.
| | |
| 1 / Dodge & Cox Income Fund | | |
Fund Strategy and OutlookThe recent performance from the bond market has been quite modest, as the LBAG has had an annualized total return of 3.38% over the past two years. This has not been surprising, given the low yields that existed two years ago when, for example, the two-year and five-year Treasuries yielded 1.82% and 3.25%, respectively. Modest as this recent performance has been, it would have been worse if not for the strong—and unexpected—performance of the 10+ year sector. This sector has returned 6.73% (twice the return of the LBAG) over the last two years. While this sector is not large—approximately 12% of the LBAG—it has certainly had an outsized impact on recent bond market performance.
As inflation, economic growth, the Fed Funds rate, and short and intermediate-term yields have increased over the past two years, many investors—including ourselves—have been surprised by the resiliency of longer-term interest rates and the strong relative performance of longer-maturity bonds. While the explanations cited for this resiliency are numerous (e.g., global savings glut, repatriation of foreign trade surpluses, expectations for continued low inflation) the results are incontrovertible: first, there is a diminished risk premium embedded in longer-term interest rates, and second, “real” yields remain low by historical standards. A look at today’s flat yield curve illustrates the absence of the risk premium typically accorded longer-term bonds relative to short-term ones, particularly as we are not faced with an obviously deteriorating economy or falling inflation. In addition, there is a much smaller safety cushion relative to inflation for longer-term bonds than historically has been the case: the gap between ten-year U.S. Treasury yields and core inflation was 2.2% at year end, while the average for the last twenty years has been 3.3%.
The risk premium of longer-term bonds compensates the investor for heightened price sensitivity to changes in inflation expectations and real yields—and accordingly, greater potential return volatility—than shorter-maturity securities. As we have discussed in previous letters, we are uncomfortable with the diminished risk premium of longer-maturity securities, and have underweighted this sector. Moreover, all of the longer-maturity securities in the Fund are Corporate bonds with yield premiums (i.e., extra income) that should offset somewhat the negative price movement associated with rising rates. The Fund currently holds no U.S. Treasuries with maturities
greater than four years, and has an overall duration of 3.5 years, shorter than the LBAG’s 4.6 years.
Our team works together to uncover new opportunities and actively monitor existing positions and strategy. Recently, we added to the Fund’s MBS holdings through the purchase of seasoned, thirty-year, Agency-backed mortgage pools at attractive valuations. Within the Corporate sector, the Fund’s FMCC and GMAC holdings are likely to remain volatile for the foreseeable future; nonetheless, they offer attractive yields (over 10% for FMCC and almost 9% for GMAC) and strong total return potential if their automotive parents can turn around their performance or if the finance units can be separated and appraised on a stand-alone basis. As always, we seek opportunities in the MBS and Corporate sectors in our efforts to add to the portfolio’s yield and total return potential without incurring undue, or uncompensated, risks.
In Closing
We welcome back John Taylor as an Independent Trustee of the Dodge & Cox Funds. Mr. Taylor was elected Trustee at the Special Meeting of Shareholders on December 2nd and previously served on the Board from January 1998 until March 2001, prior to his 2001 appointment as Under Secretary of the U.S. Treasury for International Affairs.
We are also pleased to announce that on December 31st, John Gunn became Chief Executive Officer of Dodge & Cox. Harry Hagey, the firm’s Chairman and Chief Executive Officer since 1992, will continue to serve as Chairman of the Board and as a member of the Investment Policy Committee until his retirement at the end of 2006. Also on December 31st, longstanding Dodge & Cox employees Ken Olivier and Dana Emery were named the firm’s President and Executive Vice President respectively.
Thank you for the continued confidence you have placed in our firm as a shareholder of the Income Fund. As always, we welcome your comments and questions.
For the Board of Trustees,
| | |

| | 
|
| Harry R. Hagey, Chairman | | Dana M. Emery, Vice President |
February 16, 2006
| 1 | | Duration is a measure of price sensitivity to changes in interest rates. |
| | |
| | | Dodge & Cox Income Fund / 2 |
Growth of $10,000 Over 10 Years | |
For an investment made on December 31, 1995
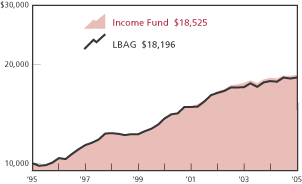
| | Past performance does not guarantee future results. Investment return and share price will fluctuate with market conditions, and investors may have a gain or loss when shares are sold. Mutual fund performance changes over time and currently may be significantly lower than stated above. Performance is updated and published monthly. Visit the Fund’s web site at www.dodgeandcox.com or call 1-800-621-3979 for current performance figures. The Fund’s total returns include the reinvestment of dividend and capital gain distributions, but have not been adjusted for any income taxes payable by shareholders on these distributions. The Lehman Brothers Aggregate Bond Index is an unmanaged index of investment-grade fixed-income securities. Index returns include dividends and/or interest income and, unlike Fund returns, do not reflect fees or expenses. Lehman Brothers® is a trademark of Lehman Brothers, Inc. |
Average Annual Total Return
for periods ended December 31, 2005
| | | | | | | | | |
| | | 1 Year | | | 5 Years | | | 10 Years | |
Dodge & Cox Income Fund | | 1.98 | % | | 6.48 | % | | 6.35 | % |
Lehman Brothers
Aggregate Bond Index (LBAG) | | 2.43 | | | 5.87 | | | 6.16 | |
Fund Expense Example
As a Fund shareholder, you incur ongoing Fund costs, including management fees and other Fund expenses. All mutual funds have ongoing costs, sometimes referred to as operating expenses.
The following example shows ongoing costs of investing in the Fund and can help you understand these costs and compare them with those of other mutual funds. The example assumes a $1,000 investment held for the six months indicated.
Actual Expenses
The first line of the table below provides information about actual account values and expenses based on the Fund’s actual returns. You may use the information in this line, together with your account balance, to estimate the expenses that you paid over the period. Simply divide your account value by $1,000 (for example, an $8,600 account value divided by $1,000 = 8.6), then multiply the result by the number in the first line under the heading “Expenses Paid During Period” to estimate the expenses you paid on your account during this period.
Hypothetical Example for Comparison with Other Mutual Funds
Information on the second line of the table can help you compare ongoing costs of investing in the Fund with those of other mutual funds. This information may not be used to estimate the actual ending account balance or expenses you paid during the period. The hypothetical “Ending Account Value” is based on the actual expense ratio of the Fund and an assumed 5% annual rate of return before expenses (not the Fund’s actual return). The amount under the heading “Expense Paid During the Period” shows the hypothetical expenses your account would have incurred under this scenario. You can compare this figure with the 5% hypothetical examples that appear in shareholder reports of other mutual funds.
| | | | | | | | | |
Six Months Ended December 31, 2005 | | Beginning Account
Value 7/1/2005 | | Ending Account
Value 12/31/2005 | | Expenses Paid
During Period* |
Based on Actual Fund Return | | $ | 1,000.00 | | $ | 1,003.20 | | $ | 2.22 |
Based on Hypothetical 5% Yearly Return | | | 1,000.00 | | | 1,022.99 | | | 2.55 |
| * | | Expenses are equal to the Fund’s annualized six-month expense ratio of 0.44%, multiplied by the average account value over the period, multiplied by 184/365 (to reflect the one-half year period). |
The expenses shown in the table highlight ongoing costs only and do not reflect any transactional costs or account maintenance fees. While other mutual funds may charge such fees, please note that the Fund does not charge transaction fees (e.g., redemption fees, sales loads) or universal account maintenance fees (e.g., small account fees).
| | |
| 3 / Dodge & Cox Income Fund | | |
Fund Information | December 31, 2005 |
General Information
| | |
Net Asset Value Per Share | | $12.54 |
Total Net Assets (millions) | | $9,610 |
30-Day SEC Yield1 | | 4.89% |
2005 Expense Ratio | | 0.44% |
2005 Portfolio Turnover | | 24% |
Fund Inception | | 1989 |
|
| Investment Manager: Dodge & Cox, San Francisco. Managed by the Fixed Income Strategy Committee, whose nine members’ average tenure at Dodge & Cox is 16 years, and by the Investment Policy Committee (for certain fixed-income decisions), whose twelve members’ average tenure at Dodge & Cox is 22 years. |
| | | | |
| Fixed-Income Characteristics | | Fund | | LBAG |
Number of Fixed-Income Securities | | 317 | | 6,434 |
Average Maturity (years) | | 5.4 | | 7.1 |
Effective Duration (years) | | 3.5 | | 4.6 |
| | |
| Five Largest Corporate Issuers3 | | % of Fund |
GMAC | | 2.4 |
Ford Motor Credit Co. | | 2.4 |
HCA, Inc. | | 1.9 |
AT&T Corp. | | 1.9 |
Time Warner, Inc. | | 1.9 |
| | | | | | |
| Credit Quality | | Fund4 | | | LBAG5 | |
U.S. Government & Government Agencies | | 67.2 | % | | 71.3 | % |
Aaa | | 0.7 | | | 7.3 | |
Aa | | 1.1 | | | 4.7 | |
A | | 3.9 | | | 8.9 | |
Baa | | 14.1 | | | 7.8 | |
Ba | | 9.2 | | | 0.0 | |
B | | 0.9 | | | 0.0 | |
Cash Equivalents | | 2.9 | | | 0.0 | |
| | |
Average Quality | | Aa | | | AA+ | |
Asset Allocation
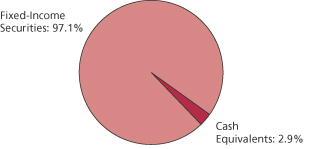
| | | | | | |
| Sector Diversification | | Fund | | | LBAG | |
U.S. Treasury & Government Agency | | 33.9 | % | | 36.4 | % |
Mortgage-Related Securities | | 33.5 | | | 34.9 | |
Asset-Backed Securities/CMBS2 | | 0.1 | | | 5.3 | |
Corporate | | 29.6 | | | 19.5 | |
Non-Corporate Yankee | | 0.0 | | | 3.9 | |
Cash Equivalents | | 2.9 | | | 0.0 | |
| | | | | | |
| Maturity Diversification | | Fund | | | LBAG | |
0-1 Years to Maturity | | 8.7 | % | | 0.0 | % |
1-5 | | 62.4 | | | 42.7 | |
5-10 | | 19.4 | | | 44.8 | |
10-15 | | 1.5 | | | 3.4 | |
15-20 | | 0.2 | | | 2.7 | |
20-25 | | 3.6 | | | 3.5 | |
25 and Over | | 4.2 | | | 2.9 | |
| 1 | | SEC Yield is an annualization of the Fund’s total net investment income per share for the 30-day period ended on the last day of the month. |
| 2 | | CMBS refers to commercial mortgage-backed securities, which are a component of the LBAG but not currently held by the Fund. |
| 3 | | The Fund’s portfolio holdings are subject to change without notice. The mention of specific securities is not a recommendation or solicitation for any person to buy, sell or hold any particular security. |
| 4 | | Credit quality ratings are from Moody’s Investor Services. If no Moody’s rating is available, the Standard & Poor’s rating is reported. If unrated, the investment manager may determine a comparable rating, which is included in the portfolio breakdown. The credit quality of the investments in the portfolio does not apply to the stability or safety of the Fund. |
| 5 | | Credit quality ratings are from Lehman Brothers and reference Moody’s, Standard & Poor’s, and Fitch ratings. |
| | |
| | | Dodge & Cox Income Fund / 4 |
Portfolio of Investments | December 31, 2005 |
| | | | | | |
| FIXED-INCOME SECURITIES: 97.1% | | |
| | |
| | | PAR VALUE | | VALUE |
| U.S. TREASURY AND GOVERNMENT AGENCY: 33.9% |
| U.S. TREASURY: 31.5% | | | | | | |
U.S. Treasury Notes | | | | | | |
1.625%, 2/28/06 | | $ | 75,000,000 | | $ | 74,718,750 |
4.625%, 5/15/06 | | | 450,000,000 | | | 450,457,200 |
6.625%, 5/15/07 | | | 415,000,000 | | | 427,060,730 |
3.00%, 11/15/07 | | | 475,000,000 | | | 463,162,050 |
3.125%, 10/15/08 | | | 125,000,000 | | | 120,913,125 |
3.25%, 1/15/09 | | | 400,000,000 | | | 387,296,800 |
3.625%, 7/15/09 | | | 435,000,000 | | | 424,362,945 |
3.375%, 9/15/09 | | | 275,000,000 | | | 265,815,550 |
3.50%, 11/15/09 | | | 425,000,000 | | | 411,901,500 |
| | | | | |
|
|
| | | | | | | 3,025,688,650 |
| GOVERNMENT AGENCY: 2.4% | | | | | | |
Small Business Administration (504) | | | | | | |
Series 91-20K, 8.25%, 11/1/11 | | | 613,383 | | | 645,631 |
Series 92-20B, 8.10%, 2/1/12 | | | 455,011 | | | 477,352 |
Series 92-20C, 8.20%, 3/1/12 | | | 1,149,210 | | | 1,208,434 |
Series 92-20D, 8.20%, 4/1/12 | | | 713,256 | | | 750,774 |
Series 92-20G, 7.60%, 7/1/12 | | | 1,754,955 | | | 1,830,128 |
Series 92-20H, 7.40%, 8/1/12 | | | 971,123 | | | 1,010,658 |
Series 92-20I, 7.05%, 9/1/12 | | | 1,255,924 | | | 1,301,260 |
Series 92-20J, 7.00%, 10/1/12 | | | 1,687,003 | | | 1,747,636 |
Series 92-20K, 7.55%, 11/1/12 | | | 1,874,751 | | | 1,959,715 |
Series 92-20L, 7.45%, 12/1/12 | | | 924,038 | | | 965,157 |
Series 93-20B, 7.00%, 2/1/13 | | | 1,287,923 | | | 1,334,003 |
Series 93-20C, 6.50%, 3/1/13 | | | 3,999,528 | | | 4,112,180 |
Series 93-20D, 6.75%, 4/1/13 | | | 1,513,685 | | | 1,563,295 |
Series 93-20E, 6.55%, 5/1/13 | | | 4,768,880 | | | 4,911,159 |
Series 93-20F, 6.65%, 6/1/13 | | | 1,789,975 | | | 1,847,260 |
Series 93-20L, 6.30%, 12/1/13 | | | 2,939,753 | | | 3,017,136 |
Series 94-20L, 6.50%, 1/1/14 | | | 3,457,202 | | | 3,556,355 |
Series 94-20D, 7.70%, 4/1/14 | | | 1,026,179 | | | 1,069,621 |
Series 94-20E, 7.75%, 5/1/14 | | | 2,648,196 | | | 2,785,399 |
Series 94-20F, 7.60%, 6/1/14 | | | 1,782,558 | | | 1,871,653 |
Series 94-20G, 8.00%, 7/1/14 | | | 1,201,397 | | | 1,266,092 |
Series 94-20H, 7.95%, 8/1/14 | | | 1,314,322 | | | 1,385,067 |
Series 94-20I, 7.85%, 9/1/14 | | | 1,708,759 | | | 1,799,255 |
Series 94-20K, 8.65%, 11/1/14 | | | 1,173,320 | | | 1,252,454 |
Series 94-20L, 8.40%, 12/1/14 | | | 1,150,187 | | | 1,224,183 |
Series 95-20A, 8.50%, 1/1/15 | | | 580,989 | | | 617,319 |
Series 95-20C, 8.10%, 3/1/15 | | | 1,056,457 | | | 1,117,668 |
Series 97-20E, 7.30%, 5/1/17 | | | 1,993,005 | | | 2,096,127 |
Series 97-20J, 6.55%, 10/1/17 | | | 2,630,255 | | | 2,727,886 |
Series 98-20C, 6.35%, 3/1/18 | | | 10,986,782 | | | 11,364,940 |
Series 98-20H, 6.15%, 8/1/18 | | | 3,987,668 | | | 4,114,322 |
Series 98-20L, 5.80%, 12/1/18 | | | 2,199,427 | | | 2,251,477 |
Series 99-20C, 6.30%, 3/1/19 | | | 2,686,863 | | | 2,790,724 |
Series 99-20G, 7.00%, 7/1/19 | | | 6,783,634 | | | 7,177,318 |
Series 99-20I, 7.30%, 9/1/19 | | | 2,197,882 | | | 2,346,929 |
Series 01-20G, 6.625%, 7/1/21 | | | 14,537,248 | | | 15,443,492 |
Series 01-20L, 5.78%, 12/1/21 | | | 33,598,644 | | | 34,667,286 |
Series 02-20L, 5.10%, 12/1/22 | | | 7,988,388 | | | 8,022,949 |
Series 04-20L, 4.87%, 12/1/24 | | | 8,767,161 | | | 8,676,168 |
Series 05-20B, 4.625%, 2/1/25 | | | 11,721,261 | | | 11,424,656 |
Series 05-20C, 4.95%, 3/1/25 | | | 7,876,892 | | | 7,844,707 |
| | | | | | |
| | |
| | | PAR VALUE | | VALUE |
Small Business Administration (504) (continued) | | | |
Series 05-20E, 4.84%, 5/1/25 | | $ | 22,579,964 | | $ | 22,278,252 |
Series 05-20G, 4.75%, 7/1/25 | | | 19,975,000 | | | 19,593,499 |
Series 05-20I, 4.76%, 9/1/25 | | | 23,545,000 | | | 23,089,359 |
| | | | | |
|
|
| | | | | | | 232,536,935 |
| | | | | |
|
|
| | | | | | | 3,258,225,585 |
| MORTGAGE-RELATED SECURITIES: 33.5% |
| FEDERAL AGENCY CMO & REMIC: 4.8% | | | | | | |
Dept. of Veterans Affairs | | | | | | |
Trust 1995-2D 4A, 9.293%, 5/15/25 | | | 587,124 | | | 627,999 |
Trust 1997-2Z, 7.50%, 6/15/27 | | | 43,356,725 | | | 45,926,474 |
Trust 1998-1 1A, 8.153%, 10/15/27 | | | 1,618,154 | | | 1,714,950 |
Fannie Mae | | | | | | |
Trust 2002-47 QC, 5.50%, 11/25/14 | | | 2,766,455 | | | 2,759,749 |
Trust 1994-28 H, 6.25%, 3/25/23 | | | 404,977 | | | 404,078 |
Trust 1994-72 J, 6.00%, 6/25/23 | | | 9,000,000 | | | 9,118,786 |
Trust 1998-58 PX, 6.50%, 9/25/28 | | | 4,157,294 | | | 4,303,306 |
Trust 1998-58 PC, 6.50%, 10/25/28 | | | 23,417,231 | | | 24,232,745 |
Trust 2002-33 A1, 7.00%, 6/25/32 | | | 8,404,010 | | | 8,779,560 |
Trust 2001-T4 A1, 7.50%, 7/25/41 | | | 7,040,415 | | | 7,360,989 |
Trust 2001-T10 A1, 7.00%, 12/25/41 | | | 11,907,097 | | | 12,313,036 |
Trust 2002-90 A1, 6.50%, 6/25/42 | | | 15,609,045 | | | 15,965,796 |
Trust 2002-W6 2A1, 7.00%, 6/25/42 | | | 13,584,338 | | | 14,102,232 |
Trust 2002-W8 A2, 7.00%, 6/25/42 | | | 6,985,415 | | | 7,234,200 |
Trust 2003-W2 1A2, 7.00%, 7/25/42 | | | 43,809,480 | | | 45,153,152 |
Trust 2003-W4 3A, 7.00%, 10/25/42 | | | 13,013,931 | | | 13,467,735 |
Trust 2003-07 A1, 6.50%, 12/25/42 | | | 18,386,030 | | | 18,846,889 |
Trust 2003-W1 1A1, 6.50%, 12/25/42 | | | 27,010,234 | | | 27,631,726 |
Trust 2003-W1 2A, 7.50%, 12/25/42 | | | 12,171,802 | | | 12,731,356 |
Trust 2004-W2 5A, 7.50%, 3/25/44 | | | 61,425,750 | | | 64,766,672 |
Trust 2004-W8 3A, 7.50%, 6/25/44 | | | 32,937,384 | | | 34,694,314 |
Trust 2005-W1 1A3, 7.00%, 10/25/44 | | | 32,851,406 | | | 33,941,951 |
Trust 2001-79 BA, 7.00%, 3/25/45 | | | 3,911,867 | | | 4,047,845 |
Freddie Mac | | | | | | |
Series 1565 G, 6.00%, 8/15/08 | | | 2,993,872 | | | 3,018,404 |
Series 1601 PJ, 6.00%, 10/15/08 | | | 13,943,260 | | | 14,061,231 |
Series (GN) 37 I, 6.00%, 6/17/22 | | | 3,954,546 | | | 3,964,103 |
Series 2439 LG, 6.00%, 9/15/30 | | | 16,342,027 | | | 16,559,693 |
Series T-48 1A, 7.104%, 7/25/33 | | | 12,130,913 | | | 12,523,819 |
Ginnie Mae | | | | | | |
7.25% , 7/16/28 | | | 5,698,900 | | | 5,842,090 |
| | | | | |
|
|
| | | | | | | 466,094,880 |
| FEDERAL AGENCY MORTGAGE PASS-THROUGH: 28.5% | | | |
Fannie Mae, 15 Year | | | | | | |
5.50%, 9/1/14 - 9/1/20 | | | 399,802,594 | | | 402,743,785 |
6.00%, 4/1/13 - 12/1/19 | | | 780,233,617 | | | 797,498,009 |
6.50%, 11/1/12 - 11/1/18 | | | 279,119,320 | | | 287,078,660 |
7.00%, 7/1/08 - 12/1/11 | | | 3,114,897 | | | 3,203,583 |
7.50%, 11/1/14 - 8/1/17 | | | 30,746,262 | | | 32,307,464 |
8.00%, 8/1/10 | | | 80,476 | | | 82,053 |
Fannie Mae, 20 Year | | | | | | |
6.50%, 4/1/19 - 10/1/24 | | | 89,228,471 | | | 92,210,636 |
Fannie Mae, 30 Year | | | | | | |
6.00%, 2/1/34 - 4/1/35 | | | 217,587,575 | | | 220,011,966 |
6.50%, 12/1/32 | | | 245,960,924 | | | 252,829,533 |
7.00%, 4/1/32 | | | 5,620,800 | | | 5,867,552 |
| | |
| 5 / Dodge & Cox Income Fund | | See accompanying Notes to Financial Statements |
Portfolio of Investments | December 31, 2005 |
| | | | | | |
| FIXED-INCOME SECURITIES (continued) | | |
| | |
| | | PAR VALUE | | VALUE |
Fannie Mae, 30 Year (continued) | | | | | | |
7.50%, 9/1/07 | | $ | 248,115 | | $ | 251,532 |
8.00%, 1/1/12 - 8/1/22 | | | 321,234 | | | 331,157 |
Fannie Mae Multifamily DUS | | | | | | |
Pool 555191, 4.822%, 2/1/13 | | | 19,712,253 | | | 19,499,491 |
Pool 555162, 4.835%, 1/1/13 | | | 17,511,251 | | | 17,335,814 |
Pool 555172, 5.587%, 12/1/12 | | | 4,102,679 | | | 4,211,853 |
Pool 545685, 6.017%, 4/1/12 | | | 29,232,988 | | | 30,480,394 |
Pool 545708, 6.051%, 5/1/12 | | | 2,732,400 | | | 2,857,677 |
Pool 545209, 6.126%, 10/1/11 | | | 44,218,171 | | | 46,272,852 |
Pool 545059, 6.241%, 5/1/11 | | | 31,644,715 | | | 33,187,061 |
Pool 323822, 6.528%, 7/1/09 | | | 6,729,021 | | | 6,983,514 |
Pool 160329, 7.15%, 10/1/15 | | | 6,281,798 | | | 6,885,491 |
Freddie Mac, 30 Year | | | | | | |
6.00%, 2/15/30 | | | 3,084,350 | | | 3,090,034 |
7.25%, 1/1/08 | | | 462 | | | 466 |
7.50%, 10/1/08 | | | 7,001 | | | 7,096 |
8.00%, 1/1/08 - 8/1/09 | | | 42,973 | | | 43,491 |
8.25%, 5/1/09 | | | 346 | | | 348 |
Freddie Mac Gold, 15 Year | | | | | | |
5.50%, 11/1/13 - 11/1/18 | | | 93,765,469 | | | 94,439,954 |
6.00%, 4/1/13 - 2/1/19 | | | 187,913,609 | | | 191,813,800 |
6.50%, 2/1/11 - 9/1/18 | | | 105,520,985 | | | 108,435,842 |
7.00%, 11/1/08 - 3/1/12 | | | 2,718,557 | | | 2,808,521 |
Freddie Mac Gold, 20 Year | | | | | | |
6.50% , 7/1/21 - 4/1/22 | | | 6,599,754 | | | 6,813,899 |
Freddie Mac Gold, 30 Year | | | | | | |
6.50%, 5/1/17 | | | 12,517,088 | | | 12,863,412 |
7.00%, 4/1/31 | | | 31,816,864 | | | 33,220,920 |
7.90%, 2/17/21 | | | 3,587,575 | | | 3,804,616 |
Ginnie Mae, 15 Year | | | | | | |
7.00%, 4/15/09 | | | 1,079,686 | | | 1,105,432 |
Ginnie Mae, 30 Year | | | | | | |
7.00%, 5/15/28 | | | 2,935,022 | | | 3,090,538 |
7.50%, 9/15/17 - 5/15/25 | | | 10,064,797 | | | 10,591,245 |
7.80%, 6/15/20 - 1/15/21 | | | 2,981,379 | | | 3,104,950 |
| | | | | |
|
|
| | | | | | | 2,737,364,641 |
| PRIVATE LABEL CMO & REMIC SECURITIES: 0.2% | | | |
GSMPS Mortgage Loan Trust,
Series 2004-4 1A4 | | | | | | |
8.50%, 6/25/34(b) | | | 19,462,589 | | | 20,643,532 |
| | | | | |
|
|
| | | | | | | 3,224,103,053 |
| ASSET-BACKED SECURITIES: 0.1% |
| PRIVATE LABEL CMO & REMIC SECURITIES: 0.1% | | | |
CA Infrastructure and Econ. Dev. Bank Special Purpose Trust PGE-1 Rate Reduction Ctf. 1997-1 A-7 | | | | | | |
6.42% , 9/25/08 | | | 3,457,301 | | | 3,483,477 |
CA Infrastructure and Econ. Dev. Bank Special Purpose Trust SCE-1 Rate Reduction Ctf. 1997-1 A-6 | | | | | | |
6.38% , 9/25/08 | | | 3,076,612 | | | 3,101,667 |
| | | | | |
|
|
| | | | | | | 6,585,144 |
| | | | | | |
| | |
| | | PAR VALUE | | VALUE |
| CORPORATE: 29.6% |
| FINANCIALS: 5.3% | | | |
BankAmerica Capital II(a)
8.00% , 12/15/26, callable 2006 | | $ | 14,250,000 | | $ | 15,134,768 |
BankAmerica Capital Trust VI(a)
5.625% , 3/8/35 | | | 21,450,000 | | | 21,160,554 |
Boston Properties, Inc. | | | | | | |
6.25%, 1/15/13 | | | 50,036,000 | | | 52,490,316 |
5.625%, 4/15/15 | | | 34,195,000 | | | 34,558,424 |
5.00%, 6/1/15 | | | 8,650,000 | | | 8,330,547 |
Citicorp Capital Trust I(a)
7.933%, 2/15/27, callable 2007 | | | 6,375,000 | | | 6,801,532 |
Citicorp Capital Trust II(a)
8.015%, 2/15/27 | | | 10,300,000 | | | 11,002,027 |
Citigroup, Inc. (First Nationwide)
10.00% , 10/1/06 | | | 4,065,000 | | | 4,211,934 |
EOP Operating Limited Partnership(c) | | | | | | |
6.80%, 1/15/09 | | | 17,240,000 | | | 18,026,110 |
7.00%, 7/15/11 | | | 33,470,000 | | | 35,824,380 |
5.875%, 1/15/13 | | | 37,700,000 | | | 38,328,308 |
4.75%, 3/15/14 | | | 51,900,000 | | | 49,044,981 |
JPMorgan Chase Capital III (Bank One)(a)
8.75%, 9/1/30 | | | 19,130,000 | | | 25,713,035 |
Safeco Corp. | | | | | | |
4.875%, 2/1/10 | | | 15,115,000 | | | 15,003,738 |
7.25%, 9/1/12 | | | 17,873,000 | | | 19,924,052 |
St. Paul Travelers Companies, Inc. | | | | | | |
8.125%, 4/15/10 | | | 21,425,000 | | | 23,791,648 |
5.00%, 3/15/13 | | | 16,295,000 | | | 16,027,208 |
UnumProvident Corp. | | | | | | |
7.625%, 3/1/11 | | | 40,405,000 | | | 43,577,075 |
6.85%, 11/15/15(b) | | | 11,700,000 | | | 12,187,048 |
7.19%, 2/1/28 | | | 11,640,000 | | | 11,504,732 |
7.375%, 6/15/32 | | | 29,670,000 | | | 31,125,314 |
UnumProvident Corp.
(Provident Companies, Inc.)
7.25%, 3/15/28 | | | 15,370,000 | | | 15,857,275 |
| | | | | |
|
|
| | | | | | | 509,625,006 |
| INDUSTRIALS: 23.2% | | | |
Amerada Hess Corp. 7.875%, 10/1/29 | | | 33,870,000 | | | 41,012,607 |
AT&T Corp. | | | | | | |
9.05%, 11/15/11 | | | 37,705,000 | | | 41,732,837 |
9.75%, 11/15/31 | | | 113,325,000 | | | 142,350,252 |
CIGNA Corp. | | | | | | |
7.00%, 1/15/11 | | | 13,565,000 | | | 14,622,039 |
6.375%, 10/15/11 | | | 28,650,000 | | | 30,378,197 |
7.65%, 3/1/23 | | | 3,330,000 | | | 3,904,648 |
7.875%, 5/15/27 | | | 27,615,000 | | | 33,786,290 |
Comcast Corp. | | | | | | |
5.30%, 1/15/14 | | | 74,525,000 | | | 73,112,602 |
5.85%, 11/15/15 | | | 24,700,000 | | | 25,019,149 |
Cox Communications, Inc.
5.45% , 12/15/14 | | | 96,050,000 | | | 93,725,878 |
Dillard’s, Inc. | | | | | | |
7.375%, 6/1/06 | | | 4,875,000 | | | 4,905,469 |
6.625%, 11/15/08 | | | 4,985,000 | | | 4,997,463 |
| | |
| See accompanying Notes to Financial Statements | | Dodge & Cox Income Fund / 6 |
Portfolio of Investments | December 31, 2005 |
| | | | | | |
| FIXED-INCOME SECURITIES (continued) |
| | |
| | | PAR VALUE | | VALUE |
Dillard’s, Inc. (continued) | | | | | | |
7.13%, 8/1/18 | | $ | 23,715,000 | | $ | 22,766,400 |
7.75%, 7/15/26 | | | 21,075,000 | | | 20,442,750 |
7.75%, 5/15/27 | | | 12,373,000 | | | 12,001,810 |
7.00%, 12/1/28 | | | 19,825,000 | | | 18,387,687 |
Dow Chemical Co. | | | | | | |
4.027%, 9/30/09(b) | | | 54,087,000 | | | 52,115,096 |
6.00%, 10/1/12 | | | 9,600,000 | | | 10,089,379 |
7.375%, 11/1/29 | | | 16,604,000 | | | 20,004,848 |
Electronic Data Systems Corp.
6.50% , 8/1/13 | | | 60,340,000 | | | 62,012,202 |
Federated Department Stores, Inc.
(May Department Stores Co.) | | | | | | |
7.625%, 8/15/13 | | | 7,105,000 | | | 7,967,980 |
7.875%, 3/1/30 | | | 34,645,000 | | | 41,317,073 |
6.90%, 1/15/32 | | | 15,465,000 | | | 16,602,806 |
7.875%, 8/15/36, callable 2016 | | | 7,825,000 | | | 8,603,329 |
Ford Motor Credit Co. | | | | | | |
5.80%, 1/12/09 | | | 30,250,000 | | | 26,388,255 |
7.375%, 10/28/09 | | | 10,100,000 | | | 8,957,549 |
7.375%, 2/1/11 | | | 45,420,000 | | | 39,811,448 |
7.25%, 10/25/11 | | | 181,030,000 | | | 156,383,852 |
General Electric Co. 5.00%, 2/1/13 | | | 34,994,000 | | | 34,975,803 |
GMAC | | | | | | |
6.125%, 1/22/08 | | | 4,510,000 | | | 4,129,938 |
5.125%, 5/9/08 | | | 2,030,000 | | | 1,807,175 |
7.75%, 1/19/10 | | | 27,875,000 | | | 26,032,100 |
6.875%, 9/15/11 | | | 221,540,000 | | | 202,032,295 |
HCA, Inc. | | | | | | |
8.75%, 9/1/10 | | | 54,595,000 | | | 60,381,906 |
7.875%, 2/1/11 | | | 33,675,000 | | | 36,205,912 |
6.25%, 2/15/13 | | | 30,230,000 | | | 30,251,494 |
6.75%, 7/15/13 | | | 28,883,000 | | | 29,780,857 |
5.75%, 3/15/14 | | | 28,675,000 | | | 27,806,205 |
Health Net, Inc. 9.875%, 4/15/11 | | | 55,718,000 | | | 64,816,805 |
Hewlett-Packard Co. 5.50%, 7/1/07 | | | 35,945,000 | | | 36,235,436 |
International Paper Co. 5.25%, 4/1/16 | | | 26,725,000 | | | 25,401,551 |
Lockheed Martin Corp. | | | | | | |
7.65%, 5/1/16 | | | 15,025,000 | | | 17,899,628 |
8.50%, 12/1/29 | | | 16,684,000 | | | 22,739,758 |
May Department Stores Co. | | | | | | |
7.60%, 6/1/25 | | | 13,500,000 | | | 15,415,542 |
6.70%, 9/15/28 | | | 12,950,000 | | | 13,601,618 |
8.75%, 5/15/29 | | | 31,677,000 | | | 40,542,157 |
Raytheon Co. | | | | | | |
6.75%, 8/15/07 | | | 6,756,000 | | | 6,921,319 |
6.15%, 11/1/08 | | | 3,024,000 | | | 3,138,380 |
6.55%, 3/15/10 | | | 10,150,000 | | | 10,695,288 |
Time Warner, Inc. (AOL Time Warner) | | | | | | |
7.625%, 4/15/31 | | | 102,455,000 | | | 114,098,908 |
7.70%, 5/1/32 | | | 61,765,000 | | | 69,464,563 |
Wyeth | | | | | | |
5.50%, 3/15/13 | | | 10,070,000 | | | 10,208,644 |
5.50%, 2/1/14 | | | 100,215,000 | | | 101,513,085 |
Wyeth (American Home Products)
6.95% , 3/15/11 | | | 8,155,000 | | | 8,797,312 |
| | | | | | | |
| | |
| | | PAR VALUE | | | VALUE |
Xerox Corp. | | | | | | | |
9.75%, 1/15/09 | | $ | 44,100,000 | | | $ | 48,785,625 |
7.125%, 6/15/10 | | | 77,640,000 | | | | 80,842,650 |
6.875%, 8/15/11 | | | 30,350,000 | | | | 31,412,250 |
7.20%, 4/1/16 | | | 17,346,000 | | | | 18,213,300 |
| | | | | | |
|
|
| | | | | | | | 2,227,547,399 |
| TRANSPORTATION: 1.1% | | | | |
Burlington Northern Santa Fe Railway
7.57% , 1/2/21 | | | 12,509,071 | | | | 14,449,978 |
CSX Transportation, Inc. 9.75%, 6/15/20 | | | 10,072,000 | | | | 13,750,748 |
FedEx Corp. 6.72%, 1/15/22 | | | 8,241,984 | | | | 9,001,978 |
Norfolk Southern Corp. 9.75%, 6/15/20 | | | 13,908,000 | | | | 19,476,151 |
Union Pacific Corp. | | | | | | | |
5.375%, 5/1/14 | | | 10,886,000 | | | | 11,010,144 |
6.85%, 1/2/19 | | | 6,224,335 | | | | 6,779,982 |
6.70%, 2/23/19 | | | 13,108,818 | | | | 14,136,287 |
7.60%, 1/2/20 | | | 1,045,784 | | | | 1,206,082 |
4.698%, 1/2/24 | | | 4,310,358 | | | | 4,147,210 |
5.082%, 1/2/29 | | | 9,725,000 | | | | 9,639,614 |
| | | | | | |
|
|
| | | | | | | | 103,598,174 |
| | | | | | |
|
|
| | | | | | | | 2,840,770,579 |
| | | | | | |
|
|
TOTAL FIXED-INCOME SECURITIES
(Cost $9,341,066,787) | | | | | | | 9,329,684,361 |
| | | | | | |
|
|
| SHORT-TERM INVESTMENTS: 1.8% | | | | | |
| | |
SSgA Prime Money Market Fund | | | 47,760,168 | | | | 47,760,168 |
State Street Repurchase Agreement
3.10%, 1/3/06, maturity value $122,275,102 (collateralized by U.S. Treasury Securities, value $124,679,450, 4.125%, 8/15/08) | | | 122,233,000 | | | | 122,233,000 |
| | | | | | |
|
|
TOTAL SHORT-TERM INVESTMENTS
(Cost $169,993,168) | | | | | | | 169,993,168 |
| | | | | | |
|
|
TOTAL INVESTMENTS
(Cost $9,511,059,955) | | | 98.9 | % | | | 9,499,677,529 |
OTHER ASSETS LESS LIABILITIES | | | 1.1 | % | | | 110,088,442 |
| | |
|
|
| |
|
|
TOTAL NET ASSETS | | | 100.0 | % | | $ | 9,609,765,971 |
| | |
|
|
| |
|
|
| (a) | | Cumulative preferred security |
| (b) | | Security exempt from registration under Rule 144A of the Securities Act of 1933. The security may be resold in transactions exempt from registration, normally to qualified institutional buyers. As of December 31, 2005, all such securities in total represented $84,945,676 or 0.9% of total net assets. |
| (c) | | EOP Operating LP is the operating partnership of Equity Office Properties Trust. |
When two issuers are identified, the first name refers to the acquirer or successor obligor, and the second name (within the parentheses) refers to the original issuer of the instrument.
CMO: Collateralized Mortgage Obligation
REMIC: Real Estate Mortgage Investment Conduit
| | |
| 7 / Dodge & Cox Income Fund | | See accompanying Notes to Financial Statements |
| | | | |
| Statement of Assets and Liabilities | |
| December 31, 2005 | |
| Assets: | |
Investments, at value (cost $9,511,059,955) | | $ | 9,499,677,529 | |
Receivable for paydowns on mortgage-backed securities | | | 4,462 | |
Receivable for Fund shares sold | | | 54,417,185 | |
Interest receivable | | | 98,941,056 | |
Prepaid expenses and other assets | | | 50,198 | |
| | |
|
|
|
| | | | 9,653,090,430 | |
| | |
|
|
|
| Liabilities: | | | | |
Payable for investments purchased | | | 30,865,945 | |
Payable for Fund shares redeemed | | | 8,510,557 | |
Management fees payable | | | 3,238,501 | |
Accrued expenses | | | 709,456 | |
| | |
|
|
|
| | | | 43,324,459 | |
| | |
|
|
|
| Net Assets | | $ | 9,609,765,971 | |
| | |
|
|
|
| Net Assets Consist of: | | | | |
Paid in capital | | $ | 9,688,287,130 | |
Undistributed net investment income | | | 6,670,694 | |
Undistributed net realized loss on investments | | | (73,809,427 | ) |
Net unrealized depreciation on investments | | | (11,382,426 | ) |
| | |
|
|
|
| | | $ | 9,609,765,971 | |
| | |
|
|
|
Fund shares outstanding (par value $0.01 each, unlimited shares authorized) | | | 766,606,768 | |
Net asset value per share | | | $12.54 | |
|
| Statement of Operations | |
| | | Year Ended December 31, 2005 | |
| Investment Income: | | | | |
Interest | | $ | 392,736,434 | |
| | |
|
|
|
| Expenses: | | | | |
Management fees | | | 35,559,299 | |
Custody and fund accounting fees | | | 173,762 | |
Transfer agent fees | | | 1,993,192 | |
Professional services | | | 93,023 | |
Shareholder reports | | | 679,084 | |
Registration fees | | | 375,394 | |
Trustees’ fees | | | 118,625 | |
Miscellaneous | | | 65,532 | |
| | |
|
|
|
| | | | 39,057,911 | |
| | |
|
|
|
| Net Investment Income | | | 353,678,523 | |
| | |
|
|
|
Realized and Unrealized Gain (Loss)
on Investments: | | | | |
Net realized gain | | | 20,155,850 | |
Net change in unrealized appreciation/depreciation | | | (200,036,683 | ) |
| | |
|
|
|
Net realized and unrealized loss | | | (179,880,833 | ) |
| | |
|
|
|
| Net Increase in Net Assets from Operations | | $ | 173,797,690 | |
| | |
|
|
|
| | | | | | | | |
| Statement of Changes in Net Assets | |
| | |
| | | Year Ended December 31, 2005 | | | Year Ended
December 31, 2004 | |
| Operations: | | | | | | | | |
Net investment income | | $ | 353,678,523 | | | $ | 242,536,193 | |
Net realized gain | | | 20,155,850 | | | | 16,364,800 | |
Net change in unrealized appreciation/depreciation | | | (200,036,683 | ) | | | (14,505,944 | ) |
| | |
|
|
| |
|
|
|
Net increase in net assets from operations | | | 173,797,690 | | | | 244,395,049 | |
| | |
|
|
| |
|
|
|
| | |
| Distributions to Shareholders from: | | | | | | | | |
Net investment income | | | (390,586,222 | ) | | | (289,903,700 | ) |
Net realized gain | | | — | | | | — | |
| | |
|
|
| |
|
|
|
Total distributions | | | (390,586,222 | ) | | | (289,903,700 | ) |
| | |
|
|
| |
|
|
|
| | |
| Fund Share Transactions | | | | | | | | |
Proceeds from sale of shares | | | 3,244,793,643 | | | | 3,644,938,350 | |
Reinvestment of distributions | | | 334,969,730 | | | | 249,578,904 | |
Cost of shares redeemed | | | (1,623,405,388 | ) | | | (1,676,183,293 | ) |
| | |
|
|
| |
|
|
|
Net increase from Fund share transactions | | | 1,956,357,985 | | | | 2,218,333,961 | |
| | |
|
|
| |
|
|
|
Total increase in net assets | | | 1,739,569,453 | | | | 2,172,825,310 | |
| | |
| Net Assets: | | | | | | | | |
Beginning of year | | | 7,870,196,518 | | | | 5,697,371,208 | |
| | |
|
|
| |
|
|
|
End of year (including undistributed net investment income of $6,670,694 and $2,334,451, respectively) | | $ | 9,609,765,971 | | | $ | 7,870,196,518 | |
| | |
|
|
| |
|
|
|
| | |
| Share Information: | | | | | | | | |
Shares sold | | | 254,312,934 | | | | 282,927,918 | |
Distributions reinvested | | | 26,493,475 | | | | 19,509,574 | |
Shares redeemed | | | (127,349,477 | ) | | | (130,172,563 | ) |
| | |
|
|
| |
|
|
|
Net increase in shares outstanding | | | 153,456,932 | | | | 172,264,929 | |
| | |
|
|
| |
|
|
|
| | |
| See accompanying Notes to Financial Statements | | Dodge & Cox Income Fund / 8 |
Notes to Financial Statements
Note 1 — Organization and Significant Accounting Policies
Dodge & Cox Income Fund (the “Fund”) is one of the series constituting the Dodge & Cox Funds (the “Trust” or the “Funds”). The Trust is organized as a Delaware statutory trust and is registered under the Investment Company Act of 1940, as amended, as a diversified, open-end management investment company. The Fund commenced operations on January 3, 1989, and seeks high and stable current income consistent with long-term preservation of capital. Risk considerations and investment strategies of the Fund are discussed in the Fund’s Prospectus.
The financial statements have been prepared in conformity with accounting principles generally accepted in the United States of America, which require the use of estimates and assumptions by management. Significant accounting policies are as follows:
Security valuation. The Fund’s net assets are valued as of the close of trading on the New York Stock Exchange (NYSE), generally 4:00 p.m. Eastern Time, each day that the NYSE is open for business. Fixed-income securities with original maturities of one year or more are priced on the basis of valuations furnished by pricing services which utilize both dealer-supplied valuations and electronic data processing techniques. Under certain circumstances, fixed-income securities that are not valued by pricing services are temporarily valued by the investment manager utilizing both dealer-supplied valuations and electronic data processing techniques. Valuations of fixed-income securities take into account appropriate factors such as institutional-size trading markets in similar groups of securities, yield, quality, coupon rate, maturity, type of issue, trading characteristics and other market data and do not rely exclusively upon exchange or over-the-counter listed prices. Security values are not discounted based on the size of the Fund’s position. Securities for which market quotations are not readily available are valued at fair value as determined in good faith by or at the direction of the Board of Trustees. Short-term securities are valued at amortized cost which approximates current value. All securities held by the Fund are denominated in U.S. dollars.
Security transactions, investment income, expenses, and distributions. Security transactions are recorded on the trade
date. Realized gains and losses on securities sold are determined on the basis of identified cost.
Interest income is recorded on the accrual basis. Interest income includes coupon interest, amortization of premium and accretion of discount on debt securities, and gains and losses on paydowns of mortgage-backed securities. The ability of the issuers of the debt securities held by the Fund to meet their obligations may be affected by economic developments in a specific industry, state or region. Debt obligations may be placed on non-accrual status and related interest income may be reduced by ceasing current accruals and writing off interest receivables when the collection of all or a portion of interest has become doubtful based on consistently applied procedures. A debt obligation is removed from non-accrual status when the issuer resumes interest payments or when collectibility of interest is reasonably assured.
Expenses are recorded on the accrual basis. Most expenses of the Trust can be directly attributed to a specific series. Expenses which cannot be directly attributed are apportioned among the Funds in the Trust.
Distributions to shareholders are recorded on the ex-dividend date.
Repurchase agreements. The Fund may enter into repurchase agreements secured by U.S. government securities which involve the purchase of securities from a counterparty with a simultaneous commitment to resell the securities at an agreed-upon date and price. It is the Fund’s policy that its custodian take possession of the underlying collateral securities, the fair value of which exceeds the principal amount of the repurchase transaction, including accrued interest, at all times. In the event of default by the counterparty, the Fund has the contractual right to liquidate the securities and to apply the proceeds in satisfaction of the obligation.
Note 2 — Related Party Transactions
Management fees. Under a written agreement, the Fund pays an annual management fee of 0.50% of the Fund’s average daily net assets up to $100 million and 0.40% of the Fund’s average daily net assets in excess of $100 million to Dodge & Cox, investment manager of the Fund. The agreement further provides that Dodge & Cox shall waive its fee to the extent that such fee plus all other ordinary operating expenses of the Fund exceed 1% of the average daily net assets for the year.
| | |
| 9 / Dodge & Cox Income Fund | | |
Notes to Financial Statements (continued)
Fund officers and trustees. All officers and four of the trustees of the Trust are officers or employees of Dodge & Cox. The Trust pays a fee only to those trustees who are not affiliated with Dodge & Cox.
Indemnification. Under the Trust’s organizational documents, its officers and trustees are indemnified against certain liabilities arising out of the performance of their duties to the Trust. In addition, in the normal course of business the Trust enters into contracts that provide general indemnities to other parties. The Trust’s maximum exposure under these arrangements is unknown as this would involve future claims that may be made against the Trust that have not yet occurred.
Note 3 — Income Tax Information and Distributions to Shareholders
A provision for federal income taxes is not required since the Fund intends to continue to qualify as a regulated investment company under Subchapter M of the Internal Revenue Code and distribute all of its taxable income to shareholders. Distributions are determined in accordance with income tax regulations, which may differ from net investment income and realized gains for financial reporting purposes. Financial reporting records are adjusted for permanent book/tax differences to reflect tax character. Financial records are not adjusted for temporary differences.
Book/tax differences are primarily due to differing treatments of net short-term realized gain and paydown loss. At December 31, 2005, the cost of investments for federal income tax purposes was equal to the cost for financial reporting purposes.
Distributions during the year ended December 31, 2005 were characterized as follows for federal income tax purposes:
| | | |
Ordinary income ($0.55 per share) | | $ | 390,586,222 |
Long-term capital gain | | | — |
| | |
|
|
Total distributions ($0.55 per share) | | $ | 390,586,222 |
| | |
|
|
At December 31, 2005, the tax basis components of distributable earnings were as follows:
| | | | |
Unrealized appreciation | | $ | 124,242,255 | |
Unrealized depreciation | | | (135,624,681 | ) |
| | |
|
|
|
Net unrealized depreciation | | | (11,382,426 | ) |
Undistributed ordinary income | | | 6,670,694 | |
Capital loss carryforward* | | | (66,584,656 | ) |
Deferred loss** | | | (7,224,771 | ) |
| * | | Represents accumulated capital loss which may be carried forward to offset future capital gains. This carryforward expires as follows: |
| | | |
Expiring in 2011 | | $ | 14,093,589 |
Expiring in 2012 | | | 32,528,048 |
Expiring in 2013 | | | 19,963,019 |
| | |
|
|
| | | $ | 66,584,656 |
| | |
|
|
| ** | | Represents net realized loss incurred between November 1, 2005 and December 31, 2005. As permitted by tax regulations, the Fund has elected to treat this loss as arising in 2006. |
Note 4 — Purchase and Sales of Investments
For the year ended December 31, 2005, purchases and sales of securities, other than short-term securities and U.S. government securities, aggregated $879,962,954 and $430,887,177, respectively. For the year ended December 31, 2005, purchases and sales of U.S. government securities aggregated $4,468,161,362 and $3,051,033,404, respectively.
| | |
| | | Dodge & Cox Income Fund / 10 |
Financial Highlights
| | | | | | | | | | | | | | | | | |
SELECTED DATA AND RATIOS
(for a share outstanding throughout each year) | | | | Year Ended December 31, | |
| | | | | 2005 | | | 2004 | | | 2003 | | | 2002 | | | 2001 | |
Net asset value, beginning of year | | | | $12.84 | | | $12.92 | | | $12.77 | | | $12.20 | | | $11.80 | |
Income from investment operations: | | | | | | | | | | | | | | | | | |
Net investment income | | | | 0.55 | | | 0.54 | | | 0.60 | | | 0.66 | | | 0.74 | |
Net realized and unrealized gain (loss) | | | | (0.30 | ) | | (0.08 | ) | | 0.15 | | | 0.62 | | | 0.46 | |
| | | | |
|
| |
|
| |
|
| |
|
| |
|
|
Total from investment operations | | | | 0.25 | | | 0.46 | | | 0.75 | | | 1.28 | | | 1.20 | |
| | | | |
|
| |
|
| |
|
| |
|
| |
|
|
Distributions to shareholders from: | | | | | | | | | | | | | | | | | |
Net investment income | | | | (0.55 | ) | | (0.54 | ) | | (0.60 | ) | | (0.66 | ) | | (0.74 | ) |
Net realized gain | | | | — | | | — | | | — | | | (0.05 | ) | | (0.06 | ) |
| | | | |
|
| |
|
| |
|
| |
|
| |
|
|
Total distributions | | | | (0.55 | ) | | (0.54 | ) | | (0.60 | ) | | (0.71 | ) | | (0.80 | ) |
| | | | |
|
| |
|
| |
|
| |
|
| |
|
|
Net asset value, end of year | | | | $12.54 | | | $12.84 | | | $12.92 | | | $12.77 | | | $12.20 | |
| | | | |
|
| |
|
| |
|
| |
|
| |
|
|
Total return | | | | 1.98 | % | | 3.64 | % | | 5.97 | % | | 10.75 | % | | 10.32 | % |
Ratios/supplemental data: | | | | | | | | | | | | | | | | | |
Net assets, end of year (millions) | | | | $9,610 | | | $7,870 | | | $5,697 | | | $3,405 | | | $1,512 | |
Ratio of expenses to average net assets | | | | 0.44 | % | | 0.44 | % | | 0.45 | % | | 0.45 | % | | 0.45 | % |
Ratio of net investment income to average net assets | | | | 3.99 | % | | 3.61 | % | | 3.93 | % | | 5.38 | % | | 6.18 | % |
Portfolio turnover rate | | | | 24 | % | | 30 | % | | 41 | % | | 31 | % | | 40 | % |
See accompanying Notes to Financial Statements
Report of Independent Registered Public Accounting Firm
To the Trustees of Dodge & Cox Funds and Shareholders of Dodge & Cox Income Fund
In our opinion, the accompanying statement of assets and liabilities, including the portfolio of investments, and the related statements of operations and of changes in net assets and the financial highlights present fairly, in all material respects, the financial position of the Dodge & Cox Income Fund (the “Fund”, one of the series constituting Dodge & Cox Funds) at December 31, 2005, the results of its operations for the year then ended, the changes in its net assets for each of the two years in the period then ended and the financial highlights for each of the five years in the period then ended, in conformity with accounting principles generally accepted in the United States of America. These financial statements and financial highlights (hereafter referred to as “financial statements”) are the responsibility of the Fund’s management; our responsibility is to express an opinion on these financial statements based on our audits. We conducted our audits of these financial statements in accordance with the standards of the Public Company Accounting Oversight Board (United States). Those standards require that we plan and perform the audit to obtain reasonable assurance about whether the financial statements are free of material misstatement. An audit includes examining, on a test basis, evidence supporting the amounts and disclosures in the financial statements, assessing the accounting principles used and significant estimates made by management, and evaluating the overall financial statement presentation. We believe that our audits, which included confirmation of securities at December 31, 2005 by correspondence with the custodian and brokers, provide a reasonable basis for our opinion.
PricewaterhouseCoopers LLP
San Francisco, California
February 16, 2006
| | |
| 11 / Dodge & Cox Income Fund | | |
Shareholder Meeting Results (unaudited)
On December 2, 2005, a joint special meeting of shareholders of the Dodge & Cox Funds was held at which the nine Trustees and nominees identified below were elected. The following is a report of the total votes cast by the Funds’ shareholders:
PROPOSAL: Election of Trustees
| | | | | | |
| | | FOR | | WITHHELD | | TOTAL |
Trustees: | | | | | | |
1. William F. Ausfahl | | 1,184,162,195 | | 11,475,032 | | 1,195,637,227 |
2. L. Dale Crandall | | 1,186,779,006 | | 8,858,221 | | 1,195,637,227 |
3. Dana M. Emery | | 1,186,497,036 | | 9,140,191 | | 1,195,637,227 |
4. John A. Gunn | | 1,186,448,522 | | 9,188,705 | | 1,195,637,227 |
5. Harry R. Hagey | | 1,186,227,617 | | 9,409,610 | | 1,195,637,227 |
6. Thomas A. Larsen | | 1,159,731,462 | | 35,905,765 | | 1,195,637,227 |
7. Will C. Wood | | 1,187,752,504 | | 7,884,723 | | 1,195,637,227 |
| | | |
Nominees: | | | | | | |
8. Kenneth E. Olivier | | 1,158,621,330 | | 37,015,897 | | 1,195,637,227 |
9. John B. Taylor | | 1,187,597,104 | | 8,040,123 | | 1,195,637,227 |
Board Approval of Funds’ Investment Management Agreements and Management Fees (unaudited)
The Board of Trustees is responsible for overseeing the performance of the Dodge & Cox Funds’ investment manager and determining whether to continue the Investment Management Agreements between the Funds and Dodge & Cox each year (the “Agreements”). At a meeting of the Board of Trustees of the Trust held on December 16, 2005, the Trustees, by a unanimous vote (including a separate vote of those Trustees who are not “interested persons” (as defined in the Investment Company Act of 1940) (the “Independent Trustees”)), approved the renewal of the Agreements for an additional one-year term through December 31, 2006. During the course of the year, the Board received a wide variety of materials relating to the services provided by Dodge & Cox and the performance of the Funds.
Information Received
In advance of the meeting, the Board, including each of the Independent Trustees, requested, received and reviewed materials relating to the Agreements. The Independent Trustees retained Morningstar® to prepare an independent expense and performance summary for each Fund and comparable funds managed by other advisers identified by Morningstar®. The Morningstar® materials
included information regarding advisory fee rates, expense ratios, and transfer agency, custodial and distribution expenses, as well as performance comparisons to an appropriate index or combination of indices. The materials reviewed by the Board also included information concerning Dodge & Cox’s profitability, financial results and condition, including advisory fee revenue and separate account advisory fee schedules. The Board additionally considered the Funds’ brokerage commissions, turnover rates and sales and redemption data for the Funds, including “soft dollar” payments made for research benefiting the Funds and other accounts managed by Dodge & Cox, and brokerage commissions and expenses paid by Dodge & Cox. Other aspects of Dodge & Cox’s services to the Funds which were reviewed included compliance and supervision of third-party service providers (e.g., custodian, “blue sky” administrator, transfer agent and fund accountant), shareholder servicing, accounting and administrative services, web services, the character of non-advisory services, the record of compliance with the Funds’ investment policies and restrictions and the Funds’ Code of Ethics, investment management staffing and biographies, information furnished to investors and shareholders (including the Funds’ prospectus, Statement of Additional Information, shareholder reports, and quarterly reports), and third-party retirement plan administrator reimbursements by Dodge & Cox for the same periods.
The Board received a memorandum from the Independent Legal Counsel to the Independent Trustees, discussing the factors generally regarded as appropriate to consider in evaluating advisory arrangements and copies of the Agreements. The Trust’s Governance Committee, consisting solely of Independent Trustees, met with the Independent Legal Counsel on December 1, 2005 to discuss whether to renew the Agreements. The Board, including the Independent Trustees, subsequently concluded that the existing Agreements are fair and reasonable and voted to approve the Agreements.
In considering the Agreements, the Board, including the Independent Trustees, did not identify any single factor or particular information as all-important or controlling. In reaching the decision to approve the Agreements, the Board, which was advised by Independent Legal Counsel, considered the following factors, among others, and reached the conclusions described below.
Nature, Quality, and Extent of the Services
The Board considered the nature, quality and extent of portfolio management, administrative and shareholder services performed by Dodge & Cox, including: Dodge & Cox’s established long-term history of care and conscientiousness in the management of the
| | |
| | | Dodge & Cox Income Fund / 12 |
Funds; demonstrated consistency in investment approach and depth, background and experience of the Dodge & Cox Investment Policy Committee, International Investment Policy Committee, Fixed Income Strategy Committee and research analysts responsible for managing the Funds; Dodge & Cox’s organizational structure; frequent favorable recognition of Dodge & Cox and the Funds in the media and industry publications; Dodge & Cox’s performance in the areas of compliance, administration and shareholder communication and services, supervision of Fund operations and general oversight of other service providers; favorable peer group comparisons of expense ratios, management fee comparisons, expenses (e.g., transfer agent, custody and other fees and expenses) and asset comparisons and performance and risk summaries prepared independently by Morningstar® and favorable fiduciary grade and “Star” rankings by Morningstar®. The Board also acknowledged Dodge & Cox’s decision to close its institutional equity and balanced separate account business and had previously voted, at the recommendation of Dodge & Cox, to close the Stock and Balanced Funds to control the pace of growth. The Board also acknowledged that the services provided by Dodge & Cox are extensive in nature and that Dodge & Cox consistently delivered a high level of service. The Board concluded that it was satisfied with the nature, extent and quality of investment management and other services provided to the Funds by Dodge & Cox.
Investment Performance
The Board considered short-term and long-term investment performance for each Fund (including periods of outperformance or underperformance) as compared to both relevant indices and the performance of such Fund’s peer group. While not dispositive in the determination, performance information prepared by Morningstar® and Dodge & Cox demonstrated to the Board a consistent pattern of favorable performance for investors and, in most instances, the Funds have outperformed their peer groups for short and long-term periods. The Board also noted that the strong investment performance delivered by Dodge & Cox to the Funds appeared to be consistent with the performance delivered for other (non-Fund) clients of Dodge & Cox. The Board concluded that Dodge & Cox delivers favorable performance for Fund investors consistent with the long-term investment strategies being pursued by the Funds.
Costs and Ancillary Benefits
Costs of Services to Funds: Fees and Expenses. The Board considered each Fund’s management fee rates and expense ratios relative to industry averages for similar mutual funds and relative to
management fees charged by Dodge & Cox to other (non-fund) clients. The Board evaluated the operating structures of the Funds and Dodge & Cox—which included a centralized focus on investment management operations, outsourcing of non-advisory support services to unaffiliated third-party service providers, avoiding the practice of charging front-end sales commissions or distribution fees, having Dodge & Cox pay for distribution-related costs and reimbursements to third-party retirement plan administrators, receiving numerous administrative, regulatory compliance, and shareholder support services from Dodge & Cox without any additional administrative fee, and achieving relatively low transaction costs and portfolio turnover rates. The Board noted that the Funds are substantially below peer group averages in expense ratios and management fee rates. The Board also noted that the range of services under the Agreements is much more extensive than under Dodge & Cox’s separate advisory (non-fund) client agreements, and that there are reasonable justifications for differences in fee rates charged between the two lines of business. The Board concluded that costs incurred by the Funds for the services it receives (including the management fee paid to Dodge & Cox) are reasonable and that the fees are acceptable based upon the qualifications, experience, reputation, and performance of Dodge & Cox and the low overall expense ratios of the Funds.
Profitability and Costs of Services to Dodge & Cox; “Fall-out” Benefits. The Board reviewed reports of Dodge & Cox’s financial position, profitability and estimated overall value, and they considered Dodge & Cox’s overall profitability within its context as a private, employee-owned S-Corporation and relative to the favorable
services provided. The Board considered recent increases to Dodge & Cox’s gross revenues, and noted the importance of Dodge & Cox’s profitability—which is derived solely from management fees and does not include other business ventures—to maintain its independence, company culture and ethics, and management continuity. They noted that Dodge & Cox’s profitability is enhanced due to its efficient internal business model, and that the compensation/profit structure at Dodge & Cox is vital for remaining independent and facilitating retention of its management and investment professionals. They also noted that Dodge & Cox has voluntarily limited growth of assets by closing the Stock and Balanced Funds to new investors and by not taking on new equity and balanced separate account clients. The Board noted that these actions were financially disadvantageous to Dodge & Cox, but illustrated a commitment to act in the best interest of existing Fund shareholders and separate account clients. The Board considered potential “fall-out” benefits (including the receipt of research from unaffiliated brokers) that Dodge & Cox might receive in its
| | |
| 13 / Dodge & Cox Income Fund | | |
association with the Funds, and they concluded that these benefits are reasonable in light of Dodge & Cox’s well established stand-alone separate account business. The Board also noted the extent of additional administrative services performed by Dodge & Cox for the Funds, and that the magnitude of costs and risks borne by Dodge & Cox in rendering advisory services to the Funds (including risks in the compliance, securities valuation and investment management processes) are increasing. The Board concluded that the profitability of Dodge & Cox’s relationship with the Funds (including fall-out benefits) was fair and reasonable.
The Benefit of Economies of Scale
The Board considered whether there have been economies of scale with respect to the management of each Fund, whether the Funds have appropriately benefited from any economies of scale, and whether the management fee rate is reasonable in relation to the Fund assets and any economies of scale that may exist. The Board noted that considerable efficiencies of the Funds’ organization and fee structure have been realized by shareholders at the outset of their investment (i.e., from the first dollar), such as management fee rates that start lower than industry and many peer group averages and management fees and overall expense ratios that are lower than averages for peer group funds with approximately the same level of assets. Shareholders also realize efficiencies from the outset of their investment due to organizational efficiencies involved with Dodge & Cox’s investment management process and with avoiding distribution and marketing structures whose costs would ultimately be borne by the Funds. The Board noted that Dodge & Cox’s internal costs of providing investment management, administrative, and compliance services to the Funds have increased. The Board’s decision to renew the Agreements was made after consideration of economies of scale and review of comparable fund expense ratios and historical expense ratio patterns for the Funds. Their review also included consideration of the desirability of adding breakpoints to the Funds’ fee schedules. The Board concluded that the current Dodge & Cox fee structure is fair and reasonable and adequately reflect economies of scale.
Conclusion
Based on their evaluation of all material factors and assisted by the advice of Independent Legal Counsel to the Independent Trustees, the Board, including the Independent Trustees, concluded that the advisory fee structure was fair and reasonable, that each Fund was paying a competitive fee for the services provided, that the scope and quality of Dodge & Cox’s services has provided substantial value for Fund shareholders over the long-term, and that approval of the
Agreements was in the best interests of each Fund and its shareholders.
Fund Holdings
The Fund provides a complete list of its holdings four times in each fiscal year, at the quarter-ends. The lists appear in the Fund’s First Quarter, Semi-Annual, Third Quarter and Annual Reports to shareholders. The Fund files the lists with the Securities and Exchange Commission (SEC) on Form N-CSR (second and fourth quarters) and Form N-Q (first and third quarters). Shareholders may view the Funds’ Forms N-CSR and N-Q on the SEC’s website at www.sec.gov. Forms N-CSR and N-Q may also be reviewed and copied at the SEC’s Public Reference Room in Washington, DC. Information regarding the operations of the Public Reference Room may be obtained by 1-202-942-8090 (direct) or 1-800-732-0330 (general SEC number). A complete list of the Fund’s quarter-end holdings are also available at www.dodgeandcox.com on or about 15 days following each quarter end.
Proxy Voting
For a free copy of the Fund’s proxy voting policies and procedures, please call 1-800-621-3979, visit www.dodgeandcox.com or the SEC’s web site at www.sec.gov. Information regarding how Dodge & Cox, on behalf of the Fund, voted proxies relating to the Fund’s portfolio securities for the most recent twelve-month period ending June 30 is also available at www.dodgeandcox.com or the SEC’s web site at www.sec.gov.
| | |
| | | Dodge & Cox Income Fund / 14 |
Dodge & Cox Funds—Executive Officer & Trustee Information
| | | | | | |
Name (Age) and
Address* | | Position with Trust
(Year of Election or
Appointment) | | Principal Occupation During Past 5 Years | | Other Directorships Held by Trustees |
| Interested Trustees & Officers |
Harry R. Hagey (64) | | Chairman and Trustee (Trustee since 1975) | | Chairman and Director of Dodge & Cox, Portfolio Manager and member of Investment Policy Committee (IPC) | | — |
John A. Gunn (62) | | President and Trustee
(Trustee since 1985) | | Chief Executive Officer (since December, 2005), Chief Investment Officer and Director of Dodge & Cox, Portfolio Manager, and member of IPC, Fixed-Income Strategy Committee (FISC) and International Investment Policy Committee (IIPC) | | — |
Dana M. Emery (44) | | Vice President and Trustee (Trustee since 1993) | | Executive Vice President (since December, 2005) and Director of Dodge & Cox, Manager of the Fixed-Income Department, Portfolio Manager and member of IPC and FISC | | — |
Kenneth E. Olivier (53) | | Vice President and Trustee
(Trustee since 2005) | | President (since December, 2005) and Director of Dodge & Cox, Portfolio Manager and member of IPC | | — |
A. Horton Shapiro (66) | | Executive Vice President (Since 1998) | | Senior Vice President and Director of Dodge & Cox, Portfolio Manager | | — |
| Katherine Herrick Drake (51) | | Vice President (Since 1993) | | Vice President of Dodge & Cox, Portfolio Manager | | — |
| Diana S. Strandberg (46) | | Vice President
(Since 2005) | | Vice President of Dodge & Cox, Portfolio Manager and member of IPC and IIPC | | |
John M. Loll (39) | | Treasurer and Assistant Secretary (Since 2000) | | Vice President and Treasurer of Dodge & Cox | | — |
| Thomas M. Mistele (52) | | Secretary and Assistant Treasurer (Since 2000) | | Chief Operating Officer (since 2004), Director (since 2005), Secretary and General Counsel of Dodge & Cox | | — |
| Marcia P. Venegas (37) | | Chief Compliance Officer
(Since 2004) | | Chief Compliance Officer of Dodge & Cox (since 2005), Compliance Officer of Dodge & Cox (2003-2004); Compliance and Business Risk Manager of Deutsche Asset Management, Australia Limited (1999-2001) | | — |
| Independent Trustees |
William F. Ausfahl (65) | | Trustee (Since 2002) | | CFO, The Clorox Co. (1982-1997); Director, The Clorox Co. (1984-1997) | | — |
L. Dale Crandall (64) | | Trustee (Since 1999) | | President, Kaiser Foundation Health Plan, Inc. and Kaiser Foundation Hospitals (2000-2002); Senior Vice President—Finance and Administration & CFO, Kaiser Foundation Health Plan, Inc. and Kaiser Foundation Hospitals (1998-2000) | | Director, Union BanCal Corporation (bank holding company) and Union Bank of California (commercial bank) (2001-Present); Director, Covad Communications Group (broadband communications services) (2002-Present); Director, Ansell Limited (medical equipment and supplies) (2002-Present); Director, BEA Systems, Inc. (software and programming) (2003-Present); Director, Coventry Health Care, Inc. (managed healthcare) (2004-Present) |
Thomas A. Larsen (56) | | Trustee (Since 2002) | | Director in Howard, Rice, Nemerovski, Canady, Falk & Rabkin (law firm) | | — |
John B. Taylor (60) | | Trustee (Since 2005) | | Professor of Economics, Stanford University; Senior Fellow, Hoover Institution; Under Secretary for International Affairs, United States Treasury (2001-2005) | | — |
Will C. Wood (66) | | Trustee (Since 1992) | | Principal, Kentwood Associates, Financial Advisers | | Director, Banco Latinoamericano de Exportaciones S.A. (Latin American Foreign Trade Bank) (1999-Present) |
| * | | The address for each Officer and Trustee is 555 California Street, 40th Floor, San Francisco, California 94104. Each Officer and Trustee oversees all four series in the Dodge & Cox Funds complex and serves for an indefinite term. |
Additional information about the Trust’s Trustees is available in the Trust’s Statement of Additional Information (SAI). You can get a free copy of the SAI by contacting Dodge & Cox Funds at 1-800-621-3979.
A code of ethics, as defined in Item 2 of Form N-CSR, adopted by the registrant and applicable to the registrant’s principal executive officer and principal financial officer, is filed as an exhibit to this Form N-CSR. No substantive amendments were approved or waivers were granted to this code of ethics during the period covered by this report.
| ITEM 3. | AUDIT COMMITTEE FINANCIAL EXPERT. |
The Board of Trustees of the registrant has determined that William F. Ausfahl and L. Dale Crandall, members of the registrant’s Audit Committee, are each an “audit committee financial expert” and are “independent,” as defined in Item 3 of Form N-CSR.
| ITEM 4. | PRINCIPAL ACCOUNTANT FEES AND SERVICES. |
(a) – (d) Aggregate fees billed to the registrant for the fiscal years ended December 31, 2005 and December 31, 2004 for professional services rendered by the registrant’s principal accountant were as follows:
| | | | | | |
| | | 2005 | | 2004 |
Audit Fees | | $ | 179,550 | | $ | 158,400 |
Audit-Related Fees | | | 18,000 | | | 16,500 |
Tax Fees | | | 58,000 | | | 55,200 |
All Other Fees | | | — | | | — |
Audit fees include amounts related to the audit of the registrant’s annual financial statements and services normally provided by the accountant in connection with statutory and regulatory filings. Audit-related fees include the performance of agreed-upon procedures in connection with the registrant’s semi-annual financial statements. Tax fees include amounts related to tax return preparation, compliance, and reviews.
(e)(1) The registrant’s audit committee has adopted policies and procedures (“Policies”) which require the registrant’s audit committee to pre-approve all audit and non-audit services provided by the principal accountant to the registrant. The policies also require the audit committee to pre-approve any engagement of the principal accountant to provide non-audit services to the registrant’s investment adviser, if the services directly impact the registrant’s operations and controls. The Policies do not apply in the case of audit services that the principal accountant provides to the registrant’s adviser. If a service (other than the engagement of the principal accountant to audit the registrant’s financial statements) is required to be pre-approved under the Policies between regularly scheduled audit committee meetings, pre-approval may be authorized by a designated audit committee member with ratification at the next scheduled audit committee meeting.
(e)(2) No services included in (b) - (d) above were approved pursuant to paragraph (c)(7)(i)(C) of Rule 2-01 of Regulation S-X.
(f) Less than 50 percent of the hours expended on the principal accountant’s engagement to audit the registrant’s financial statements for the most recent fiscal year were attributed to work performed by persons other than the principal accountant’s full-time, permanent employees.
(g) For the fiscal years ended December 31, 2005 and December 31, 2004, the aggregate fees billed by the registrant’s principal accountant for non-audit services rendered to the registrant, for non-audit services rendered to the registrant’s investment adviser, and for non-audit services rendered to entities controlled by the adviser were $181,000 and $178,100, respectively.
(h) All non-audit services described under (g) above were pre-approved by the registrant’s audit committee. Accordingly, these services were considered by the registrant’s audit committee and found to be compatible with maintaining the principal accountant’s independence.
| ITEM 5. | AUDIT COMMITTEE OF LISTED REGISTRANTS. |
Not applicable.
| ITEM 6. | SCHEDULE OF INVESTMENTS. |
Not applicable. The complete schedule of investments is included in Item 1 of this Form N-CSR.
| ITEM 7. | DISCLOSURE OF PROXY VOTING POLICIES AND PROCEDURES FOR CLOSED-END MANAGEMENT INVESTMENT COMPANIES. |
Not applicable.
| ITEM 8. | PORTFOLIO MANAGERS OF CLOSED-END MANAGEMENT INVESTMENT COMPANIES. |
Not applicable.
| ITEM 9. | PURCHASES OF EQUITY SECURITIES BY CLOSED-END MANAGEMENT INVESTMENT COMPANY AND AFFILIATED PURCHASERS. |
Not applicable.
| ITEM 10. | SUBMISSION OF MATTERS TO A VOTE OF SECURITY HOLDERS. |
The registrant has adopted the following procedures by which shareholders may recommend nominees to the registrant’s Board of Trustees.
1. The shareholder must submit any such recommendation in writing to the registrant to the attention of the Secretary at the address of the principal executive offices of the registrant. The shareholder’s recommendation is then considered by the registrant’s Nominating Committee.
2. The shareholder recommendation must include:
(i) A statement in writing setting forth (a) the name, date of birth, business address and residence address of the person recommended by the shareholder (the “candidate”); and (b) whether the recommending shareholder believes that the candidate is or will be an “interested person” of the registrant (as defined in the Investment Company Act of 1940) and, if not an “interested person,” information regarding the candidate that will be sufficient for the registrant to make such determination and, if applicable, similar information regarding whether the candidate would satisfy the standards for independence of a Board member under listing standards of the New York Stock Exchange or other applicable securities exchange.
(ii) The written and manually signed consent of the candidate to be named as a nominee and to serve as a Trustee if elected;
(iii) The recommending shareholder’s name as it appears on the registrant’s books and the number of all shares of the registrant owned beneficially and of record by the recommending shareholder (as evidenced to the Nominating Committee’s satisfaction by a recent brokerage or account statement); and
(iv) A description of all arrangements or understandings between the recommending shareholder and the candidate and any other person or persons (including their names) pursuant to which the recommendation is being made by the recommending shareholder.
In addition, the Nominating Committee may require the candidate to furnish such other information as it may reasonably require or deem necessary to determine the eligibility of such candidate to serve on the Board or to satisfy applicable law and information regarding the candidate that would be required to be disclosed if the candidate were a nominee in a proxy statement or other filing required to be made in connection with solicitation of proxies for election of Trustees.
| ITEM 11. | CONTROLS AND PROCEDURES. |
(a) An evaluation was performed within 90 days of the filing of this report, under the supervision and with the participation of the registrant’s management, including the principal executive officer and principal financial officer, of the effectiveness of the design and operation of the registrant’s disclosure controls and procedures. Based on that evaluation, the principal executive officer and principal financial officer concluded that the registrant’s disclosure controls and procedures were effective.
(b) The registrant’s principal executive officer and principal financial officer are aware of no changes in the registrant’s internal control over financial reporting that occurred during the registrant’s second fiscal quarter of the period covered by this report that has materially affected, or is reasonably likely to materially affect, the registrant’s internal control over financial reporting.
| | |
| (a)(1) | | The registrant’s code of ethics pursuant to Item 2 of Form N-CSR is attached. (EX.99A) |
| |
| (a)(2) | | Certifications pursuant to Section 302 of the Sarbanes-Oxley Act of 2002 are attached. (EX.99B) |
| |
| (a)(3) | | Not applicable. |
| |
| (b) | | Certifications pursuant to Section 906 of the Sarbanes-Oxley Act of 2002 are attached. (EX.99C) |
SIGNATURES
Pursuant to the requirements of the Securities Exchange Act of 1934 and the Investment Company Act of 1940, the registrant has duly caused this report to be signed on its behalf by the undersigned, thereunto duly authorized.
| | |
| Dodge & Cox Funds |
| |
| By | | /s/ Harry R. Hagey |
| | Harry R. Hagey |
| | Chairman - Principal Executive Officer |
Date February 27, 2006
Pursuant to the requirements of the Securities Exchange Act of 1934 and the Investment Company Act of 1940, this report has been signed below by the following persons on behalf of the registrant and in the capacities and on the dates indicated.
| | |
| Dodge & Cox Funds |
| |
| By | | /s/ Harry R. Hagey |
| | Harry R. Hagey |
| | Chairman - Principal Executive Officer |
| |
| By | | /s/ John M. Loll |
| | John M. Loll |
| | Treasurer – Principal Financial Officer |
Date February 27, 2006