UNITED STATES
SECURITIES AND EXCHANGE COMMISSION
Washington, D.C. 20549
FORM N-CSR
CERTIFIED SHAREHOLDER REPORT OF REGISTERED
MANAGEMENT INVESTMENT COMPANIES
Investment Company Act file number 811-173
DODGE & COX FUNDS
(Exact name of registrant as specified in charter)
| | |
555 California Street, 40th Floor San Francisco, CA 94104 |
|
| (Address of principal executive offices) (Zip code) |
Thomas M. Mistele, Esq.
555 California Street, 40th Floor
San Francisco, CA 94104
(Name and address of agent for service)
Registrant’s telephone number, including area code: 415-981-1710
Date of fiscal year end: December 31, 2004
Date of reporting period: from July 1, 2004 through December 31, 2004
Form N-CSR is to be used by management investment companies to file reports with the Commission not later than 10 days after the transmission to stockholders of any report that is required to be transmitted to stockholders under Rule 30e-1 under the Investment Company Act of 1940 (17 CFR 270.30e-1). The Commission may use the information provided on Form N-CSR in its regulatory, disclosure review, inspection, and policymaking roles.
A registrant is required to disclose the information specified by Form N-CSR, and the Commission will make this information public. A registrant is not required to respond to the collection of information contained in Form N-CSR unless the Form displays a currently valid Office of Management and Budget (“OMB”) control number. Please direct comments concerning the accuracy of the information collection burden estimate and any suggestions for reducing the burden to Secretary, Securities and Exchange Commission, 450 Fifth Street, NW, Washington, DC 20549-0609. The OMB has reviewed this collection of information under the clearance requirements of 44 U.S.C. ss. 3507.
ITEM 1. REPORTS TO STOCKHOLDERS.
The following are the December 31, 2004 annual reports for the Dodge & Cox Funds, a Delaware statutory trust, consisting of four series: Dodge & Cox Stock Fund, Dodge & Cox International Stock Fund, Dodge & Cox Balanced Fund and Dodge & Cox Income Fund. The reports of each series were transmitted to their respective shareholders on March 1, 2005.

Stock Fund
(Closed to New Investors)
Established 1965

40th Annual Report
December 31, 2004
2004
Stock Fund
www.dodgeandcox.com
For Fund literature, transactions and account
information, please visit the Funds’ web site.
or write or call:
Dodge & Cox Funds
c/o Boston Financial Data Services
P.O. Box 8422
Boston, Massachusetts 02266-8422
(800) 621-3979
Investment Manager
Dodge & Cox
555 California Street, 40th Floor
San Francisco, California 94104
(415) 981-1710
This report is submitted for the general information of the shareholders of the Fund. The report is not authorized for distribution to prospective investors in the Fund unless it is accompanied by a current prospectus.
This report reflects our views, opinions and portfolio holdings as of December 31, 2004, the end of the reporting period. Any such views are subject to change at any time based upon market or other conditions and Dodge & Cox disclaims any responsibility to update such views. These views may not be relied on as investment advice and, because investment decisions for a Dodge & Cox Fund are based on numerous factors, may not be relied on as an indication of trading intent on behalf of any Dodge & Cox Fund.
12/04 SF AR  Printed on recycled paper
To Our Shareholders
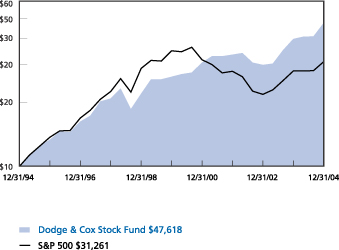
In last year’s Stock Fund Annual Report we wrote, “At the risk of looking like a stopped clock, we want to reiterate our caution about future equity returns.” Fortunately, we also wrote, “Forecasting the market on a short-term basis has a large error rate,” as returns in the equity markets exceeded our expectations. For the year ended December 31, 2004, the Fund returned 19.2%, compared to 10.9% for the S&P 500 Index (S&P 500). Returns for longer periods are listed on the following page.
Please note that the five-year return comparisons are measured from the top of the stock market bubble—a period in which the Fund benefited from avoiding most of the declining high-priced “growth” companies, while the ten-year return comparisons include 1995 through 1999—years when the Fund lagged the returns of the S&P 500 as those same growth companies ascended.
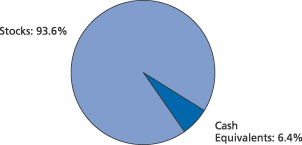
At year-end, the Fund had net assets of $43.3 billion and a cash position of 6.4%. The share price of the Fund rose from $113.78 at the end of 2003 to $130.22 on December 31, 2004. In addition, during the year, the Fund distributed income of $1.53 per share, a short-term capital gain of $1.21 per share and long-term capital gains of $2.44 per share.
2004 Performance Review
A surprisingly strong rally in the fourth quarter (the Stock Fund returned 12.6% compared to 9.2% for the S&P 500) boosted the full year results. During 2004, every sector in the Fund contributed positively to results. The Fund’s holdings in the Information Technology (e.g., Computer Sciences up 27%, Motorola up 38% and NCR Corp. up 78%) and Financial (e.g., Capital One up 38% and Loews up 44%) sectors were particularly strong contributors. Additional notable performers in 2004 included AT&T Wireless (up 87% until its sale to Cingular), Amerada Hess (up 57%), and FedEx (up 46%). Not all holdings fared as well, as 16 stocks ended the year with lower prices, including Pfizer (down 22%), Alcoa (down 16%), Hewlett-Packard (down 7%) and Delphi (down 9%). For each of the Fund’s holdings, we continuously reassess our long-term outlook for the company and then compare that outlook to its current stock price. While the Fund’s investment in each of these companies detracted from returns, we remain optimistic about their opportunities for capital appreciation in the years ahead.
Strategy
The Fund’s portfolio is built one security at a time, based on our fundamental research effort, a three-to-five year time horizon and a strong price discipline. Because we are sensitive to how much we pay for each company’s future earnings and cash flow, the valuation characteristics (such as price-to-earnings ratio or “P/E”) of the Stock Fund are typically lower than the market’s, and Dodge & Cox has become known as a “value” manager. We think it is less useful to distinguish between growth and value management styles, and more important to understand the potential outcomes for each company and determine a reasonable value based on those long-term fundamentals.
The firm’s 19 analysts work alongside the eight members of the Investment Policy Committee to provide continuous analysis and management of the Fund. We often find investment opportunity when valuations decline as a result of bad news affecting near-term earnings, but where we believe the long-term earnings opportunity remains largely intact. For example, over the last year, as investors became more skeptical about the positive long-term trends in Health Care, an area traditionally associated with growth investing, we have found more companies at attractive valuations, such as GlaxoSmithKline and Cardinal Health. In fact, for the first time in many years the Fund now has a higher weighting in Health Care stocks (13.6%) than the S&P 500 (12.8%).
Diversification
Diversification is a hallmark of the Dodge & Cox investment philosophy, and is driven by our individual security selection approach. As a result, the Stock Fund is economically diversified, yet looks different than the S&P 500. Most obviously, the Fund is more concentrated than the market, currently investing in 89 companies versus the 500 in the S&P 500. While 71 of these companies were also found in the S&P 500 at year end, they represented over 80% of the value of the Fund, but only 20% of the value of the S&P 500. Furthermore, our search for investment value has led us to invest in companies based outside the U.S., an area that is only marginally represented in the S&P 500. At year-end, 14.5% of the Stock Fund was invested in 16 foreign-domiciled companies whose stocks trade in the U.S. (primarily as American Depository Receipts or “ADRs”). The Fund can invest up to 20% of its assets in U.S. dollar-denominated foreign securities. The Fund’s cash position is another investment class not represented in the S&P 500. Given these differences, we would expect the Fund’s returns to continue to vary from those of the S&P 500.
Opportunities in Media Stocks
Valuations have been declining in recent years in the Media sector (an area also associated with growth investing), and we have increased the Fund’s weighting to 8.7% in five companies (News Corp., Time Warner, Comcast, Liberty Media and Interpublic Group). We believe these companies offer a blend of attractive fundamental business operations and exposure to ongoing consumer technology adoption. For example, both Comcast and Time Warner currently derive significant revenue from subscription-based services (e.g., cable and broadband data) with recurring, utility-like cash flow. Both companies are also poised to launch advanced Voice-Over-Internet Protocol (VOIP) telephone services in 2005.
| | |
| 1 / Dodge & Cox Stock Fund | | |
Another example is News Corp., which the Fund has held continuously for over seven years. We believe News Corp. remains well positioned for profitable growth potential in entertainment “content” (e.g., cable networks and 20th Century Fox film studio), satellite television subscriptions (e.g., partial ownership in DirecTV), as well as a rebound in advertising spending around the world. While approximately 85% of News Corp.’s consolidated earnings come from its U.S. business franchises, it also owns significant foreign assets, such as several British newspapers and the satellite television providers STAR in Asia and BSkyB in the U.K. (36% stake). We believe that the complexity in valuing News Corp.’s diverse global assets has created an investment opportunity. At the same time, CEO Rupert Murdoch and his management team are working hard to simplify the company and build long-term shareholder value.
Importantly, we believe that each of the Fund’s media investments currently trades at a reasonable valuation compared to long-term growth prospects. Also, please note that we discuss these holdings to illustrate our investment approach, not because we think they are more attractive than the Fund’s other holdings.
Outlook
Looking out over a three-to-five year period, we continue to believe that returns from the broad equity market will be modest and could be punctuated by some unpleasant negative contractions. While we are optimistic about the continued expansion of the global economy in the years ahead, P/E multiples are above average and profit margins are historically high. If interest rates and/or inflation rise, there is a risk that P/E multiples could contract. But as we noted earlier, forecasting is difficult, and rather than overly concerning ourselves with anticipating the direction of the broad market, we focus our energy attempting to understand the long-term risks and opportunities of each company in the Fund relative to its current price.
On the occasion of the Fund’s 40th anniversary we would like to thank you for the continued confidence you have placed in our firm as a shareholder of the Stock Fund. As always, we welcome your comments and questions.
For the Board of Trustees,
| | |
 | | 
|
| |
| Harry R. Hagey, Chairman | | John A. Gunn, President |
February 18, 2005
Ten Years of Investment Performance
through December 31, 2004 (in thousands)
Average annual total return for periods ended December 31, 2004
| | | | | | | | | | | | |
| | | 1 Year | | | 5 Years | | | 10 Years | | | 20 Years | |
| Dodge & Cox Stock Fund | | 19.16 | % | | 12.40 | % | | 16.89 | % | | 16.14 | % |
| S&P 500 | | 10.86 | | | (2.29 | ) | | 12.07 | | | 13.22 | |
Past performance does not guarantee future results. Investment return and share price will fluctuate with market conditions, and investors may have a gain or loss when shares are sold. Mutual fund performance changes over time and currently may be significantly lower than stated above. Performance is updated and published monthly. Visit the Fund’s web site at www.dodgeandcox.com or call 800-621-3979 for current performance figures.
The Fund’s total returns include the reinvestment of dividend and capital gain distributions, but have not been adjusted for any income taxes payable by shareholders on these distributions. The Standard & Poor’s 500 (S&P 500) is a broad-based unmanaged measure of common stocks. Index returns include dividends and/or interest income and, unlike Fund returns, do not reflect fees or expenses.
Standard & Poor’s, Standard & Poor’s 500, and S&P 500® are trademarks of The McGraw-Hill Companies, Inc.
| | |
| | | Dodge & Cox Stock Fund / 2 |
Fund Expenses
As a shareholder of the Fund, you incur ongoing costs, which include costs for portfolio management, administrative services, and shareholder reports (like this one), among others. Operating expenses, which are deducted from a Fund’s gross income, directly reduce the investment return of the Fund. The following examples are intended to help you understand the ongoing costs (in dollars) of investing in the Fund and to compare these costs with those of other mutual funds. The examples are based on an investment of $1,000 made at the beginning of the period shown and held for the entire period.
The table below illustrates the Fund’s costs in two ways:
Actual Fund Expenses
This section helps you to estimate the actual expenses that you paid over the period. The “Ending Account Value” shown is derived from the Fund’s actual return, and the third column shows the dollar amount that would have been paid by an investor who started with $1,000 in the Fund. You may use the information here, together with the amount you invested, to estimate the expenses that you paid over the period. To do so, simply divide your account value by $1,000 (for example, an $8,600 account value divided by $1,000 = 8.6), then multiply the result by the number given for the Fund under the heading “Expenses Paid During Period.”
Hypothetical Example for Comparison
This section is intended to help you compare the Fund’s costs with those of other mutual Funds. It assumes that the Fund had a yearly return of 5% before expenses, but that the expense ratio is unchanged. In this case—because the return used is not the Fund’s actual return—the results do not apply to your investment. The example is useful in making comparisons because the Securities and Exchange Commission requires all mutual funds to calculate expenses based on a 5% return. You can assess the Fund’s costs by comparing this hypothetical example with the hypothetical examples that appear in shareholder reports of other funds.
| | | | | | |
Six Months Ended
December 31, 2004 | | Beginning
Account Value 7/1/2004 | | Ending
Account Value 12/31/2004 | | Expenses Paid
During Period* |
| Based on Actual Fund Return | | $1,000.00 | | $1,123.50 | | $2.80 |
| Based on Hypothetical 5% Yearly Return | | 1,000.00 | | 1,022.37 | | 2.66 |
| * | | These calculations are based on expenses incurred in the most recent fiscal half-year. The Fund’s annualized six-month expense ratio for that period is 0.52%. The dollar amounts shown as “Expenses Paid” are equal to the annualized expense ratio multiplied by the average account value over the period, multiplied by the number of days in the most recent fiscal half-year, then divided by 366. |
The expenses shown in the table are meant to highlight and help you compare ongoing costs only and do not reflect any transactional costs, account maintenance fees or charges by processing organizations. While other mutual funds may charge such fees, please note that the Fund does not charge any transaction fee (e.g., redemption fee), account maintenance fee (e.g., small account fee), nor does it charge a “sales load.”
| | |
| 3 / Dodge & Cox Stock Fund | | |
Fund Information | December 31, 2004 |
General Information
| | |
Net Asset Value Per Share | | $130.22 |
Total Net Assets (millions) | | $43,266 |
2004 Expense Ratio | | 0.53% |
2004 Portfolio Turnover | | 11% |
30-Day SEC Yield1 | | 1.29% |
Fund Inception Date | | 1965 |
Investment Manager: Dodge & Cox, San Francisco. Managed by the Investment Policy Committee, whose eight members’ average tenure at Dodge & Cox is 23 years.
Asset Allocation
| | | | |
| Stock Characteristics | | Fund | | S&P 500 |
Number of Stocks | | 90 | | 500 |
Median Market Capitalization (billions) | | $15 | | $11 |
Weighted-Average Market Cap. (billions) | | $39 | | $92 |
Price-to-Earnings Ratio2 | | 16x | | 17x |
Price-to-Book Value Ratio | | 2.1x | | 3.0x |
Foreign Stocks3 (% of Fund) | | 14.5% | | 0.0% |
| | |
| Ten Largest Holdings | | % of Fund |
Comcast Class A | | 3.2 |
Hewlett-Packard | | 3.0 |
HCA, Inc. | | 2.4 |
Cardinal Health | | 2.4 |
News Corp. Class A | | 2.4 |
Time Warner | | 2.4 |
AT&T | | 2.3 |
Sony ADR (Japan) | | 2.2 |
Union Pacific | | 2.2 |
McDonald’s | | 2.1 |
| | | | | | |
| Sector Diversification | | Fund | | | S&P 500 | |
Consumer Discretionary | | 20.4 | % | | 11.5 | % |
Financials | | 17.5 | | | 20.9 | |
Health Care | | 13.6 | | | 12.8 | |
Information Technology | | 11.5 | | | 16.1 | |
Energy | | 8.5 | | | 7.2 | |
Materials | | 8.2 | | | 3.2 | |
Industrials | | 6.5 | | | 11.5 | |
Utilities | | 2.9 | | | 3.0 | |
Telecommunication Services | | 2.8 | | | 3.3 | |
Consumer Staples | | 1.7 | | | 10.5 | |
| 1 | | SEC Yield is an annualization of the Fund’s total net investment income per share for the 30-day period ended on the last day of the month. |
| 2 | | The Fund’s price-to-earnings (P/E) ratio is calculated using Dodge & Cox’s estimated forward earnings and excludes extraordinary items. The S&P 500’s P/E ratio is calculated by Standard & Poor’s and uses an aggregated estimate of forward earnings. |
| 3 | | All U.S. dollar-denominated. |
| | |
| | | Dodge & Cox Stock Fund / 4 |
Portfolio of Investments | December 31, 2004 |
| | | | | |
| COMMON STOCKS: 93.6% |
| | |
| | | SHARES | | MARKET VALUE |
| CONSUMER DISCRETIONARY: 20.4% | | | |
| MEDIA: 8.7% | | | | | |
Comcast Corp. Class A(a) | | 41,114,330 | | $ | 1,368,284,902 |
News Corp. Class A | | 54,679,238 | | | 1,020,314,581 |
Time Warner, Inc.(a) | | 52,462,900 | | | 1,019,878,776 |
Liberty Media Corp. Series A(a) | | 33,502,700 | | | 367,859,646 |
Interpublic Group of Companies, Inc.(a) | | 337,800 | | | 4,526,520 |
| | | | |
|
|
| | | | | | 3,780,864,425 |
| CONSUMER DURABLES & APPAREL: 5.2% | | | |
Sony Corp. ADR(b) (Japan) | | 24,527,700 | | | 955,599,192 |
Matsushita Electric Industrial Co., Ltd. ADR(b) (Japan) | | 34,434,200 | | | 552,668,910 |
Whirlpool Corp.(c) | | 4,388,050 | | | 303,696,941 |
Eastman Kodak Co. | | 7,629,089 | | | 246,038,120 |
VF Corp. | | 3,467,900 | | | 192,052,302 |
| | | | |
|
|
| | | | | | 2,250,055,465 |
| HOTELS, RESTAURANTS & LEISURE: 2.4% | | | |
McDonald’s Corp. | | 28,880,400 | | | 925,905,624 |
InterContinental Hotels Group PLC ADR(b) (United Kingdom) | | 8,855,548 | | | 111,757,018 |
| | | | |
|
|
| | | | | | 1,037,662,642 |
| RETAILING: 2.0% | | | | | |
May Department Stores Co.(c) | | 17,894,400 | | | 526,095,360 |
Gap, Inc. | | 8,972,500 | | | 189,499,200 |
Dillard’s, Inc. Class A(c) | | 5,177,500 | | | 139,119,425 |
| | | | |
|
|
| | | | | | 854,713,985 |
| AUTOMOBILES & COMPONENTS: 1.2% | | | |
Delphi Corp.(c) | | 36,051,632 | | | 325,185,721 |
Honda Motor Co. Ltd. ADR(b) (Japan) | | 7,670,400 | | | 199,890,624 |
| | | | |
|
|
| | | | | | 525,076,345 |
| TRADING COMPANIES & DISTRIBUTORS: 0.9% | | | |
Genuine Parts Co.(c) | | 8,953,800 | | | 394,504,428 |
| | | | |
|
|
| | | | | | 8,842,877,290 |
| FINANCIALS: 17.5% | | | | | |
| INSURANCE: 6.4% | | | | | |
St. Paul Travelers Companies, Inc. | | 19,206,550 | | | 711,986,809 |
Loews Corp. | | 7,518,900 | | | 528,578,670 |
Chubb Corp. | | 5,738,750 | | | 441,309,875 |
Safeco Corp. | | 5,058,600 | | | 264,261,264 |
Torchmark Corp. | | 4,525,800 | | | 258,604,212 |
Genworth Financial, Inc. Class A | | 8,869,300 | | | 239,471,100 |
UnumProvident Corp. | | 11,748,800 | | | 210,773,472 |
MBIA, Inc. | | 1,567,000 | | | 99,159,760 |
| | | | |
|
|
| | | | | | 2,754,145,162 |
| DIVERSIFIED FINANCIALS: 4.8% | | | |
Capital One Financial Corp. | | 10,676,000 | | | 899,025,960 |
JPMorgan Chase & Co. | | 18,460,328 | | | 720,137,395 |
CIT Group, Inc. | | 9,570,100 | | | 438,501,982 |
| | | | |
|
|
| | | | | | 2,057,665,337 |
| | | | | |
| | |
| | | SHARES | | MARKET VALUE |
| BANKS: 3.9% | | | | | |
Wachovia Corp. | | 14,950,300 | | $ | 786,385,780 |
Golden West Financial Corp. | | 8,898,600 | | | 546,552,012 |
Wells Fargo & Co. | | 6,046,600 | | | 375,796,190 |
| | | | |
|
|
| | | | | | 1,708,733,982 |
| REAL ESTATE: 2.4% | | | | | |
Equity Office Properties Trust(c) | | 22,260,300 | | | 648,219,936 |
Equity Residential Properties Trust | | 11,143,500 | | | 403,171,830 |
| | | | |
|
|
| | | | | | 1,051,391,766 |
| | | | |
|
|
| | | | | | 7,571,936,247 |
| HEALTH CARE: 13.6% | | | | | |
| HEALTH CARE EQUIPMENT & SERVICES: 7.1% | | | |
HCA, Inc.(c) | | 26,418,400 | | | 1,055,679,264 |
Cardinal Health, Inc. | | 17,893,150 | | | 1,040,486,673 |
Wellpoint, Inc.(a) | | 4,245,950 | | | 488,284,250 |
Becton, Dickinson & Co. | | 4,222,350 | | | 239,829,480 |
Thermo Electron Corp(a) | | 7,433,400 | | | 224,414,346 |
| | | | |
|
|
| | | | | | 3,048,694,013 |
| PHARMACEUTICALS & BIOTECHNOLOGY: 6.5% | | | |
Schering-Plough Corp. | | 41,890,500 | | | 874,673,640 |
Pfizer, Inc. | | 25,517,925 | | | 686,177,003 |
GlaxoSmithKline PLC ADR(b)
(United Kingdom) | | 12,998,900 | | | 616,017,871 |
Wyeth | | 10,268,800 | | | 437,348,192 |
Bristol-Myers Squibb Co. | | 8,105,050 | | | 207,651,381 |
| | | | |
|
|
| | | | | | 2,821,868,087 |
| | | | |
|
|
| | | | | | 5,870,562,100 |
| INFORMATION TECHNOLOGY: 11.5% | | | |
| TECHNOLOGY HARDWARE & EQUIPMENT: 7.3% | | | |
Hewlett-Packard Co. | | 61,127,163 | | | 1,281,836,608 |
Xerox Corp.(a) | | 45,764,500 | | | 778,454,145 |
NCR Corp.(a) | | 3,711,900 | | | 256,974,837 |
Motorola, Inc. | | 14,685,900 | | | 252,597,480 |
Storage Technology Corp.(a,c) | | 7,511,200 | | | 237,429,032 |
Avaya, Inc.(a) | | 12,229,400 | | | 210,345,680 |
Freescale Semiconductor, Inc. Class A | | 5,482,700 | | | 97,701,714 |
Freescale Semiconductor, Inc. Class B | | 1,621,547 | | | 29,771,603 |
| | | | |
|
|
| | | | | | 3,145,111,099 |
| SOFTWARE & SERVICES: 4.2% | | | | | |
Electronic Data Systems Corp.(c) | | 33,204,400 | | | 767,021,640 |
Computer Sciences Corp.(a,c) | | 12,893,600 | | | 726,812,232 |
BMC Software, Inc.(a,c) | | 11,787,600 | | | 219,249,360 |
Compuware Corp.(a,c) | | 19,357,100 | | | 125,240,437 |
| | | | |
|
|
| | | | | | 1,838,323,669 |
| | | | |
|
|
| | | | | | 4,983,434,768 |
| | |
| 5 / Dodge & Cox Stock Fund | | See accompanying Notes to Financial Statements |
Portfolio of Investments | December 31, 2004 |
| | | | | |
| COMMON STOCKS (continued) | | | | |
| | |
| | | SHARES | | MARKET VALUE |
| ENERGY: 8.5% | | | | | |
ChevronTexaco Corp. | | 13,960,128 | | $ | 733,046,321 |
Shell Transport & Trading Co. PLC ADR(b) (United Kingdom) | | 12,111,400 | | | 622,525,960 |
Unocal Corp. | | 11,456,400 | | | 495,374,736 |
ConocoPhillips | | 5,643,400 | | | 490,016,422 |
Baker Hughes, Inc. | | 9,717,750 | | | 414,656,393 |
Occidental Petroleum Corp. | | 6,254,500 | | | 365,012,620 |
Amerada Hess Corp. | | 4,346,700 | | | 358,081,146 |
Schlumberger Ltd.(b) (Netherlands Antilles) | | 2,901,700 | | | 194,268,815 |
| | | | |
|
|
| | | | | | 3,672,982,413 |
| MATERIALS: 8.2% | | | | | |
| CHEMICALS: 6.2% | | | | | |
Dow Chemical Co. | | 17,593,114 | | | 871,035,074 |
Akzo Nobel N.V. ADR(b),(c) (Netherlands) | | 18,186,723 | | | 772,753,859 |
Rohm and Haas Co. | | 6,784,500 | | | 300,078,437 |
Syngenta A.G. ADR(b) (Switzerland) | | 12,651,800 | | | 270,115,930 |
NOVA Chemicals Corp.(b,c) (Canada) | | 4,752,570 | | | 224,796,561 |
Engelhard Corp.(c) | | 6,266,100 | | | 192,181,287 |
Lubrizol Corp. | | 929,100 | | | 34,246,626 |
Bayer A.G. ADR(b) (Germany) | | 116,900 | | | 3,972,262 |
| | | | |
|
|
| | | | | | 2,669,180,036 |
| METALS AND MINING: 1.5% | | | | | |
Rio Tinto PLC ADR(b) (United Kingdom) | | 4,630,831 | | | 552,041,363 |
Alcoa, Inc. | | 3,671,983 | | | 115,373,706 |
| | | | |
|
|
| | | | | | 667,415,069 |
| PAPER AND FOREST PRODUCTS: 0.5% | | | | | |
International Paper Co. | | 5,239,300 | | | 220,050,600 |
| | | | |
|
|
| | | | | | 3,556,645,705 |
| INDUSTRIALS: 6.5% | | | | | |
| TRANSPORTATION: 3.5% | | | | | |
Union Pacific Corp.(c) | | 13,860,950 | | | 932,148,887 |
Fedex Corp. | | 5,699,900 | | | 561,383,151 |
| | | | |
|
|
| | | | | | 1,493,532,038 |
| CAPITAL GOODS: 1.7% | | | | | |
Masco Corp. | | 9,510,900 | | | 347,433,177 |
Fluor Corp.(c) | | 4,375,550 | | | 238,511,231 |
Volvo A.B. ADR(b) (Sweden) | | 3,360,200 | | | 133,231,930 |
| | | | |
|
|
| | | | | | 719,176,338 |
| COMMERCIAL SERVICES & SUPPLIES: 1.1% | | | |
Pitney Bowes, Inc. | | 6,157,150 | | | 284,952,902 |
R.R. Donnelley & Sons Co. | | 5,259,000 | | | 185,590,110 |
| | | | |
|
|
| | | | | | 470,543,012 |
| ELECTRONIC EQUIPMENT & INSTRUMENTS: 0.2% |
American Power Conversion Corp. | | 4,862,281 | | | 104,052,813 |
| | | | |
|
|
| | | | | | 2,787,304,201 |
| | | | | |
| | |
| | | SHARES | | MARKET VALUE |
| UTILITIES: 2.9% | | | | | |
Duke Energy Corp. | | 26,869,200 | | $ | 680,596,836 |
American Electric Power Co., Inc. | | 7,630,910 | | | 262,045,449 |
FirstEnergy Corp. | | 4,486,500 | | | 177,261,615 |
Scottish Power PLC ADR(b)
(United Kingdom) | | 4,586,800 | | | 142,924,688 |
| | | | |
|
|
| | | | | | 1,262,828,588 |
| TELECOMMUNICATION SERVICES: 2.8% | | | |
AT&T Corp.(c) | | 52,008,200 | | | 991,276,292 |
Vodafone Group PLC ADR(b)
(United Kingdom) | | 8,073,000 | | | 221,038,740 |
| | | | |
|
|
| | | | | | 1,212,315,032 |
| CONSUMER STAPLES: 1.7% | | | | | |
| FOOD, BEVERAGE AND TOBACCO: 1.7% | | | |
Unilever N.V.(b) (Netherlands) | | 11,244,000 | | | 750,087,240 |
| | | | |
|
|
| | | | | | 750,087,240 |
| | | | |
|
|
Total Common Stocks (Cost $30,615,421,151) | | | 40,510,973,584 |
| | | | |
|
|
| | | | | | |
|
| SHORT-TERM INVESTMENTS: 6.5% |
| | |
| | | PAR VALUE | | MARKET VALUE |
SSgA Prime Money Market Fund | | $ | 216,771,900 | | $ | 216,771,900 |
State Street Repurchase Agreement, 1.40%, 1/3/05, maturity value $582,327,930 (collateralized by U.S. Treasury Securities, value $593,953,293, 1.935%–8.125%, 6/30/05–5/15/21) | | | 582,260,000 | | | 582,260,000 |
U.S. Treasury Bills | | | | | | |
1/6/2005 | | | 150,000,000 | | | 149,957,604 |
1/20/2005 | | | 300,000,000 | | | 299,724,500 |
1/27/2005 | | | 300,000,000 | | | 299,601,514 |
2/3/2005 | | | 300,000,000 | | | 299,477,500 |
2/10/2005 | | | 300,000,000 | | | 299,323,333 |
2/17/2005 | | | 100,000,000 | | | 99,739,111 |
4/28/2005 | | | 250,000,000 | | | 248,318,125 |
5/19/2005 | | | 300,000,000 | | | 297,395,248 |
| | | | | |
|
|
Total Short-Term Investments
(Cost $2,792,568,835) | | | | | | 2,792,568,835 |
| | | | | |
|
|
| | | | | | | |
| | | | | | | | |
TOTAL INVESTMENTS
(Cost $33,407,989,986) | | 100.1 | % | | | 43,303,542,419 | |
OTHER ASSETS LESS LIABILITIES | | (0.1 | ) | | | (37,199,023 | ) |
| | |
|
| |
|
|
|
TOTAL NET ASSETS | | 100.0 | % | | $ | 43,266,343,396 | |
| | |
|
| |
|
|
|
| (b) | | Securities denominated in U.S. Dollars |
| (c) | | Affiliated issuer. See Note 4 of Notes to Financial Statements. |
| | |
| See accompanying Notes to Financial Statements | | Dodge & Cox Stock Fund / 6 |
Statement of Assets and Liabilities
| | | |
|
| December 31, 2004 |
| Assets: | | | |
Investments (identified cost $33,407,989,986) | | | |
Unaffiliated issuers, at market value | | $ | 34,483,620,526 |
Affiliated issuers, at market value | | | 8,819,921,893 |
| | |
|
|
| | | | 43,303,542,419 |
Cash | | | 49,935,875 |
Receivable for investments sold | | | 38,264,461 |
Receivable for Fund shares sold | | | 13,432,527 |
Dividends and interest receivable | | | 53,587,911 |
Prepaid expenses and other assets | | | 261,256 |
| | |
|
|
| | | | 43,459,024,449 |
| | |
|
|
| Liabilities: | | | |
Payable for investments purchased | | | 159,634,515 |
Payable for Fund shares redeemed | | | 12,604,685 |
Management fees payable | | | 18,086,199 |
Accounts payable | | | 2,355,654 |
| | |
|
|
| | | | 192,681,053 |
| | |
|
|
| Net Assets | | $ | 43,266,343,396 |
| | |
|
|
| Net Assets Consist of: | | | |
Paid in capital | | $ | 33,102,729,732 |
Accumulated undistributed
net investment income | | | 8,922,900 |
Accumulated undistributed net
realized gain on investments | | | 259,138,331 |
Net unrealized appreciation on investments | | | 9,895,552,433 |
| | |
|
|
| | | $ | 43,266,343,396 |
| | |
|
|
Fund shares outstanding (par value
$0.01 each, unlimited shares authorized) | | | 332,246,229 |
Net asset value per share | | | $130.22 |
| |
| Statement of Operations | | | |
|
Year Ended
December 31, 2004 |
| Investment Income: | | | |
Dividends (net of foreign taxes of $8,887,593) | | | |
Unaffiliated issuers | | $ | 424,818,661 |
Affiliated issuers | | | 210,795,271 |
Interest | | | 29,505,499 |
| | |
|
|
| | | | 665,119,431 |
| | |
|
|
| Expenses: | | | |
Management fees | | | 179,639,203 |
Custodian and fund accounting fees | | | 608,621 |
Transfer agent fees | | | 6,400,426 |
Professional services | | | 85,592 |
Shareholder reports | | | 1,460,658 |
Registration fees | | | 1,723,533 |
Trustees’ fees | | | 82,000 |
Miscellaneous | | | 267,081 |
| | |
|
|
| | | | 190,267,114 |
| | |
|
|
| Net Investment Income | | | 474,852,317 |
| | |
|
|
| Realized and Unrealized Gain on Investments: | | | |
Net realized gain from: | | | |
Investments in unaffiliated issuers | | | 1,290,734,715 |
Investments in affiliated issuers | | | 127,031,462 |
Net change unrealized appreciation | | | 4,726,648,936 |
| | |
|
|
Net realized and unrealized gain | | | 6,144,415,113 |
| | |
|
|
| Net Increase in Net Assets from Operations | | $ | 6,619,267,430 |
| | |
|
|
Statement of Changes in Net Assets
| | | | | | | | |
| | |
| | | Year Ended
December 31, 2004 | | | Year Ended
December 31, 2003 | |
| Operations: | | | | | | | | |
Net investment income | | $ | 474,852,317 | | | $ | 339,700,192 | |
Net realized gain | | | 1,417,766,177 | | | | 330,946,926 | |
Net change in unrealized appreciation | | | 4,726,648,936 | | | | 5,488,029,040 | |
| | |
|
|
| |
|
|
|
Net increase in net assets from operations | | | 6,619,267,430 | | | | 6,158,676,158 | |
| | |
|
|
| |
|
|
|
| | |
Distributions to
Shareholders from: | | | | | | | | |
Net investment income | | | (469,055,741 | ) | | | (340,525,138 | ) |
Net realized gain | | | (1,173,587,700 | ) | | | (214,176,406 | ) |
| | |
|
|
| |
|
|
|
Total distributions | | | (1,642,643,441 | ) | | | (554,701,544 | ) |
| | |
|
|
| |
|
|
|
| | |
| Fund Share Transactions: | | | | | | | | |
Amounts received from
sale of shares | | | 11,863,567,462 | | | | 12,166,924,022 | |
Net asset value of shares issued in reinvestment of distributions | | | 1,513,787,692 | | | | 505,674,193 | |
Amounts paid for
shares redeemed | | | (4,524,858,539 | ) | | | (2,875,628,981 | ) |
| | |
|
|
| |
|
|
|
Net increase from Fund
share transactions | | | 8,852,496,615 | | | | 9,796,969,234 | |
| | |
|
|
| |
|
|
|
Total increase in net assets | | | 13,829,120,604 | | | | 15,400,943,848 | |
| | |
| Net Assets: | | | | | | | | |
Beginning of year | | | 29,437,222,792 | | | | 14,036,278,944 | |
| | |
|
|
| |
|
|
|
End of year (including undistributed net investment income of $8,922,900 and
$3,126,324, respectively) | | $ | 43,266,343,396 | | | $ | 29,437,222,792 | |
| | |
|
|
| |
|
|
|
| | |
Shares sold | | | 99,334,591 | | | | 124,244,324 | |
Shares issued in
reinvestment of distributions | | | 11,920,322 | | | | 4,855,626 | |
Shares redeemed | | | (37,725,900 | ) | | | (29,796,487 | ) |
| | |
|
|
| |
|
|
|
Net increase in
shares outstanding | | | 73,529,013 | | | | 99,303,463 | |
| | |
|
|
| |
|
|
|
| | |
| 7 / Dodge & Cox Stock Fund | | See accompanying Notes to Financial Statements |
Notes to Financial Statements
Note 1 — Organization and Significant Accounting Policies
Dodge & Cox Stock Fund (the “Fund”) is one of the funds constituting the Dodge & Cox Funds (the “Trust”). The Trust is organized as a Delaware statutory trust and is registered under the Investment Company Act of 1940, as amended, as a diversified, open-end management investment company. The Fund commenced operations on January 4, 1965, and seeks long-term growth of principal and income. Risk considerations and investment strategies of the Fund are discussed in the Fund’s Prospectus. The Fund is closed to new investors.
The Fund consistently follows accounting policies which are in conformity with accounting principles generally accepted in the United States of America. In preparing these financial statements, management is required to make estimates and assumptions that affect reported amounts and disclosures. Actual results could differ from those estimates. Significant accounting policies are as follows:
Security valuation. The Fund’s net assets are valued as of the close of trading on the New York Stock Exchange (the “NYSE”), generally 4:00 p.m. Eastern Time, each day that the NYSE is open for business. Stocks are valued at market, using as a price the official quoted close price or the last sale of the day at the close of the NYSE or, if not available, at the mean between the exchange listed bid and ask prices for the day. A security which is listed or traded on more than one exchange is valued at the quotation on the exchange determined to be the primary market for such security. Security values are not discounted based on the size of the Fund’s position. Securities for which market quotations are not readily available are valued at fair value as determined in good faith by or at the direction of the Board of Trustees. Short-term securities are valued at amortized cost which approximates current value. All securities held by the Fund are denominated in U.S. dollars.
Security transactions and related investment income. Security transactions are recorded by the Fund as of the date the trades are executed with brokers. Realized gains and losses on securities sold are determined on the basis of identified cost. Dividend income and corporate action transactions are recorded on the ex-dividend date, except for certain dividends or corporate actions from foreign securities where the ex-dividend date may have passed, which are recorded as soon as the Fund is informed of the ex-dividend date. Withholding taxes on foreign dividends have been provided for in accordance with the Fund’s understanding of the applicable country’s tax rules and rates. Non-cash dividends included in dividend income, if any, are recorded at the fair market value of the securities received. Distributions received in excess of income are recorded as a reduction of cost of investments and/or realized gain. The Fund may estimate the character of distributions received from Real Estate Investment Trusts (“REITs”). Interest income is recorded on the accrual basis.
Expenses. Expenses are recorded on the accrual basis. Most expenses of the Trust can be directly attributed to a specific fund. Expenses which cannot be directly attributed are apportioned among all of the funds in the Trust.
Repurchase agreements. The Fund may enter into repurchase agreements secured by U.S. government securities which involve the purchase of securities from a counterparty with a simultaneous commitment to resell the securities at an agreed-upon date and price. It is the Fund’s policy that its custodian take possession of the underlying collateral securities, the fair value of which exceeds the principal amount of the repurchase transaction, including accrued interest, at all times. In the event of default by the counterparty, the Fund has the contractual right to liquidate the securities and to apply the proceeds in satisfaction of the obligation.
Income taxes and distributions to shareholders. No provision for federal income taxes has been included in the accompanying financial statements since the Fund intends to distribute all of its taxable income and continue to comply with requirements for regulated investment companies. Distributions to shareholders of income and capital gains are reflected in the net asset value per share computation on the ex-dividend date. Income and capital gain distributions are determined in accordance with income tax regulations, which may differ from accounting principles generally accepted in the United States of America. Temporary differences between financial statement and tax treatments may occur when certain items of income, expense, gain or loss are recognized in different periods for financial statement
| | |
| | | Dodge & Cox Stock Fund / 8 |
Notes to Financial Statements (continued)
and tax purposes. Differences in classification may also arise due to the treatment of short-term realized gains as ordinary income for tax purposes. Permanent differences are reclassified among capital accounts in the financial statements to reflect their tax character. These adjustments have no impact on net assets or results of operations.
Note 2 — Related Party Transactions
Management fees. Under a written agreement, the Fund pays an annual management fee of 0.50% of the Fund’s average daily net asset value to Dodge & Cox, investment manager of the Fund. The agreement further provides that Dodge & Cox shall waive its fee to the extent that such fee plus all other ordinary operating expenses of the Fund exceed 0.75% of the average daily net assets for the year.
Trustees’ fees. All officers and three of the trustees of the Trust are officers and employees of Dodge & Cox. Those trustees who are not affiliated with Dodge & Cox receive from the Trust an annual fee plus an attendance fee for each Board or Committee meeting attended. Payments to trustees are shared equally among each fund in the Trust. The Trust does not pay any other remuneration to its officers or trustees.
Indemnifications. Under the Trust’s organizational documents, its officers and trustees are indemnified against certain liabilities arising out of the performance of their duties to the Trust. In addition, in the normal course of business the Trust enters into contracts that provide general indemnifications to other parties. The Trust’s maximum exposure under these arrangements is unknown as this would involve future claims that may be made against the Trust that have not yet occurred.
Note 3 — Distributions Paid, Distributable Earnings and Investment Transactions
Distributions paid during the years ended December 31, 2004 and 2003 were characterized as follows for federal tax purposes:
| | | | |
| | | 2004
| | 2003
|
Ordinary income | | $862,230,499 | | $440,163,145 |
| | | ($2.74 per share) | | ($2.01 per share) |
Long-term capital gain | | $780,412,942 | | $114,538,399 |
| | | ($2.44 per share) | | ($0.45 per share) |
At December 31, 2004, the tax basis components of accumulated undistributed income and net realized gain include $59,231,655 of ordinary income and $208,829,576 of long-term capital gain. In 2004, the Fund recognized net capital gain of $82,601,070 from the delivery of appreciated securities in an in-kind redemption transaction. For federal income tax purposes, this gain is not recognized as taxable income to the Fund and therefore will not be distributed to shareholders. At December 31, 2004, the cost of investments for federal income tax purposes was equal to the cost for financial reporting purposes. Net unrealized appreciation aggregated $9,895,552,433, of which $10,062,614,207 represented appreciated securities and $167,061,774 represented depreciated securities.
For the year ended December 31, 2004, purchases and sales of securities, other than short-term securities and U.S. government securities, aggregated $11,475,134,108 and $3,839,712,362, respectively.
| | |
| 9 / Dodge & Cox Stock Fund | | |
Notes to Financial Statements (continued)
Note 4 — Investments in Affiliates
Each of the companies listed below is considered to be an affiliate of the Fund because the Fund owned at least 5% of the company’s voting securities during the year ended December 31, 2004. Transactions during the period in securities of affiliated companies were as follows:
| | | | | | | | | | | | | | | |
| | | Shares at
Beginning
of Period | | Additions | | Reductions | | | Shares at
End of
Period | | Dividend
Income 2 | | Market Value of
Investment in
Affiliates at
December 31,
2004 |
AT&T Corp. | | 41,562,080 | | 10,654,720 | | (208,600 | ) | | 52,008,200 | | $ | 49,128,951 | | $ | 991,276,292 |
Akzo Nobel N.V. ADR (Netherlands) | | 13,562,223 | | 4,697,400 | | (72,900 | ) | | 18,186,723 | | | 19,561,783 | | | 772,753,859 |
Amerada Hess Corp. | | 5,639,100 | | 5,000 | | (1,297,400 | ) | | 4,346,700 | | | 6,005,130 | | | —1 |
BMC Software, Inc. | | 2,518,500 | | 9,316,400 | | (47,300 | ) | | 11,787,600 | | | —4 | | | 219,249,360 |
CIT Group, Inc. | | 11,320,000 | | 16,000 | | (1,765,900 | ) | | 9,570,100 | | | 5,823,675 | | | —1 |
Computer Sciences Corp. | | 7,718,300 | | 5,227,000 | | (51,700 | ) | | 12,893,600 | | | —4 | | | 726,812,232 |
Compuware Corp. | | 19,401,100 | | 33,600 | | (77,600 | ) | | 19,357,100 | | | —4 | | | 125,240,437 |
Delphi Corp. | | 30,557,032 | | 5,639,200 | | (144,600 | ) | | 36,051,632 | | | 9,891,534 | | | 325,185,721 |
Dillard's Inc. Class A | | 5,190,700 | | 7,600 | | (20,800 | ) | | 5,177,500 | | | 831,112 | | | 139,119,425 |
Electronic Data Systems Corp. | | 24,105,200 | | 9,232,400 | | (133,200 | ) | | 33,204,400 | | | 12,631,350 | | | 767,021,640 |
Engelhard Corp. | | 5,682,700 | | 608,400 | | (25,000 | ) | | 6,266,100 | | | 2,590,291 | | | 192,181,287 |
Equity Office Properties Trust | | 18,569,200 | | 3,780,000 | | (88,900 | ) | | 22,260,300 | | | 31,292,2483 | | | 648,219,936 |
Fluor Corp. | | 4,386,550 | | 6,500 | | (17,500 | ) | | 4,375,550 | | | 2,808,912 | | | 238,511,231 |
Genuine Parts Co. | | 8,976,800 | | 12,900 | | (35,900 | ) | | 8,953,800 | | | 10,777,770 | | | 394,504,428 |
HCA, Inc. | | 15,210,800 | | 11,313,600 | | (106,000 | ) | | 26,418,400 | | | 9,306,895 | | | 1,055,679,264 |
May Department Stores Co. | | 16,320,900 | | 1,645,300 | | (71,800 | ) | | 17,894,400 | | | 17,023,864 | | | 526,095,360 |
NCR Corp. | | 5,819,800 | | 5,200 | | (2,113,100 | ) | | 3,711,900 | | | —4 | | | —1 |
Nova Chemicals Corp. (Canada) | | 5,756,770 | | 7,600 | | (1,011,800 | ) | | 4,752,570 | | | 1,474,691 | | | 224,796,561 |
Storage Technology Corp. | | 6,000,100 | | 2,406,200 | | (895,100 | ) | | 7,511,200 | | | —4 | | | 237,429,032 |
Union Pacific Corp. | | 5,744,050 | | 8,172,500 | | (55,600 | ) | | 13,860,950 | | | 14,127,540 | | | 932,148,887 |
Unocal Corp. | | 13,155,700 | | 880,600 | | (2,579,900 | ) | | 11,456,400 | | | 10,866,780 | | | —1 |
Whirlpool Corp. | | 3,291,350 | | 1,114,300 | | (17,600 | ) | | 4,388,050 | | | 6,652,745 | | | 303,696,941 |
Xerox Corp. | | 41,985,600 | | 3,962,500 | | (183,600 | ) | | 45,764,500 | | | —4 | | | —1 |
| | | | | | | | | | | |
|
| |
|
|
| | | | | | | | | | | | $ | 210,795,271 | | $ | 8,819,921,893 |
| | | | | | | | | | | |
|
| |
|
|
| 1 | | Company was not an affiliate at the end of the period |
| 2 | | Net of foreign taxes, if any |
| 3 | | In addition to dividend income, also paid capital gain distributions of $5,754,837 |
| | |
| | | Dodge & Cox Stock Fund / 10 |
Financial Highlights
| | | | | | | | | | | | | | | |
| SELECTED DATA AND RATIOS (for a share outstanding throughout each year) | | | Year Ended December 31, | |
| | | 2004 | | | 2003 | | | 2002 | | | 2001 | | | 2000 | |
Net asset value, beginning of year | | $113.78 | | | $ 88.05 | | | $100.51 | | | $ 96.67 | | | $100.52 | |
| | | | | |
Income from investment operations: | | | | | | | | | | | | | | | |
Net investment income | | 1.54 | | | 1.60 | | | 1.53 | | | 1.72 | | | 2.06 | |
Net realized and unrealized gain (loss) | | 20.08 | | | 26.59 | | | (12.06 | ) | | 7.05 | | | 13.28 | |
| | |
|
| |
|
| |
|
| |
|
| |
|
|
Total from investment operations | | 21.62 | | | 28.19 | | | (10.53 | ) | | 8.77 | | | 15.34 | |
| | |
|
| |
|
| |
|
| |
|
| |
|
|
Distributions to shareholders from: | | | | | | | | | | | | | | | |
Net investment income | | (1.53 | ) | | (1.62 | ) | | (1.51 | ) | | (1.73 | ) | | (2.09 | ) |
Net realized gain | | (3.65 | ) | | (0.84 | ) | | (0.42 | ) | | (3.20 | ) | | (17.10 | ) |
| | |
|
| |
|
| |
|
| |
|
| |
|
|
Total distributions | | (5.18 | ) | | (2.46 | ) | | (1.93 | ) | | (4.93 | ) | | (19.19 | ) |
| | |
|
| |
|
| |
|
| |
|
| |
|
|
Net asset value, end of year | | $130.22 | | | $113.78 | | | $ 88.05 | | | $100.51 | | | $ 96.67 | |
| | |
|
| |
|
| |
|
| |
|
| |
|
|
Total return | | 19.16 | % | | 32.35 | % | | (10.52 | )% | | 9.33 | % | | 16.30 | % |
Ratios/supplemental data: | | | | | | | | | | | | | | | |
Net assets, end of year (millions) | | $43,266 | | | $29,437 | | | $14,036 | | | $9,396 | | | $5,728 | |
Ratio of expenses to average net assets | | 0.53 | % | | 0.54 | % | | 0.54 | % | | 0.54 | % | | 0.54 | % |
Ratio of net investment income to average net assets | | 1.32 | % | | 1.72 | % | | 1.74 | % | | 1.80 | % | | 2.13 | % |
Portfolio turnover rate | | 11 | % | | 8 | % | | 13 | % | | 10 | % | | 32 | % |
| | |
| 11 / Dodge & Cox Stock Fund | | |
Report of Independent Registered Public Accounting Firm
To the Trustees of Dodge & Cox Funds and Shareholders of Dodge & Cox Stock Fund
In our opinion, the accompanying statement of assets and liabilities, including the portfolio of investments, and the related statements of operations and of changes in net assets and the financial highlights present fairly, in all material respects, the financial position of the Dodge & Cox Stock Fund (the “Fund”, one of the series constituting Dodge & Cox Funds) at December 31, 2004, the results of its operations for the year then ended, the changes in its net assets for each of the two years in the period then ended and the financial highlights for each of the five years in the period then ended, in conformity with accounting principles generally accepted in the United States of America. These financial statements and financial highlights (hereafter referred to as “financial statements”) are the responsibility of the Fund’s management; our responsibility is to express an opinion on these financial statements based on our audits. We conducted our audits of these financial statements in accordance with the standards of the Public Company Accounting Oversight Board (United States). Those standards require that we plan and perform the audit to obtain reasonable assurance about whether the financial statements are free of material misstatement. An audit includes examining, on a test basis, evidence supporting the amounts and disclosures in the financial statements, assessing the accounting principles used and significant estimates made by management, and evaluating the overall financial statement presentation. We believe that our audits, which included confirmation of securities at December 31, 2004 by correspondence with the custodian and brokers, provide a reasonable basis for our opinion.
PricewaterhouseCoopers LLP
San Francisco, California
February 18, 2005
| | |
| | | Dodge & Cox Stock Fund / 12 |
Special 2004 Tax Information (unaudited)
The following information is provided pursuant to provisions of the Internal Revenue Code:
The Fund designates $600,784,411 of its distributions paid to shareholders in 2004 as qualified dividends (treated for federal income tax purposes in the hands of shareholders as taxable at a maximum rate of 15%).
For shareholders that are corporations, the Fund designates 52% of its ordinary dividends (including short-term gains) paid to shareholders in 2004 as dividends from domestic corporations eligible for the corporate dividends received deduction, provided that the shareholder otherwise satisfies applicable requirements to claim that deduction.
Fund’s Holdings
The Funds provide a complete list of their holdings four times in each fiscal year, at the quarter-ends. The lists appear in the Funds’ First Quarter, Semi-Annual, Third Quarter and Annual Reports to shareholders. The Funds file the lists with the Securities and Exchange Commission (SEC) on Form N-CSR (second and fourth quarters) and Form N-Q (first and third quarters). Shareholders may view the Funds’ Forms N-CSR and N-Q on the SEC’s website at www.sec.gov. Forms N-CSR and N-Q may also be reviewed and copied at the SEC’s Public Reference Room in Washington, DC. Information regarding the operations of the Public Reference Room may be obtained by 1-202-942-8090 (direct) or 1-800/SEC-0330 (general SEC number). A complete list of the Funds’ quarter-end holdings are also available at www.dodgeandcox.com on or about 15 days following each quarter end.
Proxy Voting
For a free copy of the Fund’s proxy voting policies and procedures, please call (800) 621-3979, visit www.dodgeandcox.com or the Securities and Exchange Commission’s web site at www.sec.gov. Information regarding how Dodge & Cox, on behalf of the Fund, voted proxies relating to the Fund’s portfolio securities for the most recent twelve-month period ending June 30 is available at www.dodgeandcox.com or the SEC’s web site at www.sec.gov.
| | |
| 13 / Dodge & Cox Stock Fund | | |
THIS PAGE INTENTIONALLY LEFT BLANK
| | |
| | | Dodge & Cox Stock Fund / 14 |
Dodge & Cox Funds—Executive Officer & Trustee Information (unaudited)
| | | | | | |
Name (Age) and
Address* | | Position with Trust
(Year of Election
or Appointment) | | Principal Occupation During Past 5 Years | | Other Directorships Held by Trustees |
| Interested Trustees & Officers |
Harry R. Hagey (63) | | Chairman and Trustee (Trustee since 1975) | | Chairman, Chief Executive Officer and Director of Dodge & Cox, Portfolio Manager and member of Investment Policy Committee (IPC) | | — |
John A. Gunn (61) | | President and Trustee
(Trustee since 1985) | | President, Chief Investment Officer and Director of Dodge & Cox, Portfolio Manager, and member of IPC, Fixed Income Strategy Committee (FISC) and International Investment Policy Committee (IIPC) | | — |
Dana M. Emery (43) | | Vice President and Trustee (Trustee since 1993) | | Senior Vice President and Director of Dodge & Cox, Manager of the Fixed Income Department, Portfolio Manager, and member of IPC and FISC | | — |
A. Horton Shapiro (65) | | Executive Vice President (Officer since 1985) | | Senior Vice President and Director of Dodge & Cox and Portfolio Manager | | — |
| Katherine Herrick Drake (50) | | Vice President (Officer since 1993) | | Vice President of Dodge & Cox and Portfolio Manager | | — |
Kenneth E. Olivier (52) | | Vice President
(Officer since 1992) | | Executive Vice President (since 2002) and Director of Dodge & Cox, Portfolio Manager and member of IPC | | — |
| Diana S. Strandberg (45) | | Vice President
(Officer since 2001) | | Vice President of Dodge & Cox, Portfolio Manager and member of the IIPC | | |
John M. Loll (38) | | Treasurer and Assistant Secretary (Officer since 2000) | | Vice President and Treasurer of Dodge & Cox | | — |
| Thomas M. Mistele (51) | | Secretary and Assistant Treasurer (Officer since 2000) | | Chief Operating Officer (since 2004), Secretary and General Counsel of Dodge & Cox | | — |
| Marcia P. Venegas (36) | | Chief Compliance Officer
(Officer since 2004) | | Chief Compliance Officer of the Trust (since 2004), Compliance Officer of Dodge & Cox (2003-2004); Compliance and Business Risk Manager of Deutsche Asset Management, Australia Limited (1999-2001) | | — |
| Independent Trustees |
William F. Ausfahl (64) | | Trustee (Since 2002) | | CFO, The Clorox Co. (1982-1997); Director, The Clorox Co. (1984-1997) | | — |
L. Dale Crandall (63) | | Trustee (Since 1999) | | President, Kaiser Foundation Health Plan, Inc. and Kaiser Foundation Hospitals (2000-2002); Senior Vice President–Finance and Administration & CFO, Kaiser Foundation Health Plan, Inc. and Kaiser Foundation Hospitals (1998-2000) | | Director, Union BanCal Corporation (bank holding company) and Union Bank of California (commercial bank) (2001-Present); Director, Covad Communications Group (broadband communications services) (2002-Present); Director, Ansell Limited (medical equipment and supplies) (2002-Present); Director, BEA Systems, Inc. (software and programming) (2003-Present); Director, Coventry Health Care, Inc. (managed healthcare) (2004-Present) |
Thomas A. Larsen (55) | | Trustee (Since 2002) | | Director in Howard, Rice, Nemerovski, Canady, Falk & Rabkin (law firm) | | — |
Will C. Wood (65) | | Trustee (Since 1992) | | Principal, Kentwood Associates, Financial Advisers | | Director, Banco Latinoamericano de Exportaciones S.A. (Latin American Foreign Trade Bank) (1999-Present); Director, Dover Investment Corp. (real estate development) (1992-Present) |
| * | | The address for each Officer and Trustee is 555 California Street, 40th Floor, San Francisco, California 94104. Each Officer and Trustee oversees all four series in the Dodge & Cox Funds complex and serves for an indefinite term. |
Additional information about the Trust’s Trustees is available in the Trust’s Statement of Additional Information (SAI). You can get a free copy of the SAI by contacting Dodge & Cox Funds at (800) 621-3979.

International
Stock Fund
Established 2001

4th Annual Report
December 31, 2004
2004
International Stock Fund
www.dodgeandcox.com
For Fund literature, transactions and account
information, please visit the Funds’ web site.
or write or call:
Dodge & Cox Funds
c/o Boston Financial Data Services
P.O. Box 8422
Boston, Massachusetts 02266-8422
(800) 621-3979
Investment Manager
Dodge & Cox
555 California Street, 40th Floor
San Francisco, California 94104
(415) 981-1710
This report is submitted for the general information of the shareholders of the Fund. The report is not authorized for distribution to prospective investors in the Fund unless it is accompanied by a current prospectus.
This report reflects our views, opinions and portfolio holdings as of December 31, 2004, the end of the reporting period. Any such views are subject to change at any time based upon market or other conditions and Dodge & Cox disclaims any responsibility to update such views. These views may not be relied on as investment advice and, because investment decisions for a Dodge & Cox Fund are based on numerous factors, may not be relied on as an indication of trading intent on behalf of any Dodge & Cox Fund.

12/04 ISF AR  Printed on recycled paper
To Our Shareholders
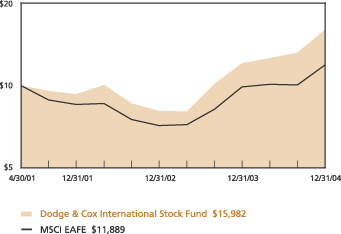
The Dodge & Cox International Stock Fund had a total return of 32.5% for the year ended 2004, compared to a total return of 20.2% for the Morgan Stanley Capital International Europe, Australasia, Far East Index (MSCI EAFE) benchmark. Since inception on May 1, 2001, the Fund had an annualized total return of 13.6% compared to 4.9% for the MSCI EAFE.
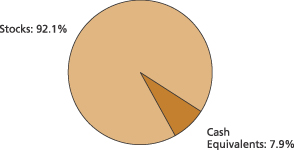
At year-end, the Fund had net assets of $4.2 billion and a cash position of 7.9%. The share price of the Fund rose from $23.48 at the end of 2003 to $30.64 on December 31, 2004. In addition, during the year, the Fund distributed income per share of $0.24 per share, short-term capital gain of $0.12 per share and long-term capital gain of $0.10 per share.
Performance Review
The International Stock Fund performed well on an absolute basis and relative to the MSCI EAFE. The following are performance perspectives:
| • | | Investments in the United Kingdom, Europe, and Japan each contributed over 3% of outperformance relative to the MSCI EAFE. |
| • | | Investments in the Materials, Energy, and Consumer Discretionary sectors each contributed over 2% of outperformance relative to the MSCI EAFE benchmark. |
| • | | Investments in a number of strong performers including Stolt Offshore (up 164%), Standard Bank (up 106%), Yara (up 79%), Nova (up 76%), Makita (up 78%) and Kidde (up 72%). |
Although no one sector of the Fund negatively impacted performance, two individual holdings were particularly weak. Converium Holdings, a Swiss re-insurance company, lost 19% of its value since the Fund’s initial purchase. Seiko Epson, a Japanese manufacturer of color inkjet printers, lost 4% of its value in 2004.
While we are pleased with the performance over the past few years, extrapolating future returns from the recent past is neither prudent nor realistic. When the Fund began on May 1, 2001, the initial net asset value (NAV) was $20.00. On March 12, 2003, after a severe market downturn, the NAV reached a low of $13.34. While we do not expect such severe price movements in the future, they cannot be ruled out. We urge fellow shareholders to invest with an eye on the long term.
Common Threads Through All Our Funds
As the Fund has grown and the number of shareholders has increased dramatically, we would like to take this opportunity to review how Dodge & Cox’s investment philosophy is implemented in the International Stock Fund.
As is the case with all of the Dodge & Cox Funds, we analyze the International Stock Fund’s investments using a three-to-five year investment horizon and adhere to a strict price discipline. Through a research-intensive process, we search for companies whose current stock valuations do not reflect our outlook for their long-term earnings and cash flow prospects. With this bottom-up approach, we construct an economically and geographically diversified portfolio of international stocks.
The Emerging Consumer
The developing world is playing a larger role both as an engine of global growth and as a catalyst for change at many companies. The developing world now represents approximately 85% of the world’s population, yet only 20% of its gross production.
We believe this disparity between population and production could be reduced over time as many companies are now increasing their productive capacity in the developing world (e.g., Honda’s motorcycle plants in India and Nestle’s expansion of operations in China). This growth in capacity should lead to more and higher wage earners, and consequently, more consumption. The expanding class of consumers should, in turn, necessitate additional investments in capacity—a beneficial cycle of economic growth.
We expect few companies—regardless of whether they are based inside or outside of the developing world—to be immune from at least one of the following collateral effects of global development:
| • | | New market demand: Energy and materials companies, like Royal Dutch Shell, BHP Billiton and Rio Tinto, have benefited greatly as growth in the developing world has boosted demand and pricing for their commodities. |
| • | | New investment opportunities: Companies such as Unilever, Nestle, Standard Chartered, Honda and Suzuki are focused on strengthening their footholds in these growing markets. |
| • | | New competition forces change: The threat of competition from companies in these new economies has forced companies based in the developed world, such as Bayer, Matsushita and Sony, to restructure their operations and move more aggressively than before. Companies are also being forced to place a greater emphasis on financial transparency and shareholder returns in order to attract capital from the global investor. |
Foreign Currency and Stock Selection
There are numerous experts predicting a continued decline in the U.S. dollar given our nation’s large trade and fiscal deficits. All else being equal, when the dollar declines, foreign securities increase in value in dollar terms. While it may be the case that the dollar continues to decline, currency movements can be highly volatile and unpredictable in the short-term, as evidenced in 2004.
| | |
| 1 / Dodge & Cox International Stock Fund | | |
In the fourth quarter last year, a declining U.S. dollar contributed meaningfully to the total return of the Fund and the market as measured by the MSCI EAFE. Currency impacts (defined as the differential between local currency returns and U.S. dollar returns) were over half of the market’s 15.3% return. However, currency impacts actually hurt returns for the nine months ended September 30, with the MSCI EAFE up 5.5% in local currency, but only 4.3% in U.S. dollar terms.
Since 1970, when the MSCI EAFE was created, through the end of 2004, earnings growth and dividend yield has provided most of the market’s total return. Accordingly, we evaluate currency movements in the context of how they might impact an individual company’s long-term earnings and cash flow prospects.
Currency movements can have a different effect on a company, depending on its geographical mix of revenues and costs. For example, Honda, the Japanese automaker, has a large revenue base in the U.S., but a significant cost base in Japan. Consequently, a declining dollar hurts Honda’s margins, as U.S. dollar revenues are translated into fewer Yen, while Yen-based costs remain unchanged. Honda is responding to this challenge by increasing its overseas production capabilities to better match its revenues with its costs. Honda also hedges its currency exposure on an opportunistic basis. In contrast, a company such as Aderans, a Japanese wig-maker, has most of its revenues and costs in Japan; thus, a weak dollar has little impact on its profitability.
In Closing
Looking forward, we do not expect the high returns of the past two years for the Fund and the MSCI EAFE to be repeated. That said, the world’s equity markets do not always move in sync and over half of the world’s leading companies are domiciled outside of the U.S., so investing internationally adds diversification to one’s portfolio. We encourage our shareholders to look beyond short-term price swings, and take a long-term view toward international investing.
Thank you for the continued confidence you have placed in our firm as a shareholder of the International Stock Fund. As always, we welcome your comments and questions.
Sincerely,
| | |
 | |  |
Harry R. Hagey
Chairman February 18, 2005 | | Diana S. Strandberg Vice President |
Investment Performance
Total return for periods ended December 31, 2004
Average Annual Total return for periods ending December 31, 2004
| | | | | | | | | |
| | | 1 Year | | | 3 Years | | | Since
Inception
(5/1/01) | |
| Dodge & Cox International Stock Fund* | | 32.46 | % | | 19.81 | % | | 13.63 | % |
| MSCI EAFE | | 20.24 | | | 11.89 | | | 4.91 | |
Past performance does not guarantee future results. Investment return and share price will fluctuate with market conditions, and investors may have a gain or loss when shares are sold. Mutual fund performance changes over time and currently may be significantly lower than stated above. Performance is updated and published monthly. Visit the Fund’s web site at www.dodgeandcox.com or call 800-621-3979 for current performance figures.
* | | Through April 30, 2005, Dodge & Cox has contractually agreed to reimburse the Fund for all ordinary expenses to the extent necessary to maintain total Fund operating expenses at 0.90%. Expense reimbursements were paid since the Fund’s inception through June 30, 2003, but have not been required after this point as assets in the Fund increased and the Fund’s ratio of expenses to average net assets fell below 0.90%. Without reimbursement, returns for the Fund for periods beginning before June 30, 2003 would have been lower. |
The Morgan Stanley Capital International Europe, Australasia, Far East Index (MSCI EAFE) is a widely recognized benchmark of the world’s stock markets, excluding the United States. The Fund’s total returns include the reinvestment of dividend and capital gain distributions, but have not been adjusted for any income taxes payable on these distributions. Index returns include dividends and, unlike Fund returns, do not reflect fees or expenses.
Morgan Stanley®, Morgan Stanley Capital International, and EAFE® are trademarks of Morgan Stanley.
Risks of International Investing: Foreign investing, especially in developing countries,
has special risks such as currency and market volatility and political and social instability.
These and other risk considerations are
discussed in the Fund’s prospectus.
| | |
| | | Dodge & Cox International Stock Fund / 2 |
Fund Expenses
As a shareholder of the Fund, you incur ongoing costs, which include costs for portfolio management, administrative services, and shareholder reports (like this one), among others. Operating expenses, which are deducted from a Fund’s gross income, directly reduce the investment return of the Fund. The following examples are intended to help you understand the ongoing costs (in dollars) of investing in the Fund and to compare these costs with those of other mutual funds. The examples are based on an investment of $1,000 made at the beginning of the period shown and held for the entire period.
The table below illustrates the Fund’s costs in two ways:
Actual Fund Expenses
This section helps you to estimate the actual expenses that you paid over the period. The “Ending Account Value” shown is derived from the Fund’s actual return, and the third column shows the dollar amount that would have been paid by an investor who started with $1,000 in the Fund. You may use the information here, together with the amount you invested, to estimate the expenses that you paid over the period. To do so, simply divide your account value by $1,000 (for example, an $8,600 account value divided by $1,000 = 8.6), then multiply the result by the number given for the Fund under the heading “Expenses Paid During Period.”
Hypothetical Example for Comparison
This section is intended to help you compare the Fund’s costs with those of other mutual Funds. It assumes that the Fund had a yearly return of 5% before expenses, but that the expense ratio is unchanged. In this case—because the return used is not the Fund’s actual return—the results do not apply to your investment. The example is useful in making comparisons because the Securities and Exchange Commission requires all mutual funds to calculate expenses based on a 5% return. You can assess the Fund’s costs by comparing this hypothetical example with the hypothetical examples that appear in shareholder reports of other funds.
| | | | | | | | | |
Six Months Ended
December 31, 2004 | | Beginning
Account Value 7/1/2004 | | Ending
Account Value 12/31/2004 | | Expenses Paid
During Period* |
| Based on Actual Fund Return | | $1,000.00 | | $1,203.70 | | $4.19 |
| Based on Hypothetical 5% Yearly Return | | 1,000.00 | | 1,021.20 | | 3.84 |
| * | | These calculations are based on expenses incurred in the most recent fiscal half-year. The Fund’s annualized six-month expense ratio for that period is 0.76%. The dollar amounts shown as “Expenses Paid” are equal to the annualized expense ratio multiplied by the average account value over the period, multiplied by the number of days in the most recent fiscal half-year, then divided by 366. |
The expenses shown in the table are meant to highlight and help you compare ongoing costs only and do not reflect any transactional costs, account maintenance fees or charges by processing organizations. While other mutual funds may charge such fees, please note that the Fund does not charge any transaction fee (e.g., redemption fee), account maintenance fee (e.g., small account fee), nor does it charge a “sales load.”
| | |
| 3 / Dodge & Cox International Stock Fund | | |
Fund Information | December 31, 2004 |
General Information
| | |
Net Asset Value Per Share | | $30.64 |
Total Net Assets (millions) | | $4,203 |
2004 Expense Ratio | | 0.77% |
2004 Turnover Ratio | | 6% |
30-Day SEC Yield1 | | 1.43% |
Fund Inception Date | | May 1, 2001 |
Investment Manager: Dodge & Cox, San Francisco. Managed by the International Investment Policy Committee, whose seven members’ average tenure at Dodge & Cox is 16 years.
Asset Allocation
| | | | |
| Portfolio Characteristics | | Fund | | MSCI
EAFE |
Number of Stocks | | 67 | | 1,070 |
Median Market Capitalization (billions) | | $11 | | $3 |
Weighted-Average Market Capitalization (billions) | | $40 | | $45 |
Price-to-Earnings Ratio2 | | 14x | | 16x |
Price-to-Book Value Ratio | | 1.8x | | 2.1x |
| | | | | |
| | |
Ten Largest Holdings | | % of Fund |
GlaxoSmithKline PLC ADR (United Kingdom) | | 3.0 |
Sony ADR (Japan) | | 2.9 |
Electrolux A.B. (Sweden) | | 2.8 |
Royal Dutch Petroleum (Netherlands) | | 2.7 |
KT Corp. ADR (South Korea) | | 2.4 |
Lafarge S.A. (France) | | 2.2 |
Banco Santander Central Hispano (Spain) | | 2.2 |
Uniao de Bancos Brasileiros GDR (Brazil) | | 2.2 |
Petroleo Brasileiro S.A. ADR (Brazil) | | 2.2 |
Royal Bank of Scotland Group PLC (United Kingdom) | | 2.1 |
| | | | | | |
| Region Diversification | | Fund | | | MSCI
EAFE | |
Europe (excluding United Kingdom) | | 39.4 | % | | 45.3 | % |
Japan | | 16.2 | | | 21.9 | |
United Kingdom | | 13.1 | | | 25.0 | |
Pacific (excluding Japan) | | 8.8 | | | 7.8 | |
Latin America | | 8.7 | | | 0.0 | |
United States3 | | 2.1 | | | 0.0 | |
Africa | | 1.9 | | | 0.0 | |
Middle East | | 1.1 | | | 0.0 | |
Canada | | 0.8 | | | 0.0 | |
| | | | | | |
| Sector Diversification | | Fund | | | MSCI
EAFE | |
Financials | | 18.1 | % | | 27.6 | % |
Materials | | 17.2 | | | 7.3 | |
Consumer Discretionary | | 14.6 | | | 12.3 | |
Energy | | 10.4 | | | 8.1 | |
Consumer Staples | | 7.4 | | | 8.1 | |
Health Care | | 6.5 | | | 8.0 | |
Information Technology | | 6.0 | | | 6.3 | |
Telecommunication Services | | 4.5 | | | 7.6 | |
Industrials | | 4.4 | | | 9.5 | |
Utilities | | 3.0 | | | 5.2 | |
| 1 | | SEC Yield is an annualization of the Fund’s total net investment income per share for the 30-day period ended on the last day of the month. |
| 2 | | The Fund’s price-to-earnings (P/E) ratio is calculated using fiscal year-end earnings and excludes extraordinary items. |
| 3 | | In the fourth quarter of 2004 News Corp. reincorporated as a Delaware corporation (formerly New South Wales, Australia) headquartered in New York, NY (formerly Sydney, Australia). |
Dodge & Cox International Stock Fund / 4
Portfolio of Investments | December 31, 2004 |
COMMON STOCKS: 85.2%
| | | | | |
| | | SHARES | | MARKET VALUE |
| MATERIALS: 17.2% | | | | | |
| CHEMICALS: 11.5% | | | |
BASF A.G. (Germany) | | 1,043,400 | | $ | 75,105,936 |
Akzo Nobel N.V. (Netherlands) | | 1,591,100 | | | 67,810,660 |
Bayer A.G. (Germany) | | 1,917,000 | | | 64,933,098 |
Kemira Oyj (Finland) | | 4,434,800 | | | 61,194,911 |
Yara International A.S.A.(a) (Norway) | | 3,991,310 | | | 52,463,138 |
Makhteshim-Agan Industries, Ltd. (Israel) | | 8,244,284 | | | 44,313,026 |
NOVA Chemicals Corp. (Canada) | | 751,200 | | | 35,519,360 |
Givaudan (Switzerland) | | 43,100 | | | 28,347,295 |
Imperial Chemical Industries PLC (United Kingdom) | | 4,778,000 | | | 22,092,657 |
Syngenta A.G. ADR(b) (Switzerland) | | 1,005,500 | | | 21,467,425 |
Kemira GrowHow Oyj (Finland) | | 1,511,393 | | | 11,556,687 |
| | | | |
|
|
| | | | | | 484,804,193 |
| CONSTRUCTION MATERIALS: 3.0% | | | |
Lafarge S.A. (France) | | 973,422 | | | 93,865,731 |
Rinker Group Ltd. (Australia) | | 3,850,000 | | | 32,084,463 |
| | | | |
|
|
| | | | | | 125,950,194 |
| METALS AND MINING: 2.7% | | | |
BHP Billiton Ltd. (Australia) | | 5,260,078 | | | 63,139,622 |
Rio Tinto PLC (United Kingdom) | | 1,684,400 | | | 49,541,842 |
| | | | |
|
|
| | | | | | 112,681,464 |
| | | | |
|
|
| | | | | | 723,435,851 |
| FINANCIALS: 15.9% | | | |
| BANKS: 13.1% | | | |
Banco Santander Central Hispano (Spain) | | 7,620,000 | | | 94,487,271 |
Royal Bank of Scotland Group PLC (United Kingdom) | | 2,640,972 | | | 88,773,360 |
Standard Bank Group Limited (South Africa) | | 6,746,234 | | | 78,597,365 |
Kookmin Bank ADR(a),(b) (South Korea) | | 1,906,000 | | | 74,486,480 |
Shinsei Bank, Ltd. (Japan) | | 7,865,000 | | | 53,629,366 |
Mitsubishi Tokyo Financial Group, Inc. ADR(b) (Japan) | | 4,956,800 | | | 50,658,496 |
Danske Bank (Denmark) | | 1,445,300 | | | 44,253,838 |
DBS Group Holdings Ltd. (Singapore) | | 4,142,000 | | | 40,854,132 |
Standard Chartered PLC (United Kingdom) | | 1,405,000 | | | 26,107,225 |
| | | | |
|
|
| | | | | | 551,847,533 |
| DIVERSIFIED FINANCIALS: 1.9% | | | |
Credit Suisse Group (Switzerland) | | 1,570,000 | | | 65,899,192 |
Euler & Hermes (France) | | 210,100 | | | 14,467,103 |
| | | | |
|
|
| | | | | | 80,366,295 |
| INSURANCE: 0.9% | | | |
Converium Holdings AG (Switzerland) | | 4,233,328 | | | 37,731,190 |
| | | | |
|
|
| | | | | | 669,945,018 |
| | | | | |
| | | SHARES | | MARKET VALUE |
| CONSUMER DISCRETIONARY: 14.6% | | | |
| CONSUMER DURABLES & APPAREL: 9.0% | | | |
Sony Corp. ADR(b) (Japan) | | 3,146,500 | | $ | 122,587,640 |
Electrolux A.B. (Sweden) | | 5,067,700 | | | 116,011,085 |
Matsushita Electric Industrial Co., Ltd. ADR(b) (Japan) | | 3,431,700 | | | 55,078,785 |
Consorcio Ara S.A.(a,d) (Mexico) | | 18,217,700 | | | 54,769,178 |
Makita Corp. (Japan) | | 883,000 | | | 15,457,783 |
Corporacion Geo S.A.(a) (Mexico) | | 7,191,600 | | | 14,392,235 |
| | | | |
|
|
| | | | | | 378,296,706 |
| AUTOMOBILES & COMPONENTS: 3.0% | | | |
Honda Motor Co. Ltd. ADR(b) (Japan) | | 2,020,800 | | | 52,662,048 |
Fiat SPA ADR(a, b) (Italy) | | 4,960,700 | | | 39,586,386 |
Suzuki Motor Corp. (Japan) | | 1,893,000 | | | 34,618,239 |
| | | | |
|
|
| | | | | | 126,866,673 |
| MEDIA: 2.1% | | | |
News Corp. Class A(b, c) (United States) | | 4,748,292 | | | 88,603,129 |
| |
| HOTELS, RESTAURANTS & LEISURE: 0.5% | | | |
InterContinental Hotels Group PLC (United Kingdom) | | 1,518,461 | | | 18,863,756 |
| | | | |
|
|
| | | | | | 612,630,264 |
| ENERGY: 8.2% | | | |
Royal Dutch Petroleum Co.(b) (Netherlands) | | 2,000,000 | | | 114,760,000 |
Norsk Hydro A.S.A. ADR(b) (Norway) | | 1,061,500 | | | 83,561,280 |
Total (France) | | 303,500 | | | 66,240,276 |
Stolt Offshore S.A. ADR(a, b) (Norway) | | 6,950,200 | | | 45,176,300 |
Schlumberger Ltd.(b) (Netherlands Antilles) | | 540,700 | | | 36,199,865 |
| | | | |
|
|
| | | | | | 345,937,721 |
| CONSUMER STAPLES: 7.4% | | | |
| FOOD, BEVERAGE AND TOBACCO: 6.2% | | | |
Nestle S.A. (Switzerland) | | 326,000 | | | 85,164,208 |
Unilever N.V.(b) (Netherlands) | | 1,113,900 | | | 74,308,269 |
Fomento Economico Mexicano, S.A. de C.V. ADR(b) (Mexico) | | 1,377,400 | | | 72,465,014 |
Kikkoman Corp. (Japan) | | 2,891,000 | | | 27,592,507 |
| | | | |
|
|
| | | | | | 259,529,998 |
| PERSONAL PRODUCTS: 1.2% | | | |
Aderans Co.(d) (Japan) | | 2,233,200 | | | 51,704,040 |
| | | | |
|
|
| | | | | | 311,234,038 |
| INFORMATION TECHNOLOGY: 6.0% | | | |
| TECHNOLOGY HARDWARE & EQUIPMENT: 6.0% | | | |
Brother Industries, Ltd. (Japan) | | 8,000,000 | | | 68,070,141 |
Seiko Epson Corp. (Japan) | | 1,499,200 | | | 66,784,076 |
LG.Philips LCD Co., Ltd. ADR(a,b) (South Korea) | | 3,400,000 | | | 61,166,000 |
Oce N.V. (Netherlands) | | 3,649,767 | | | 55,815,021 |
| | | | |
|
|
| | | | | | 251,835,238 |
| | |
| 5 / Dodge & Cox International Stock Fund | | See accompanying Notes to Financial Statements |
Portfolio of Investments | December 31, 2004 |
COMMON STOCKS (continued)
| | | | | |
| | | SHARES | | MARKET VALUE |
| HEALTH CARE: 4.9% | | | |
| PHARMACEUTICALS & BIOTECHNOLOGY: 3.0% | | | |
GlaxoSmithKline PLC ADR(b) (United Kingdom) | | 2,675,000 | | $ | 126,768,250 |
| | | | | | |
| HEALTH CARE EQUIPMENT & SERVICES: 1.9% | | | |
MEDICEO Holdings Co., Ltd. (Japan) | | 7,153,500 | | | 80,574,273 |
| | | | |
|
|
| | | | | | 207,342,523 |
| TELECOMMUNICATION SERVICES: 4.5% | | | |
KT Corp. ADR(b) (South Korea) | | 4,588,400 | | | 100,073,004 |
Vodafone Group PLC ADR(b) (United Kingdom) | | 3,205,000 | | | 87,752,900 |
| | | | |
|
|
| | | | | | 187,825,904 |
| INDUSTRIALS: 4.4% | | | |
| CAPITAL GOODS: 3.3% | | | |
Volvo A.B. (Sweden) | | 1,231,600 | | | 48,875,960 |
Kidde PLC (United Kingdom) | | 13,230,200 | | | 42,263,495 |
Sulzer A.G. (Switzerland) | | 65,500 | | | 26,011,921 |
CNH Global N.V.(b) (Netherlands) | | 1,027,220 | | | 19,897,251 |
| | | | |
|
|
| | | | | | 137,048,627 |
| ELECTRONIC EQUIPMENT & INSTRUMENTS: 1.1% | | | |
Nexans(d) (France) | | 1,166,440 | | | 45,830,901 |
| | | | |
|
|
| | | | | | 182,879,528 |
| UTILITIES: 2.1% | | | |
National Grid Transco PLC (United Kingdom) | | 5,500,000 | | | 52,339,447 |
Scottish Power PLC ADR(b) (United Kingdom) | | 1,140,600 | | | 35,541,096 |
| | | | |
|
|
| | | | | | 87,880,543 |
| | | | |
|
|
| Total Common Stocks (Cost $2,976,857,630) | | | 3,580,946,628 |
| | | | |
|
|
| | | | | |
PREFERRED STOCKS: 6.9%
|
| | | SHARES | | MARKET VALUE |
| ENERGY: 2.2% | | | |
Petroleo Brasileiro S.A. ADR(b) (Brazil) | | 2,495,700 | | $ | 90,369,297 |
| FINANCIALS: 2.2% | | | |
| BANKS: 2.2% | | | |
Uniao de Bancos Brasileiros Sponsored GDR(b) (Brazil) | | 2,916,500 | | | 92,511,380 |
| HEALTH CARE: 1.6% | | | |
| HEALTH CARE EQUIPMENT & SERVICES: 1.6% | | | |
Fresenius Medical Care (Germany) | | 1,168,041 | | | 67,658,861 |
| UTILITIES: 0.9% | | | |
Ultrapar Participacoes S.A. ADR(b) (Brazil) | | 2,005,900 | | | 39,736,879 |
| | | | |
|
|
Total Preferred Stocks (Cost $214,655,775) | | | 290,276,417 |
| | | | |
|
|
| | | | |
| |
| SHORT-TERM INVESTMENTS: 8.6% | | |
| | | | | | | | |
| | | PAR VALUE | | | MARKET VALUE | |
SSgA Prime Money Market Fund(b) | | $ | 20,553,941 | | | $ | 20,553,941 | |
State Street Repurchase Agreement, 1.40%, 1/3/05(b), maturity value $272,049,735 (collateralized by U.S. Treasury Securities, value $277,475,765, 4.875%–8.125%, 2/15/12–8/15/19) | | | 272,018,000 | | | | 272,018,000 | |
U.S. Treasury Bills, 1/27/05(b) | | | 70,000,000 | | | | 69,913,550 | |
| | | | | | |
|
|
|
| |
| Total Short-Term Investments (Cost $362,485,491) | | | | 362,485,491 | |
| | | | | | |
|
|
|
TOTAL INVESTMENTS (Cost $3,553,998,896) | | | 100.7 | % | | | 4,233,708,536 | |
OTHER ASSETS LESS LIABILITIES | | | (0.7 | ) | | | (30,778,830 | ) |
| | |
|
|
| |
|
|
|
| TOTAL NET ASSETS | | | 100.0 | % | | $ | 4,202,929,706 | |
| | |
|
|
| |
|
|
|
| (b) | | Securities denominated in U.S. Dollars |
| (c) | | In the fourth quarter of 2004 News Corp. reincorporated as a Delaware corporation (formerly New South Wales, Australia) headquartered in New York, NY (formerly Sydney, Australia). |
| (d) | | Affiliated issuers. See Note 4 of Notes to Financial Statements. |
| | |
| See accompanying Notes to Financial Statements | | Dodge & Cox International Stock Fund / 6 |
| | | | |
Statement of Assets and Liabilities
| |
|
| December 31, 2004 | |
| Assets: | | | | |
Investments, (identified cost $3,553,998,896) | | | | |
Unaffiliated issuers, at market value | | $ | 4,081,404,417 | |
Affiliated issuers, at market value | | | 152,304,119 | |
| | |
|
|
|
| | | $ | 4,233,708,536 | |
Cash denominated in foreign currency (identified cost $221,222) | | | 221,222 | |
Receivable for Fund shares sold | | | 29,945,316 | |
Dividends and interest receivable | | | 10,013,082 | |
Prepaid expenses and other assets | | | 10,764 | |
| | |
|
|
|
| | | | 4,273,898,920 | |
| | |
|
|
|
| Liabilities: | | | | |
Payable for investments purchased | | | 67,096,968 | |
Payable for Fund shares redeemed | | | 1,069,918 | |
Management fees payable | | | 1,933,181 | |
Accounts payable | | | 869,147 | |
| | |
|
|
|
| | | | 70,969,214 | |
| | |
|
|
|
| Net Assets | | $ | 4,202,929,706 | |
| | |
|
|
|
| Net Assets Consist of: | | | | |
Paid in capital | | $ | 3,518,374,512 | |
Accumulated undistributed
net investment income | | | 2,145,796 | |
Accumulated undistributed net
realized gain on investments | | | 2,649,321 | |
Net unrealized appreciation on investments | | | 679,760,077 | |
| | |
|
|
|
| | | $ | 4,202,929,706 | |
| | |
|
|
|
Fund shares outstanding (par value $0.01 each, unlimited shares authorized) | | | 137,156,518 | |
Net asset value per share | | | $30.64 | |
|
Statement of Operations
| |
Year Ended December 31, 2004 | |
| Investment Income: | | | | |
Dividends (net of foreign taxes of $4,816,449) | | | | |
Unaffiliated issuers | | $ | 46,122,586 | |
Affiliated issuers | | | 605,629 | |
Interest | | | 1,444,899 | |
| | |
|
|
|
| | | | 48,173,114 | |
| | |
|
|
|
| Expenses: | | | | |
Management fees | | | 10,819,237 | |
Custodian and fund accounting fees | | | 987,536 | |
Transfer agent fees | | | 943,494 | |
Professional services | | | 89,707 | |
Shareholder reports | | | 252,241 | |
Registration fees | | | 751,446 | |
Trustees’ fees | | | 82,000 | |
Miscellaneous | | | 8,181 | |
| | |
|
|
|
| | | | 13,933,842 | |
| | |
|
|
|
| Net Investment Income | | | 34,239,272 | |
| | |
|
|
|
| Realized and Unrealized Gain (Loss) on Investments and Foreign Currency: | | | | |
Net realized gain (loss) from: | | | | |
Investments in unaffiliated issuers | | | 38,891,684 | |
Investments in affiliated issuers | | | — | |
Foreign currency transactions | | | (1,092,235 | ) |
Net change in unrealized appreciation | | | 579,342,103 | |
| | |
|
|
|
Net realized and unrealized gain | | | 617,141,552 | |
| | |
|
|
|
| Net Increase in Net Assets from Operations | | $ | 651,380,824 | |
| | |
|
|
|
| | | | | | | | |
Statement of Changes in Net Assets
| |
| | |
| | | Year Ended
December 31, 2004 | | | Year Ended
December 31, 2003 | |
| Operations: | | | | | | | | |
Net investment income | | $ | 34,239,272 | | | $ | 3,611,292 | |
Net realized gain (loss) | | | 37,799,449 | | | | (5,919,747 | ) |
Net change in unrealized appreciation | | | 579,342,103 | | | | 118,219,534 | |
| | |
|
|
| |
|
|
|
Net increase in net assets from operations | | | 651,380,824 | | | | 115,911,079 | |
| | |
|
|
| |
|
|
|
| Distributions to | | | | | | | | |
| Shareholders from: | | | | | | | | |
Net investment income | | | (32,093,476 | ) | | | (3,707,922 | ) |
Net realized gain | | | (27,805,906 | ) | | | (22,032 | ) |
| | |
|
|
| |
|
|
|
Total distributions | | | (59,899,382 | ) | | | (3,729,954 | ) |
| | |
|
|
| |
|
|
|
| | |
| Fund Share Transactions: | | | | | | | | |
Amounts received from
sale of shares | | | 3,130,085,912 | | | | 505,237,353 | |
Net asset value of shares issued in reinvestment of distributions | | | 55,967,564 | | | | 3,479,385 | |
Amounts paid for
shares redeemed | | | (229,499,144 | ) | | | (82,943,027 | ) |
| | |
|
|
| |
|
|
|
Net increase from fund share transactions | | | 2,956,554,332 | | | | 425,773,711 | |
| | |
|
|
| |
|
|
|
Total increase in net assets | | | 3,548,035,774 | | | | 537,954,836 | |
| | |
| Net Assets: | | | | | | | | |
Beginning of year | | | 654,893,932 | | | | 116,939,096 | |
| | |
|
|
| |
|
|
|
End of year (including undistributed net investment income of $2,145,796 and $0, respectively) | | $ | 4,202,929,706 | | | $ | 654,893,932 | |
| | |
|
|
| |
|
|
|
| | |
Shares sold | | | 116,358,049 | | | | 24,888,635 | |
Shares issued in
reinvestment of
distributions | | | 1,836,809 | | | | 149,716 | |
Shares redeemed | | | (8,933,703 | ) | | | (4,541,214 | ) |
| | |
|
|
| |
|
|
|
Net increase in
shares outstanding | | | 109,261,155 | | | | 20,497,137 | |
| | |
|
|
| |
|
|
|
| | |
| 7 / Dodge & Cox International Stock Fund | | See accompanying Notes to Financial Statements |
Notes to Financial Statements
Note 1 — Organization and Significant Accounting Policies
Dodge & Cox International Stock Fund (the “Fund”) is one of the funds constituting the Dodge & Cox Funds (the “Trust”). The Trust is organized as a Delaware statutory trust and is registered under the Investment Company Act of 1940, as amended, as a diversified, open-end management investment company. The Fund’s predecessor, Dodge & Cox International Equity Fund, L.L.C. (the “LLC”), was organized on October 25, 1999 as a private investment company that converted into, and had the same investment manager as, the Fund. The Fund was capitalized on April 30, 2001 upon the transfer of assets from the LLC and commenced operations on May 1, 2001. The Fund seeks long-term growth of principal and income, and the Fund invests primarily in a diversified portfolio of foreign stocks. Foreign investing, especially in developing countries, has special risks such as currency and market volatility and political and social instability. These and other risk considerations are discussed in the Fund’s Prospectus.
The Fund consistently follows accounting policies which are in conformity with accounting principles generally accepted in the United States of America. In preparing these financial statements, management is required to make estimates and assumptions that affect the reported amounts of assets and liabilities at the date of the financial statements and the reported amounts of income and expenses during the reporting period. Actual results could differ from those estimates. Significant accounting policies are as follows:
Security valuation. The Fund’s net assets are valued as of the close of trading on the New York Stock Exchange (the “NYSE”), generally 4:00 p.m. Eastern Time, each day that the NYSE is open for business. Listed securities are valued at market, using as a price the official quoted close price or the last sale on the date of determination on the principal exchange on which such securities are traded or, if not available, at the mean between the exchange listed bid and ask prices for the day. A security which is listed or traded on more than one exchange is valued at the quotation on the exchange determined to be the primary market for such security. Security values are not discounted based on the size of the Fund’s position. Securities for which market quotations are not readily available or whose values have been materially affected by events occurring before the Fund’s pricing time but after the close of the securities’ primary markets are valued at fair value as determined in good faith by or at the direction of the Board of Trustees. For securities that do not trade during NYSE hours, fair value determinations are based on analyses of market movements after the close of those securities’ primary markets, and include reviews of developments in foreign markets, the performance of U.S. securities markets, and the performance of instruments trading in U.S. markets that represent foreign securities and baskets of foreign securities. Pricing services are used to obtain closing market prices and to compute certain fair value adjustments utilizing computerized pricing models. When fair value pricing is employed, the prices of securities used by the Fund to calculate its net asset value may differ from quoted or published prices for the same securities. Foreign securities are converted to U.S. dollars using prevailing exchange rates. Short-term securities are valued at amortized cost which approximates current value.
Foreign Currency Translation. Investment securities and other assets and liabilities denominated in a foreign currency are translated into U.S. dollars at the prevailing rates of exchange at period end. Purchases and sales of securities, income receipts and expenses are translated into U.S. dollars at the prevailing exchange rate on the respective dates of such transactions. Net realized gains and losses on foreign currency transactions represent net gains and losses from sales and maturities of foreign currency contracts, disposition of foreign currencies, the difference between the amount of net investment income accrued and the U.S. dollar amount actually received, and gains and losses between trade and settlement date on purchases and sales of securities. The effects of changes in foreign currency exchange rates on investments in securities are included with the net realized and unrealized gain or loss on investments.
The Fund may enter into forward foreign currency exchange contracts in order to reduce the exposure to changes in foreign currency exchange rates on the foreign portfolio holdings and to lock in the U.S. dollar cost of firm purchase and sale commitments for securities denominated in or exposed to foreign currencies.
Security transactions and related investment income. Security transactions are recorded by the Fund as of the date the trades are executed with brokers. Realized gains and losses on securities sold are determined on the basis of identified cost. Dividend income and corporate action transactions are recorded on the ex-dividend date, except for certain dividends or corporate actions from foreign securities where the ex-dividend date may have passed, which are recorded as soon as the Fund is informed of the ex-dividend date. Withholding taxes on foreign dividends have been
| | |
| | | Dodge & Cox International Stock Fund / 8 |
Notes to Financial Statements (continued)
provided for in accordance with the Fund’s understanding of the applicable country’s tax rules and rates. Non-cash dividends included in dividend income, if any, are recorded at the fair market value of the securities received. Distributions received in excess of income are recorded as a reduction of cost of investments and/or realized gain. Interest income is recorded on the accrual basis.
Expenses. Expenses are recorded on the accrual basis. Most expenses of the Trust can be directly attributed to a specific fund. Expenses which cannot be directly attributed are apportioned among all of the funds in the Trust.
Repurchase agreements. The Fund may enter into repurchase agreements secured by U.S. government securities which involve the purchase of securities from a counterparty with a simultaneous commitment to resell the securities at an agreed-upon date and price. It is the Fund’s policy that its custodian take possession of the underlying collateral securities, the fair value of which exceeds the principal amount of the repurchase transaction, including accrued interest, at all times. In the event of default by the counterparty, the Fund has the contractual right to liquidate the securities and to apply the proceeds in satisfaction of the obligation.
Income taxes and distributions to shareholders. No provision for federal income taxes has been included in the accompanying financial statements since the Fund intends to distribute all of its taxable income and continue to comply with requirements for regulated investment companies. Distributions to shareholders of income and capital gains are reflected in the net asset value per share computation on the ex-dividend date. Income and capital gain distributions are determined in accordance with income tax regulations, which may differ from accounting principles generally accepted in the United States of America. Temporary differences between financial statement and tax treatments may occur when certain items of income, expense, gain or loss are recognized in different periods for financial statement and tax purposes. Differences in classification may also arise due to the treatment of short-term realized gains and currency transaction realized gains as ordinary income for tax purposes. Permanent differences are reclassified among capital accounts in the financial statements to reflect their tax character. These adjustments have no impact on net assets or results of operations.
Note 2 — Related Party Transactions
Management fees. Under a written agreement, the Fund pays an annual management fee of 0.60% of the Fund’s average daily net asset value to Dodge & Cox, investment manager of the Fund.
Expense Reimbursement. For the period May 1, 2001 through April 30, 2005, Dodge & Cox has contractually agreed to reimburse the Fund for all ordinary expenses to the extent necessary to maintain the ratio of expenses to average net assets at 0.90%.
Trustees’ fees. All officers and three of the trustees of the Trust are officers and employees of Dodge & Cox. Those trustees who are not affiliated with Dodge & Cox receive from the Trust an annual fee plus an attendance fee for each Board or Committee meeting attended. Payments to trustees are shared equally among each fund in the Trust. The Trust does not pay any other remuneration to its officers or trustees.
Indemnifications. Under the Trust’s organizational documents, its officers and trustees are indemnified against certain liabilities arising out of the performance of their duties to the Trust. In addition, in the normal course of business the Trust enters into contracts that provide general indemnifications to other parties. The Trust’s maximum exposure under these arrangements is unknown as this would involve future claims that may be made against the Trust that have not yet occurred.
Note 3 — Distributions Paid, Distributable Earnings and Investment Transactions
Distributions paid during the years ended December 31, 2004 and 2003 were characterized as follows for federal tax purposes:
| | | | |
| | | 2004
| | 2003
|
| Ordinary income | | $46,566,757 | | $3,729,954 |
| | | ($0.36 per share) | | ($0.14 per share) |
| Long-term capital gain | | $13,332,625 | | none |
| | | ($0.10 per share) | | |
At December 31, 2004, the tax basis components of accumulated undistributed income and net realized gain include $1,199,018 of ordinary income and no long-term capital gain. As permitted by federal tax law, the Fund elected to defer currency losses of $81,771 occurring between November 1, 2004 and December 31, 2004, and to treat those losses as arising in the year ending December 31, 2005. At December 31, 2004, the cost of investments for federal income tax purposes was equal to the cost for financial reporting purposes. Net unrealized appreciation of securities aggregated $679,760,077, of which $679,767,581 represented appreciated securities and $7,504 represented depreciated securities.
For the year ended December 31, 2004, purchases and sales of securities, other than short-term securities and U.S. government securities, aggregated $2,765,711,827 and $109,586,454, respectively.
| | |
| 9 / Dodge & Cox International Stock Fund | | |
Notes to Financial Statements (continued)
Note 4 — Investments in Affiliates
Each of the companies listed below is considered to be an affiliate of the Fund because the Fund owned at least 5% of the company’s voting securities during the year ended December 31, 2004. Transactions during the period in securities of affiliated companies were as follows:
| | | | | | | | | | | | | | |
| | | Shares at
Beginning
of Period | | Additions | | Reductions | | Shares
at End of
Period | |
| Dividend
Income1 | |
| Market Value of
Investment in
Affiliates at
December 31, 2004 |
| Aderans Co. (Japan) | | 1,070,000 | | 1,163,200 | | — | | 2,233,200 | | $ | 501,674 | | $ | 51,704,040 |
| Consorcio Ara S.A. (Mexico) | | 3,100,000 | | 15,117,700 | | — | | 18,217,700 | | | — | | | 54,769,178 |
| Nexans S.A. (France) | | — | | 1,166,440 | | — | | 1,166,440 | | | 103,955 | | | 45,830,901 |
| | | | | | | | | | | $ | 605,629 | | $ | 152,304,119 |
| 1 | | Net of foreign taxes, if any |
Financial Highlights
| | | | | | | | | | | | |
| SELECTED DATA AND RATIOS (for a share outstanding throughout each period) | | Year Ended December 31, | | | May 1, 2001 through
December 31, | |
| | | 2004 | | | 2003 | | | 2002 | | | 2001 | |
Net asset value, beginning of period | | $23.48 | | | $15.81 | | | $18.42 | | | $20.00 | |
| | | | |
Income from investment operations: | | | | | | | | | | | | |
Net investment income | | 0.26 | | | 0.14 | | | 0.13 | | | 0.14 | |
Net realized and unrealized gain (loss) | | 7.36 | | | 7.67 | | | (2.55 | ) | | (1.56 | ) |
| | |
|
|
Total from investment operations | | 7.62 | | | 7.81 | | | (2.42 | ) | | (1.42 | ) |
| | |
|
|
Distributions to shareholders from: | | | | | | | | | | | | |
Net investment income | | (0.24 | ) | | (0.14 | ) | | (0.13 | ) | | (0.14 | ) |
Net realized gain | | (0.22 | ) | | — | | | (0.06 | ) | | (0.02 | ) |
| | |
|
|
Total distributions | | (0.46 | ) | | (0.14 | ) | | (0.19 | ) | | (0.16 | ) |
| | |
|
|
Net asset value, end of period | | $30.64 | | | $23.48 | | | $15.81 | | | $18.42 | |
| | |
|
|
Total return | | 32.46 | % | | 49.42 | % | | (13.11 | )% | | (7.09 | )% |
Ratios/supplemental data: | | | | | | | | | | | | |
Net assets, end of period (millions) | | $4,203 | | | $655 | | | $117 | | | $25 | |
Ratio of expenses to average net assets | | 0.77 | % | | 0.82 | % | | 0.90 | % | | 0.90 | %* |
Ratio of expenses to average net assets,
before reimbursement by investment manager | | 0.77 | % | | 0.84 | % | | 1.03 | % | | 2.47 | %* |
Ratio of net investment income to average net assets | | 1.90 | % | | 1.53 | % | | 1.30 | % | | 1.74 | %* |
Portfolio turnover rate | | 6 | % | | 11 | % | | 12 | % | | 23 | % |
| | |
| | | Dodge & Cox International Stock Fund / 10 |
Report of Independent Registered Public Accounting Firm
To the Trustees of Dodge & Cox Funds and Shareholders of Dodge & Cox International Stock Fund
In our opinion, the accompanying statement of assets and liabilities, including the portfolio of investments, and the related statements of operations and of changes in net assets and the financial highlights present fairly, in all material respects, the financial position of the Dodge & Cox International Stock Fund (the “Fund”, one of the series constituting Dodge & Cox Funds) at December 31, 2004, the results of its operations for the year then ended, and the changes in its net assets for each of the two years in the period then ended and the financial highlights for each of the periods presented, in conformity with accounting principles generally accepted in the United States of America. These financial statements and financial highlights (hereafter referred to as “financial statements”) are the responsibility of the Fund’s management; our responsibility is to express an opinion on these financial statements based on our audits. We conducted our audits of these financial statements in accordance with the standards of the Public Company Accounting Oversight Board (United States). Those standards require that we plan and perform the audit to obtain reasonable assurance about whether the financial statements are free of material misstatement. An audit includes examining, on a test basis, evidence supporting the amounts and disclosures in the financial statements, assessing the accounting principles used and significant estimates made by management, and evaluating the overall financial statement presentation. We believe that our audits, which included confirmation of securities at December 31, 2004 by correspondence with the custodian and brokers, provide a reasonable basis for our opinion.
PricewaterhouseCoopers LLP
San Francisco, California
February 18, 2005
| | |
| 11 / Dodge & Cox International Stock Fund | | |
Special 2004 Tax Information (unaudited)
The following information is provided pursuant to provisions of the Internal Revenue Code:
In 2004, the Fund has elected to pass through to shareholders foreign source income of $47,140,030 and foreign taxes paid of $4,089,685.
The Fund designates $46,100,326 of its distributions paid to shareholders in 2004 as qualified dividends (treated for federal income tax purposes in the hands of shareholders as taxable at a maximum rate of 15%).
Fund’s Holdings
The Funds provide a complete list of their holdings four times in each fiscal year, at the quarter-ends. The lists appear in the Funds’ First Quarter, Semi-Annual, Third Quarter and Annual Reports to shareholders. The Funds file the lists with the Securities and Exchange Commission (SEC) on Form N-CSR (second and fourth quarters) and Form N-Q (first and third quarters). Shareholders may view the Funds’ Forms N-CSR and N-Q on the SEC’s website at www.sec.gov. Forms N-CSR and N-Q may also be reviewed and copied at the SEC’s Public Reference Room in Washington, DC. Information regarding the operations of the Public Reference Room may be obtained by 1-202-942-8090 (direct) or 1-800/SEC-0330 (general SEC number). A complete list of the Funds’ quarter-end holdings are also available at www.dodgeandcox.com on or about 15 days following each quarter end.
Proxy Voting
For a free copy of the Fund’s proxy voting policies and procedures, please call (800) 621-3979, visit www.dodgeandcox.com or the Securities and Exchange Commission’s web site at www.sec.gov. Information regarding how Dodge & Cox, on behalf of the Fund, voted proxies relating to the Fund’s portfolio securities for the most recent twelve-month period ending June 30 is available at www.dodgeandcox.com or the SEC’s web site at www.sec.gov.
| | |
| | | Dodge & Cox International Stock Fund / 12 |
THIS PAGE INTENTIONALLY LEFT BLANK
| | |
| 13 / Dodge & Cox International Stock Fund | | |
THIS PAGE INTENTIONALLY LEFT BLANK
| | |
| | | Dodge & Cox International Stock Fund / 14 |
Dodge & Cox Funds—Executive Officer & Trustee Information (unaudited)
| | | | | | |
Name (Age) and
Address* | | Position with Trust
(Year of Election
or Appointment) | | Principal Occupation During Past 5 Years | | Other Directorships Held by Trustees |
| Interested Trustees & Officers |
Harry R. Hagey (63) | | Chairman and Trustee (Trustee since 1975) | | Chairman, Chief Executive Officer and Director of Dodge & Cox, Portfolio Manager and member of Investment Policy Committee (IPC) | | — |
John A. Gunn (61) | | President and Trustee
(Trustee since 1985) | | President, Chief Investment Officer and Director of Dodge & Cox, Portfolio Manager, and member of IPC, Fixed Income Strategy Committee (FISC) and International Investment Policy Committee (IIPC) | | — |
Dana M. Emery (43) | | Vice President and Trustee (Trustee since 1993) | | Senior Vice President and Director of Dodge & Cox, Manager of the Fixed Income Department, Portfolio Manager, and member of IPC and FISC | | — |
A. Horton Shapiro (65) | | Executive Vice President (Officer since 1985) | | Senior Vice President and Director of Dodge & Cox and Portfolio Manager | | — |
| Katherine Herrick Drake (50) | | Vice President (Officer since 1993) | | Vice President of Dodge & Cox and Portfolio Manager | | — |
Kenneth E. Olivier (52) | | Vice President
(Officer since 1992) | | Executive Vice President (since 2002) and Director of Dodge & Cox, Portfolio Manager and member of IPC | | — |
| Diana S. Strandberg (45) | | Vice President (Officer since 2001) | | Vice President of Dodge & Cox, Portfolio Manager and member of the IIPC | | — |
John M. Loll (38) | | Treasurer and Assistant Secretary (Officer since 2000) | | Vice President and Treasurer of Dodge & Cox | | — |
| Thomas M. Mistele (51) | | Secretary and Assistant Treasurer (Officer since 2000) | | Chief Operating Officer (since 2004), Secretary and General Counsel of Dodge & Cox | | — |
| Marcia P. Venegas (36) | | Chief Compliance Officer
(Officer since 2004) | | Chief Compliance Officer of the Trust (since 2004), Compliance Officer of Dodge & Cox (2003-2004); Compliance and Business Risk Manager of Deutsche Asset Management, Australia Limited (1999-2001). | | — |
| Independent Trustees |
William F. Ausfahl (64) | | Trustee (Since 2002) | | CFO, The Clorox Co. (1982-1997); Director, The Clorox Co. (1984-1997) | | — |
L. Dale Crandall (63) | | Trustee (Since 1999) | | President, Kaiser Foundation Health Plan, Inc. and Kaiser Foundation Hospitals (2000-2002); Senior Vice President–Finance and Administration & CFO, Kaiser Foundation Health Plan, Inc. and Kaiser Foundation Hospitals (1998-2000) | | Director, Union BanCal Corporation (bank holding company) and Union Bank of California (commercial bank) (2001-Present); Director, Covad Communications Group (broadband communications services) (2002-Present); Director, Ansell Limited (medical equipment and supplies) (2002-Present); Director, BEA Systems, Inc. (software and programming) (2003-Present); Director, Coventry Health Care Inc. (managed healthcare) (2004-Present) |
Thomas A. Larsen (55) | | Trustee (Since 2002) | | Director in Howard, Rice, Nemerovski, Canady, Falk & Rabkin (law firm) | | — |
Will C. Wood (65) | | Trustee (Since 1992) | | Principal, Kentwood Associates, Financial Advisers | | Director, Banco Latinoamericano de Exportaciones S.A. (Latin American Foreign Trade Bank) (1999-Present); Director, Dover Investment Corp. (real estate development) (1992-Present) |
| * | | The address for each Officer and Trustee is 555 California Street, 40th Floor, San Francisco, California 94104. Each Officer and Trustee oversees all four series in the Dodge & Cox Funds complex and serves for an indefinite term. |
Additional information about the Trust’s Trustees is available in the Trust’s Statement of Additional Information (SAI). You can get a free copy of the SAI by contacting Dodge & Cox Funds at (800)-621-3979.

Balanced Fund
(Closed to New Investors)
Established 1931

74th Annual Report
December 31, 2004
2004
Balanced Fund
www.dodgeandcox.com
For Fund literature, transactions and account
information, please visit the Funds’ web site.
or write or call:
Dodge & Cox Funds
c/o Boston Financial Data Services
P.O. Box 8422
Boston, Massachusetts 02266-8422
(800) 621-3979
Investment Manager
Dodge & Cox
555 California Street, 40th Floor
San Francisco, California 94104
(415) 981-1710
This report is submitted for the general information of the shareholders of the Fund. The report is not authorized for distribution to prospective investors in the Fund unless it is accompanied by a current prospectus.
This report reflects our views, opinions and portfolio holdings as of December 31, 2004, the end of the reporting period. Any such views are subject to change at any time based upon market or other conditions and Dodge & Cox disclaims any responsibility to update such views. These views may not be relied on as investment advice and, because investment decisions for a Dodge & Cox Fund are based on numerous factors, may not be relied on as an indication of trading intent on behalf of any Dodge & Cox Fund.
12/04 BF AR  Printed on recycled paper
To Our Shareholders
In last year’s Annual Report we wrote, “At the risk of looking like a stopped clock, we want to reiterate our caution about future equity returns.” Fortunately, we also wrote, “Forecasting the market on a short-term basis has a large error rate,” as returns in the equity markets exceeded our expectations. On the other hand, our 2004 expectations for lower fixed-income returns relative to previous years were met. The Dodge & Cox Balanced Fund had a total return of 13.3% for the year ended December 31, 2004, compared to the 8.3% return for the Combined Index1. Total returns for longer periods are listed on the following page. At year-end 2004, the Fund’s total net assets of $20.7 billion were invested in 59% stocks, 32% fixed-income securities and 9% cash equivalents.
The share price of the Fund rose from $73.04 at the end of 2003 to $79.35 on December 31, 2004. In addition, during the year, the Fund distributed income dividends of $1.60 per share, a short-term capital gain of $0.30 per share and long-term capital gains of $1.38 per share.
2004 Performance Review
Equity Portfolio
A surprisingly strong rally in the fourth quarter boosted full year results for the Fund’s equity markets. In 2004, the equity portfolio outperformed the S&P 500’s return of 10.9% and every sector contributed positively to results. Holdings in the Information Technology (e.g., Motorola up 38% and Computer Sciences up 27%) and Financial (e.g., Loews up 44% and Capital One up 38%) sectors were particularly strong. Not all equity holdings fared as well, as 16 stocks ended the year with lower prices, including Pfizer (down 22%) and Alcoa (down 16%). For each of the Fund’s holdings, we continuously reassess our long-term outlook for the company and then compare that outlook to its current stock price. While the Fund’s investment in each of these companies detracted from returns, we remain optimistic about their opportunities for capital appreciation in the years ahead.
Fixed-Income Portfolio
During the year, the fixed-income market experienced a significant “flattening” of the yield curve, as yields on shorter-maturity securities rose along with the Federal Funds rate, while yields on longer-maturity securities remained stable or fell. In this environment the fixed-income portfolio performed roughly in line with the LBAG’s return of 4.3%. Reflecting our view that inflation would accelerate and U.S. economic growth would continue at a healthy pace, we positioned the fixed-income portfolio with a duration2 below that of the LBAG benchmark to seek to protect from price declines associated with our anticipation of a rise in interest rates. This defensive positioning hurt the fixed-income portfolio’s return relative to the LBAG in two ways. First, the portfolio earned less income due to the lower yield offered by short and intermediate bonds in the steep yield curve environment. Second, the portfolio’s securities experienced less price appreciation due to its somewhat lower exposure to higher-yielding, longer-maturity bonds, which generally rose in value.
On the positive side, the portfolio’s higher weighting than the LBAG in the Corporate and Mortgage sectors benefited the Fund during the year, given the strong performance from those areas. Our specific selection of bonds for the portfolio was modestly positive as well. Many of the portfolio’s corporate holdings performed well in 2004, led by lower-rated (BBB and below) issuers such as Dillard’s, Xerox, Health Net, Cigna, and Amerada Hess. These gains, however, were offset somewhat by poor returns from GMAC and UnumProvident bonds.
The Fund’s cash position, which represented approximately 15% of the Fund for much of the year, hindered results.
Equity Investment Strategy
The Fund’s equity portfolio is built one security at a time, based on our fundamental research effort, a three-to-five year time horizon and a strong price discipline. Because we are sensitive to how much we pay for each company’s projected future earnings and cash flow, the valuation characteristics (such as price-to-earnings ratio or “P/E”) of the portfolio are typically lower than the market’s, and Dodge & Cox has become known as a “value” manager. We think it is less useful to distinguish between growth and value management styles, and more important to understand the potential outcomes for each company and determine a reasonable value based on those long-term fundamentals.
We often find investment opportunity when valuations decline as a result of bad news affecting near-term earnings, but where we believe the long-term earnings opportunity remains largely intact. For example, over the last year, as investors became more skeptical about the positive long-term trends in Health Care, an area traditionally associated with growth investing, we have found more companies at attractive valuations, such as GlaxoSmithKline and Cardinal Health. In fact, for the first time in many years the equity portfolio now has a higher weighting than the S&P 500 in Health Care stocks.
Opportunities in Media Stocks
Valuations have been declining in recent years in the Media sector (also an area associated with growth investing), and we now have positions in five companies (News Corp., Time Warner, Comcast, Liberty Media and Interpublic Group). We believe these companies offer a blend of attractive fundamental business operations and exposure to ongoing consumer technology adoption. For example, both Comcast and Time Warner currently derive significant revenue from subscription-based services (e.g., cable and broadband data) with recurring, utility-like cash flow. Both companies are also poised to launch advanced Voice-Over-Internet Protocol (VOIP) telephone services in 2005. Importantly, we believe that each of the portfolio’s media investments currently trades at a reasonable
| | |
| 1 / Dodge & Cox Balanced Fund | | |
valuation compared to long-term growth prospects. Also, please note that we discuss these holdings to illustrate our investment approach, not because we think they are more attractive than the equity portfolio’s other holdings.
Looking Forward
Looking out over a three-to-five year period, we continue to believe that returns from the broad equity market will be modest and could be punctuated by some unpleasant negative contractions. While we are optimistic about the continued expansion of the global economy in the years ahead, P/E multiples are above average and profit margins are historically high. If interest rates and/or inflation rise, there is a risk that P/E multiples could contract. But as we noted earlier, forecasting is difficult, and rather than overly concerning ourselves with anticipating the direction of the broad market, we focus our energy attempting to understand the long-term risks and opportunities of each company in the equity portfolio relative to its current price.
With regards to the fixed-income portfolio, in the intermediate term we expect solid GDP growth, continued Federal Funds rate increases, a rise in Treasury note/bond supply (given the federal budget deficit), and, importantly, a continued acceleration of inflation. As the bond market focuses on these fundamental factors, we believe that long-term interest rates may rise. Therefore, we continue to target a below-benchmark duration. During the fourth quarter, we lowered the Fund’s cash position from 14.9% on September 30 to 8.6% at year end. This cash was invested in short-duration U.S. Treasury notes, which maintained the fixed-income portfolio’s relatively shorter duration (2.9 years versus 4.4 years for the LBAG).
Notwithstanding the defensive positioning, we continue to focus on finding attractive investment opportunities in well researched corporate and mortgage issues to build portfolio yield and long-term total return potential. This strategy allows us to build yield while maintaining the fixed-income portfolio’s well diversified, high average quality (AA)3 status.
In Closing
Thank you for the continued confidence you have placed in our firm as a shareholder of the Balanced Fund. As always, we welcome your comments and questions.
For the Board of Trustees,
| | |
 | | 
|
| |
| Harry R. Hagey, Chairman | | John A. Gunn, President |
February 18, 2005
Ten Years of Investment Performance
through December 31, 2004 (in thousands)
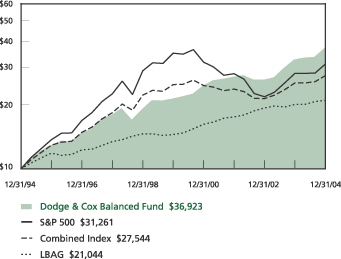
Average annual total return for periods ended December 31, 2004
| | | | | | | | | | | | |
| | | 1 Year | | | 5 Years | | | 10 Years | | | 20 Years | |
| | |
| Dodge & Cox Balanced Fund | | 13.31 | % | | 11.63 | % | | 13.95 | % | | 13.95 | % |
| Combined Index | | 8.27 | | | 1.98 | | | 10.66 | | | 11.77 | |
| S&P 500 | | 10.86 | | | (2.29 | ) | | 12.07 | | | 13.22 | |
| Lehman Brothers Aggregate Bond Index (LBAG) | | 4.34 | | | 7.71 | | | 7.72 | | | 8.84 | |
Past performance does not guarantee future results. Investment return and share price will fluctuate with market conditions, and investors may have a gain or loss when shares are sold. Mutual fund performance changes over time and currently may be significantly lower than stated above. Performance is updated and published monthly. Visit the Fund’s web site at www.dodgeandcox.com or call 800-621-3979 for current performance figures.
The Fund’s total returns include the reinvestment of dividend and capital gain distributions, but have not been adjusted for any income taxes payable by shareholders on these distributions. Index returns include dividends and/or interest income and, unlike Fund returns, do not reflect fees or expenses.
Lehman Brothers® is a trademark of Lehman Brothers, Inc.; Standard & Poor’s, Standard & Poor’s 500, and S&P 500® are trademarks of The McGraw-Hill Companies, Inc.
| 1 | | The Combined Index reflects an unmanaged portfolio of 60% of the Standard & Poor’s 500 Index (S&P 500) and 40% of the Lehman Brothers Aggregate Bond Index (LBAG). The Fund may, however, invest up to 75% of its total assets in stocks. |
| 2 | | Duration is a measure of a bond’s price sensitivity to changes in interest rates. |
| 3 | | The Fund does not currently own any AA securities and may invest in securities rated below AA. As of December 31, 2004, 9.5% of the Fund’s holdings were rated below AA. It is the Fund’s policy to invest in investment-grade debt securities. Securities that are downgraded below investment grade subsequent to purchase may continue to be held by the Fund, if Dodge & Cox believes it advantageous to do so. As of December 31, 2004, 2.7% of the Fund was invested in securities rated below investment grade (below BBB). |
| | |
| | | Dodge & Cox Balanced Fund / 2 |
Fund Expenses
As a shareholder of the Fund, you incur ongoing costs, which include costs for portfolio management, administrative services, and shareholder reports (like this one), among others. Operating expenses, which are deducted from a Fund’s gross income, directly reduce the investment return of the Fund. The following examples are intended to help you understand the ongoing costs (in dollars) of investing in the Fund and to compare these costs with those of other mutual funds. The examples are based on an investment of $1,000 made at the beginning of the period shown and held for the entire period.
The table below illustrates the Fund’s costs in two ways:
Actual Fund Expenses
This section helps you to estimate the actual expenses that you paid over the period. The “Ending Account Value” shown is derived from the Fund’s actual return, and the third column shows the dollar amount that would have been paid by an investor who started with $1,000 in the Fund. You may use the information here, together with the amount you invested, to estimate the expenses that you paid over the period. To do so, simply divide your account value by $1,000 (for example, an $8,600 account value divided by $1,000 = 8.6), then multiply the result by the number given for the Fund under the heading “Expenses Paid During Period.”
Hypothetical Example for Comparison
This section is intended to help you compare the Fund’s costs with those of other mutual Funds. It assumes that the Fund had a yearly return of 5% before expenses, but that the expense ratio is unchanged. In this case—because the return used is not the Fund’s actual return—the results do not apply to your investment. The example is useful in making comparisons because the Securities and Exchange Commission requires all mutual funds to calculate expenses based on a 5% return. You can assess the Fund’s costs by comparing this hypothetical example with the hypothetical examples that appear in shareholder reports of other funds.
| | | | | | |
Six Months Ended
December 31, 2004 | | Beginning
Account Value 7/1/2004 | | Ending
Account Value 12/31/2004 | | Expenses Paid
During Period* |
| Based on Actual Fund Return | | $1,000.00 | | $1,086.30 | | $2.82 |
| Based on Hypothetical 5% Yearly Return | | 1,000.00 | | 1,022.29 | | 2.74 |
| * | | These calculations are based on expenses incurred in the most recent fiscal half-year. The Fund’s annualized six-month expense ratio for that period is 0.54%. The dollar amounts shown as “Expenses Paid” are equal to the annualized expense ratio multiplied by the average account value over the period, multiplied by the number of days in the most recent fiscal half-year, then divided by 366. |
The expenses shown in the table are meant to highlight and help you compare ongoing costs only and do not reflect any transactional costs account maintenance fees, or charges by processing organizations. While other mutual funds may charge such fees, please note that the Fund does not charge any transaction fee (e.g., redemption fee), account maintenance fee (e.g., small account fee), nor does it charge a “sales load.”
| | |
| 3 / Dodge & Cox Balanced Fund | | |
Fund Information | December 31, 2004 |
General Information
| | |
Net Asset Value Per Share | | $79.35 |
Total Net Assets (millions) | | $20,741 |
30-Day SEC Yield1 | | 2.05% |
2004 Expense Ratio | | 0.54% |
2004 Portfolio Turnover | | 18% |
Fund Inception Date | | 1931 |
Investment Manager: Dodge & Cox, San Francisco. Managed by the Investment Policy Committee, whose eight members’ average tenure at Dodge & Cox is 23 years, and by the Fixed-Income Strategy Committee, whose nine members’ average tenure is 15 years.
Asset Allocation
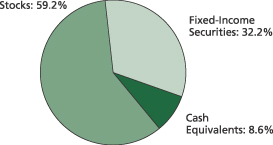
Stock Portfolio (59.2% of Fund)
| | |
Number of Stocks | | 90 |
Median Market Capitalization (billions) | | $15 |
Price-to-Earnings Ratio2 | | 16x |
Price-to-Book Value Ratio | | 2.1x |
Foreign Stocks3 (% of Fund) | | 9.2% |
| | |
| Five Largest Sectors | | % of Fund |
Consumer Discretionary | | 13.2 |
Financials | | 11.0 |
Health Care | | 8.4 |
Information Technology | | 7.3 |
Energy | | 5.2 |
| | |
Ten Largest Stock Holdings | | % of Fund |
Comcast Class A | | 2.0 |
Hewlett-Packard | | 1.8 |
News Corp. Class A | | 1.5 |
HCA, Inc. | | 1.5 |
Cardinal Health | | 1.5 |
Time Warner | | 1.4 |
AT&T | | 1.4 |
Union Pacific | | 1.3 |
McDonald’s | | 1.3 |
Dow Chemical | | 1.3 |
Fixed-Income Portfolio (32.2% of Fund)
| | |
Number of Fixed-Income Securities | | 249 |
Average Quality | | AA |
Average Maturity | | 5.1 years |
Effective Duration | | 2.9 years |
| | |
| Credit Quality Diversification4 | | % of Fund |
U.S. Government & Government Agencies | | 22.7 |
Aaa/AAA | | 0.0 |
Aa/AA | | 0.0 |
A/A | | 1.1 |
Baa/BBB | | 5.7 |
Ba/BB | | 2.5 |
B/B and below | | 0.2 |
| | |
| Sector Diversification | | % of Fund |
U.S. Treasury & Government Agency | | 9.5 |
Mortgage-Related Securities | | 13.2 |
Corporate | | 9.5 |
| 1 | | SEC Yield is an annualization of the Fund’s total net investment income per share for the 30-day period ended on the last day of the month. |
| 2 | | The Fund’s price-to-earnings (P/E) ratio is calculated using Dodge & Cox’s estimated forward earnings and excludes extraordinary items. |
| 3 | | All U.S. dollar-denominated. |
| 4 | | For presentation purposes only: when a security is split-rated, the lower of either Moody’s or Standard & Poor’s rating is reported. |
| | |
| | | Dodge & Cox Balanced Fund / 4 |
Portfolio of Investments | December 31, 2004 |
| | | | | |
| COMMON STOCKS: 59.2% |
| | |
| | | SHARES | | MARKET VALUE |
| CONSUMER DISCRETIONARY: 13.2% | | | | | |
| MEDIA: 5.5% | | | |
Comcast Corp. Class A(a) | | 12,171,909 | | $ | 405,081,132 |
News Corp. Class A | | 17,215,800 | | | 321,246,828 |
Time Warner, Inc.(a) | | 15,352,500 | | | 298,452,600 |
Liberty Media Corp. Series A(a) | | 9,888,000 | | | 108,570,240 |
Interpublic Group of Companies, Inc.(a) | | 117,000 | | | 1,567,800 |
| | | | |
|
|
| | | | | | 1,134,918,600 |
| CONSUMER DURABLES & APPAREL: 3.3% |
Sony Corp. ADR(b) (Japan) | | 6,872,900 | | | 267,768,184 |
Matsushita Electric Industrial Co., Ltd. ADR(b) (Japan) | | 10,946,300 | | | 175,688,115 |
Whirlpool Corp. | | 1,474,800 | | | 102,070,908 |
Eastman Kodak Co. | | 2,815,000 | | | 90,783,750 |
VF Corp. | | 1,051,600 | | | 58,237,608 |
| | | | |
|
|
| | | | | | 694,548,565 |
| HOTELS, RESTAURANTS & LEISURE: 1.5% | | | |
McDonald’s Corp. | | 8,678,950 | | | 278,247,137 |
InterContinental Hotels Group PLC ADR(b) (United Kingdom) | | 3,162,261 | | | 39,907,730 |
| | | | |
|
|
| | | | | | 318,154,867 |
| RETAILING: 1.3% | | | |
May Department Stores Co. | | 5,534,350 | | | 162,709,890 |
Gap, Inc. | | 3,552,400 | | | 75,026,688 |
Dillard’s, Inc. Class A | | 1,461,400 | | | 39,267,818 |
| | | | |
|
|
| | | | | | 277,004,396 |
| AUTOMOBILES & COMPONENTS: 0.9% |
Delphi Corp. | | 12,513,720 | | | 112,873,754 |
Honda Motor Co. Ltd. ADR(b) (Japan) | | 2,463,300 | | | 64,193,598 |
| | | | |
|
|
| | | | | | 177,067,352 |
| TRADING COMPANIES & DISTRIBUTORS: 0.7% |
Genuine Parts Co. | | 3,335,450 | | | 146,959,927 |
| | | | |
|
|
| | | | | | 2,748,653,707 |
| FINANCIALS: 11.0% |
| INSURANCE: 4.2% |
St. Paul Travelers Companies, Inc. | | 5,632,200 | | | 208,785,654 |
Loews Corp. | | 2,241,300 | | | 157,563,390 |
Chubb Corp. | | 1,784,512 | | | 137,228,973 |
Torchmark Corp. | | 1,751,500 | | | 100,080,710 |
Safeco Corp. | | 1,800,000 | | | 94,032,000 |
Genworth Financial, Inc. Class A | | 2,570,000 | | | 69,390,000 |
UnumProvident Corp. | | 3,795,000 | | | 68,082,300 |
MBIA, Inc. | | 562,750 | | | 35,610,820 |
| | | | |
|
|
| | | | | | 870,773,847 |
| DIVERSIFIED FINANCIALS: 2.9% |
Capital One Financial Corp. | | 3,100,200 | | | 261,067,842 |
JPMorgan Chase & Co. | | 5,268,516 | | | 205,524,809 |
CIT Group, Inc. | | 2,860,200 | | | 131,054,364 |
| | | | |
|
|
| | | | | | 597,647,015 |
| | | | | |
| | |
| | | SHARES | | MARKET VALUE |
| BANKS: 2.5% |
Wachovia Corp. | | 4,409,100 | | $ | 231,918,660 |
Golden West Financial Corp. | | 3,025,400 | | | 185,820,068 |
Wells Fargo & Co. | | 1,560,750 | | | 97,000,613 |
| | | | |
|
|
| | | | | | 514,739,341 |
| REAL ESTATE: 1.4% |
Equity Office Properties Trust | | 6,534,800 | | | 190,293,376 |
Equity Residential Properties Trust | | 2,900,600 | | | 104,943,708 |
| | | | |
|
|
| | | | | | 295,237,084 |
| | | | |
|
|
| | | | | | 2,278,397,287 |
| HEALTH CARE: 8.4% | | | | | |
| HEALTH CARE EQUIPMENT & SERVICES: 4.5% |
HCA, Inc. | | 7,795,100 | | | 311,492,196 |
Cardinal Health, Inc. | | 5,325,700 | | | 309,689,455 |
Wellpoint, Inc.(a) | | 1,250,400 | | | 143,796,000 |
Thermo Electron Corp.(a) | | 2,955,550 | | | 89,228,054 |
Becton, Dickinson & Co. | | 1,317,800 | | | 74,851,040 |
| | | | |
|
|
| | | | | | 929,056,745 |
| PHARMACEUTICALS & BIOTECHNOLOGY: 3.9% |
Schering-Plough Corp. | | 12,101,150 | | | 252,672,012 |
Pfizer, Inc. | | 7,185,492 | | | 193,217,880 |
GlaxoSmithKline PLC ADR(b)
(United Kingdom) | | 3,875,000 | | | 183,636,250 |
Wyeth | | 2,966,500 | | | 126,343,235 |
Bristol-Myers Squibb Co. | | 2,189,450 | | | 56,093,709 |
| | | | |
|
|
| | | | | | 811,963,086 |
| | | | |
|
|
| | | | | | 1,741,019,831 |
| INFORMATION TECHNOLOGY: 7.3% | | | | | |
| TECHNOLOGY HARDWARE & EQUIPMENT: 4.7% |
Hewlett-Packard Co. | | 17,999,155 | | | 377,442,280 |
Xerox Corp.(a) | | 15,102,150 | | | 256,887,572 |
Storage Technology Corp.(a) | | 2,742,200 | | | 86,680,942 |
NCR Corp.(a) | | 1,115,825 | | | 77,248,565 |
Motorola, Inc. | | 4,252,500 | | | 73,143,000 |
Avaya, Inc.(a) | | 3,292,850 | | | 56,637,020 |
Freescale Semiconductor, Inc. Class A | | 1,800,000 | | | 32,076,000 |
Freescale Semiconductor, Inc. Class B | | 469,539 | | | 8,620,736 |
| | | | |
|
|
| | | | | | 968,736,115 |
| SOFTWARE & SERVICES: 2.6% |
Computer Sciences Corp.(a) | | 3,916,000 | | | 220,744,920 |
Electronic Data Systems Corp. | | 8,982,600 | | | 207,498,060 |
BMC Software, Inc.(a) | | 4,124,700 | | | 76,719,420 |
Compuware Corp.(a) | | 6,937,800 | | | 44,887,566 |
| | | | |
|
|
| | | | | | 549,849,966 |
| | | | |
|
|
| | | | | | 1,518,586,081 |
| ENERGY: 5.2% | | | | | |
ChevronTexaco Corp. | | 3,842,616 | | | 201,775,766 |
Shell Transport & Trading Co. PLC ADR(b) (United Kingdom) | | 3,615,000 | | | 185,811,000 |
| | |
| 5 / Dodge & Cox Balanced Fund | | See accompanying Notes to Financial Statements |
Portfolio of Investments | December 31, 2004 |
| | | | | |
| COMMON STOCKS (continued) |
| | |
| | | SHARES | | MARKET VALUE |
| ENERGY (continued) |
Unocal Corp. | | 3,541,700 | | $ | 153,143,108 |
ConocoPhillips | | 1,683,100 | | | 146,143,573 |
Baker Hughes, Inc. | | 2,984,100 | | | 127,331,547 |
Occidental Petroleum Corp. | | 1,854,900 | | | 108,251,964 |
Amerada Hess Corp. | | 1,293,600 | | | 106,566,768 |
Schlumberger Ltd.(b) (Netherlands Antilles) | | 827,600 | | | 55,407,820 |
| | | | |
|
|
| | | | | | 1,084,431,546 |
| MATERIALS: 5.2% | | | | | |
| CHEMICALS: 3.9% | | | | | |
Dow Chemical Co. | | 5,528,159 | | | 273,699,152 |
Akzo Nobel N.V. ADR(b) (Netherlands) | | 5,557,451 | | | 236,136,093 |
Rohm and Haas Co. | | 2,102,600 | | | 92,997,998 |
Syngenta A.G. ADR(b) (Switzerland) | | 3,434,000 | | | 73,315,900 |
NOVA Chemicals Corp.(b) (Canada) | | 1,442,720 | | | 68,240,656 |
Engelhard Corp. | | 1,654,300 | | | 50,737,381 |
Lubrizol Corp. | | 321,400 | | | 11,846,804 |
Bayer A.G. ADR(b) (Germany) | | 39,500 | | | 1,342,210 |
| | | | |
|
|
| | | | | | 808,316,194 |
| METALS AND MINING: 1.0% | | | | | |
Rio Tinto PLC ADR(b) (United Kingdom) | | 1,455,400 | | | 173,498,234 |
Alcoa, Inc. | | 1,115,550 | | | 35,050,581 |
| | | | |
|
|
| | | | | | 208,548,815 |
| PAPER AND FOREST PRODUCTS: 0.3% | | | | | |
International Paper Co. | | 1,267,800 | | | 53,247,600 |
| | | | |
|
|
| | | | | | 1,070,112,609 |
| INDUSTRIALS: 4.1% | | | | | |
| TRANSPORTATION: 2.2% | | | | | |
Union Pacific Corp. | | 4,153,400 | | | 279,316,150 |
Fedex Corp. | | 1,730,150 | | | 170,402,474 |
| | | | |
|
|
| | | | | | 449,718,624 |
| CAPITAL GOODS: 1.1% | | | | | |
Fluor Corp. | | 1,840,300 | | | 100,314,753 |
Masco Corp. | | 2,458,700 | | | 89,816,311 |
Volvo A.B. ADR(b) (Sweden) | | 1,029,500 | | | 40,819,675 |
| | | | |
|
|
| | | | | | 230,950,739 |
| COMMERCIAL SERVICES & SUPPLIES: 0.7% | | | | | |
R.R. Donnelley & Sons Co. | | 2,036,500 | | | 71,868,085 |
Pitney Bowes, Inc. | | 1,503,150 | | | 69,565,782 |
| | | | |
|
|
| | | | | | 141,433,867 |
| ELECTRONIC EQUIPMENT & INSTRUMENTS: 0.1% | | | |
American Power Conversion Corp. | | 1,475,500 | | | 31,575,700 |
| | | | |
|
|
| | | | | | 853,678,930 |
| UTILITIES: 1.9% | | | | | |
Duke Energy Corp. | | 8,452,500 | | | 214,101,825 |
American Electric Power Co., Inc. | | 2,518,880 | | | 86,498,339 |
FirstEnergy Corp. | | 1,300,000 | | | 51,363,000 |
Scottish Power PLC ADR(b)
(United Kingdom) | | 1,357,300 | | | 42,293,468 |
| | | | |
|
|
| | | | | | 394,256,632 |
| | | | | | |
| | |
| | | SHARES | | MARKET VALUE |
| TELECOMMUNICATION SERVICES: 1.7% | | | |
AT&T Corp | | | 14,718,280 | | $ | 280,530,417 |
Vodafone Group PLC ADR(b)
(United Kingdom) | | | 2,400,000 | | | 65,712,000 |
| | | | | |
|
|
| | | | | | | 346,242,417 |
| CONSUMER STAPLES: 1.2% | | | | | | |
| FOOD, BEVERAGE AND TOBACCO: 1.2% | | | |
Unilever N.V.(b) (Netherlands) | | | 3,730,000 | | | 248,828,300 |
| | | | | |
|
|
| | | | | | | 248,828,300 |
| | | | | |
|
|
Total Common Stocks (Cost $8,885,674,291) | | | 12,284,207,340 |
| | | | | |
|
|
| |
| FIXED-INCOME SECURITIES: 32.2% | | |
| | |
| | | PAR VALUE | | MARKET VALUE |
| U.S. TREASURY AND GOVERNMENT AGENCY: 9.5% |
| U.S. TREASURY: 8.8% | | | | | | |
U.S. Treasury Notes | | | | | | |
1.625%, 1/31/05 | | $ | 350,000,000 | | $ | 349,945,400 |
1.625%, 3/31/05 | | | 50,000,000 | | | 49,921,900 |
1.625%, 4/30/05 | | | 350,000,000 | | | 349,138,650 |
2.00%, 8/31/05 | | | 350,000,000 | | | 348,632,900 |
1.875%, 11/30/05 | | | 250,000,000 | | | 248,047,000 |
1.875%, 1/31/06 | | | 175,000,000 | | | 173,318,425 |
2.25%, 4/30/06 | | | 300,000,000 | | | 297,515,700 |
3.50%, 11/15/06 | | | 8,500,000 | | | 8,571,723 |
| | | | | |
|
|
| | | | | | | 1,825,091,698 |
| GOVERNMENT AGENCY: 0.7% | | | | | | |
Arkansas Dev. Fin. Auth. GNMA Guaranteed Bonds, 9.75%, 11/15/14 | | | 4,935,000 | | | 5,917,065 |
Small Business Administration (504) Series 00-20D, 7.47%, 4/1/20 | | | 21,583,720 | | | 23,960,906 |
Series 00-20E, 8.03%, 5/1/20 | | | 8,257,563 | | | 9,318,567 |
Series 00-20G, 7.39%, 7/1/20 | | | 15,099,138 | | | 16,633,576 |
Series 00-20I, 7.21%, 9/1/20 | | | 8,382,087 | | | 9,253,869 |
Series 01-20G, 6.625%, 7/1/21 | | | 13,411,063 | | | 14,565,140 |
Series 03-20J, 4.92%, 10/1/23 | | | 25,020,822 | | | 25,313,177 |
Series 96-20L, 6.70%, 12/1/16 | | | 3,779,267 | | | 4,014,044 |
Series 97-20F, 7.20%, 6/1/17 | | | 6,169,881 | | | 6,641,138 |
Series 97-20I, 6.90%, 9/1/17 | | | 8,538,396 | | | 9,143,747 |
Series 98-20D, 6.15%, 4/1/18 | | | 9,677,786 | | | 10,219,742 |
Series 98-20I, 6.00%, 9/1/18 | | | 5,134,945 | | | 5,410,210 |
Series 99-20F, 6.80%, 6/1/19 | | | 7,129,418 | | | 7,721,303 |
| | | | | |
|
|
| | | | | | | 148,112,484 |
| | | | | |
|
|
| | | | | | | 1,973,204,182 |
| MORTGAGE-RELATED SECURITIES: 13.2% | | | |
| FEDERAL AGENCY CMO AND REMIC(c): 1.4% | | | |
Fannie Mae | | | | | | |
Trust (GN) 1994-13J, 7.00%, 6/17/22 | | | 3,688,716 | | | 3,776,541 |
SMBS I-1, 6.50%, 4/1/09 | | | 118,386 | | | 119,883 |
| | |
| See accompanying Notes to Financial Statements | | Dodge & Cox Balanced Fund / 6 |
Portfolio of Investments | December 31, 2004 |
| | | | | | |
| FIXED-INCOME SECURITIES (continued) | | |
| | |
| | | PAR VALUE | | MARKET VALUE |
Fannie Mae (continued) | | | | | | |
SMBS L-1, 5.00%, 1/1/06 | | $ | 181,611 | | $ | 181,954 |
Trust 1992-4H, 7.50%, 2/25/07 | | | 1,392,079 | | | 1,428,246 |
Trust 2001-69 OD, 5.50%, 11/25/13 | | | 5,262,251 | | | 5,277,969 |
Trust 2001-T7 A1, 7.50%, 2/25/41 | | | 10,781,838 | | | 11,542,906 |
Trust 2001-T8 A1, 7.50%, 7/25/41 | | | 11,818,395 | | | 12,641,319 |
Trust 2001-W3 A, 7.00%, 9/25/41 | | | 4,799,390 | | | 5,054,772 |
Trust 2002-33 A1, 7.00%, 6/25/32 | | | 10,946,682 | | | 11,572,668 |
Trust 2002-W6 2A1, 7.00%, 6/25/42 | | | 11,149,311 | | | 11,741,728 |
Trust 2002-W8 A2, 7.00%, 6/25/42 | | | 11,894,800 | | | 12,604,741 |
Trust 2003-W2 1A1, 6.50%, 7/25/42 | | | 24,322,056 | | | 25,431,749 |
Trust 2003-W2 1A2, 7.00%, 7/25/42 | | | 10,344,116 | | | 10,961,504 |
Trust 2003-W4 4A, 7.50%, 10/25/42 | | | 14,875,731 | | | 15,957,361 |
Trust 2004-W2 5A, 7.50%, 3/25/44 | | | 56,495,619 | | | 60,474,283 |
Freddie Mac | | | | | | |
Series (GN) 16 PK, 7.00%, 8/25/23 | | | 25,190,493 | | | 26,449,005 |
Series 1078 GZ, 6.50%, 5/15/21 | | | 2,161,135 | | | 2,158,755 |
Series 1236 H, 7.25%, 4/15/07 | | | 1,723,694 | | | 1,722,597 |
Series 1512 I, 6.50%, 5/15/08 | | | 3,817,821 | | | 3,925,321 |
Series 1539 PL, 6.50%, 5/15/08 | | | 2,873,083 | | | 2,932,531 |
Series 1655 HB, 6.50%, 10/15/08 | | | 5,574,709 | | | 5,632,740 |
Series 2100 GS, 6.50%, 12/15/13 | | | 17,562,998 | | | 18,397,299 |
Series 2366 MG, 6.00%, 12/15/14 | | | 987,567 | | | 987,460 |
Series 2386 LG, 5.50%, 2/15/14 | | | 797,402 | | | 798,759 |
Series 2430 UC, 6.00%, 9/15/16 | | | 31,672,498 | | | 32,624,180 |
Dept. of Veterans Affairs | | | | | | |
Trust 1995 1A-1, 7.219%, 2/15/25 | | | 2,082,910 | | | 2,237,138 |
Trust 1995-2C 3A, 8.792%, 6/15/25 | | | 1,263,844 | | | 1,388,319 |
| | | | | |
|
|
| | | | | | | 288,021,728 |
| FEDERAL AGENCY MORTGAGE PASS-THROUGH: 11.8% |
Fannie Mae Multifamily DUS | | | | | | |
Pool 323350, 5.607%, 11/1/08 | | | 3,513,274 | | | 3,688,506 |
Pool 323492, 6.041%, 1/1/09 | | | 8,174,397 | | | 8,705,754 |
Pool 380735, 5.965%, 10/1/08 | | | 20,885,777 | | | 22,121,186 |
Pool 381130, 5.57%, 1/1/06 | | | 5,943,595 | | | 6,002,830 |
Pool 545387, 5.863%, 1/1/12 | | | 10,992,069 | | | 11,828,733 |
Pool 545685, 6.017%, 4/1/12 | | | 30,956,669 | | | 33,168,138 |
Fannie Mae | | | | | | |
Pool 107047, 8.00%, 1/1/09 | | | 266,378 | | | 279,071 |
Pool 124668, 7.50%, 7/1/19 | | | 286,557 | | | 298,520 |
Pool 169231, 7.50%, 8/1/10 | | | 181,430 | | | 191,633 |
Pool 303787 15 Year, 6.50%, 3/1/11 | | | 1,831,736 | | | 1,944,783 |
Pool 313524 15 Year, 6.50%, 6/1/11 | | | 7,048,853 | | | 7,483,881 |
Pool 313958 15 Year, 6.50%, 1/1/13 | | | 4,423,829 | | | 4,695,323 |
Pool 323531 15 Year, 6.50%, 1/1/13 | | | 4,083,491 | | | 4,336,277 |
Pool 323623 15 Year, 6.00%, 3/1/14 | | | 8,739,937 | | | 9,177,858 |
Pool 362446 15 Year, 7.00%, 12/1/07 | | | 1,257,123 | | | 1,307,969 |
Pool 44047 15 Year, 7.00%, 12/1/07 | | | 792,637 | | | 817,923 |
Pool 50973 15 Year, 6.00%, 1/1/09 | | | 1,244,914 | | | 1,296,437 |
Pool 535493 15 Year, 7.50%, 9/1/15 | | | 5,946,555 | | | 6,314,159 |
Pool 535672 15 Year, 6.00%, 1/1/16 | | | 5,798,329 | | | 6,086,823 |
Pool 535691 15 Year, 7.50%, 1/1/16 | | | 4,504,163 | | | 4,782,602 |
Pool 535849 15 Year, 7.00%, 7/1/11 | | | 1,342,600 | | | 1,396,903 |
| | | | | | |
| | |
| | | PAR VALUE | | MARKET VALUE |
Fannie Mae (continued) | | | | | | |
Pool 535863 15 Year, 6.00%, 3/1/16 | | $ | 6,949,930 | | $ | 7,295,722 |
Pool 545033 15 Year, 7.50%, 12/1/15 | | | 10,950,282 | | | 11,627,207 |
Pool 545058 15 Year, 6.50%, 8/1/11 | | | 4,523,304 | | | 4,802,466 |
Pool 545302 15 Year, 5.50%, 11/1/16 | | | 24,149,603 | | | 24,998,406 |
Pool 545343 15 Year, 7.50%, 12/1/16 | | | 6,769,238 | | | 7,187,699 |
Pool 545348 15 Year, 5.50%, 12/1/16 | | | 10,377,600 | | | 10,742,348 |
Pool 545469 15 Year, 6.50%, 8/1/15 | | | 3,383,041 | | | 3,590,156 |
Pool 545705 15 Year, 6.50%, 6/1/17 | | | 30,571,613 | | | 32,424,329 |
Pool 545833 15 Year, 6.00%, 7/1/17 | | | 30,170,745 | | | 31,634,914 |
Pool 545961 15 Year, 5.50%, 2/1/14 | | | 14,465,391 | | | 14,990,867 |
Pool 545977 15 Year, 5.50%, 8/1/15 | | | 14,951,847 | | | 15,494,994 |
Pool 555066 15 Year, 5.50%, 9/1/14 | | | 18,871,683 | | | 19,557,224 |
Pool 555243 15 Year, 6.00%, 3/1/17 | | | 8,175,304 | | | 8,584,933 |
Pool 555364 15 Year, 6.00%, 3/1/18 | | | 13,456,783 | | | 14,109,074 |
Pool 555382 15 Year, 5.50%, 8/1/15 | | | 10,180,909 | | | 10,550,744 |
Pool 555439 15 Year, 6.00%, 3/1/18 | | | 12,322,690 | | | 12,920,009 |
Pool 555603 15 Year, 6.00%, 5/1/18 | | | 31,834,556 | | | 33,377,675 |
Pool 555803 20 Year, 6.50%, 1/1/22 | | | 17,998,801 | | | 19,025,141 |
Pool 555881 15 Year, 6.00%, 3/1/14 | | | 22,134,212 | | | 23,195,663 |
Pool 555931 15 Year, 6.00%, 5/1/18 | | | 14,035,016 | | | 14,716,127 |
Pool 555961 15 Year, 6.00%, 3/1/18 | | | 11,601,599 | | | 12,164,618 |
Pool 589416 15 Year, 6.00%, 7/1/16 | | | 6,893,022 | | | 7,227,536 |
Pool 629568 10 Year, 6.00%, 1/1/12 | | | 16,098,987 | | | 16,865,772 |
Pool 634364 10 Year, 6.00%, 3/1/12 | | | 16,619,509 | | | 17,411,516 |
Pool 638431 10 Year, 6.00%, 3/1/12 | | | 13,309,109 | | | 13,943,702 |
Pool 643517 10 Year, 6.00%, 4/1/12 | | | 11,682,559 | | | 12,239,898 |
Pool 70255 15 Year, 7.50%, 9/1/07 | | | 493,543 | | | 511,195 |
Pool 725058 15 Year, 5.50%, 4/1/18 | | | 31,580,171 | | | 32,690,141 |
Pool 725073 15 Year, 5.50%, 6/1/18 | | | 34,774,106 | | | 35,996,335 |
Pool 725074 15 Year, 6.50%, 11/1/18 | | | 28,530,255 | | | 30,259,259 |
Pool 725135 15 Year, 6.00%, 5/1/18 | | | 18,512,043 | | | 19,410,422 |
Pool 725160 15 Year, 6.50%, 4/1/18 | | | 37,582,507 | | | 39,860,101 |
Pool 725172 15 Year, 6.00%, 12/1/17 | | | 26,782,127 | | | 28,130,814 |
Pool 725194 15 Year, 6.00%, 12/1/18 | | | 4,012,782 | | | 4,207,520 |
Pool 725224 15 Year, 6.50%, 3/1/16 | | | 12,390,007 | | | 13,154,672 |
Pool 725225 15 Year, 6.00%, 6/1/17 | | | 83,117,969 | | | 87,103,911 |
Pool 725226 15 Year, 6.50%, 7/1/18 | | | 89,522,482 | | | 94,947,768 |
Pool 725240 15 Year, 6.00%, 3/1/18 | | | 15,370,129 | | | 16,116,033 |
Pool 725255 15 Year, 6.00%, 3/1/16 | | | 50,559,859 | | | 53,105,938 |
Pool 725273 15 Year, 6.00%, 12/1/15 | | | 70,179,456 | | | 73,713,533 |
Pool 725336 15 Year, 6.00%, 4/1/16 | | | 11,043,917 | | | 11,597,280 |
Pool 725343 15 Year, 6.50%, 12/1/14 | | | 26,796,588 | | | 28,441,119 |
Pool 725344 15 Year, 6.50%, 12/1/14 | | | 35,690,798 | | | 37,881,175 |
Pool 725354 15 Year, 6.50%, 10/1/18 | | | 25,168,791 | | | 26,709,664 |
Pool 725432 15 Year, 7.00%, 11/1/18 | | | 46,439,957 | | | 49,238,068 |
Pool 725513 15 Year, 6.00%, 12/1/18 | | | 81,571,432 | | | 85,658,622 |
Pool 725514 15 Year, 6.00%, 5/1/16 | | | 67,113,916 | | | 70,476,703 |
Pool 725518 15 Year, 7.50%, 8/1/17 | | | 100,746,397 | | | 106,981,293 |
Pool 725574 15 Year, 6.50%, 7/1/15 | | | 20,502,722 | | | 21,768,765 |
Pool 725679 15 Year, 6.00%, 6/1/17 | | | 25,357,865 | | | 26,630,391 |
Pool 725729 15 Year, 6.00%, 12/1/16 | | | 25,803,897 | | | 27,103,323 |
Pool 725790 15 Year, 6.00%, 11/1/17 | | | 21,067,098 | | | 22,122,679 |
Pool 725860 15 Year, 5.50%, 7/1/16 | | | 75,573,218 | | | 78,312,881 |
| | |
| 7 / Dodge & Cox Balanced Fund | | See accompanying Notes to Financial Statements |
Portfolio of Investments | December 31, 2004 |
| | | | | | |
| FIXED-INCOME SECURITIES (continued) | | |
| | |
| | | PAR VALUE | | MARKET VALUE |
Fannie Mae (continued) | | | | | | |
Pool 725862 15 Year, 6.00%, 8/1/17 | | $ | 17,207,869 | | $ | 18,074,418 |
Pool 725868 15 Year, 6.50%, 9/1/16 | | | 42,544,376 | | | 45,171,490 |
Pool 725952 15 Year, 6.00%, 12/1/13 | | | 59,144,102 | | | 62,122,464 |
Pool 735005 10 Year, 6.00%, 10/1/14 | | | 15,112,808 | | | 15,859,594 |
Pool 786844 15 Year, 6.50%, 9/1/16 | | | 20,511,610 | | | 21,770,290 |
Freddie Mac Gold | | | | | | |
Group (GN) G80063 15 Year, 7.75%, 7/25/21 | | | 2,120,880 | | | 2,291,443 |
Group (GN) G80126 15 Year,
7.47%, 3/17/23 | | | 723,199 | | | 776,541 |
Group D64097 15 Year, 8.50%, 1/1/23 | | | 600,770 | | | 636,667 |
Group E00210 15 Year, 7.00%, 5/1/08 | | | 1,969,368 | | | 2,060,556 |
Group E00573 15 Year, 6.00%, 10/1/13 | | | 7,002,033 | | | 7,344,951 |
Group E00659 15 Year, 6.00%, 4/1/14 | | | 24,664,703 | | | 25,872,633 |
Group E61328 15 Year, 7.00%, 8/1/09 | | | 2,142,239 | | | 2,250,629 |
Group E78398 15 Year, 6.50%, 7/1/14 | | | 7,409,787 | | | 7,853,731 |
Group G10288 15 Year, 6.00%, 9/1/09 | | | 2,909,624 | | | 3,003,363 |
Group G10569 15 Year, 7.00%, 12/1/08 | | | 2,857,272 | | | 2,993,725 |
Group G10721 15 Year, 6.00%, 9/1/12 | | | 4,849,533 | | | 5,088,767 |
Group G11122 15 Year, 6.50%, 5/1/16 | | | 11,042,310 | | | 11,697,383 |
Group G11152 15 Year, 7.00%, 4/1/15 | | | 1,559,019 | | | 1,645,122 |
Group G11265 15 Year, 6.00%, 9/1/15 | | | 5,515,095 | | | 5,785,186 |
Group G11281 15 Year, 6.00%, 5/1/16 | | | 6,931,201 | | | 7,271,895 |
Group G11323 15 Year, 6.50%, 8/1/17 | | | 12,019,685 | | | 12,728,160 |
Group G11334 15 Year, 6.50%, 11/1/17 | | | 14,009,858 | | | 14,840,977 |
Group G11346 15 Year, 6.50%, 3/1/17 | | | 18,743,362 | | | 19,848,151 |
Group G11409 15 Year, 6.00%, 5/1/17 | | | 35,698,997 | | | 37,392,707 |
Group G11421 15 Year, 6.50%, 12/1/17 | | | 19,795,021 | | | 20,961,798 |
Group G11431 15 Year, 6.00%, 2/1/18 | | | 28,099,537 | | | 29,432,697 |
Group G11459 15 Year, 6.50%, 8/1/17 | | | 5,382,019 | | | 5,699,251 |
Group G11465 15 Year, 6.50%, 9/1/18 | | | 9,574,850 | | | 10,139,219 |
Group G11477 15 Year, 5.50%, 8/1/14 | | | 32,383,162 | | | 33,532,719 |
Group G11498 15 Year, 6.50%, 3/1/18 | | | 18,700,296 | | | 19,802,546 |
Group G11572 15 Year, 6.00%, 10/1/14 | | | 25,320,046 | | | 26,570,016 |
Group G11589 15 Year, 6.00%, 10/1/18 | | | 22,064,626 | | | 23,153,886 |
Group G11593 15 Year, 6.00%, 6/1/16 | | | 90,296,349 | | | 94,718,527 |
Group G11608 15 Year, 5.50%, 1/1/17 | | | 33,979,730 | | | 35,185,963 |
Group G11610 15 Year, 6.00%, 10/1/16 | | | 64,224,660 | | | 67,370,002 |
Group G11612 15 Year, 6.00%, 4/1/14 | | | 27,038,131 | | | 28,366,956 |
Group P60086 15 Year, 6.50%, 11/1/14 | | | 34,191,327 | | | 35,772,676 |
Freddie Mac | | | | | | |
Group 18-0468, 8.00%, 2/1/08 | | | 114,479 | | | 118,720 |
Group 25-3827, 7.50%, 2/1/08 | | | 5,056 | | | 5,191 |
Group 27-2784, 7.25%, 1/1/08 | | | 685 | | | 702 |
Group 30-9878, 8.75%, 5/1/10 | | | 74,760 | | | 80,202 |
Group 55-5062, 8.00%, 11/1/10 | | | 489,801 | | | 509,497 |
Group 55-5098, 8.25%, 2/1/17 | | | 64,225 | | | 68,012 |
Ginnie Mae | | | | | | |
Pool 288558, 7.97%, 4/15/20 | | | 748,273 | | | 808,974 |
Pool 288564, 7.97%, 5/15/20 | | | 600,111 | | | 656,576 |
Pool 294442, 7.97%, 8/15/20 | | | 428,830 | | | 469,199 |
Pool 294443, 7.97%, 8/15/20 | | | 644,076 | | | 704,655 |
Pool 299080, 7.97%, 10/15/20 | | | 739,913 | | | 799,147 |
| | | | | | |
| | |
| | | PAR VALUE | | MARKET VALUE |
Ginnie Mae (continued) | | | | | | |
Pool 299084, 7.97%, 1/15/21 | | $ | 627,025 | | $ | 676,644 |
Pool 780729, 7.50%, 1/15/08 | | | 1,803,657 | | | 1,858,817 |
Pool 781321, 7.50%, 11/15/24 | | | 6,446,671 | | | 6,973,528 |
Pool 781322, 7.50%, 10/15/25 | | | 3,205,479 | | | 3,466,435 |
| | | | | |
|
|
| | | | | | | 2,441,017,052 |
| PRIVATE LABEL CMO & REMIC SECURITIES(c): 0.0% | | | |
Union Planters Mortgage Finance Corp., 7.70%, 12/25/24 | | | 8,216,463 | | | 8,688,950 |
| | | | | |
|
|
| | | | | | | 2,737,727,730 |
| CORPORATE: 9.5% | | | | | | |
| INDUSTRIALS: 6.9% | | | | | | |
AT&T Corp.
9.05%, 11/15/11 | | | 71,654,000 | | | 82,491,667 |
9.75%, 11/15/31 | | | 97,500,000 | | | 116,390,625 |
Amerada Hess Corp.
6.65%, 8/15/11 | | | 19,000,000 | | | 20,893,825 |
7.875%, 10/1/29 | | | 26,780,000 | | | 31,686,257 |
Cardinal Health, Inc.
6.75%, 2/15/11 | | | 5,000,000 | | | 5,500,210 |
4.00%, 6/15/15 | | | 6,475,000 | | | 5,768,040 |
Comcast Corp., 5.30%, 1/15/14 | | | 85,510,000 | | | 88,187,660 |
Dillard’s, Inc.
7.375%, 6/1/06 | | | 25,275,000 | | | 26,475,563 |
7.13%, 8/1/18 | | | 3,500,000 | | | 3,526,250 |
Dow Chemical Co.
4.027%, 9/30/09(g) | | | 24,425,000 | | | 23,853,064 |
6.00%, 10/1/12 | | | 5,750,000 | | | 6,282,140 |
7.375%, 11/1/29 | | | 30,170,000 | | | 36,604,748 |
Electronic Data Systems Corp., 6.50%, 8/1/13 | | | 29,785,000 | | | 31,449,713 |
Ford Motor Credit Co.
7.375%, 2/1/11 | | | 37,810,000 | | | 40,749,765 |
7.25%, 10/25/11 | | | 105,250,000 | | | 112,872,837 |
GMAC
7.75%, 1/19/10 | | | 12,750,000 | | | 13,684,779 |
8.875%, 6/1/10, Putable 2005 | | | 35,630,000 | | | 40,196,661 |
6.875%, 9/15/11 | | | 80,000,000 | | | 81,983,440 |
HCA, Inc.
8.75%, 9/1/10 | | | 27,750,000 | | | 31,720,609 |
7.875%, 2/1/11 | | | 23,798,000 | | | 26,213,521 |
6.95%, 5/1/12 | | | 10,000,000 | | | 10,529,050 |
6.25%, 2/15/13 | | | 27,250,000 | | | 27,488,928 |
6.75%, 7/15/13 | | | 16,250,000 | | | 16,889,031 |
5.75%, 3/15/14 | | | 11,685,000 | | | 11,319,528 |
Hewlett-Packard Co., 5.50%, 7/1/07 | | | 21,185,000 | | | 22,093,201 |
International Paper Co., 5.25%, 4/1/16 | | | 24,500,000 | | | 24,456,758 |
Lockheed Martin Corp.
7.65%, 5/1/16 | | | 18,500,000 | | | 22,666,810 |
7.75%, 5/1/26 | | | 8,500,000 | | | 10,695,040 |
May Department Stores Co.
7.625%, 8/15/13 | | | 5,900,000 | | | 6,849,499 |
7.45%, 10/15/16 | | | 11,350,000 | | | 12,997,135 |
| | |
| See accompanying Notes to Financial Statements | | Dodge & Cox Balanced Fund / 8 |
Portfolio of Investments | December 31, 2004 |
| | | | | | |
| FIXED-INCOME SECURITIES (continued) | | |
| | |
| | | PAR VALUE | | MARKET VALUE |
| INDUSTRIALS (continued) |
May Department Stores Co. (continued) | | | | | | |
7.875%, 3/1/30 | | $ | 8,240,000 | | $ | 9,781,712 |
6.90%, 1/15/32 | | | 54,484,000 | | | 58,921,994 |
6.70%, 7/15/34 | | | 20,000,000 | | | 21,038,220 |
8.125%, 8/15/35, Callable 2015 | | | 16,000,000 | | | 18,384,848 |
7.875%, 8/15/36, Callable 2016 | | | 10,440,000 | | | 11,828,123 |
Raytheon Co., 6.75%, 8/15/07 | | | 20,447,000 | | | 22,027,696 |
Time Warner Entertainment, 8.375%, 7/15/33 | | | 40,950,000 | | | 52,904,165 |
Time Warner, Inc. (TimeWarner AOL)(f)
7.625%, 4/15/31 | | | 71,000,000 | | | 85,893,031 |
7.70%, 5/1/32 | | | 22,575,000 | | | 27,611,889 |
Wyeth
5.50%, 3/15/13 | | | 24,500,000 | | | 25,463,414 |
5.50%, 2/1/14 | | | 71,665,000 | | | 74,143,749 |
Wyeth (American Home Products)(f),
6.95%, 3/15/11 | | | 17,000,000 | | | 19,141,337 |
Xerox Corp., 7.20%, 4/1/16 | | | 10,000,000 | | | 10,700,000 |
| | | | | |
|
|
| | | | | | | 1,430,356,532 |
| FINANCIALS: 2.2% | | | | | | |
BankAmerica Capital II(d), 8.00%, 12/15/26, Callable 2006 | | | 14,550,000 | | | 15,953,086 |
Boston Properties, Inc.
6.25%, 1/15/13 | | | 28,634,000 | | | 31,066,143 |
5.625%, 4/15/15 | | | 26,000,000 | | | 26,800,046 |
CIGNA Corp.
7.00%, 1/15/11 | | | 14,705,000 | | | 16,433,176 |
6.375%, 10/15/11 | | | 17,820,000 | | | 19,399,084 |
7.65%, 3/1/23 | | | 9,745,000 | | | 11,325,551 |
7.875%, 5/15/27 | | | 12,157,000 | | | 14,736,910 |
8.30%, 1/15/33, Step Coupon | | | 9,050,000 | | | 11,341,107 |
CIT Group, Inc.
7.375%, 4/2/07 | | | 6,000,000 | | | 6,478,512 |
5.75%, 9/25/07 | | | 7,500,000 | | | 7,884,412 |
Citicorp Capital Trust I(d), 7.933%, 2/15/27, Callable 2007 | | | 12,480,000 | | | 13,742,627 |
Citigroup, Inc. (First Nationwide)(f),
10.00%, 10/1/06 | | | 4,945,000 | | | 5,461,278 |
EOP Operating Limited Partnership(e) 7.00%, 7/15/11 | | | 25,340,000 | | | 28,577,007 |
6.75%, 2/15/12 | | | 19,933,000 | | | 22,189,276 |
5.875%, 1/15/13 | | | 26,715,000 | | | 28,236,847 |
4.75%, 3/15/14 | | | 15,000,000 | | | 14,510,535 |
Health Net, Inc., 9.875%, 4/15/11 | | | 37,280,000 | | | 44,973,436 |
JPMorgan Chase (Bank One)(f), 6.50%, 2/1/06 | | | 12,275,000 | | | 12,706,724 |
JPMorgan Chase Capital III (Bank One)(d, f), 8.75%, 9/1/30 | | | 23,760,000 | | | 32,163,342 |
Safeco Corp., 7.25%, 9/1/12 | | | 12,479,000 | | | 14,244,379 |
St. Paul Travelers Companies, Inc.,
8.125%, 4/15/10 | | | 19,885,000 | | | 23,225,143 |
UnumProvident Corp.
7.625%, 3/1/11 | | | 21,150,000 | | | 22,154,625 |
7.19%, 2/1/28 | | | 6,000,000 | | | 5,350,008 |
| | | | | | | |
| | |
| | | PAR VALUE | | | MARKET VALUE |
UnumProvident Corp. (continued) | | | | | | | |
6.75%, 12/15/28 | | $ | 21,495,000 | | | $ | 19,399,237 |
7.375%, 6/15/32 | | | 4,795,000 | | | | 4,585,219 |
UnumProvident Corp. (Provident Companies, Inc.)(f), 7.25%, 3/15/28 | | | 7,520,000 | | | | 7,115,800 |
| | | | | | |
|
|
| | | | | | | | 460,053,510 |
| TRANSPORTATION: 0.4% | | | | | | | |
CSX Transportation, Inc.,
9.75%, 6/15/20 | | | 5,351,000 | | | | 7,464,683 |
Consolidated Rail Corp.,
6.76%, 5/25/15, Callable 2005 | | | 4,687,141 | | | | 5,116,015 |
Federal Express, 6.72%, 1/15/22 | | | 5,993,746 | | | | 6,739,787 |
Norfolk Southern Corp., 9.75%, 6/15/20 | | | 7,389,000 | | | | 10,450,004 |
Union Pacific Corp., 6.33%, 1/2/20 | | | 41,184,644 | | | | 44,144,172 |
| | | | | | |
|
|
| | | | | | | | 73,914,661 |
| | | | | | |
|
|
| | | | | | | | 1,964,324,703 |
| | | | | | |
|
|
Total Fixed-Income Securities (Cost $6,527,459,595) | | | | 6,675,256,615 |
| | | | | | |
|
|
| |
| SHORT-TERM INVESTMENTS: 8.6% | | | |
SSgA Prime Money Market Fund | | | 103,830,851 | | | | 103,830,851 |
State Street Repurchase Agreement, 1.40%,1/3/05, maturity value $304,614,534 (collateralized by
U.S. Treasury Securities, value $310,693,348, 2.625%–8.125%, 7/31/06–8/15/19) | | | 304,579,000 | | | | 304,579,000 |
U.S. Treasury Bills
1/6/2005 | | | 125,000,000 | | | | 124,964,670 |
1/20/2005 | | | 300,000,000 | | | | 299,722,916 |
1/27/2005 | | | 150,000,000 | | | | 149,797,958 |
2/17/2005 | | | 200,000,000 | | | | 199,478,222 |
3/17/2005 | | | 450,000,000 | | | | 448,260,937 |
4/28/2005 | | | 150,000,000 | | | | 148,990,875 |
| | | | | | |
|
|
Total Short-Term Investments
(Cost $1,779,625,429) | | | | 1,779,625,429 |
| | | | | | |
|
|
TOTAL INVESTMENTS
(Cost $17,192,759,315) | | | 100.0 | % | | | 20,739,089,384 |
OTHER ASSETS LESS LIABILITIES | | | 0.0 | | | | 1,556,940 |
| | |
|
|
| |
|
|
TOTAL NET ASSETS | | | 100.0 | % | | $ | 20,740,646,324 |
| | |
|
|
| |
|
|
| (b) | | Foreign securities denominated in U.S. dollars |
| (c) | | CMO: Collateralized Mortgage Obligation
REMIC: Real Estate Mortgage Investment Conduit |
| (d) | | Cumulative Preferred Securities |
| (e) | | EOP Operating LP is the operating partnership of Equity Office Properties Trust |
| (f) | | When two issuers are identified, the first name refers to the acquirer or successor obligor, and the second name (within the parentheses) refers to the original issuer of the instrument. |
| (g) | | Securities exempt from registration under Rule 144A of the Securities Act of 1933. These securities may be resold in transactions exempt from registration, normally to qualified institutional buyers. As of December 31, 2004, these securities represented 0.1% of total net assets. |
| | |
| 9 / Dodge & Cox Balanced Fund | | See accompanying Notes to Financial Statements |
Statement of Assets and Liabilities
| | | |
| |
| | | December 31, 2004 |
| Assets: | | | |
Investments, at market value
(identified cost $17,192,759,315) | | $ | 20,739,089,384 |
Receivable for investments sold | | | 15,373,773 |
Receivable for paydowns on
mortgage-backed securities | | | 31,212 |
Receivable for Fund shares sold | | | 49,424,083 |
Dividends and interest receivable | | | 77,353,458 |
Prepaid expenses and other assets | | | 123,667 |
| | |
|
|
| | | | 20,881,395,577 |
| | |
|
|
| Liabilities: | | | |
Payable for investments purchased | | | 88,387,069 |
Payable for Fund shares redeemed | | | 41,951,966 |
Management fees payable | | | 8,720,015 |
Accounts payable | | | 1,690,203 |
| | |
|
|
| | | | 140,749,253 |
| | |
|
|
| Net Assets | | $ | 20,740,646,324 |
| | |
|
|
| Net Assets Consist of: | | | |
Paid in capital | | $ | 17,133,705,998 |
Accumulated undistributed
net investment income | | | 2,707,898 |
Accumulated undistributed net
realized gain on investments | | | 57,902,359 |
Net unrealized appreciation on investments | | | 3,546,330,069 |
| | |
|
|
| | | $ | 20,740,646,324 |
| | |
|
|
Fund shares outstanding (par value
$0.01 each, unlimited shares authorized) | | | 261,385,730 |
Net asset value per share | | | $79.35 |
| |
| Statement of Operations | | | |
|
Year Ended December 31, 2004 |
| Investment Income: | | | |
Dividends (net of foreign taxes of $2,723,199) | | $ | 191,172,133 |
Interest | | | 236,150,709 |
| | |
|
|
| | | | 427,322,842 |
| | |
|
|
| Expenses: | | | |
Management fees | | | 85,315,471 |
Custodian and fund accounting fees | | | 318,816 |
Transfer agent fees | | | 4,036,328 |
Professional services | | | 84,713 |
Shareholder reports | | | 879,516 |
Registration fees | | | 1,154,058 |
Trustees’ fees | | | 82,000 |
Miscellaneous | | | 136,326 |
| | |
|
|
| | | | 92,007,228 |
| | |
|
|
| Net Investment Income | | | 335,315,614 |
| | |
|
|
| Realized and Unrealized Gain on Investments: |
Net realized gain | | | 481,678,527 |
Net change in unrealized appreciation | | | 1,431,190,315 |
| | |
|
|
Net realized and unrealized gain | | | 1,912,868,842 |
| | |
|
|
| Net Increase in Net Assets from Operations | | $ | 2,248,184,456 |
| | |
|
|
Statement of Changes in Net Assets
| | | | | | | | |
| | |
| | | Year Ended December 31, 2004 | | | Year Ended December 31, 2003 | |
| | | | | | (Restated.
See Note 2) | |
| Operations: | | | | | | | | |
Net investment income | | $ | 335,315,614 | | | $ | 235,899,677 | |
Net realized gain | | | 481,678,527 | | | | 174,999,795 | |
Net change in unrealized appreciation | | | 1,431,190,315 | | | | 1,867,447,020 | |
| | |
|
|
| |
|
|
|
Net increase in net assets from operations | | | 2,248,184,456 | | | | 2,278,346,492 | |
| | |
|
|
| |
|
|
|
| | |
Distributions to
Shareholders from: | | | | | | | | |
Net investment income | | | (375,772,802 | ) | | | (251,969,056 | ) |
Net realized gain | | | (421,379,430 | ) | | | (120,968,603 | ) |
| | |
|
|
| |
|
|
|
| Total distributions | | | (797,152,232 | ) | | | (372,937,659 | ) |
| | |
|
|
| |
|
|
|
| | |
| Fund Share Transactions: | | | | | | | | |
Amounts received from
sale of shares | | | 7,695,755,433 | | | | 4,675,775,405 | |
Net asset value of shares issued in reinvestment of distributions | | | 764,041,016 | | | | 358,612,076 | |
Amounts paid for
shares redeemed | | | (2,365,810,731 | ) | | | (1,629,097,670 | ) |
| | |
|
|
| |
|
|
|
Net increase from Fund share transactions | | | 6,093,985,718 | | | | 3,405,289,811 | |
| | |
|
|
| |
|
|
|
Total increase in net assets | | | 7,545,017,942 | | | | 5,310,698,644 | |
| |
| Net Assets: | | | | | |
Beginning of year | | | 13,195,628,382 | | | | 7,884,929,738 | |
| | |
|
|
| |
|
|
|
End of year (including undistributed net investment income of $2,707,898 and
$1,393,086, respectively) | | $ | 20,740,646,324 | | | $ | 13,195,628,382 | |
| | |
|
|
| |
|
|
|
| | |
Shares sold | | | 102,173,318 | | | | 70,653,951 | |
Shares issued in
reinvestment of distributions | | | 9,851,544 | | | | 5,274,758 | |
Shares redeemed | | | (31,310,833 | ) | | | (25,059,171 | ) |
| | |
|
|
| |
|
|
|
Net increase in
shares outstanding | | | 80,714,029 | | | | 50,869,538 | |
| | |
|
|
| |
|
|
|
| | |
| See accompanying Notes to Financial Statements | | Dodge & Cox Balanced Fund / 10 |
Notes to Financial Statements
Note 1 — Organization and Significant Accounting Policies
Dodge & Cox Balanced Fund (the “Fund”) is one of the funds constituting the Dodge & Cox Funds (the “Trust”). The Trust is organized as a Delaware statutory trust and is registered under the Investment Company Act of 1940, as amended, as a diversified, open-end management investment company. The Fund commenced operations on June 26, 1931, and seeks regular income, conservation of principal and an opportunity for long-term growth of principal and income. Risk considerations and investment strategies of the Fund are discussed in the Fund’s Prospectus. The Fund is closed to new investors.
The Fund consistently follows accounting policies which are in conformity with accounting principles generally accepted in the United States of America. In preparing these financial statements, management is required to make estimates and assumptions that affect reported amounts and disclosures. Actual results could differ from those estimates. Significant accounting policies are as follows:
Security valuation. The Fund’s net assets are valued as of the close of trading on the New York Stock Exchange (the “NYSE”), generally 4:00 p.m. Eastern Time, each day that the NYSE is open for business. Stocks are valued at market, using as a price the official quoted close price or the last sale of the day at the close of the NYSE or, if not available, at the mean between the exchange listed bid and ask prices for the day. A security which is listed or traded on more than one exchange is valued at the quotation on the exchange determined to be the primary market for such security. Fixed-income securities with original maturities of one year or more are priced on the basis of valuations furnished by pricing services which utilize both dealer-supplied valuations and electronic data processing techniques. Valuations of fixed-income securities take into account appropriate factors such as institutional-size trading markets in similar groups of securities, yield, quality, coupon rate, maturity, type of issue, trading characteristics and other market data and do not rely exclusively upon exchange or over-the-counter listed prices. Security values are not discounted based on the size of the Fund’s position. Securities for which market quotations are not readily available are valued at fair value as determined in good faith by or at the direction of the Board of Trustees. Short-term securities are valued at amortized cost which approximates current value. All securities held by the Fund are denominated in U.S. dollars.
Security transactions and related investment income. Security transactions are recorded by the Fund as of the date the trades are executed with brokers. Realized gains and losses on securities sold are determined on the basis of identified cost. Dividend income and corporate action transactions are recorded on the ex-dividend date, except for certain dividends or corporate actions from foreign securities where the ex-dividend date may have passed, which are recorded as soon as the Fund is informed of the ex-dividend date. Withholding taxes on foreign dividends have been provided for in accordance with the Fund’s understanding of the applicable country’s tax rules and rates. Non-cash dividends included in dividend income, if any, are recorded at the fair market value of the securities received. Distributions received in excess of income are recorded as a reduction of cost of investments and/or realized gain. The Fund may estimate the character of distributions received from Real Estate Investment Trusts (“REITs”). Interest income is recorded on the accrual basis. Premiums and discounts on debt securities purchased are amortized and accreted, respectively, to interest income over the lives of the respective securities. The ability of the issuers of the debt securities held by the Fund to meet their obligations may be affected by economic developments in a specific industry, state or region. Debt obligations may be placed on non-accrual status and related interest income may be reduced by ceasing current accruals and writing off interest receivables when the collection of all or a portion of interest has become doubtful based on consistently applied procedures. A debt obligation is removed from non-accrual status when the issuer resumes interest payments or when collectibility of interest is reasonably assured.
Expenses. Expenses are recorded on the accrual basis. Most expenses of the Trust can be directly attributed to a specific fund. Expenses which cannot be directly attributed are apportioned among all of the funds in the Trust.
Repurchase agreements. The Fund may enter into repurchase agreements secured by U.S. government securities which involve the purchase of securities from a counterparty with a simultaneous commitment to resell the securities at an agreed-upon date and
| | |
| 11 / Dodge & Cox Balanced Fund | | |
Notes to Financial Statements (continued)
price. It is the Fund’s policy that its custodian take possession of the underlying collateral securities, the fair value of which exceeds the principal amount of the repurchase transaction, including accrued interest, at all times. In the event of default by the counterparty, the Fund has the contractual right to liquidate the securities and to apply the proceeds in satisfaction of the obligation.
Income taxes and distributions to shareholders. No provision for federal income taxes has been included in the accompanying financial statements since the Fund intends to distribute all of its taxable income and continue to comply with requirements for regulated investment companies. Distributions to shareholders of income and capital gains are reflected in the net asset value per share computation on the ex-dividend date. Income and capital gain distributions are determined in accordance with income tax regulations, which may differ from accounting principles generally accepted in the United States of America. Temporary differences between financial statement and tax treatments may occur when certain items of income, expense, gain or loss are recognized in different periods for financial statement and tax purposes. Differences in classification between income and gains may also arise due to differing financial statement and tax treatments of realized short-term gains and paydown gains and losses. Permanent differences are reclassified among capital accounts in the financial statements to reflect their tax character. These adjustments have no impact on net assets or results of operations.
Note 2 — Restatement
In preparing these financial statements, management determined that it had misclassified certain paydown losses on mortgage-related securities in prior years by recording them as realized losses rather than as an offset to net investment income. The misclassifications had no impact on amounts previously reported for net asset value, distributions paid, amounts of taxable income reported to shareholders, total return, portfolio turnover rate, security valuation, or net change in net assets from operations. These financial statements have been restated to reclassify amounts reported for net investment income and net realized gain in the Statement of Changes in Net Assets for the year ended December 31, 2003, and to restate the ratio of net investment income to average net assets for the years ended December 31, 2003 and 2002 in the Financial Highlights. The amounts before and after the restatement are shown in the table below:
| | | | |
| | | As originally reported
| | Restated
|
| Net investment income | | $252,104,677 | | $235,899,677 |
| Net realized gain | | 158,794,795 | | 174,999,795 |
Ratio of net investment
income to average | | | | |
| net assets: 2003 | | 2.57% | | 2.40% |
2002 | | 3.12% | | 3.05% |
Note 3 — Related Party Transactions
Management fees. Under a written agreement, the Fund pays an annual management fee of 0.50% of the Fund’s average daily net assets to Dodge & Cox, investment manager of the Fund.
Trustees’ fees. All officers and three of the trustees of the Trust are officers and employees of Dodge & Cox. Those trustees who are not affiliated with Dodge & Cox receive from the Trust an annual fee plus an attendance fee for each Board or Committee meeting attended. Payments to trustees are shared equally among each fund in the Trust. The Trust does not pay any other remuneration to its officers or trustees.
Indemnifications. Under the Trust’s organizational documents, its officers and trustees are indemnified against certain liabilities arising out of the performance of their duties to the Trust. In addition, in the normal course of business the Trust enters into contracts that provide general indemnifications to other parties. The Trust’s maximum exposure under these arrangements is unknown as this would involve future claims that may be made against the Trust that have not yet occurred.
| | |
| | | Dodge & Cox Balanced Fund / 12 |
Notes to Financial Statements (continued)
Note 4 — Distributions Paid, Distributable Earnings and Investment Transactions
Distributions paid during the years ended December 31, 2004 and 2003 were characterized as follows for federal tax purposes:
| | | | |
| | | 2004
| | 2003
|
| Ordinary income | | $452,362,257 | | $308,364,981 |
| | | ($1.90 per share) | | ($1.97 per share) |
| Long-term capital gain | | $344,789,975 | | $64,572,678 |
| | | ($1.38 per share) | | ($0.36 per share) |
At December 31, 2004, the tax basis components of accumulated undistributed income and net realized gain include $4,325,165 of ordinary income and $56,285,092 of long-term capital gain. At December 31, 2004, the cost of investments for federal income tax purposes was equal to the cost for financial reporting purposes. Net unrealized appreciation aggregated $3,546,330,069, of which $3,607,234,242 represented appreciated securities and $60,904,173 represented depreciated securities.
For the year ended December 31, 2004, purchases and sales of securities, other than short-term securities and U.S. government securities, aggregated $4,235,697,513 and $1,481,489,022 respectively. For the year ended December 31, 2004, purchases and sales of U.S. government securities aggregated $4,222,658,980 and $1,190,380,882, respectively.
Financial Highlights
| | | | | | | | | | | | | | | |
| SELECTED DATA AND RATIOS (for a share outstanding throughout each year) | | | | | | Year Ended December 31, | |
| | | 2004 | | | 2003 | | | 2002 | | | 2001 | | | 2000 | |
Net asset value, beginning of year | | $73.04 | | | $60.75 | | | $65.42 | | | $63.42 | | | $65.71 | |
| | | | | |
Income from investment operations: | | | | | | | | | | | | | | | |
Net investment income | | 1.60 | | | 1.66 | | | 1.89 | | | 2.12 | | | 2.45 | |
Net realized and unrealized gain (loss) | | 7.99 | | | 12.96 | | | (3.80 | ) | | 4.07 | | | 6.95 | |
| | |
|
| |
|
| |
|
| |
|
| |
|
|
Total from investment operations | | 9.59 | | | 14.62 | | | (1.91 | ) | | 6.19 | | | 9.40 | |
| | |
|
| |
|
| |
|
| |
|
| |
|
|
Distributions to shareholders from: | | | | | | | | | | | | | | | |
Net investment income | | (1.60 | ) | | (1.66 | ) | | (1.88 | ) | | (2.14 | ) | | (2.47 | ) |
Net realized gain | | (1.68 | ) | | (0.67 | ) | | (0.88 | ) | | (2.05 | ) | | (9.22 | ) |
| | |
|
| |
|
| |
|
| |
|
| |
|
|
Total distributions | | (3.28 | ) | | (2.33 | ) | | (2.76 | ) | | (4.19 | ) | | (11.69 | ) |
| | |
|
| |
|
| |
|
| |
|
| |
|
|
Net asset value, end of year | | $79.35 | | | $73.04 | | | $60.75 | | | $65.42 | | | $63.42 | |
| | |
|
|
Total return | | 13.31 | % | | 24.44 | % | | (2.94 | )% | | 10.06 | % | | 15.13 | % |
Ratios/supplemental data: | | | | | | | | | | | | | | | |
Net assets, end of year (millions) | | $20,741 | | | $13,196 | | | $7,885 | | | $6,040 | | | $4,909 | |
Ratio of expenses to average net assets | | 0.54 | % | | 0.54 | % | | 0.53 | % | | 0.53 | % | | 0.53 | % |
Ratio of net investment income to average net assets | | 1.97 | % | | 2.40 | %* | | 3.05 | %* | | 3.28 | % | | 3.70 | % |
Portfolio turnover rate | | 18 | % | | 19 | % | | 25 | % | | 21 | % | | 23 | % |
| * | | As restated. See Note 2 of Notes to Financial Statements. |
| | |
| 13 / Dodge & Cox Balanced Fund | | |
Report of Independent Registered Public Accounting Firm
To the Trustees of Dodge & Cox Funds and Shareholders of Dodge & Cox Balanced Fund
In our opinion, the accompanying statement of assets and liabilities, including the portfolio of investments, and the related statements of operations and of changes in net assets and the financial highlights present fairly, in all material respects, the financial position of the Dodge & Cox Balanced Fund (the “Fund”, one of the series constituting Dodge & Cox Funds) at December 31, 2004, the results of its operations for the year then ended, the changes in its net assets for each of the two years in the period then ended and the financial highlights for each of the five years in the period then ended, in conformity with accounting principles generally accepted in the United States of America. These financial statements and financial highlights (hereafter referred to as “financial statements”) are the responsibility of the Fund’s management; our responsibility is to express an opinion on these financial statements based on our audits. We conducted our audits of these financial statements in accordance with the standards of the Public Company Accounting Oversight Board (United States). Those standards require that we plan and perform the audit to obtain reasonable assurance about whether the financial statements are free of material misstatement. An audit includes examining, on a test basis, evidence supporting the amounts and disclosures in the financial statements, assessing the accounting principles used and significant estimates made by management, and evaluating the overall financial statement presentation. We believe that our audits, which included confirmation of securities at December 31, 2004 by correspondence with the custodian and brokers, provide a reasonable basis for our opinion.
As discussed in Note 2 to the Financial Statements, the Fund has restated the net investment income and net realized gain reported in the Statement of Changes in Net Assets for the year ended December 31, 2003, and has restated the ratio of net investment income to average net assets in the Financial Highlights for the years ended December 31, 2003 and 2002.
PricewaterhouseCoopers LLP
San Francisco, California
February 18, 2005
Special 2004 Tax Information (unaudited)
The following information is provided pursuant to provisions of the Internal Revenue Code:
The Fund designates $181,634,494 of its distributions paid to shareholders in 2004 as qualified dividends (treated for federal income tax purposes in the hands of shareholders as taxable at a maximum rate of 15%).
For shareholders that are corporations, the Fund designates 32% of its ordinary dividends (including short-term gains) paid to shareholders in 2004 as dividends from domestic corporations eligible for the corporate dividends received deduction, provided that the shareholder otherwise satisfies applicable requirements to claim that deduction.
Fund’s Holdings
The Funds provide a complete list of their holdings four times in each fiscal year, at the quarter-ends. The lists appear in the Funds’ First Quarter, Semi-Annual, Third Quarter and Annual Reports to shareholders. The Funds file the lists with the Securities and Exchange Commission (SEC) on Form N-CSR (second and fourth quarters) and Form N-Q (first and third quarters). Shareholders may view the Funds’ Forms N-CSR and N-Q on the SEC’s website at www.sec.gov. Forms N-CSR and N-Q may also be reviewed and copied at the SEC’s Public Reference Room in Washington, DC. Information regarding the operations of the Public Reference Room may be obtained by 1-202-942-8090 (direct) or 1-800/SEC-0330 (general SEC number). A complete list of the Funds’ quarter-end holdings are also available at www.dodgeandcox.com on or about 15 days following each quarter end.
Proxy Voting
For a free copy of the Fund’s proxy voting policies and procedures, please call (800) 621-3979, visit www.dodgeandcox.com or the Securities and Exchange Commission’s web site at www.sec.gov. Information regarding how Dodge & Cox, on behalf of the Fund, voted proxies relating to the Fund’s portfolio securities for the most recent twelve-month period ending June 30 is available at www.dodgeandcox.com or the SEC’s web site at www.sec.gov.
| | |
| | | Dodge & Cox Balanced Fund / 14 |
Dodge & Cox Funds—Executive Officer & Trustee Information (unaudited)
| | | | | | |
| | | | |
Name (Age) and
Address* | | Position with Trust
(Year of Election
or Appointment) | | Principal Occupation During Past 5 Years | | Other Directorships Held by Trustees |
| Interested Trustees & Officers |
Harry R. Hagey (63) | | Chairman and Trustee (Trustee since 1975) | | Chairman, Chief Executive Officer and Director of Dodge & Cox, Portfolio Manager and member of Investment Policy Committee (IPC) | | — |
John A. Gunn (61) | | President and Trustee
(Trustee since 1985) | | President, Chief Investment Officer and Director of Dodge & Cox, Portfolio Manager, and member of IPC, Fixed Income Strategy Committee (FISC) and International Investment Policy Committee (IIPC) | | — |
Dana M. Emery (43) | | Vice President and Trustee (Trustee since 1993) | | Senior Vice President and Director of Dodge & Cox, Manager of the Fixed Income Department, Portfolio Manager, and member of IPC and FISC | | — |
A. Horton Shapiro (65) | | Executive Vice President (Officer since 1985) | | Senior Vice President and Director of Dodge & Cox and Portfolio Manager | | — |
| Katherine Herrick Drake (50) | | Vice President (Officer since 1993) | | Vice President of Dodge & Cox and Portfolio Manager | | — |
Kenneth E. Olivier (52) | | Vice President
(Officer since 1992) | | Executive Vice President (since 2002) and Director of Dodge & Cox, Portfolio Manager and member of IPC | | — |
| Diana S. Strandberg (45) | | Vice President
(Officer since 2001) | | Vice President of Dodge & Cox, Portfolio Manager and member of the IIPC | | — |
John M. Loll (38) | | Treasurer and Assistant Secretary (Officer since 2000) | | Vice President and Treasurer of Dodge & Cox | | — |
| Thomas M. Mistele (51) | | Secretary and Assistant Treasurer (Officer since 2000) | | Chief Operating Officer (since 2004), Secretary and General Counsel of Dodge & Cox | | — |
| Marcia P. Venegas (36) | | Chief Compliance Officer
(Officer since 2004) | | Chief Compliance Officer of the Trust (since 2004), Compliance Officer of Dodge & Cox (2003-2004); Compliance and Business Risk Manager of Deutsche Asset Management, Australia Limited (1999-2001) | | — |
| Independent Trustees |
William F. Ausfahl (64) | | Trustee (Since 2002) | | CFO, The Clorox Co. (1982-1997); Director, The Clorox Co. (1984-1997) | | — |
L. Dale Crandall (63) | | Trustee (Since 1999) | | President, Kaiser Foundation Health Plan, Inc. and Kaiser Foundation Hospitals (2000-2002); Senior Vice President–Finance and Administration & CFO, Kaiser Foundation Health Plan, Inc. and Kaiser Foundation Hospitals (1998-2000) | | Director, Union BanCal Corporation (bank holding company) and Union Bank of California (commercial bank) (2001-Present); Director, Covad Communications Group (broadband communications services) (2002-Present); Director, Ansell Limited (medical equipment and supplies) (2002-Present); Director, BEA Systems, Inc. (software and programming) (2003-Present); Director, Coventry Health Care Inc. (managed healthcare) (2004-Present) |
Thomas A. Larsen (55) | | Trustee (Since 2002) | | Director in Howard, Rice, Nemerovski, Canady, Falk & Rabkin (law firm) | | — |
Will C. Wood (65) | | Trustee (Since 1992) | | Principal, Kentwood Associates, Financial Advisers | | Director, Banco Latinoamericano de Exportaciones S.A. (Latin American Foreign Trade Bank) (1999-Present); Director, Dover Investment Corp. (real estate development) (1992-Present) |
| * | | The address for each Officer and Trustee is 555 California Street, 40th Floor, San Francisco, California 94104. Each Officer and Trustee oversees all four series in the Dodge & Cox Funds complex and serves for an indefinite term. |
Additional information about the Trust’s Trustees is available in the Trust’s Statement of Additional Information (SAI). You can get a free copy of the SAI by contacting Dodge & Cox Funds at (800) 621-3979.

Income Fund
Established 1989

16th Annual Report
December 31, 2004
2004
Income Fund
www.dodgeandcox.com
For Fund literature, transactions and account
information, please visit the Funds’ web site.
or write or call:
Dodge & Cox Funds
c/o Boston Financial Data Services
P.O. Box 8422
Boston, Massachusetts 02266-8422
(800) 621-3979
Investment Manager
Dodge & Cox
555 California Street, 40th Floor
San Francisco, California 94104
(415) 981-1710
This report is submitted for the general information of the shareholders of the Fund. The report is not authorized for distribution to prospective investors in the Fund unless it is accompanied by a current prospectus.
This report reflects our views, opinions and portfolio holdings as of December 31, 2004, the end of the reporting period. Any such views are subject to change at any time based upon market or other conditions and Dodge & Cox disclaims any responsibility to update such views. These views may not be relied on as investment advice and, because investment decisions for a Dodge & Cox Fund are based on numerous factors, may not be relied on as an indication of trading intent on behalf of any Dodge & Cox Fund.

12/04 IF AR  Printed on recycled paper
To Our Shareholders
The Dodge & Cox Income Fund returned 3.6% in 2004, lagging the 4.3% return of the Lehman Brothers Aggregate Bond Index (LBAG). Total returns for longer periods are listed on the following page.
At year end the Fund had total net assets of $7.9 billion and a cash position of 1.9%. The Fund’s share price fell from $12.92 on December 31, 2003 to $12.84 on December 31, 2004. The Fund distributed income dividends of $0.54 per share over the course of the year.
Widely held expectations for rising interest rates in 2004 came to fruition only among short-maturity securities, as longer-term interest rates (ten years and longer) actually declined. The Fund’s total return was modest, as the price declines of short and intermediate-maturity bonds largely offset the price appreciation of longer-term securities, leaving the portfolio’s earned income as the predominant source of return. We reiterate the caution we have expressed in the last two annual letters about future returns from fixed income: with a starting yield of 4% and, in our estimation, a low probability of price increases to augment earned income, the Fund’s returns in the near-term are likely to be modest, and could be negative.
2004 Fixed-Income Market
Despite the headwind of rising oil prices, 2004 was notable for the strength and consistency of U.S. economic growth, illustrated by a rejuvenated employment picture (two million jobs added) and accelerating inflation, albeit from a low starting point. Other developments include a continued decline in U.S. dollar and Federal Funds rate increases by the Federal Reserve. In the fixed-income markets, this environment provoked a significant “flattening” of the yield curve, as yields on shorter-maturity securities rose along with the Federal Funds rate, while yields on longer-maturity securities remained stable or fell. Year-over-year, the yield difference between two-year U.S. Treasury Notes and the 26-year U.S. Treasury Bond, a measure of yield curve “steepness,” narrowed by 1.48%.
The past year proved to be a good one for investors in corporate and mortgage-related securities, both of which outperformed comparable U.S. Treasuries. The Corporate sector has significantly outperformed U.S. Treasuries for over two years, and has left corporate bond valuations at levels (relative to U.S. Treasuries) not seen since 1998. The story is similar in the Mortgage sector, as declining volatility and relatively moderate prepayments have boosted investor demand and pushed valuations to fairly expensive levels.
2004 Performance Review and Strategy
Reflecting our view that inflation would accelerate and U.S. economic growth would continue at a healthy pace, we positioned the Fund with a duration1 below that of the LBAG benchmark to protect from price declines associated with our anticipation of a rise in rates. We maintained this duration positioning during the year by investing a relatively high percentage of the Fund’s assets in short-duration securities. This positioning hurt the Fund’s return relative to the LBAG in two ways. First, the Fund earned less income due to the lower yield offered by short and intermediate bonds in the steep yield curve environment. Second, the Fund experienced less price appreciation due to its somewhat lower exposure to higher-yielding, longer-maturity bonds, which generally rose in value.
On the positive side, the Fund’s higher weighting than the LBAG in the Corporate and Mortgage sectors benefited the Fund during the year, given the strong performance from those areas. Our specific selection of bonds for the portfolio was modestly positive as well. For example, the Fund’s investments in higher-coupon, 15-year mortgage pools (approximately 30% of the Fund) significantly out-performed short-maturity Treasuries. On the other hand, the Fund’s ‘Reperforming’ mortgage securities (5% of the Fund) lagged as higher-than-expected prepayments from these typically refinancing-constrained mortgage borrowers reduced returns. Many of the portfolio’s corporate holdings performed well in 2004, led by lower-rated (BBB and below)2 issuers such as Dillard’s, Xerox, Health Net, Cigna, and Amerada Hess. These gains, however, were offset somewhat by poor returns from GMAC and UnumProvident bonds.
Looking Forward
In our view, long-term interest rates remain uncomfortably low (ten-year U.S. Treasury at 4.22%) given the magnitude, and recent acceleration, of inflation (CPI ended 2004 at 3.3% compared to 1.9% a year ago). Explanations for the unusually low nominal and real rates are plentiful. Examples include: strong support of U.S. bonds by less “return sensitive” foreign investors, the general “reach for yield” in a low nominal rate environment, investor confidence in the Federal Reserve’s ability to contain inflation, and lower future economic growth prospects for the U.S. economy because of overextended U.S. consumers.
While these factors may have initial appeal, our forward investment outlook is that U.S. economic growth appears to be on a healthy
| | |
| 1 / Dodge & Cox Income Fund | | |
trajectory, and reasonable job creation going forward should have positive effects on the U.S. consumer—a source of considerable concern among investors. Corporate America, having enjoyed a year of strong earnings, plentiful liquidity and increasing demand, seems likely to boost investments in plant, property and people. In the intermediate term we expect continued Federal Funds rate increases, a rise in U.S. Treasury supply as the budget deficit grows, and a continued rise in inflation. As the bond market begins to focus on these factors, we believe that long-term interest rates are likely to move higher. Therefore, we continue to position the Fund defensively vis-à-vis interest rate exposure, with over 60% of the Fund’s securities having a duration of three years or less.
We have also gradually lowered the Fund’s Corporate weighting over the past two years, from 36.7% at year-end 2002 to 31.5% at year-end 2004. Corporate bond valuations have appreciated significantly, and we see fewer attractive investment opportunities, particularly among credits rated ‘A’ or better. Likewise, we have allowed the Fund’s Mortgage weighting to decline gradually from 40.2% at year-end 2002 to 37.4% at year-end 2004, as mortgage valuations have become increasingly rich.
In Closing
We invest the Fund’s assets with a focus on total return potential over a three-to-five year investment horizon, and do not attempt to anticipate the market in the near term. Our investment decisions are grounded by our fundamental analysis of the factors likely to affect the Fund’s investments over the long term. While we are not pleased with the Fund’s performance compared to the LBAG in 2004, short-term underperformance is the occasional by-product of our pursuit of absolute and relative performance over a long-term investment horizon.
Thank you for the continued confidence you have placed in our firm as a shareholder of the Income Fund. As always, we welcome your comments and questions.
For the Board of Trustees, |

| 
|
| Harry R. Hagey, Chairman | Dana M. Emery, Vice President |
February 18, 2005
Ten Years of Investment Performance
through December 31, 2004 (in thousands)
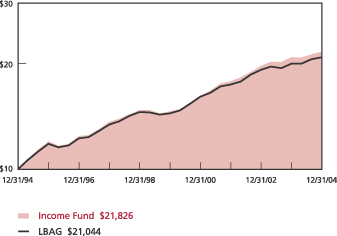
Average annual total return for periods ended December 31, 2004
| | | | | | | | | |
| | | 1 Year | | | 5 Years | | | 10 Years | |
| Dodge & Cox Income Fund | | 3.64 | % | | 8.24 | % | | 8.12 | % |
Lehman Brothers
Aggregate Bond Index (LBAG) | | 4.34 | | | 7.71 | | | 7.72 | |
Past performance does not guarantee future results. Investment return and share price will fluctuate with market conditions, and investors may have a gain or loss when shares are sold. Mutual fund performance changes over time and currently may be significantly lower than stated above. Performance is updated and published monthly. Visit the Fund’s web site at www.dodgeandcox.com or call 800-621-3979 for current performance figures.
The Fund’s total returns include the reinvestment of dividend and capital gain distributions, but have not been adjusted for any income taxes payable by shareholders on these distributions. The Lehman Brothers Aggregate Bond Index is an unmanaged index of investment-grade fixed-income securities. Index returns include dividends and/or interest income and, unlike Fund returns, do not reflect fees or expenses.
Lehman Brothers® is a trademark of Lehman Brothers, Inc.
| 1 | | Duration is a measure of price sensitivity to changes in interest rates. |
| 2 | | As of December 31, 2004, 10.7% of the Fund was invested in securities rated below investment grade (below BBB). |
| | |
| | | Dodge & Cox Income Fund / 2 |
As a shareholder of the Fund, you incur ongoing costs, which include costs for portfolio management, administrative services, and shareholder reports (like this one), among others. Operating expenses, which are deducted from a Fund’s gross income, directly reduce the investment return of the Fund. The following examples are intended to help you understand the ongoing costs (in dollars) of investing in the Fund and to compare these costs with those of other mutual funds. The examples are based on an investment of $1,000 made at the beginning of the period shown and held for the entire period.
The table below illustrates the Fund’s costs in two ways:
Actual Fund Expenses
This section helps you to estimate the actual expenses that you paid over the period. The “Ending Account Value” shown is derived from the Fund’s actual return, and the third column shows the dollar amount that would have been paid by an investor who started with $1,000 in the Fund. You may use the information here, together with the amount you invested, to estimate the expenses that you paid over the period. To do so, simply divide your account value by $1,000 (for example, an $8,600 account value divided by $1,000 = 8.6), then multiply the result by the number given for the Fund under the heading “Expenses Paid During Period.”
Hypothetical Example for Comparison
This section is intended to help you compare the Fund’s costs with those of other mutual Funds. It assumes that the Fund had a yearly return of 5% before expenses, but that the expense ratio is unchanged. In this case—because the return used is not the Fund’s actual return—the results do not apply to your investment. The example is useful in making comparisons because the Securities and Exchange Commission requires all mutual funds to calculate expenses based on a 5% return. You can assess the Fund’s costs by comparing this hypothetical example with the hypothetical examples that appear in shareholder reports of other funds.
| | | | | | |
Six Months Ended
December 31, 2004 | | Beginning
Account Value 7/1/2004 | | Ending
Account Value 12/31/2004 | | Expenses Paid
During Period* |
| Based on Actual Fund Return | | $1,000.00 | | $1,039.00 | | $2.27 |
| Based on Hypothetical 5% Yearly Return | | 1,000.00 | | 1,022.77 | | 2.25 |
| * | | These calculations are based on expenses incurred in the most recent fiscal half-year. The Fund’s annualized six-month expense ratio for that period is 0.44%. The dollar amounts shown as “Expenses Paid” are equal to the annualized expense ratio multiplied by the average account value over the period, multiplied by the number of days in the most recent fiscal half-year, then divided by 366. |
The expenses shown in the table are meant to highlight and help you compare ongoing costs only and do not reflect any transactional costs or account maintenance fees. While other mutual funds may charge such fees, please note that the Fund does not charge any transaction fee (e.g., redemption fee), account maintenance fee (e.g., small account fee), nor does it charge a “sales load.”
| | |
| 3 / Dodge & Cox Income Fund | | |
Fund Information | December 31, 2004 |
General Information
| | |
Net Asset Value Per Share | | $12.84 |
Total Net Assets (millions) | | $7,870 |
30-Day SEC Yield1 | | 3.89% |
2004 Expense Ratio | | 0.44% |
2004 Portfolio Turnover | | 30% |
Fund Inception Date | | 1989 |
|
| Investment Manager: Dodge & Cox, San Francisco. Managed by the Fixed-Income Strategy Committee, whose nine members’ average tenure at Dodge & Cox is 15 years, and by the Investment Policy Committee, whose eleven members’ (for fixed-income decisions) average tenure at Dodge & Cox is 21 years. |
Asset Allocation
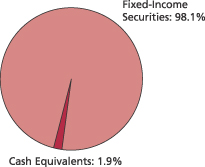
| | | | | |
| Fixed-Income Characteristics | | Fund | | | LBAG |
Number of Fixed-Income Securities | | 284 | | | 5,386 |
Average Quality | | AA | | | AA+ |
Average Maturity (years) | | 5.4 | | | 7.1 |
Effective Duration (years) | | 3.3 | | | 4.4 |
| | | | | | |
| Credit Quality Diversification3 | | Fund | | | LBAG | |
U.S. Government & Government Agencies | | 66.1 | % | | 70.9 | % |
Aaa/AAA | | 0.7 | | | 7.1 | |
Aa/AA | | 0.1 | | | 2.4 | |
A/A | | 3.1 | | | 9.6 | |
Baa/BBB | | 17.4 | | | 10.0 | |
Ba/BB | | 8.1 | | | 0.0 | |
B/B and below | | 2.6 | | | 0.0 | |
Cash Equivalents | | 1.9 | | | 0.0 | |
| | | | | | |
| Sector Diversification | | Fund | | | LBAG | |
U.S. Treasury & Government Agency | | 29.0 | % | | 35.7 | % |
Mortgage-Related Securities | | 37.4 | | | 35.1 | |
Asset-Backed/CMBS2 | | 0.2 | | | 4.4 | |
Corporate | | 31.5 | | | 20.6 | |
Non-Corporate Yankee | | 0.0 | | | 4.2 | |
Cash Equivalents | | 1.9 | | | 0.0 | |
| | | | | | |
| Maturity Diversification | | Fund | | | LBAG | |
0-1 Years to Maturity | | 12.4 | % | | 0.0 | % |
1-5 | | 56.5 | | | 44.8 | |
5-10 | | 19.8 | | | 42.3 | |
10-15 | | 1.6 | | | 3.5 | |
15-20 | | 0.6 | | | 2.9 | |
20-25 | | 3.3 | | | 3.2 | |
25 and Over | | 5.8 | | | 3.3 | |
| 1 | | SEC Yield is an annualization of the Fund’s total net investment income per share for the 30-day period ended on the last day of the month. |
| 2 | | CMBS refers to commercial mortgage-backed securities, which are a component of the LBAG but are not held by the Fund. |
| 3 | | For presentation purposes only: when a security is split-rated, the lower of either the Moody’s or Standard & Poor’s rating is reported. |
| | |
| | | Dodge & Cox Income Fund / 4 |
Portfolio of Investments | December 31, 2004 |
| | | | | | |
| FIXED-INCOME SECURITIES: 98.1% | | |
| | |
| | | PAR VALUE | | MARKET VALUE |
| U.S. TREASURY AND GOVERNMENT AGENCY: 29.0% |
| U.S. TREASURY: 27.1% | | | | | | |
Notes, 6.75%, 5/15/05 | | $ | 325,000,000 | | $ | 330,027,425 |
Notes, 2.00%, 8/31/05 | | | 400,000,000 | | | 398,437,600 |
Notes, 1.875%, 1/31/06 | | | 200,000,000 | | | 198,078,200 |
Notes, 4.625%, 5/15/06 | | | 450,000,000 | | | 460,371,150 |
Notes, 6.625%, 5/15/07 | | | 465,000,000 | | | 501,636,885 |
Notes, 3.25%, 1/15/09 | | | 250,000,000 | | | 247,832,000 |
| | | | | |
|
|
| | | | | | | 2,136,383,260 |
| GOVERNMENT AGENCY: 1.9% | | | | | | |
Small Business Administration (504) | | | | | | |
Series 01-20G, 6.625%, 7/1/21 | | | 15,800,027 | | | 17,159,684 |
Series 02-20 L, 5.10%, 12/1/22 | | | 8,862,828 | | | 9,067,836 |
Series 91-20K, 8.25%, 11/1/11 | | | 868,553 | | | 928,649 |
Series 92-20B, 8.10%, 2/1/12 | | | 812,505 | | | 864,547 |
Series 92-20C, 8.20%, 3/1/12 | | | 1,561,490 | | | 1,665,895 |
Series 92-20D, 8.20%, 4/1/12 | | | 865,192 | | | 924,472 |
Series 92-20G, 7.60%, 7/1/12 | | | 2,295,432 | | | 2,429,091 |
Series 92-20H, 7.40%, 8/1/12 | | | 1,287,286 | | | 1,360,767 |
Series 92-20I, 7.05%, 9/1/12 | | | 1,719,907 | | | 1,812,036 |
Series 92-20J, 7.00%, 10/1/12 | | | 2,622,336 | | | 2,763,601 |
Series 92-20K, 7.55%, 11/1/12 | | | 2,590,153 | | | 2,752,835 |
Series 92-20L, 7.45%, 12/1/12 | | | 1,322,706 | | | 1,405,471 |
Series 93-20B, 7.00%, 2/1/13 | | | 1,903,459 | | | 2,004,159 |
Series 93-20C, 6.50%, 3/1/13 | | | 5,217,181 | | | 5,459,660 |
Series 93-20D, 6.75%, 4/1/13 | | | 2,102,859 | | | 2,210,294 |
Series 93-20E, 6.55%, 5/1/13 | | | 6,184,829 | | | 6,486,086 |
Series 93-20F, 6.65%, 6/1/13 | | | 2,701,517 | | | 2,839,490 |
Series 93-20L, 6.30%, 12/1/13 | | | 3,819,975 | | | 3,994,735 |
Series 94-20A, 6.50%, 1/1/14 | | | 4,360,762 | | | 4,563,630 |
Series 94-20D, 7.70%, 4/1/14 | | | 1,545,269 | | | 1,648,759 |
Series 94-20E, 7.75%, 5/1/14 | | | 3,911,796 | | | 4,181,491 |
Series 94-20F, 7.60%, 6/1/14 | | | 2,562,186 | | | 2,736,196 |
Series 94-20G, 8.00%, 7/1/14 | | | 1,891,705 | | | 2,020,080 |
Series 94-20H, 7.95%, 8/1/14 | | | 1,958,132 | | | 2,092,637 |
Series 94-20I, 7.85%, 9/1/14 | | | 3,238,496 | | | 3,461,165 |
Series 94-20K, 8.65%, 11/1/14 | | | 1,550,479 | | | 1,678,268 |
Series 94-20L, 8.40%, 12/1/14 | | | 2,053,978 | | | 2,219,665 |
Series 95-20A, 8.50%, 1/1/15 | | | 950,611 | | | 1,022,697 |
Series 95-20C, 8.10%, 3/1/15 | | | 1,663,389 | | | 1,786,865 |
Series 97-20E, 7.30%, 5/1/17 | | | 2,565,371 | | | 2,763,835 |
Series 97-20J, 6.55%, 10/1/17 | | | 3,308,993 | | | 3,518,879 |
Series 98-20C, 6.35%, 3/1/18 | | | 13,005,714 | | | 13,796,590 |
Series 98-20H, 6.15%, 8/1/18 | | | 4,722,709 | | | 4,994,220 |
Series 98-20L, 5.80%, 12/1/18 | | | 2,597,376 | | | 2,723,519 |
Series 99-20C, 6.30%, 3/1/19 | | | 3,160,127 | | | 3,366,497 |
Series 99-20G, 7.00%, 7/1/19 | | | 8,257,267 | | | 8,985,122 |
Series 99-20I, 7.30%, 9/1/19 | | | 2,886,307 | | | 3,172,698 |
Series 04-20 L, 4.87%, 12/1/24 | | | 9,210,000 | | | 9,237,004 |
| | | | | |
|
|
| | | | | | | 146,099,125 |
| | | | | |
|
|
| | | | | | | 2,282,482,385 |
| | | | | | |
| | |
| | | PAR VALUE | | MARKET VALUE |
| MORTGAGE-RELATED SECURITIES: 37.4% |
| FEDERAL AGENCY CMO(a) AND REMIC(a):6.8% | | | |
Fannie Mae | | | | | | |
Trust 2004-W8 3A, 7.50%, 6/25/44 | | $ | 45,575,841 | | $ | 48,976,392 |
Trust 1994-28 H, 6.25%, 3/25/23 | | | 3,351,234 | | | 3,387,449 |
Trust 1994-72 J, 6.00%, 6/25/23 | | | 9,000,000 | | | 9,375,090 |
Trust 2001-79 BA, 7.00%, 3/25/45 | | | 5,517,946 | | | 5,833,736 |
Trust 2001-T10 A1, 7.00%, 12/25/41 | | | 17,169,832 | | | 18,099,731 |
Trust 2001-T4 A1, 7.50%, 7/25/41 | | | 9,867,375 | | | 10,546,705 |
Trust 2002-16 XQ, 5.50%, 8/25/14 | | | 4,219,478 | | | 4,221,878 |
Trust 2002-2MB, 6.00%, 9/25/14 | | | 1,727,331 | | | 1,726,150 |
Trust 2002-33 A1, 7.00%, 6/25/32 | | | 12,046,704 | | | 12,735,594 |
Trust 2002-47 QC, 5.50%, 11/25/14 | | | 20,868,373 | | | 20,998,998 |
Trust 2002-90 A1, 6.50%, 6/25/42 | | | 23,124,559 | | | 24,179,617 |
Trust 2002-W6 2A1, 7.00%, 6/25/42 | | | 19,679,426 | | | 20,725,089 |
Trust 2002-W8 A2, 7.00%, 6/25/42 | | | 9,565,333 | | | 10,136,240 |
Trust 2003-07 A1, 6.50%, 12/25/42 | | | 27,749,255 | | | 29,015,315 |
Trust 2003-07 A1W4 3A,
7.00%, 10/25/42 | | | 19,587,667 | | | 20,756,756 |
Trust 2003-W1 1A1, 6.50%, 12/25/42 | | | 40,635,217 | | | 42,312,188 |
Trust 2003-W1 2A, 7.50%, 12/25/42 | | | 18,396,263 | | | 19,684,458 |
Trust 2004-W2 5A, 7.50%, 3/25/44 | | | 89,328,020 | | | 95,618,883 |
Freddie Mac | | | | | | |
Series (GN) 37 I, 6.00%, 6/17/22 | | | 10,000,000 | | | 10,169,899 |
Series 1565 G, 6.00%, 8/15/08 | | | 5,208,777 | | | 5,356,680 |
Series 1601 PJ, 6.00%, 10/15/08 | | | 20,100,000 | | | 20,768,124 |
Series 2366 MG, 6.00%, 12/15/14 | | | 987,567 | | | 987,460 |
Series 2374 QG, 6.00%, 2/15/30 | | | 14,129,340 | | | 14,292,338 |
Series 2394 MB, 6.00%, 1/15/15 | | | 9,254,024 | | | 9,275,639 |
Series T-48 1A, 7.118%, 7/25/33 | | | 17,935,771 | | | 19,006,268 |
Ginnie Mae Series 1999-29 PB,
7.25%, 7/16/28 | | | 10,093,099 | | | 10,516,418 |
Dept. of Veterans Affairs | | | | | | |
Trust 1995-2D 4A, 9.292%, 5/15/25 | | | 837,772 | | | 921,626 |
Trust 1997-2Z, 7.50%, 6/15/27 | | | 40,233,309 | | | 43,690,714 |
Trust 1998-1 1A, 8.144%, 10/15/27 | | | 2,252,997 | | | 2,445,211 |
| | | | | |
|
|
| | | | | | | 535,760,646 |
| FEDERAL AGENCY MORTGAGE PASS-THROUGH: 30.3% | | | |
Fannie Mae Multifamily DUS | | | | | | |
Pool 160329, 7.15%, 10/1/15 | | | 5,981,511 | | | 6,754,345 |
Pool 323822, 6.504%, 7/1/09 | | | 8,181,127 | | | 8,891,083 |
Pool 545059, 6.228%, 5/1/11 | | | 40,821,252 | | | 44,641,381 |
Pool 545209, 6.13%, 10/1/11 | | | 47,887,704 | | | 52,238,583 |
Pool 545685, 6.017%, 4/1/12 | | | 29,488,944 | | | 31,595,562 |
Pool 555191, 4.828%, 2/1/13 | | | 25,417,286 | | | 25,953,797 |
Fannie Mae | | | | | | |
Pool 151777, 8.00%, 1/1/12 | | | 283,501 | | | 304,495 |
Pool 254307 15 Year, 6.00%, 5/1/17 | | | 7,192,667 | | | 7,541,317 |
Pool 260892, 8.00%, 8/1/22 | | | 182,700 | | | 191,915 |
Pool 303592 15 Year, 5.50%, 6/1/09 | | | 2,881,214 | | | 2,981,910 |
Pool 313839 15 Year, 6.50%, 11/1/12 | | | 3,631,954 | | | 3,818,648 |
Pool 323099 15 Year, 6.00%, 4/1/13 | | | 4,940,066 | | | 5,187,591 |
Pool 323623 15 Year, 6.00%, 3/1/14 | | | 6,137,811 | | | 6,445,350 |
| | |
| 5 / Dodge & Cox Income Fund | | See accompanying Notes to Financial Statements |
Portfolio of Investments | December 31, 2004 |
| | | | | | |
| FIXED-INCOME SECURITIES (continued) |
| | |
| | | PAR VALUE | | MARKET VALUE |
Fannie Mae (continued) | | | | | | |
Pool 323787 15 Year, 6.00%, 6/1/14 | | $ | 4,744,267 | | $ | 4,980,317 |
Pool 340181 15 Year, 7.00%, 12/1/10 | | | 2,280,567 | | | 2,410,259 |
Pool 353892 15 Year, 8.00%, 8/1/10 | | | 229,290 | | | 239,912 |
Pool 362447 15 Year, 7.00%, 7/1/08 | | | 1,074,021 | | | 1,122,764 |
Pool 535170 15 Year, 5.50%, 9/1/14 | | | 44,783,822 | | | 46,410,658 |
Pool 535829 15 Year, 7.50%, 11/1/14 | | | 1,854,689 | | | 1,958,092 |
Pool 535867 15 Year, 7.00%, 12/1/11 | | | 1,427,804 | | | 1,513,137 |
Pool 545774 15 Year, 6.50%, 7/1/17 | | | 32,045,294 | | | 33,987,275 |
Pool 545833 15 Year, 6.00%, 7/1/17 | | | 50,118,796 | | | 52,551,033 |
Pool 545900 15 Year, 5.50%, 7/1/17 | | | 17,193,557 | | | 17,797,870 |
Pool 545977 15 Year, 5.50%, 8/1/15 | | | 15,454,308 | | | 16,015,708 |
Pool 555066 15 Year, 5.50%, 9/1/14 | | | 20,558,844 | | | 21,305,673 |
Pool 555143 15 Year, 6.00%, 11/1/17 | | | 29,024,837 | | | 30,433,396 |
Pool 555155 15 Year, 6.00%, 1/1/18 | | | 8,391,190 | | | 8,798,410 |
Pool 555341 15 Year, 6.00%, 2/1/18 | | | 33,351,064 | | | 34,967,692 |
Pool 555382 15 Year, 5.50%, 8/1/15 | | | 8,266,898 | | | 8,567,204 |
Pool 555439 15 Year, 6.00%, 3/1/18 | | | 20,079,754 | | | 21,053,082 |
Pool 555881 15 Year, 6.00%, 3/1/14 | | | 48,305,222 | | | 50,621,711 |
Pool 555932 15 Year, 6.00%, 4/1/18 | | | 27,844,370 | | | 29,204,483 |
Pool 589416 15 Year, 6.00%, 7/1/16 | | | 10,236,803 | | | 10,733,589 |
Pool 70255 30 Year, 7.50%, 9/1/07 | | | 547,014 | | | 566,579 |
Pool 725049 15 Year, 5.50%, 2/1/18 | | | 32,862,833 | | | 34,017,886 |
Pool 725074 15 Year, 6.50%, 11/1/18 | | | 28,534,858 | | | 30,264,142 |
Pool 725197 15 Year, 6.50%, 1/1/18 | | | 43,686,218 | | | 46,333,712 |
Pool 725240 15 Year, 6.00%, 3/1/18 | | | 33,980,172 | | | 35,629,210 |
Pool 725255 15 Year, 6.00%, 3/1/16 | | | 49,723,521 | | | 52,227,484 |
Pool 725271 15 Year, 6.00%, 2/1/19 | | | 116,815,650 | | | 122,484,647 |
Pool 725272 15 Year, 6.00%, 1/1/19 | | | 51,273,286 | | | 53,761,549 |
Pool 725273 15 Year, 6.00%, 12/1/15 | | | 31,670,898 | | | 33,265,772 |
Pool 725417 15 Year, 6.50%, 4/1/18 | | | 108,750,894 | | | 115,341,470 |
Pool 725511 15 Year, 6.50%, 6/1/18 | | | 75,250,510 | | | 79,810,879 |
Pool 725512 15 Year, 6.50%, 3/1/17 | | | 31,547,873 | | | 33,459,752 |
Pool 725513 15 Year, 6.00%, 12/1/18 | | | 22,842,075 | | | 23,986,592 |
Pool 725518 15 Year, 7.50%, 8/1/17 | | | 43,979,015 | | | 46,700,746 |
Pool 725582 20 Year, 6.50%, 5/1/22 | | | 13,863,299 | | | 14,619,057 |
Pool 725678 15 Year, 6.00%, 2/1/19 | | | 52,943,479 | | | 55,512,795 |
Pool 725680 15 Year, 6.50%, 7/1/17 | | | 50,649,482 | | | 53,718,967 |
Pool 725767 15 Year, 6.00%, 7/1/19 | | | 43,351,176 | | | 45,454,983 |
Pool 725810 15 Year, 6.00%, 8/1/19 | | | 34,139,989 | | | 35,796,784 |
Pool 725879 15 Year, 6.00%, 8/1/19 | | | 59,729,352 | | | 62,646,950 |
Pool 735067 15 Year, 6.00%, 1/1/19 | | | 51,079,587 | | | 53,558,451 |
Pool 735070 20 Year, 6.50%, 10/1/24 | | | 50,871,819 | | | 53,682,631 |
Pool 735105 10 Year, 5.00%, 12/1/14 | | | 31,252,312 | | | 32,014,243 |
Freddie Mac Gold | | | | | | |
Group (GN) G80061, 7.90%, 2/17/21 | | | 4,531,850 | | | 4,916,630 |
Group B15648 10 Year, 5.00%, 7/1/14 | | | 14,694,968 | | | 14,967,619 |
Group B17048 10 Year, 5.00%, 10/1/14 | | | 12,030,899 | | | 12,254,120 |
Group C90457 20 Year, 6.50%, 7/1/21 | | | 5,681,438 | | | 5,999,570 |
Group C90544 20 Year, 6.50%, 4/1/22 | | | 4,057,989 | | | 4,284,197 |
Group E00543 15 Year, 6.00%, 4/1/13 | | | 2,337,108 | | | 2,451,566 |
Group E00549 15 Year, 6.00%, 5/1/13 | | | 1,507,512 | | | 1,581,341 |
| | | | | | |
| | |
| | | PAR VALUE | | MARKET VALUE |
Freddie Mac Gold (continued) | | | | | | |
Group E00592 15 Year, 6.00%, 12/1/13 | | $ | 14,993,461 | | $ | 15,727,751 |
Group E00593 15 Year, 5.50%, 11/1/13 | | | 32,864,579 | | | 34,039,108 |
Group E00659 15 Year, 6.00%, 4/1/14 | | | 8,317,967 | | | 8,725,331 |
Group E01007 15 Year, 6.00%, 8/1/16 | | | 21,172,727 | | | 22,177,250 |
Group E01127 15 Year, 6.50%, 2/1/17 | | | 5,397,261 | | | 5,715,391 |
Group E01138 15 Year, 6.50%, 3/1/17 | | | 6,069,557 | | | 6,427,271 |
Group E78398 15 Year, 6.50%, 7/1/14 | | | 12,394,098 | | | 13,136,668 |
Group E81526 15 Year, 6.50%, 11/1/14 | | | 1,739,782 | | | 1,844,018 |
Group E85740 15 Year, 5.50%, 10/1/16 | | | 8,814,813 | | | 9,118,907 |
Group E91927 10 Year, 5.00%, 10/1/12 | | | 10,871,604 | | | 11,077,181 |
Group G01635 15 Year, 7.00%, 4/1/31 | | | 46,509,987 | | | 49,497,531 |
Group G10139 15 Year, 7.00%, 11/1/08 | | | 407,241 | | | 424,062 |
Group G10446 15 Year, 6.50%, 2/1/11 | | | 1,425,028 | | | 1,510,765 |
Group G10532 15 Year, 6.00%, 6/1/11 | | | 9,823,047 | | | 10,307,631 |
Group G10692 15 Year, 6.50%, 6/1/12 | | | 2,787,935 | | | 2,954,683 |
Group G11029 15 Year, 6.50%, 4/1/12 | | | 3,191,819 | | | 3,383,853 |
Group G11068 15 Year, 7.00%, 12/1/11 | | | 2,472,274 | | | 2,621,181 |
Group G11090 15 Year, 6.00%, 2/1/15 | | | 5,942,975 | | | 6,234,026 |
Group G11115 15 Year, 7.00%, 3/1/12 | | | 1,167,191 | | | 1,237,492 |
Group G11122 15 Year, 6.50%, 5/1/16 | | | 24,524,790 | | | 25,979,696 |
Group G11185 15 Year, 5.50%, 10/1/16 | | | 12,110,940 | | | 12,528,745 |
Group G11191 15 Year, 6.00%, 12/1/13 | | | 2,606,019 | | | 2,734,670 |
Group G11192 15 Year, 6.00%, 7/1/11 | | | 2,217,208 | | | 2,326,362 |
Group G11283 15 Year, 6.50%, 5/1/17 | | | 18,113,950 | | | 19,181,639 |
Group G11287 15 Year, 6.00%, 8/1/17 | | | 42,594,370 | | | 44,616,046 |
Group G11288 15 Year, 6.50%, 6/1/17 | | | 24,360,355 | | | 25,796,226 |
Group G11336 15 Year, 6.00%, 6/1/17 | | | 9,966,639 | | | 10,439,690 |
Group G11375 15 Year, 5.50%, 7/1/14 | | | 20,578,453 | | | 21,313,895 |
Group G11392 15 Year, 6.00%, 1/1/18 | | | 24,899,378 | | | 26,081,189 |
Group G11409 15 Year, 6.00%, 5/1/17 | | | 44,019,792 | | | 46,108,276 |
Group G11421 15 Year, 6.50%, 12/1/17 | | | 6,462,914 | | | 6,843,858 |
Group G11430 15 Year, 6.50%, 12/1/17 | | | 35,957,902 | | | 38,077,367 |
Group G11431 15 Year, 6.00%, 2/1/18 | | | 11,080,263 | | | 11,605,957 |
Group G11459 15 Year, 6.50%, 8/1/17 | | | 10,049,902 | | | 10,642,273 |
Group G11493 15 Year, 6.50%, 9/1/18 | | | 15,251,485 | | | 16,160,848 |
Group G11521 15 Year, 6.00%, 12/1/17 | | | 42,100,530 | | | 44,097,956 |
Group G11601 15 Year, 6.00%, 2/1/19 | | | 29,999,607 | | | 31,429,461 |
Freddie Mac | | | | | | |
Group 18-0233, 7.00%, 9/1/06 | | | 1,884 | | | 1,901 |
Group 18-8028, 8.00%, 1/1/08 | | | 38,832 | | | 40,393 |
Group 26-0671, 8.25%, 5/1/09 | | | 1,874 | | | 1,917 |
Group 27-2784, 7.25%, 1/1/08 | | | 887 | | | 910 |
Group 29-0537, 8.00%, 5/1/09 | | | 38,192 | | | 39,254 |
Group 29-2668, 8.00%, 8/1/09 | | | 38,001 | | | 38,915 |
Group 53-0142, 7.50%, 10/1/08 | | | 15,013 | | | 15,527 |
Ginne Mae | | | | | | |
Pool 289199, 7.80%, 6/15/20 | | | 317,160 | | | 345,796 |
Pool 289202, 7.80%, 7/15/20 | | | 299,958 | | | 327,031 |
Pool 289205, 7.80%, 7/15/20 | | | 303,767 | | | 326,914 |
Pool 296207, 7.80%, 8/15/20 | | | 829,292 | | | 904,158 |
Pool 296211, 7.80%, 9/15/20 | | | 401,789 | | | 438,011 |
Pool 296214, 7.80%, 10/15/20 | | | 297,109 | | | 320,042 |
| | | | |
| See accompanying Notes to Financial Statements | | | | Dodge & Cox Income Fund / 6 |
Portfolio of Investments | December 31, 2004 |
| | | | | | |
| FIXED-INCOME SECURITIES (continued) |
| | |
| | | PAR VALUE | | MARKET VALUE |
Ginne Mae (continued) | | | | | | |
Pool 303672, 7.80%, 11/15/20 | | $ | 357,985 | | $ | 390,249 |
Pool 303676, 7.80%, 1/15/21 | | | 998,220 | | | 1,073,312 |
Pool 307695, 7.80%, 1/15/21 | | | 498,069 | | | 542,964 |
Pool 780139, 7.50%, 5/15/25 | | | 5,247,404 | | | 5,674,951 |
Pool 780337, 7.25%, 2/15/06 | | | 59,580 | | | 60,723 |
Pool 780490 15 Year, 7.00%, 4/15/09 | | | 1,887,544 | | | 1,982,804 |
Pool 780710, 7.50%, 9/15/17 | | | 1,055,819 | | | 1,135,874 |
Pool 781321, 7.50%, 11/15/24 | | | 8,058,339 | | | 8,716,910 |
Pool 781454, 7.00%, 5/15/28 | | | 4,198,594 | | | 4,442,801 |
| | | | | |
|
|
| | | | | | | 2,381,474,177 |
| PRIVATE LABEL CMO & REMIC SECURITIES 0.3% | | | |
GS Mortgage Secs Corporation(d)
8.50%, 6/25/34 | | | 26,293,454 | | | 28,835,815 |
| | | | | |
|
|
| | | | | | | 2,946,070,638 |
| ASSET-BACKED SECURITIES: 0.2% | | | | | | |
CA Infrastructure and Econ. Dev. Bank Special Purpose Trust PGE-1 Rate Reduction Ctf. 1997-1 A-7, 6.42%, 9/25/08 | | | 9,023,135 | | | 9,295,012 |
CA Infrastructure and Econ. Dev. Bank Special Purpose Trust SCE-1 Rate Reduction Ctf. 1997-1 A-6, 6.38%, 9/25/08 | | | 7,321,945 | | | 7,548,871 |
| | | | | |
|
|
| | | | | | | 16,843,883 |
| CORPORATE: 31.5% | | | | | | |
| INDUSTRIALS: 23.4% | | | | | | |
AT&T Corp. | | | | | | |
9.05%, 11/15/11 | | | 79,605,000 | | | 91,645,256 |
9.75%, 11/15/31 | | | 121,565,000 | | | 145,118,219 |
Amerada Hess Corp. | | | | | | |
6.65%, 8/15/11 | | | 21,400,000 | | | 23,533,045 |
7.875%, 10/1/29 | | | 30,080,000 | | | 35,590,836 |
Cardinal Health, Inc., 6.75%, 2/15/11 | | | 9,895,000 | | | 10,884,916 |
Comcast Corp., 5.30%, 1/15/14 | | | 99,100,000 | | | 102,203,217 |
Dillard’s, Inc. | | | | | | |
7.375%, 6/1/06 | | | 4,875,000 | | | 5,106,563 |
6.625%, 11/15/08 | | | 3,300,000 | | | 3,436,125 |
7.13%, 8/1/18 | | | 20,365,000 | | | 20,517,737 |
7.75%, 7/15/26 | | | 13,150,000 | | | 13,281,500 |
7.00%, 12/1/28 | | | 2,075,000 | | | 2,002,375 |
Dow Chemical Co. | | | | | | |
4.027%, 9/30/09(d) | | | 37,862,000 | | | 36,975,423 |
7.375%, 11/1/29 | | | 27,500,000 | | | 33,365,283 |
Electronic Data Systems Corp.,
6.50%, 8/1/13 | | | 38,610,000 | | | 40,767,951 |
Ford Motor Credit Co. | | | | | | |
5.80%, 1/12/09 | | | 30,125,000 | | | 30,792,028 |
7.375%, 10/28/09 | | | 10,100,000 | | | 10,894,547 |
7.25%, 10/25/11 | | | 126,000,000 | | | 135,125,676 |
| | | | | | |
| | |
| | | PAR VALUE | | MARKET VALUE |
GMAC, | | | | | | |
7.75%, 1/19/10 | | $ | 5,525,000 | | $ | 5,930,071 |
8.875%, 6/1/10, Putable 2005 | | | 36,735,000 | | | 41,443,288 |
6.875%, 9/15/11 | | | 105,345,000 | | | 107,956,819 |
General Electric Co., 5.00%, 2/1/13 | | | 9,100,000 | | | 9,336,281 |
HCA, Inc. | | | | | | |
8.75%, 9/1/10 | | | 54,550,000 | | | 62,355,287 |
7.875%, 2/1/11 | | | 33,645,000 | | | 37,060,001 |
6.25%, 2/15/13 | | | 15,200,000 | | | 15,333,274 |
6.75%, 7/15/13 | | | 15,025,000 | | | 15,615,858 |
5.75%, 3/15/14 | | | 28,650,000 | | | 27,753,914 |
Hewlett-Packard Co., 5.50%, 7/1/07 | | | 35,850,000 | | | 37,386,889 |
International Paper Co., 5.25%, 4/1/16 | | | 26,690,000 | | | 26,642,892 |
Lockheed Martin Corp., 7.65%, 5/1/16 | | | 15,000,000 | | | 18,378,495 |
May Department Stores Co. | | | | | | |
8.00%, 7/15/12 | | | 5,000,000 | | | 5,893,115 |
7.625%, 8/15/13 | | | 7,105,000 | | | 8,248,422 |
7.60%, 6/1/25 | | | 13,500,000 | | | 15,457,635 |
6.70%, 9/15/28 | | | 17,350,000 | | | 18,180,527 |
8.75%, 5/15/29 | | | 28,177,000 | | | 36,441,878 |
7.875%, 3/1/30 | | | 35,505,000 | | | 42,148,021 |
6.90%, 1/15/32 | | | 25,465,000 | | | 27,539,252 |
7.875%, 8/15/36, Callable 2016 | | | 7,725,000 | | | 8,752,131 |
Raytheon Co. | | | | | | |
6.75%, 8/15/07 | | | 6,727,000 | | | 7,247,044 |
6.15%, 11/1/08 | | | 3,024,000 | | | 3,251,193 |
6.55%, 3/15/10 | | | 10,150,000 | | | 11,168,898 |
7.20%, 8/15/27 | | | 15,200,000 | | | 17,989,337 |
7.00%, 11/1/28 | | | 2,350,000 | | | 2,731,224 |
Time Warner Entertainment | | | | | | |
8.375%, 3/15/23 | | | 10,787,000 | | | 13,523,748 |
8.375%, 7/15/33 | | | 38,520,000 | | | 49,764,797 |
Time Warner, Inc. (AOL Time Warner)(e) | | | | | | |
7.625%, 4/15/31 | | | 63,030,000 | | | 76,251,236 |
7.70%, 5/1/32 | | | 47,680,000 | | | 58,318,266 |
Wyeth | | | | | | |
5.50%, 3/15/13 | | | 5,050,000 | | | 5,248,581 |
5.50%, 2/1/14 | | | 99,875,000 | | | 103,329,477 |
Wyeth (American Home Products)(e) 6.95%, 3/15/11 | | | 25,355,000 | | | 28,548,741 |
Xerox Corp. | | | | | | |
9.75%, 1/15/09 | | | 44,100,000 | | | 51,817,500 |
7.125%, 6/15/10 | | | 72,530,000 | | | 78,332,400 |
6.875%, 8/15/11 | | | 7,325,000 | | | 7,801,125 |
7.20%, 4/1/16 | | | 17,346,000 | | | 18,560,220 |
| | | | | |
|
|
| | | | | | | 1,842,978,534 |
| FINANCIALS: 7.0% | | | | | | |
BankAmerica Capital II(b), 8.00%, 12/15/26, Callable 2006 | | | 7,575,000 | | | 8,305,472 |
Boston Properties, Inc. | | | | | | |
6.25%, 1/15/13 | | | 32,300,000 | | | 35,043,530 |
5.625%, 4/15/15 | | | 30,880,000 | | | 31,830,208 |
| | |
| 7 / Dodge & Cox Income Fund | | See accompanying Notes to Financial Statements |
Portfolio of Investments | December 31, 2004 |
| | | | | | |
| FIXED-INCOME SECURITIES (continued) |
| | |
| | | PAR VALUE | | MARKET VALUE |
| FINANCIALS (continued) | | | | | | |
CIGNA Corp. | | | | | | |
7.00%, 1/15/11 | | $ | 12,165,000 | | $ | 13,594,667 |
6.375%, 10/15/11 | | | 28,635,000 | | | 31,172,433 |
7.65%, 3/1/23 | | | 1,140,000 | | | 1,324,898 |
7.875%, 5/15/27 | | | 25,865,000 | | | 31,353,967 |
CIT Group, Inc. | | | | | | |
7.375%, 4/2/07 | | | 14,065,000 | | | 15,186,712 |
5.75%, 9/25/07 | | | 4,100,000 | | | 4,310,145 |
Citicorp Capital Trust I(b), 7.933%, 2/15/27, Callable 2007 | | | 6,325,000 | | | 6,964,913 |
Citicorp Capital Trust II(b), 8.015%, 2/15/27, Callable 2007 | | | 10,300,000 | | | 11,398,989 |
Citigroup, Inc. (First Nationwide)(e), 10.00%, 10/1/06 | | | 4,015,000 | | | 4,434,182 |
EOP Operating Limited Partnership(c) | | | | | | |
6.80%, 1/15/09 | | | 17,240,000 | | | 18,897,006 |
7.00%, 7/15/11 | | | 15,750,000 | | | 17,761,952 |
5.875%, 1/15/13 | | | 35,150,000 | | | 37,152,355 |
4.75%, 3/15/14 | | | 37,000,000 | | | 35,792,653 |
Health Net, Inc., 9.875%, 4/15/11 | | | 49,718,000 | | | 59,978,254 |
JPMorgan Chase(d) (Bank One),
7.625%, 8/1/05 | | | 12,825,000 | | | 13,175,482 |
JPMorgan Chase Capital III (Bank One)(b, e), 8.75%, 9/1/30 | | | 19,065,000 | | | 25,807,833 |
Safeco Corp., | | | | | | |
4.875%, 2/1/10 | | | 15,075,000 | | | 15,435,323 |
7.25%, 9/1/12 | | | 17,873,000 | | | 20,401,457 |
St. Paul Travelers Companies, Inc. | | | | | | |
7.875%, 4/15/05 | | | 13,750,000 | | | 13,935,103 |
8.125%, 4/15/10 | | | 12,000,000 | | | 14,015,676 |
UnumProvident Corp. | | | | | | |
7.625%, 3/1/11 | | | 35,950,000 | | | 37,657,625 |
7.19%, 2/1/28 | | | 9,060,000 | | | 8,078,512 |
7.375%, 6/15/32 | | | 25,445,000 | | | 24,331,781 |
UnumProvident Corp. (Provident
Companies, Inc.)(e), 7.25%, 3/15/28 | | | 15,370,000 | | | 14,543,863 |
| | | | | |
|
|
| | | | | | | 551,884,991 |
| TRANSPORTATION: 1.1% | | | | | | |
Burlington Northern Santa Fe Railway,
7.57%, 1/2/21 | | | 13,004,329 | | | 15,334,705 |
CSX Transportation, Inc., 9.75%, 6/15/20 | | | 10,072,000 | | | 14,050,510 |
Federal Express, 6.72%, 1/15/22 | | | 8,562,494 | | | 9,628,268 |
Norfolk Southern Corp., 9.75%, 6/15/20 | | | 13,908,000 | | | 19,669,598 |
Union Pacific Corp. | | | | | | |
6.85%, 1/2/19 | | | 6,468,829 | | | 7,254,016 |
6.70%, 2/23/19 | | | 14,168,985 | | | 15,711,421 |
| | | | | |
|
|
| | | | | | | 81,648,518 |
| | | | | |
|
|
| | | | | | | 2,476,512,043 |
| | | | | |
|
|
Total Fixed-Income Securities (Cost $7,533,254,692) | | | 7,721,908,949 |
| | | | | |
|
|
| | | | | | |
| SHORT-TERM INVESTMENTS: 3.0% | | |
| | |
| | | PAR VALUE | | MARKET VALUE |
SSgA Prime Money Market Fund | | $ | 39,569,281 | | $ | 39,569,281 |
State Street Repurchase Agreement 1.40%, 1/3/05 maturity value $192,128,412 (collateralized by U.S. Treasury Securities, value $195,964,449, 6.25%–8.125%, 8/15/19–8/15/23) | | | 192,106,000 | | | 192,106,000 |
| | | | | |
|
|
Total Short-term Investments
(Cost $231,675,281) | | | | | | 231,675,281 |
| | | | | |
|
|
| | | | | | | |
TOTAL INVESTMENTS
(Cost $7,764,929,973) | | 101.1 | % | | | 7,953,584,230 | |
OTHER ASSETS LESS LIABILITIES | | (1.1 | ) | | | (83,387,712 | ) |
| | |
|
| |
|
|
|
TOTAL NET ASSETS | | 100.0 | % | | $ | 7,870,196,518 | |
| | |
|
| |
|
|
|
| (a) | | CMO: Collateralized Mortgage Obligation
REMIC: Real Estate Mortgage Investment Conduit |
| (b) | | Cumulative Preferred Securities |
| (c) | | EOP Operating LP is the operating partnership of Equity Office Properties Trust. |
| (d) | | Securities exempt from registration under Rule 144A of the Securities Act of 1933. These securities may be resold in transactions exempt from registration, normally to qualified institutional buyers. As of December 31, 2004, these securities represented 0.8% of total net assets. |
| (e) | | When two issuers are identified, the first name refers to the acquirer or successor obligor, and the second name (within the parentheses) refers to the original issuer of the instrument. |
| | |
| See accompanying Notes to Financial Statements | | Dodge & Cox Income Fund / 8 |
| | | | |
| Statement of Assets and Liabilities | |
| December 31, 2004 | |
| Assets: | |
Investments, at market value
(identified cost $7,764,929,973) | | $ | 7,953,584,230 | |
Receivable for investments sold | | | 150,074,391 | |
Receivable for paydowns on
mortgage-backed securities | | | 9,156 | |
Receivable for Fund shares sold | | | 13,964,471 | |
Dividends and interest receivable | | | 79,343,153 | |
Prepaid expenses and other assets | | | 48,342 | |
| | |
|
|
|
| | | | 8,197,023,743 | |
| | |
|
|
|
| Liabilities: | |
Payable for investments purchased | | | 251,544,243 | |
Payable for Fund shares redeemed | | | 71,913,193 | |
Management fees payable | | | 2,658,604 | |
Accounts payable | | | 711,185 | |
| | |
|
|
|
| | | | 326,827,225 | |
| | |
|
|
|
| Net Assets | | $ | 7,870,196,518 | |
| | |
|
|
|
| Net Assets Consist of: | |
Paid in capital | | $ | 7,731,929,145 | |
Accumulated undistributed
net investment income | | | 2,334,451 | |
Accumulated undistributed net
realized loss on investments | | | (52,721,335 | ) |
Net unrealized appreciation on investments | | | 188,654,257 | |
| | |
|
|
|
| | | $ | 7,870,196,518 | |
| | |
|
|
|
Fund shares outstanding (par value $0.01 each, unlimited shares authorized) | | | 613,149,836 | |
Net asset value per share | | | $12.84 | |
| |
| Statement of Operations | | | | |
| Year Ended December 31, 2004 | |
| Investment Income: | |
Interest | | $ | 272,381,787 | |
| | |
|
|
|
| Expenses: | |
Management fees | | | 26,982,508 | |
Custodian and fund accounting fees | | | 143,490 | |
Transfer agent fees | | | 1,605,536 | |
Professional services | | | 84,225 | |
Shareholder reports | | | 365,199 | |
Registration fees | | | 522,829 | |
Trustees’ fees | | | 82,000 | |
Miscellaneous | | | 59,807 | |
| | |
|
|
|
| | | | 29,845,594 | |
| | |
|
|
|
| Net Investment Income | | | 242,536,193 | |
| | |
|
|
|
| Realized and Unrealized Gain (Loss) on Investments: | | | | |
Net realized gain | | | 16,364,800 | |
Net change in unrealized appreciation | | | (14,505,944 | ) |
| | |
|
|
|
Net realized and unrealized gain | | | 1,858,856 | |
| | |
|
|
|
| Net Increase in Net Assets from Operations | | $ | 244,395,049 | |
| | |
|
|
|
| | | | | | | | |
| Statement of Changes in Net Assets | |
| | | Year Ended
December 31, 2004 | | | Year Ended
December 31, 2003 | |
| | | | | | (Restated.
See Note 2) | |
| Operations: | | | | | |
Net investment income | | $ | 242,536,193 | | | $ | 182,530,719 | |
Net realized gain | | | 16,364,800 | | | | 20,167,865 | |
Net change in unrealized appreciation | | | (14,505,944 | ) | | | 62,935,604 | |
| | |
|
|
| |
|
|
|
Net increase in net assets from operations | | | 244,395,049 | | | | 265,634,188 | |
| | |
|
|
| |
|
|
|
| |
Distributions to
Shareholders from: | | | | | |
Net investment income | | | (289,903,700 | ) | | | (223,648,287 | ) |
Net realized gain | | | — | | | | (593,265 | ) |
| | |
|
|
| |
|
|
|
Total distributions | | | (289,903,700 | ) | | | (224,241,552 | ) |
| | |
|
|
| |
|
|
|
| |
| Fund Share Transactions: | | | | | |
Amounts received from
sale of shares | | | 3,644,938,350 | | | | 3,580,059,774 | |
Net asset value of shares issued in reinvestment of distributions | | | 249,578,904 | | | | 194,457,526 | |
Amounts paid for
shares redeemed | | | (1,676,183,293 | ) | | | (1,523,141,066 | ) |
| | |
|
|
| |
|
|
|
Net increase from Fund share transactions | | | 2,218,333,961 | | | | 2,251,376,234 | |
| | |
|
|
| |
|
|
|
Total increase in net assets | | | 2,172,825,310 | | | | 2,292,768,870 | |
| |
| Net Assets: | | | | | |
Beginning of year | | | 5,697,371,208 | | | | 3,404,602,338 | |
| | |
|
|
| |
|
|
|
End of year (including undistributed net investment income of $2,334,451 and $1,203,958, respectively) | | $ | 7,870,196,518 | | | $ | 5,697,371,208 | |
| | |
|
|
| |
|
|
|
| | |
Shares sold | | | 282,927,918 | | | | 277,328,740 | |
Shares issued in reinvestment of distributions | | | 19,509,574 | | | | 15,095,798 | |
Shares redeemed | | | (130,172,563 | ) | | | (118,162,594 | ) |
| | |
|
|
| |
|
|
|
Net increase in
shares outstanding | | | 172,264,929 | | | | 174,261,944 | |
| | |
|
|
| |
|
|
|
| | |
| 9 / Dodge & Cox Income Fund | | See accompanying Notes to Financial Statements |
Notes to Financial Statements
Note 1 — Organization and Significant Accounting Policies
Dodge & Cox Income Fund (the “Fund”) is one of the funds constituting the Dodge & Cox Funds (the “Trust”). The Trust is organized as a Delaware statutory trust and is registered under the Investment Company Act of 1940, as amended, as a diversified, open-end management investment company. The Fund commenced operations on January 3, 1989, and seeks high and stable current income consistent with long-term preservation of capital. Risk considerations and investment strategies of the Fund are discussed in the Fund’s Prospectus.
The Fund consistently follows accounting policies which are in conformity with accounting principles generally accepted in the United States of America. In preparing these financial statements, management is required to make estimates and assumptions that affect the reported amounts of assets and liabilities at the date of the financial statements and the reported amounts of income and expenses during the reporting period. Actual results could differ from those estimates. Significant accounting policies are as follows:
Security valuation. The Fund’s net assets are valued as of the close of trading on the New York Stock Exchange (the “NYSE”), generally 4:00 p.m. Eastern Time, each day that the NYSE is open for business. Fixed-income securities with original maturities of one year or more are priced on the basis of valuations furnished by pricing services which utilize both dealer-supplied valuations and electronic data processing techniques. Valuations of fixed-income securities take into account appropriate factors such as institutional-size trading markets in similar groups of securities, yield, quality, coupon rate, maturity, type of issue, trading characteristics and other market data and do not rely exclusively upon exchange or over-the-counter listed prices. Security values are not discounted based on the size of the Fund’s position. Securities for which market quotations are not readily available are valued at fair value as determined in good faith by or at the direction of the Board of Trustees. Short-term securities are valued at amortized cost which approximates current value. All securities held by the Fund are denominated in U.S. dollars.
Security transactions and related investment income. Security transactions are recorded by the Fund as of the date the trades are executed with brokers. Realized gains and losses on securities sold are determined on the basis of identified cost. Interest income is recorded on the accrual basis. Premiums and discounts on debt securities purchased are amortized and accreted, respectively, to interest income over the lives of the respective securities. The ability of the issuers of the debt securities held by the Fund to meet their obligations may be affected by economic developments in a specific industry, state or region. Debt obligations may be placed on non-accrual status and related interest income may be reduced by ceasing current accruals and writing off interest receivables when the collection of all or a portion of interest has become doubtful based on consistently applied procedures. A debt obligation is removed from non-accrual status when the issuer resumes interest payments or when collectibility of interest is reasonably assured.
Expenses. Expenses are recorded on the accrual basis. Most expenses of the Trust can be directly attributed to a specific fund. Expenses which cannot be directly attributed are apportioned among all of the funds in the Trust.
Repurchase agreements. The Fund may enter into repurchase agreements secured by U.S. government securities which involve the purchase of securities from a counterparty with a simultaneous commitment to resell the securities at an agreed-upon date and price. It is the Fund’s policy that its custodian take possession of the underlying collateral securities, the fair value of which exceeds the principal amount of the repurchase transaction, including accrued interest, at all times. In the event of default by the counterparty, the Fund has the contractual right to liquidate the securities and to apply the proceeds in satisfaction of the obligation.
Income taxes and distributions to shareholders. No provision for federal income taxes has been included in the accompanying financial statements since the Fund intends to distribute all of its taxable income and continue to comply with requirements for regulated investment companies. Distributions to shareholders of income and capital gains are reflected in the net asset value per share computation on the ex-dividend date. Income and capital gain distributions are determined in accordance with income tax regulations, which may differ from accounting principles generally accepted in the United States of America. Temporary differences between financial statement and tax
| | |
| | | Dodge & Cox Income Fund / 10 |
Notes to Financial Statements (continued)
treatments may occur when certain items of income, expense, gain or loss are recognized in different periods for financial statement and tax purposes. Differences in classification between income and gains may also arise due to differing financial statement and tax treatments of realized short-term gains and paydown gains and losses. Permanent differences are reclassified among capital accounts in the financial statements to reflect their tax character. These adjustments have no impact on net assets or results of operations.
Note 2 — Restatement
In preparing these financial statements, management determined that it had misclassified certain paydown losses on mortgage-related securities in prior years by recording them as realized losses rather than as an offset to net investment income. The misclassifications had no impact on amounts previously reported for net asset value, distributions paid, amounts of taxable income reported to shareholders, total return, portfolio turnover rate, security valuation, or net change in net assets from operations. These financial statements have been restated to reclassify amounts reported for net investment income and net realized gain in the Statement of Changes in Net Assets for the year ended December 31, 2003, and to restate the ratio of net investment income to average net assets for the years ended December 31, 2003 and 2002 in the Financial Highlights. The amounts before and after the restatement are shown in the table below:
| | | | |
| | | As originally reported
| | Restated
|
Net investment income | | $223,286,719 | | $182,530,719 |
Net realized gain (loss) | | (20,588,135) | | 20,167,865 |
Ratio of net investment income to average | | | | |
net assets: 2003 | | 4.81% | | 3.93% |
2002 | | 5.67% | | 5.38% |
Note 3 — Related Party Transactions
Management fees. Under a written agreement, the Fund pays an annual management fee of 0.50% of the Fund’s average daily net asset value up to $100 million and 0.40% of the Fund’s average daily net asset value in excess of $100 million to Dodge & Cox, investment manager of the Fund. The agreement further provides that Dodge & Cox shall waive its fee to the extent that such fee plus all other ordinary operating expenses of the Fund exceed 1% of the average daily net assets for the year.
Trustees’ fees. All officers and three of the trustees of the Trust are officers and employees of Dodge & Cox. Those trustees who are not affiliated with Dodge & Cox receive from the Trust an annual fee plus an attendance fee for each Board or Committee meeting attended. Payments to trustees are divided equally among each fund in the Trust. The Trust does not pay any other remuneration to its officers or trustees.
Indemnifications. Under the Trust’s organizational documents, its officers and trustees are indemnified against certain liabilities arising out of the performance of their duties to the Trust. In addition, in the normal course of business the Trust enters into contracts that provide general indemnifications to other parties. The Trust’s maximum exposure under these arrangements is unknown as this would involve future claims that may be made against the Trust that have not yet occurred.
Note 4 — Distributions Paid, Distributable Earnings and Investment Transactions
Distributions paid during the years ended December 31, 2003 and 2002 were characterized as follows for federal tax purposes:
| | | | |
| | | 2004
| | 2003
|
| Ordinary income | | $289,903,700 | | $223,648,287 |
| | | ($0.54 per share) | | ($0.60 per share) |
| Long-term capital gain | | — | | $593,265 |
| | | — | | ($0.00 per share) |
At December 31, 2004, the tax basis components of accumulated undistributed income and net realized gain include $2,334,451 of ordinary income and no long-term capital gain. For federal tax purposes, the Fund had a capital loss carryforward of $46,621,637 as of December 31, 2004, which is available for offsetting capital gains realized in future periods, of which $14,093,589 will expire in 2011 and $32,528,048 will expire in 2012 if not utilized. As permitted by federal tax law, the Fund elected to defer realized net capital losses of $6,099,698 occurring between November 1, 2004 and December 31, 2004, and to treat those losses as arising in the year ending December 31, 2005. At December 31, 2004, the cost of
| | |
| 11 / Dodge & Cox Income Fund | | |
Notes to Financial Statements (continued)
investments for federal income tax purposes was equal to the cost for financial reporting purposes. Net unrealized appreciation aggregated $188,654,257, of which $207,452,589 represented appreciated securities and $18,798,332 represented depreciated securities.
For the year ended December 31, 2004, purchases and sales of securities, other than short-term securities and U.S. government securities, aggregated $929,028,057 and $240,322,142, respectively. For the year ended December 31, 2004, purchases and sales of U.S. government securities aggregated $3,996,107,845 and $2,240,222,989, respectively.
Financial Highlights
| | | | | | | | | | | | | | | |
| SELECTED DATA AND RATIOS (for a share outstanding throughout each year) | | | Year Ended December 31, | |
| | | 2004 | | | 2003 | | | 2002 | | | 2001 | | | 2000 | |
Net asset value, beginning of year | | $12.92 | | | $12.77 | | | $12.20 | | | $11.80 | | | $11.40 | |
| | | | | |
Income from investment operations: | | | | | | | | | | | | | | | |
Net investment income | | 0.54 | | | 0.60 | | | 0.66 | | | 0.74 | | | 0.77 | |
Net realized and unrealized gain (loss) | | (0.08 | ) | | 0.15 | | | 0.62 | | | 0.46 | | | 0.41 | |
| | |
|
| |
|
| |
|
| |
|
| |
|
|
Total from investment operations | | 0.46 | | | 0.75 | | | 1.28 | | | 1.20 | | | 1.18 | |
| | |
|
| |
|
| |
|
| |
|
| |
|
|
Distributions to shareholders from: | | | | | | | | | | | | | | | |
Net investment income | | (0.54 | ) | | (0.60 | ) | | (0.66 | ) | | (0.74 | ) | | (0.78 | ) |
Net realized gain | | — | | | — | | | (0.05 | ) | | (0.06 | ) | | — | |
| | |
|
| |
|
| |
|
| |
|
| |
|
|
Total distributions | | (0.54 | ) | | (0.60 | ) | | (0.71 | ) | | (0.80 | ) | | (0.78 | ) |
| | |
|
| |
|
| |
|
| |
|
| |
|
|
Net asset value, end of year | | $12.84 | | | $12.92 | | | $12.77 | | | $12.20 | | | $11.80 | |
| | |
|
| |
|
| |
|
| |
|
| |
|
|
Total return | | 3.64 | % | | 5.97 | % | | 10.75 | % | | 10.32 | % | | 10.70 | % |
Ratios/supplemental data: | | | | | | | | | | | | | | | |
Net assets, end of year (millions) | | $7,870 | | | $5,697 | | | $3,405 | | | $1,512 | | | $1,021 | |
Ratio of expenses to average net assets | | 0.44 | % | | 0.45 | % | | 0.45 | % | | 0.45 | % | | 0.46 | % |
Ratio of net investment income to average net assets | | 3.61 | % | | 3.93 | %* | | 5.38 | %* | | 6.18 | % | | 6.67 | % |
Portfolio turnover rate | | 30 | % | | 41 | % | | 31 | % | | 40 | % | | 34 | % |
| * | | As restated. See Note 2 of Notes to Financial Statements. |
| | |
| | | Dodge & Cox Income Fund / 12 |
Report of Independent Registered Public Accounting Firm
To the Trustees of Dodge & Cox Funds and Shareholders of Dodge & Cox Income Fund
In our opinion, the accompanying statement of assets and liabilities, including the portfolio of investments, and the related statements of operations and of changes in net assets and the financial highlights present fairly, in all material respects, the financial position of the Dodge & Cox Income Fund (the “Fund”, one of the series constituting Dodge & Cox Funds) at December 31, 2004, the results of its operations for the year then ended, the changes in its net assets for each of the two years in the period then ended and the financial highlights for each of the five years in the period then ended, in conformity with accounting principles generally accepted in the United States of America. These financial statements and financial highlights (hereafter referred to as “financial statements”) are the responsibility of the Fund’s management; our responsibility is to express an opinion on these financial statements based on our audits. We conducted our audits of these financial statements in accordance with the standards of the Public Company Accounting Oversight Board (United States). Those standards require that we plan and perform the audit to obtain reasonable assurance about whether the financial statements are free of material misstatement. An audit includes examining, on a test basis, evidence supporting the amounts and disclosures in the financial statements, assessing the accounting principles used and significant estimates made by management, and evaluating the overall financial statement presentation. We believe that our audits, which included confirmation of securities at December 31, 2004 by correspondence with the custodian and brokers, provide a reasonable basis for our opinion.
As discussed in Note 2 to the Financial Statements, the Fund has restated the net investment income and net realized gain reported in the Statement of Changes in Net Assets for the year ended December 31, 2003, and has restated the ratio of net investment income to average net assets in the Financial Highlights for the years ended December 31, 2003 and 2002.
PricewaterhouseCoopers LLP
San Francisco, California
February 18, 2005
| | |
| 13 / Dodge & Cox Income Fund | | |
Fund’s Holdings
The Funds provide a complete list of their holdings four times in each fiscal year, at the quarter-ends. The lists appear in the Funds’ First Quarter, Semi-Annual, Third Quarter and Annual Reports to shareholders. The Funds file the lists with the Securities and Exchange Commission (SEC) on Form N-CSR (second and fourth quarters) and Form N-Q (first and third quarters). Shareholders may view the Funds’ Forms N-CSR and N-Q on the SEC’s website at www.sec.gov. Forms N-CSR and N-Q may also be reviewed and copied at the SEC’s Public Reference Room in Washington, DC. Information regarding the operations of the Public Reference Room may be obtained by 1-202-942-8090 (direct) or 1-800/SEC-0330 (general SEC number). A complete list of the Funds’ quarter-end holdings are also available at www.dodgeandcox.com on or about 15 days following each quarter end.
Proxy Voting
For a free copy of the Fund’s proxy voting policies and procedures, please call (800) 621-3979, visit www.dodgeandcox.com or the Securities and Exchange Commission’s web site at www.sec.gov. Information regarding how Dodge & Cox, on behalf of the Fund, voted proxies relating to the Fund’s portfolio securities for the most recent twelve-month period ending June 30 is available at www.dodgeandcox.com or the SEC’s web site at www.sec.gov.
| | |
| | | Dodge & Cox Income Fund / 14 |
Dodge & Cox Funds—Executive Officer & Trustee Information (unaudited)
| | | | | | |
Name (Age) and
Address* | | Position with Trust
(Year of Election
or Appointment) | | Principal Occupation During Past 5 Years | | Other Directorships Held by Trustees |
| Interested Trustees & Officers |
Harry R. Hagey (63) | | Chairman and Trustee (Trustee since 1975) | | Chairman, Chief Executive Officer and Director of Dodge & Cox, Portfolio Manager and member of Investment Policy Committee (IPC) | | — |
John A. Gunn (61) | | President and Trustee
(Trustee since 1985) | | President, Chief Investment Officer and Director of Dodge & Cox, Portfolio Manager, and member of IPC, Fixed Income Strategy Committee (FISC) and member of International Investment Policy Committee (IIPC) | | — |
Dana M. Emery (43) | | Vice President and Trustee (Trustee since 1993) | | Senior Vice President and Director of Dodge & Cox, Manager of the Fixed Income Department, Portfolio Manager, and member of IPC and FISC | | — |
A. Horton Shapiro (65) | | Executive Vice President (Officer since 1985) | | Senior Vice President and Director of Dodge & Cox and Portfolio Manager | | — |
| Katherine Herrick Drake (50) | | Vice President (Officer since 1993) | | Vice President of Dodge & Cox and Portfolio Manager | | — |
Kenneth E. Olivier (52) | | Vice President
(Officer since 1992) | | Executive Vice President (since 2002) and Director of Dodge & Cox, Portfolio Manager and member of IPC | | — |
| Diana S. Strandberg (45) | | Vice President
(Officer since 2001) | | Vice President of Dodge & Cox, Portfolio Manager and member of the IIPC | | |
John M. Loll (38) | | Treasurer and Assistant Secretary (Officer since 2000) | | Vice President and Treasurer of Dodge & Cox | | — |
| Thomas M. Mistele (51) | | Secretary and Assistant Treasurer (Officer since 2000) | | Chief Operating Officer (since 2004), Secretary and General Counsel of Dodge & Cox | | — |
| Marcia P. Venegas (36) | | Chief Compliance Officer
(Officer since 2004) | | Chief Compliance Officer of the Trust (since 2004), Compliance Officer of Dodge & Cox (2003-2004); Compliance and Business Risk Manager of Deutsche Asset Management, Australia Limited (1999-2001) | | |
| Independent Trustees |
William F. Ausfahl (64) | | Trustee (Since 2002) | | CFO, The Clorox Co. (1982-1997); Director, The Clorox Co. (1984-1997) | | — |
L. Dale Crandall (63) | | Trustee (Since 1999) | | President, Kaiser Foundation Health Plan, Inc. and Kaiser Foundation Hospitals (2000-2002); Senior Vice President–Finance and Administration & CFO, Kaiser Foundation Health Plan, Inc. and Kaiser Foundation Hospitals (1998-2000) | | Director, Union BanCal Corporation (bank holding company) and Union Bank of California (commercial bank) (2001-Present); Director, Covad Communications Group (broadband communications services) (2002-Present); Director, Ansell Limited (medical equipment and supplies) (2002-Present); Director, BEA Systems, Inc. (software and programming) (2003-Present); Director, Coventry Health Care Inc. (managed healthcare) (2004-Present) |
Thomas A. Larsen (55) | | Trustee (Since 2002) | | Director in Howard, Rice, Nemerovski, Canady, Falk & Rabkin (law firm) | | — |
Will C. Wood (65) | | Trustee (Since 1992) | | Principal, Kentwood Associates, Financial Advisers | | Director, Banco Latinoamericano de Exportaciones S.A. (Latin American Foreign Trade Bank) (1999-Present); Director, Dover Investment Corp. (real estate development) (1992-Present) |
| * | | The address for each Officer and Trustee is 555 California Street, 40th Floor, San Francisco, California 94104. Each Officer and Trustee oversees all four series in the Dodge & Cox Funds complex and serves for an indefinite term. |
Additional information about the Trust’s Trustees is available in the Trust’s Statement of Additional Information (SAI). You can get a free copy of the SAI by contacting Dodge & Cox Funds at (800)-621-3979.
ITEM 2. CODE OF ETHICS.
A code of ethics, as defined in Item 2 of Form N-CSR, applicable to the registrant’s principal executive officer and principal financial officer, is filed as an exhibit to this Form N-CSR. No substantive amendments were approved or waivers were granted to this code of ethics during the period covered by this report.
ITEM 3. AUDIT COMMITTEE FINANCIAL EXPERT.
The Board of Trustees of the registrant has determined that William F. Ausfahl and L. Dale Crandall, members of the registrant’s Audit Committee, are each an “audit committee financial expert” and are “independent,” as defined in Item 3 of Form N-CSR.
ITEM 4. PRINCIPAL ACCOUNTANT FEES AND SERVICES.
(a)- (d) Aggregate fees billed to the registrant for the fiscal years ended December 31, 2004 and December 31, 2003 for professional services rendered by the registrant’s principal accountant were as follows:
| | | | | | |
| | | 2004
| | 2003
|
Audit Fees | | $ | 158,400 | | $ | 149,600 |
Audit-Related Fees | | | 16,500 | | | 16,000 |
Tax Fees | | | 55,200 | | | 51,240 |
All Other Fees | | | — | | | — |
Audit fees include amounts related to the audit of the registrant’s annual financial statements and services normally provided by the accountant in connection with statutory and regulatory filings. Audit-related fees include the performance of agreed-upon procedures in connection with the registrant’s semi-annual financial statements. Tax fees include amounts related to tax return preparation, compliance, and reviews.
(e)(1) The registrant’s audit committee has adopted policies and procedures (“Policies”) which require the registrant’s audit committee to pre-approve all audit and non-audit services provided by the principal accountant to the registrant. The policies also require the audit committee to pre-approve any engagement of the principal accountant to provide non-audit services to the registrant’s investment adviser, if the services directly impact the registrant’s operations and controls. The Policies do not apply in the case of audit services that the principal accountant provides to the registrant’s adviser. If a service (other than the engagement of the principal accountant to audit the registrant’s financial statements) is required to be pre-approved under the Policies between regularly scheduled audit committee meetings, pre-approval may be authorized by a designated audit committee member with ratification at the next scheduled audit committee meeting.
(e)(2) No services included in (b) - (d) above were approved pursuant to paragraph (c)(7)(i)(C) of Rule 2-01 of Regulation S-X.
(f) Less than 50 percent of the hours expended on the principal accountant’s engagement to audit the registrant’s financial statements for the most recent fiscal year were attributed to work performed by persons other than the principal accountant’s full-time, permanent employees.
(g) For the fiscal years ended December 31, 2004 and December 31, 2003, the aggregate fees billed by the registrant’s principal accountant for non-audit services rendered to the registrant, for non-audit services rendered to the registrant’s investment adviser, and for non-audit services rendered to entities controlled by the adviser were $178,100 and $151,946, respectively.
(h) All non-audit services rendered in (g) were pre-approved by the registrant’s audit committee. Accordingly, these services were considered by the registrant’s audit committee in maintaining the principal accountant’s independence.
ITEM 5. AUDIT COMMITTEE OF LISTED REGISTRANTS.
Not applicable.
ITEM 6. SCHEDULE OF INVESTMENTS.
Not applicable. The complete schedule of investments is included in Item 1 of this Form N-CSR.
ITEM 7. DISCLOSURE OF PROXY VOTING POLICIES AND PROCEDURES FOR CLOSED-END MANAGEMENT INVESTMENT COMPANIES.
Not applicable.
ITEM 8. PORTFOLIO MANAGERS OF CLOSED-END MANAGEMENT INVESTMENT COMPANIES.
Not applicable.
ITEM 9. PURCHASES OF EQUITY SECURITIES BY CLOSED-END MANAGEMENT INVESTMENT COMPANY AND AFFILIATED PURCHASERS.
Not applicable.
ITEM 10. SUBMISSION OF MATTERS TO A VOTE OF SECURITY HOLDERS.
As of the end of the reporting period, the registrant did not have in place formal written procedures by which shareholders may recommend nominees to the registrant’s Board of Trustees; however, the registrant’s Statement of Additional Information provides that the registrant’s Governance Committee will consider shareholder recommendations for trustee nominees, and shareholders may send recommendations to the Secretary of the registrant.
ITEM 11. CONTROLS AND PROCEDURES.
(a) An evaluation was performed within 90 days of the filing of this report, under the supervision and with the participation of the registrant’s management, including the principal executive officer and principal financial officer, of the effectiveness of the design and operation of the registrant’s disclosure control and procedures. Based on that evaluation, the principal executive officer and principal financial officer concluded that the registrant’s disclosure control and procedures were effective.
(b) In the fourth quarter of 2004, a financial officer was added to the Fund’s financial reporting team and was appointed an Assistant Treasurer of the registrant. The Assistant Treasurer assisted with the preparation and review of financial statement disclosures. The registrant’s principal executive officer and principal financial officer are aware of no other changes in the registrant’s internal control over financial reporting that occurred during the registrant’s second fiscal quarter covered by this report that has materially affected, or is reasonably likely to materially affect, the registrant’s internal control over financial reporting.
ITEM 12. EXHIBITS.
(a) (1) The registrant’s code of ethics pursuant to Item 2 of Form N-CSR is attached. (EX.99A)
(a) (2) Certifications pursuant to Section 302 of the Sarbanes-Oxley Act of 2002 are attached. (EX.99B)
(a) (3) Not applicable.
(b) Certifications pursuant to Section 906 of the Sarbanes-Oxley Act of 2002 are attached. (EX.99C)
SIGNATURES
Pursuant to the requirements of the Securities Exchange Act of 1934 and the Investment Company Act of 1940, the registrant has duly caused this report to be signed on its behalf by the undersigned, thereunto duly authorized.
| | |
Dodge & Cox Funds |
| |
| By | | /s/ Harry R. Hagey
|
| | | Harry R. Hagey |
| | | Chairman – Principal Executive Officer |
|
| Date March 3, 2005 |
Pursuant to the requirements of the Securities Exchange Act of 1934 and the Investment Company Act of 1940, this report has been signed below by the following persons on behalf of the registrant and in the capacities and on the dates indicated.
| | |
| Dodge & Cox Funds |
| |
| By | | /s/ Harry R. Hagey
|
| | | Harry R. Hagey |
| | | Chairman – Principal Executive Officer |
| |
| By | | /s/ John M. Loll
|
| | | John M. Loll |
| | | Treasurer – Principal Financial Officer |
|
| Date March 3, 2005 |