UNITED STATES
SECURITIES AND EXCHANGE COMMISSION
Washington, D.C. 20549
FORM N-CSR
CERTIFIED SHAREHOLDER REPORT OF REGISTERED
MANAGEMENT INVESTMENT COMPANIES
Investment Company Act file number 811-173
DODGE & COX FUNDS
(Exact name of registrant as specified in charter)
One Sansome Street, 35th Floor
San Francisco, CA 94104
(Address of principal executive offices) (Zip code)
Thomas M. Mistele, Esq.
One Sansome Street, 35th Floor
San Francisco, CA 94104
(Name and address of agent for service)
Registrant’s telephone number, including area code: 415-981-1710
Date of fiscal year end: DECEMBER 31, 2003
Date of reporting period: DECEMBER 31, 2003
Form N-CSR is to be used by management investment companies to file reports with the Commission not later than 10 days after the transmission to stockholders of any report that is required to be transmitted to stockholders under Rule 30e-1 under the Investment Company Act of 1940 (17 CFR 270.30e-1). The Commission may use the information provided on Form N-CSR in its regulatory, disclosure review, inspection, and policymaking roles.
A registrant is required to disclose the information specified by Form N-CSR, and the Commission will make this information public. A registrant is not required to respond to the collection of information contained in Form N-CSR unless the Form displays a currently valid Office of Management and Budget (“OMB”) control number. Please direct comments concerning the accuracy of the information collection burden estimate and any suggestions for reducing the burden to Secretary, Securities and Exchange Commission, 450 Fifth Street, NW, Washington, DC 20549-0609. The OMB has reviewed this collection of information under the clearance requirements of 44 U.S.C. § 3507.
| ITEM 1. | | REPORT TO STOCKHOLDERS. |
The following are the December 31, 2003 annual reports for the Dodge & Cox Funds, a Delaware statutory trust, consisting of four series: Dodge & Cox Stock Fund, Dodge & Cox International Stock Fund, Dodge & Cox Balanced Fund and Dodge & Cox Income Fund. The reports of each series were transmitted to their respective shareholders on February 20, 2004

Stock Fund
Established 1965

39th Annual Report
December 31, 2003
2003
Stock Fund
www.dodgeandcox.com
For Fund literature, transactions and account
information, please visit the
Funds’ web site.
or write or call:
Dodge & Cox Funds
c/o Boston Financial Data Services
P.O. Box 8422
Boston, Massachusetts
02266-8422
(800) 621-3979
Investment Manager
Dodge & Cox
One Sansome Street
35th Floor
San Francisco, California
94104-4443
(415) 981-1710
This report is submitted for the general information of the shareholders of the Fund. The report is not authorized for distribution to prospective investors in the Fund unless it is accompanied by a current prospectus.
This report reflects our views,
opinions and portfolio holdings
as of December 31, 2003, the end of
the reporting period. The information
provided is not a complete analysis of every
aspect of any industry, security or the Fund.
The Fund’s portfolio composition may change
depending on market and economic conditions.
Although historical performance is
no guarantee of future results, these
insights may help you understand
our investment management
philosophy.
12/03 SF AR  Printed on recycled paper
To Our Shareholders
It was a good year for both the overall equity market and the Dodge & Cox Stock Fund—well beyond our expectations. The Fund had a total return of 32.4% for the year-ended December 31, 2003 compared to a 28.7% total return for the Standard & Poor’s 500 Index (S&P 500). Total returns for longer periods are listed on the following page. Regular readers of our quarterly letters may remember that we did not think double-digit returns were likely one year ago. Instead, the Fund had its third best return in the last twenty years. Conclusion: Forecasting the market on a short-term basis has a large error rate.
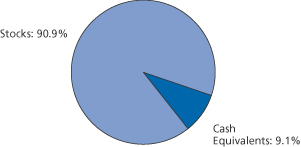
At year-end the Fund had total assets of $29.4 billion and a cash position of 9%. The share price of the Fund rose from $88.05 at the end of 2002 to $113.78 on December 31, 2003. In addition, during the year, the Fund distributed income dividends of $1.615 per share, short-term capital gain of $0.39 per share and long-term capital gain of $0.45 per share.
Deconstructing the Stock Fund’s
Long-Term Performance
When explaining past performance, we believe it helps to look at longer time periods than the last twelve months. Since the stock market moves independently of the calendar year, we will discuss the Fund’s annualized investment performance using three non-traditional time periods:
| 1) | | The Rise of the “New Economy” Bubble— |
| | | 12/31/1996 through 6/30/2000 (annualized) |
| | |
Stock Fund
| | S&P 500
|
| 14.3% | | 23.1% |
As you can see, for the 3½-year period ended June 30, 2000, the Fund’s results trailed the S&P 500. In 1997, 1998, 1999 and the first half of 2000, as stock market valuations rose to speculative levels, we sold or trimmed the few holdings the Fund had in the higher valuation areas of the S&P 500. During this period, most companies in the Technology, Media and Telecommunications sectors (the so-called “New Economy”) enjoyed extremely high valuations and drove the returns of the broad market. By the first half of 2000, the New Economy portion of the S&P 500 had reached stratospheric valuations, and the Fund had very little exposure in this broad area.
| | | 6/30/2000 through 6/30/2002 (annualized) |
| | |
Stock Fund
| | S&P 500
|
| 13.0% | | -16.4% |
During the two years ended June 30, 2002, the air rapidly left the bubble, as New Economy and other highly valued stocks dropped dramatically in value while a number of the Fund’s “Old Economy” stocks (those stocks not in the Technology/ Media/ Telecommunication sectors) appreciated significantly from relatively modest valuations. While the overall market declined, these two quite different segments within the S&P 500 achieved dramatically different returns, and the Fund’s relative and absolute returns reflected our concentration in Old Economy stocks. The Fund’s shareholders were rewarded for their patience. Please note: This two-year period is the primary reason that the Fund’s trailing five-year return is currently so far ahead of the S&P 500—relative results that will not be repeated.
| 3) | | The Past Eighteen Months— |
| | | 6/30/2002 through 12/31/2003 (annualized) |
| | |
Stock Fund
| | S&P 500
|
| 13.2% | | 10.0% |
During the past year and a half, we have witnessed the re-inflation of the S&P 500’s valuation, the Fund has continued to outperform the S&P 500, though by a smaller margin than the prior period.
2003 Performance Review
The Fund’s performance relative to the S&P 500 for 2003 should be considered in this longer-term context. Following the collapse of the bubble we identified a number of companies in the Technology, Media and Telecommunications sectors with attractive valuations, given our positive long-term outlook for their potential growth in profits and cash flow. Thus, we entered 2003 with a greater number of investments in companies that provide various technology products and services and are well positioned for long-term growth, such as Avaya (up 428% in 2003) and Corning (up 215% in 2003). While stocks in every sector, except for Telecommunications Services, contributed positively to the Fund’s results in 2003, technology-related companies were the strongest contributors to the Fund’s performance. Only a handful of companies declined. Eastman Kodak, one of the stock market’s strongest performers in 2002, was the Fund’s worst performer (down 24%) in 2003. AT&T and Schering-Plough also detracted from the Fund’s return, each with declines of 19% for the year. Please refer to the Fund’s third quarter letter for more detail on our view of the latter two stocks.
Closing the Stock Fund to New Investors
Throughout 2003, investors increasingly purchased new shares in the Stock Fund. In the fourth quarter, cash flowing into the Stock Fund accelerated rapidly. We have been able to accommodate these increased cash inflows in an orderly way, and importantly, we remain confident of our ability to find attractive investments with the assets that have been entrusted to us. However, we believe that accelerating cash flow into the Fund could eventually lead us to a different conclusion. As a result of our prospective caution, we decided to attempt to slow the pace and volume of assets coming into the Fund by closing the Stock Fund to new shareholders effective January 16, 2004. Existing shareholders may add to their holdings, including those that invest in the Fund via a retirement plan (and our other Funds remain open). If you have questions, please visit our web site at www.dodgeandcox.com.
Expected Returns
At the risk of looking like a stopped clock, we want to reiterate our caution about future equity returns. Over the next few years, we believe that there is a high probability
1 / Dodge & Cox Stock Fund
Dodge & Cox Stock Fund / 2
that total returns will be significantly lower (and possibly negative) than the past 20 years (13% annualized for the S&P 500). The S&P 500 is selling well above the average price-to-earnings ratio (P/E) in the postwar period, and net margins (a measure of profitability) are at historically high levels. The market is anticipating sustained economic growth in the U.S. At the same time, many economies outside the United States may be in the early stages of surprisingly strong economic expansion in terms of length and magnitude. In spite of these prospects for worldwide economic growth, these historically high valuations give us pause. A sign of our caution is that the Fund’s cash position is historically high at 9%.
Our Fundamental Approach
We continue to invest the Fund today as we always have. Dodge & Cox manages your money out of a single location in San Francisco. We operate as a team and value proximity when we discuss what investment decisions to make in the Fund. Thirty-two people are directly involved in the equity decisions, analysis and trading. Today, Dodge & Cox is a major owner of many companies in which the Fund is invested. Our equity staff concentrates on understanding the long-term economic prospects of the companies we own. We have a strong price discipline and usually buy lower valuation, less popular companies which we believe have attractive long-term profit and cash-flow prospects. The Fund’s turnover is low, typically less than 20% per year, and was only 8% in 2003. In future quarterly letters, we will continue to describe specific investments, as we have in the past. You may also review past shareholder letters at the Dodge & Cox Funds’ website, www.dodgeandcox.com.
In Closing
To our long-term shareholders, we thank you for sticking with us through some periods (the late 1990’s) when we didn’t look that swift. To new shareholders who have joined us in 2003 and as late as January 16, 2004, we welcome you aboard. As we said at the start of this letter, twelve months ago thoughts of appreciation in excess of 30% for 2003 were non-existent. The global economic world will continue to unfold in unforeseen ways. In this environment of continual change, our team at Dodge & Cox will do our best to uncover attractive investment values for the shareholders of the Dodge & Cox Stock Fund.
Thank you for the continued confidence you have placed in our firm as a shareholder of the Stock Fund. As always, we welcome your comments and questions.
For the Board of Trustees,
| | |
 | | 
|
| |
| Harry R. Hagey, Chairman | | John A. Gunn, President |
February 4, 2004
Ten Years of Investment Performance
through December 31, 2003 (in thousands)
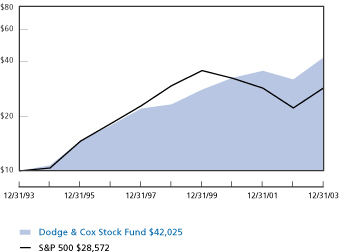
Average annual total return for periods ended December 31, 2003
| | | | | | | | | | | | |
| | | 1 Year | | | 5 Years | | | 10 Years | | | 20 Years | |
|
| Dodge & Cox Stock Fund | | 32.35 | % | | 12.60 | % | | 15.43 | % | | 15.42 | % |
| S&P 500 | | 28.67 | | | (0.56 | ) | | 11.07 | | | 12.98 | |
|
Past performance does not guarantee future results. Investment return and share price will fluctuate with market conditions, and investors may have a gain or loss when shares are sold. Mutual fund performance changes over time and currently may be significantly lower than stated above. Performance is updated and published monthly. Visit the Fund’s web site at www.dodgeandcox.com or call 800-621-3979 for current performance figures.
The Fund’s total returns include the reinvestment of dividend and capital gain distributions, but have not been adjusted for any income taxes payable by shareholders on these distributions. The Standard & Poor’s 500 (S&P 500) is a broad-based unmanaged measure of common stocks. Index returns include dividends and/or interest income and, unlike Fund returns, do not reflect fees or expenses.
Standard & Poor’s, Standard & Poor’s 500, and S&P 500® are trademarks of The McGraw-Hill Companies, Inc.
Dodge & Cox Stock Fund / 2
Fund Information | December 31, 2003 |
General Information
| | |
Net Asset Value Per Share | | $113.78 |
Total Net Assets (millions) | | $29,437 |
30-Day SEC Yield1 | | 1.26% |
2003 Expense Ratio | | 0.54% |
2003 Portfolio Turnover | | 8% |
Fund Inception Date | | 1965 |
Investment Manager: Dodge & Cox, San Francisco. Managed by the Investment Policy Committee, whose ten members’ average tenure at Dodge & Cox is 23 years.
Asset Allocation
| | | | |
| Stock Characteristics | | Fund | | S&P 500 |
|
| | |
Number of Stocks | | 82 | | 500 |
Median Market Capitalization (billions) | | $12 | | $9 |
Weighted-Average Market Cap. (billions) | | $28 | | $90 |
Price-to-Earnings Ratio2 | | 16x | | 18x |
Price-to-Book Value | | 2.0x | | 3.2x |
Foreign Stocks3 (% of Fund) | | 12.3% | | 0.0% |
| | | |
| Ten Largest Holdings | | | |
| |
AT&T | | 2.9 | % |
Hewlett-Packard | | 2.7 | |
Dow Chemical | | 2.4 | |
Bank One | | 2.4 | |
Schering-Plough | | 2.3 | |
HCA—The Healthcare Company | | 2.2 | |
Sony ADR (Japan) | | 2.2 | |
News Corp. Ltd., Pref. ADR (Australia) | | 2.2 | |
Comcast | | 2.2 | |
Electronic Data Systems | | 2.0 | |
| | | | | | |
| Sector Diversification | | Fund | | | S&P 500 | |
| |
| | |
Consumer Discretionary | | 19.2 | % | | 10.9 | % |
Financials | | 16.8 | | | 20.8 | |
Information Technology | | 12.1 | | | 17.9 | |
Health Care | | 10.0 | | | 13.5 | |
Materials | | 9.7 | | | 3.0 | |
Energy | | 8.3 | | | 5.9 | |
Industrials | | 5.1 | | | 10.6 | |
Telecommunication Services | | 4.8 | | | 3.5 | |
Utilities | | 2.6 | | | 2.9 | |
Consumer Staples | | 2.3 | | | 11.0 | |
| 1 | | SEC Yield is an annualization of the Fund’s total net investment income per share for the 30-day period ended on the last day of the month. |
| 2 | | The Fund’s Price-to-earnings (P/E) ratio is calculated using Dodge & Cox’s estimated forward earnings and excludes extraordinary items. The S&P 500’s P/E ratio is calculated by Standard & Poor’s and uses an aggregated estimate of forward earnings. |
| 3 | | All U.S. dollar-denominated. |
3 / Dodge & Cox Stock Fund
Portfolio of Investments
December 31, 2003
COMMON STOCKS: 88.7%
| | | | | |
| SHARES | | MARKET VALUE |
| |
| CONSUMER DISCRETIONARY: 17.0% |
| CONSUMER DURABLES & APPAREL: 5.6% | | | |
| 18,791,100 | | Sony Corp. ADR(b) (Japan) | | $ | 651,487,437 |
| 26,879,500 | | Matsushita Electric Industrial Co., Ltd. ADR(b) (Japan) | | | 374,700,230 |
| 3,291,350 | | Whirlpool Corp. | | | 239,116,577 |
| 9,060,700 | | Eastman Kodak Co. | | | 232,588,169 |
| 3,513,700 | | VF Corp. | | | 151,932,388 |
| | | | |
|
|
| | | | | | 1,649,824,801 |
| MEDIA: 3.5% |
| 19,588,892 | | Comcast Corp.(a) | | | 643,886,880 |
| 20,625,500 | | Time Warner Inc.(a) | | | 371,052,745 |
| | | | |
|
|
| | | | | | 1,014,939,625 |
| RETAILING: 3.3% |
| 16,320,900 | | May Department Stores Co. | | | 474,448,563 |
| 8,995,700 | | Gap, Inc. | | | 208,790,197 |
| 6,061,700 | | Nordstrom, Inc. | | | 207,916,310 |
| 5,190,700 | | Dillard’s, Inc. Class A | | | 85,438,922 |
| | | | |
|
|
| | | | | | 976,593,992 |
| HOTELS, RESTAURANTS & LEISURE: 2.4% |
| 22,863,700 | | McDonald’s Corp. | | | 567,705,671 |
| 15,160,421 | | InterContinental Hotels Group PLC ADR(b) (United Kingdom) | | | 145,085,229 |
| | | | |
|
|
| | | | | | 712,790,900 |
| AUTOMOBILES & COMPONENTS: 1.2% |
| 30,557,032 | | Delphi Automotive Systems Corp. | | | 311,987,297 |
| 2,097,960 | | Ford Motor Co. | | | 33,567,360 |
| 130,200 | | Honda Motor Co. Ltd. ADR(b) (Japan) | | | 2,929,500 |
| | | | |
|
|
| | | | | | 348,484,157 |
| TRADING COMPANIES & DISTRIBUTORS: 1.0% |
| 8,976,800 | | Genuine Parts Co. | | | 298,029,760 |
| | | | |
|
|
| | | | | | 5,000,663,235 |
| FINANCIALS: 16.8% |
| BANKS: 5.9% |
| 15,314,550 | | Bank One Corp. | | | 698,190,334 |
| 4,461,350 | | Golden West Financial Corp. | | | 460,366,707 |
| 7,430,600 | | Wachovia Corp. | | | 346,191,654 |
| 4,223,700 | | Wells Fargo & Co. | | | 248,733,693 |
| | | | |
|
|
| | | | | | 1,753,482,388 |
| INSURANCE: 5.1% | | | |
| 7,819,800 | | Loews Corp. | | | 386,689,110 |
| 9,299,650 | | St. Paul Companies, Inc. | | | 368,731,122 |
| 3,852,050 | | Chubb Corp. | | | 262,324,605 |
| 4,537,800 | | Torchmark Corp. | | | 206,651,412 |
| 11,779,900 | | UNUMProvident Corp. | | | 185,769,023 |
| 1,572,400 | | MBIA, Inc. | | | 93,133,252 |
| | | | |
|
|
| | | | | | 1,503,298,524 |
| DIVERSIFIED FINANCIALS: 3.0% | | | |
| 7,567,500 | | Capital One Financial Corp. | | | 463,812,075 |
| 11,320,000 | | CIT Group, Inc. | | | 406,954,000 |
| | | | |
|
|
| | | | | | 870,766,075 |
| | | | | |
| |
| SHARES | | MARKET VALUE |
| |
| REAL ESTATE: 2.8% | | | |
| 18,569,200 | | Equity Office Properties Trust | | $ | 532,007,580 |
| 10,017,600 | | Equity Residential Properties Trust | | | 295,619,376 |
| | | | |
|
|
| | | | | | 827,626,956 |
| | | | |
|
|
| | | | | | 4,955,173,943 |
| INFORMATION TECHNOLOGY: 12.1% | | | |
| TECHNOLOGY HARDWARE & EQUIPMENT: 8.4% | | | |
| 34,327,289 | | Hewlett-Packard Co. | | | 788,497,828 |
| 41,985,600 | | Xerox Corp.(a) | | | 579,401,280 |
| 22,487,000 | | Motorola, Inc. | | | 316,392,090 |
| 5,819,800 | | NCR Corp.(a) | | | 225,808,240 |
| 7,451,500 | | Thermo Electron Corp.(a) | | | 187,777,800 |
| 13,685,200 | | Avaya, Inc.(a) | | | 177,086,488 |
| 6,000,100 | | Storage Technology Corp.(a) | | | 154,502,575 |
| 4,276,050 | | Corning, Inc.(a) | | | 44,599,202 |
| | | | |
|
|
| | | | | | 2,474,065,503 |
| SOFTWARE & SERVICES: 3.7% | | | |
| 24,105,200 | | Electronic Data Systems | | | 591,541,608 |
| 7,718,300 | | Computer Sciences Corp.(a) | | | 341,380,409 |
| 19,401,100 | | Compuware Corp.(a) | | | 117,182,644 |
| 2,518,500 | | BMC Software, Inc.(a) | | | 46,970,025 |
| | | | |
|
|
| | | | | | 1,097,074,686 |
| | | | |
|
|
| | | | | | 3,571,140,189 |
| HEALTH CARE: 10.0% | | | |
| PHARMACEUTICALS & BIOTECHNOLOGY: 4.8% | | | |
| 39,249,100 | | Schering-Plough Corp. | | | 682,541,849 |
| 7,462,165 | | Pfizer Inc. | | | 263,638,289 |
| 8,963,650 | | Bristol-Myers Squibb Co. | | | 256,360,390 |
| 4,550,400 | | Wyeth | | | 193,164,480 |
| | | | |
|
|
| | | | | | 1,395,705,008 |
| HEALTH CARE EQUIPMENT & SERVICES: 3.9% | | | |
| 15,210,800 | | HCA—The Healthcare Company | | | 653,455,968 |
| 3,366,650 | | WellPoint Health Networks, Inc.(a) | | | 326,531,384 |
| 4,234,150 | | Becton, Dickinson & Co. | | | 174,192,931 |
| | | | |
|
|
| | | | | | 1,154,180,283 |
| HEALTH CARE PROVIDERS & SERVICES: 1.3% | | | |
| 6,269,800 | | Cardinal Health, Inc. | | | 383,460,968 |
| | | | |
|
|
| | | | | | 2,933,346,259 |
| MATERIALS: 9.7% | | | |
| CHEMICALS: 7.0% | | | |
| 17,343,614 | | Dow Chemical Co. | | | 720,974,034 |
| 13,562,223 | | Akzo Nobel N.V. ADR(b) (Netherlands) | | | 518,076,919 |
| 6,802,700 | | Rohm and Haas Co. | | | 290,543,317 |
| 5,682,700 | | Engelhard Corp. | | | 170,196,865 |
| 12,288,400 | | Syngenta A.G. ADR(b) (Switzerland) | | | 165,647,632 |
| 5,756,770 | | NOVA Chemicals Corp.(b) (Canada) | | | 155,144,951 |
| 932,300 | | Lubrizol Corp. | | | 30,318,396 |
| | | | |
|
|
| | | | | | 2,050,902,114 |
| |
See accompanying Notes to Financial Statements | Dodge & Cox Stock Fund / 4 |
Portfolio of Investments
December 31, 2003
COMMON STOCKS (continued)
| | | | | |
| SHARES | | | | MARKET VALUE |
| |
| METALS AND MINING: 2.1% | | | |
| 2,895,131 | | Rio Tinto PLC ADR(b) (United Kingdom) | | $ | 322,257,032 |
| 7,832,500 | | Alcoa, Inc. | | | 297,635,000 |
| | | | |
|
|
| | | | | | 619,892,032 |
| PAPER AND FOREST PRODUCTS: 0.6% | | | |
| 4,454,900 | | International Paper Co. | | | 192,050,739 |
| | | | |
|
|
| | | | | | 2,862,844,885 |
| ENERGY: 8.3% | | | |
| 6,050,714 | | ChevronTexaco Corp. | | | 522,721,182 |
| 13,155,700 | | Unocal Corp. | | | 484,524,431 |
| 6,475,300 | | ConocoPhillips | | | 424,585,421 |
| 9,523,200 | | Occidental Petroleum Corp. | | | 402,259,968 |
| 9,746,750 | | Baker Hughes, Inc. | | | 313,455,480 |
| 5,639,100 | | Amerada Hess Corp. | | | 299,830,947 |
| | | | |
|
|
| | | | | | 2,447,377,429 |
| INDUSTRIALS: 5.1% | | | |
| TRANSPORTATION: 2.6% | | | |
| 5,744,050 | | Union Pacific Corp. | | | 399,096,594 |
| 5,315,800 | | FedEx Corp. | | | 358,816,500 |
| | | | |
|
|
| | | | | | 757,913,094 |
| CAPITAL GOODS: 1.4% | | | |
| 8,239,000 | | Masco Corp. | | | 225,830,990 |
| 4,386,550 | | Fluor Corp. | | | 173,882,842 |
| | | | |
|
|
| | | | | | 399,713,832 |
| COMMERCIAL SERVICES & SUPPLIES: 1.1% | | | |
| 4,275,900 | | Pitney Bowes, Inc. | | | 173,687,058 |
| 5,270,900 | | R.R. Donnelley & Sons Co. | | | 158,917,635 |
| | | | |
|
|
| | | | | | 332,604,693 |
| | | | |
|
|
| | | | | | 1,490,231,619 |
| TELECOMMUNICATION SERVICES: 4.8% | | | |
| 41,562,080 | | AT&T Corp. | | | 843,710,224 |
| 70,811,700 | | AT&T Wireless Services, Inc.(a) | | | 565,785,483 |
| | | | |
|
|
| | | | | | 1,409,495,707 |
| UTILITIES: 2.6% | | | |
| 16,451,000 | | Duke Energy Corp. | | | 336,422,950 |
| 6,501,410 | | American Electric Power Co., Inc. | | | 198,358,019 |
| 4,200,300 | | Scottish Power PLC ADR(b) (United Kingdom) | | | 114,164,154 |
| 4,537,500 | | TXU Corp. | | | 107,629,500 |
| | | | |
|
|
| | | | | | 756,574,623 |
| CONSUMER STAPLES: 2.3% | | | |
| FOOD, BEVERAGE AND TOBACCO: 2.3% | | | |
| 7,978,700 | | Unilever N.V.(b) (Netherlands) | | | 517,817,630 |
| 10,272,666 | | Archer Daniels Midland Co. | | | 156,349,977 |
| | | | |
|
|
| | | | | | 674,167,607 |
| | | | |
|
|
| Total Common Stocks (cost $21,074,673,853) | | | 26,101,015,496 |
| | | | |
|
|
PREFERRED STOCKS: 2.2%
| | | | | |
| SHARES | | | | MARKET VALUE |
| |
| CONSUMER DISCRETIONARY: 2.2% | | | |
| MEDIA: 2.2% | | | |
| 21,419,869 | | News Corp. Ltd., Preferred Limited Voting Ordinary Shares ADR(b) (Australia) | | $ | 647,951,037 |
| | | | |
|
|
| Total Preferred Stocks (cost $505,389,183) | | | 647,951,037 |
| | | | |
|
|
SHORT-TERM INVESTMENTS: 9.3%
| | | | | |
| PAR VALUE | | | | |
| $ | 145,696,463 | | SSgA Prime Money Market Fund | | 145,696,463 |
| | 1,240,153,000 | | State Street Repurchase Agreement, 0.65%, 1/2/04 (collateralized by U.S. Treasury securities, value $1,265,028,227) | | 1,240,153,000 |
| | 275,000,000 | | U.S. Treasury Bills, 1/29/04 | | 274,791,555 |
| | 375,000,000 | | U.S. Treasury Bills, 3/18/04 | | 374,279,461 |
| | 100,000,000 | | U.S. Treasury Bills, 4/15/04 | | 99,709,792 |
| | 100,000,000 | | U.S. Treasury Bills, 5/13/04 | | 99,619,472 |
| | 200,000,000 | | U.S. Treasury Bills, 6/17/04 | | 199,104,000 |
| | 200,000,000 | | U.S. Treasury Bills, 6/24/04 | | 199,046,667 |
| | 100,000,000 | | U.S. Treasury Bills, 10/3/04 | | 99,555,231 |
| | | | | | |
|
|
| Total Short-Term Investments (cost $2,731,955,641) | 2,731,955,641 |
| | | | | | |
|
|
| | | | | | | | | |
TOTAL INVESTMENTS (cost $24,312,018,677) | | 100.2 | % | | | 29,480,922,174 | |
| OTHER ASSETS LESS LIABILITIES | | (0.2 | ) | | | (43,699,382 | ) |
| | | | |
|
| |
|
|
|
| TOTAL NET ASSETS | | | | 100.0 | % | | $ | 29,437,222,792 | |
| | | | |
|
| |
|
|
|
| | |
| (b) | | Foreign securities denominated in U.S. dollars |
5 / Dodge & Cox Stock Fund | See accompanying Notes to Financial Statements |
Statement of Assets and Liabilities
| | | |
|
December 31, 2003 |
| Assets: |
Investments, at market value
(identified cost $24,312,018,677) | | $ | 29,480,922,174 |
Cash | | | 471 |
Receivable for investments sold | | | 47,246,165 |
Receivable for Fund shares sold | | | 205,093,675 |
Dividends and interest receivable | | | 47,280,553 |
Prepaid expenses and other assets | | | 170,657 |
| | |
|
|
| | | | 29,780,713,695 |
| | |
|
|
| Liabilities: |
Payable for investments purchased | | | 264,214,552 |
Payable for Fund shares redeemed | | | 65,409,344 |
Management fees payable | | | 11,892,980 |
Accounts payable | | | 1,974,027 |
| | |
|
|
| | | | 343,490,903 |
| | |
|
|
| Net Assets | | $ | 29,437,222,792 |
| | |
|
|
| Net Assets Consist of: |
Paid in capital | | $ | 24,167,632,047 |
Accumulated undistributed
net investment income | | | 3,126,324 |
Accumulated undistributed net
realized gain on investments | | | 97,560,924 |
Net unrealized appreciation on investments | | | 5,168,903,497 |
| | |
|
|
| | | $ | 29,437,222,792 |
| | |
|
|
Beneficial shares outstanding (par value $0.01 each, unlimited shares authorized) | | | 258,717,216 |
Net asset value per share | | $ | 113.78 |
Statement of Operations
|
|
Year Ended December 31, 2003 |
| Investment Income: |
Dividends (net of foreign taxes of $6,172,060) | | $ | 434,184,308 |
Interest | | | 11,631,610 |
| | |
|
|
| | | | 445,815,918 |
| | |
|
|
| Expenses: |
Management fees (Note 2) | | | 98,932,648 |
Custodian and fund accounting fees | | | 437,579 |
Transfer agent fees | | | 4,295,151 |
Professional fees | | | 70,156 |
Shareholder reports | | | 936,625 |
Registration fees | | | 1,221,375 |
Trustees’ fees (Note 2) | | | 28,500 |
Miscellaneous | | | 193,692 |
| | |
|
|
| | | | 106,115,726 |
| | |
|
|
| Net Investment Income | | | 339,700,192 |
| | |
|
|
| Realized and Unrealized Gain on Investments: |
Net realized gain on investments | | | 330,946,926 |
Net unrealized appreciation on investments | | | 5,488,029,040 |
| | |
|
|
Net realized and unrealized
gain on investments | | | 5,818,975,966 |
| | |
|
|
| Net Increase in Net Assets from Operations | | $ | 6,158,676,158 |
| | |
|
|
Statement of Changes in Net Assets
| | | | | | | | |
| | |
| | | Year Ended
December 31, 2003 | | | Year Ended
December 31, 2002 | |
| Operations: | | | | | |
Net investment income | | $ | 339,700,192 | | | $ | 206,585,411 | |
Net realized gain | | | 330,946,926 | | | | 51,787,359 | |
Net unrealized appreciation (depreciation) | | | 5,488,029,040 | | | | (1,656,918,442 | ) |
| | |
|
|
| |
|
|
|
Net increase (decrease) in net assets from operations | | | 6,158,676,158 | | | | (1,398,545,672 | ) |
| | |
|
|
| |
|
|
|
| | | | | | | | | |
Distributions to
Shareholders from: | | | | | |
Net investment income | | | (340,525,138 | ) | | | (202,634,141 | ) |
Net realized gain | | | (214,176,406 | ) | | | (62,051,773 | ) |
| | |
|
|
| |
|
|
|
Total distributions | | | (554,701,544 | ) | | | (264,685,914 | ) |
| | |
|
|
| |
|
|
|
| | | | | | | | | |
| Beneficial Share Transactions: | | | | | |
Amounts received from
sale of shares | | | 12,166,924,022 | | | | 8,428,967,757 | |
| | |
Net asset value of shares issued in reinvestment of distributions | | | 505,674,193 | | | | 245,780,303 | |
| | |
Amounts paid for
shares redeemed | | | (2,875,628,981 | ) | | | (2,371,299,692 | ) |
| | |
|
|
| |
|
|
|
Net increase from beneficial
share transactions | | | 9,796,969,234 | | | | 6,303,448,368 | |
| | |
|
|
| |
|
|
|
Total increase in net assets | | | 15,400,943,848 | | | | 4,640,216,782 | |
| | | | | | | | | |
| Net Assets: | | | | | |
Beginning of year | | | 14,036,278,944 | | | | 9,396,062,162 | |
| | |
|
|
| |
|
|
|
End of year (including undistributed net investment income of $3,126,324 and $3,951,270, respectively) | | $ | 29,437,222,792 | | | $ | 14,036,278,944 | |
| | |
|
|
| |
|
|
|
| | |
Shares sold | | | 124,244,324 | | | | 89,158,684 | |
Shares issued in reinvestment of distributions | | | 4,855,626 | | | | 2,705,514 | |
Shares redeemed | | | (29,796,487 | ) | | | (25,931,055 | ) |
| | |
|
|
| |
|
|
|
Net increase in
shares outstanding | | | 99,303,463 | | | | 65,933,143 | |
| | |
|
|
| |
|
|
|
See accompanying Notes to Financial Statements | Dodge & Cox Stock Fund / 6 |
Notes to Financial Statements
Note 1 — Organization and Significant Accounting Policies
Dodge & Cox Stock Fund (the “Fund”) is a separate series of Dodge & Cox Funds (the “Trust”). The Trust is organized as a Delaware statutory trust and is registered under the Investment Company Act of 1940, as amended, as a diversified, open-end management investment company. Effective after January 16, 2004, the Fund is closed to new investors. The Fund commenced operations on January 4, 1965, and seeks long-term growth of principal and income. Risk considerations and investment strategies of the Fund are discussed in the Fund’s Prospectus.
The Fund consistently follows accounting policies which are in conformity with accounting principles generally accepted in the United States of America, which require management to make estimates and assumptions that affect the reported amounts of assets and liabilities at the date of the financial statements and the reported amounts of income and expenses during the reporting period. Actual results could differ from those estimates. Significant accounting policies are as follows:
Security valuation. The Fund’s net assets are valued as of the close of trading on the New York Stock Exchange (the “NYSE”), generally 4:00 p.m. Eastern Time, each day that the NYSE is open for business. Stocks are valued at market, using as a price the official quoted close price or the last sale of the day at the close of the NYSE or, if not available, at the mean between the exchange listed bid and ask prices for the day. A security which is listed or traded on more than one exchange is valued at the quotation on the exchange determined to be the primary market for such security. Securities for which market quotations are not readily available are valued at fair value as determined in good faith by or at the direction of the Board of Trustees. Short-term securities are valued at amortized cost which approximates current value. All securities held by the Fund are denominated in U.S. dollars.
Security transactions and related investment income. Security transactions are recorded by the Fund as of the date the trades are executed with brokers. Realized gains and losses on securities sold are determined on the basis of identified cost. Dividend income and corporate action transactions are recorded on the ex-dividend date, except for certain dividends or corporate actions from foreign securities where the ex-dividend date may have passed, which are recorded as soon as the Fund is informed of the ex-dividend date. Withholding taxes on foreign dividends have been provided for in accordance with the Fund’s understanding of the applicable country’s tax rules and rates. Non-cash dividends included in dividend income, if any, are recorded at the fair market value of the securities received. Distributions received in excess of income are recorded as a reduction of cost of investments and/or realized gain. The Fund may estimate the components of distributions received from Real Estate Investment Trusts (“REITs”). Interest income is recorded on the accrual basis.
Expenses. Expenses are recorded on the accrual basis. Most expenses of the Trust can be directly attributed to a series. Expenses which cannot be directly attributed are apportioned among all of the series in the Trust.
Repurchase agreements. The Fund may enter into repurchase agreements secured by U.S. government securities which involve the purchase of securities from a counterparty with a simultaneous commitment to resell the securities at an agreed-upon date and price. It is the Fund’s policy that its custodian take possession of the underlying collateral securities, the fair value of which exceeds the principal amount of the repurchase transaction, including accrued interest, at all times. In the event of default by the counterparty, the Fund has the contractual right to liquidate the securities and to apply the proceeds in satisfaction of the obligation.
Income taxes and distributions to shareholders. No provision for federal income taxes has been included in the accompanying financial statements since the Fund intends to distribute all of its taxable income and continue to comply with requirements for regulated investment companies. Distributions to shareholders of income and capital gains are reflected in the net asset value per share computation on the ex-dividend date. Income and capital gain distributions are determined in accordance with income tax regulations, which may differ from accounting principles generally accepted in the United States of America. Temporary differences between financial statement and tax treatments may occur when certain items of income, expense, gain or loss are recognized in different periods for financial statement and tax purposes. Differences in classification may also result from the treatment of short-term gains as ordinary income for tax purposes. Permanent differences are reclassified among capital
7 / Dodge & Cox Stock Fund
Notes to Financial Statements (continued)
accounts in the financial statements to reflect their tax character. These adjustments have no impact on net assets or the results of operations.
Note 2 — Related Party Transactions
Management fees. Under a written agreement, the Fund pays an annual management fee of 0.50% of the Fund’s average daily net asset value to Dodge & Cox, investment manager of the Fund. The agreement further provides that Dodge & Cox shall waive its fee to the extent that such fee plus all other ordinary operating expenses of the Fund exceed 0.75% of the average daily net asset value for the year.
Trustees’ fees. All officers and three of the trustees of the Trust are officers and employees of Dodge & Cox. Those trustees who are not affiliated with Dodge & Cox receive from the Trust an annual fee plus an attendance fee for each Board or Committee meeting attended. Payments to trustees are divided equally among each series of the Trust. The Trust does not pay any other remuneration to its officers or trustees.
Indemnifications. Under the Trust’s organizational documents, its officers and trustees are indemnified against certain liabilities arising out of the performance of their duties to the Trust. In addition, in the normal course of business the Trust enters into contracts that provide general indemnifications to other parties. The Trust’s maximum exposure under these arrangements is unknown as this would involve future claims that may be made against the Trust that have not yet occurred.
Note 3 — Distributions Paid, Distributable Earnings and Investment Transactions
Distributions paid during the years ended December 31, 2003 and 2002 were characterized as follows for federal tax purposes:
| | | | |
| | | 2003
| | 2002
|
Ordinary income | | $440,163,145 | | $203,493,681 |
| | | ($2.01 per share) | | ($1.52 per share) |
Long-term capital gain | | $114,538,399 | | $61,192,233 |
| | | ($0.45 per share) | | ($0.41 per share) |
At December 31, 2003, the tax basis components of accumulated undistributed income and net realized gain include $3,372,688 of ordinary income and $97,314,560 of long-term capital gain. In 2003, the Fund recognized net capital gain of $15,198,741 from the delivery of appreciated securities in an in-kind redemption transaction. For federal income tax purposes, this gain is not recognized as taxable income to the Fund and does not need to be distributed to shareholders. At December 31, 2003, the cost of investments for federal income tax purposes was equal to the cost for financial reporting purposes. Net unrealized appreciation aggregated $5,168,903,497, of which $5,594,743,037 represented appreciated securities and $425,839,540 represented depreciated securities.
For the year ended December 31, 2003, purchases and sales of securities, other than short-term securities and U.S. government securities, aggregated $9,128,392,123 and $1,443,104,975, respectively.
Dodge & Cox Stock Fund / 8
Financial Highlights
| | | | | | | | | | | | | | | | | |
| SELECTED DATA AND RATIOS (for a share outstanding throughout each year) | | | Year Ended December 31, | |
|
| | | 2003 | | | 2002 | | | 2001 | | | 2000 | | | 1999 | |
| | | | | | | | | | | | | | | | | | |
Net asset value, beginning of year | | | $ 88.05 | | | | $100.51 | | | $ 96.67 | | | $100.52 | | | $ 90.70 | |
Income from investment operations: | | | | | | | | | | | | | | | | | |
Net investment income | | | 1.60 | | | | 1.53 | | | 1.72 | | | 2.06 | | | 1.49 | |
Net realized and unrealized gain (loss) | | | 26.59 | | | | (12.06 | ) | | 7.05 | | | 13.28 | | | 16.51 | |
| | |
|
|
| |
|
|
| |
|
| |
|
| |
|
|
Total from investment operations | | | 28.19 | | | | (10.53 | ) | | 8.77 | | | 15.34 | | | 18.00 | |
| | |
|
|
| |
|
|
| |
|
| |
|
| |
|
|
Distributions to shareholders from: | | | | | | | | | | | | | | | | | |
Net investment income | | | (1.62 | ) | | | (1.51 | ) | | (1.73 | ) | | (2.09 | ) | | (1.48 | ) |
Net realized gain | | | (0.84 | ) | | | (0.42 | ) | | (3.20 | ) | | (17.10 | ) | | (6.70 | ) |
| | |
|
|
| |
|
|
| |
|
| |
|
| |
|
|
Total distributions | | | (2.46 | ) | | | (1.93 | ) | | (4.93 | ) | | (19.19 | ) | | (8.18 | ) |
| | |
|
|
| |
|
|
| |
|
| |
|
| |
|
|
Net asset value, end of year | | $ | 113.78 | | | $ | 88.05 | | | $100.51 | | | $ 96.67 | | | $100.52 | |
| | |
|
|
| |
|
|
| |
|
| |
|
| |
|
|
Total return | | | 32.35 | % | | | (10.52 | )% | | 9.33 | % | | 16.30 | % | | 20.20 | % |
| | | | | |
Ratios/supplemental data: | | | | | | | | | | | | | | | | | |
Net assets, end of year (millions) | | | $29,437 | | | | $14,036 | | | $9,396 | | | $5,728 | | | $4,625 | |
Ratio of expenses to average net assets | | | .54 | % | | | .54 | % | | .54 | % | | .54 | % | | .55 | % |
Ratio of net investment income to average net assets | | | 1.72 | % | | | 1.74 | % | | 1.80 | % | | 2.13 | % | | 1.46 | % |
Portfolio turnover rate | | | 8 | % | | | 13 | % | | 10 | % | | 32 | % | | 18 | % |
9 / Dodge & Cox Stock Fund
Report of Independent Auditors
To the Trustees of Dodge & Cox Funds and Shareholders of Dodge & Cox Stock Fund
In our opinion, the accompanying statement of assets and liabilities, including the portfolio of investments, and the related statements of operations and of changes in net assets and the financial highlights present fairly, in all material respects, the financial position of the Dodge & Cox Stock Fund (the “Fund”, one of the series constituting Dodge & Cox Funds) at December 31, 2003, the results of its operations for the year then ended, the changes in its net assets for each of the two years in the period then ended and the financial highlights for each of the five years in the period then ended, in conformity with accounting principles generally accepted in the United States of America. These financial statements and financial highlights (hereafter referred to as “financial statements”) are the responsibility of the Fund’s management; our responsibility is to express an opinion on these financial statements based on our audits. We conducted our audits of these financial statements in accordance with auditing standards generally accepted in the United States of America, which require that we plan and perform the audits to obtain reasonable assurance about whether the financial statements are free of material misstatement. An audit includes examining, on a test basis, evidence supporting the amounts and disclosures in the financial statements, assessing the accounting principles used and significant estimates made by management, and evaluating the overall financial statement presentation. We believe that our audits, which included confirmation of securities at December 31, 2003 by correspondence with the custodian and brokers, provide a reasonable basis for our opinion.
PricewaterhouseCoopers LLP
San Francisco, California
February 4, 2004
Special 2003 Tax Information (unaudited)
The following information is provided pursuant to provisions of the Internal Revenue Code:
The Fund designates $114,538,399 of its distributions paid to shareholders in 2003 as capital gain dividends (treated for federal income tax purposes in the hands of shareholders as long-term capital gain taxable at a maximum rate of 15%).
The Fund designates $377,397,662 of its distributions paid to shareholders in 2003 as qualified dividends (treated for federal income tax purposes in the hands of shareholders as taxable at a maximum rate of 15%).
For shareholders that are corporations, the Fund designates 75% of its ordinary dividends (including short-term gains) paid to shareholders in 2003 as dividends from domestic corporations eligible for the corporate dividends received deduction, provided that the shareholder otherwise satisfies applicable requirements to claim that deduction.
Dodge & Cox Stock Fund / 10
Dodge & Cox Funds—Officer & Trustee Information (unaudited)
| | | | | | |
| | | |
Name (Age) and
Address* | | Position with Trust
(Time Served) | | Principal Occupation During Past 5 Years | | Other Directorships Held by Trustees |
|
Interested Trustees & Officers
|
| | | |
Harry R. Hagey (62) | | Chairman and Trustee (Trustee since 1975) | | Chairman, Chief Executive Officer and Director of Dodge & Cox, Portfolio Manager, and member of Investment Policy Committee | | — |
|
| | | |
John A. Gunn (60) | | President and Trustee
(Trustee since 1985) | | President, Chief Investment Officer and Director of Dodge & Cox, Portfolio Manager, and member of Investment Policy Committee, Fixed Income Strategy Committee, and International Investment Policy Committee | | — |
|
| | | |
Dana M. Emery (42) | | Vice President and Trustee (Trustee since 1993) | | Senior Vice President and Director of Dodge & Cox, Manager—Fixed Income, and member of Investment Policy Committee and Fixed Income Strategy Committee | | — |
|
| | | |
A. Horton Shapiro (64) | | Executive Vice President (Officer since 1985) | | Senior Vice President and Director of Dodge & Cox, Portfolio Manager, and member of Investment Policy Committee and Fixed Income Strategy Committee | | — |
|
| | | |
| Katherine Herrick Drake (49) | | Vice President (Officer since 1993) | | Vice President of Dodge & Cox, Portfolio Manager, and member of Investment Policy Committee | | — |
|
| | | |
Kenneth E. Olivier (51) | | Vice President
(Officer since 1992) | | Executive Vice President (since 2002) and Director of Dodge & Cox, Portfolio Manager, and member of Investment Policy Committee | | — |
|
| | | |
John M. Loll (37) | | Treasurer and Assistant Secretary (Officer since 2000) | | Vice President and Treasurer (since 2000) of Dodge & Cox; prior to 2000, Fund Administration and Accounting Manager, Dodge & Cox | | — |
|
| | | |
| Thomas M. Mistele (50) | | Secretary and Assistant Treasurer (Officer since 2000) | | Vice President, Secretary and General Counsel of Dodge & Cox | | — |
|
|
Independent Trustees
|
| | | |
William F. Ausfahl (63) | | Trustee (Since: 2002) | | CFO, The Clorox Co. (1982-1997); Director, The Clorox Co. (1984-1997) | | — |
|
| | | |
L. Dale Crandall (62) | | Trustee (Since: 1999) | | President, Kaiser Foundation Health Plan, Inc. and Kaiser Foundation Hospitals (2000-2002); Executive Vice President—Finance and Administration & CFO, Kaiser Foundation Health Plan, Inc. and Kaiser Foundation Hospitals (1998-2000) | | Director, Union BanCal Corporation (bank holding company) and Union Bank of California (commercial bank) (2001-Present); Director, Covad Communications Group (broadband communications services) (2002-Present); Director, Ansell Limited (medical equipment and supplies) (2002-Present); Director, BEA Systems, Inc. (software and programming) (2003-Present); Director, Coventry Health Care, Inc. (managed healthcare) (2004-Present) |
|
| | | |
Thomas A. Larsen (54) | | Trustee (Since: 2002) | | Director in Howard, Rice, Nemerovski, Canady, Falk & Rabkin (law firm) | | — |
|
| | | |
Will C. Wood (64) | | Trustee (Since: 1992) | | Principal, Kentwood Associates, Financial Advisers | | Director, Banco Latinoamericano de Exportaciones S.A. (Latin American Foreign Trade Bank) (1999-Present); Director, Dover Investment Corp. (real estate development) (1992-Present) |
|
| * | | The address for each Officer and Trustee is One Sansome Street, 35th Floor, San Francisco, California 94104. Each Officer and Trustee oversees all four portfolios in the Dodge & Cox Funds complex and serves for an indefinite term. |
Additional information about the Trust’s Trustees is available in the Trust’s Statement of Additional Information (SAI). You can get a free copy of the SAI by contacting Dodge & Cox Funds at 1-800-621-3979.

International
Stock Fund
Established 2001

3rd Annual Report
December 31, 2003
2003
International Stock Fund
www.dodgeandcox.com
For Fund literature, transactions and account
information, please visit the
Funds’ web site.
or write or call:
Dodge & Cox Funds
c/o Boston Financial Data Services
P.O. Box 8422
Boston, Massachusetts
02266-8422
(800) 621-3979
Investment Manager
Dodge & Cox
One Sansome Street
35th Floor
San Francisco, California
94104-4443
(415) 981-1710
This report is submitted for the general information of the shareholders of the Fund. The report is not authorized for distribution to prospective investors in the Fund unless it is accompanied by a current prospectus.
This report reflects our views,
opinions and portfolio holdings
as of December 31, 2003, the end of
the reporting period. The information
provided is not a complete analysis of every
aspect of any industry, security or the Fund.
The Fund’s portfolio composition may change
depending on market and economic conditions.
Although historical performance is
no guarantee of future results, these
insights may help you understand
our investment management
philosophy.

12/03 ISF AR  Printed on recycled paper
To Our Shareholders
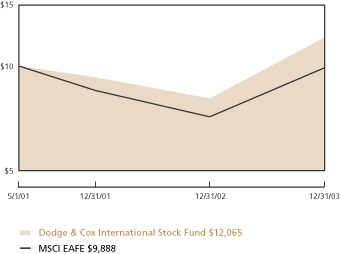
The Dodge & Cox International Stock Fund had a total return of 49.4%* for the year-ended December 31, 2003, compared to a total return of 38.6% for the Morgan Stanley Capital International Europe, Australasia, Far East Index (MSCI EAFE) benchmark. Since its inception on May 1, 2001, the Fund’s total annualized return was 7.3%* compared to -0.3% for the MSCI EAFE.
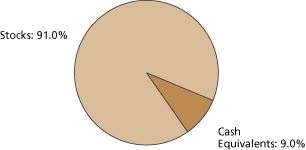
At the year-end the Fund had total assets of $655 million and a cash position of 9%, reflecting strong cash inflows at the end of December. The share price of the Fund rose from $15.81 at the end of 2002 to $23.48 on December 31, 2003. In addition, during the year, the Fund distributed income dividends of $0.14 per share.
Performance Review
Most of the world’s equity markets continued their upward move in the fourth quarter, culminating in the strongest year for the MSCI EAFE in U.S. dollar terms since 1986. The decline of the U.S. dollar was a meaningful contributor to these results (all else being equal, when the dollar declines, foreign securities increase in value in dollar terms), as the MSCI EAFE was up only 20% in local currency terms. Key factors in the International Stock Fund’s 2003 results were:
| • | | The Fund’s investments in Latin America, which averaged about 10% of the portfolio during the year, were collectively up 154%, contributing to strong absolute and relative returns. |
| • | | The Fund’s investments in the Insurance sector outperformed those in the MSCI EAFE. Examples include: Euler Hermes, a French-based credit insurer (up 114% in 2003); and Promina, an Australian property/casualty insurer (up 94% from its Initial Public Offering out of Royal Sun Alliance in May). |
| • | | Individual holdings such as Alstom and Hagemeyer, which were sold during the year, were down significantly and hurt results. |
Persistence—The Flip Side
We have talked about our persistence as a long-term investor and why we believe it contributes to the Fund’s long-term investment results. A key element of persistence is the ability to ignore past price performance in evaluating potential future investment merits of a company. It is devilishly difficult to do because of the natural human tendency to over-weight recent experience and extrapolate into the future based on that experience.
A recent example where we believe legitimate short-term concerns allowed for a successful long-term investment was in the aerospace industry. Worries about the state of the airline industry in light of possible bankruptcies of major carriers contributed to the precipitous decline of aircraft engine-maker Rolls Royce’s share price in the first quarter of 2003. During this period, we added to the Fund’s existing position in Rolls Royce. What enabled us to be persistent investors was our conviction based on our research. We continued to invest in Rolls Royce because we believed in the company’s ability to finance its business through a protracted downturn; its strong market position in an industry critical to future global economic growth; and a very low valuation on depressed earnings. In this instance, persistence was rewarded as evidenced by a significant rise in Rolls Royce’s share price during the year.
That said, persistence is not always rewarded. Sometimes, the potential investment risks materialize in the short term and undermine the potential longer-term rewards. We have made a few investments in the Fund—Alstom and Hagemeyer are examples—where this was the case. A common element of these two very different companies was a weakening balance sheet that left each company with few degrees of freedom with which to weather problems. Thus, faced with prolonged downturns in key end markets, as other operating issues materialized, significant dilution to existing shareowners was required to repair the capital structure and enable the company to address problems. We made the decision to sell both Alstom and Hagemeyer in 2003 after the erosion of the companies’ fundamentals and stock prices. Fortunately, these were only two of over 50 positions in the Fund, highlighting the benefits of a diversified portfolio.
Strategy and Outlook
While we continue to find attractive investment ideas, valuations have risen meaningfully and the likelihood of the very high returns the Fund produced in 2003 continuing is remote. Since the Fund’s inception, returns have been (and will likely remain) highly volatile. The International Fund’s 7.3% average annualized return since its inception on May 1, 2001 includes a -7.1% return for the eight
1 / Dodge & Cox International Stock Fund
months (5/1 through 12/31) of 2001, a -13.1% return for 2002, followed by the 49.4% return for 2003.
As we take a step back and examine common threads where we are investing on a bottom-up basis, we see opportunities in companies serving the consumer in the developing world. Over the past decade, the U.S. economy was the engine of global economic growth, fueled by the American consumer. We believe that the stage has been set for the consumer outside of the U.S., and especially the consumer in the developing world, to become a bigger factor in global economic growth in the future. We are finding attractive investments in companies that serve the consumer in the developing world in areas such as personal credit (Kookmin Bank based in South Korea, and Standard Chartered Bank based in the United Kingdom), personal transportation (car and motorcycle-makers Honda and Suzuki based in Japan), home ownership (home-builder Consorcio Ara based in Mexico), consumer goods (food companies Nestle and Unilever based in Europe) and communications services (telephone company KT Corp. based in South Korea).
In Closing
Thank you for the continued confidence you have placed in our firm as a shareholder of the International Stock Fund. As always, we welcome your comments and questions.
For the Board of Trustees,
| | |
 | | 
|
| |
Harry R. Hagey, Chairman | John A. Gunn, President |
February 4, 2004
Investment Performance
Total return for periods ended December 31, 2003
| | | | |
| | | 1 Year | | Since
Inception
(5/1/01) |
|
Dodge & Cox International Stock Fund* | | 49.42% | | 7.28% |
MSCI EAFE | | 38.57 | | (0.32) |
|
| Past | | performance does not guarantee future results. Investment return and share price will fluctuate with market conditions, and investors may have a gain or loss when shares are sold. Mutual fund performance changes over time and currently may be significantly lower than stated above. Performance is updated and published monthly. Visit the Fund’s web site at www.dodgeandcox.com or call 800-621-3979 for current performance figures. |
| * Expense | | reimbursements have been in effect for the International Stock Fund since its inception. Without the expense reimbursements, returns for the Fund would have been lower. |
| The | | Morgan Stanley Capital International Europe, Australasia, Far East Index (MSCI EAFE) is a widely recognized benchmark of the world’s stock markets, excluding the United States. The Fund’s total returns include the reinvestment of dividend and capital gain distributions, but have not been adjusted for any income taxes payable on these distributions. Index returns include dividends and, unlike Fund returns, do not reflect fees or expenses. |
Morgan Stanley®, Morgan Stanley Capital International, and EAFE® are trademarks of Morgan Stanley.
Risks of International Investing: Foreign investing, especially in developing countries,
has special risks such as currency and market volatility and political and social instability.
These and other risk considerations are
discussed in the Fund’s prospectus.
Dodge & Cox International Stock Fund / 2
Fund Information | December 31, 2003 |
General Information
| | |
| |
Net Asset Value Per Share | | $23.48 |
Total Net Assets (millions) | | $655 |
30-Day SEC Yield1 | | 1.07% |
2003 Expense Ratio2 | | 0.82% |
2003 Turnover Ratio | | 11% |
Fund Inception Date | | May 1, 2001 |
Investment Manager: Dodge & Cox, San Francisco. Managed by the International Investment Policy Committee, whose six members’ average tenure at Dodge & Cox is 17 years.
Asset Allocation
| | | | |
| Stock Characteristics | | Fund | | MSCI
EAFE |
|
| | |
Number of Stocks | | 54 | | 1,005 |
| | |
Median Market Capitalization (billions) | | $7 | | $3 |
| | |
Weighted Average Market Cap. (billions) | | $22 | | $42 |
| | |
Price-to-Earnings Ratio3 | | 14x | | 18x |
| | |
Price-to-Book Value | | 1.6x | | 2.0x |
| | | |
| Ten Largest Holdings | | | |
| |
Sony ADR (Japan) | | 3.6 | % |
KT Corp. ADR (South Korea) | | 3.6 | |
News Corp. Ltd., Pref. (Australia) | | 3.2 | |
Akzo Nobel (Netherlands) | | 3.0 | |
Electrolux (Sweden) | | 2.7 | |
Imperial Chemical Industries (United Kingdom) | | 2.7 | |
BASF (Germany) | | 2.7 | |
Total (France) | | 2.6 | |
Aderans (Japan) | | 2.6 | |
Nestle (Switzerland) | | 2.6 | |
| | | | | | |
| Region Diversification | | Fund | | | MSCI
EAFE | |
| |
| | |
Europe (excluding United Kingdom) | | 34.8 | % | | 45.1 | % |
| | |
Japan | | 22.7 | | | 21.4 | |
| | |
Pacific (excluding Japan) | | 11.0 | | | 7.7 | |
| | |
United Kingdom | | 9.5 | | | 25.8 | |
| | |
Latin America | | 8.7 | | | 0.0 | |
| | |
Canada | | 2.7 | | | 0.0 | |
| | |
Africa | | 1.6 | | | 0.0 | |
| | | | | | |
| Sector Diversification | | Fund | | | MSCI
EAFE | |
| |
Consumer Discretionary | | 22.7 | % | | 12.7 | % |
Materials | | 17.9 | | | 6.8 | |
Financials | | 17.7 | | | 26.5 | |
Consumer Staples | | 9.0 | | | 8.5 | |
Energy | | 6.2 | | | 8.3 | |
Information Technology | | 4.6 | | | 6.8 | |
Industrials | | 4.4 | | | 8.9 | |
Telecommunication Services | | 3.6 | | | 7.8 | |
Utilities | | 2.9 | | | 4.7 | |
Health Care | | 2.0 | | | 9.0 | |
| 1 | | SEC Yield is an annualization of the Fund’s total net investment income per share for the 30-day period ended on the last day of the month. |
| 2 | | For the fiscal years ending December 31, 2001 through 2005, Dodge & Cox has contractually agreed to reimburse the Fund for all ordinary expenses to the extent necessary to maintain total Fund operating expenses at 0.90%. The agreement is renewable annually thereafter and is subject to 30 days prior written notice for termination by either party. Without reimbursement, the expense ratio for the year ended December 31, 2003 would have been 0.84%. |
| 3 | | Price-to-earnings ratio is calculated using fiscal year-end earnings and excludes extraordinary items. |
3 / Dodge & Cox International Stock Fund
Portfolio of Investments
December 31, 2003
COMMON STOCKS: 81.3%
| | | | | |
| SHARES | | | | MARKET VALUE |
| |
| CONSUMER DISCRETIONARY: 19.5% |
| CONSUMER DURABLES & APPAREL: 10.3% |
| 674,500 | | Sony Corp. ADR(b) (Japan) | | $ | 23,384,915 |
| 817,700 | | Electrolux A.B. (Sweden) | | | 17,952,449 |
| 789,500 | | Matsushita Electric Industrial Co., Ltd. ADR(b) (Japan) | | | 11,005,630 |
| 3,100,000 | | Consorcio Ara S.A.(a) (Mexico) | | | 7,701,692 |
| 766,000 | | Makita Corp. (Japan) | | | 7,652,868 |
| | | | |
|
|
| | | | | | 67,697,554 |
| AUTOMOBILES & COMPONENTS: 5.7% |
| 718,200 | | Honda Motor Co. Ltd. ADR(b) (Japan) | | | 16,159,500 |
| 753,000 | | Suzuki Motor Corp. (Japan) | | | 11,119,721 |
| 1,280,700 | | Fiat SPA ADR(a, b) (Italy) | | | 9,912,618 |
| | | | |
|
|
| | | | | | 37,191,839 |
| HOTELS, RESTAURANTS & LEISURE: 2.6% |
| 552,400 | | H.I.S. Co., Ltd. (Japan) | | | 11,469,758 |
| 600,677 | | InterContinental Hotels Group PLC (United Kingdom) | | | 5,673,574 |
| | | | |
|
|
| | | | | | 17,143,332 |
| MEDIA: 0.9% |
| 125,600 | | Reuters Group PLC ADR(b) (United Kingdom) | | | 3,187,728 |
| 2,300 | | Sky Perfect Communications, Inc.(a) (Japan) | | | 2,698,324 |
| | | | |
|
|
| | | | | | 5,886,052 |
| | | | |
|
|
| | | | | | 127,918,777 |
| MATERIALS: 17.9% |
| CHEMICALS: 15.1% |
| 506,100 | | Akzo Nobel N.V. (Netherlands) | | | 19,483,776 |
| 5,028,000 | | Imperial Chemical Industries PLC (United Kingdom) | | | 17,865,220 |
| 312,400 | | BASF A.G. (Germany) | | | 17,521,305 |
| 28,100 | | Givaudan (Switzerland) | | | 14,545,029 |
| 805,500 | | Syngenta A.G. ADR(b) (Switzerland) | | | 10,858,140 |
| 376,200 | | NOVA Chemicals Corp. (Canada) | | | 10,176,830 |
| 717,200 | | Kemira OYJ (Finland) | | | 8,301,250 |
| | | | |
|
|
| | | | | | 98,751,550 |
| CONSTRUCTION MATERIALS: 1.6% |
| 121,000 | | Lafarge (France) | | | 10,747,450 |
|
| METALS AND MINING: 1.2% |
| 460,078 | | BHP Billiton Ltd. (Australia) | | | 4,218,321 |
| 134,400 | | Rio Tinto PLC (United Kingdom) | | | 3,702,757 |
| | | | |
|
|
| | | | | | 7,921,078 |
| | | | |
|
|
| | | | | | 117,420,078 |
| FINANCIALS: 15.5% |
| BANKS: 14.0% |
| 442,900 | | Kookmin Bank ADR(b) (South Korea) | | | 16,759,336 |
| 1,975,200 | | Mitsubishi Tokyo Financial Group, Inc. ADR(b) (Japan) | | | 15,465,816 |
| 1,269,200 | | Banco Santander Central Hispano (Spain) | | | 14,993,776 |
| 593,900 | | Danske Bank (Denmark) | | | 13,896,212 |
| 576,422 | | Banco Latinoamericano de Exportaciones ADR(a, b) (Panama) | | | 11,084,595 |
| | | | | |
| SHARES | | | | MARKET VALUE |
| | |
| 1,750,000 | | Standard Bank Group, Ltd. (South Africa) | | $ | 10,279,610 |
| 365,000 | | Standard Chartered PLC (United Kingdom) | | | 6,012,004 |
| 392,000 | | DBS Group Holdings Ltd. (Singapore) | | | 3,393,440 |
| | | | |
|
|
| | | | | | 91,884,789 |
| DIVERSIFIED FINANCIALS: 0.9% |
| 123,230 | | Euler & Hermes (France) | | | 5,906,861 |
|
| INSURANCE: 0.6% |
| 1,500,000 | | Promina Group (Australia) | | | 3,700,578 |
| | | | |
|
|
| | | | | | 101,492,228 |
| CONSUMER STAPLES: 9.0% |
| FOOD, BEVERAGE AND TOBACCO: 6.4% |
| 68,500 | | Nestle S.A. (Switzerland) | | | 17,065,629 |
| 207,900 | | Unilever N.V.(b) (Netherlands) | | | 13,492,710 |
| 1,617,000 | | Kikkoman Corp. (Japan) | | | 11,472,570 |
| | | | |
|
|
| | | | | | 42,030,909 |
| PERSONAL PRODUCTS: 2.6% |
| 1,070,000 | | Aderans Co. (Japan) | | | 17,225,605 |
| | | | |
|
|
| | | | | | 59,256,514 |
| INFORMATION TECHNOLOGY: 4.6% |
| TECHNOLOGY HARDWARE & EQUIPMENT: 4.6% |
| 250,000 | | Seiko Epson Corp. (Japan) | | | 11,638,734 |
| 711,971 | | Oce N.V. (Netherlands) | | | 10,883,133 |
| 1,725,000 | | Nortel Networks Corp.(a, b) (Canada) | | | 7,296,750 |
| | | | |
|
|
| | | | | | 29,818,617 |
| INDUSTRIALS: 4.4% |
| CAPITAL GOODS: 3.0% |
| 5,130,200 | | Kidde PLC (United Kingdom) | | | 9,755,374 |
| 22,445 | | Sulzer A.G. (Switzerland) | | | 6,026,111 |
| 255,020 | | CNH Global N.V.(b) (Netherlands) | | | 4,233,332 |
| | | | |
|
|
| | | | | | 20,014,817 |
| AEROSPACE & DEFENSE: 1.4% |
| 2,826,400 | | Rolls-Royce Group PLC (United Kingdom) | | | 8,944,991 |
| | | | |
|
|
| | | | | | 28,959,808 |
| ENERGY: 4.3% |
| 93,500 | | Total (France) | | | 17,339,017 |
| 90,400 | | Norsk Hydro A.S.A. ADR(b) (Norway) | | | 5,586,720 |
| 2,238,900 | | Stolt Offshore S.A. ADR(a, b) (Norway) | | | 5,395,749 |
| | | | |
|
|
| | | | | | 28,321,486 |
| TELECOMMUNICATION SERVICES: 3.6% |
| 1,223,000 | | KT Corp. ADR(b) (South Korea) | | | 23,322,610 |
|
| HEALTH CARE: 1.4% |
| HEALTH CARE EQUIPMENT & SERVICES: 1.4% |
| 954,700 | | Kuraya Sanseido (Japan) | | | 9,315,881 |
|
| UTILITIES: 1.1% |
| 260,600 | | Scottish Power PLC ADR(b) (United Kingdom) | | | 7,083,108 |
| | | | |
|
|
| Total Common Stocks (cost $445,792,930) | | | 532,909,107 |
| | | | |
|
|
See accompanying Notes to Financial Statements | Dodge & Cox International Stock Fund / 4 |
Portfolio of Investments
December 31, 2003
PREFERRED STOCKS: 9.7%
| | | | | |
| SHARES | | | | MARKET VALUE |
|
| CONSUMER DISCRETIONARY: 3.2% |
| MEDIA: 3.2% |
| 2,781,174 | | News Corp. Ltd., Preferred Limited Voting Ordinary Shares (Australia) | | $ | 20,918,601 |
| FINANCIALS: 2.2% |
| BANKS: 2.2% |
| 571,500 | | Uniao de Bancos Brasileiros Sponsored GDR(b) (Brazil) | | | 14,258,925 |
| ENERGY: 1.9% |
| 463,700 | | Petroleo Brasileiro S.A. ADR(b) (Brazil) | | | 12,362,242 |
|
| UTILITIES: 1.8% |
| 932,900 | | Ultrapar Participacoes S.A. ADR(b) (Brazil) | | | 11,885,146 |
|
| HEALTH CARE: 0.6% |
| 69,939 | | Fresenius Medical Care (Germany) | | | 3,515,212 |
| | | | |
|
|
| Total Preferred Stocks (cost $49,655,745) | | | 62,940,126 |
| SHORT-TERM INVESTMENTS: 11.9% | | | |
|
| | | | | |
| PAR VALUE | | |
| $ | 3,147,071 | | SSgA Prime Money Market Fund | | 3,147,071 |
| | 74,929,000 | | State Street Repurchase Agreement, 0.65%, 1/2/04 (collateralized by U.S. Treasury securities, value $76,433,347) | | 74,929,000 |
| | | | | |
|
| | | | |
| Total Short-Term Investments (cost $78,076,071) | | 78,076,071 |
| | | | |
|
| | | | | | | | | |
TOTAL INVESTMENTS (cost $573,524,746) | | 102.9 | % | | | 673,925,304 | |
OTHER ASSETS LESS LIABILITIES | | (2.9 | ) | | | (19,031,372 | ) |
| | | | |
|
| |
|
|
|
| TOTAL NET ASSETS | | | | 100.0 | % | | $ | 654,893,932 | |
| | | | |
|
| |
|
|
|
| (b) | Securities denominated in U.S. dollars |
5 / Dodge & Cox International Stock Fund | See accompanying Notes to Financial Statements |
Statement of Assets and Liabilities
| | | | |
|
December 31, 2003 | |
| Assets: | |
Investments, at market value (identified cost $573,524,746) | | $ | 673,925,304 | |
Cash denominated in foreign currency (identified cost $1,379,139) | | | 1,396,555 | |
Receivable for Fund shares sold | | | 12,138,006 | |
Dividends and interest receivable | | | 1,203,134 | |
Prepaid expenses and other assets | | | 6,409 | |
| | |
|
|
|
| | | | 688,669,408 | |
| | |
|
|
|
| Liabilities: | |
Payable for investments purchased | | | 33,126,502 | |
Payable for Fund shares redeemed | | | 200,377 | |
Management fees payable | | | 289,525 | |
Accounts payable | | | 159,072 | |
| | |
|
|
|
| | | | 33,775,476 | |
| | |
|
|
|
| Net Assets | | $ | 654,893,932 | |
| | |
|
|
|
| Net Assets Consist of: | |
Paid in capital | | $ | 561,820,180 | |
Accumulated undistributed net investment income | | | — | |
Accumulated undistributed net realized loss on investments and foreign currency transactions | | | (7,344,222 | ) |
Net unrealized appreciation on investments and foreign currency | | | 100,417,974 | |
| | |
|
|
|
| | | $ | 654,893,932 | |
| | |
|
|
|
Beneficial shares outstanding (par value $0.01 each, unlimited shares authorized) | | | 27,895,363 | |
Net asset value per share | | $ | 23.48 | |
Statement of Operations
| | | | |
|
Year Ended
December 31, 2003 | |
| Investment Income: | |
Dividends (net of foreign taxes of $593,744) | | $ | 5,404,747 | |
Interest | | | 139,683 | |
| | |
|
|
|
| | | | 5,544,430 | |
| | |
|
|
|
| Expenses: | |
Management fees (Note 2) | | | 1,418,414 | |
Custodian and fund accounting fees | | | 132,577 | |
Transfer agent fees | | | 136,279 | |
Professional fees | | | 69,687 | |
Shareholder reports | | | 56,195 | |
Registration fees | | | 135,477 | |
Trustees’ fees (Note 2) | | | 28,500 | |
Miscellaneous | | | 1,761 | |
| | |
|
|
|
Total expenses | | | 1,978,890 | |
| | |
|
|
|
Expenses reimbursed by investment manager (Note 2) | | | (45,752 | ) |
| | |
|
|
|
Net expenses | | | 1,933,138 | |
| | |
|
|
|
| Net Investment Income | | | 3,611,292 | |
| | |
|
|
|
Realized and Unrealized Gain (Loss) on
Investments: | |
Net realized loss from: | | | | |
Investments | | | (5,780,665 | ) |
Foreign currency transactions | | | (139,082 | ) |
Net unrealized appreciation on
investments and foreign currency | | | 118,219,534 | |
| | |
|
|
|
Net realized and unrealized gain on investments and foreign currency | | | 112,299,787 | |
| | |
|
|
|
| |
| Net Increase in Net Assets from Operations | | $ | 115,911,079 | |
| | |
|
|
|
Statement of Changes in Net Assets
| | | | | | | | |
| | |
| | | Year Ended
December 31, 2003 | | | Year Ended
December 31, 2002 | |
| Operations: | |
Net investment income | | $ | 3,611,292 | | | $ | 1,034,768 | |
Net realized loss | | | (5,919,747 | ) | | | (1,069,095 | ) |
Net unrealized appreciation (depreciation) | | | 118,219,534 | | | | (16,951,890 | ) |
| | |
|
|
| |
|
|
|
Net increase (decrease) in net assets from operations | | | 115,911,079 | | | | (16,986,217 | ) |
| | |
|
|
| |
|
|
|
| | | | | | | | | |
| Distributions to Shareholders From: | |
Net investment income | | | (3,707,922 | ) | | | (1,025,549 | ) |
Net realized gain | | | (22,032 | ) | | | (376,593 | ) |
| | |
|
|
| |
|
|
|
Total distributions | | | (3,729,954 | ) | | | (1,402,142 | ) |
| | |
|
|
| |
|
|
|
| | | | | | | | | |
| Beneficial Share Transactions: | |
Amounts received from sale of shares | | | 505,237,353 | | | | 174,721,935 | |
Net asset value of shares issued in reinvestment of distributions | | | 3,479,385 | | | | 1,238,324 | |
Amounts paid for shares redeemed | | | (82,943,027 | ) | | | (65,837,104 | ) |
| | |
|
|
| |
|
|
|
Net increase from beneficial share transactions | | | 425,773,711 | | | | 110,123,155 | |
| | |
|
|
| |
|
|
|
Total increase in net assets | | | 537,954,836 | | | | 91,734,796 | |
| | | | | | | | | |
| Net Assets: | | | | | | | | |
Beginning of year | | | 116,939,096 | | | | 25,204,300 | |
| | |
|
|
| |
|
|
|
End of year (including undistributed net investment income of $0 and $9,219, respectively) | | $ | 654,893,932 | | | $ | 116,939,096 | |
| | |
|
|
| |
|
|
|
| | |
Shares sold | | | 24,888,635 | | | | 9,847,266 | |
Shares issued in reinvestment of distributions | | | 149,716 | | | | 79,075 | |
Shares redeemed | | | (4,541,214 | ) | | | (3,896,407 | ) |
| | |
|
|
| |
|
|
|
Net increase in shares outstanding | | | 20,497,137 | | | | 6,029,934 | |
| | |
|
|
| |
|
|
|
See accompanying Notes to Financial Statements | Dodge & Cox International Stock Fund / 6 |
Notes to Financial Statements
Note 1 — Organization and Significant Accounting Policies
Dodge & Cox International Stock Fund (the “Fund”) is a separate series of Dodge & Cox Funds (the “Trust”). The Trust is organized as a Delaware statutory trust and is registered under the Investment Company Act of 1940, as amended, as a diversified, open-end management investment company. The Fund’s predecessor, Dodge & Cox International Equity Fund, L.L.C. (the “LLC”), was organized on October 25, 1999 as a private investment company that converted into, and had the same investment manager as, the Fund. The Fund was capitalized on April 30, 2001 upon the transfer of assets from the LLC and commenced operations on May 1, 2001. The Fund seeks long-term growth of principal and income, and the Fund invests primarily in a diversified portfolio of foreign stocks. Foreign investing, especially in developing countries, has special risks such as currency and market volatility and political and social instability. These and other risk considerations are discussed in the Fund’s Prospectus.
The Fund consistently follows accounting policies which are in conformity with accounting principles generally accepted in the United States of America, which require management to make estimates and assumptions that affect the reported amounts of assets and liabilities at the date of the financial statements and the reported amounts of income and expenses during the reporting period. Actual results could differ from those estimates. Significant accounting policies are as follows:
Security valuation. The Fund’s net assets are valued as of the close of trading on the New York Stock Exchange (the “NYSE”), generally 4:00 p.m. Eastern Time, each day that the NYSE is open for business. Listed securities are valued at market, using as a price the official quoted close price or the last sale on the date of determination on the principal exchange on which such securities are traded or, if not available, at the mean between the exchange listed bid and ask prices for the day. A security which is listed or traded on more than one exchange is valued at the quotation on the exchange determined to be the primary market for such security. Securities for which market quotations are not readily available or whose values have been materially affected by events occurring before the Fund’s pricing time but after the close of the securities’ primary markets are valued at fair value as determined in good faith by or at the direction of the Board of Trustees. Foreign securities are converted to U.S. dollars using prevailing exchange rates. Short-term securities are valued at amortized cost which approximates current value.
Foreign Currency Translation. Investment securities and other assets and liabilities denominated in a foreign currency are translated into U.S. dollars at the prevailing rates of exchange at period end. Purchases and sales of securities, income receipts and expenses are translated into U.S. dollars at the prevailing exchange rate on the respective dates of such transactions. Net realized gains and losses on foreign currency transactions represent net gains and losses from sales and maturities of foreign currency contracts, disposition of foreign currencies, the difference between the amount of net investment income accrued and the U.S. dollar amount actually received, and gains and losses between trade and settlement date on purchases and sales of securities. The effects of changes in foreign currency exchange rates on investments in securities are included with the net realized and unrealized gain or loss on investments.
The Fund may enter into forward foreign currency exchange contracts in order to reduce the exposure to changes in foreign currency exchange rates on the foreign portfolio holdings and to lock in the U.S. dollar cost of firm purchase and sale commitments for securities denominated in or exposed to foreign currencies.
Security transactions and related investment income. Security transactions are recorded by the Fund as of the date the trades are executed with brokers. Realized gains and losses on securities sold are determined on the basis of identified cost. Dividend income and corporate action transactions are recorded on the ex-dividend date, except for certain dividends or corporate actions from foreign securities where the ex-dividend date may have passed, which are recorded as soon as the Fund is informed of the ex-dividend date. Withholding taxes on foreign dividends have been provided for in accordance with the Fund’s understanding of the applicable country’s tax rules and rates. Non-cash dividends included in dividend income, if any, are recorded at the fair market value of the securities received. Distributions received in excess of income are recorded as a reduction of cost of investments and/or realized gain. Interest income is recorded on the accrual basis.
Expenses. Expenses are recorded on the accrual basis. Most expenses of the Trust can be directly attributed to a series. Expenses which cannot be directly attributed are apportioned among all of the series in the Trust.
7 / Dodge & Cox International Stock Fund
Notes to Financial Statements (continued)
Repurchase agreements. The Fund may enter into repurchase agreements secured by U.S. government securities which involve the purchase of securities from a counterparty with a simultaneous commitment to resell the securities at an agreed-upon date and price. It is the Fund’s policy that its custodian take possession of the underlying collateral securities, the fair value of which exceeds the principal amount of the repurchase transaction, including accrued interest, at all times. In the event of default by the counterparty, the Fund has the contractual right to liquidate the securities and to apply the proceeds in satisfaction of the obligation.
Income taxes and distributions to shareholders. No provision for federal income taxes has been included in the accompanying financial statements since the Fund intends to distribute all of its taxable income and continue to comply with requirements for regulated investment companies. Distributions to shareholders of income and capital gains are reflected in the net asset value per share computation on the ex-dividend date. Income and capital gain distributions are determined in accordance with income tax regulations, which may differ from accounting principles generally accepted in the United States of America. Temporary differences between financial statement and tax treatments may occur when certain items of income, expense, gain or loss are recognized in different periods for financial statement and tax purposes. Differences in classification may also result from the treatment of short-term gains and currency transaction gains as ordinary income for tax purposes. Permanent differences are reclassified among capital accounts in the financial statements to reflect their tax character. These adjustments have no impact on net assets or the results of operations.
Note 2 — Related Party Transactions
Management fees. Under a written agreement, the Fund pays an annual management fee of 0.60% of the Fund’s average daily net asset value to Dodge & Cox, investment manager of the Fund. For the fiscal years ending December 31, 2001 through 2005, Dodge & Cox has contractually agreed to reimburse the Fund for all ordinary expenses to the extent necessary to maintain the ratio of expenses to average net assets at 0.90%. The agreement is renewable annually thereafter and is subject to 30 days written notice for termination by either party.
Trustees’ fees. All officers and three of the trustees of the Trust are officers and employees of Dodge & Cox. Those trustees who are not affiliated with Dodge & Cox receive from the Trust an annual fee plus an attendance fee for each Board or Committee meeting attended. Payments to trustees are divided equally among each series of the Trust. The Trust does not pay any other remuneration to its officers or trustees.
Indemnifications. Under the Trust’s organizational documents, its officers and trustees are indemnified against certain liabilities arising out of the performance of their duties to the Trust. In addition, in the normal course of business the Trust enters into contracts that provide general indemnifications to other parties. The Trust’s maximum exposure under these arrangements is unknown as this would involve future claims that may be made against the Trust that have not yet occurred.
Note 3 — Distributions Paid, Distributable Earnings and Investment Transactions
Distributions paid during the years ended December 31, 2003 and 2002 were characterized as follows for federal tax purposes:
| | | | |
| | | 2003 | | 2002 |
| | |
| |
|
Ordinary income | | $3,729,954 | | $1,402,142 |
| | | ($0.14 per share) | | ($0.19 per share) |
Long-term capital gain | | none | | none |
At December 31, 2003, the tax basis components of accumulated undistributed income and net realized gain include no ordinary income or long-term capital gain. For federal tax purposes, the Fund had a capital loss carryforward of $2,392,608 as of December 31, 2003, which is available for offsetting capital gains realized in future periods, and which will expire in 2011 if not utilized. As permitted by federal tax law, the Fund elected to defer realized net capital losses and currency losses of $4,951,614 occurring between November 1, 2003 and December 31, 2003, and to treat those losses as arising in the fiscal year ending December 31, 2004. At December 31, 2003, the cost of investments for federal income tax purposes was equal to the cost for financial reporting purposes. Net unrealized appreciation of securities aggregated $100,400,558, of which $104,363,199 represented appreciated securities and $3,962,641 represented depreciated securities.
For the year ended December 31, 2003, purchases and sales of securities, other than short-term securities and U.S. government securities, aggregated $397,209,568 and $26,293,700, respectively.
Dodge & Cox International Stock Fund / 8
Financial Highlights
| | | | | | | | | | | |
| SELECTED DATA AND RATIOS (for a share outstanding throughout the period) | | Year Ended
December 31, | | | May 1, 2001 through December 31, | |
| |
| | | 2003 | | | 2002 | | | 2001 | |
| | | | | | | | | | |
Net asset value, beginning of period | | $ | 15.81 | | | $ | 18.42 | | | $20.00 | |
| | | |
Income from investment operations: | | | | | | | | | | | |
Net investment income | | | 0.14 | | | | 0.13 | | | 0.14 | |
Net realized and unrealized gain (loss) | | | 7.67 | | | | (2.55 | ) | | (1.56 | ) |
| | |
|
|
|
Total from investment operations | | | 7.81 | | | | (2.42 | ) | | (1.42 | ) |
| | |
|
|
|
Distributions to shareholders from: | | | | | | | | | | | |
Net investment income | | | (0.14 | ) | | | (0.13 | ) | | (0.14 | ) |
Net realized gain | | | — | | | | (0.06 | ) | | (0.02 | ) |
| | |
|
|
|
Total distributions | | | (0.14 | ) | | | (0.19 | ) | | (0.16 | ) |
| | |
|
|
|
Net asset value, end of period | | $ | 23.48 | | | $ | 15.81 | | | $18.42 | |
| | |
|
|
|
Total return | | | 49.42 | % | | | (13.11 | )% | | (7.09 | )% |
| | | |
Ratios/supplemental data: | | | | | | | | | | | |
Net assets, end of period (millions) | | $ | 655 | | | $ | 117 | | | $ 25 | |
Ratio of expenses to average net assets | | | 0.82 | % | | | 0.90 | % | | 0.90 | %* |
Ratio of expenses to average net assets,
excluding reimbursement by investment manager | | | 0.84 | % | | | 1.03 | % | | 2.47 | %* |
Ratio of net investment income to average net assets | | | 1.53 | % | | | 1.30 | % | | 1.74 | %* |
Portfolio turnover rate | | | 11 | % | | | 12 | % | | 23 | % |
9 / Dodge & Cox International Stock Fund
Report of Independent Auditors
To the Trustees of Dodge & Cox Funds and Shareholders of Dodge & Cox International Stock Fund
In our opinion, the accompanying statement of assets and liabilities, including the portfolio of investments, and the related statements of operations and of changes in net assets and the financial highlights present fairly, in all material respects, the financial position of the Dodge & Cox International Stock Fund (the “Fund”, one of the series constituting Dodge & Cox Funds) at December 31, 2003, the results of its operations for the year then ended, and the changes in its net assets for each of the two years in the period then ended and the financial highlights for each of the periods presented, in conformity with accounting principles generally accepted in the United States of America. These financial statements and financial highlights (hereafter referred to as “financial statements”) are the responsibility of the Fund’s management; our responsibility is to express an opinion on these financial statements based on our audits. We conducted our audits of these financial statements in accordance with auditing standards generally accepted in the United States of America, which require that we plan and perform the audits to obtain reasonable assurance about whether the financial statements are free of material misstatement. An audit includes examining, on a test basis, evidence supporting the amounts and disclosures in the financial statements, assessing the accounting principles used and significant estimates made by management, and evaluating the overall financial statement presentation. We believe that our audits, which included confirmation of securities at December 31, 2003 by correspondence with the custodian and brokers, provide a reasonable basis for our opinion.
PricewaterhouseCoopers LLP
San Francisco, California
February 4, 2004
Special 2003 Tax Information (unaudited)
The following information is provided pursuant to provisions of the Internal Revenue Code:
In 2003, the Fund has elected to pass through to shareholders foreign source income of $5,998,491 and foreign taxes paid of $593,744.
The Fund designates $4,323,698 of its distributions paid to shareholders in 2003 as qualified dividends (treated for federal income tax purposes in the hands of shareholders as taxable at a maximum rate of 15%).
Dodge & Cox International Stock Fund / 10
Dodge & Cox Funds—Officer & Trustee Information (unaudited)
| | | | | | |
| | | |
Name (Age) and
Address* | | Position with Trust
(Time Served) | | Principal Occupation During Past 5 Years | | Other Directorships Held by Trustees |
|
Interested Trustees & Officers
|
| | | |
Harry R. Hagey (62) | | Chairman and Trustee (Trustee since 1975) | | Chairman, Chief Executive Officer and Director of Dodge & Cox, Portfolio Manager, and member of Investment Policy Committee | | — |
|
| | | |
John A. Gunn (60) | | President and Trustee
(Trustee since 1985) | | President, Chief Investment Officer and Director of Dodge & Cox, Portfolio Manager, and member of Investment Policy Committee, Fixed Income Strategy Committee, and International Investment Policy Committee | | — |
|
| | | |
Dana M. Emery (42) | | Vice President and Trustee (Trustee since 1993) | | Senior Vice President and Director of Dodge & Cox, Manager—Fixed Income, and member of Investment Policy Committee and Fixed Income Strategy Committee | | — |
|
| | | |
A. Horton Shapiro (64) | | Executive Vice President (Officer since 1985) | | Senior Vice President and Director of Dodge & Cox, Portfolio Manager, and member of Investment Policy Committee and Fixed Income Strategy Committee | | — |
|
| | | |
| Katherine Herrick Drake (49) | | Vice President (Officer since 1993) | | Vice President of Dodge & Cox, Portfolio Manager, and member of Investment Policy Committee | | — |
|
| | | |
Kenneth E. Olivier (51) | | Vice President
(Officer since 1992) | | Executive Vice President (since 2002) and Director of Dodge & Cox, Portfolio Manager, and member of Investment Policy Committee | | — |
|
| | | |
John M. Loll (37) | | Treasurer and Assistant Secretary (Officer since 2000) | | Vice President and Treasurer (since 2000) of Dodge & Cox; prior to 2000, Fund Administration and Accounting Manager, Dodge & Cox | | — |
|
| | | |
| Thomas M. Mistele (50) | | Secretary and Assistant Treasurer (Officer since 2000) | | Vice President, Secretary and General Counsel of Dodge & Cox | | — |
|
|
Independent Trustees
|
| | | |
William F. Ausfahl (63) | | Trustee (Since: 2002) | | CFO, The Clorox Co. (1982-1997); Director, The Clorox Co. (1984-1997) | | — |
|
| | | |
L. Dale Crandall (62) | | Trustee (Since: 1999) | | President, Kaiser Foundation Health Plan, Inc. and Kaiser Foundation Hospitals (2000-2002); Executive Vice President—Finance and Administration & CFO, Kaiser Foundation Health Plan, Inc. and Kaiser Foundation Hospitals (1998-2000) | | Director, Union BanCal Corporation (bank holding company) and Union Bank of California (commercial bank) (2001-Present); Director, Covad Communications Group (broadband communications services) (2002-Present); Director, Ansell Limited (medical equipment and supplies) (2002-Present); Director, BEA Systems, Inc. (software and programming) (2003-Present); Director, Coventry Health Care Inc. (managed healthcare) (2004-Present) |
|
| | | |
Thomas A. Larsen (54) | | Trustee (Since: 2002) | | Director in Howard, Rice, Nemerovski, Canady, Falk & Rabkin (law firm) | | — |
|
| | | |
Will C. Wood (64) | | Trustee (Since: 1992) | | Principal, Kentwood Associates, Financial Advisers | | Director, Banco Latinoamericano de Exportaciones S.A. (Latin American Foreign Trade Bank) (1999-Present); Director, Dover Investment Corp. (real estate development) (1992-Present) |
|
| * | | The address for each Officer and Trustee is One Sansome Street, 35th Floor, San Francisco, California 94104. Each Officer and Trustee oversees all four portfolios in the Dodge & Cox Funds complex and serves for an indefinite term. |
Additional information about the Trust’s Trustees is available in the Trust’s Statement of Additional Information (SAI). You can get a free copy of the SAI by contacting Dodge & Cox Funds at 1-800-621-3979.

Balanced Fund
Established 1931

73rd Annual Report
December 31, 2003
2003
Balanced Fund
www.dodgeandcox.com
For Fund literature, transactions and account
information, please visit the
Funds’ web site.
or write or call:
Dodge & Cox Funds
c/o Boston Financial Data Services
P.O. Box 8422
Boston, Massachusetts
02266-8422
(800) 621-3979
Investment Manager
Dodge & Cox
One Sansome Street
35th Floor
San Francisco, California
94104-4443
(415) 981-1710
This report is submitted for the general information of the shareholders of the Fund. The report is not authorized for distribution to prospective investors in the Fund unless it is accompanied by a current prospectus.
This report reflects our views,
opinions and portfolio holdings
as of December 31, 2003, the end of
the reporting period. The information
provided is not a complete analysis of every
aspect of any industry, security or the Fund.
The Fund’s portfolio composition may change
depending on market and economic conditions.
Although historical performance is
no guarantee of future results, these
insights may help you understand
our investment management
philosophy.
12/03 BF AR  Printed on recycled paper
To Our Shareholders
The Dodge & Cox Balanced Fund had a total return of 24.4% for the year ended December 31, 2003, compared to the 18.5% return for the Combined Index1. Total returns for longer periods are listed on the following page. At year-end 2003 the Fund’s total net assets of $13.2 billion were invested in 64% stocks, 22% fixed-income securities and 14% cash equivalents.
The share price of the Fund rose from $60.75 at the end of 2002 to $73.04 on December 31, 2003. In addition, during the year, the Fund distributed income dividends of $1.66 per share, short-term capital gain of $0.31 per share, and long-term capital gain of $0.36 per share.
2003 Performance Review
Equity Portfolio
If asked in the beginning of the year, we would not have thought double-digit returns were likely for 2003. Instead, the equity portfolio had one of its best years in its history, and outperformed the S&P 500’s 2003 total return of 28.7%. Conclusion: Anticipating the market on a short-term basis has a huge error rate. The equity portfolio’s performance relative to the S&P 500 for 2003 should be considered in a longer-term context. Following the collapse of the technology bubble in second quarter of 2000, we identified a number of companies in the Technology, Media and Telecommunications sectors with attractive valuations, given our long-term outlook for their potential growth in profits and cash flow. Thus, we entered 2003 with a greater number of investments in companies that provide various technology products and services, well positioned for long-term growth, such as Avaya (up 428% in 2003) and Corning (up 215% in 2003). While stocks in every sector, except for Telecommunications Services, contributed to results in 2003, technology-related companies were the strongest contributors to the portfolio’s performance. Only a handful of companies declined. Eastman Kodak, one of the stock market’s strongest performers in 2002, was the portfolio’s worst performer (down 24%) in 2003. AT&T and Schering-Plough also detracted from the Fund’s return, each with declines of 19% for the year.
Fixed-Income Portfolio
Our fixed-income investment philosophy—focusing on identifying undervalued securities through in-depth, fundamental research and building a diversified portfolio with an eye to longer-term (three-to-five years) return potential—guides us year-in and year-out. The fixed-income portfolio’s favorable relative performance this year (the portfolio outperformed the 4.1% return for the LBAG) came from a variety of sources. An overweight position in corporate securities made a significant contribution. Mirroring the corporate sector of the LBAG, the portfolio’s best performers were from lower-rated issuers. For example, the bonds of Xerox Corp., UnumProvident, and Dillard’s, Inc. each produced a total return of over 20%. National Energy & Gas Transmission, Inc. (formerly PG&E-National Energy Group), a Fund holding, filed for Chapter 11 bankruptcy protection in July. While the market price of this holding is still significantly below its cost, the security contributed positively to the Fund’s performance in 2003 as its market value recovered from distressed levels following the company’s interest payment default in November 2002.
The favorable relative performance—and resultant higher valuations—of many of the Fund’s corporate holdings led us to selectively trim corporate exposure over the course of the year. Outright sales included Eastman Chemical, Dana Corporation and Disney. We also trimmed positions in CIT Group and Xerox, while adding new positions in the debt of Schering-Plough, Boston Properties, Comcast and Amerada Hess. The net effect of the transaction activity reduced the fixed-income portfolio’s weighting in corporate bonds by 4.5% over the year. Importantly, we do not make these decisions on an aggregate, sector-wide basis. Rather, they are made on an individual, issuer-by-issuer basis, and trims or outright sales of specific corporate securities are made when the risk of owning the security, given our view of the company’s credit outlook, is no longer reflected in its price.
Strategy & Expected Returns
At the risk of looking like a stopped clock, we want to reiterate our caution about future equity returns. Over the next few years, we believe that there is a high probability that total returns for equities will be significantly lower (and possibly negative) than the past 20 years (13% annualized for the S&P 500). The S&P 500 is selling well above the average price-to-earnings ratio (P/E) in the postwar period, and net margins (a measure of earnings profitability) are at historically high levels. The market is anticipating sustained economic growth in the U.S. At the same time, many economies outside the United States may be in the early stages of surprisingly strong economic expansion in terms of length and magnitude. In spite of these prospects for worldwide economic growth, these historically high valuations give us pause.
Furthermore, given the fixed-income portfolio’s low starting yield, and the limited likelihood of substantial price gains to supplement earned income, our expectations for fixed-income returns in the coming years are substantially lower. The strong absolute and relative price appreciation from the corporate sector—which added substantially
1 / Dodge & Cox Balanced Fund
to fixed-income returns this year—is unlikely to continue at the same pace in 2004, given the higher valuations currently accorded corporate bonds. Given this outlook, we have lowered our allocation to fixed-income securities as a percentage of the total Balanced Fund (22%) due to the lower total return prospects for fixed-income securities. The Fund’s cash position at 14% reflects our cautious outlook for future fixed-income and equity returns.
In the equity portfolio, we continue to invest today as we always have. We research well established companies where we believe the prospects for long-term profit and cash flow growth are favorable. We invest when those prospects are not reflected in the company’s current price. Our team of 18 analysts uses a wide variety of resources, although we believe that no model or research service can replace meeting onsite with company management and conferring directly with their competitors, customers and suppliers. We buy each holding anticipating a three-to-five year investment.
The fixed-income strategy has remained constant as well. We continue to emphasize corporate and mortgage-backed securities in our efforts to maintain a well diversified, high average quality portfolio2 with a higher yield-to-maturity than that of the LBAG. Mortgages continue to play a defensive role in the portfolio by providing a regular and relatively stable source of cash flow. Due to our concerns about inflation and the current low level of interest rates, we continue to position the portfolio with a shorter duration than that of the LBAG.
In Closing
As we said at the start of this letter, twelve months ago thoughts of appreciation in excess of 20% for the Fund in 2003 were non-existent. The global economic world will continue to unfold in unforeseen ways. In this environment of continual change, our team at Dodge & Cox will do our best to uncover attractive investment values for the shareholders of the Dodge & Cox Balanced Fund.
Thank you for the continued confidence you have placed in our firm as a shareholder of the Balanced Fund. As always, we welcome your comments and questions.
For the Board of Trustees,
| | |
 | | 
|
| |
| Harry R. Hagey, Chairman | | John A. Gunn, President |
February 4, 2004
Ten Years of Investment Performance
through December 31, 2003 (in thousands)
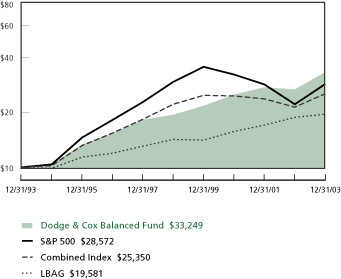
Average annual total return for periods ended December 31, 2003
| | | | | | | | | | | | |
| | | 1 Year | | | 5 Years | | | 10 Years | | | 20 Years | |
|
| | |
| Dodge & Cox Balanced Fund | | 24.44 | % | | 11.39 | % | | 12.76 | % | | 13.50 | % |
| Combined Index | | 18.45 | | | 2.67 | | | 9.75 | | | 11.86 | |
| S&P 500 | | 28.67 | | | (0.56 | ) | | 11.07 | | | 12.98 | |
| Lehman Brothers Aggregate Bond Index (LBAG) | | 4.11 | | | 6.62 | | | 6.95 | | | 9.37 | |
|
Past performance does not guarantee future results. Investment return and share price will fluctuate with market conditions, and investors may have a gain or loss when shares are sold. Mutual fund performance changes over time and currently may be significantly lower than stated above. Performance is updated and published monthly. Visit the Fund’s web site at www.dodgeandcox.com or call 800-621-3979 for current performance figures.
The Fund’s total returns include the reinvestment of dividend and capital gain distributions, but have not been adjusted for any income taxes payable by shareholders on these distributions. Index returns include dividends and/or interest income and, unlike Fund returns, do not reflect fees or expenses.
Lehman Brothers® is a trademark of Lehman Brothers, Inc.; Standard & Poor’s, Standard & Poor’s 500, and S&P 500® are trademarks of The McGraw-Hill Companies, Inc.
| | 1 | The Combined Index reflects an unmanaged portfolio of 60% of the Standard & Poor’s 500 Index (S&P 500) and 40% of the Lehman Brothers Aggregate Bond Index (LBAG). The Fund may, however, invest up to 75% of its total assets in stocks. |
| | 2 | The Fund may invest in securities rated below AA. As of December 31, 2003, 40% of the Fund’s fixed-income portfolio was rated below AA. It is in the Fund’s policy to invest in investment-grade debt securities. Securities that are downgraded below investment grade subsequent to purchase may continue to be held by the Fund, if Dodge & Cox believes it advantageous to do so. As of December 31, 2003, 1.3% of the Fund was invested in securities rated below investment grade. |
Dodge & Cox Balanced Fund / 2
Fund Information
December 31, 2003
General Information
| | |
Net Asset Value Per Share | | $73.04 |
Total Net Assets (millions) | | $13,196 |
30-Day SEC Yield1 | | 1.84% |
2003 Expense Ratio | | 0.54% |
2003 Portfolio Turnover | | 19% |
Fund Inception Date | | 1931 |
Investment Manager: Dodge & Cox, San Francisco. Managed by the Investment Policy Committee, whose ten members’ average tenure at Dodge & Cox is 23 years, and by the Fixed-Income Strategy Committee, whose eleven members’ average tenure is 15 years.
Asset Allocation

| | |
| Stock Portfolio (63.5% of Fund) | | |
Number of Stocks | | 82 |
Median Market Capitalization | | $12 billion |
Price-to-Earnings Ratio2 | | 16x |
Price-to-Book Value | | 2.0x |
Foreign Stocks3 (% of Fund) | | 8.4% |
| | |
| Five Largest Sectors | | % of Fund |
|
Consumer Discretionary | | 13.4 |
| |
Financials | | 12.2 |
Information Technology | | 8.6 |
Materials | | 6.8 |
Health Care | | 6.4 |
| | |
| Ten Largest Stock Holdings | | % of Fund |
|
| |
AT&T | | 1.8 |
Dow Chemical | | 1.7 |
Hewlett-Packard | | 1.6 |
Bank One | | 1.6 |
Xerox | | 1.6 |
HCA—The Healthcare Company | | 1.6 |
News Corp. Ltd., Pref. ADR (Australia) | | 1.4 |
Comcast | | 1.4 |
McDonald’s | | 1.4 |
Schering-Plough | | 1.4 |
| | |
| Fixed-Income Portfolio (22.3% of Fund) | | |
Number of Fixed-Income Securities | | 187 |
Average Quality4 | | AA– |
Average Maturity | | 6.6 years |
Effective Duration | | 3.8 years |
| | |
| Credit Quality Ratings4 | | % of Fund |
|
U.S. Government & Government Agencies | | 13.1 |
Aaa/AAA | | 0.1 |
Aa/AA | | 0.1 |
A/A | | 1.1 |
Baa/BBB | | 6.6 |
Ba/BB | | 0.9 |
B/B and below | | 0.4 |
| | |
| Sector Breakdown | | % of Fund |
|
| |
U.S. Treasury and Government Agency | | 2.2 |
Mortgage-Backed Securities | | 11.0 |
Corporate | | 9.1 |
| 1 | | SEC Yield is an annualization of the Fund’s total net investment income per share for the 30-day period ended on the last day of the month. |
| 2 | | The Fund’s price-to-earnings (P/E) ratio is calculated using Dodge & Cox’s estimated forward earnings and excludes extraordinary items. |
| 3 | | All U.S. dollar-denominated. |
| 4 | | For presentation purposes only: when a security is split-rated, the lower of either the Moody’s or Standard & Poor’s rating is reported. |
3 / Dodge & Cox Balanced Fund
Portfolio of Investments
December 31, 2003
COMMON STOCKS: 62.1%
| | | | | |
| SHARES | | MARKET VALUE |
| |
| FINANCIALS: 12.2% | | | |
| BANKS: 4.3% | | | |
| 4,600,600 | | Bank One Corp. | | $ | 209,741,354 |
| 1,512,700 | | Golden West Financial Corp. | | | 156,095,513 |
| 2,876,400 | | Wachovia Corp. | | | 134,011,476 |
| 1,260,750 | | Wells Fargo & Co. | | | 74,245,567 |
| | | | |
|
|
| | | | | | 574,093,910 |
| INSURANCE: 3.7% |
| 2,477,000 | | Loews Corp. | | | 122,487,650 |
| 2,992,200 | | St. Paul Companies, Inc. | | | 118,640,730 |
| 1,751,500 | | Torchmark Corp. | | | 79,763,310 |
| 1,094,612 | | Chubb Corp. | | | 74,543,077 |
| 3,795,000 | | UNUMProvident Corp. | | | 59,847,150 |
| 562,750 | | MBIA, Inc. | | | 33,331,683 |
| | | | |
|
|
| | | | | | 488,613,600 |
| DIVERSIFIED FINANCIALS: 2.4% |
| 4,476,500 | | CIT Group, Inc. | | | 160,930,175 |
| 2,470,200 | | Capital One Financial Corp. | | | 151,398,558 |
| | | | |
|
|
| | | | | | 312,328,733 |
| REAL ESTATE: 1.8% |
| 5,234,800 | | Equity Office Properties Trust | | | 149,977,020 |
| 2,800,600 | | Equity Residential Properties Trust | | | 82,645,706 |
| | | | |
|
|
| | | | | | 232,622,726 |
| | | | |
|
|
| | | | | | 1,607,658,969 |
| CONSUMER DISCRETIONARY: 12.0% | | | |
| CONSUMER DURABLES & APPAREL: 3.7% | | | |
| 5,208,600 | | Sony Corp. ADR(b) (Japan) | | | 180,582,162 |
| 8,346,300 | | Matsushita Electric Industrial Co., Ltd. ADR(b) (Japan) | | | 116,347,422 |
| 1,004,900 | | Whirlpool Corp. | | | 73,005,985 |
| 2,616,100 | | Eastman Kodak Co. | | | 67,155,287 |
| 1,107,900 | | VF Corp. | | | 47,905,596 |
| | | | |
|
|
| | | | | | 484,996,452 |
| RETAILING: 2.5% |
| 5,034,350 | | May Department Stores Co. | | | 146,348,555 |
| 2,429,250 | | Nordstrom, Inc. | | | 83,323,275 |
| 3,552,400 | | Gap, Inc. | | | 82,451,204 |
| 1,461,400 | | Dillard’s, Inc. Class A | | | 24,054,644 |
| | | | |
|
|
| | | | | | 336,177,678 |
| MEDIA: 2.3% |
| 5,738,709 | | Comcast Corp.(a) | | | 188,631,365 |
| 6,387,000 | | Time Warner Inc.(a) | | | 114,902,130 |
| | | | |
|
|
| | | | | | 303,533,495 |
| HOTELS, RESTAURANTS & LEISURE: 1.8% |
| 7,592,950 | | McDonald’s Corp. | | | 188,532,948 |
| 5,314,826 | | InterContinental Hotels Group PLC ADR(b) (United Kingdom) | | | 50,862,885 |
| | | | |
|
|
| | | | | | 239,395,833 |
| |
| | | | | |
| SHARES | | MARKET VALUE |
| AUTOMOBILES & COMPONENTS: 0.9% |
| 9,913,720 | | Delphi Automotive Systems Corp. | | $ | 101,219,081 |
| 730,830 | | Ford Motor Co. | | | 11,693,280 |
| 42,000 | | Honda Motor Co. Ltd. ADR(b) (Japan) | | | 945,000 |
| | | | |
|
|
| | | | | | 113,857,361 |
| TRADING COMPANIES & DISTRIBUTORS: 0.8% |
| 3,335,450 | | Genuine Parts Co. | | | 110,736,940 |
| | | | |
|
|
| | | | | | 1,588,697,759 |
| |
| INFORMATION TECHNOLOGY: 8.6% | | | |
| TECHNOLOGY HARDWARE & EQUIPMENT: 6.1% | | | |
| 9,165,355 | | Hewlett-Packard Co. | | | 210,528,204 |
| 15,102,150 | | Xerox Corp.(a) | | | 208,409,670 |
| 7,100,000 | | Motorola, Inc. | | | 99,897,000 |
| 2,303,625 | | NCR Corp.(a) | | | 89,380,650 |
| 2,955,550 | | Thermo Electron Corp.(a) | | | 74,479,860 |
| 4,479,150 | | Avaya, Inc.(a) | | | 57,960,201 |
| 1,677,600 | | Storage Technology Corp.(a) | | | 43,198,200 |
| 1,688,700 | | Corning, Inc.(a) | | | 17,613,141 |
| | | | |
|
|
| | | | | | 801,466,926 |
| SOFTWARE & SERVICES: 2.5% |
| 7,082,600 | | Electronic Data Systems | | | 173,807,004 |
| 2,176,400 | | Computer Sciences Corp.(a) | | | 96,262,172 |
| 6,937,800 | | Compuware Corp.(a) | | | 41,904,312 |
| 827,300 | | BMC Software, Inc.(a) | | | 15,429,145 |
| | | | |
|
|
| | | | | | 327,402,633 |
| | | | |
|
|
| | | | | | 1,128,869,559 |
| MATERIALS: 6.8% | | | |
| CHEMICALS: 4.7% | | | |
| 5,442,959 | | Dow Chemical Co. | | | 226,263,806 |
| 4,178,800 | | Akzo Nobel N.V. ADR(b) (Netherlands) | | | 159,630,160 |
| 2,102,600 | | Rohm and Haas Co. | | | 89,802,046 |
| 1,654,300 | | Engelhard Corp. | | | 49,546,285 |
| 3,434,000 | | Syngenta A.G. ADR(b) (Switzerland) | | | 46,290,320 |
| 1,676,920 | | NOVA Chemicals Corp.(b) (Canada) | | | 45,192,994 |
| 321,400 | | Lubrizol Corp. | | | 10,451,928 |
| | | | |
|
|
| | | | | | 627,177,539 |
| METALS AND MINING: 1.7% |
| 1,115,400 | | Rio Tinto PLC ADR(b) (United Kingdom) | | | 124,155,174 |
| 2,587,200 | | Alcoa, Inc. | | | 98,313,600 |
| | | | |
|
|
| | | | | | 222,468,774 |
| PAPER AND FOREST PRODUCTS: 0.4% |
| 1,267,800 | | International Paper Co. | | | 54,654,858 |
| | | | |
|
|
| | | | | | 904,301,171 |
| HEALTH CARE: 6.4% |
| PHARMACEUTICALS & BIOTECHNOLOGY: 3.0% |
| 10,623,550 | | Schering-Plough Corp. | | | 184,743,535 |
| 2,285,492 | | Pfizer Inc. | | | 80,746,432 |
| 2,435,400 | | Bristol-Myers Squibb Co. | | | 69,652,440 |
| 1,266,500 | | Wyeth | | | 53,762,925 |
| | | | |
|
|
| | | | | | 388,905,332 |
See accompanying Notes to Financial Statements
Dodge & Cox Balanced Fund / 4
Portfolio of Investments
December 31, 2003
COMMON STOCKS (continued)
| | | | | |
| SHARES | | MARKET VALUE |
| HEALTH CARE EQUIPMENT & SERVICES: 3.4% |
| 4,797,900 | | HCA—The Healthcare Company | | $ | 206,117,784 |
| 1,652,700 | | Cardinal Health, Inc. | | | 101,079,132 |
| 918,300 | | WellPoint Health Networks, Inc.(a) | | | 89,065,917 |
| 1,317,800 | | Becton, Dickinson & Co. | | | 54,214,292 |
| | | | |
|
|
| | | | | | 450,477,125 |
| | | | |
|
|
| | | | | | 839,382,457 |
| ENERGY: 5.9% |
| 1,871,308 | | ChevronTexaco Corp. | | | 161,662,298 |
| 3,410,900 | | Occidental Petroleum Corp. | | | 144,076,416 |
| 2,124,900 | | ConocoPhillips | | | 139,329,693 |
| 3,690,100 | | Unocal Corp. | | | 135,906,383 |
| 2,984,100 | | Baker Hughes, Inc. | | | 95,968,656 |
| 1,804,900 | | Amerada Hess Corp. | | | 95,966,533 |
| | | | |
|
|
| | | | | | 772,909,979 |
| INDUSTRIALS: 3.6% |
| TRANSPORTATION: 1.7% |
| 1,730,150 | | FedEx Corp. | | | 116,785,125 |
| 1,599,200 | | Union Pacific Corp. | | | 111,112,416 |
| | | | |
|
|
| | | | | | 227,897,541 |
| CAPITAL GOODS: 1.1% |
| 1,840,300 | | Fluor Corp. | | | 72,949,492 |
| 2,458,700 | | Masco Corp. | | | 67,392,967 |
| | | | |
|
|
| | | | | | 140,342,459 |
| COMMERCIAL SERVICES & SUPPLIES: 0.8% |
| 2,036,500 | | R.R. Donnelley & Sons Co. | | | 61,400,475 |
| 1,203,150 | | Pitney Bowes, Inc. | | | 48,871,953 |
| | | | |
|
|
| | | | | | 110,272,428 |
| | | | |
|
|
| | | | | | 478,512,428 |
| TELECOMMUNICATION SERVICES: 3.1% |
| 11,973,280 | | AT&T Corp. | | | 243,057,584 |
| 21,213,500 | | AT&T Wireless Services, Inc.(a) | | | 169,495,865 |
| | | | |
|
|
| | | | | | 412,553,449 |
| UTILITIES: 1.9% |
| 4,914,600 | | Duke Energy Corp. | | | 100,503,570 |
| 2,368,880 | | American Electric Power Co., Inc. | | | 72,274,529 |
| 1,686,100 | | TXU Corp. | | | 39,994,292 |
| 1,357,300 | | Scottish Power PLC ADR(b) (United Kingdom) | | | 36,891,414 |
| | | | |
|
|
| | | | | | 249,663,805 |
| CONSUMER STAPLES: 1.6% |
| FOOD, BEVERAGE AND TOBACCO: 1.6% |
| 2,370,000 | | Unilever N.V.(b) (Netherlands) | | | 153,813,000 |
| 3,537,195 | | Archer Daniels Midland Co. | | | 53,836,108 |
| | | | |
|
|
| | | | | | 207,649,108 |
| | | | |
|
|
| Total Common Stocks (cost $6,280,122,963) | | | 8,190,198,684 |
| | | | |
|
|
PREFERRED STOCKS: 1.4%
| | | | | | |
| SHARES | | MARKET VALUE |
| | CONSUMER DISCRETIONARY: 1.4% |
| | MEDIA: 1.4% |
| | 6,257,900 | | News Corp. Ltd., Preferred Limited Voting Ordinary Shares ADR(b) (Australia) | | $ | 189,301,475 |
| | | | | |
|
|
| | Total Preferred Stocks (cost $130,935,524) | | 189,301,475 | |
| | | | | |
|
|
|
| FIXED-INCOME SECURITIES: 22.3%
|
| PAR VALUE | | | | MARKET VALUE |
| | | | | |
| | U.S. TREASURY AND GOVERNMENT AGENCY: 2.2% |
| | U.S. TREASURY: 1.4% |
| $ | 30,843,076 | | U.S. Treasury Inflation-Indexed Notes,
3.00%, 7/15/12 | | $ | 33,623,764 |
| | 38,000,000 | | U.S. Treasury Notes, 3.00%, 1/31/04 | | | 38,059,356 |
| | 75,000,000 | | U.S. Treasury Notes, 3.375%, 4/30/04 | | | 75,591,825 |
| | 26,515,000 | | U.S. Treasury Notes, 7.25%, 8/15/04 | | | 27,519,680 |
| | 8,500,000 | | U.S. Treasury Notes, 3.50%, 11/15/06 | | | 8,785,881 |
| | | | | |
|
|
| | | | | | | 183,580,506 |
| | GOVERNMENT AGENCY: 0.8% |
| | 4,935,000 | | Arkansas Dev. Fin. Auth. GNMA Guaranteed Bonds, 9.75%, 11/15/14 | | | 6,130,208 |
| | 9,000,000 | | Federal Home Loan Mtge. Corp., 6.25%, 7/15/32 | | | 9,787,608 |
| | 9,827,204 | | Govt. Small Business Admin. 504
Series 00-20 I, 7.21%, 9/1/20 | | | 11,037,968 |
| | 15,302,874 | | Govt. Small Business Admin. 504
Series 01-20G, 6.625%, 7/1/21 | | | 16,806,103 |
| | 26,150,000 | | Govt. Small Business Admin. 504
Series 03-20J, 4.92%, 10/1/23 | | | 26,109,331 |
| | 4,770,430 | | Govt. Small Business Admin. 504
Series 96-20L, 6.70%, 12/1/16 | | | 5,203,956 |
| | 8,181,640 | | Govt. Small Business Admin. 504
Series 97-20F, 7.20%, 6/1/17 | | | 9,076,907 |
| | 10,025,746 | | Govt. Small Business Admin. 504
Series 97-20I, 6.90%, 9/1/17 | | | 11,037,482 |
| | 11,884,319 | | Govt. Small Business Admin. 504
Series 98-20D, 6.15%, 4/1/18 | | | 12,791,095 |
| | 6,332,906 | | Govt. Small Business Admin. 504
Series 98-20I, 6.00%, 9/1/18 | | | 6,787,468 |
| | | | | |
|
|
| | | | | | | 114,768,126 |
| | | | | |
|
|
| | | | | | | 298,348,632 |
| | MORTGAGE BACKED SECURITIES: 11.0% |
| | FEDERAL AGENCY CMO AND REMIC(c): 2.4% |
| | 3,280,285 | | Federal Home Loan Mtge. Corp.,
7.25%, 4/15/07 | | | 3,361,025 |
| | 5,625,214 | | Federal Home Loan Mtge. Corp.,
6.50%, 5/15/08 | | | 5,860,778 |
| | 6,570,068 | | Federal Home Loan Mtge. Corp.,
6.50%, 5/15/08 | | | 6,832,833 |
5 / Dodge & Cox Balanced Fund | See accompanying Notes to Financial Statements |
Portfolio of Investments
December 31, 2003
FIXED-INCOME SECURITIES (continued)
| | | | | | |
| PAR VALUE | | | | MARKET VALUE |
| | | | | |
| $ | 15,720,560 | | Federal Home Loan Mtge. Corp.,
6.50%, 10/15/08 | | $ | 16,215,434 |
| | 12,738,155 | | Federal Home Loan Mtge. Corp.,
5.50%, 12/15/13 | | | 12,903,136 |
| | 4,486,099 | | Federal Home Loan Mtge. Corp.,
5.50%, 2/15/14 | | | 4,559,582 |
| | 8,901,240 | | Federal Home Loan Mtge. Corp.,
6.00%, 12/15/14 | | | 9,024,199 |
| | 3,264,961 | | Federal Home Loan Mtge. Corp.,
6.50%, 5/15/21 | | | 3,262,605 |
| | 11,781,326 | | Federal Home Loan Mtge. Corp.,
6.25%, 9/15/22 | | | 11,976,887 |
| | 28,000,000 | | Federal Home Loan Mtge. Corp.,
7.00%, 8/25/23 | | | 30,281,846 |
| | 724,701 | | Federal Natl. Mtge. Assn., 5.00%, 1/1/06 | | | 737,440 |
| | 2,850,874 | | Federal Natl. Mtge. Assn., 7.50%, 2/25/07 | | | 2,981,661 |
| | 191,749 | | Federal Natl. Mtge. Assn., 6.50%, 4/1/09 | | | 199,507 |
| | 20,000,000 | | Federal Natl. Mtge. Assn., 5.50%, 11/25/13 | | | 20,429,876 |
| | 8,128,667 | | Federal Natl. Mtge. Assn., 7.00%, 6/17/22 | | | 8,321,001 |
| | 16,052,863 | | Federal Natl. Mtge. Assn., 7.00%, 6/25/32 | | | 17,281,918 |
| | 16,179,490 | | Federal Natl. Mtge. Assn., 7.50%, 2/25/41 | | | 17,665,981 |
| | 17,957,331 | | Federal Natl. Mtge. Assn., 7.50%, 7/25/41 | | | 19,607,160 |
| | 7,466,357 | | Federal Natl. Mtge. Assn., 7.00%, 9/25/41 | | | 8,056,669 |
| | 16,915,860 | | Federal Natl. Mtge. Assn., 7.00%, 6/25/42 | | | 18,253,279 |
| | 17,172,304 | | Federal Natl. Mtge. Assn., 7.00%, 6/25/42 | | | 18,529,997 |
| | 35,776,083 | | Federal Natl. Mtge. Assn., 6.50%, 7/25/42 | | | 37,998,672 |
| | 15,723,171 | | Federal Natl. Mtge. Assn., 7.00%, 7/25/42 | | | 16,966,292 |
| | 21,945,608 | | Federal Natl. Mtge. Assn., 7.50%, 10/25/42 | | | 23,961,860 |
| | 2,708,435 | | Veterans Affairs Vendee Mtge. Trust,
7.21%, 2/15/25 | | | 2,965,862 |
| | 1,791,254 | | Veterans Affairs Vendee Mtge. Trust,
8.793%, 6/15/25 | | | 2,006,648 |
| | | | | |
|
|
| | | | | | | 320,242,148 |
| | |
| | FEDERAL AGENCY MORTGAGE PASS-THROUGH: 8.5% |
| | 1,889 | | Federal Home Loan Mtge. Corp.,
7.50%, 7/1/06 | | | 1,879 |
| | 5,196 | | Federal Home Loan Mtge. Corp.,
7.25%, 1/1/08 | | | 5,327 |
| | 14,025 | | Federal Home Loan Mtge. Corp.,
7.50%, 2/1/08 | | | 14,707 |
| | 200,945 | | Federal Home Loan Mtge. Corp.,
8.00%, 2/1/08 | | | 212,914 |
| | 3,263,837 | | Federal Home Loan Mtge. Corp.,
7.00%, 5/1/08 | | | 3,465,033 |
| | 4,890,169 | | Federal Home Loan Mtge. Corp.,
7.00%, 12/1/08 | | | 5,169,177 |
| | 1,596,441 | | Federal Home Loan Mtge. Corp.,
6.50%, 2/1/09 | | | 1,680,048 |
| | 3,722,928 | | Federal Home Loan Mtge. Corp.,
7.00%, 8/1/09 | | | 3,973,639 |
| | 4,470,958 | | Federal Home Loan Mtge. Corp.,
6.00%, 9/1/09 | | | 4,673,157 |
| | | | | | |
| PAR VALUE | | | | MARKET VALUE |
| | | | | |
| $ | 150,107 | | Federal Home Loan Mtge. Corp.,
8.75%, 5/1/10 | | $ | 161,123 |
| | 862,613 | | Federal Home Loan Mtge. Corp.,
8.00%, 11/1/10 | | | 916,398 |
| | 7,204,438 | | Federal Home Loan Mtge. Corp.,
6.00%, 9/1/12 | | | 7,569,523 |
| | 14,858,344 | | Federal Home Loan Mtge. Corp.,
6.50%, 3/1/13 | | | 15,766,092 |
| | 10,822,954 | | Federal Home Loan Mtge. Corp.,
6.00%, 10/1/13 | | | 11,367,382 |
| | 15,419,599 | | Federal Home Loan Mtge. Corp.,
6.00%, 4/1/14 | | | 16,195,253 |
| | 11,941,998 | | Federal Home Loan Mtge. Corp.,
6.50%, 7/1/14 | | | 12,652,407 |
| | 2,646,035 | | Federal Home Loan Mtge. Corp.,
7.00%, 4/1/15 | | | 2,803,295 |
| | 8,547,863 | | Federal Home Loan Mtge. Corp.,
6.00%, 9/1/15 | | | 8,977,816 |
| | 10,301,212 | | Federal Home Loan Mtge. Corp.,
6.00%, 5/1/16 | | | 10,820,412 |
| | 106,732 | | Federal Home Loan Mtge. Corp.,
8.25%, 2/1/17 | | | 114,094 |
| | 56,045,014 | | Federal Home Loan Mtge. Corp.,
6.00%, 5/1/17 | | | 58,806,532 |
| | 8,649,001 | | Federal Home Loan Mtge. Corp.,
6.50%, 8/1/17 | | | 9,161,890 |
| | 31,014,896 | | Federal Home Loan Mtge. Corp.,
6.50%, 12/1/17 | | | 32,854,090 |
| | 45,202,962 | | Federal Home Loan Mtge. Corp.,
6.00%, 2/1/18 | | | 47,430,256 |
| | 29,118,485 | | Federal Home Loan Mtge. Corp.,
6.50%, 3/1/18 | | | 30,845,222 |
| | 15,182,358 | | Federal Home Loan Mtge. Corp.,
6.50%, 9/1/18 | | | 16,082,677 |
| | 2,752,432 | | Federal Home Loan Mtge. Corp.,
7.75%, 7/25/21 | | | 2,971,420 |
| | 1,168,494 | | Federal Home Loan Mtge. Corp.,
8.50%, 1/1/23 | | | 1,258,823 |
| | 1,374,189 | | Federal Home Loan Mtge. Corp.,
7.47%, 3/17/23 | | | 1,473,800 |
| | 10,289,667 | | Federal Natl. Mtge. Assn., 5.57%, 1/1/06 | | | 10,724,409 |
| | 887,017 | | Federal Natl. Mtge. Assn., 7.50%, 9/1/07 | | | 935,293 |
| | 1,430,452 | | Federal Natl. Mtge. Assn., 7.00%, 12/1/07 | | | 1,500,595 |
| | 2,220,256 | | Federal Natl. Mtge. Assn., 7.00%, 12/1/07 | | | 2,343,563 |
| | 1,354,027 | | Federal Natl. Mtge. Assn., 6.50%, 5/1/08 | | | 1,429,909 |
| | 21,204,365 | | Federal Natl. Mtge. Assn., 5.965%, 10/1/08 | | | 23,071,622 |
| | 3,606,027 | | Federal Natl. Mtge. Assn., 5.606%, 11/1/08 | | | 3,880,005 |
| | 3,774,917 | | Federal Natl. Mtge. Assn., 6.50%, 11/1/08 | | | 3,973,592 |
| | 1,970,872 | | Federal Natl. Mtge. Assn., 6.00%, 1/1/09 | | | 2,075,271 |
| | 8,740,081 | | Federal Natl. Mtge. Assn., 6.041%, 1/1/09 | | | 9,541,108 |
| | 439,344 | | Federal Natl. Mtge. Assn., 8.00%, 1/1/09 | | | 462,457 |
| | 288,367 | | Federal Natl. Mtge. Assn., 7.50%, 8/1/10 | | | 307,286 |
| | 2,737,157 | | Federal Natl. Mtge. Assn., 6.50%, 3/1/11 | | | 2,904,534 |
| | 2,308,863 | | Federal Natl. Mtge. Assn., 7.00%, 7/1/11 | | | 2,437,091 |
See accompanying Notes to Financial Statements
Dodge & Cox Balanced Fund / 6
Portfolio of Investments
December 31, 2003
FIXED-INCOME SECURITIES (continued)
| | | | | | |
| PAR VALUE | | | | MARKET VALUE |
| | | | | |
| $ | 7,358,034 | | Federal Natl. Mtge. Assn., 6.50%, 8/1/11 | | $ | 7,807,976 |
| | 11,268,533 | | Federal Natl. Mtge. Assn., 5.863%, 1/1/12 | | | 12,248,930 |
| | 10,847,306 | | Federal Natl. Mtge. Assn., 6.50%, 1/1/12 | | | 11,472,564 |
| | 31,207,708 | | Federal Natl. Mtge. Assn., 6.017%, 4/1/12 | | | 33,912,455 |
| | 6,393,485 | | Federal Natl. Mtge. Assn., 6.50%, 1/1/13 | | | 6,783,884 |
| | 6,762,583 | | Federal Natl. Mtge. Assn., 6.50%, 1/1/13 | | | 7,175,451 |
| | 20,868,547 | | Federal Natl. Mtge. Assn., 5.50%, 2/1/14 | | | 21,727,546 |
| | 13,014,218 | | Federal Natl. Mtge. Assn., 6.00%, 3/1/14 | | | 13,682,001 |
| | 35,044,431 | | Federal Natl. Mtge. Assn., 6.00%, 3/1/14 | | | 36,868,041 |
| | 27,800,226 | | Federal Natl. Mtge. Assn., 5.50%, 9/1/14 | | | 28,944,549 |
| | 14,745,729 | | Federal Natl. Mtge. Assn., 5.50%, 8/1/15 | | | 15,352,698 |
| | 21,530,085 | | Federal Natl. Mtge. Assn., 5.50%, 8/1/15 | | | 22,416,315 |
| | 5,719,734 | | Federal Natl. Mtge. Assn., 6.50%, 8/1/15 | | | 6,068,003 |
| | 9,700,366 | | Federal Natl. Mtge. Assn., 7.50%, 9/1/15 | | | 10,387,639 |
| | 18,397,585 | | Federal Natl. Mtge. Assn., 7.50%, 12/1/15 | | | 19,701,059 |
| | 7,014,661 | | Federal Natl. Mtge. Assn., 7.50%, 1/1/16 | | | 7,511,652 |
| | 10,317,107 | | Federal Natl. Mtge. Assn., 6.00%, 3/1/16 | | | 10,841,931 |
| | 10,498,194 | | Federal Natl. Mtge. Assn., 6.00%, 7/1/16 | | | 11,023,367 |
| | 36,509,738 | | Federal Natl. Mtge. Assn., 5.50%, 11/1/16 | | | 37,879,970 |
| | 15,694,337 | | Federal Natl. Mtge. Assn., 5.50%, 12/1/16 | | | 16,283,355 |
| | 10,943,970 | | Federal Natl. Mtge. Assn., 7.50%, 12/1/16 | | | 11,719,353 |
| | 49,409,465 | | Federal Natl. Mtge. Assn., 6.50%, 6/1/17 | | | 52,424,568 |
| | 18,633,417 | | Federal Natl. Mtge. Assn., 6.00%, 3/1/18 | | | 19,567,401 |
| | 18,886,122 | | Federal Natl. Mtge. Assn., 6.00%, 3/1/18 | | | 19,832,772 |
| | 22,177,046 | | Federal Natl. Mtge. Assn., 6.00%, 5/1/18 | | | 23,286,453 |
| | 47,302,904 | | Federal Natl. Mtge. Assn., 6.00%, 5/1/18 | | | 49,673,921 |
| | 18,215,712 | | Federal Natl. Mtge. Assn., 6.00%, 3/1/18 | | | 19,126,954 |
| | 44,625,000 | | Federal Natl. Mtge. Assn., 5.50%, 4/1/18 | | | 46,206,064 |
| | 50,000,000 | | Federal Natl. Mtge. Assn., 5.50%, 6/1/18 | | | 51,771,500 |
| | 45,102,723 | | Federal Natl. Mtge. Assn., 6.50%, 11/1/18 | | | 47,841,360 |
| | 572,116 | | Federal Natl. Mtge. Assn., 7.50%, 7/1/19 | | | 603,146 |
| | 28,950,515 | | Federal Natl. Mtge. Assn., 6.50%, 1/1/22 | | | 30,409,780 |
| | 3,283,571 | | Govt. Natl. Mtge. Assn., 7.50%, 1/15/08 | | | 3,479,176 |
| | 6,824,477 | | Govt. Natl. Mtge. Assn., 6.50%, 7/15/09 | | | 7,290,204 |
| | 952,782 | | Govt. Natl. Mtge. Assn., 7.97%, 4/15/20 | | | 1,047,336 |
| | 862,034 | | Govt. Natl. Mtge. Assn., 7.97%, 5/15/20 | | | 947,582 |
| | 615,123 | | Govt. Natl. Mtge. Assn., 7.97%, 8/15/20 | | | 676,168 |
| | 773,338 | | Govt. Natl. Mtge. Assn., 7.97%, 8/15/20 | | | 850,084 |
| | 1,006,356 | | Govt. Natl. Mtge. Assn., 7.97%, 10/15/20 | | | 1,106,226 |
| | 852,751 | | Govt. Natl. Mtge. Assn., 7.97%, 1/15/21 | | | 936,686 |
| | 10,379,064 | | Govt. Natl. Mtge. Assn., 7.50%, 11/15/24 | | | 11,211,060 |
| | 5,157,292 | | Govt. Natl. Mtge. Assn., 7.50%, 10/15/25 | | | 5,565,900 |
| | | | | |
|
|
| | | | | | | 1,116,674,201 |
| | PRIVATE LABEL CMO AND REMIC(c): 0.1% | | | |
| | 11,559,150 | | Union Planters Mortgage Finance Corp.,
7.70%, 12/25/24 | | | 12,523,223 |
| | | | | |
|
|
| | | | | | | 1,449,439,572 |
| | CORPORATE: 9.1% |
| | INDUSTRIAL: 5.9% |
| | 43,525,000 | | AOL Time Warner, Inc., 7.625%, 4/15/31 | | | 50,217,752 |
| | 10,000,000 | | AOL Time Warner, Inc., 7.70%, 5/1/32 | | | 11,671,060 |
| | 38,300,000 | | AT&T Corp., 8.05%, 11/15/11 | | | 44,082,534 |
| | 48,145,000 | | AT&T Corp., 8.75%, 11/15/31 | | | 56,260,466 |
| | 12,930,000 | | Amerada Hess Corp., 6.65%, 8/15/11 | | | 14,012,862 |
| | | | | | |
| PAR VALUE | | | | MARKET VALUE |
| | | | | |
| $ | 6,375,000 | | Amerada Hess Corp., 7.875%, 10/1/29 | | $ | 6,994,516 |
| | 17,000,000 | | American Home Products Corp.,
6.70%, 3/15/11 | | | 19,199,239 |
| | 36,265,000 | | Comcast Corp., 5.30%, 1/15/14 | | | 36,144,564 |
| | 25,275,000 | | Dillard’s, Inc., 7.375%, 6/1/06 | | | 26,159,625 |
| | 3,500,000 | | Dillard’s, Inc., 7.13%, 8/1/18 | | | 3,456,250 |
| | 28,975,000 | | Ford Motor Credit Co., 6.50%, 1/25/07 | | | 30,864,865 |
| | 52,500,000 | | Ford Motor Credit Co., 7.25%, 10/25/11 | | | 56,939,610 |
| | 12,750,000 | | GMAC, 7.75%, 1/19/10 | | | 14,452,865 |
| | 35,630,000 | | GMAC, 8.875%, 6/1/10, Putable 2005 | | | 41,701,637 |
| | 15,000,000 | | GMAC, 6.875%, 9/15/11 | | | 16,156,905 |
| | 27,750,000 | | HCA—The Healthcare Company,
8.75%, 9/1/10 | | | 33,042,896 |
| | 5,926,000 | | HCA—The Healthcare Company,
7.875%, 2/1/11 | | | 6,758,668 |
| | 20,000,000 | | HCA—The Healthcare Company,
6.25%, 2/15/13 | | | 20,472,140 |
| | 16,250,000 | | HCA—The Healthcare Company,
6.75%, 7/15/13 | | | 17,233,109 |
| | 21,185,000 | | Hewlett-Packard Co., 5.50%, 7/1/07 | | | 22,896,769 |
| | 18,500,000 | | Lockheed Martin Corp., 7.65%, 5/1/16 | | | 22,475,983 |
| | 8,500,000 | | Lockheed Martin Corp., 7.75%, 5/1/26 | | | 10,212,402 |
| | 5,900,000 | | May Department Stores Co.,
7.625%, 8/15/13 | | | 6,857,316 |
| | 11,350,000 | | May Department Stores Co.,
7.45%, 10/15/16 | | | 13,172,038 |
| | 775,000 | | May Department Stores Co., 7.875%, 3/1/30 | | | 926,802 |
| | 16,000,000 | | May Department Stores Co.,
8.125%, 8/15/35, Callable 2015 | | | 18,551,776 |
| | 10,440,000 | | May Department Stores Co.,
7.875%, 8/15/36, Callable 2016 | | | 11,897,737 |
| | 34,610,000 | | Raychem Corp., 8.20%, 10/15/08 | | | 39,109,300 |
| | 35,000,000 | | Raytheon Co., 6.75%, 8/15/07 | | | 38,777,445 |
| | 12,500,000 | | Schering-Plough Corp., 5.30%, 12/1/13 | | | 12,718,113 |
| | 22,500,000 | | Time Warner Entertainment,
8.375%, 7/15/33 | | | 28,570,320 |
| | 24,500,000 | | Wyeth, 5.50%, 3/15/13 | | | 24,940,044 |
| | 10,000,000 | | Wyeth, 5.50%, 2/1/14 | | | 10,114,150 |
| | 10,000,000 | | Xerox Corp., 7.20%, 4/1/16 | | | 10,225,000 |
| | | | | |
|
|
| | | | | | | 777,266,758 |
| | FINANCE: 2.6% |
| | 18,975,000 | | Bank One Capital III(d), 8.75%, 9/1/30 | | | 24,932,789 |
| | 12,275,000 | | Bank One Corp., 6.50%, 2/1/06 | | | 13,324,341 |
| | 14,550,000 | | BankAmerica Capital II(d),
8.00%, 12/15/26, Callable 2006 | | | 16,670,866 |
| | 17,000,000 | | Boston Properties, Inc., 6.25%, 1/15/13 | | | 18,241,731 |
| | 22,500,000 | | Boston Properties, Inc., 5.625%, 4/15/15 | | | 22,485,375 |
| | 14,705,000 | | CIGNA Corp., 7.00%, 1/15/11 | | | 16,444,704 |
| | 9,745,000 | | CIGNA Corp., 7.65%, 3/1/23 | | | 10,686,221 |
| | 10,507,000 | | CIGNA Corp., 7.875%, 5/15/27 | | | 12,140,881 |
| | 6,050,000 | | CIGNA Corp., 8.30%, 1/15/33, Step Coupon | | | 7,122,332 |
| | 6,000,000 | | CIT Group, Inc., 7.375%, 4/2/07 | | | 6,776,940 |
| | 12,500,000 | | CIT Group, Inc., 5.75%, 9/25/07 | | | 13,487,450 |
| | 12,480,000 | | Citicorp Capital Trust I(d),
7.933%, 2/15/27, Callable 2007 | | | 14,384,748 |
7 / Dodge & Cox Balanced Fund | See accompanying Notes to Financial Statements |
Portfolio of Investments
December 31, 2003
FIXED-INCOME SECURITIES (continued)
| | | | | | |
| PAR VALUE | | | | MARKET VALUE |
| | | | | |
| $ | 20,055,000 | | EOP Operating Limited Partnership(e), 8.375%, 3/15/06 | | $ | 22,456,285 |
| | 23,500,000 | | EOP Operating Limited Partnership(e), 5.875%, 1/15/13 | | | 24,532,802 |
| | 4,945,000 | | First Nationwide Bank, 10.00%, 10/1/06 | | | 5,810,924 |
| | 16,880,000 | | Health Net, Inc., 8.375%, 4/15/11 | | | 20,282,518 |
| | 3,350,000 | | Provident Companies, Inc., 7.25%, 3/15/28 | | | 3,344,938 |
| | 25,150,000 | | Safeco Corp., 7.25%, 9/1/12 | | | 28,892,622 |
| | 17,500,000 | | St. Paul Companies, Inc., 8.125%, 4/15/10 | | | 20,928,792 |
| | 10,090,000 | | UNUMProvident Corp., 7.625%, 3/1/11 | | | 11,115,447 |
| | 13,850,000 | | UNUMProvident Corp., 6.75%, 12/15/28 | | | 13,190,172 |
| | 4,795,000 | | UNUMProvident Corp., 7.375%, 6/15/32 | | | 4,847,903 |
| | | | | |
|
|
| | | | | | | 332,100,781 |
| | TRANSPORTATION: 0.5% |
| | 5,180,858 | | Consolidated Rail Corp.,
6.76%, 5/25/15, Callable 2005 | | | 5,502,226 |
| | 12,740,000 | | Consolidated Rail Corp., 9.75%, 6/15/20 | | | 17,553,376 |
| | 43,092,576 | | Union Pacific Corp., 6.33%, 1/2/20 | | | 45,961,680 |
| | | | | |
|
|
| | | | | | | 69,017,282 |
| | UTILITIES: 0.1% |
| | 25,000,000 | | National Energy & Gas Transmission, Inc.(f), 5/16/11 | | | 17,500,000 |
| | | | | |
|
|
| | | | | | | 1,195,884,821 |
| | | | | |
|
|
| | Total Fixed-Income Securities (cost $2,796,974,943) | | 2,943,673,025 |
| | | | | |
|
|
| | | | |
|
SHORT-TERM INVESTMENTS: 13.6%
|
| PAR VALUE | | | | MARKET VALUE |
| | | | | |
| 65,664,424 | | SSgA Prime Money Market Fund | | 65,664,424 |
| 410,040,000 | | State Street Repurchase Agreement, 0.65%, 1/2/04 (collateralized by U.S. Treasury securities, value $418,258,496) | | 410,040,000 |
| 275,000,000 | | U.S. Treasury Bills, 1/29/04 | | 274,792,431 |
| 300,000,000 | | U.S. Treasury Bills, 3/18/04 | | 299,387,081 |
| 225,000,000 | | U.S. Treasury Bills, 4/15/04 | | 224,381,302 |
| 125,000,000 | | U.S. Treasury Bills, 5/13/04 | | 124,524,340 |
| 100,000,000 | | U.S. Treasury Bills, 6/3/04 | | 99,610,722 |
| 200,000,000 | | U.S. Treasury Bills, 6/24/04 | | 199,046,667 |
| 100,000,000 | | U.S. Treasury Bills, 10/3/04 | | 99,555,231 |
| | | | |
|
| Total Short-Term Investments (cost $1,797,002,198) | | 1,797,002,198 |
| | | | |
|
| | | | | | | | |
TOTAL INVESTMENTS (cost $11,005,035,628) | | 99.4 | % | | | 13,120,175,382 |
| OTHER ASSETS LESS LIABILITIES | | 0.6 | | | | 75,453,000 |
| | | | |
|
| |
|
|
| TOTAL NET ASSETS | | | | 100.0 | % | | $ | 13,195,628,382 |
| | | | |
|
| |
|
|
| (b) | Foreign securities denominated in U.S. dollars |
| (c) | CMO: Collateralized Mortgage Obligation |
| | REMIC: Real Estate Mortgage Investment Conduit |
| (d) | Cumulative Preferred Securities |
| (e) | EOP Operating LP is the operating partnership of Equity Office Properties Trust. |
| (f) | Non-income producing—security in default. Company has filed for bankruptcy protection. |
See accompanying Notes to Financial Statements
Dodge & Cox Balanced Fund / 8
Statement of Assets and Liabilities
| | | |
|
| December 31, 2003 |
| Assets: |
Investments, at market value
(identified cost $11,005,035,628) | | $ | 13,120,175,382 |
Receivable for investments sold | | | 19,161,151 |
Receivable for paydowns on mortgage-backed securities | | | 64,369 |
Receivable for Fund shares sold | | | 53,338,822 |
Dividends and interest receivable | | | 47,407,768 |
Prepaid expenses and other assets | | | 93,735 |
| | |
|
|
| | | | 13,240,241,227 |
| | |
|
|
| Liabilities: |
Payable for investments purchased | | | 20,260,514 |
Payable for Fund shares redeemed | | | 18,014,476 |
Management fees payable | | | 5,434,536 |
Accounts payable | | | 903,319 |
| | |
|
|
| | | | 44,612,845 |
| | |
|
|
| Net Assets | | $ | 13,195,628,382 |
| | |
|
|
| Net Assets Consist of: |
Paid in capital | | $ | 11,039,720,280 |
Accumulated undistributed
net investment income | | | 1,393,086 |
Accumulated undistributed net
realized gain on investments | | | 39,375,262 |
Net unrealized appreciation on investments | | | 2,115,139,754 |
| | |
|
|
| | | $ | 13,195,628,382 |
| | |
|
|
Beneficial shares outstanding (par value $0.01 each, unlimited shares authorized) | | | 180,671,701 |
Net asset value per share | | $ | 73.04 |
Statement of Operations
|
|
| Year Ended December 31, 2003 |
| Investment Income: |
Dividends (net of foreign taxes of $2,161,358) | | $ | 148,005,783 |
Interest | | | 157,156,396 |
| | |
|
|
| | | | 305,162,179 |
| | |
|
|
| Expenses: |
Management fees (Note 2) | | | 49,065,640 |
Custodian and fund accounting fees | | | 247,500 |
Transfer agent fees | | | 2,514,865 |
Professional fees | | | 70,476 |
Shareholder reports | | | 472,390 |
Registration fees | | | 544,961 |
Trustees’ fees (Note 2) | | | 28,500 |
Miscellaneous | | | 113,170 |
| | |
|
|
| | | | 53,057,502 |
| | |
|
|
| Net Investment Income | | | 252,104,677 |
| | |
|
|
| Realized and Unrealized Gain on Investments: |
Net realized gain on investments | | | 158,794,795 |
Net unrealized appreciation on investments | | | 1,867,447,020 |
| | |
|
|
Net realized and unrealized
gain on investments | | | 2,026,241,815 |
| | |
|
|
| Net Increase in Net Assets from Operations | | $ | 2,278,346,492 |
| | |
|
|
Statement of Changes in Net Assets
| | | | | | | | | | |
| | | |
| | | | | Year Ended
December 31, 2003 | | | Year Ended
December 31, 2002 | |
| Operations: | | | | | | | | |
Net investment income | | | | $ | 252,104,677 | | | $ | 219,335,589 | |
Net realized gain | | | | | 158,794,795 | | | | 98,306,929 | |
Net unrealized appreciation (depreciation) | | | | | 1,867,447,020 | | | | (538,007,515 | ) |
| | |
| |
|
|
| |
|
|
|
Net increase (decrease) in net assets from operations | | | | | 2,278,346,492 | | | | (220,364,997 | ) |
| | |
| |
|
|
| |
|
|
|
| | | | | | | | | | | |
Distributions to
Shareholders from: | | | | | | | | |
Net investment income | | | | | (251,969,056 | ) | | | (218,078,124 | ) |
Net realized gain | | | | | (120,968,603 | ) | | | (108,348,437 | ) |
| | |
| |
|
|
| |
|
|
|
Total distributions | | | | | (372,937,659 | ) | | | (326,426,561 | ) |
| | |
| |
|
|
| |
|
|
|
| | | | | | | | | | | |
| Beneficial Share Transactions: | | | | | | | | |
Amounts received from
sale of shares | | | | | 4,675,775,405 | | | | 3,837,314,449 | |
| | | |
Net asset value of shares issued in reinvestment of distributions | | | | | 358,612,076 | | | | 312,743,386 | |
| | | |
Amounts paid for
shares redeemed | | | | | (1,629,097,670 | ) | | | (1,758,597,569 | ) |
| | |
| |
|
|
| |
|
|
|
Net increase from beneficial
share transactions | | | | | 3,405,289,811 | | | | 2,391,460,266 | |
| | |
| |
|
|
| |
|
|
|
Total increase in net assets | | | | | 5,310,698,644 | | | | 1,844,668,708 | |
| | | | | | | | | | | |
| Net Assets: | | | | | | | | |
Beginning of year | | | | | 7,884,929,738 | | | | 6,040,261,030 | |
| | |
| |
|
|
| |
|
|
|
End of year (including undistributed net investment income of $1,393,086 and $1,257,465, respectively) | | | | $ | 13,195,628,382 | | | $ | 7,884,929,738 | |
| | |
| |
|
|
| |
|
|
|
| | | | | | | | | | | |
Shares sold | | | | | 70,653,951 | | | | 60,354,580 | |
Shares issued in reinvestment of distributions | | | | | 5,274,758 | | | | 5,060,173 | |
Shares redeemed | | | | | (25,059,171 | ) | | | (27,950,121 | ) |
| | |
| |
|
|
| |
|
|
|
Net increase in
shares outstanding | | | | | 50,869,538 | | | | 37,464,632 | |
| | |
| |
|
|
| |
|
|
|
9 / Dodge & Cox Balanced Fund | See accompanying Notes to Financial Statements |
Notes to Financial Statements
Note 1 — Organization and Significant Accounting Policies
Dodge & Cox Balanced Fund (the “Fund”) is a separate series of Dodge & Cox Funds (the “Trust”). The Trust is organized as a Delaware statutory trust and is registered under the Investment Company Act of 1940, as amended, as a diversified, open-end management investment company. The Fund commenced operations on June 26, 1931, and seeks regular income, conservation of principal and an opportunity for long-term growth of principal and income. Risk considerations and investment strategies of the Fund are discussed in the Fund’s Prospectus.
The Fund consistently follows accounting policies which are in conformity with accounting principles generally accepted in the United States of America, which require management to make estimates and assumptions that affect the reported amounts of assets and liabilities at the date of the financial statements and the reported amounts of income and expenses during the reporting period. Actual results could differ from those estimates. Significant accounting policies are as follows:
Security valuation. The Fund’s net assets are valued as of the close of trading on the New York Stock Exchange (the “NYSE”), generally 4:00 p.m. Eastern Time, each day that the NYSE is open for business. Stocks are valued at market, using as a price the official quoted close price or the last sale of the day at the close of the NYSE or, if not available, at the mean between the exchange listed bid and ask prices for the day. A security which is listed or traded on more than one exchange is valued at the quotation on the exchange determined to be the primary market for such security. Fixed-income securities with original maturities of one year or more are priced on the basis of valuations furnished by pricing services which utilize both dealer-supplied valuations and electronic data processing techniques. Valuations of fixed-income securities take into account appropriate factors such as institutional-size trading markets in similar groups of securities, yield, quality, coupon rate, maturity, type of issue, trading characteristics and other market data and do not rely exclusively upon exchange or over-the-counter listed prices. Securities for which market quotations are not readily available are valued at fair value as determined in good faith by or at the direction of the Board of Trustees. Short-term securities are valued at amortized cost which approximates current value. All securities held by the Fund are denominated in U.S. dollars.
Security transactions and related investment income. Security transactions are recorded by the Fund as of the date the trades are executed with brokers. Realized gains and losses on securities sold are determined on the basis of identified cost. Dividend income and corporate action transactions are recorded on the ex-dividend date, except for certain dividends or corporate actions from foreign securities where the ex-dividend date may have passed, which are recorded as soon as the Fund is informed of the ex-dividend date. Withholding taxes on foreign dividends have been provided for in accordance with the Fund’s understanding of the applicable country’s tax rules and rates. Non-cash dividends included in dividend income, if any, are recorded at the fair market value of the securities received. Distributions received in excess of income are recorded as a reduction of cost of investments and/or realized gain. The Fund may estimate the components of distributions received from Real Estate Investment Trusts (“REITs”). Interest income is recorded on the accrual basis. Premiums and discounts on debt securities purchased are amortized and accreted, respectively, to interest income over the lives of the respective securities. The ability of the issuers of the debt securities held by the Fund to meet their obligations may be affected by economic developments in a specific industry, state or region. Debt obligations may be placed on non-accrual status and related interest income may be reduced by ceasing current accruals and writing off interest receivables when the collection of all or a portion of interest has become doubtful based on consistently applied procedures. A debt obligation is removed from non-accrual status when the issuer resumes interest payments or when collectibility of interest is reasonably assured.
Expenses. Expenses are recorded on the accrual basis. Most expenses of the Trust can be directly attributed to a series. Expenses which cannot be directly attributed are apportioned among all of the series in the Trust.
Repurchase agreements. The Fund may enter into repurchase agreements secured by U.S. government securities which involve the purchase of securities from a counterparty with a simultaneous commitment to resell the securities at an agreed-upon date and price. It is the Fund’s policy that its custodian take possession of the
Dodge & Cox Balanced Fund / 10
Notes to Financial Statements (continued)
underlying collateral securities, the fair value of which exceeds the principal amount of the repurchase transaction, including accrued interest, at all times. In the event of default by the counterparty, the Fund has the contractual right to liquidate the securities and to apply the proceeds in satisfaction of the obligation.
Income taxes and distributions to shareholders. No provision for federal income taxes has been included in the accompanying financial statements since the Fund intends to distribute all of its taxable income and continue to comply with requirements for regulated investment companies. Distributions to shareholders of income and capital gains are reflected in the net asset value per share computation on the ex-dividend date. Income and capital gain distributions are determined in accordance with income tax regulations, which may differ from accounting principles generally accepted in the United States of America. Temporary differences between financial statement and tax treatments may occur when certain items of income, expense, gain or loss are recognized in different periods for financial statement and tax purposes. Differences in classification may also result from the treatment of short-term gains as ordinary income for tax purposes. Permanent differences are reclassified among capital accounts in the financial statements to reflect their tax character. These adjustments have no impact on net assets or the results of operations.
Note 2 — Related Party Transactions
Management fees. Under a written agreement, the Fund pays an annual management fee of 0.50% of the Fund’s average daily net asset value to Dodge & Cox, investment manager of the Fund.
Trustees’ fees. All officers and three of the trustees of the Trust are officers and employees of Dodge & Cox. Those trustees who are not affiliated with Dodge & Cox receive from the Trust an annual fee plus an attendance fee for each Board or Committee meeting attended. Payments to trustees are divided equally among each series of the Trust. The Trust does not pay any other remuneration to its officers or trustees.
Indemnifications. Under the Trust’s organizational documents, its officers and trustees are indemnified against certain liabilities arising out of the performance of their duties to the Trust. In addition, in the normal course of business the Trust enters into contracts that provide general indemnifications to other parties. The Trust’s maximum exposure under these arrangements is unknown as this would involve future claims that may be made against the Trust that have not yet occurred.
Note 3 — Distributions Paid, Distributable Earnings and Investment Transactions
Distributions paid during the years ended December 31, 2003 and 2002 were characterized as follows for federal tax purposes:
| | | | |
| | | 2003
| | 2002
|
Ordinary income | | $308,364,981 | | $236,171,773 |
| | | ($1.97 per share) | | ($2.03 per share) |
Long-term capital gain | | $64,572,678 | | $90,254,788 |
| | | ($0.36 per share) | | ($0.73 per share) |
At December 31, 2003, the tax basis components of accumulated undistributed income and net realized gain include $2,689,961 of ordinary income and $39,375,262 of long-term capital gain, which differ in total from amounts reported in the financial statements due to temporary differences between financial statement and tax treatments for defaulted fixed-income securities. At December 31, 2003, the cost of investments for federal income tax purposes was equal to the cost for financial reporting purposes. Net unrealized appreciation aggregated $2,115,139,754, of which $2,280,622,774 represented appreciated securities and $165,483,020 represented depreciated securities.
For the year ended December 31, 2003, purchases and sales of securities, other than short-term securities and U.S. government securities, aggregated $2,371,481,873 and $969,677,864, respectively. For the year ended December 31, 2003, purchases and sales of U.S. government securities aggregated $1,234,524,482 and $668,517,276, respectively.
11 / Dodge & Cox Balanced Fund
Financial Highlights
| | | | | | | | | | | | | | | | | |
| SELECTED DATA AND RATIOS (for a share outstanding throughout each year) | | | Year Ended December 31, | |
|
| | | 2003 | | | 2002 | | | 2001 | | | 2000 | | | 1999 | |
| | | | | | | | | | | | | | | | | | |
Net asset value, beginning of year | | | $60.75 | | | | $65.42 | | | $63.42 | | | $65.71 | | | $65.22 | |
Income from investment operations: | | | | | | | | | | | | | | | | | |
Net investment income | | | 1.66 | | | | 1.89 | | | 2.12 | | | 2.45 | | | 2.24 | |
Net realized and unrealized gain (loss) | | | 12.96 | | | | (3.80 | ) | | 4.07 | | | 6.95 | | | 5.45 | |
| | |
|
|
| |
|
|
| |
|
| |
|
| |
|
|
Total from investment operations | | | 14.62 | | | | (1.91 | ) | | 6.19 | | | 9.40 | | | 7.69 | |
| | |
|
|
| |
|
|
| |
|
| |
|
| |
|
|
Distributions to shareholders from: | | | | | | | | | | | | | | | | | |
Net investment income | | | (1.66 | ) | | | (1.88 | ) | | (2.14 | ) | | (2.47 | ) | | (2.22 | ) |
Net realized gain | | | (0.67 | ) | | | (.88 | ) | | (2.05 | ) | | (9.22 | ) | | (4.98 | ) |
| | |
|
|
| |
|
|
| |
|
| |
|
| |
|
|
Total distributions | | | (2.33 | ) | | | (2.76 | ) | | (4.19 | ) | | (11.69 | ) | | (7.20 | ) |
| | |
|
|
| |
|
|
| |
|
| |
|
| |
|
|
Net asset value, end of year | | $ | 73.04 | | | $ | 60.75 | | | $65.42 | | | $63.42 | | | $65.71 | |
| | |
|
|
| |
|
|
| |
|
| |
|
| |
|
|
| Total return | | | 24.44 | % | | | (2.94 | )% | | 10.06 | % | | 15.13 | % | | 12.06 | % |
| | | | | |
Ratios/supplemental data: | | | | | | | | | | | | | | | | | |
Net assets, end of year (millions) | | | $13,196 | | | | $7,885 | | | $6,040 | | | $4,909 | | | $5,138 | |
Ratio of expenses to average net assets | | | .54 | % | | | .53 | % | | .53 | % | | .53 | % | | .53 | % |
Ratio of net investment income to average net assets | | | 2.57 | % | | | 3.12 | % | | 3.28 | % | | 3.70 | % | | 3.18 | % |
Portfolio turnover rate | | | 19 | % | | | 25 | % | | 21 | % | | 23 | % | | 17 | % |
Dodge & Cox Balanced Fund / 12
Report of Independent Auditors
To the Trustees of Dodge & Cox Funds and Shareholders of Dodge & Cox Balanced Fund
In our opinion, the accompanying statement of assets and liabilities, including the portfolio of investments, and the related statements of operations and of changes in net assets and the financial highlights present fairly, in all material respects, the financial position of the Dodge & Cox Balanced Fund (the “Fund”, one of the series constituting Dodge & Cox Funds) at December 31, 2003, the results of its operations for the year then ended, the changes in its net assets for each of the two years in the period then ended and the financial highlights for each of the five years in the period then ended, in conformity with accounting principles generally accepted in the United States of America. These financial statements and financial highlights (hereafter referred to as “financial statements”) are the responsibility of the Fund’s management; our responsibility is to express an opinion on these financial statements based on our audits. We conducted our audits of these financial statements in accordance with auditing standards generally accepted in the United States of America, which require that we plan and perform the audits to obtain reasonable assurance about whether the financial statements are free of material misstatement. An audit includes examining, on a test basis, evidence supporting the amounts and disclosures in the financial statements, assessing the accounting principles used and significant estimates made by management, and evaluating the overall financial statement presentation. We believe that our audits, which included confirmation of securities at December 31, 2003 by correspondence with the custodian and brokers, provide a reasonable basis for our opinion.
PricewaterhouseCoopers LLP
San Francisco, California
February 4, 2004
Special Tax Information (unaudited)
The following information is provided pursuant to provisions of the Internal Revenue Code:
The Fund designates $64,572,678 of its distributions paid to shareholders in 2003 as capital gain dividends (treated for federal income tax purposes in the hands of shareholders as long-term capital gain taxable at a maximum rate of 15%).
The Fund designates $129,248,638 of its distributions paid to shareholders in 2003 as qualified dividends (treated for federal income tax purposes in the hands of shareholders as taxable at a maximum rate of 15%).
For shareholders that are corporations, the Fund designates 36% of its ordinary dividends (including short-term gains) paid to shareholders in 2003 as dividends from domestic corporations eligible for the corporate dividends received deduction, provided that the shareholder otherwise satisfies applicable requirements to claim that deduction.
13 / Dodge & Cox Balanced Fund
THIS PAGE INTENTIONALLY LEFT BLANK
Dodge & Cox Balanced Fund / 14
Dodge & Cox Funds—Officer & Trustee Information (unaudited)
| | | | | | |
| | | |
Name (Age) and
Address* | | Position with Trust
(Time Served) | | Principal Occupation During Past 5 Years | | Other Directorships Held by Trustees |
|
Interested Trustees & Officers
|
| | | |
Harry R. Hagey (62) | | Chairman and Trustee (Trustee since 1975) | | Chairman, Chief Executive Officer and Director of Dodge & Cox, Portfolio Manager, and member of Investment Policy Committee | | — |
|
| | | |
John A. Gunn (60) | | President and Trustee
(Trustee since 1985) | | President, Chief Investment Officer and Director of Dodge & Cox, Portfolio Manager, and member of Investment Policy Committee, Fixed Income Strategy Committee, and International Investment Policy Committee | | — |
|
| | | |
Dana M. Emery (42) | | Vice President and Trustee (Trustee since 1993) | | Senior Vice President and Director of Dodge & Cox, Manager—Fixed Income, and member of Investment Policy Committee and Fixed Income Strategy Committee | | — |
|
| | | |
A. Horton Shapiro (64) | | Executive Vice President (Officer since 1985) | | Senior Vice President and Director of Dodge & Cox, Portfolio Manager, and member of Investment Policy Committee and Fixed Income Strategy Committee | | — |
|
| | | |
| Katherine Herrick Drake (49) | | Vice President (Officer since 1993) | | Vice President of Dodge & Cox, Portfolio Manager, and member of Investment Policy Committee | | — |
|
| | | |
Kenneth E. Olivier (51) | | Vice President
(Officer since 1992) | | Executive Vice President (since 2002) and Director of Dodge & Cox, Portfolio Manager, and member of Investment Policy Committee | | — |
|
| | | |
John M. Loll (37) | | Treasurer and Assistant Secretary (Officer since 2000) | | Vice President and Treasurer (since 2000) of Dodge & Cox; prior to 2000, Fund Administration and Accounting Manager, Dodge & Cox | | — |
|
| | | |
| Thomas M. Mistele (50) | | Secretary and Assistant Treasurer (Officer since 2000) | | Vice President, Secretary and General Counsel of Dodge & Cox | | — |
|
|
Independent Trustees
|
| | | |
William F. Ausfahl (63) | | Trustee (Since: 2002) | | CFO, The Clorox Co. (1982-1997); Director, The Clorox Co. (1984-1997) | | — |
|
| | | |
L. Dale Crandall (62) | | Trustee (Since: 1999) | | President, Kaiser Foundation Health Plan, Inc. and Kaiser Foundation Hospitals (2000-2002); Executive Vice President—Finance and Administration & CFO, Kaiser Foundation Health Plan, Inc. and Kaiser Foundation Hospitals (1998-2000) | | Director, Union BanCal Corporation (bank holding company) and Union Bank of California (commercial bank) (2001-Present); Director, Covad Communications Group (broadband communications services) (2002-Present); Director, Ansell Limited (medical equipment and supplies) (2002-Present); Director, BEA Systems, Inc. (software and programming) (2003-Present); Director, Coventry Health Care Inc. (managed healthcare) (2004-Present) |
|
| | | |
Thomas A. Larsen (54) | | Trustee (Since: 2002) | | Director in Howard, Rice, Nemerovski, Canady, Falk & Rabkin (law firm) | | — |
|
| | | |
Will C. Wood (64) | | Trustee (Since: 1992) | | Principal, Kentwood Associates, Financial Advisers | | Director, Banco Latinoamericano de Exportaciones S.A. (Latin American Foreign Trade Bank) (1999-Present); Director, Dover Investment Corp. (real estate development) (1992-Present) |
|
| * | | The address for each Officer and Trustee is One Sansome Street, 35th Floor, San Francisco, California 94104. Each Officer and Trustee oversees all four portfolios in the Dodge & Cox Funds complex and serves for an indefinite term. |
Additional information about the Trust’s Trustees is available in the Trust’s Statement of Additional Information (SAI). You can get a free copy of the SAI by contacting Dodge & Cox Funds at 1-800-621-3979.

Income Fund
Established 1989

15th Annual Report
December 31, 2003
2003
Income Fund
www.dodgeandcox.com
For Fund literature, transactions and account
information, please visit the
Funds’ web site.
or write or call:
Dodge & Cox Funds
c/o Boston Financial Data Services
P.O. Box 8422
Boston, Massachusetts
02266-8422
(800) 621-3979
Investment Manager
Dodge & Cox
One Sansome Street
35th Floor
San Francisco, California
94104-4443
(415) 981-1710
This report is submitted for the general information of the shareholders of the Fund. The report is not authorized for distribution to prospective investors in the Fund unless it is accompanied by a current prospectus.
This report reflects our views,
opinions and portfolio holdings
as of December 31, 2003, the end of
the reporting period. The information
provided is not a complete analysis of every
aspect of any industry, security or the Fund.
The Fund’s portfolio composition may change
depending on market and economic conditions.
Although historical performance is
no guarantee of future results, these
insights may help you understand
our investment management
philosophy.

12/03 IF AR  Printed on recycled paper
To Our Shareholders
The Dodge and Cox Income Fund posted a total return of 6.0% in 2003, outpacing the 4.1% return of the Lehman Aggregate Bond Index (LBAG). Total returns for longer periods are listed on the following page.
At year-end the Fund had total assets of $5.7 billion and a cash position of 6%. The Fund’s share price rose from $12.77 at the end of 2002 to $12.92 on December 31, 2003. During the year, the Fund distributed income dividends of $0.60 per share.
At this time last year we urged investors to temper their near-term return expectations for the Income Fund as the Fund was unlikely to match the double-digit annual returns of the 2000 to 2002 period. We would echo that same sentiment today. While interest rates are somewhat higher than a year ago, they remain quite low on an historical basis. Importantly, much of the uncertainty that clouded the economic outlook early last year—and drove bond prices higher—has cleared as economic growth has picked up amid contributions from both the consumer and business sectors.
2003 Recap—Strong Corporate Bond
Performance amid a Whipsaw in Interest Rates
Two broad themes dominated fixed-income markets in 2003. The first was a whipsaw in interest rates. Over the first half of the year rates dropped to generational lows (10-year Treasuries at a 3.11% yield) as geopolitical events, unimpressive economic growth and the potential for a destabilizing bout of deflation consumed the bond market. Sparked by a Federal Reserve Board statement discounting the risk of deflation, market direction changed abruptly in mid-June. Rates rose sharply (10-year Treasuries to a 4.57% yield) and bond prices fell through the rest of the summer as data signaling renewed economic vigor, both here and abroad, spurred a reassessment of economic prospects, future inflation, and the appropriate level for interest rates. Year-over-year, interest rates were higher by 25 to 50 basis points (one basis point equals 1/100 of 1%) across the U.S. Treasury maturity spectrum, save the absolute shortest (one-year and under) maturities.
The about-face in the level of interest rates—both its magnitude and pace—was particularly challenging for mortgage-backed security (MBS) investors. The extraordinarily low interest rates of the spring and early summer led to a cascade of prepayments on existing MBS, even those with historically low (6% and below) mortgage rates. Assumptions about the future rate of prepayments were commensurately high as well, and investors expected them to be short-maturity investments. Reflecting this, the duration1 of the mortgage-backed securities in the LBAG in May was calculated to be 0.6 years, an all-time low for the mortgage sector. When interest rates increased, expectations for future mortgage prepayments had to be quickly ratcheted back. This made the expected time to return of principal on many MBS significantly longer, leading to greater- than-anticipated price declines. By summer’s end the duration of the LBAG’s MBS had lengthened to over three years. This phenomenon is known as “extension risk.”
The second major theme of 2003 was the corporate bond sector, which delivered one of its best years of relative performance ever. The corporate sector of the LBAG returned 8.2% in 2003, far surpassing the 2.2% return of the LBAG’s Treasury sector. Lower-rated issuers led corporate securities higher: BBB-rated corporate issuers from the Index returned 11.8% while AAA-rated issuers returned only 3.6%. The strong performance of the sector could be attributed to historically attractive valuations at the start of the year, rising earnings, balance sheet de-leveraging and/or liquidity profile improvement, and growing investor confidence in the economic recovery.
Performance Commentary and Strategy
Our investment philosophy—focusing on identifying undervalued securities through in-depth, fundamental research and building a diversified portfolio with an eye to longer-term (three-to-five years) return potential—guides us year-in and year-out. The Fund’s favorable relative performance this year came from a variety of sources. An overweight position (37% at the beginning of the year vs. 26% for the LBAG) in corporate securities made a significant contribution. Mirroring the corporate sector of the LBAG, the Fund’s best performers were from lower-rated issuers; for example, the bonds of Xerox, UnumProvident, and Dillard’s, Inc. each produced a total return of over 20%. National Energy & Gas Transmission, Inc. (formerly PG&E-National Energy Group), a Fund holding, filed for Chapter 11 bankruptcy protection in July. While the market price of this holding is still significantly below its cost, the security contributed positively to the Fund’s performance in 2003 as its market value recovered from distressed levels following the company’s interest payment default in November 2002.
The favorable relative performance—and resultant higher valuations—of many of the Fund’s corporate holdings led us to selectively trim corporate exposure over the course of the year. Outright sales included the Fund’s holdings of Eastman Chemical, Dana Corp. and Disney. We also trimmed positions in CIT Group and Xerox, while adding new positions in the debt of Schering-Plough, Boston Properties, Comcast and Amerada Hess. The net effect of the transaction activity reduced the Fund’s weighting in corporate bonds by 5.3% over the year. Importantly, we do not make these decisions on an aggregate, sector-wide basis. Rather, they are made on an individual, issuer-by-issuer basis, and trims or outright sales of specific corporate securities are made when the risk of owning the security, given our research-intensive view of the company’s credit outlook, is no longer reflected in its price.
Our selection of specific mortgage securities was a boost to relative performance as well, particularly in the volatile market environment
1 / Dodge & Cox Income Fund
of last summer. Many of these U.S. Government or Government Agency-guaranteed holdings are backed by seasoned, higher coupon 15-year loans, previously delinquent mortgage loans, or call-protected multi-family housing loans. In this challenging environment, our long-held strategy of emphasizing these relatively stable mortgage cash flows, coupled with a focus on specific mortgage securities that would perform relatively well in a bond market sell-off, served the Fund well.
The Fund’s duration position positively impacted relative performance as well. We had been targeting a below-benchmark duration position for some time and, as rates fell to multi-decade lows in the spring and early summer, we reduced further the Fund’s duration. The lower portfolio duration and emphasis on mortgage securities with less extension risk combined to cushion the Fund from some of the negative effect of the subsequent rise in interest rates. In July alone, despite falling 2.3%, the Fund outperformed the LBAG, which lost 3.4%, by 1.1%.
Looking Forward
Given the Fund’s low starting yield, and the limited likelihood of substantial price gains to supplement earned income, our expectations for the Fund’s returns over the next two-to-three years are substantially lower than recent years’ performance. Further, the strong absolute and relative price appreciation from the corporate sector—which added substantially to fixed-income returns this year—is unlikely to continue at the same pace in 2004, given the higher valuations currently accorded corporate bonds. Given this outlook, we have positioned the Fund defensively and remain vigilant in seeking ways to add incremental return to Fund shareholders consistent with our investment philosophy and risk tolerance.
Thank you for the continued confidence you have placed in our firm as a shareholder of the Income Fund. As always, we welcome your comments and questions.
For the Board of Trustees,
|

|
Harry R. Hagey, Chairman |

|
A. Horton Shapiro, Executive Vice President |
February 4, 2004
Ten Years of Investment Performance
through December 31, 2003 (in thousands)
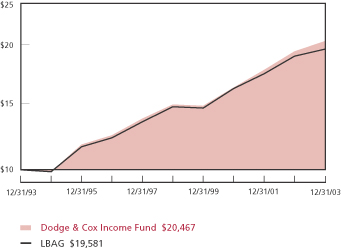
Average annual total return for periods ended December 31, 2003
| | | | | | | | | |
| | | 1 Year | | | 5 Years | | | 10 Years | |
|
| Dodge & Cox Income Fund | | 5.97 | % | | 7.29 | % | | 7.41 | % |
Lehman Brothers Aggregate Bond Index (LBAG) | | 4.11 | | | 6.62 | | | 6.95 | |
| | | | | | | | | |
Past performance does not guarantee future results. Investment return and share price will fluctuate with market conditions, and investors may have a gain or loss when shares are sold. Mutual fund performance changes over time and currently may be significantly lower than stated above. Performance is updated and published monthly. Visit the Fund’s web site at www.dodgeandcox.com or call 800-621-3979 for current performance figures.
The Fund’s total returns include the reinvestment of dividend and capital gain distributions, but have not been adjusted for any income taxes payable by shareholders on these distributions. The Lehman Brothers Aggregate Bond Index is an unmanaged index of investment-grade fixed-income securities. Index returns include dividends and/or interest income and, unlike Fund returns, do not reflect fees or expenses.
Lehman Brothers® is a trademark of Lehman Brothers, Inc.
| | 1 | | Duration is a measure of price sensitivity to changes in interest rates. |
Dodge & Cox Income Fund / 2
Fund Information | December 31, 2003 |
General Information
| | |
Net Asset Value Per Share | | $12.92 |
Total Net Assets (millions) | | $5,697 |
30-Day SEC Yield1 | | 3.53% |
2003 Expense Ratio | | 0.45% |
2003 Portfolio Turnover | | 41% |
Fund Inception Date | | 1989 |
Investment Manager: Dodge & Cox, San Francisco. Managed by the Fixed-Income Strategy Committee, whose eleven members’ average tenure is 15 years, and by the Investment Policy Committee, whose ten members’ average tenure at Dodge & Cox is 23 years.
Asset Allocation
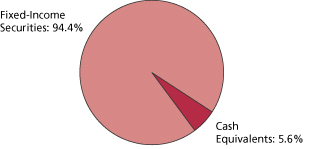
| | | | |
| Portfolio Characteristics | | Fund | | LBAG |
|
| | |
Number of Fixed-Income Securities | | 246 | | 6,766 |
| | |
Average Quality2 | | AA | | AA+ |
| | |
Average Maturity (years) | | 5.7 | | 7.6 |
| | |
Effective Duration (years) | | 3.5 | | 4.5 |
| | | | | | |
| Credit Quality Ratings2 | | Fund | | | LBAG | |
| |
| | |
U.S. Government & Government Agencies | | 62.5 | % | | 69.4 | % |
| | |
Aaa/AAA | | 0.6 | | | 7.1 | |
| | |
Aa/AA | | 0.1 | | | 2.3 | |
| | |
A/A | | 3.1 | | | 9.9 | |
| | |
Baa/BBB | | 22.3 | | | 11.3 | |
| | |
Ba/BB | | 2.5 | | | 0.0 | |
| | |
B/B and below | | 3.3 | | | 0.0 | |
| | |
Cash Equivalents | | 5.6 | | | 0.0 | |
| | | | | | |
| Sector Breakdown | | Fund | | | LBAG | |
| |
| | |
U.S. Treasury and Government Agency | | 23.8 | % | | 33.8 | % |
| | |
Mortgage Backed Securities | | 38.7 | | | 35.6 | |
| | |
Asset-Backed | | 0.5 | | | 4.3 | |
| | |
Corporate | | 31.4 | | | 22.1 | |
| | |
Non-Corporate Yankee | | 0.0 | | | 4.2 | |
| | |
Cash Equivalents | | 5.6 | | | 0.0 | |
| | | | | | |
| Maturity Breakdown | | Fund | | | LBAG | |
| |
| | |
0-1 Years to Maturity | | 14.7 | % | | 0.0 | % |
| | |
1-5 | | 50.8 | | | 40.7 | |
| | |
5-10 | | 22.2 | | | 40.1 | |
| | |
10-15 | | 3.0 | | | 8.3 | |
| | |
15-20 | | 0.9 | | | 3.8 | |
| | |
20-25 | | 2.1 | | | 3.0 | |
| | |
25 and Over | | 6.3 | | | 4.1 | |
| 1 | | SEC Yield is an annualization of the Fund’s total net investment income per share for the 30-day period ended on the last day of the month. |
| 2 | | For presentation purposes only: when a security is split-rated, the lower of either the Moody’s or Standard & Poor’s rating is reported. |
3 / Dodge & Cox Income Fund
Portfolio of Investments
December 31, 2003
FIXED-INCOME SECURITIES: 94.4%
| | | | | | |
| PAR VALUE | | MARKET VALUE |
| | |
| | U.S. TREASURY AND GOVERNMENT AGENCY: 23.8% | | | |
| | U.S. TREASURY: 20.8% | | | |
| $ | 43,619,562 | | U.S. Treasury Inflation-Indexed Note, 3.375%, 1/15/12 | | $ | 48,809,592 |
| | 100,000,000 | | U.S. Treasury Notes, 3.375%, 4/30/04 | | | 100,789,100 |
| | 250,000,000 | | U.S. Treasury Notes, 2.25%, 7/31/04 | | | 251,728,500 |
| | 125,000,000 | | U.S. Treasury Notes, 6.75%, 5/15/05 | | | 134,003,875 |
| | 350,000,000 | | U.S. Treasury Notes, 4.625%, 5/15/06 | | | 370,945,400 |
| | 200,000,000 | | U.S. Treasury Notes, 6.625%, 5/15/07 | | | 226,351,600 |
| | 50,000,000 | | U.S. Treasury Notes, 5.00%, 8/15/11 | | | 53,507,800 |
| | | | | |
|
|
| | | | | | | 1,186,135,867 |
| | GOVERNMENT AGENCY: 3.0% |
| | 1,410,693 | | Govt. Small Business Admin. 504
Series 91-20K, 8.25%, 11/1/11 | | | 1,520,158 |
| | 2,124,931 | | Govt. Small Business Admin. 504
Series 92-20B, 8.10%, 2/1/12 | | | 2,285,415 |
| | 1,979,047 | | Govt. Small Business Admin. 504
Series 92-20C, 8.20%, 3/1/12 | | | 2,134,492 |
| | 1,646,102 | | Govt. Small Business Admin. 504
Series 92-20D, 8.20%, 4/1/12 | | | 1,778,485 |
| | 4,131,206 | | Govt. Small Business Admin. 504
Series 92-20G, 7.60%, 7/1/12 | | | 4,431,666 |
| | 1,956,151 | | Govt. Small Business Admin. 504
Series 92-20H, 7.40%, 8/1/12 | | | 2,096,490 |
| | 2,792,729 | | Govt. Small Business Admin. 504
Series 92-20I, 7.05%, 9/1/12 | | | 2,983,250 |
| | 3,483,308 | | Govt. Small Business Admin. 504
Series 92-20J, 7.00%, 10/1/12 | | | 3,723,070 |
| | 4,185,651 | | Govt. Small Business Admin. 504
Series 92-20K, 7.55%, 11/1/12 | | | 4,515,886 |
| | 1,746,823 | | Govt. Small Business Admin. 504
Series 92-20L, 7.45%, 12/1/12 | | | 1,884,906 |
| | 2,798,957 | | Govt. Small Business Admin. 504
Series 93-20B, 7.00%, 2/1/13 | | | 2,998,060 |
| | 3,227,957 | | Govt. Small Business Admin. 504
Series 93-20D, 6.75%, 4/1/13 | | | 3,453,690 |
| | 3,795,391 | | Govt. Small Business Admin. 504
Series 93-20E, 6.55%, 5/1/13 | | | 4,052,096 |
| | 3,418,176 | | Govt. Small Business Admin. 504
Series 93-20F, 6.65%, 6/1/13 | | | 3,660,519 |
| | 5,309,111 | | Govt. Small Business Admin. 504
Series 93-20L, 6.30%, 12/1/13 | | | 5,679,290 |
| | 2,707,181 | | Govt. Small Business Admin. 504
Series 94-20D, 7.70%, 4/1/14 | | | 2,975,308 |
| | 6,552,517 | | Govt. Small Business Admin. 504
Series 94-20E, 7.75%, 5/1/14 | | | 7,217,142 |
| | 4,070,160 | | Govt. Small Business Admin. 504
Series 94-20F, 7.60%, 6/1/14 | | | 4,477,114 |
| | 3,041,755 | | Govt. Small Business Admin. 504
Series 94-20G, 8.00%, 7/1/14 | | | 3,352,975 |
| | 2,968,340 | | Govt. Small Business Admin. 504
Series 94-20H, 7.95%, 8/1/14 | | | 3,274,801 |
| | 5,317,791 | | Govt. Small Business Admin. 504
Series 94-20I, 7.85%, 9/1/14 | | | 5,866,355 |
| | | | | | |
| PAR VALUE | | MARKET VALUE |
| | |
| $ | 2,946,988 | | Govt. Small Business Admin. 504
Series 94-20K, 8.65%, 11/1/14 | | $ | 3,302,754 |
| | 2,751,334 | | Govt. Small Business Admin. 504
Series 94-20L, 8.40%, 12/1/14 | | | 3,076,684 |
| | 1,420,519 | | Govt. Small Business Admin. 504
Series 95-20A, 8.50%, 1/1/15 | | | 1,583,128 |
| | 2,640,680 | | Govt. Small Business Admin. 504
Series 95-20C, 8.10%, 3/1/15 | | | 2,934,973 |
| | 3,460,862 | | Govt. Small Business Admin. 504
Series 97-20E, 7.30%, 5/1/17 | | | 3,847,307 |
| | 3,946,069 | | Govt. Small Business Admin. 504
Series 97-20J, 6.55%, 10/1/17 | | | 4,299,430 |
| | 15,469,684 | | Govt. Small Business Admin. 504
Series 98-20C, 6.35%, 3/1/18 | | | 16,767,461 |
| | 5,912,209 | | Govt. Small Business Admin. 504
Series 98-20H, 6.15%, 8/1/18 | | | 6,370,452 |
| | 3,164,482 | | Govt. Small Business Admin. 504
Series 98-20L, 5.80%, 12/1/18 | | | 3,365,315 |
| | 3,847,087 | | Govt. Small Business Admin. 504
Series 99-20C, 6.30%, 3/1/19 | | | 4,173,886 |
| | 10,216,171 | | Govt. Small Business Admin. 504
Series 99-20G, 7.00%, 7/1/19 | | | 11,370,990 |
| | 3,598,401 | | Govt. Small Business Admin. 504
Series 99-20I, 7.30%, 9/1/19 | | | 4,049,179 |
| | 18,028,833 | | Govt. Small Business Admin. 504
Series 01-20G, 6.625%, 7/1/21 | | | 19,799,838 |
| | 9,589,688 | | Govt. Small Business Admin. 504
Series 02-20 L, 5.10%, 12/1/22 | | | 9,729,926 |
| | | | | |
|
|
| | | | | | | 169,032,491 |
| | | | | |
|
|
| | | | | | | 1,355,168,358 |
| | MORTGAGE BACKED SECURITIES: 38.7% |
| | FEDERAL AGENCY CMO AND REMIC(a): 12.2% |
| | 504,041 | | Federal Home Loan Mtge. Corp.,
8.00%, 4/15/07 | | | 512,395 |
| | 8,483,126 | | Federal Home Loan Mtge. Corp.,
6.00%, 8/15/08 | | | 8,903,808 |
| | 20,100,000 | | Federal Home Loan Mtge. Corp.,
6.00%, 10/15/08 | | | 21,155,304 |
| | 8,901,240 | | Federal Home Loan Mtge. Corp.,
6.00%, 12/15/14 | | | 9,024,199 |
| | 36,129,674 | | Federal Home Loan Mtge. Corp.,
6.00%, 1/15/15 | | | 36,621,298 |
| | 4,635,102 | | Federal Home Loan Mtge. Corp.,
6.50%, 4/15/22 | | | 4,666,725 |
| | 10,000,000 | | Federal Home Loan Mtge. Corp.,
6.00%, 6/17/22 | | | 10,542,624 |
| | 9,166,860 | | Federal Home Loan Mtge. Corp.,
6.00%, 4/15/27 | | | 9,227,463 |
| | 6,620,587 | | Federal Home Loan Mtge. Corp.,
6.00%, 6/15/27 | | | 6,702,359 |
| | 32,769,000 | | Federal Home Loan Mtge. Corp.,
6.00%, 2/15/30 | | | 33,879,495 |
See accompanying Notes to Financial Statements | Dodge & Cox Income Fund / 4 |
Portfolio of Investments
December 31, 2003
FIXED-INCOME SECURITIES (continued)
| | | | | | |
| PAR VALUE | | MARKET VALUE |
| | |
| | MORTGAGE BACKED SECURITIES (continued) |
| $ | 27,280,411 | | Federal Home Loan Mtge. Corp.,
7.16%, 7/25/33 | | $ | 29,577,608 |
| | 4,606,889 | | Federal Natl. Mtge. Assn., 6.00%, 1/25/14 | | | 4,635,145 |
| | 14,150,776 | | Federal Natl. Mtge. Assn., 6.00%, 7/25/14 | | | 14,320,036 |
| | 22,853,442 | | Federal Natl. Mtge. Assn., 5.50%, 8/25/14 | | | 23,165,913 |
| | 15,499,821 | | Federal Natl. Mtge. Assn., 6.00%, 9/25/14 | | | 15,710,950 |
| | 7,062,924 | | Federal Natl. Mtge. Assn., 6.00%, 10/25/14 | | | 7,094,579 |
| | 36,824,250 | | Federal Natl. Mtge. Assn., 5.50%, 11/25/14 | | | 37,777,718 |
| | 8,680,636 | | Federal Natl. Mtge. Assn., 6.25%, 3/25/23 | | | 8,843,151 |
| | 9,000,000 | | Federal Natl. Mtge. Assn., 6.00%, 6/25/23 | | | 9,514,364 |
| | 17,562,890 | | Federal Natl. Mtge. Assn., 7.00%, 6/25/32 | | | 18,907,558 |
| | 14,645,938 | | Federal Natl. Mtge. Assn., 7.50%, 7/25/41 | | | 16,050,117 |
| | 25,572,111 | | Federal Natl. Mtge. Assn., 7.00%, 12/25/41 | | | 27,593,918 |
| | 34,418,140 | | Federal Natl. Mtge. Assn., 6.50%, 6/25/42 | | | 36,831,712 |
| | 13,809,296 | | Federal Natl. Mtge. Assn., 7.00%, 6/25/42 | | | 14,901,100 |
| | 29,478,931 | | Federal Natl. Mtge. Assn., 7.00%, 6/25/42 | | | 31,809,624 |
| | 29,472,128 | | Federal Natl. Mtge. Assn., 7.00%, 10/25/42 | | | 31,802,283 |
| | 41,673,815 | | Federal Natl. Mtge. Assn., 6.50%, 12/25/42 | | | 44,262,801 |
| | 61,897,237 | | Federal Natl. Mtge. Assn., 6.50%, 12/25/42 | | | 65,742,603 |
| | 29,560,178 | | Federal Natl. Mtge. Assn., 7.50%, 12/25/42 | | | 32,362,203 |
| | 7,908,629 | | Federal Natl. Mtge. Assn., 7.00%, 3/25/45 | | | 8,533,909 |
| | 19,770,373 | | Govt. Natl. Mtge. Assn., 7.25%, 7/16/28 | | | 20,742,742 |
| | 8,554,571 | | Veterans Affairs Vendee Mtge. Trust,
7.00%, 6/15/10 | | | 8,614,110 |
| | 1,177,708 | | Veterans Affairs Vendee Mtge. Trust,
9.293%, 5/15/25 | | | 1,302,239 |
| | 37,334,903 | | Veterans Affairs Vendee Mtge. Trust,
7.50%, 6/15/27 | | | 41,560,841 |
| | 3,182,176 | | Veterans Affairs Vendee Mtge. Trust,
8.124%, 10/15/27 | | | 3,507,649 |
| | | | | |
|
|
| | | | | | | 696,400,543 |
| | FEDERAL AGENCY MORTGAGE PASS-THROUGH: 26.5% |
| | 6,246 | | Federal Home Loan Mtge. Corp.,
7.00%, 9/1/06 | | | 6,393 |
| | 6,731 | | Federal Home Loan Mtge. Corp.,
7.25%, 1/1/08 | | | 6,901 |
| | 3,605 | | Federal Home Loan Mtge. Corp.,
8.00%, 1/1/08 | | | 3,635 |
| | 60,065 | | Federal Home Loan Mtge. Corp.,
8.00%, 1/1/08 | | | 63,698 |
| | 28,275 | | Federal Home Loan Mtge. Corp.,
7.50%, 10/1/08 | | | 29,749 |
| | 722,630 | | Federal Home Loan Mtge. Corp.,
7.00%, 11/1/08 | | | 763,859 |
| | 70,780 | | Federal Home Loan Mtge. Corp.,
8.00%, 5/1/09 | | | 74,262 |
| | 8,351 | | Federal Home Loan Mtge. Corp.,
8.25%, 5/1/09 | | | 8,800 |
| | 77,366 | | Federal Home Loan Mtge. Corp.,
8.00%, 8/1/09 | | | 80,753 |
| | 2,223,268 | | Federal Home Loan Mtge. Corp.,
6.50%, 2/1/11 | | | 2,358,186 |
| | | | | | |
| PAR VALUE | | MARKET VALUE |
| | |
| $ | 14,588,060 | | Federal Home Loan Mtge. Corp.,
6.00%, 6/1/11 | | $ | 15,327,310 |
| | 3,343,157 | | Federal Home Loan Mtge. Corp.,
6.00%, 7/1/11 | | | 3,512,028 |
| | 3,713,934 | | Federal Home Loan Mtge. Corp.,
7.00%, 12/1/11 | | | 3,961,879 |
| | 1,906,625 | | Federal Home Loan Mtge. Corp.,
7.00%, 3/1/12 | | | 2,033,913 |
| | 4,954,887 | | Federal Home Loan Mtge. Corp.,
6.50%, 4/1/12 | | | 5,255,571 |
| | 4,494,878 | | Federal Home Loan Mtge. Corp.,
6.50%, 6/1/12 | | | 4,762,211 |
| | 3,605,621 | | Federal Home Loan Mtge. Corp.,
6.00%, 4/1/13 | | | 3,786,995 |
| | 2,285,580 | | Federal Home Loan Mtge. Corp.,
6.00%, 5/1/13 | | | 2,400,552 |
| | 47,895,285 | | Federal Home Loan Mtge. Corp.,
5.50%, 11/1/13 | | | 49,851,137 |
| | 4,172,920 | | Federal Home Loan Mtge. Corp.,
6.00%, 12/1/13 | | | 4,383,800 |
| | 21,859,364 | | Federal Home Loan Mtge. Corp.,
6.00%, 12/1/13 | | | 22,958,958 |
| | 12,473,083 | | Federal Home Loan Mtge. Corp.,
6.00%, 4/1/14 | | | 13,100,517 |
| | 30,089,749 | | Federal Home Loan Mtge. Corp.,
5.50%, 7/1/14 | | | 31,318,494 |
| | 19,974,973 | | Federal Home Loan Mtge. Corp.,
6.50%, 7/1/14 | | | 21,163,251 |
| | 2,435,002 | | Federal Home Loan Mtge. Corp.,
6.50%, 11/1/14 | | | 2,579,856 |
| | 9,064,757 | | Federal Home Loan Mtge. Corp.,
6.00%, 2/1/15 | | | 9,520,743 |
| | 40,126,987 | | Federal Home Loan Mtge. Corp.,
6.50%, 5/1/16 | | | 42,502,376 |
| | 17,356,912 | | Federal Home Loan Mtge. Corp.,
5.50%, 10/1/16 | | | 17,997,889 |
| | 68,912,089 | | Federal Home Loan Mtge. Corp.,
6.00%, 5/1/17 | | | 72,307,608 |
| | 27,481,442 | | Federal Home Loan Mtge. Corp.,
6.50%, 5/1/17 | | | 29,111,101 |
| | 38,572,252 | | Federal Home Loan Mtge. Corp.,
6.50%, 6/1/17 | | | 40,859,600 |
| | 68,305,555 | | Federal Home Loan Mtge. Corp.,
6.00%, 8/1/17 | | | 71,677,267 |
| | 16,150,373 | | Federal Home Loan Mtge. Corp.,
6.50%, 8/1/17 | | | 17,108,096 |
| | 10,126,113 | | Federal Home Loan Mtge. Corp.,
6.50%, 12/1/17 | | | 10,726,595 |
| | 57,375,697 | | Federal Home Loan Mtge. Corp.,
6.50%, 12/1/17 | | | 60,778,096 |
| | 38,037,172 | | Federal Home Loan Mtge. Corp.,
6.00%, 1/1/18 | | | 39,914,770 |
| | 6,144,300 | | Federal Home Loan Mtge. Corp.,
7.90%, 2/17/21 | | | 6,660,326 |
5 / Dodge & Cox Income Fund | See accompanying Notes to Financial Statements |
Portfolio of Investments
December 31, 2003
FIXED-INCOME SECURITIES (continued)
| | | | | | |
| PAR VALUE | | MARKET VALUE |
| | |
| | FEDERAL AGENCY MORTGAGE PASS-THROUGH (continued) |
| $ | 81,136,810 | | Federal Home Loan Mtge. Corp.,
7.00%, 4/1/31 | | $ | 86,274,393 |
| | 8,896,541 | | Federal Natl. Mtge. Assn., 6.825%, 5/1/06 | | | 9,533,649 |
| | 983,118 | | Federal Natl. Mtge. Assn., 7.50%, 9/1/07 | | | 1,036,624 |
| | 1,955,873 | | Federal Natl. Mtge. Assn., 7.00%, 7/1/08 | | | 2,064,497 |
| | 7,475,121 | | Federal Natl. Mtge. Assn., 5.90%, 12/1/08 | | | 8,114,910 |
| | 2,491,894 | | Federal Natl. Mtge. Assn., 6.50%, 12/1/08 | | | 2,624,252 |
| | 4,573,003 | | Federal Natl. Mtge. Assn., 5.50%, 6/1/09 | | | 4,761,411 |
| | 1,783,997 | | Federal Natl. Mtge. Assn., 6.50%, 7/1/09 | | | 1,889,930 |
| | 8,553,665 | | Federal Natl. Mtge. Assn., 6.503%, 7/1/09 | | | 9,543,717 |
| | 501,033 | | Federal Natl. Mtge. Assn., 8.00%, 8/1/10 | | | 531,008 |
| | 3,208,001 | | Federal Natl. Mtge. Assn., 7.00%, 12/1/10 | | | 3,430,081 |
| | 44,689,455 | | Federal Natl. Mtge. Assn., 6.228%, 5/1/11 | | | 49,526,409 |
| | 48,342,346 | | Federal Natl. Mtge. Assn., 6.13%, 10/1/11 | | | 53,330,018 |
| | 2,201,019 | | Federal Natl. Mtge. Assn., 7.00%, 12/1/11 | | | 2,321,823 |
| | 435,166 | | Federal Natl. Mtge. Assn., 8.00%, 1/1/12 | | | 470,792 |
| | 29,728,081 | | Federal Natl. Mtge. Assn., 6.017%, 4/1/12 | | | 32,304,590 |
| | 5,775,470 | | Federal Natl. Mtge. Assn., 6.50%, 11/1/12 | | | 6,070,149 |
| | 1,556 | | Federal Natl. Mtge. Assn., 6.50%, 1/1/13 | | | 1,621 |
| | 7,501,603 | | Federal Natl. Mtge. Assn., 6.00%, 4/1/13 | | | 7,886,523 |
| | 9,139,517 | | Federal Natl. Mtge. Assn., 6.00%, 3/1/14 | | | 9,608,482 |
| | 76,480,204 | | Federal Natl. Mtge. Assn., 6.00%, 3/1/14 | | | 80,460,010 |
| | 7,126,565 | | Federal Natl. Mtge. Assn., 6.00%, 6/1/14 | | | 7,489,088 |
| | 30,285,613 | | Federal Natl. Mtge. Assn., 5.50%, 9/1/14 | | | 31,532,241 |
| | 65,329,394 | | Federal Natl. Mtge. Assn., 5.50%, 9/1/14 | | | 68,018,506 |
| | 3,158,394 | | Federal Natl. Mtge. Assn., 7.50%, 11/1/14 | | | 3,381,560 |
| | 11,796,583 | | Federal Natl. Mtge. Assn., 5.50%, 8/1/15 | | | 12,282,159 |
| | 22,253,610 | | Federal Natl. Mtge. Assn., 5.50%, 8/1/15 | | | 23,169,621 |
| | 6,325,913 | | Federal Natl. Mtge. Assn., 7.15%, 10/1/15 | | | 7,235,199 |
| | 15,590,833 | | Federal Natl. Mtge. Assn., 6.00%, 7/1/16 | | | 16,370,765 |
| | 24,482,370 | | Federal Natl. Mtge. Assn., 5.50%, 7/1/17 | | | 25,401,208 |
| | 45,528,587 | | Federal Natl. Mtge. Assn., 6.00%, 11/1/17 | | | 47,806,157 |
| | 13,483,512 | | Federal Natl. Mtge. Assn., 6.00%, 1/1/18 | | | 14,158,026 |
| | 49,922,292 | | Federal Natl. Mtge. Assn., 6.00%, 2/1/18 | | | 52,424,603 |
| | 30,774,830 | | Federal Natl. Mtge. Assn., 6.00%, 3/1/18 | | | 32,317,391 |
| | 44,604,869 | | Federal Natl. Mtge. Assn., 6.00%, 4/1/18 | | | 46,837,189 |
| | 47,388,389 | | Federal Natl. Mtge. Assn., 5.50%, 2/1/18 | | | 49,067,360 |
| | 45,110,000 | | Federal Natl. Mtge. Assn., 6.50%, 11/1/18 | | | 47,849,079 |
| | 341,243 | | Federal Natl. Mtge. Assn., 8.00%, 8/1/22 | | | 364,848 |
| | 366,543 | | Govt. Natl. Mtge. Assn., 7.25%, 2/15/06 | | | 374,473 |
| | 3,180,641 | | Govt. Natl. Mtge. Assn., 7.00%, 4/15/09 | | | 3,414,921 |
| | 3,520,700 | | Govt. Natl. Mtge. Assn., 6.50%, 7/15/09 | | | 3,760,965 |
| | 1,512,799 | | Govt. Natl. Mtge. Assn., 7.50%, 9/15/17 | | | 1,632,327 |
| | 580,459 | | Govt. Natl. Mtge. Assn., 7.80%, 6/15/20 | | | 636,265 |
| | 405,086 | | Govt. Natl. Mtge. Assn., 7.80%, 7/15/20 | | | 444,031 |
| | 440,950 | | Govt. Natl. Mtge. Assn., 7.80%, 7/15/20 | | | 483,343 |
| | 1,134,150 | | Govt. Natl. Mtge. Assn., 7.80%, 8/15/20 | | | 1,243,188 |
| | 572,347 | | Govt. Natl. Mtge. Assn., 7.80%, 9/15/20 | | | 627,373 |
| | 412,401 | | Govt. Natl. Mtge. Assn., 7.80%, 10/15/20 | | | 452,050 |
| | 503,244 | | Govt. Natl. Mtge. Assn., 7.80%, 11/15/20 | | | 551,625 |
| | 602,800 | | Govt. Natl. Mtge. Assn., 7.80%, 1/15/21 | | | 660,250 |
| | 1,313,999 | | Govt. Natl. Mtge. Assn., 7.80%, 1/15/21 | | | 1,439,231 |
| | 12,973,831 | | Govt. Natl. Mtge. Assn., 7.50%, 11/15/24 | | | 14,013,825 |
| | | | | | |
| PAR VALUE | | MARKET VALUE |
| | |
| $ | 8,338,645 | | Govt. Natl. Mtge. Assn., 7.50%, 5/15/25 | | $ | 9,000,981 |
| | 6,637,770 | | Govt. Natl. Mtge. Assn., 7.00%, 5/15/28 | | | 7,120,568 |
| | | | | |
|
|
| | | | | | | 1,512,302,480 |
| | | | | |
|
|
| | | | | | | 2,208,703,023 |
| | ASSET-BACKED SECURITIES: 0.5% |
| | 14,479,210 | | CA Infrastructure and Econ. Dev. Bank Special Purpose Trust PGE-1 Rate Reduction Ctf. 1997-1 A-7, 6.42%, 9/25/08 | | | 15,400,411 |
| | 11,575,681 | | CA Infrastructure and Econ. Dev. Bank Special Purpose Trust SCE-1 Rate Reduction Ctf. 1997-1 A-6, 6.38%, 9/25/08 | | | 12,328,491 |
| | | | | |
|
|
| | | | | | | 27,728,902 |
| | CORPORATE: 31.4% |
| | INDUSTRIAL: 22.2% |
| | 39,275,000 | | AOL Time Warner, Inc., 7.625%, 4/15/31 | | | 45,314,238 |
| | 37,680,000 | | AOL Time Warner, Inc., 7.70%, 5/1/32 | | | 43,976,554 |
| | 53,335,000 | | AT&T Corp., 8.05%, 11/15/11 | | | 61,387,518 |
| | 81,185,000 | | AT&T Corp., 8.75%, 11/15/31 | | | 94,869,787 |
| | 18,470,000 | | Amerada Hess Corp., 6.65%, 8/15/11 | | | 20,016,826 |
| | 10,470,000 | | Amerada Hess Corp., 7.875%, 10/1/29 | | | 11,487,464 |
| | 25,175,000 | | American Home Products Corp.,
6.70%, 3/15/11 | | | 28,431,814 |
| | 55,000,000 | | Comcast Corp., 5.30%, 1/15/14 | | | 54,817,345 |
| | 5,000,000 | | Dillard’s, Inc., 7.375%, 6/1/06 | | | 5,175,000 |
| | 3,300,000 | | Dillard’s, Inc., 6.625%, 11/15/08 | | | 3,366,000 |
| | 20,365,000 | | Dillard’s, Inc., 7.13%, 8/1/18 | | | 20,110,438 |
| | 13,150,000 | | Dillard’s, Inc., 7.75%, 7/15/26 | | | 13,150,000 |
| | 2,075,000 | | Dillard’s, Inc., 7.00%, 12/1/28 | | | 1,909,000 |
| | 30,000,000 | | Ford Motor Credit Co., 5.80%, 1/12/09 | | | 30,895,590 |
| | 10,000,000 | | Ford Motor Credit Co., 7.375%, 10/28/09 | | | 10,981,610 |
| | 74,485,000 | | Ford Motor Credit Co., 7.25%, 10/25/11 | | | 80,783,750 |
| | 5,525,000 | | GMAC, 7.75%, 1/19/10 | | | 6,262,908 |
| | 36,425,000 | | GMAC, 8.875%, 6/1/10, Putable 2005 | | | 42,632,111 |
| | 51,150,000 | | GMAC, 6.875%, 9/15/11 | | | 55,095,046 |
| | 9,000,000 | | General Electric Co., 5.00%, 2/1/13 | | | 9,102,015 |
| | 54,450,000 | | HCA—The Healthcare Company, 8.75%, 9/1/10 | | | 64,835,521 |
| | 21,500,000 | | HCA—The Healthcare Company, 7.875%, 2/1/11 | | | 24,520,986 |
| | 1,750,000 | | HCA—The Healthcare Company, 6.25%, 2/15/13 | | | 1,791,312 |
| | 15,000,000 | | HCA—The Healthcare Company, 6.75%, 7/15/13 | | | 15,907,485 |
| | 35,620,000 | | Hewlett-Packard Co., 5.50%, 7/1/07 | | | 38,498,132 |
| | 15,000,000 | | Lockheed Martin Corp., 7.65%, 5/1/16 | | | 18,223,770 |
| | 10,645,000 | | Lockheed Martin Corp., 7.75%, 5/1/26 | | | 12,789,531 |
| | 5,000,000 | | May Department Stores Co., 8.00%, 7/15/12 | | | 5,937,220 |
| | 7,105,000 | | May Department Stores Co., 7.625%, 8/15/13 | | | 8,257,836 |
See accompanying Notes to Financial Statements | Dodge & Cox Income Fund / 6 |
Portfolio of Investments
December 31, 2003
FIXED-INCOME SECURITIES (continued)
| | | | | | |
| PAR VALUE | | MARKET VALUE |
| | |
| | CORPORATE (continued) |
| $ | 12,500,000 | | May Department Stores Co., 7.60%, 6/1/25 | | $ | 14,339,238 |
| | 16,990,000 | | May Department Stores Co., 8.75%, 5/15/29 | | | 21,953,866 |
| | 26,905,000 | | May Department Stores Co., 7.875%, 3/1/30 | | | 32,174,963 |
| | 7,725,000 | | May Department Stores Co., 7.875%, 8/15/36, Callable 2016 | | | 8,803,642 |
| | 30,276,000 | | Raychem Corp., 8.20%, 10/15/08 | | | 34,211,880 |
| | 11,515,000 | | Raytheon Co., 6.75%, 8/15/07 | | | 12,757,779 |
| | 5,100,000 | | Raytheon Co., 6.15%, 11/1/08 | | | 5,549,519 |
| | 10,050,000 | | Raytheon Co., 6.55%, 3/15/10 | | | 11,086,919 |
| | 15,200,000 | | Raytheon Co., 7.20%, 8/15/27 | | | 16,621,079 |
| | 2,350,000 | | Raytheon Co., 7.00%, 11/1/28 | | | 2,517,764 |
| | 20,000,000 | | Schering-Plough Corp., 5.30%, 12/1/13 | | | 20,348,980 |
| | 14,352,000 | | Time Warner Entertainment, 8.375%, 3/15/23 | | | 17,783,778 |
| | 36,000,000 | | Time Warner Entertainment, 8.375%, 7/15/33 | | | 45,712,512 |
| | 25,000,000 | | Wyeth, 5.50%, 3/15/13 | | | 25,449,025 |
| | 35,000,000 | | Wyeth, 5.50%, 2/1/14 | | | 35,399,525 |
| | 15,000,000 | | Xerox Corp., 7.15%, 8/1/04 | | | 15,337,500 |
| | 41,500,000 | | Xerox Corp., 9.75%, 1/15/09 | | | 48,555,000 |
| | 44,825,000 | | Xerox Corp., 7.125%, 6/15/10 | | | 47,962,750 |
| | 17,346,000 | | Xerox Corp., 7.20%, 4/1/16 | | | 17,736,285 |
| | | | | |
|
|
| | | | | | | 1,264,828,811 |
| | FINANCE: 7.7% |
| | 18,955,000 | | Bank One Capital III(b), 8.75%, 9/1/30 | | | 24,906,510 |
| | 12,775,000 | | Bank One Corp., 7.625%, 8/1/05 | | | 13,904,297 |
| | 7,425,000 | | BankAmerica Capital II(b),
8.00%, 12/15/26, Callable 2006 | | | 8,507,298 |
| | 30,250,000 | | Boston Properties, Inc., 6.25%, 1/15/13 | | | 32,459,551 |
| | 28,020,000 | | Boston Properties, Inc., 5.625%, 4/15/15 | | | 28,001,787 |
| | 12,115,000 | | CIGNA Corp., 7.00%, 1/15/11 | | | 13,548,289 |
| | 10,325,000 | | CIGNA Corp., 6.375%, 10/15/11 | | | 11,171,258 |
| | 1,090,000 | | CIGNA Corp., 7.65%, 3/1/23 | | | 1,195,278 |
| | 25,865,000 | | CIGNA Corp., 7.875%, 5/15/27 | | | 29,887,111 |
| | 17,550,000 | | CIT Group, Inc., 7.375%, 4/2/07 | | | 19,822,549 |
| | 15,360,000 | | CIT Group, Inc., 5.75%, 9/25/07 | | | 16,573,379 |
| | 6,300,000 | | Citicorp Capital Trust I(b),
7.933%, 2/15/27, Callable 2007 | | | 7,261,531 |
| | 10,085,000 | | Citicorp Capital Trust II(b),
8.015%, 2/15/27, Callable 2007 | | | 11,721,281 |
| | 17,240,000 | | EOP Operating Limited Partnership(c),
6.80%, 1/15/09 | | | 19,336,177 |
| | 9,500,000 | | EOP Operating Limited Partnership(c),
7.00%, 7/15/11 | | | 10,719,914 |
| | 35,150,000 | | EOP Operating Limited Partnership(c),
5.875%, 1/15/13 | | | 36,694,807 |
| | 4,015,000 | | First Nationwide Bank,
10.00%, 10/1/06 | | | 4,718,071 |
| | 20,520,000 | | Health Net, Inc., 8.375%, 4/15/11 | | | 24,656,237 |
| | | | | | | |
| | | | | | |
| PAR VALUE | | | | MARKET VALUE |
| | | |
| $ | 15,075,000 | | Safeco Corp., 4.875%, 2/1/10 | | | $ | 15,541,752 |
| | 35,925,000 | | Safeco Corp., 7.25%, 9/1/12 | | | | 41,271,071 |
| | 13,750,000 | | St. Paul Companies, Inc.,
7.875%, 4/15/05 | | | | 14,758,714 |
| | 20,300,000 | | UNUMProvident Corp.,
7.625%, 3/1/11 | | | | 22,363,089 |
| | 27,400,000 | | UNUMProvident Corp.,
7.375%, 6/15/32 | | | | 27,702,304 |
| | | | | | |
|
|
| | | | | | | | 436,722,255 |
| | TRANSPORTATION: 1.3% |
| | 13,529,923 | | Burlington Northern Santa Fe
Railway, 7.57%, 1/2/21 | | | | 15,863,834 |
| | 23,900,000 | | Consolidated Rail Corp.,
9.75%, 6/15/20 | | | | 32,929,803 |
| | 6,578,102 | | Union Pacific Corp., 6.85%, 1/2/19 | | | | 7,318,664 |
| | 15,280,144 | | Union Pacific Corp., 6.70%, 2/23/19 | | | | 17,120,790 |
| | | | | | |
|
|
| | | | | | | | 73,233,091 |
| | UTILITIES: 0.2% |
| | 17,980,000 | | National Energy & Gas Transmission, Inc.(d), 5/16/11 | | | | 12,586,000 |
| | | | | | |
|
|
| | | | | | | | 1,787,370,157 |
| | | | | | |
|
|
| | Total Fixed-Income Securities (cost $5,175,810,239) | | | 5,378,970,440 |
| | | | | | |
|
|
| | SHORT-TERM INVESTMENTS: 4.6% |
|
| | 28,113,402 | | SSgA Prime Money Market Fund | | | | 28,113,402 |
| | 130,808,000 | | State Street Repurchase Agreement,
0.65%, 1/2/04 (collateralized by
U.S. Treasury securities, value $133,430,143) | | | | 130,808,000 |
| | 50,000,000 | | U.S. Treasury Bills, 1/22/04 | | | | 49,972,875 |
| | 50,000,000 | | U.S. Treasury Bills, 4/22/04 | | | | 49,843,666 |
| | | | | | |
|
|
| | Total Short-Term Investments (cost $258,737,943) | | | 258,737,943 |
| | | | | | | | |
| | | | | | | | |
TOTAL INVESTMENTS (cost $5,434,548,182) | | 99.0 | % | | | 5,637,708,383 |
OTHER ASSETS LESS LIABILITIES | | | | 1.0 | | | | 59,662,825 |
| | | | |
|
| |
|
|
| TOTAL NET ASSETS | | | | 100.0 | % | | $ | 5,697,371,208 |
| | | | |
|
| |
|
|
| (a) | | CMO: Collateralized Mortgage Obligation |
| | | REMIC: Real Estate Mortgage Investment Conduit |
| (b) | | Cumulative Preferred Securities |
| (c) | | EOP Operating LP is the operating partnership of Equity Office Properties Trust. |
| (d) | | Non-income producing—security in default. Company has filed for bankruptcy protection. |
7 / Dodge & Cox Income Fund | See accompanying Notes to Financial Statements |
Statement of Assets and Liabilities
| | | | |
|
| December 31, 2003 | |
| Assets: | |
Investments, at market value
(identified cost $5,434,548,182) | | $ | 5,637,708,383 | |
Receivable for paydowns on
mortgage-backed securities | | | 12,553 | |
Receivable for Fund shares sold | | | 61,218,979 | |
Interest receivable | | | 55,798,201 | |
Prepaid expenses and other assets | | | 42,531 | |
| | |
|
|
|
| | | | 5,754,780,647 | |
| | |
|
|
|
| Liabilities: | |
Payable for investments purchased | | | 46,564,731 | |
Payable for Fund shares redeemed | | | 8,331,169 | |
Management fees payable | | | 1,903,988 | |
Accounts payable | | | 609,551 | |
| | |
|
|
|
| | | | 57,409,439 | |
| | |
|
|
|
| Net Assets | | $ | 5,697,371,208 | |
| | |
|
|
|
| Net Assets Consist of: | |
Paid in capital | | $ | 5,513,595,184 | |
Accumulated undistributed
net investment income | | | 1,203,958 | |
Accumulated undistributed net
realized loss on investments | | | (20,588,135 | ) |
Net unrealized appreciation on investments | | | 203,160,201 | |
| | |
|
|
|
| | | $ | 5,697,371,208 | |
| | |
|
|
|
Beneficial shares outstanding (par value $0.01 each, unlimited shares authorized) | | | 440,884,907 | |
Net asset value per share | | $ | 12.92 | |
Statement of Operations
| | | | |
|
| Year Ended December 31, 2003 | |
| Investment Income: | |
Interest | | $ | 244,000,272 | |
| | |
|
|
|
| Expenses: | |
Management fees (Note 2) | | | 18,668,249 | |
Custodian and fund accounting fees | | | 140,309 | |
Transfer agent fees | | | 1,195,226 | |
Professional fees | | | 70,284 | |
Shareholder reports | | | 234,567 | |
Registration fees | | | 338,526 | |
Trustees’ fees (Note 2) | | | 28,500 | |
Miscellaneous | | | 37,892 | |
| | |
|
|
|
| | | | 20,713,553 | |
| | |
|
|
|
| Net Investment Income | | | 223,286,719 | |
| | |
|
|
|
Realized and Unrealized Gain (Loss) on
Investments: | |
Net realized loss on investments | | | (20,588,135 | ) |
Net unrealized appreciation on investments | | | 62,935,604 | |
| | |
|
|
|
Net realized and unrealized
gain on investments | | | 42,347,469 | |
| | |
|
|
|
| Net Increase in Net Assets from Operations | | $ | 265,634,188 | |
| | |
|
|
|
Statement of Changes in Net Assets
| | | | | | | | |
| | |
| | | Year Ended
December 31, 2003 | | | Year Ended
December 31, 2002 | |
| Operations: | | | | | |
Net investment income | | $ | 223,286,719 | | | $ | 132,199,849 | |
Net realized gain (loss) | | | (20,588,135 | ) | | | 14,419,864 | |
Net unrealized appreciation | | | 62,935,604 | | | | 105,419,204 | |
| | |
|
|
| |
|
|
|
Net increase in net assets from operations | | | 265,634,188 | | | | 252,038,917 | |
| | |
|
|
| |
|
|
|
| | | | | | | | | |
Distributions to
Shareholders From: | |
Net investment income | | | (223,648,287 | ) | | | (131,199,485 | ) |
Net realized gain | | | (593,265 | ) | | | (14,116,782 | ) |
| | |
|
|
| |
|
|
|
Total distributions | | | (224,241,552 | ) | | | (145,316,267 | ) |
| | |
|
|
| |
|
|
|
| | | | | | | | | |
| Beneficial Share Transactions: | | | | | |
Amounts received from
sale of shares | | | 3,580,059,774 | | | | 2,446,118,217 | |
Net asset value of shares issued in reinvestment of distributions | | | 194,457,526 | | | | 127,404,686 | |
Amounts paid for
shares redeemed | | | (1,523,141,066 | ) | | | (787,759,403 | ) |
| | |
|
|
| |
|
|
|
Net increase from beneficial
share transactions | | | 2,251,376,234 | | | | 1,785,763,500 | |
| | |
|
|
| |
|
|
|
Total increase in net assets | | | 2,292,768,870 | | | | 1,892,486,150 | |
| | | | | | | | | |
| Net Assets: | |
Beginning of year | | | 3,404,602,338 | | | | 1,512,116,188 | |
| | |
|
|
| |
|
|
|
End of year (including undistributed net investment income of $1,203,958 and $1,565,526, respectively) | | $ | 5,697,371,208 | | | $ | 3,404,602,338 | |
| | |
|
|
| |
|
|
|
| | |
Shares sold | | | 277,328,740 | | | | 195,529,467 | |
Shares issued in reinvestment of distributions | | | 15,095,798 | | | | 10,145,746 | |
Shares redeemed | | | (118,162,594 | ) | | | (62,961,345 | ) |
| | |
|
|
| |
|
|
|
Net increase in
shares outstanding | | | 174,261,944 | | | | 142,713,868 | |
| | |
|
|
| |
|
|
|
See accompanying Notes to Financial Statements | Dodge & Cox Income Fund / 8 |
Notes to Financial Statements
Note 1 — Organization and Significant Accounting Policies
Dodge & Cox Income Fund (the “Fund”) is a separate series of Dodge & Cox Funds (the “Trust”). The Trust is organized as a Delaware statutory trust and is registered under the Investment Company Act of 1940, as amended, as a diversified, open-end management investment company. The Fund commenced operations on January 3, 1989, and seeks high and stable current income consistent with long-term preservation of capital. Risk considerations and investment strategies of the Fund are discussed in the Fund’s Prospectus.
The Fund consistently follows accounting policies which are in conformity with accounting principles generally accepted in the United States of America, which require management to make estimates and assumptions that affect the reported amounts of assets and liabilities at the date of the financial statements and the reported amounts of income and expenses during the reporting period. Actual results could differ from those estimates. Significant accounting policies are as follows:
Security valuation. The Fund’s net assets are valued as of the close of trading on the New York Stock Exchange (the “NYSE”), generally 4:00 p.m. Eastern Time, each day that the NYSE is open for business. Fixed-income securities with original maturities of one year or more are priced on the basis of valuations furnished by pricing services which utilize both dealer-supplied valuations and electronic data processing techniques. Valuations of fixed-income securities take into account appropriate factors such as institutional-size trading markets in similar groups of securities, yield, quality, coupon rate, maturity, type of issue, trading characteristics and other market data and do not rely exclusively upon exchange or over-the-counter listed prices. Securities for which market quotations are not readily available are valued at fair value as determined in good faith by or at the direction of the Board of Trustees. Short-term securities are valued at amortized cost which approximates current value. All securities held by the Fund are denominated in U.S. dollars.
Security transactions and related investment income. Security transactions are recorded by the Fund as of the date the trades are executed with brokers. Realized gains and losses on securities sold are determined on the basis of identified cost. Interest income is recorded on the accrual basis. Premiums and discounts on debt securities purchased are amortized and accreted, respectively, to interest income over the lives of the respective securities. The ability of the issuers of the debt securities held by the Fund to meet their obligations may be affected by economic developments in a specific industry, state or region. Debt obligations may be placed on non-accrual status and related interest income may be reduced by ceasing current accruals and writing off interest receivables when the collection of all or a portion of interest has become doubtful based on consistently applied procedures. A debt obligation is removed from non-accrual status when the issuer resumes interest payments or when collectibility of interest is reasonably assured.
Expenses. Expenses are recorded on the accrual basis. Most expenses of the Trust can be directly attributed to a series. Expenses which cannot be directly attributed are apportioned among all of the series in the Trust.
Repurchase agreements. The Fund may enter into repurchase agreements secured by U.S. government securities which involve the purchase of securities from a counterparty with a simultaneous commitment to resell the securities at an agreed-upon date and price. It is the Fund’s policy that its custodian take possession of the underlying collateral securities, the fair value of which exceeds the principal amount of the repurchase transaction, including accrued interest, at all times. In the event of default by the counterparty, the Fund has the contractual right to liquidate the securities and to apply the proceeds in satisfaction of the obligation.
Income taxes and distributions to shareholders. No provision for federal income taxes has been included in the accompanying financial statements since the Fund intends to distribute all of its taxable income and continue to comply with requirements for regulated investment companies. Distributions to shareholders of income and capital gains are reflected in the net asset value per share computation on the ex-dividend date. Income and capital gain distributions are determined in accordance with income tax regulations, which may differ from accounting principles generally accepted in the United States of America. Temporary differences between financial statement and tax treatments may occur when certain items of income, expense, gain or loss are recognized in different periods for financial statement and tax purposes. Differences in classification may also result from the treatment of short-term gains as ordinary income for tax
9 / Dodge & Cox Income Fund
Notes to Financial Statements (continued)
purposes. Permanent differences are reclassified among capital accounts in the financial statements to reflect their tax character. These adjustments have no impact on net assets or the results of operations.
Note 2 — Related Party Transactions
Management fees. Under a written agreement, the Fund pays an annual management fee of 0.50% of the Fund’s average daily net asset value up to $100 million and 0.40% of the Fund’s average daily net asset value in excess of $100 million to Dodge & Cox, investment manager of the Fund. The agreement further provides that Dodge & Cox shall waive its fee to the extent that such fee plus all other ordinary operating expenses of the Fund exceed 1% of the average daily net asset value for the year.
Trustees’ fees. All officers and three of the trustees of the Trust are officers and employees of Dodge & Cox. Those trustees who are not affiliated with Dodge & Cox receive from the Trust an annual fee plus an attendance fee for each Board or Committee meeting attended. Payments to trustees are divided equally among each series of the Trust. The Trust does not pay any other remuneration to its officers or trustees.
Indemnifications. Under the Trust’s organizational documents, its officers and trustees are indemnified against certain liabilities arising out of the performance of their duties to the Trust. In addition, in the normal course of business the Trust enters into contracts that provide general indemnifications to other parties. The Trust’s maximum exposure under these arrangements is unknown as this would involve future claims that may be made against the Trust that have not yet occurred.
Note 3 — Distributions Paid, Distributable Earnings and Investment Transactions
Distributions paid during the years ended December 31, 2003 and 2002 were characterized as follows for federal tax purposes:
| | | | |
| | | 2003 | | 2002 |
| | |
| |
|
Ordinary income | | $223,648,287 | | $137,069,137 |
| | | ($0.60 per share) | | ($0.68 per share) |
Long-term capital gain | | $593,265 | | $8,247,130 |
| | | ($0.00 per share) | | ($0.03 per share) |
At December 31, 2003, the tax basis components of accumulated undistributed income and net realized gain include $2,136,671 of ordinary income and no long-term capital gain, which differ in total from amounts reported in the financial statements due to temporary differences between financial statement and tax treatments for defaulted fixed-income securities and capital losses. For federal tax purposes, the Fund had a capital loss carryforward of 14,093,589 as of December 31, 2003, which is available for offsetting capital gains realized in future periods, and which will expire in 2011 if not utilized. As permitted by federal tax law, the Fund elected to defer realized net capital losses of $6,494,546 occurring between November 1, 2003 and December 31, 2003, and to treat those losses as arising in the fiscal year ending December 31, 2004. At December 31, 2003, the cost of investments for federal income tax purposes was equal to the cost for financial reporting purposes. Net unrealized appreciation aggregated $203,160,201, of which $214,538,073 represented appreciated securities and $11,377,872 represented depreciated securities.
For the year ended December 31, 2003, purchases and sales of securities, other than short-term securities and U.S. government securities, aggregated $809,503,354 and $385,105,338, respectively. For the year ended December 31, 2003, purchases and sales of U.S. government securities aggregated $3,101,030,292 and $1,414,407,485, respectively.
Dodge & Cox Income Fund / 10
Financial Highlights
| | | | | | | | | | | | | | | |
| SELECTED DATA AND RATIOS (for a share outstanding throughout each year) | | | Year Ended December 31, | |
|
| | | 2003 | | | 2002 | | | 2001 | | | 2000 | | | 1999 | |
| | | | | | | | | | | | | | | | |
Net asset value, beginning of year | | $12.77 | | | $12.20 | | | $11.80 | | | $11.40 | | | $12.25 | |
Income from investment operations: | | | | | | | | | | | | | | | |
Net investment income | | .60 | | | .66 | | | .74 | | | .77 | | | .72 | |
Net realized and unrealized gain (loss) | | .15 | | | .62 | | | .46 | | | .41 | | | (.82 | ) |
| | |
|
| |
|
| |
|
| |
|
| |
|
|
Total from investment operations | | .75 | | | 1.28 | | | 1.20 | | | 1.18 | | | (.10 | ) |
| | |
|
| |
|
| |
|
| |
|
| |
|
|
Distributions to shareholders from: | | | | | | | | | | | | | | | |
Net investment income | | (.60 | ) | | (.66 | ) | | (.74 | ) | | (.78 | ) | | (.71 | ) |
Net realized gain | | — | | | (.05 | ) | | (.06 | ) | | — | | | (.04 | ) |
| | |
|
| |
|
| |
|
| |
|
| |
|
|
Total distributions | | (.60 | ) | | (.71 | ) | | (.80 | ) | | (.78 | ) | | (.75 | ) |
| | |
|
| |
|
| |
|
| |
|
| |
|
|
Net asset value, end of year | | $12.92 | | | $12.77 | | | $12.20 | | | $11.80 | | | $11.40 | |
| | |
|
| |
|
| |
|
| |
|
| |
|
|
Total return | | 5.97 | % | | 10.75 | % | | 10.32 | % | | 10.70 | % | | (.81 | )% |
| | | | | |
Ratios/supplemental data: | | | | | | | | | | | | | | | |
Net assets, end of year (millions) | | $5,697 | | | $3,405 | | | $1,512 | | | $1,021 | | | $974 | |
Ratio of expenses to average net assets | | .45 | % | | .45 | % | | .45 | % | | .46 | % | | .46 | % |
Ratio of net investment income to average net assets | | 4.81 | % | | 5.67 | % | | 6.18 | % | | 6.67 | % | | 6.10 | % |
Portfolio turnover rate | | 41 | % | | 31 | % | | 40 | % | | 34 | % | | 24 | % |
11 / Dodge & Cox Income Fund
Report of Independent Auditors
To the Trustees of Dodge & Cox Funds and Shareholders of Dodge & Cox Income Fund
In our opinion, the accompanying statement of assets and liabilities, including the portfolio of investments, and the related statements of operations and of changes in net assets and the financial highlights present fairly, in all material respects, the financial position of the Dodge & Cox Income Fund (the “Fund”, one of the series constituting Dodge & Cox Funds) at December 31, 2003, the results of its operations for the year then ended, the changes in its net assets for each of the two years in the period then ended and the financial highlights for each of the five years in the period then ended, in conformity with accounting principles generally accepted in the United States of America. These financial statements and financial highlights (hereafter referred to as “financial statements”) are the responsibility of the Fund’s management; our responsibility is to express an opinion on these financial statements based on our audits. We conducted our audits of these financial statements in accordance with auditing standards generally accepted in the United States of America, which require that we plan and perform the audits to obtain reasonable assurance about whether the financial statements are free of material misstatement. An audit includes examining, on a test basis, evidence supporting the amounts and disclosures in the financial statements, assessing the accounting principles used and significant estimates made by management, and evaluating the overall financial statement presentation. We believe that our audits, which included confirmation of securities at December 31, 2003 by correspondence with the custodian and brokers, provide a reasonable basis for our opinion.
PricewaterhouseCoopers LLP
San Francisco, California
February 4, 2004
Special 2003 Tax Information (unaudited)
The following information is provided pursuant to provisions of the Internal Revenue Code:
The Fund designates $593,265 of its distributions paid to shareholders in 2003 as capital gain dividends (treated for federal income tax purposes in the hands of shareholders as long-term capital gain taxable at a maximum rate of 20%).
Dodge & Cox Income Fund / 12
THIS PAGE INTENTIONALLY LEFT BLANK
13 / Dodge & Cox Income Fund
THIS PAGE INTENTIONALLY LEFT BLANK
Dodge & Cox Income Fund / 14
Dodge & Cox Funds—Officer & Trustee Information (unaudited)
| | | | | | |
| | | |
Name (Age) and
Address* | | Position with Trust
(Time Served) | | Principal Occupation During Past 5 Years | | Other Directorships Held by Trustees |
|
Interested Trustees & Officers
|
| | | |
Harry R. Hagey (62) | | Chairman and Trustee (Trustee since 1975) | | Chairman, Chief Executive Officer and Director of Dodge & Cox, Portfolio Manager, and member of Investment Policy Committee | | — |
|
| | | |
John A. Gunn (60) | | President and Trustee
(Trustee since 1985) | | President, Chief Investment Officer and Director of Dodge & Cox, Portfolio Manager, and member of Investment Policy Committee, Fixed Income Strategy Committee, and International Investment Policy Committee | | — |
|
| | | |
Dana M. Emery (42) | | Vice President and Trustee (Trustee since 1993) | | Senior Vice President and Director of Dodge & Cox, Manager—Fixed Income, and member of Investment Policy Committee and Fixed Income Strategy Committee | | — |
|
| | | |
A. Horton Shapiro (64) | | Executive Vice President (Officer since 1985) | | Senior Vice President and Director of Dodge & Cox, Portfolio Manager, and member of Investment Policy Committee and Fixed Income Strategy Committee | | — |
|
| | | |
| Katherine Herrick Drake (49) | | Vice President (Officer since 1993) | | Vice President of Dodge & Cox, Portfolio Manager, and member of Investment Policy Committee | | — |
|
| | | |
Kenneth E. Olivier (51) | | Vice President
(Officer since 1992) | | Executive Vice President (since 2002) and Director of Dodge & Cox, Portfolio Manager, and member of Investment Policy Committee | | — |
|
| | | |
John M. Loll (37) | | Treasurer and Assistant Secretary (Officer since 2000) | | Vice President and Treasurer (since 2000) of Dodge & Cox; prior to 2000, Fund Administration and Accounting Manager, Dodge & Cox | | — |
|
| | | |
| Thomas M. Mistele (50) | | Secretary and Assistant Treasurer (Officer since 2000) | | Vice President, Secretary and General Counsel of Dodge & Cox | | — |
|
|
Independent Trustees
|
| | | |
William F. Ausfahl (63) | | Trustee (Since: 2002) | | CFO, The Clorox Co. (1982-1997); Director, The Clorox Co. (1984-1997) | | — |
|
| | | |
L. Dale Crandall (62) | | Trustee (Since: 1999) | | President, Kaiser Foundation Health Plan, Inc. and Kaiser Foundation Hospitals (2000-2002); Executive Vice President—Finance and Administration & CFO, Kaiser Foundation Health Plan, Inc. and Kaiser Foundation Hospitals (1998-2000) | | Director, Union BanCal Corporation (bank holding company) and Union Bank of California (commercial bank) (2001-Present); Director, Covad Communications Group (broadband communications services) (2002-Present); Director, Ansell Limited (medical equipment and supplies) (2002-Present); Director, BEA Systems, Inc. (software and programming) (2003-Present); Director, Coventry Health Care Inc. (managed healthcare) (2004-Present) |
|
| | | |
Thomas A. Larsen (54) | | Trustee (Since: 2002) | | Director in Howard, Rice, Nemerovski, Canady, Falk & Rabkin (law firm) | | — |
|
| | | |
Will C. Wood (64) | | Trustee (Since: 1992) | | Principal, Kentwood Associates, Financial Advisers | | Director, Banco Latinoamericano de Exportaciones S.A. (Latin American Foreign Trade Bank) (1999-Present); Director, Dover Investment Corp. (real estate development) (1992-Present) |
|
| * | | The address for each Officer and Trustee is One Sansome Street, 35th Floor, San Francisco, California 94104. Each Officer and Trustee oversees all four portfolios in the Dodge & Cox Funds complex and serves for an indefinite term. |
Additional information about the Trust’s Trustees is available in the Trust’s Statement of Additional Information (SAI). You can get a free copy of the SAI by contacting Dodge & Cox Funds at 1-800-621-3979.
The registrant has adopted a code of ethics that applies to the registrant’s principal executive officer and principal financial officer.
| ITEM 3. | AUDIT COMMITTEE FINANCIAL EXPERT. |
The Board of Trustees of the registrant has determined that William F. Ausfahl and L. Dale Crandall, members of the registrant’s Audit Committee, are each an “audit committee financial expert” and are “independent” for purposes of paragraph (a)(2) of Item 3 of Form N-CSR.
| ITEM 4. | PRINCIPAL ACCOUNTANT FEES AND SERVICES. |
(a) - (d) Aggregate fees billed to the registrant for the fiscal years ended December 31, 2003 and December 31, 2002 for professional services rendered by the registrant’s principal accountant were as follows:
| | | | | | |
| | | 2003
| | 2002
|
Audit Fees | | $ | 149,600 | | $ | 134,600 |
Audit-Related Fees | | | 16,000 | | | — |
Tax Fees | | | 51,240 | | | 46,400 |
All Other Fees | | | — | | | — |
Audit fees include amounts related to the audit of the registrant’s annual financial statements and services normally provided by the principal accountant in connection with statutory and regulatory filings. Audit-related fees include assurance services relating to the registrant’s financial statements, specifically the performance of agreed-upon procedures in connection with the registrant’s semi-annual financial statements. Tax fees include amounts related to tax return preparation, compliance, and reviews.
(e)(1) The registrant’s audit committee has adopted policies and procedures (“Policies”) which require the registrant’s audit committee to pre-approve all audit and non-audit services provided to the registrant by its principal accountant, as well as all non-audit service provided by the principal accountant to the registrant’s investment adviser, if the services directly impact the registrant’s operations and controls. The Policies do not apply in the case of audit services that the principal accountant provides to the registrant’s investment adviser. If a service (other than the engagement of the principal accountant to audit the registrant’s financial statements) is required to be pre-approved under the Policies between regularly scheduled audit committee meetings, pre-approval may be authorized by one audit committee member with ratification at the next scheduled audit committee meeting.
(e)(2) No services included in (b) - (d) above were approved pursuant to paragraph (c)(7)(i)(C) of Rule 2-01 of Regulation S-X.
(f) Not applicable.
(g) For the fiscal years ended December 31, 2003 and December 31, 2002, the aggregate fees billed by the registrant’s principal accountant for non-audit services rendered to the registrant and for non-audit services rendered to the registrant’s investment adviser were $151,946 and $133,956, respectively.
(h) All non-audit services rendered in (g) were pre-approved by the registrant’s audit committee. Accordingly, these services were considered by the registrant’s audit committee in maintaining the principal accountant’s independence.
| ITEM 5. | AUDIT COMMITTEE OF LISTED REGISTRANTS. |
Not applicable.
| ITEM 7. | DISCLOSURE OF PROXY VOTING POLICIES AND PROCEDURES FOR CLOSED-END MANAGEMENT INVESTMENT COMPANIES. |
Not applicable.
| ITEM 8. | PURCHASES OF EQUITY SECURITIES BY CLOSED-END MANAGEMENT INVESTMENT COMPANY AND AFFILIATED PURCHASERS. |
Not applicable.
| ITEM 9. | CONTROLS AND PROCEDURES. |
(a) The registrant’s principal executive and principal financial officers have evaluated the registrant’s disclosure controls and procedures (as defined in Rule 30a-3(c) under the Investment Company Act of 1940, as amended (the “1940 Act”) (17 CFR 270.30a-3(c))) as of a date within 90 days of this filing and have concluded that the registrant’s disclosure controls and procedures were effective, as of that date, in ensuring that information required to be disclosed by the registrant in this Form N-CSR was recorded, processed, summarized, and reported timely, based on their evaluation of these controls and procedures required by Rule 30a-3(b) under the 1940 Act (17 CFR 270.30a-3(b)) and Rules 13a-15(b) or 15d-15(b) under the Exchange Act (17 CFR 240.13a-15(b) or 240.15d-15(b)).
(b) There were no changes in the registrant’s internal control over financial reporting (as defined in Rule 30a-3(d) under the 1940 Act (17 CFR 270.30a-3(d)) that occurred during the registrant’s last fiscal half-year (the registrant’s second fiscal half-year in the case of an annual report) that has materially affected, or is reasonably likely to materially affect, the registrant’s internal control over financial reporting.
(a)(1) Code of Ethics pursuant to Item 2 of Form N-CSR is attached. (EX.99A)
(a)(2) Separate certifications pursuant to Section 302 of the Sarbanes-Oxley Act of 2002 are attached. (EX.99B)
(b) A certification pursuant to Section 906 of the Sarbanes-Oxley Act of 2002 is attached. (EX.99C)
SIGNATURES
Pursuant to the requirements of the Securities Exchange Act of 1934 and the Investment Company Act of 1940, the registrant has duly caused this report to be signed on its behalf by the undersigned, thereunto duly authorized.
| | |
Dodge & Cox Funds |
| |
| By | | /s/ Harry R. Hagey |
| | |
|
| | | Harry R. Hagey Chairman – Principal Executive Officer |
Date February 27, 2004
Pursuant to the requirements of the Securities Exchange Act of 1934 and the Investment Company Act of 1940, this report has been signed below by the following persons on behalf of the registrant and in the capacities and on the dates indicated.
| | |
Dodge & Cox Funds |
| |
| By | | /s/ Harry R. Hagey |
| | |
|
| | | Harry R. Hagey Chairman – Principal Executive Officer |
| |
| By | | /s/ John M. Loll |
| | |
|
| | | John M. Loll Treasurer – Principal Financial Officer |
Date February 27, 2004