UNITED STATES
SECURITIES AND EXCHANGE COMMISSION
Washington, D.C. 20549
FORMN-CSR
CERTIFIED SHAREHOLDER REPORT OF REGISTERED
MANAGEMENT INVESTMENT COMPANIES
Investment Company Act file number811-00173
DODGE & COX FUNDS
(Exact name of registrant as specified in charter)
555 California Street, 40th Floor
San Francisco, CA 94104
(Address of principal executive offices) (Zip code)
Roberta R.W. Kameda, Esq.
555 California Street, 40th Floor
San Francisco, CA 94104
(Name and address of agent for service)
Registrant’s telephone number, including area code:415-981-1710
Date of fiscal year end: DECEMBER 31, 2019
Date of reporting period: JUNE 30, 2019
FormN-CSR is to be used by management investment companies to file reports with the Commission not later than 10 days after the transmission to stockholders of any report that is required to be transmitted to stockholders under Rule30e-1 under the Investment Company Act of 1940 (17 CFR270.30e-1). The Commission may use the information provided on FormN-CSR in its regulatory, disclosure review, inspection, and policymaking roles.
A registrant is required to disclose the information specified by FormN-CSR, and the Commission will make this information public. A registrant is not required to respond to the collection of information contained in FormN-CSR unless the Form displays a currently valid Office of Management and Budget (“OMB”) control number. Please direct comments concerning the accuracy of the information collection burden estimate and any suggestions for reducing the burden to Secretary, Securities and Exchange Commission, 450 Fifth Street, NW, Washington, DC 20549-0609. The OMB has reviewed this collection of information under the clearance requirements of 44 U.S.C. ss. 3507.
ITEM 1. REPORTS TO STOCKHOLDERS.
The following are the June 30, 2019 semi-annual reports for the Dodge & Cox Funds, a Delaware statutory trust, consisting of six series: Dodge & Cox Stock Fund, Dodge & Cox Global Stock Fund, Dodge & Cox International Stock Fund, Dodge & Cox Balanced Fund, Dodge & Cox Income Fund, and Dodge & Cox Global Bond Fund. The reports of each series were transmitted to their respective shareholders on August 16, 2019.

DODGE & COX FUNDS®
Semi-Annual Report
June 30, 2019
Stock Fund
ESTABLISHED 1965
TICKER: DODGX
Important Notice:
Beginning on January 1, 2021, we intend to discontinue mailing paper copies of the Fund’s shareholder reports as permitted by new regulations adopted by the Securities and Exchange Commission, unless you specifically request paper copies from Dodge & Cox Funds or from your financial intermediary, such as a broker-dealer or bank. The reports will remain available to you on the Dodge & Cox Funds website (dodgeandcox.com), and you will be notified by mail each time a report is posted and provided with a link to access the report.
If you have already elected to receive shareholder reports electronically, you will not be affected by this change and do not need to take any action. If you have not done so already, you may elect to receive shareholder reports and other communications electronically by enrolling ine-delivery on the Funds website, or, if you are invested through a financial intermediary, by updating your mailing preferences through the intermediary.
If you wish to continue receiving paper copies of all future shareholder reports, please contact us at (800)621-3979. Reports will be provided to you free of charge. If you are invested through a financial intermediary, you may contact your financial intermediary to request to receive paper copies. Your election to receive reports in paper form will apply to all funds held with Dodge & Cox Funds or through your financial intermediary, as applicable.
6/19 SF SAR  Printed on recycled paper
TO OUR SHAREHOLDERS
The Dodge & Cox Stock Fund had a total return of 13.1% for the six months ended June 30, 2019, compared to a return of 18.5% for the S&P 500 Index.
MARKET COMMENTARY
After posting strong returns in the first quarter of 2019, the U.S. equity market continued to climb during the second quarter: the S&P 500 reached anall-time high in late June and ended the first half of the year up 19%. Continued U.S. job growth and the Federal Reserve’s consideration of lower interest rates propelled U.S. stocks to record levels. Growth stocks outperformed value stocks(a) as technology-related companies surged during thesix-month period: Information Technology (up 27%) and Consumer Discretionary (up 22%) were the best-performing sectors of the S&P 500, while Health Care (up 8%) and Energy (up 13%) lagged the most. These market dynamics extended a longer-term trend.
STRONG CONVICTION IN OUR VALUE-ORIENTED, ACTIVE INVESTMENT APPROACH
Over the last decade, U.S. growth stocks have outperformed value stocks by a cumulative 107 percentage points.(b)During this challenging period for value investors, the Fund has outperformed the U.S. value investment universe by 27 percentage points.(c)The valuation differential between value- and growth-oriented stocks remains wide by historical standards. Growth stocks are relatively expensive: the Russell 1000 Growth Index trades at 22.0 times forward earnings compared to 15.0 times for the Russell 1000 Value Index. This valuation gap should narrow as market prices move to more closely reflect our assessment of fundamental value. Historically, many value stocks have tended to outperform when they are particularly inexpensive, as they are today. We have conviction in our value-oriented, active investment approach and continue to believe now is an opportune time to be invested in more reasonably priced equities, selected individually after thorough research.
In addition, U.S. interest rates are extremely low by historical standards, and there is an overwhelming expectation in the market that they will remain “lower for longer.” We believe current valuations may already reflect most of these beliefs about rates. The future market “surprise” may be interest rate increases from today’s low levels, and we think there is a strong likelihood this will happen over the long term. Any increase in interest rates should create meaningful upside for many value stocks, especially in the Financials sector.
We are optimistic about the long-term outlook for the portfolio, which remains overweight in sectors poised to benefit from a rebound in U.S. value stocks such as Financials, which comprised 25.0% of the Fund compared to 13.1% for the S&P 500, and Energy at 9.6% versus 5.0%. Health Care is also an overweight in the portfolio, and accounted for 20.6% of the Fund versus 14.2% for the S&P 500.(d)
Financials
U.S. financial services companies are trading near historically low valuations relative to the overall market. Banks, for example, are trading at 57% of the S&P 500 forwardprice-to-earnings multiple, the lowest relative level since the dotcom bubble in 1999. Why are bank stocks so inexpensive? Since September 2018, U.S. Treasury yields have declined by 100 basis points,(e)as have market expectations for the federal funds rate through 2020. For most banks, lower rates have a negative impact on earnings, but we believe this issue has been fully priced into current valuations.
Despite low valuations, company fundamentals have been resilient. The Fund’s bank holdings that were subjected to the Fed’s 2019 stress-testing process have received approval to return a weighted average of 11% of their market cap in dividends and buybacks in 2020. This total yield compares favorably with the broad market and notably income-oriented equities, such as in the Real Estate (e.g., Investment Trusts) and Utilities sectors. Banks’ capital levels are near historical highs, as are aggregate banking sector profits. In recent years, Banks’ earnings growth has outpaced the broad market. We expect banks to offset the effects of lower interest rates through volume growth, cost controls, and share buybacks. Going forward, we are particularly constructive on several national retail banks—Bank of America, JPMorgan Chase, and Wells Fargo(f)—that are increasingly using their scale, advantages in technology, and marketing expertise to drive outsized deposit growth and profitability.
Energy
While the short-term direction of oil prices is difficult to forecast, the long-term fundamentals of supply and demand are constructive. We believe demand will continue to grow at roughly 1% per year, or around 1.0 to 1.5 million additional barrels per day. From a supply perspective, U.S. shale oil growth is currently robust, but the rate of growth should taper as U.S. shale producers shift their priority from production growth to generating free cash flow. The rest of the industry will need to reinvest at higher rates to counteract the natural decline from existing fields and to meet new demand growth. It is likely that world oil prices at or above current levels will be needed to incentivize that higher level of investment.
When evaluating energy stocks, we look for companies with assets that are on the low end of the global cost curve, management teams that have deployed capital prudently through the cycle, andlow-to-reasonable valuations. We continue to find long-term opportunities in selected upstream and oilfield services companies with these characteristics and recently added to the Fund’s energy holdings, including Occidental Petroleum following its agreement to acquire Anadarko Petroleum, which is also held in the Fund.
In June, one of our global industry analysts met with Occidental’s management team at their headquarters in Houston, Texas to conduct due diligence on the company’s pending acquisition. While there are concerns about integration risk and
PAGE 2§ DODGE & COX STOCK FUND
the high cost of financing, we believe Occidental’s risk-reward profile is compelling due to its attractive valuation, strong operational capabilities, and diversified, free-cash-flow generative upstream portfolio that is supplemented by its midstream and chemicals businesses. From our research on Anadarko, we know that Anadarko’s asset portfolio has been meaningfully streamlined in recent years and the remaining assets are world class with large reserves and low break-even oil prices. In addition, Occidental aims to achieve $2 billion in cost synergies, and we believe there is a high probability these savings will be realized long term. On June 30, Occidental and Anadarko were 2.3% and 1.2% positions, respectively, in the Fund.
Health Care
Within the Health Care sector, attractive valuations reflect uncertainty about potential changes to U.S. health care regulations. As part of ongoing due diligence, our global industry analysts recently met with industry experts, regulators, and policymakers in Washington, D.C. and affirmed our belief that the risk of holistic, dramatic change to U.S. drug pricing due to regulatory or market changes remains low.
There are two primary goals behind U.S. health care reform debate: providing coverage for the majority of the uninsured population and managing the rising costs of providing health care for all. If more uninsured individuals gain coverage, then the Fund’s three health care services holdings (CVS Health, Cigna, and UnitedHealth Group) should benefit as they provide managed care services for both individuals and employers. Additionally, our holdings could benefit from the expansion of government programs, such as Medicaid and Medicare, as many of these program’s beneficiaries receive their care from the Fund’s health care services holdings. While there is uncertainty around how to address the issue of rising cost, our companies are also well positioned to play a critical role in reducing U.S. health care cost trends. Moreover, these three companies have enormous competitive advantages and can leverage their scale to negotiate the best prices, invest extensively in technology and data analytics, and utilize their vast stores of clinical data to deploy innovative, proactive care management strategies. Having merged pharmacy benefit manager (PBM) companies with managed care businesses, they are well positioned to drive down the total cost of care, influence costs and incentives within the system, and deliver on the promise of patient centric care.
In Pharmaceuticals, research and development productivity continues to improve, evidenced by historically high numbers of drug approvals in the last few years. Although PBMs have been able to exert increased pricing pressure on drug manufacturers, we believe this industry has attractive prospects. The Fund continues to have a meaningful overweight position in Pharmaceuticals and Biotechnology: 14.9% compared to 6.8% for the S&P 500. These holdings have durable franchises with significant barriers to entry and long-term growth opportunities from product innovation, burgeoning emerging market demand, and development of new drug categories.
We continue to find compelling opportunities in Health Care and recently added to Cigna and Bristol-Myers Squibb, among other holdings.
Cigna
Cigna (2.2% position) is one of the largest and most diversified health care services organizations in the United States. In late 2018, Cigna acquired Express Scripts, a leading PBM, and we believe there will be significant cost savings from the transaction over the next several years. The combined company is also generating substantial free cash flow that can be used to reduce debt, repurchase shares, and drive earnings growth. In addition, Cigna has proven to be a leading innovator in the midsize employer based segment where they continue to gain share due to their patient centric care model and industry leading cost trend which remains well below industry averages. Cigna is trading at only nine times forward earnings amid heightened competitive and regulatory risks surrounding its employer-sponsored health insurance and PBM segments. Weighing the risks and opportunities, we recently added to Cigna based on our view of its modest valuation in light of its solid business franchise and management’s strong execution track record.
Bristol-Myers Squibb
Bristol-Myers Squibb—a global leader in immuno-oncology (IO)—is acquiring Celgene, a biopharmaceutical company, for $74 billion. The deal is expected to close by early 2020. While we would have preferred that the two companies remain independent, we have conducted extensive due diligence into the prospects for the combined company and continue to believe Bristol-Myers’ risk-reward profile is attractive. Hence, we recently added to the Fund’s position in Bristol-Myers, which trades at under 11 times forward earnings. Activist investors have applied significant pressure on Bristol-Myers’ management team to perform and increase profitability by commercializing Celgene’s pipeline, cutting costs, and expanding the IO business. IO drugs target a mammoth oncology market with enormous unmet needs and large patient numbers across many tumor types. The combined company will have nine products with more than $1 billion in annual sales and significant growth potential in the core disease areas of oncology, immunology, and inflammation and cardiovascular disease. On June 30, Bristol-Myers Squibb represented 2.0% of the Fund.
IN CLOSING
We remain optimistic about the long-term prospects for the Fund’s portfolio, which continues to trade at a significant discount to the market. On June 30, the Fund’s portfolio of 65 companies traded at 12.9 times forward estimated earnings, compared to 17.3 times for the S&P 500.
A fundamental, active, value-oriented investment approach requires conviction and patience. The rewards of active management are most likely to accrue to those investors who have the discipline to maintain a long-term investment horizon.
DODGE & COX STOCK FUND§PAGE 3
Thank you for your continued confidence in our firm. As always, we welcome your comments and questions.
For the Board of Trustees,
| | |
 | |  |
Charles F. Pohl, Chairman | | Dana M. Emery, President |
July 31, 2019
| (a) | | Value stocks are the lower valuation portion of the equity market, and growth stocks are the higher valuation portion. |
| (b) | | The Russell 1000 Growth Index had a total return of 351.7% compared to 245.0% for the Russell 1000 Value Index from June 30, 2009 through June 30, 2019. |
| (c) | | The Dodge & Cox Stock Fund had a total return of 272.0% from June 30, 2009 through June 30, 2019. |
| (d) | | Unless otherwise specified, all weightings and characteristics are as of June 30, 2019. |
| (e) | | One basis point is equal to 1/100th of 1%. |
| (f) | | The use of specific examples does not imply that they are more or less attractive investments than the portfolio’s other holdings. |
PAGE 4§ DODGE & COX STOCK FUND
YEAR-TO-DATE PERFORMANCE REVIEW
The Fund underperformed the S&P 500 by 5.4 percentage points year to date.
Key Detractors from Relative Results
| | § | | The Fund’s average overweight position (21% versus 14%) and lower returns in the Health Care sector (up 4% compared to up 8% for the S&P 500 sector) hurt results. Cigna (down 17%), Bristol-Myers Squibb (down 11%), and Sanofi (up 3%) were weak. | |
| | § | | Strong performance from several large internet and technology-related stocks not held by the Fund (e.g., Amazon, Apple) detracted from relative results. The negative impact was substantial in Consumer Discretionary and Information Technology (the best-performing S&P 500 sectors), where the Fund was underweight throughout the period. | |
| | § | | In the Consumer Discretionary sector, the Fund’s holdings (down 7%) trailed the S&P 500 sector (up 22%). Qurate Retail (down 37%) and Gap (down 29%) performed poorly. | |
| | § | | In the Information Technology sector, the Fund’s holdings performed well (up 22%) but lagged the S&P 500 sector (up 27%). | |
| | § | | The Fund’s higher average weighting (26% versus 13%) and weaker returns from holdings in the Financials sector (up 13% compared to up 17% for the S&P 500 sector) hampered results. Bank of New York Mellon (down 5%), Charles Schwab (down 2%), and Wells Fargo (up 5%) lagged. | |
| | § | | Occidental Petroleum (down 16%) and FedEx (up 3%) also detracted. | |
Key Contributors to Relative Results
| | § | | The Fund’s average overweight position (15% versus 10%) and holdings in the Communication Services sector (up 21% compared to up 19% for the S&P 500 sector) aided relative results. Zayo Group Holdings (up 44%) and media companies DISH Network (up 54%), Charter Communications (up 39%), and Comcast (up 25%) were key contributors. | |
| | § | | Holdings Anadarko Petroleum (up 63%), Micro Focus International (up 56%), Johnson Controls International (up 41%), and American Express (up 31%) were standout performers. | |
KEY CHARACTERISTICS OF DODGE & COX
Independent Organization
Dodge & Cox is one of the largest privately owned investment managers in the world. We remain committed to independence, with a goal of providing the highest quality investment management service to our existing clients.
Over 85 Years of Investment Experience
Dodge & Cox was founded in 1930. We have a stable and well-qualified team of investment professionals, most of whom have spent their entire careers at Dodge & Cox.
Experienced Investment Team
The U.S. Equity Investment Committee, which is the decision-making body for the Stock Fund, is a ten-member committee with an average tenure at Dodge & Cox of 24 years.
One Business with a Single Research Office
Dodge & Cox manages equity (domestic, international, and global), fixed income (domestic and global), and balanced investments, operating from one office in San Francisco.
Consistent Investment Approach
Our team decision-making process involves thorough, bottom-up fundamental analysis of each investment.
Long-Term Focus and Low Expenses
We invest with a three- to five-year investment horizon, which has historically resulted in low turnover relative to our peers. We manage Funds that maintain low expense ratios.
Risks: The Fund is subject to market risk, meaning holdings in the Fund may decline in value for extended periods due to the financial prospects of individual companies, or due to general market and economic conditions. Please read the prospectus and summary prospectus for specific details regarding the Fund’s risk profile.
DODGE & COX STOCK FUND§PAGE 5
GROWTH OF $10,000 OVER 10 YEARS
FOR AN INVESTMENT MADE ON JUNE 30, 2009
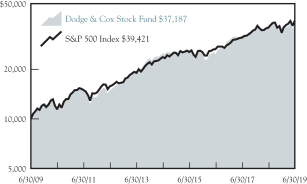
AVERAGE ANNUAL TOTAL RETURN
FOR PERIODS ENDED JUNE 30, 2019
| | | | | | | | | | | | | | | | |
| | | 1 Year | | | 5 Years | | | 10 Years | | | 20 Years | |
Dodge & Cox Stock Fund | | | 4.18 | % | | | 8.26 | % | | | 14.04 | % | | | 8.46 | % |
S&P 500 Index | | | 10.42 | | | | 10.71 | | | | 14.70 | | | | 5.90 | |
Returns represent past performance and do not guarantee future results. Investment return and share price will fluctuate with market conditions, and investors may have a gain or loss when shares are sold. Fund performance changes over time and currently may be significantly lower than stated. Performance is updated and published monthly. Visit the Fund’s website at dodgeandcox.com or call800-621-3979 for current performance figures.
The Fund’s total returns include the reinvestment of dividend and capital gain distributions, but have not been adjusted for any income taxes payable by shareholders on these distributions or on Fund share redemptions. Index returns include dividends but, unlike Fund returns, do not reflect fees or expenses. The S&P 500 Index is a market capitalization-weighted index of 500 large-capitalization stocks commonly used to represent the U.S. equity market.
S&P 500® is a trademark of S&P Global Inc.
FUND EXPENSE EXAMPLE
As a Fund shareholder, you incur ongoing Fund costs, including management fees and other Fund expenses. All mutual funds have ongoing costs, sometimes referred to as operating expenses. The following example shows ongoing costs of investing in the Fund and can help you understand these costs and compare them with those of other mutual funds. The example assumes a $1,000 investment held for the six months indicated.
ACTUAL EXPENSES
The first line of the table below provides information about actual account values and expenses based on the Fund’s actual returns. You may use the information in this line, together with your account balance, to estimate the expenses that you paid over the period. Simply divide your account value by $1,000 (for example, an $8,600 account value divided by $1,000 = 8.6), then multiply the result by the number in the first line under the heading “Expenses Paid During Period” to estimate the expenses you paid on your account during this period.
HYPOTHETICAL EXAMPLE FOR COMPARISON WITH OTHER MUTUAL FUNDS
Information on the second line of the table can help you compare ongoing costs of investing in the Fund with those of other mutual funds. This information may not be used to estimate the actual ending account balance or expenses you paid during the period. The hypothetical “Ending Account Value” is based on the actual expense ratio of the Fund and an assumed 5% annual rate of return before expenses (not the Fund’s actual return). The amount under the heading “Expenses Paid During Period” shows the hypothetical expenses your account would have incurred under this scenario. You can compare this figure with the 5% hypothetical examples that appear in shareholder reports of other mutual funds.
| | | | | | | | | | | | |
Six Months Ended
June 30, 2019 | | Beginning Account Value
1/1/2019 | | | Ending Account Value
6/30/2019 | | | Expenses Paid
During Period* | |
Based on Actual Fund Return | | $ | 1,000.00 | | | $ | 1,131.40 | | | $ | 2.77 | |
Based on Hypothetical 5% Yearly Return | | | 1,000.00 | | | | 1,022.20 | | | | 2.63 | |
| * | | Expenses are equal to the Fund’s annualized expense ratio of 0.52%, multiplied by the average account value over the period, multiplied by 181/365 (to reflect the one-half year period). |
The expenses shown in the table highlight ongoing costs only and do not reflect any transactional fees or account maintenance fees. Though other mutual funds may charge such fees, please note that the Fund does not charge transaction fees (e.g., redemption fees, sales loads) or universal account maintenance fees (e.g., small account fees).
PAGE 6§ DODGE & COX STOCK FUND
| | | | |
| FUND INFORMATION (unaudited) | | | June 30, 2019 | |
| | | | |
| GENERAL INFORMATION | | | |
Net Asset Value Per Share | | | $187.10 | |
Total Net Assets (billions) | | | $70.8 | |
Expense Ratio | | | 0.52% | |
Portfolio Turnover Rate (1/1/19 to 6/30/19, unannualized) | | | 9% | |
30-Day SEC Yield(a) | | | 1.68% | |
Active Share(b) | | | 82% | |
Number of Companies | | | 65 | |
Fund Inception | | | 1965 | |
No sales charges or distribution fees | | | | |
Investment Manager:Dodge & Cox, San Francisco. Managed by the U.S. Equity Investment Committee, whose ten members’ average tenure at Dodge & Cox is 24 years.
| | | | | | | | |
| PORTFOLIO CHARACTERISTICS | | Fund | | | S&P 500 | |
Median Market Capitalization (billions) | | | $38 | | | | $23 | |
Weighted Average Market Capitalization (billions) | | | $148 | | | | $245 | |
Price-to-Earnings Ratio(c) | | | 12.9x | | | | 17.3x | |
Foreign Securities not in the S&P 500(d) | | | 11.7% | | | | 0.0% | |
| | | | |
| TEN LARGEST HOLDINGS (%)(e) | | Fund | |
Charter Communications, Inc. | | | 3.9 | |
Microsoft Corp. | | | 3.6 | |
Wells Fargo & Co. | | | 3.5 | |
Comcast Corp. | | | 3.4 | |
Capital One Financial Corp. | | | 3.3 | |
FedEx Corp. | | | 3.2 | |
Charles Schwab Corp. | | | 3.0 | |
Alphabet, Inc. | | | 2.9 | |
Bank of America Corp. | | | 2.8 | |
JPMorgan Chase & Co. | | | 2.6 | |
| | | | | | | | |
| SECTOR DIVERSIFICATION (%) | | Fund | | | S&P 500 | |
Financials | | | 25.0 | | | | 13.1 | |
Health Care | | | 20.6 | | | | 14.2 | |
Information Technology | | | 16.2 | | | | 21.5 | |
Communication Services | | | 13.4 | | | | 10.2 | |
Energy | | | 9.6 | | | | 5.0 | |
Industrials | | | 7.6 | | | | 9.4 | |
Consumer Discretionary | | | 3.4 | | | | 10.2 | |
Materials | | | 1.0 | | | | 2.8 | |
Consumer Staples | | | 0.7 | | | | 7.3 | |
Utilities | | | 0.0 | | | | 3.3 | |
Real Estate | | | 0.0 | | | | 3.1 | |
| (a) | SEC Yield is an annualization of the Fund’s net investment income for the trailing30-day period. Dividends paid by the Fund may be higher or lower than implied by the SEC Yield. |
| (b) | Active share is a measure of how much an investment portfolio differs from its benchmark index, based on a scale of 0% (complete overlap with the index) to 100% (no overlap). Overlap for each security in the Fund is the lower of either its percentage weight in the Fund or its percentage weight in the relevant index. Active share is calculated as 100% minus the sum of the overlapping security weights. |
| (c) | Price-to-earnings (P/E) ratios are calculated using12-month forward earnings estimates from third-party sources. |
| (d) | Foreign securities are U.S. dollar denominated. |
| (e) | The Fund’s portfolio holdings are subject to change without notice. The mention of specific securities is not a recommendation to buy, sell, or hold any particular security and is not indicative of Dodge & Cox’s current or future trading activity. |
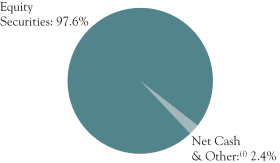
| (f) | Net Cash & Other includes cash, short-term investments, derivatives, receivables, and payables. |
DODGE & COX STOCK FUND§PAGE 7
| | | | |
| PORTFOLIO OF INVESTMENTS (unaudited) | | | June 30, 2019 | |
| | | | | | | | |
| COMMON STOCKS: 97.6% | |
| | |
| | | SHARES | | | VALUE | |
| COMMUNICATION SERVICES: 13.4% | |
MEDIA & ENTERTAINMENT: 12.1% | | | | | | | | |
Alphabet, Inc., Class A(a) | | | 82,300 | | | $ | 89,114,440 | |
Alphabet, Inc., Class C(a) | | | 1,819,553 | | | | 1,966,773,033 | |
Charter Communications, Inc., Class A(a) | | | 6,959,486 | | | | 2,750,249,678 | |
Comcast Corp., Class A | | | 56,582,894 | | | | 2,392,324,758 | |
DISH Network Corp., Class A(a) | | | 18,539,637 | | | | 712,107,457 | |
Fox Corp., Class A | | | 11,471,975 | | | | 420,333,164 | |
Fox Corp., Class B | | | 3,585,701 | | | | 130,985,658 | |
News Corp., Class A | | | 9,313,490 | | | | 125,638,980 | |
| | | | | | | | |
| | | | | | | 8,587,527,168 | |
TELECOMMUNICATION SERVICES: 1.3% | | | | | |
Sprint Corp.(a) | | | 56,515,127 | | | | 371,304,384 | |
Zayo Group Holdings, Inc.(a)(b) | | | 15,994,900 | | | | 526,392,159 | |
| | | | | | | | |
| | | | | | | 897,696,543 | |
| | | | | | | | |
| | | | | | | 9,485,223,711 | |
| CONSUMER DISCRETIONARY: 3.4% | | | | | |
AUTOMOBILES & COMPONENTS: 0.3% | | | | | |
Harley-Davidson, Inc. | | | 6,567,647 | | | | 235,318,792 | |
|
CONSUMER DURABLES & APPAREL: 0.4% | |
Mattel, Inc.(a)(b) | | | 23,148,305 | | | | 259,492,499 | |
| |
RETAILING: 2.7% | | | | | |
Booking Holdings, Inc.(a) | | | 678,500 | | | | 1,271,990,735 | |
Qurate Retail, Inc., Series A(a)(b) | | | 36,723,476 | | | | 455,003,868 | |
The Gap, Inc. | | | 11,830,600 | | | | 212,595,882 | |
| | | | | | | | |
| | | | | | | 1,939,590,485 | |
| | | | | | | | |
| | | | | | | 2,434,401,776 | |
| CONSUMER STAPLES: 0.7% | | | | | |
FOOD, BEVERAGE & TOBACCO: 0.7% | | | | | |
Molson Coors Brewing Company, Class B | | | 9,293,925 | | | | 520,459,800 | |
| | |
| ENERGY: 9.6% | | | | | | | | |
Anadarko Petroleum Corp.(b) | | | 12,420,142 | | | | 876,365,220 | |
Apache Corp.(b) | | | 32,534,809 | | | | 942,533,417 | |
Baker Hughes, a GE Company | | | 37,130,796 | | | | 914,531,505 | |
Concho Resources, Inc. | | | 4,025,500 | | | | 415,351,090 | |
Halliburton Co. | | | 20,089,212 | | | | 456,828,681 | |
Hess Corp. | | | 6,015,300 | | | | 382,392,621 | |
National Oilwell Varco, Inc. | | | 15,523,409 | | | | 345,085,382 | |
Occidental Petroleum Corp. | | | 32,937,926 | | | | 1,656,118,919 | |
Schlumberger, Ltd. (Curacao/United States) | | | 20,014,845 | | | | 795,389,940 | |
| | | | | | | | |
| | | | | | | 6,784,596,775 | |
| FINANCIALS: 25.0% | | | | | |
BANKS: 9.8% | | | | | | | | |
Bank of America Corp. | | | 69,455,300 | | | | 2,014,203,700 | |
BB&T Corp. | | | 13,492,544 | | | | 662,888,687 | |
JPMorgan Chase & Co. | | | 16,296,500 | | | | 1,821,948,700 | |
Wells Fargo & Co. | | | 51,874,841 | | | | 2,454,717,476 | |
| | | | | | | | |
| | | | | | | 6,953,758,563 | |
DIVERSIFIED FINANCIALS: 12.2% | | | | | |
American Express Co. | | | 12,037,100 | | | | 1,485,859,624 | |
Bank of New York Mellon Corp. | | | 28,770,224 | | | | 1,270,205,389 | |
Capital One Financial Corp.(b) | | | 25,380,113 | | | | 2,302,991,454 | |
Charles Schwab Corp. | | | 52,308,300 | | | | 2,102,270,577 | |
Goldman Sachs Group, Inc. | | | 7,016,700 | | | | 1,435,616,820 | |
| | | | | | | | |
| | | | | | | 8,596,943,864 | |
INSURANCE: 3.0% | | | | | | | | |
AEGON NV (Netherlands) | | | 75,622,022 | | | | 374,329,009 | |
Brighthouse Financial, Inc.(a)(b) | | | 6,685,763 | | | | 245,300,645 | |
MetLife, Inc. | | | 30,367,100 | | | | 1,508,333,857 | |
| | | | | | | | |
| | | | | | | 2,127,963,511 | |
| | | | | | | | |
| | | | | | | 17,678,665,938 | |
| | | | | | | | |
| | |
| | | SHARES | | | VALUE | |
| HEALTH CARE: 20.7% | | | | | |
HEALTH CARE EQUIPMENT & SERVICES: 5.7% | |
Cigna Corp. | | | 10,067,793 | | | $ | 1,586,180,787 | |
CVS Health Corp. | | | 12,041,500 | | | | 656,141,335 | |
Danaher Corp. | | | 3,033,100 | | | | 433,490,652 | |
Medtronic PLC (Ireland/United States) | | | 4,110,000 | | | | 400,272,900 | |
UnitedHealth Group, Inc. | | | 3,912,460 | | | | 954,679,365 | |
| | | | | | | | |
| | | | | | | 4,030,765,039 | |
PHARMACEUTICALS, BIOTECHNOLOGY & LIFE SCIENCES: 15.0% | |
Alnylam Pharmaceuticals, Inc.(a) | | | 3,197,761 | | | | 232,029,538 | |
AstraZeneca PLC ADR (United Kingdom) | | | 32,630,573 | | | | 1,346,990,053 | |
Bristol-Myers Squibb Co. | | | 30,546,239 | | | | 1,385,271,939 | |
Eli Lilly and Co. | | | 5,552,119 | | | | 615,119,264 | |
Gilead Sciences, Inc. | | | 11,322,512 | | | | 764,948,911 | |
GlaxoSmithKline PLC ADR (United Kingdom) | | | 31,935,000 | | | | 1,278,038,700 | |
Incyte Corp.(a) | | | 1,995,900 | | | | 169,571,664 | |
Novartis AG ADR (Switzerland) | | | 17,366,300 | | | | 1,585,716,853 | |
Roche Holding AG ADR (Switzerland) | | | 41,406,999 | | | | 1,453,385,665 | |
Sanofi ADR (France) | | | 40,337,328 | | | | 1,745,396,182 | |
| | | | | | | | |
| | | | | | | 10,576,468,769 | |
| | | | | | | | |
| | | | | | | 14,607,233,808 | |
| INDUSTRIALS: 7.6% | | | | | | | | |
CAPITAL GOODS: 4.4% | | | | | | | | |
Johnson Controls International PLC (Ireland/United States) | | | 44,065,751 | | | | 1,820,356,174 | |
United Technologies Corp. | | | 10,220,700 | | | | 1,330,735,140 | |
| | | | | | | | |
| | | | | | | 3,151,091,314 | |
TRANSPORTATION: 3.2% | | | | | | | | |
FedEx Corp.(b) | | | 13,636,099 | | | | 2,238,911,095 | |
| | | | | | | | |
| | | | | | | 5,390,002,409 | |
| INFORMATION TECHNOLOGY: 16.2% | |
SEMICONDUCTORS & SEMICONDUCTOR EQUIPMENT: 2.4% | |
Maxim Integrated Products, Inc. | | | 5,674,375 | | | | 339,441,113 | |
Microchip Technology, Inc.(b) | | | 15,477,133 | | | | 1,341,867,431 | |
| | | | | | | | |
| | | | | | | 1,681,308,544 | |
SOFTWARE & SERVICES: 5.3% | | | | | | | | |
Cognizant Technology Solutions Corp., Class A | | | 10,638,400 | | | | 674,368,176 | |
Micro Focus International PLC ADR(b) (United Kingdom) | | | 19,870,228 | | | | 520,401,271 | |
Microsoft Corp. | | | 19,161,400 | | | | 2,566,861,144 | |
| | | | | | | | |
| | | | | | | 3,761,630,591 | |
TECHNOLOGY, HARDWARE & EQUIPMENT: 8.5% | |
Cisco Systems, Inc. | | | 16,267,311 | | | | 890,309,931 | |
Dell Technologies, Inc., Class C(a) | | | 8,840,717 | | | | 449,108,423 | |
Hewlett Packard Enterprise Co.(b) | | | 75,227,245 | | | | 1,124,647,313 | |
HP Inc. | | | 74,243,278 | | | | 1,543,517,750 | |
Juniper Networks, Inc.(b) | | | 29,879,065 | | | | 795,679,501 | |
TE Connectivity, Ltd. (Switzerland) | | | 12,923,075 | | | | 1,237,772,123 | |
| | | | | | | | |
| | | | | | | 6,041,035,041 | |
| | | | | | | | |
| | | | | | | 11,483,974,176 | |
| | |
| MATERIALS: 1.0% | | | | | | | | |
Celanese Corp. | | | 6,253,598 | | | | 674,137,864 | |
| | | | | | | | |
| | |
TOTAL COMMON STOCKS
(Cost $50,100,186,902) | | | | | | $ | 69,058,696,257 | |
| | |
| PAGE 8§ DODGE & COX STOCK FUND | | See accompanying Notes to Financial Statements |
| | | | |
| PORTFOLIO OF INVESTMENTS (unaudited) | | | June 30, 2019 | |
| | | | | | | | |
| SHORT-TERM INVESTMENTS: 2.1% | |
| | |
| | | PAR VALUE/
SHARES | | | VALUE | |
REPURCHASE AGREEMENTS: 1.7% | |
Bank of Montreal(c)
2.45%, dated 6/28/19, due 7/1/19, maturity value $123,425,194 | | $ | 123,400,000 | | | $ | 123,400,000 | |
Fixed Income Clearing Corporation(c)
1.60%, dated 6/28/19, due 7/1/19, maturity value $735,826,097 | | | 735,728,000 | | | | 735,728,000 | |
Royal Bank of Canada(c)
2.47%, dated 6/28/19, due 7/1/19, maturity value $329,367,781 | | | 329,300,000 | | | | 329,300,000 | |
| | | | | | | | |
| | | | 1,188,428,000 | |
MONEY MARKET FUND: 0.4% | | | | | |
State Street Institutional U.S. Government Money Market Fund | | | 281,104,287 | | | | 281,104,287 | |
| | | | | | | | |
TOTAL SHORT-TERM INVESTMENTS
(Cost $1,469,532,287) | | | $ | 1,469,532,287 | |
| | | | | | | | |
TOTAL INVESTMENTS IN SECURITIES
(Cost $51,569,719,189) | | | 99.7 | % | | $ | 70,528,228,544 | |
OTHER ASSETS LESS LIABILITIES | | | 0.3 | % | | | 234,380,903 | |
| | | | | | | | |
| NET ASSETS | | | 100.0 | % | | $ | 70,762,609,447 | |
| | | | | | | | |
| (b) | See Note 9 regarding holdings of 5% voting securities |
| (c) | Repurchase agreements are collateralized by: |
Bank of Montreal: U.S. Treasury Bills8/15/19-9/12/19, U.S. Treasury Notes1.25%-3.125%,12/31/19-2/15/49, and U.S. Treasury Inflation Indexed Notes0.125%-3.875%,4/15/21-2/15/46. Total collateral value is $125,893,699.
Fixed Income Clearing Corporation: U.S. Treasury Notes1.375%-2.25%, 4/30/21. Total collateral value is $750,449,052.
Royal Bank of Canada: U.S. Treasury Notes2.25%-2.50%,3/31/21-12/31/24. Total collateral value is $335,955,153.
In determining a company’s country designation, the Fund generally references the country of incorporation. In cases where the Fund considers the country of incorporation to be a “jurisdiction of convenience” chosen primarily for tax purposes or in other limited circumstances, the Fund uses the country designation of an appropriate broad-based market index. In those cases, two countries are listed—the country of incorporation and the country designated by an appropriate index, respectively.
ADR: American Depositary Receipt
FUTURES CONTRACTS
| | | | | | | | | | | | | | | | |
| Description | | Number of
Contracts | | | Expiration
Date | | | Notional
Amount | | | Value /
Unrealized
Appreciation
(Depreciation) | |
E-mini S&P 500 Index—Long Position | | | 10,821 | | | | 9/20/19 | | | $ | 1,592,959,410 | | | $ | 16,691,793 | |
| | |
| See accompanying Notes to Financial Statements | | DODGE & COX STOCK FUND§PAGE 9 |
| | | | |
STATEMENT OF ASSETS AND LIABILITIES (unaudited) | |
| |
| | | June 30, 2019 | |
ASSETS: | | | | |
Investments in securities, at value | | | | |
Unaffiliated issuers (cost $41,467,708,412) | | $ | 58,898,642,671 | |
Affiliated issuers (cost $10,102,010,777) | | | 11,629,585,873 | |
| | | | |
| | $ | 70,528,228,544 | |
Deposits with broker for futures contracts | | | 68,172,300 | |
Receivable for variation margin for futures contracts | | | 7,195,964 | |
Receivable for investments sold | | | 145,547,498 | |
Receivable for Fund shares sold | | | 36,745,287 | |
Dividends and interest receivable | | | 87,063,252 | |
Prepaid expenses and other assets | | | 528,890 | |
| | | | |
| | | 70,873,481,735 | |
| | | | |
LIABILITIES: | | | | |
Payable for investments purchased | | | 37,162,547 | |
Payable for Fund shares redeemed | | | 44,828,359 | |
Management fees payable | | | 28,671,611 | |
Accrued expenses | | | 209,771 | |
| | | | |
| | | 110,872,288 | |
| | | | |
NET ASSETS | | $ | 70,762,609,447 | |
| | | | |
NET ASSETS CONSIST OF: | | | | |
Paid in capital | | $ | 49,211,244,157 | |
Total distributable earnings | | | 21,551,365,290 | |
| | | | |
| | $ | 70,762,609,447 | |
| | | | |
Fund shares outstanding (par value $0.01 each, unlimited shares authorized) | | | 378,209,583 | |
Net asset value per share | | $ | 187.10 | |
| |
STATEMENT OF OPERATIONS (unaudited) | | | | |
| |
| | | Six Months Ended
June 30, 2019 | |
INVESTMENT INCOME: | | | | |
Dividends (net of foreign taxes of $25,376,047) | | | | |
Unaffiliated issuers | | $ | 719,371,623 | |
Affiliated issuers | | | 222,021,081 | |
Interest | | | 15,647,489 | |
| | | | |
| | | 957,040,193 | |
| | | | |
EXPENSES: | | | | |
Management fees | | | 172,909,232 | |
Custody and fund accounting fees | | | 357,922 | |
Transfer agent fees | | | 1,901,042 | |
Professional services | | | 146,977 | |
Shareholder reports | | | 995,340 | |
Registration fees | | | 263,311 | |
Trustees’ fees | | | 170,833 | |
ADR depositary service fees | | | 4,179,100 | |
Miscellaneous | | | 380,616 | |
| | | | |
| | | 181,304,373 | |
| | | | |
NET INVESTMENT INCOME | | | 775,735,820 | |
| | | | |
REALIZED AND UNREALIZED GAIN: | | | | |
Net realized gain | | | | |
Investments in securities of unaffiliated issuers | | | 1,907,061,878 | |
Investments in securities of affiliated issuers | | | 341,793,439 | |
Futures contracts | | | 245,507,317 | |
Net change in unrealized appreciation/depreciation | | | | |
Investments in securities of unaffiliated issuers | | | 3,776,957,902 | |
Investments in securities of affiliated issuers | | | 1,265,501,366 | |
Futures contracts | | | 15,184,852 | |
| | | | |
Net realized and unrealized gain (loss) | | | 7,552,006,754 | |
| | | | |
NET CHANGE IN NET ASSETS FROM OPERATIONS | | $ | 8,327,742,574 | |
| | | | |
| | | | | | | | |
STATEMENT OF CHANGES IN NET ASSETS (unaudited) | |
| | |
| | | Six Months Ended
June 30, 2019 | | | Year Ended
December 31, 2018 | |
OPERATIONS: | | | | | | | | |
Net investment income | | $ | 775,735,820 | | | $ | 1,006,222,609 | |
Net realized gain (loss) | | | 2,494,362,634 | | | | 6,749,317,514 | |
Net change in unrealized appreciation/depreciation | | | 5,057,644,120 | | | | (12,568,242,564 | ) |
| | | | | | | | |
| | | 8,327,742,574 | | | | (4,812,702,441 | ) |
| | | | | | | | |
| | |
DISTRIBUTIONS TO SHAREHOLDERS: | | | | | | | | |
Total distributions | | | (3,032,980,959 | ) | | | (5,765,113,809 | ) |
| | |
FUND SHARE TRANSACTIONS: | | | | | | | | |
Proceeds from sale of shares | | | 4,855,360,289 | | | | 8,154,979,913 | |
Reinvestment of distributions | | | 2,863,944,145 | | | | 5,469,183,979 | |
Cost of shares redeemed | | | (5,256,148,749 | ) | | | (10,942,582,148 | ) |
| | | | | | | | |
Net change from Fund share transactions | | | 2,463,155,685 | | | | 2,681,581,744 | |
| | | | | | | | |
Total change in net assets | | | 7,757,917,300 | | | | (7,896,234,506 | ) |
| | |
NET ASSETS: | | | | | | | | |
Beginning of period | | | 63,004,692,147 | | | | 70,900,926,653 | |
| | | | | | | | |
End of period | | $ | 70,762,609,447 | | | $ | 63,004,692,147 | |
| | | | | | | | |
| | |
SHARE INFORMATION: | | | | | | | | |
Shares sold | | | 26,151,285 | | | | 40,043,780 | |
Distributions reinvested | | | 15,599,226 | | | | 30,452,377 | |
Shares redeemed | | | (28,128,636 | ) | | | (54,124,818 | ) |
| | | | | | | | |
Net change in shares outstanding | | | 13,621,875 | | | | 16,371,339 | |
| | | | | | | | |
| | |
| PAGE 10§ DODGE & COX STOCK FUND | | See accompanying Notes to Financial Statements |
NOTES TO FINANCIAL STATEMENTS (unaudited)
NOTE 1—ORGANIZATION AND SIGNIFICANT ACCOUNTING POLICIES
Dodge & Cox Stock Fund (the “Fund”) is one of the series constituting the Dodge & Cox Funds (the “Trust” or the “Funds”). The Trust is organized as a Delaware statutory trust and is registered under the Investment Company Act of 1940, as amended, as anopen-end management investment company. The Fund commenced operations on January 4, 1965, and seeks long-term growth of principal and income. Risk considerations and investment strategies of the Fund are discussed in the Fund’s Prospectus.
The Fund is an investment company and follows the accounting and reporting guidance issued in Topic 946 by the Financial Accounting Standards Board. The financial statements have been prepared in conformity with accounting principles generally accepted in the United States of America, which require the use of estimates and assumptions by management. Actual results may differ from those estimates. Significant accounting policies are as follows:
Security valuation The Fund’s net assets are normally valued as of the scheduled close of trading on the New York Stock Exchange (NYSE), generally 4 p.m. Eastern Time, each day that the NYSE is open for business.
Portfolio holdings for which market quotes are readily available are valued at market value. Listed securities, for example, are generally valued using the official quoted close price or the last sale on the exchange that is determined to be the primary market for the security. Exchange-traded derivatives are generally valued at the settlement price determined by the relevant exchange. Short-term securities less than 60 days to maturity may be valued at amortized cost if amortized cost approximates current value. Mutual funds are valued at their respective net asset values. Security values are not discounted based on the size of the Fund’s position and may differ from the value a Fund receives upon sale of the securities. All securities held by the Fund are denominated in U.S. dollars.
If market quotations are not readily available or if normal valuation procedures produce valuations that are deemed unreliable or inappropriate under the circumstances existing at the time, the investment will be valued at fair value as determined in good faith by or under the direction of the Fund’s Board of Trustees. The Board of Trustees has appointed Dodge & Cox, the Fund’s investment manager, to make fair value determinations in accordance with the Dodge & Cox Funds Valuation Policies (“Valuation Policies”), subject to Board oversight. Dodge & Cox has established a Pricing Committee that is comprised of representatives from Treasury, Legal, Compliance, and Operations. The Pricing Committee is responsible for implementing the Valuation Policies, including determining the fair value of securities and other investments when necessary. The Pricing Committee considers relevant indications of value that are reasonably available to it in determining the fair value assigned to a particular security, such as the value of similar financial instruments, trading volumes, contractual restrictions on disposition, related corporate actions, and changes in economic conditions. In doing so, the Pricing Committee employs various
methods for calibrating fair valuation approaches, including a regular review of key inputs and assumptions, back-testing, and review of any related market activity.
Valuing securities through a fair value determination involves greater reliance on judgment than valuation of securities based on readily available market quotations. In some instances, lack of information and uncertainty as to the significance of information may lead to a conclusion that a prior valuation is the best indication of a security’s value. When fair value pricing is employed, the prices of securities used by the Fund to calculate its net asset value may differ from quoted or published prices for the same securities.
Security transactions, investment income, expenses, and distributions Security transactions are recorded on the trade date. Realized gains and losses on securities sold are determined on the basis of identified cost.
Dividend income and corporate action transactions are recorded on theex-dividend date, or when the Fund first learns of the dividend/corporate action if the ex-dividend date has passed.Non-cash dividends, if any, are recorded at the fair market value of the securities received. Dividends characterized as return of capital for U.S. tax purposes are recorded as a reduction of cost of investments and/or realized gain. Interest income is recorded on the accrual basis.
Expenses are recorded on the accrual basis. Some expenses of the Trust can be directly attributed to a specific series. Expenses which cannot be directly attributed are allocated among the Funds in the Trust using methodologies determined by the nature of the expense.
Distributions to shareholders are recorded on theex-dividend date.
Repurchase agreements Repurchase agreements are transactions under which a Fund purchases a security from a dealer counterparty and agrees to resell the security to that counterparty on a specified future date at the same price, plus a specified interest rate. The Fund’s repurchase agreements are secured by U.S. government or agency securities, the fair value of which exceeds the principal amount of the repurchase transaction, including accrued interest, at all times. The Fund maintains custody of the underlying collateral securities, either through its regular custodian or through a third party custodian that maintains separate accounts for both the Fund and its counterparties. In the event of default by a counterparty, the Fund has the contractual right to liquidate the collateral securities and to apply the proceeds in satisfaction of the obligation.
Foreign taxes The Fund may be subject to foreign taxes which may be imposed by certain countries in which the Fund invests. The Fund endeavors to record foreign taxes based on applicable foreign tax law. Withholding taxes are incurred on certain foreign dividends and are accrued at the time the associated dividend is recorded. The Fund files withholding tax reclaims in certain jurisdictions to recover a portion of amounts previously withheld. The Fund records a reclaim receivable based on, among other things, a jurisdiction’s legal obligation to pay reclaims as well as payment history and
DODGE & COX STOCK FUND§PAGE 11
NOTES TO FINANCIAL STATEMENTS(unaudited)
market convention. In consideration of recent decisions rendered by European courts, the Fund has filed for additional reclaims related to prior years. A corresponding receivable is established when both the amount is known and significant contingencies or uncertainties regarding collectability are removed. These amounts, if any, are reported in “dividends and interest receivable” in the Statement of Assets and Liabilities.
Futures contracts Futures contracts involve an obligation to purchase or sell (depending on whether the Fund has entered a long or short futures contract, respectively) an asset at a future date, at a price set at the time of the contract. Upon entering into a futures contract, the Fund is required to deposit an amount of cash or liquid assets (referred to as initial margin) in a segregated account with the clearing broker. Subsequent payments (referred to as variation margin) to and from the clearing broker are made on a daily basis based on changes in the market value of futures contracts. Futures contracts are traded publicly and their market value changes daily. Changes in the market value of open futures contracts are recorded as unrealized appreciation or depreciation in the Statement of Operations. Realized gains and losses on futures contracts are recorded in the Statement of Operations at the closing or expiration of the contracts. Cash deposited with a broker as initial margin is recorded in the Statement of Assets and Liabilities. A receivable and/or payable to brokers for daily variation margin is also recorded in the Statement of Assets and Liabilities.
Investments in futures contracts may include certain risks, which may be different from, and potentially greater than, those of the underlying securities. To the extent the Fund uses futures, it is exposed to additional volatility and potential losses resulting from leverage.
The Fund entered into long S&P 500 futures contracts to provide equity exposure that approximates the Fund’s “net cash and other” position, which includes cash, short-term investments, receivables, and payables. During the six months ended June 30, 2019, these S&P 500 futures contracts had notional values up to 4% of net assets.
Indemnification Under the Trust’s organizational documents, its officers and trustees are indemnified against certain liabilities arising out of the performance of their duties to the Trust. In addition, in the normal course of business the Trust enters into contracts that provide general indemnities to other parties. The Trust’s maximum exposure under these arrangements is unknown as this would involve future claims that may be made against the Trust that have not yet occurred.
NOTE 2—VALUATION MEASUREMENTS
Various inputs are used in determining the value of the Fund’s investments. These inputs are summarized in the three broad levels listed below.
| § | | Level 1: Quoted prices in active markets for identical securities |
| § | | Level 2: Other significant observable inputs (including quoted prices for similar securities, market indices, interest rates, credit risk, forward exchange rates, etc.) |
| § | | Level 3: Significant unobservable inputs (including Fund management’s assumptions in determining the fair value of investments) |
The inputs or methodology used for valuing securities are not necessarily an indication of the risk associated with investing in those securities.
The following is a summary of the inputs used to value the Fund’s holdings at June 30, 2019:
| | | | | | | | |
| Classification | | LEVEL 1
(Quoted Prices) | | | LEVEL 2
(Other Significant
Observable Inputs) | |
Securities | | | | | | | | |
Common Stocks(a) | | $ | 69,058,696,257 | | | $ | — | |
Short-term Investments | | | | | | | | |
Repurchase Agreements | | | — | | | | 1,188,428,000 | |
Money Market Fund | | | 281,104,287 | | | | — | |
| | | | | | | | |
Total | | $ | 69,339,800,544 | | | $ | 1,188,428,000 | |
| | | | | | | | |
| | |
Other Investments | | | | | | | | |
Futures Contracts | | | | | | | | |
Appreciation | | $ | 16,691,793 | | | $ | — | |
| | | | | | | | | |
| (a) | All common stocks held in the Fund are Level 1 securities. For a detailed break-out of common stocks by major industry classification, please refer to the Portfolio of Investments. |
NOTE 3—RELATED PARTY TRANSACTIONS
Management fees Under a written agreement approved by a unanimous vote of the Board of Trustees, the Fund pays a management fee monthly at an annual rate of 0.50% of the Fund’s average daily net assets to Dodge & Cox, investment manager of the Fund. The agreement further provides that Dodge & Cox shall waive its fee to the extent that such fee plus all other ordinary operating expenses of the Fund exceed 0.75% of the average daily net assets for the year.
Fund officers and trustees All officers and two of the trustees of the Trust are officers or employees of Dodge & Cox. The Trust pays a fee only to those trustees who are not affiliated with Dodge & Cox.
NOTE 4—INCOME TAX INFORMATION AND DISTRIBUTIONS TO SHAREHOLDERS
A provision for federal income taxes is not required since the Fund intends to continue to qualify as a regulated investment company under Subchapter M of the Internal Revenue Code and distribute all of its taxable income to shareholders. Distributions are determined in accordance with income tax regulations, and such amounts may differ from net investment income and realized gains for financial reporting purposes. The Fund may also designate a portion of the amount paid to redeeming shareholders as a distribution for tax purposes. Financial reporting records are adjusted for permanent book to tax differences at year end to reflect tax character. Book to tax differences are primarily due to differing treatments of redemptions in-kind, wash sales, net short-term realized gain (loss), certain corporate action transactions, derivatives, and distributions.
PAGE 12§ DODGE & COX STOCK FUND
NOTES TO FINANCIAL STATEMENTS(unaudited)
Distributions during the periods noted below were characterized as follows for federal income tax purposes:
| | | | | | | | |
| | | Six Months Ended
June 30, 2019 | | | Year Ended
December 31, 2018 | |
Ordinary income | | $ | 857,139,473 | | | $ | 1,021,848,439 | |
| | | ($2.306 per share | ) | | | ($2.947 per share | ) |
Long-term capital gain | | $ | 2,175,841,486 | | | $ | 4,743,265,370 | |
| | | ($5.929 per share | ) | | | ($13.793 per share | ) |
The components of distributable earnings on a tax basis are reported as of the Fund’s most recent year end. At December 31, 2018, the tax basis components of distributable earnings were as follows:
| | | | |
Undistributed ordinary income | | $ | 91,321,645 | |
Undistributed long-term capital gain | | | 2,175,559,439 | |
At June 30, 2019, unrealized appreciation and depreciation for investments and derivatives based on cost for federal income tax purposes were as follows:
| | | | |
Tax cost | | $ | 51,622,194,985 | |
| | | | |
Unrealized appreciation | | | 22,221,226,056 | |
Unrealized depreciation | | | (3,298,500,704 | ) |
| | | | |
Net unrealized appreciation | | | 18,922,725,352 | |
| | | | | |
Fund management has reviewed the tax positions for open periods (three years and four years, respectively, from filing the Fund’s Federal and State tax returns) as applicable to the Fund, and has determined that no provision for income tax is required in the Fund’s financial statements.
NOTE 5—REDEMPTIONS IN-KIND
During the six months ended June 30, 2019, the Fund distributed securities and cash as payment for a redemption of Fund shares. For financial reporting purposes, the Fund realized a net gain of $69,902,483 attributable to the redemption in-kind: $63,172,477 from unaffiliated issuers and $6,730,006 from affiliated issuers. For tax purposes, no capital gain on the redemption in-kind was recognized.
NOTE 6—LOAN FACILITIES
Pursuant to an exemptive order issued by the Securities and Exchange Commission (SEC), the Fund may participate in an interfund lending facility (Facility). The Facility allows the Fund to borrow money from or loan money to the Funds. Loans under the Facility are made for temporary or emergency purposes, such as to fund shareholder redemption requests. Interest on borrowings is the average of the current repurchase agreement rate and the bank loan rate. There was no activity in the Facility during the period.
All Funds in the Trust participate in a $500 million committed credit facility (Line of Credit) with State Street Bank and Trust Company, to be utilized for temporary or emergency purposes to fund shareholder redemptions or for other short-term liquidity purposes. The maximum amount available to the Fund is $250 million. Each
Fund pays an annual commitment fee on itspro-rata portion of the Line of Credit. For the six months ended June 30, 2019, the Fund’s commitment fee amounted to $212,619 and is reflected as a Miscellaneous Expense in the Statement of Operations. Interest on borrowings is charged at the prevailing rate. There were no borrowings on the Line of Credit during the period.
NOTE 7—PURCHASES AND SALES OF INVESTMENTS
For the six months ended June 30, 2019, purchases and sales of securities, other than short-term securities, aggregated $7,576,734,723 and $6,203,312,654, respectively.
NOTE 8—SUBSEQUENT EVENTS
Fund management has determined that no material events or transactions occurred subsequent to June 30, 2019, and through the date of the Fund’s financial statements issuance, which require additional disclosure in the Fund’s financial statements.
DODGE & COX STOCK FUND§PAGE 13
NOTES TO FINANCIAL STATEMENTS(unaudited)
NOTE 9—HOLDINGS OF 5% VOTING SECURITIES
Each of the companies listed below was considered to be an affiliate of the Fund because the Fund owned 5% or more of the company’s voting securities during all or part of the six months ended June 30, 2019. Transactions during the period in these securities were as follows:
| | | | | | | | | | | | | | | | | | | | | | | | | | | | | | | | |
| | | Shares at
Beginning of Period | | | Additions | | | Reductions | | | Shares at
End of Period | | | Dividend
Income(a) | | | Realized
Gain (Loss) | | | Net Change in
Unrealized
Appreciation
(Depreciation) | | | Value at End of Period | |
COMMON STOCKS: 16.4% | | | | | | | | | | | | | | | | | | | | | | | | | | | | | | | | |
COMMUNICATION SERVICES: 0.7% | | | | | | | | | | | | | | | | | | | | | | | | | | | | | |
Zayo Group Holdings, Inc.(b) | | | 16,027,500 | | | | — | | | | (32,600 | ) | | | 15,994,900 | | | $ | — | | | $ | (145,386 | ) | | $ | 161,307,916 | | | $ | 526,392,159 | |
| | | | | | | |
CONSUMER DISCRETIONARY: 1.0% | | | | | | | | | | | | | | | | | | | | | | | | | | | | | |
Mattel, Inc.(b) | | | 20,504,501 | | | | 3,000,000 | | | | (356,196 | ) | | | 23,148,305 | | | | — | | | | (342,397 | ) | | | 24,255,693 | | | | 259,492,499 | |
Qurate Retail, Inc., Series A(b) | | | 32,289,076 | | | | 4,500,000 | | | | (65,600 | ) | | | 36,723,476 | | | | — | | | | 1,286,181 | | | | (244,408,793 | ) | | | 455,003,868 | |
| | | | | | | | | | | | | | | | | | | | | | | | | | | | | | | | |
| | | | | | | | | | | | | | | | | | | | | | | | | | | | | | | 714,496,367 | |
| | | | | | | | | | | | | | | | | | | | | | | | | | | | | | | | |
| | | | | | | |
ENERGY: 2.6% | | | | | | | | | | | | | | | | | | | | | | | | | | | | | |
Anadarko Petroleum Corp. | | | 26,957,621 | | | | 1,075,000 | | | | (15,612,479 | ) | | | 12,420,142 | | | | 15,393,943 | | | | 268,827,112 | | | | 472,828,442 | | | | 876,365,220 | |
Apache Corp. | | | 31,484,032 | | | | 1,116,977 | | | | (66,200 | ) | | | 32,534,809 | | | | 16,283,955 | | | | 574,351 | | | | 87,510,226 | | | | 942,533,417 | |
| | | | | | | | | | | | | | | | | | | | | | | | | | | | | | | | |
| | | | | | | | | | | | | | | | | | | | | | | | | | | | | | | 1,818,898,637 | |
| | | | | | | | | | | | | | | | | | | | | | | | | | | | | | | | |
| | | | | | | |
FINANCIALS: 3.6% | | | | | | | | | | | | | | | | | | | | | | | | | | | | | |
Brighthouse Financial, Inc.(b) | | | 6,699,363 | | | | — | | | | (13,600 | ) | | | 6,685,763 | | | | — | | | | 82,225 | | | | 41,612,484 | | | | 245,300,645 | |
Capital One Financial Corp. | | | 22,661,213 | | | | 2,770,000 | | | | (51,100 | ) | | | 25,380,113 | | | | 20,124,530 | | | | 2,967,578 | | | | 368,249,108 | | | | 2,302,991,454 | |
| | | | | | | | | | | | | | | | | | | | | | | | | | | | | | | | |
| | | | | | | | | | | | | | | | | | | | | | | | | | | | | | | 2,548,292,099 | |
| | | | | | | | | | | | | | | | | | | | | | | | | | | | | | | | |
| | | | | | | |
INDUSTRIALS: 3.2% | | | | | | | | | | | | | | | | | | | | | | | | | | | | | |
FedEx Corp. | | | 9,663,999 | | | | 3,995,000 | | | | (22,900 | ) | | | 13,636,099 | | | | 16,267,679 | | | | 3,275,783 | | | | (33,206,208 | ) | | | 2,238,911,095 | |
| | | | | | | |
INFORMATION TECHNOLOGY: 5.3% | | | | | | | | | | | | | | | | | | | | | | | | | | | | | |
Hewlett Packard Enterprise Co. | | | 84,295,793 | | | | 1,000,000 | | | | (10,068,548 | ) | | | 75,227,245 | | | | 17,815,414 | | | | 64,065,639 | | | | 99,149,713 | | | | 1,124,647,313 | |
Juniper Networks, Inc. | | | 25,633,165 | | | | 4,300,000 | | | | (54,100 | ) | | | 29,879,065 | | | | 10,651,045 | | | | 312,179 | | | | (6,146,009 | ) | | | 795,679,501 | |
Microchip Technology, Inc. | | | 11,350,233 | | | | 4,350,000 | | | | (223,100 | ) | | | 15,477,133 | | | | 8,681,297 | | | | 335,658 | | | | 186,359,752 | | | | 1,341,867,431 | |
Micro Focus International PLC ADR(c) | | | 19,910,713 | | | | — | | | | (40,485 | ) | | | 19,870,228 | | | | 116,803,218 | | | | 554,516 | | | | 107,989,042 | | | | 520,401,271 | |
| | | | | | | | | | | | | | | | | | | | | | | | | | | | | | | | |
| | | | | | | | | | | | | | | | | | | | | | | | | | | | | | | 3,782,595,516 | |
| | | | | | | | | | | | | | | | | | | | | | | | | | | | | | | | |
| | | | | | | | | | | | | | | | | | $ | 222,021,081 | | | $ | 341,793,439 | | | $ | 1,265,501,366 | | | $ | 11,629,585,873 | |
| | | | | | | | | | | | | | | | | | | | | | | | | | | | | | | | |
| | | | | | | | | | | | | | | | | | | | | | | | | | | | | | | | | |
| (a) | Net of foreign taxes, if any |
| (c) | Shares reflect a reverse stock split on April 30, 2019 |
FINANCIAL HIGHLIGHTS(unaudited)
| | | | | | | | | | | | | | | | | | | | | | | | |
SELECTED DATA AND RATIOS
(for a share outstanding throughout each period) | | Six Months
Ended June 30, | | | Year Ended December 31, | |
| | | 2019 | | | 2018 | | | 2017 | | | 2016 | | | 2015 | | | 2014 | |
| | | | | | | | |
Net asset value, beginning of period | | | $172.81 | | | | $203.61 | | | | $184.30 | | | | $162.77 | | | | $180.94 | | | | $168.87 | |
Income from investment operations: | | | | | | | | | | | | | | | | | | | | | | | | |
Net investment income | | | 2.08 | | | | 2.90 | | | | 3.09 | | | | 3.05 | | | | 2.42 | | | | 2.83 | |
Net realized and unrealized gain (loss) | | | 20.45 | | | | (16.96 | ) | | | 30.03 | | | | 30.56 | | | | (10.55 | ) | | | 14.60 | |
| | | | | | | | |
Total from investment operations | | | 22.53 | | | | (14.06 | ) | | | 33.12 | | | | 33.61 | | | | (8.13 | ) | | | 17.43 | |
| | | | | | | | |
Distributions to shareholders from: | | | | | | | | | | | | | | | | | | | | | | | | |
Net investment income | | | (2.08 | ) | | | (2.90 | ) | | | (3.11 | ) | | | (3.03 | ) | | | (2.46 | ) | | | (2.80 | ) |
Net realized gain | | | (6.16 | ) | | | (13.84 | ) | | | (10.70 | ) | | | (9.05 | ) | | | (7.58 | ) | | | (2.56 | ) |
| | | | | | | | |
Total distributions | | | (8.24 | ) | | | (16.74 | ) | | | (13.81 | ) | | | (12.08 | ) | | | (10.04 | ) | | | (5.36 | ) |
| | | | | | | | |
Net asset value, end of period | | | $187.10 | | | | $172.81 | | | | $203.61 | | | | $184.30 | | | | $162.77 | | | | $180.94 | |
| | | | | | | | |
Total return | | | 13.14 | % | | | (7.08 | )% | | | 18.32 | % | | | 21.27 | % | | | (4.47 | )% | | | 10.43 | % |
Ratios/ supplemental data: | | | | | | | | | | | | | | | | | | | | | | | | |
Net assets, end of period (millions) | | | $70,763 | | | | $63,005 | | | | $70,901 | | | | $61,600 | | | | $54,845 | | | | $60,260 | |
Ratios of expenses to average net assets | | | 0.52 | %(a) | | | 0.52 | % | | | 0.52 | % | | | 0.52 | % | | | 0.52 | % | | | 0.52 | % |
Ratios of net investment income to average net assets | | | 2.24 | %(a) | | | 1.41 | % | | | 1.58 | % | | | 1.83 | % | | | 1.36 | % | | | 1.62 | % |
Portfolio turnover rate | | | 9 | % | | | 20 | % | | | 13 | % | | | 16 | % | | | 15 | % | | | 17 | % |
See accompanying Notes to Financial Statements
PAGE 14§ DODGE & COX STOCK FUND
FUND HOLDINGS
The Fund provides a complete list of its holdings on a quarterly basis by filing the lists with the SEC on Form N-CSR (as of the end of the second and fourth quarters) and on Part F of FormN-PORT (as of the end of the first and third quarters). Shareholders may view the Fund’s Form N-CSR and Part F of Form N-PORT on the SEC’s website at sec.gov. A list of the Fund’s quarter-end holdings is also available at dodgeandcox.com on or about the 15th day following each quarter end and remains available on the website until the list is updated for the subsequent quarter.
PROXY VOTING
For a free copy of the Fund’s proxy voting policies and procedures, please call 800-621-3979, visit the Fund’s website at dodgeandcox.com, or visit the SEC’s website at sec.gov. Information regarding how the Fund voted proxies relating to portfolio securities during the most recent 12-month period ending June 30 is also available at dodgeandcox.com or at sec.gov.
HOUSEHOLD MAILINGS
The Fund routinely mails shareholder reports and summary prospectuses to shareholders and, on occasion, proxy statements. In order to reduce the volume of mail, when possible, only one copy of these documents will be sent to shareholders who are part of the same family and share the same residential address.
If you have a direct account with the Funds and you do not want the mailing of shareholder reports and summary prospectuses combined with other members in your household, contact the Funds at 800-621-3979. Your request will be implemented within 30 days.
DODGE & COX STOCK FUND§PAGE 15
dodgeandcox.com
For Fund literature, transactions, and account
information, please visit the Funds’ website.
or write or call:
DODGE & COX FUNDS
c/o DST Asset Manager Solutions, Inc.
P.O. Box 219502
Kansas City, Missouri 64121-9502
(800) 621-3979
INVESTMENT MANAGER
Dodge & Cox
555 California Street, 40th Floor
San Francisco, California 94104
(415) 981-1710
This report is submitted for the general information of the shareholders of the Fund. The report is not authorized for distribution to prospective investors in the Fund unless it is accompanied by a current prospectus.
This report reflects our views, opinions, and portfolio holdings as of June 30, 2019, the end of the reporting period. Any such views are subject to change at any time based upon market or other conditions and Dodge & Cox disclaims any responsibility to update such views. These views may not be relied on as investment advice and, because investment decisions for a Dodge & Cox Fund are based on numerous factors, may not be relied on as an indication of trading intent on behalf of any Dodge & Cox Fund.

DODGE & COX FUNDS®
Semi-Annual Report
June 30, 2019
Global Stock Fund
ESTABLISHED 2008
TICKER: DODWX
Important Notice:
Beginning on January 1, 2021, we intend to discontinue mailing paper copies of the Fund’s shareholder reports as permitted by new regulations adopted by the Securities and Exchange Commission, unless you specifically request paper copies from Dodge & Cox Funds or from your financial intermediary, such as a broker-dealer or bank. The reports will remain available to you on the Dodge & Cox Funds website (dodgeandcox.com), and you will be notified by mail each time a report is posted and provided with a link to access the report.
If you have already elected to receive shareholder reports electronically, you will not be affected by this change and do not need to take any action. If you have not done so already, you may elect to receive shareholder reports and other communications electronically by enrolling ine-delivery on the Funds website, or, if you are invested through a financial intermediary, by updating your mailing preferences through the intermediary.
If you wish to continue receiving paper copies of all future shareholder reports, please contact us at (800)621-3979. Reports will be provided to you free of charge. If you are invested through a financial intermediary, you may contact your financial intermediary to request to receive paper copies. Your election to receive reports in paper form will apply to all funds held with Dodge & Cox Funds or through your financial intermediary, as applicable.
6/19 GSF SAR  Printed on recycled paper
TO OUR SHAREHOLDERS
The Dodge & Cox Global Stock Fund had a total return of 12.2% for the six months ended June 30, 2019, compared to a return of 17.0% for the MSCI World Index.
MARKET COMMENTARY
After declining in the fourth quarter of 2018, global equity markets rebounded strongly through the first half of 2019, taking the S&P 500 Index, MSCI EAFE Index, and MSCI Emerging Markets Index back to levels seen in the third quarter of last year. Every developed market and most emerging market countries posted positive equity returns. As debates about trade wars, global economic growth, and the durability of low interest rates continue, so do two ongoing market themes that have persisted over the last decade. First, will U.S. equities continue to outperform international equities; and second, will growth stocks continue to outperform value stocks.(a)
A COMPELLING STARTING POINT
Over the past 10 years, the U.S. equity market’s annualized total return was more than double that of international developed markets: the S&P 500 returned an average of 14.7% per annum compared to 6.9% for the MSCI EAFE.
While earnings growth has been higher in the United States over the past decade, the current valuation spread between the U.S. and international equity markets is now near a15-year high. The MSCI EAFE is trading at an attractive valuation of 13.5 times forward earnings, versus the S&P 500 at 17.3 times.(b)
Accordingly, the Fund’s portfolio is tilted toward international stocks and trades at a compelling 11.8 times forward earnings. History has demonstrated that starting valuations are significant drivers of long-term equity returns and lower starting valuations tend to produce more attractive long-term results. In addition, many of the Fund’s holdings have the potential to improve profitability and return meaningful amounts of capital to shareholders through dividends and share buybacks. We believe this combination provides a strong foundation for long-term returns.
AN OPPORTUNE TIME TO BE INVESTED IN VALUE STOCKS
The underperformance of value stocks has been another prominent global market trend. Over the past decade, the MSCI World Growth Index has outpaced the MSCI World Value Index by 76 percentage points, largely because of a valuation decline for the MSCI World Value. Earnings growth and dividend yield were actually higher for the value index.(c)
The valuation differential between value- and growth-oriented stocks remains wide by historical standards. Growth stocks are relatively expensive: 20.8 times forward earnings for MSCI World Growth versus 12.4 times for MSCI World Value. This valuation gap should narrow as market prices move to more closely reflect our assessment of fundamental value. Historically, many value stocks have tended to outperform when they are particularly inexpensive, as they are today.
In addition, interest rates around the world are low by historical standards, and there is an overwhelming expectation in the market that they will remain “lower for longer.” We believe current valuations may already reflect most of these beliefs about rates. The future market “surprise” may be interest rate increases from today’s low levels, and we think there is a strong likelihood this will happen over the long term. Any increase in interest rates should create meaningful upside for many value stocks, especially in the Financials sector.
We have conviction in our value-oriented, active investment approach and continue to believe now is an opportune time to be invested in value stocks. Importantly, the Fund remains overweight in sectors poised to benefit from a rebound in value stocks, notably Financials and Energy.
Financials
Investors have steeply discounted companies with greater macro sensitivity and higher stock price volatility, and the Financials sector embodies investors’ concerns about the macro picture (e.g., low interest rates, low global growth). Financials, the largest component of the value universe, comprised 24.6% of the MSCI World Value and 15.8% of the MSCI World, and constituted 29.1% of the Fund on June 30.
European & UK Financials
Over half of the Fund’s Financials exposure is invested in Europe and the United Kingdom.(d) The Fund’s European Financials have been a large detractor from performance for several years, mostly due to valuation compression; however, earnings have improved in aggregate. Our global industry analysts have retested our views by incorporating input from our macro research team, learnings from industry conferences, and insights from meetings with senior management teams of these companies, competitors, regulators, central bankers, and policymakers. Based on this work, we continue to believe the Fund’s European Financials investments represent some of the best long-term opportunities currently available in the market.
These companies are more resilient today than they were in previous periods of economic stress when valuations were at similar levels. They have greatly improved their underlying fundamentals by strengthening their balance sheets and increasing capital ratios, while pursuing initiatives to improve profitability. Hence, on abottom-up basis, we recently added to the Fund’s positions in BNP Paribas, Credit Suisse Group, Societe Generale, and UniCredit.(e) While our baseline expectation is for a prolonged period of low growth and low interest rates in Europe, any improvement in the macroeconomic backdrop, notably higher interest rates, could drive further upside.
Credit Suisse—a 1.5% position in the Fund—is a leading global wealth manager with attractive growth opportunities serving ultra-high net worth clients. The company recently completed a four-year restructuring program, which resulted in significant asset disposals, cost cuts, and balance sheet recapitalization. Significant litigation liabilities are largely behind
PAGE 2§ DODGE & COX GLOBAL STOCK FUND
the company. Today, Credit Suisse is increasingly generating and distributing capital through dividends and share buybacks. Yet, the company trades at less than nine times forward earnings, and we believe that over a longer-term horizon the company should be able to grow at attractive rates.
U.S. Financials
In the United States, financial services companies are trading near historically low valuations relative to the overall market. Banks, for example, are trading at 57% of the S&P 500 forwardprice-to-earnings multiple, the lowest relative level since the dotcom bubble in 1999. Why are bank stocks so inexpensive? Since September 2018, U.S. Treasury yields have declined by 100 basis points,(f) as have market expectations for the federal funds rate through 2020. For most banks, lower rates have a negative impact on earnings, but we believe this issue has been fully priced into current valuations.
Despite low valuations, company fundamentals have been resilient. The Fund’s U.S. bank holdings that were subjected to the Federal Reserve’s 2019 stress-testing process have received approval to return a weighted average of 10% of their market cap in dividends and buybacks in 2020. This total yield compares favorably with the broad market and notably income-oriented equities, such as in the Real Estate (e.g., Investment Trusts) and Utilities sectors. Banks’ capital levels are near historical highs, as are aggregate banking sector profits. In recent years, banks’ earnings growth has outpaced the broad market. We expect banks to offset the effects of lower interest rates through volume growth, cost controls, and share buybacks. Going forward, we are particularly constructive on the Fund’s national retail bank holdings—Bank of America and Wells Fargo—that are increasingly using their scale, advantages in technology, and marketing expertise to drive outsized deposit growth and profitability.
Energy
Energy is another significant component of the MSCI World Value. While the short-term direction of oil prices is difficult to forecast, the long-term fundamentals of supply and demand are constructive. We believe global demand will continue to grow at roughly 1% per year, or around 1.0 to 1.5 million additional barrels per day. From a supply perspective, U.S. shale oil growth is currently robust, but the rate of growth should taper as U.S. shale producers shift their priority from growing production to generating free cash flow. The rest of the industry will need to reinvest at higher rates to counteract the natural decline from existing fields and to meet new demand growth. It is likely that world oil prices at or above current levels will be needed to incentivize that higher level of investment.
When evaluating energy stocks, we look for companies with assets that are on the low end of the global cost curve, management teams that have deployed capital prudently through the cycle, andlow-to-reasonable valuations. We continue to find long-term opportunities in selected upstream and oilfield services companies with these characteristics. On abottom-up basis, we recently added to the portfolio’s energy holdings, notably
Occidental Petroleum following its agreement to acquire Anadarko Petroleum, which is also held in the Fund.
In June, one of our global industry analysts met with Occidental’s management team at their headquarters in Houston, Texas to conduct due diligence on the company’s pending acquisition. While there are concerns about integration risk and the high cost of financing, we believe Occidental’s risk-reward profile is compelling due to its attractive valuation, strong operational capabilities, and diversified, free-cash-flow generative upstream portfolio that is supplemented by its midstream and chemicals businesses. From our previous research on Anadarko, we know that Anadarko’s asset portfolio has been meaningfully streamlined in recent years and the remaining assets are world class with large reserves and low break-even oil prices. In addition, Occidental aims to achieve $2 billion in cost synergies, and we believe there is a high probability these savings will be realized long term. On June 30, Occidental and Anadarko were 2.0% and 0.9% positions, respectively, in the Fund.
IN CLOSING
During a challenging decade for value investors, the Fund has outperformed the global value investment universe by 52 percentage points.(g) We are optimistic about the long-term outlook for the Fund, which remains tilted towards international stocks and sectors poised to benefit from a rebound in value stocks, such as Financials and Energy. As share prices and currencies can be volatile in the short term, we encourage shareholders to remain focused on the long term.
Thank you for your continued confidence in our firm. As always, we welcome your comments and questions.
For the Board of Trustees,
| | |
 | |  |
Charles F. Pohl, Chairman | | Dana M. Emery, President |
July 31, 2019
| (a) | | Value stocks are the lower valuation portion of the equity market and growth stocks are the higher valuation portion. |
| (b) | | Unless otherwise specified, all weightings and characteristics are as of June 30, 2019. |
| (c) | | The MSCI World Growth Index had a total return of 216.4% compared to 140.6% for the MSCI World Value Index from June 30, 2009 through June 30, 2019. |
| (d) | | On June 30, Financials accounted for 29.1% and European Financials represented 15.2% of the Fund’s net assets. |
| (e) | | The use of specific examples does not imply that they are more or less attractive investments than the portfolio’s other holdings. |
| (f) | | One basis point is equal to 1/100th of 1%. |
| (g) | | The Dodge & Cox Global Stock Fund had a cumulative total return of 192.5% compared to 140.6% for the MSCI World Value Index from June 30, 2009 through June 30, 2019. |
DODGE & COX GLOBAL STOCK FUND§PAGE 3
YEAR-TO-DATE PERFORMANCE REVIEW
The Fund underperformed the MSCI World by 4.7 percentage points year to date.
Key Detractors from Relative Results
| | § | | The Fund’s average overweight position in the Financials sector (31% versus 16% for the MSCI World sector), combined with weak relative returns (up 10% compared to up 15%), hurt results. Societe Generale (down 15%) was a detractor. | |
| | § | | Relative returns in the Health Care sector (up 6% compared to up 10% for the MSCI World sector), combined with an average overweight position (17% versus 13%), had a negative impact. Bristol-Myers Squibb (down 11%) and Sanofi (up 3%) detracted from results. | |
| | § | | Other detractors include Qurate Retail (down 37%), Grupo Televisa (down 32%), Baidu (down 25%), Occidental Petroleum (down 16%), and FedEx (up 3%). | |
Key Contributors to Relative Results
| | § | | Strong returns in the Consumer Staples sector (up 22% compared to up 15% for the MSCI World sector), combined with the Fund’s average underweight position (1% versus 9%), had a positive impact. | |
| | § | | Relative returns in the Energy sector (up 17% compared to up 13% for the MSCI World sector) also helped performance, especially Anadarko Petroleum (up 64%). | |
| | § | | Additional contributors included Micro Focus International (up 53%), JD.com (up 45%), Zayo Group Holdings (up 44%), Johnson Controls International (up 41%), and Charter Communications (up 39%). | |
KEY CHARACTERISTICS OF DODGE & COX
Independent Organization
Dodge & Cox is one of the largest privately owned investment managers in the world. We remain committed to independence, with a goal of providing the highest quality investment management service to our existing clients.
Over 85 Years of Investment Experience
Dodge & Cox was founded in 1930. We have a stable and well-qualified team of investment professionals, most of whom have spent their entire careers at Dodge & Cox.
Experienced Investment Team
The Global Equity Investment Committee, which is the decision-making body for the Global Stock Fund, is a seven-member committee with an average tenure at Dodge & Cox of 25 years.
One Business with a Single Research Office
Dodge & Cox manages equity (domestic, international, and global), fixed income (domestic and global), and balanced investments, operating from one office in San Francisco.
Consistent Investment Approach
Our team decision-making process involves thorough, bottom-up fundamental analysis of each investment.
Long-Term Focus and Low Expenses
We invest with a three- to five-year investment horizon, which has historically resulted in low turnover relative to our peers. We manage Funds that maintain low expense ratios.
Risks: The Fund is subject to market risk, meaning holdings in the Fund may decline in value for extended periods due to the financial prospects of individual companies, or due to general market and economic conditions. Investing in non-U.S. securities may entail risk due to foreign economic and political developments; this risk may be increased when investing in emerging markets. The Fund is also subject to currency risk. Please read the prospectus and summary prospectus for specific details regarding the Fund’s risk profile.
PAGE 4§ DODGE & COX GLOBAL STOCK FUND
GROWTH OF $10,000 OVER 10 YEARS
FOR AN INVESTMENT MADE ON JUNE 30, 2009
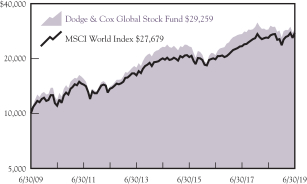
AVERAGE ANNUAL TOTAL RETURN
FOR PERIODS ENDED JUNE 30, 2019
| | | | | | | | | | | | | | | | |
| | | 1 Year | | | 3 Years | | | 5 Years | | | 10 Years | |
Dodge & Cox Global Stock Fund | | | 1.49 | % | | | 11.91 | % | | | 4.76 | % | | | 11.33 | % |
MSCI World Index | | | 6.33 | | | | 11.77 | | | | 6.60 | | | | 10.72 | |
Returns represent past performance and do not guarantee future results. Investment return and share price will fluctuate with market conditions, and investors may have a gain or loss when shares are sold. Fund performance changes over time and currently may be significantly lower than stated. Performance is updated and published monthly. Visit the Fund’s website at dodgeandcox.com or call800-621-3979 for current performance figures.
The Fund’s total returns include the reinvestment of dividend and capital gain distributions, but have not been adjusted for any income taxes payable by shareholders on these distributions or on Fund share redemptions. Index returns include dividends but, unlike Fund returns, do not reflect fees or expenses. The MSCI World Index is a broad-based, unmanaged equity market index aggregated from 23 developed market country indices, including the United States. MSCI makes no express or implied warranties or representations and shall have no liability whatsoever with respect to any MSCI data contained herein. The MSCI data may not be further redistributed or used as a basis for other indices or any securities or financial products. This report is not approved, reviewed, or produced by MSCI.
MSCI World is a service mark of MSCI Barra.
FUND EXPENSE EXAMPLE
As a Fund shareholder, you incur ongoing Fund costs, including management fees and other Fund expenses. All mutual funds have ongoing costs, sometimes referred to as operating expenses. The following example shows ongoing costs of investing in the Fund and can help you understand these costs and compare them with those of other mutual funds. The example assumes a $1,000 investment held for the six months indicated.
ACTUAL EXPENSES
The first line of the table below provides information about actual account values and expenses based on the Fund’s actual returns. You may use the information in this line, together with your account balance, to estimate the expenses that you paid over the period. Simply divide your account value by $1,000 (for example, an $8,600 account value divided by $1,000 = 8.6), then multiply the result by the number in the first line under the heading “Expenses Paid During Period” to estimate the expenses you paid on your account during this period.
HYPOTHETICAL EXAMPLE FOR COMPARISON WITH OTHER MUTUAL FUNDS
Information on the second line of the table can help you compare ongoing costs of investing in the Fund with those of other mutual funds. This information may not be used to estimate the actual ending account balance or expenses you paid during the period. The hypothetical “Ending Account Value” is based on the actual expense ratio of the Fund and an assumed 5% annual rate of return before expenses (not the Fund’s actual return). The amount under the heading “Expenses Paid During Period” shows the hypothetical expenses your account would have incurred under this scenario. You can compare this figure with the 5% hypothetical examples that appear in shareholder reports of other mutual funds.
| | | | | | | | | | | | |
Six Months Ended June 30, 2019 | | Beginning Account Value
1/1/2019 | | | Ending Account Value
6/30/2019 | | | Expenses Paid During Period* | |
Based on Actual Fund Return | | $ | 1,000.00 | | | $ | 1,122.40 | | | $ | 3.28 | |
Based on Hypothetical 5% Yearly Return | | | 1,000.00 | | | | 1,021.70 | | | | 3.13 | |
| * | | Expenses are equal to the Fund’s annualized expense ratio of 0.62%, multiplied by the average account value over the period, multiplied by 181/365 (to reflect the one-half year period). |
The expenses shown in the table highlight ongoing costs only and do not reflect any transactional fees or account maintenance fees. Though other mutual funds may charge such fees, please note that the Fund does not charge transaction fees (e.g., redemption fees, sales loads) or universal account maintenance fees (e.g., small account fees).
DODGE & COX GLOBAL STOCK FUND§PAGE 5
| | | | |
| FUND INFORMATION (unaudited) | | | June 30, 2019 | |
| | | | |
| GENERAL INFORMATION | | | |
Net Asset Value Per Share | | | $12.38 | |
Total Net Assets (billions) | | | $9.7 | |
Expense Ratio | | | 0.62% | |
Portfolio Turnover Rate (1/1/19 to 6/30/19, unannualized) | | | 12% | |
30-Day SEC Yield(a) | | | 1.93% | |
Active Share(b) | | | 88% | |
Number of Companies | | | 85 | |
Fund Inception | | | 2008 | |
No sales charges or distribution fees | | | | |
Investment Manager:Dodge & Cox, San Francisco. Managed by the Global Equity Investment Committee, whose seven members’ average tenure at Dodge & Cox is 25 years.
| | | | | | | | |
| PORTFOLIO CHARACTERISTICS | | Fund | | | MSCI
World | |
Median Market Capitalization (billions) | | | $38 | | | | $13 | |
Weighted Average Market Capitalization (billions) | | | $105 | | | | $157 | |
Price-to-Earnings Ratio(c) | | | 11.8x | | | | 15.6x | |
Countries Represented | | | 20 | | | | 23 | |
Emerging Markets (Brazil, China, India, Mexico, Russia, South Africa, South Korea, Thailand)(f)(g) | | | 13.2% | | | | 0.0% | |
| | | | |
| TEN LARGEST HOLDINGS (%)(d) | | Fund | |
Charter Communications, Inc.(United States) | | | 3.1 | |
Novartis AG(Switzerland) | | | 2.3 | |
Alphabet, Inc.(United States) | | | 2.2 | |
FedEx Corp. (United States) | | | 2.2 | |
Comcast Corp. (United States) | | | 2.2 | |
UniCredit SPA(Italy) | | | 2.2 | |
Sanofi(France) | | | 2.2 | |
Roche Holding AG(Switzerland) | | | 2.2 | |
Johnson Controls International PLC(United States) | | | 2.1 | |
Occidental Petroleum Corp.(United States) | | | 2.0 | |
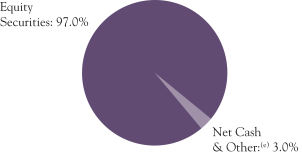
| | | | | | | | |
| REGION DIVERSIFICATION (%)(f)(g) | | Fund | | | MSCI
World | |
United States | | | 45.7 | | | | 62.7 | |
Europe (excluding United Kingdom) | | | 24.5 | | | | 15.7 | |
United Kingdom | | | 9.3 | | | | 5.7 | |
Asia Pacific (excluding Japan) | | | 7.5 | | | | 4.3 | |
Latin America | | | 3.9 | | | | 0.0 | |
Japan | | | 3.0 | | | | 8.0 | |
Africa | | | 1.6 | | | | 0.0 | |
Canada | | | 1.3 | | | | 3.5 | |
Middle East | | | 0.0 | | | | 0.2 | |
| | | | | | | | |
| SECTOR DIVERSIFICATION (%)(g) | | Fund | | | MSCI
World | |
Financials | | | 29.1 | | | | 15.8 | |
Health Care | | | 16.6 | | | | 12.6 | |
Communication Services | | | 14.1 | | | | 8.3 | |
Information Technology | | | 9.7 | | | | 16.3 | |
Energy | | | 7.9 | | | | 5.7 | |
Industrials | | | 7.6 | | | | 11.2 | |
Consumer Discretionary | | | 7.4 | | | | 10.5 | |
Materials | | | 3.6 | | | | 4.6 | |
Consumer Staples | | | 0.6 | | | | 8.5 | |
Real Estate | | | 0.4 | | | | 3.2 | |
Utilities | | | 0.0 | | | | 3.3 | |
| (a) | SEC Yield is an annualization of the Fund’s net investment income for the trailing30-day period. Dividends paid by the Fund may be higher or lower than implied by the SEC Yield. |
| (b) | Active share is a measure of how much an investment portfolio differs from its benchmark index, based on a scale of 0% (complete overlap with the index) to 100% (no overlap). Overlap for each security in the Fund is the lower of either its percentage weight in the Fund or its percentage weight in the relevant index. Active share is calculated as 100% minus the sum of the overlapping security weights. |
| (c) | Price-to-earnings (P/E) ratios are calculated using12-month forward earnings estimates from third-party sources. |
| (d) | The Fund’s portfolio holdings are subject to change without notice. The mention of specific securities is not a recommendation to buy, sell, or hold any particular security and is not indicative of Dodge & Cox’s current or future trading activity. |
| (e) | Net Cash & Other includes cash, short-term investments, derivatives, receivables, and payables. |
| (f) | The Fund may classify a company in a different category than the MSCI World. The Fund generally classifies a company based on its country of incorporation, but may designate a different country in certain circumstances. |
| (g) | Includes the Fund’s Naspers common equity market value as well as the market value of a synthetic position in “core Naspers” (i.e. Naspers excluding its holdings of Tencent), which comprises a long total return swap in Naspers common equity and a short total return swap in Tencent common equity, each with similar notional values. For context, Naspers owns a 31% stake in Tencent. |
PAGE 6§ DODGE & COX GLOBAL STOCK FUND
| | | | |
| CONSOLIDATED PORTFOLIO OF INVESTMENTS (unaudited) | | | June 30, 2019 | |
| | | | | | | | |
| COMMON STOCKS: 93.9% | | | | | | |
| | |
| | | SHARES | | | VALUE | |
| COMMUNICATION SERVICES: 14.1% | |
MEDIA & ENTERTAINMENT: 12.3% | |
Alphabet, Inc., Class C(a) (United States) | | | 201,999 | | | $ | 218,342,739 | |
Altice Europe NV, Series A(a) (Netherlands) | | | 7,733,145 | | | | 27,778,226 | |
Baidu, Inc. ADR(a) (Cayman Islands/China) | | | 991,200 | | | | 116,327,232 | |
Charter Communications, Inc., Class A(a) (United States) | | | 758,597 | | | | 299,782,362 | |
Comcast Corp., Class A (United States) | | | 5,058,700 | | | | 213,881,836 | |
DISH Network Corp., Class A(a) (United States) | | | 1,630,800 | | | | 62,639,028 | |
Grupo Televisa SAB ADR (Mexico) | | | 12,391,400 | | | | 104,583,416 | |
Liberty Global PLC, Series C(a) (United Kingdom) | | | 5,107,000 | | | | 135,488,710 | |
MultiChoice Group, Ltd.(a) (South Africa) | | | 832,403 | | | | 7,917,432 | |
Television Broadcasts, Ltd. (Hong Kong) | | | 2,509,500 | | | | 4,195,511 | |
| | | | | | | | |
| | | | | | | 1,190,936,492 | |
TELECOMMUNICATION SERVICES: 1.8% | |
Millicom International Cellular SA SDR (Luxembourg) | | | 1,003,400 | | | | 56,457,897 | |
Sprint Corp.(a) (United States) | | | 8,868,500 | | | | 58,266,045 | |
Zayo Group Holdings, Inc.(a) (United States) | | | 1,975,100 | | | | 65,000,541 | |
| | | | | | | | |
| | | | | | | 179,724,483 | |
| | | | | | | | |
| | | | | | | 1,370,660,975 | |
| CONSUMER DISCRETIONARY: 7.4% | |
AUTOMOBILES & COMPONENTS: 1.6% | |
Bayerische Motoren Werke AG (Germany) | | | 894,300 | | | | 66,190,586 | |
Honda Motor Co., Ltd. (Japan) | | | 3,289,100 | | | | 84,961,680 | |
| | | | | | | | |
| | | | | | | 151,152,266 | |
CONSUMER DURABLES & APPAREL: 0.2% | |
Mattel, Inc.(a) (United States) | | | 2,144,367 | | | | 24,038,354 | |
| | |
RETAILING: 5.6% | | | | | | | | |
Alibaba Group Holding, Ltd. ADR(a) (Cayman Islands/China) | | | 462,700 | | | | 78,404,515 | |
Booking Holdings, Inc.(a) (United States) | | | 76,100 | | | | 142,665,431 | |
JD.com, Inc. ADR(a) (Cayman Islands/China) | | | 3,508,346 | | | | 106,267,800 | |
Naspers, Ltd. (South Africa) | | | 636,453 | | | | 154,516,419 | |
Qurate Retail, Inc., Series A(a) (United States) | | | 5,081,572 | | | | 62,960,677 | |
| | | | | | | | |
| | | | | | | 544,814,842 | |
| | | | | | | | |
| | | | | | | 720,005,462 | |
| CONSUMER STAPLES: 0.6% | |
FOOD & STAPLES RETAILING: 0.6% | |
Magnit PJSC (Russia) | | | 1,006,100 | | | | 59,400,650 | |
| | |
| ENERGY: 7.3% | | | | | | | | |
Anadarko Petroleum Corp. (United States) | | | 1,284,000 | | | | 90,599,040 | |
Apache Corp. (United States) | | | 4,567,082 | | | | 132,308,366 | |
Baker Hughes, a GE Company (United States) | | | 2,333,727 | | | | 57,479,696 | |
Hess Corp. (United States) | | | 638,632 | | | | 40,597,836 | |
National Oilwell Varco, Inc. (United States) | | | 162,035 | | | | 3,602,038 | |
Occidental Petroleum Corp. (United States) | | | 3,819,663 | | | | 192,052,656 | |
Schlumberger, Ltd. (Curacao/United States) | | | 1,431,200 | | | | 56,875,888 | |
Suncor Energy, Inc. (Canada) | | | 4,150,300 | | | | 129,323,348 | |
| | | | | | | | |
| | | | | | | 702,838,868 | |
| FINANCIALS: 27.5% | |
BANKS: 17.2% | | | | | | | | |
Axis Bank, Ltd.(a) (India) | | | 7,405,600 | | | | 86,873,849 | |
Banco Santander SA (Spain) | | | 34,420,998 | | | | 159,711,270 | |
Bank of America Corp. (United States) | | | 4,797,300 | | | | 139,121,700 | |
Barclays PLC (United Kingdom) | | | 77,141,900 | | | | 146,753,522 | |
BNP Paribas SA (France) | | | 3,931,600 | | | | 186,715,570 | |
ICICI Bank, Ltd. (India) | | | 27,926,136 | | | | 176,673,697 | |
KasikornbankPCL- Foreign (Thailand) | | | 4,969,500 | | | | 30,707,435 | |
Mitsubishi UFJ Financial Group, Inc. (Japan) | | | 14,775,000 | | | | 70,164,634 | |
Societe Generale SA (France) | | | 5,964,685 | | | | 150,705,913 | |
| | | | | | | | |
| | |
| | | SHARES | | | VALUE | |
Standard Chartered PLC (United Kingdom) | | | 16,581,477 | | | $ | 150,393,632 | |
UniCredit SPA (Italy) | | | 17,345,566 | | | | 213,528,191 | |
Wells Fargo & Co. (United States) | | | 3,302,773 | | | | 156,287,218 | |
| | | | | | | | |
| | | | | | | 1,667,636,631 | |
DIVERSIFIED FINANCIALS: 8.7% | | | | | | | | |
American Express Co. (United States) | | | 298,000 | | | | 36,785,120 | |
Bank of New York Mellon Corp. (United States) | | | 1,284,400 | | | | 56,706,260 | |
Capital One Financial Corp. (United States) | | | 1,949,200 | | | | 176,870,408 | |
Charles Schwab Corp. (United States) | | | 2,999,400 | | | | 120,545,886 | |
Credit Suisse Group AG (Switzerland) | | | 12,113,899 | | | | 145,250,141 | |
Goldman Sachs Group, Inc. (United States) | | | 678,900 | | | | 138,902,940 | |
UBS Group AG (Switzerland) | | | 14,570,700 | | | | 173,140,873 | |
| | | | | | | | |
| | | | | | | 848,201,628 | |
INSURANCE: 1.6% | | | | | | | | |
AEGON NV (Netherlands) | | | 11,620,680 | | | | 57,850,354 | |
Aviva PLC (United Kingdom) | | | 18,209,820 | | | | 96,317,909 | |
| | | | | | | | |
| | | | | | | 154,168,263 | |
| | | | | | | | |
| | | | | | | 2,670,006,522 | |
| HEALTH CARE: 16.6% | | | | | | | | |
HEALTH CARE EQUIPMENT & SERVICES: 3.0% | |
Cigna Corp. (United States) | | | 638,838 | | | | 100,648,927 | |
CVS Health Corp. (United States) | | | 1,841,700 | | | | 100,354,233 | |
UnitedHealth Group, Inc. (United States) | | | 383,400 | | | | 93,553,434 | |
| | | | | | | | |
| | | | | | | 294,556,594 | |
PHARMACEUTICALS, BIOTECHNOLOGY & LIFE SCIENCES: 13.6% | |
Alnylam Pharmaceuticals, Inc.(a) (United States) | | | 358,500 | | | | 26,012,760 | |
AstraZeneca PLC (United Kingdom) | | | 1,461,700 | | | | 119,507,623 | |
Bayer AG (Germany) | | | 2,275,220 | | | | 157,661,106 | |
Bristol-Myers Squibb Co. (United States) | | | 2,542,700 | | | | 115,311,445 | |
GlaxoSmithKline PLC (United Kingdom) | | | 9,298,400 | | | | 186,172,759 | |
Incyte Corp.(a) (United States) | | | 673,300 | | | | 57,203,568 | |
Novartis AG (Switzerland) | | | 2,493,700 | | | | 227,861,135 | |
Roche Holding AG (Switzerland) | | | 753,300 | | | | 211,937,969 | |
Sanofi (France) | | | 2,468,762 | | | | 213,096,805 | |
| | | | | | | | |
| | | | | | | 1,314,765,170 | |
| | | | | | | | |
| | | | | | | 1,609,321,764 | |
| INDUSTRIALS: 7.6% | | | | | | | | |
CAPITAL GOODS: 5.3% | | | | | | | | |
Johnson Controls International PLC (Ireland/United States) | | | 4,850,940 | | | | 200,392,331 | |
Mitsubishi Electric Corp. (Japan) | | | 10,640,500 | | | | 140,044,238 | |
Schneider Electric SA (France) | | | 848,578 | | | | 76,961,875 | |
United Technologies Corp. (United States) | | | 768,700 | | | | 100,084,740 | |
| | | | | | | | |
| | | | | | | 517,483,184 | |
TRANSPORTATION: 2.3% | | | | | | | | |
FedEx Corp. (United States) | | | 1,324,500 | | | | 217,469,655 | |
| | | | | | | | |
| | | | | | | 734,952,839 | |
| INFORMATION TECHNOLOGY: 8.8% | |
SEMICONDUCTORS & SEMICONDUCTOR EQUIPMENT: 1.4% | |
Microchip Technology, Inc. (United States) | | | 1,602,300 | | | | 138,919,410 | |
| | |
SOFTWARE & SERVICES: 2.8% | | | | | | | | |
Cognizant Technology Solutions Corp., Class A (United States) | | | 1,051,200 | | | | 66,635,568 | |
Micro Focus International PLC (United Kingdom) | | | 2,612,699 | | | | 68,483,423 | |
Microsoft Corp. (United States) | | | 1,037,700 | | | | 139,010,292 | |
| | | | | | | | |
| | | | | | | 274,129,283 | |
| | |
| See accompanying Notes to Consolidated Financial Statements | | DODGE & COX GLOBAL STOCK FUND§PAGE 7 |
| | | | |
| CONSOLIDATED PORTFOLIO OF INVESTMENTS (unaudited) | | | June 30, 2019 | |
| | | | | | | | |
| COMMON STOCKS (continued) | | | | | | |
| | |
| | | SHARES | | | VALUE | |
TECHNOLOGY, HARDWARE & EQUIPMENT: 4.6% | |
Dell Technologies, Inc., Class C(a) (United States) | | | 1,077,643 | | | $ | 54,744,264 | |
Hewlett Packard Enterprise Co. (United States) | | | 5,823,298 | | | | 87,058,305 | |
HP Inc. (United States) | | | 4,207,700 | | | | 87,478,083 | |
Juniper Networks, Inc. (United States) | | | 3,167,168 | | | | 84,341,684 | |
Samsung Electronics Co., Ltd. (South Korea) | | | 159,600 | | | | 6,496,514 | |
TE Connectivity, Ltd. (Switzerland) | | | 1,311,115 | | | | 125,578,595 | |
| | | | | | | | |
| | | | | | | 445,697,445 | |
| | | | | | | | |
| | | | | | | 858,746,138 | |
| MATERIALS: 3.6% | | | | | | | | |
Celanese Corp. (United States) | | | 826,200 | | | | 89,064,360 | |
Cemex SAB de CV ADR (Mexico) | | | 11,439,917 | | | | 48,505,248 | |
LafargeHolcim, Ltd. (Switzerland) | | | 1,519,662 | | | | 74,208,449 | |
Linde PLC (Ireland/United States) | | | 669,061 | | | | 134,393,443 | |
| | | | | | | | |
| | | | | | | 346,171,500 | |
| REAL ESTATE: 0.4% | | | | | | | | |
Hang Lung Group, Ltd. (Hong Kong) | | | 14,717,900 | | | | 40,790,422 | |
| | | | | | | | |
TOTAL COMMON STOCKS
(Cost $8,292,401,978) | | | | | | $ | 9,112,895,140 | |
| | |
| PREFERRED STOCKS: 3.1% | | | | | | |
| ENERGY: 0.6% | | | | | | | | |
Petroleo Brasileiro SA (Brazil) | | | 8,681,506 | | | | 61,969,578 | |
| | |
| FINANCIALS: 1.6% | | | | | | | | |
BANKS: 1.6% | | | | | | | | |
Itau Unibanco Holding SA (Brazil) | | | 16,859,293 | | | | 159,199,459 | |
|
| INFORMATION TECHNOLOGY: 0.9% | |
TECHNOLOGY, HARDWARE & EQUIPMENT: 0.9% | |
Samsung Electronics Co., Ltd. (South Korea) | | | 2,509,700 | | | | 83,138,635 | |
| | | | | | | | |
TOTAL PREFERRED STOCKS
(Cost $134,304,810) | | | | | | $ | 304,307,672 | |
|
| SHORT-TERM INVESTMENTS: 2.7% | |
| | |
| | | PAR VALUE/
SHARES | | | VALUE | |
REPURCHASE AGREEMENTS: 2.3% | | | | | | | | |
Bank of Montreal(b)
2.45%, dated 6/28/19, due 7/1/19, maturity value $21,804,451 | | $ | 21,800,000 | | | $ | 21,800,000 | |
Fixed Income Clearing Corporation(b)
1.60%, dated 6/28/19, due 7/1/19, maturity value $142,026,934 | | | 142,008,000 | | | | 142,008,000 | |
Royal Bank of Canada(b)
2.47%, dated 6/28/19, due 7/1/19, maturity value $58,111,959 | | | 58,100,000 | | | | 58,100,000 | |
| | | | | | | | |
| | | | | | | 221,908,000 | |
MONEY MARKET FUND: 0.4% | | | | | | | | |
State Street Institutional U.S. Government Money Market Fund | | | 38,649,243 | | | | 38,649,243 | |
| | | | | | | | |
TOTAL SHORT-TERM INVESTMENTS
(Cost $260,557,243) | | | | | | $ | 260,557,243 | |
| | | | | | | | |
TOTAL INVESTMENTS IN SECURITIES
(Cost $8,687,264,031) | | | 99.7 | % | | $ | 9,677,760,055 | |
OTHER ASSETS LESS LIABILITIES | | | 0.3 | % | | | 33,580,801 | |
| | | | | | | | |
| NET ASSETS | | | 100.0 | % | | $ | 9,711,340,856 | |
| | | | | | | | |
| (b) | Repurchase agreements are collateralized by: |
Bank of Montreal: U.S. Treasury Bill 9/12/19, U.S. Treasury Notes0.875%-3.00%,7/31/19-2/15/49, and U.S. Treasury Inflation Indexed Notes0.375%-2.00%,1/15/26-7/15/27. Total collateral value is $22,240,540.
Royal Bank of Canada: U.S. Treasury Note 2.125%, 3/31/24. Total collateral value is $59,274,200.
Fixed Income Clearing Corporation: U.S. Treasury Notes2.125%-2.625%,6/15/21-7/15/21. Total collateral value is $144,851,041.
In determining a company’s country designation, the Fund generally references the country of incorporation. In cases where the Fund considers the country of incorporation to be a “jurisdiction of convenience” chosen primarily for tax purposes or in other limited circumstances, the Fund uses the country designation of an appropriate broad-based market index. In those cases, two countries are listed — the country of incorporation and the country designated by an appropriate index, respectively.
ADR: American Depositary Receipt
SDR: Swedish Depository Receipt
| | |
| PAGE 8§ DODGE & COX GLOBAL STOCK FUND | | See accompanying Notes to Consolidated Financial Statements |
| | | | |
| CONSOLIDATED PORTFOLIO OF INVESTMENTS (unaudited) | | | June 30, 2019 | |
EQUITY TOTAL RETURN SWAPS(a)
| | | | | | | | | | | | | | | | | | |
| Fund Receives | | Fund Pays | | Counterparty | | | Maturity
Date | | | Notional
Amount | | | Value / Unrealized
Appreciation
(Depreciation) | |
Total Return on Naspers, Ltd. | | 2.898% | | | JPMorgan | | | | 7/10/20 | | | $ | 68,983,815 | | | $ | 122,775 | |
| | | | | |
2.198% | | Total Return on Tencent Holdings, Ltd. | | | JPMorgan | | | | 7/10/20 | | | | 71,123,430 | | | | (3,937,163 | ) |
| | | | | | | | | | | | | | | | | | |
| | | | | | | | | | | | | | | | $ | (3,814,388 | ) |
| | | | | | | | | | | | | | | | | | |
| (a) | The combination of the equity total return swaps is designed to provide exposure to Naspers, Ltd. excluding the effect of Naspers Ltd.’s exposure to Tencent Holdings, Ltd. The swaps pay at maturity, and no upfront payments were made. |
FUTURES CONTRACTS
| | | | | | | | | | | | | | | | |
| Description | | Number of
Contracts | | | Expiration
Date | | | Notional
Amount | | | Value / Unrealized
Appreciation
(Depreciation) | |
E-mini S&P 500 Index—Long Position | | | 1,283 | | | | 9/20/19 | | | $ | 188,870,430 | | | $ | 1,779,912 | |
CURRENCY FORWARD CONTRACTS
| | | | | | | | | | | | | | | | | | | | |
| Counterparty | | Settle Date | | | Currency Purchased | | | Currency Sold | | | Unrealized
Appreciation (Depreciation) | |
CHF: Swiss Franc | |
Barclays | | | 9/11/19 | | | USD | | | 18,676,288 | | | CHF | | | 18,450,000 | | | $ | (344,338 | ) |
Credit Suisse | | | 8/14/19 | | | USD | | | 15,895,915 | | | CHF | | | 15,866,667 | | | | (422,129 | ) |
Goldman Sachs | | | 9/11/19 | | | USD | | | 18,641,542 | | | CHF | | | 18,450,000 | | | | (379,083 | ) |
Morgan Stanley | | | 7/31/19 | | | USD | | | 33,676,523 | | | CHF | | | 34,033,999 | | | | (1,283,090 | ) |
Morgan Stanley | | | 7/31/19 | | | USD | | | 67,359,380 | | | CHF | | | 68,068,001 | | | | (2,559,849 | ) |
State Street | | | 8/14/19 | | | USD | | | 7,959,360 | | | CHF | | | 7,933,333 | | | | (199,662 | ) |
CNH: Chinese Yuan Renminbi | |
Bank of America | | | 1/15/20 | | | USD | | | 18,602,432 | | | CNH | | | 125,717,097 | | | | 343,215 | |
Bank of America | | | 2/12/20 | | | USD | | | 4,790,613 | | | CNH | | | 32,500,000 | | | | 72,584 | |
Barclays | | | 7/24/19 | | | USD | | | 14,015,826 | | | CNH | | | 96,000,000 | | | | 43,451 | |
Barclays | | | 8/28/19 | | | USD | | | 6,702,608 | | | CNH | | | 46,000,000 | | | | 9,002 | |
Barclays | | | 3/4/20 | | | USD | | | 18,724,862 | | | CNH | | | 125,700,000 | | | | 483,607 | |
Citibank | | | 8/7/19 | | | USD | | | 11,988,187 | | | CNH | | | 82,856,354 | | | | (70,475 | ) |
Citibank | | | 8/7/19 | | | USD | | | 11,053,953 | | | CNH | | | 76,404,924 | | | | (65,787 | ) |
Citibank | | | 8/7/19 | | | USD | | | 12,047,102 | | | CNH | | | 82,856,354 | | | | (11,560 | ) |
Citibank | | | 8/7/19 | | | CNH | | | 87,471,800 | | | USD | | | 12,608,548 | | | | 121,832 | |
Citibank | | | 8/28/19 | | | USD | | | 21,723,766 | | | CNH | | | 149,075,000 | | | | 31,387 | |
Citibank | | | 9/25/19 | | | USD | | | 46,971,960 | | | CNH | | | 327,000,000 | | | | (597,659 | ) |
Citibank | | | 12/4/19 | | | USD | | | 28,026,826 | | | CNH | | | 196,000,000 | | | | (458,507 | ) |
Citibank | | | 2/5/20 | | | USD | | | 8,002,896 | | | CNH | | | 54,018,750 | | | | 160,037 | |
Credit Suisse | | | 1/8/20 | | | USD | | | 19,694,939 | | | CNH | | | 135,156,520 | | | | 62,356 | |
Credit Suisse | | | 1/15/20 | | | USD | | | 18,843,578 | | | CNH | | | 127,621,902 | | | | 307,706 | |
Goldman Sachs | | | 8/7/19 | | | CNH | | | 64,264,860 | | | USD | | | 9,416,097 | | | | (63,184 | ) |
Goldman Sachs | | | 8/28/19 | | | USD | | | 21,713,641 | | | CNH | | | 149,075,000 | | | | 21,262 | |
Goldman Sachs | | | 8/28/19 | | | CNH | | | 90,000,000 | | | USD | | | 12,952,436 | | | | 143,751 | |
Goldman Sachs | | | 1/22/20 | | | USD | | | 19,155,086 | | | CNH | | | 130,676,000 | | | | 177,936 | |
Goldman Sachs | | | 10/27/21 | | | USD | | | 12,720,309 | | | CNH | | | 90,000,000 | | | | (120,156 | ) |
Goldman Sachs | | | 4/27/22 | | | USD | | | 9,234,784 | | | CNH | | | 64,264,860 | | | | 104,586 | |
HSBC | | | 8/7/19 | | | USD | | | 10,946,297 | | | CNH | | | 75,264,552 | | | | (7,477 | ) |
HSBC | | | 8/7/19 | | | USD | | | 11,875,064 | | | CNH | | | 81,619,692 | | | | (3,617 | ) |
HSBC | | | 8/7/19 | | | USD | | | 11,096,980 | | | CNH | | | 76,404,924 | | | | (22,761 | ) |
HSBC | | | 8/7/19 | | | CNH | | | 65,238,570 | | | USD | | | 9,565,071 | | | | (70,448 | ) |
HSBC | | | 8/7/19 | | | CNH | | | 65,238,570 | | | USD | | | 9,449,387 | | | | 45,236 | |
HSBC | | | 8/7/19 | | | CNH | | | 64,397,667 | | | USD | | | 9,290,716 | | | | 81,525 | |
HSBC | | | 8/28/19 | | | CNH | | | 90,000,000 | | | USD | | | 12,957,098 | | | | 139,089 | |
HSBC | | | 10/23/19 | | | USD | | | 26,422,647 | | | CNH | | | 183,500,000 | | | | (262,122 | ) |
HSBC | | | 2/5/20 | | | USD | | | 7,967,921 | | | CNH | | | 53,750,000 | | | | 164,081 | |
HSBC | | | 2/12/20 | | | USD | | | 4,796,057 | | | CNH | | | 32,500,000 | | | | 78,028 | |
HSBC | | | 10/27/21 | | | USD | | | 12,723,546 | | | CNH | | | 90,000,000 | | | | (116,919 | ) |
HSBC | | | 1/26/22 | | | USD | | | 9,113,221 | | | CNH | | | 64,397,667 | | | | (55,137 | ) |
HSBC | | | 4/27/22 | | | USD | | | 9,369,992 | | | CNH | | | 65,238,570 | | | | 101,458 | |
| | |
| See accompanying Notes to Consolidated Financial Statements | | DODGE & COX GLOBAL STOCK FUND§PAGE 9 |
| | | | |
| CONSOLIDATED PORTFOLIO OF INVESTMENTS (unaudited) | | | June 30, 2019 | |
| | | | | | | | | | | | | | | | | | | | |
| Counterparty | | Settle Date | | | Currency Purchased | | | Currency Sold | | | Unrealized
Appreciation (Depreciation) | |
HSBC | | | 4/27/22 | | | USD | | | 9,230,132 | | | CNH | | | 65,238,570 | | | $ | (38,402 | ) |
JPMorgan | | | 7/31/19 | | | USD | | | 9,949,363 | | | CNH | | | 68,332,224 | | | | 4,163 | |
JPMorgan | | | 8/7/19 | | | CNH | | | 64,397,666 | | | USD | | | 9,312,750 | | | | 59,490 | |
JPMorgan | | | 8/7/19 | | | CNH | | | 64,397,667 | | | USD | | | 9,279,203 | | | | 93,038 | |
JPMorgan | | | 8/28/19 | | | USD | | | 21,391,114 | | | CNH | | | 146,850,000 | | | | 22,503 | |
JPMorgan | | | 8/28/19 | | | CNH | | | 62,000,000 | | | USD | | | 8,933,589 | | | | 88,229 | |
JPMorgan | | | 10/23/19 | | | USD | | | 22,835,938 | | | CNH | | | 160,000,000 | | | | (431,436 | ) |
JPMorgan | | | 10/23/19 | | | USD | | | 26,428,355 | | | CNH | | | 183,500,000 | | | | (256,414 | ) |
JPMorgan | | | 1/15/20 | | | CNH | | | 280,000,000 | | | USD | | | 40,238,557 | | | | 428,789 | |
JPMorgan | | | 2/5/20 | | | USD | | | 8,004,557 | | | CNH | | | 54,018,750 | | | | 161,697 | |
JPMorgan | | | 5/12/21 | | | USD | | | 39,755,786 | | | CNH | | | 280,000,000 | | | | (368,198 | ) |
JPMorgan | | | 1/26/22 | | | USD | | | 9,135,069 | | | CNH | | | 64,397,666 | | | | (33,290 | ) |
JPMorgan | | | 1/26/22 | | | USD | | | 9,093,789 | | | CNH | | | 64,397,667 | | | | (74,570 | ) |
State Street | | | 1/8/20 | | | USD | | | 2,917,791 | | | CNH | | | 20,000,000 | | | | 12,629 | |
State Street | | | 1/8/20 | | | USD | | | 2,916,940 | | | CNH | | | 20,000,000 | | | | 11,777 | |
State Street | | | 1/15/20 | | | USD | | | 18,881,493 | | | CNH | | | 127,621,901 | | | | 345,621 | |
State Street | | | 2/5/20 | | | USD | | | 7,882,983 | | | CNH | | | 53,212,500 | | | | 157,181 | |
UBS | | | 7/24/19 | | | CNH | | | 96,000,000 | | | USD | | | 13,901,358 | | | | 71,017 | |
UBS | | | 7/31/19 | | | CNH | | | 68,332,224 | | | USD | | | 9,894,617 | | | | 50,583 | |
| | | | | | | | | | | | | | | | | | | | |
Unrealized gain on currency forward contracts | | | | 4,198,846 | |
Unrealized loss on currency forward contracts | | | | (8,316,270 | ) |
| | | | | | | | | | | | | | | | | | | | |
Net unrealized loss on currency forward contracts | | | $ | (4,117,424 | ) |
| | | | | | | | | | | | | | | | | | | | |
The listed counterparty may be the parent company or one of its subsidiaries.
| | |
| PAGE 10§ DODGE & COX GLOBAL STOCK FUND | | See accompanying Notes to Consolidated Financial Statements |
| | | | |
CONSOLIDATED STATEMENT OF ASSETS AND LIABILITIES (unaudited) | |
| |
| | | June 30, 2019 | |
ASSETS: | | | | |
Investments in securities, at value (cost $8,687,264,031) | | $ | 9,677,760,055 | |
Unrealized appreciation on currency forward contracts | | | 4,198,846 | |
Unrealized appreciation on swaps | | | 122,775 | |
Cash pledged as collateral for OTC Derivatives | | | 10,050,000 | |
Cash | | | 100 | |
Cash denominated in foreign currency (cost $1,357,792) | | | 1,357,190 | |
Deposits with broker for futures contracts | | | 8,082,900 | |
Receivable for variation margin for futures contracts | | | 853,194 | |
Receivable for investments sold | | | 23,692,361 | |
Receivable for Fund shares sold | | | 3,522,948 | |
Dividends and interest receivable | | | 19,500,214 | |
Prepaid expenses and other assets | | | 35,778 | |
| | | | |
| | | 9,749,176,361 | |
| | | | |
LIABILITIES: | | | | |
Unrealized depreciation on currency forward contracts | | | 8,316,270 | |
Unrealized depreciation on swaps | | | 3,937,163 | |
Cash received as collateral for OTC Derivatives | | | 1,620,000 | |
Payable for investments purchased | | | 3,244,010 | |
Payable for Fund shares redeemed | | | 6,363,798 | |
Deferred foreign capital gains tax | | | 9,306,551 | |
Management fees payable | | | 4,680,308 | |
Accrued expenses | | | 367,405 | |
| | | | |
| | | 37,835,505 | |
| | | | |
NET ASSETS | | $ | 9,711,340,856 | |
| | | | |
NET ASSETS CONSIST OF: | | | | |
Paid in capital | | $ | 8,305,341,493 | |
Total distributable earnings | | | 1,405,999,363 | |
| | | | |
| | $ | 9,711,340,856 | |
| | | | |
Fund shares outstanding (par value $0.01 each, unlimited shares authorized) | | | 784,472,901 | |
Net asset value per share | | $ | 12.38 | |
|
CONSOLIDATED STATEMENT OF OPERATIONS (unaudited) | |
| |
| | | Six Months Ended
June 30, 2019 | |
INVESTMENT INCOME: | | | | |
Dividends (net of foreign taxes of $12,867,976) | | $ | 177,229,581 | |
Interest | | | 1,394,833 | |
| | | | |
| | | 178,624,414 | |
| | | | |
EXPENSES: | | | | |
Management fees | | | 28,160,173 | |
Custody and fund accounting fees | | | 264,508 | |
Transfer agent fees | | | 122,599 | |
Professional services | | | 153,439 | |
Shareholder reports | | | 90,046 | |
Registration fees | | | 196,830 | |
Trustees’ fees | | | 170,833 | |
ADR depositary fees | | | 85,596 | |
Miscellaneous | | | 61,767 | |
| | | | |
| | | 29,305,791 | |
| | | | |
NET INVESTMENT INCOME | | | 149,318,623 | |
| | | | |
REALIZED AND UNREALIZED GAIN (LOSS): | | | | |
Net realized gain (loss) | | | | |
Investments in securities (net of foreign taxes of $1,531,180) | | | 78,258,201 | |
Futures contracts | | | 14,012,307 | |
Currency forward contracts | | | 10,632,150 | |
Foreign currency transactions | | | (792,681 | ) |
Net change in unrealized appreciation/depreciation | | | | |
Investments in securities (net of increase in deferred foreign capital gains tax of $3,869,336) | | | 810,427,804 | |
Futures contracts | | | 82,900 | |
Swaps | | | (3,814,388 | ) |
Currency forward contracts | | | (8,739,787 | ) |
Foreign currency translation | | | 269,485 | |
| | | | |
Net realized and unrealized gain (loss) | | | 900,335,991 | |
| | | | |
NET CHANGE IN NET ASSETS FROM OPERATIONS | | $ | 1,049,654,614 | |
| | | | |
| | | | | | | | |
CONSOLIDATED STATEMENT OF CHANGES IN NET ASSETS (unaudited) | |
| | |
| | | Six Months Ended
June 30, 2019 | | | Year Ended
December 31, 2018 | |
OPERATIONS: | | | | | | | | |
Net investment income | | $ | 149,318,623 | | | $ | 146,642,500 | |
Net realized gain (loss) | | | 102,109,977 | | | | 719,841,807 | |
Net change in unrealized appreciation/depreciation | | | 798,226,014 | | | | (2,121,170,507 | ) |
| | | | | | | | |
| | | 1,049,654,614 | | | | (1,254,686,200 | ) |
| | | | | | | | |
| | |
DISTRIBUTIONS TO SHAREHOLDERS: | | | | | | | | |
Total distributions | | | — | | | | (770,232,844 | ) |
| | |
FUND SHARE TRANSACTIONS: | | | | | | | | |
Proceeds from sale of shares | | | 708,801,447 | | | | 1,404,694,112 | |
Reinvestment of distributions | | | — | | | | 749,634,584 | |
Cost of shares redeemed | | | (661,310,647 | ) | | | (1,425,797,344 | ) |
| | | | | | | | |
Net change from Fund share transactions | | | 47,490,800 | | | | 728,531,352 | |
| | | | | | | | |
Total change in net assets | | | 1,097,145,414 | | | | (1,296,387,692 | ) |
| | |
NET ASSETS: | | | | | | | | |
Beginning of period | | | 8,614,195,442 | | | | 9,910,583,134 | |
| | | | | | | | |
End of period | | $ | 9,711,340,856 | | | $ | 8,614,195,442 | |
| | | | | | | | |
| | |
SHARE INFORMATION: | | | | | | | | |
Shares sold | | | 58,721,569 | | | | 103,488,968 | |
Distributions reinvested | | | — | | | | 67,840,234 | |
Shares redeemed | | | (54,901,930 | ) | | | (105,831,354 | ) |
| | | | | | | | |
Net change in shares outstanding | | | 3,819,639 | | | | 65,497,848 | |
| | | | | | | | |
| | |
| See accompanying Notes to Consolidated Financial Statements | | DODGE & COX GLOBAL STOCK FUND§PAGE 11 |
NOTES TO CONSOLIDATED FINANCIAL STATEMENTS(unaudited)
NOTE 1—ORGANIZATION AND SIGNIFICANT ACCOUNTING POLICIES
Dodge & Cox Global Stock Fund (the “Fund”) is one of the series constituting the Dodge & Cox Funds (the “Trust” or the “Funds”). The Trust is organized as a Delaware statutory trust and is registered under the Investment Company Act of 1940, as amended, as anopen-end management investment company. The Fund commenced operations on May 1, 2008, and seeks long-term growth of principal and income. The Fund invests primarily in a diversified portfolio of U.S. and foreign equity securities. Foreign investing, especially in developing countries, has special risks such as currency and market volatility and political and social instability. These and other risk considerations are discussed in the Fund’s Prospectus.
The Fund is an investment company and follows the accounting and reporting guidance issued in Topic 946 by the Financial Accounting Standards Board. The financial statements have been prepared in conformity with accounting principles generally accepted in the United States of America, which require the use of estimates and assumptions by management. Actual results may differ from those estimates. Significant accounting policies are as follows:
Security valuation The Fund’s net assets are normally valued as of the scheduled close of trading on the New York Stock Exchange (NYSE), generally 4 p.m. Eastern Time, each day that the NYSE is open for business.
Portfolio holdings for which market quotes are readily available are valued at market value. Listed securities, for example, are generally valued using the official quoted close price or the last sale on the exchange that is determined to be the primary market for the security. Exchange-traded derivatives are valued at the settlement price determined by the relevant exchange.Short-term securities less than 60 days to maturity may be valued at amortized cost if amortized cost approximates current value. Mutual funds are valued at their respective net asset values. Security values are not discounted based on the size of the Fund’s position and may differ from the value a Fund receives upon sale of the securities.
Investments initially valued in currencies other than the U.S. dollar are converted to the U.S. dollar using prevailing exchange rates. Currency forward contracts are valued based on the prevailing forward exchange rates of the underlying currencies. As a result, the Fund’s net assets may be affected by changes in the value of currencies in relation to the U.S. dollar.
If market quotations are not readily available or if normal valuation procedures produce valuations that are deemed unreliable or inappropriate under the circumstances existing at the time, the investment will be valued at fair value as determined in good faith by or under the direction of the Fund’s Board of Trustees. The Board of Trustees has appointed Dodge & Cox, the Fund’s investment manager, to make fair value determinations in accordance with the Dodge & Cox Funds Valuation Policies (“Valuation Policies”), subject to Board oversight. Dodge & Cox has established a Pricing Committee that is comprised of representatives from Treasury, Legal, Compliance, and Operations. The Pricing Committee is responsible for implementing the
Valuation Policies, including determining the fair value of securities and other investments when necessary. The Pricing Committee considers relevant indications of value that are reasonably available to it in determining the fair value assigned to a particular security, such as the value of similar financial instruments, trading volumes, contractual restrictions on disposition, related corporate actions, and changes in economic conditions. In doing so, the Pricing Committee employs various methods for calibrating fair valuation approaches, including a regular review of key inputs and assumptions, back-testing, and review of any related market activity.
As trading in securities on most foreign exchanges is normally completed before the close of the NYSE, the value of non-U.S. securities can change by the time the Fund calculates its net asset value. To address these changes, the Fund may utilize adjustment factors provided by an independent pricing service to systematically value non-U.S. securities at fair value. These adjustment factors are based on statistical analyses of subsequent movements and changes in U.S. markets and financial instruments trading in U.S. markets that represent foreign securities or baskets of securities.
Valuing securities through a fair value determination involves greater reliance on judgment than valuation of securities based on readily available market quotations. In some instances, lack of information and uncertainty as to the significance of information may lead to a conclusion that a prior valuation is the best indication of a security’s value. When fair value pricing is employed, the prices of securities used by the Fund to calculate its net asset value may differ from quoted or published prices for the same securities.
Security transactions, investment income, expenses, and distributions Security transactions are recorded on the trade date. Realized gains and losses on securities sold are determined on the basis of identified cost.
Dividend income and corporate action transactions are recorded on theex-dividend date, or when the Fund first learns of the dividend/corporate action if the ex-dividend date has passed.Non-cash dividends, if any, are recorded at the fair market value of the securities received. Dividends characterized as return of capital for U.S. tax purposes are recorded as a reduction of cost of investments and/or realized gain. Interest income is recorded on the accrual basis.
Expenses are recorded on the accrual basis. Some expenses of the Trust can be directly attributed to a specific series. Expenses which cannot be directly attributed are allocated among the Funds in the Trust using methodologies determined by the nature of the expense.
Distributions to shareholders are recorded on theex-dividend date.
Foreign taxes The Fund is subject to foreign taxes which may be imposed by certain countries in which the Fund invests. The Fund endeavors to record foreign taxes based on applicable foreign tax law. Withholding taxes are incurred on certain foreign dividends and are accrued at the time the associated dividend is recorded. The Fund files withholding tax reclaims in certain jurisdictions to recover a portion of amounts previously withheld. The Fund records a reclaim receivable based on, among other things, a jurisdiction’s legal obligation to pay reclaims as well as
PAGE 12§ DODGE & COX GLOBAL STOCK FUND
NOTES TO CONSOLIDATED FINANCIAL STATEMENTS(unaudited)
payment history and market convention. In consideration of recent decisions rendered by European courts, the Fund has filed for additional reclaims related to prior years. A corresponding receivable is established when both the amount is known and significant contingencies or uncertainties regarding collectability are removed. These amounts, if any, are reported in “dividends and interest receivable” in the Consolidated Statement of Assets and Liabilities.
Capital gains taxes are incurred upon disposition of certain foreign securities. Expected capital gains taxes on appreciated securities, if any, are accrued as unrealized losses and incurred capital gains taxes are reflected as realized losses upon the sale of the related security. Currency taxes may be incurred when the Fund purchases certain foreign currencies related to securities transactions and are recorded as realized losses on foreign currency transactions.
Repurchase agreements Repurchase agreements are transactions under which a Fund purchases a security from a dealer counterparty and agrees to resell the security to that counterparty on a specified future date at the same price, plus a specified interest rate. The Fund’s repurchase agreements are secured by U.S. government or agency securities, the fair value of which exceeds the principal amount of the repurchase transaction, including accrued interest, at all times. The Fund maintains custody of the underlying collateral securities, either through its regular custodian or through a third party custodian that maintains separate accounts for both the Fund and its counterparties. In the event of default by a counterparty, the Fund has the contractual right to liquidate the collateral securities and to apply the proceeds in satisfaction of the obligation.
Foreign currency translation The books and records of the Fund are maintained in U.S. dollars. Foreign currency amounts are translated into U.S. dollars at the prevailing exchange rates of such currencies against the U.S. dollar. The market value of investment securities and other assets and liabilities are translated at the exchange rate as of the valuation date. Purchases and sales of investment securities, income, and expenses are translated at the exchange rate prevailing on the transaction date.
Reported realized and unrealized gain (loss) on investments include foreign currency gain (loss) related to investment transactions.
Reported realized and unrealized gain (loss) on foreign currency transactions and translation include the following: disposing/holding of foreign currency, the difference between the trade and settlement dates on securities transactions, the difference between the accrual and payment dates on dividends, and currency losses on the purchase of foreign currency in certain countries that impose taxes on such transactions.
ConsolidationThe Fund may invest in certain securities through its wholly owned subsidiary, Dodge & Cox Global Stock Fund Cayman, Ltd. (the “Subsidiary”). The Subsidiary is a Cayman Islands exempted company and invests in certain securities consistent with the investment objective of the Fund. The Fund’s Consolidated Financial Statements, including the Consolidated Portfolio of Investments, consist of the holdings and accounts of the Fund and the Subsidiary. All intercompany transactions and balances have been eliminated. At June 30, 2019, the Subsidiary had net assets of $100, which represented less than 0.01% of the Fund’s consolidated net assets.
Indemnification Under the Trust’s organizational documents, its officers and trustees are indemnified against certain liabilities arising out of the performance of their duties to the Trust. In addition, in the normal course of business the Trust enters into contracts that provide general indemnities to other parties. The Trust’s maximum exposure under these arrangements is unknown as this would involve future claims that may be made against the Trust that have not yet occurred.
NOTE 2—VALUATION MEASUREMENTS
Various inputs are used in determining the value of the Fund’s investments. These inputs are summarized in the three broad levels listed below.
| § | | Level 1: Quoted prices in active markets for identical securities |
| § | | Level 2: Other significant observable inputs (including quoted prices for similar securities, market indices, interest rates, credit risk, forward exchange rates, etc.) |
| § | | Level 3: Significant unobservable inputs (including Fund management’s assumptions in determining the fair value of investments) |
The inputs or methodology used for valuing securities are not necessarily an indication of the risk associated with investing in those securities.
The following is a summary of the inputs used to value the Fund’s holdings at June 30, 2019:
| | | | | | | | |
| Classification | | LEVEL 1
(Quoted Prices) | | | LEVEL 2
(Other Significant
Observable Inputs) | |
Securities | | | | | | | | |
Common Stocks | | | | | | | | |
Communication Services | | $ | 1,370,660,975 | | | $ | — | |
Consumer Discretionary | | | 720,005,462 | | | | — | |
Consumer Staples | | | 59,400,650 | | | | — | |
Energy | | | 702,838,868 | | | | — | |
Financials | | | 2,670,006,522 | | | | — | |
Health Care | | | 1,609,321,764 | | | | — | |
Industrials | | | 734,952,839 | | | | — | |
Information Technology | | | 858,746,138 | | | | — | |
Materials | | | 346,171,500 | | | | — | |
Real Estate | | | 40,790,422 | | | | — | |
Preferred Stocks | | | | | | | | |
Energy | | | 61,969,578 | | | | — | |
Financials | | | 159,199,459 | | | | — | |
Information Technology | | | 83,138,635 | | | | — | |
Short-term Investments | | | | | | | | |
Repurchase Agreements | | | — | | | | 221,908,000 | |
Money Market Fund | | | 38,649,243 | | | | — | |
| | | | | | | | |
Total Securities | | $ | 9,455,852,055 | | | $ | 221,908,000 | |
| | | | | | | | |
Other Investments | | | | | | | | |
Equity Total Return Swaps | | | | | | | | |
Appreciation | | $ | — | | | $ | 122,775 | |
Depreciation | | | — | | | | (3,937,163 | ) |
Futures Contracts | | | | | | | | |
Appreciation | | | 1,779,912 | | | | — | |
Currency Forward Contracts | | | | | | | | |
Appreciation | | | — | | | | 4,198,846 | |
Depreciation | | | — | | | | (8,316,270 | ) |
| | | | | | | | | |
DODGE & COX GLOBAL STOCK FUND§PAGE 13
NOTES TO CONSOLIDATED FINANCIAL STATEMENTS (unaudited)
NOTE 3—DERIVATIVE INSTRUMENTS
The Fund may enter into various transactions involving derivative instruments, including currency forward contracts, futures contracts, and swaps in connection with its investment strategy. The Fund may use derivatives to minimize the impact of losses to one or more of its investments (as a ‘‘hedging technique’’) or to implement its investment strategy.
The Fund may enter intoover-the-counter derivatives (each, an ‘‘OTC Derivative’’), such as swaps and currency forward contracts. Each OTC Derivative is subject to a negotiated master agreement (based on a form published by the International Swaps and Derivatives Association (‘‘ISDA’’)) governing all OTC Derivatives between the Fund and the relevant dealer counterparty. The master agreements specify (i) events of default and other events permitting a party to terminate some or all of the OTC Derivatives thereunder and (ii) the process by which those OTC Derivatives will be valued for purposes of determining termination payments. If some or all of the OTC Derivatives under a master agreement are terminated because of an event of default or similar event, the values of all terminated OTC Derivatives must be netted to determine a single payment owed by one party to the other. To the extent amounts owed to the Fund by its counterparties are not collateralized, the Fund is at risk of those counterparties’ non-performance. The Fund attempts to mitigate counterparty credit risk by entering into OTC Derivatives only with counterparties it believes to be of good credit quality, by exchanging collateral and by monitoring the financial stability of those counterparties.
Equity total return swaps Equity total return swaps are contracts that can create long or short economic exposure to an underlying equity security. Under such a contract, one party agrees to make payments to another based on the total return of a notional amount of the underlying security (including dividends and changes in market value), in return for periodic payments from the other party based on a fixed or variable interest rate applied to the same notional amount. Equity total return swaps can also be used to hedge against exposure to specific risks associated with a particular issuer or the underlying asset of a particular issuer. Investments in equity total return swaps may include certain risks including unfavorable price movements in the underlying reference instrument(s), or a default or failure by the counterparty.
The value of equity total return swaps changes daily based on the value of the underlying equity security. Changes in the market value of equity total return swaps are recorded as unrealized appreciation or depreciation in the Consolidated Statement of Operations. Realized gains and losses on equity total return swaps are recorded in the Consolidated Statement of Operations upon exchange of cash flows for periodic payments and upon the closing or expiration of the swaps.
The Fund entered into equity total return swaps to gain exposure to particular issuers. During the six months ended June 30, 2019, these equity total return swaps had U.S. dollar notional values up to 1% of net assets.
The Fund also entered into equity total return swaps to hedge against specific risks associated with underlying investments of a
particular issuer. During the six months ended June 30, 2019, these equity total return swaps had U.S. dollar notional values up to 1% of net assets.
Futures contracts Futures contracts involve an obligation to purchase or sell (depending on whether the Fund has entered a long or short futures contract, respectively) an asset at a future date, at a price set at the time of the contract. Upon entering into a futures contract, the Fund is required to deposit an amount of cash or liquid assets (referred to as initial margin) in a segregated account with the clearing broker. Subsequent payments (referred to as variation margin) to and from the clearing broker are made on a daily basis based on changes in the market value of futures contracts. Futures contracts are traded publicly and their market value changes daily. Changes in the market value of open futures contracts are recorded as unrealized appreciation or depreciation in the Consolidated Statement of Operations. Realized gains and losses on futures contracts are recorded in the Consolidated Statement of Operations at the closing or expiration of the contracts. Cash deposited with a broker as initial margin is recorded in the Consolidated Statement of Assets and Liabilities. A receivable and/or payable to brokers for daily variation margin is also recorded in the Consolidated Statement of Assets and Liabilities.
Investments in futures contracts may include certain risks, which may be different from, and potentially greater than, those of the underlying securities. To the extent the Fund uses futures, it is exposed to additional volatility and potential losses resulting from leverage.
The Fund entered into long S&P 500 futures contracts to provide equity exposure that approximates the Fund’s “net cash and other” position, which includes cash, short-term investments, receivables, and payables. During the six months ended June 30, 2019, these S&P 500 futures contracts had notional values up to 3% of net assets.
Currency forward contractsA currency forward contract represents an obligation to purchase or sell a specific foreign currency at a future date at a price set at the time of the contract. The values of currency forward contracts are adjusted daily based on the prevailing forward exchange rates of the underlying currencies. Changes in the value of open contracts are recorded as unrealized appreciation or depreciation in the Consolidated Statement of Operations. When a currency forward contract is closed, the Fund records a realized gain or loss in the Consolidated Statement of Operations equal to the difference between the value at the time the contract was opened and the value at the time it was closed.
Losses from these transactions may arise from unfavorable changes in currency values or if a counterparty does not perform under a contract’s terms.
The Fund entered into currency forward contracts to hedge direct and/or indirect foreign currency exposure to the Chinese yuan renminbi and Swiss franc. During the six months ended June 30, 2019, these currency forward contracts had U.S. dollar total values ranging from 5% to 7% of net assets.
PAGE 14§ DODGE & COX GLOBAL STOCK FUND
NOTES TO CONSOLIDATED FINANCIAL STATEMENTS(unaudited)
Additional derivative information For financial reporting purposes, the Fund does not offset OTC Derivative assets and liabilities that are subject to a master netting arrangement in the Consolidated Statement of Assets and Liabilities. OTC Derivatives are presented in the Consolidated Statement of Assets and Liabilities as unrealized appreciation/depreciation on currency forward contracts and unrealized appreciation/depreciation on swaps. Cash collateral pledged or received by the Fund for OTC Derivatives is reported gross in the Consolidated Statement of Assets and Liabilities as cash pledged/(received) as collateral for OTC Derivatives. Derivative information by counterparty is presented in the Consolidated Portfolio of Investments.
The netting of assets and liabilities and the offsetting of collateral pledged or received are based on contractualnetting/set-off provisions in the ISDA master agreement. The following table presents the Fund’s net exposure for OTC Derivatives that are subject to enforceable master netting arrangements as of June 30, 2019. The net amount represents the receivable from (payable to) the counterparty in the event of a default.
| | | | | | | | | | | | | | | | |
| Counterparty | | Derivative
Assets | | | Derivative
Liabilities | | | Cash
Collateral
Pledged /
(Received)(a) | | | Net
Amount | |
Bank of America | | $ | 415,799 | | | $ | — | | | $ | (415,799 | ) | | $ | — | |
Barclays | | | 536,060 | | | | (344,338 | ) | | | (191,722 | ) | | | — | |
Citibank | | | 313,256 | | | | (1,203,988 | ) | | | 660,000 | | | | (230,732 | ) |
Credit Suisse | | | 370,062 | | | | (422,129 | ) | | | — | | | | (52,067 | ) |
Goldman Sachs | | | 447,535 | | | | (562,423 | ) | | | — | | | | (114,888 | ) |
HSBC | | | 609,417 | | | | (576,883 | ) | | | (32,534 | ) | | | — | |
JPMorgan(b) | | | 980,684 | | | | (5,101,071 | ) | | | 4,120,387 | | | | — | |
Morgan Stanley | | | — | | | | (3,842,939 | ) | | | 3,842,939 | | | | — | |
State Street | | | 527,208 | | | | (199,662 | ) | | | (327,546 | ) | | | — | |
UBS | | | 121,600 | | | | — | | | | — | | | | 121,600 | |
| | | | | | | | | | | | | | | | |
Total | | $ | 4,321,621 | | | $ | (12,253,433 | ) | | $ | 7,655,725 | | | $ | (276,087 | ) |
| | | | | | | | | | | | | | | | |
| | | | | | | | | | | | | | | | | |
| (a) | Cash collateral pledged/(received) in excess of OTC Derivative assets/liabilities, if any, is not presented. Total cash collateral pledged/(received) is presented in the Consolidated Statement of Assets and Liabilities. |
| (b) | Includes OTC swaps and currency forward contracts. |
NOTE 4—RELATED PARTY TRANSACTIONS
Management fees Under a written agreement approved by a unanimous vote of the Board of Trustees, the Fund pays a management fee monthly at an annual rate of 0.60% of the Fund’s average daily net assets to Dodge & Cox, investment manager of the Fund.
Fund officers and trustees All officers and two of the trustees of the Trust are officers or employees of Dodge & Cox. The Trust pays a fee only to those trustees who are not affiliated with Dodge & Cox.
NOTE 5—INCOME TAX INFORMATION AND DISTRIBUTIONS TO SHAREHOLDERS
A provision for federal income taxes is not required since the Fund intends to qualify as a regulated investment company under Subchapter M of the Internal Revenue Code and distribute all of its taxable income to shareholders. Distributions are determined in
accordance with income tax regulations, and such amounts may differ from net investment income and realized gains for financial reporting purposes. The Fund may also designate a portion of the amount paid to redeeming shareholders as a distribution for tax purposes. Financial reporting records are adjusted for permanent book to tax differences at year end to reflect tax character. Book to tax differences are primarily due to differing treatments of wash sales, net short-term realized gain (loss), foreign currency realized gain (loss), foreign capital gains tax, certain corporate action transactions, derivatives, and distributions.
Distributions during the periods noted below were characterized as follows for federal income tax purposes:
| | | | | | | | |
| | | Six Months Ended
June 30, 2019 | | | Year Ended December 31, 2018 | |
Ordinary income | | | — | | | $ | 194,859,210 | |
| | | | | | ($ | 0.273 per share | ) |
Long-term capital gain | | | — | | | $ | 575,373,634 | |
| | | | | | ($ | 0.806 per share | ) |
The components of distributable earnings on a tax basis are reported as of the Fund’s most recent year end. At December 31, 2018, the tax basis components of distributable earnings were as follows:
| | | | |
Undistributed ordinary income | | $ | 5,895,860 | |
Undistributed long-term capital gain | | | 221,964,846 | |
At June 30, 2019, unrealized appreciation and depreciation for investments and derivatives based on cost for federal income tax purposes were as follows:
| | | | |
Tax cost | | $ | 8,759,001,723 | |
| | | | |
Unrealized appreciation | | | 1,946,058,752 | |
Unrealized depreciation | | | (1,033,452,320 | ) |
| | | | |
Net unrealized appreciation | | | 912,606,432 | |
| | | | | |
Fund management has reviewed the tax positions for open periods (three years and four years, respectively, from filing the Fund’s Federal and State tax returns) as applicable to the Fund, and has determined that no provision for income tax is required in the Fund’s financial statements.
NOTE 6—LOAN FACILITIES
Pursuant to an exemptive order issued by the Securities and Exchange Commission (SEC), the Fund may participate in an interfund lending facility (Facility). The Facility allows the Fund to borrow money from or loan money to the Funds. Loans under the Facility are made for temporary or emergency purposes, such as to fund shareholder redemption requests. Interest on borrowings is the average of the current repurchase agreement rate and the bank loan rate. There was no activity in the Facility during the period.
All Funds in the Trust participate in a $500 million committed credit facility (Line of Credit) with State Street Bank and Trust Company, to be utilized for temporary or emergency purposes to fund shareholder redemptions or for other short-term
DODGE & COX GLOBAL STOCK FUND§PAGE 15
NOTES TO CONSOLIDATED FINANCIAL STATEMENTS(unaudited)
liquidity purposes. The maximum amount available to the Fund is $250 million. Each Fund pays an annual commitment fee on itspro-rata portion of the Line of Credit. For the six months ended June 30, 2019, the Fund’s commitment fee amounted to $30,235 and is reflected as a Miscellaneous Expense in the Consolidated Statement of Operations. Interest on borrowings is charged at the prevailing rate. There were no borrowings on the Line of Credit during the period.
NOTE 7—PURCHASES AND SALES OF INVESTMENTS
For the six months ended June 30, 2019, purchases and sales of securities, other than short-term securities, aggregated $1,249,937,395 and $1,139,209,217, respectively.
NOTE 8—SUBSEQUENT EVENTS
Fund management has determined that no material events or transactions occurred subsequent to June 30, 2019, and through the date of the Fund’s financial statements issuance, which require additional disclosure in the Fund’s financial statements.
PAGE 16§ DODGE & COX GLOBAL STOCK FUND
CONSOLIDATED FINANCIAL HIGHLIGHTS(unaudited)
| | | | | | | | | | | | | | | | | | | | | | | | |
SELECTED DATA AND RATIOS (for a share outstanding throughout each period) | | Six Months Ended
June 30, | | | Year Ended December 31, | |
| | | 2019 | | | 2018 | | | 2017 | | | 2016 | | | 2015 | | | 2014 | |
| | | | | | | | |
Net asset value, beginning of period | | | $11.03 | | | | $13.86 | | | | $11.91 | | | | $10.46 | | | | $11.83 | | | | $11.48 | |
Income from investment operations: | | | | | | | | | | | | | | | | | | | | | | | | |
Net investment income | | | 0.19 | | | | 0.21 | | | | 0.13 | | | | 0.14 | | | | 0.16 | | | | 0.16 | |
Net realized and unrealized gain (loss) | | | 1.16 | | | | (1.96 | ) | | | 2.42 | | | | 1.65 | | | | (1.11 | ) | | | 0.64 | |
| | | | | | | | |
Total from investment operations | | | 1.35 | | | | (1.75 | ) | | | 2.55 | | | | 1.79 | | | | (0.95 | ) | | | 0.80 | |
| | | | | | | | |
Distributions to shareholders from: | | | | | | | | | | | | | | | | | | | | | | | | |
Net investment income | | | — | | | | (0.25 | ) | | | (0.13 | ) | | | (0.14 | ) | | | (0.19 | ) | | | (0.15 | ) |
Net realized gain | | | — | | | | (0.83 | ) | | | (0.47 | ) | | | (0.20 | ) | | | (0.23 | ) | | | (0.30 | ) |
| | | | | | | | |
Total distributions | | | — | | | | (1.08 | ) | | | (0.60 | ) | | | (0.34 | ) | | | (0.42 | ) | | | (0.45 | ) |
| | | | | | | | |
Net asset value, end of period | | | $12.38 | | | | $11.03 | | | | $13.86 | | | | $11.91 | | | | $10.46 | | | | $11.83 | |
| | | | | | | | |
Total return | | | 12.24 | % | | | (12.65 | )% | | | 21.51 | % | | | 17.09 | % | | | (8.05 | )% | | | 6.95 | % |
Ratios/supplemental data: | | | | | | | | | | | | | | | | | | | | | | | | |
Net assets, end of period (millions) | | | $9,711 | | | | $8,614 | | | | $9,911 | | | | $7,101 | | | | $5,708 | | | | $5,895 | |
Ratio of expenses to average net assets | | | 0.62 | %(a) | | | 0.62 | % | | | 0.63 | % | | | 0.63 | % | | | 0.63 | % | | | 0.65 | % |
Ratio of net investment income to average net assets | | | 3.18 | %(a) | | | 1.52 | % | | | 1.02 | % | | | 1.36 | % | | | 1.39 | % | | | 1.42 | % |
Portfolio turnover rate | | | 12 | % | | | 31 | % | | | 18 | % | | | 25 | % | | | 20 | % | | | 17 | % |
See accompanying Notes to Consolidated Financial Statements
DODGE & COX GLOBAL STOCK FUND§PAGE 17
FUND HOLDINGS
The Fund provides a complete list of its holdings on a quarterly basis by filing the lists with the SEC on Form N-CSR (as of the end of the second and fourth quarters) and on Part F of FormN-PORT (as of the end of the first and third quarters). Shareholders may view the Fund’s Form N-CSR and Part F of Form N-PORT on the SEC’s website at sec.gov. A list of the Fund’s quarter-end holdings is also available at dodgeandcox.com on or about the 15th day following each quarter end and remains available on the website until the list is updated for the subsequent quarter.
PROXY VOTING
For a free copy of the Fund’s proxy voting policies and procedures, please call 800-621-3979, visit the Fund’s website at dodgeandcox.com, or visit the SEC’s website at sec.gov. Information regarding how the Fund voted proxies relating to portfolio securities during the most recent 12-month period ending June 30 is also available at dodgeandcox.com or at sec.gov.
HOUSEHOLD MAILINGS
The Fund routinely mails shareholder reports and summary prospectuses to shareholders and, on occasion, proxy statements. In order to reduce the volume of mail, when possible, only one copy of these documents will be sent to shareholders who are part of the same family and share the same residential address.
If you have a direct account with the Funds and you do not want the mailing of shareholder reports and summary prospectuses combined with other members in your household, contact the Funds at 800-621-3979. Your request will be implemented within 30 days.
PAGE 18§ DODGE & COX GLOBAL STOCK FUND
THIS PAGE INTENTIONALLY LEFT BLANK
DODGE & COX GLOBAL STOCK FUND§PAGE 19
dodgeandcox.com
For Fund literature, transactions, and account information, please visit the Funds’ website.
or write or call:
DODGE & COX FUNDS
c/o DST Asset Manager Solutions, Inc.
P.O. Box 219502
Kansas City, Missouri 64121-9502
(800) 621-3979
INVESTMENT MANAGER
Dodge & Cox
555 California Street, 40th Floor
San Francisco, California 94104
(415) 981-1710
This report is submitted for the general information of the shareholders of the Fund. The report is not authorized for distribution to prospective investors in the Fund unless it is accompanied by a current prospectus.
This report reflects our views, opinions, and portfolio holdings as of June 30, 2019, the end of the reporting period. Any such views are subject to change at any time based upon market or other conditions and Dodge & Cox disclaims any responsibility to update such views. These views may not be relied on as investment advice and, because investment decisions for a Dodge & Cox Fund are based on numerous factors, may not be relied on as an indication of trading intent on behalf of any Dodge & Cox Fund.

DODGE & COX FUNDS®
Semi-Annual Report
June 30, 2019
International Stock Fund
ESTABLISHED 2001
TICKER: DODFX
Important Notice:
Beginning on January 1, 2021, we intend to discontinue mailing paper copies of the Fund’s shareholder reports as permitted by new regulations adopted by the Securities and Exchange Commission, unless you specifically request paper copies from Dodge & Cox Funds or from your financial intermediary, such as a broker-dealer or bank. The reports will remain available to you on the Dodge & Cox Funds website (dodgeandcox.com), and you will be notified by mail each time a report is posted and provided with a link to access the report.
If you have already elected to receive shareholder reports electronically, you will not be affected by this change and do not need to take any action. If you have not done so already, you may elect to receive shareholder reports and other communications electronically by enrolling ine-delivery on the Funds website, or, if you are invested through a financial intermediary, by updating your mailing preferences through the intermediary.
If you wish to continue receiving paper copies of all future shareholder reports, please contact us at (800)621-3979. Reports will be provided to you free of charge. If you are invested through a financial intermediary, you may contact your financial intermediary to request to receive paper copies. Your election to receive reports in paper form will apply to all funds held with Dodge & Cox Funds or through your financial intermediary, as applicable.
6/19 ISF SAR  Printed on recycled paper
TO OUR SHAREHOLDERS
The Dodge & Cox International Stock Fund had a total return of 12.9% for the six months ended June 30, 2019, compared to a return of 14.0% for the MSCI EAFE (Europe, Australasia, Far East) Index.
MARKET OVERVIEW
International equity markets rebounded strongly over the first half of 2019, with every developed market country and most emerging market countries posting positive equity returns. While international equities have performed well in the short term, two themes have persisted over the past decade. First, international equities have significantly underperformed U.S. equities; and second, value stocks have lagged growth stocks.(a)
A COMPELLING STARTING POINT FOR INTERNATIONAL EQUITIES
Over the past 10 years, the U.S. equity market’s annualized total return was more than double that of international developed markets: the S&P 500 Index returned an average of 14.7% per annum compared to 6.9% for the MSCI EAFE.
While earnings growth has been higher in the United States over the past decade, the current valuation spread between the U.S. and international equity markets is now near a15-year high. The MSCI EAFE is trading at an attractive valuation of 13.5 times forward earnings, versus the S&P 500 at 17.3 times.(b)
The Fund’s portfolio is trading at an even more compelling 11.3 times forward earnings. History has demonstrated that starting valuations are significant drivers of long-term equity returns and lower starting valuations tend to produce more attractive long-term results. In addition, many of the Fund’s holdings have the potential to improve profitability and return meaningful amounts of capital to shareholders through dividends and share buybacks. We believe this combination provides a strong foundation for long-term returns.
AN OPPORTUNE TIME TO BE INVESTED IN VALUE STOCKS
The underperformance of value stocks has been another prominent trend in international markets. The MSCI EAFE Growth Index has outpaced the MSCI EAFE Value Index by 50 percentage points over the past decade, largely because of a valuation decline for the MSCI EAFE Value.(c) Earnings growth and dividend yield in total were actually quite similar for both the growth and value indices. In this context, the valuation gap is unusually wide: 18.6 times forward earnings for MSCI EAFE Growth versus 10.4 times for MSCI EAFE Value.
Investors are paying significant premiums for companies perceived to be more stable and less exposed to macro factors, such as interest rates, while steeply discounting companies with greater macro sensitivity and volatility. For example, Consumer Staples (the largest sector in the MSCI EAFE Growth) trades at 18.4 times forward earnings compared to 10.2 times for Financials (the largest sector in the MSCI EAFE Value) and 10.8 times for Energy.
The Fund is not finding many opportunities in Consumer Staples but recently added to holdings in the Financials and Energy sectors.
While global Consumer Staples companies may appear to be “safe” investments, their higher starting valuations may make them less so. In addition, the elements that have historically underpinned their stability are coming under threat. For example, the rise of ecommerce, digital advertising, and social media platforms allows newer and smaller brands to overcome historical barriers to entry, such as mass market media and physical shelf space. Given premium valuations and competitive threats, the Fund is significantly underweight Consumer Staples: 0.7% compared to 11.7% for the MSCI EAFE.
Financials
In contrast, the Financials sector embodies investors’ concerns about the macro picture (e.g., low interest rates, low global growth) and, as a result, exhibits higher stock price volatility. Financials constituted 29.6% of the Fund on June 30, with the majority of that invested in Europe and the United Kingdom.(d) The Fund’s European Financials have been a large detractor from performance for several years, mostly due to valuation compression; however, earnings have improved in aggregate. Our global industry analysts have retested our views by incorporating input from our macro research team, learnings from industry conferences, and insights from meetings with senior management teams of these companies, competitors, regulators, central bankers, and policymakers. Based on this work, we continue to believe the Fund’s European Financials investments represent some of the best long-term opportunities currently available in the market.
These companies are more resilient today than they were in previous periods of economic stress when valuations were at similar levels. They have greatly improved their underlying fundamentals by strengthening their balance sheets and increasing capital ratios, while pursuing initiatives to improve profitability. Hence, on abottom-up basis, we recently added to the Fund’s positions in BNP Paribas, Credit Suisse Group, and UniCredit.(e) While our baseline expectation is for a prolonged period of low growth and low interest rates in Europe, any improvement in the macroeconomic backdrop, notably higher interest rates, could drive further upside.
Credit Suisse — a 2.0% position in the Fund — is a leading global wealth manager with attractive growth opportunities serving ultra-high net worth clients. The company recently completed a four-year restructuring program, which resulted in significant asset disposals, cost cuts, and balance sheet recapitalization. Significant litigation liabilities are largely behind the company. Today, Credit Suisse is increasingly generating clean earnings and distributing capital through dividends and share buybacks. Yet, the company trades at eight times forward earnings, and we believe that over a longer-term horizon the company should be able to grow at attractive rates.
PAGE 2§ DODGE & COX INTERNATIONAL STOCK FUND
Energy
Energy is another large sector of the MSCI EAFE Value. While the short-term direction of oil prices is difficult to forecast, the long-term fundamentals of supply and demand are constructive. We believe global demand will continue to grow at roughly 1% per year, or around 1.0 to 1.5 million additional barrels per day. From a supply perspective, U.S. shale oil growth is currently robust, but the rate of growth should taper as U.S. shale producers shift their priority from growing production to generating free cash flow. The rest of the industry will need to reinvest at higher rates to counteract the natural decline from existing fields and to meet new demand growth. It is likely that an oil price at or above current levels will be needed to incentivize that higher level of investment.
When evaluating energy stocks, we look for companies with assets that are on the low end of the global cost curve, management teams that have deployed capital prudently through the cycle, andlow-to-reasonable valuations. We continue to find compelling long-term opportunities in selected upstream and oilfield services companies with these characteristics. On abottom-up basis, we recently added to Equinor and Total, among other holdings.
Equinor, a leading offshore operator with strong positions in Norway and Brazil, is more sensitive to low oil prices than its peers because the company does not have a significant downstream business to help hedge against lower oil prices. Since the oil downturn in 2014, the management team has shrewdly invested both organically and via acquisition to improve the quality and profitability of its upstream portfolio. The company’s biggest projects are globally attractive. For example, its massive Johan Sverdrup oil field in Norway and its upcoming projects in Brazil are some of the lowest cost in the world. However, volatile commodity prices and macro concerns have weighed on Equinor’s valuation over the past year. At 10 times forward earnings, Equinor trades at an inexpensive valuation, despite the company’s improving outlook. On June 30, Equinor was a 1.7% position in the Fund.
IN CLOSING
We have strong conviction in our value-oriented, active investment approach. While the last decade has been challenging for value investors, the Fund has outperformed the international value investment universe by 34 percentage points.(f) Looking forward, we are optimistic about the long-term outlook for the Fund, which remains tilted toward sectors poised to benefit from a rebound in value stocks, such as Financials and Energy. As share prices and currencies can be volatile in the short term, we encourage shareholders to remain focused on the long term.
Thank you for your continued confidence in our firm. As always, we welcome your comments and questions.
For the Board of Trustees,
| | |
 | |  |
Charles F. Pohl, Chairman | | Dana M. Emery, President |
July 31, 2019
| (a) | | Value stocks are the lower valuation portion of the equity market, and growth stocks are the higher valuation portion. |
| (b) | | Unless otherwise specified, all weightings and characteristics are as of June 30, 2019. |
| (c) | | The MSCI EAFE Growth Index had a total return of 120.6% compared to 70.8% for the MSCI EAFE Value Index from June 30, 2009 through June 30, 2019. |
| (d) | | On June 30, Financials accounted for 29.6% and European and UK Financials represented 21.3% of the Fund’s net assets. |
| (e) | | The use of specific examples does not imply that they are more or less attractive investments than the portfolio’s other holdings. |
| (f) | | The Dodge & Cox International Stock Fund had a cumulative total return of 104.5% compared to 70.8% for the MSCI EAFE Value from June 30, 2009 through June 30, 2019. |
DODGE & COX INTERNATIONAL STOCK FUND§PAGE 3
YEAR-TO-DATE PERFORMANCE REVIEW
The Fund underperformed the MSCI EAFE by 1.2 percentage points year to date.
Key Detractors from Relative Results
| | § | | In European and UK Financials, the Fund’s average overweight position (22% versus 12% for the MSCI EAFE) and holdings detracted from performance. Societe Generale (down 15%), UBS Group (up 1%), and Barclays (up 2%) especially hurt results. | |
| | § | | Within Communication Services, several holdings were key detractors, including Grupo Televisa (down 32%), Baidu (down 26%), and Millicom (down 9%). | |
| | § | | The Fund’s average overweight position (16% versus 11% for the MSCI EAFE) and underperformance in the Health Care sector hampered results. Sanofi (up 3%) and Bayer (up 4%) were relative detractors. | |
| | § | | Additional detractors included Cemex (down 11%) and Equinor (down 5%). | |
Key Contributors to Relative Results
| | § | | In Japan, the worst-performing region of the MSCI EAFE, the Fund’s average underweight position and stock selection contributed to favorable results (up 13% compared to up 8% for the MSCI EAFE). Kyocera (up 31%) performed well. | |
| | § | | Several holdings contributed to returns in the Industrials sector, especially Johnson Controls International (up 41%) and Schneider Electric (up 36%). | |
| | § | | In the best-performing sector of the MSCI EAFE, the Fund’s overweight position and holdings selection in Information Technology enhanced returns. Micro Focus (up 53%) and TE Connectivity (up 28%) were key contributors. | |
| | § | | JD.com (up 45%), Linde (up 28%), Liberty Global (up 29%), Naspers (up 25%), and ICICI Bank (up 23%) also contributed. | |
KEY CHARACTERISTICS OF DODGE & COX
Independent Organization
Dodge & Cox is one of the largest privately owned investment managers in the world. We remain committed to independence, with a goal of providing the highest quality investment management service to our existing clients.
Over 85 Years of Investment Experience
Dodge & Cox was founded in 1930. We have a stable and well-qualified team of investment professionals, most of whom have spent their entire careers at Dodge & Cox.
Experienced Investment Team
The International Equity Investment Committee, which is the decision-making body for the International Stock Fund, is a nine-member committee with an average tenure at Dodge & Cox of 24 years.
One Business with a Single Research Office
Dodge & Cox manages equity (domestic, international, and global), fixed income (domestic and global), and balanced investments, operating from one office in San Francisco.
Consistent Investment Approach
Our team decision-making process involves thorough, bottom-up fundamental analysis of each investment.
Long-Term Focus and Low Expenses
We invest with a three- to five-year investment horizon, which has historically resulted in low turnover relative to our peers. We manage Funds that maintain low expense ratios.
Risks: The Fund is subject to market risk, meaning holdings in the Fund may decline in value for extended periods due to the financial prospects of individual companies, or due to general market and economic conditions. Investing in non-U.S. securities may entail risk due to foreign economic and political developments; this risk may be increased when investing in emerging markets. The Fund is also subject to currency risk. Please read the prospectus and summary prospectus for specific details regarding the Fund’s risk profile.
PAGE 4§ DODGE & COX INTERNATIONAL STOCK FUND
GROWTH OF $10,000 OVER 10 YEARS
FOR AN INVESTMENT MADE ON JUNE 30, 2009
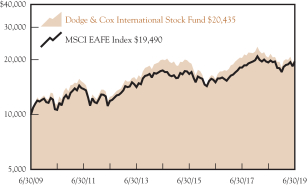
AVERAGE ANNUAL TOTAL RETURN
FOR PERIODS ENDED JUNE 30, 2019
| | | | | | | | | | | | | | | | |
| | | 1 Year | | | 3 Years | | | 5 Years | | | 10 Years | |
Dodge & Cox International
Stock Fund | | | –0.31 | % | | | 9.31 | % | | | 0.42 | % | | | 7.41 | % |
MSCI EAFE Index | | | 1.08 | | | | 9.11 | | | | 2.25 | | | | 6.90 | |
Returns represent past performance and do not guarantee future results. Investment return and share price will fluctuate with market conditions, and investors may have a gain or loss when shares are sold. Fund performance changes over time and currently may be significantly lower than stated. Performance is updated and published monthly. Visit the Fund’s website at dodgeandcox.com or call800-621-3979 for current performance figures.
The Fund’s total returns include the reinvestment of dividend and capital gain distributions, but have not been adjusted for any income taxes payable by shareholders on these distributions or on Fund share redemptions. Index returns include dividends but, unlike Fund returns, do not reflect fees or expenses. The MSCI EAFE (Europe, Australasia, Far East) Index is a broad-based, unmanaged equity market index aggregated from 21 developed market country indices, excluding the United States and Canada. MSCI makes no express or implied warranties or representations and shall have no liability whatsoever with respect to any MSCI data contained herein. The MSCI data may not be further redistributed or used as a basis for other indices or any securities or financial products. This report is not approved, reviewed, or produced by MSCI.
MSCI EAFE is a service mark of MSCI Barra.
FUND EXPENSE EXAMPLE
As a Fund shareholder, you incur ongoing Fund costs, including management fees and other Fund expenses. All mutual funds have ongoing costs, sometimes referred to as operating expenses. The following example shows ongoing costs of investing in the Fund and can help you understand these costs and compare them with those of other mutual funds. The example assumes a $1,000 investment held for the six months indicated.
ACTUAL EXPENSES
The first line of the table below provides information about actual account values and expenses based on the Fund’s actual returns. You may use the information in this line, together with your account balance, to estimate the expenses that you paid over the period. Simply divide your account value by $1,000 (for example, an $8,600 account value divided by $1,000 = 8.6), then multiply the result by the number in the first line under the heading “Expenses Paid During Period” to estimate the expenses you paid on your account during this period.
HYPOTHETICAL EXAMPLE FOR COMPARISON WITH OTHER MUTUAL FUNDS
Information on the second line of the table can help you compare ongoing costs of investing in the Fund with those of other mutual funds. This information may not be used to estimate the actual ending account balance or expenses you paid during the period. The hypothetical “Ending Account Value” is based on the actual expense ratio of the Fund and an assumed 5% annual rate of return before expenses (not the Fund’s actual return). The amount under the heading “Expenses Paid During Period” shows the hypothetical expenses your account would have incurred under this scenario. You can compare this figure with the 5% hypothetical examples that appear in shareholder reports of other mutual funds.
| | | | | | | | | | | | |
Six Months Ended
June 30, 2019 | | Beginning Account Value
1/1/2019 | | | Ending Account Value
6/30/2019 | | | Expenses Paid During Period* | |
Based on Actual Fund Return | | $ | 1,000.00 | | | $ | 1,128.70 | | | $ | 3.32 | |
Based on Hypothetical 5% Yearly Return | | | 1,000.00 | | | | 1,021.67 | | | | 3.16 | |
| * | | Expenses are equal to the Fund’s annualized expense ratio of 0.63%, multiplied by the average account value over the period, multiplied by 181/365 (to reflect theone-half year period). |
The expenses shown in the table highlight ongoing costs only and do not reflect any transactional fees or account maintenance fees. Though other mutual funds may charge such fees, please note that the Fund does not charge transaction fees (e.g., redemption fees, sales loads) or universal account maintenance fees (e.g., small account fees).
DODGE & COX INTERNATIONAL STOCK FUND§PAGE 5
| | | | |
| FUND INFORMATION (unaudited) | | | June 30, 2019 | |
| | | | |
| GENERAL INFORMATION | | | |
Net Asset Value Per Share | | | $41.66 | |
Total Net Assets (billions) | | | $49.9 | |
Expense Ratio | | | 0.63% | |
Portfolio Turnover Rate (1/1/19 to 6/30/19, unannualized) | | | 8% | |
30-Day SEC Yield(a) | | | 2.47% | |
Active Share(b) | | | 88% | |
Number of Companies | | | 66 | |
Fund Inception | | | 2001 | |
No sales charges or distribution fees | | | | |
Investment Manager: Dodge & Cox, San Francisco. Managed by the International Equity Investment Committee, whose nine members’ average tenure at Dodge & Cox is 24 years.
| | | | | | | | |
| PORTFOLIO CHARACTERISTICS | | Fund | | | MSCI
EAFE | |
Median Market Capitalization (billions) | | | $33 | | | | $10 | |
Weighted Average Market | | | | | | | | |
Capitalization (billions) | | | $72 | | | | $61 | |
Price-to-Earnings Ratio(c) | | | 11.3x | | | | 13.5x | |
Countries Represented | | | 23 | | | | 21 | |
Emerging Markets (Brazil, China, India, | | | | | | | | |
Mexico, Russia, South Africa, South Korea, | | | | | | | | |
Thailand, Turkey, United Arab
Emirates)(d)(g) | | | 21.3% | | | | 0.0% | |
| | | | |
| TEN LARGEST HOLDINGS (%)(e) | | Fund | |
Liberty Global PLC (United Kingdom) | | | 3.1 | |
ICICI Bank, Ltd.(India) | | | 3.0 | |
Roche Holding AG (Switzerland) | | | 3.0 | |
Naspers, Ltd.(South Africa)(d) | | | 2.9 | |
Sanofi (France) | | | 2.9 | |
Novartis AG(Switzerland) | | | 2.8 | |
Samsung Electronics Co., Ltd.(South Korea) | | | 2.7 | |
BNP Paribas SA(France) | | | 2.6 | |
Bayer AG(Germany) | | | 2.6 | |
Mitsubishi Electric Corp.(Japan) | | | 2.6 | |
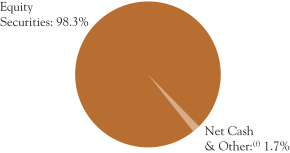
| | | | | | | | |
| REGION DIVERSIFICATION (%)(d)(g) | | Fund | | | MSCI
EAFE | |
Europe (excluding United Kingdom) | | | 39.9 | | | | 46.3 | |
United Kingdom | | | 16.1 | | | | 16.8 | |
Asia Pacific (excluding Japan) | | | 11.6 | | | | 12.7 | |
Japan | | | 10.7 | | | | 23.7 | |
United States | | | 7.7 | | | | 0.0 | |
Latin America | | | 5.8 | | | | 0.0 | |
Africa | | | 3.6 | | | | 0.0 | |
Canada | | | 2.7 | | | | 0.0 | |
Middle East | | | 0.3 | | | | 0.6 | |
| | | | | | | | |
| SECTOR DIVERSIFICATION (%)(d) | | Fund | | | MSCI
EAFE | |
Financials | | | 29.6 | | | | 18.9 | |
Health Care | | | 15.8 | | | | 11.2 | |
Consumer Discretionary | | | 9.6 | | | | 11.1 | |
Information Technology | | | 9.3 | | | | 6.7 | |
Industrials | | | 8.7 | | | | 14.8 | |
Energy | | | 8.7 | | | | 5.6 | |
Communication Services | | | 7.9 | | | | 5.4 | |
Materials | | | 6.3 | | | | 7.4 | |
Utilities | | | 1.0 | | | | 3.6 | |
Consumer Staples | | | 0.7 | | | | 11.7 | |
Real Estate | | | 0.6 | | | | 3.6 | |
| (a) | SEC Yield is an annualization of the Fund’s net investment income for the trailing 30-day period. Dividends paid by the Fund may be higher or lower than implied by the SEC Yield. |
| (b) | Active share is a measure of how much an investment portfolio differs from its benchmark index, based on a scale of 0% (complete overlap with the index) to 100% (no overlap). Overlap for each security in the Fund is the lower of either its percentage weight in the Fund or its percentage weight in the relevant index. Active share is calculated as 100% minus the sum of the overlapping security weights. |
| (c) | Price-to-earnings (P/E) ratios are calculated using 12-month forward earnings estimates from third-party sources. |
| (d) | Includes the Fund’s Naspers common equity market value as well as the market value of a synthetic position in “core Naspers” (i.e. Naspers excluding its holdings of Tencent), which comprises a long total return swap in Naspers common equity and a short total return swap in Tencent common equity, each with similar notional values. For context, Naspers owns a 31% stake in Tencent. |
| (e) | The Fund’s portfolio holdings are subject to change without notice. The mention of specific securities is not a recommendation to buy, sell, or hold any particular security and is not indicative of Dodge & Cox’s current or future trading activity. |
| (f) | Net Cash & Other includes cash, short-term investments, derivatives, receivables, and payables. |
| (g) | The Fund may classify a company in a different category than the MSCI EAFE. The Fund generally classifies a company based on its country of incorporation, but may designate a different country in certain circumstances. |
PAGE 6§ DODGE & COX INTERNATIONAL STOCK FUND
| | | | |
| CONSOLIDATED PORTFOLIO OF INVESTMENTS (unaudited) | | | June 30, 2019 | |
| | | | | | | | |
| COMMON STOCKS: 92.8% | | | | | | |
| | |
| | | SHARES | | | VALUE | |
| COMMUNICATION SERVICES: 7.9% | | | | | |
MEDIA & ENTERTAINMENT: 6.1% | | | | | | | | |
Altice Europe NV, Series A(a) (Netherlands) | | | 36,127,677 | | | $ | 129,774,208 | |
Baidu, Inc. ADR(a) (Cayman Islands/China) | | | 6,750,287 | | | | 792,213,682 | |
Grupo Televisa SAB ADR (Mexico) | | | 51,663,380 | | | | 436,038,927 | |
Liberty Global PLC, Series A(a)(b)(United Kingdom) | | | 18,353,503 | | | | 495,361,046 | |
Liberty Global PLC, Series C(a) (United Kingdom) | | | 40,231,401 | | | | 1,067,339,068 | |
MultiChoice Group, Ltd.(a)(South Africa) | | | 8,436,537 | | | | 80,244,435 | |
Television Broadcasts, Ltd.(b)(Hong Kong) | | | 39,842,700 | | | | 66,611,066 | |
| | | | | | | | |
| | | | 3,067,582,432 | |
TELECOMMUNICATION SERVICES: 1.8% | | | | | |
America Movil SAB de CV, Series L (Mexico) | | | 377,147,500 | | | | 274,896,439 | |
Millicom International Cellular SA SDR(b)(Luxembourg) | | | 6,483,836 | | | | 364,823,346 | |
MTN Group, Ltd. (South Africa) | | | 33,703,580 | | | | 255,438,918 | |
| | | | | | | | |
| | | | 895,158,703 | |
| | | | | | | | |
| | | | 3,962,741,135 | |
| CONSUMER DISCRETIONARY: 9.7% | |
AUTOMOBILES & COMPONENTS: 3.3% | |
Bayerische Motoren Werke AG (Germany) | | | 8,101,801 | | | | 599,645,483 | |
Honda Motor Co., Ltd. (Japan) | | | 29,310,955 | | | | 757,139,634 | |
Yamaha Motor Co., Ltd. (Japan) | | | 15,317,700 | | | | 272,071,563 | |
| | | | | | | | |
| | | | 1,628,856,680 | |
RETAILING: 6.4% | | | | | | | | |
Alibaba Group Holding, Ltd. ADR(a)(Cayman Islands/China) | | | 2,871,100 | | | | 486,507,895 | |
Booking Holdings, Inc.(a)(United States) | | | 315,500 | | | | 591,471,005 | |
JD.com, Inc. ADR(a) (Cayman Islands/China) | | | 19,982,648 | | | | 605,274,408 | |
Naspers, Ltd. (South Africa) | | | 6,159,058 | | | | 1,495,280,228 | |
| | | | | | | | |
| | | | 3,178,533,536 | |
| | | | | | | | |
| | | | 4,807,390,216 | |
| CONSUMER STAPLES: 0.7% | | | | | | | | |
FOOD & STAPLES RETAILING: 0.7% | |
Magnit PJSC(b) (Russia) | | | 5,823,885 | | | | 343,845,099 | |
| | |
| ENERGY: 7.5% | | | | | | | | |
Equinor ASA (Norway) | | | 43,972,604 | | | | 868,322,907 | |
Schlumberger, Ltd. (Curacao/United States) | | | 21,466,224 | | | | 853,067,742 | |
Suncor Energy, Inc. (Canada) | | | 29,602,600 | | | | 922,417,016 | |
Total SA (France) | | | 19,609,249 | | | | 1,098,718,197 | |
| | | | | | | | |
| | | | 3,742,525,862 | |
| FINANCIALS: 27.2% | | | | | | | | |
BANKS: 19.9% | | | | | | | | |
Axis Bank, Ltd.(a) (India) | | | 41,585,425 | | | | 487,831,631 | |
Banco Santander SA (Spain) | | | 233,878,820 | | | | 1,085,183,045 | |
Barclays PLC (United Kingdom) | | | 539,887,998 | | | | 1,027,074,330 | |
BNP Paribas SA (France) | | | 27,602,158 | | | | 1,310,853,768 | |
ICICI Bank, Ltd. (India) | | | 238,763,776 | | | | 1,510,530,455 | |
Kasikornbank PCL- Foreign (Thailand) | | | 30,605,000 | | | | 189,113,801 | |
Lloyds Banking Group PLC (United Kingdom) | | | 947,117,900 | | | | 680,659,840 | |
Mitsubishi UFJ Financial Group, Inc. (Japan) | | | 145,652,900 | | | | 691,687,472 | |
Societe Generale SA (France) | | | 33,067,123 | | | | 835,486,023 | |
Standard Chartered PLC (United Kingdom) | | | 103,151,613 | | | | 935,582,862 | |
UniCredit SPA (Italy) | | | 95,046,162 | | | | 1,170,041,674 | |
| | | | | | | | |
| | | | 9,924,044,901 | |
DIVERSIFIED FINANCIALS: 4.7% | | | | | | | | |
Credit Suisse Group AG (Switzerland) | | | 83,869,332 | | | | 1,005,624,391 | |
Haci Omer Sabanci Holding AS (Turkey) | | | 41,487,354 | | | | 61,545,008 | |
UBS Group AG (Switzerland) | | | 106,645,927 | | | | 1,267,253,384 | |
| | | | | | | | |
| | | | 2,334,422,783 | |
| | | | | | | | |
| | |
| | | SHARES | | | VALUE | |
INSURANCE: 2.6% | | | | | | | | |
AEGON NV (Netherlands) | | | 115,130,329 | | | $ | 573,144,628 | |
Aviva PLC (United Kingdom) | | | 136,266,227 | | | | 720,758,256 | |
| | | | | | | | |
| | | | 1,293,902,884 | |
| | | | | | | | |
| | | | 13,552,370,568 | |
| HEALTH CARE: 15.8% | | | | | | | | |
PHARMACEUTICALS, BIOTECHNOLOGY & LIFE SCIENCES: 15.8% | |
AstraZeneca PLC (United Kingdom) | | | 14,459,800 | | | | 1,182,223,661 | |
Bayer AG (Germany) | | | 18,871,350 | | | | 1,307,688,013 | |
GlaxoSmithKline PLC (United Kingdom) | | | 54,085,800 | | | | 1,082,907,019 | |
Novartis AG (Switzerland) | | | 12,279,770 | | | | 1,122,060,525 | |
Novartis AG ADR (Switzerland) | | | 3,049,800 | | | | 278,477,238 | |
Roche Holding AG (Switzerland) | | | 5,252,500 | | | | 1,477,770,052 | |
Sanofi (France) | | | 16,776,022 | | | | 1,448,060,482 | |
| | | | | | | | |
| | | | 7,899,186,990 | |
| INDUSTRIALS: 8.7% | | | | | | | | |
CAPITAL GOODS: 8.4% | | | | | | | | |
Johnson Controls International PLC (Ireland/United States) | | | 25,854,601 | | | | 1,068,053,567 | |
Mitsubishi Electric Corp. (Japan) | | | 98,577,500 | | | | 1,297,421,254 | |
Nidec Corp. (Japan) | | | 3,600,800 | | | | 491,784,817 | |
Schneider Electric SA (France) | | | 10,817,246 | | | | 981,071,309 | |
Smiths Group PLC(b) (United Kingdom) | | | 19,001,500 | | | | 377,649,241 | |
| | | | | | | | |
| | | | 4,215,980,188 | |
TRANSPORTATION: 0.3% | | | | | | | | |
DP World Plc (United Arab Emirates) | | | 8,256,304 | | | | 131,616,673 | |
| | | | | | | | |
| | | | 4,347,596,861 | |
| INFORMATION TECHNOLOGY: 7.4% | |
SOFTWARE & SERVICES: 1.5% | | | | | | | | |
Fujitsu, Ltd. (Japan) | | | 4,030,650 | | | | 280,835,160 | |
Micro Focus International PLC(b) (United Kingdom) | | | 17,229,707 | | | | 451,620,840 | |
| | | | | | | | |
| | | | 732,456,000 | |
TECHNOLOGY, HARDWARE & EQUIPMENT: 5.9% | |
Brother Industries, Ltd. (Japan) | | | 10,314,000 | | | | 194,675,973 | |
Hewlett Packard Enterprise Co. (United States) | | | 8,859,124 | | | | 132,443,904 | |
Kyocera Corp. (Japan) | | | 13,569,200 | | | | 885,399,267 | |
Murata Manufacturing Co., Ltd. (Japan) | | | 10,012,800 | | | | 449,491,740 | |
Samsung Electronics Co., Ltd. (South Korea) | | | 9,816,650 | | | | 399,586,498 | |
TE Connectivity, Ltd. (Switzerland) | | | 9,452,685 | | | | 905,378,169 | |
| | | | | | | | |
| | | | 2,966,975,551 | |
| | | | | | | | |
| | | | 3,699,431,551 | |
| MATERIALS: 6.3% | | | | | | | | |
Akzo Nobel NV (Netherlands) | | | 6,676,636 | | | | 627,403,203 | |
Cemex SAB de CV ADR (Mexico) | | | 91,966,126 | | | | 389,936,374 | |
LafargeHolcim, Ltd. (Switzerland) | | | 11,020,441 | | | | 538,152,451 | |
Linde PLC (Ireland/United States) | | | 5,857,553 | | | | 1,176,599,317 | |
Nutrien, Ltd. (Canada) | | | 7,964,553 | | | | 425,785,004 | |
| | | | | | | | |
| | | | 3,157,876,349 | |
| REAL ESTATE: 0.6% | |
Hang Lung Group, Ltd.(b) (Hong Kong) | | | 106,789,500 | | | | 295,965,369 | |
| | |
| UTILITIES: 1.0% | | | | | | | | |
Engie (France) | | | 32,049,400 | | | | 486,154,664 | |
| | | | | | | | |
TOTAL COMMON STOCKS
(Cost $46,565,159,706) | | | $ | 46,295,084,664 | |
| | |
| See accompanying Notes to Consolidated Financial Statements | | DODGE & COX INTERNATIONAL STOCK FUND§PAGE 7 |
| | | | |
| CONSOLIDATED PORTFOLIO OF INVESTMENTS (unaudited) | | | June 30, 2019 | |
| | | | | | | | |
| PREFERRED STOCKS: 5.5% | | | | | | |
| | |
| | | SHARES | | | VALUE | |
| ENERGY: 1.2% | | | | | | | | |
Petroleo Brasileiro SA (Brazil) | | | 82,374,800 | | | $ | 588,000,695 | |
| | |
| FINANCIALS: 2.4% | | | | | | | | |
BANKS: 2.4% | | | | | | | | |
Itau Unibanco Holding SA (Brazil) | | | 125,859,851 | | | | 1,188,473,339 | |
| |
| INFORMATION TECHNOLOGY: 1.9% | | | | | |
TECHNOLOGY, HARDWARE & EQUIPMENT: 1.9% | | | | | |
Samsung Electronics Co., Ltd. (South Korea) | | | 28,739,700 | | | | 952,057,788 | |
| | | | | | | | |
TOTAL PREFERRED STOCKS
(Cost $1,666,009,825) | | | $ | 2,728,531,822 | |
| |
| SHORT-TERM INVESTMENTS: 1.4% | | | | |
| | |
| | | PAR VALUE/
SHARES | | | VALUE | |
REPURCHASE AGREEMENTS: 1.0% | | | | | | | | |
Bank of Montreal(c)
2.45%, dated 6/28/19, due 7/1/19, maturity value $57,711,780 | | $ | 57,700,000 | | | $ | 57,700,000 | |
Fixed Income Clearing Corporation(c)
1.60%, dated 6/28/19, due 7/1/19, maturity value $276,347,841 | | | 276,311,000 | | | | 276,311,000 | |
Royal Bank of Canada(c)
2.47%, dated 6/28/19, due 7/1/19, maturity value $153,731,637 | | | 153,700,000 | | | | 153,700,000 | |
| | | | | | | | |
| | | | 487,711,000 | |
MONEY MARKET FUND: 0.4% | | | | | | | | |
State Street Institutional U.S. Government Money Market Fund | | | 199,636,158 | | | | 199,636,158 | |
| | | | | | | | |
TOTAL SHORT-TERM INVESTMENTS(Cost $687,347,158) | | | | | | $ | 687,347,158 | |
| | | | | | | | |
TOTAL INVESTMENTS IN SECURITIES(Cost $48,918,516,689) | | | 99.7 | % | | $ | 49,710,963,644 | |
OTHER ASSETS LESS LIABILITIES | | | 0.3 | % | | | 172,383,296 | |
| | | | | | | | |
| NET ASSETS | | | 100.0 | % | | $ | 49,883,346,940 | |
| | | | | | | | |
| (b) | See Note 9 regarding holdings of 5% voting securities |
| (c) | Repurchase agreements are collateralized by: |
Bank of Montreal: U.S. Treasury Notes 2.25%-3.00%, 8/15/28-5/15/49 and U.S. Treasury Inflation Indexed Note 0.625%, 1/15/26. Total collateral value is $58,866,069.
Fixed Income Clearing Corporation: U.S. Treasury Notes 1.375%-2.625%, 4/30/21-6/15/21. Total collateral value is $281,838,620.
Royal Bank of Canada: U.S. Treasury Notes 1.25%-1.625%, 3/31/21-5/15/26. Total collateral value is $156,806,277.
In determining a company’s country designation, the Fund generally references the country of incorporation. In cases where the Fund considers the country of incorporation to be a “jurisdiction of convenience” chosen primarily for tax purposes or in other limited circumstances, the Fund uses the country designation of an appropriate broad-based market index. In those cases, two countries are listed—the country of incorporation and the country designated by an appropriate index, respectively.
ADR: American Depositary Receipt
SDR: Swedish Depository Receipt
| | |
| PAGE 8§ DODGE & COX INTERNATIONAL STOCK FUND | | See accompanying Notes to Consolidated Financial Statements |
| | | | |
| CONSOLIDATED PORTFOLIO OF INVESTMENTS (unaudited) | | | June 30, 2019 | |
EQUITY TOTAL RETURN SWAPS(a)
| | | | | | | | | | | | | | | | |
| Fund Receives | | Fund Pays | | Counterparty | | Maturity
Date | | | Notional
Amount | | | Value/ Unrealized
Appreciation
(Depreciation) | |
Total Return on Naspers, Ltd. | | 2.898% | | JPMorgan | | | 7/10/20 | | | $ | 468,424,504 | | | $ | 833,686 | |
| | | | | |
2.198% | | Total Return on Tencent Holdings, Ltd. | | JPMorgan | | | 7/10/20 | | | | 482,953,630 | | | | (26,734,753 | ) |
| | | | | | | | | | | | | | | | |
| | | | | | | | | | | | | | $ | (25,901,067 | ) |
| | | | | | | | | | | | | | | | |
| (a) | The combination of the equity total return swaps is designed to provide exposure to Naspers, Ltd. excluding the effect of Naspers Ltd.’s exposure to Tencent Holdings, Ltd. The swaps pay at maturity, and no upfront payments were made. |
FUTURES CONTRACTS
| | | | | | | | | | | | | | | | |
| Description | | Number of
Contracts | | | Expiration
Date | | | Notional
Amount | | | Value/
Unrealized
Appreciation
(Depreciation) | |
Euro Stoxx 50 Index—Long Position | | | 4,799 | | | | 9/20/19 | | | $ | 189,137,669 | | | $ | 1,472,142 | |
Yen Denominated Nikkei 225 Index—Long Position | | | 1,275 | | | | 9/12/19 | | | | 125,974,470 | | | | 1,631,665 | |
| | | | | | | | | | | | | | | | |
| | | | | | | | | | | | | | $ | 3,103,807 | |
| | | | | | | | | | | | | | | | |
CURRENCY FORWARD CONTRACTS
| | | | | | | | | | | | | | | | | | | | | | | | |
| Counterparty | | Settle Date | | | Currency Purchased | | | Currency Sold | | | Unrealized
Appreciation (Depreciation) | |
CHF: Swiss Franc | | | | | | | | | | | | | | | | | |
Barclays | | | 9/11/19 | | | | USD | | | | 227,759,604 | | | | CHF | | | | 225,000,000 | | | $ | (4,199,242 | ) |
Credit Suisse | | | 8/14/19 | | | | USD | | | | 384,039,968 | | | | CHF | | | | 383,333,334 | | | | (10,198,495 | ) |
Goldman Sachs | | | 9/11/19 | | | | USD | | | | 227,335,876 | | | | CHF | | | | 225,000,000 | | | | (4,622,969 | ) |
Morgan Stanley | | | 7/31/19 | | | | USD | | | | 164,916,082 | | | | CHF | | | | 166,666,666 | | | | (6,283,375 | ) |
Morgan Stanley | | | 7/31/19 | | | | USD | | | | 329,863,173 | | | | CHF | | | | 333,333,334 | | | | (12,535,743 | ) |
State Street | | | 8/14/19 | | | | USD | | | | 192,295,472 | | | | CHF | | | | 191,666,666 | | | | (4,823,758 | ) |
UBS | | | 7/31/19 | | | | CHF | | | | 139,000,000 | | | | USD | | | | 140,396,950 | | | | 2,383,398 | |
CNH: Chinese Yuan Renminbi | | | | | | | | | | | | | |
Bank of America | | | 1/15/20 | | | | USD | | | | 76,426,420 | | | | CNH | | | | 516,497,388 | | | | 1,410,069 | |
Bank of America | | | 2/12/20 | | | | USD | | | | 154,773,662 | | | | CNH | | | | 1,050,000,000 | | | | 2,345,021 | |
Barclays | | | 8/28/19 | | | | USD | | | | 103,453,300 | | | | CNH | | | | 710,000,000 | | | | 138,936 | |
Barclays | | | 12/4/19 | | | | USD | | | | 46,081,464 | | | | CNH | | | | 321,750,000 | | | | (679,535 | ) |
Barclays | | | 12/4/19 | | | | USD | | | | 46,772,969 | | | | CNH | | | | 326,625,000 | | | | (696,530 | ) |
Barclays | | | 3/4/20 | | | | USD | | | | 116,617,012 | | | | CNH | | | | 782,850,000 | | | | 3,011,866 | |
Citibank | | | 8/7/19 | | | | USD | | | | 179,693,317 | | | | CNH | | | | 1,241,950,358 | | | | (1,056,361 | ) |
Citibank | | | 8/7/19 | | | | USD | | | | 180,254,043 | | | | CNH | | | | 1,241,950,357 | | | | (495,635 | ) |
Citibank | | | 8/28/19 | | | | USD | | | | 73,226,178 | | | | CNH | | | | 502,500,000 | | | | 105,800 | |
Citibank | | | 12/18/19 | | | | USD | | | | 117,305,527 | | | | CNH | | | | 813,654,596 | | | | (921,823 | ) |
Citibank | | | 2/5/20 | | | | USD | | | | 190,191,817 | | | | CNH | | | | 1,283,775,744 | | | | 3,803,337 | |
Credit Suisse | | | 1/8/20 | | | | USD | | | | 41,904,035 | | | | CNH | | | | 287,566,440 | | | | 132,671 | |
Credit Suisse | | | 1/15/20 | | | | USD | | | | 77,417,146 | | | | CNH | | | | 524,323,106 | | | | 1,264,184 | |
Goldman Sachs | | | 7/31/19 | | | | CNH | | | | 982,766,351 | | | | USD | | | | 141,633,474 | | | | 1,400,179 | |
Goldman Sachs | | | 8/7/19 | | | | CNH | | | | 573,325,830 | | | | USD | | | | 84,003,785 | | | | (563,687 | ) |
Goldman Sachs | | | 8/28/19 | | | | CNH | | | | 347,500,000 | | | | USD | | | | 50,010,794 | | | | 555,039 | |
Goldman Sachs | | | 9/25/19 | | | | USD | | | | 83,899,357 | | | | CNH | | | | 583,713,000 | | | | (1,015,032 | ) |
Goldman Sachs | | | 10/27/21 | | | | USD | | | | 120,136,249 | | | | CNH | | | | 850,000,000 | | | | (1,134,805 | ) |
Goldman Sachs | | | 4/27/22 | | | | USD | | | | 82,386,238 | | | | CNH | | | | 573,325,830 | | | | 933,043 | |
HSBC | | | 8/7/19 | | | | CNH | | | | 528,816,055 | | | | USD | | | | 76,595,605 | | | | 366,676 | |
HSBC | | | 8/28/19 | | | | CNH | | | | 850,000,000 | | | | USD | | | | 122,372,589 | | | | 1,313,622 | |
HSBC | | | 10/23/19 | | | | USD | | | | 62,780,786 | | | | CNH | | | | 436,000,000 | | | | (622,808 | ) |
HSBC | | | 2/5/20 | | | | CNH | | | | 37,611,200 | | | | USD | | | | 5,405,073 | | | | 55,612 | |
HSBC | | | 2/12/20 | | | | USD | | | | 154,949,531 | | | | CNH | | | | 1,050,000,000 | | | | 2,520,890 | |
HSBC | | | 5/12/21 | | | | USD | | | | 186,683,702 | | | | CNH | | | | 1,315,000,000 | | | | (1,755,723 | ) |
HSBC | | | 10/27/21 | | | | USD | | | | 120,166,820 | | | | CNH | | | | 850,000,000 | | | | (1,104,234 | ) |
HSBC | | | 1/26/22 | | | | USD | | | | 83,239,651 | | | | CNH | | | | 588,204,670 | | | | (503,620 | ) |
HSBC | | | 4/27/22 | | | | USD | | | | 83,592,472 | | | | CNH | | | | 582,012,585 | | | | 905,138 | |
HSBC | | | 4/27/22 | | | | USD | | | | 82,344,735 | | | | CNH | | | | 582,012,585 | | | | (342,599 | ) |
JPMorgan | | | 7/31/19 | | | | USD | | | | 372,709,137 | | | | CNH | | | | 2,559,766,351 | | | | 155,954 | |
JPMorgan | | | 8/7/19 | | | | CNH | | | | 588,204,670 | | | | USD | | | | 84,755,716 | | | | 849,802 | |
| | |
| See accompanying Notes to Consolidated Financial Statements | | DODGE & COX INTERNATIONAL STOCK FUND§PAGE 9 |
| | | | |
| CONSOLIDATED PORTFOLIO OF INVESTMENTS (unaudited) | | | June 30, 2019 | |
| | | | | | | | | | | | | | | | | | | | | | | | |
| Counterparty | | Settle Date | | | Currency Purchased | | | Currency Sold | | | Unrealized
Appreciation (Depreciation) | |
JPMorgan | | | 8/7/19 | | | | CNH | | | | 588,204,660 | | | | USD | | | | 85,062,134 | | | $ | 543,383 | |
JPMorgan | | | 8/28/19 | | | | USD | | | | 72,104,880 | | | | CNH | | | | 495,000,000 | | | | 75,851 | |
JPMorgan | | | 10/23/19 | | | | USD | | | | 62,794,349 | | | | CNH | | | | 436,000,000 | | | | (609,245 | ) |
JPMorgan | | | 12/4/19 | | | | USD | | | | 46,797,765 | | | | CNH | | | | 326,625,000 | | | | (671,734 | ) |
JPMorgan | | | 2/5/20 | | | | USD | | | | 190,231,273 | | | | CNH | | | | 1,283,775,744 | | | | 3,842,793 | |
JPMorgan | | | 1/26/22 | | | | USD | | | | 83,439,203 | | | | CNH | | | | 588,204,660 | | | | (304,067 | ) |
JPMorgan | | | 1/26/22 | | | | USD | | | | 83,062,158 | | | | CNH | | | | 588,204,670 | | | | (681,114 | ) |
State Street | | | 1/8/20 | | | | USD | | | | 73,455,394 | | | | CNH | | | | 503,500,000 | | | | 317,925 | |
State Street | | | 1/8/20 | | | | USD | | | | 73,433,968 | | | | CNH | | | | 503,500,000 | | | | 296,498 | |
State Street | | | 1/15/20 | | | | USD | | | | 77,572,917 | | | | CNH | | | | 524,323,106 | | | | 1,419,955 | |
State Street | | | 1/22/20 | | | | USD | | | | 118,252,684 | | | | CNH | | | | 804,000,000 | | | | 1,493,457 | |
State Street | | | 1/22/20 | | | | USD | | | | 118,247,467 | | | | CNH | | | | 804,000,000 | | | | 1,488,239 | |
State Street | | | 2/5/20 | | | | USD | | | | 187,342,031 | | | | CNH | | | | 1,264,614,912 | | | | 3,735,469 | |
UBS | | | 7/31/19 | | | | CNH | | | | 1,577,000,000 | | | | USD | | | | 228,352,157 | | | | 1,167,372 | |
UBS | | | 12/4/19 | | | | USD | | | | 46,441,841 | | | | CNH | | | | 325,000,000 | | | | (791,492 | ) |
UBS | | | 2/5/20 | | | | CNH | | | | 1,315,000,000 | | | | USD | | | | 189,031,841 | | | | 1,890,018 | |
UBS | | | 5/12/21 | | | | USD | | | | 186,803,040 | | | | CNH | | | | 1,315,000,000 | | | | (1,636,385 | ) |
| | | | | | | | | | | | | | | | | | | | | | | | |
Unrealized gain on currency forward contracts | | | | 39,922,197 | |
Unrealized loss on currency forward contracts | | | | (58,250,011 | ) |
| | | | | | | | | | | | | | | | | | | | | | | | |
Net unrealized loss on currency forward contracts | | | $ | (18,327,814 | ) |
| | | | | | | | | | | | | | | | | | | | | | | | |
The listed counterparty may be the parent company or one of its subsidiaries.
| | |
| PAGE 10§ DODGE & COX INTERNATIONAL STOCK FUND | | See accompanying Notes to Consolidated Financial Statements |
| | | | |
CONSOLIDATED STATEMENT OF ASSETS AND LIABILITIES (unaudited) | |
| |
| | | June 30, 2019 | |
ASSETS: | | | | |
Investments in securities, at value | | | | |
Unaffiliated issuers (cost $45,886,424,926) | | $ | 47,692,736,878 | |
Affiliated issuers (cost $3,032,091,763) | | | 2,018,226,766 | |
| | | | |
| | $ | 49,710,963,644 | |
Unrealized appreciation on currency forward contracts | | | 39,922,197 | |
Unrealized appreciation on swaps | | | 833,686 | |
Cash pledged as collateral for OTC Derivatives | | | 65,500,000 | |
Cash | | | 100 | |
Cash denominated in foreign currency (cost $15,248,665) | | | 15,242,996 | |
Deposits with broker for futures contracts | | | 19,957,904 | |
Receivable for variation margin for futures contracts | | | 9,523,201 | |
Receivable for investments sold | | | 267,347,397 | |
Receivable for Fund shares sold | | | 19,565,736 | |
Dividends and interest receivable | | | 121,458,504 | |
Prepaid expenses and other assets | | | 77,710 | |
| | | | |
| | | 50,270,393,075 | |
| | | | |
LIABILITIES: | | | | |
Unrealized depreciation on currency forward contracts | | | 58,250,011 | |
Unrealized depreciation on swaps | | | 26,734,753 | |
Cash received as collateral for OTC Derivatives | | | 14,336,000 | |
Payable for investments purchased | | | 1,585,826 | |
Payable for Fund shares redeemed | | | 199,825,822 | |
Deferred foreign capital gains tax | | | 58,328,320 | |
Management fees payable | | | 24,229,346 | |
Accrued expenses | | | 3,756,057 | |
| | | | |
| | | 387,046,135 | |
| | | | |
NET ASSETS | | $ | 49,883,346,940 | |
| | | | |
NET ASSETS CONSIST OF: | | | | |
Paid in capital | | $ | 49,937,114,448 | |
Total accumulated loss | | | (53,767,508 | ) |
| | | | |
| | $ | 49,883,346,940 | |
| | | | |
Fund shares outstanding (par value $0.01 each, unlimited shares authorized) | | | 1,197,407,697 | |
Net asset value per share | | $ | 41.66 | |
| |
CONSOLIDATED STATEMENT OF OPERATIONS (unaudited) | | | | |
| |
| | | Six Months Ended
June 30, 2019 | |
INVESTMENT INCOME: | | | | |
Dividends (net of foreign taxes of $119,783,529) | | | | |
Unaffiliated issuers | | $ | 1,137,143,441 | |
Affiliated issuers | | | 139,290,614 | |
Interest | | | 6,615,919 | |
| | | | |
| | | 1,283,049,974 | |
| | | | |
EXPENSES: | | | | |
Management fees | | | 150,882,539 | |
Custody and fund accounting fees | | | 2,896,744 | |
Transfer agent fees | | | 2,593,851 | |
Professional services | | | 177,938 | |
Shareholder reports | | | 698,495 | |
Registration fees | | | 276,415 | |
Trustees’ fees | | | 170,833 | |
ADR depositary service fees | | | 381,817 | |
Miscellaneous | | | 308,574 | |
| | | | |
| | | 158,387,206 | |
| | | | |
NET INVESTMENT INCOME | | | 1,124,662,768 | |
| | | | |
REALIZED AND UNREALIZED GAIN (LOSS): | | | | |
Net realized gain (loss) | | | | |
Investments in securities of unaffiliated issuers (net of foreign taxes of $5,893,547) | | | 83,879,801 | |
Investments in securities of affiliated issuers | | | (119,519,612 | ) |
Futures contracts | | | 70,496,663 | |
Currency forward contracts | | | 113,142,534 | |
Foreign currency transactions | | | (7,916,040 | ) |
Net change in unrealized appreciation/depreciation | | | | |
Investments in securities of unaffiliated issuers (net of increase in deferred foreign capital gains tax of $38,275,297) | | | 4,522,553,382 | |
Investments in securities of affiliated issuers | | | 396,900,201 | |
Futures contracts | | | 19,163,406 | |
Swaps | | | (25,901,067 | ) |
Currency forward contracts | | | (80,675,221 | ) |
Foreign currency translation | | | 633,230 | |
| | | | |
Net realized and unrealized gain (loss) | | | 4,972,757,277 | |
| | | | |
NET CHANGE IN NET ASSETS FROM OPERATIONS | | $ | 6,097,420,045 | |
| | | | |
| | | | | | | | |
CONSOLIDATED STATEMENT OF CHANGES IN NET ASSETS (unaudited) | |
| | |
| | | Six Months Ended
June 30, 2019 | | | Year Ended
December 31, 2018 | |
OPERATIONS: | |
Net investment income | | $ | 1,124,662,768 | | | $ | 1,314,954,895 | |
Net realized gain (loss) | | | 140,083,346 | | | | (189,442,047 | ) |
Net change in unrealized appreciation/depreciation | | | 4,832,673,931 | | | | (12,378,528,792 | ) |
| | | | | | | | |
| | | 6,097,420,045 | | | | (11,253,015,944 | ) |
| | | | | | | | |
| | |
DISTRIBUTIONS TO SHAREHOLDERS: | | | | | | | | |
Total distributions | | | — | | | | (1,392,029,880 | ) |
| |
FUND SHARE TRANSACTIONS: | | | | | |
Proceeds from sale of shares | | | 3,012,965,376 | | | | 7,786,364,752 | |
Reinvestment of distributions | | | — | | | | 1,194,160,091 | |
Cost of shares redeemed | | | (7,334,545,142 | ) | | | (13,898,235,680 | ) |
| | | | | | | | |
Net change from Fund share transactions | | | (4,321,579,766 | ) | | | (4,917,710,837 | ) |
| | | | | | | | |
Total change in net assets | | | 1,775,840,279 | | | | (17,562,756,661 | ) |
| |
NET ASSETS: | | | | | |
Beginning of period | | | 48,107,506,661 | | | | 65,670,263,322 | |
| | | | | | | | |
End of period | | $ | 49,883,346,940 | | | $ | 48,107,506,661 | |
| | | | | | | | |
| |
SHARE INFORMATION: | | | | | |
Shares sold | | | 74,536,672 | | | | 177,112,322 | |
Distributions reinvested | | | — | | | | 32,344,484 | |
Shares redeemed | | | (180,406,549 | ) | | | (323,973,781 | ) |
| | | | | | | | |
Net change in shares outstanding | | | (105,869,877 | ) | | | (114,516,975 | ) |
| | | | | | | | |
| | |
| See accompanying Notes to Consolidated Financial Statements | | DODGE & COX INTERNATIONAL STOCK FUND§PAGE 11 |
NOTES TO CONSOLIDATED FINANCIAL STATEMENTS(unaudited)
NOTE 1—ORGANIZATION AND SIGNIFICANT ACCOUNTING POLICIES
Dodge & Cox International Stock Fund (the “Fund”) is one of the series constituting the Dodge & Cox Funds (the “Trust” or the “Funds”). The Trust is organized as a Delaware statutory trust and is registered under the Investment Company Act of 1940, as amended, as anopen-end management investment company. On January 16, 2015, the Fund closed to new investors. The Fund commenced operations on May 1, 2001, and seeks long-term growth of principal and income. The Fund invests primarily in a diversified portfolio of foreign equity securities. Foreign investing, especially in developing countries, has special risks such as currency and market volatility and political and social instability. These and other risk considerations are discussed in the Fund’s Prospectus.
The Fund is an investment company and follows the accounting and reporting guidance issued in Topic 946 by the Financial Accounting Standards Board. The financial statements have been prepared in conformity with accounting principles generally accepted in the United States of America, which require the use of estimates and assumptions by management. Actual results may differ from those estimates. Significant accounting policies are as follows:
Security valuation The Fund’s net assets are normally valued as of the scheduled close of trading on the New York Stock Exchange (NYSE), generally 4 p.m. Eastern Time, each day that the NYSE is open for business.
Portfolio holdings for which market quotes are readily available are valued at market value. Listed securities, for example, are generally valued using the official quoted close price or the last sale on the exchange that is determined to be the primary market for the security. Exchange-traded derivatives are valued at the settlement price determined by the relevant exchange.Short-term securities less than 60 days to maturity may be valued at amortized cost if amortized cost approximates current value. Mutual funds are valued at their respective net asset values. Security values are not discounted based on the size of the Fund’s position and may differ from the value a Fund receives upon sale of the securities.
Investments initially valued in currencies other than the U.S. dollar are converted to the U.S. dollar using prevailing exchange rates. Currency forward contracts are valued based on the prevailing forward exchange rates of the underlying currencies. As a result, the Fund’s net assets may be affected by changes in the value of currencies in relation to the U.S. dollar.
If market quotations are not readily available or if normal valuation procedures produce valuations that are deemed unreliable or inappropriate under the circumstances existing at the time, the investment will be valued at fair value as determined in good faith by or under the direction of the Fund’s Board of Trustees. The Board of Trustees has appointed Dodge & Cox, the Fund’s investment manager, to make fair value determinations in accordance with the Dodge & Cox Funds Valuation Policies (“Valuation Policies”), subject to Board oversight. Dodge & Cox has established a Pricing Committee that is comprised of representatives from Treasury, Legal, Compliance, and Operations. The Pricing Committee is responsible for implementing the Valuation Policies, including determining the fair value of securities and other investments when necessary. The Pricing Committee considers relevant indications of value that are
reasonably available to it in determining the fair value assigned to a particular security, such as the value of similar financial instruments, trading volumes, contractual restrictions on disposition, related corporate actions, and changes in economic conditions. In doing so, the Pricing Committee employs various methods for calibrating fair valuation approaches, including a regular review of key inputs and assumptions, back-testing, and review of any related market activity.
As trading in securities on most foreign exchanges is normally completed before the close of the NYSE, the value of non-U.S. securities can change by the time the Fund calculates its net asset value. To address these changes, the Fund may utilize adjustment factors provided by an independent pricing service to systematically value non-U.S. securities at fair value. These adjustment factors are based on statistical analyses of subsequent movements and changes in U.S. markets and financial instruments trading in U.S. markets that represent foreign securities or baskets of securities.
Valuing securities through a fair value determination involves greater reliance on judgment than valuation of securities based on readily available market quotations. In some instances, lack of information and uncertainty as to the significance of information may lead to a conclusion that a prior valuation is the best indication of a security’s value. When fair value pricing is employed, the prices of securities used by the Fund to calculate its net asset value may differ from quoted or published prices for the same securities.
Security transactions, investment income, expenses, and distributions Security transactions are recorded on the trade date. Realized gains and losses on securities sold are determined on the basis of identified cost.
Dividend income and corporate action transactions are recorded on theex-dividend date, or when the Fund first learns of the dividend/corporate action if the ex-dividend date has passed.Non-cash dividends, if any, are recorded at the fair market value of the securities received. Dividends characterized as return of capital for U.S. tax purposes are recorded as a reduction of cost of investments and/or realized gain. Interest income is recorded on the accrual basis.
Expenses are recorded on the accrual basis. Some expenses of the Trust can be directly attributed to a specific series. Expenses which cannot be directly attributed are allocated among the Funds in the Trust using methodologies determined by the nature of the expense.
Distributions to shareholders are recorded on theex-dividend date.
Foreign taxes The Fund is subject to foreign taxes which may be imposed by certain countries in which the Fund invests. The Fund endeavors to record foreign taxes based on applicable foreign tax law. Withholding taxes are incurred on certain foreign dividends and are accrued at the time the associated dividend is recorded. The Fund files withholding tax reclaims in certain jurisdictions to recover a portion of amounts previously withheld. The Fund records a reclaim receivable based on, among other things, a jurisdiction’s legal obligation to pay reclaims as well as payment history and market convention. In consideration of recent decisions rendered by European courts, the Fund has filed for additional reclaims related to prior years. A corresponding receivable is established when both the amount is known and significant contingencies or uncertainties regarding collectability
PAGE 12§ DODGE & COX INTERNATIONAL STOCK FUND
NOTES TO CONSOLIDATED FINANCIAL STATEMENTS(unaudited)
are removed. These amounts, if any, are reported in “dividends and interest receivable” in the Consolidated Statement of Assets and Liabilities.
Capital gains taxes are incurred upon disposition of certain foreign securities. Expected capital gains taxes on appreciated securities, if any, are accrued as unrealized losses and incurred capital gains taxes are reflected as realized losses upon the sale of the related security. Currency taxes may be incurred when the Fund purchases certain foreign currencies related to securities transactions and are recorded as realized losses on foreign currency transactions.
Repurchase agreements Repurchase agreements are transactions under which a Fund purchases a security from a dealer counterparty and agrees to resell the security to that counterparty on a specified future date at the same price, plus a specified interest rate. The Fund’s repurchase agreements are secured by U.S. government or agency securities, the fair value of which exceeds the principal amount of the repurchase transaction, including accrued interest, at all times. The Fund maintains custody of the underlying collateral securities, either through its regular custodian or through a third party custodian that maintains separate accounts for both the Fund and its counterparties. In the event of default by a counterparty, the Fund has the contractual right to liquidate the collateral securities and to apply the proceeds in satisfaction of the obligation.
Foreign currency translation The books and records of the Fund are maintained in U.S. dollars. Foreign currency amounts are translated into U.S. dollars at the prevailing exchange rates of such currencies against the U.S. dollar. The market value of investment securities and other assets and liabilities are translated at the exchange rate as of the valuation date. Purchases and sales of investment securities, income, and expenses are translated at the exchange rate prevailing on the transaction date.
Reported realized and unrealized gain (loss) on investments include foreign currency gain (loss) related to investment transactions.
Reported realized and unrealized gain (loss) on foreign currency transactions and translation include the following: disposing/holding of foreign currency, the difference between the trade and settlement dates on securities transactions, the difference between the accrual and payment dates on dividends, and currency losses on the purchase of foreign currency in certain countries that impose taxes on such transactions.
Consolidation The Fund may invest in certain securities through its wholly owned subsidiary, Dodge & Cox International Stock Fund Cayman, Ltd. (the “Subsidiary”). The Subsidiary is a Cayman Islands exempted company and invests in certain securities consistent with the investment objective of the Fund. The Fund’s Consolidated Financial Statements, including the Consolidated Portfolio of Investments, consist of the holdings and accounts of the Fund and the Subsidiary. All intercompany transactions and balances have been eliminated. At June 30, 2019, the Subsidiary had net assets of $100, which represented less than 0.01% of the Fund’s consolidated net assets.
Indemnification Under the Trust’s organizational documents, its officers and trustees are indemnified against certain liabilities arising out of the performance of their duties to the Trust. In addition, in the normal course of business the Trust enters into contracts that provide general indemnities to other parties. The Trust’s maximum exposure under these arrangements is unknown as this would involve future claims that may be made against the Trust that have not yet occurred.
NOTE 2—VALUATION MEASUREMENTS
Various inputs are used in determining the value of the Fund’s investments. These inputs are summarized in the three broad levels listed below.
| § | | Level 1: Quoted prices in active markets for identical securities |
| § | | Level 2: Other significant observable inputs (including quoted prices for similar securities, market indices, interest rates, credit risk, forward exchange rates, etc.) |
| § | | Level 3: Significant unobservable inputs (including Fund management’s assumptions in determining the fair value of investments) |
The inputs or methodology used for valuing securities are not necessarily an indication of the risk associated with investing in those securities.
The following is a summary of the inputs used to value the Fund’s holdings at June 30, 2019:
| | | | | | | | |
| Classification | | LEVEL 1
(Quoted Prices) | | | LEVEL 2
(Other Significant
Observable Inputs) | |
Securities | | | | | | | | |
Common Stocks | | | | | | | | |
Communication Services | | $ | 3,962,741,135 | | | $ | — | |
Consumer Discretionary | | | 4,807,390,216 | | | | — | |
Consumer Staples | | | 343,845,099 | | | | — | |
Energy | | | 3,742,525,862 | | | | — | |
Financials | | | 13,552,370,568 | | | | — | |
Health Care | | | 7,899,186,990 | | | | — | |
Industrials | | | 4,215,980,188 | | | | 131,616,673 | |
Information Technology | | | 3,699,431,551 | | | | — | |
Materials | | | 3,157,876,349 | | | | — | |
Real Estate | | | 295,965,369 | | | | — | |
Utilities | | | 486,154,664 | | | | — | |
Preferred Stocks | | | | | | | | |
Energy | | | 588,000,695 | | | | — | |
Financials | | | 1,188,473,339 | | | | — | |
Information Technology | | | 952,057,788 | | | | — | |
Short-term Investments | | | | | | | | |
Repurchase Agreements | | | — | | | | 487,711,000 | |
Money Market Fund | | | 199,636,158 | | | | — | |
| | | | | | | | |
Total Securities | | $ | 49,091,635,971 | | | $ | 619,327,673 | |
| | | | | | | | |
| | |
Other Investments | | | | | | | | |
Equity Total Return Swaps | | | | | | | | |
Appreciation | | $ | — | | | $ | 833,686 | |
Depreciation | | | — | | | | (26,734,753 | ) |
Futures Contracts | | | | | | | | |
Appreciation | | | 3,103,807 | | | | — | |
Currency Forward Contracts | | | | | | | | |
Appreciation | | | — | | | | 39,922,197 | |
Depreciation | | | — | | | | (58,250,011 | ) |
| | | | | | | | | |
DODGE & COX INTERNATIONAL STOCK FUND§PAGE 13
NOTES TO CONSOLIDATED FINANCIAL STATEMENTS(unaudited)
NOTE 3—DERIVATIVE INSTRUMENTS
The Fund may enter into various transactions involving derivative instruments, including currency forward contracts, futures contracts, and swaps, in connection with its investment strategy. The Fund may use derivatives to minimize the impact of losses to one or more of its investments (as a “hedging technique”) or to implement its investment strategy.
The Fund may enter intoover-the-counter derivatives (each, an “OTC Derivative”), such as swaps and currency forward contracts. Each OTC Derivative is subject to a negotiated master agreement (based on a form published by the International Swaps and Derivatives Association (“ISDA”)) governing all OTC Derivatives between the Fund and the relevant dealer counterparty. The master agreements specify (i) events of default and other events permitting a party to terminate some or all of the OTC Derivatives thereunder and (ii) the process by which those OTC Derivatives will be valued for purposes of determining termination payments. If some or all of the OTC Derivatives under a master agreement are terminated because of an event of default or similar event, the values of all terminated OTC Derivatives must be netted to determine a single payment owed by one party to the other. To the extent amounts owed to the Fund by its counterparties are not collateralized, the Fund is at risk of those counterparties’non-performance. The Fund attempts to mitigate counterparty credit risk by entering into OTC Derivatives only with counterparties it believes to be of good credit quality, by exchanging collateral, and by monitoring the financial stability of those counterparties.
Equity total return swaps Equity total return swaps are contracts that can create long or short economic exposure to an underlying equity security. Under such a contract, one party agrees to make payments to another based on the total return of a notional amount of the underlying security (including dividends and changes in market value), in return for periodic payments from the other party based on a fixed or variable interest rate applied to the same notional amount. Equity total return swaps can also be used to hedge against exposure to specific risks associated with a particular issuer or the underlying asset of a particular issuer. Investments in equity total return swaps may include certain risks including unfavorable price movements in the underlying reference instrument(s), or a default or failure by the counterparty.
The value of equity total return swaps changes daily based on the value of the underlying equity security. Changes in the market value of equity total return swaps are recorded as unrealized appreciation or depreciation in the Consolidated Statement of Operations. Realized gains and losses on equity total return swaps are recorded in the Consolidated Statement of Operations upon exchange of cash flows for periodic payments and upon the closing or expiration of the swaps.
The Fund entered into equity total return swaps to gain exposure to particular issuers. During the six months ended June 30, 2019, these equity total return swaps had U.S. dollar notional values up to 1% of net assets.
The Fund also entered into equity total return swaps to hedge against specific risks associated with underlying investments of a particular issuer. During the six months ended June 30, 2019, these equity total return swaps had U.S. dollar notional values up to 1% of net assets.
Futures contracts Futures contracts involve an obligation to purchase or sell (depending on whether the Fund has entered a long or short futures contract, respectively) an asset at a future date, at a price set at the time of the contract. Upon entering into a futures contract, the Fund is required to deposit an amount of cash or liquid assets (referred to as initial margin) in a segregated account with the clearing broker. Subsequent payments (referred to as variation margin) to and from the clearing broker are made on a daily basis based on changes in the market value of futures contracts. Futures contracts are traded publicly and their market value changes daily. Changes in the market value of open futures contracts are recorded as unrealized appreciation or depreciation in the Consolidated Statement of Operations. Realized gains and losses on futures contracts are recorded in the Consolidated Statement of Operations at the closing or expiration of the contracts. Cash deposited with a broker as initial margin is recorded in the Consolidated Statement of Assets and Liabilities. A receivable and/or payable to brokers for daily variation margin are also recorded in the Consolidated Statement of Assets and Liabilities.
Investments in futures contracts may include certain risks, which may be different from, and potentially greater than, those of the underlying securities. To the extent the Fund uses futures, it is exposed to additional volatility and potential losses resulting from leverage.
The Fund entered into long Euro Stoxx 50 futures contracts and long Yen Denominated Nikkei futures contracts to provide equity exposure that approximates the Fund’s “net cash and other” position, which includes cash, short-term investments, receivables, and payables. During the six months ended June 30, 2019, these futures contracts had U.S. dollar notional values up to 3% of net assets.
Currency forward contractsA currency forward contract represents an obligation to purchase or sell a specific foreign currency at a future date at a price set at the time of the contract. The values of currency forward contracts are adjusted daily based on the prevailing forward exchange rates of the underlying currencies. Changes in the value of open contracts are recorded as unrealized appreciation or depreciation in the Consolidated Statement of Operations. When a currency forward contract is closed, the Fund records a realized gain or loss in the Consolidated Statement of Operations equal to the difference between the value at the time the contract was opened and the value at the time it was closed.
Losses from these transactions may arise from unfavorable changes in currency values or if a counterparty does not perform under a contract’s terms.
The Fund entered into currency forward contracts to hedge direct and/or indirect foreign currency exposure to the Chinese yuan renminbi and Swiss franc. During the six months ended June 30, 2019, these currency forward contracts had U.S. dollar total values ranging from 9% to 10% of net assets.
PAGE 14§ DODGE & COX INTERNATIONAL STOCK FUND
NOTES TO CONSOLIDATED FINANCIAL STATEMENTS(unaudited)
Additional derivative information For financial reporting purposes, the Fund does not offset OTC Derivative assets and liabilities that are subject to a master netting arrangement in the Consolidated Statement of Assets and Liabilities. OTC Derivatives are presented in the Consolidated Statement of Assets and Liabilities as unrealized appreciation/depreciation on currency forward contracts and unrealized appreciation/depreciation on swaps. Cash collateral pledged or received by the Fund for OTC Derivatives is reported gross in the Consolidated Statement of Assets and Liabilities as cash pledged/(received) as collateral for OTC Derivatives. Derivative information by counterparty is presented in the Consolidated Portfolio of Investments.
The netting of assets and liabilities and the offsetting of collateral pledged or received are based on contractualnetting/set-off provisions in the ISDA master agreement. The following table presents the Fund’s net exposure for OTC Derivatives that are subject to enforceable master netting arrangements as of June 30, 2019. The net amount represents the receivable from (payable to) the counterparty in the event of a default.
| | | | | | | | | | | | | | | | |
| Counterparty | | Gross OTC
Derivative Assets | | | Gross OTC
Derivative
Liabilities | | | Cash Collateral Pledged /
(Received)(a) | | | Net Amount | |
Bank of America | | $ | 3,755,090 | | | $ | — | | | $ | (3,755,090 | ) | | $ | — | |
Barclays | | | 3,150,802 | | | | (5,575,307 | ) | | | 2,300,000 | | | | (124,505 | ) |
Citibank | | | 3,909,137 | | | | (2,473,819 | ) | | | (1,435,318 | ) | | | — | |
Credit Suisse | | | 1,396,855 | | | | (10,198,495 | ) | | | 8,710,000 | | | | (91,640 | ) |
Goldman Sachs | | | 2,888,261 | | | | (7,336,493 | ) | | | 4,448,232 | | | | — | |
HSBC | | | 5,161,938 | | | | (4,328,984 | ) | | | (832,954 | ) | | | — | |
JPMorgan(b) | | | 6,301,469 | | | | (29,000,913 | ) | | | 22,699,444 | | | | — | |
Morgan Stanley | | | — | | | | (18,819,118 | ) | | | 18,730,000 | | | | (89,118 | ) |
State Street | | | 8,751,543 | | | | (4,823,758 | ) | | | (3,927,785 | ) | | | — | |
UBS | | | 5,440,788 | | | | (2,427,877 | ) | | | (2,830,000 | ) | | | 182,911 | |
| | | | | | | | | | | | | | | | |
Total | | $ | 40,755,883 | | | $ | (84,984,764 | ) | | $ | 44,106,529 | | | $ | (122,352 | ) |
| | | | | | | | | | | | | | | | |
| | | | | | | | | | | | | | | | | |
| (a) | Cash collateral pledged/(received) in excess of OTC Derivative assets/liabilities, if any, is not presented. Total cash collateral pledged/(received) is presented in the Consolidated Statement of Assets and Liabilities. |
| (b) | Includes OTC swaps and currency forward contracts. |
NOTE 4—RELATED PARTY TRANSACTIONS
Management fees Under a written agreement approved by a unanimous vote of the Board of Trustees, the Fund pays a management fee monthly at an annual rate of 0.60% of the Fund’s average daily net assets to Dodge & Cox, investment manager of the Fund.
Fund officers and trustees All officers and two of the trustees of the Trust are officers or employees of Dodge & Cox. The Trust pays a fee only to those trustees who are not affiliated with Dodge & Cox.
NOTE 5—INCOME TAX INFORMATION AND DISTRIBUTIONS TO SHAREHOLDERS
A provision for federal income taxes is not required since the Fund intends to continue to qualify as a regulated investment company under Subchapter M of the Internal Revenue Code and distribute all of its taxable income to shareholders. Distributions are determined in accordance with income tax regulations, and such
amounts may differ from net investment income and realized gains for financial reporting purposes. The Fund may also designate a portion of the amount paid to redeeming shareholders as a distribution for tax purposes. Financial reporting records are adjusted for permanent book to tax differences at year end to reflect tax character. Book to tax differences are primarily due to differing treatments of wash sales, net short-term realized gain (loss), investments in passive foreign investment companies, foreign currency realized gain (loss), foreign capital gains tax, certain corporate action transactions, derivatives, and distributions.
Distributions during the periods noted below were characterized as follows for federal income tax purposes.
| | | | | | | | |
| | | Six Months Ended
June 30, 2019 | | | Year Ended
December 31, 2018 | |
Ordinary income | | | — | | | $ | 1,392,029,880 | |
| | | | | | ($ | 1.080 per share | ) |
Long-term capital gain | | | — | | | | — | |
The components of distributable earnings on a tax basis are reported as of the Fund’s most recent year end. At December 31, 2018, the tax basis components of distributable earnings were as follows:
| | | | |
Capital loss carryforward(a) | | $ | (1,436,591,790 | ) |
Deferred loss(b) | | | (391,633,447 | ) |
At June 30, 2019, unrealized appreciation and depreciation for investments and derivatives based on cost for federal income tax purposes were as follows:
| | | | |
Tax cost | | $ | 49,465,809,333 | |
| | | | |
Unrealized appreciation | | | 8,431,717,297 | |
Unrealized depreciation | | | (8,227,688,060 | ) |
| | | | |
Net unrealized appreciation | | | 204,029,237 | |
| | | | | |
| (a) | Represents accumulated short-term and long-term capital loss as of December 31, 2018, which may be carried forward to offset future capital gains. |
| (b) | Represents net realized specified loss and capital loss incurred between November 1, 2018 and December 31, 2018. As permitted by tax regulation, the Fund has elected to treat this loss as arising in 2019. |
Fund management has reviewed the tax positions for open periods (three years and four years, respectively, from filing the Fund’s Federal and State tax returns) as applicable to the Fund, and has determined that no provision for income tax is required in the Fund’s financial statements.
NOTE 6—LOAN FACILITIES
Pursuant to an exemptive order issued by the Securities and Exchange Commission (SEC), the Fund may participate in an interfund lending facility (Facility). The Facility allows the Fund to borrow money from or loan money to the Funds. Loans under the Facility are made for temporary or emergency purposes, such as to fund shareholder redemption requests. Interest on borrowings is the average of the current repurchase agreement rate and the bank loan rate. There was no activity in the Facility during the period.
DODGE & COX INTERNATIONAL STOCK FUND§PAGE 15
NOTES TO CONSOLIDATED FINANCIAL STATEMENTS(unaudited)
All Funds in the Trust participate in a $500 million committed credit facility (Line of Credit) with State Street Bank and Trust Company, to be utilized for temporary or emergency purposes to fund shareholder redemptions or for other short-term liquidity purposes. The maximum amount available to the Fund is $250 million. Each Fund pays an annual commitment fee on itspro-rata portion of the Line of Credit. For the six months ended June 30, 2019, the Fund’s commitment fee amounted to $152,402 and is reflected as a Miscellaneous Expense in the Consolidated Statement of Operations. Interest on borrowings is charged at the prevailing rate. There were no borrowings on the Line of Credit during the period.
NOTE 7—PURCHASES AND SALES OF INVESTMENTS
For the six months ended June 30, 2019, purchases and sales of securities, other than short-term securities, aggregated $4,085,454,154 and $7,606,945,026 respectively.
NOTE 8—SUBSEQUENT EVENTS
Fund management has determined that no material events or transactions occurred subsequent to June 30, 2019, and through the date of the Fund’s financial statements issuance, which require additional disclosure in the Fund’s financial statements.
NOTE 9—HOLDINGS OF 5% VOTING SECURITIES
Each of the companies listed below was considered to be an affiliate of the Fund because the Fund owned 5% or more of the company’s voting securities during all or part of the six months ended June 30, 2019. Transactions during the period in these securities were as follows:
| | | | | | | | | | | | | | | | | | | | | | | | | | | | | | | | |
| | | Shares at
Beginning of Period | | | Additions | | | Reductions | | | Shares at
End of Period | | | Dividend
Income(a) | | | Realized
Gain (Loss) | | | Net Change in
Unrealized
Appreciation
(Depreciation) | | | Value at
End of Period | |
COMMON STOCKS: 4.0% | | | | | | | | | | | | | | | | | | | | | | | | | | | | | | | | |
COMMUNICATION SERVICES: 1.8% | | | | | | | | | | | | | | | | | | | | | | | | | | | | | | | | |
Liberty Global PLC,
Series A(b) | | | 18,753,503 | | | | — | | | | (400,000 | ) | | | 18,353,503 | | | $ | — | | | $ | (8,905,317 | ) | | $ | 112,563,739 | | | $ | 495,361,046 | |
Millicom International Cellular SA SDR | | | 6,764,405 | | | | — | | | | (280,569 | ) | | | 6,483,836 | | | | 7,294,942 | | | | (7,477,309 | ) | | | (38,542,836 | ) | | | 364,823,346 | |
Television Broadcasts, Ltd. | | | 39,842,700 | | | | — | | | | — | | | | 39,842,700 | | | | 3,553,124 | | | | — | | | | (8,525,851 | ) | | | 66,611,066 | |
| | | | | | | | | | | | | | | | | | | | | | | | | | | | | | | | |
| | | | | | | | | | | | | | | | | | | | | | | | | | | | | | | 926,795,458 | |
| | | | | | | | | | | | | | | | | | | | | | | | | | | | | | | | |
| | | | | | | |
CONSUMER STAPLES: 0.7% | | | | | | | | | | | | | | | | | | | | | | | | | | | | | |
Magnit PJSC | | | 6,445,340 | | | | — | | | | (621,455 | ) | | | 5,823,885 | | | | 13,783,847 | | | | (71,366,044 | ) | | | 125,777,752 | | | | 343,845,099 | |
| | | | | | | | |
INDUSTRIALS: 0.0% | | | | | | | | | | | | | | | | | | | | | | | | | | | | | | | | |
Smiths Group PLC(c) | | | 21,485,581 | | | | — | | | | (2,484,081 | ) | | | 19,001,500 | | | | 3,504,409 | | | | (2,687,957 | ) | | | 53,604,492 | | | | — | |
| | | | | | | | |
INFORMATION TECHNOLOGY: 0.9% | | | | | | | | | | | | | | | | | | | | | | | | | | | | | | | | |
Micro Focus International
PLC(d) | | | 19,016,586 | | | | — | | | | (1,786,879 | ) | | | 17,229,707 | | | | 102,851,134 | | | | (19,759,785 | ) | | | 117,238,261 | | | | 451,620,840 | |
| | | | | | | | |
REAL ESTATE: 0.6% | | | | | | | | | | | | | | | | | | | | | | | | | | | | | | | | |
Hang Lung Group, Ltd. | | | 110,219,400 | | | | — | | | | (3,429,900 | ) | | | 106,789,500 | | | | 8,303,158 | | | | (9,323,200 | ) | | | 34,784,644 | | | | 295,965,369 | |
| | | | | | | | | | | | | | | | | | | | | | | | | | | | | | | | |
| | | | | | | | | | | | | | | | | | $ | 139,290,614 | | | $ | (119,519,612 | ) | | $ | 396,900,201 | | | $ | 2,018,226,766 | |
| | | | | | | | | | | | | | | | | | | | | | | | | | | | | | | | |
| | | | | | | | | | | | | | | | | | | | | | | | | | | | | | | | | |
| (a) | Net of foreign taxes, if any |
| (c) | Company was not an affiliate at period end |
| (d) | Shares reflect a reverse stock split on April 30, 2019 |
PAGE 16§ DODGE & COX INTERNATIONAL STOCK FUND
CONSOLIDATED FINANCIAL HIGHLIGHTS(unaudited)
| | | | | | | | | | | | | | | | | | | | | | | | | | | | |
SELECTED DATA AND RATIOS (for a share outstanding throughout each period) | | Six Months Ended
June, 30, | | | | | | Year Ended December 31, | |
| | | 2019 | | | | | | 2018 | | | 2017 | | | 2016 | | | 2015 | | | 2014 | |
| | | | | | | | | | | | |
Net asset value, beginning of period | | | $36.91 | | | | | | | | $46.32 | | | | $38.10 | | | | $36.48 | | | | $42.11 | | | | $43.04 | |
Income from investment operations: | | | | | | | | | | | | | | | | | | | | | | | | | | | | |
Net investment income | | | 0.93 | | | | | | | | 1.01 | | | | 0.70 | | | | 0.82 | | | | 0.79 | | | | 0.98 | |
Net realized and unrealized gain (loss) | | | 3.82 | | | | | | | | (9.34 | ) | | | 8.41 | | | | 2.19 | | | | (5.58 | ) | | | (0.94 | ) |
| | | | | | | | | | | | |
Total from investment operations | | | 4.75 | | | | | | | | (8.33 | ) | | | 9.11 | | | | 3.01 | | | | (4.79 | ) | | | 0.04 | |
| | | | | | | | | | | | |
Distributions to shareholders from: | | | | | | | | | | | | | | | | | | | | | | | | | | | | |
Net investment income | | | — | | | | | | | | (1.08 | ) | | | (0.89 | ) | | | (0.85 | ) | | | (0.84 | ) | | | (0.97 | ) |
Net realized gain | | | — | | | | | | | | — | | | | — | | | | (0.54 | ) | | | — | | | | — | |
| | | | | | | | | | | | |
Total distributions | | | — | | | | | | | | (1.08 | ) | | | (0.89 | ) | | | (1.39 | ) | | | (0.84 | ) | | | (0.97 | ) |
| | | | | | | | | | | | |
Net asset value, end of period | | | $41.66 | | | | | | | | $36.91 | | | | $46.32 | | | | $38.10 | | | | $36.48 | | | | $42.11 | |
| | | | | | | | | | | | |
Total return | | | 12.87 | % | | | | | | | (17.98 | )% | | | 23.94 | % | | | 8.26 | % | | | (11.35 | )% | | | 0.07 | % |
Ratios/supplemental data: | | | | | | | | | | | | | | | | | | | | | | | | | | | | |
Net assets, end of period (millions) | | | $49,883 | | | | | | | | $48,108 | | | | $65,670 | | | | $54,187 | | | | $57,029 | | | | $64,040 | |
Ratio of expenses to average net assets | | | 0.63 | %(a) | | | | | | | 0.63 | % | | | 0.63 | % | | | 0.64 | % | | | 0.64 | % | | | 0.64 | % |
Ratio of net investment income to average net assets | | | 4.47 | %(a) | | | | | | | 2.17 | % | | | 1.57 | % | | | 2.12 | % | | | 1.86 | % | | | 2.39 | % |
Portfolio turnover rate | | | 8 | % | | | | | | | 17 | % | | | 17 | % | | | 17 | % | | | 18 | % | | | 12 | % |
See accompanying Notes to Consolidated Financial Statements
DODGE & COX INTERNATIONAL STOCK FUND§PAGE 17
FUND HOLDINGS
The Fund provides a complete list of its holdings on a quarterly basis by filing the lists with the SEC on Form N-CSR (as of the end of the second and fourth quarters) and on Part F ofForm N-PORT (as of the end of the first and third quarters). Shareholders may view the Fund’s Form N-CSR and Part F of Form N-PORT on the SEC’s website at sec.gov. A list of the Fund’s quarter-end holdings is also available at dodgeandcox.com on or about the 15th day following each quarter end and remains available on the website until the list is updated for the subsequent quarter.
PROXY VOTING
For a free copy of the Fund’s proxy voting policies and procedures, please call 800-621-3979, visit the Fund’s website at dodgeandcox.com, or visit the SEC’s website at sec.gov. Information regarding how the Fund voted proxies relating to portfolio securities during the most recent 12-month period ending June 30 is also available at dodgeandcox.com or at sec.gov.
HOUSEHOLD MAILINGS
The Fund routinely mails shareholder reports and summary prospectuses to shareholders and, on occasion, proxy statements. In order to reduce the volume of mail, when possible, only one copy of these documents will be sent to shareholders who are part of the same family and share the same residential address.
If you have a direct account with the Funds and you do not want the mailing of shareholder reports and summary prospectuses combined with other members in your household, contact the Funds at 800-621-3979. Your request will be implemented within 30 days.
PAGE 18§ DODGE & COX INTERNATIONAL STOCK FUND
THIS PAGE INTENTIONALLY LEFT BLANK
DODGE & COX INTERNATIONAL STOCK FUND§PAGE 19
dodgeandcox.com
For Fund literature, transactions, and account information, please visit the Funds’ website.
or write or call:
DODGE & COX FUNDS
c/o DST Asset Manager Solutions, Inc.
P.O. Box 219502
Kansas City, Missouri 64121-9502
(800) 621-3979
INVESTMENT MANAGER
Dodge & Cox
555 California Street, 40th Floor
San Francisco, California 94104
(415) 981-1710
This report is submitted for the general information of the shareholders of the Fund. The report is not authorized for distribution to prospective investors in the Fund unless it is accompanied by a current prospectus.
This report reflects our views, opinions, and portfolio holdings as of June 30, 2019, the end of the reporting period. Any such views are subject to change at any time based upon market or other conditions and Dodge & Cox disclaims any responsibility to update such views. These views may not be relied on as investment advice and, because investment decisions for a Dodge & Cox Fund are based on numerous factors, may not be relied on as an indication of trading intent on behalf of any Dodge & Cox Fund.

DODGE & COX FUNDS®
Semi-Annual Report
June 30, 2019
Balanced Fund
ESTABLISHED 1931
TICKER: DODBX
Important Notice:
Beginning on January 1, 2021, we intend to discontinue mailing paper copies of the Fund’s shareholder reports as permitted by new regulations adopted by the Securities and Exchange Commission, unless you specifically request paper copies from Dodge & Cox Funds or from your financial intermediary, such as a broker-dealer or bank. The reports will remain available to you on the Dodge & Cox Funds website (dodgeandcox.com), and you will be notified by mail each time a report is posted and provided with a link to access the report.
If you have already elected to receive shareholder reports electronically, you will not be affected by this change and do not need to take any action. If you have not done so already, you may elect to receive shareholder reports and other communications electronically by enrolling in e-delivery on the Funds website, or, if you are invested through a financial intermediary, by updating your mailing preferences through the intermediary.
If you wish to continue receiving paper copies of all future shareholder reports, please contact us at (800) 621-3979. Reports will be provided to you free of charge. If you are invested through a financial intermediary, you may contact your financial intermediary to request to receive paper copies. Your election to receive reports in paper form will apply to all funds held with Dodge & Cox Funds or through your financial intermediary, as applicable.
6/19 BF SAR  Printed on recycled paper
TO OUR SHAREHOLDERS
The Dodge & Cox Balanced Fund had a total return of 10.7% for the six months ended June 30, 2019, compared to 13.6% for the Combined Index (a 60/40 blend of stocks and fixed income securities).
MARKET COMMENTARY
After posting strong returns in the first quarter of 2019, the U.S. equity market continued to climb during the second quarter: the S&P 500 reached anall-time high in late June and ended the first half of the year up 19%. Continued U.S. job growth and the Federal Reserve’s consideration of lower interest rates propelled U.S. stocks to record levels. Growth stocks outperformed value stocks(a) as technology-related companies surged during thesix-month period: Information Technology (up 27%) and Consumer Discretionary (up 22%) were the best-performing sectors of the S&P 500, while Health Care (up 8%) and Energy (up 13%) lagged the most. These market dynamics extended a longer-term trend.
In fixed income, the U.S. investment-grade fixed income market posted a robust 6.1%(b) return, fueled by the combination of falling long-term Treasury yields and strong performance from the Corporate bond sector. Despite concerns about slowing global growth, credit markets have been supported by generally healthy corporate earnings, a dovish tilt by many central banks, and investors continuing to reach for yield.
INVESTMENT STRATEGY
We set the Fund’s asset allocation based on our long-term outlook for the Fund’s equity and fixed income holdings, which currently favors equities. We did not make any meaningful changes to this allocation during the first half of 2019. On June 30, the Fund’s 66.1%(c) equity weighting (including 4.0% in preferred stocks) reflected our more positive outlook for total return potential from equities than from fixed income.
EQUITY STRATEGY
Over the last decade, U.S. growth stocks have outperformed value stocks by a cumulative 107 percentage points.(d) During this challenging period for value investors, the equity portfolio has outperformed the U.S. value investment universe. The valuation differential between value- and growth-oriented stocks remains wide by historical standards. Growth stocks are relatively expensive: the Russell 1000 Growth Index trades at 22.0 times forward earnings compared to 15.0 times for the Russell 1000 Value Index. This valuation gap should narrow as market prices move to more closely reflect our assessment of fundamental value. Historically, many value stocks have tended to outperform when they are particularly inexpensive, as they are today. We have conviction in our value-oriented, active investment approach and continue to believe now is an opportune time to be invested in value stocks.
We are optimistic about the long-term outlook for the portfolio, which remains overweight in sectors poised to benefit from a rebound in U.S. value stocks such as Financials, which
comprised 30.0% of the portfolio compared to 13.1% for the S&P 500, and Energy at 9.1% versus 5.0%. Health Care is also an overweight in the portfolio, and accounted for 19.6% of the portfolio versus 14.2% for the S&P 500.
Financials
U.S. financial services companies are trading near historically low valuations relative to the overall market. Banks, for example, are trading at 57% of the S&P 500 forwardprice-to-earnings multiple, the lowest relative level since the dotcom bubble in 1999. Why are bank stocks so inexpensive? Since September 2018, U.S. Treasury yields have declined by 100 basis points,(e) as have market expectations for the federal funds rate through 2020. Lower rates generally have a negative impact on bank earnings because of lower reinvestment yields, but we believe this issue has been fully priced into current valuations.
Despite low valuations, company fundamentals have been resilient. The portfolio’s bank holdings that were subjected to the Fed’s 2019 stress-testing process have received approval to return a weighted average of 11% of their market cap in dividends and buybacks in 2020. This total yield compares favorably with the broad market and notably income-oriented equities, such as in the Real Estate (e.g., Investment Trusts) and Utilities sectors. Banks’ capital levels are near historical highs, as are aggregate banking sector profits. In recent years, Banks’ earnings growth has outpaced the broad market and a number of banks have been able to offset the effects of lower interest rates through volume growth, cost controls, and share buybacks. Going forward, we are particularly constructive on several national retail banks — Bank of America, JPMorgan Chase, and Wells Fargo(f) — that are increasingly using their scale, advantages in technology, and marketing expertise to drive outsized deposit growth and profitability. While there is an overwhelming expectation in the market that interest rates will remain “lower for longer,” any increase in rates should create meaningful upside for many value stocks, especially in the Financials sector.
Energy
While the short-term direction of oil prices is difficult to forecast, the long-term fundamentals of supply and demand are constructive. We believe global demand will continue to grow at roughly 1% per year, or around 1.0 to 1.5 million additional barrels per day. From a supply perspective, U.S. shale oil growth is currently robust, but the rate of growth should taper as U.S. shale producers shift their priority from production growth to generating free cash flow. The rest of the industry will need to reinvest at higher rates to counteract the natural decline from existing fields and to meet new demand growth. It is likely that an oil price at or above current levels will be needed to incentivize that higher level of investment.
When evaluating energy stocks, we look for companies with assets that are on the low end of the global cost curve, management teams that have deployed capital prudently through the cycle, andlow-to-reasonable valuations. We continue to find
PAGE 2§ DODGE & COX BALANCED FUND
long-term opportunities in selected upstream and oilfield services companies with these characteristics. For example, we recently added to the portfolio’s energy holdings, including Occidental Petroleum (following its agreement to acquire Anadarko Petroleum) and Schlumberger, among others.
Health Care
Within the Health Care sector, attractive valuations reflect uncertainty about potential changes to U.S. health care regulations. As part of ongoing due diligence, our global industry analysts recently met with industry experts, regulators, and policymakers in Washington, D.C. and affirmed our belief that the risk of holistic, dramatic change to U.S. drug pricing due to regulatory or market changes remains low.
There are two primary goals behind U.S. health care reform debate: providing coverage for the majority of the uninsured population and managing the rising costs of providing health care for all. If more uninsured individuals gain coverage, then the portfolio’s three health care services holdings (CVS Health, Cigna, and UnitedHealth Group) should benefit as they provide managed care services for both individuals and employers. Additionally, our holdings could benefit from the expansion of government programs such as Medicaid and Medicare as many of these program’s beneficiaries receive their care from the portfolio’s healthcare services holdings. While there is uncertainty around how to address the issue of rising cost, our companies are also well positioned to play a critical role in reducing U.S. health care cost trends. Moreover, these three companies have enormous competitive advantages and can leverage their scale to negotiate the best prices, invest extensively in technology and data analytics, and utilize their vast stores of clinical data to deploy innovative, proactive care management strategies. Having merged pharmacy benefit manager (PBM) companies with managed care businesses, they are well positioned to drive down the total cost of care, influence costs and incentives within the system, and deliver on the promise of patient centric care.
In Pharmaceuticals, research and development productivity continues to improve, evidenced by historically high numbers of drug approvals in the last few years. Although PBMs have been able to exert increased pricing pressure on drug manufacturers, we believe this industry has attractive prospects. The portfolio continues to have a meaningful overweight position in Pharmaceuticals and Biotechnology: 14.3% compared to 6.8% for the S&P 500. These holdings have durable franchises with significant barriers to entry and long-term growth opportunities from product innovation, burgeoning emerging market demand, and development of new drug categories. We continue to find compelling opportunities in Health Care and recently added to Cigna, among other holdings.
Cigna
Cigna (2.2% position) is one of the largest and most diversified health care services organizations in the United States. In late 2018, Cigna acquired Express Scripts, a leading PBM, and we believe there will be significant cost savings from the transaction over the next several years. The combined company is also
generating substantial free cash flow that can be used to reduce debt, repurchase shares, and drive earnings growth. In addition, Cigna has proven to be a leading innovator in the midsize employer based segment where they continue to gain share due to their patient centric care model and industry leading cost trend which remains well below industry averages. Cigna is trading at only nine times forward earnings amid heightened competitive and regulatory risks surrounding its employer-sponsored health insurance and PBM segments. Weighing the risks and opportunities, we recently added to Cigna based on our view of its modest valuation in light of its solid business franchise and management’s strong execution track record.
FIXED INCOME STRATEGY
In the first half of 2019, amidst the backdrop of a rather unique market environment in which both Treasury rates and credit yield premiums(g) declined, our team made numerous incremental shifts to portfolio positioning. Even with these adjustments, the fixed income portfolio’s overall positioning has remained stable.
Defensive Duration(h) and Economic Outlook: Mitigating the Risk of Rising Rates over Time
Upon review of market expectations and our own interest rate forecasts, we slightly reduced the fixed income portfolio’s exposure to intermediate-term rates in favor of shorter-term securities. In our view, the magnitude of the yield declines in the belly of the yield curve has resulted in a potentially significant mispricing — more so than other points along the yield curve. To balance out the decrease in duration from these trades, we closed out the portfolio’s small remaining Treasury futures short position. The net result of these moves was the same relative duration positioning (75% of the Bloomberg Barclays U.S. Agg’s duration).
The portfolio’s defensive duration positioning is underpinned by two key factors. First, the futures market and yield curve are pricing in a substantially more dovish policy path than the Fed has recently communicated. We believe this gap will narrow over time. While the Fed’s“U-turn” is likely to lead to a rate cut or two in the short term, we believe these will eventually be reversed, and the long end of the curve will resume its upward move. Second, we attempt to balance interest rate risk and yield. With10-year Treasuries yielding close to 2%, we believe investors are not well compensated for taking on more duration. Given the low level of available yields, even a small rate move can present a risk to absolute returns.
The Credit Sector: Continuing to Find Opportunities
We added a number of new credit investments to the portfolio during the first half of the year at attractive valuations. Purchases were diversified by sector, geography, and seniority, but were focused on large, established enterprises with strong capital positions and liquidity. Examples of these purchases include Anheuser-Busch InBev, HCA, UniCredit, and Vodafone hybrids.
One purchase we would like to highlight is UniCredit, the largest Italy-domiciled bank by assets. While 50% of its revenue currently comes from Italy, UniCredit has a substantial presence in Germany, Austria, and parts of Eastern Europe. We have held UniCredit equity in the Dodge & Cox International Stock Fund
DODGE & COX BALANCED FUND§PAGE 3
for more than 10 years, and over that period we developed deep knowledge of the bank’s strategy, operations, and financial position. Earlier this year as prices for Italian risk assets declined, we initiated a position in the company’s15-year subordinated debt at new issue.
UniCredit is predominantly a retail and commercial bank, and the company has undergone a deep restructuring since Jean Pierre Mustier took over as CEO in 2016. Since the global financial crisis the bank’s profitability has substantially improved, and management has sought to increase the safety and soundness of the bank by reducing its credit risk, increasing its liquidity buffers, and proactively addressing future regulatory capital requirements. Certain risks remain, including the weak macro environment in Italy, an Italian government that has periodically clashed with the European Union, and potentially more stringent regulatory requirements for European banks on the horizon. Nonetheless, on balance we see an attractive investment based on the company’s fundamentals, the low likelihood of sovereign distress in Italy, and the compelling valuation of its bonds.
While credit valuations are higher now, we remain constructive on the portfolio’s credit holdings, particularly relative tolow-yielding Treasuries. We believe that corporate revenue growth remains healthy, and that margins and cash flow are strong. The banking sector remains well-capitalized, well-funded, and highly regulated. The risk of increased corporate leverage is mitigated by high interest coverage and a reduced U.S. tax burden, which boosts cash flow. We continue to focus on investing in strong credits at attractive prices, illustrated by the positions acquired in the first half of the year. As always, our valuation discipline and deep fundamental research continue to drivebottom-up credit decisions.
The Securitized Sector: Adding Liquidity and Incremental Yield at Attractive Valuations
The portfolio’s holdings in the Securitized sector consist predominantly of Agency(i) mortgage-backed securities (MBS), with a smaller weighting inAAA-rated asset-backed securities (ABS). These securities as a group can provide attractive total-return cash flows in the front to intermediate part of the yield curve and continue to play an important role in the overall portfolio given their generally high liquidity and high credit quality.
The portfolio continues to feature a large position in Agency30-year 4.5% coupon mortgage pass-through securities, which underperformed the broad MBS market in the first half of the year. As mortgage rates have declined since late 2018, the incentive for borrowers to refinance has increased. The result is that larger amounts of cash have been returned to holders of MBS at a relatively unfavorable time because they must reinvest at lower rates. Newly issued, higher coupon MBS — including the portfolio’s30-year 4.5% coupon securities — underperformed as they were more exposed to actual acceleration in, and market expectations regarding, prepayments. The flip side of the recent underperformance is that with fundamentals stable, our outlook for these securities is even more optimistic.
IN CLOSING
We remain optimistic about the long-term prospects for the Fund’s investments. The equity portfolio continues to trade at a significant discount to the market. On June 30, the equity portfolio traded at 12.9 times forward estimated earnings, compared to 17.3 times for the S&P 500. We continue to position the fixed income portfolio defensively from a capital preservation standpoint, while seeking opportunities to add incremental yield through ourbottom-up research process.
A fundamental, active, value-oriented investment approach requires conviction and patience. The rewards of active management are most likely to accrue to those investors who have the discipline to maintain a long-term investment horizon.
Thank you for your continued confidence in our firm. As always, we welcome your comments and questions.
For the Board of Trustees,
| | |

| | 
|
Charles F. Pohl, Chairman | | Dana M. Emery, President |
July 31, 2019
| (a) | | Value stocks are the lower valuation portion of the equity market, and growth stocks are the higher valuation portion. |
| (b) | | Sector returns as calculated and reported by Bloomberg. |
| (c) | | Unless otherwise specified, all weightings and characteristics are as of June 30, 2019. |
| (d) | | The Russell 1000 Growth Index had a total return of 351.7% compared to 245.0% for the Russell 1000 Value Index from June 30, 2009 through June 30, 2019. |
| (e) | | One basis point is equal to 1/100th of 1%. |
| (f) | | The use of specific examples does not imply that they are more or less attractive investments than the Fund’s other holdings. |
| (g) | | Yield premiums are one way to measure a security’s valuation. Narrowing yield premiums result in a higher valuation. Widening yield premiums result in a lower valuation. |
| (h) | | Duration is a measure of a bond’s (or a bond portfolio’s) price sensitivity to changes in interest rates. |
| (i) | | The U.S. Government does not guarantee the Fund’s shares, yield, or net asset value. The agency guarantee (by, for example, Ginnie Mae, Fannie Mae, or Freddie Mac) does not eliminate market risk. |
PAGE 4§ DODGE & COX BALANCED FUND
YEAR-TO-DATE PERFORMANCE REVIEW
The Fund underperformed the Combined Index by 2.9 percentage points year to date. The positive relative impact of the Fund’s lower allocation to fixed income was more than offset by the equity portfolio’s underperformance.
Equity Portfolio*
| | § | | The portfolio’s average overweight position (21% versus 14%) and lower returns in the Health Care sector (up 4% compared to up 8% for the S&P 500 sector) hurt results. Cigna (down 17%) and Bristol-Myers Squibb (down 11%) were weak. | |
| | § | | Strong performance from several large internet and technology-related stocks not held by the portfolio (e.g., Amazon, Apple) detracted from relative results. The negative impact was substantial in Consumer Discretionary and Information Technology (the best-performing S&P 500 sectors), where the portfolio was underweight throughout the period. | |
| | § | | The portfolio’s average overweight position (15% versus 10%) and holdings in the Communication Services sector (up 22% compared to up 19% for the S&P 500 sector) aided relative results. Zayo Group Holdings (up 44%) and media companies DISH Network (up 54%), Charter Communications (up 39%), and Comcast (up 25%) were key contributors. | |
Fixed Income Portfolio
| | § | | Security selection within credit was positive as several issuers performed well, including Citigroup capital securities, Cemex, Enel, Petrobras, and Rio Oil Finance Trust. | |
| | § | | The portfolio’s overweight to corporate bonds and underweight to U.S. Treasuries added to relative returns given the outperformance of credit. | |
| | § | | The portfolio’s below-benchmark duration position (72%** of the Bloomberg Barclays U.S. Agg’s duration) hampered relative returns. | |
| | * | | Excludes the Fund’s preferred stock positions. | |
| | ** | | Denotes Fund positioning at the beginning of the period. | |
KEY CHARACTERISTICS OF DODGE & COX
Independent Organization
Dodge & Cox is one of the largest privately owned investment managers in the world. We remain committed to independence, with a goal of providing the highest quality investment management service to our existing clients.
Over 85 Years of Investment Experience
Dodge & Cox was founded in 1930. We have a stable and well-qualified team of investment professionals, most of whom have spent their entire careers at Dodge & Cox.
Experienced Investment Team
The U.S. Equity Investment Committee, which is responsible for determining the asset allocation of the Balanced Fund and managing the equity portion of the Balanced Fund, is a ten-member committee with an average tenure at Dodge & Cox of 24 years. The U.S. Fixed Income Investment Committee, which is responsible for managing the debt portion of the Balanced Fund, is a nine-member committee with an average tenure of 20 years.
One Business with a Single Research Office
Dodge & Cox manages equity (domestic, international, and global), fixed income (domestic and global), and balanced investments, operating from one office in San Francisco.
Consistent Investment Approach
Our team decision-making process involves thorough, bottom-up fundamental analysis of each investment.
Long-Term Focus and Low Expenses
We invest with a three- to five-year investment horizon, which has historically resulted in low turnover relative to our peers. We manage Funds that maintain low expense ratios.
Risks: The Fund is subject to market risk, meaning holdings in the Fund may decline in value for extended periods due to the financial prospects of individual companies or due to general market and economic conditions. The Fund also invests in individual bonds whose yields and market values fluctuate, so that an investment may be worth more or less than its original cost. Debt securities are subject to interest rate risk, credit risk, and prepayment and call risk, all of which could have adverse effects on the value of the Fund. A low interest rate environment creates an elevated risk of future negative returns. Financial intermediaries may restrict their market making activities for certain debt securities, which may reduce the liquidity and increase the volatility of such securities. Please read the prospectus and summary prospectus for specific details regarding the Fund’s risk profile.
DODGE & COX BALANCED FUND§PAGE 5
GROWTH OF $10,000 OVER 10 YEARS
FOR AN INVESTMENT MADE ON JUNE 30, 2009
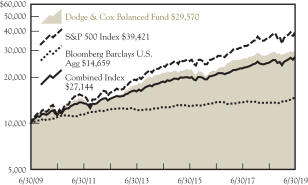
AVERAGE ANNUAL TOTAL RETURN
FOR PERIODS ENDED JUNE 30, 2019
| | | | | | | | | | | | | | | | |
| | | 1 Year | | | 5 Years | | | 10 Years | | | 20 Years | |
| | | | | | | | | | | | | | | | |
Dodge & Cox Balanced Fund | | | 5.58 | % | | | 6.64 | % | | | 11.45 | % | | | 7.75 | % |
S&P 500 Index | | | 10.42 | | | | 10.71 | | | | 14.70 | | | | 5.90 | |
Bloomberg Barclays U.S. Aggregate Bond Index (Bloomberg Barclays U.S. Agg) | | | 7.87 | | | | 2.95 | | | | 3.90 | | | | 4.93 | |
Combined Index(a) | | | 9.87 | | | | 7.76 | | | | 10.51 | | | | 5.82 | |
Returns represent past performance and do not guarantee future results. Investment return and share price will fluctuate with market conditions, and investors may have a gain or loss when shares are sold. Fund performance changes over time and currently may be significantly lower than stated. Performance is updated and published monthly. Visit the Fund’s website at dodgeandcox.com or call800-621-3979 for current performance figures.
The Fund’s total returns include the reinvestment of dividend and capital gain distributions, but have not been adjusted for any income taxes payable by shareholders on these distributions or on Fund share redemptions. Index returns include dividends and/or interest income but, unlike Fund returns, do not reflect fees or expenses.
Standard & Poor’s, Standard & Poor’s 500, and S&P 500® are trademarks of S&P Global Inc. Bloomberg is a registered trademark of Bloomberg Finance L.P. and its affiliates. Barclays® is a trademark of Barclays Bank PLC.
| (a) | The Combined Index reflects an unmanaged portfolio (rebalanced monthly) of 60% of the S&P 500 Index, which is a market capitalization-weighted index of 500 large-capitalization stocks commonly used to represent the U.S. equity market, and 40% of the Bloomberg Barclays U.S. Aggregate Bond Index (Bloomberg Barclays U.S. Agg), which is a widely recognized, unmanaged index of U.S. dollar-denominated, investment-grade, taxable fixed income securities. The Fund may, however, invest up to 75% of its total assets in equity securities. |
FUND EXPENSE EXAMPLE
As a Fund shareholder, you incur ongoing Fund costs, including management fees and other Fund expenses. All mutual funds have ongoing costs, sometimes referred to as operating expenses. The following example shows ongoing costs of investing in the Fund and can help you understand these costs and compare them with those of other mutual funds. The example assumes a $1,000 investment held for the six months indicated.
ACTUAL EXPENSES
The first line of the table below provides information about actual account values and expenses based on the Fund’s actual returns. You may use the information in this line, together with your account balance, to estimate the expenses that you paid over the period. Simply divide your account value by $1,000 (for example, an $8,600 account value divided by $1,000 = 8.6), then multiply the result by the number in the first line under the heading “Expenses Paid During Period” to estimate the expenses you paid on your account during this period.
HYPOTHETICAL EXAMPLE FOR COMPARISON WITH OTHER MUTUAL FUNDS
Information on the second line of the table can help you compare ongoing costs of investing in the Fund with those of other mutual funds. This information may not be used to estimate the actual ending account balance or expenses you paid during the period. The hypothetical “Ending Account Value” is based on the actual expense ratio of the Fund and an assumed 5% annual rate of return before expenses (not the Fund’s actual return). The amount under the heading “Expenses Paid During Period” shows the hypothetical expenses your account would have incurred under this scenario. You can compare this figure with the 5% hypothetical examples that appear in shareholder reports of other mutual funds.
| | | | | | | | | | | | |
Six Months Ended
June 30, 2019 | | Beginning Account Value
1/1/2019 | | | Ending Account Value
6/30/2019 | | | Expenses Paid
During Period* | |
Based on Actual Fund Return | | $ | 1,000.00 | | | $ | 1,107.00 | | | $ | 2.77 | |
Based on Hypothetical 5% Yearly Return | | | 1,000.00 | | | | 1,022.17 | | | | 2.66 | |
| * | | Expenses are equal to the Fund’s annualized expense ratio of 0.53%, multiplied by the average account value over the period, multiplied by 181/365 (to reflect theone-half year period). |
The expenses shown in the table highlight ongoing costs only and do not reflect any transactional fees or account maintenance fees. Though other mutual funds may charge such fees, please note that the Fund does not charge transaction fees (e.g., redemption fees, sales loads) or universal account maintenance fees (e.g., small account fees).
PAGE 6§ DODGE & COX BALANCED FUND
| | | | |
| FUND INFORMATION (unaudited) | | | June 30, 2019 | |
| | | | |
| GENERAL INFORMATION | | | |
Net Asset Value Per Share | | | $99.55 | |
Total Net Assets (billions) | | | $15.2 | |
Expense Ratio | | | 0.53% | |
Portfolio Turnover Rate (1/1/19 to 6/30/19, unannualized) | | | 16% | |
30-Day SEC Yield(a) | | | 2.23% | |
Fund Inception | | | 1931 | |
No sales charges or distribution fees | | | | |
Investment Manager: Dodge & Cox, San Francisco. Managed by the U.S. Equity Investment Committee, whose ten members’ average tenure at Dodge & Cox is 24 years, and by the U.S. Fixed Income Investment Committee, whose nine members’ average tenure is 20 years.
| | | | |
| EQUITY PORTFOLIO (66.1%) | | Fund | |
Number of Common Stocks | | | 65 | |
Number of Preferred Stocks | | | 5 | |
Median Market Capitalization (billions)(b) | | | $38 | |
Price-to-Earnings Ratio(b)(c) | | | 12.9x | |
Foreign Securities not in the S&P 500(d) | | | 7.4% | |
| | | | | | | | | | | | |
| FIVE LARGEST SECTORS (%) | | Common | | | Preferred | | | Fund | |
Financials | | | 16.2 | | | | 3.6 | | | | 19.8 | |
Health Care | | | 12.9 | | | | — | | | | 12.9 | |
Information Technology | | | 10.4 | | | | — | | | | 10.4 | |
Communication Services | | | 8.5 | | | | 0.4 | | | | 8.9 | |
Energy | | | 6.0 | | | | — | | | | 6.0 | |
| | | | | | | | | | | | |
| TEN LARGEST EQUITIES (%)(e) | | Common | | | Preferred | | | Fund | |
Wells Fargo & Co. | | | 2.2 | | | | 0.9 | | | | 3.1 | |
JPMorgan Chase & Co. | | | 1.7 | | | | 1.4 | | | | 3.1 | |
Comcast Corp. | | | 2.2 | | | | 0.4 | | | | 2.5 | |
Charter Communications, Inc. | | | 2.5 | | | | — | | | | 2.5 | |
Bank of America Corp. | | | 1.8 | | | | 0.5 | | | | 2.3 | |
Microsoft Corp. | | | 2.3 | | | | — | | | | 2.3 | |
Capital One Financial Corp. | | | 2.1 | | | | — | | | | 2.1 | |
FedEx Corp. | | | 2.0 | | | | — | | | | 2.0 | |
Charles Schwab Corp. | | | 1.9 | | | | — | | | | 1.9 | |
Alphabet, Inc. | | | 1.8 | | | | — | | | | 1.8 | |
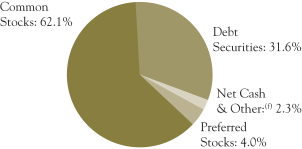
| | | | |
| FIXED INCOME PORTFOLIO (31.6%) | | Fund | |
Number of Credit Issuers | | | 56 | |
Effective Duration (years) | | | 4.3 | |
| | | | |
| SECTOR DIVERSIFICATION (%) | | Fund | |
U.S. Treasury | | | 2.8 | |
Government-Related(g) | | | 1.6 | |
Securitized | | | 14.1 | |
Corporate | | | 13.2 | |
| | | | |
| CREDIT QUALITY (%)(h) | | Fund | |
U.S. Treasury/Agency/GSE | | | 14.6 | |
AAA | | | 0.6 | |
AA | | | 2.1 | |
A | | | 1.7 | |
BBB | | | 10.6 | |
BB | | | 2.0 | |
B | | | 0.0 | |
CCC | | | 0.0 | |
| | | | |
| FIVE LARGEST CREDIT ISSUERS (%)(e) | | Fund | |
Charter Communications, Inc. | | | 0.7 | |
HSBC Holdings PLC | | | 0.6 | |
Petroleos Mexicanos | | | 0.5 | |
Verizon Communications, Inc. | | | 0.5 | |
State of California GO | | | 0.5 | |
| (a) | SEC Yield is an annualization of the Fund’s net investment income for the trailing 30-day period. Dividends paid by the Fund may be higher or lower than implied by the SEC Yield. |
| (b) | Excludes the Fund’s preferred stock positions. |
| (c) | Price-to-earnings (P/E) ratio is calculated using 12-month forward earnings estimates from third-party sources. |
| (d) | Foreign stocks are U.S. dollar denominated. |
| (e) | The Fund’s portfolio holdings are subject to change without notice. The mention of specific securities is not a recommendation to buy, sell, or hold any particular security and is not indicative of Dodge & Cox’s current or future trading activity. |
| (f) | Net Cash & Other includes cash, short-term investments, derivatives, receivables, and payables. |
| (g) | The portfolio’s Government-Related holdings include tax-exempt municipal securities; the Index classifies these securities as Municipal Bonds. |
| (h) | The credit quality distribution shown for the Fund is based on the middle of Moody’s, S&P, and Fitch ratings, which is the methodology used by Bloomberg in constructing its indices. If a security is rated by only two agencies, the lower of the two ratings is used. Please note the Fund applies the highest of Moody’s, S&P, and Fitch ratings to determine compliance with the quality requirements stated in its prospectus. The credit quality of the investments in the portfolio does not apply to the stability or safety of the Fund or its shares. |
DODGE & COX BALANCED FUND§PAGE 7
| | | | |
| PORTFOLIO OF INVESTMENTS(unaudited) | | | June 30, 2019 | |
| | | | | | | | |
| COMMON STOCKS: 62.1% | | | | | | |
| | |
| | | SHARES | | | VALUE | |
| COMMUNICATION SERVICES: 8.5% | |
MEDIA & ENTERTAINMENT: 7.7% | |
Alphabet, Inc., Class A(a) | | | 2,000 | | | $ | 2,165,600 | |
Alphabet, Inc., Class C(a) | | | 246,995 | | | | 266,979,366 | |
Charter Communications, Inc., Class A(a) | | | 951,207 | | | | 375,897,982 | |
Comcast Corp., Class A | | | 7,877,348 | | | | 333,054,274 | |
DISH Network Corp., Class A(a) | | | 2,644,334 | | | | 101,568,869 | |
Fox Corp., Class A | | | 1,592,924 | | | | 58,364,735 | |
Fox Corp., Class B | | | 404,380 | | | | 14,772,001 | |
News Corp., Class A | | | 1,307,504 | | | | 17,638,229 | |
| | | | | | | | |
| | | | 1,170,441,056 | |
TELECOMMUNICATION SERVICES: 0.8% | |
Sprint Corp.(a) | | | 8,137,071 | | | | 53,460,556 | |
Zayo Group Holdings, Inc.(a) | | | 2,225,000 | | | | 73,224,750 | |
| | | | | | | | |
| | | | 126,685,306 | |
| | | | | | | | |
| | | | 1,297,126,362 | |
| CONSUMER DISCRETIONARY: 2.2% | |
AUTOMOBILES & COMPONENTS: 0.2% | |
Harley-Davidson, Inc. | | | 938,400 | | | | 33,622,872 | |
|
CONSUMER DURABLES & APPAREL: 0.3% | |
Mattel, Inc.(a) | | | 3,193,723 | | | | 35,801,635 | |
| | |
RETAILING: 1.7% | | | | | | | | |
Booking Holdings, Inc.(a) | | | 93,300 | | | | 174,910,443 | |
Qurate Retail, Inc., Series A(a) | | | 4,885,850 | | | | 60,535,681 | |
The Gap, Inc. | | | 1,575,678 | | | | 28,314,934 | |
| | | | | | | | |
| | | | 263,761,058 | |
| | | | | | | | |
| | | | 333,185,565 | |
| CONSUMER STAPLES: 0.5% | |
FOOD, BEVERAGE & TOBACCO: 0.5% | |
Molson Coors Brewing Company, Class B | | | 1,277,014 | | | | 71,512,784 | |
| | |
| ENERGY: 6.0% | | | | | | | | |
Anadarko Petroleum Corp. | | | 1,655,392 | | | | 116,804,459 | |
Apache Corp. | | | 4,597,939 | | | | 133,202,293 | |
Baker Hughes, a GE Company | | | 5,056,900 | | | | 124,551,447 | |
Concho Resources, Inc. | | | 509,400 | | | | 52,559,892 | |
Halliburton Co. | | | 2,774,413 | | | | 63,090,152 | |
Hess Corp. | | | 790,200 | | | | 50,233,014 | |
National Oilwell Varco, Inc. | | | 2,008,241 | | | | 44,643,197 | |
Occidental Petroleum Corp. | | | 4,501,814 | | | | 226,351,208 | |
Schlumberger, Ltd. (Curacao/United States) | | | 2,759,921 | | | | 109,679,261 | |
| | | | | | | | |
| | | | 921,114,923 | |
| FINANCIALS: 16.2% | |
BANKS: 6.3% | | | | | | | | |
Bank of America Corp. | | | 9,560,300 | | | | 277,248,700 | |
BB&T Corp. | | | 1,850,584 | | | | 90,919,192 | |
JPMorgan Chase & Co. | | | 2,255,100 | | | | 252,120,180 | |
Wells Fargo & Co. | | | 7,220,106 | | | | 341,655,416 | |
| | | | | | | | |
| | | | 961,943,488 | |
DIVERSIFIED FINANCIALS: 7.8% | |
American Express Co. | | | 1,692,200 | | | | 208,885,168 | |
Bank of New York Mellon Corp. | | | 4,040,200 | | | | 178,374,830 | |
Capital One Financial Corp. | | | 3,461,248 | | | | 314,073,644 | |
Charles Schwab Corp. | | | 7,167,200 | | | | 288,049,768 | |
Goldman Sachs Group, Inc. | | | 960,000 | | | | 196,416,000 | |
| | | | | | | | |
| | | | 1,185,799,410 | |
INSURANCE: 2.1% | |
AEGON NV (Netherlands) | | | 12,667,643 | | | | 62,704,833 | |
Brighthouse Financial, Inc.(a) | | | 967,818 | | | | 35,509,242 | |
MetLife, Inc. | | | 4,481,300 | | | | 222,586,171 | |
| | | | | | | | |
| | | | 320,800,246 | |
| | | | | | | | |
| | | | 2,468,543,144 | |
| | | | | | | | |
| | |
| | | SHARES | | | VALUE | |
| HEALTH CARE: 12.9% | |
HEALTH CARE EQUIPMENT & SERVICES: 3.5% | |
Cigna Corp. | | | 1,391,638 | | | $ | 219,252,567 | |
CVS Health Corp. | | | 1,531,000 | | | | 83,424,190 | |
Danaher Corp. | | | 339,100 | | | | 48,464,172 | |
Medtronic PLC (Ireland/United States) | | | 529,200 | | | | 51,538,788 | |
UnitedHealth Group, Inc. | | | 535,072 | | | | 130,562,918 | |
| | | | | | | | |
| | | | 533,242,635 | |
PHARMACEUTICALS, BIOTECHNOLOGY & LIFE SCIENCES: 9.4% | |
Alnylam Pharmaceuticals, Inc.(a) | | | 426,000 | | | | 30,910,560 | |
AstraZeneca PLC ADR (United Kingdom) | | | 4,112,899 | | | | 169,780,471 | |
Bristol-Myers Squibb Co. | | | 4,164,800 | | | | 188,873,680 | |
Eli Lilly and Co. | | | 773,049 | | | | 85,646,099 | |
Gilead Sciences, Inc. | | | 1,580,680 | | | | 106,790,741 | |
GlaxoSmithKline PLC ADR (United Kingdom) | | | 4,426,000 | | | | 177,128,520 | |
Incyte Corp.(a) | | | 410,000 | | | | 34,833,600 | |
Novartis AG ADR (Switzerland) | | | 2,407,800 | | | | 219,856,218 | |
Roche Holding AG ADR (Switzerland) | | | 5,236,900 | | | | 183,815,190 | |
Sanofi ADR (France) | | | 5,570,265 | | | | 241,025,366 | |
| | | | | | | | |
| | | | 1,438,660,445 | |
| | | | | | | | |
| | | | 1,971,903,080 | |
| INDUSTRIALS: 4.8% | |
CAPITAL GOODS: 2.8% | |
Johnson Controls International PLC (Ireland/United States) | | | 6,077,214 | | | | 251,049,711 | |
United Technologies Corp. | | | 1,360,000 | | | | 177,072,000 | |
| | | | | | | | |
| | | | 428,121,711 | |
TRANSPORTATION: 2.0% | |
FedEx Corp. | | | 1,895,354 | | | | 311,198,173 | |
| | | | | | | | |
| | | | 739,319,884 | |
| INFORMATION TECHNOLOGY: 10.4% | |
SEMICONDUCTORS & SEMICONDUCTOR EQUIPMENT: 1.5% | |
Maxim Integrated Products, Inc. | | | 800,191 | | | | 47,867,426 | |
Microchip Technology, Inc. | | | 2,107,900 | | | | 182,754,930 | |
| | | | | | | | |
| | | | 230,622,356 | |
SOFTWARE & SERVICES: 3.4% | |
Cognizant Technology Solutions Corp., Class A | | | 1,378,900 | | | | 87,408,471 | |
Micro Focus International PLC ADR (United Kingdom) | | | 3,051,871 | | | | 79,928,501 | |
Microsoft Corp. | | | 2,562,400 | | | | 343,259,104 | |
| | | | | | | | |
| | | | 510,596,076 | |
TECHNOLOGY, HARDWARE & EQUIPMENT: 5.5% | |
Cisco Systems, Inc. | | | 2,250,500 | | | | 123,169,865 | |
Dell Technologies, Inc., Class C(a) | | | 1,145,868 | | | | 58,210,094 | |
Hewlett Packard Enterprise Co. | | | 11,024,520 | | | | 164,816,574 | |
HP Inc. | | | 10,016,573 | | | | 208,244,553 | |
Juniper Networks, Inc. | | | 4,030,329 | | | | 107,327,661 | |
TE Connectivity, Ltd. (Switzerland) | | | 1,836,036 | | | | 175,855,528 | |
| | | | | | | | |
| | | | 837,624,275 | |
| | | | | | | | |
| | | | 1,578,842,707 | |
| MATERIALS: 0.6% | |
Celanese Corp. | | | 843,532 | | | | 90,932,750 | |
| | | | | | | | |
TOTAL COMMON STOCKS
(Cost $6,552,925,150) | | | $ | 9,472,481,199 | |
| | |
| PAGE 8§ DODGE & COX BALANCED FUND | | See accompanying Notes to Financial Statements |
| | | | |
| PORTFOLIO OF INVESTMENTS (unaudited) | | | June 30, 2019 | |
| | | | | | | | |
| PREFERRED STOCKS: 4.0% | | | | | | |
| | |
| | | PAR VALUE | | | VALUE | |
| COMMUNICATION SERVICES: 0.4% | |
MEDIA & ENTERTAINMENT: 0.4% | |
NBCUniversal Enterprise, Inc. 5.25%(c) | | $ | 53,210,000 | | | $ | 54,487,040 | |
| | |
| FINANCIALS: 3.6% | | | | | | | | |
BANKS: 3.6% | | | | | | | | |
Bank of America Corp. 6.10%(g) | | | 16,008,000 | | | | 17,288,640 | |
Bank of America Corp. 6.25%(g) | | | 52,470,000 | | | | 57,164,491 | |
Citigroup, Inc. 5.95%(g) | | | 5,175,000 | | | | 5,399,439 | |
Citigroup, Inc. 5.95%(g) | | | 77,327,000 | | | | 80,806,715 | |
Citigroup, Inc. 6.25%(g) | | | 45,886,000 | | | | 50,396,135 | |
JPMorgan Chase & Co. 6.10%(g) | | | 197,500,000 | | | | 212,770,700 | |
Wells Fargo & Co. 5.875%(g) | | | 119,772,000 | | | | 130,196,955 | |
| | | | | | | | |
| | | | 554,023,075 | |
| | | | | | | | |
TOTAL PREFERRED STOCKS
(Cost $568,912,905) | | | $ | 608,510,115 | |
| |
| DEBT SECURITIES: 31.6% | | | | |
| U.S. TREASURY: 2.8% | | | | | |
U.S. Treasury Note/Bond | | | | | | | | |
3.375%, 11/15/19 | | | 50,635,000 | | | | 50,862,462 | |
1.75%, 11/30/19 | | | 83,630,000 | | | | 83,496,062 | |
1.50%, 5/15/20 | | | 47,575,000 | | | | 47,363,143 | |
2.50%, 6/30/20 | | | 22,095,000 | | | | 22,207,201 | |
2.875%, 11/30/23 | | | 90,010,000 | | | | 94,292,507 | |
2.625%, 12/31/23 | | | 6,300,000 | | | | 6,534,281 | |
2.50%, 1/31/24 | | | 39,450,000 | | | | 40,727,502 | |
2.375%, 2/29/24 | | | 38,065,000 | | | | 39,119,222 | |
2.125%, 3/31/24 | | | 8,430,000 | | | | 8,566,658 | |
2.25%, 4/30/24 | | | 28,050,000 | | | | 28,673,455 | |
| | | | | | | | |
| | | | 421,842,493 | |
| GOVERNMENT-RELATED: 1.5% | | | | | |
FOREIGN AGENCY: 0.7% | | | | | |
Petroleo Brasileiro SA (Brazil) | | | | | | | | |
5.999%, 1/27/28 | | | 28,535,000 | | | | 30,332,705 | |
7.25%, 3/17/44 | | | 4,300,000 | | | | 4,809,593 | |
Petroleos Mexicanos (Mexico) | | | | | | | | |
6.875%, 8/4/26 | | | 13,775,000 | | | | 13,919,637 | |
6.50%, 3/13/27 | | | 18,400,000 | | | | 18,146,080 | |
6.625%, 6/15/35 | | | 9,425,000 | | | | 8,706,344 | |
6.375%, 1/23/45 | | | 20,125,000 | | | | 17,307,500 | |
6.75%, 9/21/47 | | | 11,625,000 | | | | 10,352,063 | |
6.35%, 2/12/48 | | | 15,466,000 | | | | 13,277,561 | |
| | | | | | | | |
| | | | 116,851,483 | |
LOCAL AUTHORITY: 0.8% | | | | | | | | |
New Jersey Turnpike Authority RB
7.102%, 1/1/41 | | | 12,436,000 | | | | 18,717,548 | |
State of California GO | | | | | | | | |
7.50%, 4/1/34 | | | 13,470,000 | | | | 20,331,618 | |
7.55%, 4/1/39 | | | 14,475,000 | | | | 22,915,662 | |
7.30%, 10/1/39 | | | 18,730,000 | | | | 28,153,999 | |
7.625%, 3/1/40 | | | 4,590,000 | | | | 7,242,745 | |
State of Illinois GO
5.10%, 6/1/33 | | | 22,615,000 | | | | 23,815,404 | |
| | | | | | | | |
| | | | 121,176,976 | |
| | | | | | | | |
| | | | 238,028,459 | |
| SECURITIZED: 14.1% | | | | | | | | |
ASSET-BACKED: 2.3% | | | | | | | | |
Federal Agency: 0.0%(h) | | | | |
Small Business Admin. — 504 Program | | | | | | | | |
Series 2000-20D 1, 7.47%, 4/1/20 | | | 169,286 | | | | 171,015 | |
Series 2000-20E 1, 8.03%, 5/1/20 | | | 34,069 | | | | 34,556 | |
Series 2000-20G 1, 7.39%, 7/1/20 | | | 86,305 | | | | 87,182 | |
Series 2000-20I 1, 7.21%, 9/1/20 | | | 25,648 | | | | 25,933 | |
Series 2001-20E 1, 6.34%, 5/1/21 | | | 201,248 | | | | 205,290 | |
| | | | | | | | |
| | |
| | | PAR VALUE | | | VALUE | |
Series 2001-20G 1, 6.625%, 7/1/21 | | $ | 213,655 | | | $ | 218,125 | |
Series 2003-20J 1, 4.92%, 10/1/23 | | | 923,139 | | | | 965,006 | |
Series 2007-20F 1, 5.71%, 6/1/27 | | | 1,258,060 | | | | 1,349,944 | |
| | | | | | | | |
| | | | 3,057,051 | |
Other: 0.5% | | | | | | | | |
Rio Oil Finance Trust (Brazil) | | | | | | | | |
9.25%, 7/6/24(c) | | | 21,481,128 | | | | 23,924,607 | |
9.75%, 1/6/27(c) | | | 31,052,639 | | | | 35,633,214 | |
8.20%, 4/6/28(c) | | | 4,775,000 | | | | 5,359,985 | |
| | | | | | | | |
| | | | 64,917,806 | |
Student Loan: 1.8% | | | | | | | | |
Navient Student Loan Trust
USD LIBOR 1-Month | | | | | | | | |
+1.30%, 3.704%, 3/25/66(c) | | | 24,832,000 | | | | 25,306,351 | |
+0.80%, 3.204%, 7/26/66(c) | | | 8,215,326 | | | | 8,156,644 | |
+1.15%, 3.554%, 7/26/66(c) | | | 6,902,000 | | | | 6,973,014 | |
+1.05%, 3.454%, 12/27/66(c) | | | 6,511,850 | | | | 6,545,304 | |
+0.75%, 3.154%, 3/25/67(c) | | | 86,422,000 | | | | 85,554,366 | |
+1.00%, 3.404%, 2/27/68(c) | | | 4,337,000 | | | | 4,343,413 | |
+0.70%, 3.104%, 2/25/70(c) | | | 11,365,758 | | | | 11,351,440 | |
SLM Student Loan Trust
USD LIBOR 1-Month | | | | | | | | |
+0.75%, 3.154%, 1/25/45(c) | | | 41,231,371 | | | | 40,611,989 | |
USD LIBOR 3-Month | | | | | | | | |
+0.17%, 2.75%, 1/25/41 | | | 14,492,960 | | | | 14,072,265 | |
+0.55%, 3.13%, 10/25/64(c) | | | 49,262,000 | | | | 48,556,465 | |
SLM Student Loan Trust (Private Loans)
Series 2014-A A2A, 2.59%, 1/15/26(c) | | | 146,152 | | | | 146,123 | |
SMB Private Education Loan Trust (Private Loans)
Series 2018-B A2A, 3.60%, 1/15/37(c) | | | 19,845,000 | | | | 20,811,559 | |
| | | | | | | | |
| | | | | | | 272,428,933 | |
| | | | | | | | |
| | | | | | | 340,403,790 | |
CMBS: 0.2% | | | | | | | | |
Agency CMBS: 0.2% | | | | | | | | |
Fannie Mae Multifamily DUS | | | | | | | | |
Pool AL8144, 2.405%, 10/1/22 | | | 7,614,905 | | | | 7,687,743 | |
Pool AL9086, 2.306%, 7/1/23 | | | 1,494,209 | | | | 1,492,150 | |
Freddie Mac Multifamily Interest Only | | | | | | | | |
Series K055 X1, 1.499%, 3/25/26(f) | | | 10,530,412 | | | | 815,394 | |
Series K056 X1, 1.399%, 5/25/26(f) | | | 4,612,299 | | | | 336,687 | |
Series K057 X1, 1.325%, 7/25/26(f) | | | 3,786,331 | | | | 260,247 | |
Series K064 X1, 0.743%, 3/25/27(f) | | | 9,517,194 | | | | 391,053 | |
Series K065 X1, 0.815%, 4/25/27(f) | | | 44,199,589 | | | | 2,046,751 | |
Series K066 X1, 0.89%, 6/25/27(f) | | | 37,761,185 | | | | 1,956,075 | |
Series K069 X1, 0.496%, 9/25/27(f) | | | 238,638,156 | | | | 6,694,659 | |
Series K090 X1, 0.853%, 2/25/29(f) | | | 180,782,621 | | | | 10,954,613 | |
| | | | | | | | |
| | | | | | | 32,635,372 | |
| | | | | | | | |
| | | | | | | 32,635,372 | |
MORTGAGE-RELATED: 11.6% | |
Federal Agency CMO & REMIC: 2.1% | |
Dept. of Veterans Affairs | | | | | | | | |
Series 1995-1 1, 6.421%, 2/15/25(f) | | | 180,618 | | | | 196,935 | |
Series 1995-2C 3A, 8.793%, 6/15/25 | | | 75,217 | | | | 85,163 | |
Series 2002-1 2J, 6.50%, 8/15/31 | | | 5,744,019 | | | | 6,635,089 | |
Fannie Mae | | | | | | | | |
Trust 2002-33 A1, 7.00%, 6/25/32 | | | 1,344,345 | | | | 1,469,533 | |
Trust 2009-66 ET, 6.00%, 5/25/39 | | | 769,816 | | | | 806,518 | |
Trust 2009-30 AG, 6.50%, 5/25/39 | | | 1,358,758 | | | | 1,505,188 | |
Trust 2001-T7 A1, 7.50%, 2/25/41 | | | 999,540 | | | | 1,166,686 | |
Trust 2001-T5 A3, 7.50%, 6/19/41(f) | | | 448,002 | | | | 518,710 | |
Trust 2001-T4 A1, 7.50%, 7/25/41 | | | 1,047,141 | | | | 1,224,340 | |
Trust 2001-T8 A1, 7.50%, 7/25/41 | | | 1,013,720 | | | | 1,176,880 | |
Trust 2001-W3 A, 6.013%, 9/25/41(f) | | | 653,809 | | | | 713,743 | |
Trust 2001-T10 A2, 7.50%, 12/25/41 | | | 677,290 | | | | 753,800 | |
Trust 2013-106 MA, 4.00%, 2/25/42 | | | 6,971,647 | | | | 7,388,672 | |
| | |
| See accompanying Notes to Financial Statements | | DODGE & COX BALANCED FUND§PAGE 9 |
| | | | |
| PORTFOLIO OF INVESTMENTS(unaudited) | | | June 30, 2019 | |
| | | | | | | | |
| DEBT SECURITIES (continued) | | | | | | |
| | |
| | | PAR VALUE | | | VALUE | |
Trust 2002-W6 2A1, 7.00%, 6/25/42(f) | | $ | 1,061,631 | | | $ | 1,177,587 | |
Trust 2002-W8 A2, 7.00%, 6/25/42 | | | 1,361,321 | | | | 1,591,847 | |
Trust 2003-W2 1A1, 6.50%, 7/25/42 | | | 2,303,877 | | | | 2,620,689 | |
Trust 2003-W2 1A2, 7.00%, 7/25/42 | | | 896,255 | | | | 1,043,165 | |
Trust 2003-W4 4A, 7.50%, 10/25/42(f) | | | 1,120,931 | | | | 1,270,276 | |
Trust 2012-121 NB, 7.00%, 11/25/42 | | | 1,528,816 | | | | 1,767,426 | |
Trust 2004-T1 1A2, 6.50%, 1/25/44 | | | 1,040,150 | | | | 1,187,458 | |
Trust 2004-W2 5A, 7.50%, 3/25/44 | | | 1,941,428 | | | | 2,205,832 | |
Trust 2004-W8 3A, 7.50%, 6/25/44 | | | 334,373 | | | | 388,919 | |
Trust 2005-W4 1A2, 6.50%, 8/25/45 | | | 3,286,075 | | | | 3,749,797 | |
Trust 2009-11 MP, 7.00%, 3/25/49 | | | 3,073,820 | | | | 3,598,932 | |
USD LIBOR 1-Month | | | | | | | | |
+0.55%, 2.954%, 9/25/43 | | | 6,428,833 | | | | 6,460,498 | |
Freddie Mac | | | | | | | | |
Series 1078 GZ, 6.50%, 5/15/21 | | | 11,225 | | | | 11,284 | |
Series 16 PK, 7.00%, 8/25/23 | | | 864,496 | | | | 917,174 | |
Series T-48 1A4, 5.538%, 7/25/33 | | | 21,406,549 | | | | 23,719,704 | |
Series T-51 1A, 6.50%, 9/25/43(f) | | | 145,891 | | | | 170,946 | |
Series T-59 1A1, 6.50%, 10/25/43 | | | 7,611,044 | | | | 9,031,966 | |
Series 4281 BC, 4.50%, 12/15/43(f) | | | 40,194,989 | | | | 43,234,216 | |
USD LIBOR 1-Month | | | | | | | | |
+0.61%, 3.004%, 9/15/43 | | | 14,460,156 | | | | 14,622,684 | |
Ginnie Mae | | | | | | | | |
USD LIBOR 1-Month | | | | | | | | |
+0.62%, 3.087%, 9/20/64 | | | 3,617,071 | | | | 3,617,345 | |
USD LIBOR 12-Month | | | | | | | | |
+0.30%, 3.42%, 1/20/67 | | | 24,010,784 | | | | 24,373,700 | |
+0.23%, 3.07%, 10/20/67 | | | 22,284,097 | | | | 22,055,034 | |
+0.23%, 3.07%, 10/20/67 | | | 13,357,728 | | | | 13,227,303 | |
+0.06%, 3.062%, 12/20/67 | | | 34,364,491 | | | | 33,809,102 | |
+0.08%, 2.817%, 5/20/68 | | | 9,831,574 | | | | 9,642,430 | |
+0.25%, 3.05%, 6/20/68 | | | 30,755,114 | | | | 30,344,299 | |
+0.28%, 3.159%, 11/20/68 | | | 42,587,830 | | | | 42,218,282 | |
+0.25%, 3.25%, 12/20/68 | | | 4,581,770 | | | | 4,531,926 | |
| | | | | | | | |
| | | | | | | 326,231,078 | |
Federal Agency Mortgage Pass-Through: 9.5% | |
Fannie Mae, 15 Year | | | | | | | | |
6.00%, 3/1/22 | | | 82,915 | | | | 84,675 | |
4.50%, 1/1/25-1/1/27 | | | 6,555,516 | | | | 6,863,932 | |
3.50%, 11/1/25-12/1/29 | | | 19,307,303 | | | | 19,948,300 | |
Fannie Mae, 20 Year | | | | | | | | |
4.00%, 11/1/30-2/1/37 | | | 37,560,418 | | | | 39,456,030 | |
4.50%, 1/1/31-12/1/34 | | | 56,758,475 | | | | 60,410,935 | |
3.50%, 6/1/35-4/1/37 | | | 71,530,342 | | | | 73,663,949 | |
Fannie Mae, 30 Year | | | | | | | | |
6.50%, 12/1/28-8/1/39 | | | 13,257,531 | | | | 15,346,175 | |
5.50%, 7/1/33-8/1/37 | | | 8,634,155 | | | | 9,581,704 | |
6.00%, 9/1/36-8/1/37 | | | 12,002,092 | | | | 13,606,137 | |
7.00%, 8/1/37 | | | 316,641 | | | | 367,999 | |
4.50%, 1/1/39-3/1/49 | | | 486,904,846 | | | | 513,216,900 | |
5.00%, 12/1/48-3/1/49 | | | 23,028,713 | | | | 24,409,413 | |
Fannie Mae, 40 Year
4.50%, 6/1/56 | | | 36,025,238 | | | | 38,568,133 | |
Fannie Mae, Hybrid ARM(f) | | | | | | | | |
1-Year U.S. Treasury CMT | | | | | | | | |
+2.05%, 4.305%, 9/1/34 | | | 692,718 | | | | 724,837 | |
USD LIBOR 12-Month | | | | | | | | |
+1.32%, 4.234%, 12/1/34 | | | 857,566 | | | | 886,295 | |
+1.58%, 4.654%, 1/1/35 | | | 753,778 | | | | 788,066 | |
+1.55%, 4.446%, 8/1/35 | | | 576,989 | | | | 602,494 | |
+1.64%, 4.693%, 5/1/37 | | | 631,117 | | | | 661,161 | |
+1.84%, 4.536%, 7/1/39 | | | 1,098,831 | | | | 1,130,558 | |
+1.78%, 3.78%, 11/1/40 | | | 1,137,401 | | | | 1,180,072 | |
+1.78%, 3.623%, 12/1/40 | | | 3,262,955 | | | | 3,385,914 | |
+1.57%, 4.43%, 11/1/43 | | | 2,464,347 | | | | 2,544,820 | |
+1.55%, 4.584%, 4/1/44 | | | 6,377,527 | | | | 6,585,729 | |
| | | | | | | | |
| | |
| | | PAR VALUE | | | VALUE | |
+1.60%, 2.805%, 11/1/44 | | $ | 14,239,050 | | | $ | 14,535,093 | |
+1.60%, 2.787%, 12/1/44 | | | 10,724,557 | | | | 10,942,910 | |
+1.59%, 2.90%, 9/1/45 | | | 2,836,641 | | | | 2,880,843 | |
+1.59%, 2.849%, 12/1/45 | | | 14,127,108 | | | | 14,338,455 | |
+1.59%, 2.65%, 1/1/46 | | | 12,317,187 | | | | 12,462,971 | |
+1.61%, 2.955%, 4/1/46 | | | 7,452,204 | | | | 7,620,059 | |
+1.61%, 2.53%, 12/1/46 | | | 12,454,165 | | | | 12,540,813 | |
+1.61%, 3.163%, 6/1/47 | | | 10,539,332 | | | | 10,770,114 | |
+1.61%, 3.127%, 7/1/47 | | | 14,323,239 | | | | 14,623,848 | |
+1.60%, 2.706%, 8/1/47 | | | 18,570,862 | | | | 18,791,786 | |
+1.61%, 3.378%, 1/1/49 | | | 13,275,727 | | | | 13,606,352 | |
USD LIBOR 6-Month | | | | | | | | |
+1.53%, 4.238%, 1/1/35 | | | 960,386 | | | | 992,735 | |
Freddie Mac, Hybrid ARM(f) | | | | | | | | |
1-Year U.S. Treasury CMT | | | | | | | | |
+2.25%, 4.687%, 10/1/35 | | | 1,629,154 | | | | 1,717,282 | |
USD LIBOR 12-Month | | | | | | | | |
+1.96%, 4.836%, 5/1/34 | | | 1,243,037 | | | | 1,314,258 | |
+1.55%, 4.439%, 4/1/37 | | | 1,517,874 | | | | 1,588,785 | |
+1.79%, 4.543%, 9/1/37 | | | 1,045,656 | | | | 1,099,334 | |
+1.87%, 4.64%, 1/1/38 | | | 164,778 | | | | 171,855 | |
+2.06%, 5.187%, 2/1/38 | | | 1,768,924 | | | | 1,865,342 | |
+1.94%, 4.72%, 7/1/38 | | | 152,126 | | | | 157,905 | |
+1.75%, 4.672%, 10/1/38 | | | 785,215 | | | | 824,864 | |
+1.79%, 3.613%, 10/1/41 | | | 751,549 | | | | 774,497 | |
+1.79%, 3.695%, 8/1/42 | | | 3,447,519 | | | | 3,546,436 | |
+1.62%, 2.954%, 5/1/44 | | | 9,413,227 | | | | 9,589,725 | |
+1.61%, 3.054%, 5/1/44 | | | 1,415,544 | | | | 1,445,515 | |
+1.62%, 2.943%, 6/1/44 | | | 2,833,419 | | | | 2,889,175 | |
+1.62%, 3.17%, 6/1/44 | | | 2,592,403 | | | | 2,651,615 | |
+1.63%, 3.069%, 1/1/45 | | | 14,633,663 | | | | 14,966,656 | |
+1.62%, 2.733%, 10/1/45 | | | 7,931,727 | | | | 8,022,184 | |
+1.62%, 2.826%, 10/1/45 | | | 8,530,450 | | | | 8,642,542 | |
+1.63%, 3.244%, 7/1/47 | | | 8,816,866 | | | | 9,003,607 | |
Freddie Mac Gold, 15 Year | | | | | | | | |
4.50%, 9/1/24-9/1/26 | | | 4,475,296 | | | | 4,620,547 | |
Freddie Mac Gold, 20 Year | | | | | | | | |
6.50%, 10/1/26 | | | 2,340,654 | | | | 2,507,896 | |
4.50%, 4/1/31-6/1/31 | | | 7,231,984 | | | | 7,703,135 | |
Freddie Mac Gold, 30 Year | | | | | | | | |
7.75%, 7/25/21 | | | 56,097 | | | | 56,152 | |
7.47%, 3/17/23 | | | 45,833 | | | | 47,304 | |
6.50%, 12/1/32-4/1/33 | | | 3,956,856 | | | | 4,490,092 | |
7.00%, 11/1/37-9/1/38 | | | 3,192,712 | | | | 3,695,924 | |
5.50%, 12/1/37 | | | 463,099 | | | | 514,181 | |
6.00%, 2/1/39 | | | 1,151,783 | | | | 1,305,985 | |
4.50%, 9/1/41-8/1/48 | | | 328,989,355 | | | | 347,749,697 | |
Freddie Mac Pool, 30 Year
4.50%, 2/1/49 | | | 32,719,330 | | | | 34,232,313 | |
Ginnie Mae, 30 Year | | | | | | | | |
7.97%, 4/15/20-1/15/21 | | | 24,985 | | | | 25,390 | |
7.50%, 11/15/24-10/15/25 | | | 379,181 | | | | 411,096 | |
| | | | | | | | |
| | | | | | | 1,445,751,496 | |
| | | | | | | | |
| | | | | | | 1,771,982,574 | |
| | | | | | | | |
| | | | | | | 2,145,021,736 | |
| CORPORATE: 13.2% | | | | | | | | |
FINANCIALS: 4.6% | | | | | | | | |
Bank of America Corp. | | | | | | | | |
3.004%, 12/20/23(g) | | | 44,918,000 | | | | 45,723,686 | |
4.20%, 8/26/24 | | | 5,825,000 | | | | 6,192,912 | |
4.45%, 3/3/26 | | | 3,970,000 | | | | 4,280,613 | |
4.25%, 10/22/26 | | | 2,970,000 | | | | 3,171,704 | |
4.183%, 11/25/27 | | | 7,925,000 | | | | 8,406,932 | |
Barclays PLC (United Kingdom) | | | | | | | | |
4.375%, 9/11/24 | | | 18,275,000 | | | | 18,723,682 | |
4.836%, 5/9/28 | | | 9,525,000 | | | | 9,747,792 | |
| | |
| PAGE 10§ DODGE & COX BALANCED FUND | | See accompanying Notes to Financial Statements |
| | | | |
| PORTFOLIO OF INVESTMENTS(unaudited) | | | June 30, 2019 | |
| | | | | | | | |
| DEBT SECURITIES (continued) | | | | | | |
| | |
| | | PAR VALUE | | | VALUE | |
BNP Paribas SA (France) | | | | | | | | |
4.25%, 10/15/24 | | $ | 36,700,000 | | | $ | 38,584,721 | |
4.375%, 9/28/25(c) | | | 20,120,000 | | | | 21,132,727 | |
4.375%, 5/12/26(c) | | | 8,000,000 | | | | 8,385,144 | |
4.625%, 3/13/27(c) | | | 9,775,000 | | | | 10,432,878 | |
Boston Properties, Inc. | | | | | | | | |
3.85%, 2/1/23 | | | 7,800,000 | | | | 8,137,632 | |
3.125%, 9/1/23 | | | 17,550,000 | | | | 17,992,835 | |
3.80%, 2/1/24 | | | 5,000,000 | | | | 5,241,200 | |
3.65%, 2/1/26 | | | 4,450,000 | | | | 4,627,712 | |
Capital One Financial Corp. | | | | | | | | |
3.50%, 6/15/23 | | | 21,006,000 | | | | 21,800,973 | |
3.90%, 1/29/24 | | | 4,275,000 | | | | 4,488,435 | |
4.20%, 10/29/25 | | | 10,175,000 | | | | 10,682,664 | |
Cigna Corp.
7.875%, 5/15/27 | | | 17,587,000 | | | | 22,927,867 | |
Citigroup, Inc. | | | | | | | | |
4.00%, 8/5/24 | | | 5,925,000 | | | | 6,242,823 | |
USD LIBOR 3-Month | | | | | | | | |
+6.37%, 8.953%, 10/30/40(b) | | | 37,080,925 | | | | 41,041,168 | |
Equity Residential | | | | | | | | |
3.00%, 4/15/23 | | | 14,775,000 | | | | 15,131,999 | |
2.85%, 11/1/26 | | | 6,000,000 | | | | 6,063,222 | |
HSBC Holdings PLC (United Kingdom) | | | | | | | | |
3.95%, 5/18/24(g) | | | 21,200,000 | | | | 22,171,592 | |
4.30%, 3/8/26 | | | 11,462,000 | | | | 12,306,508 | |
6.50%, 5/2/36 | | | 31,355,000 | | | | 40,537,407 | |
6.50%, 9/15/37 | | | 12,665,000 | | | | 16,507,280 | |
JPMorgan Chase & Co. | | | | | | | | |
4.125%, 12/15/26 | | | 3,000,000 | | | | 3,209,537 | |
8.75%, 9/1/30(b) | | | 25,692,000 | | | | 36,702,685 | |
Lloyds Banking Group PLC (United Kingdom) | | | | | | | | |
4.05%, 8/16/23 | | | 10,325,000 | | | | 10,773,339 | |
4.50%, 11/4/24 | | | 19,575,000 | | | | 20,467,333 | |
4.582%, 12/10/25 | | | 2,500,000 | | | | 2,607,110 | |
4.65%, 3/24/26 | | | 16,100,000 | | | | 16,803,557 | |
Royal Bank of Scotland Group PLC (United Kingdom) | | | | | | | | |
6.125%, 12/15/22 | | | 43,156,000 | | | | 46,542,355 | |
6.00%, 12/19/23 | | | 16,825,000 | | | | 18,315,513 | |
UniCredit SPA (Italy)
7.296%, 4/2/34(c)(g) | | | 23,425,000 | | | | 24,827,642 | |
Unum Group | | | | | | | | |
7.19%, 2/1/28 | | | 8,305,000 | | | | 10,127,538 | |
7.25%, 3/15/28 | | | 2,030,000 | | | | 2,504,694 | |
6.75%, 12/15/28 | | | 11,368,000 | | | | 13,762,756 | |
Wells Fargo & Co. | | | | | | | | |
2.15%, 12/6/19 | | | 19,500,000 | | | | 19,481,434 | |
4.10%, 6/3/26 | | | 3,376,000 | | | | 3,576,681 | |
4.30%, 7/22/27 | | | 21,995,000 | | | | 23,749,608 | |
USD LIBOR 3-Month | | | | | | | | |
+0.65%, 3.124%, 12/6/19 | | | 11,575,000 | | | | 11,606,511 | |
| | | | | | | | |
| | | | | | | 695,742,401 | |
INDUSTRIALS: 8.1% | | | | | | | | |
Anheuser-Busch InBev SA/NV (Belgium) | | | | | | | | |
5.45%, 1/23/39 | | | 6,375,000 | | | | 7,573,308 | |
5.55%, 1/23/49 | | | 16,900,000 | | | | 20,607,604 | |
AT&T, Inc. | | | | | | | | |
5.35%, 9/1/40 | | | 27,575,000 | | | | 31,096,074 | |
4.75%, 5/15/46 | | | 7,000,000 | | | | 7,359,468 | |
5.65%, 2/15/47 | | | 5,175,000 | | | | 6,065,533 | |
4.50%, 3/9/48 | | | 24,560,000 | | | | 25,162,029 | |
Bayer AG (Germany) | | | | | | | | |
3.875%, 12/15/23(c) | | | 16,175,000 | | | | 16,758,534 | |
4.25%, 12/15/25(c) | | | 6,600,000 | | | | 6,979,172 | |
4.375%, 12/15/28(c) | | | 26,300,000 | | | | 27,709,288 | |
| | | | | | | | |
| | |
| | | PAR VALUE | | | VALUE | |
Bayerische Motoren Werke AG (Germany) 3.40%, 8/13/21(c) | | $ | 6,200,000 | | | $ | 6,317,529 | |
BHP Billiton, Ltd. (Australia)
6.75%, 10/19/75(b)(c)(g) | | | 7,525,000 | | | | 8,586,025 | |
Burlington Northern Santa Fe LLC(e) | | | | | | | | |
5.72%, 1/15/24 | | | 2,616,284 | | | | 2,825,696 | |
5.342%, 4/1/24 | | | 4,959,241 | | | | 5,275,567 | |
5.629%, 4/1/24 | | | 8,050,035 | | | | 8,583,427 | |
Cemex SAB de CV (Mexico) | | | | | | | | |
6.00%, 4/1/24(c) | | | 10,575,000 | | | | 10,892,250 | |
5.70%, 1/11/25(c) | | | 22,475,000 | | | | 23,350,401 | |
6.125%, 5/5/25(c) | | | 12,870,000 | | | | 13,465,237 | |
Charter Communications, Inc. | | | | | | | | |
4.125%, 2/15/21 | | | 5,547,000 | | | | 5,649,059 | |
4.908%, 7/23/25 | | | 11,600,000 | | | | 12,586,592 | |
4.20%, 3/15/28 | | | 5,000,000 | | | | 5,191,489 | |
5.05%, 3/30/29 | | | 5,250,000 | | | | 5,783,831 | |
6.55%, 5/1/37 | | | 11,000,000 | | | | 12,699,482 | |
6.75%, 6/15/39 | | | 6,160,000 | | | | 7,139,969 | |
6.484%, 10/23/45 | | | 38,477,000 | | | | 45,294,427 | |
5.375%, 5/1/47 | | | 4,100,000 | | | | 4,314,105 | |
5.75%, 4/1/48 | | | 12,300,000 | | | | 13,596,362 | |
Cigna Corp. | | | | | | | | |
3.75%, 7/15/23(c) | | | 16,900,000 | | | | 17,585,729 | |
4.125%, 11/15/25(c) | | | 4,100,000 | | | | 4,354,272 | |
4.375%, 10/15/28(c) | | | 2,692,000 | | | | 2,903,280 | |
Comcast Corp. | | | | | | | | |
3.95%, 10/15/25 | | | 5,325,000 | | | | 5,741,666 | |
4.70%, 10/15/48 | | | 3,625,000 | | | | 4,248,017 | |
3.999%, 11/1/49 | | | 3,772,000 | | | | 3,970,073 | |
Cox Enterprises, Inc. | | | | | | | | |
3.25%, 12/15/22(c) | | | 6,240,000 | | | | 6,366,825 | |
2.95%, 6/30/23(c) | | | 37,166,000 | | | | 37,482,451 | |
3.85%, 2/1/25(c) | | | 24,125,000 | | | | 25,206,284 | |
3.35%, 9/15/26(c) | | | 3,400,000 | | | | 3,435,430 | |
CRH PLC (Ireland)
3.875%, 5/18/25(c) | | | 17,100,000 | | | | 17,876,380 | |
CVS Health Corp. | | | | | | | | |
3.70%, 3/9/23 | | | 13,033,000 | | | | 13,454,559 | |
4.10%, 3/25/25 | | | 6,025,000 | | | | 6,351,110 | |
4.30%, 3/25/28 | | | 22,645,000 | | | | 23,866,244 | |
4.78%, 3/25/38 | | | 8,125,000 | | | | 8,468,452 | |
Dell Technologies, Inc.
5.45%, 6/15/23(c) | | | 14,966,000 | | | | 16,130,411 | |
Dillard’s, Inc. | | | | | | | | |
7.875%, 1/1/23 | | | 8,660,000 | | | | 9,308,067 | |
7.75%, 7/15/26 | | | 50,000 | | | | 55,768 | |
7.75%, 5/15/27 | | | 540,000 | | | | 592,971 | |
7.00%, 12/1/28 | | | 15,135,000 | | | | 16,315,651 | |
Dow, Inc. | | | | | | | | |
7.375%, 11/1/29 | | | 17,000,000 | | | | 22,347,867 | |
9.40%, 5/15/39 | | | 5,677,000 | | | | 9,005,665 | |
5.55%, 11/30/48(c) | | | 5,250,000 | | | | 6,241,261 | |
Elanco Animal Health, Inc. | | | | | | | | |
3.912%, 8/27/21 | | | 2,500,000 | | | | 2,553,478 | |
4.272%, 8/28/23 | | | 2,500,000 | | | | 2,622,849 | |
4.90%, 8/28/28 | | | 3,500,000 | | | | 3,907,010 | |
Ford Motor Credit Co. LLC(e) | | | | | | | | |
5.75%, 2/1/21 | | | 12,700,000 | | | | 13,220,938 | |
5.875%, 8/2/21 | | | 12,945,000 | | | | 13,646,078 | |
3.813%, 10/12/21 | | | 14,270,000 | | | | 14,469,419 | |
5.596%, 1/7/22 | | | 9,425,000 | | | | 9,979,622 | |
4.25%, 9/20/22 | | | 4,243,000 | | | | 4,350,134 | |
4.14%, 2/15/23 | | | 5,166,000 | | | | 5,261,094 | |
4.375%, 8/6/23 | | | 11,405,000 | | | | 11,705,178 | |
Fox Corp. | | | | | | | | |
4.709%, 1/25/29(c) | | | 2,125,000 | | | | 2,370,646 | |
5.476%, 1/25/39(c) | | | 2,550,000 | | | | 3,008,315 | |
| | |
| See accompanying Notes to Financial Statements | | DODGE & COX BALANCED FUND§PAGE 11 |
| | | | |
| PORTFOLIO OF INVESTMENTS (unaudited) | | | June 30, 2019 | |
| | | | | | | | |
| DEBT SECURITIES (continued) | | | | | | |
| | |
| | | PAR VALUE | | | VALUE | |
HCA Healthcare, Inc. | | | | | | | | |
4.125%, 6/15/29 | | $ | 6,725,000 | | | $ | 6,881,333 | |
5.25%, 6/15/49 | | | 10,255,000 | | | | 10,662,226 | |
Imperial Brands PLC (United Kingdom) | | | | | | | | |
3.75%, 7/21/22(c) | | | 10,475,000 | | | | 10,780,564 | |
4.25%, 7/21/25(c) | | | 46,275,000 | | | | 48,532,624 | |
Kinder Morgan, Inc. | | | | | | | | |
4.30%, 6/1/25 | | | 11,050,000 | | | | 11,802,279 | |
5.50%, 3/1/44 | | | 25,893,000 | | | | 29,222,202 | |
5.40%, 9/1/44 | | | 20,119,000 | | | | 22,279,872 | |
Macy’s, Inc.
6.70%, 7/15/34 | | | 5,890,000 | | | | 6,491,057 | |
Naspers, Ltd. (South Africa) | | | | | | | | |
6.00%, 7/18/20(c) | | | 16,900,000 | | | | 17,391,756 | |
5.50%, 7/21/25(c) | | | 25,825,000 | | | | 28,144,085 | |
4.85%, 7/6/27(c) | | | 14,200,000 | | | | 15,168,298 | |
RELX PLC (United Kingdom) | | | | | | | | |
3.125%, 10/15/22 | | | 17,458,000 | | | | 17,769,791 | |
4.00%, 3/18/29 | | | 5,400,000 | | | | 5,702,739 | |
TC Energy Corp. (Canada) | | | | | | | | |
5.625%, 5/20/75(b)(g) | | | 20,570,000 | | | | 20,353,192 | |
5.875%, 8/15/76(b)(g) | | | 4,500,000 | | | | 4,618,800 | |
5.30%, 3/15/77(b)(g) | | | 25,885,000 | | | | 24,859,889 | |
Telecom Italia SPA (Italy) | | | | | | | | |
5.303%, 5/30/24(c) | | | 25,508,000 | | | | 26,400,780 | |
7.20%, 7/18/36 | | | 11,596,000 | | | | 12,784,590 | |
7.721%, 6/4/38 | | | 8,212,000 | | | | 9,259,030 | |
The Walt Disney Co. | | | | | | | | |
6.15%, 3/1/37(c) | | | 15,000,000 | | | | 20,362,092 | |
6.65%, 11/15/37(c) | | | 4,638,000 | | | | 6,658,667 | |
Ultrapar Participacoes SA (Brazil) | | | | | | | | |
5.25%, 10/6/26(c) | | | 12,050,000 | | | | 12,607,313 | |
5.25%, 6/6/29(c) | | | 11,350,000 | | | | 11,605,375 | |
Union Pacific Corp.
6.176%, 1/2/31 | | | 6,018,144 | | | | 7,013,660 | |
United Technologies Corp. | | | | | | | | |
3.35%, 8/16/21 | | | 3,650,000 | | | | 3,730,145 | |
3.65%, 8/16/23 | | | 13,000,000 | | | | 13,609,290 | |
Verizon Communications, Inc. | | | | | | | | |
4.272%, 1/15/36 | | | 11,847,000 | | | | 12,820,593 | |
4.522%, 9/15/48 | | | 7,000,000 | | | | 7,818,255 | |
5.012%, 4/15/49 | | | 49,149,000 | | | | 58,467,012 | |
Vodafone Group PLC (United Kingdom)
7.00%, 4/4/79(b)(g) | | | 16,900,000 | | | | 18,240,921 | |
Xerox Corp.
4.50%, 5/15/21 | | | 21,561,000 | | | | 22,012,272 | |
Zoetis, Inc. | | | | | | | | |
3.25%, 2/1/23 | | | 2,150,000 | | | | 2,193,646 | |
4.50%, 11/13/25 | | | 17,545,000 | | | | 19,241,446 | |
| | | | | | | | |
| | | | | | | 1,234,751,446 | |
UTILITIES: 0.5% | | | | | | | | |
Dominion Energy, Inc. | | | | | | | | |
2.579%, 7/1/20 | | | 4,600,000 | | | | 4,593,150 | |
4.104%, 4/1/21 | | | 5,650,000 | | | | 5,783,495 | |
5.75%, 10/1/54(b)(g) | | | 22,950,000 | | | | 23,845,050 | |
Enel SPA (Italy) | | | | | | | | |
4.25%, 9/14/23(c) | | | 4,075,000 | | | | 4,277,511 | |
4.625%, 9/14/25(c) | | | 10,500,000 | | | | 11,264,884 | |
6.80%, 9/15/37(c) | | | 13,700,000 | | | | 17,410,311 | |
6.00%, 10/7/39(c) | | | 13,352,000 | | | | 15,819,130 | |
| | | | | | | | |
| | | | | | | 82,993,531 | |
| | | | | | | | |
| | | | | | | 2,013,487,378 | |
| | | | | | | | |
TOTAL DEBT SECURITIES
(Cost $4,607,708,394) | | | | | | $ | 4,818,380,066 | |
| | | | | | | | |
| SHORT-TERM INVESTMENTS: 1.9% | | | | |
| | |
| | | PAR VALUE/
SHARES | | | VALUE | |
REPURCHASE AGREEMENTS: 1.5% | | | | | | | | |
Bank of Montreal(d)
2.45%, dated 6/28/19, due 7/1/19, maturity value $23,704,839 | | $ | 23,700,000 | | | $ | 23,700,000 | |
Fixed Income Clearing Corporation(d)
1.60%, dated 6/28/19, due 7/1/19, maturity value $134,878,981 | | | 134,861,000 | | | | 134,861,000 | |
Royal Bank of Canada(d)
2.47%, dated 6/28/19, due 7/1/19, maturity value $63,112,988 | | | 63,100,000 | | | | 63,100,000 | |
| | | | | | | | |
| | | | 221,661,000 | |
MONEY MARKET FUND: 0.4% | | | | | | | | |
State Street Institutional U.S. Government Money Market Fund | | | 60,691,922 | | | | 60,691,922 | |
| | | | | | | | |
TOTAL SHORT-TERM INVESTMENTS
(Cost $282,352,922) | | | $ | 282,352,922 | |
| | | | | | | | |
TOTAL INVESTMENTS IN SECURITIES
(Cost $12,011,899,371) | | | 99.6 | % | | $ | 15,181,724,302 | |
OTHER ASSETS LESS LIABILITIES | | | 0.4 | % | | | 59,254,654 | |
| | | | | | | | |
| NET ASSETS | | | 100.0 | % | | $ | 15,240,978,956 | |
| | | | | | | | |
| (b) | Hybrid security has characteristics of both a debt and equity security. |
| (c) | Security exempt from registration under Rule 144A of the Securities Act of 1933. The security may be resold in transactions exempt from registration, normally to qualified institutional buyers. |
| (d) | Repurchase agreements are collateralized by: |
Bank of Montreal: U.S. Treasury Notes 2.00%-3.00%, 8/31/20-8/15/48 and U.S. Treasury Inflation Indexed Notes 0.75%-3.375%, 1/15/25-2/15/46. Total collateral value is $24,178,970.
Fixed Income Clearing Corporation: U.S. Treasury Notes 1.125%-2.75%, 7/31/21-9/15/21. Total collateral value is $137,562,853.
Royal Bank of Canada: U.S. Treasury Note 2.75%, 9/15/21. Total collateral value is $64,375,265.
| (e) | Subsidiary (see below) |
| (f) | Variable rate security: interest rate is determined by the interest rates of underlying pool of assets that collateralize the security. The interest rate of the security may change due to a change in the interest rates or the composition of underlying pool of assets. The interest rate shown is the rate as of period end. |
| (g) | Variable rate security: fixed-to-float security pays an initial fixed interest rate and will pay a floating interest rate established at a predetermined time in the future. The interest rate shown is the rate as of period end. |
In determining a company’s country designation, the Fund generally references the country of incorporation. In cases where the Fund considers the country of incorporation to be a “jurisdiction of convenience” chosen primarily for tax purposes or in other limited circumstances, the Fund uses the country designation of an appropriate broad-based market index. In those cases, two countries are listed — the country of incorporation and the country designated by an appropriate index, respectively.
Debt securities are grouped by parent company unless otherwise noted. Actual securities may be issued by the listed parent company or one of its subsidiaries.
Debt securities with floating interest rates are linked to the referenced benchmark; the interest rate shown is the rate as of period end.
| | |
| PAGE 12§ DODGE & COX BALANCED FUND | | See accompanying Notes to Financial Statements |
| | | | |
| PORTFOLIO OF INVESTMENTS (unaudited) | |
| June 30, 2019
|
|
ADR: American Depositary Receipt
ARM: Adjustable Rate Mortgage
CMBS: Commercial Mortgage-Backed Security
CMO: Collateralized Mortgage Obligation
CMT: Constant Maturity Treasury
DUS: Delegated Underwriting and Servicing
GO: General Obligation
RB: Revenue Bond
REMIC: Real Estate Mortgage Investment Conduit
| | |
| See accompanying Notes to Financial Statements | | DODGE & COX BALANCED FUND§PAGE 13 |
| | | | |
STATEMENT OF ASSETS AND LIABILITIES (unaudited) | |
| |
| | | June 30, 2019 | |
ASSETS: | |
Investments in securities, at value (cost $12,011,899,371) | | $ | 15,181,724,302 | |
Receivable for investments sold | | | 57,009,314 | |
Receivable for Fund shares sold | | | 5,053,875 | |
Dividends and interest receivable | | | 55,342,502 | |
Prepaid expenses and other assets | | | 136,764 | |
| | | | |
| | | 15,299,266,757 | |
| | | | |
LIABILITIES: | | | | |
Payable for investments purchased | | | 38,908,140 | |
Payable for Fund shares redeemed | | | 12,376,308 | |
Management fees payable | | | 6,213,820 | |
Accrued expenses | | | 789,533 | |
| | | | |
| | | 58,287,801 | |
| | | | |
NET ASSETS | | $ | 15,240,978,956 | |
| | | | |
NET ASSETS CONSIST OF: | |
Paid in capital | | $ | 11,652,546,495 | |
Total distributable earnings | | | 3,588,432,461 | |
| | | | |
| | $ | 15,240,978,956 | |
| | | | |
Fund shares outstanding (par value $0.01 each, unlimited shares authorized) | | | 153,105,022 | |
Net asset value per share | | $ | 99.55 | |
| |
STATEMENT OF OPERATIONS (unaudited) | | | | |
| |
| | | Six Months Ended
June 30, 2019 | |
INVESTMENT INCOME: | |
Dividends (net of foreign taxes of $3,451,782) | | $ | 132,957,163 | |
Interest | | | 112,897,193 | |
| | | | |
| | | 245,854,356 | |
| | | | |
EXPENSES: | | | | |
Management fees | | | 37,515,302 | |
Custody and fund accounting fees | | | 118,601 | |
Transfer agent fees | | | 698,771 | |
Professional services | | | 117,664 | |
Shareholder reports | | | 122,178 | |
Registration fees | | | 122,048 | |
Trustees’ fees | | | 170,833 | |
ADR depositary service fees | | | 836,353 | |
Miscellaneous | | | 96,690 | |
| | | | |
| | | 39,798,440 | |
| | | | |
NET INVESTMENT INCOME | | | 206,055,916 | |
| | | | |
REALIZED AND UNREALIZED GAIN (LOSS): | | | | |
Net realized gain (loss) | | | | |
Investments in securities | | | 407,728,065 | |
Futures contracts | | | (7,355,862 | ) |
Net change in unrealized appreciation/depreciation | | | | |
Investments in securities | | | 901,282,340 | |
Futures contracts | | | 3,564,635 | |
| | | | |
Net realized and unrealized gain (loss) | | | 1,305,219,178 | |
| | | | |
NET CHANGE IN NET ASSETS FROM OPERATIONS | | $ | 1,511,275,094 | |
| | | | |
| | | | | | | | |
STATEMENT OF CHANGES IN NET ASSETS (unaudited) | |
| | |
| | | Six Months Ended
June 30, 2019 | | | Year Ended
December 31, 2018 | |
OPERATIONS: | | | | | | | | |
Net investment income | | $ | 206,055,916 | | | $ | 325,943,721 | |
Net realized gain (loss) | | | 400,372,203 | | | | 1,300,493,950 | |
Net change in unrealized appreciation/depreciation | | | 904,846,975 | | | | (2,310,617,993 | ) |
| | | | | | | | |
| | | 1,511,275,094 | | | | (684,189,322 | ) |
| | | | | | | | |
| | |
DISTRIBUTIONS TO SHAREHOLDERS: | | | | | | | | |
Total distributions | | | (547,607,449 | ) | | | (1,299,992,127 | ) |
| | |
FUND SHARE TRANSACTIONS: | | | | | | | | |
Proceeds from sale of shares | | | 801,209,882 | | | | 1,255,189,936 | |
Reinvestment of distributions | | | 516,378,876 | | | | 1,229,242,880 | |
Cost of shares redeemed | | | (1,221,306,778 | ) | | | (2,706,186,811 | ) |
| | | | | | | | |
Net change from Fund share transactions | | | 96,281,980 | | | | (221,753,995 | ) |
| | | | | | | | |
Total change in net assets | | | 1,059,949,625 | | | | (2,205,935,444 | ) |
| | |
NET ASSETS: | | | | | | | | |
Beginning of period | | | 14,181,029,331 | | | | 16,386,964,775 | |
| | | | | | | | |
End of period | | $ | 15,240,978,956 | | | $ | 14,181,029,331 | |
| | | | | | | | |
| | |
SHARE INFORMATION: | | | | | | | | |
Shares sold | | | 8,102,683 | | | | 11,905,136 | |
Distributions reinvested | | | 5,280,667 | | | | 12,704,514 | |
Shares redeemed | | | (12,320,238 | ) | | | (25,719,422 | ) |
| | | | | | | | |
Net change in shares outstanding | | | 1,063,112 | | | | (1,109,772 | ) |
| | | | | | | | |
| | |
| PAGE 14§ DODGE & COX BALANCED FUND | | See accompanying Notes to Financial Statements |
NOTES TO FINANCIAL STATEMENTS(unaudited)
NOTE 1—ORGANIZATION AND SIGNIFICANT ACCOUNTING POLICIES
Dodge & Cox Balanced Fund (the “Fund”) is one of the series constituting the Dodge & Cox Funds (the “Trust” or the “Funds”). The Trust is organized as a Delaware statutory trust and is registered under the Investment Company Act of 1940, as amended, as anopen-end management investment company. The Fund commenced operations on June 26, 1931, and seeks regular income, conservation of principal, and an opportunity for long-term growth of principal and income. Risk considerations and investment strategies of the Fund are discussed in the Fund’s Prospectus.
The Fund is an investment company and follows the accounting and reporting guidance issued in Topic 946 by the Financial Accounting Standards Board. The financial statements have been prepared in conformity with accounting principles generally accepted in the United States of America, which require the use of estimates and assumptions by management. Actual results may differ from those estimates. Significant accounting policies are as follows:
Security valuation The Fund’s net assets are normally valued as of the scheduled close of trading on the New York Stock Exchange (NYSE), generally 4 p.m. Eastern Time, each day that the NYSE is open for business.
Portfolio securities and other financial instruments for which market quotes are readily available are valued at market value. Listed securities, for example, are generally valued using the official quoted close price or the last sale on the exchange that is determined to be the primary market for the security.
Debt securities, certain preferred stocks, and derivatives traded over the counter are valued using prices received from independent pricing services which utilize dealer quotes, recent transaction data, pricing models, and other inputs to arrive at market-based valuations. Pricing models may consider quoted prices for similar securities, interest rates, cash flows (including prepayment speeds), and credit risk. Exchange-traded derivatives are valued at the settlement price determined by the relevant exchange. Short-term securities less than 60 days to maturity may be valued at amortized cost if amortized cost approximates current value. Mutual funds are valued at their respective net asset values. Security values are not discounted based on the size of the Fund’s position and may differ from the value a Fund receives upon sale of the securities. All securities held by the Fund are denominated in U.S. dollars.
If market quotations are not readily available or if normal valuation procedures produce valuations that are deemed unreliable or inappropriate under the circumstances existing at the time, the investment will be valued at fair value as determined in good faith by or under the direction of the Fund’s Board of Trustees. The Board of Trustees has appointed Dodge & Cox, the Fund’s investment manager, to make fair value determinations in accordance with the Dodge & Cox Funds Valuation Policies (“Valuation Policies”), subject to Board oversight. Dodge & Cox has established a Pricing Committee that is comprised of representatives from Treasury, Legal, Compliance, and Operations. The Pricing Committee is responsible
for implementing the Valuation Policies, including determining the fair value of securities and other investments when necessary. The Pricing Committee considers relevant indications of value that are reasonably available to it in determining the fair value assigned to a particular security, such as the value of similar financial instruments, trading volumes, contractual restrictions on disposition, related corporate actions, and changes in economic conditions. In doing so, the Pricing Committee employs various methods for calibrating fair valuation approaches, including a regular review of key inputs and assumptions, back-testing, and review of any related market activity.
Valuing securities through a fair value determination involves greater reliance on judgment than valuation of securities based on readily available market quotations. In some instances, lack of information and uncertainty as to the significance of information may lead to a conclusion that a prior valuation is the best indication of a security’s value. When fair value pricing is employed, the prices of securities used by the Fund to calculate its net asset value may differ from quoted or published prices for the same securities.
Security transactions, investment income, expenses, and distributions Security transactions are recorded on the trade date. Realized gains and losses on securities sold are determined on the basis of identified cost.
Dividend income and corporate action transactions are recorded on theex-dividend date, or when the Fund first learns of the dividend/corporate action if the ex-dividend date has passed.Non-cash dividends, if any, are recorded at the fair market value of the securities received. Dividends characterized as return of capital for U.S. tax purposes are recorded as a reduction of cost of investments and/or realized gain.
Interest income is recorded on the accrual basis. Interest income includes coupon interest, amortization of premium and accretion of discount on debt securities, and gain/loss on paydowns. The ability of the issuers of the debt securities held by the Fund to meet their obligations may be affected by economic developments in a specific industry, state, or region. Debt obligations may be placed onnon-accrual status and related interest income may be reduced by ceasing current accruals and writing off interest receivables when the collection of all or a portion of interest has become doubtful. A debt obligation is removed fromnon-accrual status when the issuer resumes interest payments or when collectibility of interest is reasonably assured.
Expenses are recorded on the accrual basis. Some expenses of the Trust can be directly attributed to a specific series. Expenses which cannot be directly attributed are allocated among the Funds in the Trust using methodologies determined by the nature of the expense.
Distributions to shareholders are recorded on theex-dividend date.
Foreign taxes The Fund may be subject to foreign taxes which may be imposed by certain countries in which the Fund invests. The Fund endeavors to record foreign taxes based on applicable foreign tax law. Withholding taxes are incurred on certain foreign dividends and are accrued at the time the associated dividend is recorded. The Fund files withholding tax
DODGE & COX BALANCED FUND§PAGE 15
NOTES TO FINANCIAL STATEMENTS(unaudited)
reclaims in certain jurisdictions to recover a portion of amounts previously withheld. The Fund records a reclaim receivable based on, among other things, a jurisdiction’s legal obligation to pay reclaims as well as payment history and market convention. In consideration of recent decisions rendered by European courts, the Fund has filed for additional reclaims related to prior years. A corresponding receivable is established when both the amount is known and significant contingencies or uncertainties regarding collectability are removed. These amounts, if any, are reported in “dividends and interest receivable” in the Statement of Assets and Liabilities.
Repurchase agreements Repurchase agreements are transactions under which a Fund purchases a security from a dealer counterparty and agrees to resell the security to that counterparty on a specified future date at the same price, plus a specified interest rate. The Fund’s repurchase agreements are secured by U.S. government or agency securities, the fair value of which exceeds the principal amount of the repurchase transaction, including accrued interest, at all times. The Fund maintains custody of the underlying collateral securities, either through its regular custodian or through a third party custodian that maintains separate accounts for both the Fund and its counterparties. In the event of default by a counterparty, the Fund has the contractual right to liquidate the collateral securities and to apply the proceeds in satisfaction of the obligation.
Indemnification Under the Trust’s organizational documents, its officers and trustees are indemnified against certain liabilities arising out of the performance of their duties to the Trust. In addition, in the normal course of business the Trust enters into contracts that provide general indemnities to other parties. The Trust’s maximum exposure under these arrangements is unknown as this would involve future claims that may be made against the Trust that have not yet occurred.
NOTE 2—VALUATION MEASUREMENTS
Various inputs are used in determining the value of the Fund’s investments. These inputs are summarized in the three broad levels listed below.
| § | | Level 1: Quoted prices in active markets for identical securities |
| § | | Level 2: Other significant observable inputs (including quoted prices for similar securities, market indices, interest rates, credit risk, forward exchange rates, etc.) |
| § | | Level 3: Significant unobservable inputs (including Fund management’s assumptions in determining the fair value of investments) |
The inputs or methodology used for valuing securities are not necessarily an indication of the risk associated with investing in those securities.
The following is a summary of the inputs used to value the Fund’s holdings at June 30, 2019:
| | | | | | | | |
| Classification | | LEVEL 1
(Quoted Prices) | | | LEVEL 2
(Other Significant
Observable Inputs) | |
Securities | | | | | | | | |
Common Stocks(a) | | $ | 9,472,481,199 | | | $ | — | |
Preferred Stocks | | | — | | | | 608,510,115 | |
Debt Securities | | | | | | | | |
U.S. Treasury | | | — | | | | 421,842,493 | |
Government-Related | | | — | | | | 238,028,459 | |
Securitized | | | — | | | | 2,145,021,736 | |
Corporate | | | — | | | | 2,013,487,378 | |
Short-term Investments | | | | | | | | |
Repurchase Agreements | | | — | | | | 221,661,000 | |
Money Market Fund | | | 60,691,922 | | | | — | |
| | | | | | | | |
Total Securities | | $ | 9,533,173,121 | | | $ | 5,648,551,181 | |
| | | | | | | | |
| | | | | | | | | |
| (a) | All common stocks held in the Fund are Level 1 securities. For a detailed break-out of common stocks by major industry classification, please refer to the Portfolio of Investments. |
NOTE 3—DERIVATIVE INSTRUMENTS
The Fund may enter into various transactions involving derivative instruments, including Treasury futures contracts and purchased equity index put options, in connection with its investment strategy. The Fund may use derivatives to minimize the impact of losses to one or more of its investments (as a “hedging technique”) or to implement its investment strategy.
The Fund may enter intoover-the-counter derivatives (each, an “OTC Derivative”), such as put options. Each OTC Derivative is subject to a negotiated master agreement (based on a form published by the International Swaps and Derivatives Association (“ISDA”)) governing all OTC Derivatives between the Fund and the relevant dealer counterparty. The master agreements specify (i) events of default and other events permitting a party to terminate some or all of the OTC Derivatives thereunder and (ii) the process by which those OTC Derivatives will be valued for purposes of determining termination payments. If some or all of the OTC Derivatives under a master agreement are terminated because of an event of default or similar event, the values of all terminated OTC Derivatives must be netted to determine a single payment owed by one party to the other. To the extent amounts owed to the Fund by its counterparties are not collateralized, the Fund is at risk of those counterparties’non-performance. The Fund attempts to mitigate counterparty credit risk by entering into OTC Derivatives only with counterparties it believes to be of good credit quality, by exchanging collateral, and by monitoring the financial stability of those counterparties.
Futures contracts Futures contracts involve an obligation to purchase or sell (depending on whether the Fund has entered a long or short futures contract, respectively) an asset at a future date, at a price set at the time of the contract. Upon entering into a futures contract, the Fund is required to deposit an amount of
PAGE 16§ DODGE & COX BALANCED FUND
NOTES TO FINANCIAL STATEMENTS(unaudited)
cash or liquid assets (referred to as initial margin) in a segregated account with the clearing broker. Subsequent payments (referred to as variation margin) to and from the clearing broker are made on a daily basis based on changes in the market value of futures contracts. Futures contracts are traded publicly and their market value changes daily. Changes in the market value of open futures contracts are recorded as unrealized appreciation or depreciation in the Statement of Operations. Realized gains and losses on futures contracts are recorded in the Statement of Operations at the closing or expiration of the contracts. Cash deposited with a broker as initial margin is recorded in the Statement of Assets and Liabilities. A receivable and/or payable to brokers for daily variation margin is also recorded in the Statement of Assets and Liabilities.
Investments in futures contracts may include certain risks, which may be different from, and potentially greater than, those of the underlying securities. To the extent the Fund uses futures, it is exposed to additional volatility and potential losses resulting from leverage.
The Fund entered into short Treasury futures contracts to assist with the management of the portfolio’s interest rate exposure. During the six months ended June 30, 2019, these Treasury futures contracts had notional values up to 1% of net assets.
Equity index put options An equity index put option gives its holder the right (but not the obligation) to sell the future value of an equity stock index, such as the S&P 500 index, at a predetermined strike price. A put option has value at its expiration if the index price is lower than the strike price. The buyer of an equity index put option pays a premium amount to purchase the contract, but has no payment obligations thereafter. Cash collateral received from the counterparty is recorded in the Statement of Assets and Liabilities. Changes in the value of open equity index put options are recorded as unrealized appreciation or depreciation and realized gains or losses are recorded at the closing or expiration of the options in the Statement of Operations within investments in securities. For the six months ended June 30, 2019, the Fund did not enter into any equity index put options.
Additional derivative information For financial reporting purposes, the Fund does not offset OTC Derivative assets and liabilities that are subject to a master netting arrangement in the Statement of Assets and Liabilities. OTC Derivatives, if any, are presented in the Statement of Assets and Liabilities as investments. Collateral, if any, held by the Fund for OTC Derivatives are reported gross and presented as “Cash received as collateral for options purchased” in the Statement of Assets and Liabilities.
The netting of assets and liabilities and the offsetting of collateral pledged or received are based on contractualnetting/set-off provisions in the ISDA master agreement. The Fund did not hold any derivative or collateral subject to a master netting arrangement at period end.
NOTE 4—RELATED PARTY TRANSACTIONS
Management fees Under a written agreement approved by a unanimous vote of the Board of Trustees, the Fund pays a management fee monthly at an annual rate of 0.50% of the Fund’s average daily net assets to Dodge & Cox, investment manager of the Fund.
Fund officers and trustees All officers and two of the trustees of the Trust are officers or employees of Dodge & Cox. The Trust pays a fee only to those trustees who are not affiliated with Dodge & Cox.
NOTE 5—INCOME TAX INFORMATION AND DISTRIBUTIONS TO SHAREHOLDERS
A provision for federal income taxes is not required since the Fund intends to continue to qualify as a regulated investment company under Subchapter M of the Internal Revenue Code and distribute all of its taxable income to shareholders. Distributions are determined in accordance with income tax regulations, and such amounts may differ from net investment income and realized gains for financial reporting purposes. The Fund may also designate a portion of the amount paid to redeeming shareholders as a distribution for tax purposes. Financial reporting records are adjusted for permanent book to tax differences at year end to reflect tax character. Book to tax differences are primarily due to differing treatments of wash sales, net short-term realized gain (loss), certain corporate action transactions, derivatives, and distributions.
Distributions during the periods noted below were characterized as follows for federal income tax purposes:
| | | | | | | | |
| | | Six Months Ended
June 30, 2019 | | | Year Ended
December 31, 2018 | |
Ordinary income | | $ | 202,325,168 | | | $ | 297,446,889 | |
| | ($ | 1.330 per share | ) | | ($ | 2.010 per share | ) |
Long-term capital gain | | $ | 345,282,281 | | | $ | 1,002,545,238 | |
| | ($ | 2.281 per share | ) | | ($ | 6.916 per share | ) |
The components of distributable earnings on a tax basis are reported as of the Fund’s most recent year end. At December 31, 2018, the tax basis components of distributable earnings were as follows:
| | | | |
Undistributed long-term capital gain | | $ | 345,167,737 | |
DODGE & COX BALANCED FUND§PAGE 17
NOTES TO FINANCIAL STATEMENTS(unaudited)
At June 30, 2019, unrealized appreciation and depreciation for investments and derivatives based on cost for federal income tax purposes were as follows:
| | | | |
Tax cost | | $ | 12,015,372,579 | |
| | | | |
Unrealized appreciation | | | 3,633,435,260 | |
Unrealized depreciation | | | (467,083,537 | ) |
| | | | |
Net unrealized appreciation | | | 3,166,351,723 | |
Fund management has reviewed the tax positions for open periods (three years and four years, respectively, from filing the Fund’s Federal and State tax returns) as applicable to the Fund, and has determined that no provision for income tax is required in the Fund’s financial statements.
NOTE 6—LOAN FACILITIES
Pursuant to an exemptive order issued by the Securities and Exchange Commission (SEC), the Fund may participate in an interfund lending facility (Facility). The Facility allows the Fund to borrow money from or loan money to the Funds. Loans under the Facility are made for temporary or emergency purposes, such as to fund shareholder redemption requests. Interest on borrowings is the average of the current repurchase agreement rate and the bank loan rate. There was no activity in the Facility during the period.
All Funds in the Trust participate in a $500 million committed credit facility (Line of Credit) with State Street Bank and Trust Company, to be utilized for temporary or emergency purposes to fund shareholder redemptions or for other short-term liquidity purposes. The maximum amount available to the Fund is $250 million. Each Fund pays an annual commitment fee on itspro-rata portion of the Line of Credit. For the six months ended
June 30, 2019, the Fund’s commitment fee amounted to $48,458 and is reflected as a Miscellaneous Expense in the Statement of Operations. Interest on borrowings is charged at the prevailing rate. There were no borrowings on the Line of Credit during the period.
NOTE 7—PURCHASES AND SALES OF INVESTMENTS
For the six months ended June 30, 2019, purchases and sales of securities, other than short-term securities and U.S. government securities, aggregated $1,245,379,783 and $1,385,637,017, respectively. For the six months ended June 30, 2019, purchases and sales of U.S. government securities aggregated $1,061,733,375 and $977,652,914, respectively.
NOTE 8—NEW ACCOUNTING GUIDANCE
In March 2017, the Financial Accounting Standards Board issued an update to amend the amortization period for certain purchased callable debt securities held at a premium. The amendments shorten the amortization period for premiums to the earliest call date, but do not require an accounting change for securities held at a discount. The amendments are effective for financial statements for fiscal years beginning after December 15, 2018, and interim periods within those fiscal years. The Fund’s adoption of the updated accounting standards on January 1, 2019 did not have a material impact on the Fund’s financial statements.
NOTE 9—SUBSEQUENT EVENTS
Fund management has determined that no material events or transactions occurred subsequent to June 30, 2019, and through the date of the Fund’s financial statements issuance, which require additional disclosure in the Fund’s financial statements.
PAGE 18§ DODGE & COX BALANCED FUND
FINANCIAL HIGHLIGHTS(unaudited)
| | | | | | | | | | | | | | | | | | | | | | | | |
SELECTED DATA AND RATIOS (for a share outstanding throughout each period) | | Six Months Ended
June 30, | | | Year Ended December 31, | |
| | | 2019 | | | 2018 | | | 2017 | | | 2016 | | | 2015 | | | 2014 | |
| | | | | | | | |
Net asset value, beginning of period | | | $93.27 | | | | $107.00 | | | | $103.35 | | | | $94.42 | | | | $102.48 | | | | $98.30 | |
Income from investment operations: | | | | | | | | | | | | | | | | | | | | | | | | |
Net investment income | | | 1.35 | | | | 2.20 | | | | 2.28 | | | | 2.34 | | | | 2.06 | | | | 2.03 | |
Net realized and unrealized gain (loss) | | | 8.54 | | | | (7.00 | ) | | | 10.45 | | | | 12.89 | | | | (4.99 | ) | | | 6.59 | |
| | | | | | | | |
Total from investment operations | | | 9.89 | | | | (4.80 | ) | | | 12.73 | | | | 15.23 | | | | (2.93 | ) | | | 8.62 | |
| | | | | | | | |
Distributions to shareholders from: | | | | | | | | | | | | | | | | | | | | | | | | |
Net investment income | | | (1.33 | ) | | | (2.01 | ) | | | (2.29 | ) | | | (2.34 | ) | | | (2.06 | ) | | | (2.03 | ) |
Net realized gain | | | (2.28 | ) | | | (6.92 | ) | | | (6.79 | ) | | | (3.96 | ) | | | (3.07 | ) | | | (2.41 | ) |
| | | | | | | | |
Total distributions | | | (3.61 | ) | | | (8.93 | ) | | | (9.08 | ) | | | (6.30 | ) | | | (5.13 | ) | | | (4.44 | ) |
| | | | | | | | |
Net asset value, end of period | | | $99.55 | | | | $93.27 | | | | $107.00 | | | | $103.35 | | | | $94.42 | | | | $102.48 | |
| | | | | | | | |
Total return | | | 10.70 | % | | | (4.61 | )% | | | 12.59 | % | | | 16.55 | % | | | (2.88 | )% | | | 8.85 | % |
Ratios/supplemental data: | | | | | | | | | | | | | | | | | | | | | | | | |
Net assets, end of period (millions) | | | $15,241 | | | | $14,181 | | | | $16,387 | | | | $15,382 | | | | $14,269 | | | | $15,465 | |
Ratio of expenses to average net assets | | | 0.53 | %(a) | | | 0.53 | % | | | 0.53 | % | | | 0.53 | % | | | 0.53 | % | | | 0.53 | % |
Ratio of net investment income to average net assets | | | 2.75 | %(a) | | | 2.06 | % | | | 2.12 | % | | | 2.41 | % | | | 2.03 | % | | | 2.00 | % |
Portfolio turnover rate | | | 16 | % | | | 24 | % | | | 19 | % | | | 24 | % | | | 20 | % | | | 23 | % |
See accompanying Notes to Financial Statements
FUND HOLDINGS
The Fund provides a complete list of its holdings on a quarterly basis by filing the lists with the SEC on Form N-CSR (as of the end of the second and fourth quarters) and on Part F of Form N-PORT (as of the end of the first and third quarters). Shareholders may view the Fund’s Form N-CSR and Part F of Form N-PORT on the SEC’s website at sec.gov. A list of the Fund’s quarter-end holdings is also available at dodgeandcox.com on or about the 15th day following each quarter end and remains available on the website until the list is updated for the subsequent quarter.
PROXY VOTING
For a free copy of the Fund’s proxy voting policies and procedures, please call800-621-3979, visit the Fund’s website at dodgeandcox.com, or visit the SEC’s website at sec.gov. Information regarding how the Fund voted proxies relating to portfolio securities during the most recent 12-month period ending June 30 is also available at dodgeandcox.com or at sec.gov.
HOUSEHOLD MAILINGS
The Fund routinely mails shareholder reports and summary prospectuses to shareholders and, on occasion, proxy statements. In order to reduce the volume of mail, when possible, only one copy of these documents will be sent to shareholders who are part of the same family and share the same residential address.
If you have a direct account with the Funds and you do not want the mailing of shareholder reports and summary prospectuses combined with other members in your household, contact the Funds at800-621-3979. Your request will be implemented within 30 days.
DODGE & COX BALANCED FUND§PAGE 19
dodgeandcox.com
For Fund literature, transactions, and account information, please visit the Funds’ website.
or write or call:
DODGE & COX FUNDS
c/o DST Asset Manager Solutions, Inc.
P.O. Box 219502
Kansas City, Missouri 64121-9502
(800) 621-3979
INVESTMENT MANAGER
Dodge & Cox
555 California Street, 40th Floor
San Francisco, California 94104
(415) 981-1710
This report is submitted for the general information of the shareholders of the Fund. The report is not authorized for distribution to prospective investors in the Fund unless it is accompanied by a current prospectus.
This report reflects our views, opinions, and portfolio holdings as of June 30, 2019, the end of the reporting period. Any such views are subject to change at any time based upon market or other conditions and Dodge & Cox disclaims any responsibility to update such views. These views may not be relied on as investment advice and, because investment decisions for a Dodge & Cox Fund are based on numerous factors, may not be relied on as an indication of trading intent on behalf of any Dodge & Cox Fund.

DODGE & COX FUNDS®
Semi-Annual Report
June 30, 2019
Income Fund
ESTABLISHED 1989
TICKER: DODIX
Important Notice:
Beginning on January 1, 2021, we intend to discontinue mailing paper copies of the Fund’s shareholder reports as permitted by new regulations adopted by the Securities and Exchange Commission, unless you specifically request paper copies from Dodge & Cox Funds or from your financial intermediary, such as a broker-dealer or bank. The reports will remain available to you on the Dodge & Cox Funds website (dodgeandcox.com), and you will be notified by mail each time a report is posted and provided with a link to access the report.
If you have already elected to receive shareholder reports electronically, you will not be affected by this change and do not need to take any action. If you have not done so already, you may elect to receive shareholder reports and other communications electronically by enrolling in e-delivery on the Funds website, or, if you are invested through a financial intermediary, by updating your mailing preferences through the intermediary.
If you wish to continue receiving paper copies of all future shareholder reports, please contact us at (800) 621-3979. Reports will be provided to you free of charge. If you are invested through a financial intermediary, you may contact your financial intermediary to request to receive paper copies. Your election to receive reports in paper form will apply to all funds held with Dodge & Cox Funds or through your financial intermediary, as applicable.
6/19 IF SAR  Printed on recycled paper
TO OUR SHAREHOLDERS
The Dodge & Cox Income Fund had a total return of 6.6% for the six months ended June 30, 2019, compared to a total return of 6.1% for the Bloomberg Barclays U.S. Aggregate Bond Index (Bloomberg Barclays U.S. Agg).
MARKET COMMENTARY
During the first half of 2019, the U.S. investment-grade fixed income market posted a robust 6.1% return, fueled by the combination of falling long-term Treasury yields and strong performance from the Corporate bond sector.
The recent plunge in Treasury yields has been particularly remarkable. The yield on the10-year Treasury note, for example, has fallen by more than a full percentage point since November 2018, reflecting increased worries over trade tensions and slowing economic growth, as well as expectations that the Federal Reserve would cut interest rates in the second half of the year. As a result of recent interest rate movements, the Treasury yield curve is now “inverted” in the classic sense, with yields of3-month Treasury bills (2.09%) above those of10-year Treasuries (2.01%).
The ongoing U.S.-China trade war has reverberated throughout the global economy, exacerbating the slowdown in China and hurting growth in Europe, which was already suffering from the effects of the Brexit saga. Trade tensions escalated in the first half of the year as negotiations between the United States and China collapsed, and President Trump threatened to impose additional tariffs. However, at the end of June both governments agreed to resume trade talks. While the economic expansion in the United States is the longest on record, signs of deceleration have emerged as trade and manufacturing sectors have been relatively weak.
The Fed held its benchmark interest rate steady but made a substantial pivot in guidance regarding future monetary policy. In December 2018, Fed officials said they anticipated two federal funds rate increases in 2019 as part of their gradual reduction of monetary accommodation. However, policymakers quickly shifted gears starting in January, first adopting a “patient” stance, and later shifting to a more dovish outlook. In June, citing growing risks to the economy from escalating trade tensions as well as below-target inflation, Fed Chairman Jerome Powell strongly suggested the Fed would cut rates as early as July.
Despite concerns about slowing global growth, credit markets have been supported by generally healthy corporate earnings, a dovish tilt by many central banks, and investors continuing to reach for yield. The investment-grade Corporate sector returned 9.9%(a) in the first half of the year, outperforming comparable-duration(b) Treasuries by 3.9 percentage points. Meanwhile, Agency(c) MBS returned 4.2%, performing in line with comparable-duration Treasuries.
INVESTMENT STRATEGY
Fixed income markets are constantly in motion as economic forces and market dynamics evolve. In the first half of 2019, amidst the backdrop of a rather unique market environment in which both Treasury rates and credit yield premiums(d) declined, our team made numerous incremental shifts to portfolio positioning.
Even with these adjustments, the Fund’s overall positioning has remained stable. The Fund holds sizable positions in corporate
bonds (41%) and Agency MBS (37%) and smaller positions in asset-backed securities (7%), U.S. Treasuries (7%), government-related securities (5%), and net cash (2%).(e) While we adjusted the Fund’s interest rate positioning slightly, we maintained the Fund’s defensive duration position, reflecting our longer-term expectations for interest rates to rise more than is implied by current market valuations.
Defensive Duration and Economic Outlook: Mitigating the Risk of Rising Rates over Time
In light of the decline in Treasury yields and the yield curve inversion, our U.S. Fixed Income Investment Committee convened multiple times to discuss our economic outlook, ourtwo-year interest rate forecasts, and the Fund’s interest rate positioning. Given the economic backdrop, we lowered our estimates for interest rates. Our change was primarily due to the significant dovish pivot by the Fed, suggesting that easing would be warranted in face of inflation undershooting the target and higher uncertainties due to trade tensions and global economic weakness. We continue to believe that the United States will avoid a recession, but given a moderate worsening of the macroeconomic outlook and heightened trade tensions, we expect U.S. growth to fall to around or somewhat below potential.
Upon review of market expectations and our own forecasts, we slightly reduced the Fund’s exposure to intermediate-term rates in favor of shorter-term securities. In our view, the magnitude of the yield declines in the belly of the yield curve has resulted in a potentially significant mispricing—more so than other points along the yield curve. To balance out the decrease in duration from these trades, we closed out the Fund’s small remaining Treasury futures short position. The net result of these moves was the same relative duration positioning (74% of the Bloomberg Barclays U.S. Agg’s duration) and an absolute duration of 4.2 years.
The Fund’s defensive duration positioning is underpinned by two key factors. First, the futures market and yield curve are pricing in a substantially more dovish policy path than the Fed has recently communicated. We believe this gap will narrow over time. While the Fed’s“U-turn” is likely to lead to a rate cut or two in the short term, we believe these will eventually be reversed, and the long end of the curve will resume its upward move. Second, we attempt to balance interest rate risk and yield. With10-year Treasuries yielding close to 2%, we believe investors are not well compensated for taking on more duration. Given the low level of available yields, even a small rate move can present a risk to absolute returns.
The Credit Sector: Continuing to Find Opportunities
We added a number of new credit investments to the Fund during the first half of the year at attractive valuations. Purchases were diversified by sector, geography, and seniority, but were focused on large, established enterprises with strong capital positions and liquidity. Examples of these purchases include Anheuser-Busch InBev, HCA, UniCredit, and Vodafone hybrids.(f)
One purchase we would like to highlight is UniCredit, the largest Italy-domiciled bank by assets. While 50% of its revenue currently comes from Italy, UniCredit has a substantial presence in
PAGE 2§ DODGE & COX INCOME FUND
Germany, Austria, and parts of Eastern Europe. We have held UniCredit equity in the Dodge & Cox International Stock Fund for more than 10 years, and over that period we developed deep knowledge of the bank’s strategy, operations, and financial position. Earlier this year as prices for Italian risk assets declined, we initiated a position in the company’s15-year subordinated debt at new issue.
UniCredit is predominantly a retail and commercial bank, and the company has undergone a deep restructuring since Jean Pierre Mustier took over as CEO in 2016. Since the global financial crisis the bank’s profitability has substantially improved, and management has sought to increase the safety and soundness of the bank by reducing its credit risk, increasing its liquidity buffers, and proactively addressing future regulatory capital requirements. Certain risks remain, including the weak macro environment in Italy, an Italian government that has periodically clashed with the European Union, and potentially more stringent regulatory requirements for European banks on the horizon. Nonetheless, on balance we see an attractive investment based on the company’s fundamentals, the low likelihood of sovereign distress in Italy, and the compelling valuation of its bonds.
While credit valuations are higher now, we remain constructive on the Fund’s credit holdings, particularly relative tolow-yielding Treasuries. We believe that corporate revenue growth remains healthy, and that margins and cash flow are strong. The banking sector remains well-capitalized, well-funded, and highly regulated. The risk of increased corporate leverage is mitigated by high interest coverage and a reduced U.S. tax burden, which boosts cash flow. We continue to focus on investing in strong credits at attractive prices, illustrated by the positions acquired in the first half of the year. As always, our valuation discipline and deep fundamental research continue to drivebottom-up credit decisions.
As part of our “macro” assessment of longer-term U.S. economic trends, we are closely reviewing opportunities in the market and holdings in the Fund that could be impacted by a slowing economy, as well as the potential implications for the credit risk of the Fund’s issuers. We evaluate creditworthiness independent of the rating agencies. As always, we are focused on individual issuers in conducting such an evaluation, as the economic environment could result in divergent outcomes for different issuers. We emphasize downside risk analysis as part of the deepbottom-up research we conduct, focusing on financial performance (revenue and profitability impact, and any potential strategic response management may implement) in a cyclical downturn. Our risk assessment, which may include ratings implications, is continually compared to the compensation offered from owning the security. Depending on our assessment of this risk-reward tradeoff, we may elect to adjust positioning.
The Securitized Sector: Adding Liquidity and Incremental Yield at Attractive Valuations
The Fund’s holdings in the Securitized sector consist predominantly of Agency mortgage-backed securities (MBS), with a smaller weighting inAAA-rated asset-backed securities (ABS). These securities as a group can provide attractive total-return cash flows in the front to intermediate part of the yield curve and continue to play an important role in the overall portfolio given their generally high liquidity and high credit quality.
The Fund continues to feature a large position in Agency30-year 4.5% coupon mortgage pass-through securities, which underperformed the broad MBS market in the first half of the year. As mortgage rates have declined since late 2018, the incentive for borrowers to refinance has increased. The result is that larger amounts of cash have been returned to holders of MBS at a relatively unfavorable time because they must reinvest at lower rates. Newly issued, higher coupon MBS—including the Fund’s30-year 4.5% coupon securities—underperformed as they were more exposed to actual acceleration in, and market expectations regarding, prepayments. The flip side of the recent underperformance is that with fundamentals stable, our outlook for these securities is even more optimistic. In addition to individually-selected Agency MBS pass-throughs, the Fund holds GinnieMae-guaranteed Home Equity Conversion Mortgages (also known as Reverse Mortgages). These floating rate securities offer attractive spreads and low prepayment risk.
Within ABS, we sold securities backed by credit card debt and auto loans because we concluded they no longer presented a compelling risk-reward dynamic primarily driven by their high relative valuations, and we reinvested the proceeds in MBS. The Fund continues to hold floating rate ABS backed by 97% federally guaranteed student loans. These short-duration securities trade at attractive levels relative to ABS and MBS alternatives, and their floating rate coupon adds a defensive duration element to the portfolio.
IN CLOSING
We are pleased with the Fund’s absolute and relative returns year to date. However, given lower initial yields, we encourage shareholders to temper near-term total return expectations for bonds. Nonetheless, we are optimistic about the long-term prospects for the Fund. Bonds serve a vital defensive role in a diversified portfolio by offering opportunities for liquidity, income generation, capital protection, and low correlations with riskier asset classes. We continue to position the Fund defensively from a capital preservation standpoint, while seeking opportunities to enhance the Fund’s yield through ourbottom-up, research-driven investment approach.
Thank you for your continued confidence in Dodge & Cox. As always, we welcome your comments and questions.
For the Board of Trustees,
| | |
 | |  |
Charles F. Pohl, Chairman | | Dana M. Emery, President |
July 31, 2019
| (a) | | Sector returns as calculated and reported by Bloomberg. |
| (b) | | Duration is a measure of a bond’s (or a bond portfolio’s) price sensitivity to changes in interest rates. |
| (c) | | The U.S. Government does not guarantee the Fund’s shares, yield, or net asset value. The agency guarantee (by, for example, Ginnie Mae, Fannie Mae, or Freddie Mac) does not eliminate market risk. |
| (d) | | Yield premiums are one way to measure a security’s valuation. Narrowing yield premiums result in a higher valuation. Widening yield premiums result in a lower valuation. |
| (e) | | Unless otherwise specified, all weightings and characteristics are as of June 30, 2019. |
| (f) | | The use of specific examples does not imply that they are more or less attractive investments than the Fund’s other holdings. |
DODGE & COX INCOME FUND§PAGE 3
YEAR-TO-DATE PERFORMANCE REVIEW
The Fund outperformed the Bloomberg Barclays U.S. Agg by 0.5 percentage points year to date.
Key Contributors to Relative Results
| | § | | Security selection within credit was positive as several issuers performed well, including Citigroup capital securities, Cemex, Enel, Petrobras, and Rio Oil Finance Trust. | |
| | § | | The Fund’s overweight to corporate bonds and underweight to U.S. Treasuries added to relative returns given the outperformance of credit. | |
| | § | | Despite the overall decline in rates, the Fund’s lower exposure to long-term (10+ years) bonds added to relative returns as the long end of the yield curve declined less than the curve on average. | |
Key Detractors from Relative Results
| | § | | The Fund’s below benchmark duration position (74%* of the Bloomberg Barclays U.S. Agg’s duration) hampered relative returns as Treasury yields plunged. | |
| | § | | The Fund’s Agency MBS holdings underperformed the MBS in the Bloomberg Barclays U.S. Agg after adjusting for duration differences. | |
| | * | | Denotes Fund positioning at the beginning of the period. | |
KEY CHARACTERISTICS OF DODGE & COX
Independent Organization
Dodge & Cox is one of the largest privately owned investment managers in the world. We remain committed to independence, with a goal of providing the highest quality investment management service to our existing clients.
Over 85 Years of Investment Experience
Dodge & Cox was founded in 1930. We have a stable and well-qualified team of investment professionals, most of whom have spent their entire careers at Dodge & Cox.
Experienced Investment Team
The U.S. Fixed Income Investment Committee, which is the decision-making body for the Income Fund, is a nine-member committee with an average tenure at Dodge & Cox of 20 years.
One Business with a Single Research Office
Dodge & Cox manages equity (domestic, international, and global), fixed income (domestic and global), and balanced investments, operating from one office in San Francisco.
Consistent Investment Approach
Our team decision-making process involves thorough, bottom-up fundamental analysis of each investment.
Long-Term Focus and Low Expenses
We invest with a three- to five-year investment horizon, which has historically resulted in low turnover relative to our peers. We manage Funds that maintain low expense ratios.
Risks: The Fund invests in individual bonds whose yields and market values fluctuate, so that an investment may be worth more or less than its original cost. Debt securities are subject to interest rate risk, credit risk, and prepayment and call risk, all of which could have adverse effects on the value of the Fund. A low interest rate environment creates an elevated risk of future negative returns. Financial intermediaries may restrict their market making activities for certain debt securities, which may reduce the liquidity and increase the volatility of such securities. Please read the prospectus and summary prospectus for specific details regarding the Fund’s risk profile.
PAGE 4§ DODGE & COX INCOME FUND
GROWTH OF $10,000 OVER 10 YEARS
FOR AN INVESTMENT MADE ON JUNE 30, 2009

AVERAGE ANNUAL TOTAL RETURN
FOR PERIODS ENDED JUNE 30, 2019
| | | | | | | | | | | | | | | | |
| | | 1 Year | | | 5 Years | | | 10 Years | | | 20 Years | |
Dodge & Cox Income Fund | | | 7.58 | % | | | 3.27 | % | | | 4.90 | % | | | 5.48 | % |
Bloomberg Barclays U.S. Aggregate Bond Index (Bloomberg Barclays U.S. Agg) | | | 7.87 | | | | 2.95 | | | | 3.90 | | | | 4.93 | |
Returns represent past performance and do not guarantee future results. Investment return and share price will fluctuate with market conditions, and investors may have a gain or loss when shares are sold. Fund performance changes over time and currently may be significantly lower than stated. Performance is updated and published monthly. Visit the Fund’s website at dodgeandcox.com or call800-621-3979 for current performance figures.
The Fund’s total returns include the reinvestment of dividend and capital gain distributions, but have not been adjusted for any income taxes payable by shareholders on these distributions or on Fund share redemptions. Index returns include interest income but, unlike Fund returns, do not reflect fees or expenses. The Bloomberg Barclays U.S. Aggregate Bond Index (Bloomberg Barclays U.S. Agg) is a widely recognized, unmanaged index of U.S. dollar-denominated, investment-grade, taxable debt securities.
Bloomberg is a registered trademark of Bloomberg Finance L.P. and its affiliates. Barclays® is a trademark of Barclays Bank PLC.
FUND EXPENSE EXAMPLE
As a Fund shareholder, you incur ongoing Fund costs, including management fees and other Fund expenses. All mutual funds have ongoing costs, sometimes referred to as operating expenses. The following example shows ongoing costs of investing in the Fund and can help you understand these costs and compare them with those of other mutual funds. The example assumes a $1,000 investment held for the six months indicated.
ACTUAL EXPENSES
The first line of the table below provides information about actual account values and expenses based on the Fund’s actual returns. You may use the information in this line, together with your account balance, to estimate the expenses that you paid over the period. Simply divide your account value by $1,000 (for example, an $8,600 account value divided by $1,000 = 8.6), then multiply the result by the number in the first line under the heading “Expenses Paid During Period” to estimate the expenses you paid on your account during this period.
HYPOTHETICAL EXAMPLE FOR COMPARISON WITH OTHER MUTUAL FUNDS
Information on the second line of the table can help you compare ongoing costs of investing in the Fund with those of other mutual funds. This information may not be used to estimate the actual ending account balance or expenses you paid during the period. The hypothetical “Ending Account Value” is based on the actual expense ratio of the Fund and an assumed 5% annual rate of return before expenses (not the Fund’s actual return). The amount under the heading “Expenses Paid During Period” shows the hypothetical expenses your account would have incurred under this scenario. You can compare this figure with the 5% hypothetical examples that appear in shareholder reports of other mutual funds.
| | | | | | | | | | | | |
Six Months Ended June 30, 2019 | | Beginning Account Value
1/1/2019 | | | Ending Account Value
6/30/2019 | | | Expenses Paid
During Period* | |
Based on Actual Fund Return | | $ | 1,000.00 | | | $ | 1,065.90 | | | $ | 2.17 | |
Based on Hypothetical 5% Yearly Return | | | 1,000.00 | | | | 1,022.70 | | | | 2.12 | |
| * | | Expenses are equal to the Fund’s annualized expense ratio of 0.42%, multiplied by the average account value over the period, multiplied by 181/365 (to reflect theone-half year period). |
The expenses shown in the table highlight ongoing costs only and do not reflect any transactional fees or account maintenance fees. Though other mutual funds may charge such fees, please note that the Fund does not charge transaction fees (e.g., redemption fees, sales loads) or universal account maintenance fees (e.g., small account fees).
DODGE & COX INCOME FUND§PAGE 5
| | | | |
| FUND INFORMATION (unaudited) | | | June 30, 2019 | |
| | | | |
| GENERAL INFORMATION | | | |
Net Asset Value Per Share | | | $13.91 | |
Total Net Assets (billions) | | | $59.6 | |
Expense Ratio | | | 0.42% | |
Portfolio Turnover Rate (1/1/19 to 6/30/19, unannualized) | | | 16% | |
30-Day SEC Yield(a) | | | 3.08% | |
Number of Credit Issuers | | | 59 | |
Fund Inception | | | 1989 | |
No sales charges or distribution fees | | | | |
Investment Manager: Dodge & Cox, San Francisco. Managed by the U.S. Fixed Income Investment Committee, whose nine members’ average tenure at Dodge & Cox is 20 years.
| | | | | | | | |
| PORTFOLIO CHARACTERISTICS | | Fund | | | BBG Barclays
U.S. Agg | |
Effective Duration (years) | | | 4.2 | | | | 5.7 | |
| | | | |
| FIVE LARGEST CREDIT ISSUERS (%)(b) | | Fund | |
Charter Communications, Inc. | | | 2.3 | |
Wells Fargo & Co. | | | 1.9 | |
HSBC Holdings PLC | | | 1.8 | |
Petroleos Mexicanos | | | 1.8 | |
Verizon Communications, Inc. | | | 1.7 | |
| | | | | | | | |
| CREDIT QUALITY (%)(c) | | Fund | | | BBG Barclays
U.S. Agg | |
U.S. Treasury/Agency/GSE | | | 44.5 | | | | 68.8 | |
AAA | | | 2.8 | | | | 3.8 | |
AA | | | 5.9 | | | | 3.0 | |
A | | | 6.8 | | | | 10.7 | |
BBB | | | 32.3 | | | | 13.7 | |
BB | | | 6.0 | | | | 0.0 | |
B | | | 0.0 | | | | 0.0 | |
CCC | | | 0.0 | (f) | | | 0.0 | |
Net Cash & Other(e) | | | 1.7 | | | | 0.0 | |
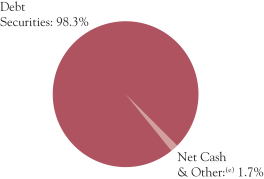
| | | | | | | | |
| SECTOR DIVERSIFICATION (%) | | Fund | | | BBG Barclays
U.S. Agg | |
U.S. Treasury | | | 7.1 | | | | 39.5 | |
Government-Related(d) | | | 5.5 | | | | 5.8 | |
Securitized | | | 44.3 | | | | 29.7 | |
Corporate | | | 41.5 | | | | 25.0 | |
Net Cash & Other(e) | | | 1.7 | | | | 0.0 | |
| | | | | | | | |
| MATURITY DIVERSIFICATION (%) | | Fund | | | BBG Barclays
U.S. Agg | |
0-1 Years to Maturity | | | 5.4 | | | | 0.0 | |
1-5 | | | 42.4 | | | | 48.4 | |
5-10 | | | 34.2 | | | | 34.5 | |
10-15 | | | 2.6 | | | | 1.3 | |
15-20 | | | 6.1 | | | | 2.7 | |
20-25 | | | 2.1 | | | | 4.9 | |
25 and Over | | | 7.3 | | | | 8.3 | |
| (a) | SEC Yield is an annualization of the Fund’s net investment income for the trailing 30-day period. Dividends paid by the Fund may be higher or lower than implied by the SEC Yield. |
| (b) | The Fund’s portfolio holdings are subject to change without notice. The mention of specific securities is not a recommendation to buy, sell, or hold any particular security and is not indicative of Dodge & Cox’s current or future trading activity. |
| (c) | The credit quality distributions shown for the Fund and the Index are based on the middle of Moody’s, S&P, and Fitch ratings, which is the methodology used by Bloomberg in constructing its indices. If a security is rated by only two agencies, the lower of the two ratings is used. Please note the Fund applies the highest of Moody’s, S&P, and Fitch ratings to determine compliance with the quality requirements stated in its prospectus. On that basis, the Fund held 4.8% in securities rated below investment grade. The credit quality of the investments in the portfolio does not apply to the stability or safety of the Fund or its shares. |
| (d) | The portfolio’s Government-Related holdings include tax-exempt municipal securities; the Index classifies these securities as Municipal Bonds. |
| (e) | Net Cash & Other includes cash, short-term investments, derivatives, receivables, and payables. |
PAGE 6§ DODGE & COX INCOME FUND
| | | | |
| PORTFOLIO OF INVESTMENTS (unaudited) | | | June 30, 2019 | |
| | | | | | | | |
| DEBT SECURITIES: 98.3% | | | | | | |
| | |
| | | PAR VALUE | | | VALUE | |
| U.S. TREASURY: 7.1% | | | | | | | | |
U.S. Treasury Note/Bond | | | | | | | | |
1.00%, 10/15/19 | | $ | 104,335,000 | | | $ | 104,000,802 | |
3.375%, 11/15/19 | | | 447,725,000 | | | | 449,736,266 | |
1.75%, 11/30/19 | | | 609,220,000 | | | | 608,244,298 | |
2.25%, 3/31/20 | | | 300,000,000 | | | | 300,492,186 | |
1.50%, 5/15/20 | | | 177,740,000 | | | | 176,948,502 | |
2.50%, 6/30/20 | | | 266,575,000 | | | | 267,928,700 | |
2.625%, 7/15/21 | | | 375,000,000 | | | | 381,386,719 | |
3.00%, 10/31/25 | | | 561,940,000 | | | | 600,331,915 | |
2.50%, 2/28/26 | | | 700,000,000 | | | | 727,644,533 | |
2.375%, 4/30/26 | | | 600,000,000 | | | | 619,265,628 | |
| | | | | | | | |
| | | | | | | 4,235,979,549 | |
| GOVERNMENT-RELATED: 5.4% | | | | | |
FOREIGN AGENCY: 2.4% | | | | | | | | |
Petroleo Brasileiro SA (Brazil) | | | | | |
5.999%, 1/27/28 | | | 329,050,000 | | | | 349,780,150 | |
7.25%, 3/17/44 | | | 10,705,000 | | | | 11,973,650 | |
6.90%, 3/19/49 | | | 12,355,000 | | | | 13,158,075 | |
Petroleos Mexicanos (Mexico) | | | | | | | | |
4.875%, 1/18/24 | | | 123,065,000 | | | | 120,726,765 | |
6.875%, 8/4/26 | | | 120,490,000 | | | | 121,755,145 | |
6.50%, 3/13/27 | | | 227,365,000 | | | | 224,227,363 | |
6.625%, 6/15/35 | | | 112,290,000 | | | | 103,727,887 | |
6.375%, 1/23/45 | | | 166,156,000 | | | | 142,894,160 | |
6.75%, 9/21/47 | | | 191,366,000 | | | | 170,411,423 | |
6.35%, 2/12/48 | | | 192,270,000 | | | | 165,063,795 | |
| | | | | | | | |
| | | | | | | 1,423,718,413 | |
LOCAL AUTHORITY: 3.0% | | | | | | | | |
L.A. Unified School District GO | | | | | | | | |
5.75%, 7/1/34 | | | 6,075,000 | | | | 7,755,163 | |
6.758%, 7/1/34 | | | 185,585,000 | | | | 254,479,720 | |
New Jersey Turnpike Authority RB | | | | | | | | |
7.414%, 1/1/40 | | | 41,065,000 | | | | 63,525,502 | |
7.102%, 1/1/41 | | | 148,277,000 | | | | 223,173,195 | |
New Valley Generation
4.929%, 1/15/21 | | | 146,348 | | | | 151,134 | |
State of California GO
7.50%, 4/1/34 | | | 190,026,000 | | | | 286,825,244 | |
7.55%, 4/1/39 | | | 106,975,000 | | | | 169,354,262 | |
7.30%, 10/1/39 | | | 208,455,000 | | | | 313,339,133 | |
7.625%, 3/1/40 | | | 119,575,000 | | | | 188,682,175 | |
State of Illinois GO
5.10%, 6/1/33 | | | 306,400,000 | | | | 322,663,712 | |
| | | | | | | | |
| | | | | | | 1,829,949,240 | |
| | | | | | | | |
| | | | | | | 3,253,667,653 | |
| SECURITIZED: 44.3% | |
ASSET-BACKED: 6.9% | |
Federal Agency: 0.1% | |
Small Business Admin. — 504 Program | |
Series1999-20G 1, 7.00%, 7/1/19 | | | 19,101 | | | | 19,104 | |
Series1999-20I 1, 7.30%, 9/1/19 | | | 9,755 | | | | 9,787 | |
Series2000-20C 1, 7.625%, 3/1/20 | | | 952 | | | | 962 | |
Series2000-20G 1, 7.39%, 7/1/20 | | | 916 | | | | 925 | |
Series2001-20G 1, 6.625%, 7/1/21 | | | 257,632 | | | | 263,023 | |
Series2001-20L 1, 5.78%, 12/1/21 | | | 642,048 | | | | 659,435 | |
Series2002-20A 1, 6.14%, 1/1/22 | | | 5,595 | | | | 5,746 | |
Series2002-20L 1, 5.10%, 12/1/22 | | | 184,351 | | | | 190,554 | |
Series2003-20G 1, 4.35%, 7/1/23 | | | 17,051 | | | | 17,629 | |
Series2004-20L 1, 4.87%, 12/1/24 | | | 441,157 | | | | 462,619 | |
Series2005-20B 1, 4.625%, 2/1/25 | | | 870,926 | | | | 908,311 | |
Series2005-20D 1, 5.11%, 4/1/25 | | | 28,688 | | | | 30,134 | |
Series2005-20E 1, 4.84%, 5/1/25 | | | 1,221,004 | | | | 1,279,087 | |
Series2005-20G 1, 4.75%, 7/1/25 | | | 1,450,551 | | | | 1,516,162 | |
Series2005-20H 1, 5.11%, 8/1/25 | | | 16,638 | | | | 17,479 | |
Series2005-20I 1, 4.76%, 9/1/25 | | | 1,775,506 | | | | 1,860,387 | |
| | | | | | | | |
| | |
| | | PAR VALUE | | | VALUE | |
Series2006-20A 1, 5.21%, 1/1/26 | | $ | 1,568,714 | | | $ | 1,653,474 | |
Series2006-20B 1, 5.35%, 2/1/26 | | | 534,553 | | | | 567,009 | |
Series2006-20C 1, 5.57%, 3/1/26 | | | 2,157,404 | | | | 2,297,070 | |
Series2006-20G 1, 6.07%, 7/1/26 | | | 3,993,258 | | | | 4,260,607 | |
Series2006-20H 1, 5.70%, 8/1/26 | | | 31,745 | | | | 33,844 | |
Series2006-20I 1, 5.54%, 9/1/26 | | | 56,216 | | | | 59,974 | |
Series2006-20J 1, 5.37%, 10/1/26 | | | 1,517,937 | | | | 1,614,234 | |
Series2006-20L 1, 5.12%, 12/1/26 | | | 1,422,369 | | | | 1,505,762 | |
Series2007-20A 1, 5.32%, 1/1/27 | | | 2,921,992 | | | | 3,092,165 | |
Series2007-20C 1, 5.23%, 3/1/27 | | | 4,497,833 | | | | 4,786,240 | |
Series2007-20D 1, 5.32%, 4/1/27 | | | 4,665,523 | | | | 4,941,374 | |
Series2007-20G 1, 5.82%, 7/1/27 | | | 2,922,496 | | | | 3,122,624 | |
| | | | | | | | |
| | | | | | | 35,175,721 | |
|
Other: 1.3% | |
Rio Oil Finance Trust (Brazil) | | | | | | | | |
9.25%, 7/6/24(b) | | | 389,984,651 | | | | 434,345,405 | |
9.75%, 1/6/27(b) | | | 231,229,854 | | | | 265,338,570 | |
8.20%, 4/6/28(b) | | | 66,400,000 | | | | 74,534,664 | |
| | | | | | | | |
| | | | | | | 774,218,639 | |
Student Loan: 5.5% | |
Navient Student Loan Trust
USD LIBOR1-Month | |
+1.25%, 3.654%, 6/25/65(b) | | | 247,760,006 | | | | 250,536,802 | |
+1.15%, 3.554%, 3/25/66(b) | | | 109,313,712 | | | | 109,724,666 | |
+1.30%, 3.704%, 3/25/66(b) | | | 152,006,000 | | | | 154,909,679 | |
+0.80%, 3.204%, 7/26/66(b) | | | 319,017,558 | | | | 316,738,816 | |
+1.05%, 3.454%, 7/26/66(b) | | | 323,668,000 | | | | 324,022,708 | |
+1.15%, 3.554%, 7/26/66(b) | | | 234,752,000 | | | | 237,167,340 | |
+1.00%, 3.404%, 9/27/66(b) | | | 114,564,000 | | | | 114,528,497 | |
+1.05%, 3.454%, 12/27/66(b) | | | 201,704,026 | | | | 202,740,280 | |
+0.72%, 3.124%, 3/25/67(b) | | | 97,760,000 | | | | 97,456,250 | |
+0.80%, 3.204%, 3/25/67(b) | | | 183,798,000 | | | | 182,537,054 | |
+0.68%, 3.084%, 6/27/67(b) | | | 225,000,000 | | | | 223,106,783 | |
+1.00%, 3.404%, 2/27/68(b) | | | 60,078,000 | | | | 60,166,831 | |
+0.70%, 3.104%, 2/25/70(b) | | | 266,595,898 | | | | 266,260,040 | |
Navient Student Loan Trust (Private Loans) | | | | | | | | |
Series2014-AA A2A, 2.74%, 2/15/29(b) | | | 16,953,564 | | | | 17,107,296 | |
Series2017-A A2A, 2.88%, 12/16/58(b) | | | 31,000,000 | | | | 31,361,057 | |
SLM Student Loan Trust
USD LIBOR1-Month | |
+1.20%, 3.604%, 10/25/34 | | | 27,721,000 | | | | 28,128,374 | |
+1.10%, 3.504%, 8/27/40 | | | 27,767,475 | | | | 28,096,186 | |
USD LIBOR3-Month | | | | | | | | |
+0.63%, 3.21%, 1/25/40(b) | | | 142,597,151 | | | | 141,081,286 | |
+0.17%, 2.75%, 7/25/40 | | | 13,626,000 | | | | 12,858,405 | |
+0.75%, 3.33%, 10/25/40 | | | 80,889,000 | | | | 80,236,646 | |
+0.60%, 3.18%, 1/25/41 | | | 128,757,433 | | | | 126,722,628 | |
+0.55%, 3.13%, 10/25/64(b) | | | 32,458,000 | | | | 31,993,133 | |
+0.55%, 3.13%, 10/25/64(b) | | | 72,950,000 | | | | 71,681,130 | |
SLM Student Loan Trust (Private Loans)
Series2013-C A2A, 2.94%, 10/15/31(b) | | | 2,743,759 | | | | 2,743,806 | |
SMB Private Education Loan Trust (Private Loans) | | | | | | | | |
Series2017-A A2A, 2.88%, 9/15/34(b) | | | 23,645,352 | | | | 23,920,446 | |
Series2017-B A2A, 2.82%, 10/15/35(b) | | | 26,946,000 | | | | 27,178,102 | |
Series2018-A A2A, 3.50%, 2/15/36(b) | | | 50,000,000 | | | | 51,834,510 | |
Series2018-B A2A, 3.60%, 1/15/37(b) | | | 68,386,000 | | | | 71,716,767 | |
| | | | | | | | |
| | | | | | | 3,286,555,518 | |
| | | | | | | | |
| | | | | | | 4,095,949,878 | |
CMBS: 0.4% | |
Agency CMBS: 0.4% | |
Fannie Mae Multifamily DUS | |
Pool AL6028, 2.70%, 7/1/21 | | | 2,206,475 | | | | 2,239,469 | |
Pool AL6455, 2.765%, 11/1/21 | | | 9,074,073 | | | | 9,057,697 | |
Pool AL6445, 2.50%, 1/1/22 | | | 5,830,285 | | | | 5,890,640 | |
| | |
| See accompanying Notes to Financial Statements | | DODGE & COX INCOME FUND§PAGE 7 |
| | | | |
| PORTFOLIO OF INVESTMENTS (unaudited) | | | June 30, 2019 | |
| | | | | | | | |
| DEBT SECURITIES (continued) | | | | | | |
| | |
| | | PAR VALUE | | | VALUE | |
Freddie Mac Multifamily Interest Only | |
Series K055 X1, 1.499%, 3/25/26(e) | | $ | 118,752,667 | | | $ | 9,195,292 | |
Series K056 X1, 1.399%, 5/25/26(e) | | | 41,143,437 | | | | 3,003,372 | |
Series K057 X1, 1.325%, 7/25/26(e) | | | 246,337,594 | | | | 16,931,596 | |
Series K062 X1, 0.437%, 12/25/26(e) | | | 323,839,339 | | | | 6,976,503 | |
Series K064 X1, 0.743%, 3/25/27(e) | | | 413,004,697 | | | | 16,969,991 | |
Series K065 X1, 0.815%, 4/25/27(e) | | | 478,771,187 | | | | 22,170,457 | |
Series K066 X1, 0.89%, 6/25/27(e) | | | 381,242,016 | | | | 19,748,794 | |
Series K067 X1, 0.713%, 7/25/27(e) | | | 480,105,165 | | | | 20,005,502 | |
Series K069 X1, 0.496%, 9/25/27(e) | | | 101,083,043 | | | | 2,835,743 | |
Series K071 X1, 0.42%, 11/25/27(e) | | | 258,848,509 | | | | 5,761,165 | |
Series K070 X1, 0.457%, 11/25/27(e) | | | 201,483,592 | | | | 5,136,744 | |
Series K089 X1, 0.688%, 1/25/29(e) | | | 524,938,644 | | | | 24,374,739 | |
Series K091 X1, 0.704%, 3/25/29(e) | | | 263,675,331 | | | | 12,808,978 | |
Series K092 X1, 0.852%, 4/25/29(e) | | | 490,956,421 | | | | 29,762,515 | |
Series K093 X1, 0.952%, 5/25/29(e) | | | 235,100,000 | | | | 18,677,614 | |
Series K052 X1, 1.102%, 1/25/31(e) | | | 42,869,561 | | | | 3,547,563 | |
Series K154 X1, 0.449%, 11/25/32(e) | | | 394,254,479 | | | | 12,434,156 | |
Series K1511 X1, 0.93%, 3/25/34(e) | | | 177,965,564 | | | | 14,920,562 | |
| | | | | | | | |
| | | | | | | 262,449,092 | |
| | | | | | | | |
| | | | | | | 262,449,092 | |
MORTGAGE-RELATED: 37.0% | |
Federal Agency CMO & REMIC: 5.2% | |
Dept. of Veterans Affairs | |
Series1995-2D 4A, 9.293%, 5/15/25 | | | 62,132 | | | | 70,335 | |
Series1997-2 Z, 7.50%, 6/15/27 | | | 5,233,035 | | | | 5,851,394 | |
Series1998-2 2A, 8.667%, 8/15/27(e) | | | 14,084 | | | | 15,840 | |
Series1998-1 1A, 8.293%, 3/15/28(e) | | | 89,764 | | | | 98,477 | |
Fannie Mae | |
Trust1998-58 PX, 6.50%, 9/25/28 | | | 184,580 | | | | 204,218 | |
Trust1998-58 PC, 6.50%, 10/25/28 | | | 1,055,559 | | | | 1,170,773 | |
Trust2001-69 PQ, 6.00%, 12/25/31 | | | 1,277,743 | | | | 1,443,489 | |
Trust2002-33 A1, 7.00%, 6/25/32 | | | 1,609,867 | | | | 1,759,780 | |
Trust2002-69 Z, 5.50%, 10/25/32 | | | 169,809 | | | | 183,250 | |
Trust2008-24 GD, 6.50%, 3/25/37 | | | 614,561 | | | | 683,598 | |
Trust2007-47 PE, 5.00%, 5/25/37 | | | 2,157,717 | | | | 2,351,715 | |
Trust2009-53 QM, 5.50%, 5/25/39 | | | 608,583 | | | | 630,847 | |
Trust2009-30 AG, 6.50%, 5/25/39 | | | 5,788,216 | | | | 6,411,994 | |
Trust2009-40 TB, 6.00%, 6/25/39 | | | 2,300,662 | | | | 2,520,240 | |
Trust2010-123 WT, 7.00%, 11/25/40 | | | 24,820,703 | | | | 28,939,538 | |
Trust2001-T3 A1, 7.50%, 11/25/40 | | | 88,697 | | | | 99,845 | |
Trust2001-T7 A1, 7.50%, 2/25/41 | | | 51,405 | | | | 60,001 | |
Trust2001-T5 A2, 6.98%, 6/19/41(e) | | | 33,838 | | | | 38,284 | |
Trust2001-T5 A3, 7.50%, 6/19/41(e) | | | 171,212 | | | | 198,234 | |
Trust2011-58 AT, 4.00%, 7/25/41 | | | 6,629,149 | | | | 7,052,394 | |
Trust2001-T4 A1, 7.50%, 7/25/41 | | | 1,468,462 | | | | 1,716,957 | |
Trust2001-T10 A1, 7.00%, 12/25/41 | | | 1,554,734 | | | | 1,799,966 | |
Trust2013-106 MA, 4.00%, 2/25/42 | | | 15,657,746 | | | | 16,594,350 | |
Trust2002-90 A1, 6.50%, 6/25/42 | | | 3,572,880 | | | | 3,995,294 | |
Trust2002-W6 2A1, 7.00%, 6/25/42(e) | | | 1,944,780 | | | | 2,157,198 | |
Trust2002-W8 A2, 7.00%, 6/25/42 | | | 1,122,089 | | | | 1,312,104 | |
Trust2003-W2 1A2, 7.00%, 7/25/42 | | | 5,618,116 | | | | 6,539,013 | |
Trust2002-T16 A3, 7.50%, 7/25/42 | | | 2,722,485 | | | | 3,230,972 | |
Trust2003-W4 3A, 7.00%, 10/25/42(e) | | | 1,679,373 | | | | 1,877,253 | |
Trust2012-121 NB, 7.00%, 11/25/42 | | | 815,454 | | | | 942,726 | |
Trust2003-W1 2A, 5.865%, 12/25/42(e) | | | 2,124,108 | | | | 2,343,630 | |
Trust2003-7 A1, 6.50%, 12/25/42 | | | 2,837,238 | | | | 3,202,114 | |
Trust2004-T1 1A2, 6.50%, 1/25/44 | | | 1,322,337 | | | | 1,509,609 | |
Trust2004-W2 2A2, 7.00%, 2/25/44 | | | 72,572 | | | | 82,947 | |
Trust2004-W2 5A, 7.50%, 3/25/44 | | | 3,064,010 | | | | 3,481,299 | |
Trust2004-W8 3A, 7.50%, 6/25/44 | | | 2,376,059 | | | | 2,763,663 | |
Trust2004-W15 1A2, 6.50%, 8/25/44 | | | 581,244 | | | | 663,036 | |
Trust2005-W1 1A3, 7.00%, 10/25/44 | | | 4,799,066 | | | | 5,590,971 | |
Trust2001-79 BA, 7.00%, 3/25/45 | | | 521,093 | | | | 574,289 | |
Trust2006-W1 1A1, 6.50%, 12/25/45 | | | 280,774 | | | | 321,599 | |
Trust2006-W1 1A2, 7.00%, 12/25/45 | | | 2,070,159 | | | | 2,397,813 | |
| | | | | | | | |
| | |
| | | PAR VALUE | | | VALUE | |
Trust2006-W1 1A3, 7.50%, 12/25/45 | | $ | 35,295 | | | $ | 41,195 | |
Trust2006-W1 1A4, 8.00%, 12/25/45 | | | 2,405,329 | | | | 2,824,219 | |
Trust2007-W10 1A, 6.259%, 8/25/47(e) | | | 7,055,767 | | | | 7,838,112 | |
Trust2007-W10 2A, 6.315%, 8/25/47(e) | | | 2,197,498 | | | | 2,432,138 | |
USD LIBOR1-Month | | | | | | | | |
+0.55%, 2.954%, 9/25/43 | | | 29,375,776 | | | | 29,520,466 | |
+0.40%, 2.804%, 7/25/44 | | | 1,253,800 | | | | 1,240,877 | |
Freddie Mac | |
Series 3312 AB, 6.50%, 6/15/32 | | | 2,150,690 | | | | 2,447,717 | |
Series 2456 CJ, 6.50%, 6/15/32 | | | 121,735 | | | | 139,113 | |
SeriesT-41 2A, 5.361%, 7/25/32(e) | | | 201,572 | | | | 220,009 | |
Series 2587 ZU, 5.50%, 3/15/33 | | | 3,026,803 | | | | 3,327,794 | |
Series 2610 UA, 4.00%, 5/15/33 | | | 1,315,273 | | | | 1,381,252 | |
SeriesT-48 1A, 4.931%, 7/25/33(e) | | | 2,179,385 | | | | 2,356,221 | |
Series 2708 ZD, 5.50%, 11/15/33 | | | 11,815,231 | | | | 12,932,518 | |
Series 3204 ZM, 5.00%, 8/15/34 | | | 5,491,904 | | | | 6,066,211 | |
Series 3330 GZ, 5.50%, 6/15/37 | | | 650,402 | | | | 701,544 | |
Series 3427 Z, 5.00%, 3/15/38 | | | 2,414,895 | | | | 2,641,374 | |
SeriesT-51 1A, 6.50%, 9/25/43(e) | | | 49,603 | | | | 58,122 | |
Series 4283 DW, 4.50%, 12/15/43(e) | | | 66,090,319 | | | | 71,806,967 | |
Series 4283 EW, 4.50%, 12/15/43(e) | | | 39,269,412 | | | | 42,255,273 | |
Series 4281 BC, 4.50%, 12/15/43(e) | | | 109,665,041 | | | | 117,957,045 | |
Series 4319 MA, 4.50%, 3/15/44(e) | | | 21,608,833 | | | | 23,617,545 | |
USD LIBOR1-Month | | | | | | | | |
+0.53%, 2.924%, 8/15/43 | | | 53,725,201 | | | | 54,214,282 | |
Ginnie Mae
USD LIBOR1-Month | |
+0.65%, 3.117%, 10/20/64 | | | 7,632,500 | | | | 7,641,862 | |
+0.63%, 3.097%, 4/20/65 | | | 11,089,826 | | | | 11,095,106 | |
+0.60%, 3.067%, 7/20/65 | | | 7,859,809 | | | | 7,854,649 | |
+0.60%, 3.067%, 8/20/65 | | | 7,237,798 | | | | 7,232,921 | |
+0.62%, 3.087%, 9/20/65 | | | 1,637,539 | | | | 1,637,667 | |
+0.75%, 3.217%, 11/20/65 | | | 29,735,288 | | | | 29,884,494 | |
+0.90%, 3.367%, 3/20/66 | | | 19,213,095 | | | | 19,427,239 | |
+0.90%, 3.367%, 4/20/66 | | | 20,483,237 | | | | 20,711,851 | |
+0.78%, 3.247%, 9/20/66 | | | 11,363,317 | | | | 11,436,098 | |
+0.75%, 3.217%, 10/20/66 | | | 52,841,073 | | | | 53,128,702 | |
+0.80%, 3.267%, 11/20/66 | | | 22,964,675 | | | | 23,139,714 | |
+0.81%, 3.277%, 12/20/66 | | | 12,875,406 | | | | 12,981,339 | |
+0.57%, 3.037%, 9/20/67 | | | 30,017,256 | | | | 30,121,416 | |
USD LIBOR12-Month | | | | | | | | |
+0.30%, 3.128%, 9/20/66 | | | 19,187,931 | | | | 19,408,888 | |
+0.28%, 3.376%, 12/20/66 | | | 36,348,740 | | | | 36,827,020 | |
+0.30%, 3.42%, 1/20/67 | | | 94,304,175 | | | | 95,736,363 | |
+0.30%, 3.42%, 1/20/67 | | | 102,481,171 | | | | 104,030,143 | |
+0.31%, 3.43%, 1/20/67 | | | 38,520,028 | | | | 39,113,406 | |
+0.25%, 3.271%, 2/20/67 | | | 19,999,801 | | | | 20,279,152 | |
+0.20%, 3.221%, 3/20/67 | | | 3,302,872 | | | | 3,341,350 | |
+0.30%, 3.179%, 4/20/67 | | | 24,003,064 | | | | 24,384,759 | |
+0.20%, 2.93%, 5/20/67 | | | 46,812,868 | | | | 46,462,066 | |
+0.30%, 3.03%, 5/20/67 | | | 20,227,893 | | | | 20,176,657 | |
+0.20%, 2.937%, 6/20/67 | | | 101,443,190 | | | | 100,690,918 | |
+0.30%, 3.037%, 6/20/67 | | | 24,126,232 | | | | 24,077,104 | |
+0.20%, 2.972%, 8/20/67 | | | 22,466,326 | | | | 22,207,840 | |
+0.25%, 3.078%, 9/20/67 | | | 23,332,647 | | | | 23,143,611 | |
+0.27%, 3.098%, 9/20/67 | | | 71,846,686 | | | | 71,252,004 | |
+0.22%, 3.06%, 10/20/67 | | | 35,200,984 | | | | 34,891,211 | |
+0.23%, 3.07%, 10/20/67 | | | 160,603,600 | | | | 158,952,724 | |
+0.23%, 3.07%, 10/20/67 | | | 74,833,532 | | | | 74,102,858 | |
+0.25%, 3.09%, 10/20/67 | | | 49,198,514 | | | | 48,754,428 | |
+0.20%, 3.125%, 11/20/67 | | | 17,476,248 | | | | 17,307,413 | |
+0.22%, 3.145%, 11/20/67 | | | 23,785,905 | | | | 23,575,349 | |
+0.22%, 3.145%, 11/20/67 | | | 132,784,772 | | | | 131,445,292 | |
+0.06%, 3.062%, 12/20/67 | | | 56,782,874 | | | | 55,865,166 | |
+0.18%, 3.276%, 12/20/67 | | | 35,084,140 | | | | 34,695,144 | |
+0.06%, 3.062%, 1/20/68 | | | 103,796,218 | | | | 102,133,371 | |
| | |
| PAGE 8§ DODGE & COX INCOME FUND | | See accompanying Notes to Financial Statements |
| | | | |
| PORTFOLIO OF INVESTMENTS (unaudited) | | | June 30, 2019 | |
| | | | | | | | |
| DEBT SECURITIES (continued) | | | | | | |
| | |
| | | PAR VALUE | | | VALUE | |
+0.08%, 3.082%, 1/20/68 | | $ | 46,841,483 | | | $ | 46,242,076 | |
+0.15%, 3.27%, 1/20/68 | | | 16,381,078 | | | | 16,181,858 | |
+0.05%, 2.83%, 2/20/68 | | | 25,792,350 | | | | 25,404,565 | |
+0.04%, 3.061%, 2/20/68 | | | 54,168,127 | | | | 53,310,748 | |
+0.05%, 3.071%, 2/20/68 | | | 3,693,923 | | | | 3,638,434 | |
+0.07%, 3.091%, 2/20/68 | | | 49,306,236 | | | | 48,590,373 | |
+0.10%, 3.102%, 2/20/68 | | | 99,834,657 | | | | 98,056,183 | |
+0.10%, 3.102%, 2/20/68 | | | 49,610,663 | | | | 48,797,802 | |
+0.15%, 3.152%, 2/20/68 | | | 33,678,335 | | | | 33,251,903 | |
+0.03%, 2.909%, 3/20/68 | | | 18,150,876 | | | | 17,830,745 | |
+0.05%, 2.929%, 3/20/68 | | | 45,188,879 | | | | 44,558,341 | |
+0.04%, 3.061%, 3/20/68 | | | 87,395,960 | | | | 86,059,659 | |
+0.04%, 3.061%, 3/20/68 | | | 37,545,551 | | | | 36,771,913 | |
+0.06%, 3.081%, 3/20/68 | | | 14,680,691 | | | | 14,391,706 | |
+0.02%, 2.899%, 4/20/68 | | | 26,149,007 | | | | 25,556,727 | |
+0.05%, 2.929%, 4/20/68 | | | 48,347,863 | | | | 47,358,530 | |
+0.05%, 2.929%, 4/20/68 | | | 42,713,912 | | | | 41,838,841 | |
+0.04%, 2.77%, 5/20/68 | | | 48,834,462 | | | | 47,749,556 | |
+0.15%, 2.887%, 6/20/68 | | | 46,116,648 | | | | 45,423,630 | |
+0.25%, 3.00%, 7/20/68 | | | 41,211,603 | | | | 40,719,363 | |
+0.12%, 2.95%, 8/20/68 | | | 34,982,105 | | | | 34,432,144 | |
+0.10%, 3.02%, 10/20/68 | | | 64,415,542 | | | | 63,156,379 | |
+0.22%, 3.22%, 11/20/68 | | | 35,015,926 | | | | 34,514,176 | |
+0.30%, 3.45%, 11/20/68 | | | 36,762,006 | | | | 36,590,095 | |
+0.40%, 3.30%, 2/20/69 | | | 31,683,915 | | | | 31,718,270 | |
| | | | | | | | |
| | | | | | | 3,100,192,355 | |
Federal Agency Mortgage Pass-Through: 31.7% | |
Fannie Mae, 15 Year | | | | | | | | |
6.00%,8/1/19-3/1/23 | | | 11,562,975 | | | | 11,890,559 | |
5.50%, 12/1/19-7/1/25 | | | 51,803,660 | | | | 53,771,494 | |
6.50%, 12/1/19 | | | 13 | | | | 13 | |
4.00%, 9/1/25 | | | 682,488 | | | | 694,011 | |
5.00%, 9/1/25 | | | 22,444,225 | | | | 23,114,853 | |
3.50%, 10/1/25-2/1/31 | | | 635,007,325 | | | | 656,185,392 | |
4.50%, 3/1/29 | | | 15,787,473 | | | | 16,569,406 | |
Fannie Mae, 20 Year | | | | | | | | |
4.50%, 3/1/29-1/1/34 | | | 328,946,040 | | | | 348,601,634 | |
4.00%, 9/1/30-3/1/37 | | | 1,568,462,470 | | | | 1,648,616,416 | |
3.50%, 11/1/35-4/1/37 | | | 380,231,735 | | | | 391,320,294 | |
Fannie Mae, 30 Year | | | | | | | | |
6.00%, 11/1/28-2/1/39 | | | 84,307,757 | | | | 95,441,686 | |
7.00%, 4/1/32-2/1/39 | | | 7,354,527 | | | | 8,628,841 | |
6.50%, 12/1/32-8/1/39 | | | 34,167,654 | | | | 39,605,678 | |
5.50%, 2/1/33-11/1/39 | | | 126,383,480 | | | | 139,158,350 | |
4.50%, 11/1/35-3/1/49 | | | 6,780,254,089 | | | | 7,136,284,889 | |
5.00%, 7/1/37-3/1/49 | | | 194,347,719 | | | | 206,523,465 | |
4.00%, 10/1/40-2/1/47 | | | 529,093,035 | | | | 553,608,504 | |
3.00%, 3/1/47-5/1/48 | | | 425,529,624 | | | | 430,795,866 | |
Fannie Mae, 40 Year
4.50%, 1/1/52-6/1/56 | | | 143,785,388 | | | | 153,683,723 | |
Fannie Mae, Hybrid ARM(e)
1-Year U.S. Treasury CMT | | | | | | | | |
+2.14%, 4.503%, 10/1/33 | | | 1,038,048 | | | | 1,090,650 | |
+2.14%, 4.456%, 8/1/34 | | | 291,318 | | | | 305,987 | |
+1.96%, 4.297%, 9/1/34 | | | 1,286,449 | | | | 1,343,669 | |
+2.29%, 4.878%, 1/1/36 | | | 8,455,494 | | | | 8,906,227 | |
+2.12%, 4.496%, 7/1/36 | | | 61,175 | | | | 64,584 | |
+2.14%, 4.553%, 12/1/36 | | | 1,388,604 | | | | 1,460,226 | |
USD LIBOR12-Month | | | | | | | | |
+1.68%, 4.634%, 7/1/34 | | | 1,345,426 | | | | 1,408,820 | |
+1.37%, 4.238%, 10/1/34 | | | 626,940 | | | | 648,778 | |
+1.94%, 4.914%, 1/1/35 | | | 662,962 | | | | 703,027 | |
+1.37%, 4.361%, 4/1/35 | | | 1,458,051 | | | | 1,513,338 | |
+1.75%, 4.625%, 6/1/35 | | | 397,550 | | | | 417,783 | |
+1.45%, 4.242%, 7/1/35 | | | 337,475 | | | | 351,158 | |
+1.50%, 4.25%, 7/1/35 | | | 464,677 | | | | 482,906 | |
| | | | | | | | |
| | |
| | | PAR VALUE | | | VALUE | |
+1.52%, 4.342%, 7/1/35 | | $ | 916,732 | | | $ | 957,218 | |
+1.75%, 4.547%, 7/1/35 | | | 1,050,361 | | | | 1,106,380 | |
+1.31%, 4.063%, 8/1/35 | | | 650,757 | | | | 669,257 | |
+1.38%, 4.134%, 8/1/35 | | | 2,503,642 | | | | 2,622,848 | |
+1.75%, 4.538%, 8/1/35 | | | 1,391,643 | | | | 1,456,479 | |
+1.77%, 4.517%, 9/1/35 | | | 1,135,821 | | | | 1,190,131 | |
+1.57%, 4.378%, 10/1/35 | | | 1,295,926 | | | | 1,342,700 | |
+1.75%, 4.498%, 10/1/35 | | | 813,467 | | | | 849,615 | |
+1.62%, 4.543%, 12/1/35 | | | 385,078 | | | | 400,955 | |
+1.62%, 4.515%, 1/1/36 | | | 1,581,823 | | | | 1,654,824 | |
+1.70%, 4.576%, 1/1/36 | | | 2,519,087 | | | | 2,641,663 | |
+1.75%, 4.635%, 11/1/36 | | | 972,632 | | | | 1,023,461 | |
+1.74%, 4.618%, 12/1/36 | | | 767,564 | | | | 806,455 | |
+1.59%, 4.614%, 1/1/37 | | | 942,145 | | | | 987,732 | |
+2.01%, 5.013%, 2/1/37 | | | 1,935,648 | | | | 2,041,138 | |
+1.93%, 4.803%, 4/1/37 | | | 339,754 | | | | 362,491 | |
+1.19%, 4.065%, 8/1/37 | | | 106,193 | | | | 106,071 | |
+1.74%, 4.551%, 8/1/37 | | | 1,107,730 | | | | 1,164,592 | |
+1.48%, 4.431%, 11/1/37 | | | 458,711 | | | | 476,694 | |
+1.73%, 4.613%, 5/1/38 | | | 82,518,098 | | | | 86,532,148 | |
+1.93%, 4.802%, 5/1/38 | | | 1,504,124 | | | | 1,596,521 | |
+1.88%, 4.634%, 9/1/38 | | | 249,301 | | | | 261,797 | |
+1.60%, 4.431%, 10/1/38 | | | 3,581,922 | | | | 3,746,377 | |
+1.70%, 4.507%, 10/1/38 | | | 1,292,647 | | | | 1,348,795 | |
+1.71%, 4.613%, 10/1/38 | | | 655,929 | | | | 688,371 | |
+1.71%, 4.638%, 6/1/39 | | | 411,400 | | | | 433,102 | |
+1.77%, 4.216%, 12/1/39 | | | 1,313,688 | | | | 1,359,074 | |
+1.71%, 4.608%, 4/1/42 | | | 4,744,844 | | | | 4,930,637 | |
+1.67%, 2.36%, 9/1/42 | | | 4,870,993 | | | | 5,022,054 | |
+1.68%, 2.474%, 11/1/42 | | | 4,625,005 | | | | 4,782,924 | |
+1.57%, 2.276%, 12/1/42 | | | 12,652,910 | | | | 12,711,734 | |
+1.57%, 2.821%, 2/1/43 | | | 9,965,356 | | | | 10,245,798 | |
+1.82%, 4.617%, 2/1/43 | | | 1,786,230 | | | | 1,868,731 | |
+1.56%, 2.302%, 5/1/43 | | | 2,685,243 | | | | 2,699,617 | |
+1.47%, 4.296%, 6/1/43 | | | 1,443,511 | | | | 1,489,343 | |
+1.56%, 3.029%, 9/1/43 | | | 3,691,116 | | | | 3,771,999 | |
+1.56%, 3.26%, 9/1/43 | | | 2,288,042 | | | | 2,347,757 | |
+1.45%, 4.24%, 9/1/43 | | | 2,259,355 | | | | 2,318,109 | |
+1.61%, 2.362%, 10/1/43 | | | 26,021,598 | | | | 26,601,406 | |
+1.55%, 2.658%, 11/1/43 | | | 9,454,056 | | | | 9,626,770 | |
+1.60%, 2.877%, 11/1/43 | | | 12,097,821 | | | | 12,311,517 | |
+1.56%, 3.085%, 12/1/43 | | | 4,528,162 | | | | 4,619,761 | |
+1.59%, 2.696%, 2/1/44 | | | 4,987,816 | | | | 5,062,171 | |
+1.58%, 2.968%, 2/1/44 | | | 5,093,422 | | | | 5,178,540 | |
+1.55%, 4.675%, 2/1/44 | | | 1,070,313 | | | | 1,103,359 | |
+1.59%, 2.967%, 4/1/44 | | | 4,188,036 | | | | 4,254,230 | |
+1.59%, 3.033%, 4/1/44 | | | 3,210,939 | | | | 3,265,105 | |
+1.58%, 3.186%, 4/1/44 | | | 15,745,426 | | | | 16,169,605 | |
+1.68%, 4.543%, 4/1/44 | | | 15,213,981 | | | | 15,784,344 | |
+1.56%, 4.556%, 4/1/44 | | | 5,588,684 | | | | 5,762,318 | |
+1.57%, 3.04%, 5/1/44 | | | 17,103,958 | | | | 17,424,322 | |
+1.57%, 4.529%, 5/1/44 | | | 6,088,135 | | | | 6,278,680 | |
+1.58%, 2.807%, 7/1/44 | | | 8,823,328 | | | | 8,979,496 | |
+1.59%, 2.854%, 7/1/44 | | | 11,167,915 | | | | 11,384,623 | |
+1.57%, 2.922%, 7/1/44 | | | 4,552,082 | | | | 4,643,433 | |
+1.56%, 2.954%, 7/1/44 | | | 6,861,942 | | | | 6,997,968 | |
+1.59%, 2.974%, 7/1/44 | | | 4,036,991 | | | | 4,119,661 | |
+1.58%, 3.076%, 7/1/44 | | | 9,603,110 | | | | 9,808,554 | |
+1.58%, 2.79%, 8/1/44 | | | 7,183,345 | | | | 7,319,305 | |
+1.57%, 2.793%, 8/1/44 | | | 15,797,513 | | | | 16,094,396 | |
+1.58%, 2.89%, 8/1/44 | | | 5,387,141 | | | | 5,496,730 | |
+1.57%, 2.996%, 8/1/44 | | | 5,846,383 | | | | 5,968,680 | |
+1.58%, 2.656%, 9/1/44 | | | 7,044,462 | | | | 7,166,069 | |
+1.58%, 2.754%, 9/1/44 | | | 7,681,915 | | | | 7,822,060 | |
+1.65%, 2.815%, 9/1/44 | | | 28,653,631 | | | | 29,161,664 | |
+1.58%, 2.849%, 9/1/44 | | | 4,378,566 | | | | 4,467,816 | |
| | |
| See accompanying Notes to Financial Statements | | DODGE & COX INCOME FUND§PAGE 9 |
| | | | |
| PORTFOLIO OF INVESTMENTS (unaudited) | | | June 30, 2019 | |
| | | | | | | | |
| DEBT SECURITIES (continued) | | | | | | |
| | |
| | | PAR VALUE | | | VALUE | |
+1.64%, 2.928%, 9/1/44 | | $ | 13,365,628 | | | $ | 13,643,495 | |
+1.59%, 3.018%, 9/1/44 | | | 5,813,645 | | | | 5,948,640 | |
+1.57%, 2.473%, 10/1/44 | | | 6,874,436 | | | | 6,977,939 | |
+1.60%, 2.564%, 10/1/44 | | | 5,529,900 | | | | 5,621,180 | |
+1.57%, 2.622%, 10/1/44 | | | 11,769,322 | | | | 11,971,352 | |
+1.58%, 2.732%, 10/1/44 | | | 6,873,675 | | | | 7,003,125 | |
+1.57%, 2.764%, 10/1/44 | | | 26,852,704 | | | | 27,345,953 | |
+1.58%, 2.792%, 10/1/44 | | | 12,361,205 | | | | 12,605,701 | |
+1.56%, 2.846%, 10/1/44 | | | 6,630,551 | | | | 6,770,209 | |
+1.60%, 2.85%, 10/1/44 | | | 11,833,868 | | | | 12,087,634 | |
+1.60%, 2.88%, 10/1/44 | | | 8,508,329 | | | | 8,694,204 | |
+1.60%, 2.901%, 10/1/44 | | | 14,254,336 | | | | 14,573,492 | |
+1.56%, 2.933%, 10/1/44 | | | 6,725,834 | | | | 6,871,237 | |
+1.58%, 2.949%, 10/1/44 | | | 4,076,619 | | | | 4,172,257 | |
+1.58%, 2.739%, 11/1/44 | | | 5,118,300 | | | | 5,219,310 | |
+1.60%, 2.786%, 11/1/44 | | | 5,911,932 | | | | 6,032,077 | |
+1.60%, 2.786%, 11/1/44 | | | 11,319,458 | | | | 11,556,655 | |
+1.58%, 2.826%, 11/1/44 | | | 13,618,601 | | | | 13,899,735 | |
+1.56%, 2.929%, 11/1/44 | | | 13,452,013 | | | | 13,763,246 | |
+1.57%, 2.955%, 11/1/44 | | | 12,185,691 | | | | 12,473,330 | |
+1.59%, 2.682%, 12/1/44 | | | 3,686,193 | | | | 3,749,951 | |
+1.58%, 2.722%, 12/1/44 | | | 3,481,685 | | | | 3,548,000 | |
+1.57%, 2.729%, 12/1/44 | | | 26,539,726 | | | | 27,042,114 | |
+1.58%, 2.782%, 12/1/44 | | | 4,195,975 | | | | 4,279,628 | |
+1.60%, 2.819%, 12/1/44 | | | 9,374,087 | | | | 9,566,075 | |
+1.59%, 2.98%, 12/1/44 | | | 5,543,545 | | | | 5,668,490 | |
+1.57%, 2.90%, 1/1/45 | | | 9,198,508 | | | | 9,392,416 | |
+1.58%, 2.758%, 2/1/45 | | | 14,802,800 | | | | 15,080,305 | |
+1.57%, 3.005%, 3/1/45 | | | 120,466,339 | | | | 123,011,721 | |
+1.59%, 3.071%, 3/1/45 | | | 2,949,318 | | | | 3,015,394 | |
+1.61%, 2.582%, 4/1/45 | | | 5,167,467 | | | | 5,231,862 | |
+1.57%, 2.837%, 4/1/45 | | | 29,273,132 | | | | 29,801,245 | |
+1.59%, 2.64%, 8/1/45 | | | 10,292,407 | | | | 10,398,855 | |
+1.58%, 2.659%, 8/1/45 | | | 8,639,723 | | | | 8,737,638 | |
+1.58%, 2.815%, 10/1/45 | | | 22,262,744 | | | | 22,581,954 | |
+1.60%, 2.615%, 11/1/45 | | | 18,111,485 | | | | 18,291,471 | |
+1.61%, 2.833%, 3/1/46 | | | 3,748,132 | | | | 3,806,532 | |
+1.60%, 2.423%, 4/1/46 | | | 30,858,725 | | | | 31,181,623 | |
+1.59%, 2.684%, 4/1/46 | | | 5,932,819 | | | | 6,002,671 | |
+1.61%, 2.745%, 4/1/46 | | | 5,503,689 | | | | 5,576,076 | |
+1.58%, 2.802%, 4/1/46 | | | 14,991,966 | | | | 15,209,635 | |
+1.61%, 2.94%, 4/1/46 | | | 4,194,728 | | | | 4,267,316 | |
+1.58%, 2.485%, 5/1/46 | | | 7,631,261 | | | | 7,695,969 | |
+1.59%, 2.711%, 6/1/46 | | | 8,737,252 | | | | 8,861,043 | |
+1.60%, 2.73%, 6/1/46 | | | 2,809,018 | | | | 2,848,190 | |
+1.59%, 2.668%, 7/1/46 | | | 2,808,651 | | | | 2,844,818 | |
+1.62%, 2.304%, 12/1/46 | | | 6,542,795 | | | | 6,576,245 | |
+1.61%, 3.10%, 6/1/47 | | | 22,171,446 | | | | 22,646,823 | |
+1.61%, 3.163%, 6/1/47 | | | 24,839,926 | | | | 25,383,853 | |
+1.61%, 3.131%, 7/1/47 | | | 8,109,094 | | | | 8,288,896 | |
+1.59%, 3.141%, 7/1/47 | | | 19,822,565 | | | | 20,286,221 | |
+1.60%, 2.706%, 8/1/47 | | | 24,725,862 | | | | 25,020,007 | |
+1.61%, 3.025%, 8/1/47 | | | 7,421,745 | | | | 7,576,881 | |
+1.61%, 3.028%, 8/1/47 | | | 7,897,632 | | | | 8,065,648 | |
+1.59%, 3.18%, 8/1/47 | | | 9,534,514 | | | | 9,748,386 | |
+1.57%, 2.914%, 10/1/47 | | | 5,898,561 | | | | 6,013,498 | |
+1.61%, 3.083%, 10/1/47 | | | 10,044,745 | | | | 10,257,810 | |
+1.61%, 2.896%, 11/1/47 | | | 7,145,024 | | | | 7,277,690 | |
+1.59%, 2.978%, 11/1/47 | | | 15,851,995 | | | | 16,199,301 | |
+1.61%, 3.12%, 1/1/48 | | | 4,066,179 | | | | 4,152,226 | |
+1.61%, 3.149%, 1/1/48 | | | 7,850,950 | | | | 8,001,590 | |
+1.61%, 3.098%, 3/1/48 | | | 10,323,172 | | | | 10,554,192 | |
+1.60%, 3.185%, 4/1/48 | | | 12,091,071 | | | | 12,347,555 | |
+1.61%, 3.168%, 5/1/48 | | | 91,961,685 | | | | 93,947,815 | |
+1.62%, 3.321%, 10/1/48 | | | 21,251,169 | | | | 21,729,065 | |
| | | | | | | | |
| | |
| | | PAR VALUE | | | VALUE | |
USD LIBOR6-Month | | | | | | | | |
+1.42%, 4.118%, 8/1/34 | | $ | 1,451,172 | | | $ | 1,493,906 | |
+1.50%, 4.20%, 1/1/35 | | | 672,996 | | | | 693,351 | |
+1.57%, 4.376%, 11/1/35 | | | 1,046,536 | | | | 1,078,370 | |
Freddie Mac, Hybrid ARM(e)
1-Year U.S. Treasury CMT | | | | | | | | |
+2.25%, 4.971%, 2/1/34 | | | 2,735,559 | | | | 2,881,711 | |
+2.25%, 4.738%, 11/1/34 | | | 975,435 | | | | 1,028,618 | |
+2.25%, 5.00%, 2/1/35 | | | 588,839 | | | | 620,625 | |
+2.13%, 4.625%, 4/1/35 | | | 311,165 | | | | 324,028 | |
+1.67%, 4.268%, 1/1/36 | | | 1,688,935 | | | | 1,749,582 | |
+2.25%, 4.835%, 1/1/36 | | | 2,570,275 | | | | 2,709,721 | |
USD LIBOR12-Month | | | | | | | | |
+1.78%, 4.529%, 9/1/33 | | | 3,580,565 | | | | 3,747,316 | |
+1.80%, 4.55%, 8/1/34 | | | 536,728 | | | | 562,871 | |
+1.63%, 4.704%, 1/1/35 | | | 270,501 | | | | 282,223 | |
+1.80%, 4.777%, 3/1/35 | | | 765,698 | | | | 805,550 | |
+1.72%, 4.569%, 8/1/35 | | | 825,957 | | | | 865,871 | |
+1.87%, 4.62%, 8/1/35 | | | 1,625,501 | | | | 1,711,325 | |
+1.82%, 4.567%, 9/1/35 | | | 1,048,997 | | | | 1,087,669 | |
+1.63%, 4.406%, 10/1/35 | | | 1,373,734 | | | | 1,433,588 | |
+1.61%, 4.491%, 1/1/36 | | | 874,377 | | | | 913,545 | |
+1.88%, 4.795%, 4/1/36 | | | 1,874,011 | | | | 1,979,393 | |
+1.78%, 4.649%, 12/1/36 | | | 1,390,663 | | | | 1,463,567 | |
+1.77%, 4.80%, 1/1/37 | | | 996,162 | | | | 1,044,522 | |
+1.57%, 4.681%, 3/1/37 | | | 1,259,960 | | | | 1,316,272 | |
+1.55%, 4.439%, 4/1/37 | | | 949,635 | | �� | | 994,000 | |
+1.68%, 4.604%, 4/1/37 | | | 1,039,454 | | | | 1,093,223 | |
+1.63%, 4.50%, 5/1/37 | | | 837,814 | | | | 876,201 | |
+1.63%, 4.389%, 7/1/37 | | | 3,426,339 | | | | 3,579,878 | |
+2.09%, 4.835%, 10/1/37 | | | 108,651 | | | | 114,770 | |
+2.04%, 5.096%, 1/1/38 | | | 363,594 | | | | 385,445 | |
+1.65%, 4.584%, 2/1/38 | | | 2,631,185 | | | | 2,755,275 | |
+1.75%, 4.647%, 4/1/38 | | | 2,382,617 | | | | 2,504,945 | |
+1.85%, 4.816%, 4/1/38 | | | 3,961,440 | | | | 4,189,388 | |
+1.90%, 4.771%, 5/1/38 | | | 661,157 | | | | 685,620 | |
+1.67%, 4.591%, 6/1/38 | | | 1,955,632 | | | | 2,051,717 | |
+1.73%, 4.623%, 10/1/38 | | | 2,120,074 | | | | 2,227,392 | |
+1.75%, 4.672%, 10/1/38 | | | 386,740 | | | | 406,268 | |
+1.80%, 4.677%, 11/1/39 | | | 1,021,188 | | | | 1,076,795 | |
+1.85%, 4.653%, 7/1/43 | | | 1,304,064 | | | | 1,361,825 | |
+1.71%, 4.665%, 8/1/43 | | | 15,135,682 | | | | 15,680,618 | |
+1.64%, 2.794%, 10/1/43 | | | 1,659,226 | | | | 1,689,830 | |
+1.59%, 2.867%, 1/1/44 | | | 2,734,670 | | | | 2,776,716 | |
+1.61%, 3.083%, 1/1/44 | | | 2,722,441 | | | | 2,772,327 | |
+1.62%, 2.859%, 2/1/44 | | | 9,213,101 | | | | 9,356,514 | |
+1.64%, 3.081%, 4/1/44 | | | 2,643,719 | | | | 2,692,678 | |
+1.63%, 3.125%, 4/1/44 | | | 5,078,474 | | | | 5,171,587 | |
+1.63%, 2.995%, 5/1/44 | | | 76,023,561 | | | | 77,365,958 | |
+1.62%, 2.836%, 6/1/44 | | | 4,528,250 | | | | 4,610,784 | |
+1.62%, 3.088%, 6/1/44 | | | 15,319,279 | | | | 15,598,394 | |
+1.63%, 3.056%, 7/1/44 | | | 4,054,950 | | | | 4,144,372 | |
+1.62%, 3.061%, 7/1/44 | | | 4,709,453 | | | | 4,808,533 | |
+1.61%, 2.841%, 8/1/44 | | | 6,631,043 | | | | 6,758,574 | |
+1.62%, 3.026%, 8/1/44 | | | 7,285,136 | | | | 7,442,463 | |
+1.63%, 3.039%, 8/1/44 | | | 8,272,468 | | | | 8,443,856 | |
+1.62%, 2.674%, 9/1/44 | | | 6,905,264 | | | | 7,022,659 | |
+1.62%, 2.727%, 9/1/44 | | | 9,713,858 | | | | 9,898,874 | |
+1.62%, 2.83%, 9/1/44 | | | 6,870,059 | | | | 7,001,773 | |
+1.62%, 2.839%, 10/1/44 | | | 4,297,879 | | | | 4,387,741 | |
+1.62%, 2.844%, 10/1/44 | | | 12,547,738 | | | | 12,804,076 | |
+1.61%, 2.903%, 10/1/44 | | | 9,012,950 | | | | 9,201,452 | |
+1.63%, 2.932%, 10/1/44 | | | 10,881,268 | | | | 11,121,609 | |
+1.63%, 3.017%, 10/1/44 | | | 11,712,431 | | | | 11,995,478 | |
+1.60%, 2.69%, 11/1/44 | | | 14,576,670 | | | | 14,834,806 | |
+1.63%, 2.752%, 11/1/44 | | | 6,444,212 | | | | 6,562,992 | |
| | |
| PAGE 10§ DODGE & COX INCOME FUND | | See accompanying Notes to Financial Statements |
| | | | |
| PORTFOLIO OF INVESTMENTS (unaudited) | | | June 30, 2019 | |
| | | | | | | | |
| DEBT SECURITIES (continued) | | | | | | |
| | |
| | | PAR VALUE | | | VALUE | |
+1.63%, 2.779%, 11/1/44 | | $ | 10,592,472 | | | $ | 10,799,769 | |
+1.61%, 2.886%, 11/1/44 | | | 7,374,341 | | | | 7,523,240 | |
+1.62%, 2.907%, 11/1/44 | | | 11,304,030 | | | | 11,541,595 | |
+1.61%, 2.911%, 11/1/44 | | | 5,850,830 | | | | 5,968,866 | |
+1.61%, 2.912%, 11/1/44 | | | 19,982,038 | | | | 20,417,781 | |
+1.63%, 2.939%, 11/1/44 | | | 8,935,862 | | | | 9,125,330 | |
+1.62%, 2.941%, 11/1/44 | | | 9,623,337 | | | | 9,833,605 | |
+1.63%, 2.945%, 11/1/44 | | | 14,394,299 | | | | 14,718,062 | |
+1.60%, 2.997%, 11/1/44 | | | 4,968,268 | | | | 5,080,706 | |
+1.63%, 2.773%, 12/1/44 | | | 3,022,402 | | | | 3,074,531 | |
+1.63%, 2.834%, 12/1/44 | | | 16,086,814 | | | | 16,392,041 | |
+1.62%, 2.898%, 12/1/44 | | | 10,135,457 | | | | 10,341,653 | |
+1.63%, 2.91%, 12/1/44 | | | 14,249,619 | | | | 14,549,224 | |
+1.62%, 2.91%, 12/1/44 | | | 7,126,559 | | | | 7,273,540 | |
+1.62%, 2.671%, 1/1/45 | | | 11,019,429 | | | | 11,190,763 | |
+1.63%, 2.846%, 1/1/45 | | | 8,461,478 | | | | 8,617,645 | |
+1.62%, 2.856%, 1/1/45 | | | 8,241,869 | | | | 8,386,377 | |
+1.62%, 2.906%, 1/1/45 | | | 15,252,359 | | | | 15,554,076 | |
+1.63%, 3.069%, 1/1/45 | | | 19,383,158 | | | | 19,824,226 | |
+1.62%, 2.905%, 2/1/45 | | | 11,862,841 | | | | 12,086,322 | |
+1.62%, 2.619%, 4/1/45 | | | 6,189,778 | | | | 6,283,601 | |
+1.63%, 2.597%, 5/1/45 | | | 38,676,440 | | | | 39,086,363 | |
+1.63%, 2.748%, 6/1/45 | | | 4,470,762 | | | | 4,523,530 | |
+1.63%, 2.624%, 8/1/45 | | | 10,673,615 | | | | 10,769,104 | |
+1.64%, 2.738%, 8/1/45 | | | 31,027,064 | | | | 31,409,133 | |
+1.60%, 2.782%, 8/1/45 | | | 7,247,803 | | | | 7,338,438 | |
+1.63%, 2.812%, 9/1/45 | | | 8,881,012 | | | | 8,997,207 | |
+1.63%, 2.728%, 5/1/46 | | | 197,393,899 | | | | 199,790,904 | |
+1.62%, 2.738%, 5/1/46 | | | 14,864,707 | | | | 15,047,539 | |
+1.62%, 2.614%, 7/1/46 | | | 20,828,539 | | | | 21,038,910 | |
+1.63%, 2.543%, 9/1/46 | | | 36,235,416 | | | | 36,505,852 | |
+1.63%, 3.178%, 6/1/47 | | | 11,427,274 | | | | 11,666,731 | |
+1.63%, 3.203%, 8/1/47 | | | 6,806,043 | | | | 6,937,560 | |
+1.64%, 3.087%, 10/1/47 | | | 7,512,950 | | | | 7,657,195 | |
+1.64%, 3.15%, 11/1/47 | | | 3,759,682 | | | | 3,834,786 | |
USD LIBOR6-Month | | | | | | | | |
+1.59%, 4.288%, 8/1/36 | | | 1,731,885 | | | | 1,793,411 | |
Freddie Mac Gold, 15 Year | | | | | | | | |
5.50%, 10/1/20-12/1/24 | | | 1,303,265 | | | | 1,324,538 | |
6.00%, 8/1/21-11/1/23 | | | 5,016,080 | | | | 5,196,931 | |
4.50%, 3/1/25-6/1/26 | | | 8,162,605 | | | | 8,434,321 | |
Freddie Mac Gold, 20 Year | | | | | | | | |
6.50%, 10/1/26 | | | 1,721,816 | | | | 1,844,841 | |
4.50%, 5/1/30-1/1/34 | | | 83,367,217 | | | | 88,793,010 | |
4.00%, 9/1/31-10/1/35 | | | 391,741,376 | | | | 412,352,159 | |
3.50%, 7/1/35-1/1/36 | | | 155,207,390 | | | | 160,165,249 | |
Freddie Mac Gold, 30 Year | | | | | | | | |
7.90%, 2/17/21 | | | 13,282 | | | | 13,277 | |
7.00%, 4/1/31-11/1/38 | | | 2,548,341 | | | | 2,905,856 | |
6.50%, 12/1/32-10/1/38 | | | 8,378,498 | | | | 9,516,560 | |
6.00%, 12/1/33-2/1/39 | | | 14,837,371 | | | | 16,737,653 | |
5.50%, 3/1/34-12/1/38 | | | 42,802,579 | | | | 47,445,363 | |
4.50%, 3/1/39-3/1/49 | | | 2,382,579,810 | | | | 2,519,934,693 | |
4.00%, 11/1/45-11/1/47 | | | 724,777,138 | | | | 757,985,743 | |
Freddie Mac Pool, 30 Year | | | | | | | | |
7.00%, 11/1/37 | | | 9,086 | | | | 10,708 | |
4.50%, 8/1/48-2/1/49 | | | 607,477,886 | | | | 635,603,527 | |
Ginnie Mae, 20 Year
4.00%, 1/20/35 | | | 7,116,240 | | | | 7,364,889 | |
Ginnie Mae, 30 Year | | | | | | | | |
7.80%, 6/15/20-1/15/21 | | | 25,803 | | | | 25,929 | |
8.00%, 9/15/20 | | | 87 | | | | 87 | |
7.85%, 1/15/21 | | | 1,805 | | | | 1,809 | |
7.50%, 12/15/23-5/15/25 | | | 550,751 | | | | 596,258 | |
7.00%, 5/15/28 | | | 191,837 | | | | 209,910 | |
| | | | | | | | |
| | | | | | | 18,914,759,824 | |
| | | | | | | | |
| | |
| | | PAR VALUE | | | VALUE | |
Private Label CMO & REMIC: 0.1% | |
GSMPS Mortgage Loan Trust
Series2004-4 1A4, 8.50%, 6/25/34(b) | | $ | 2,929,954 | | | $ | 3,376,952 | |
Seasoned Credit Risk Transfer Trust
Series2017-4 M45T, 4.50%, 6/25/57 | | | 27,569,886 | | | | 29,484,533 | |
| | | | | | | | |
| | | | | | | 32,861,485 | |
| | | | | | | | |
| | | | | | | 22,047,813,664 | |
| | | | | | | | |
| | | | | | | 26,406,212,634 | |
| CORPORATE: 41.5% | |
FINANCIALS: 14.2% | |
Bank of America Corp. | | | | | | | | |
3.004%, 12/20/23(f) | | | 422,916,000 | | | | 430,501,768 | |
4.20%, 8/26/24 | | | 163,140,000 | | | | 173,444,063 | |
4.25%, 10/22/26 | | | 185,082,000 | | | | 197,651,602 | |
Barclays PLC (United Kingdom) | | | | | | | | |
4.375%, 9/11/24 | | | 239,204,000 | | | | 245,076,860 | |
4.836%, 5/9/28 | | | 77,975,000 | | | | 79,798,852 | |
BNP Paribas SA (France) | | | | | | | | |
4.25%, 10/15/24 | | | 381,716,000 | | | | 401,318,945 | |
4.375%, 9/28/25(b) | | | 170,531,000 | | | | 179,114,564 | |
4.375%, 5/12/26(b) | | | 118,904,000 | | | | 124,628,404 | |
4.625%, 3/13/27(b) | | | 237,000,000 | | | | 252,950,610 | |
Boston Properties, Inc. | | | | | | | | |
5.625%, 11/15/20 | | | 79,385,000 | | | | 82,410,274 | |
4.125%, 5/15/21 | | | 52,852,000 | | | | 54,364,999 | |
3.85%, 2/1/23 | | | 76,031,000 | | | | 79,322,091 | |
3.125%, 9/1/23 | | | 19,500,000 | | | | 19,992,039 | |
3.80%, 2/1/24 | | | 64,024,000 | | | | 67,112,522 | |
3.20%, 1/15/25 | | | 47,075,000 | | | | 48,030,542 | |
3.65%, 2/1/26 | | | 19,580,000 | | | | 20,361,933 | |
4.50%, 12/1/28 | | | 101,325,000 | | | | 112,438,967 | |
Capital One Financial Corp. | |
3.50%, 6/15/23 | | | 155,385,000 | | | | 161,265,556 | |
3.90%, 1/29/24 | | | 51,765,000 | | | | 54,349,439 | |
3.75%, 4/24/24 | | | 36,940,000 | | | | 38,738,012 | |
3.20%, 2/5/25 | | | 52,515,000 | | | | 53,519,310 | |
4.20%, 10/29/25 | | | 121,149,000 | | | | 127,193,522 | |
Cigna Corp. | | | | | | | | |
4.00%, 2/15/22 | | | 62,964,000 | | | | 65,040,230 | |
7.65%, 3/1/23 | | | 7,217,000 | | | | 8,429,308 | |
7.875%, 5/15/27 | | | 26,720,000 | | | | 34,834,401 | |
Citigroup, Inc. | | | | | | | | |
3.50%, 5/15/23 | | | 72,730,000 | | | | 75,016,996 | |
4.00%, 8/5/24 | | | 31,300,000 | | | | 32,978,963 | |
USD LIBOR3-Month | | | | | | | | |
+6.37%, 8.953%, 10/30/40(a) | | | 427,488,075 | | | | 473,143,801 | |
Equity Residential | | | | | | | | |
4.75%, 7/15/20 | | | 5,200,000 | | | | 5,289,016 | |
4.625%, 12/15/21 | | | 108,687,000 | | | | 114,299,071 | |
3.00%, 4/15/23 | | | 47,300,000 | | | | 48,442,879 | |
3.375%, 6/1/25 | | | 77,890,000 | | | | 81,428,761 | |
HSBC Holdings PLC (United Kingdom) | | | | | | | | |
5.10%, 4/5/21 | | | 85,935,000 | | | | 89,785,547 | |
9.30%, 6/1/21 | | | 100,000 | | | | 111,873 | |
2.65%, 1/5/22 | | | 32,865,000 | | | | 32,982,869 | |
3.262%, 3/13/23(f) | | | 13,570,000 | | | | 13,804,440 | |
3.60%, 5/25/23 | | | 63,550,000 | | | | 66,089,694 | |
3.95%, 5/18/24(f) | | | 133,680,000 | | | | 139,806,530 | |
4.30%, 3/8/26 | | | 116,100,000 | | | | 124,654,126 | |
6.50%, 5/2/36 | | | 218,122,000 | | | | 281,999,689 | |
6.50%, 9/15/37 | | | 230,191,000 | | | | 300,025,841 | |
6.80%, 6/1/38 | | | 29,650,000 | | | | 39,970,828 | |
JPMorgan Chase & Co. | | | | | | | | |
3.375%, 5/1/23 | | | 92,238,000 | | | | 94,799,319 | |
4.125%, 12/15/26 | | | 119,864,000 | | | | 128,235,975 | |
| | |
| See accompanying Notes to Financial Statements | | DODGE & COX INCOME FUND§PAGE 11 |
| | | | |
| PORTFOLIO OF INVESTMENTS (unaudited) | | | June 30, 2019 | |
| | | | | | | | |
| DEBT SECURITIES (continued) | | | | | | |
| | |
| | | PAR VALUE | | | VALUE | |
4.25%, 10/1/27 | | $ | 125,244,000 | | | $ | 135,493,742 | |
8.75%, 9/1/30(a) | | | 81,412,000 | | | | 116,302,311 | |
Lloyds Banking Group PLC (United Kingdom) | | | | | | | | |
4.05%, 8/16/23 | | | 146,125,000 | | | | 152,470,136 | |
4.50%, 11/4/24 | | | 218,317,000 | | | | 228,269,055 | |
4.582%, 12/10/25 | | | 116,731,000 | | | | 121,732,219 | |
4.65%, 3/24/26 | | | 118,232,000 | | | | 123,398,645 | |
Royal Bank of Scotland Group PLC (United Kingdom) | | | | | | | | |
6.125%, 12/15/22 | | | 340,311,000 | | | | 367,014,442 | |
6.10%, 6/10/23 | | | 19,737,000 | | | | 21,419,047 | |
6.00%, 12/19/23 | | | 350,211,000 | | | | 381,235,905 | |
5.125%, 5/28/24 | | | 28,169,000 | | | | 29,728,795 | |
UniCredit SPA (Italy)
7.296%, 4/2/34(b)(f) | | | 292,266,000 | | | | 309,766,304 | |
Unum Group | | | | | | | | |
7.19%, 2/1/28 | | | 11,295,000 | | | | 13,773,696 | |
7.25%, 3/15/28 | | | 25,060,000 | | | | 30,920,018 | |
6.75%, 12/15/28 | | | 8,107,000 | | | | 9,814,801 | |
Wells Fargo & Co. | | | | | | | | |
2.15%, 12/6/19 | | | 280,875,000 | | | | 280,607,573 | |
3.55%, 8/14/23 | | | 244,815,000 | | | | 255,381,002 | |
4.10%, 6/3/26 | | | 130,170,000 | | | | 137,907,737 | |
4.30%, 7/22/27 | | | 323,175,000 | | | | 348,955,646 | |
USD LIBOR3-Month
+0.65%, 3.124%, 12/6/19 | | | 135,850,000 | | | | 136,219,830 | |
| | | | | | | | |
| | | | | | | 8,455,165,935 | |
INDUSTRIALS: 25.5% | |
Anheuser-Busch InBev SA/NV (Belgium) | | | | | | | | |
5.45%, 1/23/39 | | | 82,275,000 | | | | 97,740,218 | |
5.55%, 1/23/49 | | | 137,800,000 | | | | 168,031,230 | |
AT&T, Inc. | | | | | | | | |
8.75%, 11/15/31 | | | 100,978,000 | | | | 137,509,669 | |
5.35%, 9/1/40 | | | 59,744,000 | | | | 67,372,760 | |
4.75%, 5/15/46 | | | 112,670,000 | | | | 118,455,895 | |
5.65%, 2/15/47 | | | 130,385,000 | | | | 152,822,138 | |
5.45%, 3/1/47 | | | 144,180,000 | | | | 165,460,975 | |
4.50%, 3/9/48 | | | 234,630,000 | | | | 240,381,389 | |
Bayer AG (Germany) | | | | | | | | |
3.875%, 12/15/23(b) | | | 301,635,000 | | | | 312,516,869 | |
4.25%, 12/15/25(b) | | | 133,965,000 | | | | 141,661,329 | |
4.375%, 12/15/28(b) | | | 170,210,000 | | | | 179,330,720 | |
Bayerische Motoren Werke AG (Germany)
3.40%, 8/13/21(b) | | | 92,505,000 | | | | 94,258,554 | |
BHP Billiton, Ltd. (Australia)
6.75%, 10/19/75(a)(b)(f) | | | 111,122,000 | | | | 126,790,202 | |
Burlington Northern Santa Fe LLC(d) | | | | | | | | |
4.70%, 10/1/19 | | | 33,445,000 | | | | 33,615,298 | |
8.251%, 1/15/21 | | | 1,007,835 | | | | 1,040,866 | |
3.05%, 9/1/22 | | | 39,535,000 | | | | 40,487,826 | |
5.943%, 1/15/23 | | | 8,173 | | | | 8,340 | |
3.85%, 9/1/23 | | | 79,525,000 | | | | 84,507,298 | |
5.72%, 1/15/24 | | | 9,710,918 | | | | 10,488,198 | |
5.342%, 4/1/24 | | | 2,753,765 | | | | 2,929,414 | |
5.629%, 4/1/24 | | | 11,951,618 | | | | 12,743,528 | |
5.996%, 4/1/24 | | | 26,276,713 | | | | 28,832,120 | |
3.442%, 6/16/28(b) | | | 77,096,435 | | | | 80,585,003 | |
Cemex SAB de CV (Mexico) | | | | | | | | |
6.00%, 4/1/24(b) | | | 113,175,000 | | | | 116,570,250 | |
5.70%, 1/11/25(b) | | | 225,456,000 | | | | 234,237,511 | |
6.125%, 5/5/25(b) | | | 113,075,000 | | | | 118,304,719 | |
7.75%, 4/16/26(b) | | | 138,048,000 | | | | 151,854,180 | |
Charter Communications, Inc. | | | | | | | | |
5.00%, 2/1/20 | | | 20,700,000 | | | | 20,971,656 | |
4.125%, 2/15/21 | | | 33,095,000 | | | | 33,703,914 | |
| | | | | | | | |
| | |
| | | PAR VALUE | | | VALUE | |
4.00%, 9/1/21 | | $ | 40,609,000 | | | $ | 41,670,395 | |
4.908%, 7/23/25 | | | 122,505,000 | | | | 132,924,181 | |
4.20%, 3/15/28 | | | 68,500,000 | | | | 71,123,403 | |
5.05%, 3/30/29 | | | 76,525,000 | | | | 84,306,215 | |
6.55%, 5/1/37 | | | 46,188,000 | | | | 53,323,969 | |
6.75%, 6/15/39 | | | 112,072,000 | | | | 129,901,069 | |
6.484%, 10/23/45 | | | 450,292,000 | | | | 530,075,583 | |
5.375%, 5/1/47 | | | 57,310,000 | | | | 60,302,763 | |
5.75%, 4/1/48 | | | 195,865,000 | | | | 216,508,250 | |
Cigna Corp. | | | | | | | | |
3.75%, 7/15/23(b) | | | 244,625,000 | | | | 254,550,828 | |
4.125%, 11/15/25(b) | | | 47,550,000 | | | | 50,498,932 | |
4.375%, 10/15/28(b) | | | 154,300,000 | | | | 166,410,134 | |
Comcast Corp. | | | | | | | | |
3.95%, 10/15/25 | | | 95,605,000 | | | | 103,085,819 | |
3.969%, 11/1/47 | | | 18,315,000 | | | | 19,248,151 | |
4.70%, 10/15/48 | | | 36,050,000 | | | | 42,245,796 | |
Cox Enterprises, Inc. | | | | | | | | |
3.25%, 12/15/22(b) | | | 94,333,000 | | | | 96,250,279 | |
2.95%, 6/30/23(b) | | | 251,295,000 | | | | 253,434,661 | |
3.85%, 2/1/25(b) | | | 263,159,000 | | | | 274,953,800 | |
3.35%, 9/15/26(b) | | | 139,412,000 | | | | 140,864,762 | |
3.50%, 8/15/27(b) | | | 144,842,000 | | | | 147,489,088 | |
CRH PLC (Ireland)
3.875%, 5/18/25(b) | | | 196,754,000 | | | | 205,687,094 | |
CSX Corp. | | | | | | | | |
9.75%, 6/15/20 | | | 10,067,000 | | | | 10,757,022 | |
6.251%, 1/15/23 | | | 11,859,995 | | | | 13,077,522 | |
CVS Health Corp. | | | | | | | | |
3.70%, 3/9/23 | | | 185,864,000 | | | | 191,875,858 | |
4.10%, 3/25/25 | | | 42,500,000 | | | | 44,800,358 | |
4.30%, 3/25/28 | | | 274,462,000 | | | | 289,263,725 | |
4.78%, 3/25/38 | | | 89,275,000 | | | | 93,048,745 | |
Dell Technologies, Inc.
5.45%, 6/15/23(b) | | | 200,159,000 | | | | 215,732,123 | |
Dillard’s, Inc. | | | | | | | | |
7.875%, 1/1/23 | | | 275,000 | | | | 295,580 | |
7.75%, 7/15/26 | | | 21,016,000 | | | | 23,440,528 | |
7.75%, 5/15/27 | | | 12,848,000 | | | | 14,108,307 | |
7.00%, 12/1/28 | | | 28,225,000 | | | | 30,426,775 | |
Dow, Inc. | | | | | | | | |
4.55%, 11/30/25(b) | | | 20,200,000 | | | | 21,991,040 | |
4.80%, 11/30/28(b) | | | 24,050,000 | | | | 27,005,800 | |
7.375%, 11/1/29 | | | 69,100,000 | | | | 90,837,506 | |
9.40%, 5/15/39 | | | 153,811,000 | | | | 243,996,879 | |
5.25%, 11/15/41 | | | 39,918,000 | | | | 44,469,462 | |
5.55%, 11/30/48(b) | | | 19,204,000 | | | | 22,829,939 | |
Elanco Animal Health, Inc. | | | | | | | | |
3.912%, 8/27/21 | | | 32,870,000 | | | | 33,573,128 | |
4.272%, 8/28/23 | | | 32,775,000 | | | | 34,385,555 | |
4.90%, 8/28/28 | | | 46,519,000 | | | | 51,928,629 | |
Ford Motor Credit Co. LLC(d) | | | | | | | | |
5.75%, 2/1/21 | | | 192,923,000 | | | | 200,836,464 | |
5.875%, 8/2/21 | | | 169,660,000 | | | | 178,848,482 | |
3.813%, 10/12/21 | | | 194,775,000 | | | | 197,496,928 | |
5.596%, 1/7/22 | | | 105,725,000 | | | | 111,946,473 | |
3.219%, 1/9/22 | | | 30,125,000 | | | | 30,154,310 | |
4.25%, 9/20/22 | | | 3,142,000 | | | | 3,221,334 | |
4.14%, 2/15/23 | | | 127,081,000 | | | | 129,420,265 | |
4.375%, 8/6/23 | | | 43,064,000 | | | | 44,197,437 | |
Fox Corp. | | | | | | | | |
4.709%, 1/25/29(b) | | | 31,520,000 | | | | 35,163,649 | |
5.476%, 1/25/39(b) | | | 29,145,000 | | | | 34,383,270 | |
HCA Healthcare, Inc. | | | | | | | | |
4.125%, 6/15/29 | | | 73,620,000 | | | | 75,331,405 | |
5.125%, 6/15/39 | | | 39,000,000 | | | | 40,509,844 | |
5.25%, 6/15/49 | | | 43,600,000 | | | | 45,331,356 | |
| | |
| PAGE 12§ DODGE & COX INCOME FUND | | See accompanying Notes to Financial Statements |
| | | | |
| PORTFOLIO OF INVESTMENTS (unaudited) | | | June 30, 2019 | |
| | | | | | | | |
| DEBT SECURITIES (continued) | | | | | | |
| | |
| | | PAR VALUE | | | VALUE | |
Imperial Brands PLC (United Kingdom) | | | | | | | | |
3.75%, 7/21/22(b) | | $ | 124,595,000 | | | $ | 128,229,530 | |
4.25%, 7/21/25(b) | | | 593,845,000 | | | | 622,816,987 | |
Kinder Morgan, Inc. | | | | | | | | |
4.30%, 6/1/25 | | | 135,830,000 | | | | 145,077,243 | |
6.50%, 2/1/37 | | | 50,861,000 | | | | 61,035,897 | |
6.95%, 1/15/38 | | | 92,139,000 | | | | 118,041,973 | |
6.50%, 9/1/39 | | | 72,546,000 | | | | 89,214,037 | |
5.00%, 8/15/42 | | | 78,782,000 | | | | 83,148,504 | |
5.00%, 3/1/43 | | | 86,308,000 | | | | 90,426,798 | |
5.50%, 3/1/44 | | | 96,910,000 | | | | 109,370,238 | |
5.40%, 9/1/44 | | | 69,297,000 | | | | 76,739,812 | |
Macy’s, Inc. | | | | | | | | |
6.90%, 4/1/29 | | | 30,383,000 | | | | 33,018,108 | |
6.70%, 7/15/34 | | | 77,960,000 | | | | 85,915,582 | |
4.50%, 12/15/34 | | | 95,617,000 | | | | 86,848,126 | |
6.375%, 3/15/37 | | | 21,354,000 | | | | 22,203,716 | |
Naspers, Ltd. (South Africa) | | | | | | | | |
6.00%, 7/18/20(b) | | | 220,010,000 | | | | 226,411,851 | |
5.50%, 7/21/25(b) | | | 347,931,000 | | | | 379,175,204 | |
4.85%, 7/6/27(b) | | | 140,217,000 | | | | 149,778,397 | |
Nordstrom, Inc.
6.95%, 3/15/28 | | | 20,107,000 | | | | 23,653,596 | |
RELX PLC (United Kingdom) | | | | | | | | |
3.125%, 10/15/22 | | | 146,687,000 | | | | 149,306,756 | |
3.50%, 3/16/23 | | | 64,115,000 | | | | 66,187,873 | |
4.00%, 3/18/29 | | | 59,330,000 | | | | 62,656,205 | |
TC Energy Corp. (Canada) | | | | | | | | |
5.625%, 5/20/75(a)(f) | | | 237,639,000 | | | | 235,134,285 | |
5.875%, 8/15/76(a)(f) | | | 84,536,000 | | | | 86,767,750 | |
5.30%, 3/15/77(a)(f) | | | 282,129,000 | | | | 270,955,986 | |
Telecom Italia SPA (Italy) | | | | | | | | |
5.303%, 5/30/24(b) | | | 300,679,000 | | | | 311,202,765 | |
7.20%, 7/18/36 | | | 61,253,000 | | | | 67,531,433 | |
7.721%, 6/4/38 | | | 163,602,000 | | | | 184,461,255 | |
The Walt Disney Co. | | | | | | | | |
6.20%, 12/15/34(b) | | | 14,795,000 | | | | 20,045,860 | |
6.40%, 12/15/35(b) | | | 49,525,000 | | | | 67,872,259 | |
6.15%, 3/1/37(b) | | | 31,905,000 | | | | 43,310,170 | |
6.65%, 11/15/37(b) | | | 79,075,000 | | | | 113,526,101 | |
6.15%, 2/15/41(b) | | | 49,083,000 | | | | 68,196,549 | |
Ultrapar Participacoes SA (Brazil) | |
5.25%, 10/6/26(b) | | | 151,950,000 | | | | 158,977,688 | |
5.25%, 6/6/29(b) | | | 137,300,000 | | | | 140,389,250 | |
Union Pacific Corp. | | | | | | | | |
7.60%, 1/2/20 | | | 181,000 | | | | 184,023 | |
6.061%, 1/17/23 | | | 1,939,227 | | | | 2,151,923 | |
4.698%, 1/2/24 | | | 1,514,664 | | | | 1,602,413 | |
5.082%, 1/2/29 | | | 4,543,417 | | | | 4,933,566 | |
5.866%, 7/2/30 | | | 27,944,412 | | | | 31,678,840 | |
6.176%, 1/2/31 | | | 24,736,369 | | | | 28,828,235 | |
United Technologies Corp. | | | | | | | | |
3.35%, 8/16/21 | | | 44,860,000 | | | | 45,845,015 | |
3.65%, 8/16/23 | | | 180,430,000 | | | | 188,886,480 | |
Verizon Communications, Inc. | | | | | | | | |
4.272%, 1/15/36 | | | 166,472,000 | | | | 180,152,761 | |
4.522%, 9/15/48 | | | 213,601,000 | | | | 238,569,575 | |
5.012%, 4/15/49 | | | 480,632,000 | | | | 571,753,589 | |
Vodafone Group PLC (United Kingdom)
7.00%, 4/4/79(a)(f) | | | 201,235,000 | | | | 217,201,876 | |
Xerox Corp. | | | | | | | | |
5.625%, 12/15/19 | | | 87,407,000 | | | | 88,281,070 | |
2.75%, 9/1/20 | | | 22,690,000 | | | | 22,572,012 | |
4.50%, 5/15/21 | | | 100,501,000 | | | | 102,604,486 | |
4.07%, 3/17/22 | | | 2,349,000 | | | | 2,363,681 | |
| | | | | | | | |
| | |
| | | PAR VALUE | | | VALUE | |
Zoetis, Inc. | | | | | | | | |
3.45%, 11/13/20 | | $ | 39,377,000 | | | $ | 39,869,279 | |
4.50%, 11/13/25 | | | 166,139,000 | | | | 182,203,169 | |
| | | | | | | | |
| | | | | | | 15,200,062,716 | |
UTILITIES: 1.8% | |
Dominion Energy, Inc. | | | | | | | | |
2.962%, 7/1/19 | | | 10,000,000 | | | | 10,000,000 | |
2.579%, 7/1/20 | | | 32,099,000 | | | | 32,051,201 | |
4.104%, 4/1/21 | | | 97,451,000 | | | | 99,753,508 | |
5.75%, 10/1/54(a)(f) | | | 232,036,000 | | | | 241,085,404 | |
Enel SPA (Italy) | | | | | | | | |
4.25%, 9/14/23(b) | | | 60,000,000 | | | | 62,981,763 | |
4.625%, 9/14/25(b) | | | 175,588,000 | | | | 188,378,903 | |
3.625%, 5/25/27(b) | | | 38,125,000 | | | | 38,282,150 | |
6.80%, 9/15/37(b) | | | 174,509,000 | | | | 221,770,506 | |
6.00%, 10/7/39(b) | | | 157,024,000 | | | | 186,038,277 | |
| | | | | | | | |
| | | | | | | 1,080,341,712 | |
| | | | | | | | |
| | | | | | | 24,735,570,363 | |
| | | | | | | | |
TOTAL DEBT SECURITIES
(Cost $56,534,144,857) | | | $ | 58,631,430,199 | |
| | |
| See accompanying Notes to Financial Statements | | DODGE & COX INCOME FUND§PAGE 13 |
| | | | |
| PORTFOLIO OF INVESTMENTS (unaudited) | | | June 30, 2019 | |
| | | | | | | | |
| SHORT-TERM INVESTMENTS: 2.1% | |
| | |
| | | PAR VALUE/
SHARES | | | VALUE | |
REPURCHASE AGREEMENTS: 1.0% | |
Bank of Montreal(c)
2.45%, dated 6/28/19, due 7/1/19,
maturity value $72,314,761 | | $ | 72,300,000 | | | $ | 72,300,000 | |
Fixed Income Clearing Corporation(c)
1.60%, dated 6/28/19, due 7/1/19,
maturity value $363,414,449 | | | 363,366,000 | | | | 363,366,000 | |
Royal Bank of Canada(c)
2.47%, dated 6/28/19, due 7/1/19,
maturity value $192,939,705 | | | 192,900,000 | | | | 192,900,000 | |
| | | | | | | | |
| | | | | | | 628,566,000 | |
MONEY MARKET FUND: 0.4% | |
State Street Institutional U.S. Government Money Market Fund | | | 238,213,507 | | | | 238,213,507 | |
|
TREASURY BILL: 0.7% | |
U.S. Treasury Bill
9/26/19 | | | 400,000,000 | | | | 397,984,499 | |
| | | | | | | | |
TOTAL SHORT-TERM INVESTMENTS
(Cost $1,264,764,006) | | | $ | 1,264,764,006 | |
| | | | | | | | |
TOTAL INVESTMENTS IN SECURITIES
(Cost $57,798,908,863) | | | 100.4 | % | | $ | 59,896,194,205 | |
OTHER ASSETS LESS LIABILITIES | | | (0.4 | %) | | | (275,015,465 | ) |
| | | | | | | | |
| NET ASSETS | | | 100.0 | % | | $ | 59,621,178,740 | |
| | | | | | | | |
| (a) | Hybrid security has characteristics of both a debt and equity security. |
| (b) | Security exempt from registration under Rule 144A of the Securities Act of 1933. The security may be resold in transactions exempt from registration, normally to qualified institutional buyers. |
| (c) | Repurchase agreements are collateralized by: |
Bank of Montreal: U.S. Treasury Bill 8/15/19, U.S. Treasury Notes2.00%-3.00%,5/31/24-5/15/47, and U.S. Treasury Inflation Indexed Notes0.875%-2.125%,1/15/29-2/15/46. Total collateral value is $73,761,076.
Fixed Income Clearing Corporation: U.S. Treasury Note 2.625%, 6/15/21. Total collateral value is $370,634,222.
Royal Bank of Canada: U.S. Treasury Notes1.625%-1.875%,9/30/22-5/15/26. Total collateral value is $196,798,571.
| (d) | Subsidiary (see below) |
| (e) | Variable rate security: interest rate is determined by the interest rates of underlying pool of assets that collateralize the security. The interest rate of the security may change due to a change in the interest rates or the composition of underlying pool of assets. The interest rate shown is the rate as of period end. |
| (f) | Variable rate security:fixed-to-float security pays an initial fixed interest rate and will pay a floating interest rate established at a predetermined time in the future. The interest rate shown is the rate as of period end. |
Debt securities are grouped by parent company unless otherwise noted. Actual securities may be issued by the listed parent company or one of its subsidiaries. In determining a parent company’s country designation, the Fund generally references the country of incorporation.
Debt securities with floating interest rates are linked to the referenced benchmark; the interest rate shown is the rate as of period end.
ARM: Adjustable Rate Mortgage
CMBS: Commercial Mortgage-Backed Security
CMO: Collateralized Mortgage Obligation
CMT: Constant Maturity Treasury
DUS: Delegated Underwriting and Servicing
GO: General Obligation
RB: Revenue Bond
REMIC: Real Estate Mortgage Investment Conduit
| | |
| PAGE 14§ DODGE & COX INCOME FUND | | See accompanying Notes to Financial Statements |
| | | | |
STATEMENT OF ASSETS AND LIABILITIES | |
(unaudited) | |
| |
| | | June 30, 2019 | |
ASSETS: | | | | |
Investments in securities, at value (cost $57,798,908,863) | | $ | 59,896,194,205 | |
Receivable for investments sold | | | 169,941,405 | |
Receivable for Fund shares sold | | | 94,830,491 | |
Interest receivable | | | 447,230,491 | |
Prepaid expenses and other assets | | | 65,952 | |
| | | | |
| | | 60,608,262,544 | |
| | | | |
LIABILITIES: | | | | |
Payable for investments purchased | | | 873,003,049 | |
Payable for Fund shares redeemed | | | 91,261,251 | |
Management fees payable | | | 19,432,464 | |
Accrued expenses | | | 3,387,040 | |
| | | | |
| | | 987,083,804 | |
| | | | |
NET ASSETS | | $ | 59,621,178,740 | |
| | | | |
NET ASSETS CONSIST OF: | | | | |
Paid in capital | | $ | 57,494,752,091 | |
Total distributable earnings | | | 2,126,426,649 | |
| | | | |
| | $ | 59,621,178,740 | |
| | | | |
Fund shares outstanding (par value $0.01 each, unlimited shares authorized) | | | 4,286,615,644 | |
Net asset value per share | | $ | 13.91 | |
|
STATEMENT OF OPERATIONS | |
(unaudited) | | | | |
| |
| | | Six Months Ended
June 30, 2019 | |
INVESTMENT INCOME: | | | | |
Dividends | | $ | 19,459,736 | |
Interest | | | 1,051,246,182 | |
| | | | |
| | | 1,070,705,918 | |
| | | | |
EXPENSES: | | | | |
Management fees | | | 112,279,338 | |
Custody and fund accounting fees | | | 395,533 | |
Transfer agent fees | | | 3,572,797 | |
Professional services | | | 135,612 | |
Shareholder reports | | | 1,320,172 | |
Registration fees | | | 581,768 | |
Trustees’ fees | | | 170,833 | |
Miscellaneous | | | 312,950 | |
| | | | |
| | | 118,769,003 | |
| | | | |
NET INVESTMENT INCOME | | | 951,936,915 | |
| | | | |
REALIZED AND UNREALIZED GAIN (LOSS): | | | | |
Net realized gain (loss) | | | | |
Investments in securities | | | 96,331,847 | |
Futures contracts | | | (65,402,334 | ) |
Net change in unrealized appreciation/depreciation | | | | |
Investments in securities | | | 2,610,694,938 | |
Futures contracts | | | 27,176,840 | |
| | | | |
Net realized and unrealized gain (loss) | | | 2,668,801,291 | |
| | | | |
NET CHANGE IN NET ASSETS FROM OPERATIONS | | $ | 3,620,738,206 | |
| | | | |
| | | | | | | | |
STATEMENT OF CHANGES IN NET ASSETS | |
(unaudited) | | | | | |
| | |
| | | Six Months Ended June 30, 2019 | | | Year Ended December 31, 2018 | |
OPERATIONS: | | | | | | | | |
Net investment income | | $ | 951,936,915 | | | $ | 1,688,153,909 | |
Net realized gain (loss) | | | 30,929,513 | | | | 67,886,229 | |
Net change in unrealized appreciation/depreciation | | | 2,637,871,778 | | | | (1,942,972,195 | ) |
| | | | | | | | |
| | | 3,620,738,206 | | | | (186,932,057 | ) |
| | | | | | | | |
| | |
DISTRIBUTIONS TO SHAREHOLDERS: | | | | | | | | |
Total distributions | | | (921,337,732 | ) | | | (1,887,086,223 | ) |
| | |
FUND SHARE TRANSACTIONS: | | | | | | | | |
Proceeds from sale of shares | | | 8,460,818,695 | | | | 14,058,784,954 | |
Reinvestment of distributions | | | 794,698,812 | | | | 1,568,832,950 | |
Cost of shares redeemed | | | (6,647,360,023 | ) | | | (13,526,739,100 | ) |
| | | | | | | | |
Net change from Fund share transactions | | | 2,608,157,484 | | | | 2,100,878,804 | |
| | | | | | | | |
Total change in net assets | | | 5,307,557,958 | | | | 26,860,524 | |
| | |
NET ASSETS: | | | | | | | | |
Beginning of period | | | 54,313,620,782 | | | | 54,286,760,258 | |
| | | | | | | | |
End of period | | $ | 59,621,178,740 | | | $ | 54,313,620,782 | |
| | | | | | | | |
| | |
SHARE INFORMATION: | | | | | | | | |
Shares sold | | | 621,738,660 | | | | 1,043,147,794 | |
Distributions reinvested | | | 57,750,116 | | | | 117,588,178 | |
Shares redeemed | | | (489,462,978 | ) | | | (1,008,309,102 | ) |
| | | | | | | | |
Net change in shares outstanding | | | 190,025,798 | | | | 152,426,870 | |
| | | | | | | | |
| | |
| See accompanying Notes to Financial Statements | | DODGE & COX INCOME FUND§PAGE 15 |
NOTES TO FINANCIAL STATEMENTS(unaudited)
NOTE 1—ORGANIZATION AND SIGNIFICANT ACCOUNTING POLICIES
Dodge & Cox Income Fund (the “Fund”) is one of the series constituting the Dodge & Cox Funds (the “Trust” or the “Funds”). The Trust is organized as a Delaware statutory trust and is registered under the Investment Company Act of 1940, as amended, as anopen-end management investment company. The Fund commenced operations on January 3, 1989, and seeks high and stable current income consistent with long-term preservation of capital. Risk considerations and investment strategies of the Fund are discussed in the Fund’s Prospectus.
The Fund is an investment company and follows the accounting and reporting guidance issued in Topic 946 by the Financial Accounting Standards Board. The financial statements have been prepared in conformity with accounting principles generally accepted in the United States of America, which require the use of estimates and assumptions by management. Actual results may differ from those estimates. Significant accounting policies are as follows:
Security valuation The Fund’s net assets are normally valued as of the scheduled close of trading on the New York Stock Exchange (NYSE), generally 4 p.m. Eastern Time, each day that the NYSE is open for business.
Debt securities and derivatives traded over the counter are valued using prices received from independent pricing services which utilize dealer quotes, recent transaction data, pricing models, and other inputs to arrive at market-based valuations. Pricing models may consider quoted prices for similar securities, interest rates, cash flows (including prepayment speeds), and credit risk. Exchange-traded derivatives are valued at the settlement price determined by the relevant exchange. Short-term securities less than 60 days to maturity may be valued at amortized cost if amortized cost approximates current value. Mutual funds are valued at their respective net asset values. Security values are not discounted based on the size of the Fund’s position and may differ from the value a Fund receives upon sale of the securities. All securities held by the Fund are denominated in U.S. dollars.
If market quotations are not readily available or if normal valuation procedures produce valuations that are deemed unreliable or inappropriate under the circumstances existing at the time, the investment will be valued at fair value as determined in good faith by or under the direction of the Fund’s Board of Trustees. The Board of Trustees has appointed Dodge & Cox, the Fund’s investment manager, to make fair value determinations in accordance with the Dodge & Cox Funds Valuation Policies (“Valuation Policies”), subject to Board oversight. Dodge & Cox has established a Pricing Committee that is comprised of representatives from Treasury, Legal, Compliance, and Operations. The Pricing Committee is responsible for implementing the Valuation Policies, including determining the fair value of securities and other investments when necessary. The Pricing Committee considers relevant indications of value that are reasonably available to it in determining the fair value assigned to a particular security, such as the value of similar financial instruments, trading volumes, contractual restrictions on disposition, related corporate actions, and changes in economic
conditions. In doing so, the Pricing Committee employs various methods for calibrating fair valuation approaches, including a regular review of key inputs and assumptions, back-testing, and review of any related market activity.
Valuing securities through a fair value determination involves greater reliance on judgment than valuation of securities based on readily available market quotations. In some instances, lack of information and uncertainty as to the significance of information may lead to a conclusion that a prior valuation is the best indication of a security’s value. When fair value pricing is employed, the prices of securities used by the Fund to calculate its net asset value may differ from quoted or published prices for the same securities.
Security transactions, investment income, expenses, and distributions Security transactions are recorded on the trade date. Realized gains and losses on securities sold are determined on the basis of identified cost.
Interest income is recorded on the accrual basis. Interest income includes coupon interest, amortization of premium and accretion of discount on debt securities, and gain/loss on paydowns. The ability of the issuers of the debt securities held by the Fund to meet their obligations may be affected by economic developments in a specific industry, state, or region. Debt obligations may be placed onnon-accrual status and related interest income may be reduced by ceasing current accruals and writing off interest receivables when the collection of all or a portion of interest has become doubtful. A debt obligation is removed fromnon-accrual status when the issuer resumes interest payments or when collectibility of interest is reasonably assured. Dividend income is recorded on the ex-dividend date.
Expenses are recorded on the accrual basis. Some expenses of the Trust can be directly attributed to a specific series. Expenses which cannot be directly attributed are allocated among the Funds in the Trust using methodologies determined by the nature of the expense.
Distributions to shareholders are recorded on theex-dividend date.
Repurchase agreements Repurchase agreements are transactions under which a Fund purchases a security from a dealer counterparty and agrees to resell the security to that counterparty on a specified future date at the same price, plus a specified interest rate. The Fund’s repurchase agreements are secured by U.S. government or agency securities, the fair value of which exceeds the principal amount of the repurchase transaction, including accrued interest, at all times. The Fund maintains custody of the underlying collateral securities, either through its regular custodian or through a third party custodian that maintains separate accounts for both the Fund and its counterparties. In the event of default by the counterparty, the Fund has the contractual right to liquidate the securities and to apply the proceeds in satisfaction of the obligation.
Futures contracts Futures contracts involve an obligation to purchase or sell (depending on whether the Fund has entered a long or short futures contract, respectively) an asset at a future date, at a price set at the time of the contract. Upon entering into a futures contract, the Fund is required to deposit an amount of
PAGE 16§ DODGE & COX INCOME FUND
NOTES TO FINANCIAL STATEMENTS(unaudited)
cash or liquid assets (referred to as initial margin) in a segregated account with the clearing broker. Subsequent payments (referred to as variation margin) to and from the clearing broker are made on a daily basis based on changes in the market value of futures contracts. Futures contracts are traded publicly and their market value changes daily. Changes in the market value of open futures contracts are recorded as unrealized appreciation or depreciation in the Statement of Operations. Realized gains and losses on futures contracts are recorded in the Statement of Operations at the closing or expiration of the contracts. Cash deposited with a broker as initial margin is recorded in the Statement of Assets and Liabilities. A receivable and/or payable to brokers for daily variation margin is also recorded in the Statement of Assets and Liabilities.
Investments in futures contracts may include certain risks, which may be different from, and potentially greater than, those of the underlying securities. To the extent the Fund uses futures, it is exposed to additional volatility and potential losses resulting from leverage.
The Fund entered into short Treasury futures contracts to assist with the management of the portfolio’s interest rate exposure. During the six months ended June 30, 2019, these Treasury futures contracts had notional values up to 1% of net assets.
Indemnification Under the Trust’s organizational documents, its officers and trustees are indemnified against certain liabilities arising out of the performance of their duties to the Trust. In addition, in the normal course of business the Trust enters into contracts that provide general indemnities to other parties. The Trust’s maximum exposure under these arrangements is unknown as this would involve future claims that may be made against the Trust that have not yet occurred.
NOTE 2—VALUATION MEASUREMENTS
Various inputs are used in determining the value of the Fund’s investments. These inputs are summarized in the three broad levels listed below.
| § | | Level 1: Quoted prices in active markets for identical securities |
| § | | Level 2: Other significant observable inputs (including quoted prices for similar securities, market indices, interest rates, credit risk, forward exchange rates, etc.) |
| § | | Level 3: Significant unobservable inputs (including Fund management’s assumptions in determining the fair value of investments) |
The inputs or methodology used for valuing securities are not necessarily an indication of the risk associated with investing in those securities.
The following is a summary of the inputs used to value the Fund’s holdings at June 30, 2019:
| | | | | | | | |
| Classification | | LEVEL 1 (Quoted Prices) | | | LEVEL 2 (Other Significant
Observable Inputs) | |
Securities | | | | | | | | |
Debt Securities | | | | | | | | |
U.S. Treasury | | $ | — | | | $ | 4,235,979,549 | |
Government-Related | | | — | | | | 3,253,667,653 | |
Securitized | | | — | | | | 26,406,212,634 | |
Corporate | | | — | | | | 24,735,570,363 | |
Short-term Investments | | | | | | | | |
Repurchase Agreements | | | — | | | | 628,566,000 | |
Money Market Fund | | | 238,213,507 | | | | — | |
Treasury Bill | | | — | | | | 397,984,499 | |
| | | | | | | | |
Total Securities | | $ | 238,213,507 | | | $ | 59,657,980,698 | |
| | | | | | | | |
| | | | | | | | | |
NOTE 3—RELATED PARTY TRANSACTIONS
Management fees Under a written agreement approved by a unanimous vote of the Board of Trustees, the Fund pays a management fee monthly at an annual rate of 0.50% of the Fund’s average daily net assets up to $100 million and 0.40% of the Fund’s average daily net assets in excess of $100 million to Dodge & Cox, investment manager of the Fund. The agreement further provides that Dodge & Cox shall waive its fee to the extent that such fee plus all other ordinary operating expenses of the Fund exceed 1% of the average daily net assets for the year.
Fund officers and trustees All officers and two of the trustees of the Trust are officers or employees of Dodge & Cox. The Trust pays a fee only to those trustees who are not affiliated with Dodge & Cox.
NOTE 4—INCOME TAX INFORMATION AND DISTRIBUTIONS TO SHAREHOLDERS
A provision for federal income taxes is not required since the Fund intends to continue to qualify as a regulated investment company under Subchapter M of the Internal Revenue Code and distribute all of its taxable income to shareholders. Distributions are determined in accordance with income tax regulations, and such amounts may differ from net investment income and realized gains for financial reporting purposes. The Fund may also designate a portion of the amount paid to redeeming shareholders as a distribution for tax purposes. Financial reporting records are adjusted for permanent book to tax differences at year end to reflect tax character. Book to tax differences are primarily due to differing treatments of wash sales, net short-term realized gain (loss), derivatives, and distributions.
DODGE & COX INCOME FUND§PAGE 17
NOTES TO FINANCIAL STATEMENTS(unaudited)
Distributions during the periods noted below were characterized as follows for federal income tax purposes:
| | | | | | | | |
| | | Six Months Ended June 30, 2019 | | | Year Ended December 31, 2018 | |
Ordinary income | | $ | 921,337,732 | | | $ | 1,653,646,376 | |
| | ($ | 0.220 per share | ) | | ($ | 0.398 per share | ) |
Long-term capital gain | | | — | | | $ | 233,439,847 | |
| | | | | | ($ | 0.057 per share | ) |
The components of distributable earnings on a tax basis are reported as of the Fund’s most recent year end. At December 31, 2018, the tax basis components of distributable earnings were as follows:
| | | | |
Undistributed ordinary income | | $ | 11,346,654 | |
Deferred loss(a) | | | (70,637,963 | ) |
At June 30, 2019, unrealized appreciation and depreciation for investments and derivatives based on cost for federal income tax purposes were as follows:
| | | | |
Tax cost | | $ | 57,798,921,329 | |
| | | | |
Unrealized appreciation | | | 2,348,263,663 | |
Unrealized depreciation | | | (250,990,787 | ) |
| | | | |
Net unrealized appreciation | | | 2,097,272,876 | |
| | | | | |
| (a) | Represents net realized capital loss incurred between November 1, 2018 and December 31, 2018. As permitted by tax regulation, the Fund has elected to treat this loss as arising in 2019. |
Fund management has reviewed the tax positions for open periods (three years and four years, respectively, from filing the Fund’s Federal and State tax returns) as applicable to the Fund, and has determined that no provision for income tax is required in the Fund’s financial statements.
NOTE 5—LOAN FACILITIES
Pursuant to an exemptive order issued by the Securities and Exchange Commission (SEC), the Fund may participate in an interfund lending facility (Facility). The Facility allows the Fund to borrow money from or loan money to the Funds. Loans under the Facility are made for temporary or emergency purposes, such as to fund shareholder redemption requests. Interest on borrowings is the average of the current repurchase agreement rate and the bank loan rate. There was no activity in the Facility during the period.
All Funds in the Trust participate in a $500 million committed credit facility (Line of Credit) with State Street Bank and Trust Company, to be utilized for temporary or emergency purposes to fund shareholder redemptions or for other short-term liquidity purposes. The maximum amount available to the Fund is $250 million. Each Fund pays an annual commitment fee on itspro-rata portion of the Line of Credit. For the six months ended June 30, 2019, the Fund’s commitment fee amounted to $182,463 and is reflected as a Miscellaneous Expense in the Statement of Operations. Interest on borrowings is charged at the prevailing rate. There were no borrowings on the Line of Credit during the period.
NOTE 6—PURCHASES AND SALES OF INVESTMENTS
For the six months ended June 30, 2019, purchases and sales of securities, other than short-term securities and U.S. government securities, aggregated $2,188,315,701 and $2,553,149,099 respectively. For the six months ended June 30, 2019, purchases and sales of U.S. government securities aggregated $6,989,387,970 and $6,079,994,762 respectively.
NOTE 7—NEW ACCOUNTING GUIDANCE
In March 2017, the Financial Accounting Standards Board issued an update to amend the amortization period for certain purchased callable debt securities held at a premium. The amendments shorten the amortization period for premiums to the earliest call date, but do not require an accounting change for securities held at a discount. The amendments are effective for financial statements for fiscal years beginning after December 15, 2018, and interim periods within those fiscal years. The Fund’s adoption of the updated accounting standards on January 1, 2019 did not have a material impact on the Fund’s financial statements.
NOTE 8—SUBSEQUENT EVENTS
Fund management has determined that no material events or transactions occurred subsequent to June 30, 2019, and through the date of the Fund’s financial statements issuance, which require additional disclosure in the Fund’s financial statements.
PAGE 18§ DODGE & COX INCOME FUND
FINANCIAL HIGHLIGHTS(unaudited)
| | | | | | | | | | | | | | | | | | | | | | | | |
SELECTED DATA AND RATIOS (for a share outstanding throughout each period) | | Six Months
Ended June 30, | | | Year Ended December 31, | |
| | | 2019 | | | 2018 | | | 2017 | | | 2016 | | | 2015 | | | 2014 | |
| | | | | | | | |
Net asset value, beginning of period | | | $13.26 | | | | $13.76 | | | | $13.59 | | | | $13.29 | | | | $13.78 | | | | $13.53 | |
Income from investment operations: | | | | | | | | | | | | | | | | | | | | | | | | |
Net investment income | | | 0.22 | | | | 0.41 | | | | 0.38 | | | | 0.42 | | | | 0.40 | | | | 0.39 | |
Net realized and unrealized gain (loss) | | | 0.65 | | | | (0.45 | ) | | | 0.21 | | | | 0.32 | | | | (0.48 | ) | | | 0.35 | |
| | | | | | | | |
Total from investment operations | | | 0.87 | | | | (0.04 | ) | | | 0.59 | | | | 0.74 | | | | (0.08 | ) | | | 0.74 | |
| | | | | | | | |
Distributions to shareholders from: | | | | | | | | | | | | | | | | | | | | | | | | |
Net investment income | | | (0.22 | ) | | | (0.40 | ) | | | (0.38 | ) | | | (0.42 | ) | | | (0.40 | ) | | | (0.39 | ) |
Net realized gain | | | — | | | | (0.06 | ) | | | (0.04 | ) | | | (0.02 | ) | | | (0.01 | ) | | | (0.10 | ) |
| | | | | | | | |
Total distributions | | | (0.22 | ) | | | (0.46 | ) | | | (0.42 | ) | | | (0.44 | ) | | | (0.41 | ) | | | (0.49 | ) |
| | | | | | | | |
Net asset value, end of period | | | $13.91 | | | | $13.26 | | | | $13.76 | | | | $13.59 | | | | $13.29 | | | | $13.78 | |
| | | | | | | | |
Total return | | | 6.59 | % | | | (0.31 | )% | | | 4.36 | % | | | 5.62 | % | | | (0.59 | )% | | | 5.48 | % |
Ratios/supplemental data: | | | | | | | | | | | | | | | | | | | | | | | | |
Net assets, end of period (millions) | | | $59,621 | | | | $54,314 | | | | $54,287 | | | | $46,632 | | | | $43,125 | | | | $39,128 | |
Ratio of expenses to average net assets | | | 0.42 | %(a) | | | 0.42 | % | | | 0.43 | % | | | 0.43 | % | | | 0.43 | % | | | 0.44 | % |
Ratio of net investment income to average net assets | | | 3.39 | %(a) | | | 3.02 | % | | | 2.80 | % | | | 3.11 | % | | | 2.97 | % | | | 2.89 | % |
Portfolio turnover rate | | | 16 | % | | | 37 | % | | | 19 | % | | | 27 | % | | | 24 | % | | | 27 | % |
See accompanying Notes to Financial Statements
FUND HOLDINGS
The Fund provides a complete list of its holdings on a quarterly basis by filing the lists with the SEC on Form N-CSR (as of the end of the second and fourth quarters) and on Part F of Form N-PORT (as of the end of the first and third quarters). Shareholders may view the Fund’s Form N-CSR and Part F of Form N-PORT on the SEC’s website at sec.gov. A list of the Fund’s quarter-end holdings is also available at dodgeandcox.com on or about the 15th day following each quarter end and remains available on the website until the list is updated for the subsequent quarter.
PROXY VOTING
For a free copy of the Fund’s proxy voting policies and procedures, please call 800-621-3979, visit the Fund’s website at dodgeandcox.com, or visit the SEC’s website at sec.gov. Information regarding how the Fund voted proxies relating to portfolio securities during the most recent 12-month period ending June 30 is also available at dodgeandcox.com or at sec.gov.
HOUSEHOLD MAILINGS
The Fund routinely mails shareholder reports and summary prospectuses to shareholders and, on occasion, proxy statements. In order to reduce the volume of mail, when possible, only one copy of these documents will be sent to shareholders who are part of the same family and share the same residential address.
If you have a direct account with the Funds and you do not want the mailing of shareholder reports and summary prospectuses combined with other members in your household, contact the Funds at800-621-3979. Your request will be implemented within 30 days.
DODGE & COX INCOME FUND§PAGE 19
dodgeandcox.com
For Fund literature, transactions, and account
information, please visit the Funds’ website.
or write or call:
DODGE & COX FUNDS
c/o DST Asset Manager Solutions, Inc.
P.O. Box 219502
Kansas City, Missouri 64121-9502
(800) 621-3979
INVESTMENT MANAGER
Dodge & Cox
555 California Street, 40th Floor
San Francisco, California 94104
(415) 981-1710
This report is submitted for the general information of the shareholders of the Fund. The report is not authorized for distribution to prospective investors in the Fund unless it is accompanied by a current prospectus.
This report reflects our views, opinions, and portfolio holdings as of June 30, 2019, the end of the reporting period. Any such views are subject to change at any time based upon market or other conditions and Dodge & Cox disclaims any responsibility to update such views. These views may not be relied on as investment advice and, because investment decisions for a Dodge & Cox Fund are based on numerous factors, may not be relied on as an indication of trading intent on behalf of any Dodge & Cox Fund.

DODGE & COX FUNDS®
Semi-Annual Report
June 30, 2019
Global Bond Fund
ESTABLISHED 2014
TICKER: DODLX
Important Notice:
Beginning on January 1, 2021, we intend to discontinue mailing paper copies of the Fund’s shareholder reports as permitted by new regulations adopted by the Securities and Exchange Commission, unless you specifically request paper copies from Dodge & Cox Funds or from your financial intermediary, such as a broker-dealer or bank. The reports will remain available to you on the Dodge & Cox Funds website (dodgeandcox.com), and you will be notified by mail each time a report is posted and provided with a link to access the report.
If you have already elected to receive shareholder reports electronically, you will not be affected by this change and do not need to take any action. If you have not done so already, you may elect to receive shareholder reports and other communications electronically by enrolling in e-delivery on the Funds website, or, if you are invested through a financial intermediary, by updating your mailing preferences through the intermediary.
If you wish to continue receiving paper copies of all future shareholder reports, please contact us at (800) 621-3979. Reports will be provided to you free of charge. If you are invested through a financial intermediary, you may contact your financial intermediary to request to receive paper copies. Your election to receive reports in paper form will apply to all funds held with Dodge & Cox Funds or through your financial intermediary, as applicable.
6/19 GBF SAR  Printed on recycled paper
TO OUR SHAREHOLDERS
The Dodge & Cox Global Bond Fund had a total return of 8.1% for the six months ended June 30, 2019, compared to 5.6% for the Bloomberg Barclays Global Aggregate Bond Index (Bloomberg Barclays Global Agg).
MARKET COMMENTARY
The negative risk sentiment that permeated markets late in 2018 dissipated during the first half of 2019 as central banks took center stage, signaling the potential for easier monetary policy in response to decelerating growth, subdued inflation, and lingering geopolitical uncertainties. The resulting decline in government bond yields, narrowing of credit yield premiums,(a) and strengthening of select emerging market currencies led to the Fund’s strong performance.
In the United States, the economic expansion—already the longest on record since at least the 1850s—showed signs of deceleration as manufacturing and confidence indicators fell short of expectations, while employment numbers were mixed. The U.S. yield curve inverted in March—as measured by the difference in yields between the10-year Treasury bond and the3-month Treasury bill—intensifying recession concerns among some investors. Market expectations for federal funds rates shifted meaningfully downward (from no expected changes to one or two cuts in 2019) after the Federal Reserve signaled its willingness to support the economy through near-term rate cuts. The10-year U.S. Treasury yield declined by 68 basis points(b) to 2.0%, its lowest level since before the 2016 U.S. Presidential election.
Interest rates generally declined across the world as major central banks, including the European Central Bank (ECB), the Bank of Japan, and the Reserve Bank of Australia, assumed an accommodative stance. The ECB initially pushed back the timing of a planned rate hike to beyond 2019, and later committed to a series of new easing measures including a potential tiered rate cut that would push its policy rate deeper into negative territory and possible expansions of its asset purchase program. These moves came amidst weaker economic data in Europe, with the German manufacturing sector facing a persistent slowdown during the period. As a result,10-year yields in Europe fell anywhere from 57 basis points in Germany to over 100 basis points in Spain. Likewise,10-year interest rates in many emerging market countries (e.g., Brazil, Mexico, Russia) fell significantly.
Corporate bond markets responded positively to the prospect of easier monetary policy. Credit yield premiums, narrowed significantly during the first half of the year, with lower-rated issuers such asBBB-rated corporates outperformingA-rated corporates. UK bank securities also performed well, despite the resignation of Prime Minister Theresa May and a succession struggle that reignited concerns of a“no-deal” Brexit.
Jousting between the United States and China over international trade continued to generate headlines, though tensions appeared to ease in late June with a joint announcement that negotiations would resume. Uncertainty, however, has begun to affect trade volumes and is leading companies to shift supply
chains and postpone investment decisions, the downstream effects of which are being felt in the global deceleration of growth. Despite this, the U.S. dollar index has barely moved in 2019, and currency volatility has been quite subdued outside of a few emerging market currencies.
INVESTMENT STRATEGY
In May, the Global Bond Fund completed its fifth year as a publicly offered fund. Our investment philosophy remains anchored in detailed fundamental research, valuation discipline, and a long-term outlook. We believe this philosophy and our highly experienced team positions the Fund to provide strong long-term returns to investors.
The excellentyear-to-date returns of the Fund have been driven by the three key investment levers in the fund: credit, currency, and rates. The additions we made to selected corporate and emerging market government bonds during the tumult of the latter half of 2018 enhanced the Fund’s recent performance. As always, valuation discipline is a key pillar of our investment philosophy and as valuations rebounded this year, we subsequently reduced the Fund’s allocation to credit and modestly reduced a few emerging market currency positions.
Rates: How Low Can You Go?
The fall in global yields provided a strong performance boost to the Fund, but returns us to alow-yield world that, other things being equal, tempers expected future returns. In this yield environment, we believe our active, opportunistic investment approach to global bond investing is critical. With a yield of 1.5%(c) and a duration(d) of seven years, the Bloomberg Barclays Global Agg features low income levels and high price sensitivity to even small rate increases. Furthermore, over $10 trillion in global debt is negative yielding. The Fund continued to avoid investing in low or negative-yielding developed market government bonds and has instead focused on higher-yielding geographies or sectors with potentially higher return prospects. Furthermore, the duration of the Fund’s U.S. dollar denominated holdings is a moderate three years, stemming from our limited appetite for interest rate risk. Our expectations for Fed rate cuts are below those of the market, and we believe a defensive positionvis-à-vis interest rates is prudent.
One rates market in which we are finding value is Thailand, where we recently increased the Fund’s holdings of inflation-linked government bonds maturing in 2028. Real (i.e., inflation-adjusted) yields in Thailand are currently significantly higher than in the United States and other developed economies. Given ongoing United States-China trade tensions and slowing global growth, we expect Thailand’s growth to slow, supporting lower interest rates (and thus higher bond prices). Statements from the Thai central bank suggest a dovish bias, and inflation expectations are subdued. In addition to our positive return outlook on the Thai bond position, it has a low correlation with many other Fund holdings, adding diversification benefits.
PAGE 2§ DODGE & COX GLOBAL BOND FUND
Credit: A Swift Rebound
After dismal performance in late 2018, corporate bonds have surged back in 2019, providing healthy excess and total returns. The Fund’s large allocation (53%) to a diversified set of thoroughly researched and stress-tested credit holdings drove particularly strong returns. While over half of the Fund remains invested in the credit sector, we have adjusted the underlying holdings based on fluctuations in valuations. After adding almost seven percentage points during the fourth quarter of 2018 when credit yield premiums widened significantly, we trimmed six percentage points during the first half of this year given higher valuations. Even at current valuation levels, we believe long-term total return prospects for the Fund’s credit holdings are attractive. Though we do not foresee an imminent recession, we retain our emphasis on those credits that we believe offer durability through economic cycles.
While we primarily reduced the Fund’s aggregate credit exposure, we continued to find attractive credit-related investments and initiated a few new positions. For example, we established a 1% position in UniCredit,(e) at present the largest Italy-domiciled bank, with leading positions in commercial banking within the key markets of Italy, Germany, Austria, as well as several Eastern European countries. Italian revenue currently represents approximately 50% of the bank’s revenue. The bonds were issued at a high yield premium (487 basis points above U.S. Treasuries), largely reflecting concerns about macroeconomic and political risks in Italy. We believe this valuation provided more than adequate compensation for the risks involved. UniCredit has an improving credit profile reflecting management’s success in recent years in reducingnon-performing loans and improving its capital ratios and profitability. In addition, should Italian debt or political dynamics worsen, we believe Italy’s systemic importance would prompt the ECB and Eurozone institutions to employ their expanded set of tools to support the sovereign and its banks.
Currency: Modest Moves
The U.S. dollar continues to trade near its strongest levels in almost 15 years, supported by positive growth and interest rate differentials versus other major developed markets, as well as a safe-haven status. However, the prospect of Fed rate cuts and corresponding lower interest rate differentials, and a weaker U.S. fiscal and growth outlook, add depreciation pressure. Despite our view that the U.S. dollar may weaken modestly in the coming years, we continue to avoid most developed market currencies because the paltry yields offered in these markets offset the potential benefit of mild currency appreciation, especially considering the high volatility associated with currency investments.
On the other hand, we are still finding opportunity in certain emerging market currencies, which represent 16% of the Fund. On a total return basis (including both spot moves and carry), nearly all of the Fund’s emerging market currency exposures (expressed via holdings in local government bonds) performed well. We made only minor adjustments to the Fund’s currency positioning, modestly trimming Mexican and Indian government bonds.
Overall, we continue to believe local emerging market bonds are one of the more compelling parts of the global bond universe.
IN CLOSING
We are pleased with the strong recent performance of the Fund, but acknowledge that the decline in interest rates and credit yield premiums leaves us with more moderate expectations for future returns for the broad bond market. Nevertheless, we are confident in our ability to continue identifying attractive investments in individual companies and countries and building a portfolio with multiple and diverse sources of return.
Thank you for your continued confidence in Dodge & Cox. As always, we welcome your comments and questions.
For the Board of Trustees,
| | |
 | |  |
Charles F. Pohl, Chairman | | Dana M. Emery, President |
July 31, 2019
| (a) | | Yield premiums are one way to measure a security’s valuation. Narrowing yield premiums result in a higher valuation. Widening yield premiums result in a lower valuation. |
| (b) | | One basis point is equal to 1/100th of 1%. |
| (c) | | Unless otherwise specified, all weightings and characteristics are as of June 30, 2019. |
| (d) | | Duration is a measure of a bond’s (or a bond portfolio’s) price sensitivity to changes in interest rates. |
| (e) | | The use of specific examples does not imply that they are more or less attractive investments than the Fund’s other holdings. |
DODGE & COX GLOBAL BOND FUND§PAGE 3
YEAR-TO-DATE PERFORMANCE REVIEW
The Fund returned 8.1% year to date.
Key Contributors
| | § | | The significant decline in global interest rates, particularly in the United States, Mexico, Indonesia, India, and Colombia, bolstered returns. | |
| | § | | The Fund’s large allocation to corporate bonds (53%*) drove strong performance as credit yield premiums declined considerably, led by AT&T, Kinder Morgan, Millicom, and Verizon. | |
| | § | | The Fund’s exposure to several appreciating emerging market currencies added to returns, including the Mexican peso (6.5%), Indonesian rupiah (3.4%), and Indian rupee (3.8%). | |
Key Detractors
| | § | | Certain credits underperformed, including euro-denominated Province of Buenos Aires bonds. | |
| | * | | Denotes Fund positioning at the beginning of the period. | |
KEY CHARACTERISTICS OF DODGE & COX
Independent Organization
Dodge & Cox is one of the largest privately owned investment managers in the world. We remain committed to independence, with a goal of providing the highest quality investment management service to our existing clients.
Over 85 Years of Investment Experience
Dodge & Cox was founded in 1930. We have a stable and well-qualified team of investment professionals, most of whom have spent their entire careers at Dodge & Cox.
Experienced Investment Team
The Global Fixed Income Investment Committee, which is the decision-making body for the Global Bond Fund, is a six-member committee with an average tenure at Dodge & Cox of 21 years.
One Business with a Single Research Office
Dodge & Cox manages equity (domestic, international, and global), fixed income (domestic and global), and balanced investments, operating from one office in San Francisco.
Consistent Investment Approach
Our team decision-making process involves thorough, bottom-up fundamental analysis of each investment.
Long-Term Focus and Low Expenses
We invest with a three- to five-year investment horizon, which has historically resulted in low turnover relative to our peers. We manage Funds that maintain low expense ratios.
Risks: The yields and market values of the instruments in which the Fund invests may fluctuate. Accordingly, an investment may be worth more or less than its original cost. Debt securities are subject to interest rate risk, credit risk, and prepayment and call risk, all of which could have adverse effects on the value of the Fund. A low interest rate environment creates an elevated risk of future negative returns. Financial intermediaries may restrict their market making activities for certain debt securities, which may reduce the liquidity and increase the volatility of such securities. Investing in non-U.S. securities may entail risk due to foreign economic and political developments; this risk may be increased when investing in emerging markets. The Fund is also subject to currency risk. Please read the prospectus and summary prospectus for specific details regarding the Fund’s risk profile.
PAGE 4§ DODGE & COX GLOBAL BOND FUND
GROWTH OF $10,000 SINCE INCEPTION
FOR AN INVESTMENT MADE ON DECEMBER 5, 2012
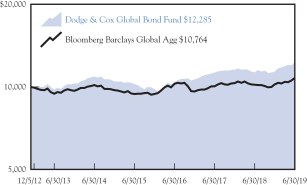
AVERAGE ANNUAL TOTAL RETURN
FOR PERIODS ENDED JUNE 30, 2019
| | | | | | | | | | | | | | | | |
| | | 1 Year | | | 3 Years | | | 5 Years | | | Since
Inception
(12/5/12) | |
| | | | | | | | | | | | | | | | |
Dodge & Cox Global Bond Fund(a) | | | 8.65 | % | | | 5.65 | % | | | 2.43 | % | | | 3.19 | % |
Bloomberg Barclays Global Aggregate Bond Index (Bloomberg Barclays Global Agg) | | | 5.85 | | | | 1.62 | | | | 1.20 | | | | 1.14 | |
| (a) | | Expense reimbursements have been in effect for the Fund since its inception. Without the expense reimbursements, returns for the Fund would have been lower. The Fund’s returns since May 1, 2014 are as presented in the Financial Highlights. |
Returns represent past performance and do not guarantee future results. Investment return and share price will fluctuate with market conditions, and investors may have a gain or loss when shares are sold. Fund performance changes over time and currently may be significantly lower than stated. Performance is updated and published monthly. Visit the Fund’s website at dodgeandcox.com or call800-621-3979 for current performance figures.
A private fund managed and funded by Dodge & Cox (the “Private Fund”) was reorganized into the Fund and the Fund commenced operations on May 1, 2014. The Private Fund commenced operations on December 5, 2012 and had an investment objective, policies, and strategies that were, in all material respects, the same as those of the Fund, and was managed in a manner that, in all material respects, complied with the investment guidelines and restrictions of the Fund. However, the Private Fund was not registered as an investment company under the Investment Company Act of 1940 (the “1940 Act”), and therefore was not subject to certain investment limitations, diversification requirements, liquidity requirements, and other restrictions imposed by the 1940 Act and the Internal Revenue Code, which, if applicable, may have adversely affected its performance.
The Fund’s total returns include the reinvestment of dividend and capital gain distributions, but have not been adjusted for any income taxes payable by shareholders on these distributions or on Fund share redemptions. Index returns include interest income but, unlike Fund returns, do not reflect fees or expenses. The Bloomberg Barclays Global Aggregate Bond Index (Bloomberg Barclays Global Agg) is a widely recognized, unmanaged index of multi-currency investment-grade, debt securities.
Bloomberg is a registered trademark of Bloomberg Finance L.P. and its affiliates. Barclays® is a trademark of Barclays Bank PLC.
FUND EXPENSE EXAMPLE
As a Fund shareholder, you incur ongoing Fund costs, including management fees and other Fund expenses. All mutual funds have ongoing costs, sometimes referred to as operating expenses. The following example shows ongoing costs of investing in the Fund and can help you understand these costs and compare them with those of other mutual funds. The example assumes a $1,000 investment held for the six months indicated.
ACTUAL EXPENSES
The first line of the table below provides information about actual account values and expenses based on the Fund’s actual returns. You may use the information in this line, together with your account balance, to estimate the expenses that you paid over the period. Simply divide your account value by $1,000 (for example, an $8,600 account value divided by $1,000 = 8.6), then multiply the result by the number in the first line under the heading “Expenses Paid During Period” to estimate the expenses you paid on your account during this period.
HYPOTHETICAL EXAMPLE FOR COMPARISON WITH OTHER MUTUAL FUNDS
Information on the second line of the table can help you compare ongoing costs of investing in the Fund with those of other mutual funds. This information may not be used to estimate the actual ending account balance or expenses you paid during the period. The hypothetical “Ending Account Value” is based on the actual expense ratio of the Fund and an assumed 5% annual rate of return before expenses (not the Fund’s actual return). The amount under the heading “Expenses Paid During Period” shows the hypothetical expenses your account would have incurred under this scenario. You can compare this figure with the 5% hypothetical examples that appear in shareholder reports of other mutual funds.
| | | | | | | | | | | | |
Six Months Ended June 30, 2019 | | Beginning Account Value
1/1/2019 | | | Ending Account Value
6/30/2019 | | | Expenses Paid
During Period* | |
Based on Actual Fund Return | | $ | 1,000.00 | | | $ | 1,081.10 | | | $ | 2.32 | |
Based on Hypothetical 5% Yearly Return | | | 1,000.00 | | | | 1,022.57 | | | | 2.25 | |
| * | | Expenses are equal to the Fund’s annualized net expense ratio of 0.45%, multiplied by the average account value over the period, multiplied by 181/365 (to reflect the one-half year period). |
The expenses shown in the table highlight ongoing costs only and do not reflect any transactional fees or account maintenance fees. Though other mutual funds may charge such fees, please note that the Fund does not charge transaction fees (e.g., redemption fees, sales loads) or universal account maintenance fees (e.g., small account fees).
DODGE & COX GLOBAL BOND FUND§PAGE 5
| | | | |
| FUND INFORMATION (unaudited) | | | June 30, 2019 | |
| | | | |
| GENERAL INFORMATION | | | |
Net Asset Value Per Share | | | $11.06 | |
Total Net Assets (millions) | | | $285.7 | |
Net Expense Ratio(a) | | | 0.45% | |
Gross Expense Ratio (1/1/19 to 6/30/19, annualized) | | | 0.92% | |
Portfolio Turnover Rate (1/1/19 to 6/30/19, unannualized) | | | 31% | |
30-Day SEC Yield (using net expenses)(a)(b) | | | 4.53% | |
30-Day SEC Yield (using gross expenses) | | | 4.06% | |
Number of Credit Issuers | | | 57 | |
Fund Inception | | | 2014 | |
No sales charges or distribution fees | | | | |
Investment Manager:Dodge & Cox, San Francisco. Managed by the Global Fixed Income Investment Committee, whose six members’ average tenure at Dodge & Cox is 21 years.
| | | | | | | | |
| PORTFOLIO CHARACTERISTICS | | Fund | | | BBG Barclays
Global Agg | |
Effective Duration (years)(c) | | | 3.6 | | | | 7.1 | |
Emerging Markets(d) | | | 29.3% | | | | 6.5% | |
Non-USD Currency Exposure(e) | | | 16.0% | | | | 55.2% | |
| | | | |
| FIVE LARGEST CREDIT ISSUERS (%)(f) | | Fund | |
TC Energy Corp. | | | 2.0 | |
AT&T, Inc. | | | 2.0 | |
Charter Communications, Inc. | | | 2.0 | |
BNP Paribas SA | | | 1.7 | |
Enel SPA | | | 1.5 | |
| | | | | | | | |
| CREDIT QUALITY (%)(g)(h) | | Fund | | | BBG Barclays
Global Agg | |
AAA | | | 21.1 | | | | 39.5 | |
AA | | | 1.5 | | | | 15.8 | |
A | | | 13.6 | | | | 29.4 | |
BBB | | | 47.7 | | | | 15.4 | |
BB | | | 11.2 | | | | 0.0 | |
B | | | 2.5 | | | | 0.0 | |
CCC | | | 0.0 | | | | 0.0 | |
Net Cash & Other(i) | | | 2.4 | | | | 0.0 | |
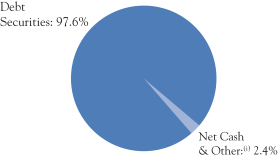
| | | | | | | | |
| SECTOR DIVERSIFICATION (%)(h) | | Fund | | | BBG Barclays
Global Agg | |
Government | | | 24.5 | | | | 54.5 | |
Government-Related | | | 5.5 | | | | 12.0 | |
Securitized | | | 20.0 | | | | 14.7 | |
Corporate | | | 47.6 | | | | 18.8 | |
Net Cash & Other(i) | | | 2.4 | | | | 0.0 | |
| | | | | | | | |
| REGION DIVERSIFICATION (%)(d)(h) | | Fund | | | BBG Barclays
Global Agg | |
United States | | | 48.0 | | | | 39.1 | |
Latin America | | | 18.0 | | | | 1.1 | |
Europe (excluding United Kingdom) | | | 12.1 | | | | 25.2 | |
Asia Pacific (excluding Japan) | | | 8.9 | | | | 6.5 | |
United Kingdom | | | 6.7 | | | | 5.1 | |
Canada | | | 2.0 | | | | 3.4 | |
Africa | | | 1.9 | | | | 0.0 | (j) |
Japan | | | 0.0 | | | | 16.9 | |
Supranational | | | 0.0 | | | | 2.1 | |
Middle East | | | 0.0 | | | | 0.6 | |
| (a) | Dodge & Cox has contractually agreed to reimburse the Fund for all ordinary expenses to the extent necessary to maintain total annual fund operating expenses at 0.45% through April 30, 2020. The term of the agreement renews annually thereafter unless terminated with 30 days’ written notice by either party prior to the end of the term. |
| (b) | SEC Yield is an annualization of the Fund’s net investment income for the trailing30-day period. Dividends paid by the Fund may be higher or lower than implied by the SEC Yield. |
| (c) | Interest rate derivatives reduce total Fund duration by 2.0 years (i.e., total Fund duration is 5.6 years without derivatives). |
| (d) | The Fund may classify an issuer in a different category than the Bloomberg Barclays Global Aggregate Bond Index. The Fund generally classifies a corporate issuer based on the country of incorporation of the parent company, but may designate a different country in certain circumstances. |
| (e) | Non-USD currency exposure for the Fund reflects the value of the portfolio’snon-U.S. dollar denominated investments, as well as the impact of currency derivatives. |
| (f) | The Fund’s portfolio holdings are subject to change without notice. The mention of specific securities is not a recommendation to buy, sell, or hold any particular security and is not indicative of Dodge & Cox’s current or future trading activity. |
| (g) | The credit quality distributions shown for the Fund and the Index are based on the middle of Moody’s, S&P, and Fitch ratings, which is the methodology used by Bloomberg in constructing its indices. If a security is rated by only two agencies, the lower of the two ratings is used. Please note the Fund applies the highest of Moody’s, S&P, and Fitch ratings to comply with the quality requirements stated in its prospectus. On that basis, the Fund held 10.7% in securities rated below investment grade. The credit quality of the investments in the portfolio does not apply to the stability or safety of the Fund or its shares. |
| (h) | Region, sector, and quality weights exclude the effect of the Fund’s derivative contracts. |
| (i) | Net Cash & Other includes cash, short-term investments, derivatives, receivables, and payables. |
PAGE 6§ DODGE & COX GLOBAL BOND FUND
| | | | |
| CONSOLIDATED PORTFOLIO OF INVESTMENTS (unaudited) | | | June 30, 2019 | |
| | | | | | | | | | | | |
| DEBT SECURITIES: 97.6% | |
| | | |
| | | | | | PAR VALUE | | | VALUE | |
| GOVERNMENT: 24.5% | |
Argentina Government (Argentina)
4.50%, 2/13/20(h) | | | USD | | | | 3,890,000 | | | $ | 3,331,300 | |
Brazil Government (Brazil)
10.00%, 1/1/23 | | | BRL | | | | 2,000,000 | | | | 573,249 | |
Colombia Government (Colombia) | |
7.75%, 4/14/21 | | | COP | | | | 11,510,000,000 | | | | 3,744,018 | |
3.00%, 3/25/33(a) | | | COP | | | | 9,765,578,650 | | | | 2,972,067 | |
India Government (India)
8.24%, 2/15/27 | | | INR | | | | 531,480,000 | | | | 8,242,712 | |
Indonesia Government (Indonesia) | |
8.75%, 5/15/31 | | | IDR | | | | 18,000,000,000 | | | | 1,383,567 | |
8.25%, 5/15/36 | | | IDR | | | | 110,400,000,000 | | | | 8,217,902 | |
Mexico Government (Mexico) | |
2.00%, 6/9/22(a) | | | MXN | | | | 103,019,700 | | | | 5,157,225 | |
5.75%, 3/5/26 | | | MXN | | | | 59,100,000 | | | | 2,799,450 | |
8.00%, 11/7/47 | | | MXN | | | | 159,800,000 | | | | 8,462,916 | |
Poland Government (Poland)
2.50%, 1/25/23 | | | PLN | | | | 10,000,000 | | | | 2,737,804 | |
Thailand Government Bond (Thailand)
1.25%, 3/12/28(a) | | | THB | | | | 135,122,340 | | | | 4,213,002 | |
Turkey Government (Turkey)
10.50%, 8/11/27 | | | TRY | | | | 5,785,000 | | | | 749,288 | |
U.S. Treasury Note/Bond (United States) | |
1.75%, 11/30/19 | | | USD | | | | 6,850,000 | | | | 6,839,029 | |
1.375%, 2/15/20 | | | USD | | | | 3,850,000 | | | | 3,833,607 | |
2.50%, 2/15/22 | | | USD | | | | 810,000 | | | | 825,662 | |
2.50%, 2/28/26 | | | USD | | | | 5,600,000 | | | | 5,821,156 | |
| | | | | | | | | | | | |
| | | | | | | | | | | 69,903,954 | |
| GOVERNMENT-RELATED: 5.5% | |
Chicago Transit Authority RB (United States)
6.899%, 12/1/40 | | | USD | | | | 1,000,000 | | | | 1,350,800 | |
Indonesia Government International (Indonesia)
3.75%, 6/14/28(c) | | | EUR | | | | 1,050,000 | | | | 1,423,321 | |
Peru Government International (Peru)
3.75%, 3/1/30 | | | EUR | | | | 1,000,000 | | | | 1,448,165 | |
Petroleo Brasileiro SA (Brazil) | |
6.625%, 1/16/34 | | | GBP | | | | 525,000 | | | | 741,581 | |
7.25%, 3/17/44 | | | USD | | | | 1,500,000 | | | | 1,677,765 | |
Petroleos Mexicanos (Mexico) | |
4.75%, 2/26/29 | | | EUR | | | | 1,200,000 | | | | 1,303,186 | |
6.75%, 9/21/47 | | | USD | | | | 2,736,000 | | | | 2,436,408 | |
6.35%, 2/12/48 | | | USD | | | | 51,000 | | | | 43,784 | |
Province of Buenos Aires Argentina (Argentina) | | | | | | | | | | | | |
5.375%, 1/20/23(c) | | | EUR | | | | 3,275,000 | | | | 2,824,105 | |
BADLARPP
+3.83%, 48.771%, 5/31/22 | | | ARS | | | | 54,100,000 | | | | 1,045,731 | |
State of Illinois GO (United States)
5.10%, 6/1/33 | | | USD | | | | 1,250,000 | | | | 1,316,350 | |
| | | | | | | | | | | | |
| | | | | | | | | | | 15,611,196 | |
| SECURITIZED: 20.0% | |
ASSET-BACKED: 5.6% | |
Other: 1.2% | |
Rio Oil Finance Trust (Brazil) | |
9.25%, 7/6/24(c) | | | USD | | | | 2,089,640 | | | | 2,327,337 | |
9.75%, 1/6/27(c) | | | USD | | | | 524,477 | | | | 601,842 | |
8.20%, 4/6/28(c) | | | USD | | | | 400,000 | | | | 449,004 | |
| | | | | | | | | | | | |
| | | | | | | | | | | 3,378,183 | |
| | | | | | | | | | | | |
| | | |
| | | | | | PAR VALUE | | | VALUE | |
Student Loan: 4.4% | |
Navient Student Loan Trust (United States)
USD LIBOR1-Month +1.00%,
3.404%, 9/27/66(c) | | | USD | | | | 3,863,000 | | | $ | 3,861,803 | |
Navient Student Loan Trust (Private Loans) (United States) | | | | | | | | | | | | |
Series2015-CA B, 3.25%, 5/15/40(c) | | | USD | | | | 434,319 | | | | 434,426 | |
Series2017-A B, 3.91%, 12/16/58(c) | | | USD | | | | 1,050,000 | | | | 1,082,001 | |
SLM Student Loan Trust (United States) | | | | | | | | | | | | |
USD LIBOR1-Month | | | | | | | | | |
+0.95%, 3.38%, 9/25/28 | | | USD | | | | 2,015,702 | | | | 1,989,707 | |
USD LIBOR3-Month | | | | | | | | | |
+0.11%, 2.52%, 12/15/32(c) | | | USD | | | | 2,631,188 | | | | 2,476,254 | |
SMB Private Education Loan Trust (Private Loans) (United States) | | | | | | | | | | | | |
Series2017-B A2A, 2.82%, 10/15/35(c) | | | USD | | | | 1,697,000 | | | | 1,711,617 | |
Series2018-C B, 4.00%, 11/17/42(c) | | | USD | | | | 1,000,000 | | | | 1,048,485 | |
| | | | | | | | | | | | |
| | | | | | | | | | | 12,604,293 | |
| | | | | | | | | | | | |
| | | | | | | | | | | 15,982,476 | |
CMBS: 0.6% | |
Agency CMBS: 0.6% | |
Freddie Mac Military Housing Trust Multifamily (United States)
12.439%, 11/25/55(c)(f) | | | USD | | | | 1,628,988 | | | | 1,804,817 | |
| | | | | | | | | | | | |
|
MORTGAGE-RELATED: 13.8% | |
Federal Agency CMO & REMIC: 1.7% | |
Fannie Mae (United States)
Trust2004-W9 1A3, 6.05%, 2/25/44 | | | USD | | | | 420,915 | | | | 469,448 | |
Freddie Mac (United States) | |
Series 4283 EW, 4.50%, 12/15/43(f) | | | USD | | | | 115,373 | | | | 124,145 | |
Series 4319 MA, 4.50%, 3/15/44(f) | | | USD | | | | 414,286 | | | | 452,797 | |
Ginnie Mae (United States) | |
Series2010-169 JZ, 4.00%, 12/20/40 | | | USD | | | | 556,641 | | | | 580,728 | |
USD LIBOR12-Month
| | | | | | | | | |
+0.22%, 3.06%, 10/20/67 | | | USD | | | | 624,883 | | | | 619,384 | |
+0.15%, 3.27%, 12/20/67 | | | USD | | | | 1,451,356 | | | | 1,434,673 | |
+0.04%, 3.061%, 2/20/68 | | | USD | | | | 1,106,789 | | | | 1,089,271 | |
| | | | | | | | | | | | |
| | | | | | | | | | | 4,770,446 | |
Federal Agency Mortgage Pass-Through: 12.1% | |
Fannie Mae, 15 Year (United States)
5.00%, 7/1/25 | | | USD | | | | 14,451 | | | | 14,918 | |
Fannie Mae, 30 Year (United States) | |
4.50%, 4/1/39-3/1/49 | | | USD | | | | 14,820,326 | | | | 15,548,143 | |
Fannie Mae, Hybrid ARM(f) (United States) | | | | | | | | | | | | |
USD LIBOR12-Month | | | | | | | | | |
+1.58%, 2.89%, 8/1/44 | | | USD | | | | 112,101 | | | | 114,382 | |
+1.58%, 2.754%, 9/1/44 | | | USD | | | | 170,389 | | | | 173,498 | |
Freddie Mac, Hybrid ARM(f)
(United States) | | | | | | | | | | | | |
USD LIBOR12-Month | | | | | | | | | |
+1.63%, 3.017%, 10/1/44 | | | USD | | | | 240,045 | | | | 245,846 | |
+1.60%, 2.69%, 11/1/44 | | | USD | | | | 599,374 | | | | 609,988 | |
+1.62%, 2.671%, 1/1/45 | | | USD | | | | 610,161 | | | | 619,647 | |
Freddie Mac Gold, 30 Year (United States) | | | | | | | | | | | | |
6.00%, 2/1/35 | | | USD | | | | 59,626 | | | | 67,065 | |
4.50%, 8/1/44-3/1/49 | | | USD | | | | 16,540,789 | | | | 17,332,139 | |
| | | | | | | | | | | | |
| | | | | | | | | | | 34,725,626 | |
| | | | | | | | | | | | |
| | | | | | | | | | | 39,496,072 | |
| | | | | | | | | | | | |
| | | | | | | | | | | 57,283,365 | |
| | |
| See accompanying Notes to Consolidated Financial Statements | | DODGE & COX GLOBAL BOND FUND§PAGE 7 |
| | | | |
| CONSOLIDATED PORTFOLIO OF INVESTMENTS (unaudited) | |
| June 30, 2019
|
|
| | | | | | | | | | | | |
| DEBT SECURITIES (continued) | |
| | | |
| | | | | | PAR VALUE | | | VALUE | |
| CORPORATE: 47.6% | |
FINANCIALS: 13.1% | |
Bank of America Corp. (United States) | | | | | | | | | | | | |
4.25%, 10/22/26 | | | USD | | | | 1,000,000 | | | $ | 1,067,914 | |
4.183%, 11/25/27 | | | USD | | | | 1,650,000 | | | | 1,750,339 | |
Barclays PLC (United Kingdom)
4.836%, 5/9/28 | | | USD | | | | 2,650,000 | | | | 2,711,984 | |
BNP Paribas SA (France) | |
4.375%, 9/28/25(c) | | | USD | | | | 2,400,000 | | | | 2,520,802 | |
4.625%, 3/13/27(c) | | | USD | | | | 2,100,000 | | | | 2,241,335 | |
Capital One Financial Corp. (United States)
3.75%, 4/24/24 | | | USD | | | | 625,000 | | | | 655,421 | |
Chubb, Ltd. (Switzerland)
2.50%, 3/15/38 | | | EUR | | | | 3,300,000 | | | | 4,281,129 | |
Citigroup, Inc. (United States)
USD LIBOR3-Month
+6.37 8.953%, 10/30/40(b) | | | USD | | | | 2,075,000 | | | | 2,296,610 | |
HSBC Holdings PLC (United Kingdom) | | | | | | | | | | | | |
6.50%, 9/15/37 | | | USD | | | | 775,000 | | | | 1,010,118 | |
6.00%, 3/29/40 | | | GBP | | | | 1,875,000 | | | | 3,122,582 | |
JPMorgan Chase & Co. (United States)
1.09%, 3/11/27(g) | | | EUR | | | | 2,250,000 | | | | 2,641,664 | |
Lloyds Banking Group PLC (United Kingdom) | | | | | | | | | | | | |
4.50%, 11/4/24 | | | USD | | | | 1,125,000 | | | | 1,176,284 | |
4.582%, 12/10/25 | | | USD | | | | 2,875,000 | | | | 2,998,177 | |
Royal Bank of Scotland Group PLC (United Kingdom)
6.00%, 12/19/23 | | | USD | | | | 3,200,000 | | | | 3,483,485 | |
UniCredit SPA (Italy)
7.296%, 4/2/34(c)(g) | | | USD | | | | 2,450,000 | | | | 2,596,701 | |
Wells Fargo & Co. (United States)
4.30%, 7/22/27 | | | USD | | | | 2,575,000 | | | | 2,780,416 | |
| | | | | | | | | | | | |
| | | | | | | | | | | 37,334,961 | |
INDUSTRIALS: 30.4% | |
Anheuser-Busch InBev SA/NV (Belgium) | | | | | | | | | |
5.45%, 1/23/39 | | | USD | | | | 350,000 | | | | 415,789 | |
5.55%, 1/23/49 | | | USD | | | | 825,000 | | | | 1,005,992 | |
AT&T, Inc. (United States)
3.15%, 9/4/36 | | | EUR | | | | 4,375,000 | | | | 5,613,231 | |
Bayer AG (Germany)
3.75%, 7/1/74(b)(g) | | | EUR | | | | 3,700,000 | | | | 4,344,394 | |
Becton, Dickinson and Co. (United States)
2.894%, 6/6/22 | | | USD | | | | 1,700,000 | | | | 1,721,668 | |
BHP Billiton, Ltd. (Australia)
6.75%, 10/19/75(b)(c)(g) | | | USD | | | | 1,650,000 | | | | 1,882,650 | |
Cemex SAB de CV (Mexico)
7.75%, 4/16/26(c) | | | USD | | | | 3,625,000 | | | | 3,987,536 | |
Charter Communications, Inc. (United States) | | | | | | | | | | | | |
7.30%, 7/1/38 | | | USD | | | | 1,725,000 | | | | 2,091,895 | |
6.75%, 6/15/39 | | | USD | | | | 1,300,000 | | | | 1,506,812 | |
6.484%, 10/23/45 | | | USD | | | | 1,700,000 | | | | 2,001,209 | |
Cigna Corp. (United States) | |
3.75%, 7/15/23(c) | | | USD | | | | 850,000 | | | | 884,489 | |
4.125%, 11/15/25(c) | | | USD | | | | 575,000 | | | | 610,660 | |
4.375%, 10/15/28(c) | | | USD | | | | 1,275,000 | | | | 1,375,068 | |
Concho Resources, Inc. (United States) | | | | | | | | | | | | |
4.875%, 10/1/47 | | | USD | | | | 500,000 | | | | 559,043 | |
4.85%, 8/15/48 | | | USD | | | | 250,000 | | | | 280,814 | |
Cox Enterprises, Inc. (United States) | |
4.80%, 2/1/35(c) | | | USD | | | | 350,000 | | | | 354,352 | |
8.375%, 3/1/39(c) | | | USD | | | | 1,775,000 | | | | 2,427,382 | |
| | | | | | | | | | | | |
| | | |
| | | | | | PAR VALUE | | | VALUE | |
CVS Health Corp. (United States) | |
4.30%, 3/25/28 | | | USD | | | | 1,275,000 | | | $ | 1,343,761 | |
4.78%, 3/25/38 | | | USD | | | | 700,000 | | | | 729,590 | |
Dell Technologies, Inc. (United States)
5.45%, 6/15/23(c) | | | USD | | | | 775,000 | | | | 835,298 | |
Dow, Inc. (United States)
5.55%, 11/30/48(c) | | | USD | | | | 1,275,000 | | | | 1,515,735 | |
Elanco Animal Health, Inc. (United States)
4.90%, 8/28/28 | | | USD | | | | 1,025,000 | | | | 1,144,196 | |
Ford Motor Credit Co. LLC(d) (United States) | | | | | | | | | | | | |
4.14%, 2/15/23 | | | USD | | | | 1,825,000 | | | | 1,858,594 | |
4.375%, 8/6/23 | | | USD | | | | 2,000,000 | | | | 2,052,640 | |
Grupo Televisa SAB (Mexico) | |
8.50%, 3/11/32 | | | USD | | | | 1,464,000 | | | | 1,937,165 | |
6.125%, 1/31/46 | | | USD | | | | 750,000 | | | | 869,176 | |
HCA Healthcare, Inc. (United States) | | | | | | | | | | | | |
4.75%, 5/1/23 | | | USD | | | | 1,225,000 | | | | 1,305,643 | |
4.125%, 6/15/29 | | | USD | | | | 650,000 | | | | 665,110 | |
Imperial Brands PLC (United Kingdom)
3.375%, 2/26/26 | | | EUR | | | | 2,125,000 | | | | 2,728,961 | |
Kinder Morgan, Inc. (United States)
6.95%, 1/15/38 | | | USD | | | | 3,275,000 | | | | 4,195,698 | |
LafargeHolcim, Ltd. (Switzerland) | |
7.125%, 7/15/36 | | | USD | | | | 1,150,000 | | | | 1,445,733 | |
4.75%, 9/22/46(c) | | | USD | | | | 950,000 | | | | 937,959 | |
Macy’s, Inc. (United States) | |
6.70%, 9/15/28 | | | USD | | | | 50,000 | | | | 54,822 | |
6.90%, 4/1/29 | | | USD | | | | 75,000 | | | | 81,505 | |
6.70%, 7/15/34 | | | USD | | | | 425,000 | | | | 468,370 | |
Millicom International Cellular SA (Luxembourg)
5.125%, 1/15/28(c) | | | USD | | | | 2,725,000 | | | | 2,759,062 | |
Molex Electronic Technologies LLC(d) (United States)
2.878%, 4/15/20(c) | | | USD | | | | 731,000 | | | | 731,329 | |
MTN Group, Ltd. (South Africa)
4.755%, 11/11/24(c) | | | USD | | | | 1,425,000 | | | | 1,428,406 | |
Naspers, Ltd. (South Africa) | |
5.50%, 7/21/25(c) | | | USD | | | | 2,150,000 | | | | 2,343,070 | |
4.85%, 7/6/27(c) | | | USD | | | | 1,625,000 | | | | 1,735,809 | |
QVC, Inc.(d) (United States)
4.45%, 2/15/25 | | | USD | | | | 2,650,000 | | | | 2,667,633 | |
RELX PLC (United Kingdom) | |
3.125%, 10/15/22 | | | USD | | | | 574,000 | | | | 584,251 | |
3.50%, 3/16/23 | | | USD | | | | 325,000 | | | | 335,507 | |
TC Energy Corp. (Canada) | |
5.625%, 5/20/75(b)(g) | | | USD | | | | 1,800,000 | | | | 1,781,028 | |
5.30%, 3/15/77(b)(g) | | | USD | | | | 4,075,000 | | | | 3,913,620 | |
Telecom Italia SPA (Italy) | |
7.20%, 7/18/36 | | | USD | | | | 1,000,000 | | | | 1,102,500 | |
7.721%, 6/4/38 | | | USD | | | | 2,800,000 | | | | 3,157,000 | |
The Walt Disney Co. (United States) | |
6.65%, 11/15/37(c) | | | USD | | | | 1,100,000 | | | | 1,579,244 | |
6.15%, 2/15/41(c) | | | USD | | | | 550,000 | | | | 764,177 | |
Ultrapar Participacoes SA (Brazil) | |
5.25%, 10/6/26(c) | | | USD | | | | 559,000 | | | | 584,854 | |
5.25%, 6/6/29(c) | | | USD | | | | 2,000,000 | | | | 2,045,000 | |
Verizon Communications, Inc. (United States)
5.012%, 4/15/49 | | | USD | | | | 1,700,000 | | | | 2,022,298 | |
Vodafone Group PLC (United Kingdom)
7.00%, 4/4/79(b)(g) | | | USD | | | | 900,000 | | | | 971,410 | |
Xerox Corp. (United States)
4.50%, 5/15/21 | | | USD | | | | 1,250,000 | | | | 1,276,163 | |
| | | | | | | | | | | | |
| | | | | | | | | | | 87,015,301 | |
| | |
| PAGE 8§ DODGE & COX GLOBAL BOND FUND | | See accompanying Notes to Consolidated Financial Statements |
| | | | |
| CONSOLIDATED PORTFOLIO OF INVESTMENTS (unaudited) | |
| June 30, 2019
|
|
| | | | | | | | | | | | |
| DEBT SECURITIES (continued) | |
| | | |
| | | | | | PAR VALUE | | | VALUE | |
UTILITIES: 4.1% | |
Dominion Energy, Inc. (United States)
5.75%, 10/1/54(b)(g) | | | USD | | | | 3,065,000 | | | $ | 3,184,535 | |
Enel SPA (Italy)
3.375%, 11/24/81(b)(g) | | | EUR | | | | 3,800,000 | | | | 4,416,198 | |
NextEra Energy, Inc. (United States)
5.65%, 5/1/79(b)(g) | | | USD | | | | 1,875,000 | | | | 1,933,007 | |
The Southern Co. (United States)
5.50%, 3/15/57(b)(g) | | | USD | | | | 2,125,000 | | | | 2,177,544 | |
| | | | | | | | | | | | |
| | | | | | | | | | | 11,711,284 | |
| | | | | | | | | | | | |
| | | | | | | | | | | 136,061,546 | |
| | | | | | | | | | | | |
TOTAL DEBT SECURITIES
(Cost $269,844,375) | | | $ | 278,860,061 | |
|
| SHORT-TERM INVESTMENTS: 4.7% | |
| | | |
| | | | | | PAR VALUE/ SHARES | | | VALUE | |
REPURCHASE AGREEMENTS: 4.3% | |
Bank of Montreal(e)
2.45%, dated 6/28/19, due 7/1/19, maturity value $1,100,225 | | | USD | | | | 1,100,000 | | | | 1,100,000 | |
Fixed Income Clearing Corporation(e)
1.60%, dated 6/28/19, due 7/1/19, maturity value $8,446,126 | | | USD | | | | 8,445,000 | | | | 8,445,000 | |
Royal Bank of Canada(e)
2.47%, dated 6/28/19, due 7/1/19, maturity value $2,900,597 | | | USD | | | | 2,900,000 | | | | 2,900,000 | |
| | | | | | | | | | | | |
| | | | | | | | | | | 12,445,000 | |
MONEY MARKET FUND: 0.4% | | | | | | | | | | | | |
State Street Institutional U.S. Government Money Market Fund | | | USD | | | | 1,136,645 | | | | 1,136,645 | |
| | | | | | | | | | | | |
TOTAL SHORT-TERM INVESTMENTS
(Cost $13,581,645) | | | $ | 13,581,645 | |
| | | | | | | | | | | | |
TOTAL INVESTMENTS IN SECURITIES
(Cost $283,426,020) | | | | 102.3 | % | | $ | 292,441,706 | |
OTHER ASSETS LESS LIABILITIES | | | | (2.3 | %) | | | (6,705,592 | ) |
| | | | | | | | | | | | |
| NET ASSETS | | | | | | | 100.0 | % | | $ | 285,736,114 | |
| | | | | | | | | | | | |
| (b) | Hybrid security has characteristics of both a debt and equity security. |
| (c) | Security exempt from registration under Rule 144A of the Securities Act of 1933. The security may be resold in transactions exempt from registration, normally to qualified institutional buyers. |
| (d) | Subsidiary (see below) |
| (e) | Repurchase agreements are collateralized by: |
Bank of Montreal: U.S. Treasury Bill 9/12/19, U.S. Treasury Note2.00%-3.00%,11/30/22-5/15/47, and U.S. Treasury Inflation Indexed Notes0.875%-2.50%,1/15/21-1/15/29. Total collateral value is $1,122,249.
Fixed Income Clearing Corporation: U.S. Treasury Note 2.75%, 8/15/21. Total collateral value is $8,616,535.
Royal Bank of Canada: U.S. Treasury Note 1.25%, 3/31/21. Total collateral value is $2,958,701.
| (f) | Variable rate security: interest rate is determined by the interest rates of underlying pool of assets that collateralize the security. The interest rate of the security may change due to a change in the interest rates or the composition of underlying pool of assets. The interest rate shown is the rate as of period end. |
| (g) | Variable rate security:fixed-to-float security pays an initial fixed interest rate and will pay a floating interest rate established at a predetermined time in the future. The interest rate shown is the rate as of period end. |
| (h) | Dual currency bond. Issued in USD but pays in ARS at maturity. |
Debt securities are grouped by parent company unless otherwise noted. Actual securities may be issued by the listed parent company or one of its subsidiaries. In determining a parent company’s country designation, the Fund generally references the country of incorporation.
ARM: Adjustable Rate Mortgage
CMBS: Commercial Mortgage-Backed Security
CMO: Collateralized Mortgage Obligation
GO: General Obligation
RB: Revenue Bond
REMIC: Real Estate Mortgage Investment Conduit
ARS:Argentine Peso
BRL:Brazilian Real
COP:Colombian Peso
EUR:Euro
GBP:British Pound
IDR:Indonesian Rupiah
INR:Indian Rupee
MXN:Mexican Peso
PLN:Polish Zloty
THB:Thai Bhat
TRY:Turkish Lira
USD:United States Dollar
| | |
| See accompanying Notes to Consolidated Financial Statements | | DODGE & COX GLOBAL BOND FUND§PAGE 9 |
| | | | |
| CONSOLIDATED PORTFOLIO OF INVESTMENTS (unaudited) | | | June 30, 2019 | |
FUTURES CONTRACTS
| | | | | | | | | | | | | | | | |
| Description | | Number of Contracts | | | Expiration Date | | | Notional
Amount | | | Value / Unrealized Appreciation
(Depreciation) | |
Euro-Bobl Future—Short Position | | | 26 | | | | 9/6/19 | | | $ | (3,974,665 | ) | | $ | (18,371 | ) |
Euro-Bund Future—Short Position | | | 87 | | | | 9/6/19 | | | | (17,088,773 | ) | | | (183,205 | ) |
Euro-Buxl Future—Short Position | | | 15 | | | | 9/6/19 | | | | (3,460,764 | ) | | | (97,928 | ) |
Long-Term U.S. Treasury Bond—Short Position | | | 74 | | | | 9/19/19 | | | | (11,513,938 | ) | | | (368,785 | ) |
UK-Gilt Future—Short Position | | | 29 | | | | 9/26/19 | | | | (4,798,758 | ) | | | (25,830 | ) |
Ultra Long-Term U.S. Treasury Bond—Short Positions | | | 33 | | | | 9/19/19 | | | | (5,859,563 | ) | | | (216,758 | ) |
| | | | | | | | | | | | | | | | |
| | | | | | | | | | | | | | $ | (910,877 | ) |
| | | | | | | | | | | | | | | | |
CURRENCY FORWARD CONTRACTS
| | | | | | | | | | | | | | | | | | | | | | | | |
| Counterparty | | Settle Date | | | Currency Purchased | | | Currency Sold | | | Unrealized
Appreciation (Depreciation) | |
BRL: Brazilian Real | |
Goldman Sachs | | | 8/13/19 | | | | USD | | | | 1,020,656 | | | | BRL | | | | 4,039,756 | | | $ | (27,334 | ) |
Goldman Sachs | | | 8/13/19 | | | | BRL | | | | 1,875,000 | | | | USD | | | | 490,966 | | | | (4,555 | ) |
EUR: Euro | |
Bank of America | | | 7/10/19 | | | | USD | | | | 2,039,127 | | | | EUR | | | | 1,760,000 | | | | 36,470 | |
Bank of America | | | 7/10/19 | | | | USD | | | | 10,190,699 | | | | EUR | | | | 8,925,000 | | | | 35,179 | |
Bank of America | | | 10/17/19 | | | | USD | | | | 878,137 | | | | EUR | | | | 775,000 | | | | (10,447 | ) |
Barclays | | | 7/10/19 | | | | USD | | | | 1,249,947 | | | | EUR | | | | 1,075,000 | | | | 26,733 | |
Barclays | | | 10/17/19 | | | | USD | | | | 9,282,975 | | | | EUR | | | | 8,125,000 | | | | (32,826 | ) |
Barclays | | | 10/17/19 | | | | USD | | | | 795,039 | | | | EUR | | | | 700,000 | | | | (7,553 | ) |
Citibank | | | 7/10/19 | | | | USD | | | | 1,282,290 | | | | EUR | | | | 1,100,000 | | | | 30,629 | |
Citibank | | | 7/10/19 | | | | USD | | | | 2,741,807 | | | | EUR | | | | 2,425,000 | | | | (17,536 | ) |
Citibank | | | 10/17/19 | | | | USD | | | | 820,267 | | | | EUR | | | | 725,000 | | | | (10,989 | ) |
Citibank | | | 12/18/19 | | | | USD | | | | 1,729,691 | | | | EUR | | | | 1,500,000 | | | | 1,743 | |
GBP: British Pound | |
Barclays | | | 7/10/19 | | | | USD | | | | 769,946 | | | | GBP | | | | 600,000 | | | | 7,662 | |
Citibank | | | 10/17/19 | | | | USD | | | | 2,847,597 | | | | GBP | | | | 2,175,000 | | | | 72,819 | |
Citibank | | | 10/17/19 | | | | USD | | | | 255,234 | | | | GBP | | | | 200,000 | | | | 82 | |
THB: Thai Bhat | |
Barclays | | | 1/22/20 | | | | USD | | | | 1,219,357 | | | | THB | | | | 38,300,000 | | | | (34,625 | ) |
Barclays | | | 6/10/20 | | | | USD | | | | 754,389 | | | | THB | | | | 23,420,000 | | | | (13,809 | ) |
Barclays | | | 6/10/20 | | | | USD | | | | 2,145,156 | | | | THB | | | | 66,650,000 | | | | (41,025 | ) |
| | | | | | | | | | | | | | | | | | | | | | | | |
Unrealized gain on currency forward contracts | | | | 211,317 | |
Unrealized loss on currency forward contracts | | | | (200,699 | ) |
| | | | | | | | | | | | | | | | | | | | | | | | |
Net unrealized gain on currency forward contracts | | | $ | 10,618 | |
| | | | | |
The listed counterparty may be the parent company or one of its subsidiaries.
CENTRALLY CLEARED INTEREST RATE SWAP CONTRACTS
| | | | | | | | | | | | | | | | | | | | | | |
Notional
Amount | | Expiration
Date | | | Pay (Semi-Annually) | | Receive (Quarterly) | | | Value | | | Upfront
Payments
(Receipts) | | | Unrealized
Appreciation/
(Depreciation) | |
$1,420,000 | | | 9/18/49 | | | Fixed 3.25% | | | USD LIBOR 3-Month | | | $ | (327,074 | ) | | $ | (278,802 | ) | | $ | (48,750 | ) |
| | |
| PAGE 10§ DODGE & COX GLOBAL BOND FUND | | See accompanying Notes to Consolidated Financial Statements |
| | | | |
CONSOLIDATED
STATEMENT OF ASSETS AND LIABILITIES
(unaudited) | |
| |
| | | June 30, 2019 | |
ASSETS: | | | | |
Investments in securities, at value (cost $283,426,020) | | $ | 292,441,706 | |
Unrealized appreciation on currency forward contracts | | | 211,317 | |
Cash | | | 100 | |
Cash denominated in foreign currency (cost $80) | | | 80 | |
Deposits with broker for futures contracts | | | 728,908 | |
Deposits with broker for swaps | | | 150,245 | |
Receivable for variation margin for futures contracts | | | 8,952 | |
Receivable for variation margin for swaps | | | 6,889 | |
Receivable for investments sold | | | 26,238 | |
Receivable for Fund shares sold | | | 931,139 | |
Dividends and interest receivable | | | 3,250,543 | |
Expense reimbursement receivable | | | 100,645 | |
Prepaid expenses and other assets | | | 4,690 | |
| | | | |
| | | 297,861,452 | |
| | | | |
LIABILITIES: | | | | |
Unrealized depreciation on currency forward contracts | | | 200,699 | |
Cash received as collateral for OTC Derivatives | | | 530,000 | |
Payable for investments purchased | | | 10,912,624 | |
Payable for Fund shares redeemed | | | 42,881 | |
Deferred foreign capital gains tax | | | 90,420 | |
Management fees payable | | | 112,170 | |
Accrued expenses | | | 236,544 | |
| | | | |
| | | 12,125,338 | |
| | | | |
NET ASSETS | | $ | 285,736,114 | |
| | | | |
NET ASSETS CONSIST OF: | | | | |
Paid in capital | | $ | 277,054,331 | |
Total distributable earnings | | | 8,681,783 | |
| | | | |
| | $ | 285,736,114 | |
| | | | |
Fund shares outstanding (par value $0.01 each, unlimited shares authorized) | | | 25,845,718 | |
Net asset value per share | | $ | 11.06 | |
| |
CONSOLIDATED STATEMENT OF OPERATIONS (unaudited) | | | | |
| |
| | | Six Months Ended
June 30, 2019 | |
INVESTMENT INCOME: | | | | |
Dividends | | $ | 94,456 | |
Interest (net of foreign taxes of $48,642) | | | 6,157,394 | |
| | | | |
| | | 6,251,850 | |
| | | | |
EXPENSES: | | | | |
Management fees | | | 622,042 | |
Custody and fund accounting fees | | | 34,689 | |
Transfer agent fees | | | 19,591 | |
Professional services | | | 180,421 | |
Shareholder reports | | | 38,675 | |
Registration fees | | | 62,328 | |
Trustees’ fees | | | 170,833 | |
Miscellaneous | | | 10,980 | |
| | | | |
Total expenses | | | 1,139,559 | |
Expenses reimbursed by investment manager | | | (579,721 | ) |
| | | | |
Net expenses | | | 559,838 | |
| | | | |
NET INVESTMENT INCOME | | | 5,692,012 | |
| | | | |
REALIZED AND UNREALIZED GAIN (LOSS): | | | | |
Net realized gain (loss) | | | | |
Investments in securities | | | 289,210 | |
Futures contracts | | | (2,808,770 | ) |
Swaps | | | (214,503 | ) |
Currency forward contracts | | | 590,260 | |
Foreign currency transactions | | | (32,695 | ) |
Net change in unrealized appreciation/depreciation | | | | |
Investments in securities (net of increase in deferred foreign capital gains tax of $36,654) | | | 16,055,896 | |
Futures contracts | | | (52,109 | ) |
Swaps | | | (1,177 | ) |
Currency forward contracts | | | (108,598 | ) |
Foreign currency translation | | | 24,862 | |
| | | | |
Net realized and unrealized gain (loss) | | | 13,742,376 | |
| | | | |
NET CHANGE IN NET ASSETS FROM OPERATIONS | | $ | 19,434,388 | |
| | | | |
| | | | | | | | |
CONSOLIDATED STATEMENT OF CHANGES IN NET ASSETS (unaudited) | |
| | |
| | | Six Months Ended
June 30, 2019 | | | Year Ended
December 31, 2018 | |
OPERATIONS: | | | | | | | | |
Net investment income | | $ | 5,692,012 | | | $ | 8,249,112 | |
Net realized gain (loss) | | | (2,176,498 | ) | | | 576,759 | |
Net change in unrealized appreciation/depreciation | | | 15,918,874 | | | | (11,885,492 | ) |
| | | | | | | | |
| | | 19,434,388 | | | | (3,059,621 | ) |
| | | | | | | | |
| | |
DISTRIBUTIONS TO SHAREHOLDERS: | | | | | | | | |
Total distributions | | | — | | | | (10,969,606 | ) |
| | |
FUND SHARE TRANSACTIONS: | | | | | | | | |
Proceeds from sale of shares | | | 63,447,269 | | | | 123,099,819 | |
Reinvestment of distributions | | | — | | | | 10,700,054 | |
Cost of shares redeemed | | | (23,248,660 | ) | | | (49,996,330 | ) |
| | | | | | | | |
Net change from Fund share transactions | | | 40,198,609 | | | | 83,803,543 | |
| | | | | | | | |
Total change in net assets | | | 59,632,997 | | | | 69,774,316 | |
| | |
NET ASSETS: | | | | | | | | |
Beginning of period | | | 226,103,117 | | | | 156,328,801 | |
| | | | | | | | |
End of period | | $ | 285,736,114 | | | $ | 226,103,117 | |
| | | | | | | | |
| | |
SHARE INFORMATION: | | | | | | | | |
Shares sold | | | 5,925,332 | | | | 11,449,398 | |
Distributions reinvested | | | — | | | | 1,037,870 | |
Shares redeemed | | | (2,185,781 | ) | | | (4,697,860 | ) |
| | | | | | | | |
Net change in shares outstanding | | | 3,739,551 | | | | 7,789,408 | |
| | | | | | | | |
| | |
| See accompanying Notes to Consolidated Financial Statements | | DODGE & COX GLOBAL BOND FUND§PAGE 11 |
NOTES TO CONSOLIDATED FINANCIAL STATEMENTS(unaudited)
NOTE 1—ORGANIZATION AND SIGNIFICANT ACCOUNTING POLICIES
Dodge & Cox Global Bond Fund (the “Fund”) is one of the series constituting the Dodge & Cox Funds (the “Trust” or the “Funds”). The Trust is organized as a Delaware statutory trust and is registered under the Investment Company Act of 1940, as amended, as anopen-end management investment company. The Fund1 seeks a high rate of total return consistent with long-term preservation of capital. Foreign investing, especially in developing countries, has special risks such as currency and market volatility and political and social instability. These and other risk considerations are discussed in the Fund’s Prospectus.
The Fund is an investment company and follows the accounting and reporting guidance issued in Topic 946 by the Financial Accounting Standards Board. The financial statements have been prepared in conformity with accounting principles generally accepted in the United States of America, which require the use of estimates and assumptions by management. Actual results may differ from those estimates. Significant accounting policies are as follows:
Security valuation The Fund’s net assets are normally valued as of the scheduled close of trading on the New York Stock Exchange (NYSE), generally 4 p.m. Eastern Time, each day that the NYSE is open for business.
Debt securities and derivatives traded over the counter are valued using prices received from independent pricing services which utilize dealer quotes, recent transaction data, pricing models, and other inputs to arrive at market-based valuations. Pricing models may consider quoted prices for similar securities, interest rates, cash flows (including prepayment speeds), and credit risk. Exchange-traded derivatives are valued at the settlement price determined by the relevant exchange. Other financial instruments for which market quotes are readily available are valued at market value. Short-term securities less than 60 days to maturity may be valued at amortized cost if amortized cost approximates current value. Mutual funds are valued at their respective net asset values. Security values are not discounted based on the size of the Fund’s position and may differ from the value a Fund receives upon sale of the securities.
Investments initially valued in currencies other than the U.S. dollar are converted to the U.S. dollar using prevailing exchange rates. Currency forward contracts are valued based on the prevailing forward exchange rates of the underlying currencies. As a result, the Fund’s net assets may be affected by changes in the value of currencies in relation to the U.S. dollar.
If market quotations are not readily available or if normal valuation procedures produce valuations that are deemed unreliable or inappropriate under the circumstances existing at the time, the investment will be valued at fair value as determined in good faith by
| 1 | | The Fund’s predecessor, Dodge & Cox Global Bond Fund, L.L.C. (the “Private Fund”), was organized on August 31, 2012 and commenced operations on December 5, 2012 as a private investment fund that reorganized into, and had the same investment manager as, the Fund. The Fund commenced operations on May 1, 2014, upon the transfer of assets from the Private Fund. This transaction was accomplished through a transfer of Private Fund net assets valued at $10,725,688 in exchange for 1,000,000 shares of the Fund. Immediately after the transfer, the shares of the Fund were distributed to the sole owner of the Private Fund and the investment manager of the Fund, Dodge & Cox, which became the initial shareholder of the Fund. |
or under the direction of the Fund’s Board of Trustees. The Board of Trustees has appointed Dodge & Cox, the Fund’s investment manager, to make fair value determinations in accordance with the Dodge & Cox Funds Valuation Policies (“Valuation Policies”), subject to Board oversight. Dodge & Cox has established a Pricing Committee that is comprised of representatives from Treasury, Legal, Compliance, and Operations. The Pricing Committee is responsible for implementing the Valuation Policies, including determining the fair value of securities and other investments when necessary. The Pricing Committee considers relevant indications of value that are reasonably available to it in determining the fair value assigned to a particular security, such as the value of similar financial instruments, trading volumes, contractual restrictions on disposition, related corporate actions, and changes in economic conditions. In doing so, the Pricing Committee employs various methods for calibrating fair valuation approaches, including a regular review of key inputs and assumptions, back-testing, and review of any related market activity.
Valuing securities through a fair value determination involves greater reliance on judgment than valuation of securities based on readily available market quotations. In some instances, lack of information and uncertainty as to the significance of information may lead to a conclusion that a prior valuation is the best indication of a security’s value. When fair value pricing is employed, the prices of securities used by the Fund to calculate its net asset value may differ from quoted or published prices for the same securities.
Security transactions, investment income, expenses, and distributions Security transactions are recorded on the trade date. Realized gains and losses on securities sold are determined on the basis of identified cost.
Interest income is recorded on the accrual basis. Interest income includes coupon interest, amortization of premium and accretion of discount on debt securities, gain/loss on paydowns, and inflation adjustments to the principal amount of inflation-indexed securities. The ability of the issuers of the debt securities held by the Fund to meet their obligations may be affected by economic developments in a specific industry, state, region, or country. Debt obligations may be placed on non-accrual status and related interest income may be reduced by ceasing current accruals and writing off interest receivables when the collection of all or a portion of interest has become doubtful. A debt obligation is removed from non-accrual status when the issuer resumes interest payments or when collectability of interest is reasonably assured. Dividend income is recorded on the ex-dividend date.
Expenses are recorded on the accrual basis. Some expenses of the Trust can be directly attributed to a specific series. Expenses which cannot be directly attributed are allocated among the Funds in the Trust using methodologies determined by the nature of the expense.
Distributions to shareholders are recorded on theex-dividend date.
Foreign taxes The Fund is subject to foreign taxes which may be imposed by certain countries in which the Fund invests. The Fund endeavors to record foreign taxes based on applicable foreign tax law. Withholding taxes are incurred on certain foreign receipts and are accrued at the time the associated interest income is recorded.
PAGE 12§ DODGE & COX GLOBAL BOND FUND
NOTES TO CONSOLIDATED FINANCIAL STATEMENTS(unaudited)
Capital gains taxes are incurred upon disposition of certain foreign securities. Expected capital gains taxes on appreciated securities, if any, are accrued as unrealized losses and incurred capital gains taxes are reflected as realized losses upon the sale of the related security. Currency taxes may be incurred when the Fund purchases certain foreign currencies related to securities transactions and are recorded as realized losses on foreign currency transactions.
Repurchase agreements Repurchase agreements are transactions under which a Fund purchases a security from a dealer counterparty and agrees to resell the security to that counterparty on a specified future date at the same price, plus a specified interest rate. The Fund’s repurchase agreements are secured by U.S. government or agency securities, the fair value of which exceeds the principal amount of the repurchase transaction, including accrued interest, at all times. The Fund maintains custody of the underlying collateral securities, either through its regular custodian or through a third party custodian that maintains separate accounts for both the Fund and its counterparties. In the event of default by a counterparty, the Fund has the contractual right to liquidate the securities and to apply the proceeds in satisfaction of the obligation.
Foreign currency translation The books and records of the Fund are maintained in U.S. dollars. Foreign currency amounts are translated into U.S. dollars at the prevailing exchange rates of such currencies against the U.S. dollar. The market value of investment securities and other assets and liabilities are translated at the exchange rate as of the valuation date. Purchases and sales of investment securities, income, and expenses are translated at the exchange rate prevailing on the transaction date.
Reported realized and unrealized gain (loss) on investments includes foreign currency gain (loss) related to investment transactions.
Reported realized and unrealized gain (loss) on foreign currency transactions and translation include the following: holding/disposing of foreign currency, the difference between the trade and settlement dates on securities transactions, the difference between the accrual and payment dates on interest, and currency losses on the purchase of foreign currency in certain countries that impose taxes on such transactions.
Consolidation The Fund may invest in certain securities through its wholly owned subsidiary, Dodge & Cox Global Bond Fund Cayman, Ltd. (the “Subsidiary”). The Subsidiary is a Cayman Islands exempted company and invests in certain securities consistent with the investment objective of the Fund. The Fund’s Consolidated Financial Statements, including the Consolidated Portfolio of Investments, consist of the holdings and accounts of the Fund and the Subsidiary. All intercompany transactions and balances have been eliminated. At June 30, 2019, the Subsidiary had net assets of $100, which represented less than 0.01% of the Fund’s consolidated net assets.
Indemnification Under the Trust’s organizational documents, its officers and trustees are indemnified against certain liabilities arising out of the performance of their duties to the Trust. In addition, in the normal course of business the Trust enters into contracts that provide general indemnities to other parties. The Trust’s maximum exposure under these arrangements is unknown as this would involve future claims that may be made against the Trust that have not yet occurred.
NOTE 2—VALUATION MEASUREMENTS
Various inputs are used in determining the value of the Fund’s investments. These inputs are summarized in the three broad levels listed below.
| § | | Level 1: Quoted prices in active markets for identical securities |
| § | | Level 2: Other significant observable inputs (including quoted prices for similar securities, market indices, interest rates, credit risk, forward exchange rates, etc.) |
| § | | Level 3: Significant unobservable inputs (including Fund management’s assumptions in determining the fair value of investments) |
The inputs or methodology used for valuing securities are not necessarily an indication of the risk associated with investing in those securities.
The following is a summary of the inputs used to value the Fund’s holdings at June 30, 2019:
| | | | | | | | |
| Classification | | LEVEL 1 (Quoted Prices) | | | LEVEL 2
(Other Significant
Observable Inputs) | |
Securities | | | | | | | | |
Debt Securities | | | | | | | | |
Government | | $ | — | | | $ | 69,903,954 | |
Government-Related | | | — | | | | 15,611,196 | |
Securitized | | | — | | | | 57,283,365 | |
Corporate | | | — | | | | 136,061,546 | |
Short-term Investments | | | | | | | | |
Repurchase Agreements | | | — | | | | 12,445,000 | |
Money Market Fund | | | 1,136,645 | | | | — | |
| | | | | | | | |
Total Securities | | $ | 1,136,645 | | | $ | 291,305,061 | |
| | | | | | | | |
| | |
Other Investments | | | | | | | | |
Futures Contracts | | | | | | | | |
Depreciation | | $ | (910,877 | ) | | $ | — | |
Interest Rate Swaps | | | | | | | | |
Depreciation | | | — | | | | (48,750 | ) |
Currency Forward Contracts | | | | | | | | |
Appreciation | | | — | | | | 211,317 | |
Depreciation | | | — | | | | (200,699 | ) |
| | | | | | | | | |
NOTE 3—DERIVATIVE INSTRUMENTS
The Fund may enter into various transactions involving derivative instruments, including currency forward contracts, futures contracts, and swaps, in connection with its investment strategy. The Fund may use derivatives to minimize the impact of losses to one or more of its investments (as a “hedging technique”) or to implement its investment strategy.
The Fund may enter intoover-the-counter derivatives (each, an “OTC Derivative”), such as currency forward contracts. Each OTC Derivative is subject to a negotiated master agreement (based on a form published by the International Swaps and Derivatives Association (“ISDA”)) governing all OTC Derivatives between the Fund and the relevant dealer counterparty. The master agreements specify (i) events of default and other events permitting a party to terminate some or all of the OTC Derivatives thereunder and (ii) the process by which those OTC Derivatives will be valued for purposes of determining termination payments. If some or all of the OTC Derivatives under a master agreement
DODGE & COX GLOBAL BOND FUND§PAGE 13
NOTES TO CONSOLIDATED FINANCIAL STATEMENTS(unaudited)
are terminated because of an event of default or similar event, the values of all terminated OTC Derivatives must be netted to determine a single payment owed by one party to the other. To the extent amounts owed to the Fund by its counterparties are not collateralized, the Fund is at risk of those counterparties’ non-performance. The Fund attempts to mitigate counterparty credit risk by entering into OTC Derivatives only with counterparties it believes to be of good credit quality, by exchanging collateral, and by monitoring the financial stability of those counterparties.
Futures contracts Futures contracts involve an obligation to purchase or sell (depending on whether the Fund has entered a long or short futures contract, respectively) an asset at a future date, at a price set at the time of the contract. Upon entering into a futures contract, the Fund is required to deposit an amount of cash or liquid assets (referred to as initial margin) in a segregated account with the clearing broker. Subsequent payments (referred to as variation margin) to and from the clearing broker are made on a daily basis based on changes in the market value of futures contracts. Futures contracts are traded publicly and their market value changes daily. Changes in the market value of open futures contracts are recorded as unrealized appreciation or depreciation in the Consolidated Statement of Operations. Realized gains and losses on futures contracts are recorded in the Consolidated Statement of Operations at the closing or expiration of the contracts. Cash deposited with a broker as initial margin is recorded in the Consolidated Statement of Assets and Liabilities. A receivable and/or payable to brokers for daily variation margin is also recorded in the Consolidated Statement of Assets and Liabilities.
Investments in futures contracts may include certain risks, which may be different from, and potentially greater than, those of the underlying securities. To the extent the Fund uses futures, it is exposed to additional volatility and potential losses resulting from leverage.
The Fund entered into short Treasury futures contracts, short Euro Government Bond futures contracts, and short UK Gilt futures contracts to assist with the management of the portfolio’s interest rate exposure. During the six months ended June 30, 2019, these futures contracts had U.S. dollar notional values ranging from 16% to 19% of net assets.
Interest rate swaps Interest rate swaps are agreements that obligate two parties to exchange a series of cash flows at specified payment dates calculated by reference to specified interest rates, such as an exchange of floating rate payments for fixed rate payments. Upon entering into a centrally cleared interest rate swap, the Fund is required to post an amount of cash or liquid assets (referred to as initial margin) in a segregated account with the clearing broker. Subsequent payments (referred to as variation margin) to and from the clearing broker are made on a daily basis based on changes in the market value of each interest rate swap. Changes in the market value of open interest rate swaps are recorded as unrealized appreciation or depreciation in the Consolidated Statement of Operations. Realized gains and losses on interest rate swaps are recorded in the Consolidated Statement of Operations, both upon the exchange of cash flows on each specified payment date and upon the closing or expiration of the swap. Cash deposited with the clearing broker as initial margin is recorded in the Consolidated Statement of Assets and Liabilities. A receivable and/or payable to brokers for daily variation margin is also recorded in the Consolidated Statement of Assets and Liabilities.
Investments in interest rate swaps may include certain risks including unfavorable changes in interest rates, or a default or failure by the clearing broker or clearinghouse.
The Fund entered into interest rate swaps in connection with the management of the portfolio’s interest rate exposure. During the six months ended June 30, 2019, these interest rate swaps had U.S. dollar notional values up to 1% of net assets.
Currency forward contracts A currency forward contract represents an obligation to purchase or sell a specific foreign currency at a future date at a price set at the time of the contract. The values of currency forward contracts are adjusted daily based on the prevailing forward exchange rates of the underlying currencies. Changes in the value of open contracts are recorded as unrealized appreciation or depreciation in the Consolidated Statement of Operations. When a currency forward contract is closed, the Fund records a realized gain or loss in the Consolidated Statement of Operations equal to the difference between the value at the time the contract was opened and the value at the time it was closed.
Losses from these transactions may arise from unfavorable changes in currency values or if a counterparty does not perform under a contract’s terms.
The Fund entered into currency forward contracts to hedge direct and/or indirect foreign currency exposure to the Brazilian real, British pound, euro and Thai bhat. During the six months ended June 30, 2019, these currency forward contracts had U.S. dollar total values ranging from 11% to 14% of net assets.
Additional derivative information For financial reporting purposes, the Fund does not offset OTC Derivative assets and liabilities that are subject to a master netting arrangement in the Consolidated Statement of Assets and Liabilities. OTC Derivatives are presented in the Consolidated Statement of Assets and Liabilities as unrealized appreciation/(depreciation) on currency forward contracts. Cash collateral pledged or received by the Fund for OTC Derivatives, if any, is reported gross in the Consolidated Statement of Assets and Liabilities as cash pledged/(received) as collateral for OTC Derivatives. Derivative information by counterparty is presented in the Consolidated Portfolio of Investments.
The netting of assets and liabilities and the offsetting of collateral pledged or received are based on contractual netting/set-off provisions in the ISDA master agreement. The following table presents the Fund’s net exposure for OTC Derivatives that are subject to enforceable master netting arrangements as of June 30, 2019. The net amount represents the receivable from (payable to) the counterparty in the event of a default.
| | | | | | | | | | | | | | | | |
| Counterparty | | Gross
OTC Derivative Assets | | | Gross
OTC Derivative Liabilities | | | Cash Collateral Pledged / (Received)(a) | | | Net Amount | |
Bank of America | | $ | 71,649 | | | $ | (10,447 | ) | | $ | (61,202 | ) | | $ | — | |
Barclays | | | 34,395 | | | | (129,838 | ) | | | — | | | | (95,443 | ) |
Citibank | | | 105,273 | | | | (28,525 | ) | | | (76,748 | ) | | | — | |
Goldman Sachs | | | — | | | | (31,889 | ) | | | — | | | | (31,889 | ) |
| | | | | | | | | | | | | | | | |
Total | | $ | 211,317 | | | $ | (200,699 | ) | | $ | (137,950 | ) | | $ | (127,332 | ) |
| | | | | | | | | | | | | | | | |
| | | | | | | | | | | | | | | | | |
| (a) | Cash collateral pledged/(received) in excess of OTC Derivative assets/liabilities, if any, is not presented. Total cash collateral pledged/(received) is presented in the Consolidated Statement of Assets and Liabilities. |
PAGE 14§ DODGE & COX GLOBAL BOND FUND
NOTES TO CONSOLIDATED FINANCIAL STATEMENTS(unaudited)
NOTE 4—RELATED PARTY TRANSACTIONS
Management fees Under a written agreement approved by a unanimous vote of the Board of Trustees, the Fund pays a management fee monthly at an annual rate of 0.50% of the Fund’s average daily net assets to Dodge & Cox, investment manager of the Fund. Dodge & Cox has contractually agreed to reimburse the Fund for all ordinary expenses to the extent necessary to maintain the ratio of total operating expenses to average net assets (“net expense ratio”) at 0.45% through April 30, 2020. The term of the agreement is renewable annually thereafter unless terminated with 30 days’ written notice by either party prior to the end of the term.
Fund officers and trustees All officers and two of the trustees of the Trust are officers or employees of Dodge & Cox. The Trust pays a fee only to those trustees who are not affiliated with Dodge & Cox.
Share ownership At June 30, 2019, Dodge & Cox owned 6% of the Fund’s outstanding shares.
NOTE 5—INCOME TAX INFORMATION AND DISTRIBUTIONS TO SHAREHOLDERS
A provision for federal income taxes is not required since the Fund intends to continue to qualify as a regulated investment company under Subchapter M of the Internal Revenue Code and distribute all of its taxable income to shareholders. Distributions are determined in accordance with income tax regulations, and such amounts may differ from net investment income and realized gains for financial reporting purposes. The Fund may also designate a portion of the amount paid to redeeming shareholders as a distribution for tax purposes. Financial reporting records are adjusted for permanent book to tax differences at year end to reflect tax character. Book to tax differences are primarily due to differing treatments of wash sales, net short-term realized gain (loss), foreign currency realized gain (loss), straddles, derivatives, and distributions.
Distributions during the periods noted below were characterized as follows for federal income tax purposes:
| | | | | | | | |
| | | Six Months Ended June 30, 2019 | | | Year Ended
December 31, 2018 | |
Ordinary income | | | — | | | $ | 9,758,236 | |
| | | | | | ($ | 0.471 per share | ) |
Long-term capital gain | | | — | | | $ | 1,211,370 | |
| | | | | | ($ | 0.060 per share | ) |
The components of distributable earnings on a tax basis are reported as of the Fund’s most recent year end. At December 31, 2018, the tax basis components of distributable earnings were as follows:
| | | | |
Deferred loss(a) | | $ | (3,174,536 | ) |
At June 30, 2019, unrealized appreciation and depreciation for investments and derivatives based on cost for federal income tax purposes were as follows:
| | | | |
Tax cost | | $ | 282,652,421 | |
| | | | |
Unrealized appreciation | | | 12,024,071 | |
Unrealized depreciation | | | (3,183,795 | ) |
| | | | |
Net unrealized appreciation | | | 8,840,276 | |
| | | | | |
| (a) | Represents net realized specified loss and capital loss incurred between November 1, 2018 and December 31, 2018. As permitted by tax regulation, the Fund has elected to treat this loss as arising in 2019. |
Fund management has reviewed the tax positions for the open period (three years and four years, respectively, from filing the Fund’s federal and State tax returns) applicable to the Fund, and has determined that no provision for income tax is required in the Fund’s financial statements.
NOTE 6—LOAN FACILITIES
Pursuant to an exemptive order issued by the Securities and Exchange Commission (SEC), the Fund may participate in an interfund lending facility (Facility). The Facility allows the Fund to borrow money from or loan money to the Funds. Loans under the Facility are made for temporary or emergency purposes, such as to fund shareholder redemption requests. Interest on borrowings is the average of the current repurchase agreement rate and the bank loan rate. There was no activity in the Facility during the period.
All Funds in the Trust participate in a $500 million committed credit facility (Line of Credit) with State Street Bank and Trust Company, to be utilized for temporary or emergency purposes to fund shareholder redemptions or for other short-term liquidity purposes. The maximum amount available to the Fund is $250 million. Each Fund pays an annual commitment fee on itspro-rata portion of the Line of Credit. For the six months ended June 30, 2019, the Fund’s commitment fee amounted to $848 and is reflected as a Miscellaneous Expense in the Consolidated Statement of Operations. Interest on borrowings is charged at the prevailing rate. There were no borrowings on the Line of Credit during the period.
DODGE & COX GLOBAL BOND FUND§PAGE 15
NOTES TO CONSOLIDATED FINANCIAL STATEMENTS(unaudited)
NOTE 7—PURCHASES AND SALES OF INVESTMENTS
For the six months ended June 30, 2019, purchases and sales of securities, other than short-term securities and U.S. government securities, aggregated $38,734,924 and $29,461,232, respectively. For the six months ended June 30, 2019, purchases and sales of U.S. government securities aggregated $66,008,032 and $44,760,157, respectively.
NOTE 8—NEW ACCOUNTING GUIDANCE
In March 2017, the Financial Accounting Standards Board issued an update to amend the amortization period for certain purchased callable debt securities held at a premium. The amendments shorten the amortization period for premiums to the earliest call date, but do not require an accounting change for securities held at a discount. The amendments are effective for financial statements for fiscal years beginning after December 15, 2018, and interim periods within those fiscal years. The Fund’s adoption of the updated accounting standards on January 1, 2019 did not have a material impact on the Fund’s financial statements.
NOTE 9—SUBSEQUENT EVENTS
Fund management has determined that no material events or transactions occurred subsequent to June 30, 2019, and through the date of the Fund’s financial statements issuance, which require additional disclosure in the Fund’s financial statements.
PAGE 16§ DODGE & COX GLOBAL BOND FUND
CONSOLIDATED FINANCIAL HIGHLIGHTS(unaudited)
| | | | | | | | | | | | | | | | | | | | | | | | |
SELECTED DATA AND RATIOS (for a share outstanding throughout each period) | | Six Months Ended June 30, 2019 | | | Year Ended December 31, | | | Period from
May 1, 2014
(commencement of
Fund operations) to December 31, 2014 | |
| | 2018 | | | 2017 | | | 2016 | | | 2015 | |
Net asset value, beginning of period | | | $10.23 | | | | $10.92 | | | | $10.33 | | | | $9.67 | | | | $10.31 | | | | $10.73 | |
Income from investment operations: | | | | | | | | | | | | | | | | | | | | | | | | |
Net investment income | | | 0.22 | | | | 0.40 | | | | 0.37 | | | | 0.30 | | | | 0.34 | | | | 0.16 | |
Net realized and unrealized gain (loss) | | | 0.61 | | | | (0.56 | ) | | | 0.49 | | | | 0.54 | | | | (0.98 | ) | | | (0.44 | ) |
| | | | | | | | |
Total from investment operations | | | 0.83 | | | | (0.16 | ) | | | 0.86 | | | | 0.84 | | | | (0.64 | ) | | | (0.28 | ) |
| | | | | | | | |
Distributions to shareholders from: | | | | | | | | | | | | | | | | | | | | | | | | |
Net investment income | | | — | | | | (0.43 | ) | | | (0.26 | ) | | | (0.18 | ) | | | — | | | | (0.14 | ) |
Net realized gain | | | — | | | | (0.10 | ) | | | (0.01 | ) | | | — | | | | — | | | | — | |
| | | | | | | | |
Total distributions | | | — | | | | (0.53 | ) | | | (0.27 | ) | | | (0.18 | ) | | | — | | | | (0.14 | ) |
| | | | | | | | |
Net asset value, end of period | | | $11.06 | | | | $10.23 | | | | $10.92 | | | | $10.33 | | | | $9.67 | | | | $10.31 | |
| | | | | | | | |
Total return | | | 8.11 | % | | | (1.45 | )% | | | 8.31 | % | | | 8.64 | % | | | (6.21 | )% | | | (2.59 | )% |
Ratios/supplemental data: | | | | | | | | | | | | | | | | | | | | | | | | |
Net assets, end of period (millions) | | | $286 | | | | $226 | | | | $156 | | | | $110 | | | | $68 | | | | $65 | |
Ratio of expenses to average net assets | | | 0.45 | %(a) | | | 0.45 | % | | | 0.49 | % | | | 0.60 | % | | | 0.60 | % | | | 0.60 | %(a) |
Ratio of expenses to average net assets,
before reimbursement by investment manager | | | 0.92 | %(a) | | | 0.92 | % | | | 1.06 | % | | | 1.33 | % | | | 1.41 | % | | | 2.18 | %(a) |
Ratio of net investment income to average net assets | | | 4.57 | %(a) | | | 4.15 | % | | | 3.51 | % | | | 3.77 | % | | | 3.39 | % | | | 2.83 | %(a) |
Portfolio turnover rate | | | 31 | % | | | 55 | % | | | 46 | % | | | 73 | % | | | 55 | % | | | 36 | % |
See accompanying Notes to Consolidated Financial Statements
DODGE & COX GLOBAL BOND FUND§PAGE 17
FUND HOLDINGS
The Fund provides a complete list of its holdings on a quarterly basis by filing the lists with the SEC on Form N-CSR (as of the end of the second and fourth quarters) and on Part F ofForm N-PORT (as of the end of the first and third quarters). Shareholders may view the Fund’s Form N-CSR and Part F of Form N-PORT on the SEC’s website at sec.gov. A list of the Fund’s quarter-end holdings is also available at dodgeandcox.com on or about the 15th day following each quarter end and remains available on the website until the list is updated for the subsequent quarter.
PROXY VOTING
For a free copy of the Fund’s proxy voting policies and procedures, please call 800-621-3979, visit the Fund’s website at www.dodgeandcox.com, or visit the SEC’s website at sec.gov. Information regarding how the Fund voted proxies relating to portfolio securities during the most recent 12-month period ending June 30 is also available at dodgeandcox.com or at sec.gov.
HOUSEHOLD MAILINGS
The Fund routinely mails shareholder reports and summary prospectuses to shareholders and, on occasion, proxy statements. In order to reduce the volume of mail, when possible, only one copy of these documents will be sent to shareholders who are part of the same family and share the same residential address.
If you have a direct account with the Funds and you do not want the mailing of shareholder reports and summary prospectuses combined with other members in your household, contact the Funds at 800-621-3979. Your request will be implemented within 30 days.
PAGE 18§ DODGE & COX GLOBAL BOND FUND
THIS PAGE INTENTIONALLY LEFT BLANK
DODGE & COX GLOBAL BOND FUND§PAGE 19
dodgeandcox.com
For Fund literature, transactions, and account
information, please visit the Funds’ website.
or write or call:
DODGE & COX FUNDS
c/o DST Asset Manager Solutions, Inc.
P.O. Box 219502
Kansas City, Missouri 64121-9502
(800) 621-3979
INVESTMENT MANAGER
Dodge & Cox
555 California Street, 40th Floor
San Francisco, California 94104
(415) 981-1710
This report is submitted for the general information of the shareholders of the Fund. The report is not authorized for distribution to prospective investors in the Fund unless it is accompanied by a current prospectus.
This report reflects our views, opinions, and portfolio holdings as of June 30, 2019, the end of the reporting period. Any such views are subject to change at any time based upon market or other conditions and Dodge & Cox disclaims any responsibility to update such views. These views may not be relied on as investment advice and, because investment decisions for a Dodge & Cox Fund are based on numerous factors, may not be relied on as an indication of trading intent on behalf of any Dodge & Cox Fund.
ITEM 2. CODE OF ETHICS.
Not applicable for semi-annual report filings.
ITEM 3. AUDIT COMMITTEE FINANCIAL EXPERT.
Not applicable for semi-annual report filings.
ITEM 4. PRINCIPAL ACCOUNTANT FEES AND SERVICES.
Not applicable for semi-annual report filings.
ITEM 5. AUDIT COMMITTEE OF LISTED REGISTRANTS.
Not applicable.
ITEM 6. INVESTMENTS.
Not applicable. The complete schedule of investments is included in Item 1 of this FormN-CSR.
ITEM 7. DISCLOSURE OF PROXY VOTING POLICIES AND PROCEDURES FORCLOSED-END MANAGEMENT INVESTMENT COMPANIES.
Not applicable.
ITEM 8. PORTFOLIO MANAGERS OFCLOSED-END MANAGEMENT INVESTMENT COMPANIES.
Not applicable.
ITEM 9. PURCHASES OF EQUITY SECURITIES BYCLOSED-END MANAGEMENT INVESTMENT COMPANY AND AFFILIATED PURCHASERS.
Not applicable.
ITEM 10. SUBMISSION OF MATTERS TO A VOTE OF SECURITY HOLDERS.
During the reporting period, there were no material changes to the procedures by which shareholders may recommend nominees to the registrant’s Board of Trustees.
ITEM 11. CONTROLS AND PROCEDURES.
(a) An evaluation was performed within 90 days of the filing of this report, under the supervision and with the participation of the registrant’s management, including the principal executive officer and principal financial officer, of the effectiveness of the design and operation of the registrant’s disclosure controls and procedures. Based on that evaluation, the principal executive officer and principal financial officer concluded that the registrant’s disclosure controls and procedures were effective.
(b) The registrant’s principal executive officer and principal financial officer are aware of no changes in the registrant’s internal control over financial reporting that occurred during the period covered by this report that have materially affected, or are reasonably likely to materially affect, the registrant’s internal control over financial reporting.
ITEM 12. DISCLOSURE OF SECURITIES LENDING ACTIVITIES FORCLOSED-END MANAGEMENT INVESTMENT COMPANIES.
Not applicable.
ITEM 13. EXHIBITS.
| | |
| |
| (a)(1) | | Not applicable for semi-annual report filings. |
| |
| (a)(2) | | Certifications pursuant to Section 302 of the Sarbanes-Oxley Act of 2002 are attached. (EX.99A) |
| |
| (a)(3) | | Not applicable. |
| |
| (b) | | Certifications pursuant to Section 906 of the Sarbanes-Oxley Act of 2002 are attached. (EX.99B) |
SIGNATURES
Pursuant to the requirements of the Securities Exchange Act of 1934 and the Investment Company Act of 1940, the registrant has duly caused this report to be signed on its behalf by the undersigned, thereunto duly authorized.
| | |
Dodge & Cox Funds |
| |
By | | /s/ Charles F. Pohl |
| | Charles F. Pohl |
| | Chairman—Principal Executive Officer |
Date August 22, 2019
Pursuant to the requirements of the Securities Exchange Act of 1934 and the Investment Company Act of 1940, this report has been signed below by the following persons on behalf of the registrant and in the capacities and on the dates indicated.
| | |
Dodge & Cox Funds |
| |
By | | /s/ Charles F. Pohl |
| | Charles F. Pohl |
| | Chairman—Principal Executive Officer |
| |
By | | /s/ David H. Longhurst |
| | David H. Longhurst |
| | Treasurer—Principal Financial Officer |
Date August 22, 2019