UNITED STATES
SECURITIES AND EXCHANGE COMMISSION
Washington, D.C. 20549
FORM N-CSR
CERTIFIED SHAREHOLDER REPORT OF REGISTERED
MANAGEMENT INVESTMENT COMPANIES
Investment Company Act file number 811-00173
DODGE & COX FUNDS
(Exact name of registrant as specified in charter)
555 California Street, 40th Floor
San Francisco, CA 94104
(Address of principal executive offices) (Zip code)
Roberta R.W. Kameda, Esq.
555 California Street, 40th Floor
San Francisco, CA 94104
(Name and address of agent for service)
Registrant’s telephone number, including area code: 415-981-1710
Date of fiscal year end: DECEMBER 31, 2018
Date of reporting period: JUNE 30, 2018
Form N-CSR is to be used by management investment companies to file reports with the Commission not later than 10 days after the transmission to stockholders of any report that is required to be transmitted to stockholders under Rule 30e-1 under the Investment Company Act of 1940 (17 CFR 270.30e-1). The Commission may use the information provided on Form N-CSR in its regulatory, disclosure review, inspection, and policymaking roles.
A registrant is required to disclose the information specified by Form N-CSR, and the Commission will make this information public. A registrant is not required to respond to the collection of information contained in Form N-CSR unless the Form displays a currently valid Office of Management and Budget (“OMB”) control number. Please direct comments concerning the accuracy of the information collection burden estimate and any suggestions for reducing the burden to Secretary, Securities and Exchange Commission, 450 Fifth Street, NW, Washington, DC 20549-0609. The OMB has reviewed this collection of information under the clearance requirements of 44 U.S.C. ss. 3507.
| ITEM 1. | REPORTS TO STOCKHOLDERS. |
The following are the June 30, 2018 semi-annual reports for the Dodge & Cox Funds, a Delaware statutory trust, consisting of six series: Dodge & Cox Stock Fund, Dodge & Cox Global Stock Fund, Dodge & Cox International Stock Fund, Dodge & Cox Balanced Fund, Dodge & Cox Income Fund, and Dodge & Cox Global Bond Fund. The reports of each series were transmitted to their respective shareholders on August 16, 2018.

DODGE & COX FUNDS®
Semi-Annual Report
June 30, 2018
Stock Fund
ESTABLISHED 1965
TICKER: DODGX
6/18 SF SAR  Printed on recycled paper
TO OUR SHAREHOLDERS
The Dodge & Cox Stock Fund had a total return of 1.0% for the six months ended June 30, 2018, compared to a return of 2.6% for the S&P 500 Index.
MARKET COMMENTARY
During the first half of 2018, U.S. growth stocks (the higher valuation portion of the equity market) outperformed value stocks (the lower valuation portion) by nine percentage points,(a) continuing a long-term trend. Since the end of 2014, growth has bested value by 32 percentage points;(b) growth-oriented companies in sectors and industries associated with technology—most notably the “FAANG” stocks (Facebook, Amazon, Apple, Netflix, Google)—have led markets.
Dodge & Cox’s approach is value oriented, and the Fund has performed well compared to the U.S. value investment universe—outperforming the Russell 1000 Value Index by 12 percentage points over the past three and a half years. However, the broad-based S&P 500, which was boosted by growth stocks, outperformed the Fund by four percentage points over this same period.(c)
INVESTMENT STRATEGY
We understand that there are periods when value is trumped by growth. However, we believe the current divergence may narrow. In the United States, the valuation differential between growth and value stocks is wider than usual, with growth stocks trading at historically large premiums. Returns of value-focused strategies have been influenced by valuation spreads, and we believe current conditions are favorable for value stocks to rebound. While investors may not immediately recognize the intrinsic value of companies in relation to sales, cash flows, earnings, or book value, market prices over time tend to be driven by long-term fundamentals.
In the first six months of 2018, we made gradual portfolio adjustments in response to diverging valuations. For example, we sold selected technology and retail holdings that had performed strongly, such as Walmart.(d) In recent years, Walmart—the largest retailer in the world—has faced additional competition from large online retailers, such as Amazon. In 2015, Walmart announced a transformation plan that focused on increasing investment in labor, technology, and sales growth; the company successfully executed on these initiatives and improved its same store sales. In addition, Walmart restructured and expanded its ecommerce division by entering into a partnership with JD.com (China’s largest retailer), purchasing Jet.com, and naming Jet founder Marc Lore as head of Walmart’s ecommerce. Under Lore’s leadership, U.S. online sales growth year over year increased from 29% at the end of fiscal 2016 to at least 50% in each of the first three quarters of fiscal 2017.
On the heels of these positive developments, Walmart’s share price performed strongly, and we sold the position in early 2018. We continue to find selected opportunities in industries such as Media and Banks.
Media
Within Consumer Discretionary, Media is an important overweight position: 11%(e) of the Fund compared to 2% of the S&P 500 on June 30. The media landscape is evolving due to new direct-to-consumer entrants, changes in consumer viewing and listening habits, shifting revenue streams, and industry consolidation. Uncertainty surrounding pending merger and acquisition (M&A) transactions and potential regulatory incursions (e.g., unbundling, forced wholesale access, price regulation on broadband) pose risks to the Fund’s media investments. Nevertheless, we recently added to Comcast, Time Warner (before it was acquired by AT&T), and Charter Communications after weighing each company’s long-term fundamentals against its attractive valuation.
Comcast
Comcast—the largest U.S. cable provider—has been held in the Fund since 2002; over the years, we have actively added to and trimmed from the position based on relative valuation. In the first half of 2018, Comcast’s share price declined 17% amid concerns about its $31 billion cash offer to acquire UK-based pay-television company Sky PLC and its $65 billion all-cash bid for a majority of Twenty-First Century Fox’s assets.
Given these developments, our equity and fixed income teams worked together to evaluate Comcast’s risk/return profiles for a range of potential M&A outcomes. We spoke with company management about their overall M&A strategy and reconfirmed our longstanding view that they are skilled at allocating capital to create shareholder value. We believe the Sky acquisition is strategically sound because it would expand Comcast’s international presence and provide greater scale to amortize content costs. In July, Comcast dropped its bid for Fox and continued its pursuit of Sky.
In our opinion, the market has overly penalized Comcast’s share price as a result of concerns about bidding wars and subscriber growth. Trading at a multi-decade low valuation versus the S&P 500, Comcast was our largest addition in the Media industry during the first six months of 2018. The company has a de-facto local monopoly on broadband internet services in many parts of the United States and, despite talk of “cord cutting,” has the potential to grow through increased broadband penetration and pricing power in residential and business services. We believe NBC Universal (owned by Comcast) can increase its operating profit through affiliate fee increases at NBC and continued investment in its theme parks. In addition, owner-operator Brian Roberts has created significant shareholder value and leads a strong management team. Comcast, the Fund’s second-largest holding, was a 3.8% position on June 30.
Wells Fargo
During the first half of 2018, we opportunistically added to Wells Fargo (down 7%), which was weak among bank stocks and detracted from performance. In February, Wells Fargo entered into a consent agreement with the Federal Reserve (Fed) that, among
PAGE 2 § DODGE & COX STOCK FUND
other things, placed restrictions on the bank’s asset growth (capped at $1.952 trillion). This regulatory agreement stemmed from Wells Fargo’s previously disclosed improper sales practices.
Since 2016, Wells Fargo has made substantial progress improving its governance, compliance controls, and operational risk management. Notably, the leadership and composition of the company’s board has improved, including the election of six new independent directors in 2017. Management has affirmed its commitment to have third parties conduct an initial risk management review by the end of 2018. The company has settled with regulators regarding its auto insurance and mortgage sales practices and has also resolved class-action lawsuits with shareholders and consumers. Furthermore, Wells Fargo passed the Fed’s annual industry stress test in June and received approval to use $32.9 billion for dividends and share buybacks over the next 12 months, representing a significant return of capital to shareholders.
After a comprehensive review, we believe Wells Fargo’s superior franchise, deep management team, track record of generating higher returns than other banks, and attractive valuation at 1.5 times book value make it a compelling long-term investment opportunity. On June 30, Wells Fargo was the Fund’s largest holding (a 3.9% position).
IN CLOSING
Despite concerns about tariffs and trade wars, we remain optimistic about the long-term outlook for the U.S. economy and the portfolio, which trades at a discount to the overall market (13.9 times forward earnings compared to 17.1 times for the S&P 500).
As a result of individual security selection, the Fund remains tilted toward more economically sensitive companies: as of June 30, Financials comprised 26% of the portfolio, Information Technology accounted for 16%, Consumer Discretionary was 15%, and Energy represented 9%. We believe the Fund is well positioned based on our view that longer-term global economic growth will be better than many investors expect, interest rates will continue to rise, and the outlook for corporate earnings remains attractive.
Patience, persistence, and a long-term investment horizon are essential to our investment approach. We encourage our shareholders to take a similar view. Thank you for your continued confidence in our firm. As always, we welcome your comments and questions.
For the Board of Trustees,
| | |
 | |  |
Charles F. Pohl, Chairman | | Dana M. Emery, President |
August 1, 2018
| (a) | | The Russell 1000 Growth Index had a total return of 7.3% compared to –1.7% for the Russell 1000 Value Index during the first six months of 2018. |
| (b) | | The Russell 1000 Growth Index had a total return of 58.0% compared to 26.1% for the Russell 1000 Value Index from December 31, 2014 through June 30, 2018. |
| (c) | | The Dodge & Cox Stock Fund had a total return of 38.4% compared to 26.1% for the Russell 1000 Value Index and 42.0% for the S&P 500 from December 31, 2014 through June 30, 2018. |
| (d) | | The use of specific examples does not imply that they are more or less attractive investments than the portfolio’s other holdings. |
| (e) | | Unless otherwise specified, all weightings and characteristics are as of June 30, 2018. |
DODGE & COX STOCK FUND §PAGE 3
YEAR-TO-DATE PERFORMANCE REVIEW
The Fund underperformed the S&P 500 by 1.7 percentage points year to date.
Key Detractors from Relative Results
| | § | | Similar to full-year 2017, the strong performance of several large internet and technology stocks not held by the Fund (including Amazon, Apple, Facebook, and Netflix) negatively impacted relative results. This was significant in both the Information Technology and Consumer Discretionary sectors. | |
| | § | | Within Information Technology (holdings up 6% compared to up 11% for the S&P 500 sector), Micro Focus International (down 48%) was particularly weak. | |
| | § | | Within Consumer Discretionary (holdings up 2% compared to up 12% for the S&P 500 sector), media holdings DISH Network (down 30%), Comcast (down 17%), and Charter Communications (down 13%) performed poorly. | |
| | § | | The Fund’s average overweight position (28% versus 15% for the S&P 500 sector) in the Financials sector detracted. Goldman Sachs (down 13%) and MetLife (down 12%) were weak. | |
| | § | | Cigna (down 16%) and Johnson Controls International (down 11%) also lagged. | |
Key Contributors to Relative Results
| | § | | In the Consumer Staples sector, the Fund’s underweight position (average less than 1% versus 7% for the S&P 500 sector) helped results. The Fund’s lack of holdings in the Tobacco and Household Products industries, down 20% and 12% in the Index, respectively, was a meaningful positive. | |
| | § | | A higher average weighting (8% versus 6%) and strong returns from holdings in the Energy sector (up 16% compared to up 7% for the S&P 500 sector) aided performance. Anadarko Petroleum (up 38%), National Oilwell Varco (up 21%), and Apache (up 12%) were key contributors. | |
| | § | | Twenty-First Century Fox (up 45%) and GlaxoSmithKline (up 17%) also contributed. | |
KEY CHARACTERISTICS OF DODGE & COX
Independent Organization
Dodge & Cox is one of the largest privately owned investment managers in the world. We remain committed to independence, with a goal of providing the highest quality investment management service to our existing clients.
Over 85 Years of Investment Experience
Dodge & Cox was founded in 1930. We have a stable and well-qualified team of investment professionals, most of whom have spent their entire careers at Dodge & Cox.
Experienced Investment Team
The U.S. Equity Investment Committee, which is the decision-making body for the Stock Fund, is a nine-member committee with an average tenure at Dodge & Cox of 24 years.
One Business with a Single Research Office
Dodge & Cox manages equity (domestic, international, and global), fixed income (domestic and global), and balanced investments, operating from one office in San Francisco.
Consistent Investment Approach
Our team decision-making process involves thorough, bottom-up fundamental analysis of each investment.
Long-Term Focus and Low Expenses
We invest with a three- to five-year investment horizon, which has historically resulted in low turnover relative to our peers. We manage Funds that maintain low expense ratios.
Risks: The Fund is subject to market risk, meaning holdings in the Fund may decline in value for extended periods due to the financial prospects of individual companies, or due to general market and economic conditions. Please read the prospectus and summary prospectus for specific details regarding the Fund’s risk profile.
PAGE 4 § DODGE & COX STOCK FUND
GROWTH OF $10,000 OVER 10 YEARS
FOR AN INVESTMENT MADE ON JUNE 30, 2008
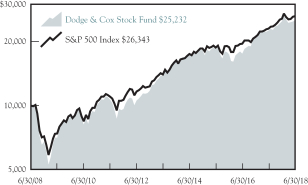
AVERAGE ANNUAL TOTAL RETURN
FOR PERIODS ENDED JUNE 30, 2018
| | | | | | | | | | | | | | | | |
| | | 1 Year | | | 5 Years | | | 10 Years | | | 20 Years | |
Dodge & Cox Stock Fund | | | 11.87 | % | | | 12.81 | % | | | 9.69 | % | | | 9.16 | % |
S&P 500 Index | | | 14.37 | | | | 13.42 | | | | 10.17 | | | | 6.46 | |
Returns represent past performance and do not guarantee future results. Investment return and share price will fluctuate with market conditions, and investors may have a gain or loss when shares are sold. Fund performance changes over time and currently may be significantly lower than stated. Performance is updated and published monthly. Visit the Fund’s website at dodgeandcox.com or call 800-621-3979 for current performance figures.
The Fund’s total returns include the reinvestment of dividend and capital gain distributions, but have not been adjusted for any income taxes payable by shareholders on these distributions or on Fund share redemptions. Index returns include dividends but, unlike Fund returns, do not reflect fees or expenses. The S&P 500 Index is a market capitalization-weighted index of 500 large-capitalization stocks commonly used to represent the U.S. equity market.
S&P 500® is a trademark of S&P Global Inc.
FUND EXPENSE EXAMPLE
As a Fund shareholder, you incur ongoing Fund costs, including management fees and other Fund expenses. All mutual funds have ongoing costs, sometimes referred to as operating expenses. The following example shows ongoing costs of investing in the Fund and can help you understand these costs and compare them with those of other mutual funds. The example assumes a $1,000 investment held for the six months indicated.
ACTUAL EXPENSES
The first line of the table below provides information about actual account values and expenses based on the Fund’s actual returns. You may use the information in this line, together with your account balance, to estimate the expenses that you paid over the period. Simply divide your account value by $1,000 (for example, an $8,600 account value divided by $1,000 = 8.6), then multiply the result by the number in the first line under the heading “Expenses Paid During Period” to estimate the expenses you paid on your account during this period.
HYPOTHETICAL EXAMPLE FOR COMPARISON WITH OTHER MUTUAL FUNDS
Information on the second line of the table can help you compare ongoing costs of investing in the Fund with those of other mutual funds. This information may not be used to estimate the actual ending account balance or expenses you paid during the period. The hypothetical “Ending Account Value” is based on the actual expense ratio of the Fund and an assumed 5% annual rate of return before expenses (not the Fund’s actual return). The amount under the heading “Expenses Paid During Period” shows the hypothetical expenses your account would have incurred under this scenario. You can compare this figure with the 5% hypothetical examples that appear in shareholder reports of other mutual funds.
| | | | | | | | | | | | |
Six Months Ended
June 30, 2018 | | Beginning Account Value
1/1/2018 | | | Ending Account Value
6/30/2018 | | | Expenses Paid
During Period* | |
Based on Actual Fund Return | | $ | 1,000.00 | | | $ | 1,009.50 | | | $ | 2.61 | |
Based on Hypothetical 5% Yearly Return | | | 1,000.00 | | | | 1,022.20 | | | | 2.63 | |
| * | | Expenses are equal to the Fund’s annualized expense ratio of 0.52%, multiplied by the average account value over the period, multiplied by 181/365 (to reflect the one-half year period). |
The expenses shown in the table highlight ongoing costs only and do not reflect any transactional fees or account maintenance fees. Though other mutual funds may charge such fees, please note that the Fund does not charge transaction fees (e.g., redemption fees, sales loads) or universal account maintenance fees (e.g., small account fees).
DODGE & COX STOCK FUND §PAGE 5
| | | | |
| FUND INFORMATION (unaudited) | | | June 30, 2018 | |
| | | | |
| GENERAL INFORMATION | | | |
Net Asset Value Per Share | | | $201.86 | |
Total Net Assets (billions) | | | $70.5 | |
Expense Ratio | | | 0.52% | |
Portfolio Turnover Rate (1/1/18 to 6/30/18, unannualized) | | | 8% | |
30-Day SEC Yield(a) | | | 1.29% | |
Active Share(b) | | | 80% | |
Number of Companies | | | 65 | |
Fund Inception | | | 1965 | |
No sales charges or distribution fees | | | | |
Investment Manager: Dodge & Cox, San Francisco. Managed by the U.S. Equity Investment Committee, whose nine members’ average tenure at Dodge & Cox is 24 years.
| | | | | | | | |
| PORTFOLIO CHARACTERISTICS | | Fund | | | S&P 500 | |
Median Market Capitalization (billions) | | | $45 | | | | $21 | |
Weighted Average Market Capitalization (billions) | | | $144 | | | | $217 | |
Price-to-Earnings Ratio(c) | | | 13.9x | | | | 17.1x | |
Foreign Securities not in the S&P 500(d) | | | 11.0% | | | | 0.0% | |
| | | | |
| TEN LARGEST HOLDINGS (%)(e) | | Fund | |
Wells Fargo & Co. | | | 3.9 | |
Comcast Corp. | | | 3.8 | |
Twenty-First Century Fox, Inc. | | | 3.6 | |
Capital One Financial Corp. | | | 3.5 | |
Charles Schwab Corp. | | | 3.4 | |
Microsoft Corp. | | | 3.3 | |
Bank of America Corp. | | | 3.2 | |
Alphabet, Inc. | | | 3.1 | |
Charter Communications, Inc. | | | 3.0 | |
Anadarko Petroleum Corp. | | | 2.9 | |
| | | | | | | | |
| SECTOR DIVERSIFICATION (%) | | Fund | | | S&P 500 | |
Financials | | | 26.3 | | | | 13.8 | |
Health Care | | | 22.6 | | | | 14.1 | |
Information Technology | | | 16.4 | | | | 26.0 | |
Consumer Discretionary | | | 14.6 | | | | 12.9 | |
Energy | | | 9.2 | | | | 6.3 | |
Industrials | | | 4.9 | | | | 9.5 | |
Telecommunication Services | | | 2.8 | | | | 2.0 | |
Materials | | | 1.0 | | | | 2.6 | |
Consumer Staples | | | 0.2 | | | | 7.0 | |
Utilities | | | 0.0 | | | | 2.9 | |
Real Estate | | | 0.0 | | | | 2.9 | |
| (a) | SEC Yield is an annualization of the Fund’s net investment income for the trailing 30-day period. Dividends paid by the Fund may be higher or lower than implied by the SEC Yield. |
| (b) | Active share is a measure of how much an investment portfolio differs from its benchmark index, based on a scale of 0% (complete overlap with the index) to 100% (no overlap). Overlap for each security in the Fund is the lower of either its percentage weight in the Fund or its percentage weight in the relevant index. The Stock Fund’s total overlap with the S&P 500 is the sum of each security’s calculated overlap. |
| (c) | Price-to-earnings (P/E) ratios are calculated using 12-month forward earnings estimates from third-party sources. |
| (d) | Foreign securities are U.S. dollar denominated. |
| (e) | The Fund’s portfolio holdings are subject to change without notice. The mention of specific securities is not a recommendation to buy, sell, or hold any particular security and is not indicative of Dodge & Cox’s current or future trading activity. |
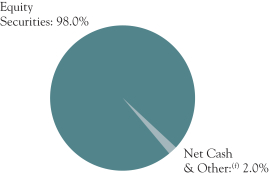
| (f) | Net Cash & Other includes cash, short-term investments, derivatives, receivables, and payables. |
PAGE 6 § DODGE & COX STOCK FUND
| | | | |
| PORTFOLIO OF INVESTMENTS (unaudited) | | | June 30, 2018 | |
| | | | | | | | |
| COMMON STOCKS: 98.0% | | | | | | |
| | |
| | | SHARES | | | VALUE | |
| CONSUMER DISCRETIONARY: 14.6% | |
AUTOMOBILES & COMPONENTS: 0.3% | |
Harley-Davidson, Inc. | | | 5,581,047 | | | $ | 234,850,458 | |
|
CONSUMER DURABLES & APPAREL: 0.5% | |
Mattel, Inc.(a)(b) | | | 20,504,501 | | | | 336,683,906 | |
| | |
MEDIA: 11.1% | | | | | | | | |
Charter Communications, Inc., Class A(a) | | | 7,233,786 | | | | 2,121,018,393 | |
Comcast Corp., Class A | | | 81,005,794 | | | | 2,657,800,101 | |
DISH Network Corp., Class A(a) | | | 9,976,176 | | | | 335,299,276 | |
News Corp., Class A | | | 7,528,790 | | | | 116,696,245 | |
Twenty-First Century Fox, Inc., Class A | | | 42,510,126 | | | | 2,112,328,161 | |
Twenty-First Century Fox, Inc., Class B | | | 9,300,600 | | | | 458,240,562 | |
| | | | | | | | |
| | | | | | | 7,801,382,738 | |
RETAILING: 2.7% | | | | | | | | |
Booking Holdings, Inc.(a) | | | 406,600 | | | | 824,214,794 | |
Qurate Retail, Inc., Series A(a) | | | 22,509,076 | | | | 477,642,593 | |
Target Corp. | | | 7,728,254 | | | | 588,274,694 | |
| | | | | | | | |
| | | | | | | 1,890,132,081 | |
| | | | | | | | |
| | | | | | | 10,263,049,183 | |
| CONSUMER STAPLES: 0.2% | |
FOOD, BEVERAGE & TOBACCO: 0.2% | |
Molson Coors Brewing Company, Class B | | | 1,843,925 | | | | 125,460,657 | |
| | |
| ENERGY: 9.2% | | | | | | | | |
Anadarko Petroleum Corp.(b) | | | 27,357,621 | | | | 2,003,945,738 | |
Apache Corp.(b) | | | 24,184,032 | | | | 1,130,603,496 | |
Baker Hughes, a GE Company | | | 25,498,040 | | | | 842,200,261 | |
Concho Resources, Inc.(a) | | | 2,550,500 | | | | 352,861,675 | |
National Oilwell Varco, Inc.(b) | | | 19,498,800 | | | | 846,247,920 | |
Occidental Petroleum Corp. | | | 3,044,726 | | | | 254,782,672 | |
Schlumberger, Ltd. (Curacao/United States) | | | 13,905,645 | | | | 932,095,385 | |
Weatherford International PLC(a) (Ireland) | | | 29,359,600 | | | | 96,593,084 | |
| | | | | | | | |
| | | | | | | 6,459,330,231 | |
| FINANCIALS: 26.3% | | | | | | | | |
BANKS: 10.3% | | | | | | | | |
Bank of America Corp. | | | 80,235,100 | | | | 2,261,827,469 | |
BB&T Corp. | | | 11,315,944 | | | | 570,776,215 | |
JPMorgan Chase & Co. | | | 16,329,700 | | | | 1,701,554,740 | |
Wells Fargo & Co. | | | 49,727,141 | | | | 2,756,872,697 | |
| | | | | | | | |
| | | | | | | 7,291,031,121 | |
DIVERSIFIED FINANCIALS: 13.4% | |
American Express Co. | | | 16,413,200 | | | | 1,608,493,600 | |
Bank of New York Mellon Corp. | | | 27,262,624 | | | | 1,470,273,312 | |
Capital One Financial Corp.(b) | | | 26,775,511 | | | | 2,460,669,461 | |
Charles Schwab Corp. | | | 47,605,000 | | | | 2,432,615,500 | |
Goldman Sachs Group, Inc. | | | 6,699,500 | | | | 1,477,708,715 | |
| | | | | | | | |
| | | | | | | 9,449,760,588 | |
INSURANCE: 2.6% | |
AEGON NV (Netherlands) | | | 71,237,724 | | | | 421,727,326 | |
Brighthouse Financial, Inc.(a) | | | 2,099,363 | | | | 84,121,476 | |
MetLife, Inc. | | | 30,428,900 | | | | 1,326,700,040 | |
| | | | | | | | |
| | | | | | | 1,832,548,842 | |
| | | | | | | | |
| | | | | | | 18,573,340,551 | |
| HEALTH CARE: 22.6% | | | | | | | | |
HEALTH CARE EQUIPMENT & SERVICES: 7.6% | |
Cigna Corp. | | | 6,191,117 | | | | 1,052,180,334 | |
Danaher Corp. | | | 3,229,500 | | | | 318,687,060 | |
Express Scripts Holding Co.(a) | | | 25,487,758 | | | | 1,967,909,795 | |
Medtronic PLC (Ireland) | | | 11,373,400 | | | | 973,676,774 | |
UnitedHealth Group, Inc. | | | 4,249,260 | | | | 1,042,513,449 | |
| | | | | | | | |
| | | | | | | 5,354,967,412 | |
| | | | | | | | |
| | |
| | | SHARES | | | VALUE | |
PHARMACEUTICALS, BIOTECHNOLOGY & LIFE SCIENCES: 15.0% | |
Alnylam Pharmaceuticals, Inc.(a) | | | 2,813,861 | | | $ | 277,137,170 | |
AstraZeneca PLC ADR (United Kingdom) | | | 34,646,973 | | | | 1,216,455,222 | |
Bristol-Myers Squibb Co. | | | 19,848,739 | | | | 1,098,429,216 | |
Eli Lilly and Co. | | | 16,568,419 | | | | 1,413,783,193 | |
Gilead Sciences, Inc. | | | 10,745,612 | | | | 761,219,154 | |
GlaxoSmithKline PLC ADR (United Kingdom) | | | 32,000,000 | | | | 1,289,920,000 | |
Merck & Co., Inc. | | | 1,131,632 | | | | 68,690,063 | |
Novartis AG ADR (Switzerland) | | | 21,730,200 | | | | 1,641,499,308 | |
Roche Holding AG ADR (Switzerland) | | | 42,192,699 | | | | 1,165,784,273 | |
Sanofi ADR (France) | | | 40,619,428 | | | | 1,625,183,314 | |
| | | | | | | | |
| | | | | | | 10,558,100,913 | |
| | | | | | | | |
| | | | | | | 15,913,068,325 | |
| INDUSTRIALS: 4.9% | | | | | | | | |
CAPITAL GOODS: 1.7% | | | | | | | | |
Johnson Controls International PLC (Ireland) | | | 36,754,251 | | | | 1,229,429,696 | |
| | |
TRANSPORTATION: 3.2% | | | | | | | | |
FedEx Corp. | | | 6,288,999 | | | | 1,427,980,113 | |
Union Pacific Corp. | | | 5,837,300 | | | | 827,028,664 | |
| | | | | | | | |
| | | | | | | 2,255,008,777 | |
| | | | | | | | |
| | | | | | | 3,484,438,473 | |
| INFORMATION TECHNOLOGY: 16.4% | |
SEMICONDUCTORS & SEMICONDUCTOR EQUIPMENT: 0.5% | |
Maxim Integrated Products, Inc. | | | 5,795,475 | | | | 339,962,564 | |
|
SOFTWARE & SERVICES: 8.8% | |
Alphabet, Inc., Class A(a) | | | 82,500 | | | | 93,158,175 | |
Alphabet, Inc., Class C(a) | | | 1,886,153 | | | | 2,104,286,594 | |
Dell Technologies, Inc., Class V(a) | | | 9,452,510 | | | | 799,493,296 | |
Micro Focus International PLC ADR (United Kingdom) | | | 20,522,377 | | | | 354,421,451 | |
Microsoft Corp. | | | 23,231,000 | | | | 2,290,808,910 | |
Synopsys, Inc.(a) | | | 3,454,669 | | | | 295,616,026 | |
VMware, Inc.(a) | | | 2,120,000 | | | | 311,576,400 | |
| | | | | | | | |
| | | | | | | 6,249,360,852 | |
TECHNOLOGY, HARDWARE & EQUIPMENT: 7.1% | |
Cisco Systems, Inc. | | | 25,225,111 | | | | 1,085,436,526 | |
Hewlett Packard Enterprise Co.(b) | | | 84,295,793 | | | | 1,231,561,536 | |
HP Inc. | | | 51,646,578 | | | | 1,171,860,855 | |
Juniper Networks, Inc.(b) | | | 24,633,165 | | | | 675,441,384 | |
TE Connectivity, Ltd. (Switzerland) | | | 9,198,175 | | | | 828,387,641 | |
| | | | | | | | |
| | | | | | | 4,992,687,942 | |
| | | | | | | | |
| | | | | | | 11,582,011,358 | |
| MATERIALS: 1.0% | | | | | | | | |
Celanese Corp., Series A | | | 6,266,298 | | | | 695,935,056 | |
|
| TELECOMMUNICATION SERVICES: 2.8% | |
AT&T, Inc. | | | 27,637,787 | | | | 887,449,340 | |
Sprint Corp.(a) | | | 100,731,527 | | | | 547,979,507 | |
Zayo Group Holdings, Inc.(a)(b) | | | 14,627,500 | | | | 533,611,200 | |
| | | | | | | | |
| | | | | | | 1,969,040,047 | |
TOTAL COMMON STOCKS
(Cost $45,720,734,469) | | | | | | $ | 69,065,673,881 | |
| | |
| See accompanying Notes to Financial Statements | | DODGE & COX STOCK FUND §PAGE 7 |
| | | | |
| PORTFOLIO OF INVESTMENTS (unaudited) | | | June 30, 2018 | |
| | | | | | | | |
| SHORT-TERM INVESTMENTS: 2.1% | |
| | |
| | | PAR VALUE/ SHARES | | | VALUE | |
REPURCHASE AGREEMENT: 1.7% | |
Fixed Income Clearing Corporation(c)
1.20%, dated 6/29/18, due 7/2/18, maturity value $1,209,687,957 | | $ | 1,209,567,000 | | | $ | 1,209,567,000 | |
|
MONEY MARKET FUND: 0.4% | |
State Street Institutional U.S. Government Money Market Fund | | | 282,279,936 | | | | 282,279,936 | |
| | | | | | | | |
TOTAL SHORT-TERM INVESTMENTS
(Cost $1,491,846,936) | | | $ | 1,491,846,936 | |
| | | | | | | | |
TOTAL INVESTMENTS IN SECURITIES
(Cost $47,212,581,405) | | | 100.1 | % | | $ | 70,557,520,817 | |
OTHER ASSETS LESS LIABILITIES | | | (0.1 | %) | | | (69,476,993 | ) |
| | | | | | | | |
| NET ASSETS | | | 100.0 | % | | $ | 70,488,043,824 | |
| | | | | | | | |
| (b) | See Note 8 regarding holdings of 5% voting securities |
| (c) | Repurchase agreement is collateralized by U.S. Treasury Notes 2.375%-3.125%, 3/15/21-5/15/21. Total collateral value is $1,233,769,748. |
In determining a company’s country designation, the Fund generally references the country of incorporation. In cases where the Fund considers the country of incorporation to be a “jurisdiction of convenience” chosen primarily for tax purposes or in other limited circumstances, the Fund uses the country designation of an appropriate broad-based market index. In those cases, two countries are listed — the country of incorporation and the country designated by an appropriate index, respectively.
ADR: American Depositary Receipt
| | | | | | | | | | | | | | | | |
| FUTURES CONTRACTS | |
| Description | | Number of
Contracts | | | Expiration
Date | | | Notional
Amount | | | Value /
Unrealized
Appreciation
(Depreciation) | |
E-mini S&P 500 Index—Long Position | | | 9,058 | | | | 9/21/18 | | | $ | 1,232,612,640 | | | $ | (27,127,390 | ) |
| | |
| PAGE 8 § DODGE & COX STOCK FUND | | See accompanying Notes to Financial Statements |
| | | | |
STATEMENT OF ASSETS AND LIABILITIES (unaudited) | |
| |
| | | June 30, 2018 | |
ASSETS: | | | | |
Investments in securities, at value | | | | |
Unaffiliated issuers (cost $40,064,419,760) | | $ | 61,338,756,176 | |
Affiliated issuers (cost $7,148,161,645) | | | 9,218,764,641 | |
| | | | |
| | | 70,557,520,817 | |
Deposits with broker for futures contracts | | | 50,724,818 | |
Receivable for variation margin for futures contracts | | | 6,819,678 | |
Receivable for investments sold | | | 116,132,320 | |
Receivable for Fund shares sold | | | 120,341,535 | |
Dividends and interest receivable | | | 77,771,551 | |
Prepaid expenses and other assets | | | 111,409 | |
| | | | |
| | | 70,929,422,128 | |
| | | | |
LIABILITIES: | | | | |
Payable for investments purchased | | | 71,897,404 | |
Payable for Fund shares redeemed | | | 339,901,315 | |
Management fees payable | | | 29,409,708 | |
Accrued expenses | | | 169,877 | |
| | | | |
| | | 441,378,304 | |
| | | | |
NET ASSETS | | $ | 70,488,043,824 | |
| | | | |
NET ASSETS CONSIST OF: | | | | |
Paid in capital | | $ | 43,906,895,374 | |
Undistributed net investment income | | | 7,094,335 | |
Undistributed net realized gain | | | 3,256,242,093 | |
Net unrealized appreciation | | | 23,317,812,022 | |
| | | | |
| | $ | 70,488,043,824 | |
| | | | |
Fund shares outstanding (par value $0.01 each, unlimited shares authorized) | | | 349,185,202 | |
Net asset value per share | | $ | 201.86 | |
| |
STATEMENT OF OPERATIONS (unaudited) | | | | |
| |
| | | Six Months Ended
June 30, 2018 | |
INVESTMENT INCOME: | | | | |
Dividends (net of foreign taxes of $25,830,560) | | | | |
Unaffiliated issuers | | $ | 653,099,857 | |
Affiliated issuers | | | 73,594,263 | |
Interest | | | 4,427,970 | |
| | | | |
| | | 731,122,090 | |
| | | | |
EXPENSES: | | | | |
Management fees | | | 177,423,841 | |
Custody and fund accounting fees | | | 432,085 | |
Transfer agent fees | | | 1,722,513 | |
Professional services | | | 107,761 | |
Shareholder reports | | | 732,863 | |
Registration fees | | | 262,993 | |
Trustees’ fees | | | 162,083 | |
ADR depositary service fees | | | 4,653,615 | |
Miscellaneous | | | 424,858 | |
| | | | |
| | | 185,922,612 | |
| | | | |
NET INVESTMENT INCOME | | | 545,199,478 | |
| | | | |
REALIZED AND UNREALIZED GAIN (LOSS): | |
Net realized gain | | | | |
Investments in securities of unaffiliated issuers | | | 3,175,910,706 | |
Investments in securities of affiliated issuers | | | 100,554,131 | |
Futures contracts | | | 32,562,748 | |
Net change in unrealized appreciation/depreciation | | | | |
Investments in securities of unaffiliated issuers | | | (3,729,426,024 | ) |
Investments in securities of affiliated issuers | | | 599,888,797 | |
Futures contracts | | | (38,450,343 | ) |
| | | | |
Net realized and unrealized gain | | | 141,040,015 | |
| | | | |
NET CHANGE IN NET ASSETS
FROM OPERATIONS | | $ | 686,239,493 | |
| | | | |
| | | | | | | | |
STATEMENT OF CHANGES IN NET ASSETS (unaudited) | |
| | |
| | | Six Months Ended
June 30, 2018 | | | Year Ended
December 31, 2017 | |
OPERATIONS: | | | | | | | | |
Net investment income | | $ | 545,199,478 | | | $ | 1,049,903,472 | |
Net realized gain (loss) | | | 3,309,027,585 | | | | 3,567,659,704 | |
Net change in unrealized appreciation/depreciation | | | (3,167,987,570 | ) | | | 6,614,504,649 | |
| | | | | | | | |
| | | 686,239,493 | | | | 11,232,067,825 | |
| | | | | | | | |
| | |
DISTRIBUTIONS TO SHAREHOLDERS FROM: | | | | | | | | |
Net investment income | | | (545,894,033 | ) | | | (1,054,882,152 | ) |
Net realized gain | | | (720,505,797 | ) | | | (3,605,758,265 | ) |
| | | | | | | | |
Total distributions | | | (1,266,399,830 | ) | | | (4,660,640,417 | ) |
| | | | | | | | |
| | |
FUND SHARE
TRANSACTIONS: | | | | | | | | |
Proceeds from sale of shares | | | 4,103,049,775 | | | | 8,669,060,752 | |
Reinvestment of distributions | | | 1,199,876,016 | | | | 4,418,678,881 | |
Cost of shares redeemed | | | (5,135,648,283 | ) | | | (10,358,716,247 | ) |
| | | | | | | | |
Net change from Fund share transactions | | | 167,277,508 | | | | 2,729,023,386 | |
| | | | | | | | |
Total change in net assets | | | (412,882,829 | ) | | | 9,300,450,794 | |
| | |
NET ASSETS: | | | | | | | | |
Beginning of period | | | 70,900,926,653 | | | | 61,600,475,859 | |
| | | | | | | | |
End of period (including undistributed net investment income of $7,094,335 and $7,788,890, respectively) | | $ | 70,488,043,824 | | | $ | 70,900,926,653 | |
| | | | | | | | |
| | |
SHARE INFORMATION: | | | | | | | | |
Shares sold | | | 19,943,961 | | | | 44,674,938 | |
Distributions reinvested | | | 6,026,848 | | | | 22,297,192 | |
Shares redeemed | | | (25,001,976 | ) | | | (53,003,282 | ) |
| | | | | | | | |
Net change in shares outstanding | | | 968,833 | | | | 13,968,848 | |
| | | | | | | | |
| | |
| See accompanying Notes to Financial Statements | | DODGE & COX STOCK FUND §PAGE 9 |
NOTES TO FINANCIAL STATEMENTS (unaudited)
NOTE 1—ORGANIZATION AND SIGNIFICANT ACCOUNTING POLICIES
Dodge & Cox Stock Fund (the “Fund”) is one of the series constituting the Dodge & Cox Funds (the “Trust” or the “Funds”). The Trust is organized as a Delaware statutory trust and is registered under the Investment Company Act of 1940, as amended, as an open-end management investment company. The Fund commenced operations on January 4, 1965, and seeks long-term growth of principal and income. Risk considerations and investment strategies of the Fund are discussed in the Fund’s Prospectus.
The financial statements have been prepared in conformity with accounting principles generally accepted in the United States of America, which require the use of estimates and assumptions by management. Actual results may differ from those estimates. Significant accounting policies are as follows:
Security valuation The Fund’s net assets are normally valued as of the scheduled close of trading on the New York Stock Exchange (NYSE), generally 4 p.m. Eastern Time, each day that the NYSE is open for business.
Portfolio holdings for which market quotes are readily available are valued at market value. Listed securities, for example, are generally valued using the official quoted close price or the last sale on the exchange that is determined to be the primary market for the security. Exchange-traded derivatives are generally valued at the settlement price determined by the relevant exchange. Short-term securities less than 60 days to maturity may be valued at amortized cost if amortized cost approximates current value. Mutual funds are valued at their respective net asset values. Security values are not discounted based on the size of the Fund’s position and may differ from the value a Fund receives upon sale of the securities. All securities held by the Fund are denominated in U.S. dollars.
If market quotations are not readily available or if normal valuation procedures produce valuations that are deemed unreliable or inappropriate under the circumstances existing at the time, the investment will be valued at fair value as determined in good faith by or under the direction of the Fund’s Board of Trustees. The Board of Trustees has appointed Dodge & Cox, the Fund’s investment manager, to make fair value determinations in accordance with the Dodge & Cox Funds Valuation Policies (“Valuation Policies”), subject to Board oversight. Dodge & Cox has established a Pricing Committee that is comprised of representatives from Treasury, Legal, Compliance, and Operations. The Pricing Committee is responsible for implementing the Valuation Policies, including determining the fair value of securities and other investments when necessary. The Pricing Committee considers relevant indications of value that are reasonably available to it in determining the fair value assigned to a particular security, such as the value of similar financial instruments, trading volumes, contractual restrictions on disposition, related corporate actions, and changes in economic conditions. In doing so, the Pricing Committee employs various
methods for calibrating fair valuation approaches, including a regular review of key inputs and assumptions, back-testing, and review of any related market activity.
Valuing securities through a fair value determination involves greater reliance on judgment than valuation of securities based on readily available market quotations. In some instances, lack of information and uncertainty as to the significance of information may lead to a conclusion that a prior valuation is the best indication of a security’s value. When fair value pricing is employed, the prices of securities used by the Fund to calculate its net asset value may differ from quoted or published prices for the same securities.
Security transactions, investment income, expenses, and distributions Security transactions are recorded on the trade date. Realized gains and losses on securities sold are determined on the basis of identified cost.
Dividend income and corporate action transactions are recorded on the ex-dividend date, or when the Fund first learns of the dividend/corporate action if the ex-dividend date has passed. Non-cash dividends, if any, are recorded at the fair market value of the securities received. Dividends characterized as return of capital for U.S. tax purposes are recorded as a reduction of cost of investments and/or realized gain. Interest income is recorded on the accrual basis.
Expenses are recorded on the accrual basis. Some expenses of the Trust can be directly attributed to a specific series. Expenses which cannot be directly attributed are allocated among the Funds in the Trust using methodologies determined by the nature of the expense.
Distributions to shareholders are recorded on the ex-dividend date.
Repurchase agreements Repurchase agreements are transactions under which a Fund purchases a security from a dealer counterparty and agrees to resell the security to that counterparty on a specified future date at the same price, plus a specified interest rate. The Fund’s repurchase agreements are secured by U.S. government or agency securities. It is the Fund’s policy that its custodian take possession of the underlying collateral securities, the fair value of which exceeds the principal amount of the repurchase transaction, including accrued interest, at all times. In the event of default by the counterparty, the Fund has the contractual right to liquidate the collateral securities and to apply the proceeds in satisfaction of the obligation.
Foreign taxes The Fund may be subject to foreign taxes which may be imposed by certain countries in which the Fund invests. The Fund endeavors to record foreign taxes based on applicable foreign tax law. Withholding taxes are incurred on certain foreign dividends and are accrued at the time the associated dividend is recorded. The Fund files withholding tax reclaims in certain jurisdictions to recover a portion of amounts previously withheld. The Fund records a reclaim receivable based on, among other things, a jurisdiction’s legal obligation to pay reclaims as well as payment history and market convention. In consideration of recent decisions rendered by
PAGE 10 § DODGE & COX STOCK FUND
NOTES TO FINANCIAL STATEMENTS (unaudited)
European courts, the Fund has filed for additional reclaims related to prior years. A corresponding receivable is established when both the amount is known and significant contingencies or uncertainties regarding collectability are removed. These amounts, if any, are reported in “dividends and interest receivable” in the Statement of Assets and Liabilities.
Futures contracts Futures contracts involve an obligation to purchase or sell (depending on whether the Fund has entered a long or short futures contract, respectively) an asset at a future date, at a price set at the time of the contract. Upon entering into a futures contract, the Fund is required to deposit an amount of cash or liquid assets (referred to as initial margin) in a segregated account with the clearing broker. Subsequent payments (referred to as variation margin) to and from the clearing broker are made on a daily basis based on changes in the market value of futures contracts. Futures contracts are traded publicly and their market value changes daily. Changes in the market value of open futures contracts are recorded as unrealized appreciation or depreciation in the Statement of Operations. Realized gains and losses on futures contracts are recorded in the Statement of Operations at the closing or expiration of the contracts. Cash deposited with a broker as initial margin is recorded in the Statement of Assets and Liabilities. A receivable and/or payable to brokers for daily variation margin is also recorded in the Statement of Assets and Liabilities.
Investments in futures contracts may include certain risks, which may be different from, and potentially greater than, those of the underlying securities. To the extent the Fund uses futures, it is exposed to additional volatility and potential losses resulting from leverage.
The Fund has maintained long S&P 500 futures contracts to provide equity exposure that approximates the Fund’s “net cash and other” position, which includes cash, short-term investments, receivables, and payables. During the six months ended June 30, 2018, these S&P 500 futures contracts had notional values up to 2% of net assets.
Indemnification Under the Trust’s organizational documents, its officers and trustees are indemnified against certain liabilities arising out of the performance of their duties to the Trust. In addition, in the normal course of business the Trust enters into contracts that provide general indemnities to other parties. The Trust’s maximum exposure under these arrangements is unknown as this would involve future claims that may be made against the Trust that have not yet occurred.
NOTE 2—VALUATION MEASUREMENTS
Various inputs are used in determining the value of the Fund’s investments. These inputs are summarized in the three broad levels listed below.
| § | | Level 1: Quoted prices in active markets for identical securities |
| § | | Level 2: Other significant observable inputs (including quoted prices for similar securities, market indices, interest rates, credit risk, forward exchange rates, etc.) |
| § | | Level 3: Significant unobservable inputs (including Fund management’s assumptions in determining the fair value of investments) |
The inputs or methodology used for valuing securities are not necessarily an indication of the risk associated with investing in those securities.
The following is a summary of the inputs used to value the Fund’s holdings at June 30, 2018:
| | | | | | | | |
| Classification(a) | | LEVEL 1
(Quoted Prices) | | | LEVEL 2
(Other Significant
Observable Inputs) | |
Securities | | | | | | | | |
Common Stocks(b) | | $ | 69,065,673,881 | | | $ | — | |
Short-term Investments | | | | | | | | |
Repurchase Agreement | | | — | | | | 1,209,567,000 | |
Money Market Fund | | | 282,279,936 | | | | — | |
| | | | | | | | |
Total | | $ | 69,347,953,817 | | | $ | 1,209,567,000 | |
| | | | | | | | |
Other Investments | | | | | | | | |
Futures Contracts | | | | | | | | |
Depreciation | | $ | (27,127,390 | ) | | $ | — | |
| | | | | | | | | |
| (a) | There were no transfers between Level 1 and Level 2 during the six months ended June 30, 2018. There were no Level 3 securities at June 30, 2018 and December 31, 2017, and there were no transfers to Level 3 during the period. |
| (b) | All common stocks held in the Fund are Level 1 securities. For a detailed break-out of common stocks by major industry classification, please refer to the Portfolio of Investments. |
NOTE 3—RELATED PARTY TRANSACTIONS
Management fees Under a written agreement approved by a unanimous vote of the Board of Trustees, the Fund pays a management fee monthly at an annual rate of 0.50% of the Fund’s average daily net assets to Dodge & Cox, investment manager of the Fund. The agreement further provides that Dodge & Cox shall waive its fee to the extent that such fee plus all other ordinary operating expenses of the Fund exceed 0.75% of the average daily net assets for the year.
Fund officers and trustees All officers and two of the trustees of the Trust are officers or employees of Dodge & Cox. The Trust pays a fee only to those trustees who are not affiliated with Dodge & Cox.
NOTE 4—INCOME TAX INFORMATION AND DISTRIBUTIONS TO SHAREHOLDERS
A provision for federal income taxes is not required since the Fund intends to continue to qualify as a regulated investment company under Subchapter M of the Internal Revenue Code and distribute all of its taxable income to shareholders. Distributions are determined in accordance with income tax regulations, and such amounts may differ from net investment income and realized gains for financial reporting purposes. Financial reporting records are adjusted for permanent book to tax differences at year end to reflect tax character. Book to tax differences are primarily due to differing treatments of wash sales, net short-term realized gain (loss), certain dividends, and derivatives.
DODGE & COX STOCK FUND §PAGE 11
NOTES TO FINANCIAL STATEMENTS (unaudited)
Distributions during the periods noted below were characterized as follows for federal income tax purposes:
| | | | | | | | |
| | | Six Months Ended
June 30, 2018 | | | Year Ended
December 31, 2017 | |
Ordinary income | | $ | 562,174,692 | | | $ | 1,232,159,263 | |
| | | ($1.617 per share | ) | | | ($3.636 per share | ) |
Long-term capital gain | | $ | 704,225,138 | | | $ | 3,428,481,154 | |
| | | ($2.033 per share | ) | | | ($10.173 per share | ) |
The components of distributable earnings on a tax basis are reported as of the Fund’s most recent year end. At December 31, 2017, the tax basis components of distributable earnings were as follows:
| | | | |
Undistributed ordinary income | | $ | 23,926,831 | |
Undistributed long-term capital gain | | | 703,938,909 | |
At June 30, 2018, unrealized appreciation and depreciation for investments and derivatives based on cost for federal income tax purposes was as follows:
| | | | |
Tax cost | | $ | 47,226,487,609 | |
| | | | |
Unrealized appreciation | | | 24,873,177,532 | |
Unrealized depreciation | | | (1,569,271,714 | ) |
| | | | |
Net unrealized appreciation | | | 23,303,905,818 | |
| | | | | |
Fund management has reviewed the tax positions for open periods (three years and four years, respectively, from filing the Fund’s Federal and State tax returns) as applicable to the Fund, and has determined that no provision for income tax is required in the Fund’s financial statements.
NOTE 5—LOAN FACILITIES
Pursuant to an exemptive order issued by the Securities and Exchange Commission (SEC), the Fund may participate in an interfund lending facility (Facility). The Facility allows the Fund to borrow money from or loan money to the Funds. Loans under the Facility are made for temporary or emergency purposes, such as to fund shareholder redemption requests. Interest on borrowings is the average of the current repurchase agreement rate and the bank loan rate. There was no activity in the Facility during the period.
All Funds in the Trust participate in a $500 million committed credit facility (Line of Credit) with State Street Bank and Trust Company, to be utilized for temporary or emergency purposes to fund shareholder redemptions or for other short-term liquidity purposes. The maximum amount available to the Fund is $250 million. Each Fund pays an annual commitment fee on its pro-rata portion of the Line of Credit. For the six months ended June 30, 2018, the Fund’s commitment fee amounted to $201,233 and is reflected as a Miscellaneous Expense in the Statement of Operations. Interest on borrowings is charged at the prevailing rate. There were no borrowings on the Line of Credit during the period.
NOTE 6—PURCHASES AND SALES OF INVESTMENTS
For the six months ended June 30, 2018, purchases and sales of securities, other than short-term securities, aggregated $5,829,833,197 and $6,825,864,822, respectively.
NOTE 7—SUBSEQUENT EVENTS
Fund management has determined that no material events or transactions occurred subsequent to June 30, 2018, and through the date of the Fund’s financial statements issuance, which require additional disclosure in the Fund’s financial statements.
PAGE 12 § DODGE & COX STOCK FUND
NOTES TO FINANCIAL STATEMENTS (unaudited)
NOTE 8—HOLDINGS OF 5% VOTING SECURITIES
Each of the companies listed below was considered to be an affiliate of the Fund because the Fund owned 5% or more of the company’s voting securities during all or part of the six months ended June 30, 2018. Transactions during the period in these securities were as follows:
| | | | | | | | | | | | | | | | | | | | | | | | | | | | | | | | |
| | | Shares at
Beginning of Period | | | Additions | | | Reductions | | | Shares at
End of Period | | | Dividend Income(a) | | | Realized Gain (Loss) | | | Net Change
in Unrealized Appreciation/
Depreciation | | | Value at
End of Period | |
| COMMON STOCKS: 13.1% | | | | | | | | | |
| CONSUMER DISCRETIONARY: 0.5% | | | | | | | | | |
Mattel, Inc.(b) | | | 16,700,000 | | | | 3,804,501 | | | | — | | | | 20,504,501 | | | $ | — | | | $ | — | | | $ | 30,529,122 | | | $ | 336,683,906 | |
| | |
| ENERGY: 5.6% | | | | | | | | | |
Anadarko Petroleum Corp. | | | 27,357,621 | | | | — | | | | — | | | | 27,357,621 | | | | 13,678,811 | | | | — | | | | 536,482,948 | | | | 2,003,945,738 | |
Apache Corp. | | | 18,700,694 | | | | 5,483,338 | | | | — | | | | 24,184,032 | | | | 10,721,182 | | | | — | | | | 143,441,646 | | | | 1,130,603,496 | |
National Oilwell Varco, Inc. | | | 18,698,800 | | | | 1,300,000 | | | | (500,000 | ) | | | 19,498,800 | | | | 1,965,509 | | | | 4,985,023 | | | | 139,834,828 | | | | 846,247,920 | |
| | | | | | | | | | | | | | | | | | | | | | | | | | | | | | | | |
| | | | | | | | | | | | | | | | | | | | | | | | | | | | | | | 3,980,797,154 | |
| | | | | | | | | | | | | | | | | | | | | | | | | | | | | | | | |
| FINANCIALS: 3.5% | | | | | | | | | |
Capital One Financial Corp. | | | 26,795,511 | | | | 150,000 | | | | (170,000 | ) | | | 26,775,511 | | | | 21,368,409 | | | | 3,576,505 | | | | (209,575,696 | ) | | | 2,460,669,461 | |
| | |
| INFORMATION TECHNOLOGY: 2.7% | | | | | | | | | |
Hewlett Packard Enterprise Co. | | | 102,041,816 | | | | — | | | | (17,746,023 | ) | | | 84,295,793 | | | | 17,136,413 | | | | 91,992,603 | | | | (13,695,115 | ) | | | 1,231,561,536 | |
Juniper Networks, Inc. | | | 22,833,165 | | | | 1,800,000 | | | | — | | | | 24,633,165 | | | | 8,723,939 | | | | — | | | | (23,218,716 | ) | | | 675,441,384 | |
| | | | | | | | | | | | | | | | | | | | | | | | | | | | | | | | |
| | | | | | | | | | | | | | | | | | | | | | | | | | | | | | | 1,907,002,920 | |
| | | | | | | | | | | | | | | | | | | | | | | | | | | | | | | | |
| TELECOMMUNICATION SERVICES: 0.8% | | | | | | | | | |
Zayo Group Holdings, Inc.(b) | | | 14,027,500 | | | | 600,000 | | | | — | | | | 14,627,500 | | | | — | | | | — | | | | (3,910,220 | ) | | | 533,611,200 | |
| | | | | | | | | | | | | | | | | | | | | | | | | | | | | | | | |
| | | | | | | | | | | | | | | | | | $ | 73,594,263 | | | $ | 100,554,131 | | | $ | 599,888,797 | | | $ | 9,218,764,641 | |
| | | | | | | | | | | | | | | | | | | | | | | | | | | | | | | | |
| | | | | | | | | | | | | | | | | | | | | | | | | | | | | | | | | |
| (a) | Net of foreign taxes, if any |
FINANCIAL HIGHLIGHTS
| | | | | | | | | | | | | | | | | | | | | | | | |
SELECTED DATA AND RATIOS (for a share outstanding throughout each period) | | Six Months
Ended June 30, | | | Year Ended December 31, | |
| | | 2018 | | | 2017 | | | 2016 | | | 2015 | | | 2014 | | | 2013 | |
| | | | | | | | |
Net asset value, beginning of period | | | $203.61 | | | | $184.30 | | | | $162.77 | | | | $180.94 | | | | $168.87 | | | | $121.90 | |
Income from investment operations: | | | | | | | | | | | | | | | | | | | | | | | | |
Net investment income | | | 1.57 | | | | 3.09 | | | | 3.05 | | | | 2.42 | | | | 2.83 | | | | 2.11 | |
Net realized and unrealized gain (loss) | | | 0.33 | | | | 30.03 | | | | 30.56 | | | | (10.55 | ) | | | 14.60 | | | | 46.97 | |
| | | | | | | | |
Total from investment operations | | | 1.90 | | | | 33.12 | | | | 33.61 | | | | (8.13 | ) | | | 17.43 | | | | 49.08 | |
| | | | | | | | |
Distributions to shareholders from: | | | | | | | | | | | | | | | | | | | | | | | | |
Net investment income | | | (1.57 | ) | | | (3.11 | ) | | | (3.03 | ) | | | (2.46 | ) | | | (2.80 | ) | | | (2.11 | ) |
Net realized gain | | | (2.08 | ) | | | (10.70 | ) | | | (9.05 | ) | | | (7.58 | ) | | | (2.56 | ) | | | — | |
| | | | | | | | |
Total distributions | | | (3.65 | ) | | | (13.81 | ) | | | (12.08 | ) | | | (10.04 | ) | | | (5.36 | ) | | | (2.11 | ) |
| | | | | | | | |
Net asset value, end of period | | | $201.86 | | | | $203.61 | | | | $184.30 | | | | $162.77 | | | | $180.94 | | | | $168.87 | |
| | | | | | | | |
Total return | | | 0.95 | % | | | 18.32 | % | | | 21.27 | % | | | (4.47 | )% | | | 10.43 | % | | | 40.55 | % |
Ratios/supplemental data: | | | | | | | | | | | | | | | | | | | | | | | | |
Net assets, end of period (millions) | | | $70,488 | | | | $70,901 | | | | $61,600 | | | | $54,845 | | | | $60,260 | | | | $54,848 | |
Ratio of expenses to average net assets | | | 0.52 | %(a) | | | 0.52 | % | | | 0.52 | % | | | 0.52 | % | | | 0.52 | % | | | 0.52 | % |
Ratio of net investment income to average net assets | | | 1.54 | %(a) | | | 1.58 | % | | | 1.83 | % | | | 1.36 | % | | | 1.62 | % | | | 1.45 | % |
Portfolio turnover rate | | | 8 | % | | | 13 | % | | | 16 | % | | | 15 | % | | | 17 | % | | | 15 | % |
See accompanying Notes to Financial Statements
DODGE & COX STOCK FUND §PAGE 13
FUND HOLDINGS
The Fund provides a complete list of its holdings four times each fiscal year, as of the end of each quarter. The Fund files the lists with the Securities and Exchange Commission (SEC) on Form N-CSR (second and fourth quarters) and Form N-Q (first and third quarters). Shareholders may view the Fund’s Forms N-CSR and N-Q on the SEC’s website at sec.gov. Forms N-CSR and N-Q may also be reviewed and copied at the SEC’s Public Reference Room in Washington, DC. Information regarding the operations of the Public Reference Room may be obtained by calling 800-SEC-0330. A list of the Fund’s quarter-end holdings is also available at dodgeandcox.com on or about 15 days following each quarter end and remains available on the website until the list is updated in the subsequent quarter.
PROXY VOTING
For a free copy of the Fund’s proxy voting policies and procedures, please call 800-621-3979, visit the Fund’s website at dodgeandcox.com, or visit the SEC’s website at sec.gov. Information regarding how the Fund voted proxies relating to portfolio securities during the most recent 12-month period ending June 30 is also available at dodgeandcox.com or at sec.gov.
HOUSEHOLD MAILINGS
The Fund routinely mails shareholder reports and summary prospectuses to shareholders and, on occasion, proxy statements. In order to reduce the volume of mail, when possible, only one copy of these documents will be sent to shareholders who are part of the same family and share the same residential address.
If you have a direct account with the Funds and you do not want the mailing of shareholder reports and summary prospectuses combined with other members in your household, contact the Funds at 800-621-3979. Your request will be implemented within 30 days.
PAGE 14 § DODGE & COX STOCK FUND
TRUSTEES AND EXECUTIVE OFFICERS
Charles F. Pohl, Chairman and Trustee
Chairman, Dodge & Cox
Dana M. Emery, President and Trustee
Chief Executive Officer and President, Dodge & Cox
Caroline M. Hoxby, Independent Trustee
Professor of Economics, Stanford University; Senior Fellow, Hoover Institution
Thomas A. Larsen, Independent Trustee
Former Senior Counsel, Arnold & Porter Kaye Scholer LLP
Ann Mather, Independent Trustee
Former Executive Vice President, Chief Financial Officer, and Company Secretary, Pixar Animation Studios
Robert B. Morris III, Independent Trustee
Former Partner and Managing director - Global Investment Research, Goldman Sachs; former Advisory Director, The Presidio Group
Gary Roughead, Independent Trustee
Robert and Marion Oster Distinguished Military Fellow, Hoover Institution; former U.S. Navy Chief of Naval Operations
Mark E. Smith, Independent Trustee
Former Executive Vice President and Managing Director-Fixed Income, Loomis Sayles & Company, L.P.
John B. Taylor, Independent Trustee
Professor of Economics, Stanford University; Senior Fellow, Hoover Institution; and former Under Secretary for International Affairs, United States Treasury
Diana S. Strandberg, Senior Vice President
Senior Vice President and Director of International Equity, Dodge & Cox
David H. Longhurst, Treasurer
Vice President and Assistant Treasurer, Dodge & Cox
Katherine M. Primas, Chief Compliance Officer
Vice President and Chief Compliance Officer, Dodge & Cox
Roberta R.W. Kameda, Secretary
Vice President, General Counsel, and Secretary, Dodge & Cox
William W. Strickland, Vice President, Assistant Secretary, and Assistant Treasurer
Vice President and Chief Operating Officer, Dodge & Cox
Additional information about the Trust’s Trustees and Officers is available in the Trust’s Statement of Additional Information (SAI). You can get a free copy of the SAI by visiting the Funds’ website at dodgeandcox.com or calling 800-621-3979.
DODGE & COX STOCK FUND §PAGE 15
dodgeandcox.com
For Fund literature, transactions, and account
information, please visit the Funds’ website.
or write or call:
DODGE & COX FUNDS
c/o DST Asset Manager Solutions, Inc.
P.O. Box 8422
Boston, Massachusetts 02266-8422
(800) 621-3979
INVESTMENT MANAGER
Dodge & Cox
555 California Street, 40th Floor
San Francisco, California 94104
(415) 981-1710
This report is submitted for the general information of the shareholders of the Fund. The report is not authorized for distribution to prospective investors in the Fund unless it is accompanied by a current prospectus.
This report reflects our views, opinions, and portfolio holdings as of June 30, 2018, the end of the reporting period. Any such views are subject to change at any time based upon market or other conditions and Dodge & Cox disclaims any responsibility to update such views. These views may not be relied on as investment advice and, because investment decisions for a Dodge & Cox Fund are based on numerous factors, may not be relied on as an indication of trading intent on behalf of any Dodge & Cox Fund.
DODGE & COX FUNDS®
Semi-Annual Report
June 30, 2018
Global Stock Fund
ESTABLISHED 2008
TICKER: DODWX
6/18 GSF SAR Printed on recycled paper
TO OUR SHAREHOLDERS
The Dodge & Cox Global Stock Fund had a total return of –3.4% for the six months ended June 30, 2018, compared to a return of 0.4% for the MSCI World Index. As fellow shareholders, we are disappointed by the Fund’s recent performance.
WHY HAS THE FUND UNDERPERFORMED?
The Fund’s underperformance in the first half of 2018 is explained by a combination of industry positioning and poor stock selection. The Fund’s overweight positions and holdings in the Financials sector, Europe, and emerging markets detracted significantly from relative performance. These areas of the market were particularly weak as macroeconomic concerns dominated headlines. Heightened rhetoric about tariffs and trade wars, the rise of populism, higher oil prices, and a strengthening U.S. dollar weighed on the outlook for continued global economic growth.
Stock selection, particularly in companies that are in the midst of some form of business restructuring, further hindered performance. In the Media industry, weak performers included Liberty Global(a) (European cable) and U.S.-based Comcast, Charter Communications, and DISH Network. Magnit (Russian food retailer) and Micro Focus International (UK software) also did poorly and were affected by company-specific issues that disrupted improvement plans. However, we believe the challenges these companies face are fixable over our three- to five-year investment horizon and that their management teams are tackling the issues with a sense of urgency.
HOW ARE WE RESPONDING?
Since the Fund’s inception in 2008, there have been periods of short-term underperformance. During these intervals, we ask ourselves: Have the fundamentals changed? If so, how has our investment thesis changed? Are we being adequately compensated for the thesis to work over our investment time horizon, such that we should hold or even add to our position? Or should we sell our position because the risk/reward profile is no longer attractive?
We answer these questions by using a “clean sheet of paper” approach to determine whether the long-term fundamentals have changed in relation to valuation. We rigorously employ our bottom-up analysis to assess concerns facing a company and its industry. We evaluate growth prospects and competitive dynamics by meeting with the management of our holdings and their competitors. And we vigorously debate the relative opportunities and risks as part of our team decision-making process.
In some cases, we conclude the thesis has changed and decide to sell. For example, we sold Saipem, an engineering and construction company focused on oil and gas, during the second quarter. The company is heavily tied to offshore oilfield activity, and we think a rebound in that market has been pushed back and Saipem’s competitive position has weakened.
In other cases, we reaffirmed the merit of an investment and added to our position. For example, we added to Grupo Televisa, the dominant television content producer and pay-television operator in Mexico, earlier in the year. The shares had been weak due to concerns about lower ratings, changes to the company’s
advertising pricing model, and slowing cable subscriber growth. We think those are short-term challenges that should not overshadow the substantive changes a new and improved management team is making to improve content programming and capital allocation. Grupo Televisa was subsequently a strong contributor to performance during the second quarter.
WHY ARE WE OPTIMISTIC?
The process of re-evaluating each of the Fund’s holdings has reinforced our positive outlook for the portfolio. We have many different potential drivers of long-term performance, including those in:
| | § | | Financials—valuations have fallen yet fundamentals have improved; | |
| | § | | Health Care—fundamentals are stable, while attractive dividend yields and share buybacks enable us to be patient; | |
| | § | | Media—an attractively valued way to benefit from growing demand for communications and entertainment around the world; | |
| | § | | Emerging markets—valuations are reasonable for companies with strong franchises and above average growth; | |
| | § | | Energy—we are in the early innings of a recovery; and | |
| | § | | The previously mentioned companies involved in restructuring —we see potential for significant earnings and cash flow improvement. | |
We are particularly enthusiastic about the Fund’s holdings in the Financials and Health Care sectors and Media industry, which collectively represent 59% of the portfolio and the three largest overweight positions in the Fund.(b)
Financials
The Fund is overweight Financials (27% versus 17% for the MSCI World), with 21% domiciled in developed markets and 6% in emerging markets. Despite current macroeconomic concerns, we find the Fund’s financial services holdings to be increasingly attractive investment opportunities. This sector exemplifies the recent trend of lower valuations despite improving fundamentals. Over the past year, the forward price-to-earnings ratio for the MSCI World Financials sector contracted from 12.8 to 11.3 times, while trailing earnings per share grew by 14%. The decline in valuation suggests a worsening outlook for earnings and capital generation. However, we reach a different conclusion when we evaluate the Fund’s 21 financial services investments using our bottom-up approach. Management teams are actively cutting costs, exiting low-return businesses, strengthening balance sheets, and improving returns on equity. UniCredit, the largest bank in Italy, is a good example of this divergence between fundamentals and valuation.
UniCredit declined 19% in the second quarter. Recent fears that a new anti-establishment Italian government would leave the Eurozone or repudiate debt have overshadowed the progress UniCredit has made in improving its balance sheet and profitability. From 2014 to 2017, UniCredit’s non-performing loan ratio declined from 16.5% to 10.3%, and its adjusted return on
PAGE 2 § DODGE & COX GLOBAL STOCK FUND
tangible equity increased from 4.6% to 7.6% on a much bigger capital cushion. In spite of these improvements, the company’s valuation declined from 0.7 times price to tangible book value to 0.6 times. Current valuation does not give credit for UniCredit’s deep restructuring of its balance sheet and cost structure, and reflects market skepticism of management reaching its target of 9% return on tangible equity. However, we believe their target is achievable through internal self-help measures, and we added to the Fund’s UniCredit position during the first half of 2018.
Health Care
Health Care continues to be an attractive area of the market, where underlying fundamentals have remained stable while valuations have declined. The Fund is overweight Health Care (20% compared to 12% of the MSCI World). Six of the Fund’s Health Care sector holdings are European pharmaceutical companies with global footprints. Despite pricing pressures in the U.S. market, profit margins have been resilient and free cash flow has been robust. Most of the Fund’s current pharmaceutical holdings have returned one-third of their market capitalization in dividends and share buybacks over the past five years, while at the same time investing meaningfully in research and development (R&D).
We believe growth can accelerate due to improved R&D productivity in a variety of groundbreaking areas of innovation, including immuno-oncology and rare diseases. Nevertheless, valuations for the Fund’s European pharmaceutical holdings have declined from an average of 17 times forward earnings in 2015 to 14 times on June 30, 2018, with an average dividend yield of 4%. At this lower valuation, we believe we are being compensated for our patience.
Media
Within Consumer Discretionary, Media is an important overweight position: 12% of the Fund compared to 2% of the MSCI World on June 30. The media landscape is evolving due to new direct-to-consumer entrants, changes in consumer viewing and listening habits, shifting revenue streams, and industry consolidation. Uncertainty surrounding pending mergers and potential regulatory incursions (e.g., unbundling, forced wholesale access, price regulation on broadband) pose risks to the Fund’s media investments.
Nevertheless, we recently added to Comcast and Charter Communications—the largest and second-largest cable providers in the United States—because we believe the market has overly penalized their share prices as a result of concerns about subscriber growth and potential bidding wars. Both companies have attractive valuations, difficult-to-replicate assets, and the potential to benefit from growth in data consumption. Comcast and Charter Communications also have de-facto local monopolies on broadband internet services in many parts of the United States and, despite talk of “cord cutting,” have potential to grow through increased broadband penetration and pricing power in residential and business services. Furthermore, their shareholder-friendly management teams are skilled capital allocators who seek to
maximize value. Among the ten largest holdings in the Fund, Comcast and Charter Communications were 2.5% and 2.2% positions, respectively, on June 30.
IN CLOSING
In many respects, the recent underperformance echoes what happened in 2015 when macroeconomic concerns also weighed heavily on the market. Back then, international equity markets were volatile due to fears of slowing growth in China, a stronger U.S. dollar, and growing populist sentiment in Europe that culminated in the Brexit decision the following June. The Fund trailed the MSCI World by seven percentage points in 2015, then outperformed the benchmark by 13 percentage points over the next seven quarters.
Although we do not know how the future will unfold, our investment team has successfully navigated a number of difficult periods in the market. The 2015-17 period illustrates the importance of employing a consistent process and staying the course with our convictions in the face of underperformance.
Starting points, as measured by valuation, matter for investment returns. With many of the Fund’s holdings trading at lower valuations than they did six or nine months ago, we are increasingly optimistic about the potential for the current portfolio to generate strong returns over the long term. Our time-tested approach requires persistence, and we thank our fellow shareholders for your continued confidence in Dodge & Cox.
For the Board of Trustees,
| | |
| | |
Charles F. Pohl, Chairman | | Dana M. Emery, President |
August 1, 2018
| (a) | | The use of specific examples does not imply that they are more or less attractive investments than the portfolio’s other holdings. |
| (b) | | Unless otherwise specified, all weightings and characteristics are as of June 30, 2018. |
DODGE & COX GLOBAL STOCK FUND §PAGE 3
YEAR-TO-DATE PERFORMANCE REVIEW
The Fund underperformed the MSCI World by 3.8 percentage points year to date.
Key Detractors from Relative Results
| | § | | Weak returns from holdings in the Financials sector (down 9% versus down 6% for the MSCI World sector), combined with an average overweight position (28% versus 18%), hindered performance. ICICI Bank (down 18%) was a notable detractor. | |
| | § | | The Fund’s relative returns in the Information Technology sector (up 1% compared to up 9% for the MSCI World sector) and average underweight position (13% versus 18%) hurt results. Micro Focus International (down 48%) and Samsung Electronics (down 12%) detracted from results. | |
| | § | | Additional detractors included Magnit (down 33%), MTN Group (down 26%), and Liberty Global (down 21%). | |
Key Contributors to Relative Results
| | § | | Relative returns in the Energy sector (up 15% compared to up 7% for the MSCI World sector) had a positive impact. Anadarko Petroleum (up 38%) and Suncor Energy (up 13%) were strong performers. | |
| | § | | The Fund’s average underweight position in the Industrials sector (5% versus 12% for the MSCI World sector) contributed to returns. | |
| | § | | Additional contributors included Twenty-First Century Fox (up 45%), Target (up 19%), and GlaxoSmithKline (up 16%). | |
KEY CHARACTERISTICS OF DODGE & COX
Independent Organization
Dodge & Cox is one of the largest privately owned investment managers in the world. We remain committed to independence, with a goal of providing the highest quality investment management service to our existing clients.
Over 85 Years of Investment Experience
Dodge & Cox was founded in 1930. We have a stable and well-qualified team of investment professionals, most of whom have spent their entire careers at Dodge & Cox.
Experienced Investment Team
The Global Equity Investment Committee, which is the decision-making body for the Global Stock Fund, is a seven-member committee with an average tenure at Dodge & Cox of 24 years.
One Business with a Single Research Office
Dodge & Cox manages equity (domestic, international, and global), fixed income (domestic and global), and balanced investments, operating from one office in San Francisco.
Consistent Investment Approach
Our team decision-making process involves thorough, bottom-up fundamental analysis of each investment.
Long-Term Focus and Low Expenses
We invest with a three- to five-year investment horizon, which has historically resulted in low turnover relative to our peers. We manage Funds that maintain low expense ratios.
Risks: The Fund is subject to market risk, meaning holdings in the Fund may decline in value for extended periods due to the financial prospects of individual companies, or due to general market and economic conditions. Investing in non-U.S. securities may entail risk due to foreign economic and political developments; this risk may be increased when investing in emerging markets. The Fund is also subject to currency risk. Please read the prospectus and summary prospectus for specific details regarding the Fund’s risk profile.
PAGE 4 § DODGE & COX GLOBAL STOCK FUND
GROWTH OF $10,000 OVER 10 YEARS
FOR AN INVESTMENT MADE ON JUNE 30, 2008
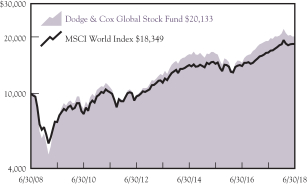
AVERAGE ANNUAL TOTAL RETURN
FOR PERIODS ENDED JUNE 30, 2018
| | | | | | | | | | | | | | | | |
| | | 1 Year | | | 3 Years | | | 5 Years | | | 10 Years | |
Dodge & Cox Global Stock Fund | | | 5.84 | % | | | 7.34 | % | | | 10.04 | % | | | 7.25 | % |
MSCI World Index | | | 11.09 | | | | 8.48 | | | | 9.94 | | | | 6.26 | |
Returns represent past performance and do not guarantee future results. Investment return and share price will fluctuate with market conditions, and investors may have a gain or loss when shares are sold. Fund performance changes over time and currently may be significantly lower than stated. Performance is updated and published monthly. Visit the Fund’s website at dodgeandcox.com or call 800-621-3979 for current performance figures.
The Fund’s total returns include the reinvestment of dividend and capital gain distributions, but have not been adjusted for any income taxes payable by shareholders on these distributions or on Fund share redemptions. Index returns include dividends but, unlike Fund returns, do not reflect fees or expenses. The MSCI World Index is a broad-based, unmanaged equity market index aggregated from 23 developed market country indices, including the United States. MSCI makes no express or implied warranties or representations and shall have no liability whatsoever with respect to any MSCI data contained herein. The MSCI data may not be further redistributed or used as a basis for other indices or any securities or financial products. This report is not approved, reviewed, or produced by MSCI.
MSCI World is a service mark of MSCI Barra.
FUND EXPENSE EXAMPLE
As a Fund shareholder, you incur ongoing Fund costs, including management fees and other Fund expenses. All mutual funds have ongoing costs, sometimes referred to as operating expenses. The following example shows ongoing costs of investing in the Fund and can help you understand these costs and compare them with those of other mutual funds. The example assumes a $1,000 investment held for the six months indicated.
ACTUAL EXPENSES
The first line of the table below provides information about actual account values and expenses based on the Fund’s actual returns. You may use the information in this line, together with your account balance, to estimate the expenses that you paid over the period. Simply divide your account value by $1,000 (for example, an $8,600 account value divided by $1,000 = 8.6), then multiply the result by the number in the first line under the heading “Expenses Paid During Period” to estimate the expenses you paid on your account during this period.
HYPOTHETICAL EXAMPLE FOR COMPARISON WITH OTHER MUTUAL FUNDS
Information on the second line of the table can help you compare ongoing costs of investing in the Fund with those of other mutual funds. This information may not be used to estimate the actual ending account balance or expenses you paid during the period. The hypothetical “Ending Account Value” is based on the actual expense ratio of the Fund and an assumed 5% annual rate of return before expenses (not the Fund’s actual return). The amount under the heading “Expenses Paid During Period” shows the hypothetical expenses your account would have incurred under this scenario. You can compare this figure with the 5% hypothetical examples that appear in shareholder reports of other mutual funds.
| | | | | | | | | | | | |
Six Months Ended June 30, 2018 | | Beginning Account Value
1/1/2018 | | | Ending Account Value
6/30/2018 | | | Expenses Paid During Period* | |
Based on Actual Fund Return | | $ | 1,000.00 | | | $ | 966.10 | | | $ | 3.06 | |
Based on Hypothetical 5% Yearly Return | | | 1,000.00 | | | | 1,021.68 | | | | 3.14 | |
| * | | Expenses are equal to the Fund’s annualized expense ratio of 0.63%, multiplied by the average account value over the period, multiplied by 181/365 (to reflect the one-half year period). |
The expenses shown in the table highlight ongoing costs only and do not reflect any transactional fees or account maintenance fees. Though other mutual funds may charge such fees, please note that the Fund does not charge transaction fees (e.g., redemption fees, sales loads) or universal account maintenance fees (e.g., small account fees).
DODGE & COX GLOBAL STOCK FUND §PAGE 5
| | | | |
| FUND INFORMATION (unaudited) | | | June 30, 2018 | |
| | | | |
| GENERAL INFORMATION | | | |
Net Asset Value Per Share | | | $13.39 | |
Total Net Assets (billions) | | | $9.4 | |
Expense Ratio | | | 0.63% | |
Portfolio Turnover Rate (1/1/18 to 6/30/18, unannualized) | | | 13% | |
30-Day SEC Yield(a) | | | 1.31% | |
Active Share(b) | | | 85% | |
Number of Companies | | | 88 | |
Fund Inception | | | 2008 | |
No sales charges or distribution fees | | | | |
Investment Manager: Dodge & Cox, San Francisco. Managed by the Global Equity Investment Committee, whose seven members’ average tenure at Dodge & Cox is 24 years.
| | | | | | | | |
| PORTFOLIO CHARACTERISTICS | | Fund | | | MSCI
World | |
Median Market Capitalization (billions) | | | $44 | | | | $13 | |
Weighted Average Market Capitalization (billions) | | | $108 | | | | $138 | |
Price-to-Earnings Ratio(c) | | | 13.1x | | | | 15.3x | |
Countries Represented | | | 21 | | | | 23 | |
Emerging Markets (Brazil, China, India, Mexico, Russia, South Africa, South Korea, Thailand) | | | 16.3% | | | | 0.0% | |
| | | | |
| TEN LARGEST HOLDINGS (%)(d) | | Fund | |
Alphabet, Inc. (United States) | | | 2.7 | |
Comcast Corp. (United States) | | | 2.5 | |
Novartis AG (Switzerland) | | | 2.4 | |
Sanofi (France) | | | 2.3 | |
ICICI Bank, Ltd. (India) | | | 2.3 | |
GlaxoSmithKline PLC (United Kingdom) | | | 2.3 | |
Charter Communications, Inc. (United States) | | | 2.2 | |
Samsung Electronics Co., Ltd. (South Korea) | | | 2.1 | |
Roche Holding AG (Switzerland) | | | 2.0 | |
Express Scripts Holding Co. (United States) | | | 2.0 | |
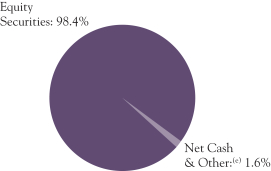
| | | | | | | | |
| REGION DIVERSIFICATION (%)(f) | | Fund | | | MSCI
World | |
United States | | | 45.0 | | | | 60.7 | |
Europe (excluding United Kingdom) | | | 24.8 | | | | 16.3 | |
United Kingdom | | | 10.1 | | | | 6.4 | |
Pacific (excluding Japan) | | | 9.1 | | | | 4.3 | |
Latin America | | | 4.4 | | | | 0.0 | |
Africa | | | 2.5 | | | | 0.0 | |
Canada | | | 1.5 | | | | 3.5 | |
Japan | | | 1.0 | | | | 8.6 | |
Middle East | | | 0.0 | | | | 0.2 | |
| | | | | | | | |
| SECTOR DIVERSIFICATION (%) | | Fund | | | MSCI
World | |
Financials | | | 26.9 | | | | 16.8 | |
Health Care | | | 20.1 | | | | 12.2 | |
Consumer Discretionary | | | 18.6 | | | | 12.7 | |
Information Technology | | | 11.9 | | | | 18.5 | |
Energy | | | 7.2 | | | | 6.8 | |
Industrials | | | 4.7 | | | | 11.2 | |
Materials | | | 3.9 | | | | 4.9 | |
Telecommunication Services | | | 3.7 | | | | 2.6 | |
Consumer Staples | | | 0.9 | | | | 8.3 | |
Real Estate | | | 0.5 | | | | 3.0 | |
Utilities | | | 0.0 | | | | 3.0 | |
| (a) | SEC Yield is an annualization of the Fund’s net investment income for the trailing 30-day period. Dividends paid by the Fund may be higher or lower than implied by the SEC Yield. |
| (b) | Active share is a measure of how much an investment portfolio differs from its benchmark index, based on a scale of 0% (complete overlap with the index) to 100% (no overlap). Overlap for each security in the Fund is the lower of either its percentage weight in the Fund or its percentage weight in the relevant index. The Global Stock Fund’s total overlap with the MSCI World is the sum of each security’s calculated overlap. |
| (c) | Price-to-earnings (P/E) ratios are calculated using 12-month forward earnings estimates from third-party sources. |
| (d) | The Fund’s portfolio holdings are subject to change without notice. The mention of specific securities is not a recommendation to buy, sell, or hold any particular security and is not indicative of Dodge & Cox’s current or future trading activity. |
| (e) | Net Cash & Other includes cash, short-term investments, derivatives, receivables, and payables. |
| (f) | The Fund may classify a company in a different category than the MSCI World. The Fund generally classifies a company based on its country of incorporation, but may designate a different country in certain circumstances. |
PAGE 6 § DODGE & COX GLOBAL STOCK FUND
| | | | |
| CONSOLIDATED PORTFOLIO OF INVESTMENTS (unaudited) | | | June 30, 2018 | |
| | | | | | | | |
| COMMON STOCKS: 94.6% | | | | | | |
| | |
| | | SHARES | | | VALUE | |
| CONSUMER DISCRETIONARY: 18.1% | |
AUTOMOBILES & COMPONENTS: 1.8% | | | | | | | | |
Bayerische Motoren Werke AG (Germany) | | | 867,300 | | | $ | 78,666,793 | |
Honda Motor Co., Ltd. (Japan) | | | 3,289,100 | | | | 96,444,482 | |
| | | | | | | | |
| | | | 175,111,275 | |
CONSUMER DURABLES & APPAREL: 0.5% | | | | | | | | |
Mattel, Inc.(a) (United States) | | | 2,741,367 | | | | 45,013,246 | |
| | |
MEDIA: 12.0% | | | | | | | | |
Altice Europe NV, Series A(a) (Netherlands) | | | 7,733,145 | | | | 31,472,493 | |
Altice USA, Inc., Class A (United States) | | | 3,219,308 | | | | 54,921,395 | |
Charter Communications, Inc., Class A(a) (United States) | | | 693,597 | | | | 203,369,576 | |
Comcast Corp., Class A (United States) | | | 7,046,600 | | | | 231,198,946 | |
DISH Network Corp., Class A(a) (United States) | | | 1,066,600 | | | | 35,848,426 | |
Grupo Televisa SAB ADR (Mexico) | | | 7,247,600 | | | | 137,342,020 | |
Liberty Global PLC, Series C(a) (United Kingdom) | | | 4,583,900 | | | | 121,977,579 | |
Liberty Latin America Ltd, Series A(a) (Bermuda/United Kingdom) | | | 1,199,000 | | | | 22,924,880 | |
Liberty Latin America Ltd, Series C(a) (Bermuda/United Kingdom) | | | 788,562 | | | | 15,282,332 | |
Naspers, Ltd. (South Africa) | | | 455,100 | | | | 115,338,219 | |
Television Broadcasts, Ltd. (Hong Kong) | | | 2,509,500 | | | | 7,943,406 | |
Twenty-First Century Fox, Inc., Class A (United States) | | | 2,950,500 | | | | 146,610,345 | |
| | | | | | | | |
| | | | 1,124,229,617 | |
RETAILING: 3.8% | | | | | | | | |
Booking Holdings, Inc.(a) (United States) | | | 51,600 | | | | 104,597,844 | |
JD.com, Inc. ADR(a) (Cayman Islands/China) | | | 2,496,200 | | | | 97,226,990 | |
Qurate Retail, Inc., Series A(a) (United States) | | | 3,964,372 | | | | 84,123,974 | |
Target Corp. (United States) | | | 907,300 | | | | 69,063,676 | |
| | | | | | | | |
| | | | 355,012,484 | |
| | | | | | | | |
| | | | 1,699,366,622 | |
| CONSUMER STAPLES: 0.9% | | | | | | | | |
FOOD & STAPLES RETAILING: 0.9% | | | | | | | | |
Magnit PJSC (Russia) | | | 1,171,100 | | | | 85,873,926 | |
| | |
| ENERGY: 6.6% | | | | | | | | |
Anadarko Petroleum Corp. (United States) | | | 2,381,273 | | | | 174,428,247 | |
Apache Corp. (United States) | | | 2,206,382 | | | | 103,148,359 | |
Baker Hughes, a GE Company (United States) | | | 111,547 | | | | 3,684,397 | |
National Oilwell Varco, Inc. (United States) | | | 1,598,700 | | | | 69,383,580 | |
Occidental Petroleum Corp. (United States) | | | 621,463 | | | | 52,004,024 | |
Schlumberger, Ltd. (Curacao/United States) | | | 918,900 | | | | 61,593,867 | |
Suncor Energy, Inc. (Canada) | | | 3,416,300 | | | | 138,975,084 | |
Weatherford International PLC(a) (Ireland) | | | 4,434,175 | | | | 14,588,436 | |
| | | | | | | | |
| | | | 617,805,994 | |
| FINANCIALS: 25.7% | | | | | | | | |
BANKS: 15.4% | | | | | | | | |
Axis Bank, Ltd.(a) (India) | | | 11,219,400 | | | | 83,144,253 | |
Banco Santander SA (Spain) | | | 10,350,033 | | | | 55,253,068 | |
Bank of America Corp. (United States) | | | 6,080,000 | | | | 171,395,200 | |
Barclays PLC (United Kingdom) | | | 68,713,400 | | | | 171,340,914 | |
BNP Paribas SA (France) | | | 1,907,100 | | | | 118,210,697 | |
ICICI Bank, Ltd. (India) | | | 54,800,436 | | | | 219,858,207 | |
Kasikornbank PCL- Foreign (Thailand) | | | 18,922,500 | | | | 113,963,255 | |
Societe Generale SA (France) | | | 3,028,100 | | | | 127,506,713 | |
Standard Chartered PLC (United Kingdom) | | | 7,988,977 | | | | 72,995,784 | |
UniCredit SPA (Italy) | | | 7,668,366 | | | | 127,536,640 | |
Wells Fargo & Co. (United States) | | | 3,302,773 | | | | 183,105,735 | |
| | | | | | | | |
| | | | 1,444,310,466 | |
DIVERSIFIED FINANCIALS: 8.3% | | | | | | | | |
American Express Co. (United States) | | | 739,700 | | | | 72,490,600 | |
Bank of New York Mellon Corp. (United States) | | | 1,490,500 | | | | 80,382,665 | |
| | | | | | | | |
| | |
| | | SHARES | | | VALUE | |
Capital One Financial Corp. (United States) | | | 1,585,800 | | | $ | 145,735,020 | |
Charles Schwab Corp. (United States) | | | 3,185,100 | | | | 162,758,610 | |
Credit Suisse Group AG (Switzerland) | | | 5,622,799 | | | | 84,384,336 | |
Goldman Sachs Group, Inc. (United States) | | | 496,200 | | | | 109,446,834 | |
UBS Group AG (Switzerland) | | | 7,679,500 | | | | 118,149,678 | |
| | | | | | | | |
| | | | 773,347,743 | |
INSURANCE: 2.0% | | | | | | | | |
AEGON NV (Netherlands) | | | 10,924,705 | | | | 65,283,683 | |
Aviva PLC (United Kingdom) | | | 18,209,820 | | | | 121,091,161 | |
| | | | | | | | |
| | | | 186,374,844 | |
| | | | | | | | |
| | | | 2,404,033,053 | |
| HEALTH CARE: 20.1% | | | | | | | | |
HEALTH CARE EQUIPMENT & SERVICES: 5.2% | |
Cigna Corp. (United States) | | | 581,700 | | | | 98,859,915 | |
Express Scripts Holding Co.(a) (United States) | | | 2,459,100 | | | | 189,867,111 | |
Medtronic PLC (Ireland) | | | 1,216,700 | | | | 104,161,687 | |
UnitedHealth Group, Inc. (United States) | | | 396,800 | | | | 97,350,912 | |
| | | | | | | | |
| | | | 490,239,625 | |
PHARMACEUTICALS, BIOTECHNOLOGY & LIFE SCIENCES: 14.9% | |
Alnylam Pharmaceuticals, Inc.(a) (United States) | | | 358,500 | | | | 35,308,665 | |
AstraZeneca PLC (United Kingdom) | | | 2,246,200 | | | | 155,516,078 | |
Bayer AG (Germany) | | | 742,920 | | | | 81,852,349 | |
Bristol-Myers Squibb Co. (United States) | | | 2,006,800 | | | | 111,056,312 | |
Eli Lilly and Co. (United States) | | | 1,753,248 | | | | 149,604,652 | |
GlaxoSmithKline PLC (United Kingdom) | | | 10,727,400 | | | | 216,433,806 | |
Merck & Co., Inc. (United States) | | | 102,200 | | | | 6,203,540 | |
Novartis AG (Switzerland) | | | 2,741,200 | | | | 207,630,939 | |
Novartis AG ADR (Switzerland) | | | 260,900 | | | | 19,708,386 | |
Roche Holding AG (Switzerland) | | | 855,900 | | | | 190,450,756 | |
Sanofi (France) | | | 2,755,562 | | | | 220,644,643 | |
| | | | | | | | |
| | | | 1,394,410,126 | |
| | | | | | | | |
| | | | 1,884,649,751 | |
| INDUSTRIALS: 4.7% | | | | | | | | |
CAPITAL GOODS: 2.7% | | | | | | | | |
Johnson Controls International PLC (Ireland) | | | 5,578,840 | | | | 186,612,198 | |
Schneider Electric SA (France) | | | 848,578 | | | | 70,583,517 | |
| | | | | | | | |
| | | | 257,195,715 | |
TRANSPORTATION: 2.0% | | | | | | | | |
FedEx Corp. (United States) | | | 386,800 | | | | 87,826,808 | |
Union Pacific Corp. (United States) | | | 691,100 | | | | 97,915,048 | |
| | | | | | | | |
| | | | 185,741,856 | |
| | | | | | | | |
| | | | 442,937,571 | |
| INFORMATION TECHNOLOGY: 10.4% | |
SOFTWARE & SERVICES: 6.6% | | | | | | | | |
Alphabet, Inc., Class C(a) (United States) | | | 223,999 | | | | 249,904,485 | |
Baidu, Inc. ADR(a) (Cayman Islands/China) | | | 373,600 | | | | 90,784,800 | |
Dell Technologies, Inc., Class V(a) (United States) | | | 1,252,416 | | | | 105,929,345 | |
Micro Focus International PLC ADR (United Kingdom) | | | 2,872,449 | | | | 49,607,194 | |
Microsoft Corp. (United States) | | | 1,260,000 | | | | 124,248,600 | |
| | | | | | | | |
| | | | 620,474,424 | |
TECHNOLOGY, HARDWARE & EQUIPMENT: 3.8% | |
Hewlett Packard Enterprise Co. (United States) | | | 6,828,424 | | | | 99,763,275 | |
HP Inc. (United States) | | | 2,080,200 | | | | 47,199,738 | |
Juniper Networks, Inc. (United States) | | | 2,967,168 | | | | 81,359,746 | |
Samsung Electronics Co., Ltd. (South Korea) | | | 1,336,200 | | | | 55,794,309 | |
TE Connectivity, Ltd. (Switzerland) | | | 823,815 | | | | 74,192,779 | |
| | | | | | | | |
| | | | 358,309,847 | |
| | | | | | | | |
| | | | 978,784,271 | |
| | |
| See accompanying Notes to Consolidated Financial Statements | | DODGE & COX GLOBAL STOCK FUND §PAGE 7 |
| | | | |
| CONSOLIDATED PORTFOLIO OF INVESTMENTS (unaudited) | | | June 30, 2018 | |
| | | | | | | | |
| COMMON STOCKS (continued) | |
| | |
| | | SHARES | | | VALUE | |
| MATERIALS: 3.9% | | | | | | | | |
Celanese Corp., Series A (United States) | | | 519,000 | | | $ | 57,640,140 | |
Cemex SAB de CV ADR (Mexico) | | | 15,489,917 | | | | 101,613,855 | |
LafargeHolcim, Ltd. (Switzerland) | | | 1,142,520 | | | | 55,708,589 | |
Linde AG (Germany) | | | 624,910 | | | | 149,124,098 | |
| | | | | | | | |
| | | | 364,086,682 | |
| REAL ESTATE: 0.5% | | | | | | | | |
Hang Lung Group, Ltd. (Hong Kong) | | | 15,217,900 | | | | 42,593,866 | |
|
| TELECOMMUNICATION SERVICES: 3.7% | |
AT&T, Inc. (United States) | | | 2,678,662 | | | | 86,011,837 | |
Millicom International Cellular SA SDR (Luxembourg) | | | 1,003,400 | | | | 59,020,798 | |
MTN Group, Ltd. (South Africa) | | | 9,129,900 | | | | 71,752,511 | |
Sprint Corp.(a) (United States) | | | 9,218,500 | | | | 50,148,640 | |
Zayo Group Holdings, Inc.(a) (United States) | | | 2,108,300 | | | | 76,910,784 | |
| | | | | | | | |
| | | | 343,844,570 | |
| | | | | | | | |
TOTAL COMMON STOCKS
(Cost $7,376,065,179) | | | $ | 8,863,976,306 | |
|
| PREFERRED STOCKS: 3.3% | |
| ENERGY: 0.6% | | | | | | | | |
Petroleo Brasileiro SA(a) (Brazil) | | | 13,407,906 | | | | 59,467,691 | |
| | |
| FINANCIALS: 1.2% | | | | | | | | |
BANKS: 1.2% | | | | | | | | |
Itau Unibanco Holding SA (Brazil) | | | 10,481,129 | | | | 109,090,819 | |
|
| INFORMATION TECHNOLOGY: 1.5% | |
TECHNOLOGY, HARDWARE & EQUIPMENT: 1.5% | |
Samsung Electronics Co., Ltd. (South Korea) | | | 4,040,700 | | | | 136,255,716 | |
| | | | | | | | |
TOTAL PREFERRED STOCKS
(Cost $168,119,229) | | | $ | 304,814,226 | |
|
| EQUITY-LINKED NOTE: 0.5% | |
| CONSUMER DISCRETIONARY: 0.5% | |
MEDIA: 0.5% | | | | | | | | |
Naspers, Ltd. excluding Tencent Holdings, Ltd. 5/30/19(a)(c) (South Africa) | | | 191,000 | | | | 49,512,930 | |
| | | | | | | | |
TOTAL EQUITY-LINKED NOTE
(Cost $49,510,485) | | | $ | 49,512,930 | |
| | | | | | | | |
| SHORT-TERM INVESTMENTS: 2.2% | |
| | |
| | | PAR VALUE/
SHARES | | | VALUE | |
| REPURCHASE AGREEMENT: 1.8% | |
Fixed Income Clearing Corporation(b) 1.20%, dated 6/29/18, due 7/2/18, maturity value $166,178,616 | | $ | 166,162,000 | | | $ | 166,162,000 | |
| | |
MONEY MARKET FUND: 0.4% | | | | | | | | |
State Street Institutional U.S. Government Money Market Fund | | | 37,184,064 | | | | 37,184,064 | |
| | | | | | | | |
TOTAL SHORT-TERM INVESTMENTS
(Cost $203,346,064) | | | $ | 203,346,064 | |
| | | | | | | | |
TOTAL INVESTMENTS IN SECURITIES
(Cost $7,797,040,957) | | | 100.6 | % | | $ | 9,421,649,526 | |
OTHER ASSETS LESS LIABILITIES | | | (0.6 | %) | | | (54,450,339 | ) |
| | | | | | | | |
| NET ASSETS | | | 100.0 | % | | $ | 9,367,199,187 | |
| | | | | | | | |
| (b) | Repurchase agreement is collateralized by U.S. Treasury Note 2.625%, 6/15/21. Total collateral value is $169,488,614. |
| (c) | Equity-linked note issued by JPMorgan Chase Bank, N.A. The note is designed to provide exposure to Naspers, Ltd. excluding the effect of Naspers Ltd’s investment in Tencent Holdings, Ltd. The note is exempt from registration under Rule 144A of the Securities Act of 1933. The note may be resold in transactions exempt from registration, normally to qualified institutional buyers. The note has been deemed liquid by Dodge & Cox, investment manager, pursuant to procedures approved by the Fund’s Board of Trustees. |
In determining a company’s country designation, the Fund generally references the country of incorporation. In cases where the Fund considers the country of incorporation to be a “jurisdiction of convenience” chosen primarily for tax purposes or in other limited circumstances, the Fund uses the country designation of an appropriate broad-based market index. In those cases, two countries are listed—the country of incorporation and the country designated by an appropriate index, respectively.
ADR: American Depositary Receipt
SDR: Swedish Depository Receipt
| | |
| PAGE 8 § DODGE & COX GLOBAL STOCK FUND | | See accompanying Notes to Consolidated Financial Statements |
| | | | |
| CONSOLIDATED PORTFOLIO OF INVESTMENTS (unaudited) | | | June 30, 2018 | |
FUTURES CONTRACTS
| | | | | | | | | | | | | | | | |
| Description | | Number of
Contracts | | | Expiration
Date | | | Notional
Amount | | | Value /
Unrealized
Appreciation
(Depreciation) | |
E-mini S&P 500 Index—Long Position | | | 738 | | | | 9/21/18 | | | $ | 100,427,040 | | | $ | (2,361,868 | ) |
CURRENCY FORWARD CONTRACTS | |
| | | | | | Contract Amount | | | | |
| Counterparty | | Settle
Date | | | Receive U.S.
Dollar | | | Deliver
Foreign
Currency | | | Unrealized
Appreciation
(Depreciation) | |
Contracts to sell CHF: | |
Citibank | | | 7/25/18 | | | | 15,165,156 | | | | 14,703,150 | | | $ | 290,709 | |
Citibank | | | 7/25/18 | | | | 7,639,590 | | | | 7,406,850 | | | | 146,447 | |
Goldman Sachs | | | 7/25/18 | | | | 7,537,227 | | | | 7,296,300 | | | | 155,922 | |
Goldman Sachs | | | 7/25/18 | | | | 14,961,959 | | | | 14,483,700 | | | | 309,518 | |
HSBC | | | 7/25/18 | | | | 7,635,739 | | | | 7,406,850 | | | | 142,596 | |
HSBC | | | 7/25/18 | | | | 15,157,512 | | | | 14,703,150 | | | | 283,064 | |
Barclays | | | 8/8/18 | | | | 9,495,416 | | | | 9,300,000 | | | | 75,909 | |
Goldman Sachs | | | 8/8/18 | | | | 7,397,431 | | | | 7,250,000 | | | | 54,267 | |
Goldman Sachs | | | 8/8/18 | | | | 7,397,431 | | | | 7,250,000 | | | | 54,267 | |
JPMorgan | | | 8/15/18 | | | | 20,322,954 | | | | 20,200,000 | | | | (148,731 | ) |
HSBC | | | 8/22/18 | | | | 20,226,128 | | | | 20,000,000 | | | | (54,871 | ) |
Contracts to sell CNH: | |
Bank of America | | | 8/1/18 | | | | 5,871,921 | | | | 40,354,776 | | | | (206,054 | ) |
Bank of America | | | 8/1/18 | | | | 4,070,927 | | | | 27,977,448 | | | | (142,855 | ) |
JPMorgan | | | 8/1/18 | | | | 5,872,776 | | | | 40,354,777 | | | | (205,200 | ) |
JPMorgan | | | 8/1/18 | | | | 5,873,630 | | | | 40,354,776 | | | | (204,345 | ) |
JPMorgan | | | 8/1/18 | | | | 4,071,520 | | | | 27,977,449 | | | | (142,262 | ) |
JPMorgan | | | 8/1/18 | | | | 4,070,631 | | | | 27,977,449 | | | | (143,151 | ) |
JPMorgan | | | 8/1/18 | | | | 4,072,112 | | | | 27,977,448 | | | | (141,670 | ) |
JPMorgan | | | 8/1/18 | | | | 5,871,494 | | | | 40,354,777 | | | | (206,481 | ) |
Bank of America | | | 8/8/18 | | | | 9,366,533 | | | | 64,455,800 | | | | (338,902 | ) |
Credit Suisse | | | 8/8/18 | | | | 9,368,984 | | | | 64,455,800 | | | | (336,451 | ) |
Goldman Sachs | | | 8/8/18 | | | | 7,205,552 | | | | 49,581,400 | | | | (260,170 | ) |
JPMorgan | | | 8/8/18 | | | | 7,206,075 | | | | 49,581,400 | | | | (259,646 | ) |
JPMorgan | | | 8/8/18 | | | | 7,205,028 | | | | 49,581,400 | | | | (260,694 | ) |
JPMorgan | | | 8/15/18 | | | | 25,259,917 | | | | 172,651,536 | | | | (729,471 | ) |
UBS | | | 8/15/18 | | | | 2,248,430 | | | | 15,399,496 | | | | (69,670 | ) |
UBS | | | 8/15/18 | | | | 8,655,478 | | | | 59,281,368 | | | | (268,199 | ) |
Bank of America | | | 8/29/18 | | | | 6,039,970 | | | | 40,800,000 | | | | (98,089 | ) |
Bank of America | | | 8/29/18 | | | | 6,171,734 | | | | 41,616,000 | | | | (89,087 | ) |
Bank of America | | | 8/29/18 | | | | 11,363,809 | | | | 75,000,000 | | | | 80,611 | |
Citibank | | | 8/29/18 | | | | 6,045,743 | | | | 40,800,000 | | | | (92,317 | ) |
HSBC | | | 8/29/18 | | | | 40,667,900 | | | | 275,000,000 | | | | (703,826 | ) |
UBS | | | 8/29/18 | | | | 5,337,129 | | | | 36,000,000 | | | | (78,806 | ) |
UBS | | | 8/29/18 | | | | 5,861,715 | | | | 39,584,160 | | | | (93,431 | ) |
UBS | | | 8/29/18 | | | | 6,103,228 | | | | 41,199,840 | | | | (94,985 | ) |
Credit Suisse | | | 1/9/19 | | | | 7,298,389 | | | | 48,278,840 | | | | 69,060 | |
HSBC | | | 1/9/19 | | | | 1,820,112 | | | | 12,069,710 | | | | 12,780 | |
HSBC | | | 1/9/19 | | | | 1,820,579 | | | | 12,069,710 | | | | 13,247 | |
HSBC | | | 1/9/19 | | | | 5,460,337 | | | | 36,209,130 | | | | 38,340 | |
HSBC | | | 1/9/19 | | | | 5,461,737 | | | | 36,209,130 | | | | 39,740 | |
JPMorgan | | | 1/16/19 | | | | 22,554,310 | | | | 147,128,533 | | | | 527,631 | |
JPMorgan | | | 1/16/19 | | | | 35,845,717 | | | | 233,832,367 | | | | 838,568 | |
Citibank | | | 1/30/19 | | | | 7,918,195 | | | | 51,135,704 | | | | 265,783 | |
Citibank | | | 1/30/19 | | | | 7,803,155 | | | | 50,372,484 | | | | 264,958 | |
Citibank | | | 1/30/19 | | | | 439,944 | | | | 2,840,015 | | | | 14,938 | |
Citibank | | | 1/30/19 | | | | 446,430 | | | | 2,883,046 | | | | 14,985 | |
HSBC | | | 1/30/19 | | | | 7,881,608 | | | | 50,881,297 | | | | 267,268 | |
HSBC | | | 1/30/19 | | | | 444,367 | | | | 2,868,702 | | | | 15,069 | |
UBS | | | 1/30/19 | | | | 7,916,357 | | | | 51,135,705 | | | | 263,944 | |
UBS | | | 1/30/19 | | | | 446,327 | | | | 2,883,047 | | | | 14,881 | |
Citibank | | | 2/13/19 | | | | 5,050,348 | | | | 32,500,000 | | | | 188,745 | |
Credit Suisse | | | 2/13/19 | | | | 5,047,760 | | | | 32,500,000 | | | | 186,156 | |
Citibank | | | 6/12/19 | | | | 10,779,347 | | | | 70,000,000 | | | | 344,634 | |
| | | | | | | | | | | | | | | | |
| | | | | | Contract Amount | | | | |
| Counterparty | | Settle
Date | | | Deliver U.S.
Dollar | | | Receive Foreign
Currency | | | Unrealized
Appreciation
(Depreciation) | |
Contracts to buy CNH: | |
Goldman Sachs | | | 8/1/18 | | | | 32,310,927 | | | | 204,996,676 | | | $ | (1,435,655 | ) |
Citibank | | | 8/8/18 | | | | 2,617,690 | | | | 16,609,769 | | | | (116,674 | ) |
Goldman Sachs | | | 8/8/18 | | | | 2,616,824 | | | | 16,609,769 | | | | (115,808 | ) |
HSBC | | | 8/8/18 | | | | 2,578,092 | | | | 16,361,862 | | | | (114,404 | ) |
| | | | | | | | | | | | | | | | |
Unrealized gain on currency forward contracts | | | | 4,974,037 | |
Unrealized loss on currency forward contracts | | | | (7,151,905 | ) |
| | | | | | | | | | | | | | | | |
Net unrealized loss on currency forward contracts | | | $ | (2,177,868 | ) |
| | | | | | | | | | | | | | | | |
The listed counterparty may be the parent company or one of its subsidiaries.
CHF:Swiss Franc
CNH:Chinese Yuan Renminbi
| | |
| See accompanying Notes to Consolidated Financial Statements | | DODGE & COX GLOBAL STOCK FUND §PAGE 9 |
| | | | |
CONSOLIDATED STATEMENT OF ASSETS AND LIABILITIES (unaudited) | |
| |
| | | June 30, 2018 | |
ASSETS: | | | | |
Investments in securities, at value (cost $7,797,040,957) | | $ | 9,421,649,526 | |
Unrealized appreciation on currency forward contracts | | | 4,974,037 | |
Cash pledged as collateral for currency forward contracts | | | 3,250,000 | |
Cash | | | 100 | |
Cash denominated in foreign currency (cost $497) | | | 485 | |
Deposits with broker for futures contracts | | | 4,132,802 | |
Receivable for variation margin for futures contracts | | | 77,490 | |
Receivable for investments sold | | | 37,363,985 | |
Receivable for Fund shares sold | | | 2,508,553 | |
Dividends and interest receivable | | | 16,798,926 | |
Prepaid expenses and other assets | | | 19,349 | |
| | | | |
| | | 9,490,775,253 | |
| | | | |
LIABILITIES: | | | | |
Unrealized depreciation on currency forward contracts | | | 7,151,905 | |
Cash received as collateral for currency forward contracts | | | 1,820,000 | |
Payable for investments purchased | | | 105,664,446 | |
Payable for Fund shares redeemed | | | 3,778,403 | |
Management fees payable | | | 4,678,434 | |
Accrued expenses | | | 482,878 | |
| | | | |
| | | 123,576,066 | |
| | | | |
NET ASSETS | | $ | 9,367,199,187 | |
| | | | |
NET ASSETS CONSIST OF: | | | | |
Paid in capital | | $ | 7,270,717,687 | |
Undistributed net investment income | | | 101,792,028 | |
Undistributed net realized gain | | | 374,760,292 | |
Net unrealized appreciation | | | 1,619,929,180 | |
| | | | |
| | $ | 9,367,199,187 | |
| | | | |
Fund shares outstanding (par value $0.01 each, unlimited shares authorized) | | | 699,407,697 | |
Net asset value per share | | $ | 13.39 | |
|
CONSOLIDATED STATEMENT OF OPERATIONS (unaudited) | |
| |
| | | Six Months Ended
June 30, 2018 | |
INVESTMENT INCOME: | | | | |
Dividends (net of foreign taxes of $10,620,639) | | $ | 130,491,527 | |
Interest | | | 1,019,975 | |
| | | | |
| | | 131,511,502 | |
| | | | |
EXPENSES: | | | | |
Management fees | | | 29,244,587 | |
Custody and fund accounting fees | | | 436,511 | |
Transfer agent fees | | | 225,372 | |
Professional services | | | 100,707 | |
Shareholder reports | | | 22,290 | |
Registration fees | | | 198,789 | |
Trustees’ fees | | | 162,083 | |
ADR depositary service fees | | | 111,352 | |
Miscellaneous | | | 67,025 | |
| | | | |
| | | 30,568,716 | |
| | | | |
NET INVESTMENT INCOME | | | 100,942,786 | |
| | | | |
REALIZED AND UNREALIZED GAIN (LOSS): | | | | |
Net realized gain (loss) | | | | |
Investments in securities | | | 269,202,562 | |
Futures contracts | | | 10,321,077 | |
Currency forward contracts | | | (25,349,502 | ) |
Foreign currency transactions | | | (1,466,652 | ) |
Net change in unrealized appreciation/depreciation | | | | |
Investments in securities (net of decrease in deferred foreign capital gains tax of $3,859,673) | | | (700,938,102 | ) |
Futures contracts | | | (3,342,797 | ) |
Currency forward contracts | | | 26,496,633 | |
Foreign currency translation | | | (310,396 | ) |
| | | | |
Net realized and unrealized loss | | | (425,387,177 | ) |
| | | | |
NET CHANGE IN NET ASSETS FROM OPERATIONS | | $ | (324,444,391 | ) |
| | | | |
| | | | | | | | |
CONSOLIDATED STATEMENT OF CHANGES IN NET ASSETS (unaudited) | |
| | |
| | | Six Months Ended
June 30, 2018 | | | Year Ended
December 31, 2017 | |
OPERATIONS: | | | | | | | | |
Net investment income | | $ | 100,942,786 | | | $ | 86,363,057 | |
Net realized gain (loss) | | | 252,707,485 | | | | 377,089,181 | |
Net change in unrealized appreciation/depreciation | | | (678,094,662 | ) | | | 1,154,466,793 | |
| | | | | | | | |
| | | (324,444,391 | ) | | | 1,617,919,031 | |
| | | | | | | | |
| | |
DISTRIBUTIONS TO SHAREHOLDERS FROM: | | | | | | | | |
Net investment income | | | — | | | | (87,312,909 | ) |
Net realized gain | | | — | | | | (310,519,938 | ) |
| | | | | | | | |
Total distributions | | | — | | | | (397,832,847 | ) |
| | | | | | | | |
| | |
FUND SHARE TRANSACTIONS: | | | | | | | | |
Proceeds from sale of shares | | | 488,173,737 | | | | 2,601,130,740 | |
Reinvestment of distributions | | | — | | | | 387,957,885 | |
Cost of shares redeemed | | | (707,113,293 | ) | | | (1,399,820,312 | ) |
| | | | | | | | |
Net change from Fund share transactions | | | (218,939,556 | ) | | | 1,589,268,313 | |
| | | | | | | | |
Total change in net assets | | | (543,383,947 | ) | | | 2,809,354,497 | |
| | |
NET ASSETS: | | | | | | | | |
Beginning of period | | | 9,910,583,134 | | | | 7,101,228,637 | |
| | | | | | | | |
End of period (including undistributed net investment income of $101,792,028 and $849,242, respectively) | | $ | 9,367,199,187 | | | $ | 9,910,583,134 | |
| | | | | | | | |
| | |
SHARE INFORMATION: | | | | | | | | |
Shares sold | | | 35,074,088 | | | | 195,795,071 | |
Distributions reinvested | | | — | | | | 28,276,808 | |
Shares redeemed | | | (50,821,805 | ) | | | (105,299,029 | ) |
| | | | | | | | |
Net change in shares outstanding | | | (15,747,717 | ) | | | 118,772,850 | |
| | | | | | | | |
| | |
| PAGE 10 § DODGE & COX GLOBAL STOCK FUND | | See accompanying Notes to Consolidated Financial Statements |
NOTES TO CONSOLIDATED FINANCIAL STATEMENTS (unaudited)
NOTE 1—ORGANIZATION AND SIGNIFICANT ACCOUNTING POLICIES
Dodge & Cox Global Stock Fund (the “Fund”) is one of the series constituting the Dodge & Cox Funds (the “Trust” or the “Funds”). The Trust is organized as a Delaware statutory trust and is registered under the Investment Company Act of 1940, as amended, as an open-end management investment company. The Fund commenced operations on May 1, 2008, and seeks long-term growth of principal and income. The Fund invests primarily in a diversified portfolio of U.S. and foreign equity securities. Foreign investing, especially in developing countries, has special risks such as currency and market volatility and political and social instability. These and other risk considerations are discussed in the Fund’s Prospectus.
The financial statements have been prepared in conformity with accounting principles generally accepted in the United States of America, which require the use of estimates and assumptions by management. Actual results may differ from those estimates. Significant accounting policies are as follows:
Security valuation The Fund’s net assets are normally valued as of the scheduled close of trading on the New York Stock Exchange (NYSE), generally 4 p.m. Eastern Time, each day that the NYSE is open for business.
Portfolio holdings for which market quotes are readily available are valued at market value. Listed securities, for example, are generally valued using the official quoted close price or the last sale on the exchange that is determined to be the primary market for the security. Equity-linked notes are valued using prices received from independent pricing services which utilize market quotes from underlying reference instruments. Exchange-traded derivatives are valued at the settlement price determined by the relevant exchange. Short-term securities less than 60 days to maturity may be valued at amortized cost if amortized cost approximates current value. Security values are not discounted based on the size of the Fund’s position and may differ from the value a Fund receives upon sale of the securities. Mutual funds are valued at their respective net asset values.
Investments initially valued in currencies other than the U.S. dollar are converted to the U.S. dollar using prevailing exchange rates. Currency forward contracts are valued based on the prevailing forward exchange rates of the underlying currencies. As a result, the Fund’s net assets may be affected by changes in the value of currencies in relation to the U.S. dollar.
If market quotations are not readily available or if normal valuation procedures produce valuations that are deemed unreliable or inappropriate under the circumstances existing at the time, the investment will be valued at fair value as determined in good faith by or under the direction of the Fund’s Board of Trustees. The Board of Trustees has appointed Dodge & Cox, the Fund’s investment manager, to make fair value determinations in accordance with the Dodge & Cox Funds Valuation Policies (“Valuation Policies”), subject to Board oversight. Dodge & Cox has established a Pricing Committee that is comprised of representatives from Treasury, Legal, Compliance, and Operations. The Pricing Committee is responsible for implementing the
Valuation Policies, including determining the fair value of securities and other investments when necessary. The Pricing Committee considers relevant indications of value that are reasonably available to it in determining the fair value assigned to a particular security, such as the value of similar financial instruments, trading volumes, contractual restrictions on disposition, related corporate actions, and changes in economic conditions. In doing so, the Pricing Committee employs various methods for calibrating fair valuation approaches, including a regular review of key inputs and assumptions, back-testing, and review of any related market activity.
As trading in securities on most foreign exchanges is normally completed before the close of the NYSE, the value of non-U.S. securities can change by the time the Fund calculates its net asset value. To address these changes, the Fund may utilize adjustment factors provided by an independent pricing service to systematically value non-U.S. securities at fair value. These adjustment factors are based on statistical analyses of subsequent movements and changes in U.S. markets and financial instruments trading in U.S. markets that represent foreign securities or baskets of securities.
Valuing securities through a fair value determination involves greater reliance on judgment than valuation of securities based on readily available market quotations. In some instances, lack of information and uncertainty as to the significance of information may lead to a conclusion that a prior valuation is the best indication of a security’s value. When fair value pricing is employed, the prices of securities used by the Fund to calculate its net asset value may differ from quoted or published prices for the same securities.
Security transactions, investment income, expenses, and distributions Security transactions are recorded on the trade date. Realized gains and losses on securities sold are determined on the basis of identified cost.
Dividend income and corporate action transactions are recorded on the ex-dividend date, or when the Fund first learns of the dividend/corporate action if the ex-dividend date has passed. Non-cash dividends, if any, are recorded at the fair market value of the securities received. Dividends characterized as return of capital for U.S. tax purposes are recorded as a reduction of cost of investments and/or realized gain. Interest income is recorded on the accrual basis.
Expenses are recorded on the accrual basis. Some expenses of the Trust can be directly attributed to a specific series. Expenses which cannot be directly attributed are allocated among the Funds in the Trust using methodologies determined by the nature of the expense.
Distributions to shareholders are recorded on the ex-dividend date.
Foreign taxes The Fund is subject to foreign taxes which may be imposed by certain countries in which the Fund invests. The Fund endeavors to record foreign taxes based on applicable foreign tax law. Withholding taxes are incurred on certain foreign dividends and are accrued at the time the associated dividend is recorded. The Fund files withholding tax reclaims in certain jurisdictions to recover a portion of amounts previously withheld. The Fund records a reclaim receivable based on, among other things, a jurisdiction’s legal obligation to pay reclaims as well as
DODGE & COX GLOBAL STOCK FUND §PAGE 11
NOTES TO CONSOLIDATED FINANCIAL STATEMENTS (unaudited)
payment history and market convention. In consideration of recent decisions rendered by European courts, the Fund has filed for additional reclaims related to prior years. A corresponding receivable is established when both the amount is known and significant contingencies or uncertainties regarding collectability are removed. These amounts, if any, are reported in “dividends and interest receivable” in the Consolidated Statement of Assets and Liabilities.
Capital gains taxes are incurred upon disposition of certain foreign securities. Expected capital gains taxes on appreciated securities, if any, are accrued as unrealized losses and incurred capital gains taxes are reflected as realized losses upon the sale of the related security. Currency taxes may be incurred when the Fund purchases certain foreign currencies related to securities transactions and are recorded as realized losses on foreign currency transactions.
Equity-linked note An Equity-linked note is a structured security linked to underlying reference instruments. Changes in the market value of equity-linked notes are recorded as unrealized appreciation or depreciation and realized gains or losses are recorded upon the sale or maturity of the notes in the Consolidated Statement of Operations within investments in securities. The risks of investing in equity-linked notes include unfavorable price movements in the underlying securities and the credit risk of the issuing financial institution. Equity-linked notes may be more volatile and less liquid than other investments held by the Fund.
Repurchase agreements Repurchase agreements are transactions under which a Fund purchases a security from a dealer counterparty and agrees to resell the security to that counterparty on a specified future date at the same price, plus a specified interest rate. The Fund’s repurchase agreements are secured by U.S. government or agency securities. It is the Fund’s policy that its custodian take possession of the underlying collateral securities, the fair value of which exceeds the principal amount of the repurchase transaction, including accrued interest, at all times. In the event of default by the counterparty, the Fund has the contractual right to liquidate the collateral securities and to apply the proceeds in satisfaction of the obligation.
Foreign currency translation The books and records of the Fund are maintained in U.S. dollars. Foreign currency amounts are translated into U.S. dollars at the prevailing exchange rates of such currencies against the U.S. dollar. The market value of investment securities and other assets and liabilities are translated at the exchange rate as of the valuation date. Purchases and sales of investment securities, income, and expenses are translated at the exchange rate prevailing on the transaction date.
Reported realized and unrealized gain (loss) on investments include foreign currency gain (loss) related to investment transactions.
Reported realized and unrealized gain (loss) on foreign currency transactions and translation include the following: disposing/holding of foreign currency, the difference between the trade and settlement dates on securities transactions, the difference between the accrual and payment dates on dividends, and currency losses on the purchase of foreign currency in certain countries that impose taxes on such transactions.
Consolidation The Fund may invest in certain securities through its wholly owned subsidiary, Dodge & Cox Global Stock Fund Cayman, Ltd. (the “Subsidiary”). The Subsidiary is a
Cayman Islands exempted company and invests in certain securities consistent with the investment objective of the Fund. The Fund’s Consolidated Financial Statements, including the Consolidated Portfolio of Investments, consist of the holdings and accounts of the Fund and the Subsidiary. All intercompany transactions and balances have been eliminated. At June 30, 2018, the Subsidiary had net assets of $100, which represented less than 0.01% of the Fund’s consolidated net assets.
Indemnification Under the Trust’s organizational documents, its officers and trustees are indemnified against certain liabilities arising out of the performance of their duties to the Trust. In addition, in the normal course of business the Trust enters into contracts that provide general indemnities to other parties. The Trust’s maximum exposure under these arrangements is unknown as this would involve future claims that may be made against the Trust that have not yet occurred.
NOTE 2—VALUATION MEASUREMENTS
Various inputs are used in determining the value of the Fund’s investments. These inputs are summarized in the three broad levels listed below.
| § | | Level 1: Quoted prices in active markets for identical securities |
| § | | Level 2: Other significant observable inputs (including quoted prices for similar securities, market indices, interest rates, credit risk, forward exchange rates, etc.) |
| § | | Level 3: Significant unobservable inputs (including Fund management’s assumptions in determining the fair value of investments) |
The inputs or methodology used for valuing securities are not necessarily an indication of the risk associated with investing in those securities.
The following is a summary of the inputs used to value the Fund’s holdings at June 30, 2018:
| | | | | | | | |
| Classification(a) | | LEVEL 1
(Quoted Prices) | | | LEVEL 2
(Other Significant
Observable Inputs) | |
Securities | | | | | | | | |
Common Stocks | | | | | | | | |
Consumer Discretionary | | $ | 1,369,501,228 | | | $ | 329,865,394 | |
Consumer Staples | | | — | | | | 85,873,926 | |
Energy | | | 617,805,994 | | | | — | |
Financials | | | 925,314,664 | | | | 1,478,718,389 | |
Health Care | | | 812,121,180 | | | | 1,072,528,571 | |
Industrials | | | 372,354,054 | | | | 70,583,517 | |
Information Technology | | | 922,989,962 | | | | 55,794,309 | |
Materials | | | 159,253,995 | | | | 204,832,687 | |
Real Estate | | | — | | | | 42,593,866 | |
Telecommunication Services | | | 213,071,261 | | | | 130,773,309 | |
Preferred Stocks | | | | | | | | |
Energy | | | 59,467,691 | | | | — | |
Financials | | | 109,090,819 | | | | — | |
Information Technology | | | — | | | | 136,255,716 | |
Equity-Linked Note | | | | | | | | |
Consumer Discretionary | | | — | | | | 49,512,930 | |
Short-term Investments | | | | | | | | |
Repurchase Agreement | | | | | | | 166,162,000 | |
Money Market Fund | | | 37,184,064 | | | | | |
| | | | | | | | |
Total Securities | | $ | 5,598,154,912 | | | $ | 3,823,494,614 | |
| | | | | | | | |
PAGE 12 § DODGE & COX GLOBAL STOCK FUND
NOTES TO CONSOLIDATED FINANCIAL STATEMENTS (unaudited)
| | | | | | | | |
| Classification(a) | | LEVEL 1
(Quoted Prices) | | | LEVEL 2
(Other Significant
Observable Inputs) | |
Other Investments | | | | | | | | |
Futures Contracts | | | | | | | | |
Depreciation | | $ | (2,361,868) | | | $ | — | |
Currency Forward Contracts | | | | | | | | |
Appreciation | | | — | | | | 4,974,037 | |
Depreciation | | | — | | | | (7,151,905 | ) |
| | | | | | | | | |
| (a) | Transfers during the period between Level 1 and Level 2 relate to the use of systematic fair valuation or when significant observable inputs are used to fair value a specific security. On days when systematic fair valuation is used, securities whose primary market closes before the NYSE are classified as Level 2. There were no Level 3 securities at June 30, 2018 and December 31, 2017, and there were no transfers to Level 3 during the period. |
NOTE 3—DERIVATIVE INSTRUMENTS
The Fund entered into various transactions involving derivative instruments, including currency forward contracts and futures contracts, in connection with its investment strategy. The Fund may use derivatives to minimize the impact of losses to one or more of its investments (as a ‘‘hedging technique’’) or to implement its investment strategy.
The Fund has entered into over-the-counter derivatives, such as currency forward contracts (each, an ‘‘OTC Derivative’’). Each OTC Derivative is subject to a negotiated master agreement (based on a form published by the International Swaps and Derivatives Association (‘‘ISDA’’)) governing all OTC Derivatives between the Fund and the relevant dealer counterparty. The master agreements specify (i) events of default and other events permitting a party to terminate some or all of the OTC Derivatives thereunder and (ii) the process by which those OTC Derivatives will be valued for purposes of determining termination payments. If some or all of the OTC Derivatives under a master agreement are terminated because of an event of default or similar event, the values of all terminated OTC Derivatives must be netted to determine a single payment owed by one party to the other. To the extent amounts owed to the Fund by its counterparties are not collateralized, the Fund is at risk of those counterparties’ non-performance. The Fund attempts to mitigate counterparty credit risk by entering into OTC Derivatives only with counterparties it believes to be of good credit quality, by exchanging collateral and by monitoring the financial stability of those counterparties.
Futures contracts Futures contracts involve an obligation to purchase or sell (depending on whether the Fund has entered a long or short futures contract, respectively) an asset at a future date, at a price set at the time of the contract. Upon entering into a futures contract, the Fund is required to deposit an amount of cash or liquid assets (referred to as initial margin) in a segregated account with the clearing broker. Subsequent payments (referred to as variation margin) to and from the clearing broker are made on a daily basis based on changes in the market value of futures contracts. Futures contracts are traded publicly and their market value changes daily. Changes in the market value of open futures contracts are recorded as unrealized appreciation or depreciation in the Consolidated Statement of Operations. Realized gains and losses on futures contracts are recorded in the Consolidated
Statement of Operations at the closing or expiration of the contracts. Cash deposited with a broker as initial margin is recorded in the Consolidated Statement of Assets and Liabilities. A receivable and/or payable to brokers for daily variation margin is also recorded in the Consolidated Statement of Assets and Liabilities.
Investments in futures contracts may include certain risks, which may be different from, and potentially greater than, those of the underlying securities. To the extent the Fund uses futures, it is exposed to additional volatility and potential losses resulting from leverage.
The Fund has maintained long S&P 500 futures contracts to provide equity exposure that approximates the Fund’s “net cash and other” position, which includes cash, short-term investments, receivables, and payables. During the six months ended June 30, 2018, these S&P 500 futures contracts had notional values up to 5% of net assets.
Currency forward contracts A currency forward contract represents an obligation to purchase or sell a specific foreign currency at a future date at a price set at the time of the contract. The values of currency forward contracts are adjusted daily based on the prevailing forward exchange rates of the underlying currencies. Changes in the value of open contracts are recorded as unrealized appreciation or depreciation in the Consolidated Statement of Operations. When a currency forward contract is closed, the Fund records a realized gain or loss in the Consolidated Statement of Operations equal to the difference between the value at the time the contract was opened and the value at the time it was closed.
Losses from these transactions may arise from unfavorable changes in currency values or if a counterparty does not perform under a contract’s terms.
The Fund has maintained currency forward contracts to hedge direct and/or indirect foreign currency exposure to the Chinese yuan renminbi, euro, and Swiss franc. During the six months ended June 30, 2018, these currency forward contracts had U.S. dollar total values ranging from 4% to 7% of net assets.
Additional derivative information For financial reporting purposes, the Fund does not offset OTC Derivative assets and liabilities that are subject to a master netting arrangement in the Consolidated Statement of Assets and Liabilities. OTC Derivatives are presented in the Consolidated Statement of Assets and Liabilities as unrealized appreciation/depreciation on currency forward contracts. Cash collateral pledged or received by the Fund for OTC Derivatives is reported gross in the Consolidated Statement of Assets and Liabilities as cash pledged/(received) as collateral for currency forward contracts. Derivative information by counterparty is presented in the Consolidated Portfolio of Investments.
The netting of assets and liabilities and the offsetting of collateral pledged or received are based on contractual netting/set-off provisions in the ISDA master agreement. The following table presents the Fund’s net exposure for OTC Derivatives that are subject to enforceable master netting arrangements as of June 30, 2018. The net amount represents the receivable from (payable to) the counterparty in the event of a default.
DODGE & COX GLOBAL STOCK FUND §PAGE 13
NOTES TO CONSOLIDATED FINANCIAL STATEMENTS (unaudited)
| | | | | | | | | | | | | | | | |
| Counterparty | | Gross OTC Derivative
Assets | | | Gross OTC Derivative
Liabilities | | | Cash Collateral Pledged / (Received)(a) | | | Net Amount | |
Bank of America | | $ | 80,611 | | | $ | (874,987 | ) | | $ | 794,376 | | | $ | — | |
Barclays | | | 75,909 | | | | — | | | | — | | | | 75,909 | |
Citibank | | | 1,531,199 | | | | (208,991 | ) | | | (1,322,208 | ) | | | — | |
Credit Suisse | | | 255,216 | | | | (336,451 | ) | | | 81,235 | | | | — | |
Goldman Sachs | | | 573,974 | | | | (1,811,633 | ) | | | 880,000 | | | | (357,659 | ) |
HSBC | | | 812,104 | | | | (873,101 | ) | | | 60,997 | | | | — | |
JPMorgan | | | 1,366,199 | | | | (2,441,651 | ) | | | 840,000 | | | | (235,452 | ) |
UBS | | | 278,825 | | | | (605,091 | ) | | | 326,266 | | | | — | |
| | | | | | | | | | | | | | | | |
Total | | $ | 4,974,037 | | | $ | (7,151,905 | ) | | $ | 1,660,666 | | | $ | (517,202 | ) |
| | | | | | | | | | | | | | | | |
| | | | | | | | | | | | | | | | | |
| (a) | Cash collateral pledged/(received) in excess of OTC Derivative assets/liabilities, if any, is not presented. Total cash collateral pledged/(received) is presented in the Consolidated Statement of Assets and Liabilities. |
NOTE 4—RELATED PARTY TRANSACTIONS
Management fees Under a written agreement approved by a unanimous vote of the Board of Trustees, the Fund pays a management fee monthly at an annual rate of 0.60% of the Fund’s average daily net assets to Dodge & Cox, investment manager of the Fund.
Fund officers and trustees All officers and two of the trustees of the Trust are officers or employees of Dodge & Cox. The Trust pays a fee only to those trustees who are not affiliated with Dodge & Cox.
NOTE 5—INCOME TAX INFORMATION AND DISTRIBUTIONS TO SHAREHOLDERS
A provision for federal income taxes is not required since the Fund intends to qualify as a regulated investment company under Subchapter M of the Internal Revenue Code and distribute all of its taxable income to shareholders. Distributions are determined in accordance with income tax regulations, and such amounts may differ from net investment income and realized gains for financial reporting purposes. Financial reporting records are adjusted for permanent book to tax differences at year end to reflect tax character. Book to tax differences are primarily due to differing treatments of wash sales, net short-term realized gain (loss), foreign currency realized gain (loss), and derivatives.
Distributions during the periods noted below were characterized as follows for federal income tax purposes:
| | | | | | | | |
| | | Six Months Ended June 30, 2018 | | | Year Ended December 31, 2017 | |
Ordinary income | | | — | | | $ | 133,923,724 | |
| | | | | | ($ | 0.204 per share | ) |
Long-term capital gain | | | — | | | $ | 263,909,123 | |
| | | | | | ($ | 0.402 per share | ) |
The components of distributable earnings on a tax basis are reported as of the Fund’s most recent year end. At December 31, 2017, the tax basis components of distributable earnings were as follows:
| | | | |
Undistributed ordinary income | | $ | 849,242 | |
Undistributed long-term capital gain | | | 106,100,637 | |
Deferred loss(a) | | | (399,262 | ) |
At June 30, 2018, unrealized appreciation and depreciation for investments and derivatives based on cost for federal income tax purposes was as follows:
| | | | |
Tax cost | | $ | 7,858,404,932 | |
| | | | |
Unrealized appreciation | | | 2,087,465,450 | |
Unrealized depreciation | | | (528,760,592 | ) |
| | | | |
Net unrealized appreciation | | | 1,558,704,858 | |
| | | | | |
| (a) | Represents capital loss incurred between November 1, 2017 and December 31, 2017. As permitted by tax regulation, the Fund has elected to treat this loss as arising in 2018. |
Fund management has reviewed the tax positions for open periods (three years and four years, respectively, from filing the Fund’s Federal and State tax returns) as applicable to the Fund, and has determined that no provision for income tax is required in the Fund’s financial statements.
NOTE 6—LOAN FACILITIES
Pursuant to an exemptive order issued by the Securities and Exchange Commission (SEC), the Fund may participate in an interfund lending facility (Facility). The Facility allows the Fund to borrow money from or loan money to the Funds. Loans under the Facility are made for temporary or emergency purposes, such as to fund shareholder redemption requests. Interest on borrowings is the average of the current repurchase agreement rate and the bank loan rate. There was no activity in the Facility during the period.
All Funds in the Trust participate in a $500 million committed credit facility (Line of Credit) with State Street Bank and Trust Company, to be utilized for temporary or emergency purposes to fund shareholder redemptions or for other short-term liquidity purposes. The maximum amount available to the Fund is $250 million. Each Fund pays an annual commitment fee on its pro-rata portion of the Line of Credit. For the six months ended June 30, 2018, the Fund’s commitment fee amounted to $27,512 and is reflected as a Miscellaneous Expense in the Consolidated Statement of Operations. Interest on borrowings is charged at the prevailing rate. There were no borrowings on the Line of Credit during the period.
NOTE 7—PURCHASES AND SALES OF INVESTMENTS
For the six months ended June 30, 2018, purchases and sales of securities, other than short-term securities, aggregated $1,406,175,898 and $1,212,984,880, respectively.
NOTE 8—SUBSEQUENT EVENTS
Fund management has determined that no material events or transactions occurred subsequent to June 30, 2018, and through the date of the Fund’s financial statements issuance, which require additional disclosure in the Fund’s financial statements.
PAGE 14 § DODGE & COX GLOBAL STOCK FUND
CONSOLIDATED FINANCIAL HIGHLIGHTS (unaudited)
| | | | | | | | | | | | | | | | | | | | | | | | |
SELECTED DATA AND RATIOS (for a share outstanding throughout each period) | | Six Months Ended June 30, | | | Year Ended December 31, | |
| | | 2018 | | | 2017 | | | 2016 | | | 2015 | | | 2014 | | | 2013 | |
| | | | | | | | |
Net asset value, beginning of period | | | $13.86 | | | | $11.91 | | | | $10.46 | | | | $11.83 | | | | $11.48 | | | | $8.99 | |
Income from investment operations: | | | | | | | | | | | | | | | | | | | | | | | | |
Net investment income | | | 0.22 | | | | 0.13 | | | | 0.14 | | | | 0.16 | | | | 0.16 | | | | 0.16 | |
Net realized and unrealized gain (loss) | | | (0.69 | ) | | | 2.42 | | | | 1.65 | | | | (1.11 | ) | | | 0.64 | | | | 2.81 | |
| | | | | | | | |
Total from investment operations | | | (0.47 | ) | | | 2.55 | | | | 1.79 | | | | (0.95 | ) | | | 0.80 | | | | 2.97 | |
| | | | | | | | |
Distributions to shareholders from: | | | | | | | | | | | | | | | | | | | | | | | | |
Net investment income | | | — | | | | (0.13 | ) | | | (0.14 | ) | | | (0.19 | ) | | | (0.15 | ) | | | (0.16 | ) |
Net realized gain | | | — | | | | (0.47 | ) | | | (0.20 | ) | | | (0.23 | ) | | | (0.30 | ) | | | (0.32 | ) |
| | | | | | | | |
Total distributions | | | — | | | | (0.60 | ) | | | (0.34 | ) | | | (0.42 | ) | | | (0.45 | ) | | | (0.48 | ) |
| | | | | | | | |
Net asset value, end of period | | | $13.39 | | | | $13.86 | | | | $11.91 | | | | $10.46 | | | | $11.83 | | | | $11.48 | |
| | | | | | | | |
Total return | | | (3.39 | )% | | | 21.51 | % | | | 17.09 | % | | | (8.05 | )% | | | 6.95 | % | | | 33.17 | % |
Ratios/supplemental data: | | | | | | | | | | | | | | | | | | | | | | | | |
Net assets, end of period (millions) | | | $9,367 | | | | $9,911 | | | | $7,101 | | | | $5,708 | | | | $5,895 | | | | $3,924 | |
Ratio of expenses to average net assets | | | 0.63 | %(a) | | | 0.63 | % | | | 0.63 | % | | | 0.63 | % | | | 0.65 | % | | | 0.65 | % |
Ratio of net investment income to average net assets | | | 2.07 | %(a) | | | 1.02 | % | | | 1.36 | % | | | 1.39 | % | | | 1.42 | % | | | 1.58 | % |
Portfolio turnover rate | | | 13 | % | | | 18 | % | | | 25 | % | | | 20 | % | | | 17 | % | | | 24 | % |
See accompanying Notes to Consolidated Financial Statements
DODGE & COX GLOBAL STOCK FUND §PAGE 15
FUND HOLDINGS
The Fund provides a complete list of its holdings four times each fiscal year, as of the end of each quarter. The Fund files the lists with the Securities and Exchange Commission (SEC) on Form N-CSR (second and fourth quarters) and Form N-Q (first and third quarters). Shareholders may view the Fund’s Forms N-CSR and N-Q on the SEC’s website at sec.gov. Forms N-CSR and N-Q may also be reviewed and copied at the SEC’s Public Reference Room in Washington, DC. Information regarding the operations of the Public Reference Room may be obtained by calling 800-SEC-0330. A list of the Fund’s quarter-end holdings is also available at dodgeandcox.com on or about 15 days following each quarter end and remains available on the website until the list is updated in the subsequent quarter.
PROXY VOTING
For a free copy of the Fund’s proxy voting policies and procedures, please call 800-621-3979, visit the Fund’s website at dodgeandcox.com, or visit the SEC’s website at sec.gov. Information regarding how the Fund voted proxies relating to portfolio securities during the most recent 12-month period ending June 30 is also available at dodgeandcox.com or at sec.gov.
HOUSEHOLD MAILINGS
The Fund routinely mails shareholder reports and summary prospectuses to shareholders and, on occasion, proxy statements. In order to reduce the volume of mail, when possible, only one copy of these documents will be sent to shareholders who are part of the same family and share the same residential address.
If you have a direct account with the Funds and you do not want the mailing of shareholder reports and summary prospectuses combined with other members in your household, contact the Funds at 800-621-3979. Your request will be implemented within 30 days.
PAGE 16 § DODGE & COX GLOBAL STOCK FUND
[THIS PAGE INTENTIONALLY LEFT BLANK]
DODGE & COX GLOBAL STOCK FUND §PAGE 17
[THIS PAGE INTENTIONALLY LEFT BLANK]
PAGE 18 § DODGE & COX GLOBAL STOCK FUND
TRUSTEES AND EXECUTIVE OFFICERS
Charles F. Pohl, Chairman and Trustee
Chairman, Dodge & Cox
Dana M. Emery, President and Trustee
Chief Executive Officer and President, Dodge & Cox
Caroline M. Hoxby, Independent Trustee
Professor of Economics, Stanford University; Senior Fellow, Hoover Institution
Thomas A. Larsen, Independent Trustee
Former Senior Counsel, Arnold & Porter Kaye Scholer LLP
Ann Mather, Independent Trustee
Former Executive Vice President, Chief Financial Officer, and Company Secretary, Pixar Animation Studios
Robert B. Morris III, Independent Trustee
Former Partner and Managing director - Global Investment Research, Goldman Sachs; former Advisory Director, The Presidio Group
Gary Roughead, Independent Trustee
Robert and Marion Oster Distinguished Military Fellow, Hoover Institution; former U.S. Navy Chief of Naval Operations
Mark E. Smith, Independent Trustee
Former Executive Vice President and Managing Director-Fixed Income, Loomis Sayles & Company, L.P.
John B. Taylor, Independent Trustee
Professor of Economics, Stanford University; Senior Fellow, Hoover Institution; and former Under Secretary for International Affairs, United States Treasury
Diana S. Strandberg, Senior Vice President
Senior Vice President and Director of International Equity, Dodge & Cox
David H. Longhurst, Treasurer
Vice President and Assistant Treasurer, Dodge & Cox
Katherine M. Primas, Chief Compliance Officer
Vice President and Chief Compliance Officer, Dodge & Cox
Roberta R.W. Kameda, Secretary
Vice President, General Counsel, and Secretary, Dodge & Cox
William W. Strickland, Vice President, Assistant Secretary, and Assistant Treasurer
Vice President and Chief Operating Officer, Dodge & Cox
Additional information about the Trust’s Trustees and Officers is available in the Trust’s Statement of Additional Information (SAI). You can get a free copy of the SAI by visiting the Funds’ website at dodgeandcox.com or calling 800-621-3979.
DODGE & COX GLOBAL STOCK FUND §PAGE 19
dodgeandcox.com
For Fund literature, transactions, and account information, please visit the Funds’ website.
or write or call:
DODGE & COX FUNDS
c/o DST Asset Manager Solutions, Inc.
P.O. Box 8422
Boston, Massachusetts 02266-8422
(800) 621-3979
INVESTMENT MANAGER
Dodge & Cox
555 California Street, 40th Floor
San Francisco, California 94104
(415) 981-1710
This report is submitted for the general information of the shareholders of the Fund. The report is not authorized for distribution to prospective investors in the Fund unless it is accompanied by a current prospectus.
This report reflects our views, opinions, and portfolio holdings as of June 30, 2018, the end of the reporting period. Any such views are subject to change at any time based upon market or other conditions and Dodge & Cox disclaims any responsibility to update such views. These views may not be relied on as investment advice and, because investment decisions for a Dodge & Cox Fund are based on numerous factors, may not be relied on as an indication of trading intent on behalf of any Dodge & Cox Fund.
DODGE & COX FUNDS®
Semi-Annual Report
June 30, 2018
International Stock Fund
ESTABLISHED 2001
TICKER: DODFX
(Closed to New Investors)
6/18 ISF SAR Printed on recycled paper
TO OUR SHAREHOLDERS
The Dodge & Cox International Stock Fund had a total return of –7.1% for the six months ended June 30, 2018, compared to a return of –2.8% for the MSCI EAFE (Europe, Australasia, Far East) Index. As fellow shareholders, we are disappointed by the Fund’s recent performance.
WHY HAS THE FUND UNDERPERFORMED?
The Fund’s recent underperformance started in the fourth quarter of 2017 and is explained by a combination of industry positioning and poor stock selection. The largest detractors from relative performance were the Fund’s holdings in the Financials sector, Europe, and emerging markets. These areas performed poorly because of mounting macroeconomic concerns related to the prospect of a trade war, the rise of populism, higher oil prices, and a strengthening U.S. dollar. All of these factors weighed on the outlook for continued global economic growth.
Financials—a significant overweight position in the Fund (29% versus 20% for the MSCI EAFE sector(a))—was the second-worst performing sector of the market over the past nine months, falling 5% versus the MSCI EAFE’s total return of 1%. Due to their sensitivity to macroeconomic sentiment, emerging markets (24% of the Fund) fell 8% during the second quarter of 2018, ending five consecutive quarters of outperformance. In addition, the Fund’s overweight position in Health Care detracted from performance. The Fund’s European pharmaceutical holdings were negatively impacted by concerns about lower drug pricing in the crucial U.S. market.
Stock selection, particularly in companies that are in the midst of some form of business restructuring, further hindered performance. In the Media industry, weak performers included Liberty Global(b) (European cable), Altice (French telecom), and Grupo Televisa (Spanish language television programming). Magnit (Russian food retailer) and Micro Focus International (UK software) also did poorly. Each of these stocks was affected by company-specific issues that disrupted improvement plans. However, we believe the challenges these companies face are fixable over our three- to five-year investment horizon and that their management teams are tackling the issues with a sense of urgency.
HOW ARE WE RESPONDING?
As we have done in other challenging periods since the Fund’s inception in 2001, we ask ourselves the following questions: Have the fundamentals changed? If so, how has our investment thesis changed? Are we being adequately compensated for the thesis to work over our investment time horizon, such that we should hold or even add to our position? Or should we sell our position because the risk/reward profile is no longer attractive?
We answer these questions by using a “clean sheet of paper” framework to determine whether the long-term fundamentals have changed in relation to valuation. We rigorously employ our bottom-up analysis to assess concerns facing a company and its industry. We evaluate growth prospects and competitive dynamics by meeting with the management of our holdings and their
competitors. And we vigorously debate the relative opportunities and risks as part of our team decision-making process.
In some cases, we conclude the thesis has changed and decide to sell. For example, we sold Saipem, an engineering and construction company focused on oil and gas, during the second quarter. The company is heavily tied to offshore oilfield activity, and we think a rebound in that market has been pushed back and Saipem’s competitive position has weakened.
In other cases, we reaffirmed the merit of an investment and added to our position. For example, we added to Grupo Televisa, the dominant television content producer and pay-television operator in Mexico, earlier in the year. The shares had been weak due to concerns about lower ratings, changes to the company’s advertising pricing model, and slowing cable subscriber growth. We think those are short-term challenges that should not overshadow the substantive changes a new and improved management team is making to improve content programming and capital allocation. Grupo Televisa was subsequently a strong contributor to performance during the second quarter.
WHY ARE WE OPTIMISTIC?
The process of re-evaluating each of the Fund’s holdings has reinforced our positive outlook for the portfolio. We have many different potential drivers of long-term performance in:
| | § | | Financials—valuations have fallen yet fundamentals have improved; | |
| | § | | Health Care—fundamentals are stable, while attractive dividend yields and share buybacks enable us to be patient; | |
| | § | | Emerging markets—valuations are reasonable for companies with strong franchises and above average growth; | |
| | § | | Energy—we are in the early innings of a recovery; and | |
| | § | | The previously mentioned companies involved in restructuring—we see potential for significant earnings and cash flow improvement. | |
We are particularly enthusiastic about the Fund’s holdings in the Financials and Health Care sectors, which collectively represent 46% of the portfolio and the two largest overweight positions in the Fund.
Financials
Financials, which have been one of the weakest areas of the market, exemplify the recent trend of lower valuations despite improving fundamentals. Over the past year, the forward price-to-earnings ratio for the MSCI EAFE Financials sector contracted from 12.0 to 10.7 times, while trailing earnings per share grew by 21%. The decline in valuation suggests the market expects a worsening outlook for earnings and capital generation. However, we reach a different conclusion when we evaluate the Fund’s 17 financial services investments. Management teams are actively cutting costs, exiting low-return businesses, strengthening balance sheets, and improving returns on equity. UniCredit, the largest bank in Italy, and Itau Unibanco, the second largest bank in Brazil, are good examples of this divergence between fundamentals and valuation.
PAGE 2 § DODGE & COX INTERNATIONAL STOCK FUND
UniCredit shares declined 19% in the second quarter. Recent fears that a new anti-establishment Italian government would leave the Eurozone or repudiate debt have overshadowed the progress UniCredit has made in improving its balance sheet and profitability. From 2014 to 2017, UniCredit’s non-performing loan ratio declined from 16.5% to 10.3%, and its adjusted return on tangible equity increased from 4.6% to 7.6% on a much bigger capital cushion. In spite of these improvements, the company’s valuation declined from 0.7 times price to tangible book value to 0.6 times. Current valuation does not give credit for UniCredit’s deep restructuring of its balance sheet and cost structure, and reflects market skepticism of management reaching its target of 9% return on tangible equity. However, we believe their target is achievable through internal self-help measures, and we added to the Fund’s UniCredit position during the second quarter.
Itau Unibanco declined 32% in U.S.-dollar terms in the second quarter (or 21% in local currency) as a weakening Brazilian currency and higher fuel prices raised concerns about inflation and weaker economic growth in Brazil. While we recognize these risks, we are comforted by the fact that the management team has successfully navigated significant economic volatility in the past and generated an average return on equity of 26% over the last 20 years. Recent data show loan growth is recovering after a severe recession from 2015-16, and the long-term outlook for higher credit penetration remains promising. The company also benefits from a favorable competitive landscape: the top six Brazilian banks have about 80% market share, and three of those six are majority-owned by the government. Itau has weathered credit cycles better than its state-owned competitors, enabling it to earn superior returns. In the first quarter, we reduced our position in Itau based on its relative valuation, but the large pullback in its share price in the second quarter provided an opportunity to purchase more shares at an attractive valuation of 11 times forward earnings in what we regard as one of the best-managed banks in the world.
Health Care
Health Care continues to be an attractive area of the market, where underlying fundamentals have remained stable while valuations have declined. The Fund is overweight Health Care (17% compared to 11% of the MSCI EAFE). Seven of the Fund’s eight Health Care sector holdings are European pharmaceutical companies with global footprints. Despite pricing pressures in the U.S. market, profit margins have been resilient and free cash flow has been robust. Most of the Fund’s current pharmaceutical holdings have returned one-third of their market capitalization in dividends and share buybacks over the past five years, while at the same time investing meaningfully in research and development (R&D).
We believe growth can accelerate due to improved R&D productivity in a variety of groundbreaking areas of innovation, including immuno-oncology and rare diseases. Nevertheless, valuations for the Fund’s European pharmaceutical holdings have declined from an average of 17 times forward earnings in 2015 to 14 times on June 30, 2018, with an average dividend yield of 4%. At this lower valuation, we believe we are being compensated for our patience.
IN CLOSING
In many respects, the recent underperformance echoes what happened in 2015 when macroeconomic concerns also weighed heavily on the market. Back then, international equity markets were volatile due to fears of slowing growth in China, a stronger U.S. dollar, and growing populist sentiment in Europe that culminated in the Brexit decision the following June. After trailing the MSCI EAFE in 2015, the Fund then outperformed the benchmark by 11 percentage points over the next seven quarters.
Although we do not know how the future will unfold, our investment team has successfully navigated a number of difficult periods in the market. The 2015-17 period illustrates the importance of employing a consistent process and staying the course with our convictions in the face of underperformance.
Starting points, as measured by valuation, matter for investment returns. With many of the Fund’s holdings trading at lower valuations than they did six or nine months ago, we are increasingly optimistic about the potential for the current portfolio to generate strong returns over the long term. Our time-tested approach requires persistence, and we thank our fellow shareholders for your continued confidence in Dodge & Cox.
For the Board of Trustees,
| | |
| | |
Charles F. Pohl, Chairman | | Dana M. Emery, President |
August 1, 2018
| (a) | | Unless otherwise specified, all weightings and characteristics are as of June 30, 2018. |
| (b) | | The use of specific examples does not imply that they are more or less attractive investments than the portfolio’s other holdings. |
DODGE & COX INTERNATIONAL STOCK FUND §PAGE 3
YEAR-TO-DATE PERFORMANCE REVIEW
The Fund underperformed the MSCI EAFE by 4.4 percentage points in year to date.
Key Detractors from Relative Results
| | § | | Poor performance from the Fund’s emerging markets holdings (down 11%) hindered performance. Notable declines included Magnit (down 33%), MTN Group (down 26%), and Samsung Electronics (down 11%). | |
| | § | | The Fund’s overweight position in the Financials sector (average 30% versus 21% for the MSCI EAFE sector), one of the weakest areas of the market, significantly detracted from results, particularly ICICI Bank (down 18%), Societe Generale (down 15%), Itau Unibanco (down 15%), and BNP Paribas (down 14%). | |
| | § | | The Fund’s underweight position in Japan (average 9% versus 24% for the MSCI EAFE region), along with the underperformance of specific holdings, hurt relative results. Mitsubishi Electric was down 19%. | |
| | § | | The Fund’s overweight position and underperformance (down 9% versus down 2%) in the Consumer Discretionary sector, especially the media holdings, detracted from results. Liberty Global declined 21%. | |
| | § | | Micro Focus International (down 48%) was an additional detractor. | |
Key Contributors to Relative Results
| | § | | Within the Materials sector, the Fund’s selected chemicals holdings helped performance, especially Linde (up 5%). | |
| | § | | Additional contributors included Equinor (up 26%), Ericsson (up 19%), GlaxoSmithKline (up 16%), Philips (up 14%), and Suncor Energy (up 13%). | |
KEY CHARACTERISTICS OF DODGE & COX
Independent Organization
Dodge & Cox is one of the largest privately owned investment managers in the world. We remain committed to independence, with a goal of providing the highest quality investment management service to our existing clients.
Over 85 Years of Investment Experience
Dodge & Cox was founded in 1930. We have a stable and well-qualified team of investment professionals, most of whom have spent their entire careers at Dodge & Cox.
Experienced Investment Team
The International Equity Investment Committee, which is the decision-making body for the International Stock Fund, is a nine-member committee with an average tenure at Dodge & Cox of 23 years.
One Business with a Single Research Office
Dodge & Cox manages equity (domestic, international, and global), fixed income (domestic and global), and balanced investments, operating from one office in San Francisco.
Consistent Investment Approach
Our team decision-making process involves thorough, bottom-up fundamental analysis of each investment.
Long-Term Focus and Low Expenses
We invest with a three- to five-year investment horizon, which has historically resulted in low turnover relative to our peers. We manage Funds that maintain low expense ratios.
Risks: The Fund is subject to market risk, meaning holdings in the Fund may decline in value for extended periods due to the financial prospects of individual companies, or due to general market and economic conditions. Investing in non-U.S. securities may entail risk due to foreign economic and political developments; this risk may be increased when investing in emerging markets. The Fund is also subject to currency risk. Please read the prospectus and summary prospectus for specific details regarding the Fund’s risk profile.
PAGE 4 § DODGE & COX INTERNATIONAL STOCK FUND
GROWTH OF $10,000 OVER 10 YEARS
FOR AN INVESTMENT MADE ON JUNE 30, 2008

AVERAGE ANNUAL TOTAL RETURN
FOR PERIODS ENDED JUNE 30, 2018
| | | | | | | | | | | | | | | | |
| | | 1 Year | | | 3 Years | | | 5 Years | | | 10 Years | |
Dodge & Cox International
Stock Fund | | | 0.50 | % | | | 2.06 | % | |
| 5.79
| %
| | | 3.68 | % |
MSCI EAFE Index | | | 6.84 | | | | 4.90 | | | | 6.44 | | | | 2.84 | |
Returns represent past performance and do not guarantee future results. Investment return and share price will fluctuate with market conditions, and investors may have a gain or loss when shares are sold. Fund performance changes over time and currently may be significantly lower than stated. Performance is updated and published monthly. Visit the Fund’s website at dodgeandcox.com or call 800-621-3979 for current performance figures.
The Fund’s total returns include the reinvestment of dividend and capital gain distributions, but have not been adjusted for any income taxes payable by shareholders on these distributions or on Fund share redemptions. Index returns include dividends but, unlike Fund returns, do not reflect fees or expenses. The MSCI EAFE (Europe, Australasia, Far East) Index is a broad-based, unmanaged equity market index aggregated from 21 developed market country indices, excluding the United States and Canada. MSCI makes no express or implied warranties or representations and shall have no liability whatsoever with respect to any MSCI data contained herein. The MSCI data may not be further redistributed or used as a basis for other indices or any securities or financial products. This report is not approved, reviewed, or produced by MSCI.
MSCI EAFE is a service mark of MSCI Barra.
FUND EXPENSE EXAMPLE
As a Fund shareholder, you incur ongoing Fund costs, including management fees and other Fund expenses. All mutual funds have ongoing costs, sometimes referred to as operating expenses. The following example shows ongoing costs of investing in the Fund and can help you understand these costs and compare them with those of other mutual funds. The example assumes a $1,000 investment held for the six months indicated.
ACTUAL EXPENSES
The first line of the table below provides information about actual account values and expenses based on the Fund’s actual returns. You may use the information in this line, together with your account balance, to estimate the expenses that you paid over the period. Simply divide your account value by $1,000 (for example, an $8,600 account value divided by $1,000 = 8.6), then multiply the result by the number in the first line under the heading “Expenses Paid During Period” to estimate the expenses you paid on your account during this period.
HYPOTHETICAL EXAMPLE FOR COMPARISON WITH OTHER MUTUAL FUNDS
Information on the second line of the table can help you compare ongoing costs of investing in the Fund with those of other mutual funds. This information may not be used to estimate the actual ending account balance or expenses you paid during the period. The hypothetical “Ending Account Value” is based on the actual expense ratio of the Fund and an assumed 5% annual rate of return before expenses (not the Fund’s actual return). The amount under the heading “Expenses Paid During Period” shows the hypothetical expenses your account would have incurred under this scenario. You can compare this figure with the 5% hypothetical examples that appear in shareholder reports of other mutual funds.
| | | | | | | | | | | | |
Six Months Ended
June 30, 2018 | | Beginning Account Value
1/1/2018 | | | Ending Account Value
6/30/2018 | | | Expenses Paid During Period* | |
Based on Actual Fund Return | | $ | 1,000.00 | | | $ | 928.50 | | | $ | 3.01 | |
Based on Hypothetical 5% Yearly Return | | | 1,000.00 | | | | 1,021.67 | | | | 3.15 | |
| * | | Expenses are equal to the Fund’s annualized expense ratio of 0.63%, multiplied by the average account value over the period, multiplied by 181/365 (to reflect the one-half year period). |
The expenses shown in the table highlight ongoing costs only and do not reflect any transactional fees or account maintenance fees. Though other mutual funds may charge such fees, please note that the Fund does not charge transaction fees (e.g., redemption fees, sales loads) or universal account maintenance fees (e.g., small account fees).
DODGE & COX INTERNATIONAL STOCK FUND §PAGE 5
| | | | |
| FUND INFORMATION (unaudited) | | | June 30, 2018 | |
| | | | |
| GENERAL INFORMATION | | | |
Net Asset Value Per Share | | | $43.01 | |
Total Net Assets (billions) | | | $59.3 | |
Expense Ratio | | | 0.63% | |
Portfolio Turnover Rate (1/1/18 to 6/30/18, unannualized) | | | 9% | |
30-Day SEC Yield(a) | | | 1.87% | |
Active Share(b) | | | 88% | |
Number of Companies | | | 68 | |
Fund Inception | | | 2001 | |
No sales charges or distribution fees | | | | |
Investment Manager: Dodge & Cox, San Francisco. Managed by the International Equity Investment Committee, whose nine members’ average tenure at Dodge & Cox is 23 years.
| | | | | | | | |
| PORTFOLIO CHARACTERISTICS | | Fund | | | MSCI
EAFE | |
Median Market Capitalization (billions) | | | $36 | | | | $11 | |
Weighted Average Market Capitalization (billions) | | | $69 | | | | $56 | |
Price-to-Earnings Ratio(c) | | | 11.8x | | | | 13.6x | |
Countries Represented | | | 25 | | | | 21 | |
Emerging Markets (Brazil, China, India, Mexico, Russia, South Africa, South Korea, | | | | | | | | |
Thailand, Turkey, United Arab Emirates) | | | 24.4% | | | | 0.0% | |
| | | | |
| TEN LARGEST HOLDINGS (%)(d) | | Fund | |
Samsung Electronics Co., Ltd. (South Korea) | | | 3.8 | |
Sanofi (France) | | | 3.5 | |
Novartis AG (Switzerland) | | | 3.0 | |
ICICI Bank, Ltd. (India) | | | 2.8 | |
Roche Holding AG (Switzerland) | | | 2.8 | |
Naspers, Ltd. (South Africa) | | | 2.6 | |
BNP Paribas SA (France) | | | 2.4 | |
Liberty Global PLC (United Kingdom) | | | 2.4 | |
GlaxoSmithKline PLC (United Kingdom) | | | 2.4 | |
UBS Group AG (Switzerland) | | | 2.4 | |
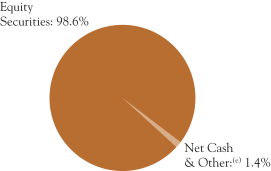
| | | | | | | | |
| REGION DIVERSIFICATION (%)(f) | | Fund | | | MSCI
EAFE | |
Europe (excluding United Kingdom) | | | 43.3 | | | | 45.4 | |
United Kingdom | | | 15.7 | | | | 18.0 | |
Pacific (excluding Japan) | | | 12.2 | | | | 12.1 | |
Japan | | | 8.3 | | | | 24.0 | |
Latin America | | | 7.2 | | | | 0.0 | |
Africa | | | 4.5 | | | | 0.0 | |
United States | | | 4.0 | | | | 0.0 | |
Canada | | | 3.1 | | | | 0.0 | |
Middle East | | | 0.3 | | | | 0.5 | |
| | | | | | | | |
| SECTOR DIVERSIFICATION (%) | | Fund | | | MSCI
EAFE | |
Financials | | | 29.2 | | | | 19.8 | |
Health Care | | | 17.2 | | | | 10.7 | |
Consumer Discretionary | | | 14.1 | | | | 12.4 | |
Information Technology | | | 10.8 | | | | 6.8 | |
Industrials | | | 7.6 | | | | 14.3 | |
Energy | | | 7.6 | | | | 6.1 | |
Materials | | | 6.5 | | | | 8.2 | |
Telecommunication Services | | | 2.8 | | | | 3.6 | |
Utilities | | | 1.6 | | | | 3.3 | |
Consumer Staples | | | 0.7 | | | | 11.3 | |
Real Estate | | | 0.5 | | | | 3.5 | |
| (a) | SEC Yield is an annualization of the Fund’s net investment income for the trailing 30-day period. Dividends paid by the Fund may be higher or lower than implied by the SEC Yield. |
| (b) | Active share is a measure of how much an investment portfolio differs from its benchmark index, based on a scale of 0% (complete overlap with the index) to 100% (no overlap). Overlap for each security in the Fund is the lower of either its percentage weight in the Fund or its percentage weight in the relevant index. The Global Stock Fund’s total overlap with the MSCI World is the sum of each security’s calculated overlap. |
| (c) | Price-to-earnings (P/E) ratios are calculated using 12-month forward earnings estimates from third-party sources. |
| (d) | The Fund’s portfolio holdings are subject to change without notice. The mention of specific securities is not a recommendation to buy, sell, or hold any particular security and is not indicative of Dodge & Cox’s current or future trading activity. |
| (e) | Net Cash & Other includes cash, short-term investments, derivatives, receivables, and payables. |
| (f) | The Fund may classify a company in a different category than the MSCI World. The Fund generally classifies a company based on its country of incorporation, but may designate a different country in certain circumstances. |
PAGE 6 § DODGE & COX INTERNATIONAL STOCK FUND
| | | | |
| CONSOLIDATED PORTFOLIO OF INVESTMENTS (unaudited) | | | June 30, 2018 | |
| | | | | | | | |
| COMMON STOCKS: 92.6% | | | | | | |
| | |
| | | SHARES | | | VALUE | |
| CONSUMER DISCRETIONARY: 13.5% | | | | | |
AUTOMOBILES & COMPONENTS: 3.9% | | | | | |
Bayerische Motoren Werke AG (Germany) | | | 10,324,500 | | | $ | 936,464,092 | |
Honda Motor Co., Ltd. (Japan) | | | 32,452,955 | | | | 951,600,266 | |
Yamaha Motor Co., Ltd. (Japan) | | | 16,675,000 | | | | 418,614,574 | |
| | | | | | | | |
| | | | | | | 2,306,678,932 | |
MEDIA: 8.1% | | | | | | | | |
Altice Europe NV, Series A(a) (Netherlands) | | | 56,721,177 | | | | 230,844,872 | |
Altice USA, Inc., Class A (United States) | | | 23,613,025 | | | | 402,838,207 | |
Grupo Televisa SAB ADR (Mexico) | | | 47,785,517 | | | | 905,535,547 | |
Liberty Global PLC, Series A(a)(b) (United Kingdom) | | | 18,753,503 | | | | 516,471,473 | |
Liberty Global PLC, Series C(a) (United Kingdom) | | | 34,043,454 | | | | 905,896,311 | |
Liberty Latin America Ltd, Series A(a)(b) (Bermuda/United Kingdom) | | | 3,917,037 | | | | 74,893,747 | |
Liberty Latin America Ltd, Series C(a) (Bermuda/United Kingdom) | | | 5,535,198 | | | | 107,272,137 | |
Naspers, Ltd. (South Africa) | | | 6,014,795 | | | | 1,524,358,914 | |
Television Broadcasts, Ltd.(b) (Hong Kong) | | | 40,022,900 | | | | 126,685,854 | |
| | | | | | | | |
| | | | | | | 4,794,797,062 | |
RETAILING: 1.5% | | | | | | | | |
JD.com, Inc. ADR(a) (Cayman Islands/China) | | | 23,015,248 | | | | 896,443,910 | |
| | | | | | | | |
| | | | | | | 7,997,919,904 | |
| CONSUMER STAPLES: 0.7% | | | | | | | | |
FOOD & STAPLES RETAILING: 0.7% | | | | | | | | |
Magnit PJSC(b) (Russia) | | | 5,978,285 | | | | 438,373,159 | |
| | |
| ENERGY: 6.0% | | | | | | | | |
Equinor ASA (Norway) | | | 29,548,850 | | | | 782,052,000 | |
Schlumberger, Ltd. (Curacao/United States) | | | 19,365,724 | | | | 1,298,084,480 | |
Suncor Energy, Inc. (Canada) | | | 30,270,400 | | | | 1,231,399,872 | |
Total SA (France) | | | 1,734,080 | | | | 105,451,726 | |
Weatherford International PLC(a) (Ireland) | | | 34,997,592 | | | | 115,142,077 | |
| | | | | | | | |
| | | | | | | 3,532,130,155 | |
| FINANCIALS: 27.0% | | | | | | | | |
BANKS: 19.9% | | | | | | | | |
Axis Bank, Ltd.(a) (India) | | | 83,083,633 | | | | 615,712,660 | |
Banco Santander SA (Spain) | | | 160,519,395 | | | | 856,923,741 | |
Barclays PLC (United Kingdom) | | | 547,834,798 | | | | 1,366,058,368 | |
BNP Paribas SA (France) | | | 23,560,158 | | | | 1,460,365,324 | |
ICICI Bank, Ltd.(b) (India) | | | 416,511,276 | | | | 1,671,034,558 | |
Kasikornbank PCL- Foreign(b) (Thailand) | | | 114,401,427 | | | | 688,997,701 | |
Lloyds Banking Group PLC (United Kingdom) | | | 1,034,259,000 | | | | 860,425,401 | |
Mitsubishi UFJ Financial Group, Inc. (Japan) | | | 128,370,200 | | | | 728,087,172 | |
Societe Generale SA (France) | | | 27,845,642 | | | | 1,172,519,494 | |
Standard Chartered PLC (United Kingdom) | | | 114,193,813 | | | | 1,043,396,028 | |
UniCredit SPA (Italy) | | | 80,061,162 | | | | 1,331,539,423 | |
| | | | | | | | |
| | | | | | | 11,795,059,870 | |
DIVERSIFIED FINANCIALS: 4.2% | | | | | | | | |
Credit Suisse Group AG (Switzerland) | | | 64,979,908 | | | | 975,188,053 | |
Haci Omer Sabanci Holding AS (Turkey) | | | 47,323,154 | | | | 90,692,151 | |
UBS Group AG (Switzerland) | | | 91,890,027 | | | | 1,413,734,885 | |
| | | | | | | | |
| | | | | | | 2,479,615,089 | |
INSURANCE: 2.9% | | | | | | | | |
AEGON NV(b) (Netherlands) | | | 126,710,800 | | | | 757,196,434 | |
Aviva PLC (United Kingdom) | | | 147,092,527 | | | | 978,131,847 | |
| | | | | | | | |
| | | | | | | 1,735,328,281 | |
| | | | | | | | |
| | | | | | | 16,010,003,240 | |
| | | | | | | | |
| | |
| | | SHARES | | | VALUE | |
| HEALTH CARE: 17.2% | | | | | | | | |
HEALTH CARE EQUIPMENT & SERVICES: 0.9% | |
Koninklijke Philips NV (Netherlands) | | | 13,024,560 | | | $ | 552,063,182 | |
|
PHARMACEUTICALS, BIOTECHNOLOGY & LIFE SCIENCES: 16.3% | |
AstraZeneca PLC (United Kingdom) | | | 17,055,100 | | | | 1,180,813,046 | |
Bayer AG (Germany) | | | 12,511,150 | | | | 1,378,435,114 | |
GlaxoSmithKline PLC (United Kingdom) | | | 70,270,800 | | | | 1,417,769,143 | |
Novartis AG (Switzerland) | | | 12,624,870 | | | | 956,264,997 | |
Novartis AG ADR (Switzerland) | | | 11,028,500 | | | | 833,092,890 | |
Roche Holding AG (Switzerland) | | | 7,461,300 | | | | 1,660,252,627 | |
Sanofi (France) | | | 25,897,722 | | | | 2,073,694,451 | |
Shire PLC (United Kingdom) | | | 3,075,800 | | | | 172,975,781 | |
| | | | | | | | |
| | | | | | | 9,673,298,049 | |
| | | | | | | | |
| | | | | | | 10,225,361,231 | |
| INDUSTRIALS: 7.6% | | | | | | | | |
CAPITAL GOODS: 7.3% | | | | | | | | |
Johnson Controls International PLC (Ireland) | | | 37,144,801 | | | | 1,242,493,594 | |
Mitsubishi Electric Corp. (Japan) | | | 85,520,800 | | | | 1,136,300,146 | |
Nidec Corp. (Japan) | | | 4,172,000 | | | | 625,056,801 | |
Schneider Electric SA (France) | | | 11,723,546 | | | | 975,147,963 | |
Smiths Group PLC (United Kingdom) | | | 14,995,900 | | | | 335,940,011 | |
| | | | | | | | |
| | | | | | | 4,314,938,515 | |
TRANSPORTATION: 0.3% | | | | | | | | |
DP World, Ltd. (United Arab Emirates) | | | 8,256,304 | | | | 190,105,396 | |
| | | | | | | | |
| | | | | | | 4,505,043,911 | |
| INFORMATION TECHNOLOGY: 9.2% | | | | | |
SOFTWARE & SERVICES: 1.8% | | | | | | | | |
Baidu, Inc. ADR(a) (Cayman Islands/China) | | | 2,861,987 | | | | 695,462,841 | |
Micro Focus International PLC (United Kingdom) | | | 7,117,520 | | | | 123,766,643 | |
Micro Focus International PLC ADR (United Kingdom) | | | 13,027,673 | | | | 224,987,912 | |
| | | | | | | | |
| | | | | | | 1,044,217,396 | |
TECHNOLOGY, HARDWARE & EQUIPMENT: 7.4% | |
Brother Industries, Ltd. (Japan) | | | 9,724,000 | | | | 191,749,626 | |
Hewlett Packard Enterprise Co. (United States) | | | 44,558,147 | | | | 650,994,528 | |
Kyocera Corp. (Japan) | | | 15,266,400 | | | | 857,781,852 | |
Samsung Electronics Co., Ltd. (South Korea) | | | 31,271,350 | | | | 1,305,765,135 | |
TE Connectivity, Ltd. (Switzerland) | | | 6,667,162 | | | | 600,444,610 | |
Telefonaktiebolaget LM Ericsson (Sweden) | | | 104,599,800 | | | | 805,070,493 | |
| | | | | | | | |
| | | | | | | 4,411,806,244 | |
| | | | | | | | |
| | | | | | | 5,456,023,640 | |
| MATERIALS: 6.5% | | | | | | | | |
Akzo Nobel NV (Netherlands) | | | 7,860,599 | | | | 669,806,081 | |
Cemex SAB de CV ADR (Mexico) | | | 103,424,726 | | | | 678,466,202 | |
LafargeHolcim, Ltd. (Switzerland) | | | 11,130,483 | | | | 542,715,664 | |
Linde AG (Germany) | | | 5,660,837 | | | | 1,350,862,061 | |
Nutrien, Ltd. (Canada) | | | 11,109,553 | | | | 604,137,492 | |
| | | | | | | | |
| | | | | | | 3,845,987,500 | |
| REAL ESTATE: 0.5% | | | | | | | | |
Hang Lung Group, Ltd.(b) (Hong Kong) | | | 111,345,400 | | | | 311,648,190 | |
|
| TELECOMMUNICATION SERVICES: 2.8% | |
America Movil SAB de CV, Series L (Mexico) | | | 505,100,600 | | | | 421,674,850 | |
Millicom International Cellular SA SDR(b) (Luxembourg) | | | 7,561,236 | | | | 444,758,007 | |
MTN Group, Ltd.(b) (South Africa) | | | 102,215,380 | | | | 803,317,687 | |
| | | | | | | | |
| | | | | | | 1,669,750,544 | |
| | |
| See accompanying Notes to Consolidated Financial Statements | | DODGE & COX INTERNATIONAL STOCK FUND §PAGE 7 |
| | | | |
| CONSOLIDATED PORTFOLIO OF INVESTMENTS (unaudited) | | | June 30, 2018 | |
| | | | | | | | |
| COMMON STOCKS (continued) | | | | | | |
| | |
| | | SHARES | | | VALUE | |
| UTILITIES: 1.6% | | | | | | | | |
Engie (France) | | | 60,603,100 | | | $ | 927,462,656 | |
| | | | | | | | |
| | |
TOTAL COMMON STOCKS
(Cost $53,222,711,046) | | | | | | $ | 54,919,704,130 | |
| | |
| PREFERRED STOCKS: 5.4% | | | | | | |
| ENERGY: 1.6% | | | | | | | | |
Petroleo Brasileiro SA(a) (Brazil) | | | 210,392,800 | | | | 933,148,999 | |
| | |
| FINANCIALS: 2.2% | | | | | | | | |
BANKS: 2.2% | | | | | | | | |
Itau Unibanco Holding SA (Brazil) | | | 125,122,201 | | | | 1,302,310,415 | |
| |
| INFORMATION TECHNOLOGY: 1.6% | | | | | |
TECHNOLOGY, HARDWARE & EQUIPMENT: 1.6% | | | | | |
Samsung Electronics Co., Ltd. (South Korea) | | | 28,125,800 | | | | 948,425,029 | |
| | | | | | | | |
| | |
TOTAL PREFERRED STOCKS
(Cost $2,794,641,000) | | | | | | $ | 3,183,884,443 | |
| | |
| EQUITY-LINKED NOTE: 0.6% | | | | | | |
| CONSUMER DISCRETIONARY: 0.6% | | | | | |
MEDIA: 0.6% | | | | | | | | |
Naspers, Ltd. excluding Tencent Holdings, Ltd. 5/30/19(a)(d) (South Africa) | | | 1,300,000 | | | | 336,999,000 | |
| | | | | | | | |
| | |
TOTAL EQUITY-LINKED NOTE
(Cost $336,982,360) | | | | | | $ | 336,999,000 | |
| | | | | | | | |
| SHORT-TERM INVESTMENTS: 1.8% | | | | |
| | |
| | | PAR VALUE/ SHARES | | | VALUE | |
REPURCHASE AGREEMENT: 1.4% | | | | | | | | |
Fixed Income Clearing Corporation(c)
1.20%, dated 6/29/18, due 7/2/18, maturity value $821,895,181 | | $ | 821,813,000 | | | $ | 821,813,000 | |
| | |
MONEY MARKET FUND: 0.4% | | | | | | | | |
State Street Institutional U.S. Government Money Market Fund | | | 235,558,705 | | | | 235,558,705 | |
| | | | | | | | |
TOTAL SHORT-TERM INVESTMENTS
(Cost $1,057,371,705) | | | | | | $ | 1,057,371,705 | |
| | | | | | | | |
TOTAL INVESTMENTS IN SECURITIES
(Cost $57,411,706,111) | | | 100.4 | % | | $ | 59,497,959,278 | |
OTHER ASSETS LESS LIABILITIES | | | (0.4 | %) | | | (224,293,431 | ) |
| | | | | | | | |
| NET ASSETS | | | 100.0 | % | | $ | 59,273,665,847 | |
| | | | | | | | |
| (b) | See Note 9 regarding holdings of 5% voting securities |
| (c) | Repurchase agreement is collateralized by U.S. Treasury Notes 1.375%-3.125%, 5/15/21-6/15/21. Total collateral value is $ 838,257,931. |
| (d) | Equity-linked note issued by JPMorgan Chase Bank, N.A. The note is designed to provide exposure to Naspers, Ltd. excluding the effect of Naspers, Ltd.’s investment in Tencent Holdings, Ltd. The note is exempt from registration under Rule 144A of the Securities Act of 1933. The note may be resold in transactions exempt from registration, normally to qualified institutional buyers. The note has been deemed liquid by Dodge & Cox, investment manager, pursuant to procedures approved by the Fund’s Board of Trustees. |
In determining a company’s country designation, the Fund generally references the country of incorporation. In cases where the Fund considers the country of incorporation to be a “jurisdiction of convenience” chosen primarily for tax purposes or in other limited circumstances, the Fund uses the country designation of an appropriate broad-based market index. In those cases, two countries are listed—the country of incorporation and the country designated by an appropriate index, respectively.
ADR: American Depositary Receipt
SDR: Swedish Depository Receipt
| | |
| PAGE 8 § DODGE & COX INTERNATIONAL STOCK FUND | | See accompanying Notes to Consolidated Financial Statements |
| | | | |
| CONSOLIDATED PORTFOLIO OF INVESTMENTS (unaudited) | | | June 30, 2018 | |
FUTURES CONTRACTS
| | | | | | | | | | | | | | | | |
| Description | | Number of
Contracts | | | Expiration
Date | | | Notional
Amount | | | Value / Unrealized
Appreciation
(Depreciation) | |
Euro Stoxx 50 Index—Long Position | | | 8,771 | | | | 9/21/18 | | | $ | 347,332,465 | | | $ | (7,820,735 | ) |
Yen Denominated Nikkei 225 Index—Long Position | | | 3,249 | | | | 9/13/18 | | | | 326,103,170 | | | | (3,938,568 | ) |
| | | | | | | | | | | | | | | | |
| | | | | | | | | | | | | | $ | (11,759,303 | ) |
| | | | | | | | | | | | | | | | |
CURRENCY FORWARD CONTRACTS
| | | | | | | | | | | | | | | | |
| | | | Contract Amount | | | | |
| Counterparty | | Settle
Date | | | Receive
U.S. Dollar | | | Deliver Foreign
Currency | | | Unrealized
Appreciation
(Depreciation) | |
Contracts to sell CHF: | |
Citibank | | | 7/25/18 | | | | 116,908,879 | | | | 113,347,250 | | | $ | 2,241,086 | |
Citibank | | | 7/25/18 | | | | 232,072,849 | | | | 225,002,750 | | | | 4,448,723 | |
Goldman Sachs | | | 7/25/18 | | | | 115,342,420 | | | | 111,655,500 | | | | 2,386,087 | |
Goldman Sachs | | | 7/25/18 | | | | 228,963,312 | | | | 221,644,500 | | | | 4,736,561 | |
HSBC | | | 7/25/18 | | | | 116,849,944 | | | | 113,347,250 | | | | 2,182,151 | |
HSBC | | | 7/25/18 | | | | 231,955,859 | | | | 225,002,750 | | | | 4,331,732 | |
Barclays | | | 8/8/18 | | | | 365,011,946 | | | | 357,500,000 | | | | 2,917,992 | |
Goldman Sachs | | | 8/8/18 | | | | 110,961,462 | | | | 108,750,000 | | | | 814,001 | |
Goldman Sachs | | | 8/8/18 | | | | 110,961,462 | | | | 108,750,000 | | | | 814,000 | |
JPMorgan | | | 8/15/18 | | | | 311,886,916 | | | | 310,000,000 | | | | (2,282,505 | ) |
HSBC | | | 8/22/18 | | | | 141,582,897 | | | | 140,000,000 | | | | (384,100 | ) |
Contracts to sell CNH: | |
Bank of America | | | 8/1/18 | | | | 50,833,132 | | | | 349,350,697 | | | | (1,783,808 | ) |
Bank of America | | | 8/1/18 | | | | 73,321,899 | | | | 503,904,752 | | | | (2,572,971 | ) |
JPMorgan | | | 8/1/18 | | | | 50,847,929 | | | | 349,350,697 | | | | (1,769,011 | ) |
JPMorgan | | | 8/1/18 | | | | 50,829,434 | | | | 349,350,699 | | | | (1,787,506 | ) |
JPMorgan | | | 8/1/18 | | | | 73,343,243 | | | | 503,904,752 | | | | (2,551,627 | ) |
JPMorgan | | | 8/1/18 | | | | 73,332,570 | | | | 503,904,752 | | | | (2,562,301 | ) |
JPMorgan | | | 8/1/18 | | | | 73,316,565 | | | | 503,904,753 | | | | (2,578,305 | ) |
JPMorgan | | | 8/1/18 | | | | 50,840,529 | | | | 349,350,698 | | | | (1,776,410 | ) |
Bank of America | | | 8/8/18 | | | | 116,911,358 | | | | 804,525,512 | | | | (4,230,108 | ) |
Credit Suisse | | | 8/8/18 | | | | 116,941,947 | | | | 804,525,513 | | | | (4,199,519 | ) |
Goldman Sachs | | | 8/8/18 | | | | 89,974,833 | | | | 619,116,825 | | | | (3,248,712 | ) |
JPMorgan | | | 8/8/18 | | | | 89,968,295 | | | | 619,116,825 | | | | (3,255,249 | ) |
JPMorgan | | | 8/8/18 | | | | 89,981,371 | | | | 619,116,825 | | | | (3,242,173 | ) |
JPMorgan | | | 8/15/18 | | | | 369,751,221 | | | | 2,527,249,599 | | | | (10,677,897 | ) |
UBS | | | 8/15/18 | | | | 136,768,981 | | | | 936,730,749 | | | | (4,237,928 | ) |
UBS | | | 8/15/18 | | | | 35,528,421 | | | | 243,334,152 | | | | (1,100,885 | ) |
Bank of America | | | 8/29/18 | | | | 90,004,449 | | | | 606,900,000 | | | | (1,299,189 | ) |
Bank of America | | | 8/29/18 | | | | 88,082,902 | | | | 595,000,000 | | | | (1,430,469 | ) |
Citibank | | | 8/29/18 | | | | 88,167,088 | | | | 595,000,000 | | | | (1,346,283 | ) |
UBS | | | 8/29/18 | | | | 77,833,126 | | | | 525,000,000 | | | | (1,149,260 | ) |
UBS | | | 8/29/18 | | | | 89,005,407 | | | | 600,831,000 | | | | (1,385,195 | ) |
UBS | | | 8/29/18 | | | | 85,483,341 | | | | 577,269,000 | | | | (1,362,532 | ) |
Credit Suisse | | | 1/9/19 | | | | 139,332,844 | | | | 921,686,760 | | | | 1,318,412 | |
HSBC | | | 1/9/19 | | | | 23,165,060 | | | | 153,614,460 | | | | 162,654 | |
HSBC | | | 1/9/19 | | | | 69,512,999 | | | | 460,843,380 | | | | 505,784 | |
HSBC | | | 1/9/19 | | | | 69,495,179 | | | | 460,843,380 | | | | 487,963 | |
HSBC | | | 1/9/19 | | | | 23,171,000 | | | | 153,614,460 | | | | 168,595 | |
JPMorgan | | | 1/16/19 | | | | 281,062,458 | | | | 1,833,454,733 | | | | 6,575,125 | |
JPMorgan | | | 1/16/19 | | | | 188,813,770 | | | | 1,231,688,867 | | | | 4,417,075 | |
Citibank | | | 1/30/19 | | | | 27,943,631 | | | | 180,387,314 | | | | 948,832 | |
Citibank | | | 1/30/19 | | | | 170,432,841 | | | | 1,100,655,288 | | | | 5,720,771 | |
Citibank | | | 1/30/19 | | | | 167,956,687 | | | | 1,084,227,597 | | | | 5,703,005 | |
Citibank | | | 1/30/19 | | | | 28,355,599 | | | | 183,120,456 | | | | 951,788 | |
HSBC | | | 1/30/19 | | | | 28,224,578 | | | | 182,209,409 | | | | 957,105 | |
HSBC | | | 1/30/19 | | | | 169,645,335 | | | | 1,095,179,391 | | | | 5,752,728 | |
UBS | | | 1/30/19 | | | | 28,349,014 | | | | 183,120,457 | | | | 945,203 | |
UBS | | | 1/30/19 | | | | 170,393,264 | | | | 1,100,655,288 | | | | 5,681,193 | |
Citibank | | | 2/13/19 | | | | 163,165,092 | | | | 1,050,000,000 | | | | 6,097,907 | |
Credit Suisse | | | 2/13/19 | | | | 163,081,463 | | | | 1,050,000,000 | | | | 6,014,278 | |
| | | | | | | | | | | | | | | | |
| | | | Contract Amount | | | | |
| | | | |
| Counterparty | | Settle
Date | | | Deliver
U.S. Dollar | | | Receive Foreign
Currency | | | Unrealized
Appreciation
(Depreciation) | |
Contracts to buy CHF: | |
Barclays | | | 7/25/18 | | | | 165,808,982 | | | | 165,000,000 | | | $ | 1,113,337 | |
Contracts to buy CNH: | |
Bank of America | | | 8/1/18 | | | | 134,001,641 | | | | 853,255,449 | | | | (5,489,831 | ) |
Citibank | | | 8/8/18 | | | | 42,086,499 | | | | 268,175,171 | | | | (1,706,010 | ) |
Citibank | | | 8/8/18 | | | | 42,100,374 | | | | 268,175,172 | | | | (1,719,885 | ) |
Citibank | | | 8/8/18 | | | | 32,387,363 | | | | 206,372,275 | | | | (1,312,848 | ) |
Citibank | | | 8/8/18 | | | | 32,398,040 | | | | 206,372,276 | | | | (1,323,525 | ) |
Citibank | | | 8/8/18 | | | | 42,475,579 | | | | 269,516,047 | | | | (1,893,188 | ) |
Citibank | | | 8/8/18 | | | | 65,373,554 | | | | 414,808,273 | | | | (2,913,779 | ) |
Goldman Sachs | | | 8/8/18 | | | | 42,075,273 | | | | 268,175,170 | | | | (1,694,785 | ) |
Goldman Sachs | | | 8/8/18 | | | | 32,378,724 | | | | 206,372,274 | | | | (1,304,210 | ) |
Goldman Sachs | | | 8/8/18 | | | | 42,461,526 | | | | 269,516,047 | | | | (1,879,135 | ) |
Goldman Sachs | | | 8/8/18 | | | | 65,351,925 | | | | 414,808,273 | | | | (2,892,150 | ) |
HSBC | | | 8/8/18 | | | | 64,384,638 | | | | 408,617,104 | | | | (2,857,099 | ) |
HSBC | | | 8/8/18 | | | | 41,833,045 | | | | 265,493,419 | | | | (1,856,361 | ) |
Goldman Sachs | | | 1/16/19 | | | | 78,849,469 | | | | 500,000,250 | | | | (3,994,206 | ) |
Goldman Sachs | | | 1/16/19 | | | | 78,802,246 | | | | 500,000,250 | | | | (3,946,983 | ) |
Goldman Sachs | | | 1/16/19 | | | | 78,876,716 | | | | 499,999,500 | | | | (4,021,565 | ) |
| | | | | | | | | | | | | | | | |
Unrealized gain on currency forward contracts | | | | 78,394,088 | |
Unrealized loss on currency forward contracts | | | | (103,019,503 | ) |
| | | | | | | | | | | | | | | | |
Net unrealized loss on currency forward contracts | | | $ | (24,625,415 | ) |
| | | | | | | | | | | | | | | | |
The listed counterparty may be the parent company or one of its subsidiaries.
CHF: Swiss Franc
CNH: Chinese Yuan Renminbi
| | |
| See accompanying Notes to Consolidated Financial Statements | | DODGE & COX INTERNATIONAL STOCK FUND §PAGE 9 |
| | | | |
CONSOLIDATED STATEMENT OF ASSETS AND LIABILITIES (unaudited) | |
| |
| | | June 30, 2018 | |
ASSETS: | | | | |
Investments in securities, at value | | | | |
Unaffiliated issuers (cost $51,725,145,199) | | $ | 55,110,776,603 | |
Affiliated issuers (cost $5,686,560,912) | | | 4,387,182,675 | |
| | | | |
| | | 59,497,959,278 | |
Unrealized appreciation on currency forward contracts | | | 78,394,088 | |
Cash pledged as collateral for currency forward contracts | | | 47,400,000 | |
Cash | | | 100 | |
Cash denominated in foreign currency (cost $11,185,013) | | | 11,166,349 | |
Deposits with broker for futures contracts | | | 39,945,725 | |
Receivable for variation margin for futures contracts | | | 35,584,391 | |
Receivable for investments sold | | | 18,141,006 | |
Receivable for Fund shares sold | | | 57,394,186 | |
Dividends and interest receivable | | | 151,264,882 | |
Prepaid expenses and other assets | | | 103,525 | |
| | | | |
| | | 59,937,353,530 | |
| | | | |
LIABILITIES: | | | | |
Unrealized depreciation on currency forward contracts | | | 103,019,503 | |
Cash received as collateral for currency forward contracts | | | 37,710,000 | |
Payable for investments purchased | | | 111,144,699 | |
Payable for Fund shares redeemed | | | 379,793,676 | |
Management fees payable | | | 30,079,663 | |
Accrued expenses | | | 1,940,142 | |
| | | | |
| | | 663,687,683 | |
| | | | |
NET ASSETS | | $ | 59,273,665,847 | |
| | | | |
NET ASSETS CONSIST OF: | | | | |
Paid in capital | | $ | 57,398,409,067 | |
Undistributed net investment income | | | 719,175,973 | |
Accumulated net realized loss | | | (892,910,093 | ) |
Net unrealized appreciation | | | 2,048,990,900 | |
| | | | |
| | $ | 59,273,665,847 | |
| | | | |
Fund shares outstanding (par value $0.01 each, unlimited shares authorized) | | | 1,378,263,976 | |
Net asset value per share | | $ | 43.01 | |
| |
CONSOLIDATED STATEMENT OF OPERATIONS (unaudited) | | | | |
| |
| | | Six Months Ended
June 30, 2018 | |
INVESTMENT INCOME: | | | | |
Dividends (net of foreign taxes of $126,671,932) | | | | |
Unaffiliated issuers | | $ | 1,118,745,215 | |
Affiliated issuers | | | 89,919,126 | |
Interest | | | 5,177,282 | |
| | | | |
| | | 1,213,841,623 | |
| | | | |
EXPENSES: | | | | |
Management fees | | | 193,615,402 | |
Custody and fund accounting fees | | | 3,863,202 | |
Transfer agent fees | | | 2,453,834 | |
Professional services | | | 140,888 | |
Shareholder reports | | | 974,890 | |
Registration fees | | | 188,537 | |
Trustees’ fees | | | 162,083 | |
ADR depositary service fees | | | 826,629 | |
Miscellaneous | | | 711,248 | |
| | | | |
| | | 202,936,713 | |
| | | | |
NET INVESTMENT INCOME | | | 1,010,904,910 | |
| | | | |
REALIZED AND UNREALIZED GAIN (LOSS): | | | | |
Net realized gain (loss) | | | | |
Investments in securities of unaffiliated issuers | | | 1,602,692,039 | |
Investments in securities of affiliated issuers | | | (813,213,182 | ) |
Futures contracts | | | 8,633,860 | |
Currency forward contracts | | | (237,912,089 | ) |
Foreign currency transactions | | | (5,383,258 | ) |
Net change in unrealized appreciation/depreciation | | | | |
Investments in securities of unaffiliated issuers | | | (5,802,875,728 | ) |
Investments in securities of affiliated issuers (net of decrease in deferred foreign capital gains tax of $32,878,609) | | | (653,088,774 | ) |
Futures contracts | | | (9,813,629 | ) |
Currency forward contracts | | | 278,653,826 | |
Foreign currency translation | | | (3,629,052 | ) |
| | | | |
Net realized and unrealized loss | | | (5,635,935,987 | ) |
| | | | |
NET CHANGE IN NET ASSETS FROM OPERATIONS | | $ | (4,625,031,077 | ) |
| | | | |
| | | | | | | | |
CONSOLIDATED STATEMENT OF CHANGES IN NET ASSETS (unaudited) | |
| | |
| | | Six Months Ended
June 30, 2018 | | | Year Ended
December 31, 2017 | |
OPERATIONS: | | | | | |
Net investment income | | $ | 1,010,904,910 | | | $ | 968,379,628 | |
Net realized gain (loss) | | | 554,817,370 | | | | (371,445,449 | ) |
Net change in unrealized appreciation/depreciation | | | (6,190,753,357 | ) | | | 12,279,943,481 | |
| | | | | | | | |
| | | (4,625,031,077 | ) | | | 12,876,877,660 | |
| | | | | | | | |
| | |
DISTRIBUTIONS TO SHAREHOLDERS FROM: | | | | | | | | |
Net investment income | | | — | | | | (1,246,064,935 | ) |
Net realized gain | | | — | | | | — | |
| | | | | | | | |
Total distributions | | | — | | | | (1,246,064,935 | ) |
| | | | | | | | |
| | |
FUND SHARE TRANSACTIONS: | | | | | | | | |
Proceeds from sale of shares | | | 3,882,021,390 | | | | 8,048,181,192 | |
Reinvestment of distributions | | | — | | | | 1,054,276,376 | |
Cost of shares redeemed | | | (5,653,587,788 | ) | | | (9,249,656,015 | ) |
| | | | | | | | |
Net change from Fund share transactions | | | (1,771,566,398 | ) | | | (147,198,447 | ) |
| | | | | | | | |
Total change in net assets | | | (6,396,597,475 | ) | | | 11,483,614,278 | |
| | |
NET ASSETS: | | | | | | | | |
Beginning of period | | | 65,670,263,322 | | | | 54,186,649,044 | |
| | | | | | | | |
End of period (including undistributed net investment income of $719,175,973 and distributions in excess of net investment income of $(291,728,937), respectively) | | $ | 59,273,665,847 | | | $ | 65,670,263,322 | |
| | | | | | | | |
| | |
SHARE INFORMATION: | | | | | | | | |
Shares sold | | | 83,565,974 | | | | 184,640,901 | |
Distributions reinvested | | | — | | | | 23,034,217 | |
Shares redeemed | | | (123,096,547 | ) | | | (212,133,063 | ) |
| | | | | | | | |
Net change in shares outstanding | | | (39,530,573 | ) | | | (4,457,945 | ) |
| | | | | | | | |
| | |
| PAGE 10 § DODGE & COX INTERNATIONAL STOCK FUND | | See accompanying Notes to Consolidated Financial Statements |
NOTES TO CONSOLIDATED FINANCIAL STATEMENTS (unaudited)
NOTE 1—ORGANIZATION AND SIGNIFICANT ACCOUNTING POLICIES
Dodge & Cox International Stock Fund (the “Fund”) is one of the series constituting the Dodge & Cox Funds (the “Trust” or the “Funds”). The Trust is organized as a Delaware statutory trust and is registered under the Investment Company Act of 1940, as amended, as an open-end management investment company. On January 16, 2015, the Fund closed to new investors. The Fund commenced operations on May 1, 2001, and seeks long-term growth of principal and income. The Fund invests primarily in a diversified portfolio of foreign equity securities. Foreign investing, especially in developing countries, has special risks such as currency and market volatility and political and social instability. These and other risk considerations are discussed in the Fund’s Prospectus.
The financial statements have been prepared in conformity with accounting principles generally accepted in the United States of America, which require the use of estimates and assumptions by management. Actual results may differ from those estimates. Significant accounting policies are as follows:
Security valuation The Fund’s net assets are normally valued as of the scheduled close of trading on the New York Stock Exchange (NYSE), generally 4 p.m. Eastern Time, each day that the NYSE is open for business.
Portfolio holdings for which market quotes are readily available are valued at market value. Listed securities, for example, are generally valued using the official quoted close price or the last sale on the exchange that is determined to be the primary market for the security. Equity-linked notes are valued using prices received from independent pricing services which utilize market quotes from underlying reference instruments. Exchange-traded derivatives are valued at the settlement price determined by the relevant exchange. Short-term securities less than 60 days to maturity may be valued at amortized cost if amortized cost approximates current value. Security values are not discounted based on the size of the Fund’s position and may differ from the value a Fund receives upon sale of the securities. Mutual funds are valued at their respective net asset values.
Investments initially valued in currencies other than the U.S. dollar are converted to the U.S. dollar using prevailing exchange rates. Currency forward contracts are valued based on the prevailing forward exchange rates of the underlying currencies. As a result, the Fund’s net assets may be affected by changes in the value of currencies in relation to the U.S. dollar.
If market quotations are not readily available or if normal valuation procedures produce valuations that are deemed unreliable or inappropriate under the circumstances existing at the time, the investment will be valued at fair value as determined in good faith by or under the direction of the Fund’s Board of Trustees. The Board of Trustees has appointed Dodge & Cox, the Fund’s investment manager, to make fair value determinations in accordance with the Dodge & Cox Funds Valuation Policies (“Valuation Policies”), subject to Board oversight. Dodge & Cox has established a Pricing Committee that is comprised of representatives from Treasury, Legal, Compliance, and Operations. The Pricing Committee is responsible for implementing the Valuation Policies, including determining the fair value of securities and other investments when necessary. The Pricing Committee considers relevant indications of value that are
reasonably available to it in determining the fair value assigned to a particular security, such as the value of similar financial instruments, trading volumes, contractual restrictions on disposition, related corporate actions, and changes in economic conditions. In doing so, the Pricing Committee employs various methods for calibrating fair valuation approaches, including a regular review of key inputs and assumptions, back-testing, and review of any related market activity.
As trading in securities on most foreign exchanges is normally completed before the close of the NYSE, the value of non-U.S. securities can change by the time the Fund calculates its net asset value. To address these changes, the Fund may utilize adjustment factors provided by an independent pricing service to systematically value non-U.S. securities at fair value. These adjustment factors are based on statistical analyses of subsequent movements and changes in U.S. markets and financial instruments trading in U.S. markets that represent foreign securities or baskets of securities.
Valuing securities through a fair value determination involves greater reliance on judgment than valuation of securities based on readily available market quotations. In some instances, lack of information and uncertainty as to the significance of information may lead to a conclusion that a prior valuation is the best indication of a security’s value. When fair value pricing is employed, the prices of securities used by the Fund to calculate its net asset value may differ from quoted or published prices for the same securities.
Security transactions, investment income, expenses, and distributions Security transactions are recorded on the trade date. Realized gains and losses on securities sold are determined on the basis of identified cost.
Dividend income and corporate action transactions are recorded on the ex-dividend date, or when the Fund first learns of the dividend/corporate action if the ex-dividend date has passed. Non-cash dividends, if any, are recorded at the fair market value of the securities received. Dividends characterized as return of capital for U.S. tax purposes are recorded as a reduction of cost of investments and/or realized gain. Interest income is recorded on the accrual basis.
Expenses are recorded on the accrual basis. Some expenses of the Trust can be directly attributed to a specific series. Expenses which cannot be directly attributed are allocated among the Funds in the Trust using methodologies determined by the nature of the expense.
Distributions to shareholders are recorded on the ex-dividend date.
Foreign taxes The Fund is subject to foreign taxes which may be imposed by certain countries in which the Fund invests. The Fund endeavors to record foreign taxes based on applicable foreign tax law. Withholding taxes are incurred on certain foreign dividends and are accrued at the time the associated dividend is recorded. The Fund files withholding tax reclaims in certain jurisdictions to recover a portion of amounts previously withheld. The Fund records a reclaim receivable based on, among other things, a jurisdiction’s legal obligation to pay reclaims as well as payment history and market convention. In consideration of recent decisions rendered by European courts, the Fund has filed for additional reclaims related to prior years. A corresponding receivable is established when both the amount is known and significant contingencies or uncertainties regarding collectability
DODGE & COX INTERNATIONAL STOCK FUND §PAGE 11
NOTES TO CONSOLIDATED FINANCIAL STATEMENTS (unaudited)
are removed. These amounts, if any, are reported in “dividends and interest receivable” in the Consolidated Statement of Assets and Liabilities.
Capital gains taxes are incurred upon disposition of certain foreign securities. Expected capital gains taxes on appreciated securities, if any, are accrued as unrealized losses and incurred capital gains taxes are reflected as realized losses upon the sale of the related security. Currency taxes may be incurred when the Fund purchases certain foreign currencies related to securities transactions and are recorded as realized losses on foreign currency transactions.
Repurchase agreements Repurchase agreements are transactions under which a Fund purchases a security from a dealer counterparty and agrees to resell the security to that counterparty on a specified future date at the same price, plus a specified interest rate. The Fund’s repurchase agreements are secured by U.S. government or agency securities. It is the Fund’s policy that its custodian take possession of the underlying collateral securities, the fair value of which exceeds the principal amount of the repurchase transaction, including accrued interest, at all times. In the event of default by the counterparty, the Fund has the contractual right to liquidate the collateral securities and to apply the proceeds in satisfaction of the obligation.
Equity-linked note An Equity-linked note is a structured security linked to underlying reference instruments. Changes in the market value of equity-linked notes are recorded as unrealized appreciation or depreciation and realized gains or losses are recorded upon the sale or maturity of the notes in the Consolidated Statement of Operations within investments in securities. The risks of investing in equity-linked notes include unfavorable price movements in the underlying securities and the credit risk of the issuing financial institution. Equity-linked notes may be more volatile and less liquid than other investments held by the Fund.
Foreign currency translation The books and records of the Fund are maintained in U.S. dollars. Foreign currency amounts are translated into U.S. dollars at the prevailing exchange rates of such currencies against the U.S. dollar. The market value of investment securities and other assets and liabilities are translated at the exchange rate as of the valuation date. Purchases and sales of investment securities, income, and expenses are translated at the exchange rate prevailing on the transaction date.
Reported realized and unrealized gain (loss) on investments include foreign currency gain (loss) related to investment transactions.
Reported realized and unrealized gain (loss) on foreign currency transactions and translation include the following: disposing/holding of foreign currency, the difference between the trade and settlement dates on securities transactions, the difference between the accrual and payment dates on dividends, and currency losses on the purchase of foreign currency in certain countries that impose taxes on such transactions.
Consolidation The Fund may invest in certain securities through its wholly owned subsidiary, Dodge & Cox International Stock Fund Cayman, Ltd. (the “Subsidiary”). The Subsidiary is a Cayman Islands exempted company and invests in certain securities
consistent with the investment objective of the Fund. The Fund’s Consolidated Financial Statements, including the Consolidated Portfolio of Investments, consist of the holdings and accounts of the Fund and the Subsidiary. All intercompany transactions and balances have been eliminated. At June 30, 2018, the Subsidiary had net assets of $100, which represented less than 0.01% of the Fund’s consolidated net assets.
Indemnification Under the Trust’s organizational documents, its officers and trustees are indemnified against certain liabilities arising out of the performance of their duties to the Trust. In addition, in the normal course of business the Trust enters into contracts that provide general indemnities to other parties. The Trust’s maximum exposure under these arrangements is unknown as this would involve future claims that may be made against the Trust that have not yet occurred.
NOTE 2—VALUATION MEASUREMENTS
Various inputs are used in determining the value of the Fund’s investments. These inputs are summarized in the three broad levels listed below.
| § | | Level 1: Quoted prices in active markets for identical securities |
| § | | Level 2: Other significant observable inputs (including quoted prices for similar securities, market indices, interest rates, credit risk, forward exchange rates, etc.) |
| § | | Level 3: Significant unobservable inputs (including Fund management’s assumptions in determining the fair value of investments) |
The inputs or methodology used for valuing securities are not necessarily an indication of the risk associated with investing in those securities.
The following is a summary of the inputs used to value the Fund’s holdings at June 30, 2018:
| | | | | | | | |
| Classification(a) | | LEVEL 1
(Quoted Prices) | | | LEVEL 2
(Other Significant
Observable Inputs) | |
Securities | | | | | | | | |
Common Stocks | | | | | | | | |
Consumer Discretionary | | $ | 3,809,351,331 | | | $ | 4,188,568,573 | |
Consumer Staples | | | — | | | | 438,373,159 | |
Energy | | | 2,644,626,429 | | | | 887,503,726 | |
Financials | | | — | | | | 16,010,003,240 | |
Health Care | | | 833,092,890 | | | | 9,392,268,341 | |
Industrials | | | 1,242,493,594 | | | | 3,262,550,317 | |
Information Technology | | | 2,171,889,891 | | | | 3,284,133,749 | |
Materials | | | 1,282,603,695 | | | | 2,563,383,805 | |
Real Estate | | | — | | | | 311,648,190 | |
Telecommunication Services | | | 421,674,850 | | | | 1,248,075,694 | |
Utilities | | | — | | | | 927,462,656 | |
Preferred Stocks | | | | | | | | |
Energy | | | 933,148,999 | | | | — | |
Financials | | | 1,302,310,415 | | | | — | |
Information Technology | | | — | | | | 948,425,029 | |
Equity-Linked Note | | | | | | | | |
Consumer Discretionary | | | — | | | | 336,999,000 | |
Short-term Investments | | | | | | | | |
Repurchase Agreement | | | — | | | | 821,813,000 | |
Money Market Fund | | | 235,558,705 | | | | — | |
| | | | | | | | |
Total Securities | | $ | 14,876,750,799 | | | $ | 44,621,208,479 | |
| | | | | | | | |
PAGE 12 § DODGE & COX INTERNATIONAL STOCK FUND
NOTES TO CONSOLIDATED FINANCIAL STATEMENTS (unaudited)
| | | | | | | | |
| Classification(a) | | LEVEL 1
(Quoted
Prices) | | | LEVEL 2
(Other
Significant
Observable
Inputs) | |
Other Investments | | | | | | | | |
Futures Contracts | | | | | | | | |
Depreciation | | $ | (11,759,303 | ) | | $ | — | |
Currency Forward Contracts | | | | | | | | |
Appreciation | | | — | | | | 78,394,088 | |
Depreciation | | | — | | | | (103,019,503 | ) |
| | | | | | | | | |
| (a) | Transfers during the period between Level 1 and Level 2 relate to the use of systematic fair valuation or when significant observable inputs are used to fair value a specific security. On days when systematic fair valuation is used, securities whose primary market closes before the NYSE are classified as Level 2. There were no Level 3 securities at June 30, 2018 and December 31, 2017, and there were no transfers to Level 3 during the period. |
NOTE 3—DERIVATIVE INSTRUMENTS
The Fund entered into various transactions involving derivative instruments, including currency forward contracts and futures contracts, in connection with its investment strategy. The Fund may use derivatives to minimize the impact of losses to one or more of its investments (as a “hedging technique”) or to implement its investment strategy.
The Fund has entered into over-the-counter derivatives, such as currency forward contracts (each, an “OTC Derivative”). Each OTC Derivative is subject to a negotiated master agreement (based on a form published by the International Swaps and Derivatives Association (“ISDA”)) governing all OTC Derivatives between the Fund and the relevant dealer counterparty. The master agreements specify (i) events of default and other events permitting a party to terminate some or all of the OTC Derivatives thereunder and (ii) the process by which those OTC Derivatives will be valued for purposes of determining termination payments. If some or all of the OTC Derivatives under a master agreement are terminated because of an event of default or similar event, the values of all terminated OTC Derivatives must be netted to determine a single payment owed by one party to the other. To the extent amounts owed to the Fund by its counterparties are not collateralized, the Fund is at risk of those counterparties’ non-performance. The Fund attempts to mitigate counterparty credit risk by entering into OTC Derivatives only with counterparties it believes to be of good credit quality, by exchanging collateral, and by monitoring the financial stability of those counterparties.
Futures contracts Futures contracts involve an obligation to purchase or sell (depending on whether the Fund has entered a long or short futures contract, respectively) an asset at a future date, at a price set at the time of the contract. Upon entering into a futures contract, the Fund is required to deposit an amount of cash or liquid assets (referred to as initial margin) in a segregated account with the clearing broker. Subsequent payments (referred to as variation margin) to and from the clearing broker are made on a daily basis based on changes in the market value of futures contracts. Futures contracts are traded publicly and their market value changes daily. Changes in the market value of open futures contracts are recorded as unrealized appreciation or depreciation in the Consolidated Statement of Operations. Realized gains and
losses on futures contracts are recorded in the Consolidated Statement of Operations at the closing or expiration of the contracts. Cash deposited with a broker as initial margin is recorded in the Consolidated Statement of Assets and Liabilities. A receivable and/or payable to brokers for daily variation margin are also recorded in the Consolidated Statement of Assets and Liabilities.
Investments in futures contracts may include certain risks, which may be different from, and potentially greater than, those of the underlying securities. To the extent the Fund uses futures, it is exposed to additional volatility and potential losses resulting from leverage.
The Fund entered into long Euro Stoxx 50 futures contracts and long Yen Denominated Nikkei futures contracts to provide equity exposure that approximates the Fund’s “net cash and other” position, which includes cash, short-term investments, receivables, and payables. During the six months ended June 30, 2018, these futures contracts had notional values up to 3% of net assets.
Currency forward contracts A currency forward contract represents an obligation to purchase or sell a specific foreign currency at a future date at a price set at the time of the contract. The values of currency forward contracts are adjusted daily based on the prevailing forward exchange rates of the underlying currencies. Changes in the value of open contracts are recorded as unrealized appreciation or depreciation in the Consolidated Statement of Operations. When a currency forward contract is closed, the Fund records a realized gain or loss in the Consolidated Statement of Operations equal to the difference between the value at the time the contract was opened and the value at the time it was closed.
Losses from these transactions may arise from unfavorable changes in currency values or if a counterparty does not perform under a contract’s terms.
The Fund has maintained currency forward contracts to hedge direct and/or indirect foreign currency exposure to the Chinese yuan renminbi, euro, and Swiss franc. During the six months ended June 30, 2018, these currency forward contracts had U.S. dollar total values ranging from 8% to 13% of net assets.
Additional derivative information For financial reporting purposes, the Fund does not offset OTC Derivative assets and liabilities that are subject to a master netting arrangement in the Consolidated Statement of Assets and Liabilities. OTC Derivatives are presented in the Consolidated Statement of Assets and Liabilities as unrealized appreciation/depreciation on currency forward contracts. Cash collateral pledged or received by the Fund for OTC Derivatives is reported gross in the Consolidated Statement of Assets and Liabilities as cash pledged/(received) as collateral for currency forward contracts. Derivative information by counterparty is presented in the Consolidated Portfolio of Investments.
The netting of assets and liabilities and the offsetting of collateral pledged or received are based on contractual netting/set-off provisions in the ISDA master agreement. The following table presents the Fund’s net exposure for OTC Derivatives that are subject to enforceable master netting arrangements as of June 30, 2018. The net amount represents the receivable from (payable to) the counterparty in the event of a default.
DODGE & COX INTERNATIONAL STOCK FUND §PAGE 13
NOTES TO CONSOLIDATED FINANCIAL STATEMENTS (unaudited)
| | | | | | | | | | | | | | | | |
| Counterparty | | Gross OTC Derivative Assets | | | Gross OTC
Derivative
Liabilities | | | Cash Collateral Pledged /
(Received)(a) | | | Net Amount | |
Bank of America | | $ | — | | | $ | (16,806,376 | ) | | $ | 12,870,000 | | | $ | (3,936,376 | ) |
Barclays | | | 4,031,329 | | | | — | | | | (4,031,329 | ) | | | — | |
Citibank | | | 26,112,112 | | | | (12,215,518 | ) | | | (13,896,594 | ) | | | — | |
Credit Suisse | | | 7,332,690 | | | | (4,199,519 | ) | | | (2,020,000 | ) | | | 1,113,171 | |
Goldman Sachs | | | 8,750,649 | | | | (22,981,746 | ) | | | 14,231,097 | | | | — | |
HSBC | | | 14,548,712 | | | | (5,097,560 | ) | | | (9,451,152 | ) | | | — | |
JPMorgan | | | 10,992,200 | | | | (32,482,984 | ) | | | 18,070,000 | | | | (3,420,784 | ) |
UBS | | | 6,626,396 | | | | (9,235,800 | ) | | | 1,950,000 | | | | (659,404 | ) |
| | | | | | | | | | | | | | | | |
Total | | $ | 78,394,088 | | | $ | (103,019,503 | ) | | $ | 17,722,022 | | | $ | (6,903,393 | ) |
| | | | | | | | | | | | | | | | |
| | | | | | | | | | | | | | | | | |
| (a) | Cash collateral pledged/(received) in excess of OTC Derivative assets/liabilities, if any, is not presented. Total cash collateral pledged/(received) is presented in the Consolidated Statement of Assets and Liabilities. |
NOTE 4—RELATED PARTY TRANSACTIONS
Management fees Under a written agreement approved by a unanimous vote of the Board of Trustees, the Fund pays a management fee monthly at an annual rate of 0.60% of the Fund’s average daily net assets to Dodge & Cox, investment manager of the Fund.
Fund officers and trustees All officers and two of the trustees of the Trust are officers or employees of Dodge & Cox. The Trust pays a fee only to those trustees who are not affiliated with Dodge & Cox.
NOTE 5—INCOME TAX INFORMATION AND DISTRIBUTIONS TO SHAREHOLDERS
A provision for federal income taxes is not required since the Fund intends to continue to qualify as a regulated investment company under Subchapter M of the Internal Revenue Code and distribute all of its taxable income to shareholders. Distributions are determined in accordance with income tax regulations, and such amounts may differ from net investment income and realized gains for financial reporting purposes. Financial reporting records are adjusted for permanent book to tax differences at year end to reflect tax character. Book to tax differences are primarily due to differing treatments of wash sales, net short-term realized gain (loss), investments in passive foreign investment companies, foreign currency realized gain (loss), and derivatives.
Distributions during the periods noted below were characterized as follows for federal income tax purposes.
| | | | | | | | |
| | | Six Months Ended June 30, 2018 | | | Year Ended
December 31, 2017 | |
Ordinary income | | $ | — | | | $ | 1,246,064,935 | |
| | | | | | ($ | 0.892 per share | ) |
Long-term capital gain | | | — | | | | — | |
| | | | | | | — | |
The components of distributable earnings on a tax basis are reported as of the Fund’s most recent year end. At December 31, 2017, the tax basis components of distributable earnings were as follows:
| | | | |
Capital loss carryforward(a) | | $ | (1,533,865,207 | ) |
Deferred loss(b) | | | (82,697,219 | ) |
At June 30, 2018, unrealized appreciation and depreciation for investments and derivatives based on cost for federal income tax purposes was as follows:
| | | | |
Tax cost | | $ | 57,995,908,581 | |
| | | | |
Unrealized appreciation | | | 8,642,371,867 | |
Unrealized depreciation | | | (7,176,705,888 | ) |
| | | | |
Net unrealized appreciation | | | 1,465,665,979 | |
| | | | | |
| (a) | Represents accumulated long-term capital loss as of December 31, 2017, which may be carried forward to offset future capital gains. |
| (b) | Represents net realized specified loss and capital loss incurred between November 1, 2017 and December 31, 2017. As permitted by tax regulation, the Fund has elected to treat this loss as arising in 2018. |
Fund management has reviewed the tax positions for open periods (three years and four years, respectively, from filing the Fund’s Federal and State tax returns) as applicable to the Fund, and has determined that no provision for income tax is required in the Fund’s financial statements.
NOTE 6—LOAN FACILITIES
Pursuant to an exemptive order issued by the Securities and Exchange Commission (SEC), the Fund may participate in an interfund lending facility (Facility). The Facility allows the Fund to borrow money from or loan money to the Funds. Loans under the Facility are made for temporary or emergency purposes, such as to fund shareholder redemption requests. Interest on borrowings is the average of the current repurchase agreement rate and the bank loan rate. There was no activity in the Facility during the period.
All Funds in the Trust participate in a $500 million committed credit facility (Line of Credit) with State Street Bank and Trust Company, to be utilized for temporary or emergency purposes to fund shareholder redemptions or for other short-term liquidity purposes. The maximum amount available to the Fund is $250 million. Each Fund pays an annual commitment fee on its pro-rata portion of the Line of Credit. For the six months ended June 30, 2018, the Fund’s commitment fee amounted to $183,546 and is reflected as a Miscellaneous Expense in the Consolidated Statement of Operations. Interest on borrowings is charged at the prevailing rate. There were no borrowings on the Line of Credit during the period.
NOTE 7—PURCHASES AND SALES OF INVESTMENTS
For the six months ended June 30, 2018, purchases and sales of securities, other than short-term securities, aggregated $5,612,871,438 and $6,593,351,393 respectively.
NOTE 8—SUBSEQUENT EVENTS
Fund management has determined that no material events or transactions occurred subsequent to June 30, 2018, and through the date of the Fund’s financial statements issuance, which require additional disclosure in the Fund’s financial statements.
PAGE 14 § DODGE & COX INTERNATIONAL STOCK FUND
NOTES TO CONSOLIDATED FINANCIAL STATEMENTS (unaudited)
NOTE 9—HOLDINGS OF 5% VOTING SECURITIES
Each of the companies listed below was considered to be an affiliate of the Fund because the Fund owned 5% or more of the company’s voting securities during all or part of the six months ended June 30, 2018. Transactions during the period in these securities were as follows:
| | | | | | | | | | | | | | | | | | | | | | | | | | | | | | | | |
| | | Shares at
Beginning of Period | | | Additions | | | Reductions | | | Shares at End of Period | | | Dividend
Income(a) | | | Realized
Gain (Loss) | | | Net Change in Unrealized Appreciation/
Depreciation | | | Value at
End of Period | |
| COMMON STOCKS: 7.4% | | | | | | | | | | | | | | | | | | | | | | | | | | | | | |
| CONSUMER DISCRETIONARY: 1.2% | | | | | | | | | | | | | | | | | | | | | | | | | |
Liberty Global PLC, Series A(b) | | | 18,753,503 | | | | — | | | | — | | | | 18,753,503 | | | $ | — | | | $ | — | | | $ | (155,654,075 | ) | | $ | 516,471,473 | |
Liberty Latin America Ltd, Series A(b) | | | 3,917,037 | | | | — | | | | — | | | | 3,917,037 | | | | — | | | | — | | | | (4,034,549 | ) | | | 74,893,747 | |
Television Broadcasts, Ltd. | | | 40,022,900 | | | | — | | | | — | | | | 40,022,900 | | | | 5,101,188 | | | | — | | | | (17,582,776 | ) | | | 126,685,854 | |
| | | | | | | | | | | | | | | | | | | | | | | | | | | | | | | | |
| | | | | | | | | | | | | | | | | | | | | | | | | | | | | | | 718,051,074 | |
| | | | | | | | | | | | | | | | | | | | | | | | | | | | | | | | |
| CONSUMER STAPLES: 0.7% | | | | | | | | | | | | | | | | | | | | | | | | | |
Magnit PJSC | | | 5,432,785 | | | | 545,500 | | | | — | | | | 5,978,285 | | | | — | | | | — | | | | (204,529,819 | ) | | | 438,373,159 | |
| | | | | | | | |
| ENERGY: 0.0% | | | | | | | | | | | | | | | | | | | | | | | | | | | | | | | | |
Saipem SPA(b) | | | 56,980,627 | | | | — | | | | (56,980,627 | ) | | | — | | | | — | | | | (811,495,790 | ) | | | 775,603,389 | | | | — | |
| | | | | | | | |
| FINANCIALS: 2.9% | | | | | | | | | | | | | | | | | | | | | | | | | | | | | | | | |
AEGON NV | | | 134,755,530 | | | | 3,455,270 | | | | (11,500,000 | ) | | | 126,710,800 | | | | 22,227,664 | | | | 13,724,556 | | | | (67,656,800 | ) | | | — | (c) |
ICICI Bank, Ltd. | | | 384,183,576 | | | | 32,327,700 | | | | — | | | | 416,511,276 | | | | — | | | | — | | | | (355,868,639 | ) | | | 1,671,034,558 | |
Kasikornbank PCL- Foreign | | | 132,832,727 | | | | — | | | | (18,431,300 | ) | | | 114,401,427 | | | | 11,884,649 | | | | 19,296,630 | | | | (170,310,220 | ) | | | — | (c) |
| | | | | | | | | | | | | | | | | | | | | | | | | | | | | | | | |
| | | | | | | | | | | | | | | | | | | | | | | | | | | | | | | 1,671,034,558 | |
| | | | | | | | | | | | | | | | | | | | | | | | | | | | | | | | |
| REAL ESTATE: 0.5% | | | | | | | | | | | | | | | | | | | | | | | | | | | | | | | | |
Hang Lung Group, Ltd. | | | 111,345,400 | | | | — | | | | — | | | | 111,345,400 | | | | 8,654,247 | | | | — | | | | (97,971,026 | ) | | | 311,648,190 | |
| | | | | | |
| TELECOMMUNICATION SERVICES: 2.1% | | | | | | | | | | | | | | | | | | | | | | | | | |
Millicom International Cellular SA SDR | | | 8,703,436 | | | | — | | | | (1,142,200 | ) | | | 7,561,236 | | | | 8,475,253 | | | | (34,738,578 | ) | | | (28,553,096 | ) | | | 444,758,007 | |
MTN Group, Ltd. | | | 102,215,380 | | | | — | | | | — | | | | 102,215,380 | | | | 33,576,125 | | | | — | | | | (326,531,163 | ) | | | 803,317,687 | |
| | | | | | | | | | | | | | | | | | | | | | | | | | | | | | | | |
| | | | | | | | | | | | | | | | | | | | | | | | | | | | | | | 1,248,075,694 | |
| | | | | | | | | | | | | | | | | | | | | | | | | | | | | | | | |
| | | | | | | | | | | | | | | | | | $ | 89,919,126 | | | $ | (813,213,182 | ) | | $ | (653,088,774 | ) | | $ | 4,387,182,675 | |
| | | | | | | | | | | | | | | | | | | | | | | | | | | | | | | | |
| | | | | | | | | | | | | | | | | | | | | | | | | | | | | | | | | |
| (a) | Net of foreign taxes, if any |
| (c) | Company was not an affiliate at period end |
DODGE & COX INTERNATIONAL STOCK FUND §PAGE 15
CONSOLIDATED FINANCIAL HIGHLIGHTS (unaudited)
| | | | | | | | | | | | | | | | | | | | | | | | |
SELECTED DATA AND RATIOS (for a share outstanding throughout each period) | | Six Months
Ended June 30, | | | Year Ended December 31, | |
| | | 2018 | | | 2017 | | | 2016 | | | 2015 | | | 2014 | | | 2013 | |
| | | | | | | | |
Net asset value, beginning of period | | | $46.32 | | | | $38.10 | | | | $36.48 | | | | $42.11 | | | | $43.04 | | | | $34.64 | |
Income from investment operations: | | | | | | | | | | | | | | | | | | | | | | | | |
Net investment income | | | 1.02 | | | | 0.70 | | | | 0.82 | | | | 0.79 | | | | 0.98 | | | | 0.70 | |
Net realized and unrealized gain (loss) | | | (4.33 | ) | | | 8.41 | | | | 2.19 | | | | (5.58 | ) | | | (0.94 | ) | | | 8.40 | |
| | | | | | | | |
Total from investment operations | | | (3.31 | ) | | | 9.11 | | | | 3.01 | | | | (4.79 | ) | | | 0.04 | | | | 9.10 | |
| | | | | | | | |
Distributions to shareholders from: | | | | | | | | | | | | | | | | | | | | | | | | |
Net investment income | | | — | | | | (0.89 | ) | | | (0.85 | ) | | | (0.84 | ) | | | (0.97 | ) | | | (0.70 | ) |
Net realized gain | | | — | | | | — | | | | (0.54 | ) | | | — | | | | — | | | | — | |
| | | | | | | | |
Total distributions | | | — | | | | (0.89 | ) | | | (1.39 | ) | | | (0.84 | ) | | | (0.97 | ) | | | (0.70 | ) |
| | | | | | | | |
Net asset value, end of period | | | $43.01 | | | | $46.32 | | | | $38.10 | | | | $36.48 | | | | $42.11 | | | | $43.04 | |
| | | | | | | | |
Total return | | | (7.15 | )% | | | 23.94 | % | | | 8.26 | % | | | (11.35 | )% | | | 0.07 | % | | | 26.31 | % |
Ratios/supplemental data: | | | | | | | | | | | | | | | | | | | | | | | | |
Net assets, end of period (millions) | | | $59,274 | | | | $65,670 | | | | $54,187 | | | | $57,029 | | | | $64,040 | | | | $53,616 | |
Ratio of expenses to average net assets | | | 0.63 | %(a) | | | 0.63 | % | | | 0.64 | % | | | 0.64 | % | | | 0.64 | % | | | 0.64 | % |
Ratio of net investment income to average net assets | | | 3.13 | %(a) | | | 1.57 | % | | | 2.12 | % | | | 1.86 | % | | | 2.39 | % | | | 1.85 | % |
Portfolio turnover rate | | | 9 | % | | | 17 | % | | | 17 | % | | | 18 | % | | | 12 | % | | | 13 | % |
See accompanying Notes to Consolidated Financial Statements
PAGE 16 § DODGE & COX INTERNATIONAL STOCK FUND
FUND HOLDINGS
The Fund provides a complete list of its holdings four times each fiscal year, as of the end of each quarter. The Fund files the lists with the Securities and Exchange Commission (SEC) on Form N-CSR (second and fourth quarters) and Form N-Q (first and third quarters). Shareholders may view the Fund’s Forms N-CSR and N-Q on the SEC’s website at sec.gov. Forms N-CSR and N-Q may also be reviewed and copied at the SEC’s Public Reference Room in Washington, DC. Information regarding the operations of the Public Reference Room may be obtained by calling 800-SEC-0330. A list of the Fund’s quarter-end holdings is also available at dodgeandcox.com on or about 15 days following each quarter end and remains available on the website until the list is updated in the subsequent quarter.
PROXY VOTING
For a free copy of the Fund’s proxy voting policies and procedures, please call 800-621-3979, visit the Fund’s website at dodgeandcox.com, or visit the SEC’s website at sec.gov. Information regarding how the Fund voted proxies relating to portfolio securities during the most recent 12-month period ending June 30 is also available at dodgeandcox.com or at sec.gov.
HOUSEHOLD MAILINGS
The Fund routinely mails shareholder reports and summary prospectuses to shareholders and, on occasion, proxy statements. In order to reduce the volume of mail, when possible, only one copy of these documents will be sent to shareholders who are part of the same family and share the same residential address.
If you have a direct account with the Funds and you do not want the mailing of shareholder reports and summary prospectuses combined with other members in your household, contact the Funds at 800-621-3979. Your request will be implemented within 30 days.
DODGE & COX INTERNATIONAL STOCK FUND §PAGE 17
[THIS PAGE INTENTIONALLY LEFT BLANK]
PAGE 18 § DODGE & COX INTERNATIONAL STOCK FUND
TRUSTEES AND EXECUTIVE OFFICERS
Charles F. Pohl, Chairman and Trustee
Chairman, Dodge & Cox
Dana M. Emery, President and Trustee
Chief Executive Officer and President, Dodge & Cox
Caroline M. Hoxby, Independent Trustee
Professor of Economics, Stanford University; Senior Fellow, Hoover Institution
Thomas A. Larsen, Independent Trustee
Former Senior Counsel, Arnold & Porter Kaye Scholer LLP
Ann Mather, Independent Trustee
Former Executive Vice President, Chief Financial Officer, and Company Secretary, Pixar Animation Studios
Robert B. Morris III, Independent Trustee
Former Partner and Managing director - Global Investment Research, Goldman Sachs; former Advisory Director, The Presidio Group
Gary Roughead, Independent Trustee
Robert and Marion Oster Distinguished Military Fellow, Hoover Institution; former U.S. Navy Chief of Naval Operations
Mark E. Smith, Independent Trustee
Former Executive Vice President and Managing Director-Fixed Income, Loomis Sayles & Company, L.P.
John B. Taylor, Independent Trustee
Professor of Economics, Stanford University; Senior Fellow, Hoover Institution; and former Under Secretary for International Affairs, United States Treasury
Diana S. Strandberg, Senior Vice President
Senior Vice President and Director of International Equity, Dodge & Cox
David H. Longhurst, Treasurer
Vice President and Assistant Treasurer, Dodge & Cox
Katherine M. Primas, Chief Compliance Officer
Vice President and Chief Compliance Officer, Dodge & Cox
Roberta R.W. Kameda, Secretary
Vice President, General Counsel, and Secretary, Dodge & Cox
William W. Strickland, Vice President, Assistant Secretary, and Assistant Treasurer
Vice President and Chief Operating Officer, Dodge & Cox
Additional information about the Trust’s Trustees and Officers is available in the Trust’s Statement of Additional Information (SAI). You can get a free copy of the SAI by visiting the Funds’ website at dodgeandcox.com or calling 800-621-3979.
DODGE & COX INTERNATIONAL STOCK FUND §PAGE 19
dodgeandcox.com
For Fund literature, transactions, and account information, please visit the Funds’ website.
or write or call:
DODGE & COX FUNDS
c/o DST Asset Manager Solutions, Inc.
P.O. Box 8422
Boston, Massachusetts 02266-8422
(800) 621-3979
INVESTMENT MANAGER
Dodge & Cox
555 California Street, 40th Floor
San Francisco, California 94104
(415) 981-1710
This report is submitted for the general information of the shareholders of the Fund. The report is not authorized for distribution to prospective investors in the Fund unless it is accompanied by a current prospectus.
This report reflects our views, opinions, and portfolio holdings as of June 30, 2018, the end of the reporting period. Any such views are subject to change at any time based upon market or other conditions and Dodge & Cox disclaims any responsibility to update such views. These views may not be relied on as investment advice and, because investment decisions for a Dodge & Cox Fund are based on numerous factors, may not be relied on as an indication of trading intent on behalf of any Dodge & Cox Fund.
DODGE & COX FUNDS®
Semi-Annual Report
June 30, 2018
Balanced Fund
ESTABLISHED 1931
TICKER: DODBX
6/18 BF SAR Printed on recycled paper
TO OUR SHAREHOLDERS
The Dodge & Cox Balanced Fund had a total return of 0.0% for the six months ended June 30, 2018, compared to a return of 1.0% for the Combined Index (a 60/40 blend of stocks and fixed income securities).
MARKET COMMENTARY
During the first half of 2018, U.S. growth stocks (the higher valuation portion of the equity market) outperformed value stocks (the lower valuation portion) by nine percentage points,(a) continuing a long-term trend. Since the end of 2014, growth has bested value by 32 percentage points;(b) growth-oriented companies in sectors and industries associated with technology—most notably the “FAANG” stocks (Facebook, Amazon, Apple, Netflix, Google)—have led markets.
In fixed income, the U.S. investment-grade bond market delivered a negative return as higher Treasury yields and wider credit spreads pushed bond prices lower. Interest rates fluctuated throughout the period as investors grappled with the offsetting influences of strong U.S. economic activity, rising inflation, geopolitical uncertainty, and intervals of volatility in financial markets.
INVESTMENT STRATEGY
We set the Fund’s asset allocation based on our long-term outlook for the Fund’s equity and fixed income holdings, which currently favors equities. We did not make any meaningful changes to this allocation during the first half of the year. At quarter end, the Fund’s 71.4% equity weighting (including 4.9% in preferred stocks) reflected our more positive outlook for total return potential from equities than from fixed income.(c)
Equity Strategy
We understand that there are periods when value is trumped by growth. However, we believe the current divergence may narrow. In the United States, the valuation differential between growth and value stocks is wider than usual, with growth stocks trading at historically large premiums. Returns of value-focused strategies have been influenced by valuation spreads, and we believe current conditions are favorable for value stocks to rebound. While investors may not immediately recognize the intrinsic value of companies in relation to sales, cash flows, earnings, or book value, market prices over time tend to be driven by long-term fundamentals.
In the first six months of 2018, we made gradual portfolio adjustments in response to diverging valuations. For example, we sold selected technology and retail holdings that had performed strongly. We continue to find selected opportunities in industries such as Media and Banks.
Media
Within Consumer Discretionary, Media is an important overweight position in the equity portfolio: 11% compared to 2% for the S&P 500 on June 30. The media landscape is evolving due to direct-to-consumer new entrants, changes in consumer viewing and listening habits, shifting revenue streams, and industry consolidation. Uncertainty surrounding pending merger and acquisition (M&A) transactions and potential regulatory incursions (e.g., unbundling, forcing wholesale access, price regulation on broadband) pose risks to the portfolio’s media investments.
Nevertheless, we recently added to Comcast(d) and Charter Communications—the largest and second-largest cable providers in the United States—because we believe the market has overly
penalized their share prices as a result of concerns about subscriber growth and potential bidding wars. Both companies have attractive valuations, difficult-to-replicate assets, and the potential to benefit from growth in data consumption. Comcast and Charter Communications also have de-facto local monopolies on broadband internet services in many parts of the United States and, despite talk of “cord cutting,” have potential to grow through increased broadband penetration and pricing power in residential and business services. Furthermore, their shareholder-friendly management teams are skilled capital allocators who seek to maximize value. In the equity portfolio, Comcast and Charter Communications were 3.6% and 2.9% positions, respectively, and among the ten largest holdings on June 30.
Wells Fargo
During the first half of 2018, we opportunistically added to Wells Fargo (down 7%), which was weak among bank stocks and detracted from performance. In February, Wells Fargo entered into a consent agreement with the Federal Reserve (Fed) that, among other things, placed restrictions on the bank’s asset growth (capped at $1.952 trillion). This regulatory agreement stemmed from Wells Fargo’s previously disclosed improper sales practices.
Since 2016, Wells Fargo has made substantial progress improving its governance, compliance controls, and operational risk management. Notably, the leadership and composition of the company’s board has improved, including the election of six new independent directors in 2017. Management has affirmed its commitment to have third parties conduct an initial risk management review by the end of 2018. The company has settled with regulators regarding its auto insurance and mortgage sales practices and has also resolved class-action lawsuits with shareholders and consumers. Furthermore, Wells Fargo passed the Fed’s annual industry stress test in June and received approval to use $32.9 billion for dividends and share buybacks over the next 12 months, representing a significant return of capital to shareholders.
After a comprehensive review, we believe Wells Fargo’s superior franchise, deep management team, track record of generating higher returns than other banks, and attractive valuation at 1.5 times book value make it a compelling long-term investment opportunity. On June 30, Wells Fargo was the equity portfolio’s largest holding (a 5.9% position).
Fixed Income Strategy
The fixed income portfolio features sizable positions in corporate bonds and Agency(e) mortgage-backed securities (MBS) (38% and 35%, respectively) and smaller positions in government-related securities (5%) and asset-backed securities (ABS) (7%). The portfolio’s 15% position in U.S. Treasuries represents “dry powder” we can deploy as we uncover interesting opportunities. We have maintained the portfolio’s defensive duration position given our longer-term expectations for interest rates to rise more than implied by current market valuations. Modest changes to portfolio positioning over the first half of 2018 reflected decisions made at the individual security and issuer levels by our investment team.
Credit: Continuing to Monitor Risks and Seek Opportunities
The fixed income portfolio’s weighting in credit-related issues declined by just one percentage point during the first half of 2018
PAGE 2 § DODGE & COX BALANCED FUND
to 45%, which understates a number of adjustments made at the individual security and issuer levels. For example, we trimmed certain holdings with somewhat less compelling risk/reward relationships after strong performance (e.g., State of California, Telecom Italia). In addition, other holdings either matured (e.g., State of Illinois), were “make-whole” called(f) (e.g., Navient), or were redeemed by the issuer at a large premium to the market price (e.g., Bank of America capital securities).
The recent widening in credit spreads generally—from 85 bps in early February to 123 bps at the end of June—has created incremental opportunities. These types of market movements have enabled us to add value over longer time periods, as we often use market weakness to add to existing positions or build new ones. For example, we purchased CVS bonds in the first quarter in connection with the company’s levered acquisition of Aetna, and we added to the portfolio’s Charter Communications position at an attractive valuation as investor sentiment regarding cable television providers soured somewhat amid M&A rumors.
We also initiated a position in Bayer AG, which issued approximately $20 billion of debt in June to fund its acquisition of Monsanto. The combination of Bayer and Monsanto creates a leader in crop science and pharmaceuticals, industries that are expected to benefit from global trends such as an aging population in developed markets, as well as population and income growth in emerging markets. In addition to the large scale and diverse nature of Bayer’s business, we were attracted by the company’s significant free cash flow, large equity cushion, and ample liquidity. The company’s management is committed to rapidly delevering the balance sheet and returning the company to an A rating. Our firm’s substantial knowledge of this company, based on the 14 years we’ve held Bayer equity in the Dodge & Cox International Stock Fund, facilitated our ability to comprehensively research its creditworthiness. We believe investors are being adequately compensated for the risks of high initial leverage for the combined companies, upcoming patent expirations, and potential M&A integration challenges.
We remain constructive on the portfolio’s credit holdings which, in our view, offer attractive long-term value relative to Treasuries. In general, fundamentals remain strong: corporate profitability is solid and the operating environment is healthy. There is sustained global growth, and the banking system remains well capitalized and liquid. That said, concerns about higher leverage, particularly in association with M&A activity, and macro uncertainty have weighed on credit spreads. We recognize certain factors could create volatility in credit markets (e.g., escalating trade tensions, geopolitical events, equity market volatility), but such short-term turbulence can provide opportunities as prices fluctuate. Our rigorous, downside-focused underwriting process is designed to mitigate default risk, underpin the conviction necessary to maintain holdings through periods of stress, and facilitate the long-term compounding of incremental yield. The result is a credit portfolio that is significantly differentiated from the broad credit market.
Securitized: A Source of Consistency, Liquidity, and Incremental Yield
The fixed income portfolio’s holdings in the Securitized sector consist predominantly of Agency MBS, with a small position in AAA-rated ABS. As a group, these securities add incremental yield over Treasuries in the intermediate portion of the yield curve and, given their high credit quality and strong liquidity, provide ballast for the overall portfolio. In the first half of the year, we
added modestly to the portfolio’s weighting, slightly changing the composition of underlying Agency MBS holdings and also adding modestly to ABS holdings in response to relative valuations. As with credit investments, we utilize in-house fundamental research on securities in this sector to identify attractive total return opportunities over a broad range of scenarios.
Defensive Duration: Mitigating Interest Rate Risk
We continue to position the portfolio defensively with regard to interest rate risk, with a duration of 4.6 years (equal to 76% of the Bloomberg Barclays U.S. Agg’s duration). Despite the Fed’s recent federal funds rate hikes, we continue to believe that a shorter relative duration is prudent. The significant tightening in measures of unemployment is likely to lead to higher wages. Coupled with stimulative tax and spending measures, the prospects for more rapid economic growth and somewhat higher inflation have risen. Keeping in mind the Fed’s dual mandate of full employment and stable inflation, these factors should keep the Fed nudging short-term rates higher and add upward pressure on longer-term rates.
IN CLOSING
Despite geopolitical uncertainty, we remain optimistic about the long-term outlook for the U.S. economy and the Fund. The equity portfolio trades at a discount to the overall market (13.8 times forward earnings compared to 17.1 times for the S&P 500). We continue to position the fixed income portfolio defensively from a capital preservation standpoint, while seeking opportunities to build portfolio yield through our bottom-up, research-driven investment approach.
We believe the Fund is well positioned based on our view that longer-term global economic growth will be better than many investors expect, interest rates will continue to rise, and the outlook for corporate earnings remains attractive.
Patience, persistence, and a long-term investment horizon are essential to our investment approach. We encourage our shareholders to take a similar view. Thank you for your continued confidence in our firm. As always, we welcome your comments and questions.
For the Board of Trustees,
| | |
| |
|
Charles F. Pohl, Chairman | | Dana M. Emery, President |
August 1, 2018
| (a) | | The Russell 1000 Growth Index had a total return of 7.3% compared to –1.7% for the Russell 1000 Value Index during the first six months of 2018. |
| (b) | | The Russell 1000 Growth Index had a cumulative total return of 58.0% compared to 26.1% for the Russell 1000 Value Index from December 31, 2014 through June 30, 2018. |
| (c) | | Unless otherwise specified, all weightings and characteristics are as of June 30, 2018. |
| (d) | | The use of specific examples does not imply that they are more or less attractive investments than the Fund’s other holdings. |
| (e) | | The U.S. Government does not guarantee the Fund’s shares, yield, or net asset value. The agency guarantee (by, for example, Ginnie Mae, Fannie Mae, or Freddie Mac) does not eliminate market risk. |
| (f) | | A make-whole call provision is a call provision attached to a bond, whereby the borrower must make a payment to the lender in an amount equal to the net present value of the coupon payments that the lender will forgo if the borrower pays the bonds off early. |
DODGE & COX BALANCED FUND §PAGE 3
YEAR-TO-DATE PERFORMANCE REVIEW
The Fund underperformed the Combined Index by 1.0 percentage points year to date. The underperformance of the equity portfolio was partially offset by having a lower allocation to fixed income.
Equity Portfolio
| | § | | Similar to full-year 2017, the strong performance of several large internet and technology stocks not held by the portfolio (including Amazon, Apple, Facebook, and Netflix) negatively impacted relative results. This was significant in both the Information Technology and Consumer Discretionary sectors. | |
| | § | | Within Information Technology (holdings up 6% compared to up 11% for the S&P 500 sector), Micro Focus International (down 48%) was particularly weak. | |
| | § | | In the Consumer Staples sector, the portfolio’s underweight position (average less than 1% versus 7% for the S&P 500 sector) helped results. The portfolio’s lack of holdings in the Tobacco and Household Products industries, down 20% and 12% in the Index, respectively, was a meaningful positive. | |
Fixed Income Portfolio
| | § | | The portfolio’s shorter relative duration (72% of the Bloomberg Barclays U.S. Agg’s duration) added significantly to relative returns. | |
| | § | | Security selection within credit was positive as several holdings performed well, particularly Bank of America capital securities, which outperformed due to redemption by the issuer at a premium to the market price. Other outperformers included Macy’s, Rio Oil Finance Trust, and Verizon. | |
| | § | | The portfolio’s overweight to corporate bonds and underweight to U.S. Treasuries detracted from relative returns given the poor performance of credit. | |
KEY CHARACTERISTICS OF DODGE & COX
Independent Organization
Dodge & Cox is one of the largest privately owned investment managers in the world. We remain committed to independence, with a goal of providing the highest quality investment management service to our existing clients.
Over 85 Years of Investment Experience
Dodge & Cox was founded in 1930. We have a stable and well-qualified team of investment professionals, most of whom have spent their entire careers at Dodge & Cox.
Experienced Investment Team
The U.S. Equity Investment Committee, which is responsible for determining the asset allocation of the Balanced Fund and managing the equity portion of the Balanced Fund, is a nine-member committee with an average tenure at Dodge & Cox of 24 years. The U.S. Fixed Income Investment Committee, which is responsible for managing the debt portion of the Balanced Fund, is a ten-member committee with an average tenure of 21 years.
One Business with a Single Research Office
Dodge & Cox manages equity (domestic, international, and global), fixed income (domestic and global), and balanced investments, operating from one office in San Francisco.
Consistent Investment Approach
Our team decision-making process involves thorough, bottom-up fundamental analysis of each investment.
Long-Term Focus and Low Expenses
We invest with a three- to five-year investment horizon, which has historically resulted in low turnover relative to our peers. We manage Funds that maintain low expense ratios.
Risks: The Fund is subject to market risk, meaning holdings in the Fund may decline in value for extended periods due to the financial prospects of individual companies or due to general market and economic conditions. The Fund also invests in individual bonds whose yields and market values fluctuate, so that an investment may be worth more or less than its original cost. Debt securities are subject to interest rate risk, credit risk, and prepayment and call risk, all of which could have adverse effects on the value of the Fund. A low interest rate environment creates an elevated risk of future negative returns. Financial intermediaries may restrict their market making activities for certain debt securities, which may reduce the liquidity and increase the volatility of such securities. Please read the prospectus and summary prospectus for specific details regarding the Fund’s risk profile.
PAGE 4 § DODGE & COX BALANCED FUND
GROWTH OF $10,000 OVER 10 YEARS
FOR AN INVESTMENT MADE ON JUNE 30, 2008

AVERAGE ANNUAL TOTAL RETURN
FOR PERIODS ENDED JUNE 30, 2018
| | | | | | | | | | | | | | | | |
| | | 1 Year | | | 5 Years | | | 10 Years | | | 20 Years | |
| | | | | | | | | | | | | | | | |
Dodge & Cox Balanced Fund | | | 6.88 | % | | | 9.62 | % | | | 8.39 | % | | | 8.11 | % |
S&P 500 Index | | | 14.37 | | | | 13.42 | | | | 10.17 | | | | 6.46 | |
Bloomberg Barclays U.S. Aggregate Bond Index (Bloomberg Barclays U.S. Agg) | | | –0.40 | | | | 2.27 | | | | 3.72 | | | | 4.70 | |
Combined Index(a) | | | 8.34 | | | | 8.98 | | | | 7.84 | | | | 6.07 | |
Returns represent past performance and do not guarantee future results. Investment return and share price will fluctuate with market conditions, and investors may have a gain or loss when shares are sold. Fund performance changes over time and currently may be significantly lower than stated. Performance is updated and published monthly. Visit the Fund’s website at dodgeandcox.com or call 800-621-3979 for current performance figures.
The Fund’s total returns include the reinvestment of dividend and capital gain distributions, but have not been adjusted for any income taxes payable by shareholders on these distributions or on Fund share redemptions. Index returns include dividends and/or interest income but, unlike Fund returns, do not reflect fees or expenses.
Standard & Poor’s, Standard & Poor’s 500, and S&P 500® are trademarks of S&P Global Inc. Bloomberg is a registered trademark of Bloomberg Finance L.P. and its affiliates. Barclays® is a trademark of Barclays Bank PLC.
| (a) | The Combined Index reflects an unmanaged portfolio (rebalanced monthly) of 60% of the S&P 500 Index, which is a market capitalization-weighted index of 500 large-capitalization stocks commonly used to represent the U.S. equity market, and 40% of the Bloomberg Barclays U.S. Aggregate Bond Index (Bloomberg Barclays U.S. Agg), which is a widely recognized, unmanaged index of U.S. dollar-denominated, investment-grade, taxable fixed income securities. The Fund may, however, invest up to 75% of its total assets in equity securities. |
FUND EXPENSE EXAMPLE
As a Fund shareholder, you incur ongoing Fund costs, including management fees and other Fund expenses. All mutual funds have ongoing costs, sometimes referred to as operating expenses. The following example shows ongoing costs of investing in the Fund and can help you understand these costs and compare them with those of other mutual funds. The example assumes a $1,000 investment held for the six months indicated.
ACTUAL EXPENSES
The first line of the table below provides information about actual account values and expenses based on the Fund’s actual returns. You may use the information in this line, together with your account balance, to estimate the expenses that you paid over the period. Simply divide your account value by $1,000 (for example, an $8,600 account value divided by $1,000 = 8.6), then multiply the result by the number in the first line under the heading “Expenses Paid During Period” to estimate the expenses you paid on your account during this period.
HYPOTHETICAL EXAMPLE FOR COMPARISON WITH OTHER MUTUAL FUNDS
Information on the second line of the table can help you compare ongoing costs of investing in the Fund with those of other mutual funds. This information may not be used to estimate the actual ending account balance or expenses you paid during the period. The hypothetical “Ending Account Value” is based on the actual expense ratio of the Fund and an assumed 5% annual rate of return before expenses (not the Fund’s actual return). The amount under the heading “Expenses Paid During Period” shows the hypothetical expenses your account would have incurred under this scenario. You can compare this figure with the 5% hypothetical examples that appear in shareholder reports of other mutual funds.
| | | | | | | | | | | | |
Six Months Ended
June 30, 2018 | | Beginning Account Value
1/1/2018 | | | Ending Account Value
6/30/2018 | | | Expenses Paid
During Period* | |
Based on Actual Fund Return | | $ | 1,000.00 | | | $ | 1,000.20 | | | $ | 2.63 | |
Based on Hypothetical 5% Yearly Return | | | 1,000.00 | | | | 1,022.16 | | | | 2.66 | |
| * | | Expenses are equal to the Fund’s annualized expense ratio of 0.53%, multiplied by the average account value over the period, multiplied by 181/365 (to reflect the one-half year period). |
The expenses shown in the table highlight ongoing costs only and do not reflect any transactional fees or account maintenance fees. Though other mutual funds may charge such fees, please note that the Fund does not charge transaction fees (e.g., redemption fees, sales loads) or universal account maintenance fees (e.g., small account fees).
DODGE & COX BALANCED FUND §PAGE 5
| | | | |
| FUND INFORMATION (unaudited) | | | June 30, 2018 | |
| | | | |
| GENERAL INFORMATION | |
Net Asset Value Per Share | | | $104.75 | |
Total Net Assets (billions) | | | $15.4 | |
Expense Ratio | | | 0.53% | |
Portfolio Turnover Rate (1/1/18 to 6/30/18, unannualized) | | | 10% | |
30-Day SEC Yield(a) | | | 2.00% | |
Fund Inception | | | 1931 | |
No sales charges or distribution fees | | | | |
Investment Manager: Dodge & Cox, San Francisco. Managed by the U.S. Equity Investment Committee, whose nine members’ average tenure at Dodge & Cox is 24 years, and by the U.S. Fixed Income Investment Committee, whose ten members’ average tenure is 21 years.
| | | | |
| EQUITY PORTFOLIO (71.4%) | | Fund | |
Number of Common Stocks | | | 65 | |
Number of Preferred Stocks | | | 5 | |
Median Market Capitalization (billions)(b) | | | $45 | |
Price-to-Earnings Ratio(b)(c) | | | 13.8x | |
Foreign Securities not in the S&P 500(d) | | | 7.6% | |
| | | | | | | | | | | | |
FIVE LARGEST
SECTORS (%) | | Common | | | Preferred | | | Fund | |
Financials | | | 18.0 | | | | 4.5 | | | | 22.5 | |
Health Care | | | 15.5 | | | | — | | | | 15.5 | |
Information Technology | | | 11.2 | | | | — | | | | 11.2 | |
Consumer Discretionary | | | 9.7 | | | | 0.4 | | | | 10.1 | |
Energy | | | 6.1 | | | | — | | | | 6.1 | |
| | | | | | | | | | | | |
TEN LARGEST EQUITIES (%)(e) | | Common | | | Preferred | | | Fund | |
Wells Fargo & Co. | | | 2.7 | | | | 1.5 | | | | 4.2 | |
JPMorgan Chase & Co. | | | 1.6 | | | | 1.7 | | | | 3.3 | |
Bank of America Corp. | | | 2.2 | | | | 0.5 | | | | 2.7 | |
Comcast Corp. | | | 2.5 | | | | — | | | | 2.5 | |
Capital One Financial Corp. | | | 2.4 | | | | — | | | | 2.4 | |
Charles Schwab Corp. | | | 2.4 | | | | — | | | | 2.4 | |
Twenty-First Century Fox, Inc. | | | 2.3 | | | | — | | | | 2.3 | |
Microsoft Corp. | | | 2.2 | | | | — | | | | 2.2 | |
Charter Communications, Inc. | | | 2.1 | | | | — | | | | 2.1 | |
Alphabet, Inc. | | | 2.1 | | | | — | | | | 2.1 | |
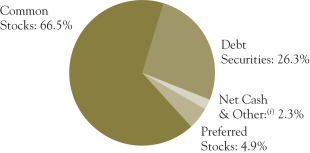
| | | | |
| FIXED INCOME PORTFOLIO (26.3%) | | Fund | |
Number of Credit Issuers | | | 48 | |
Effective Duration (years)(g) | | | 4.6 | |
| | | | |
| SECTOR DIVERSIFICATION (%) | | Fund | |
U.S. Treasury(h) | | | 3.9 | |
Government-Related(i) | | | 1.6 | |
Securitized | | | 10.9 | |
Corporate | | | 9.9 | |
| | | | |
| CREDIT QUALITY (%)(j) | | Fund | |
U.S. Treasury/Agency/GSE(h) | | | 13.1 | |
Aaa | | | 0.5 | |
Aa | | | 1.7 | |
A | | | 1.0 | |
Baa | | | 8.0 | |
Ba | | | 2.0 | |
B | | | 0.0 | |
Caa | | | 0.0 | |
| | | | |
| FIVE LARGEST CREDIT ISSUERS (%)(e) | | Fund | |
Charter Communications, Inc. | | | 0.7 | |
Petroleos Mexicanos | | | 0.5 | |
State of California GO | | | 0.5 | |
Verizon Communications, Inc. | | | 0.4 | |
Cox Enterprises, Inc. | | | 0.4 | |
| (a) | SEC Yield is an annualization of the Fund’s net investment income for the trailing 30-day period. Dividends paid by the Fund may be higher or lower than implied by the SEC Yield. |
| (b) | Excludes the Fund’s preferred stock positions. |
| (c) | Price-to-earnings (P/E) ratio is calculated using 12-month forward earnings estimates from third-party sources. |
| (d) | Foreign stocks are U.S. dollar denominated. |
| (e) | The Fund’s portfolio holdings are subject to change without notice. The mention of specific securities is not a recommendation to buy, sell, or hold any particular security and is not indicative of Dodge & Cox’s current or future trading activity. |
| (f) | Net Cash & Other includes cash, short-term investments, derivatives, receivables, and payables. |
| (g) | Interest rate derivatives reduce the duration of the fixed income portfolio by 0.2 years (i.e., total portfolio duration is 4.8 years without derivatives). |
| (h) | Data as presented excludes the Fund’s position in Treasury futures contracts. |
| (i) | The portfolio’s Government-Related holdings include tax-exempt municipal securities; the Index classifies these securities as Municipal Bonds. |
| (j) | The credit quality distribution shown for the Fund is based on the middle of Moody’s, S&P, and Fitch ratings, which is the methodology used by Bloomberg in constructing its indices. If a security is rated by only two agencies, the lower of the two ratings is used. Please note the Fund applies the highest of Moody’s, S&P, and Fitch ratings to determine compliance with the quality requirements stated in its prospectus. The credit quality of the investments in the portfolio does not apply to the stability or safety of the Fund or its shares. |
PAGE 6 § DODGE & COX BALANCED FUND
| | | | |
| PORTFOLIO OF INVESTMENTS (unaudited) | | | June 30, 2018 | |
| | | | | | | | |
| COMMON STOCKS: 66.5% | | | | | | |
| | |
| | | SHARES | | | VALUE | |
| CONSUMER DISCRETIONARY: 9.7% | | | | | |
AUTOMOBILES & COMPONENTS: 0.2% | | | | | |
Harley-Davidson, Inc. | | | 838,400 | | | $ | 35,279,872 | |
CONSUMER DURABLES & APPAREL: 0.4% | |
Mattel, Inc.(a) | | | 3,618,723 | | | | 59,419,431 | |
MEDIA: 7.4% | | | | | | | | |
Charter Communications, Inc., Class A(a) | | | 1,103,207 | | | | 323,471,324 | |
Comcast Corp., Class A | | | 12,005,348 | | | | 393,895,468 | |
DISH Network Corp., Class A(a) | | | 1,685,032 | | | | 56,633,926 | |
News Corp., Class A | | | 1,057,504 | | | | 16,391,312 | |
Twenty-First Century Fox, Inc., Class A | | | 5,960,200 | | | | 296,162,338 | |
Twenty-First Century Fox, Inc., Class B | | | 1,153,000 | | | | 56,808,310 | |
| | | | | | | | |
| | | | | | | 1,143,362,678 | |
RETAILING: 1.7% | | | | | | | | |
Booking Holdings, Inc.(a) | | | 55,400 | | | | 112,300,786 | |
Qurate Retail, Inc., Series A(a) | | | 3,154,617 | | | | 66,940,973 | |
Target Corp. | | | 986,200 | | | | 75,069,544 | |
| | | | | | | | |
| | | | | | | 254,311,303 | |
| | | | | | | | |
| | | | | | | 1,492,373,284 | |
| CONSUMER STAPLES: 0.2% | | | | | | | | |
FOOD, BEVERAGE & TOBACCO: 0.2% | | | | | | | | |
Molson Coors Brewing Company, Class B | | | 507,614 | | | | 34,538,057 | |
| ENERGY: 6.1% | | | | | | | | |
Anadarko Petroleum Corp. | | | 3,878,892 | | | | 284,128,839 | |
Apache Corp. | | | 3,704,439 | | | | 173,182,523 | |
Baker Hughes, a GE Company | | | 3,828,100 | | | | 126,442,143 | |
Concho Resources, Inc.(a) | | | 324,400 | | | | 44,880,740 | |
National Oilwell Varco, Inc. | | | 2,636,000 | | | | 114,402,400 | |
Occidental Petroleum Corp. | | | 658,814 | | | | 55,129,555 | |
Schlumberger, Ltd. (Curacao/United States) | | | 2,033,221 | | | | 136,286,804 | |
Weatherford International PLC(a) (Ireland) | | | 3,970,000 | | | | 13,061,300 | |
| | | | | | | | |
| | | | | | | 947,514,304 | |
| FINANCIALS: 18.0% | | | | | | | | |
BANKS: 7.0% | | | | | | | | |
Bank of America Corp. | | | 12,007,500 | | | | 338,491,425 | |
BB&T Corp. | | | 1,525,584 | | | | 76,950,457 | |
JPMorgan Chase & Co. | | | 2,429,100 | | | | 253,112,220 | |
Wells Fargo & Co. | | | 7,400,106 | | | | 410,261,877 | |
| | | | | | | | |
| | | | | | | 1,078,815,979 | |
DIVERSIFIED FINANCIALS: 9.2% | | | | | | | | |
American Express Co. | | | 2,433,000 | | | | 238,434,000 | |
Bank of New York Mellon Corp. | | | 4,032,400 | | | | 217,467,332 | |
Capital One Financial Corp. | | | 4,073,559 | | | | 374,360,072 | |
Charles Schwab Corp. | | | 7,147,200 | | | | 365,221,920 | |
Goldman Sachs Group, Inc. | | | 989,600 | | | | 218,276,072 | |
| | | | | | | | |
| | | | | | | 1,413,759,396 | |
INSURANCE: 1.8% | | | | | | | | |
AEGON NV (Netherlands) | | | 11,908,965 | | | | 70,501,073 | |
Brighthouse Financial, Inc.(a) | | | 337,818 | | | | 13,536,367 | |
MetLife, Inc. | | | 4,692,300 | | | | 204,584,280 | |
| | | | | | | | |
| | | | | | | 288,621,720 | |
| | | | | | | | |
| | | | | | | 2,781,197,095 | |
| HEALTH CARE: 15.5% | | | | | | | | |
HEALTH CARE EQUIPMENT & SERVICES: 5.2% | |
Cigna Corp. | | | 959,859 | | | | 163,128,037 | |
Danaher Corp. | | | 376,100 | | | | 37,113,548 | |
Express Scripts Holding Co.(a) | | | 3,867,568 | | | | 298,614,925 | |
Medtronic PLC (Ireland) | | | 1,614,200 | | | | 138,191,662 | |
UnitedHealth Group, Inc. | | | 639,572 | | | | 156,912,595 | |
| | | | | | | | |
| | | | | | | 793,960,767 | |
| | | | | | | | |
| | |
| | | SHARES | | | VALUE | |
PHARMACEUTICALS, BIOTECHNOLOGY & LIFE SCIENCES: 10.3% | |
Alnylam Pharmaceuticals, Inc.(a) | | | 392,300 | | | $ | 38,637,627 | |
AstraZeneca PLC ADR (United Kingdom) | | | 5,070,899 | | | | 178,039,264 | |
Bristol-Myers Squibb Co. | | | 2,984,800 | | | | 165,178,832 | |
Eli Lilly and Co. | | | 2,601,949 | | | | 222,024,308 | |
Gilead Sciences, Inc. | | | 1,647,680 | | | | 116,721,651 | |
GlaxoSmithKline PLC ADR (United Kingdom) | | | 4,545,000 | | | | 183,208,950 | |
Merck & Co., Inc. | | | 200,603 | | | | 12,176,602 | |
Novartis AG ADR (Switzerland) | | | 3,271,200 | | | | 247,106,448 | |
Roche Holding AG ADR (Switzerland) | | | 6,486,000 | | | | 179,208,180 | |
Sanofi ADR (France) | | | 6,205,265 | | | | 248,272,653 | |
| | | | | | | | |
| | | | | | | 1,590,574,515 | |
| | | | | | | | |
| | | | | | | 2,384,535,282 | |
| INDUSTRIALS: 3.3% | | | | | | | | |
CAPITAL GOODS: 1.2% | | | | | | | | |
Johnson Controls International PLC (Ireland) | | | 5,538,214 | | | | 185,253,258 | |
TRANSPORTATION: 2.1% | | | | | | | | |
FedEx Corp. | | | 934,354 | | | | 212,154,419 | |
Union Pacific Corp. | | | 763,200 | | | | 108,130,176 | |
| | | | | | | | |
| | | | | | | 320,284,595 | |
| | | | | | | | |
| | | | | | | 505,537,853 | |
| INFORMATION TECHNOLOGY: 11.2% | |
SEMICONDUCTORS & SEMICONDUCTOR EQUIPMENT: 0.3% | |
Maxim Integrated Products, Inc. | | | 810,191 | | | | 47,525,804 | |
SOFTWARE & SERVICES: 6.0% | | | | | | | | |
Alphabet, Inc., Class A(a) | | | 2,000 | | | | 2,258,380 | |
Alphabet, Inc., Class C(a) | | | 287,195 | | | | 320,409,102 | |
Dell Technologies, Inc., Class V(a) | | | 1,438,163 | | | | 121,639,827 | |
Micro Focus International PLC ADR (United Kingdom) | | | 3,236,727 | | | | 55,898,275 | |
Microsoft Corp. | | | 3,446,400 | | | | 339,849,504 | |
Synopsys, Inc.(a) | | | 401,100 | | | | 34,322,127 | |
VMware, Inc.(a) | | | 278,000 | | | | 40,857,660 | |
| | | | | | | | |
| | | | | | | 915,234,875 | |
TECHNOLOGY, HARDWARE & EQUIPMENT: 4.9% | |
Cisco Systems, Inc. | | | 3,865,200 | | | | 166,319,556 | |
Hewlett Packard Enterprise Co. | | | 13,275,520 | | | | 193,955,347 | |
HP Inc. | | | 7,657,773 | | | | 173,754,870 | |
Juniper Networks, Inc. | | | 3,590,329 | | | | 98,446,821 | |
TE Connectivity, Ltd. (Switzerland) | | | 1,368,036 | | | | 123,205,322 | |
| | | | | | | | |
| | | | | | | 755,681,916 | |
| | | | | | | | |
| | | | | | | 1,718,442,595 | |
| MATERIALS: 0.6% | | | | | | | | |
Celanese Corp., Series A | | | 843,032 | | | | 93,627,134 | |
|
| TELECOMMUNICATION SERVICES: 1.9% | |
AT&T, Inc. | | | 4,316,016 | | | | 138,587,274 | |
Sprint Corp.(a) | | | 15,802,971 | | | | 85,968,162 | |
Zayo Group Holdings, Inc.(a) | | | 2,075,000 | | | | 75,696,000 | |
| | | | | | | | |
| | | | | | | 300,251,436 | |
| | | | | | | | |
TOTAL COMMON STOCKS
(Cost $6,460,266,904) | | | $ | 10,258,017,040 | |
| | |
| PREFERRED STOCKS: 4.9% | | | | | | |
| | |
| | | PAR VALUE | | | VALUE | |
| CONSUMER DISCRETIONARY: 0.4% | |
MEDIA: 0.4% | | | | | | | | |
NBCUniversal Enterprise, Inc. 5.25%(c) | | $ | 53,210,000 | | | $ | 53,742,100 | |
| | |
| See accompanying Notes to Financial Statements | | DODGE & COX BALANCED FUND §PAGE 7 |
| | | | |
| PORTFOLIO OF INVESTMENTS (unaudited) | | | June 30, 2018 | |
| | | | | | | | |
| PREFERRED STOCKS (continued) | |
| | |
| | | PAR VALUE | | | VALUE | |
| FINANCIALS: 4.5% | | | | | | | | |
BANKS: 4.5% | | | | | | | | |
Bank of America Corp. 6.10%(g) | | $ | 16,008,000 | | | $ | 16,638,715 | |
Bank of America Corp. 6.25%(g) | | | 52,470,000 | | | | 54,831,150 | |
Citigroup, Inc. 5.95%(g) | | | 5,175,000 | | | | 5,265,563 | |
Citigroup, Inc. 5.95%(g) | | | 77,327,000 | | | | 78,003,611 | |
Citigroup, Inc. 6.25%(g) | | | 50,886,000 | | | | 52,794,225 | |
JPMorgan Chase & Co. 6.10%(g) | | | 246,575,000 | | | | 254,613,345 | |
Wells Fargo & Co. 5.875%(g) | | | 227,645,000 | | | | 234,758,906 | |
| | | | | | | | |
| | | | | | | 696,905,515 | |
| | | | | | | | |
| | |
TOTAL PREFERRED STOCKS
(Cost $731,149,551) | | | | | | $ | 750,647,615 | |
| | |
| DEBT SECURITIES: 26.3% | | | | | | |
| U.S. TREASURY: 3.9% | | | | | | | | |
U.S. Treasury Note/Bond | | | | | | | | |
2.00%, 1/15/21 | | | 19,600,000 | | | | 19,311,359 | |
2.25%, 2/15/21 | | | 58,695,000 | | | | 58,174,540 | |
1.125%, 2/28/21 | | | 111,515,000 | | | | 107,285,271 | |
1.125%, 7/31/21 | | | 56,610,000 | | | | 54,089,086 | |
1.75%, 11/30/21 | | | 130,000,000 | | | | 126,140,625 | |
1.875%, 1/31/22 | | | 90,500,000 | | | | 88,018,320 | |
1.875%, 2/28/22 | | | 14,110,000 | | | | 13,714,810 | |
1.75%, 5/31/22 | | | 38,064,000 | | | | 36,724,326 | |
2.00%, 11/30/22 | | | 9,200,000 | | | | 8,927,594 | |
2.75%, 4/30/23 | | | 43,045,000 | | | | 43,073,584 | |
2.75%, 5/31/23 | | | 54,000,000 | | | | 54,048,516 | |
| | | | | | | | |
| | | | | | | 609,508,031 | |
| GOVERNMENT-RELATED: 1.6% | |
FEDERAL AGENCY: 0.1% | | | | | | | | |
Small Business Admin. — 504 Program | | | | | | | | |
Series 1998-20I 1, 6.00%, 9/1/18 | | | 28,991 | | | | 29,069 | |
Series 1999-20F 1, 6.80%, 6/1/19 | | | 55,594 | | | | 56,206 | |
Series 2000-20D 1, 7.47%, 4/1/20 | | | 379,886 | | | | 387,417 | |
Series 2000-20E 1, 8.03%, 5/1/20 | | | 71,466 | | | | 73,208 | |
Series 2000-20G 1, 7.39%, 7/1/20 | | | 157,621 | | | | 160,681 | |
Series 2000-20I 1, 7.21%, 9/1/20 | | | 78,357 | | | | 79,757 | |
Series 2001-20E 1, 6.34%, 5/1/21 | | | 308,426 | | | | 315,808 | |
Series 2001-20G 1, 6.625%, 7/1/21 | | | 362,110 | | | | 371,781 | |
Series 2003-20J 1, 4.92%, 10/1/23 | | | 1,309,267 | | | | 1,353,486 | |
Series 2007-20F 1, 5.71%, 6/1/27 | | | 1,653,329 | | | | 1,723,454 | |
| | | | | | | | |
| | | | | | | 4,550,867 | |
FOREIGN AGENCY: 0.6% | | | | | | | | |
Petroleo Brasileiro SA (Brazil) | | | | | | | | |
4.375%, 5/20/23 | | | 7,620,000 | | | | 7,118,985 | |
5.999%, 1/27/28(c) | | | 13,335,000 | | | | 12,068,175 | |
Petroleos Mexicanos (Mexico) | | | | | | | | |
6.875%, 8/4/26 | | | 13,775,000 | | | | 14,477,525 | |
6.50%, 3/13/27 | | | 18,400,000 | | | | 18,823,200 | |
6.625%, 6/15/35 | | | 9,425,000 | | | | 9,212,937 | |
6.375%, 1/23/45 | | | 20,125,000 | | | | 18,535,125 | |
6.35%, 2/12/48(c) | | | 15,466,000 | | | | 13,996,730 | |
| | | | | | | | |
| | | | | | | 94,232,677 | |
LOCAL AUTHORITY: 0.9% | | | | | | | | |
New Jersey Turnpike Authority RB
7.102%, 1/1/41 | | | 12,436,000 | | | | 17,502,924 | |
State of California GO | | | | | | | | |
7.50%, 4/1/34 | | | 13,470,000 | | | | 18,918,480 | |
7.55%, 4/1/39 | | | 14,475,000 | | | | 21,345,414 | |
7.30%, 10/1/39 | | | 18,730,000 | | | | 26,536,664 | |
7.625%, 3/1/40 | | | 4,590,000 | | | | 6,769,516 | |
State of Illinois | | | | | | | | |
GO 5.877%, 3/1/19 | | | 10,225,000 | | | | 10,406,187 | |
5.00%, 11/1/20 | | | 8,000,000 | | | | 8,309,280 | |
5.00%, 11/1/21 | | | 10,500,000 | | | | 11,017,125 | |
| | | | | | | | |
| | |
| | | PAR VALUE | | | VALUE | |
5.10%, 6/1/33 | | $ | 22,615,000 | | | $ | 21,401,931 | |
| | | | | | | | |
| | | | | | | 142,207,521 | |
| | | | | | | | |
| | | | | | | 240,991,065 | |
| SECURITIZED: 10.9% | | | | | | | | |
ASSET-BACKED: 1.8% | | | | | | | | |
Auto Loan: 0.2% | | | | | | | | |
Ford Credit Auto Owner Trust | | | | | | | | |
Series 2015-REV1 A, 2.12%, 7/15/26(c) | | | 16,450,000 | | | | 16,228,849 | |
Series 2017-REV2 A, 2.36%, 3/15/29(c) | | | 6,721,000 | | | | 6,481,303 | |
| | | | | | | | |
| | | | | | | 22,710,152 | |
Credit Card: 0.3% | | | | | | | | |
Bank of America Credit Card Trust
Series 2018-A1 A1, 2.70%, 7/17/23 | | | 44,399,000 | | | | 44,126,186 | |
Other: 0.4% | | | | | | | | |
Rio Oil Finance Trust (Brazil) | | | | | | | | |
9.25%, 7/6/24(c) | | | 23,777,853 | | | | 25,442,302 | |
9.75%, 1/6/27(c) | | | 32,740,283 | | | | 35,089,726 | |
| | | | | | | | |
| | | | | | | 60,532,028 | |
Student Loan: 0.9% | | | | | | | | |
Navient Student Loan Trust | | | | | | | | |
USD LIBOR 1-Month
+1.15%, 3.241%, 7/26/66(c) | | | 6,902,000 | | | | 7,069,868 | |
+0.75%, 2.841%, 3/25/67(c) | | | 86,422,000 | | | | 86,275,783 | |
SLM Student Loan Trust | | | | | | | | |
USD LIBOR 1-Month
+0.75%, 2.841%, 1/25/45(c) | | | 43,864,456 | | | | 44,084,888 | |
SLM Student Loan Trust (Private Loans) | | | | | | | | |
Series 2014-A A2A, 2.59%, 1/15/26(c) | | | 2,638,718 | | | | 2,632,933 | |
Series 2012-B A2, 3.48%, 10/15/30(c) | | | 106,012 | | | | 106,058 | |
Series 2012-E A2A, 2.09%, 6/15/45(c) | | | 4,399,944 | | | | 4,388,775 | |
Series 2012-C A2, 3.31%, 10/15/46(c) | | | 1,183,810 | | | | 1,184,777 | |
| | | | | | | | |
| | | | | | | 145,743,082 | |
| | | | | | | | |
| | | | | | | 273,111,448 | |
CMBS: 0.2% | | | | | | | | |
Agency CMBS: 0.2% | | | | | | | | |
Fannie Mae Multifamily DUS | | | | | | | | |
Pool AL8144, 2.404%, 10/1/22 | | | 7,768,330 | | | | 7,664,873 | |
Pool AL9086, 2.31%, 7/1/23 | | | 1,672,449 | | | | 1,634,668 | |
Freddie Mac Multifamily Interest Only | | | | | | | | |
Series K055 X1, 1.501%, 3/25/26(f) | | | 10,603,108 | | | | 915,927 | |
Series K056 X1, 1.401%, 5/25/26(f) | | | 4,647,562 | | | | 375,279 | |
Series K057 X1, 1.326%, 7/25/26(f) | | | 3,806,736 | | | | 296,199 | |
Series K064 X1, 0.744%, 3/25/27(f) | | | 9,555,949 | | | | 432,371 | |
Series K065 X1, 0.815%, 4/25/27(f) | | | 44,330,103 | | | | 2,235,288 | |
Series K066 X1, 0.891%, 6/25/27(f) | | | 38,029,542 | | | | 2,150,898 | |
Series K069 X1, 0.497%, 9/25/27(f) | | | 238,762,899 | | | | 7,310,371 | |
| | | | | | | | |
| | | | | | | 23,015,874 | |
MORTGAGE-RELATED: 8.9% | | | | | | | | |
Federal Agency CMO & REMIC: 1.6% | |
Dept. of Veterans Affairs | | | | | | | | |
Series 1995-1 1, 6.877%, 2/15/25(f) | | | 211,388 | | | | 223,708 | |
Series 1995-2C 3A, 8.793%, 6/15/25 | | | 101,622 | | | | 114,083 | |
Series 2002-1 2J, 6.50%, 8/15/31 | | | 7,040,514 | | | | 7,857,054 | |
Fannie Mae | | | | | | | | |
Trust 2002-33 A1, 7.00%, 6/25/32 | | | 1,474,075 | | | | 1,682,985 | |
Trust 2009-66 ET, 6.00%, 5/25/39 | | | 1,370,777 | | | | 1,424,636 | |
Trust 2009-30 AG, 6.50%, 5/25/39 | | | 1,652,575 | | | | 1,781,890 | |
Trust 2001-T7 A1, 7.50%, 2/25/41 | | | 1,140,153 | | | | 1,290,488 | |
Trust 2001-T5 A3, 7.50%, 6/19/41(f) | | | 492,172 | | | | 549,535 | |
Trust 2001-T4 A1, 7.50%, 7/25/41 | | | 1,199,398 | | | | 1,365,202 | |
Trust 2001-T8 A1, 7.50%, 7/25/41 | | | 1,233,968 | | | | 1,392,295 | |
Trust 2001-W3 A, 7.00%, 9/25/41(f) | | | 779,685 | | | | 820,652 | |
Trust 2001-T10 A2, 7.50%, 12/25/41 | | | 910,634 | | | | 1,033,560 | |
Trust 2013-106 MA, 4.00%, 2/25/42 | | | 7,772,214 | | | | 7,922,218 | |
Trust 2002-W6 2A1, 7.00%, 6/25/42(f) | | | 1,230,293 | | | | 1,323,831 | |
| | |
| PAGE 8 § DODGE & COX BALANCED FUND | | See accompanying Notes to Financial Statements |
| | | | |
| PORTFOLIO OF INVESTMENTS (unaudited) | | | June 30, 2018 | |
| | | | | | | | |
| DEBT SECURITIES (continued) | |
| | |
| | | PAR VALUE | | | VALUE | |
Trust 2002-W8 A2, 7.00%, 6/25/42 | | $ | 1,559,107 | | | $ | 1,763,944 | |
Trust 2003-W2 1A1, 6.50%, 7/25/42 | | | 2,574,148 | | | | 2,824,167 | |
Trust 2003-W2 1A2, 7.00%, 7/25/42 | | | 1,059,038 | | | | 1,189,657 | |
Trust 2003-W4 4A, 7.50%, 10/25/42(f) | | | 1,228,717 | | | | 1,346,173 | |
Trust 2012-121 NB, 7.00%, 11/25/42 | | | 1,821,863 | | | | 2,029,567 | |
Trust 2004-T1 1A2, 6.50%, 1/25/44 | | | 1,573,249 | | | | 1,750,135 | |
Trust 2004-W2 5A, 7.50%, 3/25/44 | | | 2,416,888 | | | | 2,666,733 | |
Trust 2004-W8 3A, 7.50%, 6/25/44 | | | 406,818 | | | | 460,952 | |
Trust 2005-W4 1A2, 6.50%, 8/25/45 | | | 3,870,463 | | | | 4,287,075 | |
Trust 2009-11 MP, 7.00%, 3/25/49 | | | 3,494,768 | | | | 3,873,236 | |
USD LIBOR 1-month | | | | | | | | |
+0.55%, 2.641%, 9/25/43 | | | 7,607,643 | | | | 7,699,703 | |
Freddie Mac | | | | | | | | |
Series 1078 GZ, 6.50%, 5/15/21 | | | 38,995 | | | | 39,750 | |
Series 16 PK, 7.00%, 8/25/23 | | | 1,239,387 | | | | 1,315,918 | |
Series T-48 1A4, 5.538%, 7/25/33 | | | 24,022,098 | | | | 25,533,156 | |
Series T-51 1A, 6.50%, 9/25/43(f) | | | 163,871 | | | | 183,605 | |
Series T-59 1A1, 6.50%, 10/25/43 | | | 8,531,410 | | | | 9,735,625 | |
Series 4281 BC, 4.50%, 12/15/43(f) | | | 45,919,987 | | | | 48,093,609 | |
USD LIBOR 1-month | | | | | | | | |
+0.61%, 2.683%, 9/15/43 | | | 16,569,761 | | | | 16,791,170 | |
Ginnie Mae | | | | | | | | |
USD LIBOR 1-Month | | | | | | | | |
+0.62%, 2.537%, 9/20/64 | | | 3,887,380 | | | | 3,911,387 | |
USD LIBOR 12-Month | | | | | | | | |
+0.23%, 2.01%, 10/20/67 | | | 22,350,719 | | | | 22,498,945 | |
+0.23%, 2.01%, 10/20/67 | | | 13,815,039 | | | | 13,899,217 | |
+0.06%, 2.35%, 12/20/67 | | | 35,989,960 | | | | 35,901,205 | |
+0.08%, 2.81%, 5/20/68 | | | 10,085,980 | | | | 9,997,334 | |
| | | | | | | | |
| | | | | | | 246,574,400 | |
Federal Agency Mortgage Pass-Through: 7.3% | |
Fannie Mae, 15 Year | | | | | | | | |
6.50%, 7/1/18-11/1/18 | | | 401 | | | | 400 | |
7.00%, 11/1/18 | | | 627 | | | | 627 | |
6.00%, 12/1/18-3/1/22 | | | 139,012 | | | | 142,471 | |
4.50%, 1/1/25-1/1/27 | | | 8,924,329 | | | | 9,214,496 | |
3.50%, 11/1/25-12/1/29 | | | 24,502,316 | | | | 24,829,946 | |
Fannie Mae, 20 Year | | | | | | | | |
4.00%, 11/1/30-2/1/37 | | | 45,056,337 | | | | 46,529,931 | |
4.50%, 1/1/31-12/1/34 | | | 68,400,991 | | | | 71,490,710 | |
3.50%, 6/1/35-4/1/37 | | | 81,687,078 | | | | 82,441,207 | |
Fannie Mae, 30 Year | | | | | | | | |
6.50%, 12/1/28-8/1/39 | | | 15,946,349 | | | | 17,711,623 | |
5.50%, 7/1/33-8/1/37 | | | 10,336,174 | | | | 11,234,480 | |
6.00%, 9/1/36-8/1/37 | | | 14,395,087 | | | | 15,869,977 | |
7.00%, 8/1/37 | | | 418,485 | | | | 481,619 | |
4.50%, 1/1/39-5/1/48 | | | 242,983,371 | | | | 254,369,749 | |
Fannie Mae, 40 Year | | | | | | | | |
4.50%, 6/1/56 | | | 41,498,068 | | | | 43,418,561 | |
Fannie Mae, Hybrid ARM | | | | | | | | |
1-Year U.S. Treasury CMT
+2.04%, 3.186%, 9/1/34 | | | 803,338 | | | | 844,114 | |
USD LIBOR 12-Month | | | | | | | | |
+1.36%, 3.107%, 12/1/34 | | | 1,301,079 | | | | 1,350,168 | |
+1.58%, 3.524%, 1/1/35 | | | 838,797 | | | | 876,180 | |
+1.52%, 3.314%, 8/1/35 | | | 778,218 | | | | 808,941 | |
+1.64%, 3.767%, 5/1/37 | | | 1,009,181 | | | | 1,052,310 | |
+1.85%, 4.189%, 7/1/39 | | | 1,505,659 | | | | 1,591,271 | |
+1.78%, 3.772%, 11/1/40 | | | 1,817,059 | | | | 1,878,228 | |
+1.78%, 3.628%, 12/1/40 | | | 3,551,714 | | | | 3,656,289 | |
+1.58%, 2.683%, 11/1/43 | | | 4,212,876 | | | | 4,379,791 | |
+1.55%, 2.694%, 4/1/44 | | | 10,037,276 | | | | 10,384,276 | |
+1.60%, 2.817%, 11/1/44 | | | 17,880,930 | | | | 17,950,112 | |
+1.60%, 2.808%, 12/1/44 | | | 12,834,503 | | | | 12,880,557 | |
+1.59%, 2.89%, 9/1/45 | | | 3,558,160 | | | | 3,558,452 | |
+1.59%, 2.845%, 12/1/45 | | | 16,437,597 | | | | 16,444,571 | |
+1.59%, 2.664%, 1/1/46 | | | 14,300,264 | | | | 14,256,807 | |
| | | | | | | | |
| | |
| | | PAR VALUE | | | VALUE | |
+1.61%, 3.182%, 6/1/47 | | $ | 13,079,314 | | | $ | 13,131,097 | |
+1.61%, 3.143%, 7/1/47 | | | 17,907,704 | | | | 17,959,748 | |
+1.60%, 2.729%, 8/1/47 | | | 21,901,771 | | | | 21,884,158 | |
USD LIBOR 6-Month | | | | | | | | |
+1.54%, 3.731%, 1/1/35 | | | 1,455,543 | | | | 1,505,507 | |
Freddie Mac, Hybrid ARM | | | | | | | | |
1-Year U.S. Treasury CMT | | | | | | | | |
+2.25%, 3.496%, 10/1/35 | | | 1,883,253 | | | | 1,988,470 | |
USD LIBOR 12-Month | | | | | | | | |
+1.96%, 4.519%, 5/1/34 | | | 1,700,975 | | | | 1,804,028 | |
+1.56%, 3.941%, 4/1/37 | | | 1,833,659 | | | | 1,905,680 | |
+1.79%, 3.543%, 9/1/37 | | | 1,123,568 | | | | 1,178,224 | |
+1.94%, 3.704%, 1/1/38 | | | 256,508 | | | | 268,277 | |
+2.06%, 4.024%, 2/1/38 | | | 3,094,697 | | | | 3,249,185 | |
+1.96%, 3.832%, 7/1/38 | | | 219,162 | | | | 231,402 | |
+1.73%, 3.653%, 10/1/38 | | | 999,060 | | | | 1,045,179 | |
+1.79%, 3.617%, 10/1/41 | | | 852,473 | | | | 866,943 | |
+1.79%, 2.594%, 8/1/42 | | | 7,024,825 | | | | 7,328,529 | |
+1.62%, 2.952%, 5/1/44 | | | 11,638,014 | | | | 11,695,984 | |
+1.61%, 2.994%, 5/1/44 | | | 1,629,061 | | | | 1,637,842 | |
+1.62%, 2.934%, 6/1/44 | | | 3,621,306 | | | | 3,635,593 | |
+1.62%, 3.148%, 6/1/44 | | | 4,374,614 | | | | 4,412,771 | |
+1.63%, 3.078%, 1/1/45 | | | 20,113,120 | | | | 20,216,824 | |
+1.62%, 2.735%, 10/1/45 | | | 9,450,940 | | | | 9,434,276 | |
+1.62%, 2.822%, 10/1/45 | | | 10,638,941 | | | | 10,627,270 | |
+1.63%, 3.239%, 7/1/47 | | | 10,621,480 | | | | 10,662,013 | |
Freddie Mac Gold, 15 Year | | | | | | | | |
4.50%, 9/1/24-9/1/26 | | | 6,101,367 | | | | 6,303,769 | |
Freddie Mac Gold, 20 Year | | | | | | | | |
6.50%, 10/1/26 | | | 2,939,920 | | | | 3,174,471 | |
4.50%, 4/1/31-6/1/31 | | | 8,505,303 | | | | 8,882,631 | |
Freddie Mac Gold, 30 Year | | | | | | | | |
7.75%, 7/25/21 | | | 118,780 | | | | 121,333 | |
7.47%, 3/17/23 | | | 62,337 | | | | 65,237 | |
6.50%, 12/1/32-4/1/33 | | | 4,761,809 | | | | 5,303,125 | |
7.00%, 11/1/37-9/1/38 | | | 3,828,267 | | | | 4,242,612 | |
5.50%, 12/1/37 | | | 539,567 | | | | 585,926 | |
6.00%, 2/1/39 | | | 1,345,484 | | | | 1,484,079 | |
4.50%, 9/1/41-8/1/47 | | | 273,278,595 | | | | 285,187,404 | |
Ginnie Mae, 30 Year | | | | | | | | |
7.97%, 4/15/20-1/15/21 | | | 96,580 | | | | 99,756 | |
7.50%, 11/15/24-10/15/25 | | | 514,324 | | | | 558,577 | |
| | | | | | | | |
| | | | | | | 1,132,325,784 | |
| | | | | | | | |
| | | | | | | 1,378,900,184 | |
| | | | | | | | |
| | | | | | | 1,675,027,506 | |
| CORPORATE: 9.9% | | | | | | | | |
FINANCIALS: 3.5% | | | | | | | | |
Bank of America Corp. | | | | | | | | |
3.004%, 12/20/23(g) | | | 36,273,000 | | | | 35,172,858 | |
4.20%, 8/26/24 | | | 5,825,000 | | | | 5,852,982 | |
4.25%, 10/22/26 | | | 2,970,000 | | | | 2,933,823 | |
4.183%, 11/25/27 | | | 7,925,000 | | | | 7,715,170 | |
Barclays PLC (United Kingdom) | | | | | | | | |
4.375%, 9/11/24 | | | 18,275,000 | | | | 17,755,624 | |
4.836%, 5/9/28 | | | 4,525,000 | | | | 4,271,849 | |
BNP Paribas SA (France)
4.25%, 10/15/24 | | | 31,175,000 | | | | 30,748,394 | |
4.375%, 9/28/25(c) | | | 20,120,000 | | | | 19,630,716 | |
4.375%, 5/12/26(c) | | | 8,000,000 | | | | 7,758,954 | |
4.625%, 3/13/27(c) | | | 4,275,000 | | | | 4,194,545 | |
Boston Properties, Inc.
3.85%, 2/1/23 | | | 7,800,000 | | | | 7,837,191 | |
3.125%, 9/1/23 | | | 17,550,000 | | | | 17,061,879 | |
3.80%, 2/1/24 | | | 5,000,000 | | | | 4,972,971 | |
3.65%, 2/1/26 | | | 4,450,000 | | | | 4,290,620 | |
Capital One Financial Corp. | | | | | | | | |
3.50%, 6/15/23 | | | 21,006,000 | | | | 20,512,981 | |
4.20%, 10/29/25 | | | 10,175,000 | | | | 9,878,512 | |
| | |
| See accompanying Notes to Financial Statements | | DODGE & COX BALANCED FUND §PAGE 9 |
| | | | |
| PORTFOLIO OF INVESTMENTS (unaudited) | | | June 30, 2018 | |
| | | | | | | | |
| DEBT SECURITIES (continued) | | | | | | |
| | |
| | | PAR VALUE | | | VALUE | |
Cigna Corp. | | | | | | | | |
7.875%, 5/15/27 | | $ | 17,587,000 | | | $ | 21,808,414 | |
Citigroup, Inc. | | | | | | | | |
4.00%, 8/5/24 | | | 5,925,000 | | | | 5,822,890 | |
USD LIBOR 3-Month | | | | | | | | |
+6.37%, 8.729%, 10/30/40(b) | | | 37,080,925 | | | | 40,195,723 | |
Equity Residential | | | | | | | | |
3.00%, 4/15/23 | | | 14,775,000 | | | | 14,413,524 | |
2.85%, 11/1/26 | | | 6,000,000 | | | | 5,566,496 | |
HSBC Holdings PLC (United Kingdom) | | | | | | | | |
4.30%, 3/8/26 | | | 4,600,000 | | | | 4,610,229 | |
6.50%, 5/2/36 | | | 27,355,000 | | | | 31,704,398 | |
6.50%, 9/15/37 | | | 12,665,000 | | | | 14,766,170 | |
JPMorgan Chase & Co. | | | | | | | | |
8.75%, 9/1/30(b) | | | 23,042,000 | | | | 31,686,550 | |
Lloyds Banking Group PLC (United Kingdom) | | | | | | | | |
4.50%, 11/4/24 | | | 19,575,000 | | | | 19,343,741 | |
4.65%, 3/24/26 | | | 11,100,000 | | | | 10,917,991 | |
Royal Bank of Scotland Group PLC (United Kingdom) | | | | | | | | |
6.125%, 12/15/22 | | | 43,156,000 | | | | 45,404,273 | |
6.00%, 12/19/23 | | | 8,825,000 | | | | 9,257,411 | |
Unum Group | | | | | | | | |
7.19%, 2/1/28 | | | 8,305,000 | | | | 9,526,288 | |
7.25%, 3/15/28 | | | 2,030,000 | | | | 2,408,273 | |
6.75%, 12/15/28 | | | 11,368,000 | | | | 13,130,630 | |
Wells Fargo & Co. | | | | | | | | |
2.15%, 12/6/19 | | | 19,500,000 | | | | 19,286,948 | |
4.10%, 6/3/26 | | | 3,376,000 | | | | 3,307,037 | |
4.30%, 7/22/27 | | | 21,995,000 | | | | 21,667,710 | |
USD LIBOR 3-Month | | | | | | | | |
+0.65%, 2.964%, 12/6/19 | | | 11,575,000 | | | | 11,652,367 | |
| | | | | | | | |
| | | | | | | 537,066,132 | |
INDUSTRIALS: 6.0% | | | | | | | | |
AT&T, Inc. | | | | | | | | |
5.35%, 9/1/40 | | | 27,575,000 | | | | 26,894,215 | |
4.75%, 5/15/46 | | | 7,000,000 | | | | 6,248,212 | |
5.65%, 2/15/47 | | | 5,175,000 | | | | 5,207,418 | |
4.50%, 3/9/48 | | | 24,560,000 | | | | 21,080,733 | |
Bayer AG (Germany) | | | | | | | | |
3.875%, 12/15/23(c) | | | 6,175,000 | | | | 6,172,947 | |
4.25%, 12/15/25(c) | | | 6,600,000 | | | | 6,637,963 | |
4.375%, 12/15/28(c) | | | 18,700,000 | | | | 18,727,740 | |
BHP Billiton, Ltd. (Australia) | | | | | | | | |
6.75%, 10/19/75(b)(c)(g) | | | 7,525,000 | | | | 8,160,863 | |
Burlington Northern Santa Fe LLC(e) | | | | | | | | |
5.72%, 1/15/24 | | | 3,127,484 | | | | 3,330,911 | |
5.342%, 4/1/24 | | | 6,179,946 | | | | 6,434,989 | |
5.629%, 4/1/24 | | | 9,789,896 | | | | 10,460,474 | |
Cemex SAB de CV (Mexico) | | | | | | | | |
6.00%, 4/1/24(c) | | | 10,575,000 | | | | 10,720,406 | |
5.70%, 1/11/25(c) | | | 22,475,000 | | | | 22,216,538 | |
6.125%, 5/5/25(c) | | | 8,100,000 | | | | 8,233,650 | |
Charter Communications, Inc. | | | | | | | | |
8.75%, 2/14/19 | | | 7,840,000 | | | | 8,101,661 | |
8.25%, 4/1/19 | | | 21,815,000 | | | | 22,627,462 | |
4.125%, 2/15/21 | | | 2,260,000 | | | | 2,271,363 | |
4.908%, 7/23/25 | | | 11,600,000 | | | | 11,711,284 | |
4.20%, 3/15/28 | | | 5,000,000 | | | | 4,679,064 | |
6.55%, 5/1/37 | | | 11,000,000 | | | | 11,662,846 | |
6.75%, 6/15/39 | | | 6,160,000 | | | | 6,563,178 | |
6.484%, 10/23/45 | | | 31,570,000 | | | | 33,253,516 | |
5.375%, 5/1/47 | | | 4,100,000 | | | | 3,720,526 | |
Comcast Corp. | | | | | | | | |
3.999%, 11/1/49 | | | 3,772,000 | | | | 3,331,344 | |
| | | | | | | | |
| | |
| | | PAR VALUE | | | VALUE | |
Cox Enterprises, Inc. | | | | | | | | |
3.25%, 12/15/22(c) | | $ | 6,240,000 | | | $ | 6,059,353 | |
2.95%, 6/30/23(c) | | | 37,166,000 | | | | 35,198,191 | |
3.85%, 2/1/25(c) | | | 24,125,000 | | | | 23,626,055 | |
CRH PLC (Ireland) | | | | | | | | |
3.875%, 5/18/25(c) | | | 17,100,000 | | | | 16,860,844 | |
CVS Health Corp. | | | | | | | | |
3.70%, 3/9/23 | | | 13,650,000 | | | | 13,511,042 | |
4.10%, 3/25/25 | | | 4,275,000 | | | | 4,251,574 | |
4.30%, 3/25/28 | | | 9,425,000 | | | | 9,293,236 | |
4.78%, 3/25/38 | | | 5,125,000 | | | | 5,065,851 | |
Dell Technologies, Inc. | | | | | | | | |
5.45%, 6/15/23(c) | | | 14,966,000 | | | | 15,651,967 | |
Dillard’s, Inc. | | | | | | | | |
7.875%, 1/1/23 | | | 8,660,000 | | | | 9,636,231 | |
7.75%, 7/15/26 | | | 50,000 | | | | 56,276 | |
7.75%, 5/15/27 | | | 540,000 | | | | 607,179 | |
7.00%, 12/1/28 | | | 15,135,000 | | | | 16,385,364 | |
DowDuPont, Inc. | | | | | | | | |
7.375%, 11/1/29 | | | 17,000,000 | | | | 21,186,323 | |
9.40%, 5/15/39 | | | 5,677,000 | | | | 8,742,176 | |
Ford Motor Credit Co. LLC(e) | | | | | | | | |
2.681%, 1/9/20 | | | 13,000,000 | | | | 12,877,673 | |
5.75%, 2/1/21 | | | 12,700,000 | | | | 13,335,381 | |
5.875%, 8/2/21 | | | 12,945,000 | | | | 13,722,173 | |
4.25%, 9/20/22 | | | 4,243,000 | | | | 4,277,199 | |
Imperial Brands PLC (United Kingdom) | | | | | | | | |
3.75%, 7/21/22(c) | | | 10,475,000 | | | | 10,394,014 | |
4.25%, 7/21/25(c) | | | 44,175,000 | | | | 43,959,688 | |
Kinder Morgan, Inc. | | | | | | | | |
4.30%, 6/1/25 | | | 11,050,000 | | | | 10,992,220 | |
5.50%, 3/1/44 | | | 25,893,000 | | | | 25,700,023 | |
5.40%, 9/1/44 | | | 20,119,000 | | | | 19,515,030 | |
Macy’s, Inc. | | | | | | | | |
6.70%, 7/15/34 | | | 5,890,000 | | | | 6,137,551 | |
Naspers, Ltd. (South Africa) | | | | | | | | |
6.00%, 7/18/20(c) | | | 16,900,000 | | | | 17,628,221 | |
5.50%, 7/21/25(c) | | | 20,075,000 | | | | 20,647,138 | |
4.85%, 7/6/27(c) | | | 14,200,000 | | | | 13,898,704 | |
RELX PLC (United Kingdom) | | | | | | | | |
3.125%, 10/15/22 | | | 17,458,000 | | | | 17,122,905 | |
Telecom Italia SPA (Italy) | | | | | | | | |
7.175%, 6/18/19 | | | 27,527,000 | | | | 28,310,143 | |
5.303%, 5/30/24(c) | | | 10,225,000 | | | | 10,084,406 | |
7.20%, 7/18/36 | | | 11,596,000 | | | | 12,012,296 | |
7.721%, 6/4/38 | | | 7,062,000 | | | | 7,591,650 | |
TransCanada Corp. (Canada) | | | | | | | | |
5.625%, 5/20/75(b)(g) | | | 20,570,000 | | | | 20,055,750 | |
5.875%, 8/15/76(b)(g) | | | 4,500,000 | | | | 4,455,000 | |
5.30%, 3/15/77(b)(g) | | | 20,885,000 | | | | 19,747,081 | |
Twenty-First Century Fox, Inc. | | | | | | | | |
6.15%, 3/1/37 | | | 15,000,000 | | | | 17,583,090 | |
6.65%, 11/15/37 | | | 4,638,000 | | | | 5,753,485 | |
Ultrapar Participacoes SA (Brazil) | | | | | | | | |
5.25%, 10/6/26(c) | | | 12,050,000 | | | | 11,170,350 | |
Union Pacific Corp. | | | | | | | | |
6.176%, 1/2/31 | | | 7,733,557 | | �� | | 8,476,559 | |
Verizon Communications, Inc. | | | | | | | | |
4.272%, 1/15/36 | | | 11,847,000 | | | | 10,922,063 | |
4.522%, 9/15/48 | | | 7,000,000 | | | | 6,376,787 | |
5.012%, 4/15/49 | | | 49,149,000 | | | | 47,825,625 | |
Xerox Corp. | | | | | | | | |
4.50%, 5/15/21 | | | 13,311,000 | | | | 13,483,949 | |
Zoetis, Inc. | | | | | | | | |
3.25%, 2/1/23 | | | 2,150,000 | | | | 2,116,153 | |
4.50%, 11/13/25 | | | 17,545,000 | | | | 18,149,954 | |
| | | | | | | | |
| | | | | | | 928,903,226 | |
| | |
| PAGE 10 § DODGE & COX BALANCED FUND | | See accompanying Notes to Financial Statements |
| | | | |
| PORTFOLIO OF INVESTMENTS (unaudited) | | | June 30, 2018 | |
| | | | | | | | |
| DEBT SECURITIES (continued) | | | | | | |
| | |
| | | PAR VALUE | | | VALUE | |
UTILITIES: 0.4% | | | | | | | | |
Dominion Energy, Inc. | | | | | | | | |
4.104%, 4/1/21 | | $ | 5,300,000 | | | $ | 5,373,935 | |
5.75%, 10/1/54(b)(g) | | | 22,950,000 | | | | 23,913,900 | |
Enel SPA (Italy) | | | | | | | | |
6.80%, 9/15/37(c) | | | 13,700,000 | | | | 16,363,330 | |
6.00%, 10/7/39(c) | | | 13,352,000 | | | | 14,829,167 | |
| | | | | | | | |
| | | | | | | 60,480,332 | |
| | | | | | | | |
| | | | | | | 1,526,449,690 | |
| | | | | | | | |
TOTAL DEBT SECURITIES
(Cost $4,024,122,463) | | | | | | $ | 4,051,976,292 | |
|
| EQUITY INDEX PUT OPTIONS PURCHASED: 0.6% | |
| | |
| | | CONTRACTS | | | VALUE | |
Counterparty: Barclays
S&P 500 Index, 3/15/19 at $2,675 Notional Amount $13,591,850 | | | 5,000 | | | $ | 584,402 | |
S&P 500 Index, 6/21/19 at $2,775 Notional Amount $475,714,750 | | | 175,000 | | | | 30,817,502 | |
Counterparty: Goldman Sachs | | | | | | | | |
S&P 500 Index, 12/21/18 at $2,550 Notional Amount $407,755,500 | | | 150,000 | | | | 9,142,489 | |
S&P 500 Index, 3/15/19 at $2,700 Notional Amount $407,755,500 | | | 150,000 | | | | 18,630,001 | |
Counterparty: JPMorgan | | | | | | | | |
S&P 500 Index, 12/21/18 at $2,375 Notional Amount $135,918,500 | | | 50,000 | | | | 1,732,572 | |
S&P 500 Index, 12/21/18 at $2,475 Notional Amount $271,837,000 | | | 100,000 | | | | 4,770,092 | |
S&P 500 Index, 12/21/18 at $2,575 Notional Amount $339,796,250 | | | 125,000 | | | | 8,243,760 | |
S&P 500 Index, 6/21/19 at $2,750 Notional Amount $407,755,500 | | | 150,000 | | | | 24,974,999 | |
| | | | | | | | |
TOTAL EQUITY INDEX PUT OPTIONS PURCHASED
(Cost $140,034,140) | | | $ | 98,895,817 | |
|
| SHORT-TERM INVESTMENTS: 3.1% | |
| | |
| | | PAR VALUE/ SHARES | | | VALUE | |
REPURCHASE AGREEMENT: 2.7% | |
Fixed Income Clearing Corporation(d)
1.20%, dated 6/29/18, due 7/2/18, maturity value $409,348,931 | | $ | 409,308,000 | | | $ | 409,308,000 | |
|
MONEY MARKET FUND: 0.4% | |
State Street Institutional U.S. Government Money Market Fund | | | 62,957,318 | | | | 62,957,318 | |
| | | | | | | | |
TOTAL SHORT-TERM INVESTMENTS
(Cost $472,265,318) | | | $ | 472,265,318 | |
| | | | | | | | |
TOTAL INVESTMENTS IN SECURITIES
(Cost $11,827,838,376) | | | 101.4 | % | | $ | 15,631,802,082 | |
OTHER ASSETS LESS LIABILITIES | | | (1.4 | %) | | | (221,171,337 | ) |
| | | | | | | | |
| NET ASSETS | | | 100.0 | % | | $ | 15,410,630,745 | |
| | | | | | | | |
| (c) | Security exempt from registration under Rule 144A of the Securities Act of 1933. The security may be resold in transactions exempt from registration, normally to qualified institutional buyers. These securities have been deemed liquid by Dodge & Cox, investment manager, pursuant to procedures approved by the Fund’s Board of Trustees. |
| (d) | Repurchase agreement is collateralized by U.S. Treasury Notes 2.125%-2.625%, 6/15/21-8/15/21. Total collateral value is $417,496,972. |
| (e) | Subsidiary (see below) |
| (f) | Variable rate security: interest rate is determined by the interest rates of underlying pool of assets that collateralize the security. The interest rate of the security may change due to a change in the interest rates or the composition of underlying pool of assets. The interest rate shown is the rate as of period end. |
| (g) | Variable rate security: fixed-to-float security pays an initial fixed interest rate and will pay a floating interest rate established at a predetermined time in the future. The interest rate shown is the rate as of period end. |
In determining a company’s country designation, the Fund generally references the country of incorporation. In cases where the Fund considers the country of incorporation to be a “jurisdiction of convenience” chosen primarily for tax purposes or in other limited circumstances, the Fund uses the country designation of an appropriate broad-based market index. In those cases, two countries are listed — the country of incorporation and the country designated by an appropriate index, respectively.
Debt securities are grouped by parent company unless otherwise noted. Actual securities may be issued by the listed parent company or one of its subsidiaries.
Debt securities with floating interest rates are linked to the referenced benchmark; the interest rate shown is the rate as of period end.
ADR: American Depositary Receipt
ARM: Adjustable Rate Mortgage
CMBS: Commercial Mortgage-Backed Security
CMO: Collateralized Mortgage Obligation
CMT: Constant Maturity Treasury
DUS: Delegated Underwriting and Servicing
GO: General Obligation
RB: Revenue Bond
REMIC: Real Estate Mortgage Investment Conduit
FUTURES CONTRACTS
| | | | | | | | | | | | | | | | |
| Description | | Number of
Contracts | | | Expiration
Date | | | Notional
Amount | | | Value /
Unrealized
Appreciation
(Depreciation) | |
Ultra Long-Term U.S. Treasury Bond—Short Position | | | 368 | | | | 9/19/18 | | | $ | (58,719,000 | ) | | $ | (1,304,240 | ) |
| | |
| See accompanying Notes to Financial Statements | | DODGE & COX BALANCED FUND §PAGE 11 |
| | | | |
STATEMENT OF ASSETS AND LIABILITIES (unaudited) | |
| |
| | | June 30, 2018 | |
ASSETS: | | | | |
Investments in securities, at value (cost $11,827,838,376) | | $ | 15,631,802,082 | |
Deposits with broker for futures contracts | | | 1,749,000 | |
Receivable for variation margin for futures contracts | | | 26,997 | |
Receivable for investments sold | | | 193,589,075 | |
Receivable for Fund shares sold | | | 4,699,305 | |
Dividends and interest receivable | | | 51,567,955 | |
Prepaid expenses and other assets | | | 31,567 | |
| | | | |
| | | 15,883,465,981 | |
| | | | |
LIABILITIES: | | | | |
Cash received as collateral for options purchased | | | 101,490,000 | |
Payable for investments purchased | | | 13,372,245 | |
Payable for Fund shares redeemed | | | 350,813,233 | |
Management fees payable | | | 6,530,200 | |
Accrued expenses | | | 629,558 | |
| | | | |
| | | 472,835,236 | |
| | | | |
NET ASSETS | | $ | 15,410,630,745 | |
| | | | |
NET ASSETS CONSIST OF: | | | | |
Paid in capital | | $ | 11,079,900,408 | |
Undistributed net investment income | | | 1,732,979 | |
Undistributed net realized gain | | | 526,337,892 | |
Net unrealized appreciation | | | 3,802,659,466 | |
| | | | |
| | $ | 15,410,630,745 | |
| | | | |
Fund shares outstanding (par value $0.01 each, unlimited shares authorized) | | | 147,111,644 | |
Net asset value per share | | $ | 104.75 | |
| |
STATEMENT OF OPERATIONS (unaudited) | | | | |
| |
| | | Six Months Ended June 30, 2018 | |
INVESTMENT INCOME: | | | | |
Dividends (net of foreign taxes of $4,001,601) | | $ | 114,154,250 | |
Interest | | | 98,047,898 | |
| | | | |
| | | 212,202,148 | |
| | | | |
EXPENSES: | | | | |
Management fees | | | 40,100,626 | |
Custody and fund accounting fees | | | 118,347 | |
Transfer agent fees | | | 769,089 | |
Professional services | | | 83,628 | |
Shareholder reports | | | 193,154 | |
Registration fees | | | 121,365 | |
Trustees’ fees | | | 162,083 | |
ADR depositary service fees | | | 870,548 | |
Miscellaneous | | | 112,994 | |
| | | | |
| | | 42,531,834 | |
| | | | |
NET INVESTMENT INCOME | | | 169,670,314 | |
| | | | |
REALIZED AND UNREALIZED GAIN (LOSS): | | | | |
Net realized gain | | | | |
Investments in securities | | | 597,157,601 | |
Futures contracts | | | 9,594,349 | |
Net change in unrealized appreciation/depreciation | | | | |
Investments in securities | | | (771,325,579 | ) |
Futures contracts | | | (1,610,904 | ) |
| | | | |
Net realized and unrealized loss | | | (166,184,533 | ) |
| | | | |
NET CHANGE IN NET ASSETS FROM OPERATIONS | | $ | 3,485,781 | |
| | | | |
| | | | | | | | |
STATEMENT OF CHANGES IN NET ASSETS (unaudited) | |
| | |
| | | Six Months Ended June 30, 2018 | | | Year Ended
December 31, 2017 | |
OPERATIONS: | | | | | | | | |
Net investment income | | $ | 169,670,314 | | | $ | 337,024,067 | |
Net realized gain (loss) | | | 606,751,950 | | | | 858,113,109 | |
Net change in unrealized appreciation/depreciation | | | (772,936,483 | ) | | | 694,677,141 | |
| | | | | | | | |
| | | 3,485,781 | | | | 1,889,814,317 | |
| | | | | | | | |
| | |
DISTRIBUTIONS TO SHAREHOLDERS FROM: | | | | | | | | |
Net investment income | | | (170,207,925 | ) | | | (338,037,335 | ) |
Net realized gain | | | (168,863,143 | ) | | | (994,897,721 | ) |
| | | | | | | | |
Total distributions | | | (339,071,068 | ) | | | (1,332,935,056 | ) |
| | | | | | | | |
| | |
FUND SHARE
TRANSACTIONS: | | | | | | | | |
Proceeds from sale of shares | | | 620,126,191 | | | | 1,562,877,163 | |
Reinvestment of distributions | | | 320,295,877 | | | | 1,265,331,879 | |
Cost of shares redeemed | | | (1,581,170,811 | ) | | | (2,379,686,448 | ) |
| | | | | | | | |
Net change from Fund share transactions | | | (640,748,743 | ) | | | 448,522,594 | |
| | | | | | | | |
Total change in net assets | | | (976,334,030 | ) | | | 1,005,401,855 | |
| | |
NET ASSETS: | | | | | | | | |
Beginning of period | | | 16,386,964,775 | | | | 15,381,562,920 | |
| | | | | | | | |
End of period (including undistributed net investment income of $1,732,979 and $2,270,590, respectively) | | $ | 15,410,630,745 | | | $ | 16,386,964,775 | |
| | | | | | | | |
| | |
SHARE INFORMATION: | | | | | | | | |
Shares sold | | | 5,782,330 | | | | 14,655,810 | |
Distributions reinvested | | | 3,074,442 | | | | 11,918,105 | |
Shares redeemed | | | (14,896,810 | ) | | | (22,251,076 | ) |
| | | | | | | | |
Net change in shares outstanding | | | (6,040,038 | ) | | | 4,322,839 | |
| | | | | | | | |
| | |
| PAGE 12 § DODGE & COX BALANCED FUND | | See accompanying Notes to Financial Statements |
NOTES TO FINANCIAL STATEMENTS (unaudited)
NOTE 1—ORGANIZATION AND SIGNIFICANT ACCOUNTING POLICIES
Dodge & Cox Balanced Fund (the “Fund”) is one of the series constituting the Dodge & Cox Funds (the “Trust” or the “Funds”). The Trust is organized as a Delaware statutory trust and is registered under the Investment Company Act of 1940, as amended, as an open-end management investment company. The Fund commenced operations on June 26, 1931, and seeks regular income, conservation of principal, and an opportunity for long-term growth of principal and income. Risk considerations and investment strategies of the Fund are discussed in the Fund’s Prospectus.
The financial statements have been prepared in conformity with accounting principles generally accepted in the United States of America, which require the use of estimates and assumptions by management. Actual results may differ from those estimates. Significant accounting policies are as follows:
Security valuation The Fund’s net assets are normally valued as of the scheduled close of trading on the New York Stock Exchange (NYSE), generally 4 p.m. Eastern Time, each day that the NYSE is open for business. Portfolio securities and other financial instruments for which market quotes are readily available are valued at market value. Listed securities, for example, are generally valued using the official quoted close price or the last sale on the exchange that is determined to be the primary market for the security.
Debt securities, certain preferred stocks, and derivatives traded over the counter are valued using prices received from independent pricing services which utilize dealer quotes, recent transaction data, pricing models, and other inputs to arrive at market-based valuations. Pricing models may consider quoted prices for similar securities, interest rates, cash flows (including prepayment speeds), and credit risk. Exchange-traded derivatives are valued at the settlement price determined by the relevant exchange. Short-term securities less than 60 days to maturity may be valued at amortized cost if amortized cost approximates current value. Mutual funds are valued at their respective net asset values. Security values are not discounted based on the size of the Fund’s position and may differ from the value a Fund receives upon sale of the securities. All securities held by the Fund are denominated in U.S. dollars.
If market quotations are not readily available or if normal valuation procedures produce valuations that are deemed unreliable or inappropriate under the circumstances existing at the time, the investment will be valued at fair value as determined in good faith by or under the direction of the Fund’s Board of Trustees. The Board of Trustees has appointed Dodge & Cox, the Fund’s investment manager, to make fair value determinations in accordance with the Dodge & Cox Funds Valuation Policies (“Valuation Policies”), subject to Board oversight. Dodge & Cox has established a Pricing Committee that is comprised of representatives from Treasury, Legal, Compliance, and Operations. The Pricing Committee is responsible for implementing the Valuation Policies, including determining the fair value of
securities and other investments when necessary. The Pricing Committee considers relevant indications of value that are reasonably available to it in determining the fair value assigned to a particular security, such as the value of similar financial instruments, trading volumes, contractual restrictions on disposition, related corporate actions, and changes in economic conditions. In doing so, the Pricing Committee employs various methods for calibrating fair valuation approaches, including a regular review of key inputs and assumptions, back-testing, and review of any related market activity.
Valuing securities through a fair value determination involves greater reliance on judgment than valuation of securities based on readily available market quotations. In some instances, lack of information and uncertainty as to the significance of information may lead to a conclusion that a prior valuation is the best indication of a security’s value. When fair value pricing is employed, the prices of securities used by the Fund to calculate its net asset value may differ from quoted or published prices for the same securities.
Security transactions, investment income, expenses, and distributions Security transactions are recorded on the trade date. Realized gains and losses on securities sold are determined on the basis of identified cost.
Dividend income and corporate action transactions are recorded on the ex-dividend date, or when the Fund first learns of the dividend/corporate action if the ex-dividend date has passed. Non-cash dividends, if any, are recorded at the fair market value of the securities received. Dividends characterized as return of capital for U.S. tax purposes are recorded as a reduction of cost of investments and/or realized gain.
Interest income is recorded on the accrual basis. Interest income includes coupon interest, amortization of premium and accretion of discount on debt securities, and gain/loss on paydowns. The ability of the issuers of the debt securities held by the Fund to meet their obligations may be affected by economic developments in a specific industry, state, or region. Debt obligations may be placed on non-accrual status and related interest income may be reduced by ceasing current accruals and writing off interest receivables when the collection of all or a portion of interest has become doubtful. A debt obligation is removed from non-accrual status when the issuer resumes interest payments or when collectibility of interest is reasonably assured.
Expenses are recorded on the accrual basis. Some expenses of the Trust can be directly attributed to a specific series. Expenses which cannot be directly attributed are allocated among the Funds in the Trust using methodologies determined by the nature of the expense.
Distributions to shareholders are recorded on the ex-dividend date.
Foreign taxes The Fund may be subject to foreign taxes which may be imposed by certain countries in which the Fund invests. The Fund endeavors to record foreign taxes based on applicable foreign tax law. Withholding taxes are incurred on certain foreign dividends and are accrued at the time the associated dividend is recorded. The Fund files withholding tax
DODGE & COX BALANCED FUND §PAGE 13
NOTES TO FINANCIAL STATEMENTS (unaudited)
reclaims in certain jurisdictions to recover a portion of amounts previously withheld. The Fund records a reclaim receivable based on, among other things, a jurisdiction’s legal obligation to pay reclaims as well as payment history and market convention. In consideration of recent decisions rendered by European courts, the Fund has filed for additional reclaims related to prior years. A corresponding receivable is established when both the amount is known and significant contingencies or uncertainties regarding collectability are removed. These amounts, if any, are reported in “dividends and interest receivable” in the Statement of Assets and Liabilities.
Repurchase agreements Repurchase agreements are transactions under which a Fund purchases a security from a dealer counterparty and agrees to resell the security to that counterparty on a specified future date at the same price, plus a specified interest rate. The Fund’s repurchase agreements are secured by U.S. government or agency securities. It is the Fund’s policy that its custodian take possession of the underlying collateral securities, the fair value of which exceeds the principal amount of the repurchase transaction, including accrued interest, at all times. In the event of default by the counterparty, the Fund has the contractual right to liquidate the collateral securities and to apply the proceeds in satisfaction of the obligation.
Indemnification Under the Trust’s organizational documents, its officers and trustees are indemnified against certain liabilities arising out of the performance of their duties to the Trust. In addition, in the normal course of business the Trust enters into contracts that provide general indemnities to other parties. The Trust’s maximum exposure under these arrangements is unknown as this would involve future claims that may be made against the Trust that have not yet occurred.
NOTE 2—VALUATION MEASUREMENTS
Various inputs are used in determining the value of the Fund’s investments. These inputs are summarized in the three broad levels listed below.
| § | | Level 1: Quoted prices in active markets for identical securities |
| § | | Level 2: Other significant observable inputs (including quoted prices for similar securities, market indices, interest rates, credit risk, forward exchange rates, etc.) |
| § | | Level 3: Significant unobservable inputs (including Fund management’s assumptions in determining the fair value of investments) |
The inputs or methodology used for valuing securities are not necessarily an indication of the risk associated with investing in those securities.
The following is a summary of the inputs used to value the Fund’s holdings at June 30, 2018:
| | | | | | | | |
| Classification(a) | | LEVEL 1
(Quoted Prices) | | | LEVEL 2
(Other Significant
Observable Inputs) | |
Securities | | | | | | | | |
Common Stocks(b) | | $ | 10,258,017,040 | | | $ | — | |
Preferred Stocks | | | — | | | | 750,647,615 | |
Debt Securities | | | | | | | | |
U.S. Treasury | | | — | | | | 609,508,031 | |
Government-Related | | | — | | | | 240,991,065 | |
Securitized | | | — | | | | 1,675,027,506 | |
Corporate | | | — | | | | 1,526,449,690 | |
Equity Index Put Options Purchased | | | — | | | | 98,895,817 | |
Short-term Investments | | | | | | | | |
Repurchase Agreement | | | — | | | | 409,308,000 | |
Money Market Fund | | | 62,957,318 | | | | — | |
| | | | | | | | |
Total Securities | | $ | 10,320,974,358 | | | $ | 5,310,827,724 | |
| | | | | | | | |
Other Investments | | | | | | | | |
Futures Contracts | | | | | | | | |
Depreciation | | $ | (1,304,240 | ) | | | — | |
| | | | | | | | | |
| (a) | There were no transfers between Level 1 and Level 2 during the period. There were no Level 3 securities at June 30, 2018 and December 31, 2017, and there were no transfers to Level 3 during the period. |
| (b) | All common stocks held in the Fund are Level 1 securities. For a detailed break-out of common stocks by major industry classification, please refer to the Portfolio of Investments. |
NOTE 3—DERIVATIVE INSTRUMENTS
The Fund entered into various transactions involving derivative instruments, including Treasury futures contracts and purchased equity index put options, in connection with its investment strategy. The Fund may use derivatives to minimize the impact of losses to one or more of its investments (as a “hedging technique”) or to implement its investment strategy.
The Fund has entered into over-the-counter derivatives, such as put options (each, an “OTC Derivative”). Each OTC Derivative is subject to a negotiated master agreement (based on a form published by the International Swaps and Derivatives Association (“ISDA”)) governing all OTC Derivatives between the Fund and the relevant dealer counterparty. The master agreements specify (i) events of default and other events permitting a party to terminate some or all of the OTC Derivatives thereunder and (ii) the process by which those OTC Derivatives will be valued for purposes of determining termination payments. If some or all of the OTC Derivatives under a master agreement are terminated because of an event of default or similar event, the values of all terminated OTC Derivatives must be netted to determine a single payment owed by one party to the other. To the extent amounts owed to the Fund by its counterparties are not collateralized, the Fund is at risk of those counterparties’ non-performance. The Fund attempts to mitigate counterparty credit risk by entering into OTC Derivatives only with counterparties it believes to be of good credit quality, by exchanging collateral, and by monitoring the financial stability of those counterparties.
PAGE 14 § DODGE & COX BALANCED FUND
NOTES TO FINANCIAL STATEMENTS (unaudited)
Futures contracts Futures contracts involve an obligation to purchase or sell (depending on whether the Fund has entered a long or short futures contract, respectively) an asset at a future date, at a price set at the time of the contract. Upon entering into a futures contract, the Fund is required to deposit an amount of cash or liquid assets (referred to as initial margin) in a segregated account with the clearing broker. Subsequent payments (referred to as variation margin) to and from the clearing broker are made on a daily basis based on changes in the market value of futures contracts. Futures contracts are traded publicly and their market value changes daily. Changes in the market value of open futures contracts are recorded as unrealized appreciation or depreciation in the Statement of Operations. Realized gains and losses on futures contracts are recorded in the Statement of Operations at the closing or expiration of the contracts. Cash deposited with a broker as initial margin is recorded in the Statement of Assets and Liabilities. A receivable and/or payable to brokers for daily variation margin is also recorded in the Statement of Assets and Liabilities.
Investments in futures contracts may include certain risks, which may be different from, and potentially greater than, those of the underlying securities. To the extent the Fund uses futures, it is exposed to additional volatility and potential losses resulting from leverage.
The Fund has maintained short Treasury futures contracts to assist with the management of the portfolio’s interest rate exposure. During the six months ended June 30, 2018, these Treasury futures contracts had notional values up to 2% of net assets.
Equity index put options An equity index put option gives its holder the right (but not the obligation) to sell the future value of an equity stock index, such as the S&P 500 index, at a predetermined strike price. A put option has value at its expiration if the index price is lower than the strike price. The buyer of an equity index put option pays a premium amount to purchase the contract, but has no payment obligations thereafter. Cash collateral received from the counterparty is recorded in the Statement of Assets and Liabilities. Changes in the value of open equity index put options are recorded as unrealized appreciation or depreciation and realized gains or losses are recorded at the closing or expiration of the options in the Statement of Operations within investments in securities. For the six months ended June 30, 2018, the change in unrealized appreciation/depreciation and realized gain (loss) was ($41,138,323) and ($59,301,025), respectively.
The Fund purchased over-the-counter equity index put options to hedge against a general downturn in the equity markets. During the six months ended June 30, 2018, these equity index put options had values up to 1% of net assets.
Additional derivative information For financial reporting purposes, the Fund does not offset OTC Derivative assets and liabilities that are subject to a master netting arrangement in the Statement of Assets and Liabilities. OTC Derivatives are presented in the Statement of Assets and Liabilities as investments. Collateral held by the Fund for OTC Derivatives are
reported gross and presented as “Cash received as collateral for options purchased” in the Statement of Assets and Liabilities.
The netting of assets and liabilities and the offsetting of collateral pledged or received are based on contractual netting/set-off provisions in the ISDA master agreement. The following table presents the Fund’s net exposure for OTC Derivatives that are subject to enforceable master netting arrangements as of June 30, 2018. The net amount represents the receivable from (payable to) the counterparty in the event of a default.
| | | | | | | | | | | | | | | | |
| Counterparty | | Gross OTC Derivative Assets | | | Gross OTC Derivative Liabilities | | | Cash Collateral Pledged/ (Received)(a) | | | Net Amount | |
Barclays | | $ | 31,401,904 | | | $ | — | | | $ | (31,401,904 | ) | | $ | — | |
JPMorgan | | | 27,772,490 | | | | — | | | | (27,772,490 | ) | | | — | |
Goldman Sachs | | | 39,721,423 | | | | — | | | | (39,721,423 | ) | | | — | |
| | | | | | | | | | | | | | | | |
Total | | $ | 98,895,817 | | | $ | — | | | $ | (98,895,817 | ) | | $ | — | |
| | | | | | | | | | | | | | | | |
| | | | | | | | | | | | | | | | | |
| (a) | Cash collateral received in excess of OTC Derivative assets/liabilities, if any, is not presented. Total cash collateral received is presented in the Statement of Assets and Liabilities. |
NOTE 4—RELATED PARTY TRANSACTIONS
Management fees Under a written agreement approved by a unanimous vote of the Board of Trustees, the Fund pays a management fee monthly at an annual rate of 0.50% of the Fund’s average daily net assets to Dodge & Cox, investment manager of the Fund.
Fund officers and trustees All officers and two of the trustees of the Trust are officers or employees of Dodge & Cox. The Trust pays a fee only to those trustees who are not affiliated with Dodge & Cox.
NOTE 5—INCOME TAX INFORMATION AND DISTRIBUTIONS TO SHAREHOLDERS
A provision for federal income taxes is not required since the Fund intends to continue to qualify as a regulated investment company under Subchapter M of the Internal Revenue Code and distribute all of its taxable income to shareholders. Distributions are determined in accordance with income tax regulations, and such amounts may differ from net investment income and realized gains for financial reporting purposes. Financial reporting records are adjusted for permanent book to tax differences at year end to reflect tax character. Book to tax differences are primarily due to differing treatments of wash sales, net short-term realized gain (loss), certain dividends, derivatives, and Treasury Inflation-Protected Securities.
Distributions during the periods noted below were characterized as follows for federal income tax purposes:
| | | | | | | | |
| | | Six Months Ended
June 30, 2018 | | | Year Ended
December 31, 2017 | |
Ordinary income | | $ | 170,207,925 | | | $ | 381,953,061 | |
| | ($ | 1.130 per share | ) | | ($ | 2.589 per share | ) |
Long-term capital gain | | $ | 168,863,143 | | | $ | 950,981,995 | |
| | ($ | 1.116 per share | ) | | ($ | 6.491 per share | ) |
DODGE & COX BALANCED FUND §PAGE 15
NOTES TO FINANCIAL STATEMENTS (unaudited)
The components of distributable earnings on a tax basis are reported as of the Fund’s most recent year end. At December 31, 2017, the tax basis components of distributable earnings were as follows:
| | | | |
Undistributed ordinary income | | $ | 2,283,411 | |
Undistributed long-term capital gain | | | 168,781,846 | |
Deferred loss(a) | | | (76,090,802 | ) |
At June 30, 2018, unrealized appreciation and depreciation for investments and derivatives based on cost for federal income tax purposes was as follows:
| | | | |
Tax cost | | $ | 11,830,324,642 | |
| | | | |
Unrealized appreciation | | | 4,117,701,155 | |
Unrealized depreciation | | | (317,527,955 | ) |
| | | | |
Net unrealized appreciation | | | 3,800,173,200 | |
| | | | | |
| (a) | Represents capital loss incurred between November 1, 2017 and December 31, 2017. As permitted by tax regulation, the Fund has elected to treat this loss as arising in 2018. |
Fund management has reviewed the tax positions for open periods (three years and four years, respectively, from filing the Fund’s Federal and State tax returns) as applicable to the Fund, and has determined that no provision for income tax is required in the Fund’s financial statements.
NOTE 6—LOAN FACILITIES
Pursuant to an exemptive order issued by the Securities and Exchange Commission (SEC), the Fund may participate in an interfund lending facility (Facility). The Facility allows the Fund to borrow money from or loan money to the Funds. Loans under the Facility are made for temporary or emergency purposes, such as to fund shareholder redemption requests. Interest on borrowings is the average of the current repurchase agreement rate and the bank loan rate. There was no activity in the Facility during the period.
All Funds in the Trust participate in a $500 million committed credit facility (Line of Credit) with State Street Bank and Trust Company, to be utilized for temporary or emergency purposes to fund shareholder redemptions or for other short-term liquidity purposes. The maximum amount available to the Fund is $250 million. Each Fund pays an annual commitment fee on its pro-rata portion of the Line of Credit. For the six months ended June 30, 2018, the Fund’s commitment fee amounted to $46,308 and is reflected as a Miscellaneous Expense in the Statement of Operations. Interest on borrowings is charged at the prevailing rate. There were no borrowings on the Line of Credit during the period.
NOTE 7—PURCHASES AND SALES OF INVESTMENTS
For the six months ended June 30, 2018, purchases and sales of securities, other than short-term securities and U.S. government securities, aggregated $1,217,687,610 and $1,724,288,872, respectively. For the six months ended June 30, 2018, purchases and sales of U.S. government securities aggregated $433,077,720 and $634,277,584, respectively.
NOTE 8—NEW ACCOUNTING GUIDANCE
In March 2017, the Financial Accounting Standards Board issued an update to amend the amortization period for certain purchased callable debt securities held at a premium. The amendments shorten the amortization period for premiums to the earliest call date, but do not require an accounting change for securities held at a discount. The amendments are effective for financial statements for fiscal years beginning after December 15, 2018, and interim periods within those fiscal years. Management is evaluating the impact, if any, of this guidance on the Fund’s financial statements and disclosures.
NOTE 9—SUBSEQUENT EVENTS
Fund management has determined that no material events or transactions occurred subsequent to June 30, 2018, and through the date of the Fund’s financial statements issuance, which require additional disclosure in the Fund’s financial statements.
PAGE 16 § DODGE & COX BALANCED FUND
FINANCIAL HIGHLIGHTS (unaudited)
| | | | | | | | | | | | | | | | | | | | | | | | |
SELECTED DATA AND RATIOS (for a share outstanding throughout each period) | | Six Months
Ended June 30, | | | Year Ended December 31, | |
| | | 2018 | | | 2017 | | | 2016 | | | 2015 | | | 2014 | | | 2013 | |
| | | | | | | | |
Net asset value, beginning of period | | | $107.00 | | | | $103.35 | | | | $94.42 | | | | $102.48 | | | | $98.30 | | | | $78.06 | |
Income from investment operations: | | | | | | | | | | | | | | | | | | | | | | | | |
Net investment income | | | 1.13 | | | | 2.28 | | | | 2.34 | | | | 2.06 | | | | 2.03 | | | | 1.66 | |
Net realized and unrealized gain (loss) | | | (1.13 | ) | | | 10.45 | | | | 12.89 | | | | (4.99 | ) | | | 6.59 | | | | 20.30 | |
| | | | | | | | |
Total from investment operations | | | — | | | | 12.73 | | | | 15.23 | | | | (2.93 | ) | | | 8.62 | | | | 21.96 | |
| | | | | | | | |
Distributions to shareholders from: | | | | | | | | | | | | | | | | | | | | | | | | |
Net investment income | | | (1.13 | ) | | | (2.29 | ) | | | (2.34 | ) | | | (2.06 | ) | | | (2.03 | ) | | | (1.65 | ) |
Net realized gain | | | (1.12 | ) | | | (6.79 | ) | | | (3.96 | ) | | | (3.07 | ) | | | (2.41 | ) | | | (0.07 | ) |
| | | | | | | | |
Total distributions | | | (2.25 | ) | | | (9.08 | ) | | | (6.30 | ) | | | (5.13 | ) | | | (4.44 | ) | | | (1.72 | ) |
| | | | | | | | |
Net asset value, end of period | | | $104.75 | | | | $107.00 | | | | $103.35 | | | | $94.42 | | | | $102.48 | | | | $98.30 | |
| | | | | | | | |
Total return | | | 0.02 | % | | | 12.59 | % | | | 16.55 | % | | | (2.88 | )% | | | 8.85 | % | | | 28.37 | % |
Ratios/supplemental data: | | | | | | | | | | | | | | | | | | | | | | | | |
Net assets, end of period (millions) | | | $15,411 | | | | $16,387 | | | | $15,382 | | | | $14,269 | | | | $15,465 | | | | $14,404 | |
Ratio of expenses to average net assets | | | 0.53 | %(a) | | | 0.53 | % | | | 0.53 | % | | | 0.53 | % | | | 0.53 | % | | | 0.53 | % |
Ratio of net investment income to average net assets | | | 2.12 | %(a) | | | 2.12 | % | | | 2.41 | % | | | 2.03 | % | | | 2.00 | % | | | 1.85 | % |
Portfolio turnover rate | | | 10 | % | | | 19 | % | | | 24 | % | | | 20 | % | | | 23 | % | | | 25 | % |
See accompanying Notes to Financial Statements
DODGE & COX BALANCED FUND §PAGE 17
FUND HOLDINGS
The Fund provides a complete list of its holdings four times each fiscal year, as of the end of each quarter. The Fund files the lists with the SEC on Form N-CSR (second and fourth quarters) and Form N-Q (first and third quarters). Shareholders may view the Fund’s Forms N-CSR and N-Q on the SEC’s website at sec.gov. Forms N-CSR and N-Q may also be reviewed and copied at the SEC’s Public Reference Room in Washington, DC. Information regarding the operations of the Public Reference Room may be obtained by calling 800-SEC-0330. A list of the Fund’s quarter-end holdings is also available at dodgeandcox.com on or about 15 days following each quarter end and remains available on the website until the list is updated in the subsequent quarter.
PROXY VOTING
For a free copy of the Fund’s proxy voting policies and procedures, please call 800-621-3979, visit the Fund’s website at dodgeandcox.com, or visit the SEC’s website at sec.gov. Information regarding how the Fund voted proxies relating to portfolio securities during the most recent 12-month period ending June 30 is also available at dodgeandcox.com or at sec.gov.
HOUSEHOLD MAILINGS
The Fund routinely mails shareholder reports and summary prospectuses to shareholders and, on occasion, proxy statements. In order to reduce the volume of mail, when possible, only one copy of these documents will be sent to shareholders who are part of the same family and share the same residential address.
If you have a direct account with the Funds and you do not want the mailing of shareholder reports and summary prospectuses combined with other members in your household, contact the Funds at 800-621-3979. Your request will be implemented within 30 days.
PAGE 18 § DODGE & COX BALANCED FUND
TRUSTEES AND EXECUTIVE OFFICERS
Charles F. Pohl, Chairman and Trustee
Chairman, Dodge & Cox
Dana M. Emery, President and Trustee
Chief Executive Officer and President, Dodge & Cox
Caroline M. Hoxby, Independent Trustee
Professor of Economics, Stanford University; Senior Fellow, Hoover Institution
Thomas A. Larsen, Independent Trustee
Former Senior Counsel, Arnold & Porter Kaye Scholer LLP
Ann Mather, Independent Trustee
Former Executive Vice President, Chief Financial Officer, and Company Secretary, Pixar Animation Studios
Robert B. Morris III, Independent Trustee
Former Partner and Managing director - Global Investment Research, Goldman Sachs; former Advisory Director, The Presidio Group
Gary Roughead, Independent Trustee
Robert and Marion Oster Distinguished Military Fellow, Hoover Institution; former U.S. Navy Chief of Naval Operations
Mark E. Smith, Independent Trustee
Former Executive Vice President and Managing Director-Fixed Income, Loomis Sayles & Company, L.P.
John B. Taylor, Independent Trustee
Professor of Economics, Stanford University; Senior Fellow, Hoover Institution; and former Under Secretary for International Affairs, United States Treasury
Diana S. Strandberg, Senior Vice President
Senior Vice President and Director of International Equity, Dodge & Cox
David H. Longhurst, Treasurer
Vice President and Assistant Treasurer, Dodge & Cox
Katherine M. Primas, Chief Compliance Officer
Vice President and Chief Compliance Officer, Dodge & Cox
Roberta R.W. Kameda, Secretary
Vice President, General Counsel, and Secretary, Dodge & Cox
William W. Strickland, Vice President, Assistant Secretary, and Assistant Treasurer
Vice President and Chief Operating Officer, Dodge & Cox
Additional information about the Trust’s Trustees and Officers is available in the Trust’s Statement of Additional Information (SAI). You can get a free copy of the SAI by visiting the Funds’ website at dodgeandcox.com or calling 800-621-3979.
DODGE & COX BALANCED FUND §PAGE 19
dodgeandcox.com
For Fund literature, transactions, and account information, please visit the Funds’ website.
or write or call:
DODGE & COX FUNDS
c/o DST Asset Manager Solutions, Inc.
P.O. Box 8422
Boston, Massachusetts 02266-8422
(800) 621-3979
INVESTMENT MANAGER
Dodge & Cox
555 California Street, 40th Floor
San Francisco, California 94104
(415) 981-1710
This report is submitted for the general information of the shareholders of the Fund. The report is not authorized for distribution to prospective investors in the Fund unless it is accompanied by a current prospectus.
This report reflects our views, opinions, and portfolio holdings as of June 30, 2018, the end of the reporting period. Any such views are subject to change at any time based upon market or other conditions and Dodge & Cox disclaims any responsibility to update such views. These views may not be relied on as investment advice and, because investment decisions for a Dodge & Cox Fund are based on numerous factors, may not be relied on as an indication of trading intent on behalf of any Dodge & Cox Fund.
DODGE & COX FUNDS®
Semi-Annual Report
June 30, 2018
Income Fund
ESTABLISHED 1989
TICKER: DODIX
6/18 IF SAR Printed on recycled paper
TO OUR SHAREHOLDERS
The Dodge & Cox Income Fund had a total return of –1.2% for the six months ended June 30, 2018, compared to a return of –1.6% for the Bloomberg Barclays U.S. Aggregate Bond Index (Bloomberg Barclays U.S. Agg).
MARKET COMMENTARY
The U.S. investment-grade bond market delivered a negative return for the first half of 2018 as higher Treasury yields and wider credit spreads pushed bond prices lower. Interest rates fluctuated throughout the period as investors grappled with the offsetting influences of strong U.S. economic activity, rising inflation, geopolitical uncertainty, and intervals of volatility in financial markets. Overall, the two-year Treasury yield rose 65 basis points (bps)(a) to 2.53% and the ten-year yield rose 45 bps to 2.86%, resulting in the smallest gap between the yields since 2007.
Economic data released during the period was generally upbeat, indicating that the U.S. economy remained on a solid path of steady growth and higher inflation. Employers continued to add jobs at a consistent pace, and the unemployment rate declined to 3.8 percent, the lowest level since 2000. This was accompanied by strong retail sales, housing market data, and services sector activity. Meanwhile, Federal Reserve (Fed) officials raised short-term rates twice (by 25 bps each time) and revised their forecast upward to include a total of four hikes in 2018, citing the continued strength of the economy.
However, several geopolitical developments weighed on market sentiment. Investors grew concerned that escalating trade tensions between the United States and its key trading partners might lead to a broader trade war that could hurt economic growth. In addition, signs of political upheaval in Italy and elsewhere in Europe elevated volatility in financial markets.
The investment-grade Corporate sector generated a first half return of –3.3%,(b) underperforming comparable-duration(c) Treasuries by 1.8 percentage points. Reflecting the risk-averse tone in the market, credit yield premiums(d) widened to late 2016 levels. This underperformance occurred despite solid corporate earnings that reflected core business strength and as tax windfalls associated with the recent tax bill. Meanwhile, Agency(e) mortgage backed securities (MBS) returned –1.0%, underperforming comparable-duration Treasuries by 0.2 percentage points.
INVESTMENT STRATEGY
The Fund features sizable positions in corporate bonds and Agency MBS (34%(f) each) and smaller positions in government-related securities (6%) and asset-backed securities (7%). The Fund’s 17% position in U.S. Treasuries represents “dry powder” we can deploy as we uncover interesting opportunities. We have maintained the Fund’s defensive duration position given our longer-term expectations for interest rates to rise more than implied by current market valuations. Modest changes to portfolio positioning over the first half of 2018 reflected decisions made at the individual security and issuer levels by our investment team.
Credit: Continuing to Monitor Risks and Seek Opportunities
The Fund’s weighting in credit-related issues declined by just one percentage point during the first half of 2018 to 41%, which understates a number of adjustments made at the individual security and issuer levels. For example, we trimmed certain holdings with somewhat less compelling risk/reward relationships after strong performance (e.g., Citigroup capital securities,(g) State of California, Telecom Italia). In addition, other holdings either matured (e.g., State of Illinois), were “make-whole” called(h) (e.g., Navient), or were redeemed by the issuer at a large premium to the market price (e.g., Bank of America capital securities).
The recent widening in credit spreads generally—from 85 bps in early February to 123 bps at the end of June—has created incremental opportunities. These types of market movements have enabled us to add value over longer time periods, as we often use market weakness to add to existing positions or build new ones. For example, we purchased CVS bonds in the first quarter in connection with the company’s levered acquisition of Aetna, and we added to the Fund’s Charter Communications position at an attractive valuation as investor sentiment regarding cable television providers soured somewhat amid merger and acquisition (M&A) rumors.
We also initiated a position in Bayer AG, which issued approximately $20 billion of debt in June to fund its acquisition of Monsanto. The combination of Bayer and Monsanto creates a leader in crop science and pharmaceuticals, industries that are expected to benefit from global trends such as an aging population in developed markets, as well as population and income growth in emerging markets. In addition to the large scale and diverse nature of Bayer’s business, we were attracted by the company’s significant free cash flow, large equity cushion, and ample liquidity. The company’s management is committed to rapidly delevering the balance sheet and returning the company to an A rating. Our firm’s substantial knowledge of this company, based on the 14 years we’ve held Bayer equity in the Dodge & Cox International Stock Fund, facilitated our ability to comprehensively research its creditworthiness. We believe investors are being adequately compensated for the risks of high initial leverage for the combined companies, upcoming patent expirations, and potential M&A integration challenges.
We remain constructive on the Fund’s credit holdings which, in our view, offer attractive long-term value relative to Treasuries. In general, fundamentals remain strong: corporate profitability is solid and the operating environment is healthy. There is sustained global growth, and the banking system remains well capitalized and liquid. That said, concerns about higher leverage, particularly in association with M&A activity, and macro uncertainty have weighed on credit spreads. We recognize certain factors could create volatility in credit markets (e.g., escalating trade tensions, geopolitical events, equity market volatility), but such short-term turbulence can provide opportunities as prices fluctuate. Our rigorous, downside-focused underwriting process is designed to
PAGE 2 § DODGE & COX INCOME FUND
mitigate default risk, underpin the conviction necessary to maintain holdings through periods of stress, and facilitate the long-term compounding of incremental yield. The result is a credit portfolio that is significantly differentiated from the broad credit market. Demonstrating this fact, the Fund’s credit holdings offer a yield premium of 186 bps versus 116 bps for the broad investment-grade Credit Index.(i)
Securitized: A Source of Consistency, Liquidity, and Incremental Yield
The Fund’s holdings in the Securitized sector consist predominantly of Agency MBS, with a small position in AAA-rated asset-backed securities (ABS). As a group, these securities add incremental yield over Treasuries in the intermediate portion of the yield curve and, given their high credit quality and strong liquidity, provide ballast for the overall Fund portfolio. As with credit investments, we utilize in-house fundamental research on securities in this sector to identify attractive total return opportunities over a broad range of scenarios.
In the first half of the year, we added modestly to the Fund’s weighting (from 36% to 41%), slightly changing the composition of underlying Agency MBS holdings and also adding to ABS holdings. Within MBS, we added slightly to the Fund’s position in Ginnie Mae-guaranteed Home Equity Conversion Mortgages. These floating rate securities offer attractive spreads and low prepayment risk with high interest rate caps. We also reduced the Fund’s holdings of 15-year MBS and added to 30-year 4% coupon securities in response to changes in relative valuations. We continue to favor 30-year 4% and 4.5% MBS; their highly liquid and heterogeneous nature allows for deep security selection across various characteristics. Within ABS, we added to specific AAA-rated, floating rate ABS backed by 97% federally guaranteed student loans. These short-duration securities trade at attractive levels relative to ABS and MBS alternatives, and their floating rate coupon, based on LIBOR, adds a defensive duration element to the portfolio.
In the MBS market, the Fed’s well-telegraphed, ongoing balance sheet reduction process, which began in October 2017, is expected to reach its maximum runoff target of $20 billion of MBS per month by the end of the year. While well organized, this process presents a potential supply headwind with the possibility of incremental spread widening. We will continue to evaluate opportunities and risks in the MBS market as the Fed’s policy normalizes.
Defensive Duration: Mitigating Interest Rate Risk
We continue to position the Fund defensively with regard to interest rate risk, with a duration of 4.4 years (equal to 73% of the Bloomberg Barclays U.S. Agg’s duration). This represents a slightly less defensive duration position versus the end of 2017—a change we made by reducing the Fund’s short position in Treasury futures and extending certain short-duration Treasuries into the intermediate part of the curve as the gap has narrowed somewhat between market expectations for the pace of future federal funds rate increases (implied by the forward curve) and the Fed’s stated
expectations. Despite the narrower gap and the Fed’s recent federal funds rate hikes, we continue to believe that a shorter relative duration is prudent. The significant tightening in measures of unemployment is likely to lead to higher wages. Coupled with stimulative tax and spending measures, the prospects for more rapid economic growth and somewhat higher inflation have risen. Keeping in mind the Fed’s dual mandate of full employment and stable inflation, these factors should keep the Fed nudging short-term rates higher and add upward pressure on longer-term rates.
IN CLOSING
While we are pleased with the Fund’s relative results, we continue to encourage shareholders to temper near-term total return expectations for bonds. The first half of 2018, in which the broad bond market was down 1.6%, illustrates the potential for low, and even negative, bond market returns over shorter time periods. That said, we are optimistic about the long-term prospects for the Fund. Bonds serve a vital defensive role in a diversified portfolio by offering liquidity, income generation, downside protection, and low correlation to riskier asset classes.
We continue to position the Fund defensively from a capital preservation standpoint, while seeking opportunities to build portfolio yield through our bottom-up, research-driven investment approach. Thank you for your continued confidence in our firm. As always, we welcome your comments and questions.
For the Board of Trustees,
| | |
| | |
Charles F. Pohl, Chairman | | Dana M. Emery, President |
August 1, 2018
| (a) | | One basis point (bps) is equal to 1/100th of one percent. |
| (b) | | Sector returns as calculated and reported by Bloomberg. |
| (c) | | Duration is a measure of a bond’s (or a bond portfolio’s) price sensitivity to changes in interest rates. |
| (d) | | Yield premiums are one way to measure a security’s valuation. Narrowing yield premiums result in a higher valuation. Widening yield premiums result in a lower valuation. |
| (e) | | The U.S. Government does not guarantee the Fund’s shares, yield, or net asset value. The agency guarantee (by, for example, Ginnie Mae, Fannie Mae, or Freddie Mac) does not eliminate market risk. |
| (f) | | Unless otherwise specified, all weightings and characteristics are as of June 30, 2018. |
| (g) | | The use of specific examples does not imply that they are more or less attractive investments than the Fund’s other holdings. |
| (h) | | A make-whole call provision is a call provision attached to a bond, whereby the borrower must make a payment to the lender in an amount equal to the net present value of the coupon payments that the lender will forgo if the borrower pays the bonds off early. |
| (i) | | Credit Index refers to the Bloomberg Barclays U.S. Credit Index. |
DODGE & COX INCOME FUND §PAGE 3
YEAR-TO-DATE PERFORMANCE REVIEW
The Fund outperformed the Bloomberg Barclays U.S. Agg by 0.4 percentage points year to date.
Key Contributors to Relative Results
| | § | | The Fund’s shorter relative duration (71% of the Bloomberg Barclays U.S. Agg’s duration) added significantly to relative returns. | |
| | § | | Security selection within credit was positive as several holdings performed well, particularly Bank of America capital securities, which outperformed due to redemption by the issuer at a premium to the market price. Other outperformers included Macy’s, Rio Oil Finance Trust, and Verizon. | |
Key Detractors from Relative Results
| | § | | The Fund’s overweight to corporate bonds and underweight to U.S. Treasuries detracted from relative returns given the poor performance of credit. | |
| | § | | Certain non-U.S. domiciled holdings underperformed, including HSBC, Pemex, and Telecom Italia. | |
KEY CHARACTERISTICS OF DODGE & COX
Independent Organization
Dodge & Cox is one of the largest privately owned investment managers in the world. We remain committed to independence, with a goal of providing the highest quality investment management service to our existing clients.
Over 85 Years of Investment Experience
Dodge & Cox was founded in 1930. We have a stable and well-qualified team of investment professionals, most of whom have spent their entire careers at Dodge & Cox.
Experienced Investment Team
The U.S. Fixed Income Investment Committee, which is the decision-making body for the Income Fund, is a ten-member committee with an average tenure at Dodge & Cox of 21 years.
One Business with a Single Research Office
Dodge & Cox manages equity (domestic, international, and global), fixed income (domestic and global), and balanced investments, operating from one office in San Francisco.
Consistent Investment Approach
Our team decision-making process involves thorough, bottom-up fundamental analysis of each investment.
Long-Term Focus and Low Expenses
We invest with a three- to five-year investment horizon, which has historically resulted in low turnover relative to our peers. We manage Funds that maintain low expense ratios.
Risks: The Fund invests in individual bonds whose yields and market values fluctuate, so that an investment may be worth more or less than its original cost. Debt securities are subject to interest rate risk, credit risk, and prepayment and call risk, all of which could have adverse effects on the value of the Fund. A low interest rate environment creates an elevated risk of future negative returns. Financial intermediaries may restrict their market making activities for certain debt securities, which may reduce the liquidity and increase the volatility of such securities. Please read the prospectus and summary prospectus for specific details regarding the Fund’s risk profile.
PAGE 4 § DODGE & COX INCOME FUND
GROWTH OF $10,000 OVER 10 YEARS
FOR AN INVESTMENT MADE ON JUNE 30, 2008
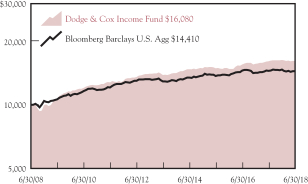
AVERAGE ANNUAL TOTAL RETURN
FOR PERIODS ENDED JUNE 30, 2018
| | | | | | | | | | | | | | | | |
| | | 1 Year | | | 5 Years | | | 10 Years | | | 20 Years | |
Dodge & Cox Income Fund | | | 0.37 | % | | | 3.09 | % | | | 4.86 | % | | | 5.24 | % |
Bloomberg Barclays U.S. Aggregate Bond Index (Bloomberg Barclays U.S. Agg) | | | –0.40 | | | | 2.27 | | | | 3.72 | | | | 4.70 | |
Returns represent past performance and do not guarantee future results. Investment return and share price will fluctuate with market conditions, and investors may have a gain or loss when shares are sold. Fund performance changes over time and currently may be significantly lower than stated. Performance is updated and published monthly. Visit the Fund’s website at dodgeandcox.com or call 800-621-3979 for current performance figures.
The Fund’s total returns include the reinvestment of dividend and capital gain distributions, but have not been adjusted for any income taxes payable by shareholders on these distributions or on Fund share redemptions. Index returns include interest income but, unlike Fund returns, do not reflect fees or expenses. The Bloomberg Barclays U.S. Aggregate Bond Index (Bloomberg Barclays U.S. Agg) is a widely recognized, unmanaged index of U.S. dollar-denominated, investment-grade, taxable debt securities.
Bloomberg is a registered trademark of Bloomberg Finance L.P. and its affiliates. Barclays® is a trademark of Barclays Bank PLC.
FUND EXPENSE EXAMPLE
As a Fund shareholder, you incur ongoing Fund costs, including management fees and other Fund expenses. All mutual funds have ongoing costs, sometimes referred to as operating expenses. The following example shows ongoing costs of investing in the Fund and can help you understand these costs and compare them with those of other mutual funds. The example assumes a $1,000 investment held for the six months indicated.
ACTUAL EXPENSES
The first line of the table below provides information about actual account values and expenses based on the Fund’s actual returns. You may use the information in this line, together with your account balance, to estimate the expenses that you paid over the period. Simply divide your account value by $1,000 (for example, an $8,600 account value divided by $1,000 = 8.6), then multiply the result by the number in the first line under the heading “Expenses Paid During Period” to estimate the expenses you paid on your account during this period.
HYPOTHETICAL EXAMPLE FOR COMPARISON WITH OTHER MUTUAL FUNDS
Information on the second line of the table can help you compare ongoing costs of investing in the Fund with those of other mutual funds. This information may not be used to estimate the actual ending account balance or expenses you paid during the period. The hypothetical “Ending Account Value” is based on the actual expense ratio of the Fund and an assumed 5% annual rate of return before expenses (not the Fund’s actual return). The amount under the heading “Expenses Paid During Period” shows the hypothetical expenses your account would have incurred under this scenario. You can compare this figure with the 5% hypothetical examples that appear in shareholder reports of other mutual funds.
| | | | | | | | | | | | |
Six Months Ended June 30, 2018 | | Beginning Account Value
1/1/2018 | | | Ending Account Value
6/30/2018 | | | Expenses Paid
During Period* | |
Based on Actual Fund Return | | $ | 1,000.00 | | | $ | 987.70 | | | $ | 2.10 | |
Based on Hypothetical 5% Yearly Return | | | 1,000.00 | | | | 1,022.68 | | | | 2.14 | |
| * | | Expenses are equal to the Fund’s annualized expense ratio of 0.43%, multiplied by the average account value over the period, multiplied by 181/365 (to reflect the one-half year period). |
The expenses shown in the table highlight ongoing costs only and do not reflect any transactional fees or account maintenance fees. Though other mutual funds may charge such fees, please note that the Fund does not charge transaction fees (e.g., redemption fees, sales loads) or universal account maintenance fees (e.g., small account fees).
DODGE & COX INCOME FUND §PAGE 5
| | | | |
| FUND INFORMATION (unaudited) | | | June 30, 2018 | |
| | | | |
| GENERAL INFORMATION | | | |
Net Asset Value Per Share | | | $13.37 | |
Total Net Assets (billions) | | | $56.3 | |
Expense Ratio | | | 0.43% | |
Portfolio Turnover Rate (1/1/18 to 6/30/18, unannualized) | | | 19% | |
30-Day SEC Yield(a) | | | 3.21% | |
Number of Credit Issuers | | | 52 | |
Fund Inception | | | 1989 | |
No sales charges or distribution fees | | | | |
Investment Manager: Dodge & Cox, San Francisco. Managed by the U.S. Fixed Income Investment Committee, whose ten members’ average tenure at Dodge & Cox is 21 years.
| | | | | | | | |
| PORTFOLIO CHARACTERISTICS | | Fund | | | BBG Barclays
U.S. Agg | |
Effective Duration (years)(b) | | | 4.4 | | | | 6.0 | |
| | | | |
| FIVE LARGEST CREDIT ISSUERS (%)(c) | | Fund | |
Charter Communications, Inc. | | | 2.6 | |
Petroleos Mexicanos | | | 1.8 | |
State of California GO | | | 1.7 | |
Cox Enterprises, Inc. | | | 1.5 | |
Wells Fargo & Co. | | | 1.5 | |
| | | | | | | | |
| CREDIT QUALITY (%)(d) | | Fund | | | BBG Barclays
U.S. Agg | |
U.S. Treasury/Agency/GSE(e) | | | 51.4 | | | | 68.3 | |
Aaa | | | 3.3 | | | | 4.3 | |
Aa | | | 5.3 | | | | 3.2 | |
A | | | 4.1 | | | | 11.0 | |
Baa | | | 27.5 | | | | 13.2 | |
Ba | | | 6.5 | | | | 0.0 | |
B | | | 0.0 | | | | 0.0 | |
Caa | | | 0.0 | | | | 0.0 | |
Net Cash & Other(g) | | | 1.9 | | | | 0.0 | |
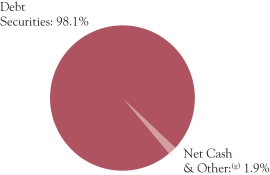
| | | | | | | | |
| SECTOR DIVERSIFICATION (%) | | Fund | | | BBG Barclays
U.S. Agg | |
U.S. Treasury(e) | | | 17.4 | | | | 37.8 | |
Government-Related(f) | | | 6.0 | | | | 6.6 | |
Securitized | | | 40.6 | | | | 30.6 | |
Corporate | | | 34.1 | | | | 25.0 | |
Net Cash & Other(g) | | | 1.9 | | | | 0.0 | |
| | | | | | | | |
| MATURITY DIVERSIFICATION (%)(e) | | Fund | | | BBG Barclays
U.S. Agg | |
0-1 Years to Maturity | | | 4.9 | | | | 0.0 | |
1-5 | | | 34.6 | | | | 39.6 | |
5-10 | | | 44.1 | | | | 44.4 | |
10-15 | | | 2.3 | | | | 1.5 | |
15-20 | | | 4.5 | | | | 2.4 | |
20-25 | | | 3.6 | | | | 4.0 | |
25 and Over | | | 6.0 | | | | 8.1 | |
| (a) | SEC Yield is an annualization of the Fund’s net investment income for the trailing 30-day period. Dividends paid by the Fund may be higher or lower than implied by the SEC Yield. |
| (b) | Interest rate derivatives reduce total Fund duration by 0.1 years (i.e., total Fund duration is 4.5 years without derivatives). |
| (c) | The Fund’s portfolio holdings are subject to change without notice. The mention of specific securities is not a recommendation to buy, sell, or hold any particular security and is not indicative of Dodge & Cox’s current or future trading activity. |
| (d) | The credit quality distributions shown for the Fund and the Index are based on the middle of Moody’s, S&P, and Fitch ratings, which is the methodology used by Bloomberg in constructing its indices. If a security is rated by only two agencies, the lower of the two ratings is used. Please note the Fund applies the highest of Moody’s, S&P, and Fitch ratings to determine compliance with the quality requirements stated in its prospectus. On that basis, the Fund held 2.9% in securities rated below investment grade. The credit quality of the investments in the portfolio does not apply to the stability or safety of the Fund or its shares. |
| (e) | Data as presented excludes the Fund’s position in Treasury futures contracts. |
| (f) | The portfolio’s Government-Related holdings include tax-exempt municipal securities; the Index classifies these securities as Municipal Bonds. |
| (g) | Net Cash & Other includes cash, short-term investments, derivatives, receivables, and payables. |
PAGE 6 § DODGE & COX INCOME FUND
| | | | |
| PORTFOLIO OF INVESTMENTS (unaudited) | | | June 30, 2018 | |
| | | | | | | | |
| DEBT SECURITIES: 98.1% | | | | | | |
| | |
| | | PAR VALUE | | | VALUE | |
| U.S. TREASURY: 17.4% | | | | | | | | |
U.S. Treasury Note/Bond | | | | | | | | |
1.50%, 2/28/19 | | $ | 496,995,000 | | | $ | 494,568,268 | |
1.25%, 4/30/19 | | | 300,000,000 | | | | 297,339,843 | |
1.625%, 7/31/19 | | | 600,000,000 | | | | 595,054,686 | |
0.875%, 9/15/19 | | | 600,000,000 | | | | 589,007,814 | |
1.375%, 12/15/19 | | | 165,000,000 | | | | 162,415,430 | |
1.625%, 12/31/19 | | | 500,000,000 | | | | 493,750,000 | |
1.875%, 12/31/19 | | | 500,000,000 | | | | 495,546,875 | |
1.375%, 1/15/20 | | | 250,000,000 | | | | 245,781,250 | |
1.50%, 5/31/20 | | | 175,000,000 | | | | 171,623,046 | |
1.625%, 6/30/20 | | | 200,000,000 | | | | 196,445,312 | |
1.375%, 9/15/20 | | | 600,000,000 | | | | 584,789,064 | |
1.75%, 11/15/20 | | | 350,000,000 | | | | 343,300,783 | |
2.00%, 1/15/21 | | | 500,000,000 | | | | 492,636,720 | |
2.25%, 2/15/21 | | | 951,780,000 | | | | 943,340,386 | |
2.375%, 4/15/21 | | | 875,275,000 | | | | 869,599,384 | |
2.625%, 5/15/21 | | | 400,000,000 | | | | 399,984,376 | |
1.375%, 5/31/21 | | | 450,000,000 | | | | 434,250,000 | |
1.125%, 7/31/21 | | | 250,000,000 | | | | 238,867,188 | |
2.00%, 12/31/21 | | | 165,000,000 | | | | 161,306,836 | |
1.875%, 7/31/22 | | | 200,000,000 | | | | 193,570,312 | |
2.75%, 4/30/23 | | | 568,030,000 | | | | 568,407,206 | |
2.75%, 5/31/23 | | | 400,000,000 | | | | 400,359,376 | |
2.625%, 6/30/23 | | | 400,000,000 | | | | 397,937,500 | |
| | | | | | | | |
| | | | | | | 9,769,881,655 | |
| GOVERNMENT-RELATED: 6.0% | |
FEDERAL AGENCY: 0.1% | | | | | | | | |
Small Business Admin.—504 Program | | | | | | | | |
Series 1998-20H 1, 6.15%, 8/1/18 | | | 27,842 | | | | 27,890 | |
Series 1998-20L 1, 5.80%, 12/1/18 | | | 14,599 | | | | 14,669 | |
Series 1999-20C 1, 6.30%, 3/1/19 | | | 20,200 | | | | 20,316 | |
Series 1999-20E 1, 6.30%, 5/1/19 | | | 679 | | | | 682 | |
Series 1999-20G 1, 7.00%, 7/1/19 | | | 59,886 | | | | 60,552 | |
Series 1999-20I 1, 7.30%, 9/1/19 | | | 31,924 | | | | 32,382 | |
Series 2000-20C 1, 7.625%, 3/1/20 | | | 2,062 | | | | 2,106 | |
Series 2000-20G 1, 7.39%, 7/1/20 | | | 1,672 | | | | 1,705 | |
Series 2001-20G 1, 6.625%, 7/1/21 | | | 436,645 | | | | 448,308 | |
Series 2001-20L 1, 5.78%, 12/1/21 | | | 923,315 | | | | 944,369 | |
Series 2002-20A 1, 6.14%, 1/1/22 | | | 7,883 | | | | 8,132 | |
Series 2002-20L 1, 5.10%, 12/1/22 | | | 284,817 | | | | 292,041 | |
Series 2003-20G 1, 4.35%, 7/1/23 | | | 24,958 | | | | 25,492 | |
Series 2004-20L 1, 4.87%, 12/1/24 | | | 574,465 | | | | 590,890 | |
Series 2005-20B 1, 4.625%, 2/1/25 | | | 1,170,506 | | | | 1,196,455 | |
Series 2005-20D 1, 5.11%, 4/1/25 | | | 42,430 | | | | 43,731 | |
Series 2005-20E 1, 4.84%, 5/1/25 | | | 1,739,610 | | | | 1,783,837 | |
Series 2005-20G 1, 4.75%, 7/1/25 | | | 2,020,547 | | | | 2,068,503 | |
Series 2005-20H 1, 5.11%, 8/1/25 | | | 22,429 | | | | 23,104 | |
Series 2005-20I 1, 4.76%, 9/1/25 | | | 2,354,678 | | | | 2,412,331 | |
Series 2006-20A 1, 5.21%, 1/1/26 | | | 2,121,099 | | | | 2,189,660 | |
Series 2006-20B 1, 5.35%, 2/1/26 | | | 642,438 | | | | 665,236 | |
Series 2006-20C 1, 5.57%, 3/1/26 | | | 2,905,205 | | | | 3,021,849 | |
Series 2006-20G 1, 6.07%, 7/1/26 | | | 5,250,971 | | | | 5,490,135 | |
Series 2006-20H 1, 5.70%, 8/1/26 | | | 44,073 | | | | 45,831 | |
Series 2006-20I 1, 5.54%, 9/1/26 | | | 81,723 | | | | 84,975 | |
Series 2006-20J 1, 5.37%, 10/1/26 | | | 1,926,676 | | | | 1,996,887 | |
Series 2006-20L 1, 5.12%, 12/1/26 | | | 1,814,912 | | | | 1,873,401 | |
Series 2007-20A 1, 5.32%, 1/1/27 | | | 3,683,519 | | | | 3,803,930 | |
Series 2007-20C 1, 5.23%, 3/1/27 | | | 5,842,280 | | | | 6,006,429 | |
Series 2007-20D 1, 5.32%, 4/1/27 | | | 6,075,015 | | | | 6,268,649 | |
Series 2007-20G 1, 5.82%, 7/1/27 | | | 4,031,700 | | | | 4,201,898 | |
| | | | | | | | |
| | | | | | | 45,646,375 | |
FOREIGN AGENCY: 2.1% | | | | | | | | |
Petroleo Brasileiro SA (Brazil) | | | | | | | | |
6.25%, 3/17/24 | | | 31,505,000 | | | | 31,237,208 | |
5.999%, 1/27/28(b) | | | 169,135,000 | | | | 153,067,175 | |
| | | | | | | | |
| | |
| | | PAR VALUE | | | VALUE | |
Petroleos Mexicanos (Mexico) | | | | | | | | |
4.875%, 1/18/24 | | $ | 123,065,000 | | | $ | 121,486,076 | |
6.875%, 8/4/26 | | | 120,490,000 | | | | 126,634,990 | |
6.50%, 3/13/27 | | | 177,800,000 | | | | 181,889,400 | |
6.625%, 6/15/35 | | | 112,290,000 | | | | 109,763,475 | |
6.375%, 1/23/45 | | | 166,156,000 | | | | 153,029,676 | |
6.75%, 9/21/47 | | | 140,341,000 | | | | 133,394,120 | |
6.35%, 2/12/48(b) | | | 192,270,000 | | | | 174,004,350 | |
| | | | | | | | |
| | | | | | | 1,184,506,470 | |
LOCAL AUTHORITY: 3.8% | | | | | | | | |
L.A. Unified School District GO | | | | | | | | |
5.75%, 7/1/34 | | | 6,075,000 | | | | 7,365,573 | |
6.758%, 7/1/34 | | | 185,585,000 | | | | 245,454,721 | |
New Jersey Turnpike Authority RB | | | | | | | | |
7.414%, 1/1/40 | | | 41,065,000 | | | | 59,722,061 | |
7.102%, 1/1/41 | | | 148,277,000 | | | | 208,690,981 | |
New Valley Generation
| | | | | | | | |
4.929%, 1/15/21 | | | 197,230 | | | | 203,820 | |
State of California GO | | | | | | | | |
7.50%, 4/1/34 | | | 194,406,000 | | | | 273,041,283 | |
7.55%, 4/1/39 | | | 146,605,000 | | | | 216,189,597 | |
7.30%, 10/1/39 | | | 208,455,000 | | | | 295,339,044 | |
7.625%, 3/1/40 | | | 119,575,000 | | | | 176,353,993 | |
State of Illinois GO | | | | | | | | |
5.877%, 3/1/19 | | | 120,575,000 | | | | 122,711,589 | |
5.00%, 11/1/20 | | | 145,585,000 | | | | 151,213,316 | |
5.00%, 11/1/21 | | | 117,990,000 | | | | 123,801,008 | |
5.10%, 6/1/33 | | | 306,400,000 | | | | 289,964,704 | |
| | | | | | | | |
| | | | | | | 2,170,051,690 | |
| | | | | | | | |
| | | | | | | 3,400,204,535 | |
| SECURITIZED: 40.6% | | | | | | | | |
ASSET-BACKED: 6.7% | | | | | | | | |
Auto Loan: 0.5% | | | | | | | | |
Ford Credit Auto Owner Trust | | | | | | | | |
Series 2015-REV1 A,
2.12%, 7/15/26(b) | | | 207,826,000 | | | | 205,032,029 | |
Series 2017-REV1 A,
2.62%, 8/15/28(b) | | | 26,054,000 | | | | 25,512,348 | |
Series 2017-REV2 A,
2.36%, 3/15/29(b) | | | 54,874,000 | | | | 52,916,979 | |
| | | | | | | | |
| | | | | | | 283,461,356 | |
Credit Card: 1.0% | | | | | | | | |
American Express Master Trust | | | | | | | | |
Series 2017-3 A, 1.77%, 4/15/20 | | | 185,705,000 | | | | 182,070,920 | |
Series 2017-4 A, 1.64%, 12/15/21 | | | 21,942,000 | | | | 21,753,180 | |
Series 2017-6 A, 2.04%, 5/15/23 | | | 59,190,000 | | | | 57,995,007 | |
Bank of America Credit Card Trust
| | | | | | | | |
Series 2018-A1 A1, 2.70%, 7/17/23 | | | 224,513,000 | | | | 223,133,458 | |
Chase Issuance Trust
| | | | | | | | |
Series 2012-A4 A4, 1.58%, 8/16/21 | | | 14,693,000 | | | | 14,508,368 | |
Citibank Credit Card Issuance Trust
| | | | | | | | |
Series 2018-A1 A1, 2.49%, 1/20/23 | | | 59,944,000 | | | | 59,186,182 | |
| | | | | | | | |
| | | | | | | 558,647,115 | |
Other: 1.4% | | | | | | | | |
Rio Oil Finance Trust (Brazil) | | | | | | | | |
9.25%, 7/6/24(b) | | | 421,836,126 | | | | 451,364,655 | |
9.75%, 1/6/27(b) | | | 243,796,693 | | | | 261,291,543 | |
8.20%, 4/6/28(b) | | | 66,400,000 | | | | 67,263,200 | |
| | | | | | | | |
| | | | | | | 779,919,398 | |
Student Loan: 3.8% | | | | | | | | |
Navient Student Loan Trust
USD LIBOR 1-Month | | | | | | | | |
+1.25%, 3.341%, 6/25/65(b) | | | 102,781,468 | | | | 105,482,144 | |
+1.15%, 3.241%, 3/25/66(b) | | | 56,703,718 | | | | 57,768,693 | |
| | |
| See accompanying Notes to Financial Statements | | DODGE & COX INCOME FUND §PAGE 7 |
| | | | |
| PORTFOLIO OF INVESTMENTS (unaudited) | | | June 30, 2018 | |
| | | | | | | | |
| DEBT SECURITIES (continued) | |
| | |
| | | PAR VALUE | | | VALUE | |
+1.30%, 3.391%, 3/25/66(b) | | $ | 123,350,000 | | | $ | 127,913,753 | |
+0.80%, 2.891%, 7/26/66(b) | | | 151,345,786 | | | | 152,741,845 | |
+1.05%, 3.141%, 7/26/66(b) | | | 254,268,000 | | | | 260,076,879 | |
+1.15%, 3.241%, 7/26/66(b) | | | 218,262,000 | | | | 223,570,481 | |
+1.00%, 3.091%, 9/27/66(b) | | | 114,564,000 | | | | 117,002,540 | |
+1.05%, 3.141%, 12/27/66(b) | | | 88,043,339 | | | | 89,378,111 | |
+0.72%, 2.811%, 3/25/67(b) | | | 87,370,000 | | | | 87,637,571 | |
+0.80%, 2.888%, 3/25/67(b) | | | 133,798,000 | | | | 133,798,000 | |
+0.70%, 2.791%, 2/25/70(b) | | | 217,372,164 | | | | 218,182,875 | |
Navient Student Loan Trust
(Private Loans) | | | | | | | | |
Series 2014-AA A2A,
2.74%, 2/15/29(b) | | | 23,919,513 | | | | 23,581,875 | |
Series 2017-A A2A, 2.88%, 12/16/58(b) | | | 31,000,000 | | | | 30,193,064 | |
SLM Student Loan Trust
USD LIBOR 3-Month | | | | | | | | |
+0.17%, 2.53%, 7/25/40 | | | 13,626,000 | | | | 13,143,986 | |
+0.75%, 3.11%, 10/25/40 | | | 78,120,000 | | | | 78,112,399 | |
+0.60%, 2.96%, 1/25/41 | | | 124,361,000 | | | | 124,620,579 | |
+0.55%, 2.91%, 10/25/64(b) | | | 6,718,000 | | | | 6,693,132 | |
+0.55%, 2.91%, 10/25/64(b) | | | 47,950,000 | | | | 47,772,503 | |
SLM Student Loan Trust (Private Loans) | | | | | | | | |
Series 2013-A A2A, 1.77%, 5/17/27(b) | | | 23,793,159 | | | | 23,694,905 | |
Series 2012-B A2, 3.48%, 10/15/30(b) | | | 789,664 | | | | 790,013 | |
Series 2013-C A2A, 2.94%, 10/15/31(b) | | | 18,953,856 | | | | 18,984,853 | |
Series 2012-E A2A, 2.09%, 6/15/45(b) | | | 4,665,378 | | | | 4,653,536 | |
Series 2012-C A2, 3.31%, 10/15/46(b) | | | 11,105,307 | | | | 11,114,378 | |
SMB Private Education Loan Trust (Private Loans) | | | | | | | | |
Series 2017-A A2A, 2.88%, 9/15/34(b) | | | 26,811,000 | | | | 26,248,543 | |
Series 2017-B A2A, 2.82%, 10/15/35(b) | | | 26,946,000 | | | | 26,181,989 | |
Series 2018-A A2A, 3.50%, 2/15/36(b) | | | 50,000,000 | | | | 49,967,170 | |
Series 2018-B A2A, 3.60%, 1/15/37(b) | | | 68,386,000 | | | | 68,652,370 | |
| | | | | | | | |
| | | | | | | 2,127,958,187 | |
| | | | | | | | |
| | | | | | | 3,749,986,056 | |
CMBS: 0.2% | | | | | | | | |
Agency CMBS: 0.2% | | | | | | | | |
Fannie Mae Multifamily DUS | | | | | | | | |
Pool AL6028, 2.70%, 7/1/21 | | | 2,252,722 | | | | 2,229,050 | |
Pool AL6455, 2.765%, 11/1/21 | | | 9,283,719 | | | | 9,267,030 | |
Pool AL6445, 2.50%, 1/1/22 | | | 5,940,650 | | | | 5,827,099 | |
Freddie Mac Multifamily Interest Only | | | | | | | | |
Series K055 X1, 1.501%, 3/25/26(e) | | | 119,572,468 | | | | 10,329,017 | |
Series K056 X1, 1.401%, 5/25/26(e) | | | 41,457,993 | | | | 3,347,625 | |
Series K057 X1, 1.326%, 7/25/26(e) | | | 44,320,216 | | | | 3,448,521 | |
Series K064 X1, 0.744%, 3/25/27(e) | | | 106,857,680 | | | | 4,834,915 | |
Series K065 X1, 0.815%, 4/25/27(e) | | | 480,184,915 | | | | 24,212,700 | |
Series K066 X1, 0.891%, 6/25/27(e) | | | 383,951,383 | | | | 21,715,753 | |
Series K067 X1, 0.714%, 7/25/27(e) | | | 481,206,323 | | | | 21,718,285 | |
Series K069 X1, 0.497%, 9/25/27(e) | | | 101,135,883 | | | | 3,096,548 | |
Series K070 X1, 0.457%, 11/25/27(e) | | | 122,097,927 | | | | 3,384,664 | |
Series K154 X1, 0.45%, 11/25/32(e) | | | 295,619,525 | | | | 9,616,828 | |
| | | | | | | | |
| | | | | | | 123,028,035 | |
| | | | | | | | |
| | |
| | | PAR VALUE | | | VALUE | |
MORTGAGE-RELATED: 33.7% | | | | | | | | |
Federal Agency CMO & REMIC: 5.1% | |
Dept. of Veterans Affairs | | | | | | | | |
Series 1995-2D 4A, 9.293%, 5/15/25 | | $ | 83,591 | | | $ | 94,436 | |
Series 1997-2 Z, 7.50%, 6/15/27 | | | 6,225,159 | | | | 6,833,276 | |
Series 1998-2 2A, 8.724%, 8/15/27(e) | | | 17,346 | | | | 19,245 | |
Series 1998-1 1A, 8.293%, 3/15/28(e) | | | 119,497 | | | | 130,355 | |
Fannie Mae | | | | | | | | |
Trust 1998-58 PX, 6.50%, 9/25/28 | | | 234,579 | | | | 253,999 | |
Trust 1998-58 PC, 6.50%, 10/25/28 | | | 1,270,724 | | | | 1,379,338 | |
Trust 2001-69 PQ, 6.00%, 12/25/31 | | | 1,574,290 | | | | 1,724,882 | |
Trust 2002-33 A1, 7.00%, 6/25/32 | | | 1,765,219 | | | | 2,015,391 | |
Trust 2002-69 Z, 5.50%, 10/25/32 | | | 206,651 | | | | 222,709 | |
Trust 2008-24 GD, 6.50%, 3/25/37 | | | 741,100 | | | | 794,956 | |
Trust 2007-47 PE, 5.00%, 5/25/37 | | | 2,673,584 | | | | 2,827,212 | |
Trust 2009-53 QM, 5.50%, 5/25/39 | | | 953,406 | | | | 985,359 | |
Trust 2009-30 AG, 6.50%, 5/25/39 | | | 7,039,853 | | | | 7,590,726 | |
Trust 2009-40 TB, 6.00%, 6/25/39 | | | 2,779,551 | | | | 2,951,518 | |
Trust 2010-123 WT, 7.00%, 11/25/40 | | | 29,791,540 | | | | 33,464,021 | |
Trust 2001-T3 A1, 7.50%, 11/25/40 | | | 100,628 | | | | 112,799 | |
Trust 2001-T7 A1, 7.50%, 2/25/41 | | | 58,636 | | | | 66,368 | |
Trust 2001-T5 A2, 7.00%, 6/19/41(e) | | | 38,600 | | | | 42,368 | |
Trust 2001-T5 A3, 7.50%, 6/19/41(e) | | | 188,092 | | | | 210,015 | |
Trust 2011-58 AT, 4.00%, 7/25/41 | | | 7,870,585 | | | | 8,085,908 | |
Trust 2001-T4 A1, 7.50%, 7/25/41 | | | 1,681,979 | | | | 1,914,496 | |
Trust 2001-T10 A1, 7.00%, 12/25/41 | | | 1,948,670 | | | | 2,210,659 | |
Trust 2013-106 MA, 4.00%, 2/25/42 | | | 17,455,753 | | | | 17,792,650 | |
Trust 2002-90 A1, 6.50%, 6/25/42 | | | 4,008,102 | | | | 4,493,649 | |
Trust 2002-W6 2A1, 7.00%, 6/25/42(e) | | | 2,253,749 | | | | 2,425,099 | |
Trust 2002-W8 A2, 7.00%, 6/25/42 | | | 1,285,118 | | | | 1,453,957 | |
Trust 2003-W2 1A2, 7.00%, 7/25/42 | | | 6,638,510 | | | | 7,457,287 | |
Trust 2002-T16 A3, 7.50%, 7/25/42 | | | 3,004,106 | | | | 3,440,311 | |
Trust 2003-W4 3A, 7.00%, 10/25/42(e) | | | 1,905,595 | | | | 2,056,362 | |
Trust 2012-121 NB, 7.00%, 11/25/42 | | | 971,762 | | | | 1,082,549 | |
Trust 2003-W1 2A, 5.963%, 12/25/42(e) | | | 2,400,780 | | | | 2,614,770 | |
Trust 2003-7 A1, 6.50%, 12/25/42 | | | 3,231,857 | | | | 3,559,452 | |
Trust 2004-T1 1A2, 6.50%, 1/25/44 | | | 2,000,064 | | | | 2,224,937 | |
Trust 2004-W2 2A2, 7.00%, 2/25/44 | | | 86,840 | | | | 96,880 | |
Trust 2004-W2 5A, 7.50%, 3/25/44 | | | 3,814,392 | | | | 4,208,704 | |
Trust 2004-W8 3A, 7.50%, 6/25/44 | | | 2,890,847 | | | | 3,275,525 | |
Trust 2004-W15 1A2, 6.50%, 8/25/44 | | | 687,134 | | | | 759,977 | |
Trust 2005-W1 1A3, 7.00%, 10/25/44 | | | 5,381,771 | | | | 6,061,539 | |
Trust 2001-79 BA, 7.00%, 3/25/45 | | | 602,332 | | | | 676,658 | |
Trust 2006-W1 1A1, 6.50%, 12/25/45 | | | 340,641 | | | | 379,945 | |
Trust 2006-W1 1A2, 7.00%, 12/25/45 | | | 2,460,950 | | | | 2,770,853 | |
Trust 2006-W1 1A3, 7.50%, 12/25/45 | | | 42,898 | | | | 49,290 | |
Trust 2006-W1 1A4, 8.00%, 12/25/45 | | | 2,906,712 | | | | 3,330,718 | |
| | |
| PAGE 8 § DODGE & COX INCOME FUND | | See accompanying Notes to Financial Statements |
| | | | |
| PORTFOLIO OF INVESTMENTS (unaudited) | | | June 30, 2018 | |
| | | | | | | | |
| DEBT SECURITIES (continued) | |
| | |
| | | PAR VALUE | | | VALUE | |
Trust 2007-W10 2A, 6.324%, 8/25/47(e) | | $ | 2,742,318 | | | $ | 2,931,339 | |
Trust 2007-W10 1A, 6.331%, 8/25/47(e) | | | 9,126,379 | | | | 9,765,247 | |
USD LIBOR 1-month | | | | | | | | |
+0.55%, 2.641%, 9/25/43 | | | 34,762,205 | | | | 35,182,863 | |
USD LIBOR 1-Month | | | | | | | | |
+0.40%, 2.491%, 7/25/44 | | | 1,406,144 | | | | 1,390,689 | |
Freddie Mac | | | | | | | | |
Series 3312 AB, 6.50%, 6/15/32 | | | 2,496,583 | | | | 2,754,544 | |
Series 2456 CJ, 6.50%, 6/15/32 | | | 162,974 | | | | 180,976 | |
Series T-41 2A, 5.50%, 7/25/32(e) | | | 219,797 | | | | 232,853 | |
Series 2587 ZU, 5.50%, 3/15/33 | | | 3,613,957 | | | | 3,869,992 | |
Series 2610 UA, 4.00%, 5/15/33 | | | 1,507,012 | | | | 1,526,912 | |
Series T-48 1A, 5.015%, 7/25/33(e) | | | 2,445,673 | | | | 2,533,845 | |
Series 2708 ZD, 5.50%, 11/15/33 | | | 14,289,707 | | | | 15,623,098 | |
Series 3204 ZM, 5.00%, 8/15/34 | | | 6,552,756 | | | | 6,911,809 | |
Series 3330 GZ, 5.50%, 6/15/37 | | | 1,337,981 | | | | 1,446,105 | |
Series 3427 Z, 5.00%, 3/15/38 | | | 2,819,812 | | | | 2,975,979 | |
Series T-51 1A, 6.50%, 9/25/43(e) | | | 55,716 | | | | 62,426 | |
Series 4283 DW, 4.50%, 12/15/43(e) | | | 76,025,547 | | | | 79,472,545 | |
Series 4283 EW, 4.50%, 12/15/43(e) | | | 44,683,173 | | | | 46,944,204 | |
Series 4281 BC, 4.50%, 12/15/43(e) | | | 125,284,704 | | | | 131,215,055 | |
Series 4319 MA, 4.50%, 3/15/44(e) | | | 24,805,038 | | | | 26,094,401 | |
USD LIBOR 1-month | | | | | | | | |
+0.53%, 2.603%, 8/15/43 | | | 63,685,531 | | | | 64,024,351 | |
Ginnie Mae | | | | | | | | |
USD LIBOR 1-Month | | | | | | | | |
+0.65%, 2.567%, 10/20/64 | | | 8,031,894 | | | | 8,090,291 | |
+0.63%, 2.547%, 4/20/65 | | | 11,485,620 | | | | 11,559,222 | |
+0.60%, 2.517%, 7/20/65 | | | 8,358,003 | | | | 8,402,307 | |
+0.60%, 2.517%, 8/20/65 | | | 7,925,281 | | | | 7,967,539 | |
+0.62%, 2.537%, 9/20/65 | | | 1,783,761 | | | | 1,794,974 | |
+0.75%, 2.667%, 11/20/65 | | | 31,788,619 | | | | 32,145,796 | |
+0.90%, 2.817%, 3/20/66 | | | 20,205,804 | | | | 20,575,881 | |
+0.90%, 2.817%, 4/20/66 | | | 21,223,106 | | | | 21,612,089 | |
+0.78%, 2.697%, 9/20/66 | | | 11,800,459 | | | | 11,957,090 | |
+0.75%, 2.667%, 10/20/66 | | | 54,838,763 | | | | 55,531,377 | |
+0.80%, 2.717%, 11/20/66 | | | 24,098,547 | | | | 24,463,026 | |
+0.81%, 2.727%, 12/20/66 | | | 13,731,629 | | | | 13,950,821 | |
+0.57%, 2.487%, 9/20/67 | | | 32,882,270 | | | | 33,195,723 | |
USD LIBOR 12-Month | | | | | | | | |
+0.30%, 2.026%, 9/20/66 | | | 20,161,334 | | | | 20,333,125 | |
+0.28%, 2.136%, 12/20/66 | | | 38,217,881 | | | | 38,438,257 | |
+0.30%, 2.26%, 1/20/67 | | | 97,974,702 | | | | 98,647,905 | |
+0.31%, 2.27%, 1/20/67 | | | 41,438,412 | | | | 41,734,395 | |
+0.25%, 2.513%, 2/20/67 | | | 20,421,105 | | | | 20,540,162 | |
+0.20%, 2.463%, 3/20/67 | | | 3,486,013 | | | | 3,496,648 | |
+0.30%, 2.797%, 4/20/67 | | | 24,701,199 | | | | 24,935,295 | |
+0.20%, 2.863%, 5/20/67 | | | 48,725,524 | | | | 48,999,912 | |
+0.30%, 2.963%, 5/20/67 | | | 21,614,738 | | | | 21,830,299 | |
+0.20%, 2.977%, 6/20/67 | | | 107,468,024 | | | | 108,211,424 | |
+0.20%, 1.93%, 8/20/67 | | | 23,930,003 | | | | 24,063,959 | |
+0.25%, 1.98%, 9/20/67 | | | 24,691,932 | | | | 24,861,939 | |
+0.27%, 2.02%, 9/20/67 | | | 71,433,032 | | | | 72,072,493 | |
+0.23%, 2.01%, 10/20/67 | | | 161,083,754 | | | | 162,152,029 | |
+0.23%, 2.01%, 10/20/67 | | | 77,395,513 | | | | 77,867,099 | |
+0.22%, 2.019%, 10/20/67 | | | 37,874,594 | | | | 38,053,809 | |
+0.25%, 2.03%, 10/20/67 | | | 50,054,636 | | | | 50,431,332 | |
+0.20%, 2.06%, 11/20/67 | | | 18,610,747 | | | | 18,683,645 | |
+0.22%, 2.06%, 11/20/67 | | | 22,165,980 | | | | 22,272,769 | |
+0.22%, 2.08%, 11/20/67 | | | 134,959,367 | | | | 135,740,512 | |
+0.18%, 2.12%, 12/20/67 | | | 35,040,561 | | | | 35,147,684 | |
+0.06%, 2.35%, 12/20/67 | | | 59,468,751 | | | | 59,322,095 | |
+0.15%, 2.25%, 1/20/68 | | | 16,345,726 | | | | 16,372,953 | |
+0.06%, 2.35%, 1/20/68 | | | 104,600,080 | | | | 104,342,858 | |
+0.08%, 2.37%, 1/20/68 | | | 49,563,797 | | | | 49,480,877 | |
| | | | | | | | |
| | |
| | | PAR VALUE | | | VALUE | |
+0.10%, 2.33%, 2/20/68 | | $ | 50,011,328 | | | $ | 50,009,897 | |
+0.10%, 2.37%, 2/20/68 | | | 102,561,124 | | | | 100,344,850 | |
+0.07%, 2.40%, 2/20/68 | | | 50,415,282 | | | | 50,312,304 | |
+0.15%, 2.45%, 2/20/68 | | | 34,030,374 | | | | 34,111,209 | |
+0.05%, 2.54%, 2/20/68 | | | 3,713,266 | | | | 3,705,303 | |
+0.04%, 2.56%, 2/20/68 | | | 54,798,042 | | | | 54,669,026 | |
+0.06%, 2.58%, 3/20/68 | | | 15,057,409 | | | | 15,049,105 | |
+0.04%, 2.60%, 3/20/68 | | | 92,024,602 | | | | 91,824,863 | |
+0.04%, 2.60%, 3/20/68 | | | 38,237,676 | | | | 38,172,304 | |
+0.05%, 2.71%, 3/20/68 | | | 47,710,360 | | | | 47,650,484 | |
+0.03%, 2.73%, 3/20/68 | | | 18,273,274 | | | | 18,239,892 | |
+0.02%, 2.72%, 4/20/68 | | | 27,186,533 | | | | 27,127,445 | |
+0.05%, 2.75%, 4/20/68 | | | 49,937,449 | | | | 49,925,439 | |
+0.05%, 2.75%, 4/20/68 | | | 43,502,101 | | | | 43,491,356 | |
+0.04%, 2.80%, 5/20/68 | | | 50,056,410 | | | | 50,030,220 | |
+0.15%, 2.86%, 6/20/68 | | | 46,773,000 | | | | 47,071,426 | |
| | | | | | | | |
| | | | | | | 2,870,295,115 | |
Federal Agency Mortgage Pass-Through: 28.5% | |
Fannie Mae, 15 Year
6.50%, 11/1/18-12/1/19 | | | 527 | | | | 530 | |
5.50%, 12/1/18-7/1/25 | | | 80,954,313 | | | | 84,070,905 | |
6.00%, 1/1/19-3/1/23 | | | 21,007,076 | | | | 21,710,420 | |
4.00%, 9/1/25 | | | 839,554 | | | | 841,371 | |
5.00%, 9/1/25 | | | 33,006,533 | | | | 34,333,152 | |
3.50%, 10/1/25-2/1/31 | | | 811,626,304 | | | | 822,680,790 | |
4.50%, 3/1/29 | | | 21,631,412 | | | | 22,249,099 | |
Fannie Mae, 20 Year
4.50%, 3/1/29 -1/1/34 | | | 399,050,391 | | | | 416,926,194 | |
4.00%, 9/1/30-3/1/37 | | | 1,851,196,671 | | | | 1,912,635,184 | |
3.50%, 11/1/35-4/1/37 | | | 432,778,743 | | | | 437,566,750 | |
Fannie Mae, 30 Year
6.00%, 11/1/28 -2/1/39 | | | 101,579,212 | | | | 111,942,917 | |
7.00%, 4/1/32-2/1/39 | | | 9,849,078 | | | | 10,959,544 | |
6.50%, 12/1/32-8/1/39 | | | 41,195,427 | | | | 45,860,247 | |
5.50%, 2/1/33-11/1/39 | | | 152,601,012 | | | | 165,682,526 | |
4.50%, 11/1/35-6/1/48 | | | 3,413,698,907 | | | | 3,569,898,373 | |
5.00%, 7/1/37-7/1/40 | | | 24,185,481 | | | | 25,725,461 | |
4.00%, 10/1/40-5/1/48 | | | 1,104,037,231 | | | | 1,127,735,082 | |
Fannie Mae, 40 Year
4.50%, 1/1/52-6/1/56 | | | 164,763,599 | | | | 172,950,656 | |
Fannie Mae, Hybrid ARM 1-Year U.S. Treasury CMT | | | | | | | | |
+2.14%, 3.53%, 10/1/33 | | | 1,496,637 | | | | 1,575,447 | |
+2.14%, 3.491%, 8/1/34 | | | 414,734 | | | | 436,041 | |
+1.97%, 3.182%, 9/1/34 | | | 1,647,345 | | | | 1,727,907 | |
+2.29%, 3.825%, 1/1/36 | | | 11,679,466 | | | | 12,320,690 | |
+2.12%, 4.246%, 7/1/36 | | | 63,457 | | | | 66,683 | |
+2.14%, 3.902%, 12/1/36 | | | 1,909,504 | | | | 2,005,631 | |
USD LIBOR 12-Month | | | | | | | | |
+1.67%, 3.803%, 7/1/34 | | | 1,792,817 | | | | 1,879,182 | |
+1.34%, 3.092%, 10/1/34 | | | 1,016,767 | | | | 1,055,120 | |
+1.94%, 3.704%, 1/1/35 | | | 825,549 | | | | 874,641 | |
+1.39%, 3.523%, 4/1/35 | | | 2,067,191 | | | | 2,146,014 | |
+1.75%, 4.254%, 6/1/35 | | | 619,971 | | | | 653,470 | |
+1.44%, 3.562%, 7/1/35 | | | 400,014 | | | | 415,057 | |
+1.40%, 3.846%, 7/1/35 | | | 785,168 | | | | 818,181 | |
+1.52%, 4.121%, 7/1/35 | | | 1,119,979 | | | | 1,171,355 | |
+1.75%, 4.27%, 7/1/35 | | | 1,116,444 | | | | 1,172,980 | |
+1.37%, 3.12%, 8/1/35 | | | 1,177,111 | | | | 1,220,359 | |
+1.42%, 3.165%, 8/1/35 | | | 3,668,982 | | | | 3,842,830 | |
+1.75%, 3.552%, 8/1/35 | | | 2,453,591 | | | | 2,587,720 | |
+1.77%, 3.517%, 9/1/35 | | | 1,681,344 | | | | 1,765,978 | |
+1.60%, 3.347%, 10/1/35 | | | 2,338,050 | | | | 2,451,328 | |
+1.75%, 3.498%, 10/1/35 | | | 1,251,371 | | | | 1,316,668 | |
+1.62%, 3.374%, 12/1/35 | | | 644,497 | | | | 672,908 | |
+1.62%, 3.369%, 1/1/36 | | | 2,097,600 | | | | 2,193,624 | |
| | |
| See accompanying Notes to Financial Statements | | DODGE & COX INCOME FUND §PAGE 9 |
| | | | |
| PORTFOLIO OF INVESTMENTS (unaudited) | | | June 30, 2018 | |
| | | | | | | | |
| DEBT SECURITIES (continued) | |
| | |
| | | PAR VALUE | | | VALUE | |
+1.71%, 3.573%, 1/1/36 | | $ | 3,524,628 | | | $ | 3,710,450 | |
+1.72%, 3.995%, 11/1/36 | | | 1,364,245 | | | | 1,435,353 | |
+1.74%, 3.493%, 12/1/36 | | | 795,183 | | | | 831,906 | |
+1.55%, 3.332%, 1/1/37 | | | 1,964,758 | | | | 2,043,144 | |
+2.02%, 3.851%, 2/1/37 | | | 3,520,906 | | | | 3,712,074 | |
+1.93%, 4.303%, 4/1/37 | | | 351,806 | | | | 372,748 | |
+1.19%, 2.94%, 8/1/37 | | | 113,487 | | | | 113,421 | |
+1.82%, 4.492%, 8/1/37 | | | 1,700,900 | | | | 1,794,139 | |
+1.48%, 3.619%, 11/1/37 | | | 477,397 | | | | 494,961 | |
+2.02%, 4.39%, 4/1/38 | | | 153,184 | | | | 157,367 | |
+1.73%, 3.844%, 5/1/38 | | | 113,831,868 | | | | 119,864,549 | |
+1.91%, 4.371%, 5/1/38 | | | 1,753,919 | | | | 1,853,281 | |
+1.88%, 3.627%, 9/1/38 | | | 727,067 | | | | 768,207 | |
+1.69%, 3.524%, 10/1/38 | | | 2,608,014 | | | | 2,723,458 | |
+1.74%, 3.612%, 10/1/38 | | | 1,356,409 | | | | 1,422,772 | |
+1.64%, 3.652%, 10/1/38 | | | 5,498,100 | | | | 5,744,041 | |
+1.72%, 3.817%, 6/1/39 | | | 506,825 | | | | 530,119 | |
+1.76%, 4.119%, 12/1/39 | | | 2,144,521 | | | | 2,193,683 | |
+1.71%, 2.603%, 4/1/42 | | | 10,853,441 | | | | 11,281,934 | |
+1.67%, 2.326%, 9/1/42 | | | 8,853,781 | | | | 9,004,315 | |
+1.68%, 2.471%, 11/1/42 | | | 8,118,126 | | | | 8,278,295 | |
+1.57%, 2.285%, 12/1/42 | | | 14,589,870 | | | | 14,409,580 | |
+1.59%, 2.362%, 2/1/43 | | | 14,606,268 | | | | 14,737,324 | |
+1.79%, 3.66%, 2/1/43 | | | 2,855,621 | | | | 2,989,969 | |
+1.56%, 2.291%, 5/1/43 | | | 3,201,994 | | | | 3,156,208 | |
+1.47%, 3.932%, 6/1/43 | | | 1,967,062 | | | | 2,010,238 | |
+1.44%, 2.757%, 9/1/43 | | | 6,414,381 | | | | 6,571,341 | |
+1.56%, 2.918%, 9/1/43 | | | 4,979,913 | | | | 5,033,126 | |
+1.56%, 3.263%, 9/1/43 | | | 2,671,884 | | | | 2,689,886 | |
+1.61%, 2.294%, 10/1/43 | | | 36,314,215 | | | | 36,214,728 | |
+1.53%, 2.65%, 11/1/43 | | | 11,873,530 | | | | 11,972,843 | |
+1.60%, 2.865%, 11/1/43 | | | 13,826,039 | | | | 13,795,476 | |
+1.56%, 3.079%, 12/1/43 | | | 5,776,864 | | | | 5,846,711 | |
+1.55%, 2.429%, 2/1/44 | | | 2,347,523 | | | | 2,433,845 | |
+1.59%, 2.704%, 2/1/44 | | | 5,624,458 | | | | 5,654,500 | |
+1.58%, 2.958%, 2/1/44 | | | 7,964,750 | | | | 8,038,345 | |
+1.56%, 2.694%, 4/1/44 | | | 14,017,353 | | | | 14,541,834 | |
+1.59%, 2.934%, 4/1/44 | | | 6,066,988 | | | | 6,114,441 | |
+1.59%, 2.946%, 4/1/44 | | | 4,914,132 | | | | 4,951,119 | |
+1.58%, 3.188%, 4/1/44 | | | 18,665,790 | | | | 18,778,610 | |
+1.66%, 3.481%, 4/1/44 | | | 25,375,992 | | | | 26,245,957 | |
+1.57%, 2.454%, 5/1/44 | | | 12,474,933 | | | | 12,913,246 | |
+1.57%, 3.056%, 5/1/44 | | | 22,944,664 | | | | 23,175,277 | |
+1.58%, 2.838%, 7/1/44 | | | 10,998,141 | | | | 11,047,540 | |
+1.59%, 2.859%, 7/1/44 | | | 16,097,205 | | | | 16,179,284 | |
+1.59%, 2.943%, 7/1/44 | | | 4,980,129 | | | | 5,002,815 | |
+1.56%, 2.944%, 7/1/44 | | | 7,968,313 | | | | 8,018,243 | |
+1.57%, 2.964%, 7/1/44 | | | 5,556,553 | | | | 5,591,252 | |
+1.58%, 3.092%, 7/1/44 | | | 12,388,187 | | | | 12,486,707 | |
+1.58%, 2.791%, 8/1/44 | | | 9,924,899 | | | | 9,949,221 | |
+1.57%, 2.792%, 8/1/44 | | | 21,952,931 | | | | 22,007,476 | |
+1.58%, 2.923%, 8/1/44 | | | 6,766,372 | | | | 6,801,660 | |
+1.57%, 3.007%, 8/1/44 | | | 7,351,342 | | | | 7,403,771 | |
+1.58%, 2.70%, 9/1/44 | | | 8,891,789 | | | | 8,897,162 | |
+1.58%, 2.757%, 9/1/44 | | | 9,885,788 | | | | 9,903,056 | |
+1.65%, 2.83%, 9/1/44 | | | 35,527,363 | | | | 35,682,343 | |
+1.58%, 2.869%, 9/1/44 | | | 5,169,312 | | | | 5,189,908 | |
+1.63%, 2.962%, 9/1/44 | | | 17,507,164 | | | | 17,612,241 | |
+1.59%, 3.00%, 9/1/44 | | | 7,419,860 | | | | 7,457,493 | |
+1.57%, 2.474%, 10/1/44 | | | 7,550,502 | | | | 7,518,360 | |
+1.60%, 2.595%, 10/1/44 | | | 6,519,881 | | | | 6,510,822 | |
+1.57%, 2.657%, 10/1/44 | | | 13,792,188 | | | | 13,787,829 | |
+1.57%, 2.714%, 10/1/44 | | | 8,180,523 | | | | 8,188,882 | |
+1.58%, 2.755%, 10/1/44 | | | 32,423,367 | | | | 32,476,745 | |
+1.58%, 2.796%, 10/1/44 | | | 16,668,001 | | | | 16,726,624 | |
+1.56%, 2.84%, 10/1/44 | | | 7,355,608 | | | | 7,380,978 | |
+1.60%, 2.851%, 10/1/44 | | | 14,691,276 | | | | 14,761,162 | |
| | | | | | | | |
| | |
| | | PAR VALUE | | | VALUE | |
+1.60%, 2.863%, 10/1/44 | | $ | 10,204,619 | | | $ | 10,255,911 | |
+1.60%, 2.918%, 10/1/44 | | | 17,949,093 | | | | 18,058,084 | |
+1.58%, 2.938%, 10/1/44 | | | 4,659,913 | | | | 4,682,563 | |
+1.56%, 2.956%, 10/1/44 | | | 9,014,448 | | | | 9,063,418 | |
+1.58%, 2.732%, 11/1/44 | | | 6,550,047 | | | | 6,557,080 | |
+1.60%, 2.794%, 11/1/44 | | | 14,306,611 | | | | 14,356,764 | |
+1.60%, 2.816%, 11/1/44 | | | 7,425,347 | | | | 7,446,506 | |
+1.58%, 2.83%, 11/1/44 | | | 17,499,857 | | | | 17,556,264 | |
+1.56%, 2.917%, 11/1/44 | | | 16,104,090 | | | | 16,176,843 | |
+1.57%, 2.926%, 11/1/44 | | | 14,639,523 | | | | 14,708,470 | |
+1.58%, 2.70%, 12/1/44 | | | 4,376,108 | | | | 4,382,321 | |
+1.59%, 2.708%, 12/1/44 | | | 5,139,035 | | | | 5,141,808 | |
+1.57%, 2.74%, 12/1/44 | | | 29,751,944 | | | | 29,790,999 | |
+1.58%, 2.762%, 12/1/44 | | | 5,087,580 | | | | 5,096,008 | |
+1.60%, 2.813%, 12/1/44 | | | 11,684,004 | | | | 11,715,685 | |
+1.59%, 2.973%, 12/1/44 | | | 8,138,949 | | | | 8,178,484 | |
+1.57%, 2.917%, 1/1/45 | | | 12,895,828 | | | | 12,950,066 | |
+1.58%, 2.754%, 2/1/45 | | | 17,106,188 | | | | 17,129,651 | |
+1.57%, 3.004%, 3/1/45 | | | 154,153,414 | | | | 155,245,442 | |
+1.59%, 3.111%, 3/1/45 | | | 4,403,359 | | | | 4,429,716 | |
+1.61%, 2.58%, 4/1/45 | | | 5,857,333 | | | | 5,838,111 | |
+1.58%, 2.839%, 4/1/45 | | | 34,821,016 | | | | 34,979,175 | |
+1.59%, 2.642%, 8/1/45 | | | 12,583,903 | | | | 12,559,212 | |
+1.58%, 2.653%, 8/1/45 | | | 11,657,707 | | | | 11,633,079 | |
+1.59%, 2.811%, 10/1/45 | | | 26,161,038 | | | | 26,170,358 | |
+1.60%, 2.619%, 11/1/45 | | | 20,182,564 | | | | 20,121,349 | |
+1.61%, 2.831%, 3/1/46 | | | 4,379,770 | | | | 4,375,621 | |
+1.60%, 2.415%, 4/1/46 | | | 36,678,781 | | | | 36,729,015 | |
+1.59%, 2.684%, 4/1/46 | | | 6,773,384 | | | | 6,740,011 | |
+1.61%, 2.704%, 4/1/46 | | | 6,204,070 | | | | 6,176,238 | |
+1.58%, 2.805%, 4/1/46 | | | 17,582,042 | | | | 17,543,409 | |
+1.61%, 2.902%, 4/1/46 | | | 5,181,460 | | | | 5,172,049 | |
+1.58%, 2.485%, 5/1/46 | | | 9,153,821 | | | | 9,160,066 | |
+1.59%, 2.721%, 6/1/46 | | | 9,994,443 | | | | 9,968,132 | |
+1.60%, 2.751%, 6/1/46 | | | 3,368,970 | | | | 3,363,743 | |
+1.59%, 2.677%, 7/1/46 | | | 3,188,333 | | | | 3,176,839 | |
+1.62%, 2.295%, 12/1/46 | | | 7,735,399 | | | | 7,606,954 | |
+1.61%, 3.12%, 6/1/47 | | | 27,464,328 | | | | 27,530,929 | |
+1.61%, 3.182%, 6/1/47 | | | 30,826,356 | | | | 30,948,403 | |
+1.59%, 3.157%, 7/1/47 | | | 24,266,321 | | | | 24,364,988 | |
+1.61%, 3.177%, 7/1/47 | | | 9,737,580 | | | | 9,775,076 | |
+1.60%, 2.729%, 8/1/47 | | | 29,160,745 | | | | 29,137,294 | |
+1.61%, 3.022%, 8/1/47 | | | 9,111,216 | | | | 9,106,683 | |
+1.61%, 3.034%, 8/1/47 | | | 9,129,880 | | | | 9,127,281 | |
+1.59%, 3.203%, 8/1/47 | | | 12,125,843 | | | | 12,182,924 | |
+1.57%, 2.953%, 10/1/47 | | | 7,693,269 | | | | 7,683,469 | |
+1.61%, 3.085%, 10/1/47 | | | 11,349,024 | | | | 11,360,134 | |
+1.61%, 2.902%, 11/1/47 | | | 7,977,048 | | | | 7,938,051 | |
+1.59%, 2.99%, 11/1/47 | | | 18,984,979 | | | | 18,981,460 | |
+1.61%, 3.115%, 1/1/48 | | | 4,538,046 | | | | 4,546,691 | |
+1.61%, 3.165%, 1/1/48 | | | 9,949,590 | | | | 9,980,509 | |
+1.60%, 3.202%, 4/1/48 | | | 14,911,725 | | | | 14,996,406 | |
USD LIBOR 6-Month | | | | | | | | |
+1.42%, 3.703%, 8/1/34 | | | 1,809,711 | | | | 1,860,772 | |
+1.50%, 3.732%, 1/1/35 | | | 1,270,805 | | | | 1,311,940 | |
+1.57%, 3.54%, 11/1/35 | | | 1,643,683 | | | | 1,704,467 | |
Freddie Mac, Hybrid ARM 1-Year U.S. Treasury CMT | | | | | | | | |
+2.25%, 3.726%, 2/1/34 | | | 3,635,175 | | | | 3,836,410 | |
+2.25%, 3.50%, 11/1/34 | | | 1,125,201 | | | | 1,188,496 | |
+2.25%, 3.965%, 2/1/35 | | | 806,192 | | | | 851,429 | |
+2.13%, 4.00%, 4/1/35 | | | 507,383 | | | | 526,070 | |
+1.67%, 3.006%, 1/1/36 | | | 2,296,494 | | | | 2,372,044 | |
+2.25%, 3.594%, 1/1/36 | | | 4,575,516 | | | | 4,822,149 | |
USD LIBOR 12-Month | | | | | | | | |
+1.78%, 3.529%, 9/1/33 | | | 4,771,234 | | | | 5,019,658 | |
+1.80%, 3.558%, 8/1/34 | | | 783,726 | | | | 826,331 | |
| | |
| PAGE 10 § DODGE & COX INCOME FUND | | See accompanying Notes to Financial Statements |
| | | | |
| PORTFOLIO OF INVESTMENTS (unaudited) | | | June 30, 2018 | |
| | | | | | | | |
| DEBT SECURITIES (continued) | |
| | |
| | | PAR VALUE | | | VALUE | |
+1.63%, 3.437%, 1/1/35 | | $ | 545,267 | | | $ | 567,551 | |
+1.80%, 3.84%, 3/1/35 | | | 1,015,227 | | | | 1,066,740 | |
+1.87%, 3.62%, 8/1/35 | | | 1,863,218 | | | | 1,966,300 | |
+1.72%, 3.641%, 8/1/35 | | | 1,094,609 | | | | 1,150,003 | |
+1.83%, 3.583%, 9/1/35 | | | 1,549,445 | | | | 1,634,111 | |
+1.63%, 3.419%, 10/1/35 | | | 1,856,221 | | | | 1,941,624 | |
+1.60%, 3.434%, 1/1/36 | | | 1,484,727 | | | | 1,548,811 | |
+1.88%, 4.035%, 4/1/36 | | | 2,453,133 | | | | 2,590,640 | |
+1.78%, 3.529%, 12/1/36 | | | 1,448,197 | | | | 1,515,973 | |
+1.77%, 3.544%, 1/1/37 | | | 2,315,640 | | | | 2,422,272 | |
+1.57%, 3.50%, 3/1/37 | | | 2,072,680 | | | | 2,148,347 | |
+1.56%, 3.941%, 4/1/37 | | | 1,147,201 | | | | 1,192,260 | |
+1.72%, 4.073%, 4/1/37 | | | 1,301,660 | | | | 1,355,142 | |
+1.63%, 4.095%, 5/1/37 | | | 1,692,687 | | | | 1,757,141 | |
+1.63%, 3.428%, 7/1/37 | | | 5,228,803 | | | | 5,456,809 | |
+2.09%, 3.835%, 10/1/37 | | | 112,628 | | | | 118,516 | |
+2.01%, 3.798%, 1/1/38 | | | 641,446 | | | | 675,682 | |
+1.67%, 3.479%, 2/1/38 | | | 4,493,198 | | | | 4,656,206 | |
+1.86%, 3.96%, 4/1/38 | | | 5,962,700 | | | | 6,233,813 | |
+1.76%, 4.063%, 4/1/38 | | | 4,925,204 | | | | 5,147,485 | |
+1.90%, 4.275%, 5/1/38 | | | 756,061 | | | | 790,827 | |
+1.68%, 3.889%, 6/1/38 | | | 2,840,675 | | | | 2,965,574 | |
+1.63%, 4.146%, 6/1/38 | | | 572,681 | | | | 583,046 | |
+1.73%, 3.653%, 10/1/38 | | | 492,065 | | | | 514,780 | |
+1.73%, 3.757%, 10/1/38 | | | 2,352,030 | | | | 2,460,049 | |
+1.77%, 4.484%, 11/1/39 | | | 1,550,969 | | | | 1,629,050 | |
+1.85%, 4.013%, 7/1/43 | | | 2,020,604 | | | | 2,111,233 | |
+1.71%, 3.335%, 8/1/43 | | | 27,227,922 | | | | 28,101,176 | |
+1.64%, 2.778%, 10/1/43 | | | 2,104,592 | | | | 2,117,531 | |
+1.59%, 2.899%, 1/1/44 | | | 4,464,142 | | | | 4,498,320 | |
+1.61%, 3.09%, 1/1/44 | | | 3,560,338 | | | | 3,594,982 | |
+1.62%, 2.881%, 2/1/44 | | | 10,636,357 | | | | 10,711,302 | |
+1.64%, 3.104%, 4/1/44 | | | 3,390,678 | | | | 3,423,324 | |
+1.63%, 3.109%, 4/1/44 | | | 6,291,202 | | | | 6,348,844 | |
+1.63%, 3.001%, 5/1/44 | | | 92,064,296 | | | | 92,685,722 | |
+1.62%, 2.844%, 6/1/44 | | | 6,295,499 | | | | 6,315,769 | |
+1.62%, 3.104%, 6/1/44 | | | 19,549,091 | | | | 19,735,733 | |
+1.62%, 3.056%, 7/1/44 | | | 6,719,959 | | | | 6,765,199 | |
+1.63%, 3.057%, 7/1/44 | | | 4,828,159 | | | | 4,858,694 | |
+1.61%, 2.842%, 8/1/44 | | | 8,282,621 | | | | 8,299,272 | |
+1.62%, 3.032%, 8/1/44 | | | 8,414,593 | | | | 8,464,708 | |
+1.63%, 3.063%, 8/1/44 | | | 10,534,961 | | | | 10,606,849 | |
+1.62%, 2.729%, 9/1/44 | | | 10,328,083 | | | | 10,323,798 | |
+1.62%, 2.761%, 9/1/44 | | | 12,904,542 | | | | 12,921,827 | |
+1.62%, 2.835%, 9/1/44 | | | 7,597,916 | | | | 7,612,109 | |
+1.62%, 2.771%, 10/1/44 | | | 5,851,183 | | | | 5,860,264 | |
+1.62%, 2.82%, 10/1/44 | | | 14,540,844 | | | | 14,576,653 | |
+1.61%, 2.872%, 10/1/44 | | | 12,671,270 | | | | 12,700,749 | |
+1.63%, 2.988%, 10/1/44 | | | 13,362,277 | | | | 13,427,500 | |
+1.63%, 3.021%, 10/1/44 | | | 13,619,274 | | | | 13,701,556 | |
+1.60%, 2.723%, 11/1/44 | | | 17,953,285 | | | | 17,961,635 | |
+1.63%, 2.766%, 11/1/44 | | | 7,033,025 | | | | 7,034,414 | |
+1.63%, 2.794%, 11/1/44 | | | 13,906,246 | | | | 13,918,195 | |
+1.61%, 2.896%, 11/1/44 | | | 8,644,193 | | | | 8,665,030 | |
+1.61%, 2.907%, 11/1/44 | | | 7,262,083 | | | | 7,285,337 | |
+1.62%, 2.913%, 11/1/44 | | | 13,206,785 | | | | 13,257,494 | |
+1.61%, 2.92%, 11/1/44 | | | 24,643,353 | | | | 24,720,309 | |
+1.63%, 2.946%, 11/1/44 | | | 10,050,930 | | | | 10,081,247 | |
+1.63%, 2.949%, 11/1/44 | | | 17,529,954 | | | | 17,613,558 | |
+1.62%, 2.957%, 11/1/44 | | | 11,724,522 | | | | 11,764,084 | |
+1.60%, 2.959%, 11/1/44 | | | 6,390,087 | | | | 6,418,114 | |
+1.63%, 2.778%, 12/1/44 | | | 4,286,837 | | | | 4,287,981 | |
+1.63%, 2.84%, 12/1/44 | | | 19,165,008 | | | | 19,196,070 | |
+1.62%, 2.877%, 12/1/44 | | | 13,757,009 | | | | 13,803,784 | |
+1.63%, 2.893%, 12/1/44 | | | 17,004,232 | | | | 17,063,626 | |
+1.62%, 2.936%, 12/1/44 | | | 8,682,933 | | | | 8,707,623 | |
+1.62%, 2.678%, 1/1/45 | | | 13,763,784 | | | | 13,753,297 | |
| | | | | | | | |
| | |
| | | PAR VALUE | | | VALUE | |
+1.63%, 2.828%, 1/1/45 | | $ | 9,916,455 | | | $ | 9,941,540 | |
+1.62%, 2.858%, 1/1/45 | | | 9,283,015 | | | | 9,298,750 | |
+1.62%, 2.913%, 1/1/45 | | | 17,375,080 | | | | 17,416,687 | |
+1.63%, 3.078%, 1/1/45 | | | 26,641,023 | | | | 26,778,386 | |
+1.62%, 2.91%, 2/1/45 | | | 14,483,124 | | | | 14,513,915 | |
+1.62%, 2.668%, 4/1/45 | | | 7,820,603 | | | | 7,803,934 | |
+1.63%, 2.602%, 5/1/45 | | | 46,410,190 | | | | 46,196,329 | |
+1.63%, 2.767%, 6/1/45 | | | 5,630,682 | | | | 5,628,565 | |
+1.63%, 2.636%, 8/1/45 | | | 12,420,259 | | | | 12,368,984 | |
+1.63%, 2.732%, 8/1/45 | | | 37,492,220 | | | | 37,445,579 | |
+1.60%, 2.799%, 8/1/45 | | | 9,440,250 | | | | 9,441,371 | |
+1.63%, 2.81%, 9/1/45 | | | 10,520,697 | | | | 10,506,954 | |
+1.63%, 2.726%, 5/1/46 | | | 238,146,560 | | | | 237,621,500 | |
+1.62%, 2.734%, 5/1/46 | | | 18,591,630 | | | | 18,520,287 | |
+1.62%, 2.637%, 7/1/46 | | | 25,926,643 | | | | 25,751,620 | |
+1.63%, 2.532%, 9/1/46 | | | 44,259,460 | | | | 43,740,573 | |
+1.63%, 3.16%, 6/1/47 | | | 12,970,979 | | | | 12,991,597 | |
+1.63%, 3.196%, 8/1/47 | | | 9,247,605 | | | | 9,270,233 | |
+1.64%, 3.095%, 10/1/47 | | | 9,198,185 | | | | 9,192,955 | |
+1.64%, 3.13%, 11/1/47 | | | 3,952,469 | | | | 3,954,240 | |
USD LIBOR 6-Month | | | | | | | | |
+1.60%, 3.711%, 8/1/36 | | | 2,205,439 | | | | 2,284,925 | |
Freddie Mac Gold, | | | | | | | | |
15 Year 6.00%, 2/1/19-11/1/23 | | | 8,326,087 | | | | 8,641,198 | |
5.50%, 10/1/20-12/1/24 | | | 3,340,517 | | | | 3,408,353 | |
4.50%, 3/1/25-6/1/26 | | | 11,432,513 | | | | 11,812,800 | |
Freddie Mac Gold, 20 Year 6.50%, 10/1/26 | | | 2,162,643 | | | | 2,335,182 | |
4.50%, 5/1/30-1/1/34 | | | 100,455,373 | | | | 104,873,294 | |
4.00%, 9/1/31-10/1/35 | | | 459,298,368 | | | | 474,959,046 | |
3.50%, 7/1/35-1/1/36 | | | 178,307,782 | | | | 180,275,546 | |
Freddie Mac Gold, 30 Year 7.90%, 2/17/21 | | | 89,902 | | | | 90,497 | |
7.00%, 4/1/31-11/1/38 | | | 3,430,778 | | | | 3,755,541 | |
6.50%, 12/1/32-10/1/38 | | | 9,990,124 | | | | 11,082,602 | |
6.00%, 12/1/33-2/1/39 | | | 17,860,279 | | | | 19,598,707 | |
5.50%, 3/1/34-12/1/38 | | | 51,944,146 | | | | 56,268,795 | |
4.50%, 3/1/39-10/1/47 | | | 2,358,020,981 | | | | 2,460,113,157 | |
4.00%, 11/1/45-11/1/47 | | | 932,277,996 | | | | 953,294,384 | |
Ginnie Mae, 20 Year
4.00%, 1/20/35 | | | 9,004,691 | | | | 9,214,505 | |
Ginnie Mae, 30 Year
7.80%, 6/15/20 -1/15/21 | | | 90,876 | | | | 92,005 | |
8.00%, 9/15/20 | | | 1,283 | | | | 1,303 | |
7.85%, 1/15/21 | | | 2,903 | | | | 2,909 | |
7.50%, 12/15/23-5/15/25 | | | 772,135 | | | | 836,893 | |
7.00%, 5/15/28 | | | 259,767 | | | | 284,550 | |
| | | | | | | | |
| | | | | | | 16,042,534,773 | |
Private Label CMO & REMIC: 0.1% | | | | | | | | |
GSMPS Mortgage Loan Trust
Series 2004-4 1A4, 8.50%, 6/25/34(b) | | | 3,457,908 | | | | 3,975,097 | |
Seasoned Credit Risk Transfer Trust
Series 2017-4 M45T, 4.50%, 6/25/57 | | | 32,255,388 | | | | 33,671,602 | |
| | | | | | | | |
| | | | | | | 37,646,699 | |
| | | | | | | | |
| | | | | | | 18,950,476,587 | |
| | | | | | | | |
| | | | | | | 22,823,490,678 | |
| CORPORATE: 34.1% | | | | | | | | |
FINANCIALS: 11.9% | | | | | | | | |
Bank of America Corp. | | | | | | | | |
3.004%, 12/20/23(f) | | | 422,916,000 | | | | 410,089,173 | |
4.20%, 8/26/24 | | | 163,140,000 | | | | 163,923,702 | |
4.25%, 10/22/26 | | | 185,082,000 | | | | 182,827,546 | |
| | |
| See accompanying Notes to Financial Statements | | DODGE & COX INCOME FUND §PAGE 11 |
| | | | |
| PORTFOLIO OF INVESTMENTS (unaudited) | | | June 30, 2018 | |
| | | | | | | | |
| DEBT SECURITIES (continued) | |
| | |
| | | PAR VALUE | | | VALUE | |
Barclays PLC (United Kingdom) | | | | | | | | |
4.375%, 9/11/24 | | $ | 239,204,000 | | | $ | 232,405,822 | |
4.836%, 5/9/28 | | | 77,975,000 | | | | 73,612,693 | |
BNP Paribas SA (France) | | | | | | | | |
4.25%, 10/15/24 | | | 380,966,000 | | | | 375,752,770 | |
4.375%, 9/28/25(b) | | | 165,756,000 | | | | 161,725,096 | |
4.375%, 5/12/26(b) | | | 118,904,000 | | | | 115,321,337 | |
4.625%, 3/13/27(b) | | | 106,000,000 | | | | 104,005,096 | |
Boston Properties, Inc. | | | | | | | | |
5.875%, 10/15/19 | | | 48,079,000 | | | | 49,517,524 | |
5.625%, 11/15/20 | | | 79,385,000 | | | | 83,182,778 | |
4.125%, 5/15/21 | | | 52,852,000 | | | | 53,813,133 | |
3.85%, 2/1/23 | | | 76,031,000 | | | | 76,393,517 | |
3.125%, 9/1/23 | | | 19,500,000 | | | | 18,957,644 | |
3.80%, 2/1/24 | | | 64,024,000 | | | | 63,677,904 | |
3.20%, 1/15/25 | | | 47,075,000 | | | | 44,797,485 | |
3.65%, 2/1/26 | | | 19,580,000 | | | | 18,878,726 | |
Capital One Financial Corp. | | | | | | | | |
3.50%, 6/15/23 | | | 155,385,000 | | | | 151,738,052 | |
3.75%, 4/24/24 | | | 36,940,000 | | | | 36,217,798 | |
3.20%, 2/5/25 | | | 52,515,000 | | | | 49,285,604 | |
4.20%, 10/29/25 | | | 121,149,000 | | | | 117,618,855 | |
Cigna Corp. | | | | | | | | |
4.00%, 2/15/22 | | | 62,964,000 | | | | 63,828,532 | |
7.65%, 3/1/23 | | | 7,217,000 | | | | 8,360,836 | |
7.875%, 5/15/27 | | | 26,720,000 | | | | 33,133,612 | |
Citigroup, Inc. | | | | | | | | |
3.50%, 5/15/23 | | | 72,730,000 | | | | 71,099,067 | |
4.00%, 8/5/24 | | | 31,300,000 | | | | 30,760,581 | |
USD LIBOR 3-Month | | | | | | | | |
+6.37%, 8.729%, 10/30/40(a) | | | 417,021,400 | | | | 452,051,198 | |
Equity Residential | | | | | | | | |
4.75%, 7/15/20 | | | 5,200,000 | | | | 5,342,877 | |
4.625%, 12/15/21 | | | 108,687,000 | | | | 112,650,037 | |
3.00%, 4/15/23 | | | 47,300,000 | | | | 46,142,787 | |
3.375%, 6/1/25 | | | 77,890,000 | | | | 76,021,012 | |
HSBC Holdings PLC (United Kingdom) | | | | | | | | |
5.10%, 4/5/21 | | | 85,935,000 | | | | 89,821,616 | |
9.30%, 6/1/21 | | | 100,000 | | | | 114,649 | |
4.30%, 3/8/26 | | | 116,100,000 | | | | 116,358,161 | |
6.50%, 5/2/36 | | | 218,122,000 | | | | 252,803,027 | |
6.50%, 9/15/37 | | | 219,191,000 | | | | 255,555,585 | |
6.80%, 6/1/38 | | | 29,650,000 | | | | 35,663,191 | |
JPMorgan Chase & Co. | | | | | | | | |
3.375%, 5/1/23 | | | 92,238,000 | | | | 90,058,617 | |
4.125%, 12/15/26 | | | 106,000,000 | | | | 104,624,061 | |
4.25%, 10/1/27 | | | 125,244,000 | | | | 124,280,834 | |
8.75%, 9/1/30(a) | | | 62,983,000 | | | | 86,612,011 | |
Lloyds Banking Group PLC (United Kingdom) | | | | | | | | |
4.50%, 11/4/24 | | | 218,317,000 | | | | 215,737,803 | |
4.582%, 12/10/25 | | | 116,731,000 | | | | 114,391,045 | |
4.65%, 3/24/26 | | | 118,232,000 | | | | 116,293,321 | |
Royal Bank of Scotland Group PLC (United Kingdom) | | | | | | | | |
6.125%, 12/15/22 | | | 331,036,000 | | | | 348,281,790 | |
6.00%, 12/19/23 | | | 317,085,000 | | | | 332,621,654 | |
5.125%, 5/28/24 | | | 18,169,000 | | | | 18,319,469 | |
Unum Group | | | | | | | | |
7.19%, 2/1/28 | | | 11,295,000 | | | | 12,955,982 | |
7.25%, 3/15/28 | | | 25,060,000 | | | | 29,729,719 | |
6.75%, 12/15/28 | | | 8,107,000 | | | | 9,364,005 | |
Wells Fargo & Co. | | | | | | | | |
2.15%, 12/6/19 | | | 280,875,000 | | | | 277,806,230 | |
4.10%, 6/3/26 | | | 120,170,000 | | | | 117,715,253 | |
4.30%, 7/22/27 | | | 323,175,000 | | | | 318,366,088 | |
USD LIBOR 3-Month | | | | | | | | |
+0.65%, 2.964%, 12/6/19 | | | 135,850,000 | | | | 136,758,021 | |
| | | | | | | | |
| | | | | | | 6,687,364,926 | |
| | | | | | | | |
| | |
| | | PAR VALUE | | | VALUE | |
INDUSTRIALS: 20.9% | | | | | | | | |
AT&T, Inc. | | | | | | | | |
8.25%, 11/15/31(b) | | $ | 100,978,000 | | | $ | 129,454,739 | |
5.35%, 9/1/40 | | | 59,744,000 | | | | 58,269,011 | |
4.75%, 5/15/46 | | | 112,670,000 | | | | 100,569,434 | |
5.65%, 2/15/47 | | | 120,390,000 | | | | 121,144,158 | |
5.45%, 3/1/47 | | | 124,855,000 | | | | 122,465,285 | |
4.50%, 3/9/48 | | | 250,175,000 | | | | 214,734,221 | |
Bayer AG (Germany)
3.875%, 12/15/23(b) | | | 99,150,000 | | | | 99,117,034 | |
4.25%, 12/15/25(b) | | | 118,000,000 | | | | 118,678,730 | |
4.375%, 12/15/28(b) | | | 137,260,000 | | | | 137,463,616 | |
BHP Billiton, Ltd. (Australia)
6.75%, 10/19/75(a)(b)(f) | | | 111,122,000 | | | | 120,511,809 | |
Burlington Northern Santa Fe LLC (d)
4.70%, 10/1/19 | | | 33,445,000 | | | | 34,200,723 | |
8.251%, 1/15/21 | | | 1,805,271 | | | | 1,912,413 | |
3.05%, 9/1/22 | | | 39,535,000 | | | | 39,064,488 | |
5.943%, 1/15/23 | | | 19,861 | | | | 20,645 | |
3.85%, 9/1/23 | | | 79,525,000 | | | | 81,067,146 | |
5.72%, 1/15/24 | | | 11,608,351 | | | | 12,363,416 | |
5.342%, 4/1/24 | | | 3,431,597 | | | | 3,573,218 | |
5.629%, 4/1/24 | | | 14,534,731 | | | | 15,530,317 | |
5.996%, 4/1/24 | | | 30,441,278 | | | | 32,875,247 | |
3.442%, 6/16/28(b) | | | 80,509,841 | | | | 77,802,134 | |
Cemex SAB de CV (Mexico)
6.00%, 4/1/24(b) | | | 113,175,000 | | | | 114,731,156 | |
5.70%, 1/11/25(b) | | | 217,411,000 | | | | 214,910,774 | |
6.125%, 5/5/25(b) | | | 105,300,000 | | | | 107,037,450 | |
7.75%, 4/16/26(b) | | | 82,008,000 | | | | 88,847,467 | |
Charter Communications, Inc.
8.75%, 2/14/19 | | | 130,460,000 | | | | 134,814,112 | |
8.25%, 4/1/19 | | | 237,543,000 | | | | 246,389,880 | |
5.00%, 2/1/20 | | | 20,700,000 | | | | 21,131,492 | |
4.125%, 2/15/21 | | | 33,095,000 | | | | 33,261,404 | |
4.00%, 9/1/21 | | | 40,609,000 | | | | 40,604,758 | |
4.908%, 7/23/25 | | | 122,505,000 | | | | 123,680,244 | |
4.20%, 3/15/28 | | | 68,500,000 | | | | 64,103,175 | |
6.55%, 5/1/37 | | | 46,188,000 | | | | 48,971,230 | |
6.75%, 6/15/39 | | | 112,072,000 | | | | 119,407,217 | |
6.484%, 10/23/45 | | | 438,944,000 | | | | 462,351,330 | |
5.375%, 5/1/47 | | | 57,310,000 | | | | 52,005,691 | |
5.75%, 4/1/48 | | | 101,755,000 | | | | 98,439,874 | |
Comcast Corp.
3.969%, 11/1/47 | | | 44,560,000 | | | | 39,217,799 | |
Cox Enterprises, Inc.
3.25%, 12/15/22(b) | | | 94,333,000 | | | | 91,602,072 | |
2.95%, 6/30/23(b) | | | 251,295,000 | | | | 237,989,814 | |
3.85%, 2/1/25(b) | | | 263,159,000 | | | | 257,716,440 | |
3.35%, 9/15/26(b) | | | 139,412,000 | | | | 128,846,489 | |
3.50%, 8/15/27(b) | | | 144,842,000 | | | | 134,688,918 | |
CRH PLC (Ireland)
3.875%, 5/18/25(b) | | | 196,754,000 | | | | 194,002,252 | |
CSX Corp.
9.75%, 6/15/20 | | | 10,067,000 | | | | 11,277,809 | |
6.251%, 1/15/23 | | | 12,935,299 | | | | 13,961,068 | |
CVS Health Corp.
3.70%, 3/9/23 | | | 186,665,000 | | | | 184,764,735 | |
4.10%, 3/25/25 | | | 42,500,000 | | | | 42,267,113 | |
4.30%, 3/25/28 | | | 116,634,000 | | | | 115,003,421 | |
4.78%, 3/25/38 | | | 75,850,000 | | | | 74,974,597 | |
Dell Technologies, Inc.
4.42%, 6/15/21(b) | | | 24,151,000 | | | | 24,493,763 | |
5.45%, 6/15/23(b) | | | 178,108,000 | | | | 186,271,582 | |
Dillard’s, Inc. 7.13%, 8/1/18 | | | 23,565,000 | | | | 23,635,710 | |
7.875%, 1/1/23 | | | 275,000 | | | | 306,000 | |
7.75%, 7/15/26 | | | 21,016,000 | | | | 23,654,105 | |
| | |
| PAGE 12 § DODGE & COX INCOME FUND | | See accompanying Notes to Financial Statements |
| | | | |
| PORTFOLIO OF INVESTMENTS (unaudited) | | | June 30, 2018 | |
| | | | | | | | |
| DEBT SECURITIES (continued) | |
| | |
| | | PAR VALUE | | | VALUE | |
7.75%, 5/15/27 | | $ | 12,848,000 | | | $ | 14,446,367 | |
7.00%, 12/1/28 | | | 28,225,000 | | | | 30,556,782 | |
DowDuPont, Inc.
7.375%, 11/1/29 | | | 69,100,000 | | | | 86,116,172 | |
9.40%, 5/15/39 | | | 153,811,000 | | | | 236,857,996 | |
5.25%, 11/15/41 | | | 37,853,000 | | | | 39,783,312 | |
FedEx Corp.
8.00%, 1/15/19 | | | 16,875,000 | | | | 17,340,483 | |
Ford Motor Credit Co. LLC (d)
2.681%, 1/9/20 | | | 110,925,000 | | | | 109,881,218 | |
8.125%, 1/15/20 | | | 7,091,000 | | | | 7,596,901 | |
5.75%, 2/1/21 | | | 192,923,000 | | | | 202,574,938 | |
5.875%, 8/2/21 | | | 169,660,000 | | | | 179,845,796 | |
3.219%, 1/9/22 | | | 30,125,000 | | | | 29,454,018 | |
Imperial Brands PLC (United Kingdom)
3.75%, 7/21/22(b) | | | 124,595,000 | | | | 123,631,707 | |
4.25%, 7/21/25(b) | | | 559,133,000 | | | | 556,407,752 | |
Kinder Morgan, Inc.
4.30%, 6/1/25 | | | 129,770,000 | | | | 129,091,433 | |
6.50%, 2/1/37 | | | 50,861,000 | | | | 54,871,108 | |
6.95%, 1/15/38 | | | 92,139,000 | | | | 104,952,257 | |
6.50%, 9/1/39 | | | 72,546,000 | | | | 78,290,292 | |
5.00%, 8/15/42 | | | 78,782,000 | | | | 73,246,483 | |
5.00%, 3/1/43 | | | 86,308,000 | | | | 80,198,391 | |
5.50%, 3/1/44 | | | 96,910,000 | | | | 96,187,743 | |
5.40%, 9/1/44 | | | 69,297,000 | | | | 67,216,712 | |
Macy’s, Inc.
6.65%, 7/15/24 | | | 52,526,000 | | | | 56,686,364 | |
7.00%, 2/15/28 | | | 17,160,000 | | | | 18,622,252 | |
6.70%, 9/15/28 | | | 34,115,000 | | | | 36,119,754 | |
6.90%, 4/1/29 | | | 81,337,000 | | | | 87,319,416 | |
6.70%, 7/15/34 | | | 77,960,000 | | | | 81,236,579 | |
4.50%, 12/15/34 | | | 154,923,000 | | | | 133,618,435 | |
6.375%, 3/15/37 | | | 21,354,000 | | | | 21,482,042 | |
Naspers, Ltd. (South Africa)
6.00%, 7/18/20(b) | | | 220,010,000 | | | | 229,490,231 | |
5.50%, 7/21/25(b) | | | 291,811,000 | | | | 300,127,614 | |
4.85%, 7/6/27(b) | | | 108,648,000 | | | | 106,342,707 | |
Nordstrom, Inc.
6.95%, 3/15/28 | | | 20,107,000 | | | | 22,423,713 | |
RELX PLC (United Kingdom)
8.625%, 1/15/19 | | | 28,613,000 | | | | 29,463,329 | |
3.125%, 10/15/22 | | | 146,687,000 | | | | 143,871,435 | |
3.50%, 3/16/23 | | | 44,665,000 | | | | 44,177,901 | |
Telecom Italia SPA (Italy)
7.175%, 6/18/19 | | | 200,711,000 | | | | 206,421,228 | |
5.303%, 5/30/24(b) | | | 178,471,000 | | | | 176,017,024 | |
7.20%, 7/18/36 | | | 53,458,000 | | | | 55,377,142 | |
7.721%, 6/4/38 | | | 145,274,000 | | | | 156,169,550 | |
TransCanada Corp. (Canada)
5.625%, 5/20/75(a)(f) | | | 237,639,000 | | | | 231,698,025 | |
5.875%, 8/15/76(a)(f) | | | 84,536,000 | | | | 83,690,640 | |
5.30%, 3/15/77(a)(f) | | | 250,014,000 | | | | 236,391,987 | |
Twenty-First Century Fox, Inc.
6.20%, 12/15/34 | | | 14,795,000 | | | | 17,466,154 | |
6.40%, 12/15/35 | | | 49,525,000 | | | | 59,373,466 | |
6.15%, 3/1/37 | | | 31,905,000 | | | | 37,399,232 | |
6.65%, 11/15/37 | | | 79,075,000 | | | | 98,093,329 | |
6.15%, 2/15/41 | | | 44,858,000 | | | | 53,567,789 | |
Ultrapar Participacoes SA (Brazil)
5.25%, 10/6/26(b) | | | 140,650,000 | | | | 130,382,550 | |
Union Pacific Corp.
7.60%, 1/2/20 | | | 242,539 | | | | 253,829 | |
6.061%, 1/17/23 | | | 2,359,419 | | | | 2,584,668 | |
4.698%, 1/2/24 | | | 2,066,012 | | | | 2,126,548 | |
5.082%, 1/2/29 | | | 5,372,184 | | | | 5,599,008 | |
5.866%, 7/2/30 | | | 31,848,176 | | | | 34,587,341 | |
6.176%, 1/2/31 | | | 31,787,229 | | | | 34,841,187 | |
| | | | | | | | |
| | |
| | | PAR VALUE | | | VALUE | |
Verizon Communications, Inc.
4.272%, 1/15/36 | | $ | 166,472,000 | | | $ | 153,474,950 | |
4.522%, 9/15/48 | | | 213,601,000 | | | | 194,583,996 | |
5.012%, 4/15/49 | | | 480,632,000 | | | | 467,690,613 | |
Xerox Corp. | | | | | | | | |
5.625%, 12/15/19 | | | 87,407,000 | | | | 89,663,733 | |
2.75%, 9/1/20 | | | 22,690,000 | | | | 22,225,826 | |
4.50%, 5/15/21 | | | 63,744,000 | | | | 64,572,224 | |
4.07%, 3/17/22 | | | 2,349,000 | | | | 2,312,909 | |
Zoetis, Inc. | | | | | | | | |
3.45%, 11/13/20 | | | 39,377,000 | | | | 39,494,182 | |
4.50%, 11/13/25 | | | 166,139,000 | | | | 171,867,498 | |
| | | | | | | | |
| | | | | | | 11,733,634,986 | |
UTILITIES: 1.3% | | | | | | | | |
Dominion Energy, Inc. | | | | | | | | |
2.962%, 7/1/19 | | | 10,000,000 | | | | 9,977,744 | |
2.579%, 7/1/20 | | | 24,949,000 | | | | 24,577,010 | |
4.104%, 4/1/21 | | | 97,451,000 | | | | 98,810,442 | |
5.75%, 10/1/54(a)(f) | | | 232,036,000 | | | | 241,781,512 | |
Enel SPA (Italy) | | | | | | | | |
6.80%, 9/15/37(b) | | | 174,509,000 | | | | 208,434,188 | |
6.00%, 10/7/39(b) | | | 157,024,000 | | | | 174,395,972 | |
| | | | | | | | |
| | | | | | | 757,976,868 | |
| | | | | | | | |
| | | | | | | 19,178,976,780 | |
| | | | | | | | |
TOTAL DEBT SECURITIES
(Cost $55,385,319,939) | | | | | | $ | 55,172,553,648 | |
| | |
| See accompanying Notes to Financial Statements | | DODGE & COX INCOME FUND §PAGE 13 |
| | | | |
| PORTFOLIO OF INVESTMENTS (unaudited) | | | June 30, 2018 | |
| | | | | | | | |
| SHORT-TERM INVESTMENTS: 2.0% | | | | |
| | |
| | | PAR VALUE/ SHARES | | | VALUE | |
COMMERCIAL PAPER: 0.9% | | | | | | | | |
Ford Motor Credit Co. LLC(d) | | | | | | | | |
7/10/18(b) | | $ | 25,163,000 | | | $ | 25,148,217 | |
9/14/18(b) | | | 120,000,000 | | | | 119,400,000 | |
9/21/18(b) | | | 120,000,000 | | | | 119,344,000 | |
Mondelez International, Inc. | | | | | | | | |
9/13/18(b) | | | 100,000,000 | | | | 99,482,000 | |
9/19/18(b) | | | 80,000,000 | | | | 79,555,555 | |
AT&T, Inc.
7/23/18(b) | | | 44,200,000 | | | | 44,129,231 | |
| | | | | | | | |
| | | | | | | 487,059,003 | |
REPURCHASE AGREEMENT: 0.7% | | | | | | | | |
Fixed Income Clearing Corporation(c)
1.20%, dated 6/29/18, due 7/2/18, maturity value $417,747,771 | | | 417,706,000 | | | | 417,706,000 | |
MONEY MARKET FUND: 0.4% | | | | | | | | |
State Street Institutional U.S. Government Money Market Fund | | | 225,409,635 | | | | 225,409,635 | |
| | | | | | | | |
TOTAL SHORT-TERM INVESTMENTS
(Cost $1,130,174,638) | | | | | | $ | 1,130,174,638 | |
| | | | | | | | |
TOTAL INVESTMENTS IN SECURITIES
(Cost $56,515,494,577) | | | 100.1 | % | | $ | 56,302,728,286 | |
OTHER ASSETS LESS LIABILITIES | | | (0.1 | %) | | | (49,361,550 | ) |
| | | | | | | | |
| NET ASSETS | | | 100.0 | % | | $ | 56,253,366,736 | |
| | | | | | | | |
| (b) | Security exempt from registration under Rule 144A of the Securities Act of 1933. The security may be resold in transactions exempt from registration, normally to qualified institutional buyers. These securities have been deemed liquid by Dodge & Cox, investment manager, pursuant to procedures approved by the Fund’s Board of Trustees. |
| (c) | Repurchase agreement is collateralized by U.S. Treasury Note 2.625%, 5/15/21. Total collateral value is $426,061,008. |
| (d) | Subsidiary (see below) |
| (e) | Variable rate security: interest rate is determined by the interest rates of underlying pool of assets that collateralize the security. The interest rate of the security may change due to a change in the interest rates or the composition of underlying pool of assets. The interest rate shown is the rate as of period end. |
| (f) | Variable rate security: fixed-to-float security pays an initial fixed interest rate and will pay a floating interest rate established at a predetermined time in the future. The interest rate shown is the rate as of period end. |
Debt securities are grouped by parent company unless otherwise noted. Actual securities may be issued by the listed parent company or one of its subsidiaries. In determining a parent company’s country designation, the Fund generally references the country of incorporation.
Debt securities with floating interest rates are linked to the referenced benchmark; the interest rate shown is the rate as of period end.
ARM: Adjustable Rate Mortgage
CMBS: Commercial Mortgage-Backed Security
CMO: Collateralized Mortgage Obligation
CMT: Constant Maturity Treasury
DUS: Delegated Underwriting and Servicing
GO: General Obligation
RB: Revenue Bond
REMIC: Real Estate Mortgage Investment Conduit
FUTURES CONTRACTS
| | | | | | | | | | | | | | | | |
| Description | | Number of
Contracts | | | Expiration
Date | | | Notional
Amount | | | Value /
Unrealized
Appreciation
(Depreciation) | |
Ultra Long-Term U.S. Treasury Bond—Short Position | | | 1,399 | | | | 9/19/18 | | | $ | (223,227,938 | ) | | $ | (4,288,765 | ) |
| | |
| PAGE 14 § DODGE & COX INCOME FUND | | See accompanying Notes to Financial Statements |
| | | | |
STATEMENT OF ASSETS AND LIABILITIES (unaudited) | |
| |
| | | June 30, 2018 | |
ASSETS: | | | | |
Investments in securities, at value (cost $56,515,494,577) | | $ | 56,302,728,286 | |
Cash | | | 4,489,142 | |
Deposits with broker for futures contracts | | | 4,616,700 | |
Receivable for variation margin for futures contracts | | | 87,760 | |
Receivable for investments sold | | | 624,676,492 | |
Receivable for Fund shares sold | | | 47,246,217 | |
Interest receivable | | | 417,927,997 | |
Prepaid expenses and other assets | | | 86,405 | |
| | | | |
| | | 57,401,858,999 | |
| | | | |
LIABILITIES: | | | | |
Payable for investments purchased | | | 944,145,826 | |
Payable for Fund shares redeemed | | | 183,109,021 | |
Management fees payable | | | 18,482,114 | |
Accrued expenses | | | 2,755,302 | |
| | | | |
| | | 1,148,492,263 | |
| | | | |
NET ASSETS | | $ | 56,253,366,736 | |
| | | | |
NET ASSETS CONSIST OF: | | | | |
Paid in capital | | $ | 56,316,240,282 | |
Undistributed net investment income | | | 21,169,777 | |
Undistributed net realized gain | | | 133,011,733 | |
Net unrealized depreciation | | | (217,055,056 | ) |
| | | | |
| | $ | 56,253,366,736 | |
| | | | |
Fund shares outstanding (par value $0.01 each, unlimited shares authorized) | | | 4,207,540,153 | |
Net asset value per share | | $ | 13.37 | |
|
STATEMENT OF OPERATIONS (unaudited) | |
| |
| | | Six Months Ended June 30, 2018 | |
INVESTMENT INCOME: | | | | |
Dividends | | $ | 16,053,267 | |
Interest | | | 890,651,114 | |
| | | | |
| | | 906,704,381 | |
| | | | |
EXPENSES: | | | | |
Management fees | | | 109,943,752 | |
Custody and fund accounting fees | | | 410,617 | |
Transfer agent fees | | | 4,066,917 | |
Professional services | | | 105,633 | |
Shareholder reports | | | 1,221,599 | |
Registration fees | | | 910,431 | |
Trustees’ fees | | | 162,083 | |
Miscellaneous | | | 347,967 | |
| | | | |
| | | 117,168,999 | |
| | | | |
NET INVESTMENT INCOME | | | 789,535,382 | |
| | | | |
REALIZED AND UNREALIZED GAIN (LOSS): | | | | |
Net realized gain | | | | |
Investments in securities | | | 101,508,820 | |
Futures contracts | | | 36,244,375 | |
Net change in unrealized appreciation/depreciation | | | | |
Investments in securities | | | (1,613,911,973 | ) |
Futures contracts | | | (5,528,842 | ) |
| | | | |
Net realized and unrealized loss | | | (1,481,687,620 | ) |
| | | | |
NET CHANGE IN NET ASSETS
FROM OPERATIONS | | $ | (692,152,238 | ) |
| | | | |
| | | | | | | | |
STATEMENT OF CHANGES IN NET ASSETS (unaudited) | |
| | |
| | | Six Months Ended June 30, 2018 | | | Year Ended
December 31, 2017 | |
OPERATIONS: | | | | | | | | |
Net investment income | | $ | 789,535,382 | | | $ | 1,407,714,701 | |
Net realized gain (loss) | | | 137,753,195 | | | | 238,365,078 | |
Net change in unrealized appreciation/depreciation | | | (1,619,440,815 | ) | | | 498,474,373 | |
| | | | | | | | |
| | | (692,152,238 | ) | | | 2,144,554,152 | |
| | | | | | | | |
| | |
DISTRIBUTIONS TO SHAREHOLDERS FROM: | | | | | | | | |
Net investment income | | | (786,453,248 | ) | | | (1,404,908,219 | ) |
Net realized gain | | | (126,561,039 | ) | | | (140,759,824 | ) |
| | | | | | | | |
Total distributions | | | (913,014,287 | ) | | | (1,545,668,043 | ) |
| | | | | | | | |
| | |
FUND SHARE
TRANSACTIONS: | | | | | | | | |
Proceeds from sale of shares | | | 8,132,257,405 | | | | 14,912,910,845 | |
Reinvestment of distributions | | | 754,346,051 | | | | 1,266,629,663 | |
Cost of shares redeemed | | | (5,314,830,453 | ) | | | (9,124,121,824 | ) |
| | | | | | | | |
Net change from Fund share transactions | | | 3,571,773,003 | | | | 7,055,418,684 | |
| | | | | | | | |
Total change in net assets | | | 1,966,606,478 | | | | 7,654,304,793 | |
| | |
NET ASSETS: | | | | | | | | |
Beginning of period | | | 54,286,760,258 | | | | 46,632,455,465 | |
| | | | | | | | |
End of period (including undistributed net investment income of $21,169,777 and $18,087,643, respectively) | | $ | 56,253,366,736 | | | $ | 54,286,760,258 | |
| | | | | | | | |
| | |
SHARE INFORMATION: | | | | | | | | |
Shares sold | | | 599,511,434 | | | | 1,083,349,260 | |
Distributions reinvested | | | 56,268,185 | | | | 92,213,550 | |
Shares redeemed | | | (392,402,442 | ) | | | (663,262,463 | ) |
| | | | | | | | |
Net change in shares outstanding | | | 263,377,177 | | | | 512,300,347 | |
| | | | | | | | |
| | |
| See accompanying Notes to Financial Statements | | DODGE & COX INCOME FUND §PAGE 15 |
NOTES TO FINANCIAL STATEMENTS (unaudited)
NOTE 1—ORGANIZATION AND SIGNIFICANT ACCOUNTING POLICIES
Dodge & Cox Income Fund (the “Fund”) is one of the series constituting the Dodge & Cox Funds (the “Trust” or the “Funds”). The Trust is organized as a Delaware statutory trust and is registered under the Investment Company Act of 1940, as amended, as an open-end management investment company. The Fund commenced operations on January 3, 1989, and seeks high and stable current income consistent with long-term preservation of capital. Risk considerations and investment strategies of the Fund are discussed in the Fund’s Prospectus.
The financial statements have been prepared in conformity with accounting principles generally accepted in the United States of America, which require the use of estimates and assumptions by management. Actual results may differ from those estimates. Significant accounting policies are as follows:
Security valuation The Fund’s net assets are normally valued as of the scheduled close of trading on the New York Stock Exchange (NYSE), generally 4 p.m. Eastern Time, each day that the NYSE is open for business.
Debt securities and derivatives traded over the counter are valued using prices received from independent pricing services which utilize dealer quotes, recent transaction data, pricing models, and other inputs to arrive at market-based valuations. Pricing models may consider quoted prices for similar securities, interest rates, cash flows (including prepayment speeds), and credit risk. Exchange-traded derivatives are valued at the settlement price determined by the relevant exchange. Short-term securities less than 60 days to maturity may be valued at amortized cost if amortized cost approximates current value. Mutual funds are valued at their respective net asset values. Security values are not discounted based on the size of the Fund’s position and may differ from the value a Fund receives upon sale of the securities. All securities held by the Fund are denominated in U.S. dollars.
If market quotations are not readily available or if normal valuation procedures produce valuations that are deemed unreliable or inappropriate under the circumstances existing at the time, the investment will be valued at fair value as determined in good faith by or under the direction of the Fund’s Board of Trustees. The Board of Trustees has appointed Dodge & Cox, the Fund’s investment manager, to make fair value determinations in accordance with the Dodge & Cox Funds Valuation Policies (“Valuation Policies”), subject to Board oversight. Dodge & Cox has established a Pricing Committee that is comprised of representatives from Treasury, Legal, Compliance, and Operations. The Pricing Committee is responsible for implementing the Valuation Policies, including determining the fair value of securities and other investments when necessary. The Pricing Committee considers relevant indications of value that are reasonably available to it in determining the fair value assigned to a particular security, such as the value of similar financial instruments, trading volumes, contractual restrictions on disposition, related corporate actions, and changes in economic conditions. In doing so, the Pricing Committee employs various
methods for calibrating fair valuation approaches, including a regular review of key inputs and assumptions, back-testing, and review of any related market activity.
Valuing securities through a fair value determination involves greater reliance on judgment than valuation of securities based on readily available market quotations. In some instances, lack of information and uncertainty as to the significance of information may lead to a conclusion that a prior valuation is the best indication of a security’s value. When fair value pricing is employed, the prices of securities used by the Fund to calculate its net asset value may differ from quoted or published prices for the same securities.
Security transactions, investment income, expenses, and distributions Security transactions are recorded on the trade date. Realized gains and losses on securities sold are determined on the basis of identified cost.
Interest income is recorded on the accrual basis. Interest income includes coupon interest, amortization of premium and accretion of discount on debt securities, and gain/loss on paydowns. The ability of the issuers of the debt securities held by the Fund to meet their obligations may be affected by economic developments in a specific industry, state, or region. Debt obligations may be placed on non-accrual status and related interest income may be reduced by ceasing current accruals and writing off interest receivables when the collection of all or a portion of interest has become doubtful. A debt obligation is removed from non-accrual status when the issuer resumes interest payments or when collectibility of interest is reasonably assured. Dividend income is recorded on the ex-dividend date.
Expenses are recorded on the accrual basis. Some expenses of the Trust can be directly attributed to a specific series. Expenses which cannot be directly attributed are allocated among the Funds in the Trust using methodologies determined by the nature of the expense.
Distributions to shareholders are recorded on the ex-dividend date.
Repurchase agreements Repurchase agreements are transactions under which a Fund purchases a security from a dealer counterparty and agrees to resell the security to that counterparty on a specified future date at the same price, plus a specified interest rate. The Fund’s repurchase agreements are secured by U.S. government or agency securities. It is the Fund’s policy that its custodian take possession of the underlying collateral securities, the fair value of which exceeds the principal amount of the repurchase transaction, including accrued interest, at all times. In the event of default by the counterparty, the Fund has the contractual right to liquidate the securities and to apply the proceeds in satisfaction of the obligation.
Futures contracts Futures contracts involve an obligation to purchase or sell (depending on whether the Fund has entered a long or short futures contract, respectively) an asset at a future date, at a price set at the time of the contract. Upon entering into a futures contract, the Fund is required to deposit an amount of cash or liquid assets (referred to as initial margin) in a segregated account with the clearing broker. Subsequent payments (referred
PAGE 16 § DODGE & COX INCOME FUND
NOTES TO FINANCIAL STATEMENTS (unaudited)
to as variation margin) to and from the clearing broker are made on a daily basis based on changes in the market value of futures contracts. Futures contracts are traded publicly and their market value changes daily. Changes in the market value of open futures contracts are recorded as unrealized appreciation or depreciation in the Statement of Operations. Realized gains and losses on futures contracts are recorded in the Statement of Operations at the closing or expiration of the contracts. Cash deposited with a broker as initial margin is recorded in the Statement of Assets and Liabilities. A receivable and/or payable to brokers for daily variation margin is also recorded in the Statement of Assets and Liabilities.
Investments in futures contracts may include certain risks, which may be different from, and potentially greater than, those of the underlying securities. To the extent the Fund uses futures, it is exposed to additional volatility and potential losses resulting from leverage.
The Fund has maintained short Treasury futures contracts to assist with the management of the portfolio’s interest rate exposure. During the six months ended June 30, 2018, these Treasury futures contracts had notional values up to 2% of net assets.
Indemnification Under the Trust’s organizational documents, its officers and trustees are indemnified against certain liabilities arising out of the performance of their duties to the Trust. In addition, in the normal course of business the Trust enters into contracts that provide general indemnities to other parties. The Trust’s maximum exposure under these arrangements is unknown as this would involve future claims that may be made against the Trust that have not yet occurred.
NOTE 2—VALUATION MEASUREMENTS
Various inputs are used in determining the value of the Fund’s investments. These inputs are summarized in the three broad levels listed below.
| § | | Level 1: Quoted prices in active markets for identical securities |
| § | | Level 2: Other significant observable inputs (including quoted prices for similar securities, market indices, interest rates, credit risk, forward exchange rates, etc.) |
| § | | Level 3: Significant unobservable inputs (including Fund management’s assumptions in determining the fair value of investments) |
The inputs or methodology used for valuing securities are not necessarily an indication of the risk associated with investing in those securities.
The following is a summary of the inputs used to value the Fund’s holdings at June 30, 2018:
| | | | | | | | |
| Classification(a) | | LEVEL 1 (Quoted Prices) | | | LEVEL 2 (Other Significant Observable Inputs) | |
Securities | | | | | | | | |
Debt Securities | | | | | | | | |
U.S. Treasury | | $ | — | | | $ | 9,769,881,655 | |
Government-Related | | | — | | | | 3,400,204,535 | |
Securitized | | | — | | | | 22,823,490,678 | |
Corporate | | | — | | | | 19,178,976,780 | |
Short-term Investments | | | | | | | | |
Commercial Paper | | | — | | | | 487,059,003 | |
Repurchase Agreement | | | — | | | | 417,706,000 | |
Money Market Fund | | | 225,409,635 | | | | — | |
| | | | | | | | |
Total Securities | | $ | 225,409,635 | | | $ | 56,077,318,651 | |
| | | | | | | | |
Other Investments | | | | | | | | |
Futures Contracts | | | | | | | | |
Depreciation | | $ | (4,288,765 | ) | | $ | — | |
| | | | | | | | | |
| (a) | There were no transfers between Level 1 and Level 2 during the period. There were no Level 3 securities at June 30, 2018 and December 31, 2017, and there were no transfers to Level 3 during the period. |
NOTE 3—RELATED PARTY TRANSACTIONS
Management fees Under a written agreement approved by a unanimous vote of the Board of Trustees, the Fund pays a management fee monthly at an annual rate of 0.50% of the Fund’s average daily net assets up to $100 million and 0.40% of the Fund’s average daily net assets in excess of $100 million to Dodge & Cox, investment manager of the Fund. The agreement further provides that Dodge & Cox shall waive its fee to the extent that such fee plus all other ordinary operating expenses of the Fund exceed 1% of the average daily net assets for the year.
Fund officers and trustees All officers and two of the trustees of the Trust are officers or employees of Dodge & Cox. The Trust pays a fee only to those trustees who are not affiliated with Dodge & Cox.
NOTE 4—INCOME TAX INFORMATION AND DISTRIBUTIONS TO SHAREHOLDERS
A provision for federal income taxes is not required since the Fund intends to continue to qualify as a regulated investment company under Subchapter M of the Internal Revenue Code and distribute all of its taxable income to shareholders. Distributions are determined in accordance with income tax regulations, and such amounts may differ from net investment income and realized gains for financial reporting purposes. Financial reporting records are adjusted for permanent book to tax differences at year end to reflect tax character. Book to tax differences are primarily due to differing treatments of wash sales, net short-term realized gain (loss), derivatives, and Treasury Inflation-Protected Securities.
DODGE & COX INCOME FUND §PAGE 17
NOTES TO FINANCIAL STATEMENTS (unaudited)
Distributions during the periods noted below were characterized as follows for federal income tax purposes:
| | | | | | | | |
| | | Six Months Ended
June 30, 2018 | | | Year Ended December 31, 2017 | |
Ordinary income | | $ | 786,453,248 | | | $ | 1,404,908,219 | |
| | ($ | 0.190 per share | ) | | ($ | 0.380 per share | ) |
Long-term capital gain | | $ | 126,561,039 | | | $ | 140,759,824 | |
| | ($ | 0.031 per share | ) | | ($ | 0.037 per share | ) |
The components of distributable earnings on a tax basis are reported as of the Fund’s most recent year end. At December 31, 2017, the tax basis components of distributable earnings were as follows:
| | | | |
Undistributed ordinary income | | $ | 18,241,722 | |
Undistributed long-term capital gain | | | 123,344,088 | |
At June 30, 2018, unrealized appreciation and depreciation for investments and derivatives based on cost for federal income tax purposes was as follows:
| | | | |
Tax cost | | $ | 56,511,478,732 | |
| | | | |
Unrealized appreciation | | | 682,776,788 | |
Unrealized depreciation | | | (895,815,999 | ) |
| | | | |
Net unrealized depreciation | | | (213,039,211 | ) |
| | | | | |
Fund management has reviewed the tax positions for open periods (three years and four years, respectively, from filing the Fund’s Federal and State tax returns) as applicable to the Fund, and has determined that no provision for income tax is required in the Fund’s financial statements.
NOTE 5—LOAN FACILITIES
Pursuant to an exemptive order issued by the Securities and Exchange Commission (SEC), the Fund may participate in an interfund lending facility (Facility). The Facility allows the Fund to borrow money from or loan money to the Funds. Loans under the Facility are made for temporary or emergency purposes, such as to fund shareholder redemption requests. Interest on borrowings is the average of the current repurchase agreement rate and the bank loan rate. There was no activity in the Facility during the period.
All Funds in the Trust participate in a $500 million committed credit facility (Line of Credit) with State Street Bank and Trust Company, to be utilized for temporary or emergency purposes to fund shareholder redemptions or for other short-term liquidity purposes. The maximum amount available to the Fund is $250 million. Each Fund pays an annual commitment fee on its pro-rata portion of the Line of Credit. For the six months ended June 30, 2018, the Fund’s commitment fee amounted to $162,859 and is reflected as a Miscellaneous Expense in the Statement of Operations. Interest on borrowings is charged at the prevailing rate. There were no borrowings on the Line of Credit during the period.
NOTE 6—PURCHASES AND SALES OF INVESTMENTS
For the six months ended June 30, 2018, purchases and sales of securities, other than short-term securities and U.S. government securities, aggregated $5,409,062,697 and $1,919,434,377 respectively. For the six months ended June 30, 2018, purchases and sales of U.S. government securities aggregated $8,850,367,455 and $8,113,686,402 respectively.
NOTE 7—NEW ACCOUNTING GUIDANCE
In March 2017, the Financial Accounting Standards Board issued an update to amend the amortization period for certain purchased callable debt securities held at a premium. The amendments shorten the amortization period for premiums to the earliest call date, but do not require an accounting change for securities held at a discount. The amendments are effective for financial statements for fiscal years beginning after December 15, 2018, and interim periods within those fiscal years. Management is evaluating the impact, if any, of this guidance on the Fund’s financial statements and disclosures.
NOTE 8—SUBSEQUENT EVENTS
Fund management has determined that no material events or transactions occurred subsequent to June 30, 2018, and through the date of the Fund’s financial statements issuance, which require additional disclosure in the Fund’s financial statements.
PAGE 18 § DODGE & COX INCOME FUND
FINANCIAL HIGHLIGHTS (unaudited)
| | | | | | | | | | | | | | | | | | | | | | | | |
SELECTED DATA AND RATIOS (for a share outstanding throughout each period) | | Six Months
Ended June 30, | | | Year Ended December 31, | |
| | | 2018 | | | 2017 | | | 2016 | | | 2015 | | | 2014 | | | 2013 | |
| | | | | | | | |
Net asset value, beginning of period | | | $13.76 | | | | $13.59 | | | | $13.29 | | | | $13.78 | | | | $13.53 | | | | $13.86 | |
Income from investment operations: | | | | | | | | | | | | | | | | | | | | | | | | |
Net investment income | | | 0.19 | | | | 0.38 | | | | 0.42 | | | | 0.40 | | | | 0.39 | | | | 0.42 | |
Net realized and unrealized gain (loss) | | | (0.36 | ) | | | 0.21 | | | | 0.32 | | | | (0.48 | ) | | | 0.35 | | | | (0.33 | ) |
| | | | | | | | |
Total from investment operations | | | (0.17 | ) | | | 0.59 | | | | 0.74 | | | | (0.08 | ) | | | 0.74 | | | | 0.09 | |
| | | | | | | | |
Distributions to shareholders from: | | | | | | | | | | | | | | | | | | | | | | | | |
Net investment income | | | (0.19 | ) | | | (0.38 | ) | | | (0.42 | ) | | | (0.40 | ) | | | (0.39 | ) | | | (0.42 | ) |
Net realized gain | | | (0.03 | ) | | | (0.04 | ) | | | (0.02 | ) | | | (0.01 | ) | | | (0.10 | ) | | | — | |
| | | | | | | | |
Total distributions | | | (0.22 | ) | | | (0.42 | ) | | | (0.44 | ) | | | (0.41 | ) | | | (0.49 | ) | | | (0.42 | ) |
| | | | | | | | |
Net asset value, end of period | | | $13.37 | | | | $13.76 | | | | $13.59 | | | | $13.29 | | | | $13.78 | | | | $13.53 | |
| | | | | | | | |
Total return | | | (1.23 | )% | | | 4.36 | % | | | 5.62 | % | | | (0.59 | )% | | | 5.48 | % | | | 0.64 | % |
Ratios/supplemental data: | | | | | | | | | | | | | | | | | | | | | | | | |
Net assets, end of period (millions) | | | $56,253 | | | | $54,287 | | | | $46,632 | | | | $43,125 | | | | $39,128 | | | | $24,654 | |
Ratio of expenses to average net assets | | | 0.43 | %(a) | | | 0.43 | % | | | 0.43 | % | | | 0.43 | % | | | 0.44 | % | | | 0.43 | % |
Ratio of net investment income to average net assets | | | 2.87 | %(a) | | | 2.80 | % | | | 3.11 | % | | | 2.97 | % | | | 2.89 | % | | | 3.00 | % |
Portfolio turnover rate | | | 19 | % | | | 19 | % | | | 27 | % | | | 24 | % | | | 27 | % | | | 38 | % |
See accompanying Notes to Financial Statements
DODGE & COX INCOME FUND §PAGE 19
FUND HOLDINGS
The Fund provides a complete list of its holdings four times each fiscal year, as of the end of each quarter. The Fund files the lists with the Securities and Exchange Commission (SEC) on Form N-CSR (second and fourth quarters) and Form N-Q (first and third quarters). Shareholders may view the Fund’s Forms N-CSR and N-Q on the SEC’s website at sec.gov. Forms N-CSR and N-Q may also be reviewed and copied at the SEC’s Public Reference Room in Washington, DC. Information regarding the operations of the Public Reference Room may be obtained by calling 800-SEC-0330. A list of the Fund’s quarter-end holdings is also available at dodgeandcox.com on or about 15 days following each quarter end and remains available on the web site until the list is updated in the subsequent quarter.
PROXY VOTING
For a free copy of the Fund’s proxy voting policies and procedures, please call 800-621-3979, visit the Fund’s website at dodgeandcox.com, or visit the SEC’s website at sec.gov. Information regarding how the Fund voted proxies relating to portfolio securities during the most recent 12-month period ending June 30 is also available at dodgeandcox.com or at sec.gov.
HOUSEHOLD MAILINGS
The Fund routinely mails shareholder reports and summary prospectuses to shareholders and, on occasion, proxy statements. In order to reduce the volume of mail, when possible, only one copy of these documents will be sent to shareholders who are part of the same family and share the same residential address.
If you have a direct account with the Funds and you do not want the mailing of shareholder reports and summary prospectuses combined with other members in your household, contact the Funds at 800-621-3979. Your request will be implemented within 30 days.
PAGE 20 § DODGE & COX INCOME FUND
[THIS PAGE INTENTIONALLY LEFT BLANK]
DODGE & COX INCOME FUND §PAGE 21
[THIS PAGE INTENTIONALLY LEFT BLANK]
PAGE 22 § DODGE & COX INCOME FUND
TRUSTEES AND EXECUTIVE OFFICERS
Charles F. Pohl, Chairman and Trustee
Chairman, Dodge & Cox
Dana M. Emery, President and Trustee
Chief Executive Officer and President, Dodge & Cox
Caroline M. Hoxby, Independent Trustee
Professor of Economics, Stanford University; Senior Fellow, Hoover Institution
Thomas A. Larsen, Independent Trustee
Former Senior Counsel, Arnold & Porter Kaye Scholer LLP
Ann Mather, Independent Trustee
Former Executive Vice President, Chief Financial Officer, and Company Secretary, Pixar Animation Studios
Robert B. Morris III, Independent Trustee
Former Partner and Managing director - Global Investment Research, Goldman Sachs; former Advisory Director, The Presidio Group
Gary Roughead, Independent Trustee
Robert and Marion Oster Distinguished Military Fellow, Hoover Institution; former U.S. Navy Chief of Naval Operations
Mark E. Smith, Independent Trustee
Former Executive Vice President and Managing Director-Fixed Income, Loomis Sayles & Company, L.P.
John B. Taylor, Independent Trustee
Professor of Economics, Stanford University; Senior Fellow, Hoover Institution; and former Under Secretary for International Affairs, United States Treasury
Diana S. Strandberg, Senior Vice President
Senior Vice President and Director of International Equity, Dodge & Cox
David H. Longhurst, Treasurer
Vice President and Assistant Treasurer, Dodge & Cox
Katherine M. Primas, Chief Compliance Officer
Vice President and Chief Compliance Officer, Dodge & Cox
Roberta R.W. Kameda, Secretary
Vice President, General Counsel, and Secretary, Dodge & Cox
William W. Strickland, Vice President, Assistant Secretary, and Assistant Treasurer
Vice President and Chief Operating Officer, Dodge & Cox
Additional information about the Trust’s Trustees and Officers is available in the Trust’s Statement of Additional Information (SAI). You can get a free copy of the SAI by visiting the Funds’ website at dodgeandcox.com or calling 800-621-3979.
DODGE & COX INCOME FUND §PAGE 23
dodgeandcox.com
For Fund literature, transactions, and account
information, please visit the Funds’ website.
or write or call:
DODGE & COX FUNDS
c/o DST Asset Manager Solutions, Inc.
P.O. Box 8422
Boston, Massachusetts 02266-8422
(800) 621-3979
INVESTMENT MANAGER
Dodge & Cox
555 California Street, 40th Floor
San Francisco, California 94104
(415) 981-1710
This report is submitted for the general information of the shareholders of the Fund. The report is not authorized for distribution to prospective investors in the Fund unless it is accompanied by a current prospectus.
This report reflects our views, opinions, and portfolio holdings as of June 30, 2018, the end of the reporting period. Any such views are subject to change at any time based upon market or other conditions and Dodge & Cox disclaims any responsibility to update such views. These views may not be relied on as investment advice and, because investment decisions for a Dodge & Cox Fund are based on numerous factors, may not be relied on as an indication of trading intent on behalf of any Dodge & Cox Fund.
DODGE & COX FUNDS®
Semi-Annual Report
June 30, 2018
Global Bond Fund
ESTABLISHED 2014
TICKER: DODLX
6/18 GBF SAR Printed on recycled paper
TO OUR SHAREHOLDERS
The Dodge & Cox Global Bond Fund had a total return of –1.9% for the six months ended June 30, 2018, compared to a return of –1.5% for the Bloomberg Barclays Global Aggregate Bond Index (Bloomberg Barclays Global Agg).
MARKET COMMENTARY
Global bond market returns were challenged in the first half of 2018 as U.S. interest rates rose, the U.S. dollar strengthened, and corporate bonds underperformed. While the global economic expansion remains strong, momentum slowed in some regions, particularly Europe, and trade tensions rose, posing a mounting risk to the global outlook.
Expressing optimism about the U.S. economy, the Federal Reserve (Fed) hiked interest rates by 25 basis points (bps)(a) in both March and June, and signaled that two more increases are likely during the remainder of 2018. Notably, the Fed’s preferred measure of inflation recently reached its 2% target for the first time since 2012. The U.S. 10-year Treasury yield briefly reached 3.11% in May, its highest level since 2011, before closing the first half at 2.86%. Consumer confidence and labor market data in the United States also showed sustained momentum, contrasting with somewhat lackluster economic data coming from Europe. The European Central Bank (ECB) announced that it would end its bond purchase program in December and keep rates steady through the summer of 2019. Ten-year German bund yields finished the first half of the year at a meager 0.30%.
Despite starting 2018 on a depreciating trend, the trade-weighted U.S. dollar rose 4.2%, reversing some of its decline in 2017. The ECB’s dovish tone, combined with uncertainty around a new populist coalition government in Italy, put pressure on the euro (down 2.7%) and several related European currencies (e.g., Polish zloty, Swedish krona). The strong U.S. dollar and the prospects for higher U.S. interest rates and rising tariffs weighed on emerging market debt and currencies. This weaker external environment, combined with idiosyncratic political and economic vulnerabilities, caused significant sell-offs in Argentina, Brazil, and Turkey.
Weakness in corporate bond returns was widespread across industries. BBB-rated credits,(b) the lowest rung on the investment-grade ladder, fared worst as concerns grew about the growing size of this market segment and prospects rose for more debt-financed mergers and acquisitions, especially in the Communications and Health Care sectors. After reaching the lowest levels since the financial crisis, credit yield premiums(c) widened beginning in February. At June 30, the Bloomberg Barclays Global Agg Corporate OAS was 125 bps, the highest level since December 2016 and near long-term median levels. Despite this move, yield premiums remain fairly low in a long-term historical context, and the fundamental outlook for corporations appears strong.
INVESTMENT STRATEGY
Compared to 2016 and 2017, the market backdrop in 2018 has been a difficult one in which to generate returns from the three main return levers of our global bond strategy—credit, currency,
and interest rates. Rising yields across broad swaths of the market (e.g., corporate bonds, emerging market local debt) and depreciation of almost every currency versus the dollar drove negative returns across most of our investment universe. While we are disappointed to report negative returns, we believe these recent trends create interesting opportunities. Bond yields and non-U.S. currencies now trade at more attractive entry points for investors. The yield of the Fund, which increased during the first half of the year, is the outcome of a dynamic and deliberate investment process that is anchored in fundamental research and designed to identify our best investment ideas across the globe.
During the first six months of 2018, as valuations for “risk assets” such as corporate bonds and emerging market debt fell, we actively increased our exposure to selected issuers in these areas of the market. The following sections provide more context and specifics around the Fund’s positioning and outlook.
Credit: Opportunities Abound
As corporate bond prices fell over the period, our research team identified many compelling investment opportunities. In fact, the Fund’s corporate bond weighting rose by nine percentage points (from 38% to 47%). This is a clear departure from positioning changes in the previous two years (when valuations were rising), during which we reduced the corporate weighting by approximately 20 percentage points. The additions to the Fund came from both the primary and secondary markets, and a variety of credit-rating categories and industries. At a high level, emerging markets, Italian corporates, and corporate hybrid securities of high-quality industrials (a subordinated bond structure) were key focus areas. However, as always, our portfolio construction is bottom-up, based on deep analysis on an issuer-by-issuer basis. For example, we initiated a position in CVS(d) and added to our Cemex position.
In March, the Fund purchased several bonds issued by CVS as part of a $40 billion new issue related to CVS’s $77 billion purchase of Aetna, a health insurance provider. The transaction will create a large, diverse, and vertically integrated healthcare platform. We believe the income offered on the bonds was attractive given the immense scale of the combined company (one of the five largest companies in the United States in terms of revenue generation) and our confidence in the management team’s ability and commitment to pay down debt in the coming years.
Cemex, a Mexico-domiciled global building materials company, has been a holding of the Fund for many years; we have adjusted our position size over time in response to valuation considerations. In recent months, the yield on our Cemex holding increased meaningfully, reflecting somewhat weaker operating profitability and concerns about the political and economic outlook in Mexico. We reviewed the risks and decided to increase the Fund’s position from 1.2% to 1.7%. We believe the fears about Mexico are overdone and that Cemex’s long-term operating prospects are strong. Importantly, over the last several years, the management team has prioritized reducing leverage and achieving an investment-grade credit rating, which aligns well with our interests as creditors.
PAGE 2 § DODGE & COX GLOBAL BOND FUND
Currency: Recent Emerging Market Pains Could Turn Into Gains
The Fund holds 18%(e) in local emerging market bonds, invested across seven countries and currencies. The Fund’s investments in Colombia and Mexico government bonds performed strongly, while the Fund’s investments in Argentina, India, Indonesia, Poland, and Turkey suffered. We believe fears regarding a broad emerging markets meltdown are unfounded. First, many emerging market economies have become more resilient over time. In many cases, current account deficits are lower, inflation is lower, and the composition of debt has improved as countries have developed their own capital markets, enabling lower foreign currency borrowing and longer average debt maturities. Second, while there are commonalities among emerging market countries, they are diverse in terms of politics, economic prospects, capital market developments, and other relevant factors. Third, the recent price declines have been significant and, in some cases, overdone relative to our assessment of fair value. For several countries, real rates and currency valuations look quite appealing, and we added incrementally to a number of positions during the period. We are optimistic regarding their total return prospects, given their attractive yield coupled with the potential for currency stability or appreciation.
For example, we modestly increased our exposure to the Argentine peso, following a significant weakening. One of the Fund’s holdings is a Province of Buenos Aires bond that now yields over 50%, providing a significant cushion against further currency depreciation. 2018 has been a difficult year for Argentina. As the appetite for emerging market assets declined, fears escalated about Argentina’s large external funding needs given its sizeable twin (fiscal and current account) deficits and still underdeveloped domestic capital markets. With confidence in policy makers and the inflation outlook faltering, the central bank was forced to raise rates by nearly 13 percentage points in order to anchor inflation expectations and stem currency depreciation. Despite some deterioration in the economic and political outlook, we believe that President Macri’s institutional and macroeconomic reform agenda remains credible. We are also comforted by the $50 billion, 3-year IMF agreement reached in June, which should lessen tail risk and provide the authorities some time to continue advancing much-needed reforms.
Rates: Picking Our Spots
The Fund’s aggregate duration(f) positioning (3.6 years) remained relatively unchanged over the period. The front-end of the U.S. yield curve has risen to attractive levels (e.g., 2-year U.S. Treasury rate of 2.5%) relative to the post-financial crisis era and to many other current developed market yields (e.g., Germany, Japan). However, longer-term U.S. interest rates (e.g., 10-years maturity and longer) have risen less and, in our view, warrant caution as increases in this part of the yield curve could have a big negative price impact. Furthermore, longer-term rates in developed markets outside the United States remain at historically low levels, providing little cushion against any negative price impact from rising rates.
In contrast, nominal and inflation-adjusted longer-term interest rates in several emerging market countries look quite attractive. For example, the Fund holds a small position in longer-term Indonesia local government bonds that yield 8.4%. We believe that this yield will fall over time given the inflation outlook, a proactive central bank, and the continuation of positive economic and institutional reforms.
IN CLOSING
Recent market dynamics have created short-term challenges for investors but also ample opportunities for active global bond managers. We have confidence in our well-established investment approach and believe the Fund is well positioned to meet our long-term investment objectives. Thank you for your continued confidence in our firm. As always, we welcome your comments and questions.
For the Board of Trustees,
| | |
| | |
Charles F. Pohl, Chairman | | Dana M. Emery, President |
August 1, 2018
| (a) | | One basis point is equal to 1/100th of 1%. |
| (b) | | Credit securities refers to corporate bonds and government-related securities, as classified by Bloomberg. |
| (c) | | Yield premiums are one way to measure a security’s valuation. Narrowing yield premiums result in a higher valuation. Widening yield premiums result in a lower valuation. |
| (d) | | The use of specific examples does not imply that they are more or less attractive investments than the Fund’s other holdings. |
| (e) | | Unless otherwise specified, all weightings and characteristics are as of June 30, 2018. |
| (f) | | Duration is a measure of a bond’s (or a bond portfolio’s) price sensitivity to changes in interest rates. |
DODGE & COX GLOBAL BOND FUND §PAGE 3
YEAR-TO-DATE PERFORMANCE REVIEW
The Fund underperformed the Bloomberg Barclays Global Agg by 0.5 percentage points year to date.
Key Detractors from Relative Results
| | § | | Certain emerging market local currency bonds underperformed, including Province of Buenos Aires, Indonesia, and India (combined 5% versus 0% in the Bloomberg Barclays Global Agg). | |
| | § | | The Fund’s lack of exposure to interest rates in the Eurozone hurt relative returns as interest rates fell. | |
| | § | | The Fund’s high exposure to corporate bonds (38% versus 19% in the Bloomberg Barclays Global Agg) hurt relative performance as credit yield premiums rose. | |
Key Contributors to Relative Results
| | § | | Currency positioning contributed positively to relative performance, led by a large underweight in the euro (0% versus 26% in the Bloomberg Barclays Global Agg), and overweights in the Mexican and Colombian pesos (combined 9% versus 0%). | |
| | § | | The yield advantage of the Fund contributed positively to performance. | |
| | § | | Certain credits performed well, particularly Bank of America trust preferred securities, which outperformed after redemption by the issuer at a premium to the market price. Other outperformers included Citigroup capital securities, Rio Oil Finance Trust, and Macy’s. | |
KEY CHARACTERISTICS OF DODGE & COX
Independent Organization
Dodge & Cox is one of the largest privately owned investment managers in the world. We remain committed to independence, with a goal of providing the highest quality investment management service to our existing clients.
Over 85 Years of Investment Experience
Dodge & Cox was founded in 1930. We have a stable and well-qualified team of investment professionals, most of whom have spent their entire careers at Dodge & Cox.
Experienced Investment Team
The Global Fixed Income Investment Committee, which is the decision-making body for the Global Bond Fund, is a six-member committee with an average tenure at Dodge & Cox of 20 years.
One Business with a Single Research Office
Dodge & Cox manages equity (domestic, international, and global), fixed income (domestic and global), and balanced investments, operating from one office in San Francisco.
Consistent Investment Approach
Our team decision-making process involves thorough, bottom-up fundamental analysis of each investment.
Long-Term Focus and Low Expenses
We invest with a three- to five-year investment horizon, which has historically resulted in low turnover relative to our peers. We manage Funds that maintain low expense ratios.
Risks: The yields and market values of the instruments in which the Fund invests may fluctuate. Accordingly, an investment may be worth more or less than its original cost. Debt securities are subject to interest rate risk, credit risk, and prepayment and call risk, all of which could have adverse effects on the value of the Fund. A low interest rate environment creates an elevated risk of future negative returns. Financial intermediaries may restrict their market making activities for certain debt securities, which may reduce the liquidity and increase the volatility of such securities. Investing in non-U.S. securities may entail risk due to foreign economic and political developments; this risk may be increased when investing in emerging markets. The Fund is also subject to currency risk. Please read the prospectus and summary prospectus for specific details regarding the Fund’s risk profile.
PAGE 4 § DODGE & COX GLOBAL BOND FUND
GROWTH OF $10,000 SINCE INCEPTION
FOR AN INVESTMENT MADE ON DECEMBER 5, 2012
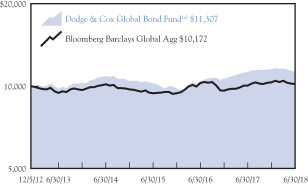
AVERAGE ANNUAL TOTAL RETURN
FOR PERIODS ENDED JUNE 30, 2018
| | | | | | | | | | | | | | | | |
| | | 1 Year | | | 3 Years | | | 5 Years | | | Since
Inception
(12/5/12) | |
| | | | | | | | | | | | | | | | |
Dodge & Cox Global Bond Fund(a) | | | 0.38 | % | | | 3.41 | % | | | 2.93 | % | | | 2.24 | % |
Bloomberg Barclays Global Aggregate Bond Index (Bloomberg Barclays Global Agg) | | | 1.36 | | | | 2.58 | | | | 1.50 | | | | 0.31 | |
| (a) | | Expense reimbursements have been in effect for the Fund since its inception. Without the expense reimbursements, returns for the Fund would have been lower. The Fund’s returns since May 1, 2014 are as presented in the Financial Highlights. |
Returns represent past performance and do not guarantee future results. Investment return and share price will fluctuate with market conditions, and investors may have a gain or loss when shares are sold. Fund performance changes over time and currently may be significantly lower than stated. Performance is updated and published monthly. Visit the Fund’s website at dodgeandcox.com or call 800-621-3979 for current performance figures.
A private fund managed and funded by Dodge & Cox (the “Private Fund”) was reorganized into the Fund and the Fund commenced operations on May 1, 2014. The Private Fund commenced operations on December 5, 2012 and had an investment objective, policies, and strategies that were, in all material respects, the same as those of the Fund, and was managed in a manner that, in all material respects, complied with the investment guidelines and restrictions of the Fund. However, the Private Fund was not registered as an investment company under the Investment Company Act of 1940 (the “1940 Act”), and therefore was not subject to certain investment limitations, diversification requirements, liquidity requirements, and other restrictions imposed by the 1940 Act and the Internal Revenue Code, which, if applicable, may have adversely affected its performance.
The Fund’s total returns include the reinvestment of dividend and capital gain distributions, but have not been adjusted for any income taxes payable by shareholders on these distributions or on Fund share redemptions. Index returns include interest income but, unlike Fund returns, do not reflect fees or expenses. The Bloomberg Barclays Global Aggregate Bond Index (Bloomberg Barclays Global Agg) is a widely recognized, unmanaged index of multi-currency investment-grade, debt securities.
Bloomberg is a registered trademark of Bloomberg Finance L.P. and its affiliates. Barclays® is a trademark of Barclays Bank PLC.
FUND EXPENSE EXAMPLE
As a Fund shareholder, you incur ongoing Fund costs, including management fees and other Fund expenses. All mutual funds have ongoing costs, sometimes referred to as operating expenses. The following example shows ongoing costs of investing in the Fund and can help you understand these costs and compare them with those of other mutual funds. The example assumes a $1,000 investment held for the six months indicated.
ACTUAL EXPENSES
The first line of the table below provides information about actual account values and expenses based on the Fund’s actual returns. You may use the information in this line, together with your account balance, to estimate the expenses that you paid over the period. Simply divide your account value by $1,000 (for example, an $8,600 account value divided by $1,000 = 8.6), then multiply the result by the number in the first line under the heading “Expenses Paid During Period” to estimate the expenses you paid on your account during this period.
HYPOTHETICAL EXAMPLE FOR COMPARISON WITH OTHER MUTUAL FUNDS
Information on the second line of the table can help you compare ongoing costs of investing in the Fund with those of other mutual funds. This information may not be used to estimate the actual ending account balance or expenses you paid during the period. The hypothetical “Ending Account Value” is based on the actual expense ratio of the Fund and an assumed 5% annual rate of return before expenses (not the Fund’s actual return). The amount under the heading “Expenses Paid During Period” shows the hypothetical expenses your account would have incurred under this scenario. You can compare this figure with the 5% hypothetical examples that appear in shareholder reports of other mutual funds.
| | | | | | | | | | | | |
Six Months Ended June 30, 2018 | | Beginning Account Value
1/1/2018 | | | Ending Account Value
6/30/2018 | | | Expenses Paid
During Period* | |
Based on Actual Fund Return | | $ | 1,000.00 | | | $ | 980.50 | | | $ | 2.21 | |
Based on Hypothetical 5% Yearly Return | | | 1,000.00 | | | | 1,022.56 | | | | 2.26 | |
| * | | Expenses are equal to the Fund’s annualized net expense ratio of 0.45%, multiplied by the average account value over the period, multiplied by 181/365 (to reflect the one-half year period). |
The expenses shown in the table highlight ongoing costs only and do not reflect any transactional fees or account maintenance fees. Though other mutual funds may charge such fees, please note that the Fund does not charge transaction fees (e.g., redemption fees, sales loads) or universal account maintenance fees (e.g., small account fees).
DODGE & COX GLOBAL BOND FUND §PAGE 5
| | | | |
| FUND INFORMATION (unaudited) | | | June 30, 2018 | |
| | | | |
| GENERAL INFORMATION | | | |
Net Asset Value Per Share | | | $10.69 | |
Total Net Assets (millions) | | | $196.3 | |
Net Expense Ratio(a) | | | 0.45% | |
Gross Expense Ratio (1/1/18 to 6/30/18, annualized) | | | 0.96% | |
Portfolio Turnover Rate (1/1/18 to 6/30/18, unannualized) | | | 21% | |
30-Day SEC Yield (using net expenses)(a)(b) | | | 4.44% | |
30-Day SEC Yield (using gross expenses) | | | 3.93% | |
Number of Credit Issuers | | | 48 | |
Fund Inception | | | May 1, 2014 | |
No sales charges or distribution fees | | | | |
Investment Manager: Dodge & Cox, San Francisco. Managed by the Global Fixed Income Investment Committee, whose six members’ average tenure at Dodge & Cox is 20 years.
| | | | | | | | |
| PORTFOLIO CHARACTERISTICS | | Fund | | | BBG Barclays
Global Agg | |
Effective Duration (years)(c) | | | 3.6 | | | | 7.0 | |
Emerging Markets(d) | | | 28.9% | | | | 5.3% | |
Non-USD Currency Exposure(e) | | | 17.5% | | | | 55.5% | |
| | | | |
| FIVE LARGEST CREDIT ISSUERS (%)(f) | | Fund | |
Telecom Italia SPA | | | 2.1 | |
Kinder Morgan, Inc. | | | 2.1 | |
Charter Communications, Inc. | | | 2.0 | |
AT&T, Inc. | | | 2.0 | |
TransCanada Corp. | | | 2.0 | |
| | | | | | | | |
| CREDIT QUALITY (%)(g)(h) | | Fund | | | BBG Barclays
Global Agg | |
Aaa | | | 21.3 | | | | 39.6 | |
Aa | | | 2.0 | | | | 16.2 | |
A | | | 13.7 | | | | 29.0 | |
Baa | | | 43.2 | | | | 15.2 | |
Ba | | | 12.9 | | | | 0.0 | |
B | | | 2.2 | | | | 0.0 | |
Caa | | | 0.0 | | | | 0.0 | |
Net Cash & Other(i) | | | 4.7 | | | | 0.0 | |
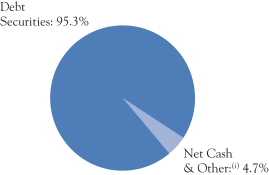
| | | | | | | | |
| SECTOR DIVERSIFICATION (%)(h) | | Fund | | | BBG Barclays
Global Agg | |
Government | | | 18.7 | | | | 54.2 | |
Government-Related | | | 5.9 | | | | 12.1 | |
Securitized | | | 24.1 | | | | 15.1 | |
Corporate | | | 46.6 | | | | 18.6 | |
Net Cash & Other(i) | | | 4.7 | | | | 0.0 | |
| | | | | | | | |
| REGION DIVERSIFICATION (%)(d)(h) | | Fund | | | BBG Barclays
Global Agg | |
United States | | | 48.5 | | | | 38.5 | |
Latin America | | | 18.9 | | | | 1.1 | |
Europe (excluding United Kingdom) | | | 10.9 | | | | 26.3 | |
United Kingdom | | | 6.4 | | | | 5.5 | |
Pacific (excluding Japan) | | | 6.3 | | | | 5.5 | |
Africa | | | 2.3 | | | | 0.0 | (j) |
Canada | | | 2.0 | | | | 3.2 | |
Japan | | | 0.0 | | | | 17.1 | |
Middle East | | | 0.0 | | | | 0.6 | |
Other | | | 0.0 | | | | 2.2 | |
| (a) | Dodge & Cox has contractually agreed to reimburse the Fund for all ordinary expenses to the extent necessary to maintain total annual fund operating expenses at 0.45% through April 30, 2019. The term of the agreement renews annually thereafter unless terminated with 30 days’ written notice by either party prior to the end of the term. |
| (b) | SEC Yield is an annualization of the Fund’s net investment income for the trailing 30-day period. Dividends paid by the Fund may be higher or lower than implied by the SEC Yield. |
| (c) | Interest rate derivatives reduce total Fund duration by 2.3 years (i.e., total Fund duration is 5.9 years without derivatives). |
| (d) | The Fund may classify an issuer in a different category than the Bloomberg Barclays Global Aggregate Bond Index. The Fund generally classifies a corporate issuer based on the country of incorporation of the parent company, but may designate a different country in certain circumstances. |
| (e) | Non-USD Currency Exposure for the Fund reflects the value of the portfolio’s non-U.S. dollar denominated investments, as well as the impact of currency derivatives. |
| (f) | The Fund’s portfolio holdings are subject to change without notice. The mention of specific securities is not a recommendation to buy, sell, or hold any particular security and is not indicative of Dodge & Cox’s current or future trading activity. |
| (g) | The credit quality distributions shown for the Fund and the Index are based on the middle of Moody’s, S&P, and Fitch ratings, which is the methodology used by Bloomberg in constructing its indices. If a security is rated by only two agencies, the lower of the two ratings is used. Please note the Fund applies the highest of Moody’s, S&P, and Fitch ratings to comply with the quality requirements stated in its prospectus. On that basis, the Fund held 8.3% in securities rated below investment grade. The credit quality of the investments in the portfolio does not apply to the stability or safety of the Fund or its shares. |
| (h) | Region, sector, and quality weights exclude the effect of the Fund’s derivative contracts. |
| (i) | Net Cash & Other includes cash, short-term investments, derivatives, receivables, and payables. |
PAGE 6 § DODGE & COX GLOBAL BOND FUND
| | | | |
| PORTFOLIO OF INVESTMENTS (unaudited) | | | June 30, 2018 | |
| | | | | | | | | | | | |
| DEBT SECURITIES: 95.3% | |
| | | |
| | | | | | PAR VALUE | | | VALUE | |
| GOVERNMENT: 18.7% | | | | | | | | | | | | |
Argentina Government (Argentina)
4.50%, 6/21/19(h) | | | USD | | | | 950,000 | | | $ | 966,825 | |
Colombia Government (Colombia)
7.75%, 4/14/21 | | | COP | | | | 13,710,000,000 | | | | 4,915,122 | |
India Government (India)
8.24%, 2/15/27 | | | INR | | | | 459,480,000 | | | | 6,732,095 | |
Indonesia Government (Indonesia)
8.25%, 5/15/36 | | | IDR | | | | 68,000,000,000 | | | | 4,685,973 | |
Mexico Government (Mexico) 2.00%, 6/9/22(a) | | | MXN | | | | 42,451,731 | | | | 1,998,284 | |
5.75%, 3/5/26 | | | MXN | | | | 247,700,000 | | | | 11,136,507 | |
Poland Government (Poland)
2.50%, 1/25/23 | | | PLN | | | | 7,450,000 | | | | 1,996,546 | |
Turkey Government (Turkey)
10.50%, 8/11/27 | | | TRY | | | | 5,785,000 | | | | 931,876 | |
U.S. Treasury Note/Bond
(United States)
2.625%, 5/15/21 | | | USD | | | | 725,000 | | | | 724,972 | |
2.75%, 4/30/23 | | | USD | | | | 2,660,000 | | | | 2,661,766 | |
| | | | | | | | | | | | |
| | | | | | | | | | | 36,749,966 | |
| GOVERNMENT-RELATED: 5.9% | |
Chicago Transit Authority RB (United States)
6.899%, 12/1/40 | | | USD | | | | 775,000 | | | | 1,008,445 | |
Indonesia Government International (Indonesia)
3.75%, 6/14/28(c) | | | EUR | | | | 650,000 | | | | 837,420 | |
Peru Government International (Peru)
3.75%, 3/1/30 | | | EUR | | | | 600,000 | | | | 837,313 | |
Petroleo Brasileiro SA (Brazil)
7.25%, 3/17/44 | | | USD | | | | 1,000,000 | | | | 925,000 | |
Petroleos Mexicanos (Mexico) 4.75%, 2/26/29 | | | EUR | | | | 900,000 | | | | 1,051,445 | |
6.75%, 9/21/47 | | | USD | | | | 1,936,000 | | | | 1,840,168 | |
6.35%, 2/12/48(c) | | | USD | | | | 51,000 | | | | 46,155 | |
Province of Buenos Aires Argentina (Argentina)
5.375%, 1/20/23(c) | | | EUR | | | | 2,100,000 | | | | 2,319,566 | |
BADLARPP | | | | | | | | | | | | |
+3.83%, 27.50%, 5/31/22 | | | ARS | | | | 34,600,000 | | | | 995,944 | |
State of Illinois GO (United States) 5.877%, 3/1/19 | | | USD | | | | 700,000 | | | | 712,404 | |
5.10%, 6/1/33 | | | USD | | | | 1,000,000 | | | | 946,360 | |
| | | | | | | | | | | | |
| | | | | | | | | | | 11,520,220 | |
| SECURITIZED: 24.1% | | | | | | | | | | | | |
ASSET-BACKED: 6.6% | | | | | | | | | | | | |
Auto Loan: 0.4% | | | | | | | | | | | | |
Ford Credit Auto Owner Trust
(United States) | | | | | | | | | | | | |
Series 2017-C A3, 2.01%, 3/15/22 | | | USD | | | | 345,000 | | | | 340,139 | |
Series 2015-REV1 A,
2.12%, 7/15/26(c) | | | USD | | | | 550,000 | | | | 542,606 | |
| | | | | | | | | | | | |
| | | | | | | | | | | 882,745 | |
Credit Card: 0.8% | | | | | | | | | | | | |
American Express Master Trust
(United States)
Series 2017-3 A, 1.77%, 4/15/20 | | | USD | | | | 1,240,000 | | | | 1,215,734 | |
Chase Issuance Trust
(United States)
Series 2016-A5 A5,
1.27%, 7/15/21 | | | USD | | | | 280,000 | | | | 275,949 | |
| | | | | | | | | | | | |
| | | | | | | | | | | 1,491,683 | |
Other: 1.3% | | | | | | | | | | | | |
Rio Oil Finance Trust (Brazil) | | | | | | | | | | | | |
9.25%, 7/6/24(c) | | | USD | | | | 1,495,484 | | | | 1,600,168 | |
9.75%, 1/6/27(c) | | | USD | | | | 552,981 | | | | 592,663 | |
8.20%, 4/6/28(c) | | | USD | | | | 400,000 | | | | 405,200 | |
| | | | | | | | | | | | |
| | | | | | | | | | | 2,598,031 | |
| | | | | | | | | | | | |
| | | |
| | | | | | PAR VALUE | | | VALUE | |
Student Loan: 4.1% | | | | | | | | | | | | |
Navient Student Loan Trust (United States)
Series 2017-4A A3,
3.091%, 9/27/66(c) | | | USD | | | | 3,863,000 | | | $ | 3,945,225 | |
Navient Student Loan Trust (Private Loans) (United States) | | | | | | | | | | | | |
Series 2015-CA B,
3.25%, 5/15/40(c) | | | USD | | | | 1,350,000 | | | | 1,350,548 | |
Series 2017-A B,
3.91%, 12/16/58(c) | | | USD | | | | 1,050,000 | | | | 1,015,387 | |
SMB Private Education Loan Trust (Private Loans) (United States)
| | | | | | | | | | | | |
Series 2017-B A2A,
2.82%, 10/15/35(c) | | | USD | | | | 1,697,000 | | | | 1,648,884 | |
| | | | | | | | | | | | |
| | | | | | | | | | | 7,960,044 | |
| | | | | | | | | | | | |
| | | | | | | | | | | 12,932,503 | |
CMBS: 0.9% | | | | | | | | | | | | |
Agency CMBS: 0.9% | | | | | | | | | | | | |
Freddie Mac Military Housing Trust Multifamily (United States)
4.492%, 11/25/55(c)(f) | | | USD | | | | 1,647,772 | | | | 1,805,301 | |
| |
MORTGAGE-RELATED: 16.6% | | | | | |
Federal Agency CMO & REMIC: 5.2% | |
Fannie Mae (United States)
Trust 2004-W9 1A3,
6.05%, 2/25/44 | | | USD | | | | 529,287 | | | | 593,938 | |
Freddie Mac (United States) | | | | | | | | | | | | |
Series 4283 EW,
4.50%, 12/15/43(f) | | | USD | | | | 131,278 | | | | 137,921 | |
Series 4319 MA, 4.50%, 3/15/44(f) | | | USD | | | | 475,564 | | | | 500,284 | |
Ginnie Mae (United States) | | | | | | | | | | | | |
Series 2010-169 JZ,
4.00%, 12/20/40 | | | USD | | | | 677,876 | | | | 683,769 | |
USD LIBOR 1-Month
+0.75%, 2.667%, 10/20/66 | | | USD | | | | 2,178,126 | | | | 2,205,636 | |
USD LIBOR 12-Month
+0.22%, 2.019%, 10/20/67 | | | USD | | | | 672,344 | | | | 675,525 | |
+0.20%, 2.10%, 11/20/67 | | | USD | | | | 2,848,923 | | | | 2,860,181 | |
+0.15%, 2.29%, 12/20/67 | | | USD | | | | 1,453,317 | | | | 1,456,437 | |
+0.04%, 2.56%, 2/20/68 | | | USD | | | | 1,119,660 | | | | 1,117,024 | |
| | | | | | | | | | | | |
| | | | | | | | | | | 10,230,715 | |
Federal Agency Mortgage Pass-Through: 11.4% | |
Fannie Mae, 15 Year (United States)
5.00%, 7/1/25 | | | USD | | | | 18,054 | | | | 18,746 | |
Fannie Mae, 20 Year (United States) 4.00%, 11/1/30 - 9/1/35 | | | USD | | | | 1,242,321 | | | | 1,280,996 | |
3.50%, 3/1/37 | | | USD | | | | 1,963,466 | | | | 1,985,347 | |
Fannie Mae, 30 Year (United States) 4.50%, 4/1/39 - 4/1/46 | | | USD | | | | 6,048,983 | | | | 6,331,965 | |
Fannie Mae, Hybrid ARM
(United States) | | | | | | | | | | | | |
USD LIBOR 12-Month | | | | | | | | | | | | |
+1.58%, 2.923%, 8/1/44 | | | USD | | | | 140,802 | | | | 141,536 | |
+1.58%, 2.757%, 9/1/44 | | | USD | | | | 219,273 | | | | 219,656 | |
Freddie Mac, Hybrid ARM (United States) | | | | | | | | | | | | |
USD LIBOR 12-Month
+1.63%, 3.021%, 10/1/44 | | | USD | | | | 279,126 | | | | 280,812 | |
+1.60%, 2.723%, 11/1/44 | | | USD | | | | 738,216 | | | | 738,560 | |
+1.62%, 2.678%, 1/1/45 | | | USD | | | | 762,119 | | | | 761,538 | |
+1.63%, 2.726%, 5/1/46 | | | USD | | | | 1,206,021 | | | | 1,203,362 | |
Freddie Mac Gold, 30 Year (United States)
6.00%, 2/1/35 | | | USD | | | | 71,035 | | | | 77,649 | |
4.50%, 8/1/44 - 8/1/47 | | | USD | | | | 7,177,133 | | | | 7,474,877 | |
4.00%, 12/1/46 | | | USD | | | | 1,761,638 | | | | 1,802,410 | |
| | | | | | | | | | | | |
| | | | | | | | | | | 22,317,454 | |
| | | | | | | | | | | | |
| | | | | | | | | | | 32,548,169 | |
| | | | | | | | | | | | |
| | | | | | | | | | | 47,285,973 | |
| | |
| See accompanying Notes to Financial Statements | | DODGE & COX GLOBAL BOND FUND §PAGE 7 |
| | | | |
| PORTFOLIO OF INVESTMENTS (unaudited) | | | June 30, 2018 | |
| | | | | | | | | | | | |
DEBT SECURITIES (continued) | |
| | | |
| | | | | | PAR VALUE | | | VALUE | |
| CORPORATE: 46.6% | | | | | | | | | | | | |
FINANCIALS: 12.5% | | | | | | | | | | | | |
Bank of America Corp. (United States)
4.25%, 10/22/26 | | | USD | | | | 1,425,000 | | | $ | 1,407,642 | |
4.183%, 11/25/27 | | | USD | | | | 1,075,000 | | | | 1,046,537 | |
Barclays PLC (United Kingdom)
4.836%, 5/9/28 | | | USD | | | | 2,050,000 | | | | 1,935,313 | |
BNP Paribas SA (France)
4.375%, 9/28/25(c) | | | USD | | | | 2,400,000 | | | | 2,341,636 | |
Capital One Financial Corp. (United States)
3.75%, 4/24/24 | | | USD | | | | 1,275,000 | | | | 1,250,073 | |
Chubb, Ltd. (Switzerland)
2.50%, 3/15/38 | | | EUR | | | | 2,475,000 | | | | 2,905,947 | |
Citigroup, Inc. (United States | | | | | | | | | | | | |
USD LIBOR 3-Month +6.37%, 8.72%, 10/30/40(b) | | | USD | | | | 1,850,000 | | | | 2,005,400 | |
HSBC Holdings PLC
(United Kingdom)
6.50%, 9/15/37 | | | USD | | | | 2,600,000 | | | | 3,031,350 | |
JPMorgan Chase & Co. (United States)
4.25%, 10/1/27 | | | USD | | | | 2,050,000 | | | | 2,034,235 | |
Lloyds Banking Group PLC (United Kingdom)
4.50%, 11/4/24 | | | USD | | | | 1,125,000 | | | | 1,111,709 | |
4.582%, 12/10/25 | | | USD | | | | 1,775,000 | | | | 1,739,419 | |
Royal Bank of Scotland Group PLC (United Kingdom)
6.00%, 12/19/23 | | | USD | | | | 1,750,000 | | | | 1,835,747 | |
Wells Fargo & Co. (United States)
4.30%, 7/22/27 | | | USD | | | | 1,950,000 | | | | 1,920,984 | |
| | | | | | | | | | | | |
| | | | | | | | | | | 24,565,992 | |
INDUSTRIALS: 29.3% | | | | | | | | | | | | |
AT&T, Inc. (United States)
| | | | | | | | | | | | |
4.75%, 5/15/46 | | | USD | | | | 2,325,000 | | | | 2,075,299 | |
4.50%, 3/9/48 | | | USD | | | | 2,250,000 | | | | 1,931,256 | |
Bayer AG (Germany)
3.75%, 7/1/74(b)(g) | | | EUR | | | | 1,700,000 | | | | 2,075,331 | |
Becton, Dickinson and Co. (United States)
2.894%, 6/6/22 | | | USD | | | | 1,700,000 | | | | 1,643,834 | |
Cemex SAB de CV (Mexico)
7.75%, 4/16/26(c) | | | USD | | | | 3,125,000 | | | | 3,385,625 | |
Charter Communications, Inc. (United States)
| | | | | | | | | | | | |
7.30%, 7/1/38 | | | USD | | | | 425,000 | | | | 481,466 | |
6.75%, 6/15/39 | | | USD | | | | 1,300,000 | | | | 1,385,086 | |
6.484%, 10/23/45 | | | USD | | | | 1,150,000 | | | | 1,211,325 | |
5.75%, 4/1/48 | | | USD | | | | 975,000 | | | | 943,235 | |
Comcast Corp. (United States)
3.969%, 11/1/47 | | | USD | | | | 550,000 | | | | 484,062 | |
Concho Resources, Inc. (United States) | | | | | | | | | | | | |
4.875%, 10/1/47 | | | USD | | | | 500,000 | | | | 503,664 | |
4.85%, 8/15/48 | | | USD | | | | 250,000 | | | | 253,174 | |
Cox Enterprises, Inc. (United States) 4.80%, 2/1/35(c) | | | USD | | | | 350,000 | | | | 322,113 | |
8.375%, 3/1/39(c) | | | USD | | | | 1,125,000 | | | | 1,486,938 | |
CVS Health Corp. (United States) 3.70%, 3/9/23 | | | USD | | | | 575,000 | | | | 569,146 | |
4.10%, 3/25/25 | | | USD | | | | 175,000 | | | | 174,041 | |
4.30%, 3/25/28 | | | USD | | | | 400,000 | | | | 394,408 | |
4.78%, 3/25/38 | | | USD | | | | 425,000 | | | | 420,095 | |
Dell Technologies, Inc. (United States)
5.45%, 6/15/23(c) | | | USD | | | | 550,000 | | | | 575,209 | |
Ford Motor Credit Co. LLC(d)
(United States)
5.875%, 8/2/21 | | | USD | | | | 1,800,000 | | | | 1,908,066 | |
| | | | | | | | | | | | |
| | | |
| | | | | | PAR VALUE | | | VALUE | |
Grupo Televisa SAB (Mexico)
8.50%, 3/11/32 | | | USD | | | | 1,264,000 | | | $ | 1,549,483 | |
6.125%, 1/31/46 | | | USD | | | | 475,000 | | | | 490,113 | |
HCA Holdings, Inc. (United States)
4.75%, 5/1/23 | | | USD | | | | 2,500,000 | | | | 2,493,750 | |
Imperial Brands PLC (United Kingdom)
4.25%, 7/21/25(c) | | | USD | | | | 2,050,000 | | | | 2,040,008 | |
Kinder Morgan, Inc. (United States)
6.95%, 1/15/38 | | | USD | | | | 3,550,000 | | | | 4,043,679 | |
LafargeHolcim, Ltd. (Switzerland) | | | | | | | | | | | | |
7.125%, 7/15/36 | | | USD | | | | 1,150,000 | | | | 1,434,894 | |
4.75%, 9/22/46(c) | | | USD | | | | 650,000 | | | | 608,282 | |
Macy’s, Inc. (United States)
6.70%, 9/15/28 | | | USD | | | | 50,000 | | | | 52,938 | |
6.90%, 4/1/29 | | | USD | | | | 75,000 | | | | 80,516 | |
6.70%, 7/15/34 | | | USD | | | | 425,000 | | | | 442,862 | |
Millicom International Cellular SA (Luxembourg)
5.125%, 1/15/28(c) | | | USD | | | | 2,125,000 | | | | 1,951,812 | |
Molex Electronic Technologies LLC(d) (United States)
2.878%, 4/15/20(c) | | | USD | | | | 731,000 | | | | 723,560 | |
MTN Group, Ltd. (South Africa)
4.755%, 11/11/24(c) | | | USD | | | | 1,125,000 | | | | 1,042,144 | |
Naspers, Ltd. (South Africa)
5.50%, 7/21/25(c) | | | USD | | | | 1,875,000 | | | | 1,928,438 | |
4.85%, 7/6/27(c) | | | USD | | | | 1,550,000 | | | | 1,517,112 | |
RELX PLC (United Kingdom) | | | | | | | | | | | | |
8.625%, 1/15/19 | | | USD | | | | 58,000 | | | | 59,724 | |
3.125%, 10/15/22 | | | USD | | | | 574,000 | | | | 562,982 | |
3.50%, 3/16/23 | | | USD | | | | 325,000 | | | | 321,456 | |
Telecom Italia SPA (Italy)
| | | | | | | | | | | | |
7.175%, 6/18/19 | | | USD | | | | 200,000 | | | | 205,690 | |
6.375%, 6/24/19 | | | GBP | | | | 800,000 | | | | 1,100,727 | |
7.20%, 7/18/36 | | | USD | | | | 1,000,000 | | | | 1,035,900 | |
7.721%, 6/4/38 | | | USD | | | | 1,650,000 | | | | 1,773,750 | |
TransCanada Corp. (Canada) | | | | | | | | | | | | |
5.625%, 5/20/75(b)(g) | | | USD | | | | 1,800,000 | | | | 1,755,000 | |
5.30%, 3/15/77(b)(g) | | | USD | | | | 2,275,000 | | | | 2,151,047 | |
Twenty-First Century Fox, Inc. (United States) | | | | | | | | | | | | |
6.65%, 11/15/37 | | | USD | | | | 1,100,000 | | | | 1,364,561 | |
6.15%, 2/15/41 | | | USD | | | | 550,000 | | | | 656,790 | |
Ultrapar Participacoes SA (Brazil)
5.25%, 10/6/26(c) | | | USD | | | | 2,200,000 | | | | 2,039,400 | |
Verizon Communications, Inc. (United States)
5.012%, 4/15/49 | | | USD | | | | 2,000,000 | | | | 1,946,148 | |
| | | | | | | | | | | | |
| | | | | | | | | | | 57,596,139 | |
UTILITIES: 4.8% | | | | | | | | | | | | |
Dominion Energy, Inc.
(United States)
5.75%, 10/1/54(b)(g) | | | USD | | | | 2,725,000 | | | | 2,839,450 | |
Enel SPA (Italy) | | | | | | | | | | | | |
6.80%, 9/15/37(c) | | | USD | | | | 650,000 | | | | 776,362 | |
6.00%, 10/7/39(c) | | | USD | | | | 880,000 | | | | 977,357 | |
3.375%, 11/24/81(b)(g) | | | EUR | | | | 1,200,000 | | | | 1,320,782 | |
The Southern Co. (United States)
5.50%, 3/15/57(b)(g) | | | USD | | | | 3,300,000 | | | | 3,398,138 | |
| | | | | | | | | | | | |
| | | | | | | | | | | 9,312,089 | |
| | | | | | | | | | | | |
| | | | | | | | | | | 91,474,220 | |
| | | | | | | | | | | | |
TOTAL DEBT SECURITIES
(Cost $192,506,419) | | | | | | | | | | $ | 187,030,379 | |
| | |
| PAGE 8 § DODGE & COX GLOBAL BOND FUND | | See accompanying Notes to Financial Statements |
| | | | |
| PORTFOLIO OF INVESTMENTS (unaudited) | | | June 30, 2018 | |
| | | | | | | | | | | | |
| SHORT-TERM INVESTMENTS: 3.1% | |
| | | |
| | | | | | PAR VALUE/ SHARES | | | VALUE | |
COMMERCIAL PAPER: 1.9% | | | | | | | | | | | | |
Ford Motor Credit Co. LLC(d) (United States)
7/10/18(c) | | | USD | | | | 1,900,000 | | | $ | 1,898,884 | |
AT&T, Inc. (United States)
7/23/18(c) | | | USD | | | | 1,900,000 | | | | 1,896,958 | |
| | | | | | | | | | | | |
| | | | | | | | | | | 3,795,842 | |
|
REPURCHASE AGREEMENT: 0.8% | |
Fixed Income Clearing Corporation(e)
1.20%, dated 6/29/18, due 7/2/18, maturity value $1,628,163 | | | USD | | | | 1,628,000 | | | | 1,628,000 | |
| | | | | | | | | | | | |
| | | |
MONEY MARKET FUND: 0.4% | | | | | | | | | | | | |
State Street Institutional U.S. Government Money Market Fund | | | USD | | | | 782,367 | | | | 782,367 | |
| | | | | | | | | | | | |
TOTAL SHORT-TERM INVESTMENTS
(Cost $6,206,209) | | | $ | 6,206,209 | |
| | | | | | | | | | | | |
TOTAL INVESTMENTS IN SECURITIES
(Cost $198,712,628) | | | | | | | 98.4 | % | | $ | 193,236,588 | |
OTHER ASSETS LESS LIABILITIES | | | | 1.6 | % | | | 3,060,604 | |
| | | | | | | | | | | | |
| NET ASSETS | | | | | | | 100.0 | % | | $ | 196,297,192 | |
| | | | | | | | | | | | |
| (c) | Security exempt from registration under Rule 144A of the Securities Act of 1933. The security may be resold in transactions exempt from registration, normally to qualified institutional buyers. These securities have been deemed liquid by Dodge & Cox, investment manager, pursuant to procedures approved by the Fund’s Board of Trustees. |
| (d) | Subsidiary (see below) |
| (e) | Repurchase agreement is collateralized by U.S. Treasury Note 2.625%, 6/15/21. Total collateral value is $1,662,439. |
| (f) | Variable rate security: interest rate is determined by the interest rates of underlying pool of assets that collateralize the security. The interest rate of the security may change due to a change in the interest rates or the composition of underlying pool of assets. The interest rate shown is the rate as of period end. |
| (g) | Variable rate security: fixed-to-float security pays an initial fixed interest rate and will pay a floating interest rate established at a predetermined time in the future. The interest rate shown is the rate as of period end. |
| (h) | Dual currency bond. Issued in USD but pays in ARS at maturity. |
Debt securities are grouped by parent company unless otherwise noted. Actual securities may be issued by the listed parent company or one of its subsidiaries. In determining a parent company’s country designation, the Fund generally references the country of incorporation.
Debt securities with floating interest rates are linked to the referenced benchmark; the interest rate shown is the rate as of period end.
ARM: Adjustable Rate Mortgage
CMBS: Commercial Mortgage-Backed Security
CMO: Collateralized Mortgage Obligation
DUS: Delegated Underwriting and Servicing
GO: General Obligation
RB: Revenue Bond
REMIC: Real Estate Mortgage Investment Conduit
ARS:Argentine Peso
COP:Colombian Peso
EUR:Euro
GBP:British Pound
IDR:Indonesian Rupiah
INR:Indian Rupee
MXN:Mexican Peso
PLN:Polish Zloty
TRY: Turkish Lira
USD:United States Dollar
FUTURES CONTRACTS
| | | | | | | | | | | | | | | | |
| Description | | Number of
Contracts | | | Expiration
Date | | | Notional
Amount | | | Value /
Unrealized
Appreciation
(Depreciation) | |
10 Year U.S. Treasury Note—Short Position | | | 36 | | | | 9/19/18 | | | $ | (4,326,750 | ) | | $ | (30,690 | ) |
Euro-Bund Future—Short Position | | | 36 | | | | 9/6/18 | | | | (6,833,732 | ) | | | (35,971 | ) |
Euro-Buxl Future—Short Position | | | 9 | | | | 9/6/18 | | | | (1,867,663 | ) | | | (30,984 | ) |
Long-Term U.S. Treasury Bond—Short Position | | | 85 | | | | 9/19/18 | | | | (12,325,000 | ) | | | (228,937 | ) |
Ultra Long-Term U.S. Treasury Bond—Short Position | | | 29 | | | | 9/19/18 | | | | (4,627,312 | ) | | | (74,863 | ) |
| | | | | | | | | | | | | | | | |
| | | | | | | | | | | | | | $ | (401,445 | ) |
| | | | | | | | | | | | | | | | |
CENTRALLY CLEARED INTEREST RATE SWAPS
| | | | | | | | | | | | | | | | | | | | |
Notional
Amount | | Expiration
Date | | | Fixed
Rate | | | Value | | | Upfront Payments (Receipts) | | | Unrealized
Appreciation/ (Depreciation) | |
Pay Fixed (Semi-Annually) / Receive USD LIBOR 3-Month (Quarterly): | |
$5,910,000 | | | 9/19/28 | | | | 2.500 | % | | $ | 247,039 | | | $ | 298,703 | | | $ | (48,732 | ) |
1,540,000 | | | 9/19/48 | | | | 2.500 | % | | | 153,047 | | | | 193,041 | | | | (39,349 | ) |
| | | | | | | | | | | | | | | | | | | | |
| | | | | | | | | | $ | 400,086 | | | $ | 491,744 | | | $ | (88,081 | ) |
| | | | | | | | | | | | | | | | | | | | |
CURRENCY FORWARD CONTRACTS
| | | | | | | | | | | | | | | | |
| | | | | | Contract Amount | | | | |
| Counterparty | | Settle
Date | | | Receive
U.S. Dollar | | | Deliver
Foreign
Currency | | | Unrealized
Appreciation
(Depreciation) | |
Contracts to sell EUR: | |
Barclays | | | 10/24/18 | | | | 538,005 | | | | 450,000 | | | $ | 7,915 | |
Barclays | | | 10/24/18 | | | | 1,051,956 | | | | 900,000 | | | | (8,224 | ) |
Barclays | | | 10/24/18 | | | | 1,026,775 | | | | 875,000 | | | | (3,956 | ) |
Barclays | | | 10/24/18 | | | | 992,685 | | | | 850,000 | | | | (8,596 | ) |
Barclays | | | 1/9/19 | | | | 1,303,867 | | | | 1,100,000 | | | | (281 | ) |
Citibank | | | 7/11/18 | | | | 1,452,852 | | | | 1,200,000 | | | | 50,706 | |
Citibank | | | 7/11/18 | | | | 347,503 | | | | 275,000 | | | | 26,178 | |
Citibank | | | 7/11/18 | | | | 309,595 | | | | 250,000 | | | | 17,481 | |
Citibank | | | 8/15/18 | | | | 2,896,532 | | | | 2,325,000 | | | | 172,867 | |
Citibank | | | 8/15/18 | | | | 3,507,040 | | | | 2,825,000 | | | | 197,641 | |
Citibank | | | 10/24/18 | | | | 383,048 | | | | 325,000 | | | | 205 | |
Contracts to sell GBP: | |
Barclays | | | 9/12/18 | | | | 1,050,150 | | | | 750,000 | | | | 57,237 | |
Citibank | | | 10/24/18 | | | | 140,642 | | | | 100,000 | | | | 7,993 | |
| | | | |
| Counterparty | | Settle
Date | | | Deliver
U.S. Dollar | | | Receive
Foreign
Currency | | | Unrealized
Appreciation
(Depreciation) | |
Contracts to buy EUR: | |
Barclays | | | 7/11/18 | | | | 2,154,244 | | | | 1,725,000 | | | | (138,658 | ) |
| | | | | | | | | | | | | | | | |
Unrealized gain on currency forward contracts | | | | 538,223 | |
Unrealized loss on currency forward contracts | | | | (159,715 | ) |
| | | | | |
Net unrealized gain on currency forward contracts | | | $ | 378,508 | |
| | | | | |
The listed counterparty may be the parent company or one of its subsidiaries.
| | |
| See accompanying Notes to Financial Statements | | DODGE & COX GLOBAL BOND FUND §PAGE 9 |
| | | | |
STATEMENT OF ASSETS AND LIABILITIES
(unaudited) | |
| |
| | | June 30, 2018 | |
ASSETS: | | | | |
Investments in securities, at value (cost $198,712,628) | | $ | 193,236,588 | |
Unrealized appreciation on currency forward contracts | | | 538,223 | |
Cash pledged as collateral for currency forward contracts | | | 270,000 | |
Cash denominated in foreign currency (cost $1,058,456) | | | 1,058,540 | |
Deposits with broker for futures contracts | | | 480,034 | |
Deposits with broker for swaps | | | 298,172 | |
Receivable for variation margin for swaps | | | 6,767 | |
Receivable for investments sold | | | 3,288,724 | |
Receivable for Fund shares sold | | | 423,309 | |
Dividends and interest receivable | | | 2,244,888 | |
Expense reimbursement receivable | | | 105,145 | |
Prepaid expenses and other assets | | | 6,165 | |
| | | | |
| | | 201,956,555 | |
| | | | |
LIABILITIES: | | | | |
Unrealized depreciation on currency forward contracts | | | 159,715 | |
Cash received as collateral for currency forward contracts | | | 540,000 | |
Payable for variation margin for futures contracts | | | 31,025 | |
Payable for investments purchased | | | 4,651,423 | |
Payable for Fund shares redeemed | | | 52,780 | |
Management fees payable | | | 79,368 | |
Accrued expenses | | | 145,052 | |
| | | | |
| | | 5,659,363 | |
| | | | |
NET ASSETS | | $ | 196,297,192 | |
| | | | |
NET ASSETS CONSIST OF: | | | | |
Paid in capital | | $ | 196,806,599 | |
Undistributed net investment income | | | 3,193,016 | |
Undistributed net realized gain | | | 1,910,709 | |
Net unrealized depreciation | | | (5,613,132 | ) |
| | | | |
| | $ | 196,297,192 | |
| | | | |
Fund shares outstanding (par value $0.01 each, unlimited shares authorized) | | | 18,362,285 | |
Net asset value per share | | $ | 10.69 | |
| |
STATEMENT OF OPERATIONS (unaudited) | | | | |
| |
| | | Six Months Ended June 30, 2018 | |
INVESTMENT INCOME: | | | | |
Dividends | | $ | 60,295 | |
Interest (net of foreign taxes of $27,831) | | | 3,797,562 | |
| | | | |
| | | 3,857,857 | |
| | | | |
EXPENSES: | | | | |
Management fees | | | 453,625 | |
Custody and fund accounting fees | | | 16,931 | |
Transfer agent fees | | | 21,953 | |
Professional services | | | 127,833 | |
Shareholder reports | | | 9,913 | |
Registration fees | | | 67,604 | |
Trustees’ fees | | | 162,083 | |
Miscellaneous | | | 13,939 | |
| | | | |
Total expenses | | | 873,881 | |
| | | | |
Expenses reimbursed by investment manager | | | (465,386 | ) |
| | | | |
Net expenses | | | 408,495 | |
| | | | |
NET INVESTMENT INCOME | | | 3,449,362 | |
| | | | |
REALIZED AND UNREALIZED GAIN (LOSS): | | | | |
Net realized gain (loss) | | | | |
Investments in securities | | | 1,531,914 | |
Futures contracts | | | 623,609 | |
Swaps | | | 491,339 | |
Currency forward contracts | | | (444,805 | ) |
Foreign currency transactions | | | (6,129 | ) |
Net change in unrealized appreciation/depreciation | | | | |
Investments in securities (net of decrease in deferred foreign capital gains tax of $1,333) | | | (9,475,454 | ) |
Futures contracts | | | (524,263 | ) |
Swaps | | | 2,613 | |
Currency forward contracts | | | 452,167 | |
Foreign currency translation | | | (24,116 | ) |
| | | | |
Net realized and unrealized loss | | | (7,373,125 | ) |
| | | | |
NET CHANGE IN NET ASSETS
FROM OPERATIONS | | $ | (3,923,763 | ) |
| | | | |
| | | | | | | | |
STATEMENT OF CHANGES IN NET ASSETS (unaudited) | |
| | |
| | | Six Months Ended
June 30, 2018 | | | Year Ended
December 31, 2017 | |
OPERATIONS: | | | | | | | | |
Net investment income | | $ | 3,449,362 | | | $ | 4,556,109 | |
Net realized gain (loss) | | | 2,195,928 | | | | 690,867 | |
Net change in unrealized appreciation/depreciation | | | (9,569,053 | ) | | | 4,620,643 | |
| | | | | | | | |
| | | (3,923,763 | ) | | | 9,867,619 | |
| | | | | | | | |
| | |
DISTRIBUTIONS TO
SHAREHOLDERS FROM: | | | | | | | | |
Net investment income | | | — | | | | (3,391,849 | ) |
Net realized gain | | | (300,736 | ) | | | (165,630 | ) |
| | | | | | | | |
Total distributions | | | (300,736 | ) | | | (3,557,479 | ) |
| | | | | | | | |
| | |
FUND SHARE
TRANSACTIONS: | | | | | | | | |
Proceeds from sale of shares | | | 61,264,252 | | | | 49,240,188 | |
Reinvestment of distributions | | | 293,844 | | | | 3,475,556 | |
Cost of shares redeemed | | | (17,365,206 | ) | | | (12,459,063 | ) |
| | | | | | | | |
Net change from Fund share transactions | | | 44,192,890 | | | | 40,256,681 | |
| | | | | | | | |
Total change in net assets | | | 39,968,391 | | | | 46,566,821 | |
| | |
NET ASSETS: | | | | | | | | |
Beginning of period | | | 156,328,801 | | | | 109,761,980 | |
| | | | | | | | |
End of period (including undistributed net investment income of $3,193,016 and distributions in excess of net investment income of $(240,339), respectively) | | $ | 196,297,192 | | | $ | 156,328,801 | |
| | | | | | | | |
| | |
SHARE INFORMATION: | | | | | | | | |
Shares sold | | | 5,623,993 | | | | 4,519,727 | |
Distributions reinvested | | | 26,958 | | | | 317,453 | |
Shares redeemed | | | (1,605,425 | ) | | | (1,146,936 | ) |
| | | | | | | | |
Net change in shares outstanding | | | 4,045,526 | | | | 3,690,244 | |
| | | | | | | | |
| | |
| PAGE 10 § DODGE & COX GLOBAL BOND FUND | | See accompanying Notes to Financial Statements |
NOTES TO FINANCIAL STATEMENTS (unaudited)
NOTE 1—ORGANIZATION AND SIGNIFICANT ACCOUNTING POLICIES
Dodge & Cox Global Bond Fund (the “Fund”) is one of the series constituting the Dodge & Cox Funds (the “Trust” or the “Funds”). The Trust is organized as a Delaware statutory trust and is registered under the Investment Company Act of 1940, as amended, as an open-end management investment company. The Fund1 seeks a high rate of total return consistent with long-term preservation of capital. Foreign investing, especially in developing countries, has special risks such as currency and market volatility and political and social instability. These and other risk considerations are discussed in the Fund’s Prospectus.
The financial statements have been prepared in conformity with accounting principles generally accepted in the United States of America, which require the use of estimates and assumptions by management. Actual results may differ from those estimates. Significant accounting policies are as follows:
Security valuation The Fund’s net assets are normally valued as of the scheduled close of trading on the New York Stock Exchange (NYSE), generally 4 p.m. Eastern Time, each day that the NYSE is open for business.
Debt securities and derivatives traded over the counter are valued using prices received from independent pricing services which utilize dealer quotes, recent transaction data, pricing models, and other inputs to arrive at market-based valuations. Pricing models may consider quoted prices for similar securities, interest rates, cash flows (including prepayment speeds), and credit risk. Exchange-traded derivatives are valued at the settlement price determined by the relevant exchange. Other financial instruments for which market quotes are readily available are valued at market value. Short-term securities less than 60 days to maturity may be valued at amortized cost if amortized cost approximates current value. Mutual funds are valued at their respective net asset values. Security values are not discounted based on the size of the Fund’s position and may differ from the value a Fund receives upon sale of the securities.
Investments initially valued in currencies other than the U.S. dollar are converted to the U.S. dollar using prevailing exchange rates. Currency forward contracts are valued based on the prevailing forward exchange rates of the underlying currencies. As a result, the Fund’s net assets may be affected by changes in the value of currencies in relation to the U.S. dollar.
If market quotations are not readily available or if normal valuation procedures produce valuations that are deemed unreliable or inappropriate under the circumstances existing at the time, the investment will be valued at fair value as determined in good faith by or under the direction of the Fund’s Board of Trustees.
| 1 | | The Fund’s predecessor, Dodge & Cox Global Bond Fund, L.L.C. (the “Private Fund”), was organized on August 31, 2012 and commenced operations on December 5, 2012 as a private investment fund that reorganized into, and had the same investment manager as, the Fund. The Fund commenced operations on May 1, 2014, upon the transfer of assets from the Private Fund. This transaction was accomplished through a transfer of Private Fund net assets valued at $10,725,688 in exchange for 1,000,000 shares of the Fund. Immediately after the transfer, the shares of the Fund were distributed to the sole owner of the Private Fund and the investment manager of the Fund, Dodge & Cox, which became the initial shareholder of the Fund. |
The Board of Trustees has appointed Dodge & Cox, the Fund’s investment manager, to make fair value determinations in accordance with the Dodge & Cox Funds Valuation Policies (“Valuation Policies”), subject to Board oversight. Dodge & Cox has established a Pricing Committee that is comprised of representatives from Treasury, Legal, Compliance, and Operations. The Pricing Committee is responsible for implementing the Valuation Policies, including determining the fair value of securities and other investments when necessary. The Pricing Committee considers relevant indications of value that are reasonably available to it in determining the fair value assigned to a particular security, such as the value of similar financial instruments, trading volumes, contractual restrictions on disposition, related corporate actions, and changes in economic conditions. In doing so, the Pricing Committee employs various methods for calibrating fair valuation approaches, including a regular review of key inputs and assumptions, back-testing, and review of any related market activity.
Valuing securities through a fair value determination involves greater reliance on judgment than valuation of securities based on readily available market quotations. In some instances, lack of information and uncertainty as to the significance of information may lead to a conclusion that a prior valuation is the best indication of a security’s value. When fair value pricing is employed, the prices of securities used by the Fund to calculate its net asset value may differ from quoted or published prices for the same securities.
Security transactions, investment income, expenses, and distributions Security transactions are recorded on the trade date. Realized gains and losses on securities sold are determined on the basis of identified cost.
Interest income is recorded on the accrual basis. Interest income includes coupon interest, amortization of premium and accretion of discount on debt securities, gain/loss on paydowns, and inflation adjustments to the principal amount of inflation-indexed securities. The ability of the issuers of the debt securities held by the Fund to meet their obligations may be affected by economic developments in a specific industry, state, region, or country. Debt obligations may be placed on non-accrual status and related interest income may be reduced by ceasing current accruals and writing off interest receivables when the collection of all or a portion of interest has become doubtful. A debt obligation is removed from non-accrual status when the issuer resumes interest payments or when collectability of interest is reasonably assured. Dividend income is recorded on the ex-dividend date.
Expenses are recorded on the accrual basis. Some expenses of the Trust can be directly attributed to a specific series. Expenses which cannot be directly attributed are allocated among the Funds in the Trust using methodologies determined by the nature of the expense.
Distributions to shareholders are recorded on the ex-dividend date.
Foreign taxes The Fund is subject to foreign taxes which may be imposed by certain countries in which the Fund invests. The Fund endeavors to record foreign taxes based on applicable foreign tax law. Withholding taxes are incurred on certain foreign receipts and are accrued at the time the associated interest income is recorded.
DODGE & COX GLOBAL BOND FUND §PAGE 11
NOTES TO FINANCIAL STATEMENTS (unaudited)
Capital gains taxes are incurred upon disposition of certain foreign securities. Expected capital gains taxes on appreciated securities, if any, are accrued as unrealized losses and incurred capital gains taxes are reflected as realized losses upon the sale of the related security. Currency taxes may be incurred when the Fund purchases certain foreign currencies related to securities transactions and are recorded as realized losses on foreign currency transactions.
Repurchase agreements Repurchase agreements are transactions under which a Fund purchases a security from a dealer counterparty and agrees to resell the security to that counterparty on a specified future date at the same price, plus a specified interest rate. The Fund’s repurchase agreements are secured by U.S. government or agency securities. It is the Fund’s policy that its custodian take possession of the underlying collateral securities, the fair value of which exceeds the principal amount of the repurchase transaction, including accrued interest, at all times. In the event of default by the counterparty, the Fund has the contractual right to liquidate the securities and to apply the proceeds in satisfaction of the obligation.
Foreign currency translation The books and records of the Fund are maintained in U.S. dollars. Foreign currency amounts are translated into U.S. dollars at the prevailing exchange rates of such currencies against the U.S. dollar. The market value of investment securities and other assets and liabilities are translated at the exchange rate as of the valuation date. Purchases and sales of investment securities, income, and expenses are translated at the exchange rate prevailing on the transaction date.
Reported realized and unrealized gain (loss) on investments includes foreign currency gain (loss) related to investment transactions.
Reported realized and unrealized gain (loss) on foreign currency transactions and translation include the following: holding/disposing of foreign currency, the difference between the trade and settlement dates on securities transactions, the difference between the accrual and payment dates on interest, and currency losses on the purchase of foreign currency in certain countries that impose taxes on such transactions.
Indemnification Under the Trust’s organizational documents, its officers and trustees are indemnified against certain liabilities arising out of the performance of their duties to the Trust. In addition, in the normal course of business the Trust enters into contracts that provide general indemnities to other parties. The Trust’s maximum exposure under these arrangements is unknown as this would involve future claims that may be made against the Trust that have not yet occurred.
NOTE 2—VALUATION MEASUREMENTS
Various inputs are used in determining the value of the Fund’s investments. These inputs are summarized in the three broad levels listed below.
| § | | Level 1: Quoted prices in active markets for identical securities |
| § | | Level 2: Other significant observable inputs (including quoted prices for similar securities, market indices, interest rates, credit risk, forward exchange rates, etc.) |
| § | | Level 3: Significant unobservable inputs (including Fund management’s assumptions in determining the fair value of investments) |
The inputs or methodology used for valuing securities are not necessarily an indication of the risk associated with investing in those securities.
The following is a summary of the inputs used to value the Fund’s holdings at June 30, 2018:
| | | | | | | | |
| Classification(a) | | LEVEL 1
(Quoted Prices) | | | LEVEL 2
(Other Significant
Observable Inputs) | |
Securities | | | | | | | | |
Debt Securities | | | | | | | | |
Government | | $ | — | | | $ | 36,749,966 | |
Government-Related | | | — | | | | 11,520,220 | |
Securitized | | | — | | | | 47,285,973 | |
Corporate | | | — | | | | 91,474,220 | |
Short-term Investments | | | | | | | | |
Commercial Paper | | | — | | | | 3,795,842 | |
Repurchase Agreement | | | — | | | | 1,628,000 | |
Money Market Fund | | | 782,367 | | | | — | |
| | | | | | | | |
Total Securities | | $ | 782,367 | | | $ | 192,454,221 | |
| | | | | | | | |
Other Investments | | | | | | | | |
Futures Contracts | | | | | | | | |
Depreciation | | $ | (401,445 | ) | | $ | — | |
Swaps | | | | | | | | |
Depreciation | | | — | | | | (88,081 | ) |
Currency Forward Contracts | | | | | | | | |
Appreciation | | | — | | | | 538,223 | |
Depreciation | | | — | | | | (159,715 | ) |
| | | | | | | | | |
| (a) | There were no transfers between Level 1 and Level 2 during the period. There were no Level 3 securities at June 30, 2018 and December 31, 2017, and there were no transfers to Level 3 during the period. |
NOTE 3—DERIVATIVE INSTRUMENTS
The Fund entered into various currency or interest rate-related transactions involving derivative instruments, including currency forward contracts, futures contracts, and swaps, in connection with its investment strategy. The Fund may use derivatives to minimize the impact of losses to one or more of its investments (as a “hedging technique”) or to implement its investment strategy.
The Fund has entered into over-the-counter derivatives, such as currency forward contracts (each, an “OTC Derivative”). Each OTC Derivative is subject to a negotiated master agreement (based on a form published by the International Swaps and Derivatives Association (“ISDA”)) governing all OTC Derivatives between the Fund and the relevant dealer counterparty. The master agreements specify (i) events of default and other events permitting a party to terminate some or all of the OTC Derivatives thereunder and (ii) the process by which those OTC Derivatives will be valued for purposes of determining termination payments. If some or all of the OTC Derivatives under a master agreement are terminated because of an event of default or similar event, the values of all terminated OTC Derivatives must be netted to determine a single payment owed by one party to the other. To the extent amounts owed to the Fund by its counterparties are not
PAGE 12 § DODGE & COX GLOBAL BOND FUND
NOTES TO FINANCIAL STATEMENTS (unaudited)
collateralized, the Fund is at risk of those counterparties’ non-performance. The Fund attempts to mitigate counterparty credit risk by entering into OTC Derivatives only with counterparties it believes to be of good credit quality, by exchanging collateral, and by monitoring the financial stability of those counterparties.
Futures contracts Futures contracts involve an obligation to purchase or sell (depending on whether the Fund has entered a long or short futures contract, respectively) an asset at a future date, at a price set at the time of the contract. Upon entering into a futures contract, the Fund is required to deposit an amount of cash or liquid assets (referred to as initial margin) in a segregated account with the clearing broker. Subsequent payments (referred to as variation margin) to and from the clearing broker are made on a daily basis based on changes in the market value of futures contracts. Futures contracts are traded publicly and their market value changes daily. Changes in the market value of open futures contracts are recorded as unrealized appreciation or depreciation in the Statement of Operations. Realized gains and losses on futures contracts are recorded in the Statement of Operations at the closing or expiration of the contracts. Cash deposited with a broker as initial margin is recorded in the Statement of Assets and Liabilities. A receivable and/or payable to brokers for daily variation margin is also recorded in the Statement of Assets and Liabilities.
Investments in futures contracts may include certain risks, which may be different from, and potentially greater than, those of the underlying securities. To the extent the Fund uses futures, it is exposed to additional volatility and potential losses resulting from leverage.
The Fund has maintained short Treasury futures contracts and short Euro Bond futures contracts to assist with the management of the portfolio’s interest rate exposure. During the six months ended June 30, 2018, these futures contracts had total notional values ranging from 12% to 16% of net assets.
Interest rate swaps Interest rate swaps are agreements that obligate two parties to exchange a series of cash flows at specified payment dates calculated by reference to specified interest rates, such as an exchange of floating rate payments for fixed rate payments. Upon entering into a centrally cleared interest rate swap, the Fund is required to post an amount of cash or liquid assets (referred to as initial margin) in a segregated account with the clearing broker. Subsequent payments (referred to as variation margin) to and from the clearing broker are made on a daily basis based on changes in the market value of each interest rate swap. Changes in the market value of open interest rate swaps are recorded as unrealized appreciation or depreciation in the Statement of Operations. Realized gains and losses on interest rate swaps are recorded in the Statement of Operations, both upon the exchange of cash flows on each specified payment date and upon the closing or expiration of the swap. Cash deposited with the clearing broker as initial margin is recorded in the Statement of Assets and Liabilities. A receivable and/or payable to brokers for daily variation margin is also recorded in the Statement of Assets and Liabilities.
Investments in interest rate swaps may include certain risks including unfavorable changes in interest rates, or a default or failure by the clearing broker or clearinghouse.
The Fund has maintained interest rate swaps in connection with the management of the portfolio’s interest rate exposure. During the six months ended June 30, 2018, these interest rate swaps had U.S. dollar notional values ranging from 3% to 6% of net assets.
Currency forward contracts A currency forward contract represents an obligation to purchase or sell a specific foreign currency at a future date at a price set at the time of the contract. The values of currency forward contracts are adjusted daily based on the prevailing forward exchange rates of the underlying currencies. Changes in the value of open contracts are recorded as unrealized appreciation or depreciation in the Statement of Operations. When a currency forward contract is closed, the Fund records a realized gain or loss in the Statement of Operations equal to the difference between the value at the time the contract was opened and the value at the time it was closed.
Losses from these transactions may arise from unfavorable changes in currency values or if a counterparty does not perform under a contract’s terms.
The Fund has maintained currency forward contracts to hedge direct and/or indirect foreign currency exposure to the British pound, euro, Thai bhat, and Japanese yen. During the six months ended June 30, 2018, these currency forward contracts had U.S. dollar total values ranging from 6% to 11% of net assets.
Additional derivative information For financial reporting purposes, the Fund does not offset OTC Derivative assets and liabilities that are subject to a master netting arrangement in the Statement of Assets and Liabilities. OTC Derivatives are presented in the Statement of Assets and Liabilities as unrealized appreciation/(depreciation) on currency forward contracts. Cash collateral pledged or received by the Fund for OTC Derivatives, if any, is reported gross in the Statement of Assets and Liabilities as cash pledged/(received) as collateral for currency forward contracts. Derivative information by counterparty is presented in the Portfolio of Investments.
The netting of assets and liabilities and the offsetting of collateral pledged or received are based on contractual netting/set-off provisions in the ISDA master agreement. The following table presents the Fund’s net exposure for OTC Derivatives that are subject to enforceable master netting arrangements as of June 30, 2018. The net amount represents the receivable from (payable to) the counterparty in the event of a default.
| | | | | | | | | | | | | | | | |
| Counterparty | | Gross OTC Derivative Assets | | | Gross
OTC Derivative Liabilities | | | Cash Collateral Pledged / (Received)(a) | | | Net Amount | |
Barclays | | $ | 65,152 | | | $ | (159,715 | ) | | $ | 94,563 | | | $ | — | |
Citibank | | | 473,071 | | | | — | | | | (473,071 | ) | | | — | |
| | | | | | | | | | | | | | | | |
Total | | $ | 538,223 | | | $ | (159,715 | ) | | $ | (378,508 | ) | | $ | — | |
| | | | | | | | | | | | | | | | |
| | | | | | | | | | | | | | | | | |
| (a) | Cash collateral pledged/(received) in excess of OTC Derivative assets/liabilities, if any, is not presented. Total cash collateral pledged/(received) is presented in the Statement of Assets and Liabilities. |
NOTE 4—RELATED PARTY TRANSACTIONS
Management fees Under a written agreement approved by a unanimous vote of the Board of Trustees, the Fund pays a management fee monthly at an annual rate of 0.50% of the Fund’s
DODGE & COX GLOBAL BOND FUND §PAGE 13
NOTES TO FINANCIAL STATEMENTS (unaudited)
average daily net assets to Dodge & Cox, investment manager of the Fund. Dodge & Cox has contractually agreed to reimburse the Fund for all ordinary expenses to the extent necessary to maintain the ratio of total operating expenses to average net assets (“net expense ratio”) at 0.45% through April 30, 2019. The term of the agreement is renewable annually thereafter unless terminated with 30 days’ written notice by either party prior to the end of the term.
Fund officers and trustees All officers and two of the trustees of the Trust are officers or employees of Dodge & Cox. The Trust pays a fee only to those trustees who are not affiliated with Dodge & Cox.
Share ownership At June 30, 2018, Dodge & Cox owned 8% of the Fund’s outstanding shares.
NOTE 5—INCOME TAX INFORMATION AND DISTRIBUTIONS TO SHAREHOLDERS
A provision for federal income taxes is not required since the Fund intends to continue to qualify as a regulated investment company under Subchapter M of the Internal Revenue Code and distribute all of its taxable income to shareholders. Distributions are determined in accordance with income tax regulations, and such amounts may differ from net investment income and realized gains for financial reporting purposes. Financial reporting records are adjusted for permanent book to tax differences at year end to reflect tax character. Book to tax differences are primarily due to differing treatments of wash sales, net short-term realized gain (loss), foreign currency realized gain (loss), straddles, and derivatives.
Distributions during the periods noted below were characterized as follows for federal income tax purposes:
| | | | | | | | |
| | | Six Months Ended June 30, 2018 | | | Year Ended
December 31, 2017 | |
Ordinary income | | $ | 100,245 | | | $ | 3,557,479 | |
| | ($ | 0.006 per share | ) | | ($ | 0.268 per share | ) |
Long-term capital gain | | $ | 200,491 | | | | — | |
| | ($ | 0.012 per share | ) | | | | |
The components of distributable earnings on a tax basis are reported as of the Fund’s most recent year end. At December 31, 2017, the tax basis components of distributable earnings were as follows:
| | | | |
Undistributed ordinary income | | $ | 258,485 | |
Undistributed long-term capital gain | | | 185,906 | |
At June 30, 2018, unrealized appreciation and depreciation for investments and derivatives based on cost for federal income tax purposes was as follows:
| | | | |
Tax cost | | $ | 199,325,435 | |
| | | | |
Unrealized appreciation | | | 940,148 | |
Unrealized depreciation | | | (6,651,846 | ) |
| | | | |
Net unrealized depreciation | | | (5,711,698 | ) |
| | | | | |
Fund management has reviewed the tax positions for the open period (three years from filing the Fund’s federal and State tax returns) applicable to the Fund, and has determined that no provision for income tax is required in the Fund’s financial statements.
NOTE 6—LOAN FACILITIES
Pursuant to an exemptive order issued by the Securities and Exchange Commission (SEC), the Fund may participate in an interfund lending facility (Facility). The Facility allows the Fund to borrow money from or loan money to the Funds. Loans under the Facility are made for temporary or emergency purposes, such as to fund shareholder redemption requests. Interest on borrowings is the average of the current repurchase agreement rate and the bank loan rate. There was no activity in the Facility during the period.
All Funds in the Trust participate in a $500 million committed credit facility (Line of Credit) with State Street Bank and Trust Company, to be utilized for temporary or emergency purposes to fund shareholder redemptions or for other short-term liquidity purposes. The maximum amount available to the Fund is $250 million. Each Fund pays an annual commitment fee on its pro-rata portion of the Line of Credit. For the six months ended June 30, 2018, the Fund’s commitment fee amounted to $558 and is reflected as a Miscellaneous Expense in the Statement of Operations. Interest on borrowings is charged at the prevailing rate. There were no borrowings on the Line of Credit during the period.
NOTE 7—PURCHASES AND SALES OF INVESTMENTS
For the six months ended June 30, 2018, purchases and sales of securities, other than short-term securities and U.S. government securities, aggregated $69,298,203 and $18,939,241, respectively. For the six months ended June 30, 2018, purchases and sales of U.S. government securities aggregated $21,265,982 and $14,288,132, respectively.
NOTE 8—NEW ACCOUNTING GUIDANCE
In March 2017, the Financial Accounting Standards Board issued an update to amend the amortization period for certain purchased callable debt securities held at a premium. The amendments shorten the amortization period for premiums to the earliest call date, but do not require an accounting change for securities held at a discount. The amendments are effective for financial statements for fiscal years beginning after December 15, 2018, and interim periods within those fiscal years. Management is evaluating the impact, if any, of this guidance on the Fund’s financial statements and disclosures.
NOTE 9—SUBSEQUENT EVENTS
Fund management has determined that no material events or transactions occurred subsequent to June 30, 2018, and through the date of the Fund’s financial statements issuance, which require additional disclosure in the Fund’s financial statements.
PAGE 14 § DODGE & COX GLOBAL BOND FUND
FINANCIAL HIGHLIGHTS (unaudited)
| | | | | | | | | | | | | | | | | | | | |
SELECTED DATA AND RATIOS (for a share outstanding throughout each period) | | Six Months Ended June 30, 2018 | | | Year Ended
December 31, 2017 | | | Year Ended
December 31, 2016 | | | Year Ended
December 31, 2015 | | | Period from
May 1, 2014
(commencement of
Fund operations) to December 31, 2014 | |
|
Net asset value, beginning of period | | | $10.92 | | | | $10.33 | | | | $9.67 | | | | $10.31 | | | | $10.73 | |
Income from investment operations: | | | | | | | | | | | | | | | | | | | | |
Net investment income | | | 0.19 | | | | 0.37 | | | | 0.30 | | | | 0.34 | | | | 0.16 | |
Net realized and unrealized gain (loss) | | | (0.40 | ) | | | 0.49 | | | | 0.54 | | | | (0.98 | ) | | | (0.44 | ) |
| | | | |
Total from investment operations | | | (0.21 | ) | | | 0.86 | | | | 0.84 | | | | (0.64 | ) | | | (0.28 | ) |
| | | | |
Distributions to shareholders from: | | | | | | | | | | | | | | | | | | | | |
Net investment income | | | — | | | | (0.26 | ) | | | (0.18 | ) | | | — | | | | (0.14 | ) |
Net realized gain | | | (0.02 | ) | | | (0.01 | ) | | | — | | | | — | | | | — | |
| | | | |
Total distributions | | | (0.02 | ) | | | (0.27 | ) | | | (0.18 | ) | | | — | | | | (0.14 | ) |
| | | | |
Net asset value, end of period | | | $10.69 | | | | $10.92 | | | | $10.33 | | | | $9.67 | | | | $10.31 | |
| | | | |
Total return | | | (1.95 | )% | | | 8.31 | % | | | 8.64 | % | | | (6.21 | )% | | | (2.59 | )% |
Ratios/supplemental data: | | | | | | | | | | | | | | | | | | | | |
Net assets, end of period (millions) | | | $196 | | | | $156 | | | | $110 | | | | $68 | | | | $65 | |
Ratio of expenses to average net assets | | | 0.45 | %(a) | | | 0.49 | % | | | 0.60 | % | | | 0.60 | % | | | 0.60 | %(a) |
Ratio of expenses to average net assets, before reimbursement by investment manager | | | 0.96 | %(a) | | | 1.06 | % | | | 1.33 | % | | | 1.41 | % | | | 2.18 | %(a) |
Ratio of net investment income to average net assets | | | 3.80 | %(a) | | | 3.51 | % | | | 3.77 | % | | | 3.39 | % | | | 2.83 | %(a) |
Portfolio turnover rate | | | 21 | % | | | 46 | % | | | 73 | % | | | 55 | % | | | 36 | % |
See accompanying Notes to Financial Statements
DODGE & COX GLOBAL BOND FUND §PAGE 15
FUND HOLDINGS
The Fund provides a complete list of its holdings four times each fiscal year, as of the end of each quarter. The Fund files the lists with the Securities and Exchange Commission (SEC) on Form N-CSR (second and fourth quarters) and Form N-Q (first and third quarters). Shareholders may view the Fund’s Forms N-CSR and N-Q on the SEC’s website at sec.gov. Forms N-CSR and N-Q may also be reviewed and copied at the SEC’s Public Reference Room in Washington, DC. Information regarding the operations of the Public Reference Room may be obtained by calling 800-SEC-0330. A list of the Fund’s quarter-end holdings is also available at dodgeandcox.com on or about 15 days following each quarter end and remains available on the web site until the list is updated in the subsequent quarter.
PROXY VOTING
For a free copy of the Fund’s proxy voting policies and procedures, please call 800-621-3979, visit the Fund’s website at www.dodgeandcox.com, or visit the SEC’s website at sec.gov. Information regarding how the Fund voted proxies relating to portfolio securities during the most recent 12-month period ending June 30 is also available at dodgeandcox.com or at sec.gov.
HOUSEHOLD MAILINGS
The Fund routinely mails shareholder reports and summary prospectuses to shareholders and, on occasion, proxy statements. In order to reduce the volume of mail, when possible, only one copy of these documents will be sent to shareholders who are part of the same family and share the same residential address.
If you have a direct account with the Funds and you do not want the mailing of shareholder reports and summary prospectuses combined with other members in your household, contact the Funds at 800-621-3979. Your request will be implemented within 30 days.
PAGE 16 § DODGE & COX GLOBAL BOND FUND
[THIS PAGE INTENTIONALLY LEFT BLANK]
DODGE & COX GLOBAL BOND FUND §PAGE 17
[THIS PAGE INTENTIONALLY LEFT BLANK]
PAGE 18 § DODGE & COX GLOBAL BOND FUND
TRUSTEES AND EXECUTIVE OFFICERS
Charles F. Pohl, Chairman and Trustee
Chairman, Dodge & Cox
Dana M. Emery, President and Trustee
Chief Executive Officer and President, Dodge & Cox
Caroline M. Hoxby, Independent Trustee
Professor of Economics, Stanford University; Senior Fellow, Hoover Institution
Thomas A. Larsen, Independent Trustee
Former Senior Counsel, Arnold & Porter Kaye Scholer LLP
Ann Mather, Independent Trustee
Former Executive Vice President, Chief Financial Officer, and Company Secretary, Pixar Animation Studios
Robert B. Morris III, Independent Trustee
Former Partner and Managing director - Global Investment Research, Goldman Sachs; former Advisory Director, The Presidio Group
Gary Roughead, Independent Trustee
Robert and Marion Oster Distinguished Military Fellow, Hoover Institution; former U.S. Navy Chief of Naval Operations
Mark E. Smith, Independent Trustee
Former Executive Vice President and Managing Director-Fixed Income, Loomis Sayles & Company, L.P.
John B. Taylor, Independent Trustee
Professor of Economics, Stanford University; Senior Fellow, Hoover Institution; and former Under Secretary for International Affairs, United States Treasury
Diana S. Strandberg, Senior Vice President
Senior Vice President and Director of International Equity, Dodge & Cox
David H. Longhurst, Treasurer
Vice President and Assistant Treasurer, Dodge & Cox
Katherine M. Primas, Chief Compliance Officer
Vice President and Chief Compliance Officer, Dodge & Cox
Roberta R.W. Kameda, Secretary
Vice President, General Counsel, and Secretary, Dodge & Cox
William W. Strickland, Vice President, Assistant Secretary, and Assistant Treasurer
Vice President and Chief Operating Officer, Dodge & Cox
Additional information about the Trust’s Trustees and Officers is available in the Trust’s Statement of Additional Information (SAI). You can get a free copy of the SAI by visiting the Funds’ website at dodgeandcox.com or calling 800-621-3979.
DODGE & COX GLOBAL BOND FUND §PAGE 19
dodgeandcox.com
For Fund literature, transactions, and account
information, please visit the Funds’ website.
or write or call:
DODGE & COX FUNDS
c/o DST Asset Manager Solutions, Inc.
P.O. Box 8422
Boston, Massachusetts 02266-8422
(800) 621-3979
INVESTMENT MANAGER
Dodge & Cox
555 California Street, 40th Floor
San Francisco, California 94104
(415) 981-1710
This report is submitted for the general information of the shareholders of the Fund. The report is not authorized for distribution to prospective investors in the Fund unless it is accompanied by a current prospectus.
This report reflects our views, opinions, and portfolio holdings as of June 30, 2018, the end of the reporting period. Any such views are subject to change at any time based upon market or other conditions and Dodge & Cox disclaims any responsibility to update such views. These views may not be relied on as investment advice and, because investment decisions for a Dodge & Cox Fund are based on numerous factors, may not be relied on as an indication of trading intent on behalf of any Dodge & Cox Fund.
Not applicable for semi-annual report filings.
| ITEM 3. | AUDIT COMMITTEE FINANCIAL EXPERT. |
Not applicable for semi-annual report filings.
| ITEM 4. | PRINCIPAL ACCOUNTANT FEES AND SERVICES. |
Not applicable for semi-annual report filings.
| ITEM 5. | AUDIT COMMITTEE OF LISTED REGISTRANTS. |
Not applicable.
| ITEM 6. | SCHEDULE OF INVESTMENTS. |
Not applicable. The complete schedule of investments is included in Item 1 of this Form N-CSR.
ITEM 7. DISCLOSURE OF PROXY VOTING POLICIES AND PROCEDURES FOR CLOSED-END MANAGEMENT INVESTMENT COMPANIES.
Not applicable.
| ITEM 8. | PORTFOLIO MANAGERS OF CLOSED-END MANAGEMENT INVESTMENT COMPANIES. |
Not applicable.
ITEM 9. PURCHASES OF EQUITY SECURITIES BY CLOSED-END MANAGEMENT INVESTMENT COMPANY AND AFFILIATED PURCHASERS.
Not applicable.
| ITEM 10. | SUBMISSION OF MATTERS TO A VOTE OF SECURITY HOLDERS. |
During the reporting period, there were no material changes to the procedures by which shareholders may recommend nominees to the registrant’s Board of Trustees.
| ITEM 11. | CONTROLS AND PROCEDURES. |
(a) An evaluation was performed within 90 days of the filing of this report, under the supervision and with the participation of the registrant’s management, including the principal executive officer and principal financial officer, of the effectiveness of the design and operation of the registrant’s disclosure controls and procedures. Based on that evaluation, the principal executive officer and principal financial officer concluded that the registrant’s disclosure controls and procedures were effective.
(b) The registrant’s principal executive officer and principal financial officer are aware of no changes in the registrant’s internal control over financial reporting that occurred during the registrant’s second fiscal quarter of the period covered by this report that have materially affected, or are reasonably likely to materially affect, the registrant’s internal control over financial reporting.
(a)(1) Not applicable for semi-annual report filings.
(a)(2) Certifications pursuant to Section 302 of the Sarbanes-Oxley Act of 2002 are attached. (EX.99A)
(a)(3) Not applicable.
(b) Certifications pursuant to Section 906 of the Sarbanes-Oxley Act of 2002 are attached. (EX.99B)
SIGNATURES
Pursuant to the requirements of the Securities Exchange Act of 1934 and the Investment Company Act of 1940, the registrant has duly caused this report to be signed on its behalf by the undersigned, thereunto duly authorized.
| | |
| Dodge & Cox Funds |
| |
| By | | /s/ Charles F. Pohl |
| | Charles F. Pohl |
| | Chairman - Principal Executive Officer |
| |
| Date | | August 22, 2018 |
Pursuant to the requirements of the Securities Exchange Act of 1934 and the Investment Company Act of 1940, this report has been signed below by the following persons on behalf of the registrant and in the capacities and on the dates indicated.
| | |
| Dodge & Cox Funds |
| |
| By | | /s/ Charles F. Pohl |
| | Charles F. Pohl |
| | Chairman - Principal Executive Officer |
| |
| By | | /s/ David H. Longhurst |
| | David H. Longhurst |
| | Treasurer - Principal Financial Officer |
| |
| Date | | August 22, 2018 |