UNITED STATES
SECURITIES AND EXCHANGE COMMISSION
Washington, D.C. 20549
FORM N-CSR
CERTIFIED SHAREHOLDER REPORT OF REGISTERED
MANAGEMENT INVESTMENT COMPANIES
Investment Company Act file number 811-173
DODGE & COX FUNDS
(Exact name of registrant as specified in charter)
555 California Street, 40th Floor
San Francisco, CA 94104
(Address of principal executive offices) (Zip code)
Thomas M. Mistele, Esq.
555 California Street, 40th Floor
San Francisco, CA 94104
(Name and address of agent for service)
Registrant’s telephone number, including area code: 415-981-1710
Date of fiscal year end: DECEMBER 31, 2015
Date of reporting period: JUNE 30, 2015
Form N-CSR is to be used by management investment companies to file reports with the Commission not later than 10 days after the transmission to stockholders of any report that is required to be transmitted to stockholders under Rule 30e-1 under the Investment Company Act of 1940 (17 CFR 270.30e-1). The Commission may use the information provided on Form N-CSR in its regulatory, disclosure review, inspection, and policymaking roles.
A registrant is required to disclose the information specified by Form N-CSR, and the Commission will make this information public. A registrant is not required to respond to the collection of information contained in Form N-CSR unless the Form displays a currently valid Office of Management and Budget (“OMB”) control number. Please direct comments concerning the accuracy of the information collection burden estimate and any suggestions for reducing the burden to Secretary, Securities and Exchange Commission, 450 Fifth Street, NW, Washington, DC 20549-0609. The OMB has reviewed this collection of information under the clearance requirements of 44 U.S.C. ss. 3507.
ITEM 1. REPORTS TO STOCKHOLDERS.
The following are the June 30, 2015 semi-annual reports for the Dodge & Cox Funds, a Delaware statutory trust, consisting of six series: Dodge & Cox Stock Fund, Dodge & Cox Global Stock Fund, Dodge & Cox International Stock Fund, Dodge & Cox Balanced Fund, Dodge & Cox Income Fund and Dodge & Cox Global Bond Fund. The reports of each series were transmitted to their respective shareholders on August 18, 2015.

DODGE & COX FUNDS®
Semi-Annual Report
June 30, 2015
Stock Fund
ESTABLISHED 1965
TICKER: DODGX
06/15 SF SAR  Printed on recycled paper
TO OUR SHAREHOLDERS
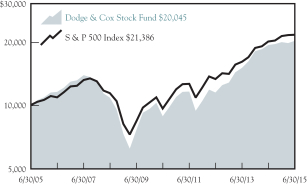
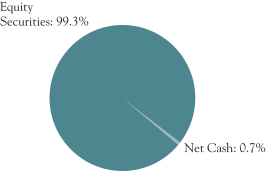
The Dodge & Cox Stock Fund had a total return of 1.4% for the six months ending June 30, 2015, compared to a return of 1.2% for the S&P 500 Index. On June 30, the Fund had net assets of $59.9 billion with net cash of 0.7%.
MARKET COMMENTARY
U.S. equity markets modestly appreciated during the first half of 2015: the S&P 500 rose to a record high in May before retreating to end the period up slightly. After moderating in the first quarter, U.S. economic activity expanded in recent months: labor market conditions improved, household spending grew, and the housing sector reached multi-year highs in existing home sales and building permits. However, these positive developments were tempered by concerns about Greece’s sovereign debt crisis and potential exit from the Eurozone. The escalating situation in Greece could continue to create market volatility.
Indicative of a stronger U.S. economy, longer-term U.S. Treasury rates rose over the six-month period ended June 30. Despite the increase, interest rates remained low in the United States and around the world compared to historical averages. The U.S. Federal Reserve (Fed) reaffirmed its target range for the federal funds rate and its intention to raise rates slowly. Many investors now expect the Fed to begin increasing rates in the second half of 2015. We believe the Fund is well positioned to benefit from a future normalization of interest rates.
INVESTMENT STRATEGY: THE IMPORTANCE OF CAPITAL ALLOCATION
As long-term investors, we look beyond readily available short-term information and consider ourselves part-owners of companies in which we invest. Our global industry analysts thoroughly research each company and evaluate its financial staying power. As part of our analysis, we assess the strength and depth of management teams and attempt to identify potential risks to their business models and our financial projections. In assessing corporate governance, we evaluate the extent to which management is running the company for the benefit of long-term shareholders.
Each investment opportunity is valued on its potential to generate future earnings and cash flow. Importantly, the company’s executive management team—not shareholders—ultimately determines how cash from operations is deployed (e.g., dividends, share repurchases, debt reduction, capital expenditures, acquisitions). As a result, we incorporate each company’s capital allocation track record and plans into our bottom-up research process.
Accelerating Merger & Acquisition (M&A) Activity
From 2008 through 2013, many U.S. corporations focused on improving their balance sheets as a top priority. Such improvements included lowering debt levels, increasing debt coverage ratios, and holding a higher percentage of assets in cash. Consequently, M&A activity ebbed.
More recently, with corporations in stronger financial positions, M&A activity has accelerated due to an improved lending environment, moderating earnings growth, and strong cash positions. The volume of M&A transactions was high in 2014 and, in the second quarter of 2015, exceeded that of each quarter since 2007. A number of Fund holdings across multiple industries are involved in pending transactions, including Baker Hughes, BB&T, Danaher, FedEx, General Electric, Pfizer, and Time Warner Cable.
M&A activity may affect the portfolio, even when it does not involve portfolio holdings. For example, within the Health Care sector (18.2% of the Fund(a)), industry dynamics are driving increased consolidation in the Heath Care Providers and Services industry (Health Care Services). On June 30, the Fund was overweight Health Care Services (6.0% compared to 3.1% of the S&P 500).
Health Care Services
In 2013, we established positions in Health Care Services by purchasing Cigna, UnitedHealth Group, and Express Scripts based on their attractive valuations and improving fundamentals. Industry growth prospects were and continue to be favorable: the Affordable Care Act increased access for previously uninsured citizens, demographic trends are encouraging (e.g., aging population, lengthening life expectancy), and new and improved treatments are being developed.
Industry dynamics are contributing to rising M&A activity in Health Care Services. Elevated regulatory burdens, combined with the need for better data analytics, are driving the need for more sophisticated IT infrastructure. The evolution of value-based pricing systems and consumer-driven health care has increased the advantage of scale players. Furthermore, economies of scale are important in cost-conscious environments: purchasing power is essential in procuring everything from pharmaceuticals to hospital stays to doctor visits.
Concentration among pharmacy benefit managers (PBMs) has created economies of scale in negotiating drug prices, which helps lower treatment costs. Most recently, UnitedHealth’s OptumRx announced plans to acquire Catamaran. If the deal is successful, the three largest PBMs (Express Scripts, CVS, and OptumRx) will manage over 75% of all prescriptions in the United States, compared to only 44% in 2007. One company that should benefit from further industry consolidation is Express Scripts(b) (the Fund’s largest Health Care Services holding).
Express Scripts
Over the past decade, Express Scripts has benefited significantly from three industry trends: increased generic penetration, mail order pharmacy growth, and industry consolidation. Past rounds of mergers—CVS/Caremark, Express Scripts/Medco Health Solutions (Medco), and SXC Health Solutions/Catalyst Health—created an oligopolistic market structure where the top three players now control over 65% of industry volumes. Following its merger with
PAGE 2 § DODGE & COX STOCK FUND
Medco in 2012, Express Scripts became the largest PBM in the United States. The company now generates over $100 billion in annual revenue and manages 1.3 billion claims, or 30% of all U.S. prescription claims. Today, the company operates three vertically integrated businesses: a basic pharmacy benefit manager, a mail order pharmacy, and a specialty pharmacy. Express Scripts has achieved measurable growth by providing patients with generic drugs. With multiple equivalent treatments available, the company has used its buying power to save money for customers and generate profits; its mission is well aligned with customers looking to reduce health care and pharmacy cost trends. This strategy has boosted generic drug penetration to high levels.
The upcoming challenge for Express Scripts is in specialty drugs, which are used to treat chronic, complex diseases, including cancer, hepatitis, and multiple sclerosis. In the United States, this segment accounts for only 1% of volume, yet 25 to 30% of all drug spending. Biotech companies have maintained pricing power in this segment as disease complexity necessitates innovative and unique therapies. However, at over ten times the price of the average prescription, a need exists to manage the costs of these drugs, which we view as an attractive long-term growth opportunity. Express Scripts, with 30% market share in specialty drugs, is best positioned to help patients receive needed treatments cost effectively. Given the emergence of biosimilars and substitute treatments for older biotech drugs, Express Scripts’ strategy has the potential to influence prices in this segment.
During the second quarter, we increased the Fund’s position in Express Scripts after weighing the company’s fundamental outlook against its valuation. We believe Express Scripts’ strong business franchise, significant scale advantage, financial stability, growth opportunities, and reasonable valuation at 15.5 times forward earnings present an attractive investment opportunity. On June 30, Express Scripts was a 2.4% position in the Fund.
IN CLOSING
Despite trading above their long-term average, U.S. equity market valuations remain reasonable in our opinion: the S&P 500 traded at 17.5 times forward estimated earnings with a 2.1% dividend yield at June 30. Given higher starting valuations, we continue to have a more tempered outlook for long-term equity returns. Corporate balance sheets and cash flows continue to be strong. Over our three- to five-year investment horizon, we continue to believe the Fund’s portfolio is well positioned to benefit from long-term global growth opportunities. Acknowledging that markets can be volatile in the short term, we encourage shareholders to remain focused on the long term.
Thank you for your continued confidence in our firm. As always, we welcome your comments and questions.
For the Board of Trustees,
| | |
 | |  |
Charles F. Pohl, Chairman | | Dana M. Emery, President |
July 31, 2015
| (a) | | Unless otherwise specified, all weightings and characteristics are as of June 30, 2015. |
| (b) | | The use of specific examples does not imply that they are more attractive investments than the Fund’s other holdings. |
DODGE & COX STOCK FUND §PAGE 3
YEAR-TO-DATE PERFORMANCE REVIEW
The Fund outperformed the S&P 500 by 0.1 percentage points year to date.
Key Contributors to Relative Results
| | § | | Returns from holdings in the Financials sector (up 5% compared to flat for the S&P 500 sector) contributed to results. Charles Schwab (up 9%) and Capital One (up 8%) were particularly strong. | |
| | § | | The Fund’s average overweight position (18% versus 15%) and holdings in the Health Care sector (up 12% compared to up 10% for the S&P 500 sector) aided performance. Key contributors included Cigna (up 57%), UnitedHealth Group (up 22%), and Sanofi (up 11%). | |
| | § | | The Fund’s underweight position in the Utilities sector (no holdings versus average 3% for the S&P 500 sector), the weakest sector of the market (down 11%), helped results. | |
| | § | | Additional contributors included Celanese (up 21%) and Time Warner Cable (up 19%). | |
Key Detractors from Relative Results
| | § | | The Fund’s average overweight position (23% versus 20%) and holdings in the Information Technology sector (down 6% compared to up 1% for the S&P 500 sector) hurt returns. Hewlett-Packard (down 24%), NetApp (down 23%), and EMC (down 10%) performed poorly. | |
| | § | | Returns from holdings in the Consumer Discretionary sector (up 3% compared to up 7% for the S&P 500 sector) detracted from results. Twenty-First Century Fox (down 15%) was particularly weak. | |
| | § | | Additional detractors included National Oilwell Varco (down 25%), Wal-Mart (down 16%), and Apache (down 7%). | |
KEY CHARACTERISTICS OF DODGE & COX
Independent Organization
Dodge & Cox is one of the largest privately owned investment managers in the world. We remain committed to independence, with a goal of providing the highest quality investment management service to our existing clients.
Over 80 Years of Investment Experience
Dodge & Cox was founded in 1930. We have a stable and well-qualified team of investment professionals, most of whom have spent their entire careers at Dodge & Cox.
Experienced Investment Team
The Investment Policy Committee, which is the decision-making body for the Stock Fund, is a nine-member committee with an average tenure at Dodge & Cox of 27 years.
One Business with a Single Research Office
Dodge & Cox manages equity (domestic, international, and global), fixed income (domestic and global), and balanced investments, operating from one office in San Francisco.
Consistent Investment Approach
Our team decision-making process involves thorough, bottom-up fundamental analysis of each investment.
Long-Term Focus and Low Expenses
We invest with a three- to five-year investment horizon, which has historically resulted in low turnover relative to our peers. We manage Funds that maintain low expense ratios.
Risks: The Fund is subject to market risk, meaning holdings in the Fund may decline in value for extended periods due to the financial prospects of individual companies, or due to general market and economic conditions. Please read the prospectus and summary prospectus for specific details regarding the Fund’s risk profile.
PAGE 4 § DODGE & COX STOCK FUND
GROWTH OF $10,000 OVER 10 YEARS
FOR AN INVESTMENT MADE ON JUNE 30, 2005
AVERAGE ANNUAL TOTAL RETURN
FOR PERIODS ENDED JUNE 30, 2015
| | | | | | | | | | | | | | | | |
| | | 1 Year | | | 5 Years | | | 10 Years | | | 20 Years | |
Dodge & Cox Stock Fund | | | 4.55 | % | | | 17.80 | % | | | 7.20 | % | | | 11.00 | % |
S&P 500 | | | 7.43 | | | | 17.35 | | | | 7.90 | | | | 8.91 | |
Returns represent past performance and do not guarantee future results. Investment return and share price will fluctuate with market conditions, and investors may have a gain or loss when shares are sold. Fund performance changes over time and currently may be significantly lower than stated. Performance is updated and published monthly. Visit the Fund’s website at dodgeandcox.com or call 800-621-3979 for current performance figures.
The Fund’s total returns include the reinvestment of dividend and capital gain distributions, but have not been adjusted for any income taxes payable by shareholders on these distributions or on Fund share redemptions. Index returns include dividends but, unlike Fund returns, do not reflect fees or expenses. The S&P 500 Index is a market capitalization-weighted index of 500 large-capitalization stocks commonly used to represent the U.S. equity market.
S&P 500® is a trademark of McGraw Hill Financial.
FUND EXPENSE EXAMPLE
As a Fund shareholder, you incur ongoing Fund costs, including management fees and other Fund expenses. All mutual funds have ongoing costs, sometimes referred to as operating expenses. The following example shows ongoing costs of investing in the Fund and can help you understand these costs and compare them with those of other mutual funds. The example assumes a $1,000 investment held for the six months indicated.
ACTUAL EXPENSES
The first line of the table below provides information about actual account values and expenses based on the Fund’s actual returns. You may use the information in this line, together with your account balance, to estimate the expenses that you paid over the period. Simply divide your account value by $1,000 (for example, an $8,600 account value divided by $1,000 = 8.6), then multiply the result by the number in the first line under the heading “Expenses Paid During Period” to estimate the expenses you paid on your account during this period.
HYPOTHETICAL EXAMPLE FOR COMPARISON WITH OTHER MUTUAL FUNDS
Information on the second line of the table can help you compare ongoing costs of investing in the Fund with those of other mutual funds. This information may not be used to estimate the actual ending account balance or expenses you paid during the period. The hypothetical “Ending Account Value” is based on the actual expense ratio of the Fund and an assumed 5% annual rate of return before expenses (not the Fund’s actual return). The amount under the heading “Expense Paid During the Period” shows the hypothetical expenses your account would have incurred under this scenario. You can compare this figure with the 5% hypothetical examples that appear in shareholder reports of other mutual funds.
| | | | | | | | | | | | |
Six Months Ended
June 30, 2015 | | Beginning Account Value
1/1/2015 | | | Ending Account Value
6/30/2015 | | | Expenses Paid
During Period* | |
Based on Actual Fund Return | | $ | 1,000.00 | | | $ | 1,013.50 | | | $ | 2.61 | |
Based on Hypothetical 5% Yearly Return | | | 1,000.00 | | | | 1,022.20 | | | | 2.62 | |
| * | | Expenses are equal to the Fund’s annualized expense ratio of 0.52%, multiplied by the average account value over the period, multiplied by 181/365 (to reflect the one-half year period). |
The expenses shown in the table highlight ongoing costs only and do not reflect any transactional fees or account maintenance fees. Though other mutual funds may charge such fees, please note that the Fund does not charge transaction fees (e.g., redemption fees, sales loads) or universal account maintenance fees (e.g., small account fees).
DODGE & COX STOCK FUND §PAGE 5
| | | | |
| FUND INFORMATION | | | June 30, 2015 | |
| | | | |
| GENERAL INFORMATION | | | |
Net Asset Value Per Share | | | $180.47 | |
Total Net Assets (billions) | | | $59.9 | |
Expense Ratio | | | 0.52% | |
Portfolio Turnover Rate (1/1/15 to 6/30/15, unannualized) | | | 7% | |
30-Day SEC Yield(a) | | | 1.30% | |
Fund Inception | | | 1965 | |
No sales charges or distribution fees | | | | |
Investment Manager: Dodge & Cox, San Francisco. Managed by the Investment Policy Committee, whose nine members’ average tenure at Dodge & Cox is 27 years.
| | | | | | | | |
| PORTFOLIO CHARACTERISTICS | | Fund | | | S&P 500 | |
Number of Equity Securities | | | 64 | | | | 502 | |
Median Market Capitalization (billions) | | | $48 | | | | $18 | |
Weighted Average Market Capitalization (billions) | | | $114 | | | | $135 | |
Price-to-Earnings Ratio(b) | | | 14.9x | | | | 17.5x | |
Foreign Securities not in the S&P 500(c) | | | 10.0% | | | | 0.0% | |
| | | | |
| TEN LARGEST HOLDINGS (%)(d) | | Fund | |
Capital One Financial Corp. | | | 4.2 | |
Wells Fargo & Co. | | | 4.0 | |
Hewlett-Packard Co. | | | 3.6 | |
Microsoft Corp. | | | 3.6 | |
Time Warner Cable, Inc. | | | 3.4 | |
Time Warner, Inc. | | | 3.3 | |
Novartis AG (Switzerland) | | | 3.2 | |
Charles Schwab Corp. | | | 3.2 | |
Bank of America Corp. | | | 3.0 | |
Comcast Corp. | | | 2.7 | |
| | | | | | | | |
| SECTOR DIVERSIFICATION (%) | | Fund | | | S&P 500 | |
Financials | | | 25.3 | | | | 16.5 | |
Information Technology | | | 22.3 | | | | 19.7 | |
Health Care | | | 18.2 | | | | 15.4 | |
Consumer Discretionary | | | 15.3 | | | | 12.9 | |
Energy | | | 8.6 | | | | 7.9 | |
Industrials | | | 5.6 | | | | 10.1 | |
Consumer Staples | | | 2.2 | | | | 9.4 | |
Materials | | | 1.0 | | | | 3.0 | |
Telecommunication Services | | | 0.8 | | | | 2.3 | |
Utilities | | | 0.0 | | | | 2.8 | |
| (a) | SEC Yield is an annualization of the Fund’s total net investment income per share for the 30-day period ended on the last day of the month. |
| (b) | Price-to-earnings (P/E) ratios are calculated using 12-month forward earnings estimates from third-party sources. |
| (c) | Foreign securities are U.S. dollar denominated. |
| (d) | The Fund’s portfolio holdings are subject to change without notice. The mention of specific securities is not a recommendation to buy, sell, or hold any particular security and is not indicative of Dodge & Cox’s current or future trading activity. |
PAGE 6 § DODGE & COX STOCK FUND
| | | | |
| PORTFOLIO OF INVESTMENTS (unaudited) | | | June 30, 2015 | |
| | | | | | | | |
| COMMON STOCKS: 99.3% | | | | | | |
| | |
| | | SHARES | | | VALUE | |
| CONSUMER DISCRETIONARY: 15.3% | | | | | |
CONSUMER DURABLES & APPAREL: 0.7% | |
Coach, Inc. | | | 10,116,700 | | | $ | 350,138,987 | |
NVR, Inc.(a) | | | 52,900 | | | | 70,886,000 | |
| | | | | | | | |
| | | | | | | 421,024,987 | |
MEDIA: 11.9% | |
Comcast Corp., Class A | | | 26,799,897 | | | | 1,611,745,806 | |
DISH Network Corp., Class A(a) | | | 6,819,649 | | | | 461,758,434 | |
News Corp., Class A(a) | | | 4,926,406 | | | | 71,876,263 | |
Time Warner Cable, Inc. | | | 11,519,110 | | | | 2,052,359,829 | |
Time Warner, Inc. | | | 22,409,432 | | | | 1,958,808,451 | |
Time, Inc. | | | 999,517 | | | | 22,998,886 | |
Twenty-First Century Fox, Inc. | | | 28,214,826 | | | | 918,251,512 | |
| | | | | | | | |
| | | | | | | 7,097,799,181 | |
RETAILING: 2.7% | |
CarMax, Inc.(a) | | | 309,392 | | | | 20,484,845 | |
Liberty Interactive Corp. QVC Group, Series A(a) | | | 13,101,375 | | | | 363,563,156 | |
Target Corp. | | | 9,640,686 | | | | 786,969,198 | |
The Priceline Group, Inc.(a) | | | 402,000 | | | | 462,850,740 | |
| | | | | | | | |
| | | | | | | 1,633,867,939 | |
| | | | | | | | |
| | | | | | | 9,152,692,107 | |
| CONSUMER STAPLES: 2.2% | | | | | | | | |
FOOD & STAPLES RETAILING: 2.2% | |
Wal-Mart Stores, Inc. | | | 18,730,350 | | | | 1,328,543,726 | |
| | |
| ENERGY: 8.6% | | | | | | | | |
Apache Corp.(c) | | | 18,108,645 | | | | 1,043,601,211 | |
Baker Hughes, Inc. | | | 16,018,450 | | | | 988,338,365 | |
Chevron Corp. | | | 6,792,280 | | | | 655,251,252 | |
National Oilwell Varco, Inc. | | | 11,246,672 | | | | 542,989,324 | |
Schlumberger, Ltd.(b) (Curacao/United States) | | | 18,575,245 | | | | 1,601,000,367 | |
Weatherford International PLC(a),(b) (Ireland) | | | 24,773,700 | | | | 303,973,299 | |
| | | | | | | | |
| | | | | | | 5,135,153,818 | |
| FINANCIALS: 25.3% | | | | | | | | |
BANKS: 10.6% | |
Bank of America Corp. | | | 105,461,800 | | | | 1,794,959,836 | |
BB&T Corp. | | | 15,935,244 | | | | 642,349,685 | |
JPMorgan Chase & Co. | | | 16,756,400 | | | | 1,135,413,664 | |
SunTrust Banks, Inc. | | | 8,620,133 | | | | 370,838,122 | |
Wells Fargo & Co. | | | 43,050,341 | | | | 2,421,151,178 | |
| | | | | | | | |
| | | | | | | 6,364,712,485 | |
DIVERSIFIED FINANCIALS: 12.2% | |
Bank of New York Mellon Corp. | | | 34,467,838 | | | | 1,446,615,161 | |
Capital One Financial Corp.(c) | | | 28,369,211 | | | | 2,495,639,492 | |
Charles Schwab Corp. | | | 58,105,900 | | | | 1,897,157,635 | |
Goldman Sachs Group, Inc. | | | 6,863,400 | | | | 1,433,009,286 | |
| | | | | | | | |
| | | | | | | 7,272,421,574 | |
INSURANCE: 2.5% | |
AEGON NV(b) (Netherlands) | | | 67,966,891 | | | | 502,954,993 | |
MetLife, Inc. | | | 17,801,700 | | | | 996,717,183 | |
| | | | | | | | |
| | | | | | | 1,499,672,176 | |
| | | | | | | | |
| | | | | | | 15,136,806,235 | |
| HEALTH CARE: 18.2% | | | | | | | | |
HEALTH CARE EQUIPMENT & SERVICES: 6.6% | |
Cigna Corp. | | | 6,094,784 | | | | 987,355,008 | |
Express Scripts Holding Co.(a) | | | 16,294,028 | | | | 1,449,190,850 | |
Medtronic PLC(b) (Ireland) | | | 4,690,000 | | | | 347,529,000 | |
UnitedHealth Group, Inc. | | | 9,585,600 | | | | 1,169,443,200 | |
| | | | | | | | |
| | | | | | | 3,953,518,058 | |
| | | | | | | | |
| | |
| | | SHARES | | | VALUE | |
PHARMACEUTICALS, BIOTECHNOLOGY & LIFE SCIENCES: 11.6% | |
GlaxoSmithKline PLC ADR(b) (United Kingdom) | | | 5,717,547 | | | $ | 238,135,833 | |
Merck & Co., Inc. | | | 14,556,500 | | | | 828,701,545 | |
Novartis AG ADR(b) (Switzerland) | | | 19,580,700 | | | | 1,925,566,038 | |
Pfizer, Inc. | | | 27,821,064 | | | | 932,840,276 | |
Roche Holding AG ADR(b) (Switzerland) | | | 40,919,500 | | | | 1,435,046,865 | |
Sanofi ADR(b) (France) | | | 31,918,929 | | | | 1,580,944,553 | |
| | | | | | | | |
| | | | | | | 6,941,235,110 | |
| | | | | | | | |
| | | | | | | 10,894,753,168 | |
| INDUSTRIALS: 5.6% | | | | | | | | |
CAPITAL GOODS: 2.0% | |
Danaher Corp. | | | 6,510,000 | | | | 557,190,900 | |
General Electric Co. | | | 19,714,475 | | | | 523,813,601 | |
Koninklijke Philips NV(b) (Netherlands) | | | 2,860,498 | | | | 72,828,279 | |
NOW, Inc.(a) | | | 1,953,229 | | | | 38,888,789 | |
| | | | | | | | |
| | | | | | | 1,192,721,569 | |
COMMERCIAL & PROFESSIONAL SERVICES: 1.5% | |
ADT Corp.(c) | | | 11,169,337 | | | | 374,954,643 | |
Tyco International PLC(b) (Ireland) | | | 13,160,975 | | | | 506,434,318 | |
| | | | | | | | |
| | | | | | | 881,388,961 | |
TRANSPORTATION: 2.1% | | | | | | | | |
FedEx Corp. | | | 7,624,299 | | | | 1,299,180,550 | |
| | | | | | | | |
| | | | | | | 3,373,291,080 | |
| INFORMATION TECHNOLOGY: 22.3% | | | | | |
SEMICONDUCTORS & SEMICONDUCTOR EQUIPMENT: 0.9% | |
Maxim Integrated Products, Inc.(c) | | | 15,856,840 | | | | 548,250,243 | |
| | |
SOFTWARE & SERVICES: 10.8% | | | | | | | | |
Cadence Design Systems, Inc.(a) | | | 7,999,300 | | | | 157,266,238 | |
eBay, Inc.(a) | | | 14,174,109 | | | | 853,848,326 | |
Google, Inc., Class A(a) | | | 795,200 | | | | 429,439,808 | |
Google, Inc., Class C(a) | | | 1,882,353 | | | | 979,783,560 | |
Microsoft Corp. | | | 48,967,900 | | | | 2,161,932,785 | |
Symantec Corp.(c) | | | 53,861,000 | | | | 1,252,268,250 | |
Synopsys, Inc.(a),(c) | | | 12,517,969 | | | | 634,035,130 | |
| | | | | | | | |
| | | | | | | 6,468,574,097 | |
TECHNOLOGY, HARDWARE & EQUIPMENT: 10.6% | |
Cisco Systems, Inc. | | | 25,168,211 | | | | 691,119,074 | |
Corning, Inc. | | | 26,627,100 | | | | 525,352,683 | |
EMC Corp. | | | 43,010,400 | | | | 1,135,044,456 | |
Hewlett-Packard Co. | | | 72,846,595 | | | | 2,186,126,316 | |
Juniper Networks, Inc. | | | 13,509,776 | | | | 350,848,883 | |
NetApp, Inc.(c) | | | 21,394,000 | | | | 675,194,640 | |
TE Connectivity, Ltd.(b) (Switzerland) | | | 12,576,575 | | | | 808,673,772 | |
| | | | | | | | |
| | | | | | | 6,372,359,824 | |
| | | | | | | | |
| | | | | | | 13,389,184,164 | |
| MATERIALS: 1.0% | | | | | | | | |
Celanese Corp., Series A(c) | | | 8,030,571 | | | | 577,237,443 | |
|
| TELECOMMUNICATION SERVICES: 0.8% | |
Sprint Corp.(a) | | | 102,018,052 | | | | 465,202,317 | |
| | | | | | | | |
TOTAL COMMON STOCKS
(Cost $41,215,301,723) | | | | | | $ | 59,452,864,058 | |
| | |
| See accompanying Notes to Financial Statements | | DODGE & COX STOCK FUND §PAGE 7 |
| | | | |
| PORTFOLIO OF INVESTMENTS (unaudited) | | | June 30, 2015 | |
| | | | | | | | |
| SHORT-TERM INVESTMENTS: 0.9% | | | | |
| | |
| | | PAR VALUE | | | VALUE | |
MONEY MARKET FUND: 0.1% | |
SSgA U.S. Treasury Money Market Fund | | | 59,794,297 | | | | 59,794,297 | |
|
REPURCHASE AGREEMENT: 0.8% | |
Fixed Income Clearing Corporation(d)
0.01%, dated 6/30/15, due 7/1/15,
maturity value $497,465,138 | | | 497,465,000 | | | | 497,465,000 | |
| | | | | | | | |
TOTAL SHORT-TERM INVESTMENTS
(Cost $557,259,297) | | | $ | 557,259,297 | |
| | | | | | | | |
TOTAL INVESTMENTS
(Cost $41,772,561,020) | | | 100.2 | % | | $ | 60,010,123,355 | |
OTHER ASSETS LESS LIABILITIES | | | (0.2 | %) | | | (139,771,519 | ) |
| | | | | | | | |
| NET ASSETS | | | 100.0 | % | | $ | 59,870,351,836 | |
| | | | | | | | |
| (b) | Security denominated in U.S. dollars |
| (c) | See Note 9 regarding holdings of 5% voting securities |
| (d) | Repurchase agreement is collateralized by U.S. Treasury Note 1.50%, 10/31/19-11/30/19 and Freddie Mac 1.87%, 12/24/19. Total collateral value is $507,415,763. |
In determining a company’s country designation, the Fund generally references the country of incorporation. In cases where the Fund considers the country of incorporation to be a “jurisdiction of convenience” chosen primarily for tax purposes or in other limited circumstances, the Fund uses the country designation of an appropriate broad-based market index. In those cases, two countries are listed - the country of incorporation and the country designated by an appropriate index, respectively.
ADR: American Depositary Receipt
| | |
| PAGE 8 § DODGE & COX STOCK FUND | | See accompanying Notes to Financial Statements |
| | | | |
STATEMENT OF ASSETS AND LIABILITIES (unaudited) | |
| |
| | | June 30, 2015 | |
ASSETS: | | | | |
Investments, at value | | | | |
Unaffiliated issuers (cost $37,146,949,629) | | $ | 53,452,543,515 | |
Affiliated issuers (cost $4,625,611,391) | | | 6,557,579,841 | |
| | | | |
| | | 60,010,123,356 | |
Receivable for investments sold | | | 106,397,218 | |
Receivable for Fund shares sold | | | 25,520,733 | |
Dividends and interest receivable | | | 64,292,426 | |
Prepaid expenses and other assets | | | 201,403 | |
| | | | |
| | | 60,206,535,136 | |
| | | | |
LIABILITIES: | | | | |
Payable for investments purchased | | | 200,734,355 | |
Payable for Fund shares redeemed | | | 108,175,900 | |
Management fees payable | | | 25,115,213 | |
Accrued expenses | | | 2,157,832 | |
| | | | |
| | | 336,183,300 | |
| | | | |
NET ASSETS | | $ | 59,870,351,836 | |
| | | | |
NET ASSETS CONSIST OF: | | | | |
Paid in capital | | $ | 40,283,063,884 | |
Undistributed net investment income | | | 7,256,148 | |
Undistributed net realized gain | | | 1,342,469,469 | |
Net unrealized appreciation | | | 18,237,562,335 | |
| | | | |
| | $ | 59,870,351,836 | |
| | | | |
Fund shares outstanding (par value $0.01 each,
unlimited shares authorized) | | | 331,753,044 | |
Net asset value per share | | $ | 180.47 | |
|
STATEMENT OF OPERATIONS
(unaudited) | |
| |
| | | Six Months Ended
June 30, 2015 | |
INVESTMENT INCOME: | | | | |
Dividends (net of foreign taxes of $20,876,250) | | | | |
Unaffiliated issuers | | $ | 558,505,536 | |
Affiliated issuers | | | 71,151,177 | |
Interest | | | 10,946 | |
| | | | |
| | | 629,667,659 | |
| | | | |
EXPENSES: | | | | |
Management fees | | | 149,597,994 | |
Custody and fund accounting fees | | | 367,793 | |
Transfer agent fees | | | 2,605,382 | |
Professional services | | | 154,395 | |
Shareholder reports | | | 605,405 | |
Registration fees | | | 171,471 | |
Trustees’ fees | | | 118,750 | |
Miscellaneous | | | 2,749,380 | |
| | | | |
| | | 156,370,570 | |
| | | | |
NET INVESTMENT INCOME | | | 473,297,089 | |
| | | | |
REALIZED AND UNREALIZED GAIN (LOSS): | | | | |
Net realized gain | | | | |
Unaffiliated issuers | | | 1,167,138,287 | |
Affiliated issuers | | | 177,959,100 | |
Net change in unrealized appreciation/depreciation | | | (1,004,176,685 | ) |
| | | | |
Net realized and unrealized gain | | | 340,920,702 | |
| | | | |
NET INCREASE IN NET ASSETS FROM OPERATIONS | | $ | 814,217,791 | |
| | | | |
| | | | | | | | |
STATEMENT OF CHANGES IN NET ASSETS (unaudited) | |
| | |
| | | Six Months Ended
June 30, 2015 | | | Year Ended
December 31, 2014 | |
OPERATIONS: | | | | | | | | |
Net investment income | | $ | 473,297,089 | | | $ | 919,834,389 | |
Net realized gain | | | 1,345,097,387 | | | | 2,333,359,854 | |
Net change in unrealized
appreciation/depreciation | | | (1,004,176,685 | ) | | | 2,407,499,870 | |
| | | | | | | | |
| | | 814,217,791 | | | | 5,660,694,113 | |
| | | | | | | | |
| | |
DISTRIBUTIONS TO SHAREHOLDERS FROM: | | | | | | | | |
Net investment income | | | (485,424,325 | ) | | | (908,453,128 | ) |
Net realized gain | | | (455,782,420 | ) | | | (840,004,493 | ) |
| | | | | | | | |
Total distributions | | | (941,206,745 | ) | | | (1,748,457,621 | ) |
| | | | | | | | |
| | |
FUND SHARE
TRANSACTIONS: | | | | | | | | |
Proceeds from sale of shares | | | 4,077,080,427 | | | | 9,175,796,977 | |
Reinvestment of distributions | | | 881,917,338 | | | | 1,609,896,035 | |
Cost of shares redeemed | | | (5,221,778,000 | ) | | | (9,285,324,011 | ) |
| | | | | | | | |
Net increase/(decrease) from
Fund share transactions | | | (262,780,235 | ) | | | 1,500,369,001 | |
| | | | | | | | |
Total increase/(decrease) in
net assets | | | (389,769,189 | ) | | | 5,412,605,493 | |
| | |
NET ASSETS: | | | | | | | | |
Beginning of period | | | 60,260,121,025 | | | | 54,847,515,532 | |
| | | | | | | | |
End of period (including undistributed
net investment income of $7,256,148 and $19,383,384, respectively) | | $ | 59,870,351,836 | | | $ | 60,260,121,025 | |
| | | | | | | | |
| | |
SHARE INFORMATION: | | | | | | | | |
Shares sold | | | 22,659,051 | | | | 52,472,086 | |
Distributions reinvested | | | 4,972,360 | | | | 9,034,682 | |
Shares redeemed | | | (28,923,244 | ) | | | (53,255,380 | ) |
| | | | | | | | |
Net increase/(decrease) in shares outstanding | | | (1,291,833 | ) | | | 8,251,388 | |
| | | | | | | | |
| | |
| See accompanying Notes to Financial Statements | | DODGE & COX STOCK FUND §PAGE 9 |
NOTES TO FINANCIAL STATEMENTS (unaudited)
NOTE 1—ORGANIZATION AND SIGNIFICANT ACCOUNTING POLICIES
Dodge & Cox Stock Fund (the “Fund”) is one of the series constituting the Dodge & Cox Funds (the “Trust” or the “Funds”). The Trust is organized as a Delaware statutory trust and is registered under the Investment Company Act of 1940, as amended, as an open-end management investment company. The Fund commenced operations on January 4, 1965, and seeks long-term growth of principal and income. Risk considerations and investment strategies of the Fund are discussed in the Fund’s Prospectus.
The financial statements have been prepared in conformity with accounting principles generally accepted in the United States of America, which require the use of estimates and assumptions by management. Actual results may differ from those estimates. Significant accounting policies are as follows:
Security valuation The Fund’s net assets are valued as of the close of trading on the New York Stock Exchange (NYSE), generally 4:00 p.m. Eastern Time, each day that the NYSE is open for business. Portfolio securities and other financial instruments for which market quotes are readily available are valued at market value. Listed securities are generally valued using the official quoted close price or the last sale on the exchange that is determined to be the primary market for the security. Security values are not discounted based on the size of the Fund’s position. Short-term securities less than 60 days to maturity may be valued at amortized cost if amortized cost approximates current value. Mutual funds are valued at their respective net asset values. All securities held by the Fund are denominated in U.S. dollars.
If market quotations are not readily available or if a security’s value is believed to have materially changed after the close of the security’s primary market but before the close of trading on the NYSE, the security is valued at fair value as determined in good faith by or under the direction of the Funds’ Board of Trustees. The Board of Trustees has delegated authority to Dodge & Cox, the Fund’s investment manager, to make fair value determinations in accordance with the Dodge & Cox Funds Valuation Policies (“Valuation Policies”), subject to Board oversight. Dodge & Cox has established a Pricing Committee that is comprised of representatives from Treasury, Legal, Compliance, and Operations. The Pricing Committee is responsible for implementing the Valuation Policies, including determining the fair value of securities when market quotations or market-based valuations are not readily available or are deemed unreliable. The Pricing Committee considers relevant indications of value that are reasonably available to it in determining the fair value assigned to a particular security, such as the value of similar financial instruments, trading volumes, contractual restrictions on disposition, related corporate actions, and changes in economic conditions. In doing so, the Pricing Committee employs various methods for calibrating fair valuation approaches, including a regular review of key inputs and assumptions, back-testing, and review of any related market activity.
Valuing securities through a fair value determination involves greater reliance on judgment than valuation of securities based on readily available market quotations. In some instances, lack of information and uncertainty as to the significance of information may lead to a conclusion that a prior valuation is the best indication of a security’s value. When fair value pricing is employed, the prices of securities used by the Fund to calculate its NAV may differ from quoted or published prices for the same securities.
Security transactions, investment income, expenses, and distributions Security transactions are recorded on the trade date. Realized gains and losses on securities sold are determined on the basis of identified cost.
Dividend income and corporate action transactions are recorded on the ex-dividend date, or when the Fund first learns of the dividend/corporate action if the ex-dividend date has passed. Withholding taxes on foreign dividends have been provided for in accordance with the Fund’s understanding of the applicable country’s tax rules and rates. Non-cash dividends included in dividend income, if any, are recorded at the fair market value of the securities received. Dividends characterized as return of capital for U.S. tax purposes are recorded as a reduction of cost of investments and/or realized gain. Interest income is recorded on the accrual basis.
Expenses are recorded on the accrual basis. Some expenses of the Trust can be directly attributed to a specific series. Expenses which cannot be directly attributed are allocated among the Funds in the Trust based on relative net assets or other expense methodologies determined by the nature of the expense.
Distributions to shareholders are recorded on the ex-dividend date.
Repurchase agreements The Fund enters into repurchase agreements, secured by U.S. government or agency securities, which involve the purchase of securities from a counterparty with a simultaneous commitment to resell the securities at an agreed-upon date and price. It is the Fund’s policy that its custodian take possession of the underlying collateral securities, the fair value of which exceeds the principal amount of the repurchase transaction, including accrued interest, at all times. In the event of default by the counterparty, the Fund has the contractual right to liquidate the collateral securities and to apply the proceeds in satisfaction of the obligation.
Indemnification Under the Trust’s organizational documents, its officers and trustees are indemnified against certain liabilities arising out of the performance of their duties to the Trust. In addition, in the normal course of business the Trust enters into contracts that provide general indemnities to other parties. The Trust’s maximum exposure under these arrangements is unknown as this would involve future claims that may be made against the Trust that have not yet occurred.
PAGE 10 § DODGE & COX STOCK FUND
NOTES TO FINANCIAL STATEMENTS (unaudited)
NOTE 2—VALUATION MEASUREMENTS
Various inputs are used in determining the value of the Fund’s investments. These inputs are summarized in the three broad levels listed below.
| § | | Level 1: Quoted prices in active markets for identical securities |
| § | | Level 2: Other significant observable inputs (including quoted prices for similar securities, market indices, interest rates, credit risk, etc.) |
| § | | Level 3: Significant unobservable inputs (including Fund management’s assumptions in determining the fair value of investments) |
The inputs or methodology used for valuing securities are not necessarily an indication of the risk associated with investing in those securities.
The following is a summary of the inputs used to value the Fund’s holdings at June 30, 2015:
| | | | | | | | |
| Classification(a) | | LEVEL 1
(Quoted Prices) | | | LEVEL 2
(Other Significant
Observable Inputs) | |
Securities | | | | | | | | |
Common Stocks(b) | | $ | 59,452,864,058 | | | $ | — | |
Short-term Investments | | | | | | | | |
Money Market Fund | | | 59,794,297 | | | | — | |
Repurchase Agreement | | | — | | | | 497,465,000 | |
| | | | | | | | |
Total | | $ | 59,512,658,355 | | | $ | 497,465,000 | |
| | | | | | | | |
| | | | | | | | | |
| (a) | There were no transfers between Level 1 and Level 2 during the period. There were no Level 3 securities at June 30, 2015 and December 31, 2014, and there were no transfers to Level 3 during the period. |
| (b) | All common stocks held in the Fund are Level 1 securities. For a detailed break-out of common stocks by major industry classification, please refer to the Portfolio of Investments. |
NOTE 3—RELATED PARTY TRANSACTIONS
Management fees Under a written agreement approved by a unanimous vote of the Board of Trustees, the Fund pays an annual management fee of 0.50% of the Fund’s average daily net assets to Dodge & Cox, investment manager of the Fund. The agreement further provides that Dodge & Cox shall waive its fee to the extent that such fee plus all other ordinary operating expenses of the Fund exceed 0.75% of the average daily net assets for the year.
Fund officers and trustees All officers and two of the trustees of the Trust are officers or employees of Dodge & Cox. The Trust pays a fee only to those trustees who are not affiliated with Dodge & Cox.
NOTE 4—INCOME TAX INFORMATION AND DISTRIBUTIONS TO SHAREHOLDERS
A provision for federal income taxes is not required since the Fund intends to continue to qualify as a regulated investment company under Subchapter M of the Internal Revenue Code and distribute all of its taxable income to shareholders. Distributions are determined in accordance with income tax regulations, and such amounts may differ from net investment income and realized gains
for financial reporting purposes. Financial reporting records are adjusted for permanent book/tax differences at year end to reflect tax character.
Book/tax differences are primarily due to differing treatments of wash sales and net short-term realized gain (loss). At June 30, 2015, the cost of investments for federal income tax purposes was $41,774,891,200.
Distributions during the periods noted below were characterized as follows for federal income tax purposes:
| | | | | | | | |
| | | Six Months Ended June 30, 2015 | | | Year Ended
December 31, 2014 | |
Ordinary income | | | $485,424,325 | | | | $908,453,128 | |
| | | ($1.460 per share) | | | | ($2.800 per share) | |
| | |
Long-term capital gain | | | $455,782,420 | | | | $840,004,493 | |
| | | ($1.367 per share) | | | | ($2.560 per share) | |
At June 30, 2015, the tax basis components of distributable earnings were as follows:
| | | | |
Unrealized appreciation | | $ | 19,662,388,678 | |
Unrealized depreciation | | | (1,427,156,522 | ) |
| | | | |
Net unrealized appreciation | | | 18,235,232,156 | |
Undistributed ordinary income | | | 7,385,084 | |
Undistributed long-term capital gain | | | 1,344,670,712 | |
Fund management has reviewed the tax positions for open periods (three years and four years, respectively, from filing the Fund’s Federal and State tax returns) as applicable to the Fund, and has determined that no provision for income tax is required in the Fund’s financial statements.
NOTE 5—LOAN FACILITIES
Pursuant to an exemptive order issued by the Securities and Exchange Commission (SEC), the Fund may participate in an interfund lending facility (Facility). The Facility allows the Fund to borrow money from or loan money to the Funds. Loans under the Facility are made for temporary or emergency purposes, such as to fund shareholder redemption requests. Interest on borrowings is the average of the current repurchase agreement rate and the bank loan rate. There was no activity in the Facility during the period.
All Funds in the Trust participate in a $500 million committed credit facility (Line of Credit) with State Street Bank and Trust Company, to be utilized for temporary or emergency purposes to fund shareholder redemptions or for other short-term liquidity purposes. The maximum amount available to the Fund is $250 million. Each Fund pays an annual commitment fee on its pro-rata portion of the Line of Credit. The Fund’s commitment fee for the six months ended June 30, 2015, amounted to $90,028 and is reflected as a Miscellaneous Expense in the Statement of Operations. Interest on borrowings is charged at the prevailing rate. There were no borrowings on the Line of Credit during the period.
DODGE & COX STOCK FUND §PAGE 11
NOTES TO FINANCIAL STATEMENTS (unaudited)
NOTE 6—PURCHASES AND SALES OF INVESTMENTS
For the six months ended June 30, 2015, purchases and sales of securities, other than short-term securities, aggregated $3,863,616,218 and $4,298,533,902, respectively.
NOTE 7—ACCOUNTING PRONOUNCEMENTS
In June 2014, the Financial Accounting Standards Board issued Accounting Standards Update (ASU) No. 2014-11, Transfers and Servicing (Topic 860), Repurchase-to-Maturity Transactions, Repurchase Financings, and Disclosures. The ASU changes the accounting for certain repurchase agreements and expands disclosure requirements related to repurchase agreements and similar transactions. There was no impact to these financial statements as a result of applying this ASU.
NOTE 8—SUBSEQUENT EVENTS
Fund management has determined that no material events or transactions occurred subsequent to June 30, 2015, and through the date of the Fund’s financial statements issuance, which require additional disclosure in the Fund’s financial statements.
PAGE 12 § DODGE & COX STOCK FUND
NOTES TO FINANCIAL STATEMENTS (unaudited)
NOTE 9—HOLDINGS OF 5% VOTING SECURITIES
Each of the companies listed below was considered to be an affiliate of the Fund because the Fund owned 5% or more of the company’s voting securities during all or part of the six months ended June 30, 2015. Purchase and sale transactions and dividend income earned during the period on these securities were as follows:
| | | | | | | | | | | | | | | | | | | | | | | | |
| | | Shares at
Beginning of Period | | | Additions | | | Reductions | | | Shares at
End of Period | | | Dividend
Income(a) | | | Value at End of Period | |
ADT Corp. | | | 11,819,337 | | | | — | | | | (650,000 | ) | | | 11,169,337 | | | $ | 4,922,122 | | | $ | 374,954,643 | |
AOL, Inc. | | | 7,100,754 | | | | — | | | | (7,100,754 | ) | | | — | | | | — | (b) | | | — | |
Apache Corp. | | | 18,390,028 | | | | 918,617 | | | | (1,200,000 | ) | | | 18,108,645 | | | | 9,609,323 | | | | — | (c) |
Capital One Financial Corp. | | | 28,169,211 | | | | 420,000 | | | | (220,000 | ) | | | 28,369,211 | | | | 19,858,448 | | | | 2,495,639,492 | |
Celanese Corp., Series A | | | 9,220,971 | | | | — | | | | (1,190,400 | ) | | | 8,030,571 | | | | 5,071,534 | | | | 577,237,443 | |
Maxim Integrated Products, Inc. | | | 16,326,840 | | | | 500,000 | | | | (970,000 | ) | | | 15,856,840 | | | | 9,011,430 | | | | 548,250,243 | |
NetApp, Inc. | | | 19,794,000 | | | | 1,600,000 | | | | — | | | | 21,394,000 | | | | 6,779,520 | | | | 675,194,640 | |
Symantec Corp. | | | 51,921,000 | | | | 1,940,000 | | | | — | | | | 53,861,000 | | | | 15,898,800 | | | | 1,252,268,250 | |
Synopsys, Inc. | | | 13,627,969 | | | | — | | | | (1,110,000 | ) | | | 12,517,969 | | | | — | (b) | | | 634,035,130 | |
| | | | | | | | | | | | | | | | | | | | | | | | |
| | | | | | | | | | | | | | | | | | $ | 71,151,177 | | | $ | 6,557,579,841 | |
| | | | | | | | | | | | | | | | | | | | | | | | |
| | | | | | | | | | | | | | | | | | | | | | | | | |
| (a) | Net of foreign taxes, if any |
| (c) | Company was not an affiliate at period end |
FINANCIAL HIGHLIGHTS (unaudited)
| | | | | | | | | | | | | | | | | | | | | | | | |
SELECTED DATA AND RATIOS (for a share outstanding throughout each period) | | Six Months Ended June 30, | | | Year Ended December 31, | |
| | | 2015(a) | | | 2014 | | | 2013 | | | 2012 | | | 2011 | | | 2010 | |
| | | | | | | | |
Net asset value, beginning of period | | | $180.94 | | | | $168.87 | | | | $121.90 | | | | $101.64 | | | | $107.76 | | | | $96.14 | |
Income from investment operations: | | | | | | | | | | | | | | | | | | | | | | | | |
Net investment income | | | 1.42 | | | | 2.83 | | | | 2.11 | | | | 1.98 | | | | 1.76 | | | | 1.23 | |
Net realized and unrealized gain (loss) | | | 0.94 | | | | 14.60 | | | | 46.97 | | | | 20.26 | | | | (6.13 | ) | | | 11.62 | |
| | | | | | | | |
Total from investment operations | | | 2.36 | | | | 17.43 | | | | 49.08 | | | | 22.24 | | | | (4.37 | ) | | | 12.85 | |
| | | | | | | | |
Distributions to shareholders from: | | | | | | | | | | | | | | | | | | | | | | | | |
Net investment income | | | (1.46 | ) | | | (2.80 | ) | | | (2.11 | ) | | | (1.98 | ) | | | (1.75 | ) | | | (1.23 | ) |
Net realized gain | | | (1.37 | ) | | | (2.56 | ) | | | — | | | | — | | | | — | | | | — | |
| | | | | | | | |
Total distributions | | | (2.83 | ) | | | (5.36 | ) | | | (2.11 | ) | | | (1.98 | ) | | | (1.75 | ) | | | (1.23 | ) |
| | | | | | | | |
Net asset value, end of period | | | $180.47 | | | | $180.94 | | | | $168.87 | | | | $121.90 | | | | $101.64 | | | | $107.76 | |
| | | | | | | | |
Total return | | | 1.35 | % | | | 10.43 | % | | | 40.55 | % | | | 22.01 | % | | | (4.08 | )% | | | 13.48 | % |
Ratios/supplemental data: | | | | | | | | | | | | | | | | | | | | | | | | |
Net assets, end of period (millions) | | | $59,870 | | | | $60,260 | | | | $54,848 | | | | $39,841 | | | | $36,562 | | | | $43,038 | |
Ratio of expenses to average net assets | | | 0.52 | %(b) | | | 0.52 | % | | | 0.52 | % | | | 0.52 | % | | | 0.52 | % | | | 0.52 | % |
Ratio of net investment income to average net assets | | | 1.58 | %(b) | | | 1.62 | % | | | 1.45 | % | | | 1.72 | % | | | 1.62 | % | | | 1.25 | % |
Portfolio turnover rate | | | 7 | % | | | 17 | % | | | 15 | % | | | 11 | % | | | 16 | % | | | 12 | % |
See accompanying Notes to Financial Statements
DODGE & COX STOCK FUND §PAGE 13
FUND HOLDINGS
The Fund provides a complete list of its holdings four times each fiscal year, as of the end of each quarter. The Fund files the lists with the Securities and Exchange Commission (SEC) on Form N-CSR (second and fourth quarters) and Form N-Q (first and third quarters). Shareholders may view the Fund’s Forms N-CSR and N-Q on the SEC’s website at sec.gov. Forms N-CSR and N-Q may also be reviewed and copied at the SEC’s Public Reference Room in Washington, DC. Information regarding the operations of the Public Reference Room may be obtained by calling 202-942-8090 (direct) or 800-732-0330 (general SEC number). A list of the Fund’s quarter-end holdings is also available at dodgeandcox.com on or about 15 days following each quarter end and remains available on the website until the list is updated in the subsequent quarter.
PROXY VOTING
For a free copy of the Fund’s proxy voting policies and procedures, please call 800-621-3979, visit the Fund’s website at dodgeandcox.com, or visit the SEC’s website at sec.gov. Information regarding how the Fund voted proxies relating to portfolio securities during the most recent 12-month period ending June 30 is also available at dodgeandcox.com or at sec.gov.
HOUSEHOLD MAILINGS
The Fund routinely mails shareholder reports and summary prospectuses to shareholders and, on occasion, proxy statements. In order to reduce the volume of mail, when possible, only one copy of these documents will be sent to shareholders who are part of the same family and share the same residential address.
If you have a direct account with the Funds and you do not want the mailing of shareholder reports and summary prospectuses combined with other members in your household, contact the Funds at 800-621-3979. Your request will be implemented within 30 days.
PAGE 14 § DODGE & COX STOCK FUND
TRUSTEES AND EXECUTIVE OFFICERS
Charles F. Pohl, Chairman and Trustee
Chairman, Dodge & Cox
Dana M. Emery, President and Trustee
Chief Executive Officer and President, Dodge & Cox
Thomas A. Larsen, Independent Trustee
Senior Counsel, Arnold & Porter LLP
Ann Mather, Independent Trustee
Former Executive Vice President, Chief Financial Officer, and Company Secretary, Pixar Studios
Robert B. Morris III, Independent Trustee
Advisory Director, The Presidio Group
Gary Roughead, Independent Trustee
Annenberg Distinguished Visiting Fellow, Hoover Institution; and former U.S. Navy Chief of Naval Operations
Mark E. Smith, Independent Trustee
Former Executive Vice President and Managing Director - Fixed Income, Loomis Sayles & Company, L.P.
John B. Taylor, Independent Trustee
Professor of Economics, Stanford University; Senior Fellow, Hoover Institute; and former Under Secretary for International Affairs, United States Treasury
John A. Gunn, Senior Vice President
Former Chairman and Chief Executive Officer, Dodge & Cox
Diana S. Strandberg, Senior Vice President
Senior Vice President and Director of International Equity, Dodge & Cox
David H. Longhurst, Treasurer
Vice President and Assistant Treasurer, Dodge & Cox
Thomas M. Mistele, Secretary
Chief Operating Officer, Secretary, and Senior Counsel, Dodge & Cox
Katherine M. Primas, Chief Compliance Officer
Chief Compliance Officer, Dodge & Cox
Additional information about the Trust’s Trustees and Officers is available in the Trust’s Statement of Additional Information (SAI). You can get a free copy of the SAI by visiting the Funds’ website at dodgeandcox.com or calling 800-621-3979.
DODGE & COX STOCK FUND §PAGE 15
dodgeandcox.com
For Fund literature, transactions, and account
information, please visit the Funds’ website.
or write or call:
DODGE & COX FUNDS
c/o Boston Financial Data Services
P.O. Box 8422
Boston, Massachusetts 02266-8422
(800) 621-3979
INVESTMENT MANAGER
Dodge & Cox
555 California Street, 40th Floor
San Francisco, California 94104
(415) 981-1710
This report is submitted for the general information of the shareholders of the Fund. The report is not authorized for distribution to prospective investors in the Fund unless it is accompanied by a current prospectus.
This report reflects our views, opinions, and portfolio holdings as of June 30, 2015, the end of the reporting period. Any such views are subject to change at any time based upon market or other conditions and Dodge & Cox disclaims any responsibility to update such views. These views may not be relied on as investment advice and, because investment decisions for a Dodge & Cox Fund are based on numerous factors, may not be relied on as an indication of trading intent on behalf of any Dodge & Cox Fund.
DODGE & COX FUNDS®
Semi-Annual Report
June 30, 2015
Global Stock Fund
ESTABLISHED 2008
TICKER: DODWX
6/15 GSF SAR Printed on recycled paper
TO OUR SHAREHOLDERS
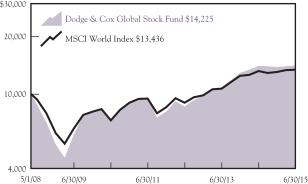
The Dodge & Cox Global Stock Fund had a total return of 2.2%, compared to a return of 2.6% for the MSCI World Index for the six months ending June 30, 2015. On June 30, the Fund had net assets of $6.5 billion with net cash of 1.7%.
MARKET COMMENTARY
During the first half of 2015, global equity markets were strong: most developed and emerging markets appreciated in local currency terms. However, the U.S. dollar’s appreciation against both developed and emerging market currencies was a headwind to performance: the MSCI World was up 4% in local currency versus up 3% in U.S. dollars; the MSCI Emerging Markets Index was up 6% in local currency versus up 3% in U.S. dollars. Among other currencies, the U.S. dollar was particularly strong against the euro (up 9%), and the Fund’s partial hedge of euro exposures helped mitigate the negative currency impact on returns.
Every region of the MSCI World generated positive returns in local currency. In the United States, equity markets modestly appreciated during the first half of 2015: the S&P 500 rose to a record high in May before retreating to end the period up 1%. After moderating in the first quarter, U.S. economic activity expanded in recent months: labor market conditions improved, household spending grew, and existing home sales and building permits reached multi-year highs. Indicative of a stronger U.S. economy, longer-term U.S. Treasury rates rose over the six-month period ended June 30. Despite the increase, interest rates remained low in the United States and around the world compared to historical averages. The U.S. Federal Reserve (Fed) reaffirmed its target range for the federal funds rate and its intention to raise rates slowly. Many investors now expect the Fed to begin increasing rates in the second half of 2015.
Japan (up 16% in local currency)—the strongest region of the market—showed signs of economic progress supported by its aggressive stimulus program, increased capital expenditures, and improving business sentiment. In Europe (up 10% in local currency), the European Central Bank substantially expanded its quantitative easing program, and manufacturing activity in the Eurozone strengthened to its highest level in four years. The sovereign debt crisis in Greece (down 19% in local currency) intensified further in the midst of tense negotiations with creditors. Concerns about Greece could continue to create volatility for markets and the euro.
In emerging markets, China (up 15% in local currency) was one of the best-performing countries for the six-month period, benefiting from stimulus measures (e.g., rate cuts, liquidity initiatives) and the government’s efforts to further liberalize capital markets. The Chinese equity market, however, has declined meaningfully from its peak in mid-June.
INVESTMENT STRATEGY:
IDENTIFYING ASSET VALUE POTENTIAL
As long-term investors, we look beyond readily available short-term information and consider ourselves part-owners of companies in which we invest. Our global industry analysts thoroughly
research each company and evaluate its financial staying power. As part of our analysis, we evaluate the extent to which management is running the company for the benefit of long-term shareholders. Our due diligence process also incorporates an analysis of underlying asset value where such value could be realized in the marketplace through corporate actions such as merger and acquisition (M&A) activity, spinoffs, and capital returns to shareholders.
Accelerating M&A Activity
From 2008 through 2013, many global corporations focused on improving their balance sheets as a top priority. Such improvements included lowering debt levels, increasing debt coverage ratios, and holding a higher percentage of assets in cash. Consequently, M&A activity ebbed.
More recently, with corporations in stronger financial positions, M&A activity has accelerated. An improved lending environment, moderating earnings growth, and strong cash positions have stimulated deal activity. The volume of M&A transactions was high in 2014 and, in the second quarter of 2015, exceeded that of each quarter since 2007. Currently, a number of Fund holdings across multiple industries are in the midst of pending transactions, including Baker Hughes, FedEx, Lafarge, and Time Warner Cable.
One area that is seeing increased M&A activity is the Health Care Providers & Services industry (Health Care Services) within the Health Care sector (13.6% of the Fund(a)). As of June 30, Health Care Services was 5.3% of the Fund compared to 1.9% of the MSCI World.
Health Care Services
Since 2013, we have established new positions in Health Care Services by purchasing Cigna, UnitedHealth Group, and Express Scripts based on their attractive valuations and improving fundamentals. Industry growth prospects were and continue to be favorable: the Affordable Care Act increased access for previously uninsured citizens, demographic trends are encouraging (e.g., aging population, lengthening life expectancy), and new and improved treatments are being developed.
Industry dynamics are contributing to rising M&A activity in Health Care Services. Elevated regulatory burdens, combined with the need for better data analytics, are driving the need for more sophisticated IT infrastructure. The evolution of value-based pricing systems and consumer-driven health care has increased the advantage of scale players. Furthermore, economies of scale are important in cost-conscious environments: purchasing power is essential in procuring everything from pharmaceuticals to hospital stays to doctor visits.
Concentration among pharmacy benefit managers (PBMs) has created economies of scale in negotiating drug prices, which helps lower treatment costs. Most recently, UnitedHealth’s OptumRx announced plans to acquire Catamaran. If the deal is successful, the three largest PBMs (Express Scripts, CVS, and OptumRx) will manage over 75% of all prescriptions in the
PAGE 2 § DODGE & COX GLOBAL STOCK FUND
United States, compared to only 44% in 2007. One company that should benefit from further industry consolidation is Express Scripts(b) (the Fund’s largest Health Care Services holding).
Express Scripts
Over the past decade, Express Scripts has been a significant beneficiary of three industry trends: increased generic penetration, mail order pharmacy growth, and industry consolidation. The past round of mergers—CVS/Caremark, Express Scripts/Medco Health Solutions (Medco), and SXC Health Solutions/Catalyst Health—has created an oligopolistic market structure where the top three players now control over 65% of industry volumes.
Following its merger with Medco in 2012, Express Scripts became the largest PBM in the United States. The company now generates over $100 billion in annual revenue and manages 1.3 billion claims, or 30% of all U.S. prescription claims. Today, the company operates three vertically integrated businesses: a basic pharmacy benefit manager, a mail order pharmacy, and a specialty pharmacy. Express Scripts has achieved measurable growth by providing patients with generic drugs. With multiple equivalent treatments available, the company has used its buying power to save money for customers and generate profits; its mission is well aligned with customers looking to reduce health care and pharmacy cost trends. This strategy has boosted generic drug penetration to high levels.
The upcoming challenge for Express Scripts is in specialty drugs, which are used to treat chronic, complex diseases, including cancer, hepatitis, and multiple sclerosis. In the United States, this segment accounts for only 1% of volume, yet 25 to 30% of all drug spending. Biotech companies have maintained pricing power in this segment as disease complexity necessitates innovative and unique therapies. At over ten times the price of the average prescription, however, a need exists to manage the costs of these drugs, which we view as an attractive long-term growth opportunity. Express Scripts, with 30% market share in specialty drugs, is best positioned to help patients receive needed treatments cost effectively. Given the emergence of biosimilars and substitute treatments for older biotech drugs, Express Scripts’ strategy has the potential to influence prices in this segment.
During the second quarter, we increased the Fund’s position in Express Scripts after weighing the company’s fundamental outlook against its valuation. We believe Express Scripts’ strong business franchise, significant scale advantage, financial stability, growth opportunities, and reasonable valuation at 15.5 times forward earnings present an attractive investment opportunity. On June 30, Express Scripts was a 2.1% position in the Fund.
IN CLOSING
While global equity valuations have trended higher, we believe they remain reasonable: the MSCI World traded at 16.1 times forward earnings (near its 20-year historical average) on June 30. As we look for long-term investment candidates in both developed and emerging markets, we continue to see attractive opportunities. Corporate balance sheets and cash flows remain strong. However, we have a more tempered outlook for long-term equity returns
given higher valuations today. The Fund is invested in companies that we believe have favorable prospects over our three- to five-year investment horizon. Acknowledging that both share prices and currencies can be volatile in the short term, we encourage shareholders to remain focused on the long term.
Thank you for your continued confidence in our firm. As always, we welcome your comments and questions.
For the Board of Trustees,
| | |
| | |
Charles F. Pohl, Chairman | | Dana M. Emery, President |
July 31, 2015
| (a) | | Unless otherwise specified, all weightings and characteristics are as of June 30, 2015. |
| (b) | | The use of specific examples does not imply that they are more attractive investments than the Fund’s other holdings. |
DODGE & COX GLOBAL STOCK FUND §PAGE 3
YEAR-TO-DATE PERFORMANCE REVIEW
The Fund underperformed the MSCI World by 0.4 percentage points year to date.
Key Detractors from Relative Results
| | § | | The Fund’s holdings in the Information Technology sector (down 6% compared to up 2% for the MSCI World sector), combined with a higher average weighting (19% versus 13%), had a negative impact. Hewlett-Packard (down 24%), NetApp (down 23%), Baidu (down 13%), and Samsung Electronics (down 6%) were notable detractors. | |
| | § | | Relative returns in the Financials sector (up 1% compared to up 2% for the MSCI World sector), especially in the emerging markets, hindered performance. BR Malls (down 22%), Kasikornbank (down 19%), and ICICI Bank (down 12%) detracted from results. | |
| | § | | Weak returns in the Consumer Staples sector (down 8% compared to up 1% for the MSCI World sector) also hurt results. Wal-Mart (down 16%) lagged. | |
| | § | | National Oilwell Varco (down 25%) was an additional notable detractor. | |
Key Contributors to Relative Results
| | § | | The Fund’s holdings in the Consumer Discretionary sector (up 9% compared to up 7% for the MSCI World sector), combined with a higher average weighting (19% versus 13%), contributed to results. Nissan Motor (up 20%), Naspers (up 19%), and Time Warner Cable (up 19%) were notable contributors. | |
| | § | | Relative returns in the Energy sector (flat compared to down 5% for the MSCI World sector), helped by the Fund’s lower average weighting in the Oil, Gas & Consumable Fuels industry (down 6% for the MSCI World industry), aided performance. | |
| | § | | The Fund’s holdings in the Health Care sector (up 12% compared to up 10% for the MSCI World sector) also had a positive impact. Cigna (up 57%) and UnitedHealth Group (up 22%) were particularly strong. | |
| | § | | Additional contributors included Nintendo (up 60%) and Standard Chartered (up 11%). | |
KEY CHARACTERISTICS OF DODGE & COX
Independent Organization
Dodge & Cox is one of the largest privately owned investment managers in the world. We remain committed to independence, with a goal of providing the highest quality investment management service to our existing clients.
Over 80 Years of Investment Experience
Dodge & Cox was founded in 1930. We have a stable and well-qualified team of investment professionals, most of whom have spent their entire careers at Dodge & Cox.
Experienced Investment Team
The Global Stock Investment Policy Committee, which is the decision-making body for the Global Stock Fund, is a seven-member committee with an average tenure at Dodge & Cox of 19 years.
One Business with a Single Research Office
Dodge & Cox manages equity (domestic, international, and global), fixed income (domestic and global), and balanced investments, operating from one office in San Francisco.
Consistent Investment Approach
Our team decision-making process involves thorough, bottom-up fundamental analysis of each investment.
Long-Term Focus and Low Expenses
We invest with a three- to five-year investment horizon, which has historically resulted in low turnover relative to our peers. We manage Funds that maintain low expense ratios.
Risks: The Fund is subject to market risk, meaning holdings in the Fund may decline in value for extended periods due to the financial prospects of individual companies, or due to general market and economic conditions. Investing in non-U.S. securities may entail risk due to foreign economic and political developments; this risk may be increased when investing in emerging markets. The Fund is also subject to currency risk. Please read the prospectus and summary prospectus for specific details regarding the Fund’s risk profile.
PAGE 4 § DODGE & COX GLOBAL STOCK FUND
GROWTH OF $10,000 SINCE INCEPTION
FOR AN INVESTMENT MADE ON MAY 1, 2008
AVERAGE ANNUAL TOTAL RETURN
FOR PERIODS ENDED JUNE 30, 2015
| | | | | | | | | | | | | | | | |
| | | 1 Year | | | 3 Years | | | 5 Years | | | Since
Inception
(5/1/08) | |
Dodge & Cox Global Stock Fund | | | 0.54 | % | | | 18.33 | % | | | 14.42 | % | | | 5.04 | % |
MSCI World Index | | | 1.42 | | | | 14.27 | | | | 13.10 | | | | 4.20 | |
Returns represent past performance and do not guarantee future results. Investment return and share price will fluctuate with market conditions, and investors may have a gain or loss when shares are sold. Fund performance changes over time and currently may be significantly lower than stated. Performance is updated and published monthly. Visit the Fund’s website at dodgeandcox.com or call 800-621-3979 for current performance figures.
The Fund’s total returns include the reinvestment of dividend and capital gain distributions, but have not been adjusted for any income taxes payable by shareholders on these distributions or on Fund share redemptions. Index returns include dividends but, unlike Fund returns, do not reflect fees or expenses. The MSCI World Index is a broad-based, unmanaged equity market index aggregated from 23 developed market country indices, including the United States. MSCI makes no express or implied warranties or representations and shall have no liability whatsoever with respect to any MSCI data contained herein. The MSCI data may not be further redistributed or used as a basis for other indices or any securities or financial products. This report is not approved, reviewed, or produced by MSCI.
MSCI World is a service mark of MSCI Barra.
FUND EXPENSE EXAMPLE
As a Fund shareholder, you incur ongoing Fund costs, including management fees and other Fund expenses. All mutual funds have ongoing costs, sometimes referred to as operating expenses. The following example shows ongoing costs of investing in the Fund and can help you understand these costs and compare them with those of other mutual funds. The example assumes a $1,000 investment held for the six months indicated.
ACTUAL EXPENSES
The first line of the table below provides information about actual account values and expenses based on the Fund’s actual returns. You may use the information in this line, together with your account balance, to estimate the expenses that you paid over the period. Simply divide your account value by $1,000 (for example, an $8,600 account value divided by $1,000 = 8.6), then multiply the result by the number in the first line under the heading “Expenses Paid During Period” to estimate the expenses you paid on your account during this period.
HYPOTHETICAL EXAMPLE FOR COMPARISON WITH OTHER MUTUAL FUNDS
Information on the second line of the table can help you compare ongoing costs of investing in the Fund with those of other mutual funds. This information may not be used to estimate the actual ending account balance or expenses you paid during the period. The hypothetical “Ending Account Value” is based on the actual expense ratio of the Fund and an assumed 5% annual rate of return before expenses (not the Fund’s actual return). The amount under the heading “Expense Paid During the Period” shows the hypothetical expenses your account would have incurred under this scenario. You can compare this figure with the 5% hypothetical examples that appear in shareholder reports of other mutual funds.
| | | | | | | | | | | | |
Six Months Ended June 30, 2015 | | Beginning Account Value
1/1/2015 | | | Ending Account Value
6/30/2015 | | | Expenses Paid During Period* | |
Based on Actual Fund Return | | $ | 1,000.00 | | | $ | 1,022.00 | | | $ | 3.21 | |
Based on Hypothetical 5% Yearly Return | | | 1,000.00 | | | | 1,021.62 | | | | 3.21 | |
| * | | Expenses are equal to the Fund’s annualized expense ratio of 0.64%, multiplied by the average account value over the period, multiplied by 181/365 (to reflect the one-half year period). |
The expenses shown in the table highlight ongoing costs only and do not reflect any transactional fees or account maintenance fees. Though other mutual funds may charge such fees, please note that the Fund does not charge transaction fees (e.g., redemption fees, sales loads) or universal account maintenance fees (e.g., small account fees).
DODGE & COX GLOBAL STOCK FUND §PAGE 5
| | | | |
| FUND INFORMATION | | | June 30, 2015 | |
| | | | |
| GENERAL INFORMATION | | | |
Net Asset Value Per Share | | | $12.09 | |
Total Net Assets (billions) | | | $6.5 | |
2014 Expense Ratio (per 5/1/15 Prospectus) | | | 0.65% | |
Expense Ratio (1/1/15 to 6/30/15, annualized) | | | 0.64% | |
Portfolio Turnover Rate (1/1/15 to 6/30/15, unannualized) | | | 6% | |
30-Day SEC Yield(a) | | | 1.23% | |
Fund Inception | | | 2008 | |
No sales charges or distribution fees | | | | |
Investment Manager: Dodge & Cox, San Francisco. Managed by the Global Stock Investment Policy Committee, whose seven members’ average tenure at Dodge & Cox is 19 years.
| | | | | | | | |
| PORTFOLIO CHARACTERISTICS | | Fund | | | MSCI
World | |
Number of Equity Securities | | | 88 | | | | 1,645 | |
Median Market Capitalization (billions) | | | $38 | | | | $11 | |
Weighted Average Market | | | | | | | | |
Capitalization (billions) | | | $89 | | | | $94 | |
Price-to-Earnings Ratio(b) | | | 14.5x | | | | 16.1x | |
Countries Represented | | | 21 | | | | 23 | |
Emerging Markets (Brazil, China, India, Mexico, South Africa, South Korea, Thailand, Turkey) | | | 16.5% | | | | 0.0% | |
| | | | |
| TEN LARGEST HOLDINGS (%)(c) | | Fund | |
Time Warner Cable, Inc. (United States) | | | 2.7 | |
Samsung Electronics Co., Ltd. (South Korea) | | | 2.6 | |
Hewlett-Packard Co. (United States) | | | 2.5 | |
Bank of America Corp. (United States) | | | 2.4 | |
Google, Inc. (United States) | | | 2.4 | |
Novartis AG (Switzerland) | | | 2.3 | |
Roche Holding AG (Switzerland) | | | 2.3 | |
Naspers, Ltd. (South Africa) | | | 2.3 | |
Standard Chartered PLC (United Kingdom) | | | 2.2 | |
Express Scripts Holding Co. (United States) | | | 2.2 | |

| | | | | | | | |
| REGION DIVERSIFICATION (%)(d) | | Fund | | | MSCI
World | |
United States | | | 48.1 | | | | 57.6 | |
Europe (excluding United Kingdom) | | | 22.1 | | | | 17.3 | |
Pacific (excluding Japan) | | | 10.2 | | | | 4.5 | |
United Kingdom | | | 6.6 | | | | 7.9 | |
Japan | | | 4.2 | | | | 8.9 | |
Africa/Middle East | | | 3.5 | | | | 0.2 | |
Latin America | | | 3.3 | | | | 0.0 | |
Canada | | | 0.3 | | | | 3.6 | |
| | | | | | | | |
| SECTOR DIVERSIFICATION (%) | | Fund | | | MSCI
World | |
Financials | | | 23.5 | | | | 21.0 | |
Consumer Discretionary | | | 19.7 | | | | 13.1 | |
Information Technology | | | 19.2 | | | | 13.3 | |
Health Care | | | 13.6 | | | | 13.5 | |
Energy | | | 7.4 | | | | 7.3 | |
Telecommunication Services | | | 5.0 | | | | 3.3 | |
Industrials | | | 3.8 | | | | 10.7 | |
Consumer Staples | | | 3.1 | | | | 9.7 | |
Materials | | | 3.0 | | | | 5.1 | |
Utilities | | | 0.0 | | | | 3.0 | |
| (a) | SEC Yield is an annualization of the Fund’s total net investment income per share for the 30-day period ended on the last day of the month. |
| (b) | Price-to-earnings (P/E) ratios are calculated using 12-month forward earnings estimates from third-party sources. |
| (c) | The Fund’s portfolio holdings are subject to change without notice. The mention of specific securities is not a recommendation to buy, sell, or hold any particular security and is not indicative of Dodge & Cox’s current or future trading activity. |
| (d) | The Fund may classify a company in a different category than the MSCI World. The Fund generally classifies a company based on its country of incorporation, but may designate a different country in certain circumstances. |
PAGE 6 § DODGE & COX GLOBAL STOCK FUND
| | | | |
| CONSOLIDATED PORTFOLIO OF INVESTMENTS (unaudited) | | | June 30, 2015 | |
| | | | | | | | |
| COMMON STOCKS: 95.6% | |
| | |
| | | SHARES | | | VALUE | |
| CONSUMER DISCRETIONARY: 19.7% | |
AUTOMOBILES & COMPONENTS: 5.1% | |
Bayerische Motoren Werke AG (Germany) | | | 451,500 | | | $ | 49,419,353 | |
Honda Motor Co., Ltd. (Japan) | | | 3,242,600 | | | | 104,960,248 | |
Mahindra & Mahindra, Ltd. (India) | | | 2,657,074 | | | | 53,677,652 | |
Nissan Motor Co., Ltd. (Japan) | | | 8,289,600 | | | | 86,360,583 | |
Yamaha Motor Co., Ltd. (Japan) | | | 1,620,400 | | | | 35,443,974 | |
| | | | | | | | |
| | | | | | | 329,861,810 | |
CONSUMER DURABLES & APPAREL: 0.5% | |
Coach, Inc. (United States) | | | 1,000,800 | | | | 34,637,688 | |
|
CONSUMER SERVICES: 0.5% | |
New Oriental Education & Technology Group, Inc. ADR(a) (Cayman Islands/China) | | | 1,235,600 | | | | 30,296,912 | |
|
MEDIA: 11.5% | |
Comcast Corp., Class A (United States) | | | 1,320,800 | | | | 79,432,912 | |
DISH Network Corp., Class A(a)
(United States) | | | 824,200 | | | | 55,806,582 | |
Grupo Televisa SAB ADR (Mexico) | | | 1,442,700 | | | | 56,005,614 | |
Liberty Global PLC, Series C(a)
(United Kingdom) | | | 1,595,700 | | | | 80,790,291 | |
Naspers, Ltd. (South Africa) | | | 931,700 | | | | 145,123,417 | |
Television Broadcasts, Ltd. (Hong Kong) | | | 2,778,100 | | | | 16,468,151 | |
Time Warner Cable, Inc. (United States) | | | 971,271 | | | | 173,051,354 | |
Time Warner, Inc. (United States) | | | 1,416,666 | | | | 123,830,775 | |
Time, Inc. (United States) | | | 412,177 | | | | 9,484,193 | |
| | | | | | | | |
| | | | | | | 739,993,289 | |
RETAILING: 2.1% | |
Target Corp. (United States) | | | 931,900 | | | | 76,070,997 | |
The Priceline Group, Inc.(a) (United States) | | | 54,300 | | | | 62,519,391 | |
| | | | | | | | |
| | | | | | | 138,590,388 | |
| | | | | | | | |
| | | | | | | 1,273,380,087 | |
| CONSUMER STAPLES: 3.1% | |
FOOD & STAPLES RETAILING: 1.5% | |
Wal-Mart Stores, Inc. (United States) | | | 1,316,500 | | | | 93,379,345 | |
|
FOOD, BEVERAGE & TOBACCO: 0.6% | |
Anadolu Efes Biracilik ve Malt Sanayii AS (Turkey) | | | 4,098,485 | | | | 37,007,327 | |
|
HOUSEHOLD & PERSONAL PRODUCTS: 1.0% | |
Unilever PLC (United Kingdom) | | | 1,546,700 | | | | 66,345,886 | |
| | | | | | | | |
| | | | | | | 196,732,558 | |
| ENERGY: 6.6% | | | | | | | | |
Apache Corp. (United States) | | | 938,732 | | | | 54,099,125 | |
Baker Hughes, Inc. (United States) | | | 1,431,987 | | | | 88,353,598 | |
National Oilwell Varco, Inc. (United States) | | | 987,400 | | | | 47,671,672 | |
Saipem SPA(a) (Italy) | | | 5,345,143 | | | | 56,461,813 | |
Schlumberger, Ltd. (Curacao/United States) | | | 1,507,600 | | | | 129,940,044 | |
Weatherford International PLC(a) (Ireland) | | | 3,885,575 | | | | 47,676,005 | |
| | | | | | | | |
| | | | | | | 424,202,257 | |
| FINANCIALS: 22.9% | |
BANKS: 10.0% | |
Bank of America Corp. (United States) | | | 9,242,200 | | | | 157,302,244 | |
Barclays PLC (United Kingdom) | | | 19,270,000 | | | | 78,874,152 | |
ICICI Bank, Ltd. (India) | | | 18,716,115 | | | | 90,523,923 | |
Kasikornbank PCL- Foreign (Thailand) | | | 8,448,100 | | | | 47,273,642 | |
Siam Commercial Bank PCL- Foreign (Thailand) | | | 5,237,100 | | | | 24,111,236 | |
Standard Chartered PLC (United Kingdom) | | | 8,760,416 | | | | 140,263,340 | |
Wells Fargo & Co. (United States) | | | 1,722,973 | | | | 96,900,002 | |
Yapi ve Kredi Bankasi AS (Turkey) | | | 8,442,517 | | | | 12,411,297 | |
| | | | | | | | |
| | | | | | | 647,659,836 | |
| | | | | | | | |
| | |
| | | SHARES | | | VALUE | |
DIVERSIFIED FINANCIALS: 8.0% | |
Bank of New York Mellon Corp.
(United States) | | | 2,076,700 | | | $ | 87,159,099 | |
Capital One Financial Corp. (United States) | | | 1,233,200 | | | | 108,484,604 | |
Charles Schwab Corp. (United States) | | | 3,784,500 | | | | 123,563,925 | |
Credit Suisse Group AG (Switzerland) | | | 3,754,904 | | | | 103,215,180 | |
Goldman Sachs Group, Inc. (United States) | | | 294,200 | | | | 61,426,018 | |
Haci Omer Sabanci Holding AS (Turkey) | | | 8,386,388 | | | | 31,604,238 | |
| | | | | | | | |
| | | | | | | 515,453,064 | |
INSURANCE: 2.9% | | | | | | | | |
AEGON NV (Netherlands) | | | 11,203,884 | | | | 82,338,334 | |
Aviva PLC (United Kingdom) | | | 7,763,800 | | | | 60,079,435 | |
Swiss Re AG (Switzerland) | | | 483,000 | | | | 42,749,077 | |
| | | | | | | | |
| | | | | | | 185,166,846 | |
REAL ESTATE: 2.0% | | | | | | | | |
BR Malls Participacoes SA (Brazil) | | | 7,750,800 | | | | 36,297,208 | |
Hang Lung Group, Ltd. (Hong Kong) | | | 14,516,000 | | | | 63,857,628 | |
Hang Lung Properties, Ltd. (Hong Kong) | | | 10,126,100 | | | | 30,176,276 | |
| | | | | | | | |
| | | | | | | 130,331,112 | |
| | | | | | | | |
| | | | | | | 1,478,610,858 | |
| HEALTH CARE: 13.6% | | | | | | | | |
HEALTH CARE EQUIPMENT & SERVICES: 5.3% | |
Cigna Corp. (United States) | | | 594,000 | | | | 96,228,000 | |
Express Scripts Holding Co.(a) (United States) | | | 1,567,700 | | | | 139,431,238 | |
UnitedHealth Group, Inc. (United States) | | | 880,700 | | | | 107,445,400 | |
| | | | | | | | |
| | | | | | | 343,104,638 | |
|
PHARMACEUTICALS, BIOTECHNOLOGY & LIFE SCIENCES: 8.3% | |
Bayer AG (Germany) | | | 413,620 | | | | 57,894,128 | |
Merck & Co., Inc. (United States) | | | 669,200 | | | | 38,097,556 | |
Novartis AG (Switzerland) | | | 932,000 | | | | 91,859,244 | |
Novartis AG ADR (Switzerland) | | | 609,700 | | | | 59,957,898 | |
Roche Holding AG (Switzerland) | | | 537,400 | | | | 150,595,005 | |
Sanofi (France) | | | 1,411,662 | | | | 138,871,298 | |
| | | | | | | | |
| | | | | | | 537,275,129 | |
| | | | | | | | |
| | | | | | | 880,379,767 | |
| INDUSTRIALS: 3.8% | | | | | | | | |
CAPITAL GOODS: 1.6% | | | | | | | | |
Koninklijke Philips NV (Netherlands) | | | 661,655 | | | | 16,833,077 | |
NOW, Inc.(a) (United States) | | | 165,300 | | | | 3,291,123 | |
Schneider Electric SA (France) | | | 1,233,678 | | | | 85,176,379 | |
| | | | | | | | |
| | | | | | | 105,300,579 | |
COMMERCIAL & PROFESSIONAL SERVICES: 1.2% | |
ADT Corp. (United States) | | | 913,000 | | | | 30,649,410 | |
Tyco International PLC (Ireland) | | | 1,263,300 | | | | 48,611,784 | |
| | | | | | | | |
| | | | | | | 79,261,194 | |
TRANSPORTATION: 1.0% | | | | | |
FedEx Corp. (United States) | | | 371,600 | | | | 63,320,640 | |
| | | | | | | | |
| | | | | | | 247,882,413 | |
| INFORMATION TECHNOLOGY: 17.9% | |
SEMICONDUCTORS & SEMICONDUCTOR EQUIPMENT: 1.4% | |
Samsung Electronics Co., Ltd. (South Korea) | | | 78,217 | | | | 88,914,031 | |
| | |
SOFTWARE & SERVICES: 8.2% | | | | | | | | |
Baidu, Inc. ADR(a) (Cayman Islands/China) | | | 409,900 | | | | 81,602,892 | |
eBay, Inc.(a) (United States) | | | 958,900 | | | | 57,764,136 | |
Google, Inc., Class A(a) (United States) | | | 60,600 | | | | 32,726,424 | |
Google, Inc., Class C(a) (United States) | | | 230,099 | | | | 119,768,830 | |
Microsoft Corp. (United States) | | | 3,039,800 | | | | 134,207,170 | |
Nintendo Co., Ltd. (Japan) | | | 264,200 | | | | 44,189,844 | |
Symantec Corp. (United States) | | | 1,690,600 | | | | 39,306,450 | |
Synopsys, Inc.(a) (United States) | | | 446,800 | | | | 22,630,420 | |
| | | | | | | | |
| | | | | | | 532,196,166 | |
| | |
| See accompanying Notes to Financial Statements | | DODGE & COX GLOBAL STOCK FUND §PAGE 7 |
| | | | |
| CONSOLIDATED PORTFOLIO OF INVESTMENTS (unaudited) | | | June 30, 2015 | |
| | | | | | | | |
| COMMON STOCKS (continued) | |
| | |
| | | SHARES | | | VALUE | |
TECHNOLOGY, HARDWARE & EQUIPMENT: 8.3% | |
Cisco Systems, Inc. (United States) | | | 2,848,200 | | | $ | 78,211,572 | |
Corning, Inc. (United States) | | | 2,591,700 | | | | 51,134,241 | |
EMC Corp. (United States) | | | 4,046,300 | | | | 106,781,857 | |
Hewlett-Packard Co. (United States) | | | 5,301,700 | | | | 159,104,017 | |
NetApp, Inc. (United States) | | | 1,366,400 | | | | 43,123,584 | |
TE Connectivity, Ltd. (Switzerland) | | | 1,056,415 | | | | 67,927,485 | |
Telefonaktiebolaget LM Ericsson (Sweden) | | | 2,853,747 | | | | 29,570,724 | |
| | | | | | | | |
| | | | | | | 535,853,480 | |
| | | | | | | | |
| | | | | | | 1,156,963,677 | |
| MATERIALS: 3.0% | |
Celanese Corp., Series A (United States) | | | 931,300 | | | | 66,941,844 | |
Lafarge SA (France) | | | 730,171 | | | | 48,223,186 | |
Linde AG (Germany) | | | 306,710 | | | | 58,094,844 | |
Teck Resources, Ltd., Class B (Canada) | | | 2,199,469 | | | | 21,796,738 | |
| | | | | | | | |
| | | | | | | 195,056,612 | |
| TELECOMMUNICATION SERVICES: 5.0% | |
America Movil SAB de CV, Series L (Mexico) | | | 29,340,500 | | | | 31,361,247 | |
China Mobile, Ltd. (Hong Kong/China) | | | 3,823,100 | | | | 49,024,536 | |
Millicom International Cellular SA SDR (Luxembourg) | | | 842,800 | | | | 62,169,062 | |
MTN Group, Ltd. (South Africa) | | | 4,156,600 | | | | 78,154,056 | |
Sprint Corp.(a) (United States) | | | 11,481,200 | | | | 52,354,272 | |
Telecom Italia SPA- RSP (Italy) | | | 47,281,384 | | | | 48,257,498 | |
| | | | | | | | |
| | | | | | | 321,320,671 | |
| | | | | | | | |
TOTAL COMMON STOCKS
(Cost $5,058,503,275) | | | | | | $ | 6,174,528,900 | |
| | |
| PREFERRED STOCKS: 2.7% | | | | | | |
| ENERGY: 0.8% | | | | | | | | |
Petroleo Brasileiro SA ADR(a) (Brazil) | | | 6,498,403 | | | | 53,026,969 | |
| | |
| FINANCIALS: 0.6% | | | | | | | | |
BANKS: 0.6% | | | | | | | | |
Itau Unibanco Holding SA (Brazil) | | | 3,476,330 | | | | 38,261,880 | |
|
| INFORMATION TECHNOLOGY: 1.3% | |
SEMICONDUCTORS & SEMICONDUCTOR EQUIPMENT: 1.3% | |
Samsung Electronics Co., Ltd. (South Korea) | | | 89,743 | | | | 79,891,343 | |
| | | | | | | | |
| | |
TOTAL PREFERRED STOCKS
(Cost $207,112,818) | | | | | | $ | 171,180,192 | |
| | | | | | | | |
| SHORT-TERM INVESTMENTS: 2.2% | |
| | |
| | | PAR VALUE | | | VALUE | |
MONEY MARKET FUND: 0.1% | |
SSgA U.S. Treasury Money Market Fund | | $ | 6,447,091 | | | $ | 6,447,091 | |
|
REPURCHASE AGREEMENT: 2.1% | |
Fixed Income Clearing Corporation(b)
0.01%, dated 6/30/15, due 7/1/15,
maturity value $138,649,039 | | | 138,649,000 | | | | 138,649,000 | |
| | | | | | | | |
TOTAL SHORT-TERM INVESTMENTS
(Cost $145,096,091) | | | $ | 145,096,091 | |
| | | | | | | | |
TOTAL INVESTMENTS
(Cost $5,410,712,184) | | | 100.5 | % | | $ | 6,490,805,183 | |
OTHER ASSETS LESS LIABILITIES | | | (0.5 | %) | | | (32,642,399 | ) |
| | | | | | | | |
| NET ASSETS | | | 100.0 | % | | $ | 6,458,162,784 | |
| | | | | | | | |
| (b) | Repurchase agreement is collateralized by U.S. Treasury Note 1.125%-2.00%, 04/30/20-08/31/21. Total collateral value is $141,422,109. |
In determining a company’s country designation, the Fund generally references the country of incorporation. In cases where the Fund considers the country of incorporation to be a “jurisdiction of convenience” chosen primarily for tax purposes or in other limited circumstances, the Fund uses the country designation of an appropriate broad-based market index. In those cases, two countries are listed — the country of incorporation and the country designated by an appropriate index, respectively.
ADR: American Depositary Receipt
SDR: Swedish Depository Receipt
FORWARD CURRENCY CONTRACTS
| | | | | | | | | | | | | | | | |
| | | | Contract Amount | | | | |
| Counterparty | | Settlement
Date | | | Receive
U.S.
Dollar | | | Deliver
Foreign
Currency | | | Unrealized
Appreciation/
(Depreciation) | |
Contracts to sell EUR: | |
JPMorgan | | | 8/12/15 | | | | 19,772,900 | | | | 17,500,000 | | | $ | 252,411 | |
Credit Suisse | | | 8/19/15 | | | | 31,044,563 | | | | 27,250,000 | | | | 645,257 | |
Deutsche Bank | | | 9/2/15 | | | | 21,199,719 | | | | 19,400,000 | | | | (446,793 | ) |
Barclays | | | 9/16/15 | | | | 21,370,345 | | | | 19,000,000 | | | | 165,721 | |
HSBC | | | 9/16/15 | | | | 12,371,205 | | | | 11,000,000 | | | | 94,843 | |
| | | | | | | | | | | | | | | | |
| | | | | | | | | | | | | | $ | 711,439 | |
| | | | | | | | | | | | | | | | |
| | |
| PAGE 8 § DODGE & COX GLOBAL STOCK FUND | | See accompanying Notes to Financial Statements |
| | | | |
CONSOLIDATED STATEMENT OF ASSETS AND LIABILITIES (unaudited) | |
| |
| | | June 30, 2015 | |
ASSETS: | | | | |
Investments, at value (cost $5,410,712,184) | | $ | 6,490,805,183 | |
Unrealized appreciation on forward currency contracts | | | 1,158,232 | |
Cash | | | 100 | |
Cash denominated in foreign currency (cost $3,029,339) | | | 3,018,384 | |
Receivable for investments sold | | | 1,727,945 | |
Receivable for Fund shares sold | | | 6,113,900 | |
Dividends and interest receivable | | | 9,395,751 | |
Prepaid expenses and other assets | | | 28,975 | |
| | | | |
| | | 6,512,248,470 | |
| | | | |
LIABILITIES: | | | | |
Unrealized depreciation on forward currency contracts | | | 446,793 | |
Payable for investments purchased | | | 47,456,335 | |
Payable for Fund shares redeemed | | | 2,067,987 | |
Management fees payable | | | 3,229,866 | |
Accrued expenses | | | 884,705 | |
| | | | |
| | | 54,085,686 | |
| | | | |
NET ASSETS | | $ | 6,458,162,784 | |
| | | | |
NET ASSETS CONSIST OF: | | | | |
Paid in capital | | $ | 5,221,400,012 | |
Undistributed net investment income | | | 61,726,034 | |
Undistributed net realized gain | | | 94,335,456 | |
Net unrealized appreciation | | | 1,080,701,282 | |
| | | | |
| | $ | 6,458,162,784 | |
| | | | |
Fund shares outstanding (par value $0.01 each,
unlimited shares authorized) | | | 534,216,575 | |
Net asset value per share | | $ | 12.09 | |
| |
CONSOLIDATED STATEMENT OF OPERATIONS
(unaudited) | | | | |
| | | Six Months Ended
June 30, 2015 | |
INVESTMENT INCOME: | | | | |
Dividends (net of foreign taxes of $4,548,386) | | $ | 82,104,034 | |
Interest | | | 5,233 | |
| | | | |
| | | 82,109,267 | |
| | | | |
EXPENSES: | | | | |
Management fees | | | 18,807,994 | |
Custody and fund accounting fees | | | 334,090 | |
Transfer agent fees | | | 302,945 | |
Professional services | | | 161,844 | |
Shareholder reports | | | 156,336 | |
Registration fees | | | 150,320 | |
Trustees’ fees | | | 118,750 | |
Miscellaneous | | | 44,709 | |
| | | | |
| | | 20,076,988 | |
| | | | |
NET INVESTMENT INCOME | | | 62,032,279 | |
| | | | |
REALIZED AND UNREALIZED GAIN (LOSS): | | | | |
Net realized gain (loss) | | | | |
Investments | | | 52,320,060 | |
Forward currency contracts | | | 11,840,644 | |
Foreign currency transactions | | | (199,695 | ) |
Net change in unrealized appreciation/depreciation | | | | |
Investments | | | 5,628,359 | |
Forward currency contracts | | | (2,669,090 | ) |
Foreign currency translation | | | 102,066 | |
| | | | |
Net realized and unrealized gain | | | 67,022,344 | |
| | | | |
NET INCREASE IN NET ASSETS
FROM OPERATIONS | | $ | 129,054,623 | |
| | | | |
| | | | | | | | |
CONSOLIDATED STATEMENT OF CHANGES IN NET ASSETS (unaudited) | |
| | |
| | | Six Months Ended
June 30, 2015 | | | Year Ended
December 31, 2014
| |
OPERATIONS: | | | | | | | | |
Net investment income | | $ | 62,032,279 | | | $ | 73,280,159 | |
Net realized gain | | | 63,961,009 | | | | 160,901,823 | |
Net change in unrealized
appreciation/depreciation | | | 3,061,335 | | | | 67,737,521 | |
| | | | | | | | |
| | | 129,054,623 | | | | 301,919,503 | |
| | | | | | | | |
| | |
DISTRIBUTIONS TO SHAREHOLDERS FROM: | | | | | | | | |
Net investment income | | | — | | | | (72,474,215 | ) |
Net realized gain | | | — | | | | (138,830,388 | ) |
| | | | | | | | |
Total distributions | | | — | | | | (211,304,603 | ) |
| | | | | | | | |
| | |
FUND SHARE
TRANSACTIONS: | | | | | | | | |
Proceeds from sale of shares | | | 839,597,995 | | | | 2,482,518,668 | |
Reinvestment of distributions | | | — | | | | 204,987,790 | |
Cost of shares redeemed | | | (405,820,358 | ) | | | (806,780,930 | ) |
| | | | | | | | |
Net increase from Fund share transactions | | | 433,777,637 | | | | 1,880,725,528 | |
| | | | | | | | |
Total increase in net assets | | | 562,832,260 | | | | 1,971,340,428 | |
| | |
NET ASSETS: | | | | | | | | |
Beginning of period | | | 5,895,330,524 | | | | 3,923,990,096 | |
| | | | | | | | |
End of period (including undistributed net investment income of $61,726,034 and $(306,245), respectively) | | $ | 6,458,162,784 | | | $ | 5,895,330,524 | |
| | | | | | | | |
| | |
SHARE INFORMATION: | | | | | | | | |
Shares sold | | | 69,415,236 | | | | 205,490,704 | |
Distributions reinvested | | | — | | | | 17,283,962 | |
Shares redeemed | | | (33,369,594 | ) | | | (66,336,804 | ) |
| | | | | | | | |
Net increase in shares outstanding | | | 36,045,642 | | | | 156,437,862 | |
| | | | | | | | |
| | |
| See accompanying Notes to Financial Statements | | DODGE & COX GLOBAL STOCK FUND §PAGE 9 |
NOTES TO CONSOLIDATED FINANCIAL STATEMENTS (unaudited)
NOTE 1—ORGANIZATION AND SIGNIFICANT ACCOUNTING POLICIES
Dodge & Cox Global Stock Fund (the “Fund”) is one of the series constituting the Dodge & Cox Funds (the “Trust” or the “Funds”). The Trust is organized as a Delaware statutory trust and is registered under the Investment Company Act of 1940, as amended, as an open-end management investment company. The Fund commenced operations on May 1, 2008, and seeks long-term growth of principal and income. The Fund invests primarily in a diversified portfolio of U.S. and foreign equity securities. Foreign investing, especially in developing countries, has special risks such as currency and market volatility and political and social instability. These and other risk considerations are discussed in the Fund’s Prospectus.
The financial statements have been prepared in conformity with accounting principles generally accepted in the United States of America, which require the use of estimates and assumptions by management. Actual results may differ from those estimates. Significant accounting policies are as follows:
Security valuation The Fund’s net assets are valued as of the close of trading on the New York Stock Exchange (NYSE), generally 4:00 p.m. Eastern Time, each day that the NYSE is open for business. Portfolio securities and other financial instruments for which market quotes are readily available are valued at market value. Listed securities are generally valued using the official quoted close price or the last sale on the exchange that is determined to be the primary market for the security. Security values are not discounted based on the size of the Fund’s position. Short-term securities less than 60 days to maturity may be valued at amortized cost if amortized cost approximates current value. Mutual funds are valued at their respective net asset values.
Investments initially valued in currencies other than the U.S. dollar are converted to the U.S. dollar using prevailing exchange rates. As a result, the Fund’s net assets may be affected by changes in the value of currencies in relation to the U.S. dollar.
If market quotations are not readily available or if a security’s value is believed to have materially changed after the close of the security’s primary market but before the close of trading on the NYSE, the security is valued at fair value as determined in good faith by or under the direction of the Funds’ Board of Trustees. The Board of Trustees has delegated authority to Dodge & Cox, the Fund’s investment manager, to make fair value determinations in accordance with the Dodge & Cox Funds Valuation Policies (“Valuation Policies”), subject to Board oversight. Dodge & Cox has established a Pricing Committee that is comprised of representatives from Treasury, Legal, Compliance, and Operations. The Pricing Committee is responsible for implementing the Valuation Policies, including determining the fair value of securities when market quotations or market-based valuations are not readily available or are deemed unreliable. The Pricing Committee considers relevant indications of value that are reasonably available to it in determining the fair value assigned to a particular security, such as the value of similar financial
instruments, trading volumes, contractual restrictions on disposition, related corporate actions, and changes in economic conditions. In doing so, the Pricing Committee employs various methods for calibrating fair valuation approaches, including a regular review of key inputs and assumptions, back-testing, and review of any related market activity.
As trading in securities on most foreign exchanges is normally completed before the close of the NYSE, the value of non-U.S. securities can change by the time the Fund calculates its NAV. To address these changes, the Fund may utilize adjustment factors provided by an independent pricing service to systemically value non-U.S. securities at fair value. These adjustment factors are based on statistical analyses of subsequent movements and changes in U.S. markets and financial instruments trading in U.S. markets that represent foreign securities or baskets of securities.
Valuing securities through a fair value determination involves greater reliance on judgment than valuation of securities based on readily available market quotations. In some instances, lack of information and uncertainty as to the significance of information may lead to a conclusion that a prior valuation is the best indication of a security’s value. When fair value pricing is employed, the prices of securities used by the Fund to calculate its NAV may differ from quoted or published prices for the same securities.
Security transactions, investment income, expenses, and distributions Security transactions are recorded on the trade date. Realized gains and losses on securities sold are determined on the basis of identified cost.
Dividend income and corporate action transactions are recorded on the ex-dividend date, or when the Fund first learns of the dividend/corporate action if the ex-dividend date has passed. Non-cash dividends included in dividend income, if any, are recorded at the fair market value of the securities received. Dividends characterized as return of capital for U.S. tax purposes are recorded as a reduction of cost of investments and/or realized gain. Interest income is recorded on the accrual basis.
Expenses are recorded on the accrual basis. Some expenses of the Trust can be directly attributed to a specific series. Expenses which cannot be directly attributed are allocated among the Funds in the Trust based on relative net assets or other expense methodologies determined by the nature of the expense.
Distributions to shareholders are recorded on the ex-dividend date.
Foreign taxes The Fund is subject to foreign taxes which may be imposed by certain countries in which the Fund invests. The Fund endeavors to record foreign taxes based on applicable foreign tax law. Withholding taxes are incurred on certain foreign dividends and are accrued at the time the associated dividend is recorded. The Fund files withholding tax reclaims in certain jurisdictions to recover a portion of amounts previously withheld. The Fund records a reclaim receivable based on, among other things, a jurisdiction’s legal obligation to pay reclaims as well as payment history and market convention. In consideration of
PAGE 10 § DODGE & COX GLOBAL STOCK FUND
NOTES TO CONSOLIDATED FINANCIAL STATEMENTS (unaudited)
recent decisions rendered by European courts, the Fund has filed for additional reclaims related to prior years. A corresponding receivable is established when both the amount is known and significant contingencies or uncertainties regarding collectability are removed.
Capital gains taxes are incurred upon disposition of certain foreign securities. Capital gains taxes on appreciated securities are accrued as unrealized losses and are reflected as realized losses upon the sale of the related security. Currency taxes may be incurred when the Fund purchases certain foreign currencies related to securities transactions and are recorded as realized losses on foreign currency transactions.
Repurchase agreements The Fund enters into repurchase agreements, secured by U.S. government or agency securities, which involve the purchase of securities from a counterparty with a simultaneous commitment to resell the securities at an agreed-upon date and price. It is the Fund’s policy that its custodian take possession of the underlying collateral securities, the fair value of which exceeds the principal amount of the repurchase transaction, including accrued interest, at all times. In the event of default by the counterparty, the Fund has the contractual right to liquidate the collateral securities and to apply the proceeds in satisfaction of the obligation.
Forward currency contracts A forward currency contract represents an obligation to purchase or sell a specific foreign currency at a future date at a price set at the time of the contract. Losses from these transactions may arise from unfavorable changes in currency values or if the counterparties do not perform under a contract’s terms.
The values of the forward currency contracts are adjusted daily based on the prevailing forward exchange rates of the underlying currencies. Changes in the value of open contracts are recorded as unrealized appreciation or depreciation in the Consolidated Statement of Operations. When the forward currency contract is closed, the Fund records a realized gain or loss in the Consolidated Statement of Operations equal to the difference between the value at the time the contract was opened and the value at the time it was closed.
During the period, the Fund maintained forward currency contracts to hedge foreign currency risks associated with portfolio investments denominated in euro. During the six months ended June 30, 2015, these euro forward currency contracts had U.S. dollar total values ranging from 1% to 2% of net assets.
Foreign currency translation The books and records of the Fund are maintained in U.S. dollars. Foreign currency amounts are translated into U.S. dollars at the prevailing exchange rates of such currencies against the U.S. dollar. The market value of investment securities and other assets and liabilities are translated at the exchange rate as of the valuation date. Purchases and sales of investment securities, income, and expenses are translated at the exchange rate prevailing on the transaction date.
Reported realized and unrealized gain (loss) on investments include foreign currency gain (loss) related to investment transactions.
Reported realized and unrealized gain (loss) on foreign currency transactions and translation include the following: disposing/holding of foreign currency, the difference between the trade and settlement dates on securities transactions, the difference between the accrual and payment dates on dividends, and currency losses on the purchase of foreign currency in certain countries that impose taxes on such transactions.
Consolidation The Fund may invest in certain securities through its wholly owned subsidiary, Dodge & Cox Global Stock Fund Cayman, Ltd. (the “Subsidiary”). The Subsidiary is a Cayman Islands exempted company and invests in certain securities consistent with the investment objective of the Fund. The Fund’s Consolidated Financial Statements, including the Consolidated Portfolio of Investments, consist of the holdings and accounts of the Fund and the Subsidiary. All intercompany transactions and balances have been eliminated. At June 30, 2015, the Subsidiary had net assets of $100, which represented less than 0.01% of the Fund’s consolidated net assets.
Indemnification Under the Trust’s organizational documents, its officers and trustees are indemnified against certain liabilities arising out of the performance of their duties to the Trust. In addition, in the normal course of business the Trust enters into contracts that provide general indemnities to other parties. The Trust’s maximum exposure under these arrangements is unknown as this would involve future claims that may be made against the Trust that have not yet occurred.
DODGE & COX GLOBAL STOCK FUND §PAGE 11
NOTES TO CONSOLIDATED FINANCIAL STATEMENTS (unaudited)
NOTE 2—VALUATION MEASUREMENTS
Various inputs are used in determining the value of the Fund’s investments and other financial instruments. These inputs are summarized in the three broad levels listed below.
| § | | Level 1: Quoted prices in active markets for identical securities |
| § | | Level 2: Other significant observable inputs (including quoted prices for similar securities, market indices, interest rates, credit risk, etc.) |
| § | | Level 3: Significant unobservable inputs (including Fund management’s assumptions in determining the fair value of investments) |
The inputs or methodology used for valuing securities are not necessarily an indication of the risk associated with investing in those securities.
The following is a summary of the inputs used to value the Fund’s holdings at June 30, 2015:
| | | | | | | | |
| Classification(a) | | LEVEL 1
(Quoted Prices) | | | LEVEL 2
(Other Significant
Observable Inputs) | |
Securities | | | | | | | | |
Common Stocks | | | | | | | | |
Consumer Discretionary | | $ | 1,273,380,087 | | | $ | — | |
Consumer Staples | | | 196,732,558 | | | | — | |
Energy | | | 424,202,257 | | | | — | |
Financials | | | 1,478,610,858 | | | | — | |
Health Care | | | 880,379,767 | | | | — | |
Industrials | | | 247,882,413 | | | | — | |
Information Technology | | | 1,156,963,677 | | | | — | |
Materials | | | 195,056,612 | | | | — | |
Telecommunication Services | | | 321,320,671 | | | | — | |
Preferred Stocks | | | | | | | | |
Energy | | | 53,026,969 | | | | — | |
Financials | | | 38,261,880 | | | | — | |
Information Technology | | | 79,891,343 | | | | — | |
Short-term Investments | | | | | | | | |
Money Market Fund | | | 6,447,091 | | | | — | |
Repurchase Agreement | | | — | | | | 138,649,000 | |
| | | | | | | | |
Total Securities | | $ | 6,352,156,183 | | | $ | 138,649,000 | |
| | | | | | | | |
| | |
Other Financial Instruments | | | | | | | | |
Forward Currency Contracts | | $ | — | | | $ | 711,439 | (b) |
| | | | | | | | | |
| (a) | | Transfers during the period between Level 1 and Level 2 relate to the use of systematic fair valuation (see Note 1). On days when systematic fair valuation is used, securities whose primary market closes before the NYSE are classified as Level 2. There were no Level 3 securities at June 30, 2015 and December 31, 2014, and there were no transfers to Level 3 during the period. |
| (b) | | Represents net unrealized appreciation/(depreciation). |
NOTE 3—ADDITIONAL DERIVATIVES INFORMATION
The Fund has entered into over-the-counter derivatives, such as forward currency contracts (each, a “Derivative”). Each Derivative is subject to a negotiated master agreement (based on a form published by the International Swaps and Derivatives Association (“ISDA”)) governing all Derivatives between the Fund and the relevant dealer counterparty. The master agreements specify (i) events of default and other events permitting a party to terminate some or all of the Derivatives thereunder and (ii) the process by which those Derivatives will be valued for purposes of determining termination payments. If some or all of the Derivatives under a master agreement are terminated because of an event of default or similar event, the values of all terminated Derivatives must be netted to determine a single payment owed by one party to the other. Some master agreements contain collateral terms requiring the parties to post collateral in respect of some or all of the Derivatives thereunder based on the net market value of those Derivatives, subject to a minimum exposure threshold. To the extent amounts owed to the Fund by its counterparties are not collateralized, the Fund is at risk of those counterparties’ non-performance. The Fund attempts to mitigate counterparty credit risk by entering into Derivatives only with counterparties it believes to be of good credit quality and by monitoring the financial stability of those counterparties.
For financial reporting purposes, the Fund does not offset financial assets and liabilities that are subject to an ISDA Master Agreement in the Consolidated Statement of Assets and Liabilities. The net amount for Derivatives is disclosed on the Consolidated Portfolio of Investments. At June 30, 2015, no collateral is pledged or held by the Fund for Derivatives.
NOTE 4—RELATED PARTY TRANSACTIONS
Management fees Under a written agreement approved by a unanimous vote of the Board of Trustees, the Fund pays an annual management fee of 0.60% of the Fund’s average daily net assets to Dodge & Cox, investment manager of the Fund.
Fund officers and trustees All officers and two of the trustees of the Trust are officers or employees of Dodge & Cox. The Trust pays a fee only to those trustees who are not affiliated with Dodge & Cox.
PAGE 12 § DODGE & COX GLOBAL STOCK FUND
NOTES TO CONSOLIDATED FINANCIAL STATEMENTS (unaudited)
NOTE 5—INCOME TAX INFORMATION AND DISTRIBUTIONS TO SHAREHOLDERS
A provision for federal income taxes is not required since the Fund intends to qualify as a regulated investment company under Subchapter M of the Internal Revenue Code and distribute all of its taxable income to shareholders. Distributions are determined in accordance with income tax regulations, and such amounts may differ from net investment income and realized gains for financial reporting purposes. Financial reporting records are adjusted for permanent book/tax differences at year end to reflect tax character.
Book/tax differences are primarily due to differing treatments of wash sales, net short-term realized gain (loss), investments in passive foreign investment companies, foreign capital gain taxes, and foreign currency realized gain (loss). At June 30, 2015, the cost of investments for federal income tax purposes was $5,413,418,925.
Distributions during the periods noted below were characterized as follows for federal income tax purposes:
| | | | | | | | |
| | | Six Months Ended June 30, 2015 | | | Year Ended December 31, 2014 | |
Ordinary income | | | — | | | | $100,240,292 | |
| | | | | | | ($0.213 per share) | |
| | |
Long-term capital gain | | | — | | | | $111,064,311 | |
| | | | | | | ($0.236 per share) | |
At June 30, 2015, the tax basis components of distributable earnings were as follows:
| | | | |
Unrealized appreciation | | | $1,313,519,592 | |
Unrealized depreciation | | | (236,133,334 | ) |
| | | | |
Net unrealized appreciation | | | 1,077,386,258 | |
Undistributed ordinary income | | | 74,405,255 | |
Undistributed long-term capital gain | | | 85,074,415 | |
Fund management has reviewed the tax positions for open periods (three years and four years, respectively, from filing the Fund’s Federal and State tax returns) as applicable to the Fund, and has determined that no provision for income tax is required in the Fund’s financial statements.
NOTE 6—LOAN FACILITIES
Pursuant to an exemptive order issued by the Securities and Exchange Commission (SEC), the Fund may participate in an interfund lending facility (Facility). The Facility allows the Fund to borrow money from or loan money to the Funds. Loans under the Facility are made for temporary or emergency purposes, such as to fund shareholder redemption requests. Interest on borrowings is the average of the current repurchase agreement rate and the bank loan rate. There was no activity in the Facility during the period.
All Funds in the Trust participate in a $500 million committed credit facility (Line of Credit) with State Street Bank and Trust Company, to be utilized for temporary or emergency purposes to fund shareholder redemptions or for other short-term liquidity purposes. The maximum amount available to the Fund is $250 million. Each Fund pays an annual commitment fee on its pro-rata portion of the Line of Credit. The Fund’s commitment fee for the six months ended June 30, 2015, amounted to $9,402 and is reflected as a Miscellaneous Expense in the Consolidated Statement of Operations. Interest on borrowings is charged at the prevailing rate. There were no borrowings on the Line of Credit during the period.
NOTE 7—PURCHASES AND SALES OF INVESTMENTS
For the six months ended June 30, 2015, purchases and sales of securities, other than short-term securities, aggregated $967,917,682 and $391,580,635, respectively.
NOTE 8—ACCOUNTING PRONOUNCEMENTS
In June 2014, the Financial Accounting Standards Board issued Accounting Standards Update (ASU) No. 2014-11, Transfers and Servicing (Topic 860), Repurchase-to-Maturity Transactions, Repurchase Financings, and Disclosures. The ASU changes the accounting for certain repurchase agreements and expands disclosure requirements related to repurchase agreements and similar transactions. There was no impact to these financial statements as a result of applying this ASU.
NOTE 9—SUBSEQUENT EVENTS
Fund management has determined that no material events or transactions occurred subsequent to June 30, 2015, and through the date of the Fund’s financial statements issuance, which require additional disclosure in the Fund’s financial statements.
DODGE & COX GLOBAL STOCK FUND §PAGE 13
CONSOLIDATED FINANCIAL HIGHLIGHTS (unaudited)
| | | | | | | | | | | | | | | | | | | | | | | | |
SELECTED DATA AND RATIOS (for a share outstanding throughout each period) | | Six Months Ended June 30, | | | Year Ended December 31, | |
| | | 2015(a) | | | 2014 | | | 2013 | | | 2012 | | | 2011 | | | 2010 | |
| | | | | | | | |
Net asset value, beginning of period | | | $11.83 | | | | $11.48 | | | | $8.99 | | | | $7.68 | | | | $8.90 | | | | $7.91 | |
Income from investment operations: | | | | | | | | | | | | | | | | | | | | | | | | |
Net investment income | | | 0.12 | | | | 0.16 | | | | 0.16 | | | | 0.15 | | | | 0.16 | | | | 0.08 | |
Net realized and unrealized gain (loss) | | | 0.14 | | | | 0.64 | | | | 2.81 | | | | 1.48 | | | | (1.18 | ) | | | 0.99 | |
| | | | | | | | |
Total from investment operations | | | 0.26 | | | | 0.80 | | | | 2.97 | | | | 1.63 | | | | (1.02 | ) | | | 1.07 | |
| | | | | | | | |
Distributions to shareholders from: | | | | | | | | | | | | | | | | | | | | | | | | |
Net investment income | | | — | | | | (0.15 | ) | | | (0.16 | ) | | | (0.15 | ) | | | (0.15 | ) | | | (0.08 | ) |
Net realized gain | | | — | | | | (0.30 | ) | | | (0.32 | ) | | | (0.17 | ) | | | (0.05 | ) | | | — | |
| | | | | | | | |
Total distributions | | | — | | | | (0.45 | ) | | | (0.48 | ) | | | (0.32 | ) | | | (0.20 | ) | | | (0.08 | ) |
| | | | | | | | |
Net asset value, end of period | | | $12.09 | | | | $11.83 | | | | $11.48 | | | | $8.99 | | | | $7.68 | | | | $8.90 | |
| | | | | | | | |
Total return | | | 2.20 | % | | | 6.95 | % | | | 33.17 | % | | | 21.11 | % | | | (11.39 | )% | | | 13.51 | % |
Ratios/supplemental data: | | | | | | | | | | | | | | | | | | | | | | | | |
Net assets, end of period (millions) | | | $6,458 | | | | $5,895 | | | | $3,924 | | | | $2,695 | | | | $1,875 | | | | $1,817 | |
Ratio of expenses to average net assets | | | 0.64 | %(b) | | | 0.65 | % | | | 0.65 | % | | | 0.65 | % | | | 0.66 | % | | | 0.69 | % |
Ratio of net investment income to average net assets | | | 1.98 | %(b) | | | 1.42 | % | | | 1.58 | % | | | 1.93 | % | | | 1.94 | % | | | 1.19 | % |
Portfolio turnover rate | | | 6 | % | | | 17 | % | | | 24 | % | | | 12 | % | | | 19 | % | | | 14 | % |
See accompanying Notes to Consolidated Financial Statements
FUND HOLDINGS
The Fund provides a complete list of its holdings four times each fiscal year, as of the end of each quarter. The Fund files the lists with the Securities and Exchange Commission (SEC) on Form N-CSR (second and fourth quarters) and Form N-Q (first and third quarters). Shareholders may view the Fund’s Forms N-CSR and N-Q on the SEC’s website at sec.gov. Forms N-CSR and N-Q may also be reviewed and copied at the SEC’s Public Reference Room in Washington, DC. Information regarding the operations of the Public Reference Room may be obtained by calling 202-942-8090 (direct) or 800-732-0330 (general SEC number). A list of the Fund’s quarter-end holdings is also available at dodgeandcox.com on or about 15 days following each quarter end and remains available on the website until the list is updated in the subsequent quarter.
PROXY VOTING
For a free copy of the Fund’s proxy voting policies and procedures, please call 800-621-3979, visit the Fund’s website at dodgeandcox.com, or visit the SEC’s website at sec.gov. Information regarding how the Fund voted proxies relating to portfolio securities during the most recent 12-month period ending June 30 is also available at dodgeandcox.com or at sec.gov.
HOUSEHOLD MAILINGS
The Fund routinely mails shareholder reports and summary prospectuses to shareholders and, on occasion, proxy statements. In order to reduce the volume of mail, when possible, only one copy of these documents will be sent to shareholders who are part of the same family and share the same residential address.
If you have a direct account with the Funds and you do not want the mailing of shareholder reports and summary prospectuses combined with other members in your household, contact the Funds at 800-621-3979. Your request will be implemented within 30 days.
PAGE 14 § DODGE & COX GLOBAL STOCK FUND
TRUSTEES AND EXECUTIVE OFFICERS
Charles F. Pohl, Chairman and Trustee
Chairman, Dodge & Cox
Dana M. Emery, President and Trustee
Chief Executive Officer and President, Dodge & Cox
Thomas A. Larsen, Independent Trustee
Senior Counsel, Arnold & Porter LLP
Ann Mather, Independent Trustee
Former Executive Vice President, Chief Financial Officer, and Company Secretary, Pixar Studios
Robert B. Morris III, Independent Trustee
Advisory Director, The Presidio Group
Gary Roughead, Independent Trustee
Annenberg Distinguished Visiting Fellow, Hoover Institution; and former U.S. Navy Chief of Naval Operations
Mark E. Smith, Independent Trustee
Former Executive Vice President and Managing Director - Fixed Income, Loomis Sayles & Company, L.P.
John B. Taylor, Independent Trustee
Professor of Economics, Stanford University; Senior Fellow, Hoover Institute; and former Under Secretary for International Affairs, United States Treasury
John A. Gunn, Senior Vice President
Former Chairman and Chief Executive Officer, Dodge & Cox
Diana S. Strandberg, Senior Vice President
Senior Vice President and Director of International Equity, Dodge & Cox
David H. Longhurst, Treasurer
Vice President and Assistant Treasurer, Dodge & Cox
Thomas M. Mistele, Secretary
Chief Operating Officer, Secretary, and Senior Counsel, Dodge & Cox
Katherine M. Primas, Chief Compliance Officer
Chief Compliance Officer, Dodge & Cox
Additional information about the Trust’s Trustees and Officers is available in the Trust’s Statement of Additional Information (SAI). You can get a free copy of the SAI by visiting the Funds’ website at dodgeandcox.com or calling 800-621-3979.
DODGE & COX GLOBAL STOCK FUND §PAGE 15
dodgeandcox.com
For Fund literature, transactions, and account information, please visit the Funds’ website.
or write or call:
DODGE & COX FUNDS
c/o Boston Financial Data Services
P.O. Box 8422
Boston, Massachusetts 02266-8422
(800) 621-3979
INVESTMENT MANAGER
Dodge & Cox
555 California Street, 40th Floor
San Francisco, California 94104
(415) 981-1710
This report is submitted for the general information of the shareholders of the Fund. The report is not authorized for distribution to prospective investors in the Fund unless it is accompanied by a current prospectus.
This report reflects our views, opinions, and portfolio holdings as of June 30, 2015, the end of the reporting period. Any such views are subject to change at any time based upon market or other conditions and Dodge & Cox disclaims any responsibility to update such views. These views may not be relied on as investment advice and, because investment decisions for a Dodge & Cox Fund are based on numerous factors, may not be relied on as an indication of trading intent on behalf of any Dodge & Cox Fund.
DODGE & COX FUNDS®
Semi-Annual Report
June 30, 2015
International Stock Fund
ESTABLISHED 2001
TICKER: DODFX
(Closed to New Investors)
6/15 ISF SAR Printed on recycled paper
TO OUR SHAREHOLDERS
The Dodge & Cox International Stock Fund had a total return of 3.9% for the six months ending June 30, 2015, compared to a return of 5.5% for the MSCI EAFE (Europe, Australasia, Far East) Index. On June 30, the Fund had net assets of $69.7 billion with a net cash position of 1.7%.
MARKET COMMENTARY
During the first half of 2015, global equity markets were strong: most developed and emerging markets appreciated in local currency terms. However, the U.S. dollar’s appreciation against both developed and emerging market currencies continued to be a headwind to performance: the MSCI EAFE was up 9% in local currency versus up 6% in U.S. dollars; the MSCI Emerging Markets Index was up 6% in local currency versus up 3% in U.S. dollars. Among other currencies, the U.S. dollar was particularly strong against the euro (up 9%), and the Fund’s partial hedge of its euro exposures helped mitigate the negative currency impact on returns.
Every region of the MSCI EAFE generated positive returns. Japan (up 16% in local currency) was the strongest region of the market and showed signs of economic progress supported by its aggressive stimulus program, increased capital expenditures, and improving business sentiment. In Europe (up 10% in local currency), the European Central Bank substantially expanded its quantitative easing program, and manufacturing activity in the Eurozone strengthened to its highest level in four years. The sovereign debt crisis in Greece (down 19% in local currency) intensified further in the midst of tense negotiations with creditors. Concerns about Greece could continue to create volatility for markets and the euro.
In emerging markets, China (up 15% in local currency) was one of the best-performing countries for the six-month period, benefiting from the government’s efforts to further liberalize capital markets and stimulus measures (e.g., rate cuts, liquidity initiatives) aimed at supporting economic activity. The Chinese equity market, however, has declined meaningfully from its peak in mid-June. Various emerging market countries (including India, Russia, and Turkey) cut interest rates to bolster growth. In contrast, and despite weak economic performance, Brazil hiked rates in an attempt to anchor inflation expectations. With an eye toward minimizing volatility, many emerging market central banks began preparing for an eventual increase in U.S. interest rates.
INVESTMENT STRATEGY:
FINDING OPPORTUNITIES IN ENERGY
International equity valuations have increased and valuation disparities have narrowed across the market: the gap between the least expensive stocks and the most expensive stocks has compressed. How are we identifying investment opportunities today? As a bottom-up investor, we weigh what we are buying, as defined by company fundamentals, against what we are paying, as measured by the current valuation, to assess each investment opportunity.
We are finding more opportunities to invest in companies with reasonable valuations that have excellent fundamentals, including strong business franchises, top-line growth, and attractive reinvestment prospects. At the same time, we are still seeing some pockets of deep value where we believe discounted valuations more than embed the company’s risks over our three- to five-year investment horizon. During the first half of the year, we added significantly to holdings that exemplify this tradeoff between fundamentals and valuation. We highlight examples in the Energy sector below.
Energy
Over the past six months, the MSCI EAFE Energy sector’s return of negative 3% lagged the rest of the market as low oil prices continued to weigh on the outlook for profitability and growth. While the short-term direction of oil prices is impossible to forecast, we believe the long-term fundamentals of supply and demand are supportive of higher prices. Incremental resources from unconventional shale in North America and deepwater basins around the globe require higher prices to be economic. Current low prices reduce the cash flow available for investment that is needed to stem the natural decline rate of existing fields. And at the same time, demand growth is accelerating due to lower prices. We believe this combination provides a favorable backdrop for higher prices long term.
As valuations have declined across the sector, the Fund’s Energy positioning has changed from a modest underweight to an overweight position (7.4% compared to 5.2% of the MSCI EAFE(a)), primarily due to the investments we have made within the Energy Equipment & Services (Oil Services) industry.
In our opinion, oil services companies are particularly appealing due to their strong franchises, attractive growth prospects, and reasonable valuations. There is meaningful demand for oil services companies’ expertise, as incremental oil resources are becoming more difficult to develop. Shale gas, tight oil, and deepwater resources are more service intensive than conventional resources. In addition, they exhibit higher decline rates and require more products and services to prolong a well’s productive life. One company that should benefit from this increased demand is Schlumberger(b)—the Fund’s largest holding in the Energy sector and an example of a leading business at a reasonable price.
While companies in the Integrated Oils industry (the oil and gas producers) have reasonable valuations, they face limited growth prospects and competitive challenges. Despite increased capital spending, these companies have not been able to grow production, demonstrating that each barrel of oil is becoming increasingly more difficult to develop; their cash flow generation has deteriorated as well. Within this industry, Petroleo Brasileiro (Petrobras) stands out as a deep value opportunity: the company has production growth prospects and an exceptionally low valuation, reflecting its significant challenges.
PAGE 2 § DODGE & COX INTERNATIONAL STOCK FUND
Schlumberger
Schlumberger—the world’s leading diversified oilfield services company—provides a variety of technology-based services that enable companies to identify hydrocarbon reservoirs, drill complex wells, manage production, and maximize recovery over the life of the well. The company is most dominant in international markets, where it is often larger than its next two biggest competitors combined. This leading scale contributes to its superior profitability and free cash flow generation. As a result, Schlumberger has historically traded at a premium valuation compared to its peers. That said, valuations for the Oil Services industry are low relative to historical averages; and, when compared to other leading global industrial companies, Schlumberger’s valuation at 2.3 times sales looks reasonable.
Although the near-term outlook for oil prices is uncertain, we believe Schlumberger’s long-term growth prospects are attractive. Through its research and development (R&D) program and targeted acquisition strategy, Schlumberger is able to offer advanced and integrated services that are differentiated and improve a customer’s productivity per well. Furthermore, Schlumberger is in the midst of a restructuring program to increase efficiency and reduce capital intensity. Management has proactively adjusted its cost structure to deal with reduced activity levels in the current environment. These efforts have enabled the company to continue generating attractive levels of free cash flow, which provide strategic options for reinvesting in the business or for returning capital to shareholders. Continued industry consolidation should improve the competitive and pricing environment. Halliburton’s proposed acquisition of Baker Hughes would combine the second- and third-largest industry competitors. While weaker demand and a low oil price environment have weighed on Schlumberger’s share price, we believe its valuation, solid balance sheet, cash flow generation, and prospects make it an attractive long-term investment opportunity. We recently added to the position (a 3.1% holding on June 30).
Petrobras
Petrobras is the leading producer of oil and gas in Brazil, accounting for roughly 90% of Brazil’s oil production. In 2014, its stock price declined approximately 50% due to a corruption scandal involving kickbacks on procurement contracts, a weakening Brazilian Real, and increasing debt from years of outspending its cash flow. The lower oil price environment and high financial leverage have raised concerns about the viability of funding growth through additional borrowings. The CEO and other senior executives resigned earlier this year and were replaced with a new management team. Investors are skeptical about the company’s ability to rectify its problems and grow production. As a result, it trades at 2.6 times 2015 estimated operating cash flow and at a substantial discount to its net asset value, well below historical levels and that of its peers.
Despite this perfect storm of challenges, the company managed to grow production in the first half of 2015 compared to the first half of 2014. This growth was driven by the company’s leading position in the deepwater fields, also known as “pre-salt,”
of the Santos Basin, which is one of the Western Hemisphere’s largest oil discoveries in 30 years. These fields are prolific, low-cost, and should enable Petrobras to maintain or grow production over the long term. In addition to possessing excellent reserves, Petrobras has improved corporate governance: the company hired two independent investigative firms and meaningfully revamped internal governance structures. The new management team is displaying more discipline on capital spending; it has announced plans to reduce capital expenditures by 37% and focus on the company’s most profitable exploration and production projects. Combined with a large scale divestiture program, these efforts should lead to a stronger balance sheet.
After meeting with the new management team in Brazil, along with government officials and industry experts, we decided to add to Petrobras in the second quarter of 2015. We believe the company’s growth prospects and ability to overcome its current challenges are not reflected in its compelling valuation today. On June 30, Petrobras was a 1.5% position in the Fund.
IN CLOSING
While international equity valuations have trended higher, we believe they remain reasonable: the MSCI EAFE traded at 15.0 times forward earnings on June 30, close to its 20-year historical average of 16.0 times. As we look for long-term investment candidates in both developed and emerging markets, we continue to see attractive opportunities. Corporate balance sheets and cash flows remain strong. However, we have a more tempered outlook for long-term equity returns given higher starting valuations today. The Fund is invested in companies that we believe have favorable prospects over our three- to five-year investment horizon. Acknowledging that both share prices and currencies can be volatile in the short term, we encourage shareholders to remain focused on the long term.
Thank you for your continued confidence in our firm. As always, we welcome your comments and questions.
For the Board of Trustees,
| | |
| | |
Charles F. Pohl, Chairman | | Dana M. Emery, President |
July 31, 2015
| (a) | | Unless otherwise specified, all weightings and characteristics are as of June 30, 2015. |
| (b) | | The use of specific examples does not imply that they are more attractive investments than the Fund’s other holdings. |
DODGE & COX INTERNATIONAL STOCK FUND §PAGE 3
International Stock Fund Soft Close
On January 16, 2015, the Dodge & Cox International Stock Fund closed to new investors, with limited exceptions. Complete rules on eligibility to invest in the International Stock Fund are available in the Fund’s prospectus, dated May 1, 2015.
We closed the International Stock Fund to new investors to proactively “tap the brakes” on the Fund’s growth. We believe this decision is in the best long-term interests of the Fund’s existing shareholders, as it allows us to have stable and balanced growth within the Fund. Over the past couple of years, the International Stock Fund experienced significant, but manageable asset flows. A meaningful portion of these flows came from existing shareholders, and we wanted to preserve their ability to continue to invest with us. Thus, current shareholders in the Fund will be able to make additional investments. We remain confident in our ability to continue to find and invest in attractive international opportunities with the assets entrusted to us.
Five of the six Dodge & Cox Funds (Stock Fund, Global Stock Fund, Balanced Fund, Income Fund, and Global Bond Fund) remain open to new investors.
YEAR-TO-DATE PERFORMANCE REVIEW
The Fund underperformed the MSCI EAFE by 1.6 percentage points year to date.
Key Detractors from Relative Results
| | § | | The Fund’s average overweight position (16% versus 5%) and holdings in the Information Technology sector (down 3% compared to up 6% for the MSCI EAFE sector) meaningfully detracted from performance. Hewlett-Packard (down 24%), Baidu (down 13%), and Samsung Electronics (down 6%) were notable detractors. | |
| | § | | Weak returns from the Fund’s emerging market Financials holdings (down 14%) negatively impacted results. Yapi Kredi (down 28%), Kasikornbank (down 19%), Itau Unibanco (down 13%), and ICICI Bank (down 12%) performed poorly. | |
| | § | | The Fund’s holdings in the Industrials sector (down 2% compared to up 6% for the MSCI EAFE sector), particularly Tyco International (down 12%) and Philips (down 11%), hindered results. | |
| | § | | Additional detractors included Royal Dutch Shell (down 13%) and Lafarge (down 5%). | |
Key Contributors to Relative Results
| | § | | The Fund’s average overweight position (7% versus 2%) and holdings in the Media industry (up 14% compared to up 9% for the MSCI EAFE industry) aided performance. Naspers (up 19%) and Grupo Televisa (up 14%) were particularly strong. | |
| | § | | In Europe & UK Financials, certain Fund holdings contributed to results, especially Lloyds Banking Group (up 14%), Credit Suisse (up 12%), Standard Chartered (up 11%), and Barclays (up 10%). | |
| | § | | The Fund’s lack of holdings in the Utilities sector, the weakest sector of the market (down 3%), helped performance. | |
| | § | | Additional contributors included Nintendo (up 60%), Nissan Motor (up 20%), and Infineon Technologies (up 18%). | |
PAGE 4 § DODGE & COX INTERNATIONAL STOCK FUND
KEY CHARACTERISTICS OF DODGE & COX
Independent Organization
Dodge & Cox is one of the largest privately owned investment managers in the world. We remain committed to independence, with a goal of providing the highest quality investment management service to our existing clients.
Over 80 Years of Investment Experience
Dodge & Cox was founded in 1930. We have a stable and well-qualified team of investment professionals, most of whom have spent their entire careers at Dodge & Cox.
Experienced Investment Team
The International Investment Policy Committee, which is the decision-making body for the International Stock Fund, is a nine-member committee with an average tenure at Dodge & Cox of 22 years.
One Business with a Single Research Office
Dodge & Cox manages equity (domestic, international, and global), fixed income (domestic and global), and balanced investments, operating from one office in San Francisco.
Consistent Investment Approach
Our team decision-making process involves thorough, bottom-up fundamental analysis of each investment.
Long-Term Focus and Low Expenses
We invest with a three- to five-year investment horizon, which has historically resulted in low turnover relative to our peers. We manage Funds that maintain low expense ratios.
Risks: The Fund is subject to market risk, meaning holdings in the Fund may decline in value for extended periods due to the financial prospects of individual companies, or due to general market and economic conditions. Investing in non-U.S. securities may entail risk due to foreign economic and political developments; this risk may be increased when investing in emerging markets. The Fund is also subject to currency risk. Please read the prospectus and summary prospectus for specific details regarding the Fund’s risk profile.
DODGE & COX INTERNATIONAL STOCK FUND §PAGE 5
GROWTH OF $10,000 OVER 10 YEARS
FOR AN INVESTMENT MADE ON JUNE 30, 2005
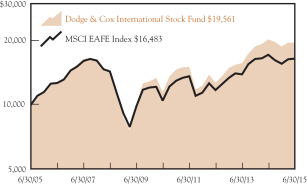
AVERAGE ANNUAL TOTAL RETURN
FOR PERIODS ENDED JUNE 30, 2015
| | | | | | | | | | | | | | | | |
| | | 1 Year | | | 3 Years | | | 5 Years | | | 10 Years | |
Dodge & Cox International
Stock Fund | | | -3.64 | % | | | 15.44 | % | | | 11.24 | % | | | 6.96 | % |
MSCI EAFE | | | -4.21 | | | | 11.98 | | | | 9.55 | | | | 5.12 | |
Returns represent past performance and do not guarantee future results. Investment return and share price will fluctuate with market conditions, and investors may have a gain or loss when shares are sold. Fund performance changes over time and currently may be significantly lower than stated. Performance is updated and published monthly. Visit the Fund’s website at dodgeandcox.com or call 800-621-3979 for current performance figures.
The Fund’s total returns include the reinvestment of dividend and capital gain distributions, but have not been adjusted for any income taxes payable by shareholders on these distributions or on Fund share redemptions. Index returns include dividends but, unlike Fund returns, do not reflect fees or expenses. The MSCI EAFE (Europe, Australasia, Far East) Index is a broad-based, unmanaged equity market index aggregated from 21 developed market country indices, excluding the United States and Canada. MSCI makes no express or implied warranties or representations and shall have no liability whatsoever with respect to any MSCI data contained herein. The MSCI data may not be further redistributed or used as a basis for other indices or any securities or financial products. This report is not approved, reviewed, or produced by MSCI.
MSCI EAFE is a service mark of MSCI Barra.
FUND EXPENSE EXAMPLE
As a Fund shareholder, you incur ongoing Fund costs, including management fees and other Fund expenses. All mutual funds have ongoing costs, sometimes referred to as operating expenses. The following example shows ongoing costs of investing in the Fund and can help you understand these costs and compare them with those of other mutual funds. The example assumes a $1,000 investment held for the six months indicated.
ACTUAL EXPENSES
The first line of the table below provides information about actual account values and expenses based on the Fund’s actual returns. You may use the information in this line, together with your account balance, to estimate the expenses that you paid over the period. Simply divide your account value by $1,000 (for example, an $8,600 account value divided by $1,000 = 8.6), then multiply the result by the number in the first line under the heading “Expenses Paid During Period” to estimate the expenses you paid on your account during this period.
HYPOTHETICAL EXAMPLE FOR COMPARISON WITH OTHER MUTUAL FUNDS
Information on the second line of the table can help you compare ongoing costs of investing in the Fund with those of other mutual funds. This information may not be used to estimate the actual ending account balance or expenses you paid during the period. The hypothetical “Ending Account Value” is based on the actual expense ratio of the Fund and an assumed 5% annual rate of return before expenses (not the Fund’s actual return). The amount under the heading “Expense Paid During the Period” shows the hypothetical expenses your account would have incurred under this scenario. You can compare this figure with the 5% hypothetical examples that appear in shareholder reports of other mutual funds.
| | | | | | | | | | | | |
Six Months Ended June 30, 2015 | | Beginning Account Value
1/1/2015 | | | Ending Account Value
6/30/2015 | | | Expenses Paid During Period* | |
Based on Actual Fund Return | | $ | 1,000.00 | | | $ | 1,038.90 | | | $ | 3.25 | |
Based on Hypothetical 5% Yearly Return | | | 1,000.00 | | | | 1,021.60 | | | | 3.23 | |
| * | Expenses are equal to the Fund’s annualized expense ratio of 0.64%, multiplied by the average account value over the period, multiplied by 181/365 (to reflect the one-half year period). |
The expenses shown in the table highlight ongoing costs only and do not reflect any transactional fees or account maintenance fees. Though other mutual funds may charge such fees, please note that the Fund does not charge transaction fees (e.g., redemption fees, sales loads) or universal account maintenance fees (e.g., small account fees).
PAGE 6 § DODGE & COX INTERNATIONAL STOCK FUND
| | | | |
| FUND INFORMATION | | | June 30, 2015 | |
| | | | |
| GENERAL INFORMATION | | | |
Net Asset Value Per Share | | | $43.75 | |
Total Net Assets (billions) | | | $69.7 | |
Expense Ratio | | | 0.64% | |
Portfolio Turnover Rate (1/1/15 to 6/30/15, unannualized) | | | 7% | |
30-Day SEC Yield(a) | | | 1.53% | |
Fund Inception | | | 2001 | |
No sales charges or distribution fees | | | | |
Investment Manager: Dodge & Cox, San Francisco. Managed by the International Investment Policy Committee, whose nine members’ average tenure at Dodge & Cox is 22 years.
| | | | | | | | |
| PORTFOLIO CHARACTERISTICS | | Fund | | | MSCI
EAFE | |
Number of Equity Securities | | | 77 | | | | 911 | |
Median Market Capitalization (billions) | | | $28 | | | | $9 | |
Weighted Average Market Capitalization (billions) | | | $70 | | | | $58 | |
Price-to-Earnings Ratio(b) | | | 13.8x | | | | 15.0x | |
Countries Represented | | | 24 | | | | 21 | |
Emerging Markets (Brazil, China, India, Mexico, South Africa, South Korea, Thailand, Turkey, United Arab Emirates) | | | 23.5% | | | | 0.0% | |
| | | | |
| TEN LARGEST HOLDINGS (%)(c) | | Fund | |
Naspers, Ltd. (South Africa) | | | 3.9 | |
Sanofi (France) | | | 3.5 | |
Novartis AG (Switzerland) | | | 3.4 | |
Samsung Electronics Co., Ltd. (South Korea) | | | 3.2 | |
Roche Holding AG (Switzerland) | | | 3.2 | |
Schlumberger, Ltd. (United States) | | | 3.1 | |
Standard Chartered PLC (United Kingdom) | | | 2.9 | |
Barclays PLC (United Kingdom) | | | 2.6 | |
Credit Suisse Group AG (Switzerland) | | | 2.2 | |
Hewlett-Packard Co. (United States) | | | 2.2 | |
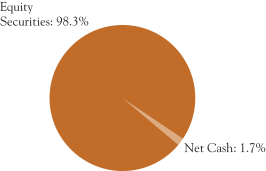
| | | | | | | | |
| REGION DIVERSIFICATION (%)(d) | | Fund | | | MSCI
EAFE | |
Europe (excluding United Kingdom) | | | 40.2 | | | | 44.5 | |
United Kingdom | | | 15.2 | | | | 20.3 | |
Japan | | | 13.0 | | | | 22.9 | |
Pacific (excluding Japan) | | | 12.2 | | | | 11.7 | |
Africa/Middle East | | | 6.1 | | | | 0.6 | |
United States | | | 5.7 | | | | 0.0 | |
Latin America | | | 5.5 | | | | 0.0 | |
Canada | | | 0.4 | | | | 0.0 | |
| | | | | | | | |
| SECTOR DIVERSIFICATION (%) | | Fund | | | MSCI
EAFE | |
Financials | | | 25.2 | | | | 26.2 | |
Consumer Discretionary | | | 16.1 | | | | 13.2 | |
Information Technology | | | 15.0 | | | | 4.7 | |
Health Care | | | 12.8 | | | | 11.2 | |
Industrials | | | 7.7 | | | | 12.7 | |
Energy | | | 7.4 | | | | 5.2 | |
Telecommunication Services | | | 6.3 | | | | 4.9 | |
Materials | | | 4.7 | | | | 7.4 | |
Consumer Staples | | | 3.1 | | | | 10.9 | |
Utilities | | | 0.0 | | | | 3.6 | |
| (a) | SEC Yield is an annualization of the Fund’s total net investment income per share for the 30-day period ended on the last day of the month. |
| (b) | Price-to-earnings (P/E) ratios are calculated using 12-month forward earnings estimates from third-party sources. |
| (c) | The Fund’s portfolio holdings are subject to change without notice. The mention of specific securities is not a recommendation to buy, sell, or hold any particular security and is not indicative of Dodge & Cox’s current or future trading activity. |
| (d) | The Fund may classify a company in a different category than the MSCI EAFE. The Fund generally classifies a company based on its country of incorporation, but may designate a different country in certain circumstances. |
DODGE & COX INTERNATIONAL STOCK FUND §PAGE 7
| | | | |
| CONSOLIDATED PORTFOLIO OF INVESTMENTS (unaudited) | | | June 30, 2015 | |
| | | | | | | | |
| COMMON STOCKS: 94.6% | |
| | |
| | | SHARES | | | VALUE | |
| CONSUMER DISCRETIONARY: 16.1% | |
AUTOMOBILES & COMPONENTS: 6.6% | | | | | |
Bayerische Motoren Werke AG (Germany) | | | 8,676,300 | | | $ | 949,672,495 | |
Honda Motor Co., Ltd. (Japan) | | | 33,966,400 | | | | 1,099,463,935 | |
Honda Motor Co., Ltd. ADR (Japan) | | | 6,758,400 | | | | 218,972,160 | |
Mahindra & Mahindra, Ltd. (India) | | | 16,522,808 | | | | 333,790,301 | |
NGK Spark Plug Co., Ltd.(b) (Japan) | | | 12,120,000 | | | | 336,212,771 | |
Nissan Motor Co., Ltd. (Japan) | | | 93,132,200 | | | | 970,245,986 | |
Yamaha Motor Co., Ltd.(b) (Japan) | | | 31,550,100 | | | | 690,114,129 | |
| | | | | | | | |
| | | | | | | 4,598,471,777 | |
CONSUMER DURABLES & APPAREL: 1.5% | |
Panasonic Corp. (Japan) | | | 75,248,434 | | | | 1,033,870,505 | |
| | |
CONSUMER SERVICES: 0.3% | | | | | | | | |
New Oriental Education & Technology Group, Inc. ADR(a),(b) (Cayman Islands/China) | | | 8,833,529 | | | | 216,598,131 | |
| | |
MEDIA: 7.7% | | | | | | | | |
Grupo Televisa SAB ADR (Mexico) | | | 22,632,192 | | | | 878,581,693 | |
Liberty Global PLC, Series A(a) (United Kingdom) | | | 11,619,005 | | | | 628,239,600 | |
Liberty Global PLC, Series C(a) (United Kingdom) | | | 17,488,247 | | | | 885,429,946 | |
Naspers, Ltd. (South Africa) | | | 17,525,595 | | | | 2,729,821,020 | |
Television Broadcasts, Ltd.(b) (Hong Kong) | | | 40,022,900 | | | | 237,249,615 | |
| | | | | | | | |
| | | | | | | 5,359,321,874 | |
| | | | | | | | |
| | | | | | | 11,208,262,287 | |
| CONSUMER STAPLES: 3.1% | | | | | | | | |
FOOD, BEVERAGE & TOBACCO: 2.0% | | | | | |
Anadolu Efes Biracilik ve Malt Sanayii AS(b) (Turkey) | | | 31,770,210 | | | | 286,869,550 | |
Imperial Tobacco Group PLC (United Kingdom) | | | 22,874,300 | | | | 1,102,317,878 | |
| | | | | | | | |
| | | | | | | 1,389,187,428 | |
HOUSEHOLD & PERSONAL PRODUCTS: 1.1% | |
Unilever PLC (United Kingdom) | | | 18,338,300 | | | | 786,623,620 | |
| | | | | | | | |
| | | | | | | 2,175,811,048 | |
| ENERGY: 5.9% | | | | | | | | |
Royal Dutch Shell PLC ADR (United Kingdom) | | | 9,329,395 | | | | 531,868,809 | |
Saipem SPA(a),(b) (Italy) | | | 46,865,200 | | | | 495,046,467 | |
Schlumberger, Ltd. (Curacao/United States) | | | 25,027,224 | | | | 2,157,096,437 | |
Total SA (France) | | | 10,779,100 | | | | 523,583,959 | |
Weatherford International PLC(a) (Ireland) | | | 31,817,592 | | | | 390,401,854 | |
| | | | | | | | |
| | | | | | | 4,097,997,526 | |
| FINANCIALS: 23.7% | | | | | | | | |
BANKS: 16.1% | | | | | | | | |
Banco Santander SA (Spain) | | | 70,096,290 | | | | 489,511,674 | |
Barclays PLC (United Kingdom) | | | 441,255,398 | | | | 1,806,105,110 | |
BNP Paribas SA (France) | | | 17,886,158 | | | | 1,079,771,340 | |
ICICI Bank, Ltd. (India) | | | 257,911,785 | | | | 1,247,437,654 | |
Kasikornbank PCL- Foreign(b) (Thailand) | | | 136,883,027 | | | | 765,966,221 | |
Lloyds Banking Group PLC (United Kingdom) | | | 847,482,400 | | | | 1,135,061,495 | |
Mitsubishi UFJ Financial Group, Inc. (Japan) | | | 116,265,800 | | | | 835,810,360 | |
Siam Commercial Bank PCL- Foreign (Thailand) | | | 78,078,500 | | | | 359,467,861 | |
Societe Generale SA (France) | | | 8,910,342 | | | | 415,923,641 | |
Standard Chartered PLC (United Kingdom) | | | 125,960,966 | | | | 2,016,765,619 | |
UniCredit SPA (Italy) | | | 118,059,078 | | | | 792,999,129 | |
Yapi ve Kredi Bankasi AS(b) (Turkey) | | | 204,376,868 | | | | 300,453,289 | |
| | | | | | | | |
| | | | | | | 11,245,273,393 | |
DIVERSIFIED FINANCIALS: 2.7% | | | | | |
Credit Suisse Group AG (Switzerland) | | | 57,060,405 | | | | 1,568,482,174 | |
Haci Omer Sabanci Holding AS (Turkey) | | | 82,095,354 | | | | 309,377,664 | |
| | | | | | | | |
| | | | | | | 1,877,859,838 | |
| | | | | | | | |
| | |
| | | SHARES | | | VALUE | |
INSURANCE: 3.3% | | | | | | | | |
AEGON NV(b) (Netherlands) | | | 127,504,334 | | | $ | 937,040,620 | |
Aviva PLC (United Kingdom) | | | 80,919,501 | | | | 626,187,932 | |
Swiss Re AG (Switzerland) | | | 7,852,668 | | | | 695,019,281 | |
| | | | | | | | |
| | | | | | | 2,258,247,833 | |
REAL ESTATE: 1.6% | | | | | | | | |
BR Malls Participacoes SA(b) (Brazil) | | | 54,870,300 | | | | 256,959,110 | |
Hang Lung Group, Ltd.(b) (Hong Kong) | | | 110,524,300 | | | | 486,209,678 | |
Hang Lung Properties, Ltd. (Hong Kong) | | | 126,187,300 | | | | 376,044,356 | |
| | | | | | | | |
| | | | | | | 1,119,213,144 | |
| | | | | | | | |
| | | | | | | 16,500,594,208 | |
| HEALTH CARE: 12.8% | | | | | | | | |
PHARMACEUTICALS, BIOTECHNOLOGY & LIFE SCIENCES: 12.8% | |
Bayer AG (Germany) | | | 9,847,650 | | | | 1,378,369,307 | |
GlaxoSmithKline PLC (United Kingdom) | | | 15,629,700 | | | | 324,781,726 | |
GlaxoSmithKline PLC ADR (United Kingdom) | | | 2,903,383 | | | | 120,925,902 | |
Novartis AG (Switzerland) | | | 8,095,570 | | | | 797,910,878 | |
Novartis AG ADR (Switzerland) | | | 16,305,000 | | | | 1,603,433,700 | |
Roche Holding AG (Switzerland) | | | 7,896,400 | | | | 2,212,799,401 | |
Sanofi (France) | | | 25,021,622 | | | | 2,461,485,208 | |
| | | | | | | | |
| | | | | | | 8,899,706,122 | |
| INDUSTRIALS: 7.7% | | | | | | | | |
CAPITAL GOODS: 6.0% | | | | | | | | |
Koninklijke Philips NV (Netherlands) | | | 37,649,495 | | | | 957,835,805 | |
Mitsubishi Electric Corp. (Japan) | | | 70,457,600 | | | | 910,764,581 | |
Nidec Corp. (Japan) | | | 7,554,800 | | | | 565,753,499 | |
Schneider Electric SA (France) | | | 17,051,646 | | | | 1,177,290,555 | |
Smiths Group PLC(b) (United Kingdom) | | | 33,926,200 | | | | 601,830,817 | |
| | | | | | | | |
| | | | | | | 4,213,475,257 | |
COMMERCIAL & PROFESSIONAL SERVICES: 1.4% | |
ADT Corp. (United States) | | | 7,476,860 | | | | 250,998,190 | |
Tyco International PLC (Ireland) | | | 19,705,320 | | | | 758,260,714 | |
| | | | | | | | |
| | | | | | | 1,009,258,904 | |
TRANSPORTATION: 0.3% | | | | | | | | |
DP World, Ltd. (United Arab Emirates) | | | 8,256,304 | | | | 176,684,906 | |
| | | | | | | | |
| | | | | | | 5,399,419,067 | |
| INFORMATION TECHNOLOGY: 14.3% | |
SEMICONDUCTORS & SEMICONDUCTOR EQUIPMENT: 3.6% | |
Infineon Technologies AG(b) (Germany) | | | 66,414,456 | | | | 824,088,884 | |
Samsung Electronics Co., Ltd. (South Korea) | | | 1,521,592 | | | | 1,729,686,365 | |
| | | | | | | | |
| | | | | | | 2,553,775,249 | |
SOFTWARE & SERVICES: 3.4% | | | | | | | | |
Baidu, Inc. ADR(a) (Cayman Islands/China) | | | 6,158,087 | | | | 1,225,951,960 | |
Fujitsu, Ltd. (Japan) | | | 46,482,700 | | | | 259,940,024 | |
Nintendo Co., Ltd. (Japan) | | | 5,276,200 | | | | 882,492,250 | |
| | | | | | | | |
| | | | | | | 2,368,384,234 | |
TECHNOLOGY, HARDWARE & EQUIPMENT: 7.3% | |
Brother Industries, Ltd.(b) (Japan) | | | 13,924,400 | | | | 197,286,511 | |
Hewlett-Packard Co. (United States) | | | 51,080,004 | | | | 1,532,910,920 | |
Kyocera Corp.(b) (Japan) | | | 20,248,000 | | | | 1,052,727,246 | |
Nokia Oyj (Finland) | | | 41,092,100 | | | | 278,992,097 | |
TE Connectivity, Ltd. (Switzerland) | | | 13,646,362 | | | | 877,461,076 | |
Telefonaktiebolaget LM Ericsson (Sweden) | | | 109,287,900 | | | | 1,132,448,791 | |
| | | | | | | | |
| | | | | | | 5,071,826,641 | |
| | | | | | | | |
| | | | | | | 9,993,986,124 | |
| MATERIALS: 4.7% | | | | | | | | |
Akzo Nobel NV (Netherlands) | | | 6,040,440 | | | | 439,540,056 | |
Lafarge SA(b) (France) | | | 20,035,291 | | | | 1,323,204,522 | |
Lanxess AG(b) (Germany) | | | 5,001,680 | | | | 294,921,030 | |
Linde AG (Germany) | | | 4,782,005 | | | | 905,773,638 | |
Teck Resources, Ltd., Class B (Canada) | | | 30,160,892 | | | | 298,894,440 | |
| | | | | | | | |
| | | | | | | 3,262,333,686 | |
| | |
| PAGE 8 § DODGE & COX INTERNATIONAL STOCK FUND | | See accompanying Notes to Financial Statements |
| | | | |
| CONSOLIDATED PORTFOLIO OF INVESTMENTS (unaudited) | | | June 30, 2015 | |
| | | | | | | | |
| COMMON STOCKS (continued) | |
| | |
| | | SHARES | | | VALUE | |
| TELECOMMUNICATION SERVICES: 6.3% | |
America Movil SAB de CV, Series L (Mexico) | | | 632,299,400 | | | $ | 675,847,299 | |
Bharti Airtel, Ltd. (India) | | | 57,768,204 | | | | 381,144,958 | |
China Mobile, Ltd. (Hong Kong/China) | | | 49,879,000 | | | | 639,610,478 | |
Millicom International Cellular SA SDR(b) (Luxembourg) | | | 10,088,392 | | | | 744,169,280 | |
MTN Group, Ltd. (South Africa) | | | 69,481,726 | | | | 1,306,423,214 | |
Telecom Italia SPA(a) (Italy) | | | 201,500,000 | | | | 255,642,811 | |
Telecom Italia SPA- RSP (Italy) | | | 352,735,486 | | | | 360,017,634 | |
| | | | | | | | |
| | | | | | | 4,362,855,674 | |
| | | | | | | | |
TOTAL COMMON STOCKS
(Cost $59,237,974,658) | | | $ | 65,900,965,742 | |
|
| PREFERRED STOCKS: 3.7% | |
| ENERGY: 1.5% | |
Petroleo Brasileiro SA ADR(a) (Brazil) | | | 123,840,300 | | | | 1,010,536,848 | |
| | |
| FINANCIALS: 1.5% | | | | | | | | |
BANKS: 1.5% | | | | | | | | |
Itau Unibanco Holding SA (Brazil) | | | 92,900,150 | | | | 1,022,496,263 | |
|
| INFORMATION TECHNOLOGY: 0.7% | |
SEMICONDUCTORS & SEMICONDUCTOR EQUIPMENT: 0.7% | |
Samsung Electronics Co., Ltd.
(South Korea) | | | 586,016 | | | | 521,685,318 | |
| | | | | | | | |
TOTAL PREFERRED STOCKS
(Cost $3,171,486,185) | | | $ | 2,554,718,429 | |
| | | | | | | | |
| SHORT-TERM INVESTMENTS: 1.8% | |
| | |
| | | PAR VALUE | | | VALUE | |
MONEY MARKET FUND: 0.1% | |
SSgA U.S. Treasury Money
Market Fund | | $ | 69,878,118 | | | $ | 69,878,118 | |
| |
REPURCHASE AGREEMENT: 1.7% | | | | | |
Fixed Income Clearing Corporation(c)
0.01%, dated 6/30/15, due 7/1/15,
maturity value $1,195,140,332 | | | 1,195,140,000 | | | | 1,195,140,000 | |
| | | | | | | | |
TOTAL SHORT-TERM INVESTMENTS
(Cost $1,265,018,118) | | | $ | 1,265,018,118 | |
| | | | | | | | |
TOTAL INVESTMENTS
(Cost $63,674,478,961) | | | 100.1 | % | | $ | 69,720,702,289 | |
OTHER ASSETS LESS LIABILITIES | | | (0.1 | %) | | | (52,229,682 | ) |
| | | | | | | | |
| NET ASSETS | | | 100.0 | % | | $ | 69,668,472,607 | |
| | | | | | | | |
| (b) | See Note 10 regarding holdings of 5% voting securities |
| (c) | Repurchase agreement is collateralized by U.S. Treasury Note 1.125%-1.625%, 12/31/19-4/30/20; Fannie Mae 1.67%-1.75%, 2/10/20-2/12/20; and Freddie Mac 1.84%, 4/8/20. Total collateral value is $1,219,052,041. |
In determining a company’s country designation, the Fund generally references the country of incorporation. In cases where the Fund considers the country of incorporation to be a “jurisdiction of convenience” chosen primarily for tax purposes or in other limited circumstances, the Fund uses the country designation of an appropriate broad-based market index. In those cases, two countries are listed—the country of incorporation and the country designated by an appropriate index, respectively.
ADR: American Depositary Receipt
SDR: Swedish Depository Receipt
FORWARD CURRENCY CONTRACTS
| | | | | | | | | | | | | | | | |
| | | | | | Contract Amount | | | | |
| Counterparty | | Settlement
Date | | | Receive U.S. Dollar | | | Deliver
Foreign
Currency | | | Unrealized
Appreciation/
(Depreciation) | |
Contracts to sell EUR: | | | | | |
JPMorgan | | | 8/12/15 | | | | 564,940,000 | | | | 500,000,000 | | | $ | 7,211,736 | |
Credit Suisse | | | 8/19/15 | | | | 569,625,000 | | | | 500,000,000 | | | | 11,839,573 | |
Deutsche Bank | | | 9/2/15 | | | | 546,384,500 | | | | 500,000,000 | | | | (11,515,287 | ) |
Barclays | | | 9/16/15 | | | | 674,853,000 | | | | 600,000,000 | | | | 5,233,290 | |
HSBC | | | 9/16/15 | | | | 337,396,500 | | | | 300,000,000 | | | | 2,586,645 | |
| | | | | | | | | | | | | | | | |
| | | | | | | | | | | | | | $ | 15,355,957 | |
| | | | | | | | | | | | | | | | |
| | |
| See accompanying Notes to Financial Statements | | DODGE & COX INTERNATIONAL STOCK FUND §PAGE 9 |
| | | | |
CONSOLIDATED STATEMENT OF ASSETS AND LIABILITIES (unaudited) | |
| |
| | | June 30, 2015 | |
ASSETS: | | | | |
Investments, at value | | | | |
Unaffiliated issuers (cost $53,921,013,535) | | $ | 59,974,207,707 | |
Affiliated issuers (cost $9,753,465,426) | | | 9,746,494,582 | |
| | | | |
| | | 69,720,702,289 | |
Unrealized appreciation on forward currency contracts | | | 26,871,244 | |
Cash | | | 100 | |
Cash denominated in foreign currency (cost $47,094,404) | | | 46,956,440 | |
Receivable for investments sold | | | 51,916,798 | |
Receivable for Fund shares sold | | | 64,155,518 | |
Dividends and interest receivable | | | 121,784,694 | |
Prepaid expenses and other assets | | | 211,202 | |
| | | | |
| | | 70,032,598,285 | |
| | | | |
LIABILITIES: | | | | |
Unrealized depreciation on forward currency contracts | | | 11,515,287 | |
Payable for investments purchased | | | 253,898,856 | |
Payable for Fund shares redeemed | | | 57,317,440 | |
Management fees payable | | | 35,158,057 | |
Accrued expenses | | | 6,236,038 | |
| | | | |
| | | 364,125,678 | |
| | | | |
NET ASSETS | | $ | 69,668,472,607 | |
| | | | |
NET ASSETS CONSIST OF: | | | | |
Paid in capital | | $ | 65,585,455,711 | |
Undistributed net investment income | | | 986,523,051 | |
Accumulated net realized loss | | | (2,964,455,533 | ) |
Net unrealized appreciation | | | 6,060,949,378 | |
| | | | |
| | $ | 69,668,472,607 | |
| | | | |
Fund shares outstanding (par value $0.01 each,
unlimited shares authorized) | | | 1,592,522,681 | |
Net asset value per share | | $ | 43.75 | |
|
CONSOLIDATED STATEMENT OF OPERATIONS
(unaudited) | |
| |
| | | Six Months Ended
June 30, 2015 | |
INVESTMENT INCOME: | | | | |
Dividends (net of foreign taxes of $66,679,362) | | | | |
Unaffiliated issuers | | $ | 1,030,498,941 | |
Affiliated issuers | | | 167,220,116 | |
Interest | | | 234,845 | |
| | | | |
| | | 1,197,953,902 | |
| | | | |
EXPENSES: | | | | |
Management fees | | | 205,930,316 | |
Custody and fund accounting fees | | | 4,734,575 | |
Transfer agent fees | | | 6,750,420 | |
Professional services | | | 254,097 | |
Shareholder reports | | | 1,316,016 | |
Registration fees | | | 1,160,784 | |
Trustees’ fees | | | 118,750 | |
Miscellaneous | | | 651,627 | |
| | | | |
| | | 220,916,585 | |
| | | | |
NET INVESTMENT INCOME | | | 977,037,317 | |
| | | | |
| |
REALIZED AND UNREALIZED GAIN (LOSS): | | | | |
Net realized gain (loss) | | | | |
Investments in unaffiliated issuers | | | (28,732,496 | ) |
Invesments in affiliated issuers | | | 104,912,201 | |
Forward currency contracts | | | 292,176,100 | |
Foreign currency transactions | | | (9,609,977 | ) |
Net change in unrealized appreciation/depreciation | | | | |
Investments | | | 1,252,627,573 | |
Forward currency contracts | | | (67,240,029 | ) |
Foreign currency translation | | | (385,973 | ) |
| | | | |
Net realized and unrealized gain | | | 1,543,747,399 | |
| | | | |
NET INCREASE IN NET ASSETS
FROM OPERATIONS | | $ | 2,520,784,716 | |
| | | | |
| | | | | | | | |
CONSOLIDATED STATEMENT OF CHANGES IN NET ASSETS (unaudited) | |
| | |
| | | Six Months Ended
June 30, 2015 | | | Year Ended
December 31, 2014 | |
OPERATIONS: | | | | | | | | |
Net investment income | | $ | 977,037,317 | | | $ | 1,451,548,384 | |
Net realized gain | | | 358,745,828 | | | | 2,019,551,822 | |
Net change in unrealized
appreciation/depreciation | | | 1,185,001,571 | | | | (3,874,051,496 | ) |
| | | | | | | | |
| | | 2,520,784,716 | | | | (402,951,290 | ) |
| | | | | | | | |
| | |
DISTRIBUTIONS TO SHAREHOLDERS FROM: | | | | | | | | |
Net investment income | | | — | | | | (1,440,251,048 | ) |
Net realized gain | | | — | | | | — | |
| | | | | | | | |
Total distributions | | | — | | | | (1,440,251,048 | ) |
| | | | | | | | |
| | |
FUND SHARE
TRANSACTIONS: | | | | | | | | |
Proceeds from sale of shares | | | 7,819,843,030 | | | | 19,083,592,819 | |
Reinvestment of distributions | | | – | | | | 1,176,502,813 | |
Cost of shares redeemed | | | (4,711,911,383 | ) | | | (7,993,354,008 | ) |
| | | | | | | | |
Net increase from Fund
share transactions | | | 3,107,931,647 | | | | 12,266,741,624 | |
| | | | | | | | |
Total increase in net assets | | | 5,628,716,363 | | | | 10,423,539,286 | |
| | |
NET ASSETS: | | | | | | | | |
Beginning of period | | | 64,039,756,244 | | | | 53,616,216,958 | |
| | | | | | | | |
End of period (including undistributed net investment income of $986,523,051 and $9,485,734, respectively) | | $ | 69,668,472,607 | | | $ | 64,039,756,244 | |
| | | | | | | | |
| | |
SHARE INFORMATION: | | | | | | | | |
Shares sold | | | 178,939,485 | | | | 427,948,359 | |
Distributions reinvested | | | — | | | | 27,741,165 | |
Shares redeemed | | | (107,155,613 | ) | | | (180,756,140 | ) |
| | | | | | | | |
Net increase in shares outstanding | | | 71,783,872 | | | | 274,933,384 | |
| | | | | | | | |
| | |
| PAGE 10 § DODGE & COX INTERNATIONAL STOCK FUND | | See accompanying Notes to Financial Statements |
NOTES TO CONSOLIDATED FINANCIAL STATEMENTS (unaudited)
NOTE 1—ORGANIZATION AND SIGNIFICANT ACCOUNTING POLICIES
Dodge & Cox International Stock Fund (the “Fund”) is one of the series constituting the Dodge & Cox Funds (the “Trust” or the “Funds”). The Trust is organized as a Delaware statutory trust and is registered under the Investment Company Act of 1940, as amended, as an open-end management investment company. The Fund is closed to new investors. The Fund commenced operations on May 1, 2001, and seeks long-term growth of principal and income. The Fund invests primarily in a diversified portfolio of foreign equity securities. Foreign investing, especially in developing countries, has special risks such as currency and market volatility and political and social instability. These and other risk considerations are discussed in the Fund’s Prospectus.
The financial statements have been prepared in conformity with accounting principles generally accepted in the United States of America, which require the use of estimates and assumptions by management. Actual results may differ from those estimates. Significant accounting policies are as follows:
Security valuation The Fund’s net assets are valued as of the close of trading on the New York Stock Exchange (NYSE), generally 4:00 p.m. Eastern Time, each day that the NYSE is open for business. Portfolio securities and other financial instruments for which market quotes are readily available are valued at market value. Listed securities are generally valued using the official quoted close price or the last sale on the exchange that is determined to be the primary market for the security. Security values are not discounted based on the size of the Fund’s position. Short-term securities less than 60 days to maturity may be valued at amortized cost if amortized cost approximates current value. Mutual funds are valued at their respective net asset values.
Investments initially valued in currencies other than the U.S. dollar are converted to the U.S. dollar using prevailing exchange rates. As a result, the Fund’s net assets may be affected by changes in the value of currencies in relation to the U.S. dollar.
If market quotations are not readily available or if a security’s value is believed to have materially changed after the close of the security’s primary market but before the close of trading on the NYSE, the security is valued at fair value as determined in good faith by or under the direction of the Funds’ Board of Trustees. The Board of Trustees has delegated authority to Dodge & Cox, the Fund’s investment manager, to make fair value determinations in accordance with the Dodge & Cox Funds Valuation Policies (“Valuation Policies”), subject to Board oversight. Dodge & Cox has established a Pricing Committee that is comprised of representatives from Treasury, Legal, Compliance, and Operations. The Pricing Committee is responsible for implementing the Valuation Policies, including determining the fair value of securities when market quotations or market-based valuations are not readily available or are deemed unreliable. The Pricing Committee considers relevant indications of value that are reasonably available to it in determining the fair value assigned to a particular security, such as the value of similar financial
instruments, trading volumes, contractual restrictions on disposition, related corporate actions, and changes in economic conditions. In doing so, the Pricing Committee employs various methods for calibrating fair valuation approaches, including a regular review of key inputs and assumptions, back-testing, and review of any related market activity.
As trading in securities on most foreign exchanges is normally completed before the close of the NYSE, the value of non-U.S. securities can change by the time the Fund calculates its NAV. To address these changes, the Fund may utilize adjustment factors provided by an independent pricing service to systemically value non-U.S. securities at fair value. These adjustment factors are based on statistical analyses of subsequent movements and changes in U.S. markets and financial instruments trading in U.S. markets that represent foreign securities or baskets of securities.
Valuing securities through a fair value determination involves greater reliance on judgment than valuation of securities based on readily available market quotations. In some instances, lack of information and uncertainty as to the significance of information may lead to a conclusion that a prior valuation is the best indication of a security’s value. When fair value pricing is employed, the prices of securities used by the Fund to calculate its NAV may differ from quoted or published prices for the same securities.
Security transactions, investment income, expenses, and distributions Security transactions are recorded on the trade date. Realized gains and losses on securities sold are determined on the basis of identified cost.
Dividend income and corporate action transactions are recorded on the ex-dividend date, or when the Fund first learns of the dividend/corporate action if the ex-dividend date has passed. Non-cash dividends included in dividend income, if any, are recorded at the fair market value of the securities received. Dividends characterized as return of capital for U.S. tax purposes are recorded as a reduction of cost of investments and/or realized gain. Interest income is recorded on the accrual basis.
Expenses are recorded on the accrual basis. Some expenses of the Trust can be directly attributed to a specific series. Expenses which cannot be directly attributed are allocated among the Funds in the Trust based on relative net assets or other expense methodologies determined by the nature of the expense.
Distributions to shareholders are recorded on the ex-dividend date.
Foreign taxes The Fund is subject to foreign taxes which may be imposed by certain countries in which the Fund invests. The Fund endeavors to record foreign taxes based on applicable foreign tax law. Withholding taxes are incurred on certain foreign dividends and are accrued at the time the associated dividend is recorded. The Fund files withholding tax reclaims in certain jurisdictions to recover a portion of amounts previously withheld. The Fund records a reclaim receivable based on, among other things, a jurisdiction’s legal obligation to pay reclaims as well as payment history and market convention. In consideration of
DODGE & COX INTERNATIONAL STOCK FUND §PAGE 11
NOTES TO CONSOLIDATED FINANCIAL STATEMENTS (unaudited)
recent decisions rendered by European courts, the Fund has filed for additional reclaims related to prior years. A corresponding receivable is established when both the amount is known and significant contingencies or uncertainties regarding collectability are removed.
Capital gains taxes are incurred upon disposition of certain foreign securities. Capital gains taxes on appreciated securities are accrued as unrealized losses and are reflected as realized losses upon the sale of the related security. Currency taxes may be incurred when the Fund purchases certain foreign currencies related to securities transactions and are recorded as realized losses on foreign currency transactions.
Repurchase agreements The Fund enters into repurchase agreements, secured by U.S. government or agency securities, which involve the purchase of securities from a counterparty with a simultaneous commitment to resell the securities at an agreed-upon date and price. It is the Fund’s policy that its custodian take possession of the underlying collateral securities, the fair value of which exceeds the principal amount of the repurchase transaction, including accrued interest, at all times. In the event of default by the counterparty, the Fund has the contractual right to liquidate the collateral securities and to apply the proceeds in satisfaction of the obligation.
Forward currency contracts A forward currency contract represents an obligation to purchase or sell a specific foreign currency at a future date at a price set at the time of the contract. Losses from these transactions may arise from unfavorable changes in currency values or if the counterparties do not perform under a contract’s terms.
The values of the forward currency contracts are adjusted daily based on the prevailing forward exchange rates of the underlying currencies. Changes in the value of open contracts are recorded as unrealized appreciation or depreciation in the Consolidated Statement of Operations. When the forward currency contract is closed, the Fund records a realized gain or loss in the Consolidated Statement of Operations equal to the difference between the value at the time the contract was opened and the value at the time it was closed.
During the period, the Fund maintained forward currency contracts to hedge foreign currency risks associated with portfolio investments denominated in euro. During the six months ended June 30, 2015, these euro forward currency contracts had U.S. dollar total values ranging from 3% to 5% of net assets.
Foreign currency translation The books and records of the Fund are maintained in U.S. dollars. Foreign currency amounts are translated into U.S. dollars at the prevailing exchange rates of such currencies against the U.S. dollar. The market value of investment securities and other assets and liabilities are translated at the exchange rate as of the valuation date. Purchases and sales of investment securities, income, and expenses are translated at the exchange rate prevailing on the transaction date.
Reported realized and unrealized gain (loss) on investments include foreign currency gain (loss) related to investment transactions.
Reported realized and unrealized gain (loss) on foreign currency transactions and translation include the following: disposing/holding of foreign currency, the difference between the trade and settlement dates on securities transactions, the difference between the accrual and payment dates on dividends, and currency losses on the purchase of foreign currency in certain countries that impose taxes on such transactions.
Consolidation The Fund may invest in certain securities through its wholly owned subsidiary, Dodge & Cox International Stock Fund Cayman, Ltd. (the “Subsidiary”). The Subsidiary is a Cayman Islands exempted company and invests in certain securities consistent with the investment objective of the Fund. The Fund’s Consolidated Financial Statements, including the Consolidated Portfolio of Investments, consist of the holdings and accounts of the Fund and the Subsidiary. All intercompany transactions and balances have been eliminated. At June 30, 2015, the Subsidiary had net assets of $100, which represented less than 0.01% of the Fund’s consolidated net assets.
Indemnification Under the Trust’s organizational documents, its officers and trustees are indemnified against certain liabilities arising out of the performance of their duties to the Trust. In addition, in the normal course of business the Trust enters into contracts that provide general indemnities to other parties. The Trust’s maximum exposure under these arrangements is unknown as this would involve future claims that may be made against the Trust that have not yet occurred.
NOTE 2—VALUATION MEASUREMENTS
Various inputs are used in determining the value of the Fund’s investments and other financial instruments. These inputs are summarized in the three broad levels listed below.
| § | | Level 1: Quoted prices in active markets for identical securities |
| § | | Level 2: Other significant observable inputs (including quoted prices for similar securities, market indices, interest rates, credit risk, etc.) |
| § | | Level 3: Significant unobservable inputs (including Fund management’s assumptions in determining the fair value of investments) |
The inputs or methodology used for valuing securities are not necessarily an indication of the risk associated with investing in those securities.
PAGE 12 § DODGE & COX INTERNATIONAL STOCK FUND
NOTES TO CONSOLIDATED FINANCIAL STATEMENTS (unaudited)
The following is a summary of the inputs used to value the Fund’s holdings at June 30, 2015:
| | | | | | | | |
| Classification(a) | | LEVEL 1
(Quoted Prices) | | | LEVEL 2
(Other Significant
Observable Inputs) | |
Securities | | | | | | | | |
Common Stocks | | | | | | | | |
Consumer Discretionary | | $ | 11,208,262,287 | | | $ | — | |
Consumer Staples | | | 2,175,811,048 | | | | — | |
Energy | | | 4,097,997,526 | | | | — | |
Financials | | | 16,500,594,208 | | | | — | |
Health Care | | | 8,899,706,122 | | | | — | |
Industrials | | | 5,399,419,067 | | | | — | |
Information Technology | | | 9,993,986,124 | | | | — | |
Materials | | | 3,262,333,686 | | | | — | |
Telecommunication Services | | | 4,362,855,674 | | | | — | |
Preferred Stocks | | | | | | | | |
Energy | | | 1,010,536,848 | | | | — | |
Financials | | | 1,022,496,263 | | | | — | |
Information Technology | | | 521,685,318 | | | | — | |
Short-term Investments | | | | | | | | |
Money Market Fund | | | 69,878,118 | | | | — | |
Repurchase Agreement | | | — | | | | 1,195,140,000 | |
| | | | | | | | |
Total Securities | | $ | 68,525,562,289 | | | $ | 1,195,140,000 | |
| | | | | | | | |
| | |
Other Financial Instruments | | | | | | | | |
Forward Currency Contracts | | $ | — | | | $ | 15,355,957 | (b) |
| | | | | | | | | |
| (a) | Transfers during the period between Level 1 and Level 2 relate to the use of systematic fair valuation (see Note 1). On days when systematic fair valuation is used, securities whose primary market closes before the NYSE are classified as Level 2. There were no Level 3 securities at June 30, 2015 and December 31, 2014, and there were no transfers to Level 3 during the period. |
| (b) | Represents net unrealized appreciation/(depreciation). |
NOTE 3—ADDITIONAL DERIVATIVES INFORMATION
The Fund has entered into over-the-counter derivatives, such as forward currency contracts (each, a “Derivative”). Each Derivative is subject to a negotiated master agreement (based on a form published by the International Swaps and Derivatives Association (“ISDA”)) governing all Derivatives between the Fund and the relevant dealer counterparty. The master agreements specify (i) events of default and other events permitting a party to terminate some or all of the Derivatives thereunder and (ii) the process by which those Derivatives will be valued for purposes of determining termination payments. If some or all of the Derivatives under a master agreement are terminated because of an event of default or similar event, the values of all terminated Derivatives must be netted to determine a single payment owed by one party to the other. Some master agreements contain collateral terms requiring the parties to post collateral in respect of some or all of the Derivatives thereunder based on the net market value of those Derivatives, subject to a minimum exposure threshold. To the
extent amounts owed to the Fund by its counterparties are not collateralized, the Fund is at risk of those counterparties’ non-performance. The Fund attempts to mitigate counterparty credit risk by entering into Derivatives only with counterparties it believes to be of good credit quality and by monitoring the financial stability of those counterparties.
For financial reporting purposes, the Fund does not offset financial assets and liabilities that are subject to an ISDA Master Agreement in the Consolidated Statement of Assets and Liabilities. The net amount for Derivatives is disclosed on the Consolidated Portfolio of Investments. At June 30, 2015, no collateral is pledged or held by the Fund for Derivatives.
NOTE 4—RELATED PARTY TRANSACTIONS
Management fees Under a written agreement approved by a unanimous vote of the Board of Trustees, the Fund pays an annual management fee of 0.60% of the Fund’s average daily net assets to Dodge & Cox, investment manager of the Fund.
Fund officers and trustees All officers and two of the trustees of the Trust are officers or employees of Dodge & Cox. The Trust pays a fee only to those trustees who are not affiliated with Dodge & Cox.
NOTE 5—INCOME TAX INFORMATION AND DISTRIBUTIONS TO SHAREHOLDERS
A provision for federal income taxes is not required since the Fund intends to continue to qualify as a regulated investment company under Subchapter M of the Internal Revenue Code and distribute all of its taxable income to shareholders. Distributions are determined in accordance with income tax regulations, and such amounts may differ from net investment income and realized gains for financial reporting purposes. Financial reporting records are adjusted for permanent book/tax differences at year end to reflect tax character.
Book/tax differences are primarily due to differing treatments of wash sales, net short-term realized gain (loss), investments in passive foreign investment companies, foreign capital gain taxes, and foreign currency realized gain (loss). At June 30, 2015, the cost of investments for federal income tax purposes was $63,707,991,362.
Distributions during the periods noted below were characterized as follows for federal income tax purposes.
| | | | | | | | |
| | | Six Months Ended
June 30, 2015 | | | Year Ended
December 31, 2014 | |
Ordinary income | | | — | | | | $1,440,251,048 | |
| | | | | | | ($0.970 per share) | |
| | |
Long-term capital gain | | | — | | | | — | |
DODGE & COX INTERNATIONAL STOCK FUND §PAGE 13
NOTES TO CONSOLIDATED FINANCIAL STATEMENTS (unaudited)
At June 30, 2015, the tax basis components of distributable earnings were as follows:
| | | | |
Unrealized appreciation | | $ | 11,716,026,154 | |
Unrealized depreciation | | | (5,703,315,227 | ) |
| | | | |
Net unrealized appreciation | | | 6,012,710,927 | |
Undistributed ordinary income | | | 987,994,455 | |
Accumulated capital gain(a) | | | 282,505,832 | |
Capital loss carryforward(b) | | | (3,199,564,411 | ) |
| (a) | Represents capital gain realized for tax purposes during the period from January 1, 2015 to June 30, 2015. |
| (b) | Represents accumulated capital loss as of December 31, 2014, which may be carried forward to offset future capital gains. During 2014, the Fund utilized $2,145,426,224 of the capital loss carryforward. If not utilized, the remaining capital loss carryforward will expire as follows: |
| | | | |
Expiring in 2017 | | $ | 2,079,444,182 | |
Expiring in 2018 | | | 1,120,120,229 | |
| | | | |
| | $ | 3,199,564,411 | |
| | | | |
Under the Regulated Investment Company Modernization Act of 2010, capital losses incurred by the Fund after January 1, 2011, are not subject to expiration. In addition, such losses must be utilized prior to the losses incurred in the years preceding enactment.
Fund management has reviewed the tax positions for open periods (three years and four years, respectively, from filing the Fund’s Federal and State tax returns) as applicable to the Fund, and has determined that no provision for income tax is required in the Fund’s financial statements.
NOTE 6—LOAN FACILITIES
Pursuant to an exemptive order issued by the Securities and Exchange Commission (SEC), the Fund may participate in an interfund lending facility (Facility). The Facility allows the Fund to borrow money from or loan money to the Funds. Loans under the Facility are made for temporary or emergency purposes, such as to fund shareholder redemption requests. Interest on borrowings is the average of the current repurchase agreement rate and the bank loan rate. There was no activity in the Facility during the period.
All Funds in the Trust participate in a $500 million committed credit facility (Line of Credit) with State Street Bank and Trust Company, to be utilized for temporary or emergency purposes to fund shareholder redemptions or for other short-term liquidity purposes. The maximum amount available to the Fund is $250 million. Each Fund pays an annual commitment fee on its pro-rata portion of the Line of Credit. The Fund’s commitment fee for the six months ended June 30, 2015, amounted to $103,908 and is reflected as a Miscellaneous Expense in the Consolidated Statement of Operations. Interest on borrowings is charged at the prevailing rate. There were no borrowings on the Line of Credit during the period.
NOTE 7—PURCHASES AND SALES OF INVESTMENTS
For the six months ended June 30, 2015, purchases and sales of securities, other than short-term securities, aggregated $8,903,278,544 and $4,791,521,717 respectively.
NOTE 8—ACCOUNTING PRONOUNCEMENTS
In June 2014, the Financial Accounting Standards Board issued Accounting Standards Update (ASU) No. 2014-11, Transfers and Servicing (Topic 860), Repurchase-to-Maturity Transactions, Repurchase Financings, and Disclosures. The ASU changes the accounting for certain repurchase agreements and expands disclosure requirements related to repurchase agreements and similar transactions. There was no impact to these financial statements as a result of applying this ASU.
NOTE 9—SUBSEQUENT EVENTS
Fund management has determined that no material events or transactions occurred subsequent to June 30, 2015, and through the date of the Fund’s financial statements issuance, which require additional disclosure in the Fund’s financial statements.
PAGE 14 § DODGE & COX INTERNATIONAL STOCK FUND
NOTES TO CONSOLIDATED FINANCIAL STATEMENTS (unaudited)
NOTE 10—HOLDINGS OF 5% VOTING SECURITIES
Each of the companies listed below was considered to be an affiliate of the Fund because the Fund owned 5% or more of the company’s voting securities during all or part of the six months ended June 30, 2015. Purchase and sale transactions and dividend income earned during the period on these securities were as follows:
| | | | | | | | | | | | | | | | | | | | | | | | |
| | | Shares at
Beginning of Period | | | Additions | | | Reductions | | | Shares at
End of Period | | | Dividend
Income(a) | | | Value at
End of Period | |
AEGON NV (Netherlands) | | | 125,227,471 | | | | 2,276,863 | | | | — | | | | 127,504,334 | | | | 16,565,339 | | | | 937,040,620 | |
Anadolu Efes Biracilik ve Malt Sanayii AS (Turkey) | | | 28,262,444 | | | | 3,507,766 | | | | — | | | | 31,770,210 | | | | 4,579,929 | | | | 286,869,550 | |
BR Malls Participacoes SA (Brazil) | | | 54,870,300 | | | | — | | | | — | | | | 54,870,300 | | | | 8,160,027 | | | | 256,959,110 | |
Brother Industries, Ltd. (Japan) | | | 18,185,100 | | | | — | | | | (4,260,700 | ) | | | 13,924,400 | | | | 1,682,895 | | | | 197,286,511 | |
Hang Lung Group, Ltd. (Hong Kong) | | | 90,430,600 | | | | 20,093,700 | | | | — | | | | 110,524,300 | | | | 8,758,610 | | | | 486,209,678 | |
Infineon Technologies AG (Germany) | | | 66,414,456 | | | | — | | | | — | | | | 66,414,456 | | | | 13,631,230 | | | | 824,088,884 | |
Kasikornbank PCL—Foreign (Thailand) | | | 123,826,527 | | | | 13,056,500 | | | | — | | | | 136,883,027 | | | | 12,769,287 | | | | 765,966,221 | |
Kyocera Corp. (Japan) | | | 20,248,000 | | | | — | | | | — | | | | 20,248,000 | | | | 9,180,068 | | | | 1,052,727,246 | |
Lafarge SA (France) | | | 20,035,291 | | | | — | | | | — | | | | 20,035,291 | | | | 24,427,989 | | | | 1,323,204,522 | |
Lanxess AG (Germany) | | | 4,539,680 | | | | 462,000 | | | | — | | | | 5,001,680 | | | | 2,419,062 | | | | 294,921,030 | |
Millicom International Cellular SA SDR (Luxembourg) | | | 10,088,392 | | | | — | | | | — | | | | 10,088,392 | | | | 22,755,923 | | | | 744,169,280 | |
New Oriental Education & Technology Group, Inc. ADR (Cayman Islands/China) | | | 5,733,700 | | | | 3,099,829 | | | | — | | | | 8,833,529 | | | | — | (b) | | | 216,598,131 | |
NGK Spark Plug Co., Ltd. (Japan) | | | 14,009,700 | | | | 1,118,700 | | | | (3,008,400 | ) | | | 12,120,000 | | | | 1,496,336 | | | | 336,212,771 | |
Saipem SPA (Italy) | | | 35,889,000 | | | | 10,976,200 | | | | — | | | | 46,865,200 | | | | — | (b) | | | 495,046,467 | |
Smiths Group PLC (United Kingdom) | | | 26,840,600 | | | | 7,085,600 | | | | — | | | | 33,926,200 | | | | 6,369,220 | | | | 601,830,817 | |
Television Broadcasts, Ltd. (Hong Kong) | | | 40,022,900 | | | | — | | | | — | | | | 40,022,900 | | | | 22,201,098 | | | | 237,249,615 | |
Yamaha Motor Co., Ltd. (Japan) | | | 31,550,100 | | | | — | | | | — | | | | 31,550,100 | | | | 6,218,327 | | | | 690,114,129 | |
Yapi ve Kredi Bankasi AS (Turkey) | | | 234,711,168 | | | | 4,650,000 | | | | (34,984,300 | ) | | | 204,376,868 | | | | 6,004,776 | | | | — | (c) |
| | | | | | | | | | | | | | | | | | | | | | | | |
| | | | | | | | | | | | | | | | | | $ | 167,220,116 | | | $ | 9,746,494,582 | |
| | | | | | | | | | | | | | | | | | | | | | | | |
| | | | | | | | | | | | | | | | | | | | | | | | | |
| (a) | Net of foreign taxes, if any |
| (c) | Company was not an affiliate at period end |
DODGE & COX INTERNATIONAL STOCK FUND §PAGE 15
CONSOLIDATED FINANCIAL HIGHLIGHTS (unaudited)
| | | | | | | | | | | | | | | | | | | | | | | | |
SELECTED DATA AND RATIOS (for a share outstanding throughout each period) | | Six Months Ended June 30, | | | Year Ended December 31, | |
| | | 2015(a) | | | 2014 | | | 2013 | | | 2012 | | | 2011 | | | 2010 | |
| | | | | | | | |
Net asset value, beginning of period | | | $42.11 | | | | $43.04 | | | | $34.64 | | | | $29.24 | | | | $35.71 | | | | $31.85 | |
Income from investment operations: | | | | | | | | | | | | | | | | | | | | | | | | |
Net investment income | | | 0.61 | | | | 0.98 | | | | 0.70 | | | | 0.76 | | | | 0.78 | | | | 0.51 | |
Net realized and unrealized gain (loss) | | | 1.03 | | | | (0.94 | ) | | | 8.40 | | | | 5.39 | | | | (6.49 | ) | | | 3.85 | |
| | | | | | | | |
Total from investment operations | | | 1.64 | | | | 0.04 | | | | 9.10 | | | | 6.15 | | | | (5.71 | ) | | | 4.36 | |
| | | | | | | | |
Distributions to shareholders from: | | | | | | | | | | | | | | | | | | | | | | | | |
Net investment income | | | — | | | | (0.97 | ) | | | (0.70 | ) | | | (0.75 | ) | | | (0.76 | ) | | | (0.50 | ) |
Net realized gain | | | — | | | | — | | | | — | | | | — | | | | — | | | | — | |
| | | | | | | | |
Total distributions | | | — | | | | (0.97 | ) | | | (0.70 | ) | | | (0.75 | ) | | | (0.76 | ) | | | (0.50 | ) |
| | | | | | | | |
Net asset value, end of period | | | $43.75 | | | | $42.11 | | | | $43.04 | | | | $34.64 | | | | $29.24 | | | | $35.71 | |
| | | | | | | | |
Total return | | | 3.89 | % | | | 0.07 | % | | | 26.31 | % | | | 21.03 | % | | | (15.97 | )% | | | 13.69 | % |
Ratios/supplemental data: | | | | | | | | | | | | | | | | | | | | | | | | |
Net assets, end of period (millions) | | | $69,668 | | | | $64,040 | | | | $53,616 | | | | $40,556 | | | | $35,924 | | | | $43,406 | |
Ratio of expenses to average net assets | | | 0.64 | %(b) | | | 0.64 | % | | | 0.64 | % | | | 0.64 | % | | | 0.64 | % | | | 0.65 | % |
Ratio of net investment income to average net assets | | | 2.85 | %(b) | | | 2.39 | % | | | 1.85 | % | | | 2.31 | % | | | 2.23 | % | | | 1.58 | % |
Portfolio turnover rate | | | 7 | % | | | 12 | % | | | 13 | % | | | 10 | % | | | 16 | % | | | 15 | % |
See accompanying Notes to Consolidated Financial Statements
PAGE 16 § DODGE & COX INTERNATIONAL STOCK FUND
FUND HOLDINGS
The Fund provides a complete list of its holdings four times each fiscal year, as of the end of each quarter. The Fund files the lists with the Securities and Exchange Commission (SEC) on Form N-CSR (second and fourth quarters) and Form N-Q (first and third quarters). Shareholders may view the Fund’s Forms N-CSR and N-Q on the SEC’s website at sec.gov. Forms N-CSR and N-Q may also be reviewed and copied at the SEC’s Public Reference Room in Washington, DC. Information regarding the operations of the Public Reference Room may be obtained by calling 202-942-8090 (direct) or 800-732-0330 (general SEC number). A list of the Fund’s quarter-end holdings is also available at dodgeandcox.com on or about 15 days following each quarter end and remains available on the website until the list is updated in the subsequent quarter.
PROXY VOTING
For a free copy of the Fund’s proxy voting policies and procedures, please call 800-621-3979, visit the Fund’s website at dodgeandcox.com, or visit the SEC’s website at sec.gov. Information regarding how the Fund voted proxies relating to portfolio securities during the most recent 12-month period ending June 30 is also available at dodgeandcox.com or at sec.gov.
HOUSEHOLD MAILINGS
The Fund routinely mails shareholder reports and summary prospectuses to shareholders and, on occasion, proxy statements. In order to reduce the volume of mail, when possible, only one copy of these documents will be sent to shareholders who are part of the same family and share the same residential address.
If you have a direct account with the Funds and you do not want the mailing of shareholder reports and summary prospectuses combined with other members in your household, contact the Funds at 800-621-3979. Your request will be implemented within 30 days.
DODGE & COX INTERNATIONAL STOCK FUND §PAGE 17
THIS PAGE INTENTIONALLY LEFT BLANK
PAGE 18 § DODGE & COX INTERNATIONAL STOCK FUND
TRUSTEES AND EXECUTIVE OFFICERS
Charles F. Pohl, Chairman and Trustee
Chairman, Dodge & Cox
Dana M. Emery, President and Trustee
Chief Executive Officer and President, Dodge & Cox
Thomas A. Larsen, Independent Trustee
Senior Counsel, Arnold & Porter LLP
Ann Mather, Independent Trustee
Former Executive Vice President, Chief Financial Officer, and Company Secretary, Pixar Studios
Robert B. Morris III, Independent Trustee
Advisory Director, The Presidio Group
Gary Roughead, Independent Trustee
Annenberg Distinguished Visiting Fellow, Hoover Institution; and former U.S. Navy Chief of Naval Operations
Mark E. Smith, Independent Trustee
Former Executive Vice President and Managing Director-Fixed Income, Loomis Sayles & Company, L.P.
John B. Taylor, Independent Trustee
Professor of Economics, Stanford University; Senior Fellow, Hoover Institute; and former Under Secretary for International Affairs, United States Treasury
John A. Gunn, Senior Vice President
Former Chairman and Chief Executive Officer, Dodge & Cox
Diana S. Strandberg, Senior Vice President
Senior Vice President and Director of International Equity, Dodge & Cox
David H. Longhurst, Treasurer
Vice President and Assistant Treasurer, Dodge & Cox
Thomas M. Mistele, Secretary
Chief Operating Officer, Secretary, and Senior Counsel, Dodge & Cox
Katherine M. Primas, Chief Compliance Officer
Chief Compliance Officer, Dodge & Cox
Additional information about the Trust’s Trustees and Officers is available in the Trust’s Statement of Additional Information (SAI). You can get a free copy of the SAI by visiting the Funds’ website at dodgeandcox.com or calling 800-621-3979.
DODGE & COX INTERNATIONAL STOCK FUND §PAGE 19
dodgeandcox.com
For Fund literature, transactions, and account information, please visit the Funds’ website.
or write or call:
DODGE & COX FUNDS
c/o Boston Financial Data Services
P.O. Box 8422
Boston, Massachusetts 02266-8422
(800) 621-3979
INVESTMENT MANAGER
Dodge & Cox
555 California Street, 40th Floor
San Francisco, California 94104
(415) 981-1710
This report is submitted for the general information of the shareholders of the Fund. The report is not authorized for distribution to prospective investors in the Fund unless it is accompanied by a current prospectus.
This report reflects our views, opinions, and portfolio holdings as of June 30, 2015, the end of the reporting period. Any such views are subject to change at any time based upon market or other conditions and Dodge & Cox disclaims any responsibility to update such views. These views may not be relied on as investment advice and, because investment decisions for a Dodge & Cox Fund are based on numerous factors, may not be relied on as an indication of trading intent on behalf of any Dodge & Cox Fund.
DODGE & COX FUNDS®
Semi-Annual Report
June 30, 2015
Balanced Fund
ESTABLISHED 1931
TICKER: DODBX
6/15 BF SAR Printed on recycled paper
TO OUR SHAREHOLDERS
The Dodge & Cox Balanced Fund had a total return of 1.1% for the six months ending June 30, 2015, compared to 0.8% for the Combined Index(a) (a 60/40 blend of stocks and fixed income securities). On June 30, the Fund’s net assets of $15.4 billion were invested in 72.0% equities(b), 26.5% fixed income securities, and 1.5% net cash.
MARKET COMMENTARY
U.S. equity markets appreciated modestly during the first half of 2015: the S&P 500 rose to a record high in May before retreating to end the period up slightly. After moderating in the first quarter, U.S. economic activity expanded in recent months: labor market conditions improved, household spending grew, and the housing sector reached multi-year highs in existing home sales and building permits. However, these positive developments were tempered by concerns about Greece’s sovereign debt crisis and potential exit from the Eurozone.
The U.S. investment-grade bond market delivered a small negative return for the first half of 2015, the result of rising interest rates and increasing credit yield premiums.(c) U.S. Treasury rates were influenced by a growing expectation that the Federal Reserve (Fed) could increase short-term rates soon, as well as broader-based improvement in U.S. economic activity. Investment-grade corporate bonds returned –0.9%(d) year to date, underperforming comparable-duration(e) Treasuries by 0.6 percentage points in an environment of heavy new issuance, much of it related to M&A financing. Agency-guaranteed(f) mortgage-backed securities (MBS) returned 0.3% for the period with relative performance versus comparable-duration Treasuries varying by coupon.
INVESTMENT STRATEGY
We set the Fund’s asset allocation based on our long-term outlook for the Fund’s equity and fixed income holdings, which currently favors equities. We increased the allocation to equities by 3.3 percentage points during the first half of the year (including a 2.0% increase in the allocation to preferred stocks) due to reasonable equity valuations and concerns about the total returns prospects for fixed income.
Equity Strategy
As long-term investors, we look beyond readily available short-term information and consider ourselves part-owners of companies in which we invest. Our global industry analysts thoroughly research each company and evaluate its financial staying power. As part of our analysis, we assess the strength and depth of management teams and attempt to identify potential risks to their business models and our financial projections.
Each investment opportunity is valued on its potential to generate future earnings and cash flow. Importantly, the company’s executive management team—not shareholders—ultimately determines how cash from operations is deployed (e.g., dividends, share repurchases, debt reduction, capital expenditures, acquisitions). As a result, we incorporate each company’s capital allocation track record and plans into our bottom-up research process.
Accelerating Merger & Acquisition (M&A) Activity
The volume of M&A transactions has grown significantly since 2013, due to an improved lending environment, moderating earnings growth, and strong cash positions. A number of holdings in the equity portfolio are involved in pending transactions, including Baker Hughes, BB&T, Danaher, FedEx, General Electric, Pfizer, and Time Warner Cable.
M&A activity may affect the portfolio, even when it does not involve portfolio holdings. For example, within the Health Care sector (17.3% of the equity portfolio(g)), industry dynamics are driving increased consolidation in the Heath Care Providers and Services industry (Health Care Services).
Health Care Services
Concentration among pharmacy benefit managers (PBMs) has created economies of scale in negotiating drug prices, which helps lower treatment costs. Most recently, UnitedHealth’s OptumRx announced plans to acquire Catamaran. If the deal is successful, the three largest PBMs (Express Scripts, CVS, and OptumRx) will manage over 75% of all prescriptions in the United States, compared to only 44% in 2007. One company that should benefit from further industry consolidation is Express Scripts(h) (the equity portfolio’s largest Health Care Services holding).
Express Scripts
Over the past decade, Express Scripts has benefited significantly from three industry trends: increased generic penetration, mail order pharmacy growth, and industry consolidation. Past rounds of mergers—CVS/Caremark, Express Scripts/Medco Health Solutions (Medco), and SXC Health Solutions/Catalyst Health—created an oligopolistic market structure where the top three players now control over 65% of industry volumes. Following its merger with Medco in 2012, Express Scripts became the largest PBM in the United States. The company now generates over $100 billion in annual revenue and manages 1.3 billion claims, or 30% of all U.S. prescription claims. Today, the company operates three vertically integrated businesses: a basic pharmacy benefit manager, a mail order pharmacy, and a specialty pharmacy. Express Scripts has achieved measurable growth by providing patients with generic drugs. With multiple equivalent treatments available, the company has used its buying power to save money for customers and generate profits; its mission is well aligned with customers looking to reduce health care and pharmacy cost trends. This strategy has boosted generic drug penetration to high levels.
The upcoming challenge for Express Scripts is in specialty drugs, which are used to treat chronic, complex diseases, including cancer, hepatitis, and multiple sclerosis. In the United States, this segment accounts for only 1% of volume, yet 25 to 30% of all drug spending. Biotech companies have maintained pricing power in this segment as disease complexity necessitates innovative and unique therapies. However, at over ten times the price of the average prescription, a need exists to manage the costs of these drugs, which we view as an attractive long-term growth opportunity. Express Scripts, with 30% market share in specialty
PAGE 2 § DODGE & COX BALANCED FUND
drugs, is well positioned to help patients receive needed treatments cost effectively. Given the emergence of biosimilars and substitute treatments for older biotech drugs, Express Scripts’ strategy has the potential to influence prices in this segment.
During the second quarter, we increased the Fund’s position in Express Scripts after weighing the company’s fundamental outlook against its valuation. We believe Express Scripts’ strong business franchise, significant scale advantage, financial stability, growth opportunities, and reasonable valuation at 15.5 times forward earnings present an attractive investment opportunity. On June 30, Express Scripts was a 2.4% position in the equity portfolio.
Fixed Income Strategy
The fixed income portfolio’s current positioning features substantial weightings in corporate bonds and Agency MBS, and smaller weightings in government-related securities and asset-backed securities (ABS). One notable area of portfolio adjustment has been in corporate and government-related credit. Over the past nine months we have added seven new credit issuers to the portfolio and increased several existing holdings, while reducing exposure to less compelling holdings. The net result has been a three percentage point increase to the fixed income portfolio’s credit weighting.
One area of recent focus has been the energy sector, which has experienced volatility since last fall’s plunge in oil prices. These efforts yielded new positions in Kinder Morgan and TransCanada. As midstream energy companies, both issuers are relatively insulated from the first-order effects of lower oil prices because their revenue streams are predominantly fee based. Yet valuations for the entire energy sector declined substantially last fall; at these lower prices, we were able to invest in what we believe are dominant business franchises poised to benefit from growth trends in energy infrastructure in North America.
Another area of focus has been the new issue market—particularly debt issued in connection with M&A activity. The pace of investment-grade new issuance has been unrelenting, topping $700 billion year to date; much of the new debt has financed strategic transactions. In our view, these transactions can offer an attractive entry point to invest in an issuer immediately after a leveraging event, particularly when the industrial logic for the business combination appears sound, and there is a credible path to reducing leverage over our investment horizon. We have participated in a number of these types of new issues this year, including Actavis Plc (now Allergan) and CRH Plc. In each case, we were attracted by the acquisition rationale, resulting business position, ability to generate cash flow for debt repayment, sources of financial flexibility, and compelling relative valuations.
The Fund’s Agency MBS position, currently 35% of the fixed income portfolio, has remained relatively stable in aggregate, although underlying composition has shifted over time. Timing and predictability of MBS cash flows drive total return over time, particularly for the shorter-duration instruments in which we invest. We seek to mitigate these risks by investing in MBS with structures and/or characteristics likely to be more stable over time. For example, we have a substantial position in 15- to 20-year MBS; these securities’ cash flows have been more predictable compared to their 30-year counterparts because prepayment risk declines when loan balances decline relatively quickly and associated
refinancing savings decrease. In addition, we have sought to invest in MBS where the underlying mortgage loans appear to be less sensitive to prepayment risk due to less efficient servicing of those loans.
Finally, we have continued to position the fixed income portfolio defensively with respect to interest rate risk, with a duration that is 72% of the Barclays Agg’s duration. This positioning reflects our view that interest rates are likely to rise at a rate that exceeds current market expectations over the next several years, with a corresponding negative impact on the pricing of fixed income securities.
IN CLOSING
Despite trading above their long-term average, U.S. equity market valuations remain reasonable in our opinion: the S&P 500 traded at 17.5 times forward estimated earnings with a 2.1% dividend yield at June 30. Given higher starting valuations, we continue to have a more tempered outlook for long-term equity returns. Corporate balance sheets and cash flows continue to be strong. Over our three- to five-year investment horizon, we continue to believe the Fund’s equity portfolio is well positioned to benefit from long-term global growth opportunities.
Despite recent increases, bond market yields remain very low relative to longer-term history. Given these low starting yields and the potential for interest rates to rise, we expect bond market returns to be quite modest and possibly negative in the near term. Nevertheless, the fixed income portfolio continues to provide an important source of diversification, liquidity, income, and downside protection to the Fund.
Thank you for your continued confidence in our firm. As always, we welcome your comments and questions.
For the Board of Trustees,
| | |
| |
|
Charles F. Pohl, Chairman | | Dana M. Emery, President |
July 31, 2015
| (a) | | The Combined Index reflects an unmanaged portfolio (rebalanced monthly) of 60% of the S&P 500 Index, which is a market capitalization-weighted index of 500 large capitalization stocks commonly used to represent the U.S. equity market, and 40% of the Barclays U.S. Aggregate Bond Index (Barclays U.S. Agg), which is a widely recognized, unmanaged index of U.S. dollar-denominated, investment-grade, taxable fixed income securities. |
| (b) | | The Fund’s equity portfolio includes a 68.0% weighting in common stocks and a 4.0% weighting in preferred stocks. |
| (c) | | Yield premiums are one way to measure a security’s valuation. Narrowing yield premiums results in a higher valuation. Widening yield premiums results in a lower valuation. |
| (d) | | Sector returns as calculated and reported by Barclays. |
| (e) | | Duration is a measure of a bond’s (or a bond portfolio’s) price sensitivity to changes in interest rates. |
| (f) | | The U.S. Government does not guarantee the Fund’s shares, yield, or net asset value. The agency guarantee (by, for example, Ginnie Mae, Fannie Mae, or Freddie Mac) does not eliminate market risk. |
| (g) | | Unless otherwise specified, all weightings and characteristics are as of June 30, 2015. |
| (h) | | The use of specific examples does not imply that they are more attractive investments than the Fund’s other holdings. |
DODGE & COX BALANCED FUND §PAGE 3
YEAR-TO-DATE PERFORMANCE REVIEW
The Fund outperformed the Combined Index by 0.3 percentage points year to date. The Fund’s higher allocation to equities had a positive impact on relative results.
EQUITY PORTFOLIO
| | § | | Returns from holdings in the Financials sector (up 5% compared to flat for the S&P 500 sector) contributed to results. Charles Schwab (up 9%) and Capital One (up 8%) were particularly strong. | |
| | § | | The portfolio’s average overweight position (18% versus 15%) and holdings in the Health Care sector (up 11% compared to up 10% for the S&P 500 sector) aided performance. | |
| | § | | The portfolio’s average overweight position (24% versus 20%) and holdings in the Information Technology sector (down 6% compared to up 1% for the S&P 500) hurt returns. Hewlett-Packard (down 24%), NetApp (down 23%), and EMC (down 10%) performed poorly. | |
| | § | | Returns from holdings in the Consumer Discretionary sector (up 3% compared to up 7% for the S&P 500 sector) detracted from results. Twenty-First Century Fox (down 15%) was particularly weak. | |
FIXED INCOME PORTFOLIO
| | § | | The portfolio’s shorter relative duration (approximately 72% of the Barclays U.S. Agg’s duration) added to relative returns, as did its lower exposure to long-term bonds. | |
| | § | | Many of the portfolio’s non-U.S. domiciled and/or lower-rated credit holdings performed well, including Cemex, Dillard’s, Petrobras, Rio Oil Finance Trust, and Telecom Italia. | |
| | § | | The portfolio’s overweight to corporate bonds (44% versus 23% for the Barclays U.S. Agg) detracted from relative returns. | |
| | § | | Though issue-specific performance was positive as a whole, certain credit holdings underperformed, including AT&T, Kinder Morgan, and Time Warner. | |
| | | | Unless otherwise noted, figures cited in this section denote portfolio positioning at the beginning of the period. | |
KEY CHARACTERISTICS OF DODGE & COX
Independent Organization
Dodge & Cox is one of the largest privately owned investment managers in the world. We remain committed to independence, with a goal of providing the highest quality investment management service to our existing clients.
Over 80 Years of Investment Experience
Dodge & Cox was founded in 1930. We have a stable and well-qualified team of investment professionals, most of whom have spent their entire careers at Dodge & Cox.
Experienced Investment Team
The Investment Policy Committee, which is the decision-making body for the equity portion of the Balanced Fund, is a nine-member committee with an average tenure at Dodge & Cox of 27 years. The Fixed Income Investment Policy Committee, which is the decision-making body for the Fixed Income portion of the Balanced Fund, is an eight-member committee with an average tenure of 20 years.
One Business with a Single Research Office
Dodge & Cox manages equity (domestic, international, and global), fixed income (domestic and global), and balanced investments, operating from one office in San Francisco.
Consistent Investment Approach
Our team decision-making process involves thorough, bottom-up fundamental analysis of each investment.
Long-Term Focus and Low Expenses
We invest with a three- to five-year investment horizon, which has historically resulted in low turnover relative to our peers. We manage Funds that maintain low expense ratios.
Risks: The Fund is subject to market risk, meaning holdings in the Fund may decline in value for extended periods due to the financial prospects of individual companies or due to general market and economic conditions. The Fund also invests in individual bonds whose yields and market values fluctuate, so that an investment may be worth more or less than its original cost. Debt securities are subject to interest rate risk, credit risk, and prepayment and call risk, all of which could have adverse effects on the value of the Fund. A low interest rate environment creates an elevated risk of future negative returns. Financial intermediaries may restrict their market making activities for certain debt securities, which may reduce the liquidity and increase the volatility of such securities. Please read the prospectus and summary prospectus for specific details regarding the Fund’s risk profile.
PAGE 4 § DODGE & COX BALANCED FUND
GROWTH OF $10,000 OVER 10 YEARS
FOR AN INVESTMENT MADE ON JUNE 30, 2005
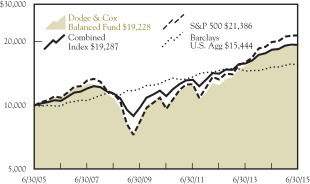
AVERAGE ANNUAL TOTAL RETURN
FOR PERIODS ENDED JUNE 30, 2015
| | | | | | | | | | | | | | | | |
| | | 1 Year | | | 5 Years | | | 10 Years | | | 20 Years | |
| | | | | | | | | | | | | | | | |
Dodge & Cox Balanced Fund | | | 3.59 | % | | | 14.09 | % | | | 6.76 | % | | | 9.51 | % |
Combined Index(a) | | | 5.29 | | | | 11.77 | | | | 6.79 | | | | 7.91 | |
S&P 500 | | | 7.43 | | | | 17.35 | | | | 7.90 | | | | 8.91 | |
Barclays U.S. Aggregate Bond Index (Barclays U.S. Agg) | | | 1.85 | | | | 3.36 | | | | 4.44 | | | | 5.63 | |
Returns represent past performance and do not guarantee future results. Investment return and share price will fluctuate with market conditions, and investors may have a gain or loss when shares are sold. Fund performance changes over time and currently may be significantly lower than stated. Performance is updated and published monthly. Visit the Fund’s website at dodgeandcox.com or call 800-621-3979 for current performance figures.
The Fund’s total returns include the reinvestment of dividend and capital gain distributions, but have not been adjusted for any income taxes payable by shareholders on these distributions or on Fund share redemptions. Index returns include dividends and/or interest income but, unlike Fund returns, do not reflect fees or expenses.
Standard & Poor’s, Standard & Poor’s 500, and S&P 500® are trademarks of McGraw Hill Financial. Barclays® is a trademark of Barclays Bank PLC.
| (a) | The Combined Index reflects an unmanaged portfolio (rebalanced monthly) of 60% of the S&P 500 Index, which is a market capitalization-weighted index of 500 large-capitalization stocks commonly used to represent the U.S. equity market, and 40% of the Barclays U.S. Aggregate Bond Index (Barclays U.S. Agg), which is a widely recognized, unmanaged index of U.S. dollar-denominated, investment-grade, taxable fixed income securities. The Fund may, however, invest up to 75% of its total assets in equity securities. |
FUND EXPENSE EXAMPLE
As a Fund shareholder, you incur ongoing Fund costs, including management fees and other Fund expenses. All mutual funds have ongoing costs, sometimes referred to as operating expenses. The following example shows ongoing costs of investing in the Fund and can help you understand these costs and compare them with those of other mutual funds. The example assumes a $1,000 investment held for the six months indicated.
ACTUAL EXPENSES
The first line of the table below provides information about actual account values and expenses based on the Fund’s actual returns. You may use the information in this line, together with your account balance, to estimate the expenses that you paid over the period. Simply divide your account value by $1,000 (for example, an $8,600 account value divided by $1,000 = 8.6), then multiply the result by the number in the first line under the heading “Expenses Paid During Period” to estimate the expenses you paid on your account during this period.
HYPOTHETICAL EXAMPLE FOR COMPARISON WITH OTHER MUTUAL FUNDS
Information on the second line of the table can help you compare ongoing costs of investing in the Fund with those of other mutual funds. This information may not be used to estimate the actual ending account balance or expenses you paid during the period. The hypothetical “Ending Account Value” is based on the actual expense ratio of the Fund and an assumed 5% annual rate of return before expenses (not the Fund’s actual return). The amount under the heading “Expense Paid During the Period” shows the hypothetical expenses your account would have incurred under this scenario. You can compare this figure with the 5% hypothetical examples that appear in shareholder reports of other mutual funds.
| | | | | | | | | | | | |
Six Months Ended
June 30, 2015 | | Beginning Account Value
1/1/2015 | | | Ending Account Value
6/30/2015 | | | Expenses Paid
During Period* | |
Based on Actual Fund Return | | $ | 1,000.00 | | | $ | 1,011.00 | | | $ | 2.66 | |
Based on Hypothetical 5% Yearly Return | | | 1,000.00 | | | | 1,022.15 | | | | 2.68 | |
| * | | Expenses are equal to the Fund’s annualized expense ratio of 0.53%, multiplied by the average account value over the period, multiplied by 181/365 (to reflect the one-half year period). |
The expenses shown in the table highlight ongoing costs only and do not reflect any transactional fees or account maintenance fees. Though other mutual funds may charge such fees, please note that the Fund does not charge transaction fees (e.g., redemption fees, sales loads) or universal account maintenance fees (e.g., small account fees).
DODGE & COX BALANCED FUND §PAGE 5
| | | | |
| FUND INFORMATION | | | June 30, 2015 | |
| | | | |
| GENERAL INFORMATION | | | |
Net Asset Value Per Share | | | $101.79 | |
Total Net Assets (billions) | | | $15.4 | |
Expense Ratio | | | 0.53% | |
Portfolio Turnover Rate (1/1/15 to 6/30/15, unannualized) | | | 11% | |
30-Day SEC Yield(a) | | | 1.87% | |
Fund Inception | | | 1931 | |
No sales charges or distribution fees | | | | |
Investment Manager: Dodge & Cox, San Francisco. Managed by the Investment Policy Committee, whose nine members’ average tenure at Dodge & Cox is 27 years, and by the Fixed Income Investment Policy Committee, whose eight members’ average tenure is 20 years.
| | | | |
| EQUITY PORTFOLIO (72.0%) | | Fund | |
Number of Common Stocks | | | 63 | |
Number of Preferred Stocks | | | 4 | |
Median Market Capitalization (billions)(b) | | | $48 | |
Price-to-Earnings Ratio(b)(c) | | | 14.9x | |
Foreign Securities not in the S&P 500(d) | | | 7.0% | |
| | | | | | | | | | | | |
SECTOR DIVERSIFICATION (%)
(FIVE LARGEST) | | Common | | | Preferred | | | Total | |
Financials | | | 17.3 | | | | 3.6 | | | | 20.9 | |
Information Technology | | | 15.5 | | | | — | | | | 15.5 | |
Health Care | | | 12.5 | | | | — | | | | 12.5 | |
Consumer Discretionary | | | 10.2 | | | | 0.4 | | | | 10.6 | |
Energy | | | 6.0 | | | | — | | | | 6.0 | |
| | | | | | | | | | | | |
TEN LARGEST EQUITY
SECURITIES (%)(e) | | Common | | | Preferred | | | Total | |
Wells Fargo & Co. | | | 2.8 | | | | 1.5 | | | | 4.3 | |
JPMorgan Chase & Co. | | | 1.3 | | | | 1.7 | | | | 3.0 | |
Capital One Financial Corp. | | | 2.8 | | | | — | | | | 2.8 | |
Hewlett-Packard Co. | | | 2.6 | | | | — | | | | 2.6 | |
Microsoft Corp. | | | 2.5 | | | | — | | | | 2.5 | |
Time Warner Cable, Inc. | | | 2.3 | | | | — | | | | 2.3 | |
Novartis AG (Switzerland) | | | 2.2 | | | | — | | | | 2.2 | |
Charles Schwab Corp. | | | 2.2 | | | | — | | | | 2.2 | |
Time Warner, Inc. | | | 2.2 | | | | — | | | | 2.2 | |
Bank of America Corp. | | | 2.0 | | | | — | | | | 2.0 | |
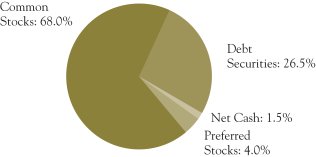
| | | | |
| FIXED INCOME PORTFOLIO (26.5%) | | Fund | |
Number of Debt Securities | | | 314 | |
Effective Duration (years) | | | 4.1 | |
| | | | |
| SECTOR DIVERSIFICATION (%) | | | |
U.S. Treasury(f) | | | 2.0 | |
Government-Related | | | 1.9 | |
Mortgage-Related(g) | | | 9.3 | |
Corporate | | | 11.6 | |
Asset-Backed | | | 1.7 | |
| | | | |
| CREDIT QUALITY (%)(h) | | | |
U.S. Treasury/Agency/GSE(f) | | | 11.4 | |
Aaa | | | 1.1 | |
Aa | | | 0.3 | |
A | | | 2.1 | |
Baa | | | 8.4 | |
Ba | | | 2.4 | |
B | | | 0.8 | |
| | | | |
| FIVE LARGEST CORPORATE ISSUERS (%)(e) | | | |
Bank of America Corp. | | | 0.5 | |
Telecom Italia SPA | | | 0.5 | |
Verizon Communications, Inc. | | | 0.5 | |
Cox Enterprises, Inc. | | | 0.5 | |
Kinder Morgan, Inc. | | | 0.4 | |
| (a) | SEC Yield is an annualization of the Fund’s total net investment income per share for the 30-day period ended on the last day of the month. |
| (b) | Excludes the Fund’s preferred stock positions. |
| (c) | Price-to-earnings (P/E) ratio is calculated using 12-month forward earnings estimates from third-party sources. |
| (d) | Foreign stocks are U.S. dollar denominated. |
| (e) | The Fund’s portfolio holdings are subject to change without notice. The mention of specific securities is not a recommendation to buy, sell, or hold any particular security and is not indicative of Dodge & Cox’s current or future trading activity. |
| (f) | Data as presented excludes the Fund’s position in Treasury futures contracts. |
| (g) | The fixed income portfolio holds 0.3% in Agency multifamily mortgage securities; the Index classifies these securities under CMBS – Agency. |
| (h) | The credit quality distribution shown for the Fund is based on the middle of Moody’s, S&P’s, and Fitch ratings, which is the methodology used by Barclays in constructing its indices. If a security is rated by only two agencies, the lower of the two ratings is used. Please note the Fund applies the highest of Moody’s, S&P’s, and Fitch ratings to determine compliance with the quality requirements stated in its prospectus. The credit quality of the investments in the portfolio does not apply to the stability or safety of the Fund or its shares. |
PAGE 6 § DODGE & COX BALANCED FUND
| | | | |
| PORTFOLIO OF INVESTMENTS (unaudited) | | | June 30, 2015 | |
| | | | | | | | |
| COMMON STOCKS: 68.0% | | | | |
| | |
| | | SHARES | | | VALUE | |
| CONSUMER DISCRETIONARY: 10.2% | | | | | |
CONSUMER DURABLES & APPAREL: 0.4% | | | | | |
Coach, Inc. | | | 1,715,036 | | | $ | 59,357,396 | |
| | |
MEDIA: 8.0% | | | | | | | | |
Comcast Corp., Class A | | | 4,784,774 | | | | 287,756,308 | |
DISH Network Corp., Class A(a) | | | 1,195,032 | | | | 80,915,617 | |
News Corp., Class A(a) | | | 688,050 | | | | 10,038,650 | |
Time Warner Cable, Inc. | | | 2,000,883 | | | | 356,497,324 | |
Time Warner, Inc. | | | 3,817,066 | | | | 333,649,739 | |
Time, Inc. | | | 96,825 | | | | 2,227,943 | |
Twenty-First Century Fox, Inc. | | | 4,832,200 | | | | 157,263,949 | |
| | | | | | | | |
| | | | | | | 1,228,349,530 | |
RETAILING: 1.8% | | | | | | | | |
CarMax, Inc.(a) | | | 34,966 | | | | 2,315,099 | |
Liberty Interactive Corp. QVC Group,
Series A(a) | | | 2,309,650 | | | | 64,092,787 | |
Target Corp. | | | 1,685,900 | | | | 137,620,017 | |
The Priceline Group, Inc.(a) | | | 71,000 | | | | 81,747,270 | |
| | | | | | | | |
| | | | | | | 285,775,173 | |
| | | | | | | | |
| | | | | | | 1,573,482,099 | |
| CONSUMER STAPLES: 1.5% | | | | | | | | |
FOOD & STAPLES RETAILING: 1.5% | | | | | | | | |
Wal-Mart Stores, Inc. | | | 3,201,900 | | | | 227,110,767 | |
| | |
| ENERGY: 6.0% | | | | | | | | |
Apache Corp. | | | 3,245,317 | | | | 187,027,619 | |
Baker Hughes, Inc. | | | 2,837,579 | | | | 175,078,624 | |
Chevron Corp. | | | 1,171,579 | | | | 113,022,226 | |
National Oilwell Varco, Inc. | | | 2,068,620 | | | | 99,872,974 | |
Schlumberger, Ltd.(b) (Curacao/United States) | | | 3,329,021 | | | | 286,928,320 | |
Weatherford International PLC(a),(b) (Ireland) | | | 4,600,000 | | | | 56,442,000 | |
| | | | | | | | |
| | | | | | | 918,371,763 | |
| FINANCIALS: 17.3% | | | | | | | | |
BANKS: 7.3% | | | | | | | | |
Bank of America Corp. | | | 18,207,100 | | | | 309,884,842 | |
BB&T Corp. | | | 2,839,584 | | | | 114,463,631 | |
JPMorgan Chase & Co. | | | 2,929,900 | | | | 198,530,024 | |
SunTrust Banks, Inc. | | | 1,534,490 | | | | 66,013,760 | |
Wells Fargo & Co. | | | 7,548,506 | | | | 424,527,977 | |
| | | | | | | | |
| | | | | | | 1,113,420,234 | |
DIVERSIFIED FINANCIALS: 8.3% | | | | | | | | |
Bank of New York Mellon Corp. | | | 6,143,635 | | | | 257,848,361 | |
Capital One Financial Corp. | | | 4,962,659 | | | | 436,565,112 | |
Charles Schwab Corp. | | | 10,229,900 | | | | 334,006,235 | |
Goldman Sachs Group, Inc. | | | 1,197,000 | | | | 249,921,630 | |
| | | | | | | | |
| | | | | | | 1,278,341,338 | |
INSURANCE: 1.7% | | | | | | | | |
AEGON NV(b) (Netherlands) | | | 11,822,277 | | | | 87,484,850 | |
MetLife, Inc. | | | 3,180,000 | | | | 178,048,200 | |
| | | | | | | | |
| | | | | | | 265,533,050 | |
| | | | | | | | |
| | | | | | | 2,657,294,622 | |
| HEALTH CARE: 12.5% | | | | | | | | |
HEALTH CARE EQUIPMENT & SERVICES: 4.5% | | | | | |
Cigna Corp. | | | 976,216 | | | | 158,146,992 | |
Express Scripts Holding Co.(a) | | | 2,990,168 | | | | 265,945,542 | |
Medtronic PLC(b) (Ireland) | | | 720,200 | | | | 53,366,820 | |
UnitedHealth Group, Inc. | | | 1,690,762 | | | | 206,272,964 | |
| | | | | | | | |
| | | | | | | 683,732,318 | |
PHARMACEUTICALS, BIOTECHNOLOGY & LIFE SCIENCES: 8.0% | |
GlaxoSmithKline PLC ADR(b)
(United Kingdom) | | | 930,050 | | | | 38,736,583 | |
Merck & Co., Inc. | | | 2,583,175 | | | | 147,060,153 | |
Novartis AG ADR(b) (Switzerland) | | | 3,464,900 | | | | 340,738,266 | |
| | | | | | | | |
| | |
| | | SHARES | | | VALUE | |
Pfizer, Inc. | | | 5,028,417 | | | $ | 168,602,822 | |
Roche Holding AG ADR(b) (Switzerland) | | | 7,350,000 | | | | 257,764,500 | |
Sanofi ADR(b) (France) | | | 5,685,165 | | | | 281,586,222 | |
| | | | | | | | |
| | | | | | | 1,234,488,546 | |
| | | | | | | | |
| | | | | | | 1,918,220,864 | |
| INDUSTRIALS: 3.8% | | | | | | | | |
CAPITAL GOODS: 1.4% | | | | | | | | |
Danaher Corp. | | | 1,111,200 | | | | 95,107,608 | |
General Electric Co. | | | 3,649,500 | | | | 96,967,215 | |
Koninklijke Philips NV(b) (Netherlands) | | | 369,707 | | | | 9,412,740 | |
NOW, Inc.(a) | | | 370,000 | | | | 7,366,700 | |
| | | | | | | | |
| | | | | | | 208,854,263 | |
COMMERCIAL & PROFESSIONAL SERVICES: 1.0% | | | | | |
ADT Corp. | | | 2,017,717 | | | | 67,734,760 | |
Tyco International PLC(b) (Ireland) | | | 2,365,434 | | | | 91,021,900 | |
| | | | | | | | |
| | | | | | | 158,756,660 | |
TRANSPORTATION: 1.4% | | | | | | | | |
FedEx Corp. | | | 1,262,254 | | | | 215,088,082 | |
| | | | | | | | |
| | | | | | | 582,699,005 | |
| INFORMATION TECHNOLOGY: 15.5% | | | | | |
SEMICONDUCTORS & SEMICONDUCTOR EQUIPMENT: 0.7% | |
Maxim Integrated Products, Inc. | | | 3,031,891 | | | | 104,827,631 | |
| | |
SOFTWARE & SERVICES: 7.4% | | | | | | | | |
Cadence Design Systems, Inc.(a) | | | 1,170,700 | | | | 23,015,962 | |
eBay, Inc.(a) | | | 2,603,331 | | | | 156,824,659 | |
Google, Inc., Class A(a) | | | 138,000 | | | | 74,525,520 | |
Google, Inc., Class C(a) | | | 326,895 | | | | 170,152,117 | |
Microsoft Corp. | | | 8,724,900 | | | | 385,204,335 | |
Symantec Corp. | | | 9,534,000 | | | | 221,665,500 | |
Synopsys, Inc.(a) | | | 2,193,100 | | | | 111,080,515 | |
| | | | | | | | |
| | | | | | | 1,142,468,608 | |
TECHNOLOGY, HARDWARE & EQUIPMENT: 7.4% | | | | | |
Cisco Systems, Inc. | | | 4,801,100 | | | | 131,838,206 | |
Corning, Inc. | | | 4,871,700 | | | | 96,118,641 | |
EMC Corp. | | | 7,650,000 | | | | 201,883,500 | |
Hewlett-Packard Co. | | | 13,217,512 | | | | 396,657,535 | |
Juniper Networks, Inc. | | | 2,303,830 | | | | 59,830,465 | |
NetApp, Inc. | | | 3,857,187 | | | | 121,732,822 | |
TE Connectivity, Ltd.(b) (Switzerland) | | | 2,080,536 | | | | 133,778,465 | |
| | | | | | | | |
| | | | | | | 1,141,839,634 | |
| | | | | | | | |
| | | | | | | 2,389,135,873 | |
| MATERIALS: 0.7% | | | | | | | | |
Celanese Corp., Series A | | | 1,475,760 | | | | 106,077,629 | |
|
| TELECOMMUNICATION SERVICES: 0.5% | |
Sprint Corp.(a) | | | 18,357,072 | | | | 83,708,248 | |
| | | | | | | | |
TOTAL COMMON STOCKS
(Cost $6,987,180,481) | | | | | | $ | 10,456,100,870 | |
| | |
| PREFERRED STOCKS: 4.0% | | | | | | |
| CONSUMER DISCRETIONARY: 0.4% | | | | | |
MEDIA: 0.4% | | | | | | | | |
NBCUniversal Enterprise, Inc. 5.25%(d) | | | 53,210 | | | | 56,602,138 | |
| | |
| FINANCIALS: 3.6% | | | | | | | | |
BANKS: 3.6% | | | | | | | | |
Citigroup, Inc. 5.95% | | | | | | | | |
7/29/49 | | | 5,175 | | | | 5,097,375 | |
12/31/49 | | | 60,975 | | | | 58,840,875 | |
JPMorgan Chase & Co. 6.10% | | | 254,565 | | | | 255,455,977 | |
Wells Fargo & Co. 5.875% | | | 227,645 | | | | 233,062,951 | |
| | | | | | | | |
| | | | | | | 552,457,178 | |
| | | | | | | | |
TOTAL PREFERRED STOCKS
(Cost $601,634,856) | | | | | | $ | 609,059,316 | |
| | |
| See accompanying Notes to Financial Statements | | DODGE & COX BALANCED FUND §PAGE 7 |
| | | | |
| PORTFOLIO OF INVESTMENTS (unaudited) | | | June 30, 2015 | |
| | | | | | | | |
| DEBT SECURITIES: 26.5% | | | | | | |
| | |
| | | PAR VALUE | | | VALUE | |
| U.S. TREASURY: 2.0% | | | | | | | | |
U.S. Treasury Note | | | | | | | | |
0.50%, 1/31/17 | | $ | 20,000,000 | | | $ | 19,985,940 | |
0.50%, 3/31/17 | | | 37,000,000 | | | | 36,945,092 | |
0.50%, 7/31/17 | | | 18,060,000 | | | | 17,992,275 | |
0.875%, 1/15/18 | | | 148,000,000 | | | | 147,976,912 | |
1.00%, 3/15/18 | | | 48,500,000 | | | | 48,587,154 | |
1.625%, 7/31/19 | | | 40,000,000 | | | | 40,318,760 | |
| | | | | | | | |
| | | | | | | 311,806,133 | |
| GOVERNMENT-RELATED: 1.9% | | | | | | | | |
FEDERAL AGENCY: 0.1% | | | | | | | | |
Small Business Admin. — 504 Program | | | | | | | | |
Series 1996-20L 1, 6.70%, 12/1/16 | | | 119,987 | | | | 123,564 | |
Series 1997-20F 1, 7.20%, 6/1/17 | | | 226,704 | | | | 235,464 | |
Series 1997-20I 1, 6.90%, 9/1/17 | | | 331,398 | | | | 346,337 | |
Series 1998-20D 1, 6.15%, 4/1/18 | | | 326,497 | | | | 347,045 | |
Series 1998-20I 1, 6.00%, 9/1/18 | | | 313,102 | | | | 331,608 | |
Series 1999-20F 1, 6.80%, 6/1/19 | | | 298,274 | | | | 320,539 | |
Series 2000-20D 1, 7.47%, 4/1/20 | | | 1,180,599 | | | | 1,276,526 | |
Series 2000-20E 1, 8.03%, 5/1/20 | | | 339,038 | | | | 368,574 | |
Series 2000-20G 1, 7.39%, 7/1/20 | | | 491,664 | | | | 531,158 | |
Series 2000-20I 1, 7.21%, 9/1/20 | | | 337,209 | | | | 363,753 | |
Series 2001-20E 1, 6.34%, 5/1/21 | | | 1,075,561 | | | | 1,170,925 | |
Series 2001-20G 1, 6.625%, 7/1/21 | | | 1,061,016 | | | | 1,160,481 | |
Series 2003-20J 1, 4.92%, 10/1/23 | | | 3,867,668 | | | | 4,176,601 | |
Series 2007-20F 1, 5.71%, 6/1/27 | | | 4,215,015 | | | | 4,691,860 | |
| | | | | | | | |
| | | | | | | 15,444,435 | |
FOREIGN AGENCY: 0.6% | | | | | | | | |
Petroleo Brasileiro SA(b) (Brazil) | | | | | | | | |
4.375%, 5/20/23 | | | 29,800,000 | | | | 25,976,660 | |
6.25%, 3/17/24 | | | 4,225,000 | | | | 4,079,111 | |
Petroleos Mexicanos(b) (Mexico) | | | | | | | | |
4.25%, 1/15/25(d) | | | 22,685,000 | | | | 22,092,921 | |
6.625%, 6/15/35 | | | 9,425,000 | | | | 10,061,188 | |
6.375%, 1/23/45 | | | 17,125,000 | | | | 17,661,012 | |
5.625%, 1/23/46(d) | | | 16,675,000 | | | | 15,569,448 | |
| | | | | | | | |
| | | | | | | 95,440,340 | |
LOCAL AUTHORITY: 1.1% | | | | | | | | |
New Jersey Turnpike Authority RB | | | | | | | | |
7.414%, 1/1/40 | | | 3,350,000 | | | | 4,685,846 | |
7.102%, 1/1/41 | | | 12,436,000 | | | | 16,831,256 | |
State of California GO | | | | | | | | |
7.50%, 4/1/34 | | | 13,470,000 | | | | 18,717,373 | |
7.55%, 4/1/39 | | | 16,525,000 | | | | 23,888,044 | |
7.30%, 10/1/39 | | | 13,730,000 | | | | 19,419,987 | |
7.625%, 3/1/40 | | | 8,790,000 | | | | 12,874,098 | |
State of Illinois GO | | | | | | | | |
4.961%, 3/1/16 | | | 3,215,000 | | | | 3,290,617 | |
5.365%, 3/1/17 | | | 37,215,000 | | | | 38,843,156 | |
5.665%, 3/1/18 | | | 26,160,000 | | | | 27,989,630 | |
| | | | | | | | |
| | | | | | | 166,540,007 | |
SOVEREIGN: 0.1% | | | | | | | | |
Spain Government International(b) (Spain) 4.00%, 3/6/18(d) | | | 11,850,000 | | | | 12,527,322 | |
| | | | | | | | |
| | | | | | | 289,952,104 | |
| MORTGAGE-RELATED: 9.3% | | | | | | | | |
FEDERAL AGENCY CMO & REMIC: 2.4% | | | | | |
Dept. of Veterans Affairs | | | | | | | | |
Series 1995-1 1, 7.235%, 2/15/25 | | | 418,011 | | | | 475,147 | |
Series 1995-2C 3A, 8.793%, 6/15/25 | | | 198,873 | | | | 244,749 | |
Series 2002-1 2J, 6.50%, 8/15/31 | | | 11,600,424 | | | | 13,306,405 | |
Fannie Mae | | | | | | | | |
Trust 2002-33 A1, 7.00%, 6/25/32 | | | 2,214,351 | | | | 2,531,924 | |
Trust 2009-66 ET, 6.00%, 5/25/39 | | | 6,025,572 | | | | 6,544,066 | |
| | | | | | | | |
| | |
| | | PAR VALUE | | | VALUE | |
Trust 2009-30 AG, 6.50%, 5/25/39 | | $ | 3,712,055 | | | $ | 4,047,866 | |
Trust 2001-T7 A1, 7.50%, 2/25/41 | | | 1,845,474 | | | | 2,173,928 | |
Trust 2001-T5 A3, 7.50%, 6/19/41 | | | 717,037 | | | | 837,141 | |
Trust 2001-T8 A1, 7.50%, 7/25/41 | | | 1,809,697 | | | | 2,039,688 | |
Trust 2001-T4 A1, 7.50%, 7/25/41 | | | 1,818,972 | | | | 2,180,322 | |
Trust 2001-W3 A, 6.792%, 9/25/41 | | | 1,317,810 | | | | 1,499,235 | |
Trust 2001-T10 A2, 7.50%, 12/25/41 | | | 1,596,330 | | | | 1,859,888 | |
Trust 2013-106 MA, 4.00%, 2/25/42 | | | 12,561,565 | | | | 13,548,966 | |
Trust 2002-W6 2A1, 6.383%, 6/25/42 | | | 1,847,404 | | | | 2,110,646 | |
Trust 2002-W8 A2, 7.00%, 6/25/42 | | | 2,331,937 | | | | 2,679,960 | |
Trust 2003-W2 1A1, 6.50%, 7/25/42 | | | 3,712,587 | | | | 4,247,794 | |
Trust 2003-W2 1A2, 7.00%, 7/25/42 | | | 1,429,115 | | | | 1,662,545 | |
Trust 2003-W4 4A, 6.997%, 10/25/42 | | | 2,015,419 | | | | 2,309,460 | |
Trust 2012-121 NB, 7.00%, 11/25/42 | | | 3,573,409 | | | | 4,180,828 | |
Trust 2012-134 FK, 0.537%, 12/25/42 | | | 16,031,643 | | | | 15,959,741 | |
Trust 2013-15 FA, 0.537%, 3/25/43 | | | 22,060,096 | | | | 22,156,564 | |
Trust 2013-98 FA, 0.737%, 9/25/43 | | | 11,217,327 | | | | 11,327,245 | |
Trust 2013-92 FA, 0.737%, 9/25/43 | | | 48,649,547 | | | | 49,083,014 | |
Trust 2004-T1 1A2, 6.50%, 1/25/44 | | | 2,383,253 | | | | 2,829,409 | |
Trust 2004-W2 5A, 7.50%, 3/25/44 | | | 4,865,448 | | | | 5,583,724 | |
Trust 2004-W8 3A, 7.50%, 6/25/44 | | | 800,711 | | | | 934,384 | |
Trust 2005-W4 1A2, 6.50%, 8/25/45 | | | 7,031,870 | | | | 7,926,183 | |
Trust 2009-11 MP, 7.00%, 3/25/49 | | | 8,326,369 | | | | 9,507,648 | |
Freddie Mac | | | | | | | | |
Series 1078 GZ, 6.50%, 5/15/21 | | | 183,621 | | | | 192,077 | |
Series 16 PK, 7.00%, 8/25/23 | | | 2,730,031 | | | | 3,053,401 | |
Series T-48 1A4, 5.538%, 7/25/33 | | | 33,508,322 | | | | 37,072,535 | |
Series 4240 FA, 0.686%, 8/15/43 | | | 10,365,440 | | | | 10,475,427 | |
Series 314 F2, 0.796%, 9/15/43 | | | 23,449,329 | | | | 23,815,414 | |
Series T-51 1A, 6.50%, 9/25/43 | | | 223,530 | | | | 265,294 | |
Series T-59 1A1, 6.50%, 10/25/43 | | | 11,975,268 | | | | 13,977,414 | |
Series 4281 BC, 5.378%, 12/15/43 | | | 76,760,905 | | | | 83,996,158 | |
| | | | | | | | |
| | | | | | | 366,636,190 | |
FEDERAL AGENCY MORTGAGE PASS-THROUGH: 6.9% | |
Fannie Mae, 15 Year | | | | | | | | |
4.00%, 2/1/27-5/1/27 | | | 83,856,197 | | | | 89,599,729 | |
4.50%, 1/1/25-1/1/27 | | | 22,138,104 | | | | 23,751,469 | |
6.00%, 7/1/16-3/1/22 | | | 4,146,778 | | | | 4,304,093 | |
6.50%, 9/1/16-11/1/18 | | | 4,088,343 | | | | 4,221,352 | |
7.00%, 11/1/18 | | | 273,527 | | | | 282,376 | |
7.50%, 9/1/15-8/1/17 | | | 461,097 | | | | 470,004 | |
Fannie Mae, 20 Year | | | | | | | | |
4.00%, 11/1/30-12/1/34 | | | 217,397,984 | | | | 232,389,942 | |
4.50%, 1/1/31-5/1/32 | | | 70,771,923 | | | | 76,775,500 | |
Fannie Mae, 30 Year | | | | | | | | |
4.50%, 1/1/39-9/1/41 | | | 31,372,564 | | | | 34,162,592 | |
5.50%, 7/1/33-8/1/37 | | | 21,233,811 | | | | 23,921,501 | |
6.00%, 9/1/36-8/1/37 | | | 27,155,828 | | | | 31,119,136 | |
6.50%, 12/1/28-8/1/39 | | | 31,529,170 | | | | 36,412,672 | |
7.00%, 4/1/37-8/1/37 | | | 10,356,601 | | | | 12,155,956 | |
Fannie Mae, Hybrid ARM | | | | | | | | |
1.915%, 1/1/35 | | | 3,789,061 | | | | 3,978,288 | |
1.959%, 12/1/34 | | | 2,678,363 | | | | 2,831,647 | |
2.114%, 8/1/35 | | | 2,268,123 | | | | 2,404,821 | |
2.138%, 9/1/34 | | | 1,924,694 | | | | 2,057,166 | |
2.20%, 1/1/35 | | | 1,629,656 | | | | 1,734,087 | |
2.332%, 8/1/38 | | | 5,159,937 | | | | 5,509,230 | |
2.532%, 11/1/43 | | | 10,759,684 | | | | 11,177,979 | |
2.701%, 4/1/44 | | | 22,679,222 | | | | 23,587,980 | |
2.828%, 12/1/44 | | | 21,520,979 | | | | 22,163,103 | |
2.848%, 11/1/44 | | | 38,026,154 | | | | 39,191,390 | |
3.276%, 6/1/41 | | | 20,667,824 | | | | 21,884,026 | |
3.585%, 12/1/40 | | | 7,248,893 | | | | 7,603,466 | |
3.708%, 11/1/40 | | | 3,373,194 | | | | 3,547,022 | |
4.252%, 7/1/39 | | | 3,490,215 | | | | 3,719,504 | |
5.543%, 5/1/37 | | | 1,955,264 | | | | 2,087,049 | |
6.35%, 9/1/36 | | | 422,137 | | | | 441,878 | |
| | |
| PAGE 8 § DODGE & COX BALANCED FUND | | See accompanying Notes to Financial Statements |
| | | | |
| PORTFOLIO OF INVESTMENTS (unaudited) | | | June 30, 2015 | |
| | | | | | | | |
| DEBT SECURITIES (continued) | | | | | | |
| | |
| | | PAR VALUE | | | VALUE | |
Fannie Mae, Multifamily DUS
Pool 462086, 5.355%, 11/1/15 | | $ | 11,207,875 | | | $ | 11,297,361 | |
Freddie Mac, Hybrid ARM | | | | | | | | |
2.216%, 4/1/37 | | | 2,903,589 | | | | 3,082,786 | |
2.279%, 9/1/37 | | | 1,557,095 | | | | 1,660,878 | |
2.479%, 10/1/38 | | | 3,169,517 | | | | 3,373,304 | |
2.628%, 8/1/42 | | | 15,625,403 | | | | 16,193,938 | |
2.679%, 5/1/34 | | | 3,307,907 | | | | 3,548,469 | |
2.691%, 2/1/38 | | | 7,728,663 | | | | 8,383,553 | |
2.921%, 5/1/44 | | | 3,349,649 | | | | 3,456,300 | |
2.971%, 5/1/44 | | | 27,256,238 | | | | 28,262,530 | |
2.974%, 6/1/44 | | | 6,757,463 | | | | 6,984,258 | |
3.185%, 6/1/44 | | | 10,571,838 | | | | 11,078,843 | |
3.588%, 10/1/41 | | | 2,433,161 | | | | 2,535,795 | |
5.316%, 10/1/35 | | | 3,911,636 | | | | 4,144,625 | |
5.877%, 7/1/38 | | | 597,468 | | | | 637,554 | |
6.10%, 1/1/38 | | | 821,293 | | | | 880,592 | |
Freddie Mac Gold, 15 Year | | | | | | | | |
4.00%, 3/1/25-11/1/26 | | | 55,786,332 | | | | 59,434,203 | |
4.50%, 9/1/24-9/1/26 | | | 15,572,371 | | | | 16,636,711 | |
6.00%, 2/1/18 | | | 522,355 | | | | 539,006 | |
6.50%, 5/1/16-9/1/18 | | | 1,846,751 | | | | 1,898,027 | |
Freddie Mac Gold, 20 Year | | | | | | | | |
4.50%, 4/1/31-6/1/31 | | | 15,586,822 | | | | 16,915,808 | |
6.50%, 10/1/26 | | | 5,867,217 | | | | 6,784,939 | |
Freddie Mac Gold, 30 Year | | | | | | | | |
4.50%, 9/1/41-1/1/44 | | | 96,591,067 | | | | 104,467,504 | |
5.50%, 12/1/37 | | | 1,311,916 | | | | 1,478,284 | |
6.00%, 2/1/39 | | | 3,368,372 | | | | 3,831,943 | |
6.50%, 12/1/32-4/1/33 | | | 8,842,037 | | | | 10,190,674 | |
7.00%, 11/1/37-9/1/38 | | | 8,647,186 | | | | 10,008,809 | |
7.47%, 3/17/23 | | | 122,877 | | | | 137,862 | |
7.75%, 7/25/21 | | | 381,029 | | | | 423,766 | |
Ginnie Mae, 30 Year | | | | | | | | |
7.50%, 11/15/24-10/15/25 | | | 1,054,908 | | | | 1,230,009 | |
7.97%, 4/15/20-1/15/21 | | | 485,494 | | | | 526,353 | |
| | | | | | | | |
| | | | | | | 1,063,509,642 | |
| | | | | | | | |
| | | | | | | 1,430,145,832 | |
| ASSET-BACKED: 1.7% | | | | | | | | |
AUTO LOAN: 0.2% | | | | | | | | |
Ford Credit Auto Owner Trust | | | | | | | | |
Series 2014-C A3, 1.06%, 5/15/19 | | | 23,000,000 | | | | 23,017,043 | |
Series 2015-1 A, 2.12%, 7/15/26(d) | | | 11,000,000 | | | | 10,996,480 | |
| | | | | | | | |
| | | | | | | 34,013,523 | |
CREDIT CARD: 0.7% | | | | | | | | |
American Express Master Trust
Series 2014-3 A, 1.49%, 4/15/20 | | | 16,025,000 | | | | 16,105,510 | |
Chase Issuance Trust | | | | | | | | |
Series 2012-A8 A8, 0.54%, 10/16/17 | | | 19,983,000 | | | | 19,985,478 | |
Series 2013-A8 A8, 1.01%, 10/15/18 | | | 14,000,000 | | | | 14,015,372 | |
Series 2014-A1 A1, 1.15%, 1/15/19 | | | 18,400,000 | | | | 18,436,690 | |
Series 2014-A6 A6, 1.26%, 7/15/19 | | | 6,500,000 | | | | 6,502,385 | |
Series 2014-A7 A7, 1.38%, 11/15/19 | | | 29,200,000 | | | | 29,254,253 | |
| | | | | | | | |
| | | | | | | 104,299,688 | |
OTHER: 0.5% | | | | | | | | |
Rio Oil Finance Trust(b) (Brazil) | | | | | | | | |
6.25%, 7/6/24(d) | | | 44,525,000 | | | | 43,745,813 | |
6.75%, 1/6/27(d) | | | 42,925,000 | | | | 41,637,250 | |
| | | | | | | | |
| | | | | | | 85,383,063 | |
| | | | | | | | |
| | |
| | | PAR VALUE | | | VALUE | |
STUDENT LOAN: 0.3% | | | | | | | | |
SLM Student Loan Trust (Private Loans) | | | | | | | | |
Series 2014-A A2A, 2.59%, 1/15/26(d) | | $ | 5,250,000 | | | $ | 5,330,598 | |
Series 2012-B A2, 3.48%, 10/15/30(d) | | | 9,725,000 | | | | 10,069,761 | |
Series 2012-E A2A, 2.09%, 6/15/45(d) | | | 13,775,000 | | | | 13,871,425 | |
Series 2012-C A2, 3.31%, 10/15/46(d) | | | 10,100,000 | | | | 10,467,276 | |
| | | | | | | | |
| | | | | | | 39,739,060 | |
| | | | | | | | |
| | | | | | | 263,435,334 | |
| CORPORATE: 11.6% | | | | | | | | |
FINANCIALS: 3.8% | | | | | | | | |
Anthem, Inc.
4.35%, 8/15/20 | | | 9,305,000 | | | | 10,060,287 | |
Bank of America Corp. | | | | | | | | |
5.30%, 3/15/17 | | | 19,000,000 | | | | 20,121,532 | |
7.625%, 6/1/19 | | | 6,800,000 | | | | 8,063,943 | |
5.625%, 7/1/20 | | | 5,030,000 | | | | 5,662,975 | |
4.20%, 8/26/24 | | | 5,825,000 | | | | 5,802,714 | |
6.625%, 5/23/36(c) | | | 37,275,000 | | | | 41,808,572 | |
Barclays PLC(b) (United Kingdom)
4.375%, 9/11/24 | | | 23,275,000 | | | | 22,322,261 | |
BNP Paribas SA(b) (France)
4.25%, 10/15/24 | | | 31,175,000 | | | | 30,866,149 | |
Boston Properties, Inc. | | | | | | | | |
5.625%, 11/15/20 | | | 3,850,000 | | | | 4,394,883 | |
3.85%, 2/1/23 | | | 7,800,000 | | | | 7,977,380 | |
3.125%, 9/1/23 | | | 17,550,000 | | | | 17,037,154 | |
3.80%, 2/1/24 | | | 11,175,000 | | | | 11,294,170 | |
Capital One Financial Corp.
3.50%, 6/15/23 | | | 42,579,000 | | | | 41,851,921 | |
Cigna Corp. | | | | | | | | |
7.65%, 3/1/23 | | | 9,705,000 | | | | 12,088,926 | |
7.875%, 5/15/27 | | | 21,888,000 | | | | 29,084,840 | |
8.30%, 1/15/33 | | | 8,845,000 | | | | 11,198,778 | |
Citigroup, Inc.
7.875%, 10/30/40(c) | | | 43,080,925 | | | | 44,735,233 | |
Equity Residential | | | | | | | | |
4.625%, 12/15/21 | | | 14,054,000 | | | | 15,318,228 | |
3.00%, 4/15/23 | | | 14,775,000 | | | | 14,304,490 | |
Health Net, Inc.
6.375%, 6/1/17 | | | 13,275,000 | | | | 14,038,312 | |
HSBC Holdings PLC(b) (United Kingdom) | | | | | | | | |
5.10%, 4/5/21 | | | 3,625,000 | | | | 4,036,865 | |
6.50%, 5/2/36 | | | 23,190,000 | | | | 27,499,792 | |
6.50%, 9/15/37 | | | 15,315,000 | | | | 18,426,227 | |
JPMorgan Chase & Co.
8.75%, 9/1/30(c) | | | 23,042,000 | | | | 32,392,674 | |
Lloyds Banking Group PLC(b) (United Kingdom)
4.50%, 11/4/24 | | | 11,550,000 | | | | 11,540,310 | |
Navient Corp. | | | | | | | | |
3.875%, 9/10/15 | | | 7,625,000 | | | | 7,634,531 | |
6.00%, 1/25/17 | | | 14,285,000 | | | | 14,856,400 | |
4.625%, 9/25/17 | | | 9,550,000 | | | | 9,705,188 | |
8.45%, 6/15/18 | | | 11,855,000 | | | | 13,174,461 | |
Royal Bank of Scotland Group PLC(b) (United Kingdom) | | | | | | | | |
6.125%, 12/15/22 | | | 48,416,000 | | | | 52,074,410 | |
6.00%, 12/19/23 | | | 3,250,000 | | | | 3,437,213 | |
Unum Group | | | | | | | | |
7.19%, 2/1/28 | | | 8,305,000 | | | | 9,885,832 | |
7.25%, 3/15/28 | | | 2,030,000 | | | | 2,497,379 | |
6.75%, 12/15/28 | | | 11,368,000 | | | | 13,778,630 | |
| | | | | | | | |
| | | | | | | 588,972,660 | |
| | |
| See accompanying Notes to Financial Statements | | DODGE & COX BALANCED FUND §PAGE 9 |
| | | | |
| PORTFOLIO OF INVESTMENTS (unaudited) | | | June 30, 2015 | |
| | | | | | | | |
| DEBT SECURITIES (continued) | | | | | | |
| | |
| | | PAR VALUE | | | VALUE | |
INDUSTRIALS: 7.4% | | | | | | | | |
Allergan PLC(b) (Ireland) | | | | | | | | |
3.00%, 3/12/20 | | $ | 19,550,000 | | | $ | 19,603,020 | |
3.80%, 3/15/25 | | | 10,870,000 | | | | 10,661,666 | |
AT&T, Inc. | | | | | | | | |
3.40%, 5/15/25 | | | 6,725,000 | | | | 6,385,219 | |
6.55%, 2/15/39 | | | 7,675,000 | | | | 8,791,751 | |
5.35%, 9/1/40 | | | 27,575,000 | | | | 27,061,360 | |
4.75%, 5/15/46 | | | 7,000,000 | | | | 6,337,142 | |
Becton, Dickinson and Co.
3.734%, 12/15/24 | | | 5,725,000 | | | | 5,697,234 | |
Burlington Northern Santa Fe LLC(f) | | | | | | | | |
8.251%, 1/15/21 | | | 664,906 | | | | 767,951 | |
3.85%, 9/1/23 | | | 2,150,000 | | | | 2,225,547 | |
5.72%, 1/15/24 | | | 9,043,583 | | | | 10,143,527 | |
5.342%, 4/1/24 | | | 9,422,120 | | | | 10,345,017 | |
5.629%, 4/1/24 | | | 14,263,983 | | | | 15,889,321 | |
Cemex SAB de CV(b) (Mexico) | | | | | | | | |
6.50%, 12/10/19(d) | | | 22,500,000 | | | | 23,618,250 | |
6.00%, 4/1/24(d) | | | 10,575,000 | | | | 10,466,078 | |
5.70%, 1/11/25(d) | | | 12,475,000 | | | | 11,897,408 | |
6.125%, 5/5/25(d) | | | 8,100,000 | | | | 7,992,270 | |
Cox Enterprises, Inc. | | | | | | | | |
3.25%, 12/15/22(d) | | | 15,740,000 | | | | 14,986,023 | |
2.95%, 6/30/23(d) | | | 37,166,000 | | | | 34,208,107 | |
3.85%, 2/1/25(d) | | | 19,625,000 | | | | 18,832,464 | |
CRH PLC(b) (Ireland)
3.875%, 5/18/25(d) | | | 17,100,000 | | | | 16,919,116 | |
CSX Corp.
9.75%, 6/15/20 | | | 5,231,000 | | | | 6,827,067 | |
Dillard’s, Inc. | | | | | | | | |
7.13%, 8/1/18 | | | 3,606,000 | | | | 4,065,765 | |
7.875%, 1/1/23 | | | 8,660,000 | | | | 10,283,750 | |
7.75%, 7/15/26 | | | 50,000 | | | | 57,875 | |
7.75%, 5/15/27 | | | 540,000 | | | | 625,050 | |
7.00%, 12/1/28 | | | 15,135,000 | | | | 16,724,175 | |
Dow Chemical Co. | | | | | | | | |
8.55%, 5/15/19 | | | 12,775,000 | | | | 15,565,379 | |
7.375%, 11/1/29 | | | 17,000,000 | | | | 21,391,950 | |
9.40%, 5/15/39 | | | 9,677,000 | | | | 14,523,880 | |
FedEx Corp. | | | | | | | | |
8.00%, 1/15/19 | | | 6,965,000 | | | | 8,320,723 | |
6.72%, 7/15/23 | | | 10,561,140 | | | | 12,211,846 | |
Ford Motor Credit Co. LLC(f) | | | | | | | | |
5.75%, 2/1/21 | | | 12,700,000 | | | | 14,239,138 | |
5.875%, 8/2/21 | | | 11,350,000 | | | | 12,908,355 | |
4.25%, 9/20/22 | | | 9,593,000 | | | | 9,978,811 | |
4.375%, 8/6/23 | | | 3,775,000 | | | | 3,929,986 | |
HCA Holdings, Inc.
6.50%, 2/15/16 | | | 43,180,000 | | | | 44,502,172 | |
Hewlett-Packard Co.
3.30%, 12/9/16 | | | 9,955,000 | | | | 10,217,434 | |
Kinder Morgan, Inc. | | | | | | | | |
4.30%, 6/1/25 | | | 36,515,000 | | | | 35,394,720 | |
5.50%, 3/1/44 | | | 30,530,000 | | | | 28,423,857 | |
Lafarge SA(b) (France) | | | | | | | | |
6.20%, 7/9/15(d) | | | 4,600,000 | | | | 4,597,930 | |
6.50%, 7/15/16 | | | 35,915,000 | | | | 37,620,963 | |
Macy’s, Inc. | | | | | | | | |
6.90%, 1/15/32 | | | 49,699,000 | | | | 61,273,798 | |
6.70%, 7/15/34 | | | 1,390,000 | | | | 1,688,162 | |
Naspers, Ltd.(b) (South Africa)
6.00%, 7/18/20(d) | | | 21,900,000 | | | | 23,745,075 | |
Norfolk Southern Corp.
9.75%, 6/15/20 | | | 7,224,000 | | | | 9,442,389 | |
| | | | | | | | |
| | |
| | | PAR VALUE | | | VALUE | |
Reed Elsevier PLC(b) (United Kingdom) | | | | | | | | |
8.625%, 1/15/19 | | $ | 4,901,000 | | | $ | 5,890,105 | |
3.125%, 10/15/22 | | | 22,133,000 | | | | 21,547,139 | |
Sprint Corp.
6.00%, 12/1/16 | | | 24,367,000 | | | | 25,250,304 | |
Telecom Italia SPA(b) (Italy) | | | | | | | | |
6.999%, 6/4/18 | | | 17,100,000 | | | | 18,830,520 | |
7.175%, 6/18/19 | | | 27,527,000 | | | | 30,933,466 | |
5.303%, 5/30/24(d) | | | 10,000,000 | | | | 9,962,500 | |
7.20%, 7/18/36 | | | 11,596,000 | | | | 12,668,630 | |
7.721%, 6/4/38 | | | 7,062,000 | | | | 7,944,750 | |
Time Warner Cable, Inc. | | | | | | | | |
8.75%, 2/14/19 | | | 13,840,000 | | | | 16,426,917 | |
8.25%, 4/1/19 | | | 33,815,000 | | | | 39,744,054 | |
Time Warner, Inc. | | | | | | | | |
7.625%, 4/15/31 | | | 31,348,000 | | | | 40,708,043 | |
7.70%, 5/1/32 | | | 14,374,000 | | | | 18,836,020 | |
TransCanada Corp.(b) (Canada)
5.625%, 5/20/75(c) | | | 15,000,000 | | | | 15,131,250 | |
Twenty-First Century Fox, Inc. | | | | | | | | |
6.15%, 3/1/37 | | | 15,000,000 | | | | 17,293,230 | |
6.65%, 11/15/37 | | | 1,638,000 | | | | 1,987,454 | |
Union Pacific Corp. | | | | | | | | |
5.866%, 7/2/30 | | | 26,813,526 | | | | 30,832,321 | |
6.176%, 1/2/31 | | | 9,502,340 | | | | 11,306,207 | |
Verizon Communications, Inc. | | | | | | | | |
4.15%, 3/15/24 | | | 12,750,000 | | | | 13,069,209 | |
4.272%, 1/15/36(d) | | | 11,847,000 | | | | 10,626,024 | |
6.55%, 9/15/43 | | | 38,476,000 | | | | 44,985,908 | |
Vulcan Materials Co.
7.50%, 6/15/21 | | | 20,340,000 | | | | 23,391,000 | |
Xerox Corp. | | | | | | | | |
6.35%, 5/15/18 | | | 28,585,000 | | | | 31,840,603 | |
4.50%, 5/15/21 | | | 19,161,000 | | | | 20,333,213 | |
| | | | | | | | |
| | | | | | | 1,140,927,588 | |
UTILITIES: 0.4% | | | | | | | | |
Dominion Resources, Inc.
5.75%, 10/1/54(c) | | | 21,175,000 | | | | 22,074,535 | |
Enel SPA(b) (Italy) | | | | | | | | |
6.80%, 9/15/37(d) | | | 18,700,000 | | | | 22,479,663 | |
6.00%, 10/7/39(d) | | | 8,550,000 | | | | 9,464,593 | |
| | | | | | | | |
| | | | | | | 54,018,791 | |
| | | | | | | | |
| | | | | | | 1,783,919,039 | |
| | | | | | | | |
TOTAL DEBT SECURITIES
(Cost $3,901,867,242) | | | | | | $ | 4,079,258,442 | |
| | |
| PAGE 10 § DODGE & COX BALANCED FUND | | See accompanying Notes to Financial Statements |
| | | | |
| PORTFOLIO OF INVESTMENTS (unaudited) | | | June 30, 2015 | |
| | | | | | | | |
| |
| SHORT-TERM INVESTMENTS: 1.3% | | | | |
| | |
| | | PAR VALUE | | | VALUE | |
MONEY MARKET FUND: 0.1% | | | | | |
SSgA U.S. Treasury Money Market Fund | | $ | 15,360,262 | | | $ | 15,360,262 | |
| |
REPURCHASE AGREEMENT: 1.2% | | | | | |
Fixed Income Clearing Corporation(e)
0.01%, dated 6/30/15, due 7/1/15,
maturity value $187,541,052 | | | 187,541,000 | | | | 187,541,000 | |
| | | | | | | | |
TOTAL SHORT-TERM INVESTMENTS
(Cost $202,901,262) | | | $ | 202,901,262 | |
| | | | | | | | |
TOTAL INVESTMENTS
(Cost $11,693,583,841) | | | 99.8 | % | | $ | 15,347,319,890 | |
OTHER ASSETS LESS LIABILITIES | | | 0.2 | % | | | 35,501,383 | |
| | | | | | | | |
| NET ASSETS | | | 100.0 | % | | $ | 15,382,821,273 | |
| | | | | | | | |
| (b) | Security denominated in U.S. dollars |
| (d) | Security exempt from registration under Rule 144A of the Securities Act of 1933. The security may be resold in transactions exempt from registration, normally to qualified institutional buyers. As of June 30, 2015, all such securities in total represented $462,705,933 or 3.1% of net assets. These securities have been deemed liquid by Dodge & Cox, investment manager, pursuant to procedures approved by the Fund’s Board of Trustees. |
| (e) | Repurchase agreement is collateralized by U.S. Treasury Note 1.75-2.125%, 8/31/21-2/28/22. Total collateral value is $191,293,881. |
| (f) | Subsidiary (see below) |
In determining a company’s country designation, the Fund generally references the country of incorporation. In cases where the Fund considers the country of incorporation to be a “jurisdiction of convenience” chosen primarily for tax purposes or in other limited circumstances, the Fund uses the country designation of an appropriate broad-based market index. In those cases, two countries are listed — the country of incorporation and the country designated by an appropriate index, respectively.
Debt securities are grouped by parent company unless otherwise noted. Actual securities may be issued by the listed parent company or one of its subsidiaries.
ADR: American Depositary Receipt
ARM: Adjustable Rate Mortgage
CMO: Collateralized Mortgage Obligation
DUS: Delegated Underwriting and Servicing
GO: General Obligation
RB: Revenue Bond
REMIC: Real Estate Mortgage Investment Conduit
FUTURES CONTRACTS
| | | | | | | | | | | | | | | | |
| Description | | Number of Contracts | | | Expiration Date | | | Notional Amount | | | Unrealized Appreciation/ (Depreciation) | |
10 Year U.S.
Treasury Note—
Short Position | | | 1,347 | | | | Sep 2015 | | | $ | (169,953,516 | ) | | $ | 638,705 | |
Long-Term U.S.
Treasury Bond—
Short Position | | | 878 | | | | Sep 2015 | | | | (135,266,875 | ) | | | 3,132,905 | |
| | | | | | | | | | | | | | | | |
| | | | | | | | | | | | | | $ | 3,771,610 | |
| | | | | | | | | | | | | | | | |
| | |
| See accompanying Notes to Financial Statements | | DODGE & COX BALANCED FUND §PAGE 11 |
| | | | |
STATEMENT OF ASSETS AND LIABILITIES
(unaudited) | |
| |
| | |
June 30, 2015 | |
ASSETS: | | | | |
Investments, at value (cost $11,693,583,841) | | $ | 15,347,319,890 | |
Cash held at broker | | | 5,151,167 | |
Receivable for investments sold | | | 24,841,223 | |
Receivable from broker for variation margin | | | 96,969 | |
Receivable for Fund shares sold | | | 6,375,833 | |
Dividends and interest receivable | | | 51,368,962 | |
Prepaid expenses and other assets | | | 61,968 | |
| | | | |
| | | 15,435,216,012 | |
| | | | |
LIABILITIES: | | | | |
Payable for investments purchased | | | 37,033,389 | |
Payable for Fund shares redeemed | | | 7,797,917 | |
Management fees payable | | | 6,411,515 | |
Accrued expenses | | | 1,151,918 | |
| | | | |
| | | 52,394,739 | |
| | | | |
NET ASSETS | | $ | 15,382,821,273 | |
| | | | |
NET ASSETS CONSIST OF: | | | | |
Paid in capital | | $ | 11,463,276,693 | |
Undistributed net investment income | | | 2,603,869 | |
Undistributed net realized gain | | | 259,433,052 | |
Net unrealized appreciation | | | 3,657,507,659 | |
| | | | |
| | $ | 15,382,821,273 | |
| | | | |
Fund shares outstanding (par value $0.01 each,
unlimited shares authorized) | | | 151,129,034 | |
Net asset value per share | | $ | 101.79 | |
|
STATEMENT OF OPERATIONS
(unaudited) | |
| | | Six Months Ended
June 30, 2015 | |
INVESTMENT INCOME: | | | | |
Dividends (net of foreign taxes of $3,724,034) | | $ | 112,334,693 | |
Interest | | | 93,452,373 | |
| | | | |
| | | 205,787,066 | |
| | | | |
EXPENSES: | | | | |
Management fees | �� | | 38,465,970 | |
Custody and fund accounting fees | | | 475,616 | |
Transfer agent fees | | | 1,020,728 | |
Professional services | | | 57,040 | |
Shareholder reports | | | 232,921 | |
Registration fees | | | 158,423 | |
Trustees’ fees | | | 118,750 | |
Miscellaneous | | | 524,295 | |
| | | | |
| | | 41,053,743 | |
| | | | |
NET INVESTMENT INCOME | | | 164,733,323 | |
| | | | |
| |
REALIZED AND UNREALIZED GAIN (LOSS): | | | | |
Net realized gain (loss) | | | | |
Investments | | | 257,948,465 | |
Treasury futures contracts | | | (6,125,343 | ) |
Net change in unrealized appreciation/depreciation | | | | |
Investments | | | (255,268,284 | ) |
Treasury futures contracts | | | 11,439,275 | |
| | | | |
Net realized and unrealized gain | | | 7,994,113 | |
| | | | |
NET INCREASE IN NET ASSETS FROM OPERATIONS | | $ | 172,727,436 | |
| | | | |
| | | | | | | | |
STATEMENT OF CHANGES IN NET ASSETS
(unaudited) | |
| | |
| | | Six Months Ended
June 30, 2015 | | | Year Ended
December 31, 2014 | |
OPERATIONS: | | | | | | | | |
Net investment income | | $ | 164,733,323 | | | $ | 298,744,812 | |
Net realized gain | | | 251,823,122 | | | | 399,919,057 | |
Net change in unrealized
appreciation/depreciation | | | (243,829,009 | ) | | | 567,009,703 | |
| | | | | | | | |
| | | 172,727,436 | | | | 1,265,673,572 | |
| | | | | | | | |
| | |
DISTRIBUTIONS TO SHAREHOLDERS FROM: | | | | | | | | |
Net investment income | | | (165,629,835 | ) | | | (298,877,158 | ) |
Net realized gain | | | (106,037,246 | ) | | | (359,115,663 | ) |
| | | | | | | | |
Total distributions | | | (271,667,081 | ) | | | (657,992,821 | ) |
| | | | | | | | |
| | |
FUND SHARE
TRANSACTIONS: | | | | | | | | |
Proceeds from sale of shares | | | 830,348,653 | | | | 1,944,425,723 | |
Reinvestment of distributions | | | 257,219,543 | | | | 624,013,075 | |
Cost of shares redeemed | | | (1,070,884,844 | ) | | | (2,114,967,089 | ) |
| | | | | | | | |
Net increase from Fund
share transactions | | | 16,683,352 | | | | 453,471,709 | |
| | | | | | | | |
Total increase/(decrease) in
net assets | | | (82,256,293 | ) | | | 1,061,152,460 | |
| | |
NET ASSETS: | | | | | | | | |
Beginning of period | | | 15,465,077,566 | | | | 14,403,925,106 | |
| | | | | | | | |
End of period (including undistributed net investment income of $2,603,869 and $3,500,381, respectively) | | $ | 15,382,821,273 | | | $ | 15,465,077,566 | |
| | | | | | | | |
| | |
SHARE INFORMATION: | | | | | | | | |
Shares sold | | | 8,115,659 | | | | 19,199,410 | |
Distributions reinvested | | | 2,542,643 | | | | 6,142,973 | |
Shares redeemed | | | (10,440,953 | ) | | | (20,958,749 | ) |
| | | | | | | | |
Net increase in shares outstanding | | | 217,349 | | | | 4,383,634 | |
| | | | | | | | |
| | |
| PAGE 12 § DODGE & COX BALANCED FUND | | See accompanying Notes to Financial Statements |
NOTES TO FINANCIAL STATEMENTS (unaudited)
NOTE 1—ORGANIZATION AND SIGNIFICANT ACCOUNTING POLICIES
Dodge & Cox Balanced Fund (the “Fund”) is one of the series constituting the Dodge & Cox Funds (the “Trust” or the “Funds”). The Trust is organized as a Delaware statutory trust and is registered under the Investment Company Act of 1940, as amended, as an open-end management investment company. The Fund commenced operations on June 26, 1931, and seeks regular income, conservation of principal, and an opportunity for long-term growth of principal and income. Risk considerations and investment strategies of the Fund are discussed in the Fund’s Prospectus.
The financial statements have been prepared in conformity with accounting principles generally accepted in the United States of America, which require the use of estimates and assumptions by management. Actual results may differ from those estimates. Significant accounting policies are as follows:
Security valuation The Fund’s net assets are valued as of the close of trading on the New York Stock Exchange (NYSE), generally 4:00 p.m. Eastern Time, each day that the NYSE is open for business. Portfolio securities and other financial instruments for which market quotes are readily available are valued at market value. Listed securities are generally valued using the official quoted close price or the last sale on the exchange that is determined to be the primary market for the security. Debt securities (including certain preferred stocks) and non-exchange traded derivatives are valued based on prices received from independent pricing services which utilize both dealer-supplied valuations and pricing models. Pricing models may consider quoted prices for similar securities, interest rates, prepayment speeds, and credit risk. Exchange-traded derivatives are valued at the settlement price determined by the relevant exchange. Security values are not discounted based on the size of the Fund’s position. Short-term securities less than 60 days to maturity may be valued at amortized cost if amortized cost approximates current value. Mutual funds are valued at their respective net asset values. All securities held by the Fund are denominated in U.S. dollars.
If market quotations are not readily available or if a security’s value is believed to have materially changed after the close of the security’s primary market but before the close of trading on the NYSE, the security is valued at fair value as determined in good faith by or under the direction of the Funds’ Board of Trustees. The Board of Trustees has delegated authority to Dodge & Cox, the Fund’s investment manager, to make fair value determinations in accordance with the Dodge & Cox Funds Valuation Policies (“Valuation Policies”), subject to Board oversight. Dodge & Cox has established a Pricing Committee that is comprised of representatives from Treasury, Legal, Compliance, and Operations. The Pricing Committee is responsible for implementing the Valuation Policies, including determining the fair value of securities when market quotations or market-based valuations are not readily available or are deemed unreliable. The Pricing Committee considers relevant indications of value that are
reasonably available to it in determining the fair value assigned to a particular security, such as the value of similar financial instruments, trading volumes, contractual restrictions on disposition, related corporate actions, and changes in economic conditions. In doing so, the Pricing Committee employs various methods for calibrating fair valuation approaches, including a regular review of key inputs and assumptions, back-testing, and review of any related market activity.
Valuing securities through a fair value determination involves greater reliance on judgment than valuation of securities based on readily available market quotations. In some instances, lack of information and uncertainty as to the significance of information may lead to a conclusion that a prior valuation is the best indication of a security’s value. When fair value pricing is employed, the prices of securities used by the Fund to calculate its NAV may differ from quoted or published prices for the same securities.
Security transactions, investment income, expenses, and distributions Security transactions are recorded on the trade date. Realized gains and losses on securities sold are determined on the basis of identified cost.
Dividend income and corporate action transactions are recorded on the ex-dividend date, or when the Fund first learns of the dividend/corporate action if the ex-dividend date has passed. Withholding taxes on foreign dividends have been provided for in accordance with the Fund’s understanding of the applicable country’s tax rules and rates. Non-cash dividends included in dividend income, if any, are recorded at the fair market value of the securities received. Dividends characterized as return of capital for U.S. tax purposes are recorded as a reduction of cost of investments and/or realized gain.
Interest income is recorded on the accrual basis. Interest income includes coupon interest, amortization of premium and accretion of discount on debt securities, and gain/loss on paydowns. The ability of the issuers of the debt securities held by the Fund to meet their obligations may be affected by economic developments in a specific industry, state, or region. Debt obligations may be placed on non-accrual status and related interest income may be reduced by ceasing current accruals and writing off interest receivables when the collection of all or a portion of interest has become doubtful. A debt obligation is removed from non-accrual status when the issuer resumes interest payments or when collectibility of interest is reasonably assured.
Expenses are recorded on the accrual basis. Some expenses of the Trust can be directly attributed to a specific series. Expenses which cannot be directly attributed are allocated among the Funds in the Trust based on relative net assets or other expense methodologies determined by the nature of the expense.
Distributions to shareholders are recorded on the ex-dividend date.
DODGE & COX BALANCED FUND §PAGE 13
NOTES TO FINANCIAL STATEMENTS (unaudited)
Repurchase agreements The Fund enters into repurchase agreements, secured by U.S. government or agency securities, which involve the purchase of securities from a counterparty with a simultaneous commitment to resell the securities at an agreed-upon date and price. It is the Fund’s policy that its custodian take possession of the underlying collateral securities, the fair value of which exceeds the principal amount of the repurchase transaction, including accrued interest, at all times. In the event of default by the counterparty, the Fund has the contractual right to liquidate the collateral securities and to apply the proceeds in satisfaction of the obligation.
Futures Contracts Futures contracts involve an obligation to purchase or sell (depending on whether the Fund has entered a long or short futures contract, respectively) an asset at a future date, at a price set at the time of the contract. Upon entering into a futures contract, the Fund is required to deposit an amount of cash or liquid assets (referred to as initial margin) in a segregated account with the clearing broker. Subsequent payments (referred to as variation margin) to and from the clearing broker are made on a daily basis based on changes in the market value of futures contracts. Futures contracts are traded publicly and their market value changes daily. Changes in the market value of open futures contracts are recorded as unrealized appreciation or depreciation in the Statement of Operations. Realized gains and losses on futures contracts are recorded in the Statement of Operations at the closing or expiration of the contracts. Cash deposited with a broker as initial margin is recorded on the Statement of Assets and Liabilities. A receivable and/or payable to brokers for daily variation margin is also recorded on the Statement of Assets and Liabilities.
Investments in futures contracts may include certain risks, which may be different from, and potentially greater than, those of the underlying securities. To the extent the Fund uses futures, it is exposed to additional volatility and potential losses resulting from leverage.
The Fund has maintained short Treasury futures contracts to assist with the management of the portfolio’s interest rate exposure. During the six months ended June 30, 2015, these Treasury futures contracts had notional values ranging from 1% to 3% of net assets.
Indemnification Under the Trust’s organizational documents, its officers and trustees are indemnified against certain liabilities arising out of the performance of their duties to the Trust. In addition, in the normal course of business the Trust enters into contracts that provide general indemnities to other parties. The Trust’s maximum exposure under these arrangements is unknown as this would involve future claims that may be made against the Trust that have not yet occurred.
NOTE 2—VALUATION MEASUREMENTS
Various inputs are used in determining the value of the Fund’s investments. These inputs are summarized in the three broad levels listed below.
| § | | Level 1: Quoted prices in active markets for identical securities |
| § | | Level 2: Other significant observable inputs (including quoted prices for similar securities, market indices, interest rates, credit risk, etc.) |
| § | | Level 3: Significant unobservable inputs (including Fund management’s assumptions in determining the fair value of investments) |
The inputs or methodology used for valuing securities are not necessarily an indication of the risk associated with investing in those securities.
The following is a summary of the inputs used to value the Fund’s holdings at June 30, 2015:
| | | | | | | | |
| Classification(a) | | LEVEL 1 (Quoted Prices) | | | LEVEL 2 (Other Significant Observable Inputs) | |
Securities | | | | | | | | |
Common Stocks(b) | | $ | 10,456,100,870 | | | $ | — | |
Preferred Stocks | | | — | | | | 609,059,316 | |
Debt Securities | | | | | | | | |
U.S. Treasury | | | — | | | | 311,806,133 | |
Government-Related | | | — | | | | 289,952,104 | |
Mortgage-Related | | | — | | | | 1,430,145,832 | |
Asset-Backed | | | — | | | | 263,435,334 | |
Corporate | | | — | | | | 1,783,919,039 | |
Short-term Investments | | | | | | | | |
Money Market Fund | | | 15,360,262 | | | | — | |
Repurchase Agreement | | | — | | | | 187,541,000 | |
| | | | | | | | |
Total Securities | | $ | 10,471,461,132 | | | $ | 4,875,858,758 | |
| | | | | | | | |
Other Financial Instruments | | | | | | | | |
Treasury Futures Contracts | | $ | 3,771,610 | (c) | | $ | — | |
| | | | | | | | | |
| (a) | U.S. Treasury securities were transferred from Level 1 to Level 2 during the period. There were no Level 3 securities at June 30, 2015 and December 31, 2014, and there were no transfers to Level 3 during the period. |
| (b) | All common stocks held in the Fund are Level 1 securities. For a detailed break-out of common stocks by major industry classification, please refer to the Portfolio of Investments. |
| (c) | Represents net unrealized appreciation/(depreciation). |
NOTE 3—RELATED PARTY TRANSACTIONS
Management fees Under a written agreement approved by a unanimous vote of the Board of Trustees, the Fund pays an annual management fee of 0.50% of the Fund’s average daily net assets to Dodge & Cox, investment manager of the Fund.
Fund officers and trustees All officers and two of the trustees of the Trust are officers or employees of Dodge & Cox. The Trust pays a fee only to those trustees who are not affiliated with Dodge & Cox.
PAGE 14 § DODGE & COX BALANCED FUND
NOTES TO FINANCIAL STATEMENTS (unaudited)
NOTE 4—INCOME TAX INFORMATION AND DISTRIBUTIONS TO SHAREHOLDERS
A provision for federal income taxes is not required since the Fund intends to continue to qualify as a regulated investment company under Subchapter M of the Internal Revenue Code and distribute all of its taxable income to shareholders. Distributions are determined in accordance with income tax regulations, and such amounts may differ from net investment income and realized gains for financial reporting purposes. Financial reporting records are adjusted for permanent book/tax differences at year end to reflect tax character.
Book/tax differences are primarily due to differing treatments of wash sales, net short-term realized gain (loss), and Treasury futures contracts. At June 30, 2015, the cost of investments for federal income tax purposes was $11,693,583,849.
Distributions during the periods noted below were characterized as follows for federal income tax purposes:
| | | | | | | | |
| | | Six Months Ended
June 30, 2015 | | | Year Ended
December 31, 2014 | |
Ordinary income | | | $169,395,362 | | | | $357,296,853 | |
| | | ($1.125 per share) | | | | ($2.417 per share) | |
| | |
Long-term capital gain | | | $102,271,719 | | | | $300,695,968 | |
| | | ($0.679 per share) | | | | ($2.020 per share) | |
At June 30, 2015, the tax basis components of distributable earnings were as follows:
| | | | |
Unrealized appreciation | | $ | 3,869,711,796 | |
Unrealized depreciation | | | (215,975,755 | ) |
| | | | |
Net unrealized appreciation | | | 3,653,736,041 | |
Undistributed ordinary income | | | 10,058,422 | |
Undistributed long-term capital gain | | | 255,750,117 | |
Fund management has reviewed the tax positions for open periods (three years and four years, respectively, from filing the Fund’s Federal and State tax returns) as applicable to the Fund, and has determined that no provision for income tax is required in the Fund’s financial statements.
NOTE 5—LOAN FACILITIES
Pursuant to an exemptive order issued by the Securities and Exchange Commission (SEC), the Fund may participate in an interfund lending facility (Facility). The Facility allows the Fund to borrow money from or loan money to the Funds. Loans under the Facility are made for temporary or emergency purposes, such as to fund shareholder redemption requests. Interest on borrowings is the average of the current repurchase agreement rate and the bank loan rate. There was no activity in the Facility during the period.
All Funds in the Trust participate in a $500 million committed credit facility (Line of Credit) with State Street Bank and Trust Company, to be utilized for temporary or emergency purposes to fund shareholder redemptions or for other short-term liquidity purposes. The maximum amount available to the Fund is $250 million. Each Fund pays an annual commitment fee on its pro-rata portion of the Line of Credit. The Fund’s commitment fee for the six months ended June 30, 2015, amounted to $23,185 and is reflected as a Miscellaneous Expense in the Statement of Operations. Interest on borrowings is charged at the prevailing rate. There were no borrowings on the Line of Credit during the period.
NOTE 6—PURCHASES AND SALES OF INVESTMENTS
For the six months ended June 30, 2015, purchases and sales of securities, other than short-term securities and U.S. government securities, aggregated $1,234,706,422 and $1,102,838,572, respectively. For the six months ended June 30, 2015, purchases and sales of U.S. government securities aggregated $368,265,426 and $576,876,842, respectively.
NOTE 7—ACCOUNTING PRONOUNCEMENTS
In June 2014, the Financial Accounting Standards Board issued Accounting Standards Update (ASU) No. 2014-11, Transfers and Servicing (Topic 860), Repurchase-to-Maturity Transactions, Repurchase Financings, and Disclosures. The ASU changes the accounting for certain repurchase agreements and expands disclosure requirements related to repurchase agreements and similar transactions. There was no impact to these financial statements as a result of applying this ASU.
NOTE 8—SUBSEQUENT EVENTS
Fund management has determined that no material events or transactions occurred subsequent to June 30, 2015, and through the date of the Fund’s financial statements issuance, which require additional disclosure in the Fund’s financial statements.
DODGE & COX BALANCED FUND §PAGE 15
FINANCIAL HIGHLIGHTS (unaudited)
| | | | | | | | | | | | | | | | | | | | | | | | |
SELECTED DATA AND RATIOS (for a share outstanding throughout each period) | | Six Months
Ended June 30, | | | Year Ended December 31, | |
| | | 2015(a) | | | 2014 | | | 2013 | | | 2012 | | | 2011 | | | 2010 | |
| | | | | | | | |
Net asset value, beginning of period | | | $102.48 | | | | $98.30 | | | | $78.06 | | | | $67.45 | | | | $70.22 | | | | $64.03 | |
Income from investment operations: | | | | | | | | | | | | | | | | | | | | | | | | |
Net investment income | | | 1.09 | | | | 2.03 | | | | 1.66 | | | | 1.65 | | | | 1.62 | | | | 1.41 | |
Net realized and unrealized gain (loss) | | | 0.02 | | | | 6.59 | | | | 20.30 | | | | 10.62 | | | | (2.77 | ) | | | 6.30 | |
| | | | | | | | |
Total from investment operations | | | 1.11 | | | | 8.62 | | | | 21.96 | | | | 12.27 | | | | (1.15 | ) | | | 7.71 | |
| | | | | | | | |
Distributions to shareholders from: | | | | | | | | | | | | | | | | | | | | | | | | |
Net investment income | | | (1.10 | ) | | | (2.03 | ) | | | (1.65 | ) | | | (1.66 | ) | | | (1.62 | ) | | | (1.52 | ) |
Net realized gain | | | (0.70 | ) | | | (2.41 | ) | | | (0.07 | ) | | | — | | | | — | | | | — | |
| | | | | | | | |
Total distributions | | | (1.80 | ) | | | (4.44 | ) | | | (1.72 | ) | | | (1.66 | ) | | | (1.62 | ) | | | (1.52 | ) |
| | | | | | | | |
Net asset value, end of period | | | $101.79 | | | | $102.48 | | | | $98.30 | | | | $78.06 | | | | $67.45 | | | | $70.22 | |
| | | | | | | | |
Total return | | | 1.10 | % | | | 8.85 | % | | | 28.37 | % | | | 18.32 | % | | | (1.66 | )% | | | 12.23 | % |
Ratios/supplemental data: | | | | | | | | | | | | | | | | | | | | | | | | |
Net assets, end of period (millions) | | | $15,383 | | | | $15,465 | | | | 14,404 | | | | $12,217 | | | | $12,220 | | | | $14,849 | |
Ratio of expenses to average net assets | | | 0.53 | %(b) | | | 0.53 | % | | | 0.53 | % | | | 0.53 | % | | | 0.53 | % | | | 0.53 | % |
Ratio of net investment income to average net assets | | | 2.14 | %(b) | | | 2.00 | % | | | 1.85 | % | | | 2.21 | % | | | 2.26 | % | | | 2.13 | % |
Portfolio turnover rate | | | 11 | % | | | 23 | % | | | 25 | % | | | 16 | % | | | 19 | % | | | 12 | % |
See accompanying Notes to Financial Statements
PAGE 16 § DODGE & COX BALANCED FUND
FUND HOLDINGS
The Fund provides a complete list of its holdings four times each fiscal year, as of the end of each quarter. The Fund files the lists with the SEC on Form N-CSR (second and fourth quarters) and Form N-Q (first and third quarters). Shareholders may view the Fund’s Forms N-CSR and N-Q on the SEC’s website at sec.gov. Forms N-CSR and N-Q may also be reviewed and copied at the SEC’s Public Reference Room in Washington, DC. Information regarding the operations of the Public Reference Room may be obtained by calling 202-942-8090 (direct) or 800-732-0330 (general SEC number). A list of the Fund’s quarter-end holdings is also available at dodgeandcox.com on or about 15 days following each quarter end and remains available on the website until the list is updated in the subsequent quarter.
PROXY VOTING
For a free copy of the Fund’s proxy voting policies and procedures, please call 800-621-3979, visit the Fund’s website at dodgeandcox.com, or visit the SEC’s website at sec.gov. Information regarding how the Fund voted proxies relating to portfolio securities during the most recent 12-month period ending June 30 is also available at dodgeandcox.com or at sec.gov.
HOUSEHOLD MAILINGS
The Fund routinely mails shareholder reports and summary prospectuses to shareholders and, on occasion, proxy statements. In order to reduce the volume of mail, when possible, only one copy of these documents will be sent to shareholders who are part of the same family and share the same residential address.
If you have a direct account with the Funds and you do not want the mailing of shareholder reports and summary prospectuses combined with other members in your household, contact the Funds at 800-621-3979. Your request will be implemented within 30 days.
DODGE & COX BALANCED FUND §PAGE 17
[THIS PAGE INTENTIONALLY LEFT BLANK]
PAGE 18 § DODGE & COX BALANCED FUND
TRUSTEES AND EXECUTIVE OFFICERS
Charles F. Pohl, Chairman and Trustee
Chairman, Dodge & Cox
Dana M. Emery, President and Trustee
Chief Executive Officer and President, Dodge & Cox
Thomas A. Larsen, Independent Trustee
Senior Counsel, Arnold & Porter LLP
Ann Mather, Independent Trustee
Former Executive Vice President, Chief Financial Officer, and Company Secretary, Pixar Studios
Robert B. Morris III, Independent Trustee
Advisory Director, The Presidio Group
Gary Roughead, Independent Trustee
Annenberg Distinguished Visiting Fellow, Hoover Institution; and former U.S. Navy Chief of Naval Operations
Mark E. Smith, Independent Trustee
Former Executive Vice President and Managing Director-Fixed Income, Loomis Sayles & Company, L.P.
John B. Taylor, Independent Trustee
Professor of Economics, Stanford University; Senior Fellow, Hoover Institute; and former Under Secretary for International Affairs, United States Treasury
John A. Gunn, Senior Vice President
Former Chairman and Chief Executive Officer, Dodge & Cox
Diana S. Strandberg, Senior Vice President
Senior Vice President and Director of International Equity, Dodge & Cox
David H. Longhurst, Treasurer
Vice President and Assistant Treasurer, Dodge & Cox
Thomas M. Mistele, Secretary
Chief Operating Officer, Secretary, and Senior Counsel, Dodge & Cox
Katherine M. Primas, Chief Compliance Officer
Chief Compliance Officer, Dodge & Cox
Additional information about the Trust’s Trustees and Officers is available in the Trust’s Statement of Additional Information (SAI). You can get a free copy of the SAI by visiting the Funds’ website at dodgeandcox.com or calling 800-621-3979.
DODGE & COX BALANCED FUND §PAGE 19
dodgeandcox.com
For Fund literature, transactions, and account information, please visit the Funds’ website.
or write or call:
DODGE & COX FUNDS
c/o Boston Financial Data Services
P.O. Box 8422
Boston, Massachusetts 02266-8422
(800) 621-3979
INVESTMENT MANAGER
Dodge & Cox
555 California Street, 40th Floor
San Francisco, California 94104
(415) 981-1710
This report is submitted for the general information of the shareholders of the Fund. The report is not authorized for distribution to prospective investors in the Fund unless it is accompanied by a current prospectus.
This report reflects our views, opinions, and portfolio holdings as of June 30, 2015, the end of the reporting period. Any such views are subject to change at any time based upon market or other conditions and Dodge & Cox disclaims any responsibility to update such views. These views may not be relied on as investment advice and, because investment decisions for a Dodge & Cox Fund are based on numerous factors, may not be relied on as an indication of trading intent on behalf of any Dodge & Cox Fund.
DODGE & COX FUNDS®
Semi-Annual Report
June 30, 2015
Income Fund
ESTABLISHED 1989
TICKER: DODIX
6/15 IF SAR Printed on recycled paper
TO OUR SHAREHOLDERS
The Dodge & Cox Income Fund had a total return of 0.1% for the six months ending June 30, 2015, compared to a total return of –0.1% for the Barclays U.S. Aggregate Bond Index (Barclays U.S. Agg). On June 30, the Fund had net assets of $44.3 billion with net cash of 1.1%.
MARKET COMMENTARY
The U.S. investment-grade bond market delivered a small negative return for the first half of 2015, the result of rising interest rates and increasing credit yield premiums. U.S. Treasury rates were influenced by a growing expectation that the Federal Reserve (Fed) could increase short-term rates as soon as the second half of 2015, as well as broader-based improvement in U.S. economic activity. Global developments also affected valuations.
The U.S. economic recovery continued in the first half of 2015, notwithstanding a 0.2% decline in first quarter annualized GDP growth; market expectations are for annualized growth of 2.5% or higher over the coming quarters. Important segments of the economy began to show signs of life. Existing home sales and building permits reached multi-year highs, consumer confidence measures improved, and labor market conditions remained strong, with the unemployment rate reaching a new post-crisis low (5.3%, released in early July). In recognition of these trends, the Fed’s post-meeting statements reflected expectations for economic activity to strengthen and inflation to rise from abnormally low levels.
Investment-grade corporate bonds returned –0.9%(a) year to date, underperforming comparable-duration(b) Treasuries by 0.6 percentage points in an environment of heavy new issuance, much of it related to M&A financing, and some deterioration in credit fundamentals in certain sectors. The Financial Institutions sub-sector has been somewhat insulated from these influences, leading to better returns (–0.1%) than the Industrials (–1.1%) and Utilities (–2.7%) sub-sectors. Agency-guaranteed(c) mortgage-backed securities (MBS) returned 0.3% for the period; relative performance versus comparable-duration Treasuries varied by coupon. Lower-coupon MBS underperformed Treasuries, given the increase in Treasury rates and extension of MBS durations, while higher-coupon MBS (5.5% and greater) outperformed in the benign prepayment environment.
INVESTMENT STRATEGY
The Fund’s current positioning features substantial weightings in corporate bonds and Agency MBS, smaller weightings in government-related securities and asset-backed securities (ABS), and a duration that is 72% of the Barclays Agg. While the Fund’s overall positioning has remained relatively stable, we have continued to make incremental shifts in response to changes in valuation and/or fundamentals.
One notable area of portfolio adjustment has been in corporate and government-related credit. From late 2013 through September 2014, with broad corporate bond valuations less compelling than in previous years, we reduced the Fund’s credit weighting by 12 percentage points through careful examination of
each issuer weighting relative to its valuation and fundamental credit profile. Since that time, global volatility, some deterioration in industrial credit profiles, and massive amounts of new corporate issuance have contributed to wider yield premiums(d) (approximately 50% wider over the past year) and created attractive entry points for us to selectively add to the Fund’s credit portfolio. Over the past nine months we have added seven new issuers to the Fund and increased several existing holdings, while reducing exposure to less compelling holdings. The net result has been a three percentage point increase to the Fund’s credit weighting.
Our organizational structure provides an important advantage in sourcing new opportunities in a market environment of wider spreads, heightened volatility, and issuer-specific risks. Our industry analysts, who cover issuers from a debt and equity perspective and have in-depth knowledge of a large number of issuers, partner with our fixed income investment team to sift through the opportunity set and source interesting long-term investments.
Our research efforts have focused on two main areas. The first is industries that have experienced heightened volatility, such as the Energy sector (given last fall’s plunge in oil prices), which yielded new positions in Kinder Morgan and TransCanada. As midstream energy companies, both issuers are relatively insulated from the first-order effects of lower oil prices because their revenue streams are predominantly fee based. Yet valuations for the entire energy sector declined substantially last fall; at these lower prices, we were able to invest in what we believe are dominant business franchises poised to benefit from growth trends in energy infrastructure in North America.
The second area is the new issue market—debt issued in connection with M&A activity in particular. The pace of investment-grade new issuance has been unrelenting, topping $700 billion year to date; much of this has financed strategic transactions. In our view, these transactions can offer an attractive entry point to invest in an issuer immediately after a leveraging event, particularly when the industrial logic for the business combination appears sound and there is a credible path to reducing leverage over our investment horizon. We have participated in a number of these types of new issues this year, including Actavis Plc (now Allergan) and CRH Plc. In each case, we were attracted by the acquisition rationale, resulting business position, ability to generate cash flow for debt repayment, sources of financial flexibility, and compelling relative valuations.
While industrial credit profiles, generally speaking, have deteriorated slightly as leverage metrics have crept up, we view default risk among the Fund’s holdings as quite low, debt servicing capacity as robust, balance sheets as generally healthy, and the prospects for moderate economic growth supportive of corporate valuations. However, we continue to monitor the Fund portfolio closely for potential risks in the current environment.
The Fund’s Agency MBS position, currently 34%(e) of the portfolio, has remained relatively stable in aggregate, although
PAGE 2 § DODGE & COX INCOME FUND
underlying composition has shifted over time. As with the credit portfolio, we undertake fundamental research to identify attractive long-term investment opportunities. Because of the Agency/GSE guarantee accorded the Fund’s MBS holdings, credit risk is minimal, so we analyze borrower and loan structure characteristics as key fundamentals. Timing and predictability of MBS cash flows drive total return over time, particularly for the shorter-duration instruments in which we invest. We seek to mitigate these risks by investing in MBS with structures and/or characteristics likely to be more stable over time. For example, we have a substantial position in 15- to 20-year MBS; these securities’ cash flows have been more predictable compared to their 30-year counterparts because prepayment risk declines when loan balances decline relatively quickly and associated refinancing savings decrease. In addition, we have sought to invest in MBS where the underlying mortgage loans appear to be less sensitive to prepayment risk due to less efficient servicing of those loans. In both of these instances, the reduced likelihood of prepayments makes it more likely the Fund will benefit from the above-market income stream for a longer period of time.
Finally, we have continued to position the Fund defensively with respect to interest rate risk, with a duration that is just over 70% of the Barclays Agg’s duration. This positioning reflects our view that interest rates are likely to rise at a rate that exceeds current market expectations over the next several years. Against the backdrop of an improving U.S. economy, the Fed is poised to begin raising interest rates for the first time since its last tightening cycle began in 2004. The timing of the first rate hike is uncertain, but likely to be this year. Of greater importance to us is the pace of future rate hikes over time relative to the market’s expectation of that pace; current U.S. Treasury valuations reflect assumptions of a very slow pace of tightening and a lower equilibrium rate than past tightening cycles. We believe that the underlying and broader-based strength of the U.S. economy, combined with somewhat improved global economic growth, could lead to interest rates rising at a faster pace than is currently built into valuations. However, we expect the path will not be linear, given uncertainties associated with the Greek debt crisis, a slower pace of growth in China, and other factors.
IN CLOSING
Despite recent increases, bond market yields remain quite low relative to longer-term history. Given these low starting yields and the potential for interest rates to rise, we expect bond market returns to be quite modest and possibly negative in the near term. Nevertheless, we believe the Fund has the potential to provide reasonable relative returns over longer time periods given its current positioning. As timing markets is very difficult, we counsel shareholders to have a long-term investment horizon. In addition, bonds continue to play an important role in an investment portfolio, providing diversification, liquidity, income, and downside protection—important for any diversified investment strategy.
Thank you for your continued confidence in our firm. As always, we welcome your comments and questions.
For the Board of Trustees,
| | |
| |
|
Charles F. Pohl, Chairman | | Dana M. Emery, President |
July 31, 2015
| (a) | | Sector returns as calculated and reported by Barclays. |
| (b) | | Duration is a measure of a bond’s (or a bond portfolio’s) price sensitivity to changes in interest rates. |
| (c) | | The U.S. Government does not guarantee the Fund’s shares, yield, or net asset value. The agency guarantee (by, for example, Ginnie Mae, Fannie Mae, or Freddie Mac) does not eliminate market risk. |
| (d) | | Yield premiums are one way to measure a security’s valuation. Narrowing yield premiums results in a higher valuation. Widening yield premiums results in a lower valuation. |
| (e) | | Unless otherwise specified, all weightings and characteristics are as of June 30, 2015. |
DODGE & COX INCOME FUND §PAGE 3
YEAR-TO-DATE PERFORMANCE REVIEW
The Fund outperformed the Barclays U.S. Agg by 0.2 percentage points year to date.
Key Contributors to Relative Results
| | § | | The Fund’s shorter relative duration (approximately 70% of the Barclays U.S. Agg’s duration) added to relative returns, as did its lower exposure to long-term bonds. | |
| | § | | Brazil-related credit holdings Petrobras and Rio Oil Finance Trust performed well after Petrobras released audited financial statements and took steps to improve liquidity and corporate governance. Other strong performers in credit included Dominion Resources hybrid securities, HSBC, and Telecom Italia. | |
| | § | | The Fund’s Agency MBS holdings performed well on an “excess return” basis, adding to relative returns. | |
| | § | | The Fund’s nominal yield advantage benefited returns. | |
Key Detractors from Relative Results
| | § | | The Fund’s overweight to corporate bonds (39% versus 23% for the Barclays U.S. Agg) detracted from relative returns. | |
| | § | | Though issue-specific performance was positive as a whole, certain credit holdings underperformed, including AT&T, Kinder Morgan, and Time Warner. | |
| | | | Unless otherwise noted, figures cited in this section denote Fund positioning at the beginning of the period. | |
KEY CHARACTERISTICS OF DODGE & COX
Independent Organization
Dodge & Cox is one of the largest privately owned investment managers in the world. We remain committed to independence, with a goal of providing the highest quality investment management service to our existing clients.
Over 80 Years of Investment Experience
Dodge & Cox was founded in 1930. We have a stable and well-qualified team of investment professionals, most of whom have spent their entire careers at Dodge & Cox.
Experienced Investment Team
The Fixed Income Investment Policy Committee, which is the decision-making body for the Income Fund, is an eight-member committee with an average tenure at Dodge & Cox of 20 years.
One Business with a Single Research Office
Dodge & Cox manages equity (domestic, international, and global), fixed income (domestic and global), and balanced investments, operating from one office in San Francisco.
Consistent Investment Approach
Our team decision-making process involves thorough, bottom-up fundamental analysis of each investment.
Long-Term Focus and Low Expenses
We invest with a three- to five-year investment horizon, which has historically resulted in low turnover relative to our peers. We manage Funds that maintain low expense ratios.
Risks: The Fund invests in individual bonds whose yields and market values fluctuate, so that an investment may be worth more or less than its original cost. Debt securities are subject to interest rate risk, credit risk, and prepayment and call risk, all of which could have adverse effects on the value of the Fund. A low interest rate environment creates an elevated risk of future negative returns. Financial intermediaries may restrict their market making activities for certain debt securities, which may reduce the liquidity and increase the volatility of such securities. Please read the prospectus and summary prospectus for specific details regarding the Fund’s risk profile.
PAGE 4 § DODGE & COX INCOME FUND
GROWTH OF $10,000 OVER 10 YEARS
FOR AN INVESTMENT MADE ON JUNE 30, 2005

AVERAGE ANNUAL TOTAL RETURN
FOR PERIODS ENDED JUNE 30, 2015
| | | | | | | | | | | | | | | | |
| | | 1 Year | | | 5 Years | | | 10 Years | | | 20 Years | |
| | | | | | | | | | | | | | | | |
Dodge & Cox Income Fund | | | 0.97 | % | | | 4.31 | % | | | 5.12 | % | | | 6.05 | % |
Barclays U.S. Aggregate Bond Index (Barclays U.S. Agg) | | | 1.85 | | | | 3.36 | | | | 4.44 | | | | 5.63 | |
Returns represent past performance and do not guarantee future results. Investment return and share price will fluctuate with market conditions, and investors may have a gain or loss when shares are sold. Fund performance changes over time and currently may be significantly lower than stated. Performance is updated and published monthly. Visit the Fund’s website at dodgeandcox.com or call 800-621-3979 for current performance figures.
The Fund’s total returns include the reinvestment of dividend and capital gain distributions, but have not been adjusted for any income taxes payable by shareholders on these distributions or on Fund share redemptions. Index returns include interest income but, unlike Fund returns, do not reflect fees or expenses. The Barclays U.S. Aggregate Bond Index (Barclays U.S. Agg) is a widely recognized, unmanaged index of U.S. dollar-denominated, investment-grade, taxable debt securities.
Barclays® is a trademark of Barclays Bank PLC.
FUND EXPENSE EXAMPLE
As a Fund shareholder, you incur ongoing Fund costs, including management fees and other Fund expenses. All mutual funds have ongoing costs, sometimes referred to as operating expenses. The following example shows ongoing costs of investing in the Fund and can help you understand these costs and compare them with those of other mutual funds. The example assumes a $1,000 investment held for the six months indicated.
ACTUAL EXPENSES
The first line of the table below provides information about actual account values and expenses based on the Fund’s actual returns. You may use the information in this line, together with your account balance, to estimate the expenses that you paid over the period. Simply divide your account value by $1,000 (for example, an $8,600 account value divided by $1,000 = 8.6), then multiply the result by the number in the first line under the heading “Expenses Paid During Period” to estimate the expenses you paid on your account during this period.
HYPOTHETICAL EXAMPLE FOR COMPARISON WITH OTHER MUTUAL FUNDS
Information on the second line of the table can help you compare ongoing costs of investing in the Fund with those of other mutual funds. This information may not be used to estimate the actual ending account balance or expenses you paid during the period. The hypothetical “Ending Account Value” is based on the actual expense ratio of the Fund and an assumed 5% annual rate of return before expenses (not the Fund’s actual return). The amount under the heading “Expense Paid During the Period” shows the hypothetical expenses your account would have incurred under this scenario. You can compare this figure with the 5% hypothetical examples that appear in shareholder reports of other mutual funds.
| | | | | | | | | | | | |
Six Months Ended June 30, 2015 | | Beginning Account Value
1/1/2015 | | | Ending Account Value
6/30/2015 | | | Expenses Paid
During Period* | |
Based on Actual Fund Return | | $ | 1,000.00 | | | $ | 1,000.90 | | | $ | 2.16 | |
Based on Hypothetical 5% Yearly Return | | | 1,000.00 | | | | 1,022.64 | | | | 2.18 | |
| * | | Expenses are equal to the Fund’s annualized expense ratio of 0.43%, multiplied by the average account value over the period, multiplied by 181/365 (to reflect the one-half year period). |
The expenses shown in the table highlight ongoing costs only and do not reflect any transactional fees or account maintenance fees. Though other mutual funds may charge such fees, please note that the Fund does not charge transaction fees (e.g., redemption fees, sales loads) or universal account maintenance fees (e.g., small account fees).
DODGE & COX INCOME FUND §PAGE 5
| | | | |
| FUND INFORMATION | | | June 30, 2015 | |
| | | | |
| GENERAL INFORMATION | | | |
Net Asset Value Per Share | | | $13.60 | |
Total Net Assets (billions) | | | $44.3 | |
30-Day SEC Yield(a) | | | 2.77% | |
2014 Expense Ratio (per 5/1/15 Prospectus) | | | 0.44% | |
Expense Ratio (1/1/15 to 6/30/15, annualized) | | | 0.43% | |
Portfolio Turnover Rate (1/1/15 to 6/30/15, unannualized) | | | 9% | |
Fund Inception | | | 1989 | |
No sales charges or distribution fees | | | | |
Investment Manager: Dodge & Cox, San Francisco. Managed by the Fixed Income Investment Policy Committee, whose eight members’ average tenure at Dodge & Cox is 20 years.
| | | | | | | | |
| PORTFOLIO CHARACTERISTICS | | Fund | | | Barclays
U.S. Agg | |
Number of Debt Securities | | | 923 | | | | 9,496 | |
Effective Duration (years) | | | 4.1 | | | | 5.6 | |
| | | | |
| FIVE LARGEST CORPORATE ISSUERS (%)(b) | | Fund | |
Bank of America Corp. | | | 1.9 | |
Cox Enterprises, Inc. | | | 1.8 | |
Verizon Communications, Inc. | | | 1.7 | |
Telecom Italia SPA | | | 1.6 | |
Citigroup, Inc. | | | 1.5 | |
| | | | | | | | |
| CREDIT QUALITY (%)(c) | | Fund | | | Barclays
U.S. Agg | |
U.S. Treasury/Agency/GSE(d) | | | 43.6 | | | | 67.5 | |
Aaa | | | 5.9 | | | | 4.9 | |
Aa | | | 0.9 | | | | 3.5 | |
A | | | 9.1 | | | | 11.4 | |
Baa | | | 29.5 | | | | 12.7 | |
Ba | | | 7.4 | | | | 0.0 | |
B | | | 2.5 | | | | 0.0 | |
Caa | | | 0.0 | (e) | | | 0.0 | |
Cash Equivalents | | | 1.1 | | | | 0.0 | |

| | | | | | | | |
| SECTOR DIVERSIFICATION(%) | | Fund | | | Barclays
U.S. Agg | |
U.S. Treasury(d) | | | 9.6 | | | | 36.1 | |
Government-Related | | | 7.2 | | | | 9.3 | |
Mortgage-Related(f) | | | 33.7 | | | | 28.2 | |
Corporate | | | 40.4 | | | | 23.9 | |
Asset-Backed/Commercial Mortgage-Backed(g) | | | 8.0 | | | | 2.5 | |
Cash Equivalents | | | 1.1 | | | | 0.0 | |
| | | | | | | | |
| MATURITY DIVERSIFICATION(%)(d) | | Fund | | | Barclays
U.S. Agg | |
0-1 Years to Maturity | | | 3.7 | | | | 0.0 | |
1-5 | | | 51.0 | | | | 43.9 | |
5-10 | | | 28.3 | | | | 41.2 | |
10-15 | | | 1.5 | | | | 2.5 | |
15-20 | | | 4.4 | | | | 1.6 | |
20-25 | | | 6.6 | | | | 3.5 | |
25 and Over | | | 4.5 | | | | 7.3 | |
| (a) | SEC Yield is an annualization of the Fund’s total net investment income per share for the 30-day period ended on the last day of the month. |
| (b) | The Fund’s portfolio holdings are subject to change without notice. The mention of specific securities is not a recommendation to buy, sell, or hold any particular security and is not indicative of Dodge & Cox’s current or future trading activity. |
| (c) | The credit quality distributions shown for the Fund and the Index are based on the middle of Moody’s, S&P’s, and Fitch ratings, which is the methodology used by Barclays in constructing its indices. If a security is rated by only two agencies, the lower of the two ratings is used. Please note the Fund applies the highest of Moody’s, S&P’s, and Fitch ratings to determine compliance with the quality requirements stated in its prospectus. On that basis, the Fund held 4.9% in securities rated below investment grade. The credit quality of the investments in the portfolio does not apply to the stability or safety of the Fund or its shares. |
| (d) | Data as presented excludes the Fund’s position in Treasury futures contracts. |
| (f) | The Fund holds 0.4% in Agency multifamily mortgage securities; the Index classifies these securities under CMBS – Agency. |
| (g) | Commercial mortgage-backed securities are a component of the Barclays U.S. Aggregate but are not currently held by the Fund. |
PAGE 6 § DODGE & COX INCOME FUND
| | | | |
| PORTFOLIO OF INVESTMENTS (unaudited) | | | June 30, 2015 | |
| | | | | | | | |
| DEBT SECURITIES: 98.9% | | | | | | |
| | |
| | | PAR VALUE | | | VALUE | |
| U.S. TREASURY: 9.6% | | | | | | | | |
U.S. Treasury Note | | | | | �� | | | |
1.00%, 3/31/17 | | $ | 150,000,000 | | | $ | 151,078,200 | |
0.875%, 5/15/17 | | | 280,000,000 | | | | 281,225,000 | |
0.50%, 7/31/17 | | | 621,000,000 | | | | 618,671,250 | |
1.00%, 9/15/17 | | | 250,000,000 | | | | 251,386,750 | |
0.625%, 9/30/17 | | | 600,000,000 | | | | 598,171,800 | |
1.50%, 8/31/18 | | | 750,000,000 | | | | 759,258,000 | |
1.50%, 2/28/19 | | | 496,995,000 | | | | 500,838,759 | |
1.625%, 7/31/19 | | | 600,000,000 | | | | 604,781,400 | |
1.625%, 12/31/19 | | | 500,000,000 | | | | 501,601,500 | |
| | | | | | | | |
| | | | | | | 4,267,012,659 | |
| GOVERNMENT-RELATED: 7.2% | | | | | | | | |
FEDERAL AGENCY: 0.3% | | | | | | | | |
Small Business Admin. — 504 Program | | | | | | | | |
Series 1997-20E 1, 7.30%, 5/1/17 | | | 41,660 | | | | 43,247 | |
Series 1997-20H 1, 6.80%, 8/1/17 | | | 10,908 | | | | 11,462 | |
Series 1997-20J 1, 6.55%, 10/1/17 | | | 147,657 | | | | 154,322 | |
Series 1997-20L 1, 6.55%, 12/1/17 | | | 6,708 | | | | 6,963 | |
Series 1998-20B 1, 6.15%, 2/1/18 | | | 17,693 | | | | 18,689 | |
Series 1998-20C 1, 6.35%, 3/1/18 | | | 593,876 | | | | 635,129 | |
Series 1998-20H 1, 6.15%, 8/1/18 | | | 288,612 | | | | 306,716 | |
Series 1998-20L 1, 5.80%, 12/1/18 | | | 162,626 | | | | 171,695 | |
Series 1999-20C 1, 6.30%, 3/1/19 | | | 160,729 | | | | 170,231 | |
Series 1999-20E 1, 6.30%, 5/1/19 | | | 4,580 | | | | 4,867 | |
Series 1999-20G 1, 7.00%, 7/1/19 | | | 296,339 | | | | 317,993 | |
Series 1999-20I 1, 7.30%, 9/1/19 | | | 142,625 | | | | 154,797 | |
Series 2000-20C 1, 7.625%, 3/1/20 | | | 8,209 | | | | 8,884 | |
Series 2000-20G 1, 7.39%, 7/1/20 | | | 5,216 | | | | 5,635 | |
Series 2001-20G 1, 6.625%, 7/1/21 | | | 1,279,412 | | | | 1,399,350 | |
Series 2001-20L 1, 5.78%, 12/1/21 | | | 3,656,506 | | | | 3,935,564 | |
Series 2002-20A 1, 6.14%, 1/1/22 | | | 26,803 | | | | 29,276 | |
Series 2002-20L 1, 5.10%, 12/1/22 | | | 1,027,645 | | | | 1,106,103 | |
Series 2003-20G 1, 4.35%, 7/1/23 | | | 67,806 | | | | 71,413 | |
Series 2004-20L 1, 4.87%, 12/1/24 | | | 1,508,078 | | | | 1,611,911 | |
Series 2005-20B 1, 4.625%, 2/1/25 | | | 2,863,092 | | | | 3,065,135 | |
Series 2005-20D 1, 5.11%, 4/1/25 | | | 125,389 | | | | 135,831 | |
Series 2005-20E 1, 4.84%, 5/1/25 | | | 4,630,302 | | | | 4,974,219 | |
Series 2005-20G 1, 4.75%, 7/1/25 | | | 4,912,620 | | | | 5,267,293 | |
Series 2005-20H 1, 5.11%, 8/1/25 | | | 67,101 | | | | 72,742 | |
Series 2005-20I 1, 4.76%, 9/1/25 | | | 5,941,418 | | | | 6,370,059 | |
Series 2006-20A 1, 5.21%, 1/1/26 | | | 5,798,133 | | | | 6,255,743 | |
Series 2006-20B 1, 5.35%, 2/1/26 | | | 1,757,570 | | | | 1,919,870 | |
Series 2006-20C 1, 5.57%, 3/1/26 | | | 8,121,973 | | | | 8,887,616 | |
Series 2006-20G 1, 6.07%, 7/1/26 | | | 15,386,470 | | | | 17,224,978 | |
Series 2006-20H 1, 5.70%, 8/1/26 | | | 131,205 | | | | 145,317 | |
Series 2006-20I 1, 5.54%, 9/1/26 | | | 270,036 | | | | 295,536 | |
Series 2006-20J 1, 5.37%, 10/1/26 | | | 5,116,049 | | | | 5,548,772 | |
Series 2006-20L 1, 5.12%, 12/1/26 | | | 4,051,527 | | | | 4,388,708 | |
Series 2007-20A 1, 5.32%, 1/1/27 | | | 9,870,098 | | | | 10,835,909 | |
Series 2007-20C 1, 5.23%, 3/1/27 | | | 15,132,988 | | | | 16,601,130 | |
Series 2007-20D 1, 5.32%, 4/1/27 | | | 15,162,028 | | | | 16,648,646 | |
Series 2007-20G 1, 5.82%, 7/1/27 | | | 10,276,475 | | | | 11,450,524 | |
| | | | | | | | |
| | | | | | | 130,252,275 | |
FOREIGN AGENCY: 2.3% | | | | | | | | |
Export-Import Bank of Korea(c)
(South Korea)
4.00%, 1/11/17 | | | 19,780,000 | | | | 20,552,943 | |
Petroleo Brasileiro SA(c) (Brazil) | | | | | | | | |
5.75%, 1/20/20 | | | 43,955,000 | | | | 43,552,372 | |
5.375%, 1/27/21 | | | 187,220,000 | | | | 180,161,806 | |
4.375%, 5/20/23 | | | 38,625,000 | | | | 33,669,413 | |
6.25%, 3/17/24 | | | 80,805,000 | | | | 78,014,803 | |
Petroleos Mexicanos(c) (Mexico) | | | | | | | | |
4.875%, 1/18/24 | | | 121,415,000 | | | | 124,450,375 | |
4.25%, 1/15/25(b) | | | 97,765,000 | | | | 95,213,334 | |
| | | | | | | | |
| | |
| | | PAR VALUE | | | VALUE | |
4.50%, 1/23/26(b) | | $ | 15,065,000 | | | $ | 14,724,531 | |
6.625%, 6/15/35 | | | 102,290,000 | | | | 109,194,575 | |
5.50%, 6/27/44 | | | 5,900,000 | | | | 5,428,000 | |
5.50%, 6/27/44(b) | | | 36,075,000 | | | | 33,189,000 | |
6.375%, 1/23/45 | | | 119,000,000 | | | | 122,724,700 | |
5.625%, 1/23/46(b) | | | 190,720,000 | | | | 178,075,264 | |
| | | | | | | | |
| | | | | | | 1,038,951,116 | |
LOCAL AUTHORITY: 4.4% | | | | | | | | |
L.A. Unified School District GO | | | | | | | | |
5.75%, 7/1/34 | | | 6,075,000 | | | | 7,288,846 | |
6.758%, 7/1/34 | | | 185,585,000 | | | | 242,340,605 | |
New Jersey Turnpike Authority RB | | | | | | | | |
7.414%, 1/1/40 | | | 41,065,000 | | | | 57,440,079 | |
7.102%, 1/1/41 | | | 148,277,000 | | | | 200,682,540 | |
New Valley Generation
4.929%, 1/15/21 | | | 340,287 | | | | 375,297 | |
State of California GO | | | | | | | | |
7.50%, 4/1/34 | | | 203,021,000 | | | | 282,109,861 | |
7.55%, 4/1/39 | | | 200,880,000 | | | | 290,386,101 | |
7.30%, 10/1/39 | | | 116,735,000 | | | | 165,112,319 | |
7.625%, 3/1/40 | | | 103,410,000 | | | | 151,457,388 | |
7.60%, 11/1/40 | | | 56,435,000 | | | | 82,461,693 | |
State of Illinois GO | | | | | | | | |
4.961%, 3/1/16 | | | 65,560,000 | | | | 67,101,971 | |
5.365%, 3/1/17 | | | 186,245,000 | | | | 194,393,219 | |
5.665%, 3/1/18 | | | 170,335,000 | | | | 182,248,230 | |
5.10%, 6/1/33 | | | 6,645,000 | | | | 6,192,808 | |
| | | | | | | | |
| | | | | | | 1,929,590,957 | |
SOVEREIGN: 0.2% | | | | | | | | |
Spain Government International(c) (Spain) 4.00%, 3/6/18(b) | | | 74,765,000 | | | | 79,038,418 | |
| | | | | | | | |
| | | | | | | 3,177,832,766 | |
| MORTGAGE-RELATED: 33.7% | | | | | | | | |
FEDERAL AGENCY CMO & REMIC: 3.7% | | | | | |
Dept. of Veterans Affairs | | | | | | | | |
Series 1995-2D 4A, 9.293%, 5/15/25 | | | 152,429 | | | | 188,229 | |
Series 1997-2 Z, 7.50%, 6/15/27 | | | 10,461,320 | | | | 11,904,950 | |
Series 1998-2 2A, 8.708%, 8/15/27 | | | 40,663 | | | | 48,175 | |
Series 1998-1 1A, 8.212%, 3/15/28 | | | 260,397 | | | | 303,949 | |
Fannie Mae | | | | | | | | |
Trust 1998-58 PX, 6.50%, 9/25/28 | | | 476,845 | | | | 529,899 | |
Trust 1998-58 PC, 6.50%, 10/25/28 | | | 2,513,280 | | | | 2,826,980 | |
Trust 2001-69 PQ, 6.00%, 12/25/31 | | | 2,942,020 | | | | 3,340,349 | |
Trust 2002-33 A1, 7.00%, 6/25/32 | | | 2,651,707 | | | | 3,032,004 | |
Trust 2002-69 Z, 5.50%, 10/25/32 | | | 362,748 | | | | 405,713 | |
Trust 2008-24 GD, 6.50%, 3/25/37 | | | 2,792,344 | | | | 3,102,690 | |
Trust 2007-47 PE, 5.00%, 5/25/37 | | | 7,174,159 | | | | 7,741,643 | |
Trust 2009-30 AG, 6.50%, 5/25/39 | | | 15,813,095 | | | | 17,243,626 | |
Trust 2009-53 QM, 5.50%, 5/25/39 | | | 4,032,455 | | | | 4,357,310 | |
Trust 2009-40 TB, 6.00%, 6/25/39 | | | 7,575,192 | | | | 8,451,970 | |
Trust 2001-T3 A1, 7.50%, 11/25/40 | | | 144,309 | | | | 169,148 | |
Trust 2010-123 WT, 7.00%, 11/25/40 | | | 59,891,985 | | | | 69,904,355 | |
Trust 2001-T7 A1, 7.50%, 2/25/41 | | | 94,910 | | | | 111,802 | |
Trust 2001-T5 A2, 6.99%, 6/19/41 | | | 55,975 | | | | 63,396 | |
Trust 2001-T5 A3, 7.50%, 6/19/41 | | | 274,029 | | | | 319,929 | |
Trust 2001-T4 A1, 7.50%, 7/25/41 | | | 2,550,842 | | | | 3,057,582 | |
Trust 2011-58 AT, 4.00%, 7/25/41 | | | 14,019,121 | | | | 14,652,786 | |
Trust 2001-T10 A1, 7.00%, 12/25/41 | | | 2,864,457 | | | | 3,336,812 | |
Trust 2013-106 MA, 4.00%, 2/25/42 | | | 28,212,240 | | | | 30,429,863 | |
Trust 2002-90 A1, 6.50%, 6/25/42 | | | 5,842,026 | | | | 6,667,662 | |
Trust 2002-W6 2A1, 6.383%, 6/25/42 | | | 3,384,223 | | | | 3,866,451 | |
Trust 2002-W8 A2, 7.00%, 6/25/42 | | | 1,922,134 | | | | 2,208,997 | |
Trust 2002-T16 A3, 7.50%, 7/25/42 | | | 4,225,756 | | | | 4,929,378 | |
Trust 2003-W2 1A2, 7.00%, 7/25/42 | | | 8,958,313 | | | | 10,421,555 | |
Trust 2003-W4 3A, 6.537%, 10/25/42 | | | 2,801,687 | | | | 3,184,316 | |
| | |
| See accompanying Notes to Financial Statements | | DODGE & COX INCOME FUND §PAGE 7 |
| | | | |
| PORTFOLIO OF INVESTMENTS (unaudited) | | | June 30, 2015 | |
| | | | | | | | |
| DEBT SECURITIES (continued) | | | | | | |
| | |
| | | PAR VALUE | | | VALUE | |
Trust 2012-121 NB, 7.00%, 11/25/42 | | $ | 1,906,017 | | | $ | 2,230,008 | |
Trust 2003-7 A1, 6.50%, 12/25/42 | | | 4,865,416 | | | | 5,545,358 | |
Trust 2003-W1 2A, 6.475%, 12/25/42 | | | 3,431,630 | | | | 3,983,422 | |
Trust 2012-133 HF, 0.537%, 12/25/42 | | | 54,421,910 | | | | 54,329,719 | |
Trust 2012-133 JF, 0.537%, 12/25/42 | | | 18,479,948 | | | | 18,480,133 | |
Trust 2012-134 FD, 0.537%, 12/25/42 | | | 1,472,238 | | | | 1,473,967 | |
Trust 2012-134 FT, 0.537%, 12/25/42 | | | 76,803,124 | | | | 77,406,489 | |
Trust 2012-148 LF, 0.487%, 1/25/43 | | | 62,409,829 | | | | 61,892,451 | |
Trust 2013-15 FA, 0.537%, 3/25/43 | | | 1,981,548 | | | | 1,990,213 | |
Trust 2013-98 FA, 0.737%, 9/25/43 | | | 51,256,220 | | | | 51,758,480 | |
Trust 2013-101 CF, 0.787%, 10/25/43 | | | 25,490,892 | | | | 25,762,855 | |
Trust 2013-101 FE, 0.787%, 10/25/43 | | | 40,654,362 | | | | 41,044,482 | |
Trust 2004-T1 1A2, 6.50%, 1/25/44 | | | 3,029,816 | | | | 3,597,013 | |
Trust 2004-W2 2A2, 7.00%, 2/25/44 | | | 165,943 | | | | 187,876 | |
Trust 2004-W2 5A, 7.50%, 3/25/44 | | | 7,678,771 | | | | 8,812,372 | |
Trust 2004-W8 3A, 7.50%, 6/25/44 | | | 5,689,856 | | | | 6,639,732 | |
Trust 2004-W14 1AF, 0.587%, 7/25/44 | | | 2,033,285 | | | | 1,997,493 | |
Trust 2004-W15 1A2, 6.50%, 8/25/44 | | | 1,267,381 | | | | 1,407,525 | |
Trust 2005-W1 1A3, 7.00%, 10/25/44 | | | 7,660,489 | | | | 8,786,911 | |
Trust 2001-79 BA, 7.00%, 3/25/45 | | | 937,320 | | | | 1,094,453 | |
Trust 2006-W1 1A1, 6.50%, 12/25/45 | | | 618,542 | | | | 697,906 | |
Trust 2006-W1 1A2, 7.00%, 12/25/45 | | | 4,550,175 | | | | 5,271,947 | |
Trust 2006-W1 1A3, 7.50%, 12/25/45 | | | 80,624 | | | | 93,519 | |
Trust 2006-W1 1A4, 8.00%, 12/25/45 | | | 5,134,497 | | | | 6,127,976 | |
Trust 2007-W10 1A, 6.297%, 8/25/47 | | | 20,563,738 | | | | 23,166,593 | |
Trust 2007-W10 2A, 6.31%, 8/25/47 | | | 5,881,021 | | | | 6,647,648 | |
Freddie Mac | | | | | | | | |
Series 2456 CJ, 6.50%, 6/15/32 | | | 266,011 | | | | 295,297 | |
Series 3312 AB, 6.50%, 6/15/32 | | | 4,934,195 | | | | 5,572,684 | |
Series T-41 2A, 5.904%, 7/25/32 | | | 323,953 | | | | 376,222 | |
Series 2587 ZU, 5.50%, 3/15/33 | | | 8,165,265 | | | | 8,858,169 | |
Series 2610 UA, 4.00%, 5/15/33 | | | 2,853,480 | | | | 2,981,607 | |
Series T-48 1A, 5.581%, 7/25/33 | | | 3,411,458 | | | | 3,951,676 | |
Series 2708 ZD, 5.50%, 11/15/33 | | | 31,755,462 | | | | 35,724,260 | |
Series 3204 ZM, 5.00%, 8/15/34 | | | 9,478,343 | | | | 10,639,231 | |
Series 3330 GZ, 5.50%, 6/15/37 | | | 8,061,474 | | | | 8,763,145 | |
Series 4091 JF, 0.686%, 6/15/41 | | | 35,441,306 | | | | 35,657,923 | |
Series 4120 YF, 0.536%, 10/15/42 | | | 83,044,190 | | | | 82,692,497 | |
Series 4122 FP, 0.586%, 10/15/42 | | | 43,590,326 | | | | 43,612,121 | |
Series 309 F4, 0.716%, 8/15/43 | | | 90,139,829 | | | | 89,982,517 | |
Series 311 F1, 0.736%, 8/15/43 | | | 121,361,290 | | | | 122,172,740 | |
Series 4240 FA, 0.686%, 8/15/43 | | | 20,965,078 | | | | 21,187,539 | |
Series T-51 1A, 6.50%, 9/25/43 | | | 76,000 | | | | 90,200 | |
Series 4259 FA, 0.686%, 10/15/43 | | | 36,232,306 | | | | 36,555,353 | |
Series 4281 BC, 5.378%, 12/15/43 | | | 209,428,788 | | | | 229,168,917 | |
Series 4283 DW, 5.395%, 12/15/43 | | | 126,715,000 | | | | 139,460,628 | |
Series 4283 EW, 5.233%, 12/15/43 | | | 77,420,658 | | | | 85,220,247 | |
Series 4310 FA, 0.736%, 2/15/44 | | | 3,199,487 | | | | 3,233,626 | |
Series 4319 MA, 5.533%, 3/15/44 | | | 38,337,000 | | | | 42,112,619 | |
| | | | | | | | |
| | | | | | | 1,645,537,278 | |
FEDERAL AGENCY MORTGAGE PASS-THROUGH: 30.0% | |
Fannie Mae, 10 Year
6.00%, 11/1/16 | | | 505,225 | | | | 517,539 | |
Fannie Mae, 15 Year | | | | | | | | |
3.50%, 8/1/26-3/1/29 | | | 815,101,059 | | | | 860,638,444 | |
4.00%, 9/1/25-5/1/29 | | | 242,961,632 | | | | 259,504,896 | |
4.50%, 3/1/29 | | | 54,522,133 | | | | 58,353,759 | |
5.00%, 9/1/25 | | | 88,581,889 | | | | 95,988,156 | |
5.50%, 1/1/18-7/1/25 | | | 240,170,659 | | | | 262,474,832 | |
6.00%, 7/1/16-3/1/23 | | | 90,927,160 | | | | 98,243,139 | |
6.50%, 5/1/16-12/1/19 | | | 8,745,657 | | | | 9,053,244 | |
7.00%, 11/1/17 | | | 14,819 | | | | 15,189 | |
7.50%, 8/1/17 | | | 183,878 | | | | 187,699 | |
Fannie Mae, 20 Year | | | | | | | | |
4.00%, 9/1/30-6/1/35 | | | 2,658,509,246 | | | | 2,841,571,841 | |
4.50%, 3/1/29-1/1/34 | | | 837,538,059 | | | | 908,678,375 | |
| | | | | | | | |
| | |
| | | PAR VALUE | | | VALUE | |
Fannie Mae, 30 Year | | | | | | | | |
4.50%, 6/1/36-10/1/44 | | $ | 789,521,222 | | | $ | 855,858,482 | |
5.00%, 7/1/37 | | | 18,971,297 | | | | 20,997,510 | |
5.50%, 2/1/33-11/1/39 | | | 314,380,253 | | | | 354,388,424 | |
6.00%, 11/1/28-2/1/39 | | | 202,684,172 | | | | 232,544,217 | |
6.50%, 12/1/32-8/1/39 | | | 87,328,616 | | | | 100,630,308 | |
7.00%, 4/1/32-2/1/39 | | | 127,997,836 | | | | 150,473,934 | |
Fannie Mae, 40 Year
4.50%, 1/1/52 | | | 15,873,833 | | | | 17,009,149 | |
Fannie Mae, Hybrid ARM | | | | | | | | |
1.795%, 8/1/34 | | | 2,453,438 | | | | 2,572,258 | |
1.854%, 10/1/34 | | | 3,130,187 | | | | 3,311,327 | |
1.87%, 1/1/35 | | | 3,759,111 | | | | 3,950,157 | |
1.879%, 6/1/43 | | | 7,357,703 | | | | 7,576,205 | |
1.904%, 8/1/35 | | | 2,889,598 | | | | 3,049,318 | |
1.945%, 11/1/35 | | | 2,940,869 | | | | 3,095,662 | |
1.962%, 9/1/43 | | | 15,938,236 | | | | 16,435,325 | |
1.968%, 8/1/35 | | | 9,719,618 | | | | 10,275,239 | |
2.00%, 4/1/35 | | | 4,708,117 | | | | 4,990,744 | |
2.026%, 7/1/35 | | | 1,891,169 | | | | 2,006,910 | |
2.094%, 1/1/37 | | | 4,735,678 | | | | 5,020,230 | |
2.112%, 9/1/34 | | | 3,805,844 | | | | 4,042,167 | |
2.137%, 7/1/35 | | | 2,208,184 | | | | 2,341,874 | |
2.167%, 10/1/35 | | | 3,832,518 | | | | 4,088,925 | |
2.17%, 4/1/44 | | | 97,012,366 | | | | 100,801,586 | |
2.185%, 1/1/36 | | | 5,225,391 | | | | 5,588,702 | |
2.188%, 12/1/35 | | | 2,248,186 | | | | 2,401,431 | |
2.221%, 10/1/38 | | | 10,517,965 | | | | 11,223,641 | |
2.224%, 10/1/38 | | | 5,759,364 | | | | 6,092,962 | |
2.248%, 10/1/35 | | | 2,954,033 | | | | 3,147,097 | |
2.271%, 1/1/36 | | | 6,295,020 | | | | 6,696,029 | |
2.272%, 5/1/43 | | | 6,543,107 | | | | 6,616,236 | |
2.274%, 9/1/35 | | | 3,473,120 | | | | 3,691,446 | |
2.293%, 12/1/42 | | | 30,614,406 | | | | 30,916,271 | |
2.297%, 8/1/34 | | | 853,614 | | | | 909,668 | |
2.306%, 7/1/35 | | | 2,733,397 | | | | 2,902,653 | |
2.307%, 10/1/33 | | | 3,594,218 | | | | 3,827,740 | |
2.317%, 10/1/43 | | | 71,354,801 | | | | 73,000,244 | |
2.321%, 7/1/34 | | | 3,637,638 | | | | 3,856,024 | |
2.326%, 8/1/35 | | | 5,437,511 | | | | 5,842,223 | |
2.348%, 2/1/44 | | | 5,762,622 | | | | 5,957,312 | |
2.357%, 11/1/36-5/1/38 | | | 244,217,924 | | | | 259,745,268 | |
2.368%, 12/1/36 | | | 4,190,956 | | | | 4,457,140 | |
2.375%, 9/1/38 | | | 1,164,691 | | | | 1,259,950 | |
2.381%, 9/1/42 | | | 19,288,521 | | | | 19,861,984 | |
2.424%, 2/1/43 | | | 24,951,829 | | | | 25,721,812 | |
2.436%, 6/1/35 | | | 1,434,633 | | | | 1,510,871 | |
2.473%, 7/1/35 | | | 2,237,833 | | | | 2,376,219 | |
2.48%, 5/1/44 | | | 27,734,841 | | | | 28,685,234 | |
2.492%, 1/1/36 | | | 25,171,458 | | | | 26,823,979 | |
2.499%, 11/1/42 | | | 16,625,477 | | | | 17,143,036 | |
2.50%, 10/1/44 | | | 12,943,916 | | | | 13,200,655 | |
2.512%, 1/1/35 | | | 1,537,643 | | | | 1,647,250 | |
2.593%, 4/1/42 | | | 22,211,324 | | | | 23,046,368 | |
2.607%, 2/1/37 | | | 11,463,626 | | | | 12,336,512 | |
2.675%, 10/1/44 | | | 24,837,355 | | | | 25,476,482 | |
2.684%, 4/1/44 | | | 32,156,500 | | | | 33,442,999 | |
2.701%, 2/1/43 | | | 11,820,666 | | | | 12,351,315 | |
2.709%, 11/1/43 | | | 27,865,392 | | | | 28,688,266 | |
2.716%, 12/1/44 | | | 12,978,417 | | | | 13,316,396 | |
2.721%, 2/1/45 | | | 40,525,769 | | | | 41,574,486 | |
2.735%, 12/1/44 | | | 8,542,754 | | | | 8,769,025 | |
2.74%, 10/1/44 | | | 19,394,926 | | | | 19,926,413 | |
2.746%, 11/1/44 | | | 9,819,594 | | | | 10,089,247 | |
2.748%, 12/1/44 | | | 8,540,511 | | | | 8,770,727 | |
2.759%, 9/1/44 | | | 20,915,093 | | | | 21,515,574 | |
| | |
| PAGE 8 § DODGE & COX INCOME FUND | | See accompanying Notes to Financial Statements |
| | | | |
| PORTFOLIO OF INVESTMENTS (unaudited) | | | June 30, 2015 | |
| | | | | | | | |
| DEBT SECURITIES (continued) | | | | | | |
| | |
| | | PAR VALUE | | | VALUE | |
2.772%, 9/1/44 | | $ | 19,655,611 | | | $ | 20,218,920 | |
2.778%, 10/1/44-11/1/44 | | | 37,023,156 | | | | 38,083,910 | |
2.80%, 12/1/44 | | | 62,844,145 | | | | 64,655,687 | |
2.802%, 2/1/44 | | | 11,592,068 | | | | 11,958,338 | |
2.806%, 10/1/44 | | | 66,400,349 | | | | 68,390,388 | |
2.814%, 8/1/44 | | | 20,978,799 | | | | 21,607,425 | |
2.822%, 10/1/44 | | | 37,158,235 | | | | 38,284,034 | |
2.823%, 12/1/44 | | | 29,738,604 | | | | 30,616,069 | |
2.831%, 8/1/44 | | | 55,226,527 | | | | 56,934,302 | |
2.844%, 10/1/44 | | | 22,770,111 | | | | 23,471,519 | |
2.847%, 10/1/44 | | | 25,770,659 | | | | 26,561,673 | |
2.863%, 11/1/44 | | | 35,654,041 | | | | 36,769,003 | |
2.869%, 11/1/44 | | | 34,935,009 | | | | 36,012,857 | |
2.87%, 7/1/44 | | | 31,884,444 | | | | 32,916,986 | |
2.891%, 9/1/44 | | | 67,622,313 | | | | 69,820,692 | |
2.893%, 10/1/44 | | | 11,052,639 | | | | 11,402,938 | |
2.894%, 9/1/44 | | | 9,180,604 | | | | 9,476,408 | |
2.902%, 7/1/44 | | | 22,493,098 | | | | 23,246,511 | |
2.905%, 10/1/44 | | | 19,711,007 | | | | 20,335,694 | |
2.911%, 2/1/44 | | | 18,556,762 | | | | 19,210,840 | |
2.913%, 8/1/44 | | | 13,346,446 | | | | 13,780,228 | |
2.923%, 11/1/44 | | | 35,389,957 | | | | 36,538,895 | |
2.925%, 9/1/43 | | | 14,094,271 | | | | 14,609,048 | |
2.934%, 10/1/44 | | | 43,813,191 | | | | 45,259,275 | |
2.935%, 1/1/45 | | | 27,189,379 | | | | 28,073,078 | |
2.941%, 7/1/44 | | | 17,638,930 | | | | 18,236,839 | |
2.947%, 11/1/43 | | | 23,158,828 | | | | 23,828,878 | |
2.966%, 4/1/44 | | | 13,475,214 | | | | 13,958,484 | |
2.969%, 4/1/44-11/1/44 | | | 45,303,202 | | | | 46,850,021 | |
2.975%, 10/1/44 | | | 25,719,917 | | | | 26,586,907 | |
2.977%, 7/1/44 | | | 12,696,549 | | | | 13,144,158 | |
3.003%, 9/1/44 | | | 38,763,216 | | | | 40,142,500 | |
3.022%, 8/1/44 | | | 18,175,010 | | | | 18,834,251 | |
3.049%, 5/1/44 | | | 51,756,478 | | | | 53,739,118 | |
3.212%, 4/1/44 | | | 39,677,212 | | | | 41,079,741 | |
3.233%, 10/1/38 | | | 2,684,122 | | | | 2,869,029 | |
3.454%, 7/1/41 | | | 85,004,735 | | | | 90,403,931 | |
4.114%, 12/1/39 | | | 4,701,678 | | | | 4,984,249 | |
4.958%, 4/1/38 | | | 1,007,758 | | | | 1,084,962 | |
5.031%, 5/1/38 | | | 3,544,126 | | | | 3,811,664 | |
5.146%, 8/1/37 | | | 720,150 | | | | 757,784 | |
5.315%, 6/1/39 | | | 1,590,993 | | | | 1,707,524 | |
5.536%, 11/1/37 | | | 2,249,216 | | | | 2,404,545 | |
5.596%, 4/1/37 | | | 751,866 | | | | 801,436 | |
5.621%, 7/1/36 | | | 70,453 | | | | 70,921 | |
5.878%, 12/1/36 | | | 1,668,739 | | | | 1,786,147 | |
5.892%, 8/1/37 | | | 3,889,509 | | | | 4,164,983 | |
Fannie Mae, Multifamily DUS | | | | | | | | |
Trust 2014-M13 ASQ2, 1.637%, 11/25/17 | | | 63,297,237 | | | | 63,979,645 | |
Pool AL6445, 2.418%, 1/1/22 | | | 24,898,671 | | | | 25,555,024 | |
Pool AL6455, 2.613%, 11/1/21 | | | 33,108,500 | | | | 34,304,375 | |
Pool AL6028, 2.859%, 7/1/21 | | | 5,533,207 | | | | 5,714,538 | |
Pool 735745, 4.949%, 1/1/17 | | | 550 | | | | 549 | |
Pool 745629, 5.251%, 1/1/18 | | | 208,041 | | | | 215,162 | |
Pool 462084, 5.275%, 11/1/15 | | | 30,702 | | | | 30,726 | |
Pool 888559, 5.452%, 6/1/17 | | | 20,893,939 | | | | 22,218,978 | |
Pool 888015, 5.521%, 11/1/16 | | | 34,270,080 | | | | 35,012,138 | |
Pool 745936, 6.082%, 8/1/16 | | | 711,825 | | | | 735,695 | |
Freddie Mac, Hybrid ARM | | | | | | | | |
1.79%, 1/1/36 | | | 3,650,986 | | | | 3,865,658 | |
1.993%, 8/1/36 | | | 4,131,729 | | | | 4,349,647 | |
2.054%, 2/1/38 | | | 13,022,090 | | | | 13,782,960 | |
2.135%, 10/1/35 | | | 4,900,394 | | | | 5,208,456 | |
2.139%, 7/1/37 | | | 11,167,513 | | | | 11,893,929 | |
2.156%, 1/1/36 | | | 4,528,280 | | | | 4,841,253 | |
2.157%, 1/1/35 | | | 2,043,520 | | | | 2,168,713 | |
| | | | | | | | |
| | |
| | | PAR VALUE | | | VALUE | |
2.189%, 3/1/37 | | $ | 5,387,220 | | | $ | 5,736,944 | |
2.216%, 4/1/37 | | | 1,816,587 | | | | 1,928,699 | |
2.279%, 9/1/33 | | | 9,511,146 | | | | 10,130,833 | |
2.299%, 8/1/34-1/1/37 | | | 5,828,986 | | | | 6,218,630 | |
2.305%, 8/1/35 | | | 2,454,933 | | | | 2,610,153 | |
2.329%, 9/1/35 | | | 3,754,873 | | | | 4,026,376 | |
2.33%, 6/1/38 | | | 6,717,276 | | | | 7,126,415 | |
2.336%, 5/1/37 | | | 5,320,256 | | | | 5,649,667 | |
2.347%, 4/1/37 | | | 3,169,218 | | | | 3,318,083 | |
2.37%, 8/1/35-1/1/36 | | | 14,586,931 | | | | 15,598,150 | |
2.372%, 4/1/35 | | | 1,398,232 | | | | 1,497,089 | |
2.375%, 11/1/34 | | | 1,981,215 | | | | 2,115,710 | |
2.384%, 2/1/34 | | | 7,524,941 | | | | 8,041,478 | |
2.392%, 10/1/38 | | | 3,944,015 | | | | 4,204,435 | |
2.395%, 4/1/38 | | | 10,887,641 | | | | 11,578,911 | |
2.416%, 3/1/35 | | | 1,949,054 | | | | 2,068,344 | |
2.459%, 7/1/43 | | | 12,765,431 | | | | 13,373,595 | |
2.467%, 4/1/38 | | | 12,948,838 | | | | 13,877,588 | |
2.479%, 10/1/38 | | | 1,561,076 | | | | 1,661,447 | |
2.49%, 2/1/35 | | | 1,398,563 | | | | 1,500,099 | |
2.496%, 4/1/36 | | | 6,175,510 | | | | 6,570,381 | |
2.731%, 1/1/45 | | | 26,584,735 | | | | 27,237,244 | |
2.75%, 11/1/44 | | | 34,703,061 | | | | 35,601,684 | |
2.761%, 10/1/43 | | | 5,077,655 | | | | 5,233,556 | |
2.777%, 9/1/44 | | | 20,807,067 | | | | 21,376,892 | |
2.801%, 12/1/44 | | | 8,670,307 | | | | 8,901,484 | |
2.833%, 11/1/44 | | | 13,938,125 | | | | 14,333,813 | |
2.834%, 9/1/44 | | | 23,769,822 | | | | 24,458,505 | |
2.838%, 11/1/44 | | | 27,668,669 | | | | 28,472,353 | |
2.842%, 10/1/44 | | | 12,294,839 | | | | 12,653,986 | |
2.843%, 10/1/44-1/1/45 | | | 50,813,498 | | | | 52,261,841 | |
2.849%, 10/1/44 | | | 28,098,054 | | | | 28,817,745 | |
2.877%, 12/1/44 | | | 23,638,368 | | | | 24,337,692 | |
2.893%, 6/1/44 | | | 14,837,707 | | | | 15,311,684 | |
2.911%, 12/1/44 | | | 42,382,527 | | | | 43,663,196 | |
2.912%, 11/1/44 | | | 24,191,475 | | | | 24,928,959 | |
2.917%, 2/1/44 | | | 20,035,567 | | | | 20,717,135 | |
2.918%, 8/1/44-11/1/44 | | | 31,787,686 | | | | 32,784,112 | |
2.922%, 12/1/44 | | | 37,383,450 | | | | 38,536,300 | |
2.925%, 2/1/45 | | | 36,552,762 | | | | 37,658,869 | |
2.946%, 1/1/45 | | | 35,174,554 | | | | 36,271,923 | |
2.947%, 1/1/44 | | | 12,472,281 | | | | 12,913,468 | |
2.95%, 11/1/44 | | | 20,324,068 | | | | 20,970,279 | |
2.96%, 11/1/44 | | | 59,278,805 | | | | 61,176,460 | |
2.961%, 12/1/44 | | | 20,689,393 | | | | 21,347,009 | |
2.963%, 11/1/44-1/1/45 | | | 35,803,074 | | | | 36,951,651 | |
2.969%, 9/1/44 | | | 16,669,363 | | | | 17,218,632 | |
2.976%, 11/1/44 | | | 34,982,881 | | | | 36,126,180 | |
3.003%, 11/1/44 | | | 28,449,712 | | | | 29,386,016 | |
3.016%, 10/1/44 | | | 26,090,583 | | | | 26,969,247 | |
3.023%, 7/1/44 | | | 12,395,040 | | | | 12,816,229 | |
3.03%, 5/1/44 | | | 219,847,726 | | | | 227,853,644 | |
3.039%, 10/1/44 | | | 29,991,326 | | | | 31,021,259 | |
3.043%, 7/1/44 | | | 15,537,966 | | | | 16,066,116 | |
3.045%, 8/1/44 | | | 21,097,793 | | | | 21,835,138 | |
3.082%, 4/1/44 | | | 16,912,419 | | | | 17,520,781 | |
3.094%, 6/1/44 | | | 45,988,365 | | | | 47,687,980 | |
3.112%, 8/1/44 | | | 22,692,977 | | | | 23,520,040 | |
3.137%, 4/1/44 | | | 7,854,482 | | | | 8,148,470 | |
3.151%, 1/1/44 | | | 10,812,814 | | | | 11,200,599 | |
3.596%, 6/1/41 | | | 12,744,518 | | | | 13,671,946 | |
3.73%, 9/1/41 | | | 16,410,472 | | | | 17,472,707 | |
4.796%, 6/1/38 | | | 1,457,125 | | | | 1,551,988 | |
5.209%, 5/1/38 | | | 4,799,000 | | | | 5,176,979 | |
5.447%, 11/1/39 | | | 5,886,215 | | | | 6,283,415 | |
5.778%, 1/1/38 | | | 1,987,611 | | | | 2,122,384 | |
| | |
| See accompanying Notes to Financial Statements | | DODGE & COX INCOME FUND §PAGE 9 |
| | | | |
| PORTFOLIO OF INVESTMENTS (unaudited) | | | June 30, 2015 | |
| | | | | | | | |
| DEBT SECURITIES (continued) | | | | | | |
| | |
| | | PAR VALUE | | | VALUE | |
6.104%, 10/1/37 | | $ | 1,585,921 | | | $ | 1,700,467 | |
6.178%, 12/1/36 | | | 2,307,036 | | | | 2,476,164 | |
Freddie Mac Gold, 10 Year
6.00%, 9/1/16 | | | 186,243 | | | | 189,870 | |
Freddie Mac Gold, 15 Year | | | | | | | | |
4.00%, 6/1/26-6/1/27 | | | 433,345,430 | | | | 462,518,553 | |
4.50%, 3/1/25-6/1/26 | | | 28,991,571 | | | | 30,980,091 | |
5.50%, 10/1/20-12/1/24 | | | 15,288,255 | | | | 16,493,702 | |
6.00%, 8/1/16-11/1/23 | | | 30,136,256 | | | | 32,774,912 | |
6.50%, 5/1/16-9/1/18 | | | 2,528,307 | | | | 2,605,569 | |
Freddie Mac Gold, 20 Year | | | | | | | | |
4.00%, 9/1/31-6/1/35 | | | 374,310,885 | | | | 399,269,406 | |
4.50%, 5/1/30-1/1/34 | | | 203,142,506 | | | | 220,561,380 | |
6.00%, 7/1/25-12/1/27 | | | 39,414,340 | | | | 44,582,927 | |
6.50%, 7/1/21-10/1/26 | | | 4,932,831 | | | | 5,697,311 | |
Freddie Mac Gold, 30 Year | | | | | | | | |
4.50%, 3/1/39-8/1/44 | | | 819,866,357 | | | | 887,418,112 | |
5.50%, 3/1/34-12/1/38 | | | 110,841,916 | | | | 124,580,953 | |
6.00%, 2/1/33-2/1/39 | | | 45,742,912 | | | | 52,026,989 | |
6.50%, 12/1/32-10/1/38 | | | 26,320,422 | | | | 30,177,317 | |
7.00%, 4/1/31-11/1/38 | | | 7,446,872 | | | | 8,717,432 | |
7.90%, 2/17/21 | | | 431,737 | | | | 475,304 | |
Ginnie Mae, 30 Year | | | | | | | | |
7.00%, 5/15/28 | | | 483,314 | | | | 565,367 | |
7.50%, 9/15/17-5/15/25 | | | 1,723,695 | | | | 2,004,024 | |
7.80%, 6/15/20-1/15/21 | | | 379,343 | | | | 408,674 | |
7.85%, 1/15/21-10/15/21 | | | 7,447 | | | | 7,519 | |
8.00%, 9/15/20 | | | 7,788 | | | | 8,591 | |
| | | | | | | | |
| | | | | | | 13,294,095,438 | |
PRIVATE LABEL CMO & REMIC: 0.0%(f) | | | | | |
GSMPS Mortgage Loan Trust
Series 2004-4 1A4,
8.50%, 6/25/34 30 Year(b) | | | 5,373,232 | | | | 5,744,813 | |
| | | | | | | | |
| | | | | | | 14,945,377,529 | |
| ASSET-BACKED: 8.0% | | | | | | | | |
AUTO LOAN: 1.0% | | | | | | | | |
Ford Credit Auto Owner Trust | | | | | | | | |
Series 2012-B A4, 1.00%, 9/15/17 | | | 10,000,000 | | | | 10,016,370 | |
Series 2014-C A3, 1.06%, 5/15/19 | | | 9,025,000 | | | | 9,031,688 | |
Series 2015-B A3, 1.16%, 11/15/19 | | | 57,115,000 | | | | 57,098,951 | |
Series 2015-1 A, 2.12%, 7/15/26(b) | | | 200,480,000 | | | | 200,415,846 | |
Toyota Auto Receivables Owner Trust | | | | | | | | |
Series 2014-B A3, 0.76%, 3/15/18 | | | 13,555,000 | | | | 13,538,775 | |
Series 2014-C A3, 0.93%, 7/16/18 | | | 100,000,000 | | | | 99,934,800 | |
Series 2015-A A3, 1.12%, 2/15/19 | | | 8,325,000 | | | | 8,339,694 | |
Series 2014-C A4, 1.44%, 4/15/20 | | | 20,975,000 | | | | 21,024,081 | |
| | | | | | | | |
| | | | | | | 419,400,205 | |
CREDIT CARD: 4.2% | | | | | | | | |
American Express Master Trust | | | | | | | | |
Series 2014-2 A, 1.26%, 1/15/20 | | | 10,900,000 | | | | 10,912,982 | |
Series 2014-3 A, 1.49%, 4/15/20 | | | 381,035,481 | | | | 382,949,803 | |
Series 2014-4 A, 1.43%, 6/15/20 | | | 179,201,000 | | | | 179,493,277 | |
Chase Issuance Trust | | | | | | | | |
Series 2012-A8 A8, 0.54%, 10/16/17 | | | 358,637,000 | | | | 358,681,471 | |
Series 2006-A2 A2, 5.16%, 4/16/18 | | | 17,465,000 | | | | 17,964,464 | |
Series 2013-A8 A8, 1.01%, 10/15/18 | | | 11,740,000 | | | | 11,752,891 | |
Series 2014-A1 A1, 1.15%, 1/15/19 | | | 152,146,000 | | | | 152,449,379 | |
Series 2014-A6 A6, 1.26%, 7/15/19 | | | 24,285,000 | | | | 24,293,913 | |
Series 2014-A7 A7, 1.38%, 11/15/19 | | | 250,740,000 | | | | 251,205,875 | |
Series 2015-A2 A2, 1.59%, 2/18/20 | | | 366,140,000 | | | | 367,943,239 | |
Series 2015-A5 A5, 1.36%, 4/15/20 | | | 116,696,000 | | | | 116,427,132 | |
| | | | | | | | |
| | | | | | | 1,874,074,426 | |
OTHER: 2.1% | | | | | | | | |
Rio Oil Finance Trust(c) (Brazil) | | | | | | | | |
6.25%, 7/6/24(b) | | | 544,912,000 | | | | 535,376,040 | |
6.75%, 1/6/27(b) | | | 379,375,000 | | | | 367,993,750 | |
| | | | | | | | |
| | | | | | | 903,369,790 | |
| | | | | | | | |
| | |
| | | PAR VALUE | | | VALUE | |
STUDENT LOAN: 0.7% | | | | | | | | |
Navient Student Loan Trust (Private Loans)
Series 2014-AA A2A,
2.74%, 2/15/29(b) | | $ | 35,880,000 | | | $ | 36,025,673 | |
SLM Student Loan Trust | | | | | | | | |
Series 2007-3 A2, 0.287%, 10/25/17 | | | 690,811 | | | | 690,512 | |
SLM Student Loan Trust (Private Loans) | | | | | | | | |
Series 2013-A A2A, 1.77%, 5/17/27(b) | | | 58,445,000 | | | | 58,060,841 | |
Series 2012-B A2, 3.48%, 10/15/30(b) | | | 70,720,000 | | | | 73,227,095 | |
Series 2013-C A2A, 2.94%, 10/15/31(b) | | | 41,885,000 | | | | 43,111,979 | |
Series 2012-E A2A, 2.09%, 6/15/45(b) | | | 14,555,000 | | | | 14,656,885 | |
Series 2012-C A2, 3.31%, 10/15/46(b) | | | 94,748,000 | | | | 98,193,416 | |
| | | | | | | | |
| | | | | | | 323,966,401 | |
| | | | | | | | |
| | | | | | | 3,520,810,822 | |
| CORPORATE: 40.4% | | | | | | | | |
FINANCIALS: 14.7% | | | | | | | | |
Anthem, Inc. | | | | | | | | |
5.875%, 6/15/17 | | | 16,016,000 | | | | 17,389,596 | |
7.00%, 2/15/19 | | | 83,470,000 | | | | 95,269,319 | |
2.25%, 8/15/19 | | | 7,400,000 | | | | 7,304,858 | |
4.35%, 8/15/20 | | | 5,000,000 | | | | 5,405,850 | |
3.70%, 8/15/21 | | | 48,839,000 | | | | 49,921,516 | |
Bank of America Corp. | | | | | | | | |
7.625%, 6/1/19 | | | 198,582,000 | | | | 235,493,231 | |
5.625%, 7/1/20 | | | 71,390,000 | | | | 80,373,718 | |
4.20%, 8/26/24 | | | 143,895,000 | | | | 143,344,458 | |
4.25%, 10/22/26 | | | 127,024,000 | | | | 123,730,776 | |
6.625%, 5/23/36(a) | | | 240,328,000 | | | | 269,557,893 | |
Barclays PLC(c) (United Kingdom) | | | | | | | | |
4.375%, 9/11/24 | | | 275,404,000 | | | | 264,130,613 | |
BNP Paribas SA(c) (France) | | | | | | | | |
4.25%, 10/15/24 | | | 374,877,000 | | | | 371,163,094 | |
Boston Properties, Inc. | | | | | | | | |
3.70%, 11/15/18 | | | 46,967,000 | | | | 49,456,674 | |
5.875%, 10/15/19 | | | 48,079,000 | | | | 54,545,337 | |
5.625%, 11/15/20 | | | 79,385,000 | | | | 90,620,200 | |
4.125%, 5/15/21 | | | 52,852,000 | | | | 56,092,356 | |
3.85%, 2/1/23 | | | 78,371,000 | | | | 80,153,235 | |
3.125%, 9/1/23 | | | 41,540,000 | | | | 40,326,118 | |
3.80%, 2/1/24 | | | 85,384,000 | | | | 86,294,535 | |
Capital One Financial Corp. | | | | | | | | |
4.75%, 7/15/21 | | | 182,195,000 | | | | 198,802,074 | |
3.50%, 6/15/23 | | | 193,115,000 | | | | 189,817,368 | |
3.75%, 4/24/24 | | | 36,940,000 | | | | 36,718,397 | |
3.20%, 2/5/25 | | | 67,240,000 | | | | 63,400,798 | |
Cigna Corp. | | | | | | | | |
4.00%, 2/15/22 | | | 62,964,000 | | | | 64,816,212 | |
7.65%, 3/1/23 | | | 6,317,000 | | | | 7,868,702 | |
7.875%, 5/15/27 | | | 33,255,000 | | | | 44,189,344 | |
8.30%, 1/15/33 | | | 8,195,000 | | | | 10,375,804 | |
6.15%, 11/15/36 | | | 88,097,000 | | | | 101,335,689 | |
5.875%, 3/15/41 | | | 14,504,000 | | | | 16,449,102 | |
5.375%, 2/15/42 | | | 54,405,000 | | | | 58,212,099 | |
Citigroup, Inc. | | | | | | | | |
1.974%, 5/15/18 | | | 140,345,000 | | | | 144,018,811 | |
3.50%, 5/15/23 | | | 105,730,000 | | | | 103,094,785 | |
7.875%, 10/30/40(a) | | | 381,543,025 | | | | 396,194,277 | |
Equity Residential | | | | | | | | |
4.75%, 7/15/20 | | | 5,200,000 | | | | 5,723,416 | |
4.625%, 12/15/21 | | | 94,097,000 | | | | 102,561,496 | |
3.00%, 4/15/23 | | | 47,300,000 | | | | 45,793,732 | |
3.375%, 6/1/25 | | | 77,890,000 | | | | 76,307,665 | |
| | |
| PAGE 10 § DODGE & COX INCOME FUND | | See accompanying Notes to Financial Statements |
| | | | |
| PORTFOLIO OF INVESTMENTS (unaudited) | | | June 30, 2015 | |
| | | | | | | | |
| DEBT SECURITIES (continued) | | | | | | |
| | |
| | | PAR VALUE | | | VALUE | |
General Electric Co. | | | | | | | | |
5.50%, 1/8/20 | | $ | 171,791,000 | | | $ | 194,591,617 | |
4.375%, 9/16/20 | | | 72,991,000 | | | | 79,407,858 | |
4.625%, 1/7/21 | | | 75,536,000 | | | | 83,085,597 | |
4.65%, 10/17/21 | | | 79,525,000 | | | | 87,057,369 | |
Health Net, Inc. | | | | | | | | |
6.375%, 6/1/17 | | | 120,854,000 | | | | 127,803,105 | |
HSBC Holdings PLC(c) (United Kingdom) | | | | | | | | |
5.10%, 4/5/21 | | | 85,935,000 | | | | 95,698,763 | |
9.30%, 6/1/21 | | | 100,000 | | | | 130,682 | |
6.50%, 5/2/36 | | | 179,105,000 | | | | 212,391,127 | |
6.50%, 9/15/37 | | | 185,136,000 | | | | 222,746,193 | |
6.80%, 6/1/38 | | | 32,000,000 | | | | 39,413,920 | |
JPMorgan Chase & Co. | | | | | | | | |
3.375%, 5/1/23 | | | 92,238,000 | | | | 89,449,830 | |
4.125%, 12/15/26 | | | 106,000,000 | | | | 104,049,600 | |
8.75%, 9/1/30(a) | | | 48,438,000 | | | | 68,094,625 | |
Lloyds Banking Group PLC(c) (United Kingdom) | | | | | | | | |
4.50%, 11/4/24 | | | 149,720,000 | | | | 149,594,385 | |
Navient Corp. | | | | | | | | |
3.875%, 9/10/15 | | | 56,710,000 | | | | 56,780,887 | |
6.00%, 1/25/17 | | | 166,603,000 | | | | 173,267,120 | |
4.625%, 9/25/17 | | | 111,437,000 | | | | 113,247,851 | |
8.45%, 6/15/18 | | | 149,638,000 | | | | 166,292,709 | |
Royal Bank of Scotland Group PLC(c) (United Kingdom) | | | | | | | | |
6.125%, 12/15/22 | | | 290,577,000 | | | | 312,533,579 | |
6.00%, 12/19/23 | | | 264,320,000 | | | | 279,545,889 | |
Unum Group | | | | | | | | |
6.85%, 11/15/15(b) | | | 10,588,000 | | | | 10,809,374 | |
7.19%, 2/1/28 | | | 11,295,000 | | | | 13,444,969 | |
7.25%, 3/15/28 | | | 25,060,000 | | | | 30,829,714 | |
6.75%, 12/15/28 | | | 8,107,000 | | | | 9,826,122 | |
| | | | | | | | |
| | | | | | | 6,506,346,033 | |
INDUSTRIALS: 24.5% | | | | | | | | |
Allergan PLC(c) (Ireland) | | | | | | | | |
3.00%, 3/12/20 | | | 181,325,000 | | | | 181,816,753 | |
3.80%, 3/15/25 | | | 168,760,000 | | | | 165,525,546 | |
AT&T, Inc. | | | | | | | | |
3.40%, 5/15/25 | | | 66,280,000 | | | | 62,931,203 | |
8.25%, 11/15/31 | | | 190,653,000 | | | | 258,094,020 | |
6.55%, 2/15/39 | | | 59,430,000 | | | | 68,077,362 | |
5.35%, 9/1/40 | | | 59,744,000 | | | | 58,631,149 | |
4.75%, 5/15/46 | | | 74,170,000 | | | | 67,146,546 | |
Becton, Dickinson and Co. | | | | | | | | |
3.734%, 12/15/24 | | | 46,675,000 | | | | 46,448,626 | |
Boston Scientific Corp. | | | | | | | | |
6.00%, 1/15/20 | | | 15,690,000 | | | | 17,753,047 | |
Burlington Northern Santa Fe LLC(e) | | | | | | | | |
4.70%, 10/1/19 | | | 75,445,000 | | | | 83,096,481 | |
7.57%, 1/2/21 | | | 10,543,615 | | | | 11,910,342 | |
8.251%, 1/15/21 | | | 4,301,710 | | | | 4,968,372 | |
4.10%, 6/1/21 | | | 5,820,000 | | | | 6,241,758 | |
3.05%, 9/1/22 | | | 39,535,000 | | | | 39,356,895 | |
5.943%, 1/15/23 | | | 57,582 | | | | 62,543 | |
3.85%, 9/1/23 | | | 89,340,000 | | | | 92,479,229 | |
5.72%, 1/15/24 | | | 15,820,891 | | | | 17,745,139 | |
3.75%, 4/1/24 | | | 29,682,000 | | | | 30,210,696 | |
5.342%, 4/1/24 | | | 5,231,910 | | | | 5,744,376 | |
5.629%, 4/1/24 | | | 21,177,259 | | | | 23,590,344 | |
5.996%, 4/1/24 | | | 40,418,999 | | | | 46,312,089 | |
3.442%, 6/16/28(b) | | | 90,750,000 | | | | 90,139,253 | |
Cemex SAB de CV(c) (Mexico) | | | | | | | | |
6.50%, 12/10/19(b) | | | 138,875,000 | | | | 145,777,087 | |
7.25%, 1/15/21(b) | | | 130,945,000 | | | | 138,173,164 | |
| | | | | | | | |
| | |
| | | PAR VALUE | | | VALUE | |
6.00%, 4/1/24(b) | | $ | 95,475,000 | | | $ | 94,491,607 | |
5.70%, 1/11/25(b) | | | 88,151,000 | | | | 84,069,609 | |
6.125%, 5/5/25(b) | | | 60,000,000 | | | | 59,202,000 | |
Comcast Corp. | | | | | | | | |
6.50%, 1/15/17 | | | 18,373,000 | | | | 19,871,410 | |
6.30%, 11/15/17 | | | 16,175,000 | | | | 18,001,934 | |
5.875%, 2/15/18 | | | 68,310,000 | | | | 75,768,154 | |
5.70%, 5/15/18 | | | 2,645,000 | | | | 2,945,596 | |
Cox Enterprises, Inc. | | | | | | | | |
5.50%, 10/1/15 | | | 265,000 | | | | 267,986 | |
5.875%, 12/1/16(b) | | | 76,215,000 | | | | 80,880,806 | |
9.375%, 1/15/19(b) | | | 145,119,000 | | | | 177,058,531 | |
3.25%, 12/15/22(b) | | | 147,403,000 | | | | 140,342,101 | |
2.95%, 6/30/23(b) | | | 241,788,000 | | | | 222,545,060 | |
3.85%, 2/1/25(b) | | | 197,601,000 | | | | 189,621,081 | |
CRH PLC(c) (Ireland) | | | | | | | | |
3.875%, 5/18/25(b) | | | 165,209,000 | | | | 163,461,419 | |
CSX Corp. | | | | | | | | |
9.75%, 6/15/20 | | | 10,067,000 | | | | 13,138,613 | |
6.251%, 1/15/23 | | | 16,255,473 | | | | 19,037,565 | |
3.40%, 8/1/24 | | | 38,025,000 | | | | 37,993,781 | |
Dillard’s, Inc. | | | | | | | | |
7.13%, 8/1/18 | | | 23,565,000 | | | | 26,569,538 | |
7.875%, 1/1/23 | | | 275,000 | | | | 326,563 | |
7.75%, 7/15/26 | | | 21,016,000 | | | | 24,326,020 | |
7.75%, 5/15/27 | | | 12,848,000 | | | | 14,871,560 | |
7.00%, 12/1/28 | | | 28,225,000 | | | | 31,188,625 | |
Dow Chemical Co. | | | | | | | | |
8.55%, 5/15/19 | | | 156,085,000 | | | | 190,177,866 | |
4.25%, 11/15/20 | | | 12,475,000 | | | | 13,294,483 | |
3.00%, 11/15/22 | | | 24,240,000 | | | | 23,290,713 | |
7.375%, 11/1/29 | | | 58,144,000 | | | | 73,165,502 | |
9.40%, 5/15/39 | | | 135,313,000 | | | | 203,086,681 | |
5.25%, 11/15/41 | | | 12,378,000 | | | | 12,585,270 | |
Eaton Corp. PLC(c) (Ireland) | | | | | | | | |
1.50%, 11/2/17 | | | 22,630,000 | | | | 22,574,557 | |
2.75%, 11/2/22 | | | 61,835,000 | | | | 60,067,818 | |
FedEx Corp. | | | | | | | | |
8.00%, 1/15/19 | | | 18,050,000 | | | | 21,563,396 | |
6.72%, 7/15/23 | | | 15,813,458 | | | | 18,285,102 | |
7.65%, 7/15/24 | | | 1,990,174 | | | | 2,398,160 | |
Ford Motor Credit Co. LLC(e) | | | | | | | | |
5.625%, 9/15/15 | | | 49,025,000 | | | | 49,470,098 | |
8.125%, 1/15/20 | | | 16,910,000 | | | | 20,634,428 | |
5.75%, 2/1/21 | | | 215,710,000 | | | | 241,852,326 | |
5.875%, 8/2/21 | | | 153,240,000 | | | | 174,279,852 | |
3.219%, 1/9/22 | | | 39,700,000 | | | | 39,211,611 | |
4.25%, 9/20/22 | | | 44,075,000 | | | | 45,847,608 | |
4.375%, 8/6/23 | | | 27,875,000 | | | | 29,019,436 | |
HCA Holdings, Inc. | | | | | | | | |
6.50%, 2/15/16 | | | 235,325,000 | | | | 242,530,651 | |
Hewlett-Packard Co. | | | | | | | | |
3.30%, 12/9/16 | | | 90,750,000 | | | | 93,142,351 | |
Kinder Morgan, Inc. | | | | | | | | |
3.45%, 2/15/23 | | | 23,425,000 | | | | 21,932,968 | |
3.50%, 9/1/23 | | | 43,211,000 | | | | 40,230,262 | |
5.625%, 11/15/23(b) | | | 49,500,000 | | | | 52,590,186 | |
4.15%, 2/1/24 | | | 47,997,000 | | | | 46,412,907 | |
4.25%, 9/1/24 | | | 13,705,000 | | | | 13,328,907 | |
4.30%, 6/1/25 | | | 182,605,000 | | | | 177,002,679 | |
6.95%, 1/15/38 | | | 40,793,000 | | | | 43,719,653 | |
6.50%, 9/1/39 | | | 1,850,000 | | | | 1,891,496 | |
5.00%, 8/15/42 | | | 50,179,000 | | | | 43,515,731 | |
5.00%, 3/1/43 | | | 58,135,000 | | | | 50,563,730 | |
5.50%, 3/1/44 | | | 50,435,000 | | | | 46,955,691 | |
5.40%, 9/1/44 | | | 54,034,000 | | | | 48,925,734 | |
| | |
| See accompanying Notes to Financial Statements | | DODGE & COX INCOME FUND §PAGE 11 |
| | | | |
| PORTFOLIO OF INVESTMENTS (unaudited) | | | June 30, 2015 | |
| | | | | | | | |
| DEBT SECURITIES (continued) | | | | | | |
| | |
| | | PAR VALUE | | | VALUE | |
Lafarge SA(c) (France) | | | | | | | | |
6.20%, 7/9/15(b) | | $ | 153,560,000 | | | $ | 153,490,898 | |
6.50%, 7/15/16 | | | 126,496,000 | | | | 132,504,560 | |
Macy’s, Inc. | | | | | | | | |
5.90%, 12/1/16 | | | 16,796,000 | | | | 17,893,333 | |
6.65%, 7/15/24 | | | 52,526,000 | | | | 63,762,677 | |
7.00%, 2/15/28 | | | 27,985,000 | | | | 34,658,163 | |
6.70%, 9/15/28 | | | 29,165,000 | | | | 34,688,647 | |
6.90%, 4/1/29 | | | 58,254,000 | | | | 71,108,444 | |
6.90%, 1/15/32 | | | 57,770,000 | | | | 71,224,517 | |
6.70%, 7/15/34 | | | 103,914,000 | | | | 126,204,073 | |
4.50%, 12/15/34 | | | 136,095,000 | | | | 130,190,518 | |
6.375%, 3/15/37 | | | 52,093,000 | | | | 61,723,172 | |
Naspers, Ltd.(c) (South Africa) | | | | | | | | |
6.00%, 7/18/20(b) | | | 206,034,000 | | | | 223,392,364 | |
Nordstrom, Inc. | | | | | | | | |
6.95%, 3/15/28 | | | 17,107,000 | | | | 21,715,985 | |
Norfolk Southern Corp. | | | | | | | | |
7.70%, 5/15/17 | | | 28,585,000 | | | | 31,770,227 | |
9.75%, 6/15/20 | | | 13,813,000 | | | | 18,054,779 | |
Reed Elsevier PLC(c) (United Kingdom) | | | | | | | | |
8.625%, 1/15/19 | | | 28,613,000 | | | | 34,387,590 | |
3.125%, 10/15/22 | | | 144,337,000 | | | | 140,516,400 | |
Sprint Corp. | | | | | | | | |
6.00%, 12/1/16 | | | 303,716,000 | | | | 314,725,705 | |
Telecom Italia SPA(c) (Italy) | | | | | | | | |
6.999%, 6/4/18 | | | 165,232,000 | | | | 181,953,478 | |
7.175%, 6/18/19 | | | 200,711,000 | | | | 225,548,986 | |
5.303%, 5/30/24(b) | | | 118,971,000 | | | | 118,524,859 | |
7.20%, 7/18/36 | | | 53,458,000 | | | | 58,402,865 | |
7.721%, 6/4/38 | | | 118,140,000 | | | | 132,907,500 | |
Time Warner Cable, Inc. | | | | | | | | |
8.75%, 2/14/19 | | | 130,460,000 | | | | 154,845,061 | |
8.25%, 4/1/19 | | | 237,543,000 | | | | 279,193,315 | |
5.00%, 2/1/20 | | | 20,700,000 | | | | 22,284,357 | |
4.125%, 2/15/21 | | | 30,545,000 | | | | 31,506,404 | |
4.00%, 9/1/21 | | | 40,609,000 | | | | 41,647,900 | |
Time Warner, Inc. | | | | | | | | |
7.625%, 4/15/31 | | | 281,417,000 | | | | 365,443,895 | |
7.70%, 5/1/32 | | | 209,171,000 | | | | 274,102,489 | |
TransCanada Corp. (c) (Canada) | | | | | | | | |
5.625%, 5/20/75(a) | | | 157,145,000 | | | | 158,520,019 | |
Twenty-First Century Fox, Inc. | | | | | | | | |
6.20%, 12/15/34 | | | 7,440,000 | | | | 8,610,848 | |
6.40%, 12/15/35 | | | 34,525,000 | | | | 40,732,699 | |
6.15%, 3/1/37 | | | 31,905,000 | | | | 36,782,700 | |
6.65%, 11/15/37 | | | 79,075,000 | | | | 95,945,019 | |
6.15%, 2/15/41 | | | 40,108,000 | | | | 46,425,892 | |
Union Pacific Corp. | | | | | | | | |
6.85%, 1/2/19 | | | 2,520,588 | | | | 2,717,262 | |
6.70%, 2/23/19 | | | 2,990,461 | | | | 3,227,449 | |
7.60%, 1/2/20 | | | 1,125,478 | | | | 1,298,552 | |
4.163%, 7/15/22 | | | 40,342,000 | | | | 43,275,953 | |
2.95%, 1/15/23 | | | 2,925,000 | | | | 2,927,641 | |
6.061%, 1/17/23 | | | 6,682,098 | | | | 7,490,137 | |
4.698%, 1/2/24 | | | 3,706,439 | | | | 4,000,144 | |
3.646%, 2/15/24 | | | 54,661,000 | | | | 56,192,492 | |
3.75%, 3/15/24 | | | 9,550,000 | | | | 10,029,381 | |
5.082%, 1/2/29 | | | 8,362,980 | | | | 9,194,310 | |
5.866%, 7/2/30 | | | 44,244,474 | | | | 50,875,809 | |
6.176%, 1/2/31 | | | 32,666,640 | | | | 38,867,879 | |
Verizon Communications, Inc. | | | | | | | | |
4.15%, 3/15/24 | | | 66,000,000 | | | | 67,652,376 | |
3.50%, 11/1/24 | | | 169,000,000 | | | | 164,135,166 | |
4.272%, 1/15/36(b) | | | 163,817,000 | | | | 146,933,692 | |
6.55%, 9/15/43 | | | 297,898,000 | | | | 348,300,554 | |
| | | | | | | | |
| | |
| | | PAR VALUE | | | VALUE | |
Vulcan Materials Co. | | | | | | | | |
7.50%, 6/15/21 | | $ | 142,484,000 | | | $ | 163,856,600 | |
Xerox Corp. | | | | | | | | |
6.40%, 3/15/16 | | | 72,137,000 | | | | 74,817,539 | |
7.20%, 4/1/16 | | | 25,586,000 | | | | 26,751,263 | |
6.75%, 2/1/17 | | | 62,799,000 | | | | 67,638,542 | |
2.95%, 3/15/17 | | | 1,125,000 | | | | 1,152,126 | |
6.35%, 5/15/18 | | | 106,052,000 | | | | 118,130,474 | |
5.625%, 12/15/19 | | | 87,407,000 | | | | 97,743,053 | |
4.50%, 5/15/21 | | | 63,744,000 | | | | 67,643,667 | |
| | | | | | | | |
| | | | | | | 10,852,001,831 | |
UTILITIES: 1.2% | | | | | | | | |
Dominion Resources, Inc.
5.75%, 10/1/54(a) | | | 232,036,000 | | | | 241,893,121 | |
Enel SPA(c) (Italy) | | | | | | | | |
6.80%, 9/15/37(b) | | | 153,664,000 | | | | 184,722,721 | |
6.00%, 10/7/39(b) | | | 116,212,000 | | | | 128,643,198 | |
| | | | | | | | |
| | | | | | | 555,259,040 | |
| | | | | | | | |
| | | | | | | 17,913,606,904 | |
| | | | | | | | |
TOTAL DEBT SECURITIES
(Cost $42,911,362,424) | | | | | | $ | 43,824,640,680 | |
| | |
| PAGE 12 § DODGE & COX INCOME FUND | | See accompanying Notes to Financial Statements |
| | | | |
| PORTFOLIO OF INVESTMENTS (unaudited) | | | June 30, 2015 | |
| | | | | | | | |
|
| SHORT-TERM INVESTMENTS: 0.6% | |
| | |
| | | PAR VALUE | | | VALUE | |
MONEY MARKET FUND: 0.1% | | | | | | | | |
SSgA U.S. Treasury Money Market Fund | | $ | 44,272,642 | | | $ | 44,272,642 | |
| |
REPURCHASE AGREEMENT: 0.5% | | | | | |
Fixed Income Clearing Corporation(d) 0.01%, dated 6/30/15, due 7/1/15, maturity value $245,890,068 | | | 245,890,000 | | | | 245,890,000 | |
| | | | | | | | |
TOTAL SHORT-TERM INVESTMENTS
(Cost $290,162,642) | | | $ | 290,162,642 | |
| | | | | | | | |
TOTAL INVESTMENTS
(Cost $43,201,525,066) | | | 99.5 | % | | $ | 44,114,803,322 | |
OTHER ASSETS LESS LIABILITIES | | | 0.5 | % | | | 205,531,337 | |
| | | | | | | | |
| NET ASSETS | | | 100.0 | % | | $ | 44,320,334,659 | |
| | | | | | | | |
| (b) | Security exempt from registration under Rule 144A of the Securities Act of 1933. The security may be resold in transactions exempt from registration, normally to qualified institutional buyers. As of June 30, 2015, all such securities in total represented $4,437,915,895 or 9.9% of net assets. These securities have been deemed liquid by Dodge & Cox, investment manager, pursuant to procedures approved by the Fund’s Board of Trustees. |
| (c) | Security denominated in U.S. dollars |
| (d) | Repurchase agreement is collateralized by U.S. Treasury Note 1.625%, 12/31/19 and Freddie Mac 1.87%, 12/24/19. Total collateral value is $250,812,188. |
| (e) | Subsidiary (see below) |
Debt securities are grouped by parent company unless otherwise noted. Actual securities may be issued by the listed parent company or one of its subsidiaries. In determining a parent company’s country designation, the Fund generally references the country of incorporation.
ARM: Adjustable Rate Mortgage
CMO: Collateralized Mortgage Obligation
DUS: Delegated Underwriting and Servicing
GO: General Obligation
RB: Revenue Bond
REMIC: Real Estate Mortgage Investment Conduit
FUTURES CONTRACTS
| | | | | | | | | | | | | | | | |
| Description | | Number of
Contracts | | | Expiration
Date | | | Notional
Amount | | | Unrealized
Appreciation/
(Depreciation) | |
10 Year U.S.
Treasury Note—
Short Position | | | 13,407 | | | | Sep 2015 | | | $ | (1,691,586,328 | ) | | $ | 6,312,221 | |
Long-Term U.S.
Treasury Bond—
Short Position | | | 8,910 | | | | Sep 2015 | | | | (1,372,696,875 | ) | | | 30,778,966 | |
| | | | | | | | | | | | | | | | |
| | | | | | | | | | | | | | $ | 37,091,187 | |
| | | | | | | | | | | | | | | | |
| | |
| See accompanying Notes to Financial Statements | | DODGE & COX INCOME FUND §PAGE 13 |
| | | | |
STATEMENT OF ASSETS AND LIABILITIES (unaudited) | |
| |
| | | June 30, 2015 | |
ASSETS: | | | | |
Investments, at value (cost $43,201,525,066) | | $ | 44,114,803,323 | |
Cash held at broker | | | 51,925,434 | |
Receivable for investments sold | | | 49,970,196 | |
Receivable from broker for variation margin | | | 975,844 | |
Receivable for Fund shares sold | | | 66,395,409 | |
Interest receivable | | | 351,893,593 | |
Prepaid expenses and other assets | | | 508,432 | |
| | | | |
| | | 44,636,472,231 | |
| | | | |
LIABILITIES: | | | | |
Payable for investments purchased | | | 257,660,549 | |
Payable for Fund shares redeemed | | | 40,261,219 | |
Management fees payable | | | 14,583,289 | |
Accrued expenses | | | 3,632,515 | |
| | | | |
| | | 316,137,572 | |
| | | | |
NET ASSETS | | $ | 44,320,334,659 | |
| | | | |
NET ASSETS CONSIST OF: | | | | |
Paid in capital | | $ | 43,332,995,464 | |
Undistributed net investment income | | | 8,000,471 | |
Undistributed net realized gain | | | 28,969,281 | |
Net unrealized appreciation | | | 950,369,443 | |
| | | | |
| | $ | 44,320,334,659 | |
| | | | |
Fund shares outstanding (par value $0.01 each,
unlimited shares authorized) | | | 3,258,721,212 | |
Net asset value per share | | $ | 13.60 | |
|
STATEMENT OF OPERATIONS
(unaudited) | |
| |
| | | Six Months Ended
June 30, 2015 | |
INVESTMENT INCOME: | | | | |
Dividends | | $ | 13,947,176 | |
Interest | | | 676,560,709 | |
| | | | |
| | | 690,507,885 | |
| | | | |
EXPENSES: | | | | |
Management fees | | | 85,127,287 | |
Custody and fund accounting fees | | | 331,294 | |
Transfer agent fees | | | 4,897,270 | |
Professional services | | | 45,562 | |
Shareholder reports | | | 794,816 | |
Registration fees | | | 969,589 | |
Trustees’ fees | | | 118,750 | |
Miscellaneous | | | 178,249 | |
| | | | |
| | | 92,462,817 | |
| | | | |
NET INVESTMENT INCOME | | | 598,045,068 | |
| | | | |
|
REALIZED AND UNREALIZED GAIN (LOSS): | |
Net realized gain (loss) | | | | |
Investments | | | 66,497,635 | |
Treasury futures contracts | | | (50,238,860 | ) |
Net change in unrealized appreciation/depreciation | | | | |
Investments | | | (710,313,292 | ) |
Treasury futures contracts | | | 99,281,392 | |
| | | | |
Net realized and unrealized loss | | | (594,773,125 | ) |
| | | | |
NET INCREASE IN NET ASSETS
FROM OPERATIONS | | $ | 3,271,943 | |
| | | | |
| | | | | | | | |
STATEMENT OF CHANGES IN NET ASSETS (unaudited) | |
| | |
| | | Six Months Ended
June 30, 2015 | | | Year Ended
December 31, 2014 | |
OPERATIONS: | | | | | | | | |
Net investment income | | $ | 598,045,068 | | | $ | 841,617,395 | |
Net realized gain | | | 16,258,775 | | | | 184,870,735 | |
Net change in unrealized
appreciation/depreciation | | | (611,031,900 | ) | | | 408,715,923 | |
| | | | | | | | |
| | | 3,271,943 | | | | 1,435,204,053 | |
| | | | | | | | |
| | |
DISTRIBUTIONS TO SHAREHOLDERS FROM: | | | | | | | | |
Net investment income | | | (602,266,545 | ) | | | (836,624,131 | ) |
Net realized gain | | | (9,315,089 | ) | | | (232,101,623 | ) |
| | | | | | | | |
Total distributions | | | (611,581,634 | ) | | | (1,068,725,754 | ) |
| | | | | | | | |
| | |
FUND SHARE
TRANSACTIONS: | | | | | | | | |
Proceeds from sale of shares | | | 9,358,313,443 | | | | 18,587,943,566 | |
Reinvestment of distributions | | | 492,438,873 | | | | 840,852,670 | |
Cost of shares redeemed | | | (4,050,044,597 | ) | | | (5,321,422,005 | ) |
| | | | | | | | |
Net increase from Fund
share transactions | | | 5,800,707,719 | | | | 14,107,374,231 | |
| | | | | | | | |
Total increase in net assets | | | 5,192,398,028 | | | | 14,473,852,530 | |
| | |
NET ASSETS: | | | | | | | | |
Beginning of period | | | 39,127,936,631 | | | | 24,654,084,101 | |
| | | | | | | | |
End of period (including undistributed net investment income of $8,000,471 and $12,221,948, respectively) | | $ | 44,320,334,659 | | | $ | 39,127,936,631 | |
| | | | | | | | |
| | |
SHARE INFORMATION: | | | | | | | | |
Shares sold | | | 675,680,493 | | | | 1,341,256,318 | |
Distributions reinvested | | | 35,948,685 | | | | 61,052,395 | |
Shares redeemed | | | (292,841,530 | ) | | | (384,742,642 | ) |
| | | | | | | | |
Net increase in shares outstanding | | | 418,787,648 | | | | 1,017,566,071 | |
| | | | | | | | |
| | |
| PAGE 14 § DODGE & COX INCOME FUND | | See accompanying Notes to Financial Statements |
NOTES TO FINANCIAL STATEMENTS (unaudited)
NOTE 1—ORGANIZATION AND SIGNIFICANT ACCOUNTING POLICIES
Dodge & Cox Income Fund (the “Fund”) is one of the series constituting the Dodge & Cox Funds (the “Trust” or the “Funds”). The Trust is organized as a Delaware statutory trust and is registered under the Investment Company Act of 1940, as amended, as an open-end management investment company. The Fund commenced operations on January 3, 1989, and seeks high and stable current income consistent with long-term preservation of capital. Risk considerations and investment strategies of the Fund are discussed in the Fund’s Prospectus.
The financial statements have been prepared in conformity with accounting principles generally accepted in the United States of America, which require the use of estimates and assumptions by management. Actual results may differ from those estimates. Significant accounting policies are as follows:
Security valuation The Fund’s net assets are valued as of the close of trading on the New York Stock Exchange (NYSE), generally 4:00 p.m. Eastern Time, each day that the NYSE is open for business. Debt securities and non-exchange traded derivatives are valued based on prices received from independent pricing services which utilize both dealer-supplied valuations and pricing models. Pricing models may consider quoted prices for similar securities, interest rates, prepayment speeds, and credit risk. Exchange-traded derivatives are valued at the settlement price determined by the relevant exchange. Security values are not discounted based on the size of the Fund’s position. Short-term securities less than 60 days to maturity may be valued at amortized cost if amortized cost approximates current value. Mutual funds are valued at their respective net asset values. All securities held by the Fund are denominated in U.S. dollars.
If market quotations are not readily available or if a security’s value is believed to have materially changed after the close of the security’s primary market but before the close of trading on the NYSE, the security is valued at fair value as determined in good faith by or under the direction of the Funds’ Board of Trustees. The Board of Trustees has delegated authority to Dodge & Cox, the Fund’s investment manager, to make fair value determinations in accordance with the Dodge & Cox Funds Valuation Policies (“Valuation Policies”), subject to Board oversight. Dodge & Cox has established a Pricing Committee that is comprised of representatives from Treasury, Legal, Compliance, and Operations. The Pricing Committee is responsible for implementing the Valuation Policies, including determining the fair value of securities when market quotations or market-based valuations are not readily available or are deemed unreliable. The Pricing Committee considers relevant indications of value that are reasonably available to it in determining the fair value assigned to a particular security, such as the value of similar financial instruments, trading volumes, contractual restrictions on disposition, related corporate actions, and changes in economic conditions. In doing so, the Pricing Committee employs various methods for calibrating fair valuation
approaches, including a regular review of key inputs and assumptions, back-testing, and review of any related market activity.
Valuing securities through a fair value determination involves greater reliance on judgment than valuation of securities based on readily available market quotations. In some instances, lack of information and uncertainty as to the significance of information may lead to a conclusion that a prior valuation is the best indication of a security’s value. When fair value pricing is employed, the prices of securities used by the Fund to calculate its NAV may differ from quoted or published prices for the same securities.
Security transactions, investment income, expenses, and distributions Security transactions are recorded on the trade date. Realized gains and losses on securities sold are determined on the basis of identified cost.
Interest income is recorded on the accrual basis. Interest income includes coupon interest, amortization of premium and accretion of discount on debt securities, and gain/loss on paydowns. The ability of the issuers of the debt securities held by the Fund to meet their obligations may be affected by economic developments in a specific industry, state, or region. Debt obligations may be placed on non-accrual status and related interest income may be reduced by ceasing current accruals and writing off interest receivables when the collection of all or a portion of interest has become doubtful. A debt obligation is removed from non-accrual status when the issuer resumes interest payments or when collectibility of interest is reasonably assured. Dividend income is recorded on the ex-dividend date.
Expenses are recorded on the accrual basis. Some expenses of the Trust can be directly attributed to a specific series. Expenses which cannot be directly attributed are allocated among the Funds in the Trust based on relative net assets or other expense methodologies determined by the nature of the expense.
Distributions to shareholders are recorded on the ex-dividend date.
Repurchase agreements The Fund enters into repurchase agreements, secured by U.S. government or agency securities, which involve the purchase of securities from a counterparty with a simultaneous commitment to resell the securities at an agreed-upon date and price. It is the Fund’s policy that its custodian take possession of the underlying collateral securities, the fair value of which exceeds the principal amount of the repurchase transaction, including accrued interest, at all times. In the event of default by the counterparty, the Fund has the contractual right to liquidate the securities and to apply the proceeds in satisfaction of the obligation.
Futures Contracts Futures contracts involve an obligation to purchase or sell (depending on whether the Fund has entered a long or short futures contract, respectively) an asset at a future date, at a price set at the time of the contract. Upon entering into a futures contract, the Fund is required to deposit an amount of cash or liquid assets (referred to as initial margin) in a segregated account with the clearing broker. Subsequent payments (referred to as variation margin) to and from the clearing broker are made
DODGE & COX INCOME FUND §PAGE 15
NOTES TO FINANCIAL STATEMENTS (unaudited)
on a daily basis based on changes in the market value of futures contracts. Futures contracts are traded publicly and their market value changes daily. Changes in the market value of open futures contracts are recorded as unrealized appreciation or depreciation in the Statement of Operations. Realized gains and losses on futures contracts are recorded in the Statement of Operations at the closing or expiration of the contracts. Cash deposited with a broker as initial margin is recorded on the Statement of Assets and Liabilities. A receivable and/or payable to brokers for daily variation margin is also recorded on the Statement of Assets and Liabilities.
Investments in futures contracts may include certain risks, which may be different from, and potentially greater than, those of the underlying securities. To the extent the Fund uses futures, it is exposed to additional volatility and potential losses resulting from leverage.
The Fund has maintained short Treasury futures contracts to assist with the management of the portfolio’s interest rate exposure. During the six months ended June 30, 2015, these Treasury futures contracts had notional values ranging from 5% to 7% of net assets.
Indemnification Under the Trust’s organizational documents, its officers and trustees are indemnified against certain liabilities arising out of the performance of their duties to the Trust. In addition, in the normal course of business the Trust enters into contracts that provide general indemnities to other parties. The Trust’s maximum exposure under these arrangements is unknown as this would involve future claims that may be made against the Trust that have not yet occurred.
NOTE 2—VALUATION MEASUREMENTS
Various inputs are used in determining the value of the Fund’s investments. These inputs are summarized in the three broad levels listed below.
| § | | Level 1: Quoted prices in active markets for identical securities |
| § | | Level 2: Other significant observable inputs (including quoted prices for similar securities, market indices, interest rates, credit risk, etc.) |
| § | | Level 3: Significant unobservable inputs (including Fund management’s assumptions in determining the fair value of investments) |
The inputs or methodology used for valuing securities are not necessarily an indication of the risk associated with investing in those securities.
The following is a summary of the inputs used to value the Fund’s holdings at June 30, 2015:
| | | | | | | | |
| Classification(a) | | LEVEL 1 (Quoted Prices) | | | LEVEL 2 (Other Significant
Observable Inputs) | |
Securities | | | | | | | | |
Debt Securities | | | | | | | | |
U.S. Treasury | | $ | — | | | $ | 4,267,012,659 | |
Government-Related | | | — | | | | 3,177,832,766 | |
Mortgage-Related | | | — | | | | 14,945,377,529 | |
Asset-Backed | | | — | | | | 3,520,810,822 | |
Corporate | | | — | | | | 17,913,606,904 | |
Short-term Investments | | | | | | | | |
Money Market Fund | | | 44,272,642 | | | | — | |
Repurchase Agreement | | | — | | | | 245,890,000 | |
| | | | | | | | |
Total Securities | | $ | 44,272,642 | | | $ | 44,070,530,680 | |
| | | | | | | | |
Other Financial Instruments | | | | | |
Treasury Futures Contracts | | $ | 37,091,187 | (b) | | $ | — | |
| | | | | | | | | |
| (a) | U.S. Treasury securities were transferred from Level 1 to Level 2 during the period. There were no Level 3 securities at June 30, 2015 and December 31, 2014, and there were no transfers to Level 3 during the period. |
| (b) | Represents net unrealized appreciation/(depreciation). |
NOTE 3—RELATED PARTY TRANSACTIONS
Management fees Under a written agreement approved by a unanimous vote of the Board of Trustees, the Fund pays an annual management fee of 0.50% of the Fund’s average daily net assets up to $100 million and 0.40% of the Fund’s average daily net assets in excess of $100 million to Dodge & Cox, investment manager of the Fund. The agreement further provides that Dodge & Cox shall waive its fee to the extent that such fee plus all other ordinary operating expenses of the Fund exceed 1% of the average daily net assets for the year.
Fund officers and trustees All officers and two of the trustees of the Trust are officers or employees of Dodge & Cox. The Trust pays a fee only to those trustees who are not affiliated with Dodge & Cox.
NOTE 4—INCOME TAX INFORMATION AND DISTRIBUTIONS TO SHAREHOLDERS
A provision for federal income taxes is not required since the Fund intends to continue to qualify as a regulated investment company under Subchapter M of the Internal Revenue Code and distribute all of its taxable income to shareholders. Distributions are determined in accordance with income tax regulations, and such amounts may differ from net investment income and realized gains for financial reporting purposes. Financial reporting records are adjusted for permanent book/tax differences at year end to reflect tax character.
Book/tax differences are primarily due to differing treatments of wash sales, net short-term realized gain (loss), and Treasury futures contracts. At June 30, 2015, the cost of investments for federal income tax purposes was $43,201,570,393.
PAGE 16 § DODGE & COX INCOME FUND
NOTES TO FINANCIAL STATEMENTS (unaudited)
Distributions during the periods noted below were characterized as follows for federal income tax purposes:
| | | | | | | | |
| | | Six Months Ended June 30, 2015 | | | Year Ended December 31, 2014 | |
Ordinary income | | | $608,476,604 | | | | $864,273,705 | |
| | | ($0.192 per share) | | | | ($0.397 per share) | |
| | |
Long-term capital gain | | | $3,105,030 | | | | $204,452,049 | |
| | | ($0.001 per share) | | | | ($0.088 per share) | |
At June 30, 2015, the tax basis components of distributable earnings were as follows:
| | | | |
Unrealized appreciation | | $
| 1,216,753,603
|
|
Unrealized depreciation | |
| (303,520,674
| )
|
| | | | |
Net unrealized appreciation | | | 913,232,929 | |
Undistributed ordinary income | | | 33,833,196 | |
Undistributed long-term capital gain | | | 89,227,857 | |
Deferred loss(a) | | | (48,954,787 | ) |
| (a) | Represents net realized loss incurred between November 1, 2014 and December 31, 2014. As permitted by tax regulations, the Fund has elected to treat this loss as arising in 2015. |
Fund management has reviewed the tax positions for open periods (three years and four years, respectively, from filing the Fund’s Federal and State tax returns) as applicable to the Fund, and has determined that no provision for income tax is required in the Fund’s financial statements.
NOTE 5—LOAN FACILITIES
Pursuant to an exemptive order issued by the Securities and Exchange Commission (SEC), the Fund may participate in an interfund lending facility (Facility). The Facility allows the Fund to borrow money from or loan money to the Funds. Loans under the Facility are made for temporary or emergency purposes, such as to fund shareholder redemption requests. Interest on borrowings is the average of the current repurchase agreement rate and the bank loan rate. There was no activity in the Facility during the period.
All Funds in the Trust participate in a $500 million committed credit facility (Line of Credit) with State Street Bank and Trust Company, to be utilized for temporary or emergency purposes to fund shareholder redemptions or for other short-term liquidity purposes. The maximum amount available to the Fund is $250 million. Each Fund pays an annual commitment fee on its pro-rata portion of the Line of Credit. The Fund’s commitment fee for the six months ended June 30, 2015, amounted to $72,498 and is reflected as a Miscellaneous Expense in the Statement of Operations. Interest on borrowings is charged at the prevailing rate. There were no borrowings on the Line of Credit during the period.
NOTE 6—PURCHASES AND SALES OF INVESTMENTS
For the six months ended June 30, 2015, purchases and sales of securities, other than short-term securities and U.S. government securities, aggregated $5,549,228,105 and $724,626,653, respectively. For the six months ended June 30, 2015, purchases and sales of U.S. government securities aggregated $5,033,894,483 and $3,258,494,857, respectively.
NOTE 7—ACCOUNTING PRONOUNCEMENTS
In June 2014, the Financial Accounting Standards Board issued Accounting Standards Update (ASU) No. 2014-11, Transfers and Servicing (Topic 860), Repurchase-to-Maturity Transactions, Repurchase Financings, and Disclosures. The ASU changes the accounting for certain repurchase agreements and expands disclosure requirements related to repurchase agreements and similar transactions. There was no impact on these financial statements as a result of applying this ASU.
NOTE 8—SUBSEQUENT EVENTS
Fund management has determined that no material events or transactions occurred subsequent to June 30, 2015, and through the date of the Fund’s financial statements issuance, which require additional disclosure in the Fund’s financial statements.
DODGE & COX INCOME FUND §PAGE 17
FINANCIAL HIGHLIGHTS (unaudited)
| | | | | | | | | | | | | | | | | | | | | | | | |
SELECTED DATA AND RATIOS (for a share outstanding throughout each period) | | Six Months
Ended June 30, | | | Year Ended December 31, | |
| | | 2015(a) | | | 2014 | | | 2013 | | | 2012 | | | 2011 | | | 2010 | |
| | | | | | | | |
Net asset value, beginning of period | | | $13.78 | | | | $13.53 | | | | $13.86 | | | | $13.30 | | | | $13.23 | | | | $12.96 | |
Income from investment operations: | | | | | | | | | | | | | | | | | | | | | | | | |
Net investment income | | | 0.19 | | | | 0.39 | | | | 0.42 | | | | 0.48 | | | | 0.55 | | | | 0.57 | |
Net realized and unrealized gain (loss) | | | (0.18 | ) | | | 0.35 | | | | (0.33 | ) | | | 0.56 | | | | 0.07 | | | | 0.35 | |
| | | | | | | | |
Total from investment operations | | | 0.01 | | | | 0.74 | | | | 0.09 | | | | 1.04 | | | | 0.62 | | | | 0.92 | |
| | | | | | | | |
Distributions to shareholders from: | | | | | | | | | | | | | | | | | | | | | | | | |
Net investment income | | | (0.19 | ) | | | (0.39 | ) | | | (0.42 | ) | | | (0.48 | ) | | | (0.55 | ) | | | (0.65 | ) |
Net realized gain | | | — | | | | (0.10 | ) | | | — | | | | — | | | | — | | | | — | |
| | | | | | | | |
Total distributions | | | (0.19 | ) | | | (0.49 | ) | | | (0.42 | ) | | | (0.48 | ) | | | (0.55 | ) | | | (0.65 | ) |
| | | | | | | | |
Net asset value, end of period | | | $13.60 | | | | $13.78 | | | | $13.53 | | | | $13.86 | | | | $13.30 | | | | $13.23 | |
| | | | | | | | |
Total return | | | 0.09 | % | | | 5.48 | % | | | 0.64 | % | | | 7.94 | % | | | 4.76 | % | | | 7.17 | % |
Ratios/supplemental data: | | | | | | | | | | | | | | | | | | | | | | | | |
Net assets, end of period (millions) | | | $44,320 | | | | $39,128 | | | | $24,654 | | | | $26,539 | | | | $24,051 | | | | $22,381 | |
Ratio of expenses to average net assets | | | 0.43 | %(b) | | | 0.44 | % | | | 0.43 | % | | | 0.43 | % | | | 0.43 | % | | | 0.43 | % |
Ratio of net investment income to average net assets | | | 2.81 | %(b) | | | 2.89 | % | | | 3.00 | % | | | 3.52 | % | | | 4.12 | % | | | 4.26 | % |
Portfolio turnover rate | | | 9 | % | | | 27 | % | | | 38 | % | | | 26 | % | | | 27 | % | | | 28 | % |
See accompanying Notes to Financial Statements
FUND HOLDINGS
The Fund provides a complete list of its holdings four times each fiscal year, as of the end of each quarter. The Fund files the lists with the Securities and Exchange Commission (SEC) on Form N-CSR (second and fourth quarters) and Form N-Q (first and third quarters). Shareholders may view the Fund’s Forms N-CSR and N-Q on the SEC’s website at sec.gov. Forms N-CSR and N-Q may also be reviewed and copied at the SEC’s Public Reference Room in Washington, DC. Information regarding the operations of the Public Reference Room may be obtained by calling 202-942-8090 (direct) or 800-732-0330 (general SEC number). A list of the Fund’s quarter-end holdings is also available at dodgeandcox.com on or about 15 days following each quarter end and remains available on the web site until the list is updated in the subsequent quarter.
PROXY VOTING
For a free copy of the Fund’s proxy voting policies and procedures, please call 800-621-3979, visit the Fund’s website at dodgeandcox.com, or visit the SEC’s website at sec.gov. Information regarding how the Fund voted proxies relating to portfolio securities during the most recent 12-month period ending June 30 is also available at dodgeandcox.com or at sec.gov.
HOUSEHOLD MAILINGS
The Fund routinely mails shareholder reports and summary prospectuses to shareholders and, on occasion, proxy statements. In order to reduce the volume of mail, when possible, only one copy of these documents will be sent to shareholders who are part of the same family and share the same residential address.
If you have a direct account with the Funds and you do not want the mailing of shareholder reports and summary prospectuses combined with other members in your household, contact the Funds at 800-621-3979. Your request will be implemented within 30 days.
PAGE 18 § DODGE & COX INCOME FUND
TRUSTEES AND EXECUTIVE OFFICERS
Charles F. Pohl, Chairman and Trustee
Chairman, Dodge & Cox
Dana M. Emery, President and Trustee
Chief Executive Officer and President, Dodge & Cox
Thomas A. Larsen, Independent Trustee
Senior Counsel, Arnold & Porter LLP
Ann Mather, Independent Trustee
Former Executive Vice President, Chief Financial Officer, and Company Secretary, Pixar Studios
Robert B. Morris III, Independent Trustee
Advisory Director, The Presidio Group
Gary Roughead, Independent Trustee
Annenberg Distinguished Visiting Fellow, Hoover Institution; and former U.S. Navy Chief of Naval Operations
Mark E. Smith, Independent Trustee
Former Executive Vice President and Managing Director-Fixed Income, Loomis Sayles & Company, L.P.
John B. Taylor, Independent Trustee
Professor of Economics, Stanford University; Senior Fellow, Hoover Institute; and former Under Secretary for International Affairs, United States Treasury
John A. Gunn, Senior Vice President
Former Chairman and Chief Executive Officer, Dodge & Cox
Diana S. Strandberg, Senior Vice President
Senior Vice President and Director of International Equity, Dodge & Cox
David H. Longhurst, Treasurer
Vice President and Assistant Treasurer, Dodge & Cox
Thomas M. Mistele, Secretary
Chief Operating Officer, Secretary, and Senior Counsel, Dodge & Cox
Katherine M. Primas, Chief Compliance Officer
Chief Compliance Officer, Dodge & Cox
Additional information about the Trust’s Trustees and Officers is available in the Trust’s Statement of Additional Information (SAI). You can get a free copy of the SAI by visiting the Funds’ website at dodgeandcox.com or calling 800-621-3979.
DODGE & COX INCOME FUND §PAGE 19
dodgeandcox.com
For Fund literature, transactions, and account
information, please visit the Funds’ website.
or write or call:
DODGE & COX FUNDS
c/o Boston Financial Data Services
P.O. Box 8422
Boston, Massachusetts 02266-8422
(800) 621-3979
INVESTMENT MANAGER
Dodge & Cox
555 California Street, 40th Floor
San Francisco, California 94104
(415) 981-1710
This report is submitted for the general information of the shareholders of the Fund. The report is not authorized for distribution to prospective investors in the Fund unless it is accompanied by a current prospectus.
This report reflects our views, opinions, and portfolio holdings as of June 30, 2015, the end of the reporting period. Any such views are subject to change at any time based upon market or other conditions and Dodge & Cox disclaims any responsibility to update such views. These views may not be relied on as investment advice and, because investment decisions for a Dodge & Cox Fund are based on numerous factors, may not be relied on as an indication of trading intent on behalf of any Dodge & Cox Fund.
DODGE & COX FUNDS®
Semi-Annual Report
June 30, 2015
Global Bond Fund
ESTABLISHED 2014
TICKER: DODLX
6/15 GBF SAR Printed on recycled paper
TO OUR SHAREHOLDERS
The Dodge & Cox Global Bond Fund had a total return of –2.1% for the six months ending June 30, 2015, compared to –3.1% for the Barclays Global Aggregate Bond Index (Barclays Global Agg). On June 30, the Fund had net assets of $74.4 million with net cash of 2.1%.
MARKET COMMENTARY
The Barclays Global Agg’s negative return was driven by foreign currency deprecation, rising interest rates, and increasing credit yield premiums. Growth in the United States accelerated and market conviction about the proximity of an interest rate hike by the Federal Reserve (Fed) strengthened, putting upward pressure on global interest rates. However, commodity prices remained subdued, and geopolitical events led to bouts of volatility. In June, a precipitous decline in Chinese equity prices and heightened fears of a Greek default and/or exit from the Eurozone weighed on global equities, credit yield premiums, and emerging market assets. Monetary policy remains a key determinant of the investment landscape, as investors dissect central bank communications for signals on impending actions. While the Fed, likely followed by the Bank of England, prepares to tighten monetary conditions, the Bank of Japan and the European Central Bank (ECB) are deeply committed to easing policies. This divergence in monetary policy is a key driver of the continued strength of the U.S. dollar, which appreciated 5.6% on a trade-weighted basis, and 8.6% and 2.3% against the euro and Japanese yen, respectively.
The U.S. economic recovery continued: market expectations are for annualized growth of 2.5% or higher over the coming quarters, despite a 0.2% decline in the first quarter that was largely attributed to “transitory” factors. The recovery appears broad-based, led by private consumption and continued improvement in labor market conditions. In the Eurozone, the economic outlook improved modestly, with mixed performance across countries; however high levels of economic slack and subdued inflation dynamics persist overall. Fueled by the ECB’s asset purchase program, European yields declined meaningfully in the first few months of the year before staging a quick reversal beginning in April, when German yields increased 90 basis points in eight weeks. Despite this bond “rout,” yields remain exceptionally low. As of June 30, 22% of European government debt had a negative yield and the 10-year German bund yield was 0.76%.
Emerging markets bonds and currencies generally performed poorly. In Brazil, the economic situation deteriorated as 2015 growth expectations were marked down to –1.5%. Despite monetary tightening to bolster the currency and fight stubbornly high inflation, the Brazilian real fell 14.4% amidst the weak outlook, as well as the corruption scandal involving government figures and Petrobras. Economies with macro imbalances and/or high commodity dependence, like Turkey and Colombia, also experienced sizeable currency depreciation. In contrast, economies where the medium-term outlook appears more promising, including India, Korea, and Mexico, have generally been more resilient.
INVESTMENT STRATEGY
The Dodge & Cox Global Bond Fund seeks attractive investments across global credit, currency, and interest rate markets, with the objective of producing a high rate of total return consistent with long-term preservation of capital. Our unique approach leverages the intensive research carried out by our research team on a wide range of global debt issuers, coupled with a rigorous macroeconomic research framework. Our portfolio is built on a bottom-up basis and benefits from the collective judgment of our seasoned investment team.
The portfolio currently features a significant weighting in credit securities (58%(a)), a high allocation to the U.S. dollar (73%) and emerging market currencies (22%), and a cautious stance toward interest rate risk (duration(b) of 3.5 years versus 6.5 for the Barclays Global Agg). The Fund enjoys a significant yield advantage over the index (4.2% versus 1.8%). Through the first half of the year, the Fund outperformed the Barclays Global Agg by 1.0%, driven by its lower exposure to interest rate risk and relative currency positioning (primarily significant underweights in the Japanese yen and the euro). Several credit holdings performed well, particularly lower-rated non-U.S. bonds, but the higher aggregate credit weighting detracted from relative returns given the sector’s poor relative performance. We remain optimistic about the Fund’s long-term return prospects.
Credit: Trending Up
A high credit allocation remains a critical aspect of our portfolio. While this allocation detracted from recent returns, we believe that current valuations are compelling, offering significant incremental yield relative to government debt and providing the opportunity for long-term price appreciation. As such, during the second quarter we increased the Fund’s corporate bond exposure from 47% to 50% by capitalizing on opportunities from increasing issuance by non-U.S. companies (49% of corporate portfolio) and accelerating M&A-related activity (e.g., Actavis/Allergan).
The Fund’s largest industry exposure is Communications (18.3% of the Fund). We have invested in a diverse group of 13 issuers domiciled in 6 different countries. Key characteristics of these investments include strong and diverse franchises with stable, recurring cash flows and management teams that have demonstrated capital discipline. A recent addition to the portfolio is MTN Group(c) (MTN), the largest African-based mobile telecom operator. Dodge & Cox equity funds have held MTN since 2010. MTN has leading positions in a diverse group of markets, consistent profitability, conservative financial policies, and low debt levels. A key risk of investing in MTN is its exposure to several challenging emerging African markets (e.g., Nigeria) but we believe this is mitigated by the aforementioned factors and a strong track record of telecom operators withstanding difficult macroeconomic and geopolitical environments.
We selectively reduced credit exposure in certain areas, including euro-denominated credits that were trading at low spread and yield levels. For example, we sold 7-year Compagnie de Saint-Gobain bonds at a yield below 1%. While we had no
PAGE 2 § DODGE & COX GLOBAL BOND FUND
concerns about the company’s creditworthiness, the yield and return prospects were far less attractive than alternatives. Looking forward, we are optimistic about the total return prospects for the Fund’s credit holdings.
Currency: The Almighty Dollar
The U.S. dollar has continued its broad-based appreciation trend, despite losing some steam in the second quarter. The Fund’s significant underweights in the euro and Japanese yen, which in aggregate were 40% of the Barclays Global Agg versus 0% of the Fund at June 30, were critical drivers of relative returns. The Fund’s high U.S. dollar weighting reflects our expectation for further appreciation relative to most developed market currencies. We increased this weighting appreciably (from 61% to 73%) during the first half of the year, as we brought the Fund’s euro and Swedish krona exposure from 6% and 5%, respectively, to zero. These decisions were driven by our increasingly cautious view of the return potential for these currencies. The differentials in growth, inflation, and monetary policy between the United States and these countries are likely to put medium-term depreciation pressure on their currencies. The output gap in the Eurozone remains large (–2.3% on average), which is likely to keep the ECB dovish. Capital flows into the Eurozone may also be hampered by weak growth, low yields, and lower reserve accumulation by China and commodity exporting countries.
We have favorable long-term outlooks for several emerging market currencies, expressed through the Fund’s exposure in countries like Mexico, Brazil, and India. With respect to Mexico, we are optimistic on the potential for recent reforms to boost growth and capital inflows, as macroeconomic underpinnings remain strong and the economy benefits from accelerating U.S. activity. These positive factors should outweigh currency volatility stemming from fluctuations in global risk sentiment and lower oil prices. For Brazil, our thesis is predicated on long-term growth potential, signs of improving macroeconomic policy credibility, and double-digit yield levels that provide a strong cushion against further currency depreciation. Risks include currently faltering growth, persistently high inflation and an ongoing, high-profile corruption scandal, but the currency has already adjusted significantly. The Fund’s exposure to India reflects our positive assessment of the potential for small but broad-based structural changes to boost growth, as the economy benefits from lower oil prices and the credible implementation of monetary policy toward the attainment of new inflation targets.
Rates: The Best Offense is a Good Defense
The Fund continues to have a defensive stance vis-à-vis interest rate risk, which benefited the Fund’s relative performance. U.S. 10-year interest rates generally rose over the period but remain at historically low levels. In our opinion, rates are likely to rise further over our three- to five-year investment horizon. While the market broadly expects the Fed to raise rates starting later this year, significant questions remain around the timing, pace, and magnitude of further hikes. Pricing in the fed fund futures market still reflects an assumed rate of only 2.0% in June 2018, which we believe is low given the U.S. growth and inflation outlook.
IN CLOSING
Acknowledging that both interest rates and currencies can be volatile in the short term, we encourage shareholders to remain focused on the long term.
We have conviction that, despite recent headwinds, the Fund’s current portfolio is well positioned for the long term. Our approach is disciplined and anchored by our fundamental views, which are not swayed by sentiment, momentum, or other technical factors. We continue to find long-term opportunity in the vast global bond universe as we evaluate individual companies and countries in both developed and emerging markets.
We are particularly encouraged by the continued growth and globalization of credit markets. The number of unique global credit issuers has grown over 50% in the last five years, providing an ever-growing opportunity set within which to leverage our seasoned research team and process.
Thank you for your continued confidence in our firm. As always, we welcome your comments and questions.
For the Board of Trustees,
| | |
| |
|
Charles F. Pohl, Chairman | | Dana M. Emery, President |
July 31, 2015
| (a) | | Unless otherwise specified, all weightings and characteristics are as of June 30, 2015. |
| (b) | | Duration is a measure of a bond’s (or a bond portfolio’s) price sensitivity to changes in interest rates. |
| (c) | | The use of specific examples does not imply that they are more attractive investments than the Fund’s other holdings. |
DODGE & COX GLOBAL BOND FUND §PAGE 3
YEAR-TO-DATE PERFORMANCE REVIEW
The Fund outperformed the Barclays Global Agg by 1.0 percentage points year to date.
Key Contributors to Relative Results
| | § | | The Fund’s relative performance benefited from significant underweights to the euro (6% versus 26% in the Barclays Global Agg) and the Japanese yen (no holdings versus 15% in the Barclays Global Agg), which depreciated 7.9% and 2.2% against the U.S. dollar, respectively. | |
| | § | | The Fund’s meaningfully lower exposure to rising interest rates (duration of 3.7 versus 6.5 for the Barclays Global Agg) added to outperformance. | |
| | § | | Security selection was positive, particularly among lower-rated credits, including Cemex, Dominion Resources, Rio Oil Finance Trust, and Telecom Italia. | |
Key Detractors from Relative Results
| | § | | The Fund’s overweight to the Swedish krona and certain Latin American currencies, including the Mexican peso and Brazilian real, detracted from relative returns as these currencies depreciated against the U.S. dollar. | |
| | § | | The Fund’s high corporate exposure detracted from returns as yield premiums rose. | |
| | § | | Certain industrial credits, including Time Warner Cable and Twenty-First Century Fox, and local government credits, including Autonomous Community of Madrid and Chicago Transit Authority, underperformed. | |
| | | | Unless otherwise noted, figures cited in this section denote Fund positioning at the beginning of the period. | |
PAGE 4 § DODGE & COX GLOBAL BOND FUND
KEY CHARACTERISTICS OF DODGE & COX
Independent Organization
Dodge & Cox is one of the largest privately owned investment managers in the world. We remain committed to independence, with a goal of providing the highest quality investment management service to our existing clients.
Over 80 Years of Investment Experience
Dodge & Cox was founded in 1930. We have a stable and well-qualified team of investment professionals, most of whom have spent their entire careers at Dodge & Cox.
Experienced Investment Team
The Global Bond Investment Policy Committee, which is the decision-making body for the Global Bond Fund, is a six-member committee with an average tenure at Dodge & Cox of 20 years.
One Business with a Single Research Office
Dodge & Cox manages equity (domestic, international, and global), fixed income (domestic and global), and balanced investments, operating from one office in San Francisco.
Consistent Investment Approach
Our team decision-making process involves thorough, bottom-up fundamental analysis of each investment.
Long-Term Focus and Low Expenses
We invest with a three- to five-year investment horizon, which has historically resulted in low turnover relative to our peers. We manage Funds that maintain low expense ratios.
Risks: The yields and market values of the instruments in which the Fund invests may fluctuate. Accordingly, an investment may be worth more or less than its original cost. Debt securities are subject to interest rate risk, credit risk, and prepayment and call risk, all of which could have adverse effects on the value of the Fund. A low interest rate environment creates an elevated risk of future negative returns. Financial intermediaries may restrict their market making activities for certain debt securities, which may reduce the liquidity and increase the volatility of such securities. Investing in non-U.S. securities may entail risk due to foreign economic and political developments; this risk may be increased when investing in emerging markets. The Fund is also subject to currency risk. Please read the prospectus and summary prospectus for specific details regarding the Fund’s risk profile.
DODGE & COX GLOBAL BOND FUND §PAGE 5
GROWTH OF $10,000 SINCE INCEPTION
FOR AN INVESTMENT MADE ON DECEMBER 5, 2012
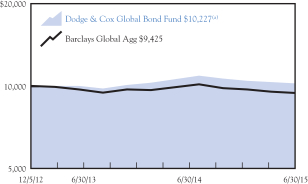
AVERAGE ANNUAL TOTAL RETURN
FOR PERIODS ENDED JUNE 30, 2015
| | | | | | | | |
| | | 1 Year | | | Since
Inception
(12/5/12) | |
| | | | | | | | |
Dodge & Cox Global Bond Fund(a) | | | -6.16 | % | | | 0.88 | % |
Barclays Global Aggregate Bond Index
(Barclays Global Agg) | | | -7.10 | | | | -2.27 | |
| (a) | | Expense reimbursements have been in effect for the Fund since its inception. Without the expense reimbursements, returns for the Fund would have been lower. The Fund’s returns from May 1, 2014 to December 31, 2014 and from January 1, 2015 to June 30, 2015 are as presented in the Financial Highlights. |
Returns represent past performance and do not guarantee future results. Investment return and share price will fluctuate with market conditions, and investors may have a gain or loss when shares are sold. Fund performance changes over time and currently may be significantly lower than stated. Performance is updated and published monthly. Visit the Fund’s website at dodgeandcox.com or call 800-621-3979 for current performance figures.
A private fund managed and funded by Dodge & Cox (the “Private Fund”) was reorganized into the Fund and the Fund commenced operations on May 1, 2014. The Private Fund commenced operations on December 5, 2012 and had an investment objective, policies, and strategies that were, in all material respects, the same as those of the Fund, and was managed in a manner that, in all material respects, complied with the investment guidelines and restrictions of the Fund. However, the Private Fund was not registered as an investment company under the Investment Company Act of 1940 (the “1940 Act”), and therefore was not subject to certain investment limitations, diversification requirements, liquidity requirements, and other restrictions imposed by the 1940 Act and the Internal Revenue Code, which, if applicable, may have adversely affected its performance.
The Fund’s total returns include the reinvestment of dividend and capital gain distributions, but have not been adjusted for any income taxes payable by shareholders on these distributions or on Fund share redemptions. Index returns include interest income but, unlike Fund returns, do not reflect fees or expenses. The Barclays Global Aggregate Bond Index (Barclays Global Agg) is a widely recognized, unmanaged index of multi-currency investment-grade, debt securities.
Barclays® is a trademark of Barclays Bank PLC.
FUND EXPENSE EXAMPLE
As a Fund shareholder, you incur ongoing Fund costs, including management fees and other Fund expenses. All mutual funds have ongoing costs, sometimes referred to as operating expenses. The following example shows ongoing costs of investing in the Fund and can help you understand these costs and compare them with those of other mutual funds. The example assumes a $1,000 investment held for the six months indicated.
ACTUAL EXPENSES
The first line of the table below provides information about actual account values and expenses based on the Fund’s actual returns. You may use the information in this line, together with your account balance, to estimate the expenses that you paid over the period. Simply divide your account value by $1,000 (for example, an $8,600 account value divided by $1,000 = 8.6), then multiply the result by the number in the first line under the heading “Expenses Paid During Period” to estimate the expenses you paid on your account during this period.
HYPOTHETICAL EXAMPLE FOR COMPARISON WITH OTHER MUTUAL FUNDS
Information on the second line of the table can help you compare ongoing costs of investing in the Fund with those of other mutual funds. This information may not be used to estimate the actual ending account balance or expenses you paid during the period. The hypothetical “Ending Account Value” is based on the actual expense ratio of the Fund and an assumed 5% annual rate of return before expenses (not the Fund’s actual return). The amount under the heading “Expense Paid During the Period” shows the hypothetical expenses your account would have incurred under this scenario. You can compare this figure with the 5% hypothetical examples that appear in shareholder reports of other mutual funds.
| | | | | | | | | | | | |
Six Months Ended June 30, 2015 | | Beginning Account Value
1/1/2015 | | | Ending Account Value
6/30/2015 | | | Expenses Paid
During Period* | |
Based on Actual Fund Return | | $ | 1,000.00 | | | $ | 978.70 | | | $ | 2.95 | |
Based on Hypothetical 5% Yearly Return | | | 1,000.00 | | | | 1,021.82 | | | | 3.01 | |
| * | | Expenses are equal to the Fund’s annualized net expense ratio of 0.60%, multiplied by the average account value over the period, multiplied by 181/365 (to reflect the one-half year period). |
The expenses shown in the table highlight ongoing costs only and do not reflect any transactional fees or account maintenance fees. Though other mutual funds may charge such fees, please note that the Fund does not charge transaction fees (e.g., redemption fees, sales loads) or universal account maintenance fees (e.g., small account fees).
PAGE 6 § DODGE & COX GLOBAL BOND FUND
| | | | |
| FUND INFORMATION | | | June 30, 2015 | |
| | | | |
| GENERAL INFORMATION | | | |
Net Asset Value Per Share | | | $10.09 | |
Total Net Assets (millions) | | | $74.4 | |
30-Day SEC Yield (using net expenses)(a)(b) | | | 3.17% | |
30-Day SEC Yield (using gross expenses) | | | 2.26% | |
Net Expense Ratio(b) | | | 0.60% | |
Gross Expense Ratio (1/1/15 to 6/30/15, annualized) | | | 1.51% | |
Portfolio Turnover Rate (1/1/15 to 6/30/15, unannualized) | | | 24% | |
Fund Inception | | | May 1, 2014 | |
No sales charges or distribution fees | | | | |
Investment Manager: Dodge & Cox, San Francisco. Managed by the Global Bond Investment Policy Committee, whose six members’ average tenure at Dodge & Cox is 20 years.
| | | | | | | | |
| PORTFOLIO CHARACTERISTICS | | Fund | | | Barclays
Global Agg | |
Number of Debt Securities | | | 111 | | | | 16,860 | |
Effective Duration (years) | | | 3.5 | | | | 6.5 | |
Emerging Markets(c) | | | 30.8% | | | | 5.5% | |
| | | | |
| FIVE LARGEST CORPORATE ISSUERS (%)(d) | | Fund | |
Millicom International Cellular SA | | | 2.6 | |
Cemex SAB de CV | | | 2.5 | |
Enel SPA | | | 2.0 | |
Imperial Tobacco Group PLC | | | 2.0 | |
Royal Bank of Scotland Group PLC | | | 2.0 | |
| | | | | | | | |
| CREDIT QUALITY (%)(e)(f) | | Fund | | | Barclays
Global Agg | |
Aaa | | | 17.5 | | | | 40.7 | |
Aa | | | 3.9 | | | | 17.3 | |
A | | | 18.7 | | | | 26.0 | |
Baa | | | 42.1 | | | | 16.0 | |
Ba | | | 11.3 | | | | 0.0 | |
B | | | 4.4 | | | | 0.0 | |
Cash Equivalents | | | 2.1 | | | | 0.0 | |
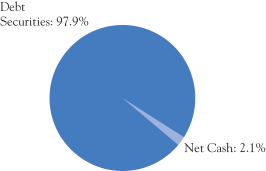
| | | | | | | | |
| SECTOR DIVERSIFICATION (%)(f) | | Fund | | | Barclays
Global Agg | |
Government | | | 21.3 | | | | 53.6 | |
Government-Related | | | 7.9 | | | | 13.1 | |
Securitized | | | 18.4 | | | | 15.4 | |
Corporate | | | 50.3 | | | | 17.9 | |
Cash Equivalents | | | 2.1 | | | | 0.0 | |
| | | | | | | | |
| REGION DIVERSIFICATION (%)(c)(f) | | Fund | | | Barclays Global Agg | |
United States | | | 46.5 | | | | 38.3 | |
Latin America | | | 22.0 | | | | 1.4 | |
Europe (excluding United Kingdom) | | | 12.0 | | | | 26.2 | |
United Kingdom | | | 8.7 | | | | 6.5 | |
Pacific (excluding Japan) | | | 4.0 | | | | 5.1 | |
Africa/Middle East | | | 2.8 | | | | 0.9 | |
Canada | | | 1.9 | | | | 3.4 | |
Japan | | | 0.0 | | | | 15.7 | |
Other | | | 0.0 | | | | 2.5 | |
| (a) | SEC Yield is an annualization of the Fund’s total net investment income per share for the 30-day period ended on the last day of the month. |
| (b) | Dodge & Cox has contractually agreed to reimburse the Fund for all ordinary expenses to the extent necessary to maintain Total Annual Fund Operating expenses at 0.60% through April 30, 2016. The term of the agreement renews annually thereafter unless terminated with 30 days’ written notice by either party prior to the end of the term. |
| (c) | The Fund may classify an issuer in a different category than the Barclays Global Aggregate Bond Index. The Fund generally classifies a corporate issuer based on the country of incorporation of the parent company, but may designate a different country in certain circumstances. |
| (d) | The Fund’s portfolio holdings are subject to change without notice. The mention of specific securities is not a recommendation to buy, sell, or hold any particular security and is not indicative of Dodge & Cox’s current or future trading activity. |
| (e) | The credit quality distributions shown for the Fund and the Index are based on the middle of Moody’s, S&P’s, and Fitch ratings, which is the methodology used by Barclays in constructing its indices. If a security is rated by only two agencies, the lower of the two ratings is used. Please note the Fund applies the highest of Moody’s, S&P’s, and Fitch ratings to comply with the quality requirements stated in its prospectus. On that basis, the Fund held 9.3% in securities rated below investment grade. The credit quality of the investments in the portfolio does not apply to the stability or safety of the Fund or its shares. |
| (f) | Excludes the Fund’s derivative contracts. |
DODGE & COX GLOBAL BOND FUND §PAGE 7
| | | | |
| PORTFOLIO OF INVESTMENTS (unaudited) | | | June 30, 2015 | |
| | | | | | | | | | |
| DEBT SECURITIES: 97.9% | | | | | | | | |
| | | |
| | | | | PAR VALUE | | | VALUE | |
| GOVERNMENT: 21.3% | | | | | | | | | | |
Brazil Government (Brazil) | | | | | | | | | | |
Series B, 6.00%, 8/15/20(a) | | BRL | | | 1,740,000 | | | $ | 1,449,884 | |
Series F, 10.00%, 1/1/21 | | BRL | | | 2,865,000 | | | | 828,626 | |
Chile Government GDN (Chile)
6.00%, 1/1/18(c) | | CLP | | | 905,000,000 | | | | 1,492,318 | |
Colombia Government (Colombia)
9.85%, 6/28/27 | | COP | | | 1,600,000,000 | | | | 753,565 | |
Indonesia Government (Indonesia)
5.25%, 5/15/18 | | IDR | | | 11,150,000,000 | | | | 776,063 | |
Malaysia Government (Malaysia)
3.172%, 7/15/16 | | MYR | | | 2,900,000 | | | | 769,682 | |
Mexico Government (Mexico)
4.75%, 6/14/18 | | MXN | | | 23,200,000 | | | | 1,482,062 | |
2.00%, 6/9/22(a) | | MXN | | | 73,347,131 | | | | 4,498,612 | |
Poland Government (Poland)
3.25%, 7/25/25 | | PLN | | | 5,550,000 | | | | 1,472,194 | |
South Korea Government
(South Korea)
3.00%, 12/10/16 | | KRW | | | 1,530,200,000 | | | | 1,397,621 | |
U.S. Treasury Note
(United States)
0.625%, 10/15/16 | | USD | | | 950,000 | | | | 952,153 | |
| | | | | | | | | | |
| | | | | | | | | 15,872,780 | |
| GOVERNMENT-RELATED: 7.9% | | | | | |
Autonomous Community of Madrid (Spain)
4.30%, 9/15/26 | | EUR | | | 910,000 | | | | 1,135,639 | |
Chicago Transit Authority RB
(United States)
6.20%, 12/1/40 | | USD | | | 50,000 | | | | 54,185 | |
6.899%, 12/1/40 | | USD | | | 1,250,000 | | | | 1,440,109 | |
Petroleo Brasileiro SA (Brazil)
7.25%, 3/17/44 | | USD | | | 550,000 | | | | 511,186 | |
Petroleos Mexicanos (Mexico)
4.25%, 1/15/25(c) | | USD | | | 425,000 | | | | 413,908 | |
5.50%, 6/27/44(c) | | USD | | | 175,000 | | | | 161,000 | |
6.375%, 1/23/45 | | USD | | | 485,000 | | | | 500,181 | |
State of California GO
(United States)
6.20%, 3/1/19 | | USD | | | 100,000 | | | | 115,320 | |
6.20%, 10/1/19 | | USD | | | 325,000 | | | | 378,687 | |
State of Illinois GO
(United States)
4.961%, 3/1/16 | | USD | | | 400,000 | | | | 409,408 | |
5.665%, 3/1/18 | | USD | | | 700,000 | | | | 748,958 | |
| | | | | | | | | | |
| | | | | | | | | 5,868,581 | |
| SECURITIZED: 18.4% | | | | | | | | | | |
Chase Issuance Trust
(United States) | | | | | | | | | | |
Series 2012-A8 A8, 0.54%, 10/16/17 | | USD | | | 650,000 | | | | 650,081 | |
Series 2013-A8 A8, 1.01%, 10/15/18 | | USD | | | 200,000 | | | | 200,220 | |
Series 2007-A3 A3, 5.23%, 4/15/19 | | USD | | | 419,000 | | | | 447,336 | |
Series 2014-A6 A6, 1.26%, 7/15/19 | | USD | | | 475,000 | | | | 475,174 | |
Fannie Mae, 15 Year
(United States)
5.00%, 7/1/25 | | USD | | | 44,223 | | | | 47,782 | |
Fannie Mae, 20 Year
(United States) | | | | | | | | | | |
4.50%, 5/1/31 | | USD | | | 1,139,816 | | | | 1,238,392 | |
4.50%, 6/1/31 | | USD | | | 302,568 | | | | 328,902 | |
4.00%, 8/1/31 | | USD | | | 138,829 | | | | 148,343 | |
4.00%, 2/1/32 | | USD | | | 213,654 | | | | 229,385 | |
4.00%, 10/1/34 | | USD | | | 387,891 | | | | 414,703 | |
| | | | | | | | | | |
| | | |
| | | | | PAR VALUE | | | VALUE | |
Fannie Mae, Hybrid ARM
(United States)
2.913%, 8/1/44 | | USD | | | 277,727 | | | $ | 286,754 | |
2.759%, 9/1/44 | | USD | | | 463,909 | | | | 477,228 | |
Ford Credit Auto Owner Trust
(United States) | | | | | | | | | | |
Series 2012-B A4, 1.00%, 9/15/17 | | USD | | | 500,000 | | | | 500,818 | |
Series 2014-C A3, 1.06%, 5/15/19 | | USD | | | 880,000 | | | | 880,652 | |
Freddie Mac (United States)
Series 4283 EW,
5.233%, 12/15/43 | | USD | | | 241,632 | | | | 265,975 | |
Freddie Mac, Hybrid ARM
(United States) | | | | | | | | | | |
3.016%, 10/1/44 | | USD | | | 534,725 | | | | 552,733 | |
2.75%, 11/1/44 | | USD | | | 1,426,946 | | | | 1,463,896 | |
2.731%, 1/1/45 | | USD | | | 1,472,032 | | | | 1,508,163 | |
Freddie Mac Gold, 15 Year
(United States)
4.00%, 8/1/25 | | USD | | | 981,554 | | | | 1,047,983 | |
Freddie Mac Gold, 30 Year
(United States) | | | | | | | | | | |
6.00%, 2/1/35 | | USD | | | 138,779 | | | | 158,831 | |
4.50%, 7/1/44 | | USD | | | 656,859 | | | | 709,484 | |
Rio Oil Finance Trust (Brazil) | | | | | | | | | | |
6.25%, 7/6/24(c) | | USD | | | 1,200,000 | | | | 1,179,000 | |
6.75%, 1/6/27(c) | | USD | | | 475,000 | | | | 460,750 | |
| | | | | | | | | | |
| | | | | | | | | 13,672,585 | |
| CORPORATE: 50.3% | | | | | | | | |
FINANCIALS: 15.6% | | | | | | | | | | |
Anthem, Inc. (United States) | | | | | | | | | | |
7.00%, 2/15/19 | | USD | | | 335,000 | | | | 382,355 | |
4.35%, 8/15/20 | | USD | | | 275,000 | | | | 297,322 | |
Bank of America Corp.
(United States) | | | | | | | | | | |
4.25%, 10/22/26 | | USD | | | 425,000 | | | | 413,981 | |
6.625%, 5/23/36(b) | | USD | | | 325,000 | | | | 364,528 | |
Barclays PLC (United Kingdom)
4.375%, 9/11/24 | | USD | | | 800,000 | | | | 767,253 | |
BNP Paribas SA (France)
5.75%, 1/24/22 | | GBP | | | 425,000 | | | | 744,141 | |
Boston Properties, Inc. (United States) | | | | | | | | | | |
5.625%, 11/15/20 | | USD | | | 850,000 | | | | 970,299 | |
4.125%, 5/15/21 | | USD | | | 425,000 | | | | 451,057 | |
Citigroup, Inc. (United States)
7.875%, 10/30/40(b) | | USD | | | 655,000 | | | | 680,152 | |
Equity Residential (United States)
4.75%, 7/15/20 | | USD | | | 700,000 | | | | 770,460 | |
Health Net, Inc. (United States)
6.375%, 6/1/17 | | USD | | | 550,000 | | | | 581,625 | |
HSBC Holdings PLC
(United Kingdom) | | | | | | | | | | |
6.50%, 5/2/36 | | USD | | | 400,000 | | | | 474,339 | |
6.50%, 9/15/37 | | USD | | | 525,000 | | | | 631,653 | |
JPMorgan Chase & Co.
(United States)
3.375%, 5/1/23 | | USD | | | 700,000 | | | | 678,840 | |
Lloyds Banking Group PLC
(United Kingdom)
4.50%, 11/4/24 | | USD | | | 1,150,000 | | | | 1,149,035 | |
Navient Corp. (United States) | | | | | | | | | | |
6.00%, 1/25/17 | | USD | | | 370,000 | | | | 384,800 | |
4.625%, 9/25/17 | | USD | | | 243,000 | | | | 246,949 | |
8.45%, 6/15/18 | | USD | | | 125,000 | | | | 138,912 | |
| | |
| PAGE 8 § DODGE & COX GLOBAL BOND FUND | | See accompanying Notes to Financial Statements |
| | | | |
| PORTFOLIO OF INVESTMENTS (unaudited) | | | June 30, 2015 | |
| | | | | | | | | | |
| DEBT SECURITIES (continued) | | | | | | |
| | | |
| | | | | PAR VALUE | | | VALUE | |
Royal Bank of Scotland Group PLC (United Kingdom) | | | | | | | | | | |
5.625%, 8/24/20 | | USD | | | 375,000 | | | $ | 421,947 | |
6.125%, 1/11/21 | | USD | | | 100,000 | | | | 114,644 | |
6.125%, 12/15/22 | | USD | | | 325,000 | | | | 349,558 | |
6.00%, 12/19/23 | | USD | | | 550,000 | | | | 581,682 | |
| | | | | | | | | | |
| | | | | | | | | 11,595,532 | |
INDUSTRIALS: 31.7% | | | | | | | | | | |
Allergan PLC (Ireland) | | | | | | | | | | |
3.00%, 3/12/20 | | USD | | | 275,000 | | | | 275,746 | |
3.80%, 3/15/25 | | USD | | | 225,000 | | | | 220,688 | |
AT&T, Inc. (United States) | | | | | | | | | | |
6.55%, 2/15/39 | | USD | | | 500,000 | | | | 572,752 | |
4.75%, 5/15/46 | | USD | | | 125,000 | | | | 113,163 | |
Canadian Pacific Railway, Ltd. (Canada)
6.25%, 6/1/18 | | CAD | | | 900,000 | | | | 820,066 | |
Cemex SAB de CV (Mexico)
7.25%, 1/15/21(c) | | USD | | | 1,750,000 | | | | 1,846,600 | |
Cox Enterprises, Inc. (United States) | | | | | | | | | | |
3.25%, 12/15/22(c) | | USD | | | 715,000 | | | | 680,750 | |
2.95%, 6/30/23(c) | | USD | | | 400,000 | | | | 368,166 | |
CRH PLC (Ireland)
3.875%, 5/18/25(c) | | USD | | | 225,000 | | | | 222,620 | |
Ford Motor Credit Co. LLC(d)
(United States)
8.125%, 1/15/20 | | USD | | | 825,000 | | | | 1,006,706 | |
Grupo Televisa SAB (Mexico)
8.50%, 3/11/32 | | USD | | | 600,000 | | | | 789,619 | |
HCA Holdings, Inc. (United States)
6.50%, 2/15/16 | | USD | | | 700,000 | | | | 721,434 | |
Hewlett-Packard Co. (United States)
| | | | | | | | | | |
2.65%, 6/1/16 | | USD | | | 150,000 | | | | 151,875 | |
2.60%, 9/15/17 | | USD | | | 525,000 | | | | 534,404 | |
Imperial Tobacco Group PLC (United Kingdom)
9.00%, 2/17/22 | | GBP | | | 725,000 | | | | 1,506,318 | |
Kinder Morgan, Inc. (United States) | | | | | | | | | | |
4.30%, 6/1/25 | | USD | | | 100,000 | | | | 96,932 | |
6.95%, 1/15/38 | | USD | | | 900,000 | | | | 964,570 | |
Macy’s, Inc. (United States) | | | | | | | | | | |
6.70%, 9/15/28 | | USD | | | 50,000 | | | | 59,470 | |
6.90%, 4/1/29 | | USD | | | 75,000 | | | | 91,550 | |
6.70%, 7/15/34 | | USD | | | 425,000 | | | | 516,165 | |
Millicom International Cellular SA (Luxembourg)
6.625%, 10/15/21(c) | | USD | | | 1,850,000 | | | | 1,900,875 | |
MTN Group, Ltd. (South Africa)
4.755%, 11/11/24(c) | | USD | | | 725,000 | | | | 719,562 | |
Naspers, Ltd. (South Africa)
6.00%, 7/18/20(c) | | USD | | | 1,275,000 | | | | 1,382,419 | |
Reed Elsevier PLC (United Kingdom) | | | | | | | | | | |
8.625%, 1/15/19 | | USD | | | 58,000 | | | | 69,705 | |
3.125%, 10/15/22 | | USD | | | 444,000 | | | | 432,247 | |
Sprint Corp. (United States)
6.00%, 12/1/16 | | USD | | | 675,000 | | | | 699,469 | |
Teck Resources, Ltd. (Canada)
6.00%, 8/15/40 | | USD | | | 400,000 | | | | 315,815 | |
Telecom Italia SPA (Italy) | | | | | | | | | | |
6.375%, 6/24/19 | | GBP | | | 450,000 | | | | 765,925 | |
7.721%, 6/4/38 | | USD | | | 575,000 | | | | 646,875 | |
Time Warner Cable, Inc.
(United States) | | | | | | | | | | |
8.75%, 2/14/19 | | USD | | | 475,000 | | | | 563,785 | |
4.00%, 9/1/21 | | USD | | | 100,000 | | | | 102,558 | |
6.75%, 6/15/39 | | USD | | | 400,000 | | | | 425,325 | |
| | | | | | | | | | |
| | | |
| | | | | PAR VALUE | | | VALUE | |
Time Warner, Inc. (United States) | | | | | | | | | | |
7.625%, 4/15/31 | | USD | | | 400,000 | | | $ | 519,434 | |
7.70%, 5/1/32 | | USD | | | 475,000 | | | | 622,451 | |
TransCanada Corp. (Canada)
5.625%, 5/20/75(b) | | USD | | | 250,000 | | | | 252,187 | |
Twenty-First Century Fox, Inc. (United States) | | | | | | | | | | |
6.15%, 3/1/37 | | USD | | | 275,000 | | | | 317,042 | |
6.65%, 11/15/37 | | USD | | | 625,000 | | | | 758,339 | |
Verizon Communications, Inc.
(United States) | | | | | | | | | | |
4.272%, 1/15/36(c) | | USD | | | 375,000 | | | | 336,352 | |
6.55%, 9/15/43 | | USD | | | 675,000 | | | | 789,206 | |
Vulcan Materials Co. (United States)
7.50%, 6/15/21 | | USD | | | 325,000 | | | | 373,750 | |
| | | | | | | | | | |
| | | | | | | | | 23,552,915 | |
UTILITIES: 3.0% | | | | | | | | | | |
Dominion Resources, Inc. (United States)
5.75%, 10/1/54(b) | | USD | | | 675,000 | | | | 703,675 | |
Enel SPA (Italy) | | | | | | | | | | |
6.80%, 9/15/37(c) | | USD | | | 650,000 | | | | 781,378 | |
6.00%, 10/7/39(c) | | USD | | | 675,000 | | | | 747,205 | |
| | | | | | | | | | |
| | | | | | | | | 2,232,258 | |
| | | | | | | | | | |
| | | | | | | | | 37,380,705 | |
| | | | | | | | | | |
TOTAL DEBT SECURITIES
(Cost $76,015,435) | | | $ | 72,794,651 | |
| | |
| See accompanying Notes to Financial Statements | | DODGE & COX GLOBAL BOND FUND §PAGE 9 |
| | | | |
| PORTFOLIO OF INVESTMENTS (unaudited) | | | June 30, 2015 | |
| | | | | | | | | | |
|
| SHORT-TERM INVESTMENTS: 1.6% | |
| | | |
| | | | | PAR VALUE | | | VALUE | |
MONEY MARKET FUND: 0.1% | | | | | | | | |
SSgA U.S. Treasury Money Market Fund | | USD | | | 75,160 | | | $ | 75,160 | |
| | |
REPURCHASE AGREEMENT: 1.5% | | | | | | | | |
Fixed Income Clearing Corporation(e) 0.01%, dated 6/30/15, due 7/1/15, maturity value $1,099,000 | | USD | | | 1,099,000 | | | | 1,099,000 | |
| | | | | | | | | | |
TOTAL SHORT-TERM INVESTMENTS
(Cost $1,174,160) | | | $ | 1,174,160 | |
| | | | | | | | | | |
TOTAL INVESTMENTS
(Cost $77,189,595) | |
| 99.5
| %
| | $ | 73,968,811 | |
OTHER ASSETS LESS LIABILITIES | | | 0.5 | % | | | 397,589 | |
| | | | | | | | | | |
| NET ASSETS | | | | | 100.0 | % | | $ | 74,366,400 | |
| | | | | | | | | | |
| (c) | Security exempt from registration under Rule 144A of the Securities Act of 1933. The security may be resold in transactions exempt from registration, normally to qualified institutional buyers. As of June 30, 2015, all such securities in total represented $12,692,903 or 17.2% of total net assets. These securities have been deemed liquid by Dodge & Cox, investment manager, pursuant to procedures approved by the Fund’s Board of Trustees. |
| (d) | Subsidiary (see below) |
| (e) | Repurchase agreement is collateralized by U.S. Treasury Note 2.00%, 08/31/21. Total collateral value is $1,124,756. |
Debt securities are grouped by parent company unless otherwise noted. Actual securities may be issued by the listed parent company or one of its subsidiaries. In determining a parent company’s country designation, the Fund generally references the country of incorporation.
ARM: Adjustable Rate Mortgage
CMO: Collateralized Mortgage Obligation
GDN: Global Depositary Note
GO: General Obligation
RB: Revenue Bond
REMIC: Real Estate Mortgage Investment Conduit
BRL: Brazilian Real
CAD: Canadian Dollar
CLP: Chilean Peso
COP: Colombian Peso
EUR: Euro
GBP: British Pound
IDR: Indonesian Rupiah
INR: Indian Rupee
KRW: South Korean Won
MXN: Mexican Peso
MYR: Malaysian Ringgit
PLN: Polish Zloty
USD: United States Dollar
FUTURES CONTRACTS
| | | | | | | | | | | | | | | | |
| Description | | Number of
Contracts | | | Expiration
Date | | | Notional
Amount | | | Unrealized
Appreciation/
(Depreciation) | |
10 Year U.S.
Treasury Note—Short Position | | | 56 | | | | Sep 2015 | | | $ | (7,065,625 | ) | | $ | 17,751 | |
Long-Term U.S. Treasury Bond—
Short Position | | | 30 | | | | Sep 2015 | | | | (4,621,875 | ) | | | 115,305 | |
| | | | | | | | | | | | | | | | |
| | | | | | | | | | | | | | $ | 133,056 | |
| | | | | | | | | | | | | | | | |
CENTRALLY CLEARED INTEREST RATE SWAPS
| | | | | | | | | | | | | | | | |
| | | | | | Contract Amount | | | | |
Notional
Amount | | Expiration
Date | | | Fixed
Rate | | | Floating Rate | | | Unrealized
Appreciation/
(Depreciation) | |
Pay Fixed/Receive Floating: | | | | | | | | | |
$825,000 | | | 5/6/24 | | | | 2.72 | % | | | USD LIBOR 3-Month | | | $ | (28,696 | ) |
825,000 | | | 8/22/24 | | | | 2.57 | % | | | USD LIBOR 3-Month | | | | (21,152 | ) |
| | | | | | | | | | | | | | | | |
| | | | | | | | | | | | | | $ | (49,848 | ) |
| | | | | | | | | | | | | | | | |
FORWARD CURRENCY CONTRACTS
| | | | | | | | | | | | | | | | |
| | | | | | Contract Amount | | | | |
| Counterparty | | Settlement
Date | | | Receive
U.S.
Dollar | | | Deliver
Foreign
Currency | | | Unrealized
Appreciation/
(Depreciation) | |
Contracts to sell EUR: | | | | | | | | | | | | | |
Barclays | | | 9/9/15 | | | | 1,144,874 | | | | 1,025,000 | | | $ | 1,059 | |
| | | | | | | | | | | | | | | | |
| | | |
| | | | | | Contract Amount | | | | |
| Counterparty | | Settlement
Date | | | Deliver
U.S.
Dollar | | | Receive
Foreign
Currency | | | Unrealized
Appreciation/
(Depreciation) | |
Contracts to buy INR: | | | | | | | | | | | | | | | | |
Barclays | | | 8/19/15 | | | | 759,414 | | | | 48,500,000 | | | $ | (4,889 | ) |
Barclays | | | 8/19/15 | | | | 613,111 | | | | 39,000,000 | | | | (6,379 | ) |
Barclays | | | 12/9/15 | | | | 151,309 | | | | 10,000,000 | | | | 959 | |
| | | | | | | | | | | | | | | | |
| | | | | | | | | | | | | | $ | (9,250 | ) |
| | | | | | | | | | | | | | | | |
| | |
| PAGE 10 § DODGE & COX GLOBAL BOND FUND | | See accompanying Notes to Financial Statements |
| | | | |
STATEMENT OF ASSETS AND LIABILITIES (unaudited) | |
| | | June 30, 2015 | |
ASSETS: | | | | |
Investments, at value (cost $77,189,595) | | $ | 73,968,811 | |
Unrealized appreciation on forward currency contracts | | | 2,018 | |
Cash held at broker | | | 242,367 | |
Receivable for investments sold | | | 35,441 | |
Receivable from broker for variation margin | | | 2,854 | |
Receivable for Fund shares sold | | | 38,039 | |
Dividends and interest receivable | | | 947,636 | |
Prepaid expenses and other assets | | | 12,675 | |
| | | | |
| | | 75,249,841 | |
| | | | |
LIABILITIES: | | | | |
Unrealized depreciation on forward currency contracts | | | 11,268 | |
Payable for investments purchased | | | 435,938 | |
Payable for Fund shares redeemed | | | 286,690 | |
Expense reimbursement received in advance | | | 36,427 | |
Accrued expenses | | | 113,118 | |
| | | | |
| | | 883,441 | |
| | | | |
NET ASSETS | | $ | 74,366,400 | |
| | | | |
NET ASSETS CONSIST OF: | | | | |
Paid in capital | | $ | 78,444,547 | |
Undistributed net investment income | | | 940,826 | |
Accumulated net realized loss | | | (1,862,987 | ) |
Net unrealized depreciation | | | (3,155,986 | ) |
| | | | |
| | $ | 74,366,400 | |
| | | | |
Fund shares outstanding (par value $0.01 each,
unlimited shares authorized) | | | 7,373,915 | |
Net asset value per share | | $ | 10.09 | |
|
STATEMENT OF OPERATIONS
(unaudited) | |
| | | Six Months Ended June 30, 2015 | |
INVESTMENT INCOME: | | | | |
Dividends | | $ | 25,791 | |
Interest (net of foreign taxes of $5,735) | | | 1,190,749 | |
| | | | |
| | | 1,216,540 | |
| | | | |
EXPENSES: | | | | |
Management fees | | | 174,392 | |
Custody and fund accounting fees | | | 13,857 | |
Transfer agent fees | | | 10,811 | |
Professional services | | | 110,815 | |
Shareholder reports | | | 10,489 | |
Registration fees | | | 80,384 | |
Trustees’ fees | | | 118,750 | |
Miscellaneous | | | 7,117 | |
| | | | |
Total expenses | | | 526,615 | |
Expenses reimbursed by investment manager | | | (317,139 | ) |
| | | | |
Net expenses | | | 209,476 | |
| | | | |
NET INVESTMENT INCOME | | | 1,007,064 | |
| | | | |
| |
REALIZED AND UNREALIZED GAIN (LOSS): | | | | |
Net realized loss | | | | |
Investments | | | (1,533,796 | ) |
Treasury futures contracts | | | (39,511 | ) |
Interest rate swaps | | | (19,858 | ) |
Forward currency contracts | | | (60,832 | ) |
Foreign currency transactions | | | (31,982 | ) |
Net change in unrealized appreciation/depreciation | | | | |
Investments | | | (1,314,648 | ) |
Treasury futures contracts | | | 340,833 | |
Interest rate swaps | | | 17,497 | |
Forward currency contracts | | | 7,859 | |
Foreign currency translation | | | 15,103 | |
| | | | |
Net realized and unrealized loss | | | (2,619,335 | ) |
| | | | |
NET DECREASE IN NET ASSETS
FROM OPERATIONS | | $ | (1,612,271 | ) |
| | | | |
| | | | | | | | |
STATEMENT OF CHANGES IN NET ASSETS (unaudited) | |
| | | Six Months Ended
June 30, 2015 | | | Period Ended
December 31, 2014* | |
OPERATIONS: | | | | | | | | |
Net investment income | | $ | 1,007,064 | | | $ | 746,563 | |
Net realized loss | | | (1,685,979 | ) | | | (339,029 | ) |
Net change in unrealized
appreciation/depreciation | | | (933,356 | ) | | | (2,222,630 | ) |
| | | | | | | | |
| | | (1,612,271 | ) | | | (1,815,096 | ) |
| | | | | | | | |
| | |
DISTRIBUTIONS TO SHAREHOLDERS FROM: | | | | | | | | |
Net investment income | | | — | | | | (650,780 | ) |
Net realized gain | | | — | | | | — | |
| | | | | | | | |
Total distributions | | | — | | | | (650,780 | ) |
| | | | | | | | |
| | |
FUND SHARE
TRANSACTIONS: | | | | | | | | |
Proceeds from sale of shares | | | 19,065,781 | | | | 75,231,468 | |
Reinvestment of distributions | | | — | | | | 582,706 | |
Cost of shares redeemed | | | (7,776,471 | ) | | | (8,658,937 | ) |
| | | | | | | | |
Net increase from Fund share transactions | | | 11,289,310 | | | | 67,155,237 | |
| | | | | | | | |
Total increase in net assets | | | 9,677,039 | | | | 64,689,361 | |
| | |
NET ASSETS: | | | | | | | | |
Beginning of period | | | 64,689,361 | | | | — | |
| | | | | | | | |
End of period (including undistributed net investment income of $940,826 and $(66,238) | | $ | 74,366,400 | | | $ | 64,689,361 | |
| | | | | | | | |
| | |
SHARE INFORMATION: | | | | | | | | |
Shares sold | | | 1,861,754 | | | | 7,034,774 | |
Distributions reinvested | | | — | | | | 55,846 | |
Shares redeemed | | | (760,081 | ) | | | (818,378 | ) |
| | | | | | | | |
Net increase in shares outstanding | | | 1,101,673 | | | | 6,272,242 | |
| | | | | | | | |
| * | Period from May 1, 2014 (commencement of operations) to December 31, 2014 |
| | |
| See accompanying Notes to Financial Statements | | DODGE & COX GLOBAL BOND FUND §PAGE 11 |
NOTES TO FINANCIAL STATEMENTS (unaudited)
NOTE 1—ORGANIZATION AND SIGNIFICANT ACCOUNTING POLICIES
Dodge & Cox Global Bond Fund (the “Fund”) is one of the series constituting the Dodge & Cox Funds (the “Trust” or the “Funds”). The Trust is organized as a Delaware statutory trust and is registered under the Investment Company Act of 1940, as amended, as an open-end management investment company. The Fund1 seeks a high rate of total return consistent with long-term preservation of capital. Foreign investing, especially in developing countries, has special risks such as currency and market volatility and political and social instability. These and other risk considerations are discussed in the Fund’s Prospectus.
The financial statements have been prepared in conformity with accounting principles generally accepted in the United States of America, which require the use of estimates and assumptions by management. Actual results may differ from those estimates. Significant accounting policies are as follows:
Security valuation The Fund’s net assets are valued as of the close of trading on the New York Stock Exchange (NYSE), generally 4:00 p.m. Eastern Time, each day that the NYSE is open for business. Debt securities and non-exchange traded derivatives are valued based on prices received from independent pricing services which utilize both dealer-supplied valuations and pricing models. Pricing models may consider quoted prices for similar securities, interest rates, prepayment speeds, and credit risk. Exchange-traded derivatives are valued at the settlement price determined by the relevant exchange. Interest rate swaps are valued daily based on prices received from independent pricing services, which represent the net present value of all future cash settlement amounts based on implied forward interest rates. Other financial instruments for which market quotes are readily available are valued at market value. Security values are not discounted based on the size of the Fund’s position. Short-term securities less than 60 days to maturity may be valued at amortized cost if amortized cost approximates current value. Mutual funds are valued at their respective net asset values.
Investments initially valued in currencies other than the U.S. dollar are converted to the U.S. dollar using prevailing exchange rates. As a result, the Fund’s net assets may be affected by changes in the value of currencies in relation to the U.S. dollar.
If market quotations are not readily available or if a security’s value is believed to have materially changed after the close of the security’s primary market but before the close of trading on the NYSE, the security is valued at fair value as determined in good
| 1 | | The Fund’s predecessor, Dodge & Cox Global Bond Fund, L.L.C. (the “Private Fund”), was organized on August 31, 2012 and commenced operations on December 5, 2012 as a private investment fund that reorganized into, and had the same investment manager as, the Fund. The Fund commenced operations on May 1, 2014, upon the transfer of assets from the Private Fund. This transaction was accomplished through a transfer of Private Fund net assets valued at $10,725,688 in exchange for 1,000,000 shares of the Fund. Immediately after the transfer, the shares of the Fund were distributed to the sole owner of the Private Fund and the investment manager of the Fund, Dodge & Cox, which became the initial shareholder of the Fund. |
faith by or under the direction of the Funds’ Board of Trustees. The Board of Trustees has delegated authority to Dodge & Cox, the Fund’s investment manager, to make fair value determinations in accordance with the Dodge & Cox Funds Valuation Policies (“Valuation Policies”), subject to Board oversight. Dodge & Cox has established a Pricing Committee that is comprised of representatives from Treasury, Legal, Compliance, and Operations. The Pricing Committee is responsible for implementing the Valuation Policies, including determining the fair value of securities when market quotations or market-based valuations are not readily available or are deemed unreliable. The Pricing Committee considers relevant indications of value that are reasonably available to it in determining the fair value assigned to a particular security, such as the value of similar financial instruments, trading volumes, contractual restrictions on disposition, related corporate actions, and changes in economic conditions. In doing so, the Pricing Committee employs various methods for calibrating fair valuation approaches, including a regular review of key inputs and assumptions, back-testing, and review of any related market activity.
Valuing securities through a fair value determination involves greater reliance on judgment than valuation of securities based on readily available market quotations. In some instances, lack of information and uncertainty as to the significance of information may lead to a conclusion that a prior valuation is the best indication of a security’s value. When fair value pricing is employed, the prices of securities used by the Fund to calculate its NAV may differ from quoted or published prices for the same securities.
Security transactions, investment income, expenses, and distributions Security transactions are recorded on the trade date. Realized gains and losses on securities sold are determined on the basis of identified cost.
Interest income is recorded on the accrual basis. Interest income includes coupon interest, amortization of premium and accretion of discount on debt securities, gain/loss on paydowns, and inflation adjustments to the principal amount of inflation-indexed securities. The ability of the issuers of the debt securities held by the Fund to meet their obligations may be affected by economic developments in a specific industry, state, region, or country. Debt obligations may be placed on non-accrual status and related interest income may be reduced by ceasing current accruals and writing off interest receivables when the collection of all or a portion of interest has become doubtful. A debt obligation is removed from non-accrual status when the issuer resumes interest payments or when collectability of interest is reasonably assured. Dividend income is recorded on the ex-dividend date.
Expenses are recorded on the accrual basis. Some expenses of the Trust can be directly attributed to a specific series. Expenses which cannot be directly attributed are allocated among the Funds in the Trust based on relative net assets or other expense methodologies determined by the nature of the expense.
Distributions to shareholders are recorded on the ex-dividend date.
PAGE 12 § DODGE & COX GLOBAL BOND FUND
NOTES TO FINANCIAL STATEMENTS (unaudited)
Foreign taxes The Fund is subject to foreign taxes which may be imposed by certain countries in which the Fund invests. The Fund endeavors to record foreign taxes based on applicable foreign tax law. Withholding taxes are incurred on certain foreign receipts and are accrued at the time the associated interest income is recorded.
Capital gains taxes are incurred upon disposition of certain foreign securities. Capital gains taxes on appreciated securities are accrued as unrealized losses and are reflected as realized losses upon the sale of the related security.
Repurchase agreements The Fund enters into repurchase agreements, secured by U.S. government or agency securities, which involve the purchase of securities from a counterparty with a simultaneous commitment to resell the securities at an agreed-upon date and price. It is the Fund’s policy that its custodian take possession of the underlying collateral securities, the fair value of which exceeds the principal amount of the repurchase transaction, including accrued interest, at all times. In the event of default by the counterparty, the Fund has the contractual right to liquidate the securities and to apply the proceeds in satisfaction of the obligation.
Futures Contracts Futures contracts involve an obligation to purchase or sell (depending on whether the Fund has entered a long or short futures contract, respectively) an asset at a future date, at a price set at the time of the contract. Upon entering into a futures contract, the Fund is required to deposit an amount of cash or liquid assets (referred to as initial margin) in a segregated account with the clearing broker. Subsequent payments (referred to as variation margin) to and from the clearing broker are made on a daily basis based on changes in the market value of futures contracts. Futures contracts are traded publicly and their market value changes daily. Changes in the market value of open futures contracts are recorded as unrealized appreciation or depreciation in the Statement of Operations. Realized gains and losses on futures contracts are recorded in the Statement of Operations at the closing or expiration of the contracts. Cash deposited with a broker as initial margin is recorded on the Statement of Assets and Liabilities. A receivable and/or payable to brokers for daily variation margin is also recorded on the Statement of Assets and Liabilities.
Investments in futures contracts may include certain risks, which may be different from, and potentially greater than, those of the underlying securities. To the extent the Fund uses futures, it is exposed to additional volatility and potential losses resulting from leverage.
The Fund has maintained short Treasury futures contracts to assist with the management of the portfolio’s interest rate exposure. During the six months ended June 30, 2015, these Treasury futures contracts had notional values ranging from 8% to 16% of net assets.
Interest rate swaps Interest rate swaps are agreements that obligate two parties to exchange a series of cash flows at specified payment dates calculated by reference to specified interest rates, such as an exchange of floating rate payments for fixed rate payments.
Upon entering into a centrally cleared interest rate swap, the Fund is required to post an amount of cash or liquid assets (referred to as initial margin) in a segregated account with the clearing broker. Subsequent payments (referred to as variation margin) to and from the clearing broker are made on a daily basis based on changes in the market value of interest rate swaps. Changes in the market value of open interest rate swaps are recorded as unrealized appreciation or depreciation in the Statement of Operations. Realized gains and losses on interest rate swaps are recorded in the Statement of Operations, both upon the exchange of cash flows on each specified payment date and upon the closing or expiration of the swap. Cash deposited with the clearing broker as initial margin is recorded on the Statement of Assets and Liabilities. A receivable and/or payable to brokers for daily variation margin is also recorded on the Statement of Assets and Liabilities.
Investments in interest rate swaps may include certain risks including unfavorable changes in interest rates, or a default or failure by the clearing broker or clearinghouse.
The Fund entered into interest rate swaps in connection with the management of the interest rate exposure of its portfolio. During the six months ended June 30, 2015, the Fund invested in interest rate swaps with U.S. dollar notional values ranging from 2% to 3% of net assets.
Forward currency contracts A forward currency contract represents an obligation to purchase or sell a specific foreign currency at a future date at a price set at the time of the contract. Losses from these transactions may arise from unfavorable changes in currency values or if the counterparties do not perform under a contract’s terms.
The values of the forward currency contracts are adjusted daily based on the prevailing forward exchange rates of the underlying currencies. Changes in the value of open contracts are recorded as unrealized appreciation or depreciation in the Statement of Operations. When the forward currency contract is closed, the Fund records a realized gain or loss in the Statement of Operations equal to the difference between the value at the time the contract was opened and the value at the time it was closed.
The Fund entered into forward currency contracts to increase its portfolio exposure to the Indian rupee. During the six months ended June 30, 2015, the Indian rupee forward currency contracts had U.S. dollar total values of 1% to 2% of net assets.
During the period, the Fund entered into forward currency contracts to hedge foreign currency risks associated with portfolio investments denominated in euro. These euro foreign currency contracts had U.S. dollar total values ranging from 0% to 2% of net assets during the period.
Foreign currency translation The books and records of the Fund are maintained in U.S. dollars. Foreign currency amounts are translated into U.S. dollars at the prevailing exchange rates of such currencies against the U.S. dollar. The market value of investment securities and other assets and liabilities are translated at the exchange rate as of the valuation date. Purchases and sales of investment securities, income, and expenses are translated at the exchange rate prevailing on the transaction date.
DODGE & COX GLOBAL BOND FUND §PAGE 13
NOTES TO FINANCIAL STATEMENTS (unaudited)
Reported realized and unrealized gain (loss) on investments includes foreign currency gain (loss) related to investment transactions.
Reported realized and unrealized gain (loss) on foreign currency transactions and translation include the following: holding/disposing of foreign currency, the difference between the trade and settlement dates on securities transactions, the difference between the accrual and payment dates on interest, and currency losses on the purchase of foreign currency in certain countries that impose taxes on such transactions.
Indemnification Under the Trust’s organizational documents, its officers and trustees are indemnified against certain liabilities arising out of the performance of their duties to the Trust. In addition, in the normal course of business the Trust enters into contracts that provide general indemnities to other parties. The Trust’s maximum exposure under these arrangements is unknown as this would involve future claims that may be made against the Trust that have not yet occurred.
NOTE 2—VALUATION MEASUREMENTS
Various inputs are used in determining the value of the Fund’s investments. These inputs are summarized in the three broad levels listed below.
| § | | Level 1: Quoted prices in active markets for identical securities |
| § | | Level 2: Other significant observable inputs (including quoted prices for similar securities, market indices, interest rates, credit risk, etc.) |
| § | | Level 3: Significant unobservable inputs (including Fund management’s assumptions in determining the fair value of investments) |
The inputs or methodology used for valuing securities are not necessarily an indication of the risk associated with investing in those securities.
The following is a summary of the inputs used to value the Fund’s holdings at June 30, 2015:
| | | | | | | | |
| Classification(a) | | LEVEL 1
(Quoted Prices) | | | LEVEL 2
(Other Significant
Observable Inputs) | |
Securities | | | | | | | | |
Debt Securities | | | | | | | | |
Government | | $ | — | | | $ | 15,872,780 | |
Government-Related | | | — | | | | 5,868,581 | |
Securitized | | | — | | | | 13,672,585 | |
Corporate | | | — | | | | 37,380,705 | |
Short-term Investments | | | | | | | | |
Money Market Fund | | | 75,160 | | | | — | |
Repurchase Agreement | | | — | | | | 1,099,000 | |
| | | | | | | | |
Total Securities | | $ | 75,160 | | | $ | 73,893,651 | |
| | | | | | | | |
Other Financial Instruments | | | | | | | | |
Treasury Futures Contracts | | $ | 133,056 | (b) | | $ | — | |
Interest Rate Swaps | | | — | | | | (49,848 | )(b) |
Forward Currency Contracts | | | — | | | | (9,250 | )(b) |
| | | | | | | | |
Total Other Financial Instruments | | $ | 133,056 | | | $ | (59,098 | ) |
| | | | | | | | |
| | | | | | | | | |
| (a) | U.S. Treasury securities were transferred from Level 1 to Level 2 during the period. There were no Level 3 securities at June 30, 2015 and December 31, 2014, and there were no transfers to Level 3 during the period. |
| (b) | Represents net unrealized appreciation/(depreciation). |
NOTE 3—ADDITIONAL DERIVATIVES INFORMATION
The Fund has entered into over-the-counter derivatives, such as foreign exchange forwards (each, a “Derivative”). Each Derivative is subject to a negotiated master agreement (based on a form published by the International Swaps and Derivatives Association (“ISDA”)) governing all Derivatives between the Fund and the relevant dealer counterparty. The master agreements specify (i) events of default and other events permitting a party to terminate some or all of the Derivatives thereunder and (ii) the process by which those Derivatives will be valued for purposes of determining termination payments. If some or all of the Derivatives under a master agreement are terminated because of an event of default or similar event, the values of all terminated Derivatives must be netted to determine a single payment owed by one party to the other. Some master agreements contain collateral terms requiring the parties to post collateral in respect of some or all of the Derivatives thereunder based on the net market value of those Derivatives, subject to a minimum exposure threshold. To the extent amounts owed to the Fund by its counterparties are not collateralized, the Fund is at risk of those counterparties’ non-performance. The Fund attempts to mitigate counterparty credit risk by entering into Derivatives only with counterparties it believes to be of good credit quality and by monitoring the financial stability of those counterparties.
For financial reporting purposes, the Fund does not offset financial assets and liabilities that are subject to an ISDA Master Agreement in the Statement of Assets and Liabilities. The net amount for Derivatives is disclosed on the Portfolio of Investments. At June 30, 2015, no collateral is pledged or held by the Fund for Derivatives.
NOTE 4—RELATED PARTY TRANSACTIONS
Management fees Under a written agreement approved by a unanimous vote of the Board of Trustees, the Fund pays an annual management fee of 0.50% of the Fund’s average daily net assets to Dodge & Cox, investment manager of the Fund. Dodge & Cox has contractually agreed to reimburse the Fund to the extent that such fee plus all other ordinary operating expenses of the Fund exceed 0.60% of the average daily net assets for the fiscal periods ending December 31, 2014 and 2015.
Fund officers and trustees All officers and two of the trustees of the Trust are officers or employees of Dodge & Cox. The Trust pays a fee only to those trustees who are not affiliated with Dodge & Cox.
Share ownership At June 30, 2015, Dodge & Cox owned 14% of the Fund’s outstanding shares.
PAGE 14 § DODGE & COX GLOBAL BOND FUND
NOTES TO FINANCIAL STATEMENTS (unaudited)
NOTE 5—INCOME TAX INFORMATION AND DISTRIBUTIONS TO SHAREHOLDERS
A provision for federal income taxes is not required since the Fund intends to continue to qualify as a regulated investment company under Subchapter M of the Internal Revenue Code and distribute all of its taxable income to shareholders. Distributions are determined in accordance with income tax regulations, and such amounts may differ from net investment income and realized gains for financial reporting purposes. Financial reporting records are adjusted for permanent book/tax differences at year end to reflect tax character.
Book/tax differences are primarily due to differing treatments of wash sales, net short-term realized gain (loss), foreign capital gain taxes, foreign currency realized gain (loss), Treasury futures contracts, and interest rate swaps. At June 30, 2015, the cost of investments for federal income tax purposes was $77,189,595.
Distributions during the periods noted below were characterized as follows for federal income tax purposes:
| | | | | | | | |
| | | Six Months Ended
June 30, 2015 | | | Eight Months Ended December 31, 2014 | |
Ordinary income | | | — | | | | $650,780 | |
| | | | | | | ($0.144 per share) | |
| | |
Long-term capital gain | | | — | | | | — | |
At June 30, 2015, the tax basis components of distributable earnings were as follows:
| | | | |
Unrealized appreciation | | $ | 42,909 | |
Unrealized depreciation | | | (3,263,693 | ) |
| | | | |
Net unrealized depreciation | | | (3,220,784 | ) |
Undistributed ordinary income | | | 1,020,415 | |
Accumulated capital loss(a) | | | (1,337,287 | ) |
Capital loss carryforward(b) | | | (401,894 | ) |
Deferred loss(c) | | | (79,589 | ) |
| (a) | Represents capital loss realized for tax purposes during the period from January 1, 2015 to June 30, 2015. |
| (b) | Represents accumulated capital loss as of December 31, 2014, which may be carried forward to offset future capital gains. |
| | | | |
No expiration | | | | |
Short-term | | $ | 140,964 | |
Long-term | | | 260,930 | |
| | | | |
| | $ | 401,894 | |
| | | | |
| (c) | Represents net realized loss on foreign currency incurred between November 1, 2014 and December 31, 2014. As permitted by tax regulations, the Fund has elected to treat this loss as arising in 2015. |
Fund management has reviewed the tax positions for the open period applicable to the Fund, and has determined that no provision for income tax is required in the Fund’s financial statements.
NOTE 6—LOAN FACILITIES
Pursuant to an exemptive order issued by the Securities and Exchange Commission (SEC), the Fund may participate in an interfund lending facility (Facility). The Facility allows the Fund to borrow money from or loan money to the Funds. Loans under the Facility are made for temporary or emergency purposes, such as to fund shareholder redemption requests. Interest on borrowings is the average of the current repurchase agreement rate and the bank loan rate. There was no activity in the Facility during the period.
All Funds in the Trust participate in a $500 million committed credit facility (Line of Credit) with State Street Bank and Trust Company, to be utilized for temporary or emergency purposes to fund shareholder redemptions or for other short-term liquidity purposes. The maximum amount available to the Fund is $250 million. Each Fund pays an annual commitment fee on its pro-rata portion of the Line of Credit. The Fund’s commitment fee for the six months ended June 30, 2015, amounted to $131 and is reflected as a Miscellaneous Expense in the Statement of Operations. Interest on borrowings is charged at the prevailing rate. There were no borrowings on the Line of Credit during the period.
NOTE 7—PURCHASES AND SALES OF INVESTMENTS
For the six months ended June 30, 2015, purchases and sales of securities, other than short-term securities and U.S. government securities, aggregated $22,147,725 and $11,717,397, respectively. For the six months ended June 30, 2015, purchases and sales of U.S. government securities aggregated $8,888,945 and $4,540,950, respectively.
NOTE 8—ACCOUNTING PRONOUNCEMENTS
In June 2014, the Financial Accounting Standards Board issued Accounting Standards Update (ASU) No. 2014-11, Transfers and Servicing (Topic 860), Repurchase-to-Maturity Transactions, Repurchase Financings, and Disclosures. The ASU changes the accounting for certain repurchase agreements and expands disclosure requirements related to repurchase agreements and similar transactions. There was no impact to these financial statements as a result of applying this ASU.
NOTE 9—SUBSEQUENT EVENTS
Fund management has determined that no material events or transactions occurred subsequent to June 30, 2015, and through the date of the Fund’s financial statements issuance, which require additional disclosure in the Fund’s financial statements.
DODGE & COX GLOBAL BOND FUND §PAGE 15
FINANCIAL HIGHLIGHTS (unaudited)
| | | | | | | | |
SELECTED DATA AND RATIOS (for a share outstanding throughout the period) | | Six Months Ended
June 30, 2015(a) | | | Period from May 1, 2014 (commencement of operations) to December 31, 2014 | |
Net asset value, beginning of period | | | $10.31 | | | | $10.73 | |
Income from investment operations: | | | | | | | | |
Net investment income | | | 0.14 | | | | 0.16 | |
Net realized and unrealized loss | | | (0.36 | ) | | | (0.44 | ) |
| | | | | | | | |
Total from investment operations | | | (0.22 | ) | | | (0.28 | ) |
| | | | | | | | |
Distributions to shareholders from: | | | | | | | | |
Net investment income | | | — | | | | (0.14 | ) |
Net realized gain | | | — | | | | — | |
| | | | | | | | |
Total distributions | | | — | | | | (0.14 | ) |
| | | | | | | | |
Net asset value, end of period | | | $10.09 | | | | $10.31 | |
| | | | | | | | |
Total return | | | (2.13 | )% | | | (2.59 | )% |
Ratios/supplemental data: | | | | | | | | |
Net assets, end of period (millions) | | | $74 | | | | $65 | |
Ratio of expenses to average net assets | | | 0.60 | %(b) | | | 0.60 | %(b) |
Ratio of expenses to average net assets, before reimbursement by investment manager | | | 1.51 | %(b) | | | 2.18 | %(b) |
Ratio of net investment income to average net assets | | | 2.89 | %(b) | | | 2.83 | %(b) |
Portfolio turnover rate | | | 24 | % | | | 36 | % |
See accompanying Notes to Financial Statements
PAGE 16 § DODGE & COX GLOBAL BOND FUND
FUND HOLDINGS
The Fund provides a complete list of its holdings four times each fiscal year, as of the end of each quarter. The Fund files the lists with the Securities and Exchange Commission (SEC) on Form N-CSR (second and fourth quarters) and Form N-Q (first and third quarters). Shareholders may view the Fund’s Forms N-CSR and N-Q on the SEC’s website at sec.gov. Forms N-CSR and N-Q may also be reviewed and copied at the SEC’s Public Reference Room in Washington, DC. Information regarding the operations of the Public Reference Room may be obtained by calling 202-942-8090 (direct) or 800-732-0330 (general SEC number). A list of the Fund’s quarter-end holdings is also available at dodgeandcox.com on or about 15 days following each quarter end and remains available on the web site until the list is updated in the subsequent quarter.
PROXY VOTING
For a free copy of the Fund’s proxy voting policies and procedures, please call 800-621-3979, visit the Fund’s website at dodgeandcox.com, or visit the SEC’s website at sec.gov. Information regarding how the Fund voted proxies relating to portfolio securities during the most recent 2-month period ending June 30 is also available at dodgeandcox.com or at www.sec.gov.
HOUSEHOLD MAILINGS
The Fund routinely mails shareholder reports and summary prospectuses to shareholders and, on occasion, proxy statements. In order to reduce the volume of mail, when possible, only one copy of these documents will be sent to shareholders who are part of the same family and share the same residential address.
If you have a direct account with the Funds and you do not want the mailing of shareholder reports and summary prospectuses combined with other members in your household, contact the Funds at 800-621-3979. Your request will be implemented within 30 days.
DODGE & COX GLOBAL BOND FUND §PAGE 17
THIS PAGE INTENTIONALLY LEFT BLANK
PAGE 18 § DODGE & COX GLOBAL BOND FUND
TRUSTEES AND EXECUTIVE OFFICERS
Charles F. Pohl, Chairman and Trustee
Chairman, Dodge & Cox
Dana M. Emery, President and Trustee
Chief Executive Officer and President, Dodge & Cox
Thomas A. Larsen, Independent Trustee
Senior Counsel, Arnold & Porter LLP
Ann Mather, Independent Trustee
Former Executive Vice President, Chief Financial Officer, and Company Secretary, Pixar Studios
Robert B. Morris III, Independent Trustee
Advisory Director, The Presidio Group
Gary Roughead, Independent Trustee
Annenberg Distinguished Visting Fellow, Hoover Institution; and former U.S. Navy Chief of Naval Operations
Mark E. Smith, Independent Trustee
Former Executive Vice President and Managing Director-Fixed Income, Loomis Sayles & Company, L.P.
John B. Taylor, Independent Trustee
Professor of Economics, Stanford University; Senior Fellow, Hoover Institute; and former Under Secretary for International Affairs, United States Treasury
John A. Gunn, Senior Vice President
Former Chairman and Chief Executive Officer, Dodge & Cox
Diana S. Strandberg, Senior Vice President
Senior Vice President and Director of International Equity, Dodge & Cox
David H. Longhurst, Treasurer
Vice President and Assistant Treasurer, Dodge & Cox
Thomas M. Mistele, Secretary
Chief Operating Officer, Secretary, and Senior Counsel, Dodge & Cox
Katherine M. Primas, Chief Compliance Officer
Chief Compliance Officer, Dodge & Cox
Additional information about the Trust’s Trustees and Officers is available in the Trust’s Statement of Additional Information (SAI). You can get a free copy of the SAI by visiting the Funds’ website at dodgeandcox.com or calling 800-621-3979.
DODGE & COX GLOBAL BOND FUND §PAGE 19
dodgeandcox.com
For Fund literature, transactions, and account
information, please visit the Funds’ website.
or write or call:
DODGE & COX FUNDS
c/o Boston Financial Data Services
P.O. Box 8422
Boston, Massachusetts 02266-8422
(800) 621-3979
INVESTMENT MANAGER
Dodge & Cox
555 California Street, 40th Floor
San Francisco, California 94104
(415) 981-1710
This report is submitted for the general information of the shareholders of the Fund. The report is not authorized for distribution to prospective investors in the Fund unless it is accompanied by a current prospectus.
This report reflects our views, opinions, and portfolio holdings as of June 30, 2015, the end of the reporting period. Any such views are subject to change at any time based upon market or other conditions and Dodge & Cox disclaims any responsibility to update such views. These views may not be relied on as investment advice and, because investment decisions for a Dodge & Cox Fund are based on numerous factors, may not be relied on as an indication of trading intent on behalf of any Dodge & Cox Fund.
ITEM 2. CODE OF ETHICS.
Not applicable for semi-annual report filings.
ITEM 3. AUDIT COMMITTEE FINANCIAL EXPERT.
Not applicable for semi-annual report filings.
ITEM 4. PRINCIPAL ACCOUNTANT FEES AND SERVICES.
Not applicable for semi-annual report filings.
ITEM 5. AUDIT COMMITTEE OF LISTED REGISTRANTS.
Not applicable.
ITEM 6. SCHEDULE OF INVESTMENTS.
Not applicable. The complete schedule of investments is included in Item 1 of this Form N-CSR.
ITEM 7. DISCLOSURE OF PROXY VOTING POLICIES AND PROCEDURES FOR CLOSED-END MANAGEMENT INVESTMENT COMPANIES.
Not applicable.
ITEM 8. PORTFOLIO MANAGERS OF CLOSED-END MANAGEMENT INVESTMENT COMPANIES.
Not applicable.
ITEM 9. PURCHASES OF EQUITY SECURITIES BY CLOSED-END MANAGEMENT INVESTMENT COMPANY AND AFFILIATED PURCHASERS.
Not applicable.
ITEM 10. SUBMISSION OF MATTERS TO A VOTE OF SECURITY HOLDERS.
During the reporting period, there were no material changes to the procedures by which shareholders may recommend nominees to the registrant’s board.
ITEM 11. CONTROLS AND PROCEDURES.
(a) An evaluation was performed within 90 days of the filing of this report, under the supervision and with the participation of the registrant’s management, including the principal executive officer and principal financial officer, of the effectiveness of the design and operation of the registrant’s disclosure controls and procedures. Based on that evaluation, the principal executive officer and principal financial officer concluded that the registrant’s disclosure controls and procedures were effective.
(b) The registrant’s principal executive officer and principal financial officer are aware of no changes in the registrant’s internal control over financial reporting that occurred during the registrant’s second fiscal quarter of the period covered by this report that have materially affected, or are reasonably likely to materially affect, the registrant’s internal control over financial reporting.
ITEM 12. EXHIBITS.
(a) (1) Not applicable for semi-annual report filings.
(a) (2) Certifications pursuant to Section 302 of the Sarbanes-Oxley Act of 2002 are attached. (EX.99A)
(a) (3) Not applicable.
(b) Certifications pursuant to Section 906 of the Sarbanes-Oxley Act of 2002 are attached. (EX.99B)
SIGNATURES
Pursuant to the requirements of the Securities Exchange Act of 1934 and the Investment Company Act of 1940, the registrant has duly caused this report to be signed on its behalf by the undersigned, thereunto duly authorized.
Dodge & Cox Funds
| | |
| By | | /s/ Charles F. Pohl |
| | Charles F. Pohl |
| | Chairman - Principal Executive Officer |
| |
| Date | | August 25, 2015 |
Pursuant to the requirements of the Securities Exchange Act of 1934 and the Investment Company Act of 1940, this report has been signed below by the following persons on behalf of the registrant and in the capacities and on the dates indicated.
Dodge & Cox Funds
| | |
| By | | /s/ Charles F. Pohl |
| | Charles F. Pohl |
| | Chairman - Principal Executive Officer |
| |
| By | | /s/ David H. Longhurst |
| | David H. Longhurst |
| | Treasurer – Principal Financial Officer |
| |
| Date | | August 25, 2015 |