UNITED STATES
SECURITIES AND EXCHANGE COMMISSION
Washington, D.C. 20549
FORM N-CSR
CERTIFIED SHAREHOLDER REPORT OF REGISTERED
MANAGEMENT INVESTMENT COMPANIES
Investment Company Act file number 811-173
DODGE & COX FUNDS
(Exact name of registrant as specified in charter)
555 California Street, 40th Floor
San Francisco, CA 94104
(Address of principal executive offices) (Zip code)
Thomas M. Mistele, Esq.
555 California Street, 40th Floor
San Francisco, CA 94104
(Name and address of agent for service)
Registrant’s telephone number, including area code: 415-981-1710
Date of fiscal year end: DECEMBER 31, 2017
Date of reporting period: JUNE 30, 2017
Form N-CSR is to be used by management investment companies to file reports with the Commission not later than 10 days after the transmission to stockholders of any report that is required to be transmitted to stockholders under Rule 30e-1 under the Investment Company Act of 1940 (17 CFR 270.30e-1). The Commission may use the information provided on Form N-CSR in its regulatory, disclosure review, inspection, and policymaking roles.
A registrant is required to disclose the information specified by Form N-CSR, and the Commission will make this information public. A registrant is not required to respond to the collection of information contained in Form N-CSR unless the Form displays a currently valid Office of Management and Budget (“OMB”) control number. Please direct comments concerning the accuracy of the information collection burden estimate and any suggestions for reducing the burden to Secretary, Securities and Exchange Commission, 450 Fifth Street, NW, Washington, DC 20549-0609. The OMB has reviewed this collection of information under the clearance requirements of 44 U.S.C. ss. 3507.
ITEM 1. REPORTS TO STOCKHOLDERS.
The following are the June 30, 2017 semi-annual reports for the Dodge & Cox Funds, a Delaware statutory trust, consisting of six series: Dodge & Cox Stock Fund, Dodge & Cox Global Stock Fund, Dodge & Cox International Stock Fund, Dodge & Cox Balanced Fund, Dodge & Cox Income Fund and Dodge & Cox Global Bond Fund. The reports of each series were transmitted to their respective shareholders on August 15, 2017.

DODGE & COX FUNDS®
Semi-Annual Report
June 30, 2017
Stock Fund
ESTABLISHED 1965
TICKER: DODGX
06/17 SF SAR  Printed on recycled paper
TO OUR SHAREHOLDERS
The Dodge & Cox Stock Fund had a total return of 6.8% for the six months ended June 30, 2017, compared to a return of 9.3% for the S&P 500 Index.
MARKET COMMENTARY
U.S. equity markets continued to climb during the first half of 2017: the S&P 500 reached an all-time high in mid-June and ended the period up 9%, marking its strongest first half since 2013. Information Technology was the best-performing sector of the S&P 500, and Energy was the worst-performing sector amid lower oil prices. Solid corporate earnings growth, combined with expectations of an improving economy, boosted U.S. equity returns and propelled valuations further above longer-term averages.
We see signs of continuing steady economic growth, increasing corporate earnings, and rising interest rates, all of which would benefit the Fund. Economic data released during the first half has been generally strong, confirming that the U.S. economy remains solid. The Trump administration’s objectives for tax cuts and increased infrastructure spending could further stimulate growth. Meanwhile, the Federal Reserve (Fed) has signaled that additional rate hikes are forthcoming, indicating the Fed has confidence in the economy. These factors, combined with accelerating global GDP growth, a recovery in energy and commodity prices, and corporate cost reductions could drive corporate earnings higher and support current market valuations.
INVESTMENT STRATEGY
At Dodge & Cox, we approach each investment from the perspective of being a long-term part owner of a business and make gradual changes based on a three- to five-year investment horizon. The Fund has historically had low portfolio turnover; 2017 has been no exception with turnover of only 4% in the first half. As a result of individual stock selection, the Fund holds 63 companies across nine sectors; areas of emphasis are Financials, Health Care, and Information Technology.(a)
During the volatility of 2016, we highlighted how the Fund’s financial services holdings were trading at inexpensive valuations despite their asset growth, improved credit quality, cost reductions, and capital return prospects. Since then, however, share prices have risen and we have trimmed a number of the Fund’s Financials holdings, including Bank of America and Bank of New York Mellon.(b) Nevertheless, we remain enthusiastic about the Fund’s position in Financials (27.7% compared to 14.5% for the S&P 500) and specific holdings, which continue to have attractive fundamentals as well as attributes that could lead to higher share prices. Increased profitability and strong capital generation allow banks to return capital to shareholders via share buybacks and dividends, making them a compelling alternative to other dividend-paying stocks, in our view. The Trump administration may create potential tailwinds for the banking system through tax reform and regulatory relief. Moreover, the Fed raised short-term rates twice in the first half of the year and signaled expectations for one additional hike in 2017, which should increase the federal
funds rate to 1.5%. If interest rates increase further, the Financials sector stands to benefit from improved earnings and higher net interest margins.
While we have trimmed Financials and certain other holdings amid higher U.S. equity market valuations, we continue to find areas of value offering long-term investment opportunities. For example, we recently added to several Health Care holdings, including AstraZeneca, and Energy companies in the Fund.
AstraZeneca
AstraZeneca, which is based in the United Kingdom, is a global pharmaceutical company with strengths in treatments for cancer, respiratory illnesses, cardiovascular problems, and infectious diseases. In the second half of 2016, the share price was under pressure due to concerns about recent and upcoming patent expirations for several of its major drugs. Despite this headwind, we added to the Fund’s holding in early 2017 after reaffirming our investment thesis.
The company’s long-term growth outlook is favorable given its robust new drug pipeline, particularly in oncology (cancer treatment). AstraZeneca has an attractive position in the revolutionary field of cancer immunotherapy, which harnesses the disease-fighting capabilities of the body’s immune system to attack cancerous tumors. We have conducted extensive due diligence, which included industry conferences and management meetings, and we continue to believe the immuno-oncology (IO) field holds great promise. Since the IO market is in its very early stages, sponsors and the scientific community are investing heavily into understanding which tumors can be targeted with IO and which patients will be most responsive to IO treatments (i.e., biomarkers). We think the field will evolve rapidly over the next five to ten years as physicians develop a better understanding of how these drugs work, creating a massive revenue and profit opportunity. With a 4.3% dividend yield, the current valuation is reasonable at 17 times forward earnings and does not appear to reflect potential success from the immunotherapy drug pipeline. AstraZeneca represented 1.9% of the Fund on June 30.
Energy
Oil prices dropped 16% over the past six months, weighing heavily on the outlook for profitability and growth in the Energy sector. While the short-term direction of oil prices is difficult to forecast, we believe the long-term fundamentals of supply and demand point to higher prices. The current demand for oil, which is about 98 million barrels a day, continues to grow about one percent per year, driven by growing transportation demand in the developing world. Oil fields deplete as the resource is extracted, reducing the global production base about two to three percent per year, so continuing investment is required to meet current demand and to prepare for future demand growth. We anticipate that 15 to 20 million barrels per day of additional production will be needed over the next five years to meet demand if these trends continue. However, upstream capital investment has declined to a 10-year low, fewer new projects are being approved, and North American
PAGE 2 § DODGE & COX STOCK FUND
unconventional resources (including shale) are unlikely to grow enough to bridge this eventual gap.
The Fund remains modestly overweight the Energy sector (7.4% compared to 6.0% for the S&P 500). Amid depressed valuations for energy companies, we recently added to selected holdings, including Anadarko Petroleum (discussed below) and Schlumberger (the world’s leading provider of oil services for drilling, production, and processing), among other holdings.
Anadarko Petroleum
Anadarko Petroleum (a 1.3% position) is an independent oil and gas exploration and production (E&P) company, one of three held in the Fund. The company’s stock price has been negatively impacted in 2017 by a gas leak that caused a fatal explosion. While tragic, this incident did not materially impact our long-term investment outlook for the company. Recent meetings with company management affirmed our belief that Anadarko remains an attractive investment over our three- to five-year investment horizon.
As a leading global explorer with strong operational capabilities, Anadarko has a record of success in generating high returns on capital over energy price cycles. In the coming years, we believe the key differentiators for E&Ps will be a company’s asset quality and its ability to develop those assets, particularly large-scale unconventional resources. Anadarko is well positioned to manage these challenges. For example, in the DJ Basin in Colorado, Anadarko systematically developed all of the needed infrastructure to execute its plan, which allowed the company to achieve growth targets at competitive costs; Anadarko is now applying the same approach of systematic field and infrastructure development to the Permian Basin.
The company’s conservative management team has an excellent track record of disciplined capital allocation. In addition, Anadarko continues to invest substantially in exploration, which it sees as the means to create upside opportunity for the company. This focus on exploration differentiates Anadarko from its peers and will likely create value across business cycles. After considering the company’s risks, opportunities, and valuation, we added to Anadarko during the first half of 2017.
IN CLOSING
Since U.S. equity valuations are now near recent highs, we have adopted a tempered outlook for broader U.S. equity market returns. However, as an active manager with a value-oriented approach, we remain optimistic about the long-term prospects for the portfolio to preserve and enhance purchasing power. On June 30, the Fund’s equity holdings collectively traded at 15.4 times forward earnings, a discount to the S&P 500, which traded at 18.6 times forward earnings.
We believe the rewards of active management are most likely to accrue to those investors who have the discipline to maintain a long-term investment horizon. Thank you for your continued confidence in our firm. As always, we welcome your comments and questions.
For the Board of Trustees,
| | |
 | |  |
Charles F. Pohl, Chairman | | Dana M. Emery, President |
July 31, 2017
| (a) | | Unless otherwise specified, all weightings and characteristics are as of June 30, 2017. |
| (b) | | The use of specific examples does not imply that they are more or less attractive investments than the portfolio’s other holdings. |
DODGE & COX STOCK FUND §PAGE 3
YEAR-TO-DATE PERFORMANCE REVIEW
The Fund underperformed the S&P 500 by 2.5 percentage points year to date.
Key Detractors from Relative Results
| | § | | The Fund’s average overweight position (29% versus 14%) and holdings in the Financials sector (up 4% compared to up 7% for the S&P 500 sector) hurt relative performance. Goldman Sachs (down 7%) and Capital One Financial (down 4%) lagged. | |
| | § | | Poor returns from the Fund’s holdings in the Energy sector (down 21% compared to down 13% for the S&P 500 sector), combined with a slightly higher average weighting (8% versus 7%), detracted from results. Anadarko Petroleum (down 35%), Apache (down 24%), and Schlumberger (down 21%) were especially weak. | |
| | § | | Outstanding performance from several large internet and technology stocks not held by the Fund (e.g., Facebook, Amazon, Apple, Netflix) boosted S&P 500 returns and hurt the Fund’s relative results. The negative impact was particularly significant in the Information Technology sector (up 12% compared to up 17% for S&P 500 sector), which was the strongest area of the market. | |
Key Contributors to Relative Results
| | § | | The Fund’s average overweight position (19% versus 14%) and holdings in the Health Care sector (up 17% compared to up 16% for the S&P 500 sector) enhanced performance. Alnylam Pharmaceuticals (up 113%), AstraZeneca (up 29%), Cigna (up 26%), and Sanofi (up 21%) were particularly strong. | |
| | § | | Returns from holdings in the Telecommunication Services sector (down 3% compared to down 11% for the S&P 500 sector) helped relative results. | |
| | § | | Charter Communications (up 17%) also contributed. | |
KEY CHARACTERISTICS OF DODGE & COX
Independent Organization
Dodge & Cox is one of the largest privately owned investment managers in the world. We remain committed to independence, with a goal of providing the highest quality investment management service to our existing clients.
Over 85 Years of Investment Experience
Dodge & Cox was founded in 1930. We have a stable and well-qualified team of investment professionals, most of whom have spent their entire careers at Dodge & Cox.
Experienced Investment Team
The U.S. Equity Investment Committee, which is the decision-making body for the Stock Fund, is an eight-member committee with an average tenure at Dodge & Cox of 24 years.
One Business with a Single Research Office
Dodge & Cox manages equity (domestic, international, and global), fixed income (domestic and global), and balanced investments, operating from one office in San Francisco.
Consistent Investment Approach
Our team decision-making process involves thorough, bottom-up fundamental analysis of each investment.
Long-Term Focus and Low Expenses
We invest with a three- to five-year investment horizon, which has historically resulted in low turnover relative to our peers. We manage Funds that maintain low expense ratios.
Risks: The Fund is subject to market risk, meaning holdings in the Fund may decline in value for extended periods due to the financial prospects of individual companies, or due to general market and economic conditions. Please read the prospectus and summary prospectus for specific details regarding the Fund’s risk profile.
PAGE 4 § DODGE & COX STOCK FUND
GROWTH OF $10,000 OVER 10 YEARS
FOR AN INVESTMENT MADE ON JUNE 30, 2007

AVERAGE ANNUAL TOTAL RETURN
FOR PERIODS ENDED JUNE 30, 2017
| | | | | | | | | | | | | | | | |
| | | 1 Year | | | 5 Years | | | 10 Years | | | 20 Years | |
Dodge & Cox Stock Fund | | | 28.62 | % | | | 16.36 | % | | | 5.89 | % | | | 9.45 | % |
S&P 500 Index | | | 17.90 | | | | 14.63 | | | | 7.18 | | | | 7.15 | |
Returns represent past performance and do not guarantee future results. Investment return and share price will fluctuate with market conditions, and investors may have a gain or loss when shares are sold. Fund performance changes over time and currently may be significantly lower than stated. Performance is updated and published monthly. Visit the Fund’s website at dodgeandcox.com or call 800-621-3979 for current performance figures.
The Fund’s total returns include the reinvestment of dividend and capital gain distributions, but have not been adjusted for any income taxes payable by shareholders on these distributions or on Fund share redemptions. Index returns include dividends but, unlike Fund returns, do not reflect fees or expenses. The S&P 500 Index is a market capitalization-weighted index of 500 large-capitalization stocks commonly used to represent the U.S. equity market.
S&P 500® is a trademark of S&P Global Inc.
FUND EXPENSE EXAMPLE
As a Fund shareholder, you incur ongoing Fund costs, including management fees and other Fund expenses. All mutual funds have ongoing costs, sometimes referred to as operating expenses. The following example shows ongoing costs of investing in the Fund and can help you understand these costs and compare them with those of other mutual funds. The example assumes a $1,000 investment held for the six months indicated.
ACTUAL EXPENSES
The first line of the table below provides information about actual account values and expenses based on the Fund’s actual returns. You may use the information in this line, together with your account balance, to estimate the expenses that you paid over the period. Simply divide your account value by $1,000 (for example, an $8,600 account value divided by $1,000 = 8.6), then multiply the result by the number in the first line under the heading “Expenses Paid During Period” to estimate the expenses you paid on your account during this period.
HYPOTHETICAL EXAMPLE FOR COMPARISON WITH OTHER MUTUAL FUNDS
Information on the second line of the table can help you compare ongoing costs of investing in the Fund with those of other mutual funds. This information may not be used to estimate the actual ending account balance or expenses you paid during the period. The hypothetical “Ending Account Value” is based on the actual expense ratio of the Fund and an assumed 5% annual rate of return before expenses (not the Fund’s actual return). The amount under the heading “Expenses Paid During Period” shows the hypothetical expenses your account would have incurred under this scenario. You can compare this figure with the 5% hypothetical examples that appear in shareholder reports of other mutual funds.
| | | | | | | | | | | | |
Six Months Ended
June 30, 2017 | | Beginning Account Value
1/1/2017 | | | Ending Account Value
6/30/2017 | | | Expenses Paid
During Period* | |
Based on Actual Fund Return | | $ | 1,000.00 | | | $ | 1,068.10 | | | $ | 2.69 | |
Based on Hypothetical 5% Yearly Return | | | 1,000.00 | | | | 1,022.20 | | | | 2.63 | |
| * | | Expenses are equal to the Fund’s annualized expense ratio of 0.52%, multiplied by the average account value over the period, multiplied by 181/365 (to reflect the one-half year period). |
The expenses shown in the table highlight ongoing costs only and do not reflect any transactional fees or account maintenance fees. Though other mutual funds may charge such fees, please note that the Fund does not charge transaction fees (e.g., redemption fees, sales loads) or universal account maintenance fees (e.g., small account fees).
DODGE & COX STOCK FUND §PAGE 5
| | | | |
| FUND INFORMATION (unaudited) | | | June 30, 2017 | |
| | | | |
| GENERAL INFORMATION | | | |
Net Asset Value Per Share | | | $192.69 | |
Total Net Assets (billions) | | | $66.1 | |
Expense Ratio | | | 0.52% | |
Portfolio Turnover Rate (1/1/17 to 6/30/17, unannualized) | | | 4% | |
30-Day SEC Yield(a) | | | 1.13% | |
Number of Companies | | | 63 | |
Fund Inception | | | 1965 | |
No sales charges or distribution fees | | | | |
Investment Manager: Dodge & Cox, San Francisco. Managed by the U.S. Equity Investment Committee, whose eight members’ average tenure at Dodge & Cox is 24 years.
| | | | | | | | |
| PORTFOLIO CHARACTERISTICS | | Fund | | | S&P 500 | |
Median Market Capitalization (billions) | | | $41 | | | | $21 | |
Weighted Average Market Capitalization (billions) | | | $125 | | | | $169 | |
Price-to-Earnings Ratio(b) | | | 15.4x | | | | 18.6x | |
Foreign Securities not in the S&P 500(c) | | | 10.0% | | | | 0.0% | |
| | | | |
| TEN LARGEST HOLDINGS (%)(d) | | Fund | |
Charles Schwab Corp. | | | 3.8 | |
Bank of America Corp. | | | 3.8 | |
Wells Fargo & Co. | | | 3.6 | |
Capital One Financial Corp. | | | 3.4 | |
Charter Communications, Inc. | | | 3.0 | |
Novartis AG (Switzerland) | | | 3.0 | |
Sanofi (France) | | | 3.0 | |
Time Warner, Inc. | | | 2.9 | |
Goldman Sachs Group, Inc. | | | 2.8 | |
Alphabet, Inc. | | | 2.8 | |
| | | | | | | | |
| SECTOR DIVERSIFICATION (%) | | Fund | | | S&P 500 | |
Financials | | | 27.7 | | | | 14.5 | |
Health Care | | | 19.7 | | | | 14.5 | |
Information Technology | | | 17.7 | | | | 22.3 | |
Consumer Discretionary | | | 15.6 | | | | 12.3 | |
Energy | | | 7.4 | | | | 6.0 | |
Industrials | | | 5.0 | | | | 10.3 | |
Telecommunication Services | | | 1.8 | | | | 2.1 | |
Consumer Staples | | | 1.5 | | | | 9.1 | |
Materials | | | 1.0 | | | | 2.8 | |
Utilities | | | 0.0 | | | | 3.2 | |
Real Estate | | | 0.0 | | | | 2.9 | |
| (a) | SEC Yield is an annualization of the Fund’s net investment income for the trailing 30-day period. Dividends paid by the Fund may be higher or lower than implied by the SEC Yield. |
| (b) | Price-to-earnings (P/E) ratios are calculated using 12-month forward earnings estimates from third-party sources. |
| (c) | Foreign securities are U.S. dollar denominated. |
| (d) | The Fund’s portfolio holdings are subject to change without notice. The mention of specific securities is not a recommendation to buy, sell, or hold any particular security and is not indicative of Dodge & Cox’s current or future trading activity. |
| (e) | Net Cash & Other includes cash, short-term investments, derivatives, receivables, and payables. |
PAGE 6 § DODGE & COX STOCK FUND
| | | | |
| PORTFOLIO OF INVESTMENTS (unaudited) | | | June 30, 2017 | |
| | | | | | | | |
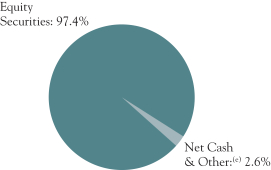
| COMMON STOCKS: 97.4% | | | | | | |
| | |
| | | SHARES | | | VALUE | |
| CONSUMER DISCRETIONARY: 15.6% | |
AUTOMOBILES & COMPONENTS: 0.5% | |
Harley-Davidson, Inc. | | | 5,610,647 | | | $ | 303,087,151 | |
|
CONSUMER DURABLES & APPAREL: 0.6% | |
Coach, Inc. | | | 8,813,900 | | | | 417,250,026 | |
| | |
MEDIA: 11.7% | | | | | | | | |
Charter Communications, Inc., Class A(a) | | | 5,934,486 | | | | 1,999,031,609 | |
Comcast Corp., Class A | | | 44,997,594 | | | | 1,751,306,358 | |
DISH Network Corp., Class A(a) | | | 9,727,476 | | | | 610,496,394 | |
News Corp., Class A | | | 6,892,103 | | | | 94,421,811 | |
Time Warner, Inc. | | | 18,778,332 | | | | 1,885,532,316 | |
Twenty-First Century Fox, Inc., Class A | | | 41,334,626 | | | | 1,171,423,301 | |
Twenty-First Century Fox, Inc., Class B | | | 9,350,000 | | | | 260,584,500 | |
| | | | | | | | |
| | | | | | | 7,772,796,289 | |
RETAILING: 2.8% | | | | | | | | |
Liberty Interactive Corp. QVC Group, Series A(a) | | | 15,980,376 | | | | 392,158,427 | |
Target Corp. | | | 11,761,054 | | | | 614,985,514 | |
The Priceline Group, Inc.(a) | | | 453,400 | | | | 848,093,768 | |
| | | | | | | | |
| | | | | | | 1,855,237,709 | |
| | | | | | | | |
| | | | | | | 10,348,371,175 | |
| CONSUMER STAPLES: 1.5% | |
FOOD & STAPLES RETAILING: 1.5% | |
Wal-Mart Stores, Inc. | | | 12,988,050 | | | | 982,935,624 | |
| | |
| ENERGY: 7.4% | | | | | | | | |
Anadarko Petroleum Corp. | | | 19,695,521 | | | | 892,994,922 | |
Apache Corp. | | | 18,045,994 | | | | 864,944,492 | |
Baker Hughes, Inc. | | | 15,371,113 | | | | 837,879,370 | |
Concho Resources, Inc.(a) | | | 3,615,000 | | | | 439,330,950 | |
National Oilwell Varco, Inc. | | | 18,798,000 | | | | 619,206,120 | |
Schlumberger, Ltd. (Curacao/United States) | | | 17,549,245 | | | | 1,155,442,291 | |
Weatherford International PLC(a) (Ireland) | | | 28,007,400 | | | | 108,388,638 | |
| | | | | | | | |
| | | | | | | 4,918,186,783 | |
| FINANCIALS: 27.7% | | | | | | | | |
BANKS: 10.6% | | | | | | | | |
Bank of America Corp. | | | 102,436,500 | | | | 2,485,109,490 | |
BB&T Corp. | | | 13,100,144 | | | | 594,877,539 | |
JPMorgan Chase & Co. | | | 16,797,800 | | | | 1,535,318,920 | |
Wells Fargo & Co. | | | 43,253,341 | | | | 2,396,667,625 | |
| | | | | | | | |
| | | | | | | 7,011,973,574 | |
DIVERSIFIED FINANCIALS: 14.3% | |
American Express Co. | | | 16,997,300 | | | | 1,431,852,552 | |
Bank of New York Mellon Corp. | | | 27,003,324 | | | | 1,377,709,590 | |
Capital One Financial Corp.(b) | | | 27,087,711 | | | | 2,237,986,683 | |
Charles Schwab Corp. | | | 58,867,600 | | | | 2,528,952,096 | |
Goldman Sachs Group, Inc. | | | 8,488,700 | | | | 1,883,642,530 | |
| | | | | | | | |
| | | | | | | 9,460,143,451 | |
INSURANCE: 2.8% | | | | | | | | |
AEGON NV (Netherlands) | | | 71,584,960 | | | | 365,799,146 | |
MetLife, Inc. | | | 26,532,700 | | | | 1,457,706,538 | |
| | | | | | | | |
| | | | | | | 1,823,505,684 | |
| | | | | | | | |
| | | | | | | 18,295,622,709 | |
| HEALTH CARE: 19.7% | | | | | | | | |
HEALTH CARE EQUIPMENT & SERVICES: 7.1% | |
Cigna Corp. | | | 8,293,217 | | | | 1,388,201,593 | |
Danaher Corp. | | | 3,437,600 | | | | 290,099,064 | |
Express Scripts Holding Co.(a) | | | 21,234,871 | | | | 1,355,634,165 | |
Medtronic PLC (Ireland) | | | 6,510,900 | | | | 577,842,375 | |
UnitedHealth Group, Inc. | | | 5,830,760 | | | | 1,081,139,519 | |
| | | | | | | | |
| | | | | | | 4,692,916,716 | |
| | | | | | | | |
| | |
| | | SHARES | | | VALUE | |
PHARMACEUTICALS, BIOTECHNOLOGY & LIFE SCIENCES: 12.6% | |
Alnylam Pharmaceuticals, Inc.(a)(b) | | | 5,500,735 | | | $ | 438,738,624 | |
AstraZeneca PLC ADR (United Kingdom) | | | 37,517,873 | | | | 1,278,984,291 | |
Bristol-Myers Squibb Co. | | | 17,941,339 | | | | 999,691,409 | |
Eli Lilly and Co. | | | 3,191,832 | | | | 262,687,774 | |
Merck & Co., Inc. | | | 7,767,900 | | | | 497,844,711 | |
Novartis AG ADR (Switzerland) | | | 23,673,500 | | | | 1,976,027,045 | |
Roche Holding AG ADR (Switzerland) | | | 27,975,399 | | | | 889,617,688 | |
Sanofi ADR (France) | | | 41,035,028 | | | | 1,965,988,191 | |
| | | | | | | | |
| | | | | | | 8,309,579,733 | |
| | | | | | | | |
| | | | | | | 13,002,496,449 | |
| INDUSTRIALS: 5.0% | |
CAPITAL GOODS: 1.4% | |
Johnson Controls International PLC (Ireland) | | | 20,810,986 | | | | 902,364,353 | |
|
TRANSPORTATION: 3.6% | |
FedEx Corp. | | | 6,897,099 | | | | 1,498,946,525 | |
Union Pacific Corp. | | | 8,070,000 | | | | 878,903,700 | |
| | | | | | | | |
| | | | | | | 2,377,850,225 | |
| | | | | | | | |
| | | | | | | 3,280,214,578 | |
| INFORMATION TECHNOLOGY: 17.7% | |
SEMICONDUCTORS & SEMICONDUCTOR EQUIPMENT: 0.8% | |
Maxim Integrated Products, Inc. | | | 12,064,675 | | | | 541,703,908 | |
|
SOFTWARE & SERVICES: 8.0% | |
Alphabet, Inc., Class A(a) | | | 148,100 | | | | 137,685,608 | |
Alphabet, Inc., Class C(a) | | | 1,920,253 | | | | 1,744,991,509 | |
Dell Technologies, Inc., Class V(a) | | | 4,022,510 | | | | 245,815,586 | |
DXC Technology Co. | | | 8,221,227 | | | | 630,732,535 | |
Microsoft Corp. | | | 24,747,300 | | | | 1,705,831,389 | |
Synopsys, Inc.(a) | | | 4,051,969 | | | | 295,510,099 | |
VMware, Inc.(a) | | | 5,955,511 | | | | 520,690,327 | |
| | | | | | | | |
| | | | | | | 5,281,257,053 | |
TECHNOLOGY, HARDWARE & EQUIPMENT: 8.9% | |
Cisco Systems, Inc. | | | 39,252,711 | | | | 1,228,609,854 | |
Corning, Inc. | | | 9,831,700 | | | | 295,442,585 | |
Hewlett Packard Enterprise Co.(b) | | | 103,083,316 | | | | 1,710,152,212 | |
HP Inc. | | | 71,435,195 | | | | 1,248,687,209 | |
Juniper Networks, Inc. | | | 11,497,165 | | | | 320,540,960 | |
NetApp, Inc.(b) | | | 7,652,331 | | | | 306,475,857 | |
TE Connectivity, Ltd. (Switzerland) | | | 9,976,475 | | | | 784,949,053 | |
| | | | | | | | |
| | | | | | | 5,894,857,730 | |
| | | | | | | | |
| | | | | | | 11,717,818,691 | |
| MATERIALS: 1.0% | | | | | | | | |
Celanese Corp., Series A(b) | | | 7,158,398 | | | | 679,618,306 | |
|
| TELECOMMUNICATION SERVICES: 1.8% | |
Sprint Corp.(a) | | | 104,462,856 | | | | 857,640,048 | |
Zayo Group Holdings, Inc.(a) | | | 9,750,000 | | | | 301,275,000 | |
| | | | | | | | |
| | | | | | | 1,158,915,048 | |
| | | | | | | | |
TOTAL COMMON STOCKS
(Cost $41,702,810,991) | | | | | | $ | 64,384,179,363 | |
| | |
| See accompanying Notes to Financial Statements | | DODGE & COX STOCK FUND §PAGE 7 |
| | | | |
| PORTFOLIO OF INVESTMENTS (unaudited) | | | June 30, 2017 | |
| | | | | | | | |
| SHORT-TERM INVESTMENTS: 2.5% | |
| | |
| | | PAR VALUE | | | VALUE | |
MONEY MARKET FUND: 0.1% | | | | | |
State Street Institutional Treasury Plus Money Market Fund | | $ | 66,033,346 | | | $ | 66,033,346 | |
|
REPURCHASE AGREEMENT: 2.4% | |
Fixed Income Clearing Corporation(c) 0.60%, dated 6/30/17, due 7/3/17, maturity value $1,594,166,704 | | | 1,594,087,000 | | | | 1,594,087,000 | |
| | | | | | | | |
TOTAL SHORT-TERM INVESTMENTS
(Cost $1,660,120,346) | | | $ | 1,660,120,346 | |
| | | | | | | | |
TOTAL INVESTMENTS
(Cost $43,362,931,337) | | | 99.9 | % | | $ | 66,044,299,709 | |
OTHER ASSETS LESS LIABILITIES | | | 0.1 | % | | | 91,371,703 | |
| | | | | | | | |
| NET ASSETS | | | 100.0 | % | | $ | 66,135,671,412 | |
| | | | | | | | |
| (b) | See Note 9 regarding holdings of 5% voting securities |
| (c) | Repurchase agreement is collateralized by U.S. Treasury Notes 1.50%-2.125%, 11/15/21-4/30/23. Total collateral value is $1,625,974,305. |
In determining a company’s country designation, the Fund generally references the country of incorporation. In cases where the Fund considers the country of incorporation to be a “jurisdiction of convenience” chosen primarily for tax purposes or in other limited circumstances, the Fund uses the country designation of an appropriate broad-based market index. In those cases, two countries are listed — the country of incorporation and the country designated by an appropriate index, respectively.
ADR: American Depositary Receipt
FUTURES CONTRACTS
| | | | | | | | | | | | | | | | |
| Description | | Number of
Contracts | | | Expiration
Date | | | Notional Amount | | | Unrealized
Appreciation/
(Depreciation) | |
E-mini S&P 500 Index—Long Position | | | 11,647 | | | | Sep 2017 | | | $ | 1,409,811,115 | | | $ | (5,420,299 | ) |
| | |
| PAGE 8 § DODGE & COX STOCK FUND | | See accompanying Notes to Financial Statements |
| | | | |
STATEMENT OF ASSETS AND LIABILITIES (unaudited) | |
| |
| | | June 30, 2017 | |
ASSETS: | | | | |
Investments, at value | | | | |
Unaffiliated issuers (cost $40,404,334,088) | | $ | 60,977,803,884 | |
Affiliated issuers (cost $2,958,597,249) | | | 5,066,495,825 | |
| | | | |
| | | 66,044,299,709 | |
Cash held at broker | | | 48,916,242 | |
Receivable for investments sold | | | 70,023,062 | |
Receivable from broker for variation margin | | | 2,853,515 | |
Receivable for Fund shares sold | | | 43,814,725 | |
Dividends and interest receivable | | | 64,596,846 | |
Prepaid expenses and other assets | | | 104,705 | |
| | | | |
| | | 66,274,608,804 | |
| | | | |
LIABILITIES: | | | | |
Payable for investments purchased | | | 68,085,773 | |
Payable for Fund shares redeemed | | | 42,911,344 | |
Management fees payable | | | 27,040,675 | |
Accrued expenses | | | 899,600 | |
| | | | |
| | | 138,937,392 | |
| | | | |
NET ASSETS | | $ | 66,135,671,412 | |
| | | | |
NET ASSETS CONSIST OF: | | | | |
Paid in capital | | $ | 42,521,487,606 | |
Undistributed net investment income | | | 7,997,157 | |
Undistributed net realized gain | | | 930,238,576 | |
Net unrealized appreciation | | | 22,675,948,073 | |
| | | | |
| | $ | 66,135,671,412 | |
| | | | |
Fund shares outstanding (par value $0.01 each, unlimited shares authorized) | | | 343,224,956 | |
Net asset value per share | | $ | 192.69 | |
|
STATEMENT OF OPERATIONS (unaudited) | |
| |
| | | Six Months Ended
June 30, 2017 | |
INVESTMENT INCOME: | | | | |
Dividends (net of foreign taxes of $25,431,443) | | | | |
Unaffiliated issuers | | $ | 572,988,155 | |
Affiliated issuers | | | 45,348,714 | |
Interest | | | 2,701,324 | |
| | | | |
| | | 621,038,193 | |
| | | | |
EXPENSES: | | | | |
Management fees | | | 160,897,971 | |
Custody and fund accounting fees | | | 402,452 | |
Transfer agent fees | | | 1,710,999 | |
Professional services | | | 81,993 | |
Shareholder reports | | | 612,474 | |
Registration fees | | | 195,797 | |
Trustees’ fees | | | 130,000 | |
ADR depository services fees | | | 4,024,180 | |
Miscellaneous | | | 557,979 | |
| | | | |
| | | 168,613,845 | |
| | | | |
NET INVESTMENT INCOME | | | 452,424,348 | |
| | | | |
REALIZED AND UNREALIZED GAIN (LOSS): | | | | |
Net realized gain (loss) | | | | |
Investments in unaffiliated issuers | | | 771,966,460 | |
Investments in affiliated issuers | | | 74,364,617 | |
Futures contracts | | | 114,867,062 | |
Net change in unrealized appreciation/depreciation | | | | |
Investments | | | 2,795,332,975 | |
Futures contracts | | | 9,320,155 | |
| | | | |
Net realized and unrealized gain | | | 3,765,851,269 | |
| | | | |
NET CHANGE IN NET ASSETS FROM OPERATIONS | | $ | 4,218,275,617 | |
| | | | |
| | | | | | | | |
STATEMENT OF CHANGES IN NET ASSETS (unaudited) | |
| | |
| | | Six Months Ended
June 30, 2017 | | | Year Ended
December 31, 2016 | |
OPERATIONS: | | | | | | | | |
Net investment income | | $ | 452,424,348 | | | $ | 1,011,975,095 | |
Net realized gain | | | 961,198,139 | | |
| 2,967,136,896
|
|
Net change in unrealized appreciation/depreciation | | | 2,804,653,130 | | | | 7,026,623,876 | |
| | | | | | | | |
| | | 4,218,275,617 | | |
| 11,005,735,867
|
|
| | | | | | | | |
| | |
DISTRIBUTIONS TO SHAREHOLDERS FROM: | | | | | | | | |
Net investment income | | | (451,809,266 | ) | | | (1,006,582,969 | ) |
Net realized gain | | | (926,622,294 | ) | | | (2,967,981,956 | ) |
| | | | | | | | |
Total distributions | | | (1,378,431,560 | ) | | | (3,974,564,925 | ) |
| | | | | | | | |
| | |
FUND SHARE TRANSACTIONS: | | | | | | | | |
Proceeds from sale of shares | | | 5,321,067,392 | | | | 7,078,053,220 | |
Reinvestment of distributions | | | 1,306,390,530 | | | | 3,757,250,793 | |
Cost of shares redeemed | | | (4,932,106,426 | ) | | | (11,111,123,603 | ) |
| | | | | | | | |
Net change from Fund share transactions | | | 1,695,351,496 | | | | (275,819,590 | ) |
| | | | | | | | |
Total change in net assets | | | 4,535,195,553 | | | | 6,755,351,352 | |
| | |
NET ASSETS: | | | | | | | | |
Beginning of period | | | 61,600,475,859 | | | | 54,845,124,507 | |
| | | | | | | | |
End of period (including undistributed net investment income of $7,997,157 and $7,382,075, respectively) | | $ | 66,135,671,412 | | | $ | 61,600,475,859 | |
| | | | | | | | |
| | |
SHARE INFORMATION: | | | | | | | | |
Shares sold | | | 27,885,017 | | | | 42,458,419 | |
Distributions reinvested | | | 6,903,842 | | | | 21,705,948 | |
Shares redeemed | | | (25,811,424 | ) | | | (66,866,904 | ) |
| | | | | | | | |
Net change in shares outstanding | | | 8,977,434 | | | | (2,702,537 | ) |
| | | | | | | | |
| | |
| See accompanying Notes to Financial Statements | | DODGE & COX STOCK FUND §PAGE 9 |
NOTES TO FINANCIAL STATEMENTS (unaudited)
NOTE 1—ORGANIZATION AND SIGNIFICANT ACCOUNTING POLICIES
Dodge & Cox Stock Fund (the “Fund”) is one of the series constituting the Dodge & Cox Funds (the “Trust” or the “Funds”). The Trust is organized as a Delaware statutory trust and is registered under the Investment Company Act of 1940, as amended, as an open-end management investment company. The Fund commenced operations on January 4, 1965, and seeks long-term growth of principal and income. Risk considerations and investment strategies of the Fund are discussed in the Fund’s Prospectus.
The financial statements have been prepared in conformity with accounting principles generally accepted in the United States of America, which require the use of estimates and assumptions by management. Actual results may differ from those estimates. Significant accounting policies are as follows:
Security valuation The Fund’s net assets are normally valued as of the scheduled close of trading on the New York Stock Exchange (NYSE), generally 4:00 p.m. Eastern Time, each day that the NYSE is open for business.
Portfolio holdings for which market quotes are readily available are valued at market value. Listed securities for example, are generally valued using the official quoted close price or the last sale on the exchange that is determined to be the primary market for the security. Exchange-traded derivatives are generally valued at the settlement price determined by the relevant exchange. Short-term securities less than 60 days to maturity may be valued at amortized cost if amortized cost approximates current value. Mutual funds are valued at their respective net asset values. Security values are not discounted based on the size of the Fund’s position and may differ from the value a Fund receives upon sale of the securities. All securities held by the Fund are denominated in U.S. dollars.
If market quotations are not readily available or if normal valuation procedures produce valuations that are deemed unreliable or inappropriate under the circumstances existing at the time, the investment will be valued at fair value as determined in good faith by or under the direction of the Fund’s Board of Trustees. The Board of Trustees has appointed Dodge & Cox, the Fund’s investment manager, to make fair value determinations in accordance with the Dodge & Cox Funds Valuation Policies (“Valuation Policies”), subject to Board oversight. Dodge & Cox has established a Pricing Committee that is comprised of representatives from Treasury, Legal, Compliance, and Operations. The Pricing Committee is responsible for implementing the Valuation Policies, including determining the fair value of securities and other investments when necessary. The Pricing Committee considers relevant indications of value that are reasonably available to it in determining the fair value assigned to a particular security, such as the value of similar financial instruments, trading volumes, contractual restrictions on disposition, related corporate actions, and changes in economic conditions. In doing so, the Pricing Committee employs various
methods for calibrating fair valuation approaches, including a regular review of key inputs and assumptions, back-testing, and review of any related market activity.
Valuing securities through a fair value determination involves greater reliance on judgment than valuation of securities based on readily available market quotations. In some instances, lack of information and uncertainty as to the significance of information may lead to a conclusion that a prior valuation is the best indication of a security’s value. When fair value pricing is employed, the prices of securities used by the Fund to calculate its NAV may differ from quoted or published prices for the same securities.
Security transactions, investment income, expenses, and distributions Security transactions are recorded on the trade date. Realized gains and losses on securities sold are determined on the basis of identified cost.
Dividend income and corporate action transactions are recorded on the ex-dividend date, or when the Fund first learns of the dividend/corporate action if the ex-dividend date has passed. Withholding taxes on foreign dividends have been provided for in accordance with the Fund’s understanding of the applicable country’s tax rules and rates. Non-cash dividends included in dividend income, if any, are recorded at the fair market value of the securities received. Dividends characterized as return of capital for U.S. tax purposes are recorded as a reduction of cost of investments and/or realized gain. Interest income is recorded on the accrual basis.
Expenses are recorded on the accrual basis. Some expenses of the Trust can be directly attributed to a specific series. Expenses which cannot be directly attributed are allocated among the Funds in the Trust using methodologies determined by the nature of the expense.
Distributions to shareholders are recorded on the ex-dividend date.
Repurchase agreements Repurchase agreements are transactions under which a Fund purchases a security from a dealer counterparty and agrees to resell the security to that counterparty on a specified future date at the same price, plus a specified interest rate. The Fund’s repurchase agreements are secured by U.S. government or agency securities. It is the Fund’s policy that its custodian take possession of the underlying collateral securities, the fair value of which exceeds the principal amount of the repurchase transaction, including accrued interest, at all times. In the event of default by the counterparty, the Fund has the contractual right to liquidate the collateral securities and to apply the proceeds in satisfaction of the obligation.
Foreign taxes The Fund may be subject to foreign taxes which may be imposed by certain countries in which the Fund invests. The Fund endeavors to record foreign taxes based on applicable foreign tax law. Withholding taxes are incurred on certain foreign dividends and are accrued at the time the associated dividend is recorded. The Fund files withholding tax reclaims in certain jurisdictions to recover a portion of amounts previously withheld. The Fund records a reclaim receivable based on, among other things, a jurisdiction’s
PAGE 10 § DODGE & COX STOCK FUND
NOTES TO FINANCIAL STATEMENTS (unaudited)
legal obligation to pay reclaims as well as payment history and market convention. In consideration of recent decisions rendered by European courts, the Fund has filed for additional reclaims related to prior years. A corresponding receivable is established when both the amount is known and significant contingencies or uncertainties regarding collectability are removed. These amounts, if any, are reported in “dividends and interest receivable” on the Statement of Assets and Liabilities.
Futures Contracts Futures contracts involve an obligation to purchase or sell (depending on whether the Fund has entered a long or short futures contract, respectively) an asset at a future date, at a price set at the time of the contract. Upon entering into a futures contract, the Fund is required to deposit an amount of cash or liquid assets (referred to as initial margin) in a segregated account with the clearing broker. Subsequent payments (referred to as variation margin) to and from the clearing broker are made on a daily basis based on changes in the market value of futures contracts. Futures contracts are traded publicly and their market value changes daily. Changes in the market value of open futures contracts are recorded as unrealized appreciation or depreciation in the Statement of Operations. Realized gains and losses on futures contracts are recorded in the Statement of Operations at the closing or expiration of the contracts. Cash deposited with a broker as initial margin is recorded on the Statement of Assets and Liabilities. A receivable and/or payable to brokers for daily variation margin is also recorded on the Statement of Assets and Liabilities.
Investments in futures contracts may include certain risks, which may be different from, and potentially greater than, those of the underlying securities. To the extent the Fund uses futures, it is exposed to additional volatility and potential losses resulting from leverage.
The Fund has maintained long S&P 500 futures contracts to provide equity exposure that approximates the Fund’s “net cash and other” position, which includes cash, short-term investments, receivables, and payables. During the six months ended June 30, 2017, these S&P 500 futures contracts had notional values ranging from 1% to 3% of net assets.
Indemnification Under the Trust’s organizational documents, its officers and trustees are indemnified against certain liabilities arising out of the performance of their duties to the Trust. In addition, in the normal course of business the Trust enters into contracts that provide general indemnities to other parties. The Trust’s maximum exposure under these arrangements is unknown as this would involve future claims that may be made against the Trust that have not yet occurred.
NOTE 2—VALUATION MEASUREMENTS
Various inputs are used in determining the value of the Fund’s investments. These inputs are summarized in the three broad levels listed below.
| § | | Level 1: Quoted prices in active markets for identical securities |
| § | | Level 2: Other significant observable inputs (including quoted prices for similar securities, market indices, interest rates, credit risk, forward exchange rates, etc.) |
| § | | Level 3: Significant unobservable inputs (including Fund management’s assumptions in determining the fair value of investments) |
The inputs or methodology used for valuing securities are not necessarily an indication of the risk associated with investing in those securities.
The following is a summary of the inputs used to value the Fund’s holdings at June 30, 2017:
| | | | | | | | |
| Classification(a) | | LEVEL 1
(Quoted Prices) | | | LEVEL 2
(Other Significant
Observable Inputs) | |
Securities | | | | | | | | |
Common Stocks(b) | | $ | 64,384,179,363 | | | $ | — | |
Short-term Investments | | | | | | | | |
Money Market Fund | | | 66,033,346 | | | | — | |
Repurchase Agreement | | | — | | | | 1,594,087,000 | |
| | | | | | | | |
Total Securities | | $ | 64,450,212,709 | | | $ | 1,594,087,000 | |
| | | | | | | | |
Other Financial Instruments | | | | | | | | |
Futures Contracts | | | | | | | | |
Depreciation | | $ | (5,420,299 | ) | | $ | — | |
| | | | | | | | | |
| (a) | There were no transfers between Level 1 and Level 2 during the six months ended June 30, 2017. There were no Level 3 securities at June 30, 2017 and December 31, 2016, and there were no transfers to Level 3 during the period. |
| (b) | All common stocks held in the Fund are Level 1 securities. For a detailed break-out of common stocks by major industry classification, please refer to the Portfolio of Investments. |
NOTE 3—RELATED PARTY TRANSACTIONS
Management fees Under a written agreement approved by a unanimous vote of the Board of Trustees, the Fund pays an annual management fee of 0.50% of the Fund’s average daily net assets to Dodge & Cox, investment manager of the Fund. The agreement further provides that Dodge & Cox shall waive its fee to the extent that such fee plus all other ordinary operating expenses of the Fund exceed 0.75% of the average daily net assets for the year.
Fund officers and trustees All officers and two of the trustees of the Trust are officers or employees of Dodge & Cox. The Trust pays a fee only to those trustees who are not affiliated with Dodge & Cox.
NOTE 4—INCOME TAX INFORMATION AND DISTRIBUTIONS TO SHAREHOLDERS
A provision for federal income taxes is not required since the Fund intends to continue to qualify as a regulated investment company under Subchapter M of the Internal Revenue Code and distribute all of its taxable income to shareholders. Distributions are determined in accordance with income tax regulations, and such amounts may differ from net investment income and realized gains for financial reporting purposes. Financial reporting records are adjusted for permanent book to tax differences at year end to reflect tax character.
DODGE & COX STOCK FUND §PAGE 11
NOTES TO FINANCIAL STATEMENTS (unaudited)
Book to tax differences are primarily due to differing treatments of wash sales, net short-term realized gain (loss), certain dividends, and futures contracts. At June 30, 2017, the cost of investments for federal income tax purposes was $43,408,498,879.
Distributions during the periods noted below were characterized as follows for federal income tax purposes:
| | | | | | | | |
| | | Six Months Ended June 30, 2017 | | | Year Ended
December 31, 2016 | |
Ordinary income | | $ | 499,423,605 | | | $ | 1,056,249,886 | |
| | | ($1.471 per share | ) | | ($ | 3.183 per share | ) |
Long-term capital gain | | $ | 879,007,955 | | | $ | 2,918,315,039 | |
| | | ($2.603 per share | ) | | ($ | 8.899 per share | ) |
At June 30, 2017, the tax basis components of distributable earnings were as follows:
| | | | |
Unrealized appreciation | | $ | 24,274,482,776 | |
Unrealized depreciation | | | (1,638,681,946 | ) |
| | | | |
Net unrealized appreciation | | | 22,635,800,830 | |
Undistributed ordinary income | | | 92,385,160 | |
Undistributed long-term capital gain | | | 885,997,816 | |
| | | | | |
Fund management has reviewed the tax positions for open periods (three years and four years, respectively, from filing the Fund’s Federal and State tax returns) as applicable to the Fund, and has determined that no provision for income tax is required in the Fund’s financial statements.
NOTE 5—LOAN FACILITIES
Pursuant to an exemptive order issued by the Securities and Exchange Commission (SEC), the Fund may participate in an interfund lending facility (Facility). The Facility allows the Fund to borrow money from or loan money to the Funds. Loans under the Facility are made for temporary or emergency purposes, such as to fund shareholder redemption requests. Interest on borrowings is the average of the current repurchase agreement rate and the bank loan rate. There was no activity in the Facility during the period.
All Funds in the Trust participate in a $500 million committed credit facility (Line of Credit) with State Street Bank and Trust Company, to be utilized for temporary or emergency purposes to fund shareholder redemptions or for other short-term liquidity purposes. The maximum amount available to the Fund is $250 million. Each Fund pays an annual commitment fee on its pro-rata portion of the Line of Credit. For the six months ended June 30, 2017, the Fund’s commitment fee amounted to $213,688 and is reflected as a Miscellaneous Expense in the Statement of Operations. Interest on borrowings is charged at the prevailing rate. There were no borrowings on the Line of Credit during the period.
NOTE 6—PURCHASES AND SALES OF INVESTMENTS
For the six months ended June 30, 2017, purchases and sales of securities, other than short-term securities, aggregated $3,495,289,450 and $2,538,000,360, respectively.
NOTE 7—NEW ACCOUNTING GUIDANCE
In October 2016, the SEC issued a new rule, Investment Company Reporting Modernization, which, among other provisions, amends Regulation S-X to require standardized, enhanced disclosures, particularly related to derivatives, in investment company financial statements. Compliance with the guidance is required for financial statements for fiscal periods ending on or after August 1, 2017. Management is currently assessing the impact of this rule to the Fund’s financial statements and other filings and does not expect any impact to the Fund’s net assets or results of operations.
NOTE 8—SUBSEQUENT EVENTS
Fund management has determined that no material events or transactions occurred subsequent to June 30, 2017, and through the date of the Fund’s financial statements issuance, which require additional disclosure in the Fund’s financial statements.
PAGE 12 § DODGE & COX STOCK FUND
NOTES TO FINANCIAL STATEMENTS (unaudited)
NOTE 9—HOLDINGS OF 5% VOTING SECURITIES
Each of the companies listed below was considered to be an affiliate of the Fund because the Fund owned 5% or more of the company’s voting securities during all or part of the six months ended June 30, 2017. Purchase and sale transactions and dividend income earned during the period on these securities were as follows:
| | | | | | | | | | | | | | | | | | | | | | | | |
| | | Shares at
Beginning of Period | | | Additions | | | Reductions | | | Shares at
End of Period | | | Dividend
Income(a) | | | Value at
End of Period | |
Alnylam Pharmaceuticals, Inc. | | | 5,430,735 | | | | 70,000 | | | | — | | | | 5,500,735 | | | $ | — | (b) | | $ | 438,738,624 | |
Capital One Financial Corp. | | | 27,167,711 | | | | — | | | | (80,000 | ) | | | 27,087,711 | | | | 21,702,169 | | | | 2,237,986,683 | |
Celanese Corp., Series A | | | 7,779,698 | | | | — | | | | (621,300 | ) | | | 7,158,398 | | | | 6,379,352 | | | | 679,618,306 | |
Hewlett Packard Enterprise Co. | | | 93,402,495 | | | | 9,680,821 | | | | — | | | | 103,083,316 | | | | 12,888,578 | | | | 1,710,152,212 | |
NetApp, Inc. | | | 14,368,331 | | | | — | | | | (6,716,000 | ) | | | 7,652,331 | | | | 4,378,615 | | | | — | (c) |
| | | | | | | | | | | | | | | | | | | | | | | | |
| | | | | | | | | | | | | | | | | | $ | 45,348,714 | | | $ | 5,066,495,825 | |
| | | | | | | | | | | | | | | | | | | | | | | | |
| | | | | | | | | | | | | | | | | | | | | | | | | |
| (a) | Net of foreign taxes, if any |
| (c) | Company was not an affiliate at period end |
FINANCIAL HIGHLIGHTS (unaudited)
| | | | | | | | | | | | | | | | | | | | | | | | |
SELECTED DATA AND RATIOS (for a share outstanding throughout each period) | | Six Months Ended June 30, | | | Year Ended December 31, | |
| | | 2017 | | | 2016 | | | 2015 | | | 2014 | | | 2013 | | | 2012 | |
| | | | | | | | |
Net asset value, beginning of period | | | $184.30 | | | | $162.77 | | | | $180.94 | | | | $168.87 | | | | $121.90 | | | | $101.64 | |
Income from investment operations: | | | | | | | | | | | | | | | | | | | | | | | | |
Net investment income | | | 1.33 | | | | 3.05 | | | | 2.42 | | | | 2.83 | | | | 2.11 | | | | 1.98 | |
Net realized and unrealized gain (loss) | | | 11.13 | | | | 30.56 | | | | (10.55 | ) | | | 14.60 | | | | 46.97 | | | | 20.26 | |
| | | | | | | | |
Total from investment operations | | | 12.46 | | | | 33.61 | | | | (8.13 | ) | | | 17.43 | | | | 49.08 | | | | 22.24 | |
| | | | | | | | |
Distributions to shareholders from: | | | | | | | | | | | | | | | | | | | | | | | | |
Net investment income | | | (1.33 | ) | | | (3.03 | ) | | | (2.46 | ) | | | (2.80 | ) | | | (2.11 | ) | | | (1.98 | ) |
Net realized gain | | | (2.74 | ) | | | (9.05 | ) | | | (7.58 | ) | | | (2.56 | ) | | | — | | | | — | |
| | | | | | | | |
Total distributions | | | (4.07 | ) | | | (12.08 | ) | | | (10.04 | ) | | | (5.36 | ) | | | (2.11 | ) | | | (1.98 | ) |
| | | | | | | | |
Net asset value, end of period | | | $192.69 | | | | $184.30 | | | | $162.77 | | | | $180.94 | | | | $168.87 | | | | $121.90 | |
| | | | | | | | |
Total return | | | 6.81 | % | | | 21.27 | % | | | (4.47 | )% | | | 10.43 | % | | | 40.55 | % | | | 22.01 | % |
Ratios/supplemental data: | | | | | | | | | | | | | | | | | | | | | | | | |
Net assets, end of period (millions) | | | $66,136 | | | | $61,600 | | | | $54,845 | | | | $60,260 | | | | $54,848 | | | | $39,841 | |
Ratios of expenses to average net assets | | | 0.52 | %(a) | | | 0.52 | % | | | 0.52 | % | | | 0.52 | % | | | 0.52 | % | | | 0.52 | % |
Ratios of net investment income to average net assets | | | 1.41 | %(a) | | | 1.83 | % | | | 1.36 | % | | | 1.62 | % | | | 1.45 | % | | | 1.72 | % |
Portfolio turnover rate | | | 4 | % | | | 16 | % | | | 15 | % | | | 17 | % | | | 15 | % | | | 11 | % |
See accompanying Notes to Financial Statements
DODGE & COX STOCK FUND §PAGE 13
FUND HOLDINGS
The Fund provides a complete list of its holdings four times each fiscal year, as of the end of each quarter. The Fund files the lists with the Securities and Exchange Commission (SEC) on Form N-CSR (second and fourth quarters) and Form N-Q (first and third quarters). Shareholders may view the Fund’s Forms N-CSR and N-Q on the SEC’s website at sec.gov. Forms N-CSR and N-Q may also be reviewed and copied at the SEC’s Public Reference Room in Washington, DC. Information regarding the operations of the Public Reference Room may be obtained by calling 202-551-8090 (direct) or 800-732-0330 (general SEC number). A list of the Fund’s quarter-end holdings is also available at dodgeandcox.com on or about 15 days following each quarter end and remains available on the website until the list is updated in the subsequent quarter.
PROXY VOTING
For a free copy of the Fund’s proxy voting policies and procedures, please call 800-621-3979, visit the Fund’s website at dodgeandcox.com, or visit the SEC’s website at sec.gov. Information regarding how the Fund voted proxies relating to portfolio securities during the most recent 12-month period ending June 30 is also available at dodgeandcox.com or at sec.gov.
HOUSEHOLD MAILINGS
The Fund routinely mails shareholder reports and summary prospectuses to shareholders and, on occasion, proxy statements. In order to reduce the volume of mail, when possible, only one copy of these documents will be sent to shareholders who are part of the same family and share the same residential address.
If you have a direct account with the Funds and you do not want the mailing of shareholder reports and summary prospectuses combined with other members in your household, contact the Funds at 800-621-3979. Your request will be implemented within 30 days.
PAGE 14 § DODGE & COX STOCK FUND
TRUSTEES AND EXECUTIVE OFFICERS
Charles F. Pohl, Chairman and Trustee
Chairman, Dodge & Cox
Dana M. Emery, President and Trustee
Chief Executive Officer and President, Dodge & Cox
Thomas A. Larsen, Independent Trustee
Senior Counsel, Arnold & Porter Kaye Scholer LLP
Ann Mather, Independent Trustee
Former Executive Vice President, Chief Financial Officer, and Company Secretary, Pixar Animation Studios
Robert B. Morris III, Independent Trustee
Former Partner and Managing Director - Global Investment Research, Goldman Sachs; former Advisory Director, The Presidio Group
Gary Roughead, Independent Trustee
Robert and Marion Oster Distinguished Fellow, Hoover Institution, and former U.S. Navy Chief of Naval Operations
Mark E. Smith, Independent Trustee
Former Executive Vice President and Managing Director - Fixed Income, Loomis Sayles & Company, L.P.
John B. Taylor, Independent Trustee
Professor of Economics, Stanford University; Senior Fellow, Hoover Institution; and former Under Secretary for International Affairs, United States Treasury
Diana S. Strandberg, Senior Vice President
Senior Vice President and Director of International Equity, Dodge & Cox
David H. Longhurst, Treasurer
Vice President and Assistant Treasurer, Dodge & Cox
Thomas M. Mistele, Secretary
Executive Vice President, Secretary, and Senior Counsel, Dodge & Cox
Katherine M. Primas, Chief Compliance Officer
Vice President and Chief Compliance Officer, Dodge & Cox
Roberta R.W. Kameda, Assistant Secretary
Vice President and General Counsel, Dodge & Cox
William W. Strickland, Assistant Secretary and Assistant Treasurer
Vice President and Chief Operating Officer, Dodge & Cox
Additional information about the Trust’s Trustees and Officers is available in the Trust’s Statement of Additional Information (SAI). You can get a free copy of the SAI by visiting the Funds’ website at dodgeandcox.com or calling 800-621-3979.
DODGE & COX STOCK FUND §PAGE 15
dodgeandcox.com
For Fund literature, transactions, and account
information, please visit the Funds’ website.
or write or call:
DODGE & COX FUNDS
c/o Boston Financial Data Services
P.O. Box 8422
Boston, Massachusetts 02266-8422
(800) 621-3979
INVESTMENT MANAGER
Dodge & Cox
555 California Street, 40th Floor
San Francisco, California 94104
(415) 981-1710
This report is submitted for the general information of the shareholders of the Fund. The report is not authorized for distribution to prospective investors in the Fund unless it is accompanied by a current prospectus.
This report reflects our views, opinions, and portfolio holdings as of June 30, 2017, the end of the reporting period. Any such views are subject to change at any time based upon market or other conditions and Dodge & Cox disclaims any responsibility to update such views. These views may not be relied on as investment advice and, because investment decisions for a Dodge & Cox Fund are based on numerous factors, may not be relied on as an indication of trading intent on behalf of any Dodge & Cox Fund.
DODGE & COX FUNDS®
Semi-Annual Report
June 30, 2017
Global Stock Fund
ESTABLISHED 2008
TICKER: DODWX
6/17 GSF SAR Printed on recycled paper
TO OUR SHAREHOLDERS
The Dodge & Cox Global Stock Fund had a total return of 10.9% for the six months ended June 30, 2017, compared to a return of 10.7% for the MSCI World Index.
MARKET COMMENTARY
Global equity markets had the strongest first half in years with 26 of the world’s top 30 stock markets rising. Every sector save Energy posted gains in both the MSCI World, the benchmark for developed markets including the United States, and the MSCI Emerging Markets Index. Within this context, emerging markets outperformed their peers in developed markets, rising 18% in U.S. dollars compared to 11% for the MSCI World. This served the Fund well because it has substantial exposure to the developing world: 17% of its net assets are invested in companies domiciled in emerging market countries.(a)
U.S. equity markets also continued to climb during the first half of 2017: the S&P 500 reached an all-time high in mid-June and ended the period up 9%, marking its strongest first half since 2013. Information Technology was the best-performing sector of the S&P 500, and Energy was the worst-performing sector amid lower oil prices. Solid corporate earnings growth, combined with expectations of an improving economy, boosted U.S. equity returns and propelled valuations further above longer-term averages.
Though international equity markets outperformed the United States through the first half of 2017, international equities have underperformed U.S. equities on a three-, five-, and ten-year basis. Robust U.S. earnings growth, a strong U.S. dollar, and price-to-earnings multiple expansion are the key reasons for this performance differential. Today, international equity valuations are less expensive than U.S. valuations. Overall, global equity valuations remain reasonable: as of June 30, the MSCI World traded at 16.5 times forward earnings, close to its 20-year average.
INVESTMENT STRATEGY
As a value-oriented manager, we weigh valuation and fundamentals in assessing long-term investment opportunity. In some cases, a company’s valuation may overly discount concerns regarding earnings and cash flow prospects. In other cases, the valuation may not give proper credit to a robust fundamental outlook. Examples include Anadarko Petroleum, Medtronic, and the Fund’s four Chinese internet holdings, which are discussed below.(b) Their valuations are reasonable yet do not reflect each company’s long-term growth potential and strong market position.
Energy
Oil prices dropped 16% over the past six months, weighing heavily on the outlook for profitability and growth in the Energy sector. While the short-term direction of oil prices is difficult to forecast, we believe the long-term fundamentals of supply and demand point to higher prices. The current demand for oil, which is about 98 million barrels a day, continues to grow about one percent per year, driven by growing transportation demand in the developing world. Oil fields deplete as the resource is extracted, reducing the
global production base about two to three percent per year, so continuing investment is required to meet current demand and to prepare for future demand growth. We anticipate that 15 to 20 million barrels per day of additional production will be needed over the next five years to meet demand if these trends continue. However, upstream capital investment has declined to a 10-year low, fewer new projects are being approved, and North American unconventional resources (including shale) are unlikely to grow enough to bridge this eventual gap.
Amid depressed valuations for energy companies, we recently added to selected holdings, including Suncor Energy (a Canadian company with best-in-class management that has a large, low-cost, and long-lived resource basin in the Canadian oil sands) and Anadarko Petroleum, among other holdings.
Anadarko Petroleum
Anadarko Petroleum (a 1.1% position) is an independent oil and gas exploration and production (E&P) company, one of two held in the Fund. The company’s stock price has been negatively impacted in 2017 by a gas leak that caused a fatal explosion. While tragic, this incident did not materially impact our long-term investment outlook for the company. Recent meetings with company management affirmed our belief that Anadarko remains an attractive investment over our three- to five-year investment horizon.
As a leading global explorer with strong operational capabilities, Anadarko has a record of success in generating high returns on capital over energy price cycles. In the coming years, we believe the key differentiators for E&Ps will be a company’s asset quality and its ability to develop those assets, particularly large-scale unconventional resources. Anadarko is well positioned to manage these challenges. For example, in the DJ Basin in Colorado, Anadarko systematically developed all of the needed infrastructure to execute its plan, which allowed the company to achieve growth targets at competitive costs; Anadarko is now applying the same approach of systematic field and infrastructure development to the Permian Basin.
The company’s conservative management team has an excellent track record of disciplined capital allocation. In addition, Anadarko continues to invest substantially in exploration, which it sees as the means to create upside opportunity for the company. This focus on exploration differentiates Anadarko from its peers and will likely create value across business cycles. After considering the company’s risks, opportunities, and valuation, we added to Anadarko during the first half of 2017.
Health Care
We continue to find attractive investment opportunities within the Health Care sector. For example, we recently added to Bristol-Myers Squibb (a U.S. biopharmaceutical company) and Novartis (a Swiss-domiciled global pharmaceutical company), and also initiated a position in Medtronic, which is discussed below.
PAGE 2 § DODGE & COX GLOBAL STOCK FUND
Medtronic
Based in Ireland, Medtronic is a global leader in medical technology that serves physicians, hospitals, and patients in approximately 160 countries worldwide. The company has a highly diversified product portfolio and dominant market positions across its four business segments of cardiac and vascular, minimally invasive therapies, restorative therapies, and diabetes. Medtronic benefits from stable demand drivers, including an aging population, rising disease incidence, increased emerging market penetration, and technological advances. As one of the largest investors in research and development (R&D) in the Health Care Equipment sub-industry, Medtronic is committed to defending current businesses and driving growth through innovation.
We view Medtronic’s management as an asset—they plan to give shareholders roughly 100% of free cash flow generated this year and 50% thereafter and also are exploring unique models that incorporate services and outcomes (e.g., catheterization laboratory management, diabetes clinics). While company profit margins are high, we believe they are sustainable and could even improve due to new product launches and synergies associated with Medtronic’s acquisition of Covidien, a global leader in surgical instruments. We started a position in Medtronic early in 2017 because we believe its valuation, at 18 times forward earnings, is reasonable given the company’s asset quality and long-term growth opportunities. On June 30, Medtronic was a 1.0% position in the Fund.
Chinese Internet Holdings
On a bottom-up basis, we have invested in four Chinese internet companies—58.com, Tencent (through Naspers), JD.com, and Baidu—comprising 5.3% of the Fund compared to 0% in the MSCI World and 1.1% in the MSCI All Country World Index. Each is a market leader, run by an owner-operator with significant wealth invested in the company. Thus, we think there is alignment with the interests of long-term owners like ourselves. These companies are reasonably valued in light of their excellent growth prospects. We believe the market for internet services in China is particularly attractive due to high economic growth, increasing internet penetration, and the potential to leapfrog traditional technologies (e.g., online versus brick-and-mortar retail, mobile versus landline, digital versus print advertising).
We recently started a position in 58.com, China’s dominant online classifieds marketplace. The company has leading positions in a number of attractive online domains (e.g., job listings, yellow pages), significant margin expansion potential, growth opportunities from new initiatives, and a focused owner/operator management team.
The Fund owns Tencent, a leading provider of internet value-added services in China, through Naspers, one of the largest holdings in the Fund. Naspers’ 34% ownership stake in Tencent is worth more than Naspers’ market cap. The core of Tencent’s value proposition is its enormous, extremely sticky, and highly engaged user base (e.g., 861 million active instant messenger accounts, 938 million WeChat mobile app users). More than 50% of all mobile internet user time in China is spent on Tencent’s apps.
Tencent has dominant positions in online and mobile gaming, social networking, and digital content distribution and is achieving growing importance in online advertising, payments, and cloud computing. The company operates in a strong ecosystem built on e-commerce, online-to-offline, and other verticals. Tencent has an innovative, product-driven, and commercially oriented culture, led by an owner-operator founder and a management team with an exceptional execution track record.
JD.com is the largest online retailer and the second largest e-commerce platform in China, known for the authenticity of its products and the quality of its service. The company benefits from attractive growth within the business-to-consumer segment of China’s e-commerce market and is gaining share from its competitors. We believe that online retail in China not only has the potential to grow much faster than in the United States but could also become a much larger portion of total retail sales. China’s strong economic growth and transition from an industrial-led to a consumer-led economy point to higher retail growth prospects. The fact that brick-and-mortar retail is less developed in China raises the possibility that consumers in China may jump straight to online retail.
Baidu—the dominant search engine in China, with over 70% search traffic and over 80% revenue share—has a profitable business model that allows the company to invest in R&D to retain its leading edge. Since search is typically a “winner-take-all” market, Baidu enjoys significant barriers to entry.
While these four companies share many characteristics, we note that their stock price movements reflect their individual company risks and opportunities more than a single industry risk exposure.
IN CLOSING
Global equity valuations remain reasonable, and we continue to see numerous investment opportunities in both developed and emerging markets. However, we have adopted a tempered outlook for future returns given recent strong performance. As an active manager with a value-oriented approach, we remain optimistic about the long-term prospects for the Fund’s holdings.
We want to express gratitude to the Fund’s shareholders for taking the long view and having confidence in Dodge & Cox. Our strategy requires patience and persistence, and we thank you for yours. As always, we welcome your comments and questions.
For the Board of Trustees,
| | |
| | |
Charles F. Pohl, Chairman | | Dana M. Emery, President |
July 31, 2017
| (a) | | Unless otherwise specified, all weightings and characteristics are as of June 30, 2017. |
| (b) | | The use of specific examples does not imply that they are more or less attractive investments than the portfolio’s other holdings. |
DODGE & COX GLOBAL STOCK FUND §PAGE 3
YEAR-TO-DATE PERFORMANCE REVIEW
The Fund outperformed the MSCI World by 0.3 percentage points year to date.
Key Contributors to Relative Results
| | § | | The Fund’s holdings in the Consumer Discretionary sector (up 17% compared to up 11% for the MSCI World sector) contributed significantly to results. JD.com (up 54%) and Naspers (up 32%) were strong performers. | |
| | § | | Relative returns in the Health Care sector (up 19% compared to up 16% for the MSCI World sector), combined with a higher average weighting (18% versus 12%), aided performance. Alnylam Pharmaceuticals (up 113%) and Sanofi (up 20%) were notable contributors. | |
| | § | | Strong returns from the Fund’s holdings in emerging markets (up 23%) had a positive impact, including Samsung Electronics (up 38%), ICICI Bank (up 32%), and some already listed above. | |
| | § | | Additional contributors included Millicom International Cellular (up 43%), UniCredit (up 30%), and Standard Chartered (up 23%). | |
Key Detractors from Relative Results
| | § | | The Fund’s holdings in the Energy sector (down 22% compared to down 10% for the MSCI World sector) had a negative impact. Anadarko Petroleum (down 35%) and Apache (down 24%) were notable detractors. | |
| | § | | Relative returns from holdings in the Information Technology sector (up 14% compared to up 18% for the MSCI World sector) also detracted from results. Hewlett Packard Enterprise (down 4%) lagged. | |
| | § | | Additional detractors included Express Scripts (down 7%), Goldman Sachs (down 7%), and Barclays (down 4%). | |
KEY CHARACTERISTICS OF DODGE & COX
Independent Organization
Dodge & Cox is one of the largest privately owned investment managers in the world. We remain committed to independence, with a goal of providing the highest quality investment management service to our existing clients.
Over 85 Years of Investment Experience
Dodge & Cox was founded in 1930. We have a stable and well-qualified team of investment professionals, most of whom have spent their entire careers at Dodge & Cox.
Experienced Investment Team
The Global Equity Investment Committee, which is the decision-making body for the Global Stock Fund, is an eight-member committee with an average tenure at Dodge & Cox of 22 years.
One Business with a Single Research Office
Dodge & Cox manages equity (domestic, international, and global), fixed income (domestic and global), and balanced investments, operating from one office in San Francisco.
Consistent Investment Approach
Our team decision-making process involves thorough, bottom-up fundamental analysis of each investment.
Long-Term Focus and Low Expenses
We invest with a three- to five-year investment horizon, which has historically resulted in low turnover relative to our peers. We manage Funds that maintain low expense ratios.
Risks: The Fund is subject to market risk, meaning holdings in the Fund may decline in value for extended periods due to the financial prospects of individual companies, or due to general market and economic conditions. Investing in non-U.S. securities may entail risk due to foreign economic and political developments; this risk may be increased when investing in emerging markets. The Fund is also subject to currency risk. Please read the prospectus and summary prospectus for specific details regarding the Fund’s risk profile.
PAGE 4 § DODGE & COX GLOBAL STOCK FUND
GROWTH OF $10,000 SINCE INCEPTION
FOR AN INVESTMENT MADE ON MAY 1, 2008

AVERAGE ANNUAL TOTAL RETURN
FOR PERIODS ENDED JUNE 30, 2017
| | | | | | | | | | | | | | | | |
| | | 1 Year | | | 3 Years | | | 5 Years | | | Since
Inception
(5/1/08) | |
Dodge & Cox Global Stock Fund | | | 30.50 | % | | | 5.52 | % | | | 14.13 | % | | | 5.70 | % |
MSCI World Index | | | 18.20 | | | | 5.24 | | | | 11.38 | | | | 4.85 | |
Returns represent past performance and do not guarantee future results. Investment return and share price will fluctuate with market conditions, and investors may have a gain or loss when shares are sold. Fund performance changes over time and currently may be significantly lower than stated. Performance is updated and published monthly. Visit the Fund’s website at dodgeandcox.com or call 800-621-3979 for current performance figures.
The Fund’s total returns include the reinvestment of dividend and capital gain distributions, but have not been adjusted for any income taxes payable by shareholders on these distributions or on Fund share redemptions. Index returns include dividends but, unlike Fund returns, do not reflect fees or expenses. The MSCI World Index is a broad-based, unmanaged equity market index aggregated from 23 developed market country indices, including the United States. MSCI makes no express or implied warranties or representations and shall have no liability whatsoever with respect to any MSCI data contained herein. The MSCI data may not be further redistributed or used as a basis for other indices or any securities or financial products. This report is not approved, reviewed, or produced by MSCI.
MSCI World is a service mark of MSCI Barra.
FUND EXPENSE EXAMPLE
As a Fund shareholder, you incur ongoing Fund costs, including management fees and other Fund expenses. All mutual funds have ongoing costs, sometimes referred to as operating expenses. The following example shows ongoing costs of investing in the Fund and can help you understand these costs and compare them with those of other mutual funds. The example assumes a $1,000 investment held for the six months indicated.
ACTUAL EXPENSES
The first line of the table below provides information about actual account values and expenses based on the Fund’s actual returns. You may use the information in this line, together with your account balance, to estimate the expenses that you paid over the period. Simply divide your account value by $1,000 (for example, an $8,600 account value divided by $1,000 = 8.6), then multiply the result by the number in the first line under the heading “Expenses Paid During Period” to estimate the expenses you paid on your account during this period.
HYPOTHETICAL EXAMPLE FOR COMPARISON WITH OTHER MUTUAL FUNDS
Information on the second line of the table can help you compare ongoing costs of investing in the Fund with those of other mutual funds. This information may not be used to estimate the actual ending account balance or expenses you paid during the period. The hypothetical “Ending Account Value” is based on the actual expense ratio of the Fund and an assumed 5% annual rate of return before expenses (not the Fund’s actual return). The amount under the heading “Expenses Paid During Period” shows the hypothetical expenses your account would have incurred under this scenario. You can compare this figure with the 5% hypothetical examples that appear in shareholder reports of other mutual funds.
| | | | | | | | | | | | |
Six Months Ended June 30, 2017 | | Beginning Account Value
1/1/2017 | | | Ending Account Value
6/30/2017 | | | Expenses Paid During Period* | |
Based on Actual Fund Return | | $ | 1,000.00 | | | $ | 1,109.20 | | | $ | 3.30 | |
Based on Hypothetical 5% Yearly Return | | | 1,000.00 | | | | 1,021.66 | | | | 3.17 | |
| * | | Expenses are equal to the Fund’s annualized expense ratio of 0.63%, multiplied by the average account value over the period, multiplied by 181/365 (to reflect the one-half year period). |
The expenses shown in the table highlight ongoing costs only and do not reflect any transactional fees or account maintenance fees. Though other mutual funds may charge such fees, please note that the Fund does not charge transaction fees (e.g., redemption fees, sales loads) or universal account maintenance fees (e.g., small account fees).
DODGE & COX GLOBAL STOCK FUND §PAGE 5
| | | | |
| FUND INFORMATION (unaudited) | | | June 30, 2017 | |
| | | | |
| GENERAL INFORMATION | | | |
Net Asset Value Per Share | | | $13.21 | |
Total Net Assets (billions) | | | $8.7 | |
Expense Ratio | | | 0.63% | |
Portfolio Turnover Rate (1/1/17 to 6/30/17, unannualized) | | | 8% | |
30-Day SEC Yield(a) | | | 1.05% | |
Number of Companies | | | 88 | |
Fund Inception | | | 2008 | |
No sales charges or distribution fees | | | | |
Investment Manager: Dodge & Cox, San Francisco. Managed by the Global Equity Investment Committee, whose eight members’ average tenure at Dodge & Cox is 22 years.
| | | | | | | | |
| PORTFOLIO CHARACTERISTICS | | Fund | | | MSCI
World | |
Median Market Capitalization (billions) | | | $40 | | | | $12 | |
Weighted Average Market Capitalization (billions) | | | $100 | | | | $110 | |
Price-to-Earnings Ratio(b) | | | 14.9x | | | | 16.5x | |
Countries Represented | | | 22 | | | | 23 | |
Emerging Markets (Brazil, China, India, Mexico, Russia, South Africa, South Korea, Thailand, Turkey) | | | 17.1% | | | | 0.0% | |
| | | | |
| TEN LARGEST HOLDINGS (%)(c) | | Fund | |
Novartis AG (Switzerland) | | | 2.9 | |
Sanofi (France) | | | 2.7 | |
Naspers, Ltd. (South Africa) | | | 2.7 | |
Alphabet, Inc. (United States) | | | 2.5 | |
Samsung Electronics Co., Ltd. (South Korea) | | | 2.3 | |
ICICI Bank, Ltd. (India) | | | 2.2 | |
Bank of America Corp. (United States) | | | 2.2 | |
Hewlett Packard Enterprise Co. (United States) | | | 1.9 | |
Express Scripts Holding Co. (United States) | | | 1.9 | |
Charles Schwab Corp. (United States) | | | 1.8 | |
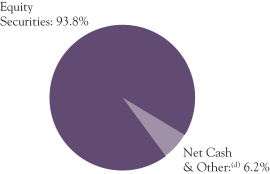
| | | | | | | | |
| REGION DIVERSIFICATION (%)(e) | | Fund | | | MSCI
World | |
United States | | | 44.0 | | | | 59.3 | |
Europe (excluding United Kingdom) | | | 22.9 | | | | 17.2 | |
Pacific (excluding Japan) | | | 9.1 | | | | 4.5 | |
United Kingdom | | | 7.8 | | | | 6.6 | |
Latin America | | | 4.1 | | | | 0.0 | |
Africa | | | 3.7 | | | | 0.0 | |
Japan | | | 1.2 | | | | 8.7 | |
Canada | | | 1.0 | | | | 3.5 | |
Middle East | | | 0.0 | | | | 0.2 | |
| | | | | | | | |
| SECTOR DIVERSIFICATION (%) | | Fund | | | MSCI
World | |
Financials | | | 24.2 | | | | 18.0 | |
Consumer Discretionary | | | 18.8 | | | | 12.3 | |
Health Care | | | 18.4 | | | | 12.6 | |
Information Technology | | | 13.8 | | | | 15.6 | |
Energy | | | 5.2 | | | | 6.0 | |
Industrials | | | 4.7 | | | | 11.5 | |
Telecommunication Services | | | 3.1 | | | | 3.0 | |
Materials | | | 3.0 | | | | 4.9 | |
Consumer Staples | | | 1.8 | | | | 9.7 | |
Real Estate | | | 0.8 | | | | 3.2 | |
Utilities | | | 0.0 | | | | 3.2 | |
| (a) | SEC Yield is an annualization of the Fund’s net investment income for the trailing 30-day period. Dividends paid by the Fund may be higher or lower than implied by the SEC Yield. |
| (b) | Price-to-earnings (P/E) ratios are calculated using 12-month forward earnings estimates from third-party sources. |
| (c) | The Fund’s portfolio holdings are subject to change without notice. The mention of specific securities is not a recommendation to buy, sell, or hold any particular security and is not indicative of Dodge & Cox’s current or future trading activity. |
| (d) | Net Cash & Other includes cash, short-term investments, derivatives, receivables, and payables. |
| (e) | The Fund may classify a company in a different category than the MSCI World. The Fund generally classifies a company based on its country of incorporation, but may designate a different country in certain circumstances. |
PAGE 6 § DODGE & COX GLOBAL STOCK FUND
| | | | |
| CONSOLIDATED PORTFOLIO OF INVESTMENTS (unaudited) | | | June 30, 2017 | |
| | | | | | | | |
| COMMON STOCKS: 90.0% | | | | | | |
| | |
| | | SHARES | | | VALUE | |
| CONSUMER DISCRETIONARY: 18.8% | |
AUTOMOBILES & COMPONENTS: 2.4% | | | | | |
Bayerische Motoren Werke AG (Germany) | | | 623,700 | | | $ | 57,900,519 | |
Honda Motor Co., Ltd. (Japan) | | | 2,745,800 | | | | 74,800,010 | |
Mahindra & Mahindra, Ltd. (India) | | | 1,783,705 | | | | 37,391,921 | |
Yamaha Motor Co., Ltd. (Japan) | | | 1,315,100 | | | | 33,884,506 | |
| | | | | | | | |
| | | | | | | 203,976,956 | |
CONSUMER DURABLES & APPAREL: 0.4% | | | | | |
Coach, Inc. (United States) | | | 779,700 | | | | 36,910,998 | |
| |
MEDIA: 11.8% | | | | | |
Altice NV, Series A(a) (Netherlands) | | | 3,514,444 | | | | 81,083,225 | |
Charter Communications, Inc., Class A(a) (United States) | | | 434,797 | | | | 146,461,369 | |
Comcast Corp., Class A (United States) | | | 2,064,700 | | | | 80,358,124 | |
DISH Network Corp., Class A(a) (United States) | | | 1,066,600 | | | | 66,939,816 | |
Grupo Televisa SAB ADR (Mexico) | | | 4,469,900 | | | | 108,931,463 | |
Liberty Global PLC LiLAC, Series A(a) (United Kingdom) | | | 767,200 | | | | 16,701,944 | |
Liberty Global PLC LiLAC, Series C(a) (United Kingdom) | | | 788,562 | | | | 16,883,112 | |
Liberty Global PLC, Series C(a) (United Kingdom) | | | 3,822,100 | | | | 119,173,078 | |
Naspers, Ltd. (South Africa) | | | 1,201,400 | | | | 233,713,969 | |
Television Broadcasts, Ltd. (Hong Kong) | | | 2,509,500 | | | | 9,449,859 | |
Time Warner, Inc. (United States) | | | 733,666 | | | | 73,667,403 | |
Twenty-First Century Fox, Inc., Class A (United States) | | | 2,623,600 | | | | 74,352,824 | |
| | | | | | | | |
| | | | | | | 1,027,716,186 | |
RETAILING: 4.2% | | | | | | | | |
JD.com, Inc. ADR(a) (Cayman Islands/China) | | | 3,274,200 | | | | 128,414,124 | |
Liberty Interactive Corp. QVC Group,
Series A(a) (United States) | | | 1,357,516 | | | | 33,313,443 | |
Target Corp. (United States) | | | 1,435,800 | | | | 75,077,982 | |
The Priceline Group, Inc.(a) (United States) | | | 66,600 | | | | 124,576,632 | |
| | | | | | | | |
| | | | | | | 361,382,181 | |
| | | | | | | | |
| | | | | | | 1,629,986,321 | |
| CONSUMER STAPLES: 1.8% | | | | | | | | |
FOOD & STAPLES RETAILING: 1.6% | | | | | | | | |
Magnit PJSC (Russia) | | | 513,600 | | | | 79,920,427 | |
Wal-Mart Stores, Inc. (United States) | | | 794,100 | | | | 60,097,488 | |
| | | | | | | | |
| | | | | | | 140,017,915 | |
FOOD, BEVERAGE & TOBACCO: 0.2% | | | | | | | | |
Anadolu Efes Biracilik ve Malt Sanayii AS (Turkey) | | | 2,609,385 | | | | 16,197,180 | |
| | | | | | | | |
| | | | | | | 156,215,095 | |
| ENERGY: 4.6% | | | | | | | | |
Anadarko Petroleum Corp. (United States) | | | 2,029,400 | | | | 92,012,996 | |
Apache Corp. (United States) | | | 1,393,032 | | | | 66,768,024 | |
National Oilwell Varco, Inc. (United States) | | | 1,598,700 | | | | 52,661,178 | |
Saipem SPA(a) (Italy) | | | 5,874,230 | | | | 21,697,714 | |
Schlumberger, Ltd. (Curacao/United States) | | | 1,033,900 | | | | 68,071,976 | |
Suncor Energy, Inc. (Canada) | | | 2,950,500 | | | | 86,154,600 | |
Weatherford International PLC(a) (Ireland) | | | 4,434,175 | | | | 17,160,257 | |
| | | | | | | | |
| | | | | | | 404,526,745 | |
| FINANCIALS: 22.5% | | | | | | | | |
BANKS: 12.7% | | | | | | | | |
Banco Santander SA (Spain) | | | 7,044,028 | | | | 46,598,576 | |
Bank of America Corp. (United States) | | | 7,943,000 | | | | 192,697,180 | |
Barclays PLC (United Kingdom) | | | 57,182,900 | | | | 151,003,837 | |
BNP Paribas SA (France) | | | 1,306,700 | | | | 94,113,705 | |
ICICI Bank, Ltd. (India) | | | 43,078,437 | | | | 193,273,975 | |
Kasikornbank PCL- Foreign (Thailand) | | | 9,540,600 | | | | 56,030,312 | |
| | | | | | | | |
| | | SHARES | | | VALUE | |
Standard Chartered PLC(a) (United Kingdom) | | | 12,954,877 | | | $ | 131,137,539 | |
UniCredit SPA(a) (Italy) | | | 5,468,531 | | | | 102,120,152 | |
Wells Fargo & Co. (United States) | | | 2,405,373 | | | | 133,281,718 | |
| | | | | | | | |
| | | | | | | 1,100,256,994 | |
DIVERSIFIED FINANCIALS: 7.9% | | | | | | | | |
American Express Co. (United States) | | | 1,131,000 | | | | 95,275,440 | |
Bank of New York Mellon Corp. (United States) | | | 1,367,200 | | | | 69,754,544 | |
Capital One Financial Corp. (United States) | | | 1,492,600 | | | | 123,318,612 | |
Charles Schwab Corp. (United States) | | | 3,737,400 | | | | 160,558,704 | |
Credit Suisse Group AG (Switzerland) | | | 5,622,799 | | | | 81,272,285 | |
Goldman Sachs Group, Inc. (United States) | | | 696,300 | | | | 154,508,970 | |
| | | | | | | | |
| | | | | | | 684,688,555 | |
INSURANCE: 1.9% | | | | | | | | |
AEGON NV (Netherlands) | | | 10,916,511 | | | | 55,745,721 | |
Aviva PLC (United Kingdom) | | | 15,984,820 | | | | 109,510,166 | |
| | | | | | | | |
| | | | | | | 165,255,887 | |
| | | | | | | | |
| | | | | | | 1,950,201,436 | |
| HEALTH CARE: 18.4% | |
HEALTH CARE EQUIPMENT & SERVICES: 5.9% | |
Cigna Corp. (United States) | | | 811,100 | | | | 135,770,029 | |
Express Scripts Holding Co.(a) (United States) | | | 2,568,800 | | | | 163,992,192 | |
Medtronic PLC (Ireland) | | | 961,700 | | | | 85,350,875 | |
UnitedHealth Group, Inc. (United States) | | | 683,900 | | | | 126,808,738 | |
| | | | | | | | |
| | | | | | | 511,921,834 | |
PHARMACEUTICALS, BIOTECHNOLOGY & LIFE SCIENCES: 12.5% | |
Alnylam Pharmaceuticals, Inc.(a) (United States) | | | 832,800 | | | | 66,424,128 | |
AstraZeneca PLC (United Kingdom) | | | 1,975,100 | | | | 132,096,247 | |
Bayer AG (Germany) | | | 724,720 | | | | 93,700,021 | |
Bristol-Myers Squibb Co. (United States) | | | 1,700,800 | | | | 94,768,576 | |
Eli Lilly and Co. (United States) | | | 822,400 | | | | 67,683,520 | |
Merck & Co., Inc. (United States) | | | 511,000 | | | | 32,749,990 | |
Novartis AG (Switzerland) | | | 2,541,600 | | | | 211,512,859 | |
Novartis AG ADR (Switzerland) | | | 465,900 | | | | 38,888,673 | |
Roche Holding AG (Switzerland) | | | 453,600 | | | | 115,516,863 | |
Sanofi (France) | | | 2,480,562 | | | | 237,306,575 | |
| | | | | | | | |
| | | | | | | 1,090,647,452 | |
| | | | | | | | |
| | | | | | | 1,602,569,286 | |
| INDUSTRIALS: 4.7% | | | | | | | | |
CAPITAL GOODS: 2.9% | | | | | | | | |
Johnson Controls International PLC (Ireland) | | | 2,857,342 | | | | 123,894,349 | |
Schneider Electric SA (France) | | | 1,672,178 | | | | 128,477,462 | |
| | | | | | | | |
| | | | | | | 252,371,811 | |
TRANSPORTATION: 1.8% | |
FedEx Corp. (United States) | | | 386,800 | | | | 84,063,244 | |
Union Pacific Corp. (United States) | | | 625,800 | | | | 68,155,878 | |
| | | | | | | | |
| | | | | | | 152,219,122 | |
| | | | | | | | |
| | | | | | | 404,590,933 | |
| INFORMATION TECHNOLOGY: 12.3% | | | | | |
SOFTWARE & SERVICES: 6.6% | | | | | | | | |
58.com, Inc. ADR(a) (Cayman Islands/China) | | | 166,566 | | | | 7,347,226 | |
Alphabet, Inc., Class C(a) (United States) | | | 240,799 | | | | 218,821,275 | |
Baidu, Inc. ADR(a) (Cayman Islands/China) | | | 515,600 | | | | 92,220,216 | |
Dell Technologies, Inc., Class V(a) (United States) | | | 1,252,416 | | | | 76,535,142 | |
DXC Technology Co. (United States) | | | 752,008 | | | | 57,694,054 | |
Microsoft Corp. (United States) | | | 1,459,000 | | | | 100,568,870 | |
VMware, Inc.(a) (United States) | | | 178,396 | | | | 15,597,162 | |
| | | | | | | | |
| | | | | | | 568,783,945 | |
| | |
| See accompanying Notes to Consolidated Financial Statements | | DODGE & COX GLOBAL STOCK FUND §PAGE 7 |
| | | | |
| CONSOLIDATED PORTFOLIO OF INVESTMENTS (unaudited) | | | June 30, 2017 | |
| | | | | | | | |
| COMMON STOCKS (continued) | | | | | | |
| | |
| | | SHARES | | | VALUE | |
TECHNOLOGY, HARDWARE & EQUIPMENT: 5.7% | |
Cisco Systems, Inc. (United States) | | | 3,162,800 | | | $ | 98,995,640 | |
Hewlett Packard Enterprise Co. (United States) | | | 10,120,300 | | | | 167,895,777 | |
HP Inc. (United States) | | | 4,347,500 | | | | 75,994,300 | |
Juniper Networks, Inc. (United States) | | | 727,768 | | | | 20,290,172 | |
Samsung Electronics Co., Ltd. (South Korea) | | | 33,417 | | | | 69,424,646 | |
TE Connectivity, Ltd. (Switzerland) | | | 823,815 | | | | 64,817,764 | |
| | | | | | | | |
| | | | | | | 497,418,299 | |
| | | | | | | | |
| | | | | | | 1,066,202,244 | |
| MATERIALS: 3.0% | | | | | | | | |
Celanese Corp., Series A (United States) | | | 574,000 | | | | 54,495,560 | |
Cemex SAB de CV ADR (Mexico) | | | 4,570,101 | | | | 43,050,352 | |
LafargeHolcim, Ltd. (Switzerland) | | | 1,219,620 | | | | 69,827,029 | |
Linde AG (Germany) | | | 500,910 | | | | 94,856,532 | |
| | | | | | | | |
| | | | | | | 262,229,473 | |
| REAL ESTATE: 0.8% | | | | | | | | |
Hang Lung Group, Ltd. (Hong Kong) | | | 16,627,400 | | | | 68,788,788 | |
| |
| TELECOMMUNICATION SERVICES: 3.1% | | | | | |
Millicom International Cellular SA SDR (Luxembourg) | | | 1,148,400 | | | | 67,829,577 | |
MTN Group, Ltd. (South Africa) | | | 9,729,600 | | | | 84,857,433 | |
Sprint Corp.(a) (United States) | | | 9,740,400 | | | | 79,968,684 | |
Zayo Group Holdings, Inc.(a) (United States) | | | 1,188,900 | | | | 36,737,010 | |
| | | | | | | | |
| | | | | | | 269,392,704 | |
| | | | | | | | |
TOTAL COMMON STOCKS
(Cost $6,129,088,535) | | | | | | $ | 7,814,703,025 | |
| |
| PREFERRED STOCKS: 3.8% | | | | |
| ENERGY: 0.6% | | | | | |
Petroleo Brasileiro SA(a) (Brazil) | | | 15,153,206 | | | | 56,580,385 | |
| | |
FINANCIALS: 1.7% | | | | | | | | |
BANKS: 1.7% | | | | | | | | |
Itau Unibanco Holding SA (Brazil) | | | 13,148,729 | | | | 145,858,852 | |
| |
INFORMATION TECHNOLOGY: 1.5% | | | | | |
TECHNOLOGY, HARDWARE & EQUIPMENT: 1.5% | |
Samsung Electronics Co., Ltd. (South Korea) | | | 80,814 | | | | 131,517,431 | |
| | | | | | | | |
TOTAL PREFERRED STOCKS
(Cost $197,639,567) | | | | | | $ | 333,956,668 | |
| |
| SHORT-TERM INVESTMENTS: 2.3% | | | | |
| | |
| | | PAR VALUE | | | VALUE | |
MONEY MARKET FUND: 0.1% | | | | | | | | |
State Street Institutional Treasury Plus Money Market Fund | | $ | 8,361,164 | | | $ | 8,361,164 | |
| | |
REPURCHASE AGREEMENT: 2.2% | | | | | | | | |
Fixed Income Clearing Corporation(b) 0.60%, dated 6/30/17, due 7/3/17, maturity value $192,161,608 | | | 192,152,000 | | | | 192,152,000 | |
| | | | | | | | |
TOTAL SHORT-TERM INVESTMENTS
(Cost $200,513,164) | | | $ | 200,513,164 | |
| | | | | | | | |
TOTAL INVESTMENTS
(Cost $6,527,241,266) | | | 96.1 | % | | $ | 8,349,172,857 | |
OTHER ASSETS LESS LIABILITIES | | | 3.9 | % | | | 333,474,001 | |
| | | | | | | | |
| NET ASSETS | | | 100.0 | % | | $ | 8,682,646,858 | |
| | | | | | | | |
| (b) | Repurchase agreement is collateralized by U.S. Treasury Note 1.375%, 6/30/23. Total collateral value is $195,996,139. |
In determining a company’s country designation, the Fund generally references the country of incorporation. In cases where the Fund considers the country of incorporation to be a “jurisdiction of convenience” chosen primarily for tax purposes or in other limited circumstances, the Fund uses the country designation of an appropriate broad-based market index. In those cases, two countries are listed — the country of incorporation and the country designated by an appropriate index, respectively.
ADR: American Depositary Receipt
SDR: Swedish Depository Receipt
FUTURES CONTRACTS
| | | | | | | | | | | | | | | | |
| Description | | Number of
Contracts | | | Expiration
Date | | | Notional
Amount | | | Unrealized
Appreciation/
(Depreciation) | |
E-mini S&P 500 Index—Long Position | | | 1,390 | | | | Sep 2017 | | | $ | 168,252,550 | | | $ | (660,746 | ) |
CURRENCY FORWARD CONTRACTS
| | | | | | | | | | | | | | | | |
| | | | | | Contract Amount | | | | |
| Counterparty | | Settle
Date | | | Receive
U.S. Dollar | | | Deliver
Foreign
Currency | | | Unrealized
Appreciation/
(Depreciation) | |
Contracts to sell CHF: | | | | | | | | | | | | | |
Citibank | | | 7/12/17 | | | | 14,952,699 | | | | 14,999,950 | | | $ | (697,027 | ) |
Citibank | | | 7/12/17 | | | | 44,897,235 | | | | 45,000,050 | | | | (2,052,153 | ) |
Bank of America | | | 7/26/17 | | | | 3,788,395 | | | | 3,750,000 | | | | (127,459 | ) |
Goldman Sachs | | | 7/26/17 | | | | 3,787,056 | | | | 3,750,000 | | | | (128,798 | ) |
HSBC | | | 7/26/17 | | | | 3,787,075 | | | | 3,750,000 | | | | (128,779 | ) |
HSBC | | | 7/26/17 | | | | 3,785,218 | | | | 3,750,000 | | | | (130,637 | ) |
UBS | | | 8/16/17 | | | | 6,764,943 | | | | 6,700,000 | | | | (240,544 | ) |
UBS | | | 8/16/17 | | | | 6,653,897 | | | | 6,600,000 | | | | (247,032 | ) |
UBS | | | 8/16/17 | | | | 6,754,713 | | | | 6,700,000 | | | | (250,774 | ) |
Contracts to sell CNH: | | | | | | | | | | | | | |
Bank of America | | | 8/2/17 | | | | 19,632,876 | | | | 136,664,450 | | | | (481,140 | ) |
Bank of America | | | 8/2/17 | | | | 3,554,252 | | | | 24,754,656 | | | | (89,091 | ) |
Credit Suisse | | | 8/2/17 | | | | 7,805,207 | | | | 54,351,560 | | | | (194,153 | ) |
Credit Suisse | | | 8/2/17 | | | | 8,258,233 | | | | 57,558,234 | | | | (213,079 | ) |
Bank of America | | | 8/9/17 | | | | 7,113,544 | | | | 49,581,400 | | | | (180,060 | ) |
Credit Suisse | | | 8/9/17 | | | | 7,108,444 | | | | 49,581,400 | | | | (185,159 | ) |
Credit Suisse | | | 8/9/17 | | | | 7,109,973 | | | | 49,581,400 | | | | (183,630 | ) |
Goldman Sachs | | | 8/9/17 | | | | 7,115,586 | | | | 49,581,400 | | | | (178,018 | ) |
Goldman Sachs | | | 8/9/17 | | | | 7,598,787 | | | | 52,886,800 | | | | (181,052 | ) |
Goldman Sachs | | | 8/9/17 | | | | 3,796,612 | | | | 26,443,400 | | | | (93,308 | ) |
Bank of America | | | 8/16/17 | | | | 2,214,480 | | | | 15,399,496 | | | | (49,700 | ) |
Credit Suisse | | | 8/16/17 | | | | 5,687,444 | | | | 39,520,912 | | | | (123,295 | ) |
Credit Suisse | | | 8/16/17 | | | | 2,843,722 | | | | 19,760,456 | | | | (61,648 | ) |
JPMorgan | | | 8/16/17 | | | | 7,773,511 | | | | 54,088,800 | | | | (179,137 | ) |
JPMorgan | | | 8/16/17 | | | | 11,368,630 | | | | 79,041,824 | | | | (252,848 | ) |
JPMorgan | | | 8/16/17 | | | | 5,679,516 | | | | 39,520,912 | | | | (131,223 | ) |
HSBC | | | 10/25/17 | | | | 39,491,635 | | | | 275,000,000 | | | | (752,433 | ) |
Citibank | | | 1/10/18 | | | | 3,413,621 | | | | 24,139,420 | | | | (100,131 | ) |
HSBC | | | 1/10/18 | | | | 6,824,925 | | | | 48,278,840 | | | | (202,577 | ) |
HSBC | | | 1/10/18 | | | | 3,413,862 | | | | 24,139,420 | | | | (99,889 | ) |
JPMorgan | | | 1/10/18 | | | | 3,413,380 | | | | 24,139,420 | | | | (100,372 | ) |
JPMorgan | | | 1/10/18 | | | | 3,414,345 | | | | 24,139,420 | | | | (99,406 | ) |
JPMorgan | | | 1/10/18 | | | | 3,414,104 | | | | 24,139,420 | | | | (99,648 | ) |
JPMorgan | | | 1/10/18 | | | | 3,414,828 | | | | 24,139,420 | | | | (98,923 | ) |
JPMorgan | | | 1/10/18 | | | | 3,414,828 | | | | 24,139,420 | | | | (98,923 | ) |
JPMorgan | | | 1/10/18 | | | | 3,413,862 | | | | 24,139,420 | | | | (99,889 | ) |
Citibank | | | 1/24/18 | | | | 7,252,384 | | | | 51,336,000 | | | | (213,016 | ) |
Citibank | | | 1/24/18 | | | | 6,771,705 | | | | 47,896,266 | | | | (193,482 | ) |
Citibank | | | 1/24/18 | | | | 6,775,536 | | | | 47,896,267 | | | | (189,650 | ) |
JPMorgan | | | 1/24/18 | | | | 19,020,716 | | | | 134,600,100 | | | | (553,142 | ) |
JPMorgan | | | 1/24/18 | | | | 3,626,192 | | | | 25,668,000 | | | | (106,508 | ) |
JPMorgan | | | 1/24/18 | | | | 3,626,192 | | | | 25,668,000 | | | | (106,508 | ) |
| | |
| PAGE 8 § DODGE & COX GLOBAL STOCK FUND | | See accompanying Notes to Consolidated Financial Statements |
| | | | |
| CONSOLIDATED PORTFOLIO OF INVESTMENTS (unaudited) | | | June 30, 2017 | |
CURRENCY FORWARD CONTRACTS (continued)
| | | | | | | | | | | | | | | | |
| | | | | | Contract Amount | | | | |
| Counterparty | | Settle
Date | | | Receive
U.S. Dollar | | | Deliver
Foreign
Currency | | | Unrealized
Appreciation/
(Depreciation) | |
JPMorgan | | | 1/24/18 | | | | 6,769,790 | | | | 47,896,267 | | | $ | (195,396 | ) |
Citibank | | | 1/31/18 | | | | 5,989,021 | | | | 42,411,810 | | | | (175,672 | ) |
JPMorgan | | | 1/31/18 | | | | 30,644,004 | | | | 216,576,500 | | | | (836,086 | ) |
JPMorgan | | | 1/31/18 | | | | 11,638,937 | | | | 82,312,890 | | | | (325,506 | ) |
JPMorgan | | | 1/31/18 | | | | 7,722,920 | | | | 54,635,800 | | | | (218,569 | ) |
Citibank | | | 2/7/18 | | | | 6,024,463 | | | | 42,598,975 | | | | (164,494 | ) |
Citibank | | | 2/7/18 | | | | 2,509,838 | | | | 17,749,575 | | | | (68,894 | ) |
Citibank | | | 2/7/18 | | | | 2,517,670 | | | | 17,749,575 | | | | (61,062 | ) |
Citibank | | | 2/7/18 | | | | 6,038,981 | | | | 42,598,975 | | | | (149,976 | ) |
Citibank | | | 2/7/18 | | | | 6,042,408 | | | | 42,598,975 | | | | (146,549 | ) |
Citibank | | | 2/7/18 | | | | 2,516,243 | | | | 17,749,575 | | | | (62,490 | ) |
Citibank | | | 2/7/18 | | | | 2,510,193 | | | | 17,749,575 | | | | (68,539 | ) |
Citibank | | | 2/7/18 | | | | 6,023,611 | | | | 42,598,975 | | | | (165,346 | ) |
Bank of America | | | 5/16/18 | | | | 3,529,328 | | | | 24,959,408 | | | | (73,234 | ) |
Bank of America | | | 5/16/18 | | | | 3,530,876 | | | | 24,959,407 | | | | (71,686 | ) |
Goldman Sachs | | | 5/16/18 | | | | 3,545,017 | | | | 25,061,497 | | | | (72,280 | ) |
Goldman Sachs | | | 5/16/18 | | | | 3,536,275 | | | | 25,005,000 | | | | (72,867 | ) |
Goldman Sachs | | | 5/16/18 | | | | 3,530,046 | | | | 24,955,663 | | | | (71,975 | ) |
Goldman Sachs | | | 5/16/18 | | | | 3,544,717 | | | | 25,059,025 | | | | (72,223 | ) |
Bank of America | | | 6/13/18 | | | | 45,881,425 | | | | 320,000,000 | | | | (222,099 | ) |
Bank of America | | | 6/13/18 | | | | 10,716,582 | | | | 75,000,000 | | | | (88,931 | ) |
Bank of America | | | 6/13/18 | | | | 10,714,286 | | | | 75,000,000 | | | | (91,228 | ) |
Contracts to sell EUR: | | | | | | | | | | | | | |
UBS | | | 8/16/17 | | | | 28,602,889 | | | | 25,937,500 | | | | (1,085,427 | ) |
UBS | | | 8/16/17 | | | | 5,857,361 | | | | 5,312,500 | | | | (223,379 | ) |
Goldman Sachs | | | 9/13/17 | | | | 1,554,603 | | | | 1,375,000 | | | | (21,561 | ) |
Goldman Sachs | | | 9/13/17 | | | | 1,554,603 | | | | 1,375,000 | | | | (21,561 | ) |
Goldman Sachs | | | 9/13/17 | | | | 2,685,223 | | | | 2,375,000 | | | | (37,243 | ) |
Goldman Sachs | | | 9/13/17 | | | | 2,685,223 | | | | 2,375,000 | | | | (37,243 | ) |
Goldman Sachs | | | 9/13/17 | | | | 2,685,698 | | | | 2,375,000 | | | | (36,768 | ) |
Goldman Sachs | | | 9/13/17 | | | | 1,554,878 | | | | 1,375,000 | | | | (21,286 | ) |
Goldman Sachs | | | 9/13/17 | | | | 1,554,878 | | | | 1,375,000 | | | | (21,286 | ) |
Goldman Sachs | | | 9/13/17 | | | | 2,685,698 | | | | 2,375,000 | | | | (36,768 | ) |
Goldman Sachs | | | 9/13/17 | | | | 2,685,698 | | | | 2,375,000 | | | | (36,768 | ) |
Goldman Sachs | | | 9/13/17 | | | | 2,685,698 | | | | 2,375,000 | | | | (36,768 | ) |
Goldman Sachs | | | 9/13/17 | | | | 1,554,878 | | | | 1,375,000 | | | | (21,286 | ) |
Goldman Sachs | | | 9/13/17 | | | | 1,554,878 | | | | 1,375,000 | | | | (21,286 | ) |
Goldman Sachs | | | 9/13/17 | | | | 1,555,022 | | | | 1,375,000 | | | | (21,142 | ) |
Goldman Sachs | | | 9/13/17 | | | | 2,685,947 | | | | 2,375,000 | | | | (36,518 | ) |
Goldman Sachs | | | 9/13/17 | | | | 1,554,609 | | | | 1,375,000 | | | | (21,555 | ) |
Goldman Sachs | | | 9/13/17 | | | | 2,685,234 | | | | 2,375,000 | | | | (37,231 | ) |
| | | | | | | | | | | | | | | | |
| | | | | | | | | | | | | | $ | (15,144,419 | ) |
| | | | | | | | | | | | | | | | |
| | |
| See accompanying Notes to Consolidated Financial Statements | | DODGE & COX GLOBAL STOCK FUND §PAGE 9 |
| | | | |
CONSOLIDATED STATEMENT OF ASSETS AND LIABILITIES (unaudited) | |
| |
| | | June 30, 2017 | |
ASSETS: | | | | |
Investments, at value (cost $6,527,241,266) | | $ | 8,349,172,857 | |
Cash | | | 100 | |
Cash denominated in foreign currency (cost $382) | | | 375 | |
Cash held at broker | | | 5,837,880 | |
Collateral receivable on currency forward contracts | | | 5,200,000 | |
Receivable for investments sold | | | 294,888 | |
Receivable from broker for variation margin | | | 340,550 | |
Receivable for Fund shares sold | | | 338,280,556 | |
Dividends and interest receivable | | | 14,298,098 | |
Prepaid expenses and other assets | | | 16,781 | |
| | | | |
| | | 8,713,442,085 | |
| | | | |
LIABILITIES: | | | | |
Unrealized depreciation on currency forward contracts | | | 15,144,419 | |
Payable for investments purchased | | | 10,184,646 | |
Payable for Fund shares redeemed | | | 875,039 | |
Management fees payable | | | 4,132,710 | |
Accrued expenses | | | 458,413 | |
| | | | |
| | | 30,795,227 | |
| | | | |
NET ASSETS | | $ | 8,682,646,858 | |
| | | | |
NET ASSETS CONSIST OF: | | | | |
Paid in capital | | $ | 6,697,571,511 | |
Undistributed net investment income | | | 65,180,198 | |
Undistributed net realized gain | | | 113,588,133 | |
Net unrealized appreciation | | | 1,806,307,016 | |
| | | | |
| | $ | 8,682,646,858 | |
| | | | |
Fund shares outstanding (par value $0.01 each, unlimited shares authorized) | | | 657,498,850 | |
Net asset value per share | | $ | 13.21 | |
|
CONSOLIDATED STATEMENT OF OPERATIONS (unaudited) | |
| |
| | | Six Months Ended
June 30, 2017 | |
INVESTMENT INCOME: | | | | |
Dividends (net of foreign taxes of $6,820,359) | | $ | 87,851,250 | |
Interest | | | 407,734 | |
| | | | |
| | | 88,258,984 | |
| | | | |
EXPENSES: | | | | |
Management fees | | | 23,340,075 | |
Custody and fund accounting fees | | | 368,450 | |
Transfer agent fees | | | 211,267 | |
Professional services | | | 111,818 | |
Shareholder reports | | | 30,956 | |
Registration fees | | | 238,521 | |
Trustees’ fees | | | 130,000 | |
ADR depository services fees | | | 55,123 | |
Miscellaneous | | | 70,903 | |
| | | | |
| | | 24,557,113 | |
| | | | |
NET INVESTMENT INCOME | | | 63,701,871 | |
| | | | |
REALIZED AND UNREALIZED GAIN (LOSS): | |
Net realized gain (loss) | | | | |
Investments | | | 36,742,584 | |
Futures contracts | | | 13,847,714 | |
Currency forward contracts | | | 7,275,537 | |
Foreign currency transactions | | | (82,033 | ) |
Net change in unrealized appreciation/depreciation | | | | |
Investments | | | 702,257,762 | |
Futures contracts | | | 344,770 | |
Currency forward contracts | | | (40,412,208 | ) |
Foreign currency translation | | | 559,643 | |
| | | | |
Net realized and unrealized gain | | | 720,533,769 | |
| | | | |
NET CHANGE IN NET ASSETS
FROM OPERATIONS | | $ | 784,235,640 | |
| | | | |
| | | | | | | | |
CONSOLIDATED STATEMENT OF CHANGES IN NET ASSETS (unaudited) | |
| | |
| | | Six Months Ended June 30, 2017 | | | Year Ended
December 31, 2016 | |
OPERATIONS: | | | | | | | | |
Net investment income | | $ | 63,701,871 | | | $ | 82,670,067 | |
Net realized gain | | | 57,783,802 | | | | 120,320,077 | |
Net change in unrealized appreciation/depreciation | | | 662,749,967 | | | | 830,600,421 | |
| | | | | | | | |
| | | 784,235,640 | | | | 1,033,590,565 | |
| | | | | | | | |
| | |
DISTRIBUTIONS TO SHAREHOLDERS FROM: | | | | | | | | |
Net investment income | | | — | | | | (81,276,853 | ) |
Net realized gain | | | — | | | | (116,688,671 | ) |
| | | | | | | | |
Total distributions | | | — | | | | (197,965,524 | ) |
| | | | | | | | |
| | |
FUND SHARE TRANSACTIONS: | | | | | | | | |
Proceeds from sale of shares | | | 1,511,660,056 | | | | 1,117,120,169 | |
Reinvestment of distributions | | | — | | | | 192,513,037 | |
Cost of shares redeemed | | | (714,477,475 | ) | | | (751,808,292 | ) |
| | | | | | | | |
Net change from Fund share transactions | | | 797,182,581 | | | | 557,824,914 | |
| | | | | | | | |
Total change in net assets | | | 1,581,418,221 | | | | 1,393,449,955 | |
| | |
NET ASSETS: | | | | | | | | |
Beginning of period | | | 7,101,228,637 | | | | 5,707,778,682 | |
| | | | | | | | |
End of period (including undistributed net investment income of $65,180,198 and $1,478,327, respectively) | | $ | 8,682,646,858 | | | $ | 7,101,228,637 | |
| | | | | | | | |
| | |
SHARE INFORMATION: | | | | | | | | |
Shares sold | | | 116,737,027 | | | | 103,526,092 | |
Distributions reinvested | | | — | | | | 16,029,395 | |
Shares redeemed | | | (55,620,741 | ) | | | (69,004,235 | ) |
| | | | | | | | |
Net change in shares outstanding | | | 61,116,286 | | | | 50,551,252 | |
| | | | | | | | |
| | |
| PAGE 10 § DODGE & COX GLOBAL STOCK FUND | | See accompanying Notes to Consolidated Financial Statements |
NOTES TO CONSOLIDATED FINANCIAL STATEMENTS (unaudited)
NOTE 1—ORGANIZATION AND SIGNIFICANT ACCOUNTING POLICIES
Dodge & Cox Global Stock Fund (the “Fund”) is one of the series constituting the Dodge & Cox Funds (the “Trust” or the “Funds”). The Trust is organized as a Delaware statutory trust and is registered under the Investment Company Act of 1940, as amended, as an open-end management investment company. The Fund commenced operations on May 1, 2008, and seeks long-term growth of principal and income. The Fund invests primarily in a diversified portfolio of U.S. and foreign equity securities. Foreign investing, especially in developing countries, has special risks such as currency and market volatility and political and social instability. These and other risk considerations are discussed in the Fund’s Prospectus.
The financial statements have been prepared in conformity with accounting principles generally accepted in the United States of America, which require the use of estimates and assumptions by management. Actual results may differ from those estimates. Significant accounting policies are as follows:
Security valuation The Fund’s net assets are normally valued as of the scheduled close of trading on the New York Stock Exchange (NYSE), generally 4:00 p.m. Eastern Time, each day that the NYSE is open for business.
Portfolio holdings for which market quotes are readily available are valued at market value. Listed securities for example, are generally valued using the official quoted close price or the last sale on the exchange that is determined to be the primary market for the security. Exchange-traded derivatives are valued at the settlement price determined by the relevant exchange. Short-term securities less than 60 days to maturity may be valued at amortized cost if amortized cost approximates current value. Security values are not discounted based on the size of the Fund’s position and may differ from the value a Fund receives upon sale of the securities. Mutual funds are valued at their respective net asset values.
Investments initially valued in currencies other than the U.S. dollar are converted to the U.S. dollar using prevailing exchange rates. Forward currency contracts are valued based on the prevailing forward exchange rates of the underlying currencies. As a result, the Fund’s net assets may be affected by changes in the value of currencies in relation to the U.S. dollar.
If market quotations are not readily available or if normal valuation procedures produce valuations that are deemed unreliable or inappropriate under the circumstances existing at the time, the investment will be valued at fair value as determined in good faith by or under the direction of the Fund’s Board of Trustees. The Board of Trustees has appointed Dodge & Cox, the Fund’s investment manager, to make fair value determinations in accordance with the Dodge & Cox Funds Valuation Policies (“Valuation Policies”), subject to Board oversight. Dodge & Cox has established a Pricing Committee that is comprised of representatives from Treasury, Legal, Compliance, and Operations. The Pricing Committee is responsible for implementing the Valuation Policies, including determining the fair value of securities and other investments when necessary. The Pricing
Committee considers relevant indications of value that are reasonably available to it in determining the fair value assigned to a particular security, such as the value of similar financial instruments, trading volumes, contractual restrictions on disposition, related corporate actions, and changes in economic conditions. In doing so, the Pricing Committee employs various methods for calibrating fair valuation approaches, including a regular review of key inputs and assumptions, back-testing, and review of any related market activity.
As trading in securities on most foreign exchanges is normally completed before the close of the NYSE, the value of non-U.S. securities can change by the time the Fund calculates its NAV. To address these changes, the Fund may utilize adjustment factors provided by an independent pricing service to systematically value non-U.S. securities at fair value. These adjustment factors are based on statistical analyses of subsequent movements and changes in U.S. markets and financial instruments trading in U.S. markets that represent foreign securities or baskets of securities.
Valuing securities through a fair value determination involves greater reliance on judgment than valuation of securities based on readily available market quotations. In some instances, lack of information and uncertainty as to the significance of information may lead to a conclusion that a prior valuation is the best indication of a security’s value. When fair value pricing is employed, the prices of securities used by the Fund to calculate its NAV may differ from quoted or published prices for the same securities.
Security transactions, investment income, expenses, and distributions Security transactions are recorded on the trade date. Realized gains and losses on securities sold are determined on the basis of identified cost.
Dividend income and corporate action transactions are recorded on the ex-dividend date, or when the Fund first learns of the dividend/corporate action if the ex-dividend date has passed. Non-cash dividends included in dividend income, if any, are recorded at the fair market value of the securities received. Dividends characterized as return of capital for U.S. tax purposes are recorded as a reduction of cost of investments and/or realized gain. Interest income is recorded on the accrual basis.
Expenses are recorded on the accrual basis. Some expenses of the Trust can be directly attributed to a specific series. Expenses which cannot be directly attributed are allocated among the Funds in the Trust using methodologies determined by the nature of the expense.
Distributions to shareholders are recorded on the ex-dividend date.
Foreign taxes The Fund is subject to foreign taxes which may be imposed by certain countries in which the Fund invests. The Fund endeavors to record foreign taxes based on applicable foreign tax law. Withholding taxes are incurred on certain foreign dividends and are accrued at the time the associated dividend is recorded. The Fund files withholding tax reclaims in certain jurisdictions to recover a portion of amounts previously withheld. The Fund records a reclaim receivable based on, among other things, a jurisdiction’s legal obligation to pay reclaims as well as
DODGE & COX GLOBAL STOCK FUND §PAGE 11
NOTES TO CONSOLIDATED FINANCIAL STATEMENTS (unaudited)
payment history and market convention. In consideration of recent decisions rendered by European courts, the Fund has filed for additional reclaims related to prior years. A corresponding receivable is established when both the amount is known and significant contingencies or uncertainties regarding collectability are removed. These amounts, if any, are reported in “dividends and interest receivable” on the Consolidated Statement of Assets and Liabilities.
Capital gains taxes are incurred upon disposition of certain foreign securities. Expected capital gains taxes on appreciated securities are accrued as unrealized losses and incurred capital gains taxes are reflected as realized losses upon the sale of the related security. Currency taxes may be incurred when the Fund purchases certain foreign currencies related to securities transactions and are recorded as realized losses on foreign currency transactions.
Repurchase agreements Repurchase agreements are transactions under which a Fund purchases a security from a dealer counterparty and agrees to resell the security to that counterparty on a specified future date at the same price, plus a specified interest rate. The Fund’s repurchase agreements are secured by U.S. government or agency securities. It is the Fund’s policy that its custodian take possession of the underlying collateral securities, the fair value of which exceeds the principal amount of the repurchase transaction, including accrued interest, at all times. In the event of default by the counterparty, the Fund has the contractual right to liquidate the collateral securities and to apply the proceeds in satisfaction of the obligation.
Futures Contracts Futures contracts involve an obligation to purchase or sell (depending on whether the Fund has entered a long or short futures contract, respectively) an asset at a future date, at a price set at the time of the contract. Upon entering into a futures contract, the Fund is required to deposit an amount of cash or liquid assets (referred to as initial margin) in a segregated account with the clearing broker. Subsequent payments (referred to as variation margin) to and from the clearing broker are made on a daily basis based on changes in the market value of futures contracts. Futures contracts are traded publicly and their market value changes daily. Changes in the market value of open futures contracts are recorded as unrealized appreciation or depreciation in the Consolidated Statement of Operations. Realized gains and losses on futures contracts are recorded in the Consolidated Statement of Operations at the closing or expiration of the contracts. Cash deposited with a broker as initial margin is recorded on the Consolidated Statement of Assets and Liabilities. A receivable and/or payable to brokers for daily variation margin is also recorded on the Consolidated Statement of Assets and Liabilities.
Investments in futures contracts may include certain risks, which may be different from, and potentially greater than, those of the underlying securities. To the extent the Fund uses futures, it is exposed to additional volatility and potential losses resulting from leverage.
The Fund has maintained long S&P 500 futures contracts to provide equity exposure that approximates the Fund’s “net cash and other” position, which includes cash, short-term investments,
receivables, and payables. During the six months ended June 30, 2017, these S&P 500 futures contracts had notional values ranging from 1% to 3% of net assets.
Currency forward contracts A currency forward contract represents an obligation to purchase or sell a specific foreign currency at a future date at a price set at the time of the contract. The values of the forward currency contracts are adjusted daily based on the prevailing forward exchange rates of the underlying currencies. Changes in the value of open contracts are recorded as unrealized appreciation or depreciation in the Consolidated Statement of Operations. When the currency forward contract is closed, the Fund records a realized gain or loss in the Consolidated Statement of Operations equal to the difference between the value at the time the contract was opened and the value at the time it was closed. Losses from these transactions may arise from unfavorable changes in currency values or if the counterparties do not perform under a contract’s terms.
The Fund has maintained currency forward contracts to hedge direct and/or indirect foreign currency exposure to the Chinese yuan renminbi, euro, and Swiss franc. During the six months ended June 30, 2017, these currency forward contracts had U.S. dollar total values ranging from 6% to 8% of net assets.
Foreign currency translation The books and records of the Fund are maintained in U.S. dollars. Foreign currency amounts are translated into U.S. dollars at the prevailing exchange rates of such currencies against the U.S. dollar. The market value of investment securities and other assets and liabilities are translated at the exchange rate as of the valuation date. Purchases and sales of investment securities, income, and expenses are translated at the exchange rate prevailing on the transaction date.
Reported realized and unrealized gain (loss) on investments include foreign currency gain (loss) related to investment transactions.
Reported realized and unrealized gain (loss) on foreign currency transactions and translation include the following: disposing/holding of foreign currency, the difference between the trade and settlement dates on securities transactions, the difference between the accrual and payment dates on dividends, and currency losses on the purchase of foreign currency in certain countries that impose taxes on such transactions.
Consolidation The Fund may invest in certain securities through its wholly owned subsidiary, Dodge & Cox Global Stock Fund Cayman, Ltd. (the “Subsidiary”). The Subsidiary is a Cayman Islands exempted company and invests in certain securities consistent with the investment objective of the Fund. The Fund’s Consolidated Financial Statements, including the Consolidated Portfolio of Investments, consist of the holdings and accounts of the Fund and the Subsidiary. All intercompany transactions and balances have been eliminated. At June 30, 2017, the Subsidiary had net assets of $100, which represented less than 0.01% of the Fund’s consolidated net assets.
Indemnification Under the Trust’s organizational documents, its officers and trustees are indemnified against certain
PAGE 12 § DODGE & COX GLOBAL STOCK FUND
NOTES TO CONSOLIDATED FINANCIAL STATEMENTS (unaudited)
liabilities arising out of the performance of their duties to the Trust. In addition, in the normal course of business the Trust enters into contracts that provide general indemnities to other parties. The Trust’s maximum exposure under these arrangements is unknown as this would involve future claims that may be made against the Trust that have not yet occurred.
NOTE 2—VALUATION MEASUREMENTS
Various inputs are used in determining the value of the Fund’s investments and other financial instruments. These inputs are summarized in the three broad levels listed below.
| § | | Level 1: Quoted prices in active markets for identical securities |
| § | | Level 2: Other significant observable inputs (including quoted prices for similar securities, market indices, interest rates, credit risk, forward exchange rates, etc.) |
| § | | Level 3: Significant unobservable inputs (including Fund management’s assumptions in determining the fair value of investments) |
The inputs or methodology used for valuing securities are not necessarily an indication of the risk associated with investing in those securities.
The following is a summary of the inputs used to value the Fund’s holdings at June 30, 2017:
| | | | | | | | |
| Classification(a) | | LEVEL 1
(Quoted Prices) | | | LEVEL 2
(Other Significant
Observable Inputs) | |
Securities | | | | | | | | |
Common Stocks | | | | | | | | |
Consumer Discretionary | | $ | 1,629,986,321 | | | $ | — | |
Consumer Staples | | | 156,215,095 | | | | — | |
Energy | | | 404,526,745 | | | | — | |
Financials | | | 1,950,201,436 | | | | — | |
Health Care | | | 1,602,569,286 | | | | — | |
Industrials | | | 404,590,933 | | | | — | |
Information Technology | | | 1,066,202,244 | | | | — | |
Materials | | | 262,229,473 | | | | — | |
Real Estate | | | 68,788,788 | | | | — | |
Telecommunication Services | | | 269,392,704 | | | | — | |
Preferred Stocks | | | | | | | | |
Energy | | | 56,580,385 | | | | — | |
Financials | | | 145,858,852 | | | | — | |
Information Technology | | | 131,517,431 | | | | — | |
Short-term Investments | | | | | | | | |
Money Market Fund | | | 8,361,164 | | | | — | |
Repurchase Agreement | | | — | | | | 192,152,000 | |
| | | | | | | | |
Total Securities | | $ | 8,157,020,857 | | | $ | 192,152,000 | |
| | | | | | | | |
Other Financial Instruments | | | | | | | | |
Futures Contracts | | | | | | | | |
Depreciation | | $ | (660,746) | | | $ | — | |
Currency Forward Contracts | | | | | | | | |
Depreciation | | | — | | | | (15,144,419 | ) |
| | | | | | | | | |
| (a) | Transfers during the period between Level 1 and Level 2 relate to the use of systematic fair valuation or when significant observable inputs are used to fair value a specific security. On days when systematic fair valuation is used, securities whose primary market closes before the NYSE are classified as Level 2. There were no Level 3 securities at June 30, 2017 and December 31, 2016, and there were no transfers to Level 3 during the period. |
NOTE 3—RELATED PARTY TRANSACTIONS
Management fees Under a written agreement approved by a unanimous vote of the Board of Trustees, the Fund pays an annual management fee of 0.60% of the Fund’s average daily net assets to Dodge & Cox, investment manager of the Fund.
Fund officers and trustees All officers and two of the trustees of the Trust are officers or employees of Dodge & Cox. The Trust pays a fee only to those trustees who are not affiliated with Dodge & Cox.
NOTE 4—INCOME TAX INFORMATION AND DISTRIBUTIONS TO SHAREHOLDERS
A provision for federal income taxes is not required since the Fund intends to qualify as a regulated investment company under Subchapter M of the Internal Revenue Code and distribute all of its taxable income to shareholders. Distributions are determined in accordance with income tax regulations, and such amounts may differ from net investment income and realized gains for financial reporting purposes. Financial reporting records are adjusted for permanent book to tax differences at year end to reflect tax character.
Book to tax differences are primarily due to differing treatments of wash sales, net short-term realized gain (loss), futures contracts, investments in passive foreign investment companies, and foreign currency realized gain (loss). At June 30, 2017, the cost of investments for federal income tax purposes was $6,537,354,164.
Distributions during the periods noted below were characterized as follows for federal income tax purposes:
| | | | | | | | |
| | | Six Months Ended June 30, 2017 | | | Year Ended December 31, 2016 | |
Ordinary income | | | — | | | $ | 113,206,589 | |
| | | | | | ($ | 0.195 per share | ) |
Long-term capital gain | | | — | | | $ | 84,758,935 | |
| | | | | | ($ | 0.146 per share | ) |
At June 30, 2017, the tax basis components of distributable earnings were as follows:
| | | | |
Unrealized appreciation | | $ | 2,116,693,624 | |
Unrealized depreciation | | | (304,874,931 | ) |
| | | | |
Net unrealized appreciation | | | 1,811,818,693 | |
Undistributed ordinary income | | | 99,309,332 | |
Undistributed long-term capital gain | | | 73,766,732 | |
| | | | | |
Fund management has reviewed the tax positions for open periods (three years and four years, respectively, from filing the Fund’s Federal and State tax returns) as applicable to the Fund, and has determined that no provision for income tax is required in the Fund’s financial statements.
NOTE 5—LOAN FACILITIES
Pursuant to an exemptive order issued by the Securities and Exchange Commission (SEC), the Fund may participate in an
DODGE & COX GLOBAL STOCK FUND §PAGE 13
NOTES TO CONSOLIDATED FINANCIAL STATEMENTS (unaudited)
interfund lending facility (Facility). The Facility allows the Fund to borrow money from or loan money to the Funds. Loans under the Facility are made for temporary or emergency purposes, such as to fund shareholder redemption requests. Interest on borrowings is the average of the current repurchase agreement rate and the bank loan rate. There was no activity in the Facility during the period.
All Funds in the Trust participate in a $500 million committed credit facility (Line of Credit) with State Street Bank and Trust Company, to be utilized for temporary or emergency purposes to fund shareholder redemptions or for other short-term liquidity purposes. The maximum amount available to the Fund is $250 million. Each Fund pays an annual commitment fee on its pro-rata portion of the Line of Credit. For the six months ended June 30, 2017, the Fund’s commitment fee amounted to $24,875 and is reflected as a Miscellaneous Expense in the Consolidated Statement of Operations. Interest on borrowings is charged at the prevailing rate. There were no borrowings on the Line of Credit during the period.
NOTE 6—PURCHASES AND SALES OF INVESTMENTS
For the six months ended June 30, 2017, purchases and sales of securities, other than short-term securities, aggregated $1,041,906,770 and $574,169,580, respectively.
NOTE 7—NEW ACCOUNTING GUIDANCE
In October 2016, the SEC issued a new rule, Investment Company Reporting Modernization, which, among other provisions, amends Regulation S-X to require standardized, enhanced disclosures, particularly related to derivatives, in investment company financial statements. Compliance with the guidance is required for financial statements for fiscal periods ending on or after August 1, 2017. Management is currently assessing the impact of this rule to the Fund’s financial statements and other filings and does not expect any impact to the Fund’s net assets or results of operations.
NOTE 8—SUBSEQUENT EVENTS
Fund management has determined that no material events or transactions occurred subsequent to June 30, 2017, and through the date of the Fund’s financial statements issuance, which require additional disclosure in the Fund’s financial statements.
PAGE 14 § DODGE & COX GLOBAL STOCK FUND
NOTES TO CONSOLIDATED FINANCIAL STATEMENTS (unaudited)
NOTE 9—ADDITIONAL DERIVATIVES INFORMATION
The Fund has entered into over-the-counter derivatives, such as currency forward contracts (each, a “Derivative”). Each Derivative is subject to a negotiated master agreement (based on a form published by the International Swaps and Derivatives Association (“ISDA”)) governing all Derivatives between the Fund and the relevant dealer counterparty. The master agreements specify (i) events of default and other events permitting a party to terminate some or all of the Derivatives thereunder and (ii) the process by which those Derivatives will be valued for purposes of determining termination payments. If some or all of the Derivatives under a master agreement are terminated because of an event of default or similar event, the values of all terminated Derivatives must be netted to determine a single payment owed by one party to the other. Some master agreements contain collateral terms requiring the parties to post collateral in respect of some or all of the Derivatives thereunder based on the net market value of those Derivatives, subject to a minimum exposure threshold. To the extent amounts owed to the Fund by its counterparties are not collateralized, the Fund is at risk of those counterparties’ non-performance. The Fund attempts to mitigate counterparty credit risk by entering into Derivatives only with counterparties it believes to be of good credit quality and by monitoring the financial stability of those counterparties.
For financial reporting purposes, the Fund does not offset financial assets and liabilities that are subject to a master netting arrangement in the Consolidated Statement of Assets and Liabilities. Derivatives are presented on the Consolidated Statement of Assets and Liabilities as unrealized appreciation/depreciation on currency forward contracts. Cash collateral pledged or received by the Fund for derivatives are reported gross on the Consolidated Statement of Assets and Liabilities as collateral receivable/payable on currency forward contracts. Derivative information by counterparty is presented in the Consolidated Portfolio of Investments.
The netting of assets and liabilities and the offsetting of collateral pledged or received are based on contractual netting/set-off provisions in the ISDA master agreement. The following table presents the Fund’s net exposure for derivative instruments that are subject to enforceable master netting arrangements as of June 30, 2017. The net amount represents the receivable from (payable to) the counterparty in the event of a default.
| | | | | | | | | | | | | | | | |
| Counterparty | | Gross Derivative Assets | | | Gross Derivative Liabilities | | | Cash Collateral Pledged/(Received)(a) | | | Net Amount | |
Bank of America | | $ | — | | | $ | (1,474,628) | | | $ | 1,040,000 | | | $ | (434,628) | |
Citibank | | | — | | | | (4,508,481) | | | | — | | | | (4,508,481) | |
Credit Suisse | | | — | | | | (960,964) | | | | — | | | | (960,964) | |
Goldman Sachs | | | — | | | | (1,336,791) | | | | 1,320,000 | | | | (16,791) | |
HSBC | | | — | | | | (1,314,315) | | | | — | | | | (1,314,315) | |
JPMorgan | | | — | | | | (3,502,084) | | | | 2,840,000 | | | | (662,084) | |
UBS | | | — | | | | (2,047,156) | | | | — | | | | (2,047,156) | |
| | | | | | | | | | | | | | | | |
| | $ | — | | | $ | (15,144,419) | | | $ | 5,200,000 | | | $ | (9,944,419) | |
| | | | | | | | | | | | | | | | |
| | | | | | | | | | | | | | | | | |
| (a) | Cash collateral pledged/(received) in excess of derivative assets/liabilities, if any, is not presented in this table. The total cash collateral is presented on the Fund’s Consolidated Statement of Assets and Liabilities. |
DODGE & COX GLOBAL STOCK FUND §PAGE 15
CONSOLIDATED FINANCIAL HIGHLIGHTS (unaudited)
| | | | | | | | | | | | | | | | | | | | | | | | |
SELECTED DATA AND RATIOS (for a share outstanding throughout each period) | | Six Months Ended June 30, | | | Year Ended December 31, | |
| | | 2017 | | | 2016 | | | 2015 | | | 2014 | | | 2013 | | | 2012 | |
| | | | | | | | |
Net asset value, beginning of period | | | $11.91 | | | | $10.46 | | | | $11.83 | | | | $11.48 | | | | $8.99 | | | | $7.68 | |
Income from investment operations: | | | | | | | | | | | | | | | | | | | | | | | | |
Net investment income | | | 0.10 | | | | 0.14 | | | | 0.16 | | | | 0.16 | | | | 0.16 | | | | 0.15 | |
Net realized and unrealized gain (loss) | | | 1.20 | | | | 1.65 | | | | (1.11 | ) | | | 0.64 | | | | 2.81 | | | | 1.48 | |
| | | | | | | | |
Total from investment operations | | | 1.30 | | | | 1.79 | | | | (0.95 | ) | | | 0.80 | | | | 2.97 | | | | 1.63 | |
| | | | | | | | |
Distributions to shareholders from: | | | | | | | | | | | | | | | | | | | | | | | | |
Net investment income | | | — | | | | (0.14 | ) | | | (0.19 | ) | | | (0.15 | ) | | | (0.16 | ) | | | (0.15 | ) |
Net realized gain | | | — | | | | (0.20 | ) | | | (0.23 | ) | | | (0.30 | ) | | | (0.32 | ) | | | (0.17 | ) |
| | | | | | | | |
Total distributions | | | — | | | | (0.34 | ) | | | (0.42 | ) | | | (0.45 | ) | | | (0.48 | ) | | | (0.32 | ) |
| | | | | | | | |
Net asset value, end of period | | | $13.21 | | | | $11.91 | | | | $10.46 | | | | $11.83 | | | | $11.48 | | | | $8.99 | |
| | | | | | | | |
Total return | | | 10.92 | % | | | 17.09 | % | | | (8.05 | )% | | | 6.95 | % | | | 33.17 | % | | | 21.11 | % |
Ratios/supplemental data: | | | | | | | | | | | | | | | | | | | | | | | | |
Net assets, end of period (millions) | | | $8,683 | | | | $7,101 | | | | $5,708 | | | | $5,895 | | | | $3,924 | | | | $2,695 | |
Ratios of expenses to average net assets | | | 0.63 | %(a) | | | 0.63 | % | | | 0.63 | % | | | 0.65 | % | | | 0.65 | % | | | 0.65 | % |
Ratios of net investment income to average net assets | | | 1.64 | %(a) | | | 1.36 | % | | | 1.39 | % | | | 1.42 | % | | | 1.58 | % | | | 1.93 | % |
Portfolio turnover rate | | | 8 | % | | | 25 | % | | | 20 | % | | | 17 | % | | | 24 | % | | | 12 | % |
See accompanying Notes to Consolidated Financial Statements
PAGE 16 § DODGE & COX GLOBAL STOCK FUND
FUND HOLDINGS
The Fund provides a complete list of its holdings four times each fiscal year, as of the end of each quarter. The Fund files the lists with the Securities and Exchange Commission (SEC) on Form N-CSR (second and fourth quarters) and Form N-Q (first and third quarters). Shareholders may view the Fund’s Forms N-CSR and N-Q on the SEC’s website at sec.gov. Forms N-CSR and N-Q may also be reviewed and copied at the SEC’s Public Reference Room in Washington, DC. Information regarding the operations of the Public Reference Room may be obtained by calling 202-551-8090 (direct) or 800-732-0330 (general SEC number). A list of the Fund’s quarter-end holdings is also available at dodgeandcox.com on or about 15 days following each quarter end and remains available on the website until the list is updated in the subsequent quarter.
PROXY VOTING
For a free copy of the Fund’s proxy voting policies and procedures, please call 800-621-3979, visit the Fund’s website at dodgeandcox.com, or visit the SEC’s website at sec.gov. Information regarding how the Fund voted proxies relating to portfolio securities during the most recent 12-month period ending June 30 is also available at dodgeandcox.com or at sec.gov.
HOUSEHOLD MAILINGS
The Fund routinely mails shareholder reports and summary prospectuses to shareholders and, on occasion, proxy statements. In order to reduce the volume of mail, when possible, only one copy of these documents will be sent to shareholders who are part of the same family and share the same residential address.
If you have a direct account with the Funds and you do not want the mailing of shareholder reports and summary prospectuses combined with other members in your household, contact the Funds at 800-621-3979. Your request will be implemented within 30 days.
DODGE & COX GLOBAL STOCK FUND §PAGE 17
THIS PAGE INTENTIONALLY LEFT BLANK
PAGE 18 § DODGE & COX GLOBAL STOCK FUND
TRUSTEES AND EXECUTIVE OFFICERS
Charles F. Pohl, Chairman and Trustee
Chairman, Dodge & Cox
Dana M. Emery, President and Trustee
Chief Executive Officer and President, Dodge & Cox
Thomas A. Larsen, Independent Trustee
Senior Counsel, Arnold & Porter Kaye Scholer LLP
Ann Mather, Independent Trustee
Former Executive Vice President, Chief Financial Officer, and Company Secretary, Pixar Animation Studios
Robert B. Morris III, Independent Trustee
Former Partner and Managing Director - Global Investment Research, Goldman Sachs; Former Advisory Director, The Presidio Group
Gary Roughead, Independent Trustee
Robert and Marion Oster Distinguished Fellow, Hoover Institution, and former U.S. Navy Chief of Naval Operations
Mark E. Smith, Independent Trustee
Former Executive Vice President and Managing Director - Fixed Income, Loomis Sayles & Company, L.P.
John B. Taylor, Independent Trustee
Professor of Economics, Stanford University; Senior Fellow, Hoover Institution; and former Under Secretary for International Affairs, United States Treasury
Diana S. Strandberg, Senior Vice President
Senior Vice President and Director of International Equity, Dodge & Cox
David H. Longhurst, Treasurer
Vice President and Assistant Treasurer, Dodge & Cox
Thomas M. Mistele, Secretary
Executive Vice President, Secretary, and Senior Counsel, Dodge & Cox
Katherine M. Primas, Chief Compliance Officer
Vice President and Chief Compliance Officer, Dodge & Cox
Roberta R.W. Kameda, Assistant Secretary
Vice President and General Counsel, Dodge & Cox
William W. Strickland, Assistant Secretary and Assistant Treasurer
Vice President and Chief Operating Officer, Dodge & Cox
Additional information about the Trust’s Trustees and Officers is available in the Trust’s Statement of Additional Information (SAI). You can get a free copy of the SAI by visiting the Funds’ website at dodgeandcox.com or calling 800-621-3979.
DODGE & COX GLOBAL STOCK FUND §PAGE 19
dodgeandcox.com
For Fund literature, transactions, and account information, please visit the Funds’ website.
or write or call:
DODGE & COX FUNDS
c/o Boston Financial Data Services
P.O. Box 8422
Boston, Massachusetts 02266-8422
(800) 621-3979
INVESTMENT MANAGER
Dodge & Cox
555 California Street, 40th Floor
San Francisco, California 94104
(415) 981-1710
This report is submitted for the general information of the shareholders of the Fund. The report is not authorized for distribution to prospective investors in the Fund unless it is accompanied by a current prospectus.
This report reflects our views, opinions, and portfolio holdings as of June 30, 2017, the end of the reporting period. Any such views are subject to change at any time based upon market or other conditions and Dodge & Cox disclaims any responsibility to update such views. These views may not be relied on as investment advice and, because investment decisions for a Dodge & Cox Fund are based on numerous factors, may not be relied on as an indication of trading intent on behalf of any Dodge & Cox Fund.
DODGE & COX FUNDS®
Semi-Annual Report
June 30, 2017
International Stock Fund
ESTABLISHED 2001
TICKER: DODFX
(Closed to New Investors)
6/17 ISF SAR Printed on recycled paper
TO OUR SHAREHOLDERS
The Dodge & Cox International Stock Fund had a total return of 14.5% for the six months ended June 30, 2017, compared to a return of 13.8% for the MSCI EAFE (Europe, Australasia, Far East) Index.
MARKET COMMENTARY
Global equity markets had the strongest first half in years with 26 of the world’s top 30 stock markets rising. Every sector save Energy posted gains in both the MSCI EAFE, the benchmark for developed markets, and the MSCI Emerging Markets Index. Within this context, emerging markets outperformed their peers in developed markets, rising 15% in local currency and 18% when measured in U.S. dollars, compared to an increase of 8% in local currency and 14% in U.S. dollars for the MSCI EAFE. This served the Fund well because it has substantial exposure to the developing world: 26% of its net assets are invested in companies domiciled in emerging market countries.(a)
Though international equity markets outperformed the United States through the first half of 2017, international equities have underperformed U.S. equities on a three-, five-, and ten-year basis. Robust U.S. earnings growth, a strong U.S. dollar, and price-to-earnings multiple expansion are the key reasons for this performance differential. Today, international equity valuations are less expensive than U.S. valuations and remain reasonable at 14.6 times forward earnings for the MSCI EAFE, compared to a 20-year average of 15.6 times.
INVESTMENT STRATEGY
As a value-oriented manager, we weigh valuation and fundamentals in assessing long-term investment opportunity. In some cases, a company’s valuation may overly discount concerns regarding earnings and cash flow prospects. In other cases, the valuation may not give proper credit to a robust fundamental outlook. Examples include Schlumberger(b) and the Fund’s four Chinese internet holdings, which are discussed below. Their valuations are reasonable yet do not reflect each company’s long-term growth potential and dominant market position.
Energy
Over the past six months, oil prices declined 16%, and Energy was the worst-performing sector worldwide. While the short-term direction of oil prices is difficult to forecast, we believe the long-term fundamentals of supply and demand point to higher prices. The current demand for oil, which is about 98 million barrels a day, continues to grow about one percent per year, driven by transportation demand in the developing world. Oil fields deplete as the resource is extracted, reducing the global production base about two to three percent per year, so continuing investment is required to meet current demand and prepare for future demand growth. We anticipate that 15 to 20 million barrels per day of new production will be needed over the next five years to meet demand if these trends continue. However, upstream capital investment has declined to a 10-year low, fewer new projects are being approved, and North American shale is unlikely to grow enough to bridge this eventual gap.
Amid depressed valuations for energy companies, we recently added to two of the Fund’s Integrated Oils holdings: Statoil (a Norwegian company that is investing counter cyclically in economically attractive new projects) and Suncor Energy (a Canadian company with best-in-class management that has a large, low-cost, and long-lived resource basin in the Canadian oil sands). We believe both of these companies are trading at a sizeable discount to the value of their resources if oil prices recover.
The Fund remains modestly overweight the Energy sector (6.5% compared to 4.7% for the MSCI EAFE), primarily due to its exposure to the Energy Equipment & Services (Oil Services) industry (2.6% compared to 0.1% for the MSCI EAFE). Incremental oil resources are becoming more difficult to develop, which drives demand for oil services companies’ expertise. Shale gas, tight oil, and deepwater resources are more product and service intensive than conventional resources. One company that should benefit from this increased demand is Schlumberger, the Fund’s largest holding in the Energy sector and an example of a leading business at a reasonable price.
Schlumberger
Schlumberger (a 2.1% position) is the world’s leading energy services company, with nearly $28 billion in sales in 2016. After the stock performed strongly in 2016, we trimmed the Fund’s position in Schlumberger early this year due to valuation. With declining oil prices, Schlumberger’s stock price retreated 22% in the first half of 2017. After reaffirming our long-term investment thesis, we decided to add to the Fund’s Schlumberger position during the second quarter.
Schlumberger has strong—and in many cases dominant—market positions across most of its portfolio of businesses and has strengthened these positions by outspending competitors in research and development (R&D), capital investment, and acquisitions. The company’s management, among the best in the industry, is driving efficiencies resulting in cost improvements and healthy free cash flow. Schlumberger’s product and geographic diversification, coupled with its strong balance sheet, gives the company staying power and offers management substantial flexibility in the face of difficult market conditions.
Chinese Internet Holdings
On a bottom-up basis, we have invested in four Chinese internet companies—58.com, Tencent (through Naspers), JD.com, and Baidu—comprising 7.4% of the Fund compared to 0% in the MSCI EAFE and 2.3% in the MSCI All Country World ex USA Index. Each is a market leader, run by an owner-operator with significant wealth invested in the company. Thus, we think there is alignment with the interests of long-term owners like ourselves. These companies are reasonably valued in light of their excellent growth prospects. We believe the market for internet services in China is particularly attractive due to high economic growth, increasing internet penetration, and the potential to leapfrog traditional technologies (e.g., online versus brick-and-mortar retail, mobile versus landline, digital versus print advertising).
PAGE 2 § DODGE & COX INTERNATIONAL STOCK FUND
We recently started a position in 58.com, China’s dominant online classifieds marketplace. The company has leading positions in a number of attractive online domains (e.g., job listings, yellow pages), significant margin expansion potential, growth opportunities from new initiatives, and a focused owner/operator management team.
The Fund owns Tencent, a leading provider of internet value-added services in China, through Naspers, the largest holding in the Fund. Naspers’ 34% ownership stake in Tencent is worth more than Naspers’ market cap. The core of Tencent’s value proposition is its enormous, extremely sticky, and highly engaged user base (e.g., 861 million active instant messenger accounts, 938 million WeChat mobile app users). More than 50% of all mobile internet user time in China is spent on Tencent’s apps. Tencent has dominant positions in online and mobile gaming, social networking, and digital content distribution and is achieving growing importance in online advertising, payments, and cloud computing. The company operates in a strong ecosystem built on e-commerce, online-to-offline, and other verticals. Tencent has an innovative, product-driven, and commercially oriented culture, led by an owner-operator founder and a management team with an exceptional execution track record.
JD.com is the largest online retailer and the second largest e-commerce platform in China, known for the authenticity of its products and the quality of its service. The company benefits from attractive growth within the business-to-consumer segment of China’s e-commerce market and is gaining share from its competitors. We believe that online retail in China not only has the potential to grow much faster than in the United States but could also become a much larger portion of total retail sales. China’s strong economic growth and transition from an industrial-led to a consumer-led economy point to higher retail growth prospects. The fact that brick-and-mortar retail is less developed in China raises the possibility that consumers in China may jump straight to online retail.
Baidu—the dominant search engine in China, with over 70% search traffic and over 80% revenue share—has a profitable business model that allows the company to invest in R&D to retain its leading edge. Since search is typically a “winner-take-all” market, Baidu enjoys significant barriers to entry.
While these four companies share many characteristics, we note that their stock price movements reflect their individual company risks and opportunities more than a single industry risk exposure.
China A-Shares
As China continues to liberalize its capital markets, the country is providing foreign investors with greater access to locally listed companies via the A-shares market, which represents a broader cross-section of the Chinese economy than is offered by ADRs and Hong Kong H-shares. To date, Dodge & Cox has invested in Chinese companies through ADRs and H-shares. While we have not yet invested in A-share companies, we have been building our research expertise and knowledge of these companies over the past five years in anticipation of this increase in market access.
IN CLOSING
International equity valuations remain reasonable, and we continue to see numerous investment opportunities in both developed and emerging markets. However, we have adopted a tempered outlook for future returns given recent strong performance. As an active manager with a value-oriented approach, we remain optimistic about the long-term prospects for the Fund’s holdings.
We want to express gratitude to the Fund’s shareholders for taking the long view and having confidence in Dodge & Cox. Our strategy requires patience and persistence, and we thank you for yours. As always, we welcome your comments and questions.
For the Board of Trustees,
| | |
| | |
Charles F. Pohl, Chairman | | Dana M. Emery, President |
July 31, 2017
| (a) | | Unless otherwise specified, all weightings and characteristics are as of June 30, 2017. |
| (b) | | The use of specific examples does not imply that they are more or less attractive investments than the portfolio’s other holdings. |
DODGE & COX INTERNATIONAL STOCK FUND §PAGE 3
YEAR-TO-DATE PERFORMANCE REVIEW
The Fund outperformed the MSCI EAFE by 0.7 percentage points year to date.
Key Contributors from Relative Results
| | § | | Strong returns from the Fund’s holdings in emerging markets (up 22%) contributed significantly to performance, notably JD.com (up 54%), Samsung Electronics (up 40%), ICICI Bank (up 32%), and Naspers (up 32%). | |
| | § | | The Fund maintained an average overweight position (14% versus 11%) in the Health Care sector, and the Fund’s holdings outperformed the sector (up 20% compared to up 16% for the MSCI EAFE sector). AstraZeneca (up 26%), Bayer (up 26%), and Sanofi (up 20%) performed particularly well. | |
| | § | | Additional contributors included Nintendo (up 62%) and UniCredit (up 30%). | |
Key Detractors to Relative Results
| | § | | The Fund’s holdings in the Energy sector performed poorly (down 16% compared to down 2% for the MSCI EAFE sector). Saipem (down 35%), Schlumberger (down 21%), Petrobras (down 15%), and Suncor Energy (down 9%) were especially weak. | |
| | § | | In the Consumer Staples sector, the Fund’s underweight position (1% versus 11% for the MSCI EAFE sector) hurt performance because this was one of the strongest sectors of the market (up 17%). | |
| | § | | The Fund’s holdings in the Industrials sector (up 12% compared to up 17% for the MSCI EAFE sector) hindered results. Mitsubishi Electric (up 4%) was among the relative detractors. | |
| | § | | Additional detractors included Honda Motor (down 6%), Hewlett Packard Enterprise (down 4%), and Barclays (down 4%). | |
KEY CHARACTERISTICS OF DODGE & COX
Independent Organization
Dodge & Cox is one of the largest privately owned investment managers in the world. We remain committed to independence, with a goal of providing the highest quality investment management service to our existing clients.
Over 85 Years of Investment Experience
Dodge & Cox was founded in 1930. We have a stable and well-qualified team of investment professionals, most of whom have spent their entire careers at Dodge & Cox.
Experienced Investment Team
The International Equity Investment Committee, which is the decision-making body for the International Stock Fund, is an eight-member committee with an average tenure at Dodge & Cox of 23 years.
One Business with a Single Research Office
Dodge & Cox manages equity (domestic, international, and global), fixed income (domestic and global), and balanced investments, operating from one office in San Francisco.
Consistent Investment Approach
Our team decision-making process involves thorough, bottom-up fundamental analysis of each investment.
Long-Term Focus and Low Expenses
We invest with a three- to five-year investment horizon, which has historically resulted in low turnover relative to our peers. We manage Funds that maintain low expense ratios.
Risks: The Fund is subject to market risk, meaning holdings in the Fund may decline in value for extended periods due to the financial prospects of individual companies, or due to general market and economic conditions. Investing in non-U.S. securities may entail risk due to foreign economic and political developments; this risk may be increased when investing in emerging markets. The Fund is also subject to currency risk. Please read the prospectus and summary prospectus for specific details regarding the Fund’s risk profile.
PAGE 4 § DODGE & COX INTERNATIONAL STOCK FUND
GROWTH OF $10,000 OVER 10 YEARS
FOR AN INVESTMENT MADE ON JUNE 30, 2007
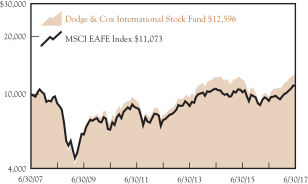
AVERAGE ANNUAL TOTAL RETURN
FOR PERIODS ENDED JUNE 30, 2017
| | | | | | | | | | | | | | | | |
| | | 1 Year | | | 3 Years | | | 5 Years | | | 10 Years | |
Dodge & Cox International
Stock Fund | | | 30.37 | % | | | 0.64 | % | | | 10.23 | % | | | 2.34 | % |
MSCI EAFE Index | | | 20.27 | | | | 1.15 | | | | 8.69 | | | | 1.03 | |
Returns represent past performance and do not guarantee future results. Investment return and share price will fluctuate with market conditions, and investors may have a gain or loss when shares are sold. Fund performance changes over time and currently may be significantly lower than stated. Performance is updated and published monthly. Visit the Fund’s website at dodgeandcox.com or call 800-621-3979 for current performance figures.
The Fund’s total returns include the reinvestment of dividend and capital gain distributions, but have not been adjusted for any income taxes payable by shareholders on these distributions or on Fund share redemptions. Index returns include dividends but, unlike Fund returns, do not reflect fees or expenses. The MSCI EAFE (Europe, Australasia, Far East) Index is a broad-based, unmanaged equity market index aggregated from 21 developed market country indices, excluding the United States and Canada. MSCI makes no express or implied warranties or representations and shall have no liability whatsoever with respect to any MSCI data contained herein. The MSCI data may not be further redistributed or used as a basis for other indices or any securities or financial products. This report is not approved, reviewed, or produced by MSCI.
MSCI EAFE is a service mark of MSCI Barra.
FUND EXPENSE EXAMPLE
As a Fund shareholder, you incur ongoing Fund costs, including management fees and other Fund expenses. All mutual funds have ongoing costs, sometimes referred to as operating expenses. The following example shows ongoing costs of investing in the Fund and can help you understand these costs and compare them with those of other mutual funds. The example assumes a $1,000 investment held for the six months indicated.
ACTUAL EXPENSES
The first line of the table below provides information about actual account values and expenses based on the Fund’s actual returns. You may use the information in this line, together with your account balance, to estimate the expenses that you paid over the period. Simply divide your account value by $1,000 (for example, an $8,600 account value divided by $1,000 = 8.6), then multiply the result by the number in the first line under the heading “Expenses Paid During Period” to estimate the expenses you paid on your account during this period.
HYPOTHETICAL EXAMPLE FOR COMPARISON WITH OTHER MUTUAL FUNDS
Information on the second line of the table can help you compare ongoing costs of investing in the Fund with those of other mutual funds. This information may not be used to estimate the actual ending account balance or expenses you paid during the period. The hypothetical “Ending Account Value” is based on the actual expense ratio of the Fund and an assumed 5% annual rate of return before expenses (not the Fund’s actual return). The amount under the heading “Expenses Paid During Period” shows the hypothetical expenses your account would have incurred under this scenario. You can compare this figure with the 5% hypothetical examples that appear in shareholder reports of other mutual funds.
| | | | | | | | | | | | |
Six Months Ended June 30, 2017 | | Beginning Account Value
1/1/2017 | | | Ending Account Value
6/30/2017 | | | Expenses Paid During Period* | |
Based on Actual Fund Return | | $ | 1,000.00 | | | $ | 1,145.20 | | | $ | 3.39 | |
Based on Hypothetical 5% Yearly Return | | | 1,000.00 | | | | 1,021.63 | | | | 3.19 | |
| * | Expenses are equal to the Fund’s annualized expense ratio of 0.64%, multiplied by the average account value over the period, multiplied by 181/365 (to reflect the one-half year period). |
The expenses shown in the table highlight ongoing costs only and do not reflect any transactional fees or account maintenance fees. Though other mutual funds may charge such fees, please note that the Fund does not charge transaction fees (e.g., redemption fees, sales loads) or universal account maintenance fees (e.g., small account fees).
DODGE & COX INTERNATIONAL STOCK FUND §PAGE 5
| | | | |
| FUND INFORMATION (unaudited) | | | June 30, 2017 | |
| | | | |
| GENERAL INFORMATION | | | |
Net Asset Value Per Share | | | $43.63 | |
Total Net Assets (billions) | | | $61.5 | |
Expense Ratio | | | 0.64% | |
Portfolio Turnover Rate (1/1/17 to 6/30/17, unannualized) | | | 9% | |
30-Day SEC Yield(a) | | | 1.58% | |
Number of Companies | | | 69 | |
Fund Inception | | | 2001 | |
No sales charges or distribution fees | | | | |
Investment Manager: Dodge & Cox, San Francisco. Managed by the International Equity Investment Committee, whose eight members’ average tenure at Dodge & Cox is 23 years.
| | | | | | | | |
| PORTFOLIO CHARACTERISTICS | | Fund | | | MSCI
EAFE | |
Median Market Capitalization (billions) | | | $33 | | | | $10 | |
Weighted Average Market Capitalization (billions) | | | $67 | | | | $56 | |
Price-to-Earnings Ratio(b) | | | 14.3x | | | | 14.6x | |
Countries Represented | | | 25 | | | | 21 | |
Emerging Markets (Brazil, China, India, Mexico, Russia, South Africa, South Korea, Thailand, Turkey, United Arab Emirates) | | | 25.7% | | | | 0.0% | |
| | | | |
| TEN LARGEST HOLDINGS (%)(c) | | Fund | |
Naspers, Ltd. (South Africa) | | | 4.1 | |
Samsung Electronics Co., Ltd. (South Korea) | | | 3.9 | |
Sanofi (France) | | | 3.9 | |
Novartis AG (Switzerland) | | | 3.5 | |
ICICI Bank, Ltd. (India) | | | 2.9 | |
BNP Paribas SA (France) | | | 2.5 | |
Schneider Electric SA (France) | | | 2.5 | |
Liberty Global PLC (United Kingdom) | | | 2.4 | |
Bayer AG (Germany) | | | 2.3 | |
Standard Chartered PLC (United Kingdom) | | | 2.3 | |
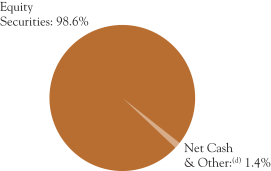
| | | | | | | | |
| REGION DIVERSIFICATION (%)(e) | | Fund | | | MSCI
EAFE | |
Europe (excluding United Kingdom) | | | 43.3 | | | | 46.2 | |
Pacific (excluding Japan) | | | 13.1 | | | | 12.0 | |
United Kingdom | | | 12.3 | | | | 17.7 | |
Japan | | | 11.2 | | | | 23.4 | |
Latin America | | | 6.7 | | | | 0.0 | |
Africa | | | 5.4 | | | | 0.0 | |
United States | | | 3.9 | | | | 0.0 | |
Canada | | | 2.4 | | | | 0.0 | |
Middle East | | | 0.3 | | | | 0.7 | |
| | | | | | | | |
| SECTOR DIVERSIFICATION (%) | | Fund | | | MSCI
EAFE | |
Financials | | | 27.2 | | | | 21.5 | |
Consumer Discretionary | | | 17.1 | | | | 12.1 | |
Health Care | | | 13.9 | | | | 10.8 | |
Information Technology | | | 13.1 | | | | 6.1 | |
Industrials | | | 8.8 | | | | 14.5 | |
Energy | | | 6.5 | | | | 4.7 | |
Materials | | | 5.7 | | | | 7.5 | |
Telecommunication Services | | | 3.4 | | | | 4.3 | |
Utilities | | | 1.1 | | | | 3.4 | |
Consumer Staples | | | 1.0 | | | | 11.5 | |
Real Estate | | | 0.8 | | | | 3.6 | |
| (a) | SEC Yield is an annualization of the Fund’s net investment income for the trailing 30-day period. Dividends paid by the Fund may be higher or lower than implied by the SEC Yield. |
| (b) | Price-to-earnings (P/E) ratios are calculated using 12-month forward earnings estimates from third-party sources. |
| (c) | The Fund’s portfolio holdings are subject to change without notice. The mention of specific securities is not a recommendation to buy, sell, or hold any particular security and is not indicative of Dodge & Cox’s current or future trading activity. |
| (d) | Net Cash & Other includes cash, short-term investments, derivatives, receivables, and payables. |
| (e) | The Fund may classify a company in a different category than the MSCI EAFE. The Fund generally classifies a company based on its country of incorporation, but may designate a different country in certain circumstances. |
PAGE 6 § DODGE & COX INTERNATIONAL STOCK FUND
| | | | |
| CONSOLIDATED PORTFOLIO OF INVESTMENTS (unaudited) | | | June 30, 2017 | |
| | | | | | | | |
| COMMON STOCKS: 93.5% | | | | | | |
| | |
| | | SHARES | | | VALUE | |
| CONSUMER DISCRETIONARY: 17.1% | |
AUTOMOBILES & COMPONENTS: 4.7% | |
Bayerische Motoren Werke AG (Germany) | | | 8,689,200 | | | $ | 806,652,537 | |
Honda Motor Co., Ltd. (Japan) | | | 41,373,755 | | | | 1,127,087,667 | |
Mahindra & Mahindra, Ltd. (India) | | | 7,171,971 | | | | 150,346,482 | |
NGK Spark Plug Co., Ltd. (Japan) | | | 5,104,300 | | | | 108,416,739 | |
Yamaha Motor Co., Ltd.(b) (Japan) | | | 27,863,300 | | | | 717,918,145 | |
| | | | | | | | |
| | | | | | | 2,910,421,570 | |
CONSUMER DURABLES & APPAREL: 1.2% | |
Panasonic Corp. (Japan) | | | 52,932,034 | | | | 717,212,001 | |
|
MEDIA: 9.4% | |
Altice NV, Series A(a) (Netherlands) | | | 29,504,274 | | | | 680,705,591 | |
Grupo Televisa SAB ADR (Mexico) | | | 33,834,317 | | | | 824,542,305 | |
Liberty Global PLC LiLAC, Series A(a)(b) (United Kingdom) | | | 3,917,037 | | | | 85,273,896 | |
Liberty Global PLC LiLAC, Series C(a) (United Kingdom) | | | 5,535,198 | | | | 118,508,589 | |
Liberty Global PLC, Series A(a) (United Kingdom) | | | 18,753,503 | | | | 602,362,516 | |
Liberty Global PLC, Series C(a) (United Kingdom) | | | 26,795,754 | | | | 835,491,610 | |
Naspers, Ltd. (South Africa) | | | 12,795,795 | | | | 2,489,225,934 | |
Television Broadcasts, Ltd.(b) (Hong Kong) | | | 40,022,900 | | | | 150,711,597 | |
| | | | | | | | |
| | | | | | | 5,786,822,038 | |
RETAILING: 1.8% | |
JD.com, Inc. ADR(a) (Cayman Islands/China) | | | 27,923,836 | | | | 1,095,172,848 | |
| | | | | | | | |
| | | | | | | 10,509,628,457 | |
| CONSUMER STAPLES: 1.0% | |
FOOD & STAPLES RETAILING: 0.8% | |
Magnit PJSC (Russia) | | | 3,312,385 | | | | 515,434,627 | |
|
FOOD, BEVERAGE & TOBACCO: 0.2% | |
Anadolu Efes Biracilik ve Malt Sanayii AS (Turkey) | | | 16,438,816 | | | | 102,040,314 | |
| | | | | | | | |
| | | | | | | 617,474,941 | |
| ENERGY: 5.1% | |
Saipem SPA(a)(b) (Italy) | | | 56,980,627 | | | | 210,470,026 | |
Schlumberger, Ltd. (Curacao/United States) | | | 19,480,024 | | | | 1,282,564,780 | |
Statoil ASA (Norway) | | | 33,897,750 | | | | 561,934,254 | |
Suncor Energy, Inc. (Canada) | | | 32,428,400 | | | | 946,909,280 | |
Weatherford International PLC(a) (Ireland) | | | 34,997,592 | | | | 135,440,681 | |
| | | | | | | | |
| | | | | | | 3,137,319,021 | |
| FINANCIALS: 24.9% | | | | | | | | |
BANKS: 18.8% | |
Banco Santander SA (Spain) | | | 146,908,086 | | | | 971,845,593 | |
Barclays PLC (United Kingdom) | | | 487,701,198 | | | | 1,287,880,679 | |
BNP Paribas SA (France) | | | 21,713,358 | | | | 1,563,881,979 | |
ICICI Bank, Ltd.(b) (India) | | | 396,386,744 | | | | 1,778,412,773 | |
Kasikornbank PCL- Foreign(b) (Thailand) | | | 130,329,627 | | | | 765,403,609 | |
Lloyds Banking Group PLC (United Kingdom) | | | 961,015,500 | | | | 827,982,549 | |
Mitsubishi UFJ Financial Group, Inc. (Japan) | | | 84,307,900 | | | | 565,775,532 | |
Societe Generale SA (France) | | | 19,290,009 | | | | 1,037,931,160 | |
Standard Chartered PLC(a) (United Kingdom) | | | 137,228,813 | | | | 1,389,117,687 | |
UniCredit SPA(a) (Italy) | | | 71,653,703 | | | | 1,338,071,782 | |
| | | | | | | | |
| | | | | | | 11,526,303,343 | |
| | | | | | | | |
| | | SHARES | | | VALUE | |
DIVERSIFIED FINANCIALS: 3.7% | |
Credit Suisse Group AG (Switzerland) | | | 67,179,908 | | | $ | 971,022,552 | |
Haci Omer Sabanci Holding AS (Turkey) | | | 47,323,154 | | | | 147,008,504 | |
UBS Group AG (Switzerland) | | | 68,845,427 | | | | 1,165,971,149 | |
| | | | | | | | |
| | | | | | | 2,284,002,205 | |
INSURANCE: 2.4% | |
AEGON NV(b) (Netherlands) | | | 134,654,438 | | | | 687,619,774 | |
Aviva PLC (United Kingdom) | | | 118,509,527 | | | | 811,895,158 | |
| | | | | | | | |
| | | | | | | 1,499,514,932 | |
| | | | | | | | |
| | | | | | | 15,309,820,480 | |
| HEALTH CARE: 13.9% | |
PHARMACEUTICALS, BIOTECHNOLOGY & LIFE SCIENCES: 13.9% | |
AstraZeneca PLC (United Kingdom) | | | 17,773,800 | | | | 1,188,725,774 | |
Bayer AG (Germany) | | | 11,002,550 | | | | 1,422,534,453 | |
Novartis AG (Switzerland) | | | 12,821,770 | | | | 1,067,032,272 | |
Novartis AG ADR (Switzerland) | | | 13,228,500 | | | | 1,104,182,895 | |
Roche Holding AG (Switzerland) | | | 5,293,300 | | | | 1,348,027,803 | |
Sanofi (France) | | | 25,082,822 | | | | 2,399,584,681 | |
| | | | | | | | |
| | | | | | | 8,530,087,878 | |
| INDUSTRIALS: 8.8% | |
CAPITAL GOODS: 8.5% | |
Johnson Controls International PLC (Ireland) | | | 21,556,255 | | | | 934,679,217 | |
Koninklijke Philips NV (Netherlands) | | | 20,106,551 | | | | 714,087,049 | |
Mitsubishi Electric Corp. (Japan) | | | 77,718,800 | | | | 1,116,290,032 | |
Nidec Corp. (Japan) | | | 5,540,700 | | | | 567,001,174 | |
Schneider Electric SA (France) | | | 19,706,046 | | | | 1,514,062,963 | |
Smiths Group PLC (United Kingdom) | | | 19,555,000 | | | | 406,746,364 | |
| | | | | | | | |
| | | | | | | 5,252,866,799 | |
TRANSPORTATION: 0.3% | |
DP World, Ltd. (United Arab Emirates) | | | 8,256,304 | | | | 172,502,171 | |
| | | | | | | | |
| | | | | | | 5,425,368,970 | |
| INFORMATION TECHNOLOGY: 11.7% | |
SOFTWARE & SERVICES: 2.9% | |
58.com, Inc. ADR(a) (Cayman Islands/China) | | | 1,237,610 | | | | 54,590,977 | |
Baidu, Inc. ADR(a) (Cayman Islands/China) | | | 4,920,687 | | | | 880,114,077 | |
Nintendo Co., Ltd. (Japan) | | | 2,536,400 | | | | 849,713,732 | |
| | | | | | | | |
| | | | | | | 1,784,418,786 | |
TECHNOLOGY, HARDWARE & EQUIPMENT: 8.8% | |
Brother Industries, Ltd. (Japan) | | | 10,024,000 | | | | 231,093,416 | |
Hewlett Packard Enterprise Co. (United States) | | | 65,881,184 | | | | 1,092,968,843 | |
Kyocera Corp. (Japan) | | | 15,884,200 | | | | 918,805,114 | |
Samsung Electronics Co., Ltd. (South Korea) | | | 735,692 | | | | 1,528,418,375 | |
TE Connectivity, Ltd. (Switzerland) | | | 10,246,962 | | | | 806,230,970 | |
Telefonaktiebolaget LM Ericsson (Sweden) | | | 115,264,300 | | | | 824,323,012 | |
| | | | | | | | |
| | | | | | | 5,401,839,730 | |
| | | | | | | | |
| | | | | | | 7,186,258,516 | |
| MATERIALS: 5.7% | | | | | | | | |
Agrium, Inc. (Canada) | | | 5,590,326 | | | | 505,868,600 | |
Akzo Nobel NV (Netherlands) | | | 6,565,695 | | | | 570,599,392 | |
Cemex SAB de CV ADR (Mexico) | | | 64,849,008 | | | | 610,877,655 | |
LafargeHolcim, Ltd. (Switzerland) | | | 13,030,483 | | | | 746,035,579 | |
Linde AG (Germany) | | | 5,545,837 | | | | 1,050,206,357 | |
| | | | | | | | |
| | | | | | | 3,483,587,583 | |
| REAL ESTATE: 0.8% | |
Hang Lung Group, Ltd.(b) (Hong Kong) | | | 118,231,200 | | | | 489,131,248 | |
| | |
| See accompanying Notes to Consolidated Financial Statements | | DODGE & COX INTERNATIONAL STOCK FUND §PAGE 7 |
| | | | |
| CONSOLIDATED PORTFOLIO OF INVESTMENTS (unaudited) | | | June 30, 2017 | |
| | | | | | | | |
| COMMON STOCKS (continued) | | | | | | |
| | |
| | | SHARES | | | VALUE | |
| TELECOMMUNICATION SERVICES: 3.4% | |
America Movil SAB de CV, Series L (Mexico) | | | 564,100,600 | | | $ | 452,554,845 | |
Bharti Airtel, Ltd. (India) | | | 49,441,504 | | | | 291,505,042 | |
Millicom International Cellular SA SDR(b) (Luxembourg) | | | 9,232,636 | | | | 545,320,269 | |
MTN Group, Ltd.(b) (South Africa) | | | 94,878,580 | | | | 827,490,616 | |
| | | | | | | | |
| | | | | | | 2,116,870,772 | |
| UTILITIES: 1.1% | |
Engie (France) | | | 43,829,700 | | | | 661,543,918 | |
| | | | | | | | |
| |
TOTAL COMMON STOCKS
(Cost $53,171,284,713) | | | $ | 57,467,091,784 | |
| | |
| PREFERRED STOCKS: 5.1% | | | | | | |
| ENERGY: 1.4% | |
Petroleo Brasileiro SA(a) (Brazil) | | | 235,671,000 | | | | 879,969,293 | |
|
| FINANCIALS: 2.3% | |
BANKS: 2.3% | |
Itau Unibanco Holding SA (Brazil) | | | 125,131,401 | | | | 1,388,082,642 | |
|
| INFORMATION TECHNOLOGY: 1.4% | |
TECHNOLOGY, HARDWARE & EQUIPMENT: 1.4% | |
Samsung Electronics Co., Ltd. (South Korea) | | | 548,216 | | | | 892,171,649 | |
| | | | | | | | |
TOTAL PREFERRED STOCKS
(Cost $3,067,535,066) | | | | | | $ | 3,160,223,584 | |
|
| SHORT-TERM INVESTMENTS: 0.9% | |
| | |
| | | PAR VALUE | | | VALUE | |
MONEY MARKET FUND: 0.1% | | | | | | | | |
State Street Institutional Treasury Plus Money Market Fund | | $ | 61,641,259 | | | $ | 61,641,259 | |
|
REPURCHASE AGREEMENT: 0.8% | |
Fixed Income Clearing Corporation(c) 0.60%, dated 6/30/17, due 7/3/17, maturity value $486,042,301 | | | 486,018,000 | | | | 486,018,000 | |
| | | | | | | | |
TOTAL SHORT-TERM INVESTMENTS
(Cost $547,659,259) | | | | | | $ | 547,659,259 | |
| | | | | | | | |
TOTAL INVESTMENTS
(Cost $56,786,479,038) | | | 99.5 | % | | $ | 61,174,974,627 | |
OTHER ASSETS LESS LIABILITIES | | | 0.5 | % | | | 287,780,356 | |
| | | | | | | | |
| NET ASSETS | | | 100.0 | % | | $ | 61,462,754,983 | |
| | | | | | | | |
| (b) | See Note 9 regarding holdings of 5% voting securities |
| (c) | Repurchase agreement is collateralized by U.S. Treasury Notes 1.625%-1.875%, 9/30/22-11/15/22. Total collateral value is $495,740,454. |
In determining a company’s country designation, the Fund generally references the country of incorporation. In cases where the Fund considers the country of incorporation to be a “jurisdiction of convenience” chosen primarily for tax purposes or in other limited circumstances, the Fund uses the country designation of an appropriate broad-based market index. In those cases, two countries are listed — the country of incorporation and the country designated by an appropriate index, respectively.
ADR: American Depositary Receipt
SDR: Swedish Depository Receipt
FUTURES CONTRACTS
| | | | | | | | | | | | | | | | |
| Description | | Number of
Contracts | | | Expiration
Date | | | Notional
Amount | | | Unrealized
Appreciation/
(Depreciation) | |
Euro Stoxx 50 Index—Long Position | | | 4,647 | | | | Sep 2017 | | | $ | 182,102,709 | | | $ | (7,470,725 | ) |
Yen Denominated Nikkei 225 Index—Long Position | | | 1,358 | | | | Sep 2017 | | | | 121,130,340 | | | | (176,882 | ) |
| | | | | | | | | | | | | | | | |
| | | | | | | | | | | | | | $ | (7,647,607 | ) |
| | | | | | | | | | | | | | | | |
CURRENCY FORWARD CONTRACTS
| | | | | | | | | | | | | | | | |
| | | | | | Contract Amount | | | | |
| Counterparty | | Settle
Date | | | Receive
U.S. Dollar | | | Deliver
Foreign
Currency | | | Unrealized
Appreciation/
(Depreciation) | |
Contracts to sell CHF: | | | | | | | | | | | | | |
Citibank | | | 7/12/17 | | | | 226,783,365 | | | | 227,500,000 | | | $ | (10,571,614 | ) |
Citibank | | | 7/12/17 | | | | 680,940,646 | | | | 682,500,000 | | | | (31,124,290 | ) |
Bank of America | | | 7/26/17 | | | | 75,767,908 | | | | 75,000,000 | | | | (2,549,182 | ) |
Goldman Sachs | | | 7/26/17 | | | | 75,741,127 | | | | 75,000,000 | | | | (2,575,963 | ) |
HSBC | | | 7/26/17 | | | | 75,741,509 | | | | 75,000,000 | | | | (2,575,581 | ) |
HSBC | | | 7/26/17 | | | | 75,704,353 | | | | 75,000,000 | | | | (2,612,737 | ) |
UBS | | | 8/16/17 | | | | 46,577,276 | | | | 46,200,000 | | | | (1,729,220 | ) |
UBS | | | 8/16/17 | | | | 47,354,604 | | | | 46,900,000 | | | | (1,683,809 | ) |
UBS | | | 8/16/17 | | | | 47,282,992 | | | | 46,900,000 | | | | (1,755,421 | ) |
Barclays | | | 9/13/17 | | | | 145,336,766 | | | | 140,000,000 | | | | (1,309,230 | ) |
Contracts to sell CNH: | | | | | | | | | | | | | |
Bank of America | | | 8/2/17 | | | | 245,153,125 | | | | 1,706,510,900 | | | | (6,007,932 | ) |
Bank of America | | | 8/2/17 | | | | 44,381,477 | | | | 309,108,109 | | | | (1,112,472 | ) |
Credit Suisse | | | 8/2/17 | | | | 97,462,589 | | | | 678,680,736 | | | | (2,424,362 | ) |
Credit Suisse | | | 8/2/17 | | | | 103,119,466 | | | | 718,722,055 | | | | (2,660,691 | ) |
Bank of America | | | 8/9/17 | | | | 88,825,943 | | | | 619,116,825 | | | | (2,248,382 | ) |
Credit Suisse | | | 8/9/17 | | | | 88,762,269 | | | | 619,116,825 | | | | (2,312,056 | ) |
Credit Suisse | | | 8/9/17 | | | | 88,781,362 | | | | 619,116,825 | | | | (2,292,964 | ) |
Goldman Sachs | | | 8/9/17 | | | | 88,851,439 | | | | 619,116,825 | | | | (2,222,886 | ) |
Goldman Sachs | | | 8/9/17 | | | | 47,376,607 | | | | 329,978,067 | | | | (1,164,361 | ) |
Goldman Sachs | | | 8/9/17 | | | | 94,822,646 | | | | 659,956,133 | | | | (2,259,289 | ) |
Bank of America | | | 8/16/17 | | | | 34,991,969 | | | | 243,334,152 | | | | (785,326 | ) |
Credit Suisse | | | 8/16/17 | | | | 89,869,786 | | | | 624,487,166 | | | | (1,948,241 | ) |
Credit Suisse | | | 8/16/17 | | | | 44,934,893 | | | | 312,243,583 | | | | (974,120 | ) |
JPMorgan | | | 8/16/17 | | | | 93,960,844 | | | | 653,788,100 | | | | (2,165,284 | ) |
JPMorgan | | | 8/16/17 | | | | 179,640,687 | | | | 1,248,974,333 | | | | (3,995,365 | ) |
JPMorgan | | | 8/16/17 | | | | 89,744,509 | | | | 624,487,166 | | | | (2,073,517 | ) |
Citibank | | | 1/10/18 | | | | 43,446,075 | | | | 307,228,920 | | | | (1,274,388 | ) |
HSBC | | | 1/10/18 | | | | 43,449,147 | | | | 307,228,920 | | | | (1,271,316 | ) |
HSBC | | | 1/10/18 | | | | 86,862,670 | | | | 614,457,840 | | | | (2,578,257 | ) |
JPMorgan | | | 1/10/18 | | | | 43,443,003 | | | | 307,228,920 | | | | (1,277,460 | ) |
JPMorgan | | | 1/10/18 | | | | 43,461,440 | | | | 307,228,920 | | | | (1,259,023 | ) |
JPMorgan | | | 1/10/18 | | | | 43,449,147 | | | | 307,228,920 | | | | (1,271,316 | ) |
JPMorgan | | | 1/10/18 | | | | 43,452,220 | | | | 307,228,920 | | | | (1,268,244 | ) |
JPMorgan | | | 1/10/18 | | | | 43,461,440 | | | | 307,228,920 | | | | (1,259,023 | ) |
JPMorgan | | | 1/10/18 | | | | 43,455,293 | | | | 307,228,920 | | | | (1,265,171 | ) |
Citibank | | | 1/24/18 | | | | 85,079,297 | | | | 601,765,866 | | | | (2,430,890 | ) |
Citibank | | | 1/24/18 | | | | 88,991,029 | | | | 629,923,000 | | | | (2,613,833 | ) |
Citibank | | | 1/24/18 | | | | 85,127,439 | | | | 601,765,867 | | | | (2,382,748 | ) |
JPMorgan | | | 1/24/18 | | | | 44,495,515 | | | | 314,961,500 | | | | (1,306,917 | ) |
JPMorgan | | | 1/24/18 | | | | 44,495,515 | | | | 314,961,500 | | | | (1,306,917 | ) |
JPMorgan | | | 1/24/18 | | | | 85,055,246 | | | | 601,765,867 | | | | (2,454,940 | ) |
Citibank | | | 1/31/18 | | | | 102,920,012 | | | | 728,837,636 | | | | (3,018,881 | ) |
JPMorgan | | | 1/31/18 | | | | 376,020,262 | | | | 2,657,523,200 | | | | (10,259,275 | ) |
JPMorgan | | | 1/31/18 | | | | 145,333,865 | | | | 1,027,830,164 | | | | (4,064,552 | ) |
JPMorgan | | | 1/31/18 | | | | 98,291,639 | | | | 695,364,200 | | | | (2,781,782 | ) |
Citibank | | | 2/7/18 | | | | 76,674,965 | | | | 542,168,675 | | | | (2,093,564 | ) |
Citibank | | | 2/7/18 | | | | 76,664,123 | | | | 542,168,675 | | | | (2,104,406 | ) |
| | |
| PAGE 8 § DODGE & COX INTERNATIONAL STOCK FUND | | See accompanying Notes to Consolidated Financial Statements |
| | | | |
| CONSOLIDATED PORTFOLIO OF INVESTMENTS (unaudited) | | | June 30, 2017 | |
CURRENCY FORWARD CONTRACTS (continued)
| | | | | | | | | | | | | | | | |
| | | | | | Contract Amount | | | | |
| Counterparty | | Settle
Date | | | Receive
U.S. Dollar | | | Deliver
Foreign
Currency | | | Unrealized
Appreciation/
(Depreciation) | |
Citibank | | | 2/7/18 | | | | 31,943,386 | | | | 225,903,625 | | | $ | (876,836 | ) |
Citibank | | | 2/7/18 | | | | 32,043,067 | | | | 225,903,625 | | | | (777,154 | ) |
Citibank | | | 2/7/18 | | | | 76,859,750 | | | | 542,168,675 | | | | (1,908,779 | ) |
Citibank | | | 2/7/18 | | | | 32,024,897 | | | | 225,903,625 | | | | (795,325 | ) |
Citibank | | | 2/7/18 | | | | 31,947,903 | | | | 225,903,625 | | | | (872,318 | ) |
Citibank | | | 2/7/18 | | | | 76,903,358 | | | | 542,168,675 | | | | (1,865,171 | ) |
Bank of America | | | 5/16/18 | | | | 47,078,342 | | | | 332,792,093 | | | | (955,812 | ) |
Bank of America | | | 5/16/18 | | | | 47,057,706 | | | | 332,792,094 | | | | (976,448 | ) |
Goldman Sachs | | | 5/16/18 | | | | 47,262,899 | | | | 334,120,337 | | | | (962,970 | ) |
Goldman Sachs | | | 5/16/18 | | | | 47,067,286 | | | | 332,742,176 | | | | (959,663 | ) |
Goldman Sachs | | | 5/16/18 | | | | 47,266,893 | | | | 334,153,300 | | | | (963,733 | ) |
Goldman Sachs | | | 5/16/18 | | | | 47,150,332 | | | | 333,400,000 | | | | (971,565 | ) |
Bank of America | | | 6/13/18 | | | | 28,571,429 | | | | 200,000,000 | | | | (243,274 | ) |
Bank of America | | | 6/13/18 | | | | 28,577,552 | | | | 200,000,000 | | | | (237,150 | ) |
Contracts to sell EUR: | | | | | | | | | | | | | |
UBS | | | 8/16/17 | | | | 503,410,853 | | | | 456,500,000 | | | | (19,103,523 | ) |
UBS | | | 8/16/17 | | | | 103,089,547 | | | | 93,500,000 | | | | (3,931,470 | ) |
Goldman Sachs | | | 9/13/17 | | | | 84,796,500 | | | | 75,000,000 | | | | (1,176,078 | ) |
Goldman Sachs | | | 9/13/17 | | | | 42,398,250 | | | | 37,500,000 | | | | (588,039 | ) |
Goldman Sachs | | | 9/13/17 | | | | 84,796,500 | | | | 75,000,000 | | | | (1,176,078 | ) |
Goldman Sachs | | | 9/13/17 | | | | 42,398,250 | | | | 37,500,000 | | | | (588,039 | ) |
Goldman Sachs | | | 9/13/17 | | | | 42,405,750 | | | | 37,500,000 | | | | (580,539 | ) |
Goldman Sachs | | | 9/13/17 | | | | 84,811,500 | | | | 75,000,000 | | | | (1,161,078 | ) |
Goldman Sachs | | | 9/13/17 | | | | 42,405,750 | | | | 37,500,000 | | | | (580,539 | ) |
Goldman Sachs | | | 9/13/17 | | | | 84,811,500 | | | | 75,000,000 | | | | (1,161,078 | ) |
Goldman Sachs | | | 9/13/17 | | | | 42,405,750 | | | | 37,500,000 | | | | (580,539 | ) |
Goldman Sachs | | | 9/13/17 | | | | 42,405,750 | | | | 37,500,000 | | | | (580,539 | ) |
Goldman Sachs | | | 9/13/17 | | | | 84,811,500 | | | | 75,000,000 | | | | (1,161,078 | ) |
Goldman Sachs | | | 9/13/17 | | | | 84,811,500 | | | | 75,000,000 | | | | (1,161,078 | ) |
Goldman Sachs | | | 9/13/17 | | | | 42,409,688 | | | | 37,500,000 | | | | (576,601 | ) |
Goldman Sachs | | | 9/13/17 | | | | 84,796,875 | | | | 75,000,000 | | | | (1,175,703 | ) |
Goldman Sachs | | | 9/13/17 | | | | 42,398,438 | | | | 37,500,000 | | | | (587,851 | ) |
Goldman Sachs | | | 9/13/17 | | | | 84,819,375 | | | | 75,000,000 | | | | (1,153,203 | ) |
| | | | | | | | | | | | | | | | |
| | | | | | | | | | | | | | $ | (195,066,449 | ) |
| | | | | | | | | | | | | | | | |
| | |
| See accompanying Notes to Consolidated Financial Statements | | DODGE & COX INTERNATIONAL STOCK FUND §PAGE 9 |
| | | | |
CONSOLIDATED STATEMENT OF ASSETS AND LIABILITIES (unaudited) | |
| |
| | | June 30, 2017 | |
ASSETS: | |
Investments, at value | |
Unaffiliated issuers (cost $49,096,380,220) | | $ | 54,917,222,674 | |
Affiliated issuers (cost $7,690,098,818) | | | 6,257,751,953 | |
| | | | |
| | | 61,174,974,627 | |
Cash | | | 100 | |
Cash denominated in foreign currency (cost $14,758,885) | | | 14,805,145 | |
Cash held at broker | | | 18,059,265 | |
Collateral receivable on currency forward contracts | | | 73,680,000 | |
Receivable for investments sold | | | 215,920,333 | |
Receivable for Fund shares sold | | | 130,307,916 | |
Dividends and interest receivable | | | 147,508,453 | |
Prepaid expenses and other assets | | | 103,307 | |
| | | | |
| | | 61,775,359,146 | |
| | | | |
LIABILITIES: | |
Unrealized depreciation on currency forward contracts | | | 195,066,449 | |
Payable for investments purchased | | | 54,987,860 | |
Payable to broker for variation margin | | | 899,580 | |
Payable for Fund shares redeemed | | | 27,752,075 | |
Management fees payable | | | 30,310,929 | |
Accrued expenses | | | 3,587,270 | |
| | | | |
| | | 312,604,163 | |
| | | | |
NET ASSETS | | $ | 61,462,754,983 | |
| | | | |
NET ASSETS CONSIST OF: | |
Paid in capital | | $ | 58,765,647,537 | |
Undistributed net investment income | | | 755,782,216 | |
Accumulated net realized loss | | | (2,245,903,243 | ) |
Net unrealized appreciation | | | 4,187,228,473 | |
| | | | |
| | $ | 61,462,754,983 | |
| | | | |
Fund shares outstanding (par value $0.01 each, unlimited shares authorized) | | | 1,408,708,941 | |
Net asset value per share | | $ | 43.63 | |
|
CONSOLIDATED STATEMENT OF OPERATIONS (unaudited) | |
| |
| | | Six Months Ended
June 30, 2017 | |
INVESTMENT INCOME: | |
Dividends (net of foreign taxes of $100,038,165) | |
Unaffiliated issuers | | $ | 861,507,579 | |
Affiliated issuers | | | 112,583,890 | |
Interest | | | 1,257,786 | |
| | | | |
| | | 975,349,255 | |
| | | | |
EXPENSES: | |
Management fees | | | 175,017,306 | |
Custody and fund accounting fees | | | 3,811,981 | |
Transfer agent fees | | | 4,507,232 | |
Professional services | | | 174,681 | |
Shareholder reports | | | 950,894 | |
Registration fees | | | 186,232 | |
Trustees’ fees | | | 130,000 | |
ADR depository services fees | | | 468,203 | |
Miscellaneous | | | 406,451 | |
| | | | |
| | | 185,652,980 | |
| | | | |
NET INVESTMENT INCOME | | | 789,696,275 | |
| | | | |
REALIZED AND UNREALIZED GAIN (LOSS): | |
Net realized gain (loss) | |
Investments in unaffiliated issuers | | | (1,214,687,527 | ) |
Investments in affiliated issuers | | | (98,537,977 | ) |
Futures contracts | | | 23,429,753 | |
Currency forward contracts | | | 95,265,211 | |
Foreign currency transactions | | | 5,038,882 | |
Net change in unrealized appreciation/depreciation | |
Investments | | | 8,746,752,185 | |
Futures contracts | | | (7,647,607 | ) |
Currency forward contracts | | | (515,193,740 | ) |
Foreign currency translation | | | 3,516,859 | |
| | | | |
Net realized and unrealized gain | | | 7,037,936,039 | |
| | | | |
NET CHANGE IN NET ASSETS FROM OPERATIONS | | $ | 7,827,632,314 | |
| | | | |
| | | | | | | | |
CONSOLIDATED STATEMENT OF CHANGES IN NET ASSETS (unaudited) | |
| | |
| | | Six Months Ended
June 30, 2017 | | | Year Ended
December 31, 2016 | |
OPERATIONS: | | | | | |
Net investment income | | $ | 789,696,275 | | | $ | 1,135,439,749 | |
Net realized loss | | | (1,189,491,658 | ) | | | 1,535,688,728 | |
Net change in unrealized appreciation/depreciation | | | 8,227,427,697 | | | | 1,535,796,846 | |
| | | | | | | | |
| | | 7,827,632,314 | | | | 4,206,925,323 | |
| | | | | | | | |
| | |
DISTRIBUTIONS TO SHAREHOLDERS FROM: | | | | | | | | |
Net investment income | | | — | | | | (1,185,247,471 | ) |
Net realized gain | | | — | | | | (757,672,431 | ) |
| | | | | | | | |
Total distributions | | | — | | | | (1,942,919,902 | ) |
| | | | | | | | |
| |
FUND SHARE TRANSACTIONS: | | | | | |
Proceeds from sale of shares | | | 4,322,176,086 | | | | 6,854,611,384 | |
Reinvestment of distributions | | | — | | | | 1,655,896,889 | |
Cost of shares redeemed | | | (4,873,702,461 | ) | | | (13,616,468,513 | ) |
| | | | | | | | |
Net change from Fund share transactions | | | (551,526,375 | ) | | | (5,105,960,240 | ) |
| | | | | | | | |
Total change in net assets | | | 7,276,105,939 | | | | (2,841,954,819 | ) |
| |
NET ASSETS: | | | | | |
Beginning of period | | | 54,186,649,044 | | | | 57,028,603,863 | |
| | | | | | | | |
End of period (including undistributed net investment income of $755,782,216 and distributions in excess of net investment income of $(33,914,061), respectively) | | $ | 61,462,754,983 | | | $ | 54,186,649,044 | |
| | | | | | | | |
| |
SHARE INFORMATION: | | | | | |
Shares sold | | | 103,312,216 | | | | 194,723,459 | |
Distributions reinvested | | | — | | | | 43,438,957 | |
Shares redeemed | | | (116,855,769 | ) | | | (379,146,976 | ) |
| | | | | | | | |
Net change in shares outstanding | | | (13,543,553 | ) | | | (140,984,560 | ) |
| | | | | | | | |
| | |
| PAGE 10 § DODGE & COX INTERNATIONAL STOCK FUND | | See accompanying Notes to Consolidated Financial Statements |
NOTES TO CONSOLIDATED FINANCIAL STATEMENTS (unaudited)
NOTE 1—ORGANIZATION AND SIGNIFICANT ACCOUNTING POLICIES
Dodge & Cox International Stock Fund (the “Fund”) is one of the series constituting the Dodge & Cox Funds (the “Trust” or the “Funds”). The Trust is organized as a Delaware statutory trust and is registered under the Investment Company Act of 1940, as amended, as an open-end management investment company. On January 16th, 2015, the Fund closed to new investors. The Fund commenced operations on May 1, 2001, and seeks long-term growth of principal and income. The Fund invests primarily in a diversified portfolio of foreign equity securities. Foreign investing, especially in developing countries, has special risks such as currency and market volatility and political and social instability. These and other risk considerations are discussed in the Fund’s Prospectus.
The financial statements have been prepared in conformity with accounting principles generally accepted in the United States of America, which require the use of estimates and assumptions by management. Actual results may differ from those estimates. Significant accounting policies are as follows:
Security valuation The Fund’s net assets are normally valued as of the scheduled close of trading on the New York Stock Exchange (NYSE), generally 4:00 p.m. Eastern Time, each day that the NYSE is open for business.
Portfolio holdings for which market quotes are readily available are valued at market value. Listed securities for example, are generally valued using the official quoted close price or the last sale on the exchange that is determined to be the primary market for the security. Exchange-traded derivatives are valued at the settlement price determined by the relevant exchange. Short-term securities less than 60 days to maturity may be valued at amortized cost if amortized cost approximates current value. Security values are not discounted based on the size of the Fund’s position and may differ from the value a Fund receives upon sale of the securities. Mutual funds are valued at their respective net asset values.
Investments initially valued in currencies other than the U.S. dollar are converted to the U.S. dollar using prevailing exchange rates. Forward currency contracts are valued based on the prevailing forward exchange rates of the underlying currencies. As a result, the Fund’s net assets may be affected by changes in the value of currencies in relation to the U.S. dollar.
If market quotations are not readily available or if normal valuation procedures produce valuations that are deemed unreliable or inappropriate under the circumstances existing at the time, the investment will be valued at fair value as determined in good faith by or under the direction of the Fund’s Board of Trustees. The Board of Trustees has appointed Dodge & Cox, the Fund’s investment manager, to make fair value determinations in accordance with the Dodge & Cox Funds Valuation Policies (“Valuation Policies”), subject to Board oversight. Dodge & Cox has established a Pricing Committee that is comprised of representatives from Treasury, Legal, Compliance, and Operations. The Pricing Committee is responsible for implementing the Valuation Policies, including determining the fair value of
securities and other investments when necessary. The Pricing Committee considers relevant indications of value that are reasonably available to it in determining the fair value assigned to a particular security, such as the value of similar financial instruments, trading volumes, contractual restrictions on disposition, related corporate actions, and changes in economic conditions. In doing so, the Pricing Committee employs various methods for calibrating fair valuation approaches, including a regular review of key inputs and assumptions, back-testing, and review of any related market activity.
As trading in securities on most foreign exchanges is normally completed before the close of the NYSE, the value of non-U.S. securities can change by the time the Fund calculates its NAV. To address these changes, the Fund may utilize adjustment factors provided by an independent pricing service to systematically value non-U.S. securities at fair value. These adjustment factors are based on statistical analyses of subsequent movements and changes in U.S. markets and financial instruments trading in U.S. markets that represent foreign securities or baskets of securities.
Valuing securities through a fair value determination involves greater reliance on judgment than valuation of securities based on readily available market quotations. In some instances, lack of information and uncertainty as to the significance of information may lead to a conclusion that a prior valuation is the best indication of a security’s value. When fair value pricing is employed, the prices of securities used by the Fund to calculate its NAV may differ from quoted or published prices for the same securities.
Security transactions, investment income, expenses, and distributions Security transactions are recorded on the trade date. Realized gains and losses on securities sold are determined on the basis of identified cost.
Dividend income and corporate action transactions are recorded on the ex-dividend date, or when the Fund first learns of the dividend/corporate action if the ex-dividend date has passed. Non-cash dividends included in dividend income, if any, are recorded at the fair market value of the securities received. Dividends characterized as return of capital for U.S. tax purposes are recorded as a reduction of cost of investments and/or realized gain. Interest income is recorded on the accrual basis.
Expenses are recorded on the accrual basis. Some expenses of the Trust can be directly attributed to a specific series. Expenses which cannot be directly attributed are allocated among the Funds in the Trust methodologies determined by the nature of the expense.
Distributions to shareholders are recorded on the ex-dividend date.
Foreign taxes The Fund is subject to foreign taxes which may be imposed by certain countries in which the Fund invests. The Fund endeavors to record foreign taxes based on applicable foreign tax law. Withholding taxes are incurred on certain foreign dividends and are accrued at the time the associated dividend is recorded. The Fund files withholding tax reclaims in certain jurisdictions to recover a portion of amounts previously withheld. The Fund records a reclaim receivable based on, among other things, a jurisdiction’s legal
DODGE & COX INTERNATIONAL STOCK FUND §PAGE 11
NOTES TO CONSOLIDATED FINANCIAL STATEMENTS (unaudited)
obligation to pay reclaims as well as payment history and market convention. In consideration of recent decisions rendered by European courts, the Fund has filed for additional reclaims related to prior years. A corresponding receivable is established when both the amount is known and significant contingencies or uncertainties regarding collectability are removed. These amounts, if any, are reported in “dividends and interest receivable” on the Consolidated Statement of Assets and Liabilities.
Capital gains taxes are incurred upon disposition of certain foreign securities. Expected capital gains taxes on appreciated securities are accrued as unrealized losses and incurred capital gains taxes are reflected as realized losses upon the sale of the related security. Currency taxes may be incurred when the Fund purchases certain foreign currencies related to securities transactions and are recorded as realized losses on foreign currency transactions.
Repurchase agreements Repurchase agreements are transactions under which a Fund purchases a security from a dealer counterparty and agrees to resell the security to that counterparty on a specified future date at the same price, plus a specified interest rate. The Fund’s repurchase agreements are secured by U.S. government or agency securities. It is the Fund’s policy that its custodian take possession of the underlying collateral securities, the fair value of which exceeds the principal amount of the repurchase transaction, including accrued interest, at all times. In the event of default by the counterparty, the Fund has the contractual right to liquidate the collateral securities and to apply the proceeds in satisfaction of the obligation.
Futures Contracts Futures contracts involve an obligation to purchase or sell (depending on whether the Fund has entered a long or short futures contract, respectively) an asset at a future date, at a price set at the time of the contract. Upon entering into a futures contract, the Fund is required to deposit an amount of cash or liquid assets (referred to as initial margin) in a segregated account with the clearing broker. Subsequent payments (referred to as variation margin) to and from the clearing broker are made on a daily basis based on changes in the market value of futures contracts. Futures contracts are traded publicly and their market value changes daily. Changes in the market value of open futures contracts are recorded as unrealized appreciation or depreciation in the Consolidated Statement of Operations. Realized gains and losses on futures contracts are recorded in the Consolidated Statement of Operations at the closing or expiration of the contracts. Cash deposited with a broker as initial margin is recorded on the Consolidated Statement of Assets and Liabilities. A receivable and/or payable to brokers for daily variation margin are also recorded on the Consolidated Statement of Assets and Liabilities. Investments in futures contracts may include certain risks, which may be different from, and potentially greater than, those of the underlying securities. To the extent the Fund uses futures, it is exposed to additional volatility and potential losses resulting from leverage.
The Fund entered into long Euro Stoxx 50 futures contracts and long Yen Denominated Nikkei futures contracts to provide
equity exposure that approximates the Fund’s “net cash and other” position, which includes cash, short-term investments, receivables, and payables. During the six months ended June 30, 2017, these futures contracts had notional values ranging from 0% to 1% of net assets.
Currency forward contracts A currency forward contract represents an obligation to purchase or sell a specific foreign currency at a future date at a price set at the time of the contract. The values of the currency forward contracts are adjusted daily based on the prevailing forward exchange rates of the underlying currencies. Changes in the value of open contracts are recorded as unrealized appreciation or depreciation in the Consolidated Statement of Operations. When the currency forward contract is closed, the Fund records a realized gain or loss in the Consolidated Statement of Operations equal to the difference between the value at the time the contract was opened and the value at the time it was closed. Losses from these transactions may arise from unfavorable changes in currency values or if the counterparties do not perform under a contract’s terms.
The Fund has maintained currency forward contracts to hedge direct and/or indirect foreign currency exposure to the Chinese yuan renminbi, euro, and Swiss franc. During the six months ended June 30, 2017, these currency forward contracts had U.S. dollar total values ranging from 11% to 13% of net assets.
Foreign currency translation The books and records of the Fund are maintained in U.S. dollars. Foreign currency amounts are translated into U.S. dollars at the prevailing exchange rates of such currencies against the U.S. dollar. The market value of investment securities and other assets and liabilities are translated at the exchange rate as of the valuation date. Purchases and sales of investment securities, income, and expenses are translated at the exchange rate prevailing on the transaction date.
Reported realized and unrealized gain (loss) on investments include foreign currency gain (loss) related to investment transactions.
Reported realized and unrealized gain (loss) on foreign currency transactions and translation include the following: disposing/holding of foreign currency, the difference between the trade and settlement dates on securities transactions, the difference between the accrual and payment dates on dividends, and currency losses on the purchase of foreign currency in certain countries that impose taxes on such transactions.
Consolidation The Fund may invest in certain securities through its wholly owned subsidiary, Dodge & Cox International Stock Fund Cayman, Ltd. (the “Subsidiary”). The Subsidiary is a Cayman Islands exempted company and invests in certain securities consistent with the investment objective of the Fund. The Fund’s Consolidated Financial Statements, including the Consolidated Portfolio of Investments, consist of the holdings and accounts of the Fund and the Subsidiary. All intercompany transactions and balances have been eliminated. At June 30, 2017, the Subsidiary had net assets of $100, which represented less than 0.01% of the Fund’s consolidated net assets.
PAGE 12 § DODGE & COX INTERNATIONAL STOCK FUND
NOTES TO CONSOLIDATED FINANCIAL STATEMENTS (unaudited)
Indemnification Under the Trust’s organizational documents, its officers and trustees are indemnified against certain liabilities arising out of the performance of their duties to the Trust. In addition, in the normal course of business the Trust enters into contracts that provide general indemnities to other parties. The Trust’s maximum exposure under these arrangements is unknown as this would involve future claims that may be made against the Trust that have not yet occurred.
NOTE 2—VALUATION MEASUREMENTS
Various inputs are used in determining the value of the Fund’s investments and other financial instruments. These inputs are summarized in the three broad levels listed below.
| § | | Level 1: Quoted prices in active markets for identical securities |
| § | | Level 2: Other significant observable inputs (including quoted prices for similar securities, market indices, interest rates, credit risk, forward exchange rates, etc.) |
| § | | Level 3: Significant unobservable inputs (including Fund management’s assumptions in determining the fair value of investments) |
The inputs or methodology used for valuing securities are not necessarily an indication of the risk associated with investing in those securities.
The following is a summary of the inputs used to value the Fund’s holdings at June 30, 2017:
| | | | | | | | |
| Classification(a) | | LEVEL 1
(Quoted Prices) | | | LEVEL 2
(Other Significant
Observable Inputs) | |
Securities | | | | | | | | |
Common Stocks | | | | | | | | |
Consumer Discretionary | | $ | 10,509,628,457 | | | $ | — | |
Consumer Staples | | | 617,474,941 | | | | — | |
Energy | | | 3,137,319,021 | | | | — | |
Financials | | | 15,309,820,480 | | | | — | |
Health Care | | | 8,530,087,878 | | | | — | |
Industrials | | | 5,252,866,799 | | | | 172,502,171 | |
Information Technology | | | 7,186,258,516 | | | | — | |
Real Estate | | | 489,131,248 | | | | — | |
Materials | | | 3,483,587,583 | | | | — | |
Telecommunication Services | | | 2,116,870,772 | | | | — | |
Utilities | | | 661,543,918 | | | | — | |
Preferred Stocks | | | | | | | | |
Energy | | | 879,969,293 | | | | — | |
Financials | | | 1,388,082,642 | | | | — | |
Information Technology | | | 892,171,649 | | | | — | |
Short-term Investments | | | | | | | | |
Money Market Fund | | | 61,641,259 | | | | — | |
Repurchase Agreement | | | — | | | | 486,018,000 | |
| | | | | | | | |
Total Securities | | $ | 60,516,454,456 | | | $ | 658,520,171 | |
| | | | | | | | |
Other Financial Instruments | | | | | | | | |
Futures Contracts | | | | | | | | |
Depreciation | | $ | (7,647,607 | ) | | $ | — | |
Currency Forward Contracts | | | | | | | | |
Depreciation | | | — | | | | (195,066,449 | ) |
| | | | | | | | | |
| (a) | Transfers during the period between Level 1 and Level 2 relate to the use of systematic fair valuation or when significant observable inputs are used to fair value a specific security. On days when systematic fair valuation is used, securities whose primary market closes before the NYSE are classified as Level 2. There were no Level 3 securities at June 30, 2017 and December 31, 2016, and there were no transfers to Level 3 during the period. |
NOTE 3—RELATED PARTY TRANSACTIONS
Management fees Under a written agreement approved by a unanimous vote of the Board of Trustees, the Fund pays an annual management fee of 0.60% of the Fund’s average daily net assets to Dodge & Cox, investment manager of the Fund.
Fund officers and trustees All officers and two of the trustees of the Trust are officers or employees of Dodge & Cox. The Trust pays a fee only to those trustees who are not affiliated with Dodge & Cox.
NOTE 4—INCOME TAX INFORMATION AND DISTRIBUTIONS TO SHAREHOLDERS
A provision for federal income taxes is not required since the Fund intends to continue to qualify as a regulated investment company under Subchapter M of the Internal Revenue Code and distribute all of its taxable income to shareholders. Distributions are determined in accordance with income tax regulations, and such amounts may differ from net investment income and realized gains for financial reporting purposes. Financial reporting records are adjusted for permanent book to tax differences at year end to reflect tax character.
Book to tax differences are primarily due to differing treatments of wash sales, net short-term realized gain (loss), futures contracts, investments in passive foreign investment companies, and foreign currency realized gain (loss). At June 30, 2017, the cost of investments for federal income tax purposes was $56,858,435,323.
Distributions during the periods noted below were characterized as follows for federal income tax purposes.
| | | | | | | | |
| | | Six Months Ended
June 30, 2017 | | | Year Ended
December 31, 2016 | |
Ordinary income | | | — | | | $ | 1,186,114,668 | |
| | | | | | ($ | 0.852 per share | ) |
Long-term capital gain | | | — | | | $ | 756,805,234 | |
| | | | | | ($ | 0.543 per share | ) |
At June 30, 2017, the tax basis components of distributable earnings were as follows:
| | | | |
Unrealized appreciation | | $ | 11,012,115,264 | |
Unrealized depreciation | | | (6,695,575,960 | ) |
| | | | |
Net unrealized appreciation | | | 4,316,539,304 | |
Undistributed ordinary income | | | 812,443,224 | |
Accumulated capital loss(a) | | | (1,776,605,681 | ) |
Deferred loss(b) | | | (656,716,341 | ) |
| | | | | |
| (a) | Represents capital loss realized for tax purposes during the period from January 1, 2017 to June 30, 2017 |
| (b) | Represents capital loss incurred between November 1, 2016 and December 31, 2016. As permitted by tax regulation, the Fund has elected to treat this loss as arising in 2017. |
Fund management has reviewed the tax positions for open periods (three years and four years, respectively, from filing the Fund’s Federal and State tax returns) as applicable to the Fund, and has determined that no provision for income tax is required in the Fund’s financial statements.
DODGE & COX INTERNATIONAL STOCK FUND §PAGE 13
NOTES TO CONSOLIDATED FINANCIAL STATEMENTS (unaudited)
NOTE 5—LOAN FACILITIES
Pursuant to an exemptive order issued by the Securities and Exchange Commission (SEC), the Fund may participate in an interfund lending facility (Facility). The Facility allows the Fund to borrow money from or loan money to the Funds. Loans under the Facility are made for temporary or emergency purposes, such as to fund shareholder redemption requests. Interest on borrowings is the average of the current repurchase agreement rate and the bank loan rate. There was no activity in the Facility during the period.
All Funds in the Trust participate in a $500 million committed credit facility (Line of Credit) with State Street Bank and Trust Company, to be utilized for temporary or emergency purposes to fund shareholder redemptions or for other short-term liquidity purposes. The maximum amount available to the Fund is $250 million. Each Fund pays an annual commitment fee on its pro-rata portion of the Line of Credit. For the six months ended June 30, 2017, the Fund’s commitment fee amounted to $182,187 and is reflected as a Miscellaneous Expense in the Consolidated Statement of Operations. Interest on borrowings is charged at the prevailing rate. There were no borrowings on the Line of Credit during the period.
NOTE 6—PURCHASES AND SALES OF INVESTMENTS
For the six months ended June 30, 2017, purchases and sales of securities, other than short-term securities, aggregated $5,200,221,664 and $5,300,228,328, respectively.
NOTE 7—NEW ACCOUNTING GUIDANCE
In October 2016, the SEC issued a new rule, Investment Company Reporting Modernization, which, among other provisions, amends Regulation S-X to require standardized, enhanced disclosures, particularly related to derivatives, in investment company financial statements. Compliance with the guidance is required for financial statements for fiscal periods ending on or after August 1, 2017. Management is currently assessing the impact of this rule to the Fund’s financial statements and other filings and does not expect any impact to the Fund’s net assets or results of operations.
NOTE 8—SUBSEQUENT EVENTS
Fund management has determined that no material events or transactions occurred subsequent to June 30, 2017, and through the date of the Fund’s financial statements issuance, which require additional disclosure in the Fund’s financial statements.
PAGE 14 § DODGE & COX INTERNATIONAL STOCK FUND
NOTES TO CONSOLIDATED FINANCIAL STATEMENTS (unaudited)
NOTE 9—HOLDINGS OF 5% VOTING SECURITIES
Each of the companies listed below was considered to be an affiliate of the Fund because the Fund owned 5% or more of the company’s voting securities during all or part of the six months ended June 30, 2017. Purchase and sale transactions and dividend income earned during the period on these securities were as follows:
| | | | | | | | | | | | | | | | | | | | | | | | |
| | | Shares at
Beginning of Period | | | Additions | | | Reductions | | | Shares at
End of Period | | | Dividend
Income(a) | | | Value at
End of Period | |
AEGON NV (Netherlands) | | | 134,654,439 | | | | 3,847,269 | | | | (3,847,270 | ) | | | 134,654,438 | | | $ | 19,657,317 | | | $ | 687,619,774 | |
Hang Lung Group, Ltd. (Hong Kong) | | | 121,585,500 | | | | — | | | | (3,354,300 | ) | | | 118,231,200 | | | | 9,268,566 | | | | 489,131,248 | |
ICICI Bank, Ltd. (India) | | | 364,368,485 | | | | 36,035,159 | | | | (4,016,900 | ) | | | 396,386,744 | | | | 13,974,428 | | | | 1,778,412,773 | |
Kasikornbank PCL- Foreign (Thailand) | | | 119,975,027 | | | | 10,354,600 | | | | — | | | | 130,329,627 | | | | 11,090,124 | | | | 765,403,609 | |
Liberty Global PLC LiLAC, Series A (United Kingdom) | | | 3,896,557 | | | | 20,480 | | | | — | | | | 3,917,037 | | | | — | (b) | | | 85,273,896 | |
Millicom International Cellular SA SDR (Luxembourg) | | | 9,603,136 | | | | — | | | | (370,500 | ) | | | 9,232,636 | | | | 21,192,669 | | | | 545,320,269 | |
MTN Group, Ltd. (South Africa) | | | 88,829,080 | | | | 6,049,500 | | | | — | | | | 94,878,580 | | | | 27,051,850 | | | | 827,490,616 | |
Saipem SPA (Italy) | | | 56,980,627 | (c) | | | — | | | | — | | | | 56,980,627 | | | | — | (b) | | | 210,470,026 | |
Television Broadcasts, Ltd. (Hong Kong) | | | 40,022,900 | | | | — | | | | — | | | | 40,022,900 | | | | 3,080,897 | | | | 150,711,597 | |
Yamaha Motor Co., Ltd. (Japan) | | | 30,076,100 | | | | — | | | | (2,212,800 | ) | | | 27,863,300 | | | | 7,268,039 | | | | 717,918,145 | |
| | | | | | | | | | | | | | | | | | | | | | | | |
| | | | | | | | | | | | | | | | | | $ | 112,583,890 | | | $ | 6,257,751,953 | |
| | | | | | | | | | | | | | | | | | | | | | | | |
| | | | | | | | | | | | | | | | | | | | | | | | | |
| (a) | Net of foreign taxes, if any |
| (c) | Shares adjusted for reverse stock split on May 22, 2017 |
DODGE & COX INTERNATIONAL STOCK FUND §PAGE 15
NOTES TO CONSOLIDATED FINANCIAL STATEMENTS (unaudited)
NOTE 10—ADDITIONAL DERIVATIVES INFORMATION
The Fund has entered into over-the-counter derivatives, such as currency forward contracts (each, a “Derivative”). Each Derivative is subject to a negotiated master agreement (based on a form published by the International Swaps and Derivatives Association (“ISDA”)) governing all Derivatives between the Fund and the relevant dealer counterparty. The master agreements specify (i) events of default and other events permitting a party to terminate some or all of the Derivatives thereunder and (ii) the process by which those Derivatives will be valued for purposes of determining termination payments. If some or all of the Derivatives under a master agreement are terminated because of an event of default or similar event, the values of all terminated Derivatives must be netted to determine a single payment owed by one party to the other. Some master agreements contain collateral terms requiring the parties to post collateral in respect of some or all of the Derivatives thereunder based on the net market value of those Derivatives, subject to a minimum exposure threshold. To the extent amounts owed to the Fund by its counterparties are not collateralized, the Fund is at risk of those counterparties’ non-performance. The Fund attempts to mitigate counterparty credit risk by entering into Derivatives only with counterparties it believes to be of good credit quality and by monitoring the financial stability of those counterparties.
For financial reporting purposes, the Fund does not offset financial assets and liabilities that are subject to a master netting arrangement in the Consolidated Statement of Assets and Liabilities. Derivatives are presented on the Consolidated Statement of Assets and Liabilities as unrealized appreciation/depreciation on currency forward contracts. Cash collateral pledged or received by the Fund for derivatives are reported gross on the Consolidated Statement of Assets and Liabilities as collateral receivable/payable on currency forward contracts. Derivative information by counterparty is presented in the Consolidated Portfolio of Investments.
The netting of assets and liabilities and the offsetting of collateral pledged or received are based on contractual netting/set-off provisions in the ISDA master agreement. The following table presents the Fund’s net exposure for derivative instruments that are subject to enforceable master netting arrangements as of June 30, 2017. The net amount represents the receivable from (payable to) the counterparty in the event of a default.
| | | | | | | | | | | | | | | | |
| Counterparty | | Gross
Derivative Assets | | | Gross
Derivative Liabilities | | | Cash Collateral Pledged/(Received)(a) | | | Net Amount | |
Bank of America | | $ | — | | | $ | (15,115,978) | | | $ | 13,680,000 | | | $ | (1,435,978) | |
Barclays | | | — | | | | (1,309,230) | | | | 1,309,230 | | | | — | |
Citibank | | | — | | | | (64,710,197) | | | | — | | | | (64,710,197) | |
Credit Suisse | | | — | | | | (12,612,434) | | | | — | | | | (12,612,434) | |
Goldman Sachs | | | — | | | | (26,068,490) | | | | 26,068,490 | | | | — | |
HSBC | | | — | | | | (9,037,891) | | | | — | | | | (9,037,891) | |
JPMorgan | | | — | | | | (38,008,786) | | | | 32,090,000 | | | | (5,918,786) | |
UBS | | | — | | | | (28,203,443) | | | | — | | | | (28,203,443) | |
| | | | | | | | | | | | | | | | |
| | $ | — | | | $ | (195,066,449) | | | $ | 73,147,720 | | | $ | (121,918,729) | |
| | | | | | | | | | | | | | | | |
| | | | | | | | | | | | | | | | | |
| (a) | Cash collateral pledged/(received) in excess of derivative assets/liabilities, if any, is not presented in this table. The total cash collateral is presented on the Fund’s Consolidated Statement of Assets and Liabilities. |
PAGE 16 § DODGE & COX INTERNATIONAL STOCK FUND
CONSOLIDATED FINANCIAL HIGHLIGHTS (unaudited)
| | | | | | | | | | | | | | | | | | | | | | | | |
SELECTED DATA AND RATIOS (for a share outstanding throughout each period) | | Six Months
Ended June 30, | | | Year Ended December 31, | |
| | | 2017 | | | 2016 | | | 2015 | | | 2014 | | | 2013 | | | 2012 | |
| | | | | | | | |
Net asset value, beginning of period | | | $38.10 | | | | $36.48 | | | | $42.11 | | | | $43.04 | | | | $34.64 | | | | $29.24 | |
Income from investment operations: | | | | | | | | | | | | | | | | | | | | | | | | |
Net investment income | | | 0.56 | | | | 0.82 | | | | 0.79 | | | | 0.98 | | | | 0.70 | | | | 0.76 | |
Net realized and unrealized gain (loss) | | | 4.97 | | | | 2.19 | | | | (5.58 | ) | | | (0.94 | ) | | | 8.40 | | | | 5.39 | |
| | | | | | | | |
Total from investment operations | | | 5.53 | | | | 3.01 | | | | (4.79 | ) | | | 0.04 | | | | 9.10 | | | | 6.15 | |
| | | | | | | | |
Distributions to shareholders from: | | | | | | | | | | | | | | | | | | | | | | | | |
Net investment income | | | — | | | | (0.85 | ) | | | (0.84 | ) | | | (0.97 | ) | | | (0.70 | ) | | | (0.75 | ) |
Net realized gain | | | — | | | | (0.54 | ) | | | — | | | | — | | | | — | | | | — | |
| | | | | | | | |
Total distributions | | | — | | | | (1.39 | ) | | | (0.84 | ) | | | (0.97 | ) | | | (0.70 | ) | | | (0.75 | ) |
| | | | | | | | |
Net asset value, end of period | | | $43.63 | | | | $38.10 | | | | $36.48 | | | | $42.11 | | | | $43.04 | | | | $34.64 | |
| | | | | | | | |
Total return | | | 14.52 | % | | | 8.26 | % | | | (11.35 | )% | | | 0.07 | % | | | 26.31 | % | | | 21.03 | % |
Ratios/supplemental data: | | | | | | | | | | | | | | | | | | | | | | | | |
Net assets, end of period (millions) | | | $61,463 | | | | $54,187 | | | | $57,029 | | | | $64,040 | | | | $53,616 | | | | $40,556 | |
Ratios of expenses to average net assets | | | 0.64 | %(a) | | | 0.64 | % | | | 0.64 | % | | | 0.64 | % | | | 0.64 | % | | | 0.64 | % |
Ratios of net investment income to average net assets | | | 2.71 | %(a) | | | 2.12 | % | | | 1.86 | % | | | 2.39 | % | | | 1.85 | % | | | 2.31 | % |
Portfolio turnover rate | | | 9 | % | | | 17 | % | | | 18 | % | | | 12 | % | | | 13 | % | | | 10 | % |
See accompanying Notes to Consolidated Financial Statements
DODGE & COX INTERNATIONAL STOCK FUND §PAGE 17
FUND HOLDINGS
The Fund provides a complete list of its holdings four times each fiscal year, as of the end of each quarter. The Fund files the lists with the Securities and Exchange Commission (SEC) on Form N-CSR (second and fourth quarters) and Form N-Q (first and third quarters). Shareholders may view the Fund’s Forms N-CSR and N-Q on the SEC’s website at sec.gov. Forms N-CSR and N-Q may also be reviewed and copied at the SEC’s Public Reference Room in Washington, DC. Information regarding the operations of the Public Reference Room may be obtained by calling 202-551-8090 (direct) or 800-732-0330 (general SEC number). A list of the Fund’s quarter-end holdings is also available at dodgeandcox.com on or about 15 days following each quarter end and remains available on the website until the list is updated in the subsequent quarter.
PROXY VOTING
For a free copy of the Fund’s proxy voting policies and procedures, please call 800-621-3979, visit the Fund’s website at dodgeandcox.com, or visit the SEC’s website at sec.gov. Information regarding how the Fund voted proxies relating to portfolio securities during the most recent 12-month period ending June 30 is also available at dodgeandcox.com or at sec.gov.
HOUSEHOLD MAILINGS
The Fund routinely mails shareholder reports and summary prospectuses to shareholders and, on occasion, proxy statements. In order to reduce the volume of mail, when possible, only one copy of these documents will be sent to shareholders who are part of the same family and share the same residential address.
If you have a direct account with the Funds and you do not want the mailing of shareholder reports and summary prospectuses combined with other members in your household, contact the Funds at 800-621-3979. Your request will be implemented within 30 days.
PAGE 18 § DODGE & COX INTERNATIONAL STOCK FUND
TRUSTEES AND EXECUTIVE OFFICERS
Charles F. Pohl, Chairman and Trustee
Chairman, Dodge & Cox
Dana M. Emery, President and Trustee
Chief Executive Officer and President, Dodge & Cox
Thomas A. Larsen, Independent Trustee
Senior Counsel, Arnold & Porter Kaye Scholer LLP
Ann Mather, Independent Trustee
Former Executive Vice President, Chief Financial Officer, and Company Secretary, Pixar Animation Studios
Robert B. Morris III, Independent Trustee
Former Partner and Managing Director - Global Investment Research, Goldman Sachs; Former Advisory Director, The Presidio Group
Gary Roughead, Independent Trustee
Robert and Marion Oster Distinguished Fellow, Hoover Institution, and former U.S. Navy Chief of Naval Operations
Mark E. Smith, Independent Trustee
Former Executive Vice President and Managing Director-Fixed Income, Loomis Sayles & Company, L.P.
John B. Taylor, Independent Trustee
Professor of Economics, Stanford University; Senior Fellow, Hoover Institution; and former Under Secretary for International Affairs, United States Treasury
Diana S. Strandberg, Senior Vice President
Senior Vice President and Director of International Equity, Dodge & Cox
David H. Longhurst, Treasurer
Vice President and Assistant Treasurer, Dodge & Cox
Thomas M. Mistele, Secretary
Executive Vice President, Secretary, and Senior Counsel, Dodge & Cox
Katherine M. Primas, Chief Compliance Officer
Vice President and Chief Compliance Officer, Dodge & Cox
Roberta R.W. Kameda, Assistant Secretary
Vice President and General Counsel, Dodge & Cox
William W. Strickland, Assistant Secretary and Assistant Treasurer
Vice President and Chief Operating Officer, Dodge & Cox
Additional information about the Trust’s Trustees and Officers is available in the Trust’s Statement of Additional Information (SAI). You can get a free copy of the SAI by visiting the Funds’ website at dodgeandcox.com or calling 800-621-3979.
DODGE & COX INTERNATIONAL STOCK FUND §PAGE 19
dodgeandcox.com
For Fund literature, transactions, and account information, please visit the Funds’ website.
or write or call:
DODGE & COX FUNDS
c/o Boston Financial Data Services
P.O. Box 8422
Boston, Massachusetts 02266-8422
(800) 621-3979
INVESTMENT MANAGER
Dodge & Cox
555 California Street, 40th Floor
San Francisco, California 94104
(415) 981-1710
This report is submitted for the general information of the shareholders of the Fund. The report is not authorized for distribution to prospective investors in the Fund unless it is accompanied by a current prospectus.
This report reflects our views, opinions, and portfolio holdings as of June 30, 2017, the end of the reporting period. Any such views are subject to change at any time based upon market or other conditions and Dodge & Cox disclaims any responsibility to update such views. These views may not be relied on as investment advice and, because investment decisions for a Dodge & Cox Fund are based on numerous factors, may not be relied on as an indication of trading intent on behalf of any Dodge & Cox Fund.
DODGE & COX FUNDS®
Semi-Annual Report
June 30, 2017
Balanced Fund
ESTABLISHED 1931
TICKER: DODBX
6/17 BF SAR Printed on recycled paper
TO OUR SHAREHOLDERS
The Dodge & Cox Balanced Fund had a total return of 5.4% for the six months ended June 30, 2017, compared to a return of 6.5% for the Combined Index (a 60/40 blend of stocks and fixed income securities).
MARKET COMMENTARY
U.S. equity markets continued to climb during the first half of 2017: the S&P 500 reached an all-time high in mid-June and ended the period up 9%, marking its strongest first half since 2013. Information Technology was the best-performing sector of the S&P 500, and Energy was the worst-performing sector amid lower oil prices. Solid corporate earnings growth, combined with expectations of an improving economy, boosted U.S. equity returns and propelled valuations further above longer-term averages.
In fixed income, the U.S. investment-grade bond market delivered a 2.3% return for the first half of 2017, driven by narrowing credit yield premiums(a) and modest declines in longer-term interest rates. Generally positive macroeconomic data, changing investor expectations regarding Federal Reserve (Fed) policy, and ongoing legislative uncertainty influenced markets over this timeframe.
INVESTMENT STRATEGY
We set the Fund’s asset allocation based on our long-term outlook for the Fund’s equity and fixed income holdings, which currently favors equities. We decreased the allocation to equities by 3.0 percentage points during the first half of the year due to rising equity valuations. At quarter end, the Fund’s 69.7%(b) equity weighting (including 5.1% in preferred stocks) reflected our more positive outlook for total return potential from equities than from fixed income.
Equity Strategy
At Dodge & Cox, we approach each investment from the perspective of being a long-term part owner of a business and make gradual changes based on a three- to five-year investment horizon. Therefore, the equity portfolio has historically had low portfolio turnover. As a result of individual stock selection, the equity portfolio holds 63 common stocks across nine sectors; areas of emphasis are Financials, Health Care, and Information Technology.
During the volatility of 2016, we highlighted how the financial services holdings in the equity portfolio were trading at inexpensive valuations despite their asset growth, improved credit quality, cost reductions, and capital return prospects. Since then, however, share prices have risen and we have trimmed a number of positions, including Bank of America and Bank of New York Mellon.(c)
While we have trimmed Financials and certain other holdings amid higher U.S. equity market valuations, we continue to find areas of value offering long-term investment opportunities. For example, we recently added to several Health Care holdings, including AstraZeneca, and Energy companies in the portfolio.
AstraZeneca
AstraZeneca, which is based in the United Kingdom, is a global pharmaceutical company with strengths in treatments for cancer, respiratory illnesses, cardiovascular problems, and infectious diseases. In the second half of 2016, the share price was under pressure due to concerns about recent and upcoming patent expirations for several of its major drugs. Despite this headwind, we added to this holding in early 2017 after reaffirming our investment thesis.
The company’s long-term growth outlook is favorable given its robust new drug pipeline, particularly in oncology (cancer treatment). AstraZeneca has an attractive position in the revolutionary field of cancer immunotherapy, which harnesses the disease-fighting capabilities of the body’s immune system to attack cancerous tumors. We have conducted extensive due diligence, which included industry conferences and management meetings, and we continue to believe the immuno-oncology (IO) field holds great promise. Since the IO market is in its very early stages, sponsors and the scientific community are investing heavily into understanding which tumors can be targeted with IO and which patients will be most responsive to IO treatments (i.e., biomarkers). We think the field will evolve rapidly over the next five to ten years as physicians develop a better understanding of how these drugs work, creating a massive revenue and profit opportunity. With a 4.3% dividend yield, the current valuation is reasonable at 17 times forward earnings and does not appear to reflect potential success from the immunotherapy drug pipeline. AstraZeneca represented 1.9% of the equity portfolio on June 30.
Energy
Oil prices dropped 16% over the past six months, weighing heavily on the outlook for profitability and growth in the Energy sector. While the short-term direction of oil prices is difficult to forecast, we believe the long-term fundamentals of supply and demand point to higher prices. The current demand for oil, which is about 98 million barrels a day, continues to grow about one percent per year, driven by growing transportation demand in the developing world. Oil fields deplete as the resource is extracted, reducing the global production base about two to three percent per year, so continuing investment is required to meet current demand and to prepare for future demand growth. We anticipate that 15 to 20 million barrels per day of additional production will be needed over the next five years to meet demand if these trends continue. However, upstream capital investment has declined to a 10-year low, fewer new projects are being approved, and North American unconventional resources (including shale) are unlikely to grow enough to bridge this eventual gap.
The equity portfolio remains modestly overweight the Energy sector (7.1% compared to 6.0% for the S&P 500). Amid depressed valuations for energy companies, we recently added to selected holdings, including Anadarko Petroleum (an independent oil and gas exploration and production company) and Schlumberger (the world’s leading provider of oil services for drilling, production, and processing), among other holdings.
PAGE 2 § DODGE & COX BALANCED FUND
Fixed Income Strategy
After a particularly dynamic year of valuation shifts and corresponding changes to portfolio positioning in 2016, the first six months of 2017 have been substantially less active. The portfolio continues to feature substantial positions in corporate bonds (40%) and Agency(d) MBS (32%) and smaller positions in government-related securities (6%), ABS (3%), and U.S. Treasuries (19%, which is roughly half the Bloomberg Barclays U.S. Aggregate Bond Index’s (Bloomberg Barclays U.S. Agg) weighting). We have also maintained a defensive duration(e) position, roughly 73% of the Bloomberg Barclays U.S. Agg’s duration, given our longer-term expectations for interest rates to rise more than currently implied by market valuations.
Opportunistic Reductions to Credit, But Credit Remains Attractive
The portfolio’s credit(f) weighting remained relatively stable during the first half of 2017, although there were changes in credit composition during the period. The year-long recovery in investor sentiment regarding commodity-related and emerging market issuers provided attractive opportunities to trim Cemex, Kinder Morgan, and Rio Oil Finance Trust. We similarly capitalized on the overall improvement in market valuations to reduce exposure to credits facing secular headwinds or transformational risk, such as Macy’s and Verizon. Notwithstanding the broader compression in credit spreads, we remained opportunistic in evaluating new additions for the credit portfolio. We added to the portfolio’s TransCanada position through the purchase of a new subordinated security. We also invested in short-duration Ford Motor Credit securities, which we believe offer attractive relative value compared to other alternatives in the intermediate portion of the market.
The portfolio’s taxable municipal holdings continued to perform well, particularly the State of Illinois general obligation (GO) bonds (a 1.3% position) which have outperformed over the past six months, despite recent volatility. The State passed a budget in July following a two-year impasse between the Republican governor and the Democrat-controlled General Assembly. The recent budget compromise included permanent income tax increases and spending reductions, both of which are credit positives. Taxable municipal securities remain a relatively small portion of the portfolio (4%) but offer attractive diversification benefits and better downside protection compared to corporate alternatives.
Reducing Interest Rate Risk
We continue to position the fixed income portfolio defensively vis-à-vis interest rate risk, with a duration that is 73% of the Bloomberg Barclays U.S. Agg’s duration. We expect U.S. economic growth to continue at an annual rate of 2% or slightly higher. Despite marginally reduced optimism regarding the Trump administration’s ability to implement its full agenda of regulatory reforms, tax reforms, and substantial fiscal stimulus, some success is likely to be achieved, which should support further U.S. economic growth. In addition, inflation measures are likely to firm amid a tight labor market. The combination of these factors should allow
the Fed to continue its gradual hiking cycle and eventually begin to reduce its balance sheet, which should contribute to rising rates over our investment horizon.
IN CLOSING
Since U.S. equity valuations are now near recent highs, we have adopted a tempered outlook for broader U.S. equity market returns. However, as an active manager with a value-oriented approach, we remain optimistic about the long-term prospects for the Fund to preserve and enhance purchasing power. On June 30, the portfolio’s equity holdings collectively traded at 15.4 times forward earnings, a discount to the S&P 500, which traded at 18.6 times forward earnings.
In fixed income, yields remain low by historical standards, increasing the risk of low (or even negative) returns if yields rise substantially from current levels. In addition, the credit markets have performed extremely well over the past 16 months, a pace which is unlikely to be repeated in the near future. Notwithstanding somewhat challenged absolute return prospects in the near term, bonds serve a vital defensive role in the Fund by offering liquidity, income generation, downside protection, and low correlation to riskier asset classes.
Thank you for your continued confidence in our firm. As always, we welcome your comments and questions.
For the Board of Trustees,
| | |
| |
|
Charles F. Pohl, Chairman | | Dana M. Emery, President |
July 31, 2017
| (a) | | Yield premiums are one way to measure a security’s valuation. Narrowing yield premiums result in a higher valuation. Widening yield premiums result in a lower valuation. |
| (b) | | Unless otherwise specified, all weightings and characteristics are as of June 30, 2017. |
| (c) | | The use of specific examples does not imply that they are more or less attractive investments than the portfolio’s other holdings. |
| (d) | | The U.S. Government does not guarantee the Fund’s shares, yield, or net asset value. The agency guarantee (by, for example, Ginnie Mae, Fannie Mae, or Freddie Mac) does not eliminate market risk. |
| (e) | | Duration is a measure of a bond’s (or a bond portfolio’s) price sensitivity to changes in interest rates. |
| (f) | | Credit securities refers to corporate bonds and government-related securities, as classified by Bloomberg. |
DODGE & COX BALANCED FUND §PAGE 3
YEAR-TO-DATE PERFORMANCE REVIEW
The Fund underperformed the Combined Index by 1.1 percentage points year to date. The Fund’s higher allocation to equities had a positive impact equity, security selection detracted from relative results.
Equity Portfolio
| | § | | The portfolio’s average overweight position (29% versus 14%) and holdings in the Financials sector (up 4% compared to up 7% for the S&P 500 sector) hurt relative performance. Goldman Sachs (down 7%) and Capital One Financial (down 4%) lagged. | |
| | § | | Poor returns from holdings in the Energy sector (down 21% compared to down 13% for the S&P 500 sector), combined with a higher average weighting (8% versus 7%), detracted from results. | |
| | § | | Information Technology was the strongest area of the market (up 17% for the S&P 500 sector), boosted by several large stocks not held in the portfolio. The performance of the portfolio’s holdings in the sector (up 12%) was modest in comparison. | |
Fixed Income Portfolio
| | § | | Security selection within credit was positive as certain emerging market-domiciled holdings performed well, including Cemex, Pemex, and Rio Oil Finance Trust. Other notable outperformers included Royal Bank of Scotland and Telecom Italia. | |
| | § | | The portfolio’s overweight to corporate bonds and underweight to U.S. Treasuries added to relative returns given the strong performance of credit. | |
| | § | | The portfolio’s Agency MBS holdings outperformed the MBS in the Bloomberg Barclays U.S. Agg after adjusting for duration differences. | |
| | § | | The portfolio’s shorter relative duration (70% of the Bloomberg Barclays U.S. Agg’s duration) detracted from relative returns. | |
| | § | | Certain corporate holdings underperformed, including Macy’s and Verizon. | |
KEY CHARACTERISTICS OF DODGE & COX
Independent Organization
Dodge & Cox is one of the largest privately owned investment managers in the world. We remain committed to independence, with a goal of providing the highest quality investment management service to our existing clients.
Over 85 Years of Investment Experience
Dodge & Cox was founded in 1930. We have a stable and well-qualified team of investment professionals, most of whom have spent their entire careers at Dodge & Cox.
Experienced Investment Team
The U.S. Equity Investment Committee, which is responsible for determining the asset allocation of the Balanced Fund and managing the equity portion of the Balanced Fund, is an eight-member committee with an average tenure at Dodge & Cox of 24 years. The U.S. Fixed Income Investment Committee, which is responsible for managing the debt portion of the Balanced Fund, is an eight-member committee with an average tenure of 22 years.
One Business with a Single Research Office
Dodge & Cox manages equity (domestic, international, and global), fixed income (domestic and global), and balanced investments, operating from one office in San Francisco.
Consistent Investment Approach
Our team decision-making process involves thorough, bottom-up fundamental analysis of each investment.
Long-Term Focus and Low Expenses
We invest with a three- to five-year investment horizon, which has historically resulted in low turnover relative to our peers. We manage Funds that maintain low expense ratios.
Risks: The Fund is subject to market risk, meaning holdings in the Fund may decline in value for extended periods due to the financial prospects of individual companies or due to general market and economic conditions. The Fund also invests in individual bonds whose yields and market values fluctuate, so that an investment may be worth more or less than its original cost. Debt securities are subject to interest rate risk, credit risk, and prepayment and call risk, all of which could have adverse effects on the value of the Fund. A low interest rate environment creates an elevated risk of future negative returns. Financial intermediaries may restrict their market making activities for certain debt securities, which may reduce the liquidity and increase the volatility of such securities. Please read the prospectus and summary prospectus for specific details regarding the Fund’s risk profile.
PAGE 4 § DODGE & COX BALANCED FUND
GROWTH OF $10,000 OVER 10 YEARS
FOR AN INVESTMENT MADE ON JUNE 30, 2007
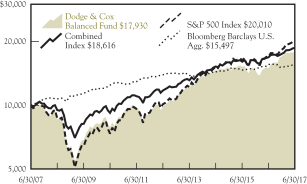
AVERAGE ANNUAL TOTAL RETURN
FOR PERIODS ENDED JUNE 30, 2017
| | | | | | | | | | | | | | | | |
| | | 1 Year | | | 5 Years | | | 10 Years | | | 20 Years | |
| | | | | | | | | | | | | | | | |
Dodge & Cox Balanced Fund | | | 20.01 | % | | | 12.73 | % | | | 6.01 | % | | | 8.52 | % |
S&P 500 Index | | | 17.90 | | | | 14.63 | | | | 7.18 | | | | 7.15 | |
Bloomberg Barclays U.S. Aggregate Bond Index (Bloomberg Barclays U.S. Agg) | | | -0.31 | | | | 2.21 | | | | 4.48 | | | | 5.24 | |
Combined Index(a) | | | 10.34 | | | | 9.65 | | | | 6.41 | | | | 6.71 | |
Returns represent past performance and do not guarantee future results. Investment return and share price will fluctuate with market conditions, and investors may have a gain or loss when shares are sold. Fund performance changes over time and currently may be significantly lower than stated. Performance is updated and published monthly. Visit the Fund’s website at dodgeandcox.com or call 800-621-3979 for current performance figures.
The Fund’s total returns include the reinvestment of dividend and capital gain distributions, but have not been adjusted for any income taxes payable by shareholders on these distributions or on Fund share redemptions. Index returns include dividends and/or interest income but, unlike Fund returns, do not reflect fees or expenses.
Standard & Poor’s, Standard & Poor’s 500, and S&P 500® are trademarks of S&P Global Inc. Bloomberg is a registered trademark of Bloomberg Finance L.P. and its affiliates. Barclays® is a trademark of Barclays Bank PLC.
| (a) | The Combined Index reflects an unmanaged portfolio (rebalanced monthly) of 60% of the S&P 500 Index, which is a market capitalization-weighted index of 500 large-capitalization stocks commonly used to represent the U.S. equity market, and 40% of the Bloomberg Barclays U.S. Aggregate Bond Index (Bloomberg Barclays U.S. Agg), which is a widely recognized, unmanaged index of U.S. dollar-denominated, investment-grade, taxable fixed income securities. The Fund may, however, invest up to 75% of its total assets in equity securities. |
FUND EXPENSE EXAMPLE
As a Fund shareholder, you incur ongoing Fund costs, including management fees and other Fund expenses. All mutual funds have ongoing costs, sometimes referred to as operating expenses. The following example shows ongoing costs of investing in the Fund and can help you understand these costs and compare them with those of other mutual funds. The example assumes a $1,000 investment held for the six months indicated.
ACTUAL EXPENSES
The first line of the table below provides information about actual account values and expenses based on the Fund’s actual returns. You may use the information in this line, together with your account balance, to estimate the expenses that you paid over the period. Simply divide your account value by $1,000 (for example, an $8,600 account value divided by $1,000 = 8.6), then multiply the result by the number in the first line under the heading “Expenses Paid During Period” to estimate the expenses you paid on your account during this period.
HYPOTHETICAL EXAMPLE FOR COMPARISON WITH OTHER MUTUAL FUNDS
Information on the second line of the table can help you compare ongoing costs of investing in the Fund with those of other mutual funds. This information may not be used to estimate the actual ending account balance or expenses you paid during the period. The hypothetical “Ending Account Value” is based on the actual expense ratio of the Fund and an assumed 5% annual rate of return before expenses (not the Fund’s actual return). The amount under the heading “Expenses Paid During Period” shows the hypothetical expenses your account would have incurred under this scenario. You can compare this figure with the 5% hypothetical examples that appear in shareholder reports of other mutual funds.
| | | | | | | | | | | | |
Six Months Ended
June 30, 2017 | | Beginning Account Value
1/1/2017 | | | Ending Account Value
6/30/2017 | | | Expenses Paid
During Period* | |
Based on Actual Fund Return | | $ | 1,000.00 | | | $ | 1,053.60 | | | $ | 2.69 | |
Based on Hypothetical 5% Yearly Return | | | 1,000.00 | | | | 1,022.17 | | | | 2.65 | |
| * | | Expenses are equal to the Fund’s annualized expense ratio of 0.53%, multiplied by the average account value over the period, multiplied by 181/365 (to reflect the one-half year period). |
The expenses shown in the table highlight ongoing costs only and do not reflect any transactional fees or account maintenance fees. Though other mutual funds may charge such fees, please note that the Fund does not charge transaction fees (e.g., redemption fees, sales loads) or universal account maintenance fees (e.g., small account fees).
DODGE & COX BALANCED FUND §PAGE 5
| | | | |
| FUND INFORMATION (unaudited) | | | June 30, 2017 | |
| | | | |
| GENERAL INFORMATION | | | |
Net Asset Value Per Share | | | $106.18 | |
Total Net Assets (billions) | | | $15.9 | |
Expense Ratio | | | 0.53% | |
Portfolio Turnover Rate (1/1/17 to 6/30/17, unannualized) | | | 10% | |
30-Day SEC Yield(a) | | | 1.74% | |
Fund Inception | | | 1931 | |
No sales charges or distribution fees | | | | |
Investment Manager: Dodge & Cox, San Francisco. Managed by the U.S. Equity Investment Committee, whose eight members’ average tenure at Dodge & Cox is 24 years, and by the U.S. Fixed Income Investment Committee, whose eight members’ average tenure is 22 years.
| | | | |
| EQUITY PORTFOLIO (69.7%) | | Fund | |
Number of Common Stocks | | | 63 | |
Number of Preferred Stocks | | | 5 | |
Median Market Capitalization (billions)(b) | | | $41 | |
Price-to-Earnings Ratio(b)(c) | | | 15.4x | |
Foreign Securities not in the S&P 500(d) | | | 6.8% | |
| | | | | | | | | | | | |
FIVE LARGEST
SECTORS (%) | | Common | | | Preferred | | | Fund | |
Financials | | | 18.6 | | | | 4.7 | | | | 23.3 | |
Health Care | | | 13.0 | | | | — | | | | 13.0 | |
Information Technology | | | 11.5 | | | | — | | | | 11.5 | |
Consumer Discretionary | | | 10.5 | | | | 0.4 | | | | 10.9 | |
Energy | | | 4.9 | | | | — | | | | 4.9 | |
| | | | | | | | | | | | |
TEN LARGEST
EQUITIES (%)(e) | | Common | | | Preferred | | | Fund | |
Wells Fargo & Co. | | | 2.5 | | | | 1.6 | | | | 4.1 | |
JPMorgan Chase & Co. | | | 1.6 | | | | 1.7 | | | | 3.3 | |
Bank of America Corp. | | | 2.5 | | | | 0.5 | | | | 3.0 | |
Charles Schwab Corp. | | | 2.6 | | | | — | | | | 2.6 | |
Capital One Financial Corp. | | | 2.4 | | | | — | | | | 2.4 | |
Novartis AG (Switzerland) | | | 2.1 | | | | — | | | | 2.1 | |
Charter Communications, Inc. | | | 2.0 | | | | — | | | | 2.0 | |
Sanofi (France) | | | 2.0 | | | | — | | | | 2.0 | |
Goldman Sachs Group, Inc. | | | 1.9 | | | | — | | | | 1.9 | |
Alphabet, Inc. | | | 1.9 | | | | — | | | | 1.9 | |
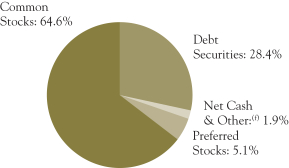
| | | | |
| FIXED INCOME PORTFOLIO (28.4%) | | Fund | |
Number of Credit Issuers | | | 48 | |
Effective Duration (years) | | | 4.4 | |
| | | | |
| SECTOR DIVERSIFICATION (%) | | Fund | |
U.S. Treasury(g) | | | 5.3 | |
Government-Related | | | 1.7 | |
Securitized | | | 10.1 | |
Corporate | | | 11.3 | |
| | | | |
| CREDIT QUALITY (%)(h) | | Fund | |
U.S. Treasury/Agency/GSE(g) | | | 14.4 | |
Aaa | | | 0.5 | |
Aa | | | 1.0 | |
A | | | 0.8 | |
Baa | | | 9.2 | |
Ba | | | 2.1 | |
B | | | 0.0 | |
Caa | | | 0.4 | |
| | | | |
| FIVE LARGEST CREDIT ISSUERS (%)(e) | | Fund | |
Bank of America Corp. | | | 0.6 | |
Petroleos Mexicanos | | | 0.5 | |
State of California GO | | | 0.5 | |
Charter Communications, Inc. | | | 0.5 | |
Telecom Italia SPA | | | 0.5 | |
| (a) | SEC Yield is an annualization of the Fund’s net investment income for the trailing 30-day period. Dividends paid by the Fund may be higher or lower than implied by the SEC Yield. |
| (b) | Excludes the Fund’s preferred stock positions. |
| (c) | Price-to-earnings (P/E) ratio is calculated using 12-month forward earnings estimates from third-party sources. |
| (d) | Foreign stocks are U.S. dollar denominated. |
| (e) | The Fund’s portfolio holdings are subject to change without notice. The mention of specific securities is not a recommendation to buy, sell, or hold any particular security and is not indicative of Dodge & Cox’s current or future trading activity. |
| (f) | Net Cash & Other includes cash, short-term investments, derivatives, receivables, and payables. |
| (g) | Data as presented excludes the Fund’s position in Treasury futures contracts. |
| (h) | The credit quality distribution shown for the Fund is based on the middle of Moody’s, S&P’s, and Fitch ratings, which is the methodology used by Bloomberg in constructing its indices. If a security is rated by only two agencies, the lower of the two ratings is used. Please note the Fund applies the highest of Moody’s, S&P’s, and Fitch ratings to determine compliance with the quality requirements stated in its prospectus. The credit quality of the investments in the portfolio does not apply to the stability or safety of the Fund or its shares. |
PAGE 6 § DODGE & COX BALANCED FUND
| | | | |
| PORTFOLIO OF INVESTMENTS (unaudited) | | | June 30, 2017 | |
| | | | | | | | |
| COMMON STOCKS: 64.6% | | | | | | |
| | |
| | | SHARES | | | VALUE | |
| CONSUMER DISCRETIONARY: 10.5% | | | | | |
AUTOMOBILES & COMPONENTS: 0.3% | | | | | | | | |
Harley-Davidson, Inc. | | | 893,400 | | | $ | 48,261,468 | |
| |
CONSUMER DURABLES & APPAREL: 0.5% | | | | | |
Coach, Inc. | | | 1,495,036 | | | | 70,775,004 | |
| | |
MEDIA: 7.9% | | | | | | | | |
Charter Communications, Inc., Class A(a) | | | 941,907 | | | | 317,281,373 | |
Comcast Corp., Class A | | | 7,263,448 | | | | 282,693,396 | |
DISH Network Corp., Class A(a) | | | 1,700,032 | | | | 106,694,009 | |
News Corp., Class A | | | 1,022,304 | | | | 14,005,565 | |
Time Warner, Inc. | | | 2,941,366 | | | | 295,342,560 | |
Twenty-First Century Fox, Inc., Class A | | | 6,997,200 | | | | 198,300,648 | |
Twenty-First Century Fox, Inc., Class B | | | 1,565,000 | | | | 43,616,550 | |
| | | | | | | | |
| | | | | | | 1,257,934,101 | |
RETAILING: 1.8% | | | | | | | | |
Liberty Interactive Corp. QVC Group,
Series A(a) | | | 2,565,850 | | | | 62,965,959 | |
Target Corp. | | | 1,838,400 | | | | 96,129,936 | |
The Priceline Group, Inc.(a) | | | 65,400 | | | | 122,332,008 | |
| | | | | | | | |
| | | | | | | 281,427,903 | |
| | | | | | | | |
| | | | | | | 1,658,398,476 | |
| CONSUMER STAPLES: 1.0% | | | | | | | | |
FOOD & STAPLES RETAILING: 1.0% | | | | | | | | |
Wal-Mart Stores, Inc. | | | 2,110,400 | | | | 159,715,072 | |
| | |
ENERGY: 4.9% | | | | | | | | |
Anadarko Petroleum Corp. | | | 3,126,892 | | | | 141,773,283 | |
Apache Corp. | | | 2,920,139 | | | | 139,962,262 | |
Baker Hughes, Inc. | | | 2,356,079 | | | | 128,429,866 | |
Concho Resources, Inc.(a) | | | 575,900 | | | | 69,989,127 | |
National Oilwell Varco, Inc. | | | 3,181,000 | | | | 104,782,140 | |
Schlumberger, Ltd. (Curacao/United States) | | | 2,749,221 | | | | 181,008,711 | |
Weatherford International PLC(a) (Ireland) | | | 4,970,000 | | | | 19,233,900 | |
| | | | | | | | |
| | | | | | | 785,179,289 | |
| FINANCIALS: 18.6% | | | | | | | | |
BANKS: 7.1% | | | | | | | | |
Bank of America Corp. | | | 16,213,400 | | | | 393,337,084 | |
BB&T Corp. | | | 1,994,584 | | | | 90,574,059 | |
JPMorgan Chase & Co. | | | 2,754,100 | | | | 251,724,740 | |
Wells Fargo & Co. | | | 7,249,606 | | | | 401,700,669 | |
| | | | | | | | |
| | | | | | | 1,137,336,552 | |
DIVERSIFIED FINANCIALS: 9.6% | | | | | | | | |
American Express Co. | | | 2,571,000 | | | | 216,581,040 | |
Bank of New York Mellon Corp. | | | 4,167,400 | | | | 212,620,748 | |
Capital One Financial Corp. | | | 4,534,059 | | | | 374,603,955 | |
Charles Schwab Corp. | | | 9,535,000 | | | | 409,623,600 | |
Goldman Sachs Group, Inc. | | | 1,378,900 | | | | 305,977,910 | |
| | | | | | | | |
| | | | | | | 1,519,407,253 | |
INSURANCE: 1.9% | | | | | | | | |
AEGON NV (Netherlands) | | | 12,485,240 | | | | 63,799,576 | |
MetLife, Inc. | | | 4,266,000 | | | | 234,374,040 | |
| | | | | | | | |
| | | | | | | 298,173,616 | |
| | | | | | | | |
| | | | | | | 2,954,917,421 | |
| HEALTH CARE: 13.0% | | | | | | | | |
HEALTH CARE EQUIPMENT & SERVICES: 4.6% | |
Cigna Corp. | | | 1,323,559 | | | | 221,550,541 | |
Danaher Corp. | | | 468,100 | | | | 39,502,959 | |
Express Scripts Holding Co.(a) | | | 3,500,668 | | | | 223,482,645 | |
Medtronic PLC (Ireland) | | | 1,015,200 | | | | 90,099,000 | |
UnitedHealth Group, Inc. | | | 858,772 | | | | 159,233,504 | |
| | | | | | | | |
| | | | | | | 733,868,649 | |
PHARMACEUTICALS, BIOTECHNOLOGY & LIFE SCIENCES: 8.4% | |
Alnylam Pharmaceuticals, Inc.(a) | | | 811,000 | | | | 64,685,360 | |
AstraZeneca PLC ADR (United Kingdom) | | | 6,060,899 | | | | 206,616,047 | |
| | | | | | | | |
| | |
| | | SHARES | | | VALUE | |
Bristol-Myers Squibb Co. | | | 2,842,800 | | | $ | 158,400,816 | |
Eli Lilly and Co. | | | 554,506 | | | | 45,635,844 | |
Merck & Co., Inc. | | | 1,084,775 | | | | 69,523,230 | |
Novartis AG ADR (Switzerland) | | | 3,986,300 | | | | 332,736,461 | |
Roche Holding AG ADR (Switzerland) | | | 4,446,000 | | | | 141,382,800 | |
Sanofi ADR (France) | | | 6,515,265 | | | | 312,146,346 | |
| | | | | | | | |
| | | | | | | 1,331,126,904 | |
| | | | | | | | |
| | | | | | | 2,064,995,553 | |
| INDUSTRIALS: 3.3% | | | | | | | | |
CAPITAL GOODS: 0.9% | | | | | | | | |
Johnson Controls International PLC (Ireland) | | | 3,445,297 | | | | 149,388,078 | |
| | |
TRANSPORTATION: 2.4% | | | | | | | | |
FedEx Corp. | | | 1,100,254 | | | | 239,118,202 | |
Union Pacific Corp. | | | 1,243,000 | | | | 135,375,130 | |
| | | | | | | | |
| | | | | | | 374,493,332 | |
| | | | | | | | |
| | | | | | | 523,881,410 | |
| INFORMATION TECHNOLOGY: 11.5% | | | | | |
SEMICONDUCTORS & SEMICONDUCTOR EQUIPMENT: 0.5% | |
Maxim Integrated Products, Inc. | | | 1,665,291 | | | | 74,771,566 | |
| | |
SOFTWARE & SERVICES: 5.2% | | | | | | | | |
Alphabet, Inc., Class A(a) | | | 14,500 | | | | 13,480,360 | |
Alphabet, Inc., Class C(a) | | | 316,395 | | | | 287,517,629 | |
Dell Technologies, Inc., Class V(a) | | | 672,163 | | | | 41,075,881 | |
DXC Technology Co. | | | 1,274,599 | | | | 97,787,235 | |
Microsoft Corp. | | | 3,872,700 | | | | 266,945,211 | |
Synopsys, Inc.(a) | | | 543,100 | | | | 39,608,283 | |
VMware, Inc.(a) | | | 818,400 | | | | 71,552,712 | |
| | | | | | | | |
| | | | | | | 817,967,311 | |
TECHNOLOGY, HARDWARE & EQUIPMENT: 5.8% | |
Cisco Systems, Inc. | | | 5,918,100 | | | | 185,236,530 | |
Corning, Inc. | | | 1,186,200 | | | | 35,645,310 | |
Hewlett Packard Enterprise Co. | | | 16,964,512 | | | | 281,441,254 | |
HP Inc. | | | 11,585,112 | | | | 202,507,758 | |
Juniper Networks, Inc. | | | 1,849,329 | | | | 51,559,292 | |
NetApp, Inc. | | | 1,176,891 | | | | 47,134,485 | |
TE Connectivity, Ltd. (Switzerland) | | | 1,583,036 | | | | 124,553,272 | |
| | | | | | | | |
| | | | | | | 928,077,901 | |
| | | | | | | | |
| | | | | | | 1,820,816,778 | |
| MATERIALS: 0.6% | | | | | | | | |
Celanese Corp., Series A | | | 1,042,532 | | | | 98,977,988 | |
|
| TELECOMMUNICATION SERVICES: 1.2% | |
Sprint Corp.(a) | | | 16,261,671 | | | | 133,508,319 | |
Zayo Group Holdings, Inc.(a) | | | 1,610,000 | | | | 49,749,000 | |
| | | | | | | | |
| | | | | | | 183,257,319 | |
TOTAL COMMON STOCKS
(Cost $6,316,417,618) | | | | | | $ | 10,250,139,306 | |
| | |
| PREFERRED STOCKS: 5.1% | | | | | | |
| | |
| | | PAR VALUE | | | VALUE | |
| CONSUMER DISCRETIONARY: 0.4% | | | | | |
MEDIA: 0.4% | | | | | | | | |
NBCUniversal Enterprise, Inc. 5.25%(c) | | $ | 53,210,000 | | | $ | 56,554,781 | |
| | |
| FINANCIALS: 4.7% | | | | | | | | |
BANKS: 4.7% | | | | | | | | |
Bank of America Corp. 6.10% | | | 16,008,000 | | | | 17,390,291 | |
Bank of America Corp. 6.25% | | | 52,470,000 | | | | 56,798,775 | |
Citigroup, Inc. 5.95% | | | | | | | | |
7/29/49 | | | 5,175,000 | | | | 5,504,906 | |
12/31/49 | | | 77,327,000 | | | | 82,858,200 | |
Citigroup, Inc. 6.25% | | | 50,886,000 | | | | 56,451,656 | |
JPMorgan Chase & Co. 6.10% | | | 254,565,000 | | | | 276,203,025 | |
| | |
| See accompanying Notes to Financial Statements | | DODGE & COX BALANCED FUND §PAGE 7 |
| | | | |
| PORTFOLIO OF INVESTMENTS (unaudited) | | | June 30, 2017 | |
| | | | | | | | |
| PREFERRED STOCKS (continued) | | | | |
| | |
| | | PAR VALUE | | | VALUE | |
Wells Fargo & Co. 5.875% | | $ | 227,645,000 | | | $ | 250,857,961 | |
| | | | | | | | |
| | | | | | | 746,064,814 | |
| | | | | | | | |
TOTAL PREFERRED STOCKS
(Cost $739,142,989) | | | $ | 802,619,595 | |
|
| DEBT SECURITIES: 28.4% | |
| U.S. TREASURY: 5.3% | |
U.S. Treasury Note/Bond
0.875%, 4/15/19 | | | 40,000,000 | | | | 39,651,560 | |
0.875%, 5/15/19 | | | 37,500,000 | | | | 37,154,288 | |
1.625%, 7/31/19 | | | 102,715,000 | | | | 103,188,413 | |
1.625%, 3/15/20 | | | 50,000,000 | | | | 50,154,300 | |
1.625%, 11/30/20 | | | 6,585,000 | | | | 6,580,371 | |
1.75%, 12/31/20 | | | 96,775,000 | | | | 97,043,357 | |
1.125%, 2/28/21 | | | 127,255,000 | | | | 124,665,106 | |
1.125%, 7/31/21 | | | 56,610,000 | | | | 55,172,616 | |
1.75%, 11/30/21 | | | 130,000,000 | | | | 129,654,720 | |
1.875%, 1/31/22 | | | 90,500,000 | | | | 90,606,066 | |
1.875%, 2/28/22 | | | 35,790,000 | | | | 35,829,154 | |
1.75%, 5/31/22 | | | 66,339,000 | | | | 65,942,492 | |
| | | | | | | | |
| | | | | | | 835,642,443 | |
| | | | | | | | |
| | | | | | | 835,642,443 | |
| GOVERNMENT-RELATED: 1.7% | |
FEDERAL AGENCY: 0.0% | |
Small Business Admin. — 504 Program | |
Series 1997-20I 1, 6.90%, 9/1/17 | | | 47,734 | | | | 48,124 | |
Series 1998-20D 1, 6.15%, 4/1/18 | | | 94,420 | | | | 95,420 | |
Series 1998-20I 1, 6.00%, 9/1/18 | | | 100,351 | | | | 101,321 | |
Series 1999-20F 1, 6.80%, 6/1/19 | | | 119,116 | | | | 121,914 | |
Series 2000-20D 1, 7.47%, 4/1/20 | | | 649,382 | | | | 673,849 | |
Series 2000-20E 1, 8.03%, 5/1/20 | | | 103,193 | | | | 107,662 | |
Series 2000-20G 1, 7.39%, 7/1/20 | | | 256,485 | | | | 265,883 | |
Series 2000-20I 1, 7.21%, 9/1/20 | | | 145,549 | | | | 150,799 | |
Series 2001-20E 1, 6.34%, 5/1/21 | | | 454,714 | | | | 477,894 | |
Series 2001-20G 1, 6.625%, 7/1/21 | | | 508,534 | | | | 535,172 | |
Series 2003-20J 1, 4.92%, 10/1/23 | | | 1,821,443 | | | | 1,930,968 | |
Series 2007-20F 1, 5.71%, 6/1/27 | | | 2,387,607 | | | | 2,567,598 | |
| | | | | | | | |
| | | | | | | 7,076,604 | |
FOREIGN AGENCY: 0.7% | |
Petroleo Brasileiro SA (Brazil)
4.375%, 5/20/23 | | | 20,950,000 | | | | 19,755,850 | |
Petroleos Mexicanos (Mexico)
4.25%, 1/15/25 | | | 22,685,000 | | | | 22,061,162 | |
6.50%, 3/13/27(c) | | | 18,400,000 | | | | 19,766,200 | |
6.625%, 6/15/35 | | | 9,425,000 | | | | 9,743,094 | |
6.375%, 1/23/45 | | | 20,125,000 | | | | 19,621,875 | |
5.625%, 1/23/46 | | | 16,675,000 | | | | 14,782,388 | |
| | | | | | | | |
| | | | | | | 105,730,569 | |
LOCAL AUTHORITY: 1.0% | |
New Jersey Turnpike Authority RB
7.102%, 1/1/41 | | | 12,436,000 | | | | 18,250,576 | |
State of California GO
7.50%, 4/1/34 | | | 13,470,000 | | | | 19,607,067 | |
7.55%, 4/1/39 | | | 22,525,000 | | | | 34,389,368 | |
7.30%, 10/1/39 | | | 13,730,000 | | | | 20,056,921 | |
7.625%, 3/1/40 | | | 5,540,000 | | | | 8,463,735 | |
State of Illinois GO
5.665%, 3/1/18 | | | 28,485,000 | | | | 28,950,730 | |
5.877%, 3/1/19 | | | 10,225,000 | | | | 10,580,625 | |
5.10%, 6/1/33 | | | 22,615,000 | | | | 21,170,354 | |
| | | | | | | | |
| | | | | | | 161,469,376 | |
| | | | | | | | |
| | | | | | | 274,276,549 | |
| SECURITIZED: 10.1% | |
ASSET-BACKED: 1.0% | |
Auto Loan: 0.1% | |
Ford Credit Auto Owner Trust
Series 2015-1 A, 2.12%, 7/15/26(c) | | | 16,450,000 | | | | 16,514,787 | |
| | | | | | | | |
| | |
| | | PAR VALUE | | | VALUE | |
Credit Card: 0.3% | |
American Express Master Trust
Series 2017-4 A, 1.64%, 12/15/21 | | $ | 44,759,000 | | | $ | 44,707,241 | |
Other: 0.4% | |
Rio Oil Finance Trust (Brazil)
9.25%, 7/6/24(c) | | | 27,990,276 | | | | 28,417,127 | |
9.75%, 1/6/27(c) | | | 36,532,617 | | | | 37,263,270 | |
| | | | | | | | |
| | | | | | | 65,680,397 | |
Student Loan: 0.2% | |
SLM Student Loan Trust (Private Loans) | |
Series 2014-A A2A, 2.59%, 1/15/26(c) | | | 5,250,000 | | | | 5,286,918 | |
Series 2012-B A2, 3.48%, 10/15/30(c) | | | 3,711,294 | | | | 3,748,964 | |
Series 2012-E A2A, 2.09%, 6/15/45(c) | | | 10,776,005 | | | | 10,783,930 | |
Series 2012-C A2, 3.31%, 10/15/46(c) | | | 5,806,054 | | | | 5,868,686 | |
| | | | | | | | |
| | | | | | | 25,688,498 | |
| | | | | | | | |
| | | | | | | 152,590,923 | |
CMBS: 0.1% | |
Agency CMBS: 0.1% | |
Fannie Mae Multifamily DUS | |
Pool AL8144, 2.404%, 10/1/22 | | | 7,916,079 | | | | 8,037,956 | |
Pool AL9086, 2.484%, 7/1/23 | | | 3,076,533 | | | | 3,080,872 | |
| | | | | | | | |
| | | | | | | 11,118,828 | |
| | | | | | | | |
| | | | | | | 11,118,828 | |
MORTGAGE-RELATED: 9.0% | |
Federal Agency CMO & REMIC: 1.2% | |
Dept. of Veterans Affairs | |
Series 1995-1 1, 6.987%, 2/15/25 | | | 284,088 | | | | 311,491 | |
Series 1995-2C 3A, 8.793%, 6/15/25 | | | 131,756 | | | | 155,564 | |
Series 2002-1 2J, 6.50%, 8/15/31 | | | 8,255,419 | | | | 9,339,038 | |
Fannie Mae | |
Trust 2002-33 A1, 7.00%, 6/25/32 | | | 1,764,790 | | | | 2,048,351 | |
Trust 2009-66 ET, 6.00%, 5/25/39 | | | 2,750,358 | | | | 2,951,588 | |
Trust 2009-30 AG, 6.50%, 5/25/39 | | | 2,123,039 | | | | 2,353,146 | |
Trust 2001-T7 A1, 7.50%, 2/25/41 | | | 1,317,874 | | | | 1,540,241 | |
Trust 2001-T5 A3, 7.50%, 6/19/41 | | | 559,104 | | | | 667,490 | |
Trust 2001-T8 A1, 7.50%, 7/25/41 | | | 1,401,448 | | | | 1,630,737 | |
Trust 2001-T4 A1, 7.50%, 7/25/41 | | | 1,352,118 | | | | 1,579,384 | |
Trust 2001-W3 A, 6.424%, 9/25/41 | | | 911,395 | | | | 995,285 | |
Trust 2001-T10 A2, 7.50%, 12/25/41 | | | 1,077,991 | | | | 1,265,513 | |
Trust 2013-106 MA, 4.00%, 2/25/42 | | | 8,901,889 | | | | 9,403,756 | |
Trust 2002-W6 2A1, 6.083%, 6/25/42 | | | 1,419,882 | | | | 1,646,372 | |
Trust 2002-W8 A2, 7.00%, 6/25/42 | | | 1,818,793 | | | | 2,136,687 | |
Trust 2003-W2 1A1, 6.50%, 7/25/42 | | | 3,029,510 | | | | 3,514,184 | |
Trust 2003-W2 1A2, 7.00%, 7/25/42 | | | 1,133,781 | | | | 1,351,765 | |
Trust 2003-W4 4A, 6.703%, 10/25/42 | | | 1,464,364 | | | | 1,698,799 | |
Trust 2012-121 NB, 7.00%, 11/25/42 | | | 2,250,088 | | | | 2,594,093 | |
Trust 2013-98 FA, 1.766%, 9/25/43 | | | 8,814,178 | | | | 8,903,357 | |
Trust 2004-T1 1A2, 6.50%, 1/25/44 | | | 1,756,540 | | | | 2,018,965 | |
Trust 2004-W2 5A, 7.50%, 3/25/44 | | | 3,046,485 | | | | 3,592,359 | |
Trust 2004-W8 3A, 7.50%, 6/25/44 | | | 496,584 | | | | 583,512 | |
Trust 2005-W4 1A2, 6.50%, 8/25/45 | | | 4,717,761 | | | | 5,454,861 | |
Trust 2009-11 MP, 7.00%, 3/25/49 | | | 4,604,823 | | | | 5,365,915 | |
Freddie Mac | |
Series 1078 GZ, 6.50%, 5/15/21 | | | 75,285 | | | | 78,468 | |
Series 16 PK, 7.00%, 8/25/23 | | | 1,647,963 | | | | 1,798,162 | |
Series T-48 1A4, 5.538%, 7/25/33 | | | 26,676,450 | | | | 29,191,263 | |
Series 314 F2, 1.769%, 9/15/43 | | | 18,969,038 | | | | 19,100,386 | |
Series T-51 1A, 6.50%, 9/25/43 | | | 179,587 | | | | 208,819 | |
Series T-59 1A1, 6.50%, 10/25/43 | | | 9,648,323 | | | | 11,389,230 | |
Series 4281 BC, 4.50%, 12/15/43 | | | 55,917,741 | | | | 60,254,883 | |
| | | | | | | | |
| | | | | | | 195,123,664 | |
| | |
| PAGE 8 § DODGE & COX BALANCED FUND | | See accompanying Notes to Financial Statements |
| | | | |
| PORTFOLIO OF INVESTMENTS (unaudited) | | | June 30, 2017 | |
| | | | | | | | |
| DEBT SECURITIES (continued) | | | | | | |
| | |
| | | PAR VALUE | | | VALUE | |
Federal Agency Mortgage Pass-Through: 7.8% | | | | | | | | |
Fannie Mae, 15 Year
6.00%, 7/1/17-3/1/22 | | $ | 295,076 | | | $ | 306,832 | |
6.50%, 4/1/18-11/1/18 | | | 13,855 | | | | 13,908 | |
7.00%, 11/1/18 | | | 2,463 | | | | 2,480 | |
4.50%, 1/1/25-1/1/27 | | | 12,285,403 | | | | 12,955,259 | |
3.50%, 11/1/25-12/1/29 | | | 30,971,311 | | | | 32,242,040 | |
4.00%, 9/1/26-3/1/29 | | | 74,020,480 | | | | 77,888,547 | |
Fannie Mae, 20 Year
4.00%, 11/1/30-2/1/37 | | | 54,225,420 | | | | 57,563,949 | |
4.50%, 1/1/31-12/1/34 | | | 84,970,889 | | | | 91,322,446 | |
3.50%, 6/1/35-4/1/37 | | | 95,732,135 | | | | 99,177,186 | |
Fannie Mae, 30 Year
6.50%, 12/1/28-8/1/39 | | | 19,753,592 | | | | 22,484,974 | |
5.50%, 7/1/33-8/1/37 | | | 12,913,992 | | | | 14,464,795 | |
6.00%, 9/1/36-8/1/37 | | | 17,569,423 | | | | 20,043,921 | |
7.00%, 4/1/37-8/1/37 | | | 6,095,330 | | | | 7,104,888 | |
4.50%, 1/1/39-4/1/46 | | | 208,281,641 | | | | 224,491,113 | |
Fannie Mae, 40 Year
4.50%, 6/1/56 | | | 50,215,968 | | | | 54,073,195 | |
Fannie Mae, Hybrid ARM
2.601%, 9/1/34 | | | 1,160,332 | | | | 1,216,478 | |
2.891%, 12/1/34 | | | 1,654,608 | | | | 1,730,893 | |
2.874%, 1/1/35 | | | 1,980,978 | | | | 2,057,601 | |
3.20%, 1/1/35 | | | 1,284,028 | | | | 1,338,796 | |
2.942%, 8/1/35-9/1/45 | | | 5,556,993 | | | | 5,711,519 | |
2.815%, 9/1/36 | | | 147,560 | | | | 152,064 | |
3.40%, 5/1/37 | | | 1,238,180 | | | | 1,283,333 | |
4.321%, 7/1/39 | | | 1,798,150 | | | | 1,894,243 | |
3.765%, 11/1/40 | | | 2,578,511 | | | | 2,678,409 | |
3.546%, 12/1/40 | | | 5,102,874 | | | | 5,306,234 | |
2.623%, 11/1/43 | | | 5,337,313 | | | | 5,508,911 | |
2.701%, 4/1/44 | | | 14,179,285 | | | | 14,631,013 | |
2.809%, 11/1/44 | | | 22,545,606 | | | | 23,182,338 | |
2.808%, 12/1/44 | | | 15,514,809 | | | | 15,946,990 | |
2.829%, 12/1/45 | | | 22,252,914 | | | | 22,809,208 | |
2.643%, 1/1/46 | | | 19,239,532 | | | | 19,607,282 | |
3.189%, 6/1/47 | | | 15,026,400 | | | | 15,450,196 | |
3.158%, 7/1/47 | | | 20,111,039 | | | | 20,658,960 | |
Freddie Mac, Hybrid ARM
3.795%, 5/1/34 | | | 2,115,113 | | | | 2,253,294 | |
2.752%, 10/1/35 | | | 2,231,665 | | | | 2,358,080 | |
3.292%, 4/1/37 | | | 2,319,428 | | | | 2,450,173 | |
3.059%, 9/1/37 | | | 1,357,493 | | | | 1,448,038 | |
6.231%, 1/1/38 | | | 453,838 | | | | 482,124 | |
3.775%, 2/1/38 | | | 5,346,228 | | | | 5,715,495 | |
4.681%, 7/1/38 | | | 291,631 | | | | 312,313 | |
3.266%, 10/1/38 | | | 1,544,343 | | | | 1,631,255 | |
3.594%, 10/1/41 | | | 1,223,886 | | | | 1,271,529 | |
2.581%, 8/1/42 | | | 9,311,413 | | | | 9,636,396 | |
2.954%, 5/1/44 | | | 14,774,892 | | | | 15,201,518 | |
2.962%, 5/1/44 | | | 1,904,706 | | | | 1,954,774 | |
2.961%, 6/1/44 | | | 4,448,006 | | | | 4,566,619 | |
3.095%, 6/1/44 | | | 5,464,858 | | | | 5,619,362 | |
3.085%, 1/1/45 | | | 28,326,200 | | | | 29,150,042 | |
2.753%, 10/1/45 | | | 11,733,033 | | | | 11,975,411 | |
2.81%, 10/1/45 | | | 13,211,906 | | | | 13,521,124 | |
3.249%, 7/1/47 | | | 11,290,262 | | | | 11,592,904 | |
Freddie Mac Gold, 15 Year
6.50%, 8/1/17-9/1/18 | | | 9,362 | | | | 9,385 | |
6.00%, 2/1/18 | | | 1,090 | | | | 1,090 | |
4.50%, 9/1/24-9/1/26 | | | 8,285,076 | | | | 8,789,160 | |
4.00%, 3/1/25-11/1/26 | | | 31,444,182 | | | | 33,005,701 | |
Freddie Mac Gold, 20 Year
6.50%, 10/1/26 | | | 3,737,807 | | | | 4,102,490 | |
4.50%, 4/1/31-6/1/31 | | | 10,404,178 | | | | 11,158,203 | |
| | | | | | | | |
| | |
| | | PAR VALUE | | | VALUE | |
Freddie Mac Gold, 30 Year
7.75%, 7/25/21 | | $ | 189,249 | | | $ | 198,298 | |
7.47%, 3/17/23 | | | 77,580 | | | | 83,281 | |
6.50%, 12/1/32-4/1/33 | | | 5,681,449 | | | | 6,530,886 | |
7.00%, 11/1/37-9/1/38 | | | 4,769,196 | | | | 5,414,814 | |
5.50%, 12/1/37 | | | 672,110 | | | | 750,350 | |
6.00%, 2/1/39 | | | 1,741,704 | | | | 1,968,193 | |
4.50%, 9/1/41-6/1/47 | | | 160,416,571 | | | | 172,013,995 | |
Ginnie Mae, 30 Year
7.97%, 4/15/20-1/15/21 | | | 193,532 | | | | 205,729 | |
7.50%, 11/15/24-10/15/25 | | | 664,776 | | | | 746,890 | |
| | | | | | | | |
| | | | | | | 1,241,418,917 | |
| | | | | | | | |
| | | | | | | 1,436,542,581 | |
| | | | | | | | |
| | | | | | | 1,600,252,332 | |
| CORPORATE: 11.3% | | | | | | | | |
FINANCIALS: 4.1% | | | | | | | | |
Bank of America Corp. | | | | | | | | |
7.625%, 6/1/19 | | | 14,175,000 | | | | 15,638,427 | |
5.625%, 7/1/20 | | | 19,324,000 | | | | 21,160,244 | |
4.20%, 8/26/24 | | | 5,825,000 | | | | 6,043,146 | |
6.625%, 5/23/36(b) | | | 37,275,000 | | | | 45,097,718 | |
Barclays PLC (United Kingdom) | | | | | | | | |
4.375%, 9/11/24 | | | 23,275,000 | | | | 23,556,441 | |
4.836%, 5/9/28 | | | 4,525,000 | | | | 4,626,342 | |
BNP Paribas SA (France) | | | | | | | | |
4.25%, 10/15/24 | | | 31,175,000 | | | | 32,516,959 | |
4.375%, 9/28/25(c) | | | 13,700,000 | | | | 14,202,132 | |
4.375%, 5/12/26(c) | | | 8,000,000 | | | | 8,285,360 | |
Boston Properties, Inc. | | | | | | | | |
3.85%, 2/1/23 | | | 7,800,000 | | | | 8,205,171 | |
3.125%, 9/1/23 | | | 17,550,000 | | | | 17,764,847 | |
3.80%, 2/1/24 | | | 5,000,000 | | | | 5,187,465 | |
Capital One Financial Corp. | | | | | | | | |
3.50%, 6/15/23 | | | 21,006,000 | | | | 21,424,755 | |
4.20%, 10/29/25 | | | 10,175,000 | | | | 10,260,816 | |
Cigna Corp. | | | | | | | | |
7.875%, 5/15/27 | | | 21,888,000 | | | | 29,372,361 | |
8.30%, 1/15/33 | | | 8,845,000 | | | | 12,300,556 | |
Citigroup, Inc. | | | | | | | | |
4.00%, 8/5/24 | | | 5,925,000 | | | | 6,098,561 | |
7.542%, 10/30/40(b) | | | 37,080,925 | | | | 38,564,162 | |
Equity Residential | | | | | | | | |
3.00%, 4/15/23 | | | 14,775,000 | | | | 14,835,637 | |
2.85%, 11/1/26 | | | 6,000,000 | | | | 5,769,960 | |
HSBC Holdings PLC (United Kingdom) | | | | | | | | |
4.30%, 3/8/26 | | | 4,600,000 | | | | 4,895,421 | |
6.50%, 5/2/36 | | | 27,355,000 | | | | 35,066,976 | |
6.50%, 9/15/37 | | | 21,490,000 | | | | 27,818,375 | |
JPMorgan Chase & Co.
8.75%, 9/1/30(b) | | | 23,042,000 | | | | 34,476,593 | |
Lloyds Banking Group PLC (United Kingdom) | | | | | | | | |
4.50%, 11/4/24 | | | 19,575,000 | | | | 20,386,208 | |
4.65%, 3/24/26 | | | 11,100,000 | | | | 11,567,177 | |
Navient Corp. | | | | | | | | |
4.625%, 9/25/17 | | | 9,550,000 | | | | 9,573,875 | |
8.45%, 6/15/18 | | | 21,054,000 | | | | 22,169,862 | |
Royal Bank of Scotland Group PLC (United Kingdom) | | | | | | | | |
6.125%, 12/15/22 | | | 44,666,000 | | | | 48,896,183 | |
6.00%, 12/19/23 | | | 4,000,000 | | | | 4,412,928 | |
Unum Group | | | | | | | | |
7.19%, 2/1/28 | | | 8,305,000 | | | | 9,902,865 | |
7.25%, 3/15/28 | | | 2,030,000 | | | | 2,581,376 | |
6.75%, 12/15/28 | | | 11,368,000 | | | | 13,871,666 | |
| | |
| See accompanying Notes to Financial Statements | | DODGE & COX BALANCED FUND §PAGE 9 |
| | | | |
| PORTFOLIO OF INVESTMENTS (unaudited) | | | June 30, 2017 | |
| | | | | | | | |
| DEBT SECURITIES (continued) | | | | | | |
| | |
| | | PAR VALUE | | | VALUE | |
Wells Fargo & Co. | | | | | | | | |
1.873%, 12/6/19 | | $ | 11,575,000 | | | $ | 11,710,404 | |
2.15%, 12/6/19 | | | 22,800,000 | | | | 22,906,658 | |
4.30%, 7/22/27 | | | 21,995,000 | | | | 23,064,837 | |
| | | | | | | | |
| | | | | | | 644,212,464 | |
INDUSTRIALS: 6.8% | | | | | | | | |
AT&T, Inc. | | | | | | | | |
5.35%, 9/1/40 | | | 27,575,000 | | | | 29,233,223 | |
4.75%, 5/15/46 | | | 7,000,000 | | | | 6,873,622 | |
5.65%, 2/15/47 | | | 5,175,000 | | | | 5,706,090 | |
4.50%, 3/9/48 | | | 24,560,000 | | | | 23,152,884 | |
BHP Billiton, Ltd. (Australia)
6.75%, 10/19/75(b)(c) | | | 19,800,000 | | | | 22,623,282 | |
Burlington Northern Santa Fe LLC(e) | | | | | | | | |
5.72%, 1/15/24 | | | 3,598,989 | | | | 3,965,348 | |
5.342%, 4/1/24 | | | 7,331,181 | | | | 7,980,199 | |
5.629%, 4/1/24 | | | 11,444,876 | | | | 12,559,447 | |
Cemex SAB de CV (Mexico) | | | | | | | | |
6.00%, 4/1/24(c) | | | 10,575,000 | | | | 11,236,995 | |
5.70%, 1/11/25(c) | | | 22,475,000 | | | | 23,851,594 | |
6.125%, 5/5/25(c) | | | 8,100,000 | | | | 8,727,750 | |
Charter Communications, Inc. | | | | | | | | |
8.75%, 2/14/19 | | | 7,840,000 | | | | 8,623,553 | |
8.25%, 4/1/19 | | | 21,815,000 | | | | 24,066,090 | |
4.125%, 2/15/21 | | | 2,260,000 | | | | 2,363,106 | |
4.908%, 7/23/25 | | | 11,600,000 | | | | 12,532,779 | |
6.55%, 5/1/37 | | | 11,000,000 | | | | 13,148,993 | |
6.75%, 6/15/39 | | | 2,110,000 | | | | 2,585,474 | |
6.484%, 10/23/45 | | | 12,070,000 | | | | 14,504,567 | |
5.375%, 5/1/47(c) | | | 4,100,000 | | | | 4,343,351 | |
Cox Enterprises, Inc. | | | | | | | | |
3.25%, 12/15/22(c) | | | 6,240,000 | | | | 6,226,166 | |
2.95%, 6/30/23(c) | | | 37,166,000 | | | | 36,244,989 | |
3.85%, 2/1/25(c) | | | 24,125,000 | | | | 24,308,905 | |
CRH PLC (Ireland)
3.875%, 5/18/25(c) | | | 17,100,000 | | | | 17,772,235 | |
Dell Technologies, Inc. | | | | | | | | |
4.42%, 6/15/21(c) | | | 25,415,000 | | | | 26,790,536 | |
5.45%, 6/15/23(c) | | | 14,966,000 | | | | 16,238,619 | |
Dillard’s, Inc. | | | | | | | | |
7.875%, 1/1/23 | | | 8,660,000 | | | | 10,030,298 | |
7.75%, 7/15/26 | | | 50,000 | | | | 57,913 | |
7.75%, 5/15/27 | | | 540,000 | | | | 622,492 | |
7.00%, 12/1/28 | | | 15,135,000 | | | | 16,765,176 | |
Dow Chemical Co. | | | | | | | | |
7.375%, 11/1/29 | | | 17,000,000 | | | | 22,829,708 | |
9.40%, 5/15/39 | | | 5,677,000 | | | | 9,551,677 | |
Ford Motor Credit Co. LLC(e) | | | | | | | | |
2.681%, 1/9/20 | | | 13,000,000 | | | | 13,086,476 | |
5.75%, 2/1/21 | | | 12,700,000 | | | | 13,973,213 | |
5.875%, 8/2/21 | | | 12,945,000 | | | | 14,434,076 | |
4.25%, 9/20/22 | | | 9,593,000 | | | | 10,076,545 | |
4.375%, 8/6/23 | | | 7,900,000 | | | | 8,310,476 | |
Imperial Brands PLC (United Kingdom) | | | | | | | | |
3.75%, 7/21/22(c) | | | 10,475,000 | | | | 10,904,695 | |
4.25%, 7/21/25(c) | | | 44,175,000 | | | | 46,630,821 | |
Kinder Morgan, Inc. | | | | | | | | |
4.30%, 6/1/25 | | | 11,050,000 | | | | 11,489,436 | |
5.50%, 3/1/44 | | | 25,893,000 | | | | 26,758,318 | |
5.40%, 9/1/44 | | | 18,119,000 | | | | 18,297,273 | |
Macy’s, Inc. | | | | | | | | |
6.90%, 1/15/32 | | | 42,110,000 | | | | 43,698,052 | |
6.70%, 7/15/34 | | | 5,890,000 | | | | 6,103,813 | |
Naspers, Ltd. (South Africa) | | | | | | | | |
6.00%, 7/18/20(c) | | | 16,900,000 | | | | 18,252,000 | |
| | | | | | | | |
| | |
| | | PAR VALUE | | | VALUE | |
5.50%, 7/21/25(c) | | $ | 20,075,000 | | | $ | 21,470,213 | |
4.85%, 7/6/27(c) | | | 14,200,000 | | | | 14,235,500 | |
RELX PLC (United Kingdom)
3.125%, 10/15/22 | | | 17,458,000 | | | | 17,495,971 | |
Telecom Italia SPA (Italy) | | | | | | | | |
7.175%, 6/18/19 | | | 27,527,000 | | | | 30,038,839 | |
5.303%, 5/30/24(c) | | | 25,025,000 | | | | 26,839,312 | |
7.20%, 7/18/36 | | | 11,596,000 | | | | 13,444,113 | |
7.721%, 6/4/38 | | | 7,062,000 | | | | 8,545,020 | |
Time Warner, Inc. | | | | | | | | |
7.625%, 4/15/31 | | | 15,500,000 | | | | 21,143,271 | |
7.70%, 5/1/32 | | | 16,944,000 | | | | 23,590,250 | |
TransCanada Corp. (Canada) | | | | | | | | |
5.625%, 5/20/75(b) | | | 20,570,000 | | | | 21,728,297 | |
5.875%, 8/15/76(b) | | | 4,500,000 | | | | 4,883,400 | |
5.30%, 3/15/77(b) | | | 18,885,000 | | | | 19,413,780 | |
Twenty-First Century Fox, Inc. | | | | | | | | |
6.15%, 3/1/37 | | | 15,000,000 | | | | 18,760,635 | |
6.65%, 11/15/37 | | | 4,638,000 | | | | 6,125,346 | |
Ultrapar Participacoes SA (Brazil)
5.25%, 10/6/26(c) | | | 15,050,000 | | | | 15,027,425 | |
Union Pacific Corp.
6.176%, 1/2/31 | | | 8,438,236 | | | | 9,797,509 | |
Verizon Communications, Inc. | | | | | | | | |
4.272%, 1/15/36 | | | 11,847,000 | | | | 11,446,903 | |
4.522%, 9/15/48 | | | 7,000,000 | | | | 6,636,847 | |
5.012%, 4/15/49(c) | | | 49,149,000 | | | | 49,705,612 | |
Vulcan Materials Co.
7.50%, 6/15/21 | | | 20,340,000 | | | | 24,002,441 | |
Xerox Corp. | | | | | | | | |
6.35%, 5/15/18 | | | 16,835,000 | | | | 17,461,110 | |
4.50%, 5/15/21 | | | 13,311,000 | | | | 13,941,369 | |
Zoetis, Inc. | | | | | | | | |
3.25%, 2/1/23 | | | 2,150,000 | | | | 2,203,234 | |
4.50%, 11/13/25 | | | 17,545,000 | | | | 19,156,561 | |
| | | | | | | | |
| | | | | | | 1,084,625,213 | |
UTILITIES: 0.4% | | | | | | | | |
Dominion Energy, Inc. | | | | | | | | |
4.104%, 4/1/21 | | | 5,300,000 | | | | 5,562,292 | |
5.75%, 10/1/54(b) | | | 22,950,000 | | | | 24,556,500 | |
Enel SPA (Italy) | | | | | | | | |
6.80%, 9/15/37(c) | | | 13,700,000 | | | | 17,571,044 | |
6.00%, 10/7/39(c) | | | 13,352,000 | | | | 15,897,051 | |
| | | | | | | | |
| | | | | | | 63,586,887 | |
| | | | | | | | |
| | | | | | | 1,792,424,564 | |
| | | | | | | | |
TOTAL DEBT SECURITIES
(Cost $4,314,864,994) | | | | | | $ | 4,502,595,888 | |
|
| EQUITY INDEX PUT OPTIONS PURCHASED: 0.6% | |
| | |
| | | CONTRACTS | | | VALUE | |
S&P 500 Index, 12/15/17 at $2,275 | | | 633,819 | | | $ | 25,226,586 | |
S&P 500 Index, 12/21/18 at $2,375 | | | 150,000 | | | | 23,505,297 | |
S&P 500 Index, 6/15/18 at $2,375 | | | 450,000 | | | | 51,817,502 | |
| | | | | | | | |
TOTAL EQUITY INDEX PUT OPTIONS PURCHASED
(Cost $160,030,157) | | | $ | 100,549,385 | |
| |
| SHORT-TERM INVESTMENTS: 1.9% | | | | |
| | |
| | | PAR VALUE | | | VALUE | |
MONEY MARKET FUND: 0.1% | | | | | | | | |
State Street Institutional Treasury Plus Money Market Fund | | $ | 15,856,875 | | | $ | 15,856,875 | |
| | |
| PAGE 10 § DODGE & COX BALANCED FUND | | See accompanying Notes to Financial Statements |
| | | | |
| PORTFOLIO OF INVESTMENTS (unaudited) | | | June 30, 2017 | |
| | | | | | | | |
| SHORT-TERM INVESTMENTS (continued) | | | | |
| | |
| | | PAR VALUE | | | VALUE | |
REPURCHASE AGREEMENT: 1.8% | | | | | |
Fixed Income Clearing Corporation(d)
0.60%, dated 6/30/17, due 7/3/17, maturity value $281,292,064 | | $ | 281,278,000 | | | $ | 281,278,000 | |
| | | | | | | | |
TOTAL SHORT-TERM INVESTMENTS
(Cost $297,134,875) | | | $ | 297,134,875 | |
| | | | | | | | |
TOTAL INVESTMENTS
(Cost $11,827,590,633) | | | 100.6 | % | | $ | 15,953,039,049 | |
OTHER ASSETS LESS LIABILITIES | | | (0.6 | %) | | | (91,937,253 | ) |
| | | | | | | | |
| NET ASSETS | | | 100.0 | % | | $ | 15,861,101,796 | |
| | | | | | | | |
| (c) | Security exempt from registration under Rule 144A of the Securities Act of 1933. The security may be resold in transactions exempt from registration, normally to qualified institutional buyers. As of June 30, 2017, all such securities in total represented $641,590,250 or 4.0% of net assets. These securities have been deemed liquid by Dodge & Cox, investment manager, pursuant to procedures approved by the Fund’s Board of Trustees. |
| (d) | Repurchase agreement is collateralized by U.S. Treasury Notes 1.25%-1.375%, 6/30/23-7/31/23. Total collateral value is $286,907,537. |
| (e) | Subsidiary (see below) |
In determining a company’s country designation, the Fund generally references the country of incorporation. In cases where the Fund considers the country of incorporation to be a “jurisdiction of convenience” chosen primarily for tax purposes or in other limited circumstances, the Fund uses the country designation of an appropriate broad-based market index. In those cases, two countries are listed—the country of incorporation and the country designated by an appropriate index, respectively.
Debt securities are grouped by parent company unless otherwise noted. Actual securities may be issued by the listed parent company or one of its subsidiaries.
ADR: American Depositary Receipt
ARM: Adjustable Rate Mortgage
CMO: Collateralized Mortgage Obligation
DUS: Delegated Underwriting and Servicing
GO: General Obligation
RB: Revenue Bond
REMIC: Real Estate Mortgage Investment Conduit
FUTURES CONTRACTS
| | | | | | | | | | | | | | | | |
| Description | | Number of
Contracts | | | Expiration
Date | | | Notional
Amount | | | Unrealized
Appreciation/
(Depreciation) | |
10 Year U.S. Treasury Note—Short Position | | | 1,334 | | | | Sep 2017 | | | $ | (167,458,688 | ) | | $ | 272,915 | |
Long Term U.S. Treasury Bond—Short Position | | | 741 | | | | Sep 2017 | | | | (122,913,375 | ) | | | (2,218,939 | ) |
| | | | | | | | | | | | | | | | |
| | | | | | | | | | | | | | $ | (1,946,024 | ) |
| | | | | | | | | | | | | | | | |
| | |
| See accompanying Notes to Financial Statements | | DODGE & COX BALANCED FUND §PAGE 11 |
| | | | |
STATEMENT OF ASSETS AND LIABILITIES (unaudited) | |
| |
| | | June 30, 2017 | |
ASSETS: | | | | |
Investments, at value (cost $11,667,560,476) | | $ | 15,953,039,049 | |
Cash held at broker | | | 4,424,000 | |
Receivable for investments sold | | | 12,937,535 | |
Receivable from broker for variation margin | | | 1,455,225 | |
Receivable for Fund shares sold | | | 9,499,488 | |
Dividends and interest receivable | | | 54,706,282 | |
Prepaid expenses and other assets | | | 31,725 | |
| | | | |
| | | 16,036,093,304 | |
| | | | |
LIABILITIES: | | | | |
Collateral payable for option contracts | | | 102,180,000 | |
Payable for investments purchased | | | 60,832,487 | |
Payable for Fund shares redeemed | | | 4,815,651 | |
Management fees payable | | | 6,510,902 | |
Accrued expenses | | | 652,468 | |
| | | | |
| | | 174,991,508 | |
| | | | |
NET ASSETS | | $ | 15,861,101,796 | |
| | | | |
NET ASSETS CONSIST OF: | | | | |
Paid in capital | | $ | 11,326,003,032 | |
Undistributed net investment income | | | 2,544,275 | |
Undistributed net realized gain | | | 409,052,097 | |
Net unrealized appreciation | | | 4,123,502,392 | |
| | | | |
| | $ | 15,861,101,796 | |
| | | | |
Fund shares outstanding (par value $0.01 each, unlimited shares authorized) | | | 149,372,846 | |
Net asset value per share | | $ | 106.18 | |
|
STATEMENT OF OPERATIONS (unaudited) | |
| |
| | | Six Months Ended
June 30, 2017 | |
INVESTMENT INCOME: | | | | |
Dividends (net of foreign taxes of $4,287,101) | | $ | 103,431,977 | |
Interest | | | 96,426,432 | |
| | | | |
| | | 199,858,409 | |
| | | | |
EXPENSES: | | | | |
Management fees | | | 39,060,375 | |
Custody and fund accounting fees | | | 132,598 | |
Transfer agent fees | | | 800,011 | |
Professional services | | | 96,948 | |
Shareholder reports | | | 149,989 | |
Registration fees | | | 108,536 | |
Trustees’ fees | | | 130,000 | |
ADR depository services fees | | | 673,109 | |
Miscellaneous | | | 135,688 | |
| | | | |
| | | 41,287,254 | |
| | | | |
NET INVESTMENT INCOME | | | 158,571,155 | |
| | | | |
REALIZED AND UNREALIZED GAIN (LOSS): | | | | |
Net realized gain (loss) | | | | |
Investments | | | 425,827,092 | |
Futures contracts | | | (7,334,272 | ) |
Option contracts | | | (223,936 | ) |
Net change in unrealized appreciation/depreciation | | | | |
Investments | | | 305,474,689 | |
Futures contracts | | | (3,410,331 | ) |
Option contracts | | | (59,480,774 | ) |
| | | | |
Net realized and unrealized gain | | | 660,852,468 | |
| | | | |
NET CHANGE IN NET ASSETS FROM OPERATIONS | | $ | 819,423,623 | |
| | | | |
| | | | | | | | |
STATEMENT OF CHANGES IN NET ASSETS (unaudited) | |
| | |
| | | Six Months Ended
June 30, 2017 | | | Year Ended
December 31, 2016 | |
OPERATIONS: | | | | | | | | |
Net investment income | | $ | 158,571,155 | | | $
| 342,632,985
|
|
Net realized gain | | | 418,268,884 | | | | 652,399,623 | |
Net change in unrealized appreciation/depreciation | | | 242,583,584 | | | | 1,209,354,799 | |
| | | | | | | | |
| | | 819,423,623 | | | | 2,204,387,407 | |
| | | | | | | | |
| | |
DISTRIBUTIONS TO SHAREHOLDERS FROM: | | | | | | | | |
Net investment income | | | (158,421,260 | ) | | | (342,522,606 | ) |
Net realized gain | | | (235,339,962 | ) | | | (577,591,290 | ) |
| | | | | | | | |
Total distributions | | | (393,761,222 | ) | | | (920,113,896 | ) |
| | | | | | | | |
| | |
FUND SHARE TRANSACTIONS: | | | | | | | | |
Proceeds from sale of shares | | | 986,602,960 | | | | 1,311,438,514 | |
Reinvestment of distributions | | | 373,059,416 | | | | 873,912,502 | |
Cost of shares redeemed | | | (1,305,785,901 | ) | | | (2,357,390,650 | ) |
| | | | | | | | |
Net change from Fund share transactions | | | 53,876,475 | | | | (172,039,634 | ) |
| | | | | | | | |
Total change in net assets | | | 479,538,876 | | | | 1,112,233,877 | |
| | |
NET ASSETS: | | | | | | | | |
Beginning of period | | | 15,381,562,920 | | | | 14,269,329,043 | |
| | | | | | | | |
End of period (including undistributed net investment income of $2,544,275 and $2,394,380, respectively) | | $ | 15,861,101,796 | | | $
| 15,381,562,920
|
|
| | | | | | | | |
| | |
SHARE INFORMATION: | | | | | | | | |
Shares sold | | | 9,325,656 | | | | 13,426,666 | |
Distributions reinvested | | | 3,559,314 | | | | 8,834,100 | |
Shares redeemed | | | (12,340,967 | ) | | | (24,554,403 | ) |
| | | | | | | | |
Net change in shares outstanding | | | 544,003 | | | | (2,293,637 | ) |
| | | | | | | | |
| | |
| PAGE 12 § DODGE & COX BALANCED FUND | | See accompanying Notes to Financial Statements |
NOTES TO FINANCIAL STATEMENTS (unaudited)
NOTE 1—ORGANIZATION AND SIGNIFICANT ACCOUNTING POLICIES
Dodge & Cox Balanced Fund (the “Fund”) is one of the series constituting the Dodge & Cox Funds (the “Trust” or the “Funds”). The Trust is organized as a Delaware statutory trust and is registered under the Investment Company Act of 1940, as amended, as an open-end management investment company. The Fund commenced operations on June 26, 1931, and seeks regular income, conservation of principal, and an opportunity for long-term growth of principal and income. Risk considerations and investment strategies of the Fund are discussed in the Fund’s Prospectus.
The financial statements have been prepared in conformity with accounting principles generally accepted in the United States of America, which require the use of estimates and assumptions by management. Actual results may differ from those estimates. Significant accounting policies are as follows:
Security valuation The Fund’s net assets are normally valued as of the scheduled close of trading on the New York Stock Exchange (NYSE), generally 4:00 p.m. Eastern Time, each day that the NYSE is open for business. Portfolio securities and other financial instruments for which market quotes are readily available are valued at market value. Listed securities are generally valued using the official quoted close price or the last sale on the exchange that is determined to be the primary market for the security.
Debt securities, certain preferred stocks, and derivatives traded over the counter, are valued using prices received from independent pricing services which utilize dealer quotes, recent transaction data, pricing models, and other inputs to arrive at market-based valuations. Pricing models may consider quoted prices for similar securities, interest rates, cash flows (including prepayment speeds), and credit risk. Exchange-traded derivatives are valued at the settlement price determined by the relevant exchange. Short-term securities less than 60 days to maturity may be valued at amortized cost if amortized cost approximates current value. Mutual funds are valued at their respective net asset values. Security values are not discounted based on the size of the Fund’s position and may differ from the value a Fund receives upon sale of the securities. All securities held by the Fund are denominated in U.S. dollars.
If market quotations are not readily available or if normal valuation procedures produce valuations that are deemed unreliable or inappropriate under the circumstances existing at the time, the investment will be valued at fair value as determined in good faith by or under the direction of the Fund’s Board of Trustees. The Board of Trustees has appointed Dodge & Cox, the Fund’s investment manager, to make fair value determinations in accordance with the Dodge & Cox Funds Valuation Policies (“Valuation Policies”), subject to Board oversight. Dodge & Cox has established a Pricing Committee that is comprised of representatives from Treasury, Legal, Compliance, and Operations. The Pricing Committee is responsible for implementing the Valuation Policies, including determining the fair value of
securities and other investments when necessary. The Pricing Committee considers relevant indications of value that are reasonably available to it in determining the fair value assigned to a particular security, such as the value of similar financial instruments, trading volumes, contractual restrictions on disposition, related corporate actions, and changes in economic conditions. In doing so, the Pricing Committee employs various methods for calibrating fair valuation approaches, including a regular review of key inputs and assumptions, back-testing, and review of any related market activity.
Valuing securities through a fair value determination involves greater reliance on judgment than valuation of securities based on readily available market quotations. In some instances, lack of information and uncertainty as to the significance of information may lead to a conclusion that a prior valuation is the best indication of a security’s value. When fair value pricing is employed, the prices of securities used by the Fund to calculate its NAV may differ from quoted or published prices for the same securities.
Security transactions, investment income, expenses, and distributions Security transactions are recorded on the trade date. Realized gains and losses on securities sold are determined on the basis of identified cost.
Dividend income and corporate action transactions are recorded on the ex-dividend date, or when the Fund first learns of the dividend/corporate action if the ex-dividend date has passed. Withholding taxes on foreign dividends have been provided for in accordance with the Fund’s understanding of the applicable country’s tax rules and rates. Non-cash dividends included in dividend income, if any, are recorded at the fair market value of the securities received. Dividends characterized as return of capital for U.S. tax purposes are recorded as a reduction of cost of investments and/or realized gain.
Interest income is recorded on the accrual basis. Interest income includes coupon interest, amortization of premium and accretion of discount on debt securities, and gain/loss on paydowns. The ability of the issuers of the debt securities held by the Fund to meet their obligations may be affected by economic developments in a specific industry, state, or region. Debt obligations may be placed on non-accrual status and related interest income may be reduced by ceasing current accruals and writing off interest receivables when the collection of all or a portion of interest has become doubtful. A debt obligation is removed from non-accrual status when the issuer resumes interest payments or when collectibility of interest is reasonably assured.
Expenses are recorded on the accrual basis. Some expenses of the Trust can be directly attributed to a specific series. Expenses which cannot be directly attributed are allocated among the Funds in the Trust using methodologies determined by the nature of the expense.
Distributions to shareholders are recorded on the ex-dividend date.
Foreign taxes The Fund may be subject to foreign taxes which may be imposed by certain countries in which the Fund invests. The Fund endeavors to record foreign taxes based on
DODGE & COX BALANCED FUND §PAGE 13
NOTES TO FINANCIAL STATEMENTS (unaudited)
applicable foreign tax law. Withholding taxes are incurred on certain foreign dividends and are accrued at the time the associated dividend is recorded. The Fund files withholding tax reclaims in certain jurisdictions to recover a portion of amounts previously withheld. The Fund records a reclaim receivable based on, among other things, a jurisdiction’s legal obligation to pay reclaims as well as payment history and market convention. In consideration of recent decisions rendered by European courts, the Fund has filed for additional reclaims related to prior years. A corresponding receivable is established when both the amount is known and significant contingencies or uncertainties regarding collectability are removed. These amounts, if any, are reported in “dividends and interest receivable” on the Statement of Assets and Liabilities.
Repurchase agreements Repurchase agreements are transactions under which a Fund purchases a security from a dealer counterparty and agrees to resell the security to that counterparty on a specified future date at the same price, plus a specified interest rate. The Fund’s repurchase agreements are secured by U.S. government or agency securities. It is the Fund’s policy that its custodian take possession of the underlying collateral securities, the fair value of which exceeds the principal amount of the repurchase transaction, including accrued interest, at all times. In the event of default by the counterparty, the Fund has the contractual right to liquidate the collateral securities and to apply the proceeds in satisfaction of the obligation.
Futures Contracts Futures contracts involve an obligation to purchase or sell (depending on whether the Fund has entered a long or short futures contract, respectively) an asset at a future date, at a price set at the time of the contract. Upon entering into a futures contract, the Fund is required to deposit an amount of cash or liquid assets (referred to as initial margin) in a segregated account with the clearing broker. Subsequent payments (referred to as variation margin) to and from the clearing broker are made on a daily basis based on changes in the market value of futures contracts. Futures contracts are traded publicly and their market value changes daily. Changes in the market value of open futures contracts are recorded as unrealized appreciation or depreciation in the Statement of Operations. Realized gains and losses on futures contracts are recorded in the Statement of Operations at the closing or expiration of the contracts. Cash deposited with a broker as initial margin is recorded on the Statement of Assets and Liabilities. A receivable and/or payable to brokers for daily variation margin is also recorded on the Statement of Assets and Liabilities.
Investments in futures contracts may include certain risks, which may be different from, and potentially greater than, those of the underlying securities. To the extent the Fund uses futures, it is exposed to additional volatility and potential losses resulting from leverage.
The Fund has maintained short Treasury futures contracts to assist with the management of the portfolio’s interest rate exposure. During the six months ended June 30, 2017, these Treasury futures contracts had notional values ranging from 1% to 3% of net assets.
Equity Index Put Options. An equity index put option gives its holder the right (but not the obligation) to sell the future value of an equity stock index, such as the S&P 500 index, at a predetermined strike price. A put option has value at its expiration if the index price is lower than the strike price. The buyer of an equity index put option pays a premium amount to purchase the contract, but has no payment obligations thereafter. Changes in the value of open equity index put options are recorded as unrealized appreciation or depreciation in the Statement of Operations. Realized gains or losses are recorded in the Statement of Operations at the closing or expiration of the options. Cash collateral received from the broker is recorded on the Statement of Assets and Liabilities.
The Fund has entered into over-the-counter equity index put options to hedge against a general downturn in the equity markets. During the six months ended June 30, 2017, these equity index put options had notional values ranging from 0% to 1% of net assets.
Indemnification Under the Trust’s organizational documents, its officers and trustees are indemnified against certain liabilities arising out of the performance of their duties to the Trust. In addition, in the normal course of business the Trust enters into contracts that provide general indemnities to other parties. The Trust’s maximum exposure under these arrangements is unknown as this would involve future claims that may be made against the Trust that have not yet occurred.
NOTE 2—VALUATION MEASUREMENTS
Various inputs are used in determining the value of the Fund’s investments. These inputs are summarized in the three broad levels listed below.
| § | | Level 1: Quoted prices in active markets for identical securities |
| § | | Level 2: Other significant observable inputs (including quoted prices for similar securities, market indices, interest rates, credit risk, forward exchange rates, etc.) |
| § | | Level 3: Significant unobservable inputs (including Fund management’s assumptions in determining the fair value of investments) |
The inputs or methodology used for valuing securities are not necessarily an indication of the risk associated with investing in those securities.
PAGE 14 § DODGE & COX BALANCED FUND
NOTES TO FINANCIAL STATEMENTS (unaudited)
The following is a summary of the inputs used to value the Fund’s holdings at June 30, 2017:
| | | | | | | | |
| Classification(a) | | LEVEL 1
(Quoted Prices) | | | LEVEL 2
(Other Significant
Observable Inputs) | |
Securities | | | | | | | | |
Common Stocks(b) | | $ | 10,250,139,306 | | | $ | — | |
Preferred Stocks | | | — | | | | 802,619,595 | |
Debt Securities | | | | | | | | |
U.S. Treasury | | | — | | | | 835,642,443 | |
Government-Related | | | — | | | | 274,276,549 | |
Securitized | | | — | | | | 1,600,252,332 | |
Corporate | | | — | | | | 1,792,424,564 | |
Short-term Investments | | | | | | | | |
Money Market Fund | | | 15,856,875 | | | | — | |
Repurchase Agreement | | | — | | | | 281,278,000 | |
| | | | | | | | |
Total Securities | | $ | 10,265,996,181 | | | $ | 5,586,493,483 | |
| | | | | | | | |
Other Financial Instruments | | | | | | | | |
Equity Index Put Options Purchased | | $ | — | | | $ | 100,549,385 | |
Futures Contracts | | | | | | | | |
Appreciation | | | 272,915 | | | | — | |
Depreciation | | | (2,218,939 | ) | | | — | |
| | | | | | | | | |
| (a) | There were no transfers between Level 1 and Level 2 during the six months ended June 30, 2017. There were no Level 3 securities at June 30, 2017 and December 31, 2016, and there were no transfers to Level 3 during the period. |
| (b) | All common stocks held in the Fund are Level 1 securities. For a detailed break-out of common stocks by major industry classification, please refer to the Portfolio of Investments. |
NOTE 3—RELATED PARTY TRANSACTIONS
Management fees Under a written agreement approved by a unanimous vote of the Board of Trustees, the Fund pays an annual management fee of 0.50% of the Fund’s average daily net assets to Dodge & Cox, investment manager of the Fund.
Fund officers and trustees All officers and two of the trustees of the Trust are officers or employees of Dodge & Cox. The Trust pays a fee only to those trustees who are not affiliated with Dodge & Cox.
NOTE 4—INCOME TAX INFORMATION AND DISTRIBUTIONS TO SHAREHOLDERS
A provision for federal income taxes is not required since the Fund intends to continue to qualify as a regulated investment company under Subchapter M of the Internal Revenue Code and distribute all of its taxable income to shareholders. Distributions are determined in accordance with income tax regulations, and such amounts may differ from net investment income and realized gains for financial reporting purposes. Financial reporting records are adjusted for permanent book to tax differences at year end to reflect tax character.
Book to tax differences are primarily due to differing treatments of wash sales, net short-term realized gain (loss), certain dividends, and futures contracts. At June 30, 2017, the cost of investments for federal income tax purposes was $11,835,238,566.
Distributions during the periods noted below were characterized as follows for federal income tax purposes:
| | | | | | | | |
| | | Six Months Ended
June 30, 2017 | | | Year Ended
December 31, 2016 | |
Ordinary income | | $ | 182,883,648 | | | $ | 353,285,575 | |
| | ($ | 1.236 per share | ) | | ($ | 2.414 per share | ) |
Long-term capital gain | | $ | 210,877,574 | | | $ | 566,828,321 | |
| | ($ | 1.431 per share | ) | | ($ | 3.884 per share | ) |
At June 30, 2017, the tax basis components of distributable earnings were as follows:
| | | | |
Unrealized appreciation | | $ | 4,478,394,185 | |
Unrealized depreciation | | | (360,593,702 | ) |
| | | | |
Net unrealized appreciation | | | 4,117,800,483 | |
Undistributed ordinary income | | | 14,398,537 | |
Undistributed long-term capital gain | | | 402,899,744 | |
| | | | | |
Fund management has reviewed the tax positions for open periods (three years and four years, respectively, from filing the Fund’s Federal and State tax returns) as applicable to the Fund, and has determined that no provision for income tax is required in the Fund’s financial statements.
NOTE 5—LOAN FACILITIES
Pursuant to an exemptive order issued by the Securities and Exchange Commission (SEC), the Fund may participate in an interfund lending facility (Facility). The Facility allows the Fund to borrow money from or loan money to the Funds. Loans under the Facility are made for temporary or emergency purposes, such as to fund shareholder redemption requests. Interest on borrowings is the average of the current repurchase agreement rate and the bank loan rate. There was no activity in the Facility during the period.
All Funds in the Trust participate in a $500 million committed credit facility (Line of Credit) with State Street Bank and Trust Company, to be utilized for temporary or emergency purposes to fund shareholder redemptions or for other short-term liquidity purposes. The maximum amount available to the Fund is $250 million. Each Fund pays an annual commitment fee on its pro-rata portion of the Line of Credit. For the six months ended June 30, 2017, the Fund’s commitment fee amounted to $50,906 and is reflected as a Miscellaneous Expense in the Statement of Operations. Interest on borrowings is charged at the prevailing rate. There were no borrowings on the Line of Credit during the period.
NOTE 6—PURCHASES AND SALES OF INVESTMENTS
For the six months ended June 30, 2017, purchases and sales of securities, other than short-term securities and U.S. government securities, aggregated $828,872,086 and $1,343,859,426, respectively. For the six months ended June 30, 2017, purchases and sales of U.S. government securities aggregated $733,676,419 and $407,251,572, respectively.
DODGE & COX BALANCED FUND §PAGE 15
NOTES TO FINANCIAL STATEMENTS (unaudited)
NOTE 7—NEW ACCOUNTING GUIDANCE
In October 2016, the SEC issued a new rule, Investment Company Reporting Modernization, which, among other provisions, amends Regulation S-X to require standardized, enhanced disclosures, particularly related to derivatives, in investment company financial statements. Compliance with the guidance is required for financial statements for fiscal periods ending on or after August 1, 2017. Management is currently assessing the impact of this rule to the Fund’s financial statements and other filings and does not expect any impact to the Fund’s net assets or results of operations.
In March 2017, the Financial Accounting Standards Board issued an update to amend the amortization period for certain purchased callable debt securities held at a premium. The amendments shorten the amortization period for premiums to the
earliest call date, but do not require an accounting change for securities held at a discount. The amendments are effective for financial statements for fiscal years beginning after December 15, 2018, and interim periods within those fiscal years. Management is evaluating the impact, if any, of this guidance on the Fund’s financial statements and disclosures.
NOTE 8—SUBSEQUENT EVENTS
Fund management has determined that no material events or transactions occurred subsequent to June 30, 2017, and through the date of the Fund’s financial statements issuance, which require additional disclosure in the Fund’s financial statements.
PAGE 16 § DODGE & COX BALANCED FUND
NOTES TO FINANCIAL STATEMENTS (unaudited)
NOTE 9—ADDITIONAL DERIVATIVES INFORMATION
The Fund has entered into over-the-counter derivatives, such as put options (each, a “Derivative”). Each Derivative is subject to a negotiated master agreement (based on a form published by the International Swaps and Derivatives Association (“ISDA”)) governing all Derivatives between the Fund and the relevant dealer counterparty. The master agreements specify (i) events of default and other events permitting a party to terminate some or all of the Derivatives thereunder and (ii) the process by which those Derivatives will be valued for purposes of determining termination payments. If some or all of the Derivatives under a master agreement are terminated because of an event of default or similar event, the values of all terminated Derivatives must be netted to determine a single payment owed by one party to the other. Some master agreements contain collateral terms requiring the parties to post collateral in respect of some or all of the Derivatives thereunder based on the net market value of those Derivatives, subject to a minimum exposure threshold. To the extent amounts owed to the Fund by its counterparties are not collateralized, the Fund is at risk of those counterparties’ non-performance. The Fund attempts to mitigate counterparty credit risk by entering into Derivatives only with counterparties it believes to be of good credit quality and by monitoring the financial stability of those counterparties.
For financial reporting purposes, the Fund does not offset financial assets and liabilities that are subject to a master netting arrangement in the Statement of Assets and Liabilities. Derivatives are presented in the Statement of Assets and Liabilities as investments. Collateral held by the Fund for derivatives are reported gross and presented as “Collateral for option contracts” in the Statement of Assets and Liabilities.
The netting of assets and liabilities and the offsetting of collateral pledged or received are based on contractual netting/set-off provisions in the ISDA master agreement. The following table presents the Fund’s net exposure for derivative instruments that are subject to enforceable master netting arrangements as of June 30, 2017. The net amount represents the receivable from (payable to) the counterparty in the event of a default.
| | | | | | | | | | | | | | | | |
| Counterparty | | Gross
Derivative Assets | | | Gross
Derivative Liabilities | | | Cash Collateral
Received(a) | | | Net Amount | |
Goldman Sachs | | $ | 39,195,058 | | | $ | — | | | $ | (39,195,058) | | | $ | — | |
JPMorgan | | | 61,354,327 | | | | — | | | | (61,354,327) | | | | — | |
| | | | | | | | | | | | | | | | |
| | $ | 100,549,385 | | | $ | — | | | $ | (100,549,385) | | | $ | — | |
| | | | | | | | | | | | | | | | |
| | | | | | | | | | | | | | | | | |
| (a) | Cash collateral received in excess of derivative assets/liabilities, if any, is not presented in this table. The total cash collateral is presented on the Fund’s Statement of Assets and Liabilities. |
FINANCIAL HIGHLIGHTS (unaudited)
| | | | | | | | | | | | | | | | | | | | | | | | |
SELECTED DATA AND RATIOS (for a share outstanding throughout each period) | | Six Months Ended June 30, | | | Year Ended December 31, | |
| | | 2017 | | | 2016 | | | 2015 | | | 2014 | | | 2013 | | | 2012 | |
| | | | | | | | |
Net asset value, beginning of period | | | $103.35 | | | | $94.42 | | | | $102.48 | | | | $98.30 | | | | $78.06 | | | | $67.45 | |
Income from investment operations: | | | | | | | | | | | | | | | | | | | | | | | | |
Net investment income | | | 1.07 | | | | 2.34 | | | | 2.06 | | | | 2.03 | | | | 1.66 | | | | 1.65 | |
Net realized and unrealized gain (loss) | | | 4.43 | | | | 12.89 | | | | (4.99 | ) | | | 6.59 | | | | 20.30 | | | | 10.62 | |
| | | | | | | | |
Total from investment operations | | | 5.50 | | | | 15.23 | | | | (2.93 | ) | | | 8.62 | | | | 21.96 | | | | 12.27 | |
| | | | | | | | |
Distributions to shareholders from: | | | | | | | | | | | | | | | | | | | | | | | | |
Net investment income | | | (1.07 | ) | | | (2.34 | ) | | | (2.06 | ) | | | (2.03 | ) | | | (1.65 | ) | | | (1.66 | ) |
Net realized gain | | | (1.60 | ) | | | (3.96 | ) | | | (3.07 | ) | | | (2.41 | ) | | | (0.07 | ) | | | — | |
| | | | | | | | |
Total distributions | | | (2.67 | ) | | | (6.30 | ) | | | (5.13 | ) | | | (4.44 | ) | | | (1.72 | ) | | | (1.66 | ) |
| | | | | | | | |
Net asset value, end of period | | | $106.18 | | | | $103.35 | | | | $94.42 | | | | $102.48 | | | | $98.30 | | | | $78.06 | |
| | | | | | | | |
Total return | | | 5.36 | % | | | 16.55 | % | | | (2.88 | )% | | | 8.85 | % | | | 28.37 | % | | | 18.32 | % |
Ratios/supplemental data: | | | | | | | | | | | | | | | | | | | | | | | | |
Net assets, end of period (millions) | | | $15,861 | | | | $15,382 | | | | $14,269 | | | | $15,465 | | | | $14,404 | | | | $12,217 | |
Ratios of expenses to average net assets | | | 0.53 | %(a) | | | 0.53 | % | | | 0.53 | % | | | 0.53 | % | | | 0.53 | % | | | 0.53 | % |
Ratios of net investment income to average net assets | | | 2.03 | %(a) | | | 2.41 | % | | | 2.03 | % | | | 2.00 | % | | | 1.85 | % | | | 2.21 | % |
Portfolio turnover rate | | | 10 | % | | | 24 | % | | | 20 | % | | | 23 | % | | | 25 | % | | | 16 | % |
See accompanying Notes to Financial Statements
DODGE & COX BALANCED FUND §PAGE 17
FUND HOLDINGS
The Fund provides a complete list of its holdings four times each fiscal year, as of the end of each quarter. The Fund files the lists with the Securities and Exchange Commission (SEC) on Form N-CSR (second and fourth quarters) and Form N-Q (first and third quarters). Shareholders may view the Fund’s Forms N-CSR and N-Q on the SEC’s website at sec.gov. Forms N-CSR and N-Q may also be reviewed and copied at the SEC’s Public Reference Room in Washington, DC. Information regarding the operations of the Public Reference Room may be obtained by calling 202-551-8090 (direct) or 800-732-0330 (general SEC number). A list of the Fund’s quarter-end holdings is also available at dodgeandcox.com on or about 15 days following each quarter end and remains available on the website until the list is updated in the subsequent quarter.
PROXY VOTING
For a free copy of the Fund’s proxy voting policies and procedures, please call 800-621-3979, visit the Fund’s website at dodgeandcox.com, or visit the SEC’s website at sec.gov. Information regarding how the Fund voted proxies relating to portfolio securities during the most recent 12-month period ending June 30 is also available at dodgeandcox.com or at sec.gov.
HOUSEHOLD MAILINGS
The Fund routinely mails shareholder reports and summary prospectuses to shareholders and, on occasion, proxy statements. In order to reduce the volume of mail, when possible, only one copy of these documents will be sent to shareholders who are part of the same family and share the same residential address.
If you have a direct account with the Funds and you do not want the mailing of shareholder reports and summary prospectuses combined with other members in your household, contact the Funds at 800-621-3979. Your request will be implemented within 30 days.
PAGE 18 § DODGE & COX BALANCED FUND
TRUSTEES AND EXECUTIVE OFFICERS
Charles F. Pohl, Chairman and Trustee
Chairman, Dodge & Cox
Dana M. Emery, President and Trustee
Chief Executive Officer and President, Dodge & Cox
Thomas A. Larsen, Independent Trustee
Senior Counsel, Arnold & Porter Kaye Scholer LLP
Ann Mather, Independent Trustee
Former Executive Vice President, Chief Financial Officer, and Company Secretary, Pixar Animation Studios
Robert B. Morris III, Independent Trustee
Former Partner and Managing director - Global Investment Research, Goldman Sachs; former Advisory Director, The Presidio Group
Gary Roughead, Independent Trustee
Robert and Marion Oster Distinguished, Hoover Institution; and former U.S. Navy Chief of Naval Operations
Mark E. Smith, Independent Trustee
Former Executive Vice President and Managing Director-Fixed Income, Loomis Sayles & Company, L.P.
John B. Taylor, Independent Trustee
Professor of Economics, Stanford University; Senior Fellow, Hoover Institution; and former Under Secretary for International Affairs, United States Treasury
Diana S. Strandberg, Senior Vice President
Senior Vice President and Director of International Equity, Dodge & Cox
David H. Longhurst, Treasurer
Vice President and Assistant Treasurer, Dodge & Cox
Thomas M. Mistele, Secretary
Executive Vice President, Secretary, and Senior Counsel, Dodge & Cox
Katherine M. Primas, Chief Compliance Officer
Vice President and Chief Compliance Officer, Dodge & Cox
Roberta R.W. Kameda, Assistant Secretary
Vice President and General Counsel, Dodge & Cox
William W. Strickland, Assistant Secretary and Assistant Treasurer
Vice President and Chief Operating Officer, Dodge & Cox
Additional information about the Trust’s Trustees and Officers is available in the Trust’s Statement of Additional Information (SAI). You can get a free copy of the SAI by visiting the Funds’ website at dodgeandcox.com or calling 800-621-3979.
DODGE & COX BALANCED FUND §PAGE 19
dodgeandcox.com
For Fund literature, transactions, and account information, please visit the Funds’ website.
or write or call:
DODGE & COX FUNDS
c/o Boston Financial Data Services
P.O. Box 8422
Boston, Massachusetts 02266-8422
(800) 621-3979
INVESTMENT MANAGER
Dodge & Cox
555 California Street, 40th Floor
San Francisco, California 94104
(415) 981-1710
This report is submitted for the general information of the shareholders of the Fund. The report is not authorized for distribution to prospective investors in the Fund unless it is accompanied by a current prospectus.
This report reflects our views, opinions, and portfolio holdings as of June 30, 2017, the end of the reporting period. Any such views are subject to change at any time based upon market or other conditions and Dodge & Cox disclaims any responsibility to update such views. These views may not be relied on as investment advice and, because investment decisions for a Dodge & Cox Fund are based on numerous factors, may not be relied on as an indication of trading intent on behalf of any Dodge & Cox Fund.
DODGE & COX FUNDS®
Semi-Annual Report
June 30, 2017
Income Fund
ESTABLISHED 1989
TICKER: DODIX
6/17 IF SAR Printed on recycled paper
TO OUR SHAREHOLDERS
The Dodge & Cox Income Fund had a total return of 2.7% for the six months ended June 30, 2017, compared to a return of 2.3% for the Bloomberg Barclays U.S. Aggregate Bond Index (Bloomberg Barclays U.S. Agg).
MARKET COMMENTARY
The U.S. investment-grade bond market delivered a 2.3% return for the first half of 2017, driven by narrowing credit yield premiums(a) and modest declines in longer-term interest rates. Generally positive macroeconomic data, changing investor expectations regarding Federal Reserve (Fed) policy, and ongoing legislative uncertainty influenced markets over this timeframe.
U.S. economic conditions were generally favorable over the first half, highlighted by a robust labor market (16-year low in the unemployment rate, now 4.4%) and positive consumer sentiment. Despite some recent softness in auto sales, overall consumer spending remains healthy. Meanwhile, the Fed raised short-term rates twice in the first half of the year, signaled expectations for one additional rate hike in 2017, and suggested that the process of reducing its $4.5 trillion in bond holdings could begin before the end of this year. While Fed officials acknowledged persistently low inflation readings this year, they viewed the recent downturn as transitory and indicated that they expect inflation to rise. Other major central banks joined the Fed in conveying more confidence about raising their policy rates and removing other accommodative policies going forward.
Optimism faded in the first half regarding President Trump’s ability to stimulate stronger growth through his economic policies. The administration’s challenges in attempting to shepherd a new healthcare bill through Congress may foretell how difficult it will be to enact other legislation, including tax reform and infrastructure stimulus. The heightened level of discord in Washington and the investigation of the administration’s ties with Russia have further weighed on the legislative agenda and raised concerns that proposed pro-growth policies may be delayed or derailed.
Investment-grade corporate bonds returned 3.8% for the first half of the year, outperforming comparable-duration(b) Treasuries by 1.5 percentage points. Investors continued to display an appetite for risk assets as yield premiums for investment-grade corporate bonds declined to their narrowest level since September 2014. Corporate issuance was robust and continued to be met with strong demand. Meanwhile, Agency(c) MBS returned 1.4% and slightly underperformed comparable-duration Treasuries.
INVESTMENT STRATEGY
After a particularly dynamic year of valuation shifts and corresponding changes to Fund positioning, the first six months of 2017 have been substantially less active on both fronts. We made relatively minor changes to Fund positioning as a result of the low volatility environment, favorable credit backdrop, and gradual tightening in credit spreads. The Fund continues to feature substantial positions in corporate bonds (39%)(d) and Agency MBS (32%) and smaller positions in government-related securities (7%), ABS (3%), and U.S. Treasuries (16%, which is less than half the Bloomberg Barclays U.S. Agg’s weighting). We have also maintained a defensive duration position, roughly 70% of the
Bloomberg Barclays U.S. Agg’s duration, given our longer-term expectations for interest rates to rise more than currently implied by market valuations.
Opportunistic Reductions to Credit, But Credit Remains Attractive
We reduced the Fund’s credit(e) weighting by two percentage points on a net basis during the first half of 2017, which understates larger underlying changes to portfolio positioning and the substantial research efforts conducted by our credit team to monitor current opportunities and risks. The net reductions were driven by a marginally less attractive valuation environment, as well as a number of issuer-specific relative value considerations. The year-long recovery in investor sentiment regarding commodity-related and emerging market issuers provided attractive opportunities to trim Cemex, Kinder Morgan, and Rio Oil Finance Trust.(f) We similarly capitalized on the overall improvement in market valuations to reduce exposure to credits facing secular headwinds or transformational risk, such as Macy’s and Verizon. Notwithstanding the broader compression in credit spreads, we remained opportunistic in evaluating new additions for the credit portfolio. We added to the Fund’s TransCanada position through the purchase of a new subordinated security. We also invested in short-duration Ford Motor Credit securities, which we believe offer attractive relative value compared to other alternatives in the intermediate portion of the market.
In our view, the credit sector continues to provide attractive long-term opportunities despite the more compressed spread environment, particularly given our focus on fundamental research, security selection, and valuation discipline. The Fund’s current credit holdings offer substantially greater spread compensation than the broad credit index (190 basis points(g) on average for Fund holdings, versus 103 basis points for the index(h), demonstrating the differentiated nature of the Fund’s credit holdings compared to the broader credit market. We believe corporate credit fundamentals remain healthy, with profitability levels high, balance sheets solid, and financing readily available. The banking system also remains well capitalized and liquid, further supporting the fundamental backdrop for credit investment. At the same time, we are attuned to the risks arising from potential policy changes here in the United States (e.g., trade, tax, healthcare), vulnerabilities across emerging markets, and geopolitical risks around the globe. We constantly strive to balance these factors issuer by issuer, and we remain vigilant in our research, security selection, and portfolio management processes.
The Fund’s taxable municipal holdings continued to perform well, particularly the State of Illinois general obligation (GO) bonds (a 1.2% position) which have outperformed over the past six months, despite recent volatility. The state passed a budget in July following a two-year impasse between the Republican governor and the Democrat-controlled General Assembly. The recent budget compromise included permanent income tax increases and spending reductions, both of which are credit positives. The state will now need to address its roughly $15 billion payables backlog, as well as push forward with long-term reforms to its employee pensions. We continue to find the securities
PAGE 2 § DODGE & COX INCOME FUND
attractive at today’s valuations, given the scale and diversity of the Illinois economy, the GO bonds’ first priority claim on General Funds revenues, and the renewed sense of urgency among lawmakers to shore up state finances. More broadly, taxable municipal securities remain a relatively small portion of the Fund (4%) but offer attractive diversification benefits and better downside protection compared to corporate alternatives.
MBS Positioning Steady, But Alert to Opportunities
The Fund’s Agency MBS continued to perform well relative to shorter-duration Treasuries and other high-quality alternatives. We have held the Fund’s MBS weighting steady at roughly a third of the portfolio for some time now, but continue to make intra-sector shifts to Fund positioning based on changes in relative valuations. For example, we recently reduced the Fund’s holdings of 15- and 20-year MBS, which generally have less prepayment risk than 30-year MBS (as borrowers with shorter loan terms are generally less sensitive to refinancing incentives) but also offer less potential upside if slow-to-moderate prepayment speeds are realized. Valuations in this portion of the market were high relative to other segments, prompting our reduction. Conversely, we increased the Fund’s holdings of 30-year premium 4.5% coupons as valuations became more attractive (i.e., MBS yield premiums widened) in the second quarter.
MBS market participants have been awaiting further guidance from the Fed regarding its plans for normalization of its balance sheet, which stood at $800 billion pre-crisis versus $4.5 trillion now. Agency MBS account for $1.8 trillion of the current Fed balance sheet. As noted earlier, Fed officials have indicated the normalization process is likely to begin later this year when the Fed will cease to reinvest paydowns of MBS and Treasuries at an aggregate cap of $10 billion per month. This cap will gradually rise over time to $50 billion per month, including $20 billion for MBS. At this point, there is no timetable or stated ending balance sheet size, but we expect the normalization process to be gradual and orderly (and also flexible, if the Fed sees a reason to temporarily deviate from the plan). That said, the process may introduce volatility in the sector as a large, non-valuation driven “investor” is removed.
Importantly, the Fund’s specific MBS holdings are different from the ones held by the Fed and also different from the broader mortgage universe. We favor MBS with generally higher coupons and shorter terms, which translates to an MBS duration that is roughly two years shorter than the MBS in the benchmark. This positioning provides a defensive element for the portfolio while continuing to provide an attractive income stream and stable duration profile across scenarios. As always, we will evaluate opportunities and risks in the MBS market as the Fed’s policy plans evolve.
Reducing Interest Rate Risk in the Fund
We continue to position the Fund defensively vis-à-vis interest rate risk, with a Fund duration that is 70% of the Bloomberg Barclays U.S. Agg’s duration. The Fed met four times during the first half of 2017 and raised the target federal funds rate twice. Despite these increases, market expectations for the federal funds rate (as implied by forward rates) did not materially increase and remain low by historical standards and compared to the underlying
fundamentals of the U.S. economy. We expect U.S. economic growth to continue at an annual rate of 2% or slightly higher. Despite marginally reduced optimism regarding the Trump administration’s ability to implement its full agenda of regulatory and tax reform and substantial fiscal stimulus, some success is likely to be achieved, which should support further U.S. economic growth. In addition, inflation measures are likely to firm amid a tight labor market. The Fed acknowledged persistently low inflation readings this year but views the shortfall as transitory. The combination of these factors should allow the Fed to continue its gradual hiking cycle and eventually begin to reduce its balance sheet, which should contribute to rising rates over our investment horizon.
IN CLOSING
While we are pleased with the Fund’s recent results, we continue to encourage shareholders to temper near-term total return expectations for bonds. Yields remain low by historical standards, increasing the risk of low (or even negative) returns if yields rise substantially from current levels. In addition, the credit markets have performed extremely well over the past 16 months, a pace which is unlikely to be repeated in the near future.
Notwithstanding somewhat challenged absolute return prospects in the near term, bonds serve a vital defensive role in a diversified portfolio by offering liquidity, income generation, downside protection, and low correlation to riskier asset classes. We continue to position the Fund defensively from a capital preservation standpoint with these goals in mind, while continuing, as always, to seek opportunities to build portfolio yield through our bottom-up, research-driven investment approach. Thank you for your continued confidence in our firm. As always, we welcome your comments and questions.
For the Board of Trustees,
| | |
| |
|
Charles F. Pohl, Chairman | | Dana M. Emery, President |
July 31, 2017
| (a) | | Yield premiums are one way to measure a security’s valuation. Narrowing yield premiums result in a higher valuation. Widening yield premiums result in a lower valuation. |
| (b) | | Duration is a measure of a bond’s (or a bond portfolio’s) price sensitivity to changes in interest rates. |
| (c) | | The U.S. Government does not guarantee the Fund’s shares, yield, or net asset value. The agency guarantee (by, for example, Ginnie Mae, Fannie Mae, or Freddie Mac) does not eliminate market risk. |
| (d) | | Unless otherwise specified, all weightings and characteristics are as of June 30, 2017. |
| (e) | | Credit securities refers to corporate bonds and government-related securities, as classified by Bloomberg. |
| (f) | | The use of specific examples does not imply that they are more or less attractive investments than the Fund’s other holdings. |
| (g) | | One basis point is equal to 1/100th of 1%. |
| (h) | | Index refers to the Bloomberg Barclays U.S. Credit Index. |
DODGE & COX INCOME FUND §PAGE 3
YEAR-TO-DATE PERFORMANCE REVIEW
The Fund outperformed the Bloomberg Barclays U.S. Agg by 0.4 percentage points year to date.
Key Contributors to Relative Results
| | § | | Security selection within credit was positive as certain emerging market-domiciled holdings performed well, including Cemex, Pemex, and Rio Oil Finance Trust. Other notable outperformers included Royal Bank of Scotland and Telecom Italia. | |
| | § | | The Fund’s overweight to corporate bonds and underweight to U.S. Treasuries added to relative returns given the strong performance of credit. | |
| | § | | The Fund’s Agency MBS holdings outperformed the MBS in the Bloomberg Barclays U.S. Agg after adjusting for duration differences. | |
| | § | | The Fund’s nominal yield advantage benefited returns. | |
Key Detractors from Relative Results
| | § | | The Fund’s shorter relative duration (72% of the Bloomberg Barclays U.S. Agg’s duration) detracted from relative returns. | |
| | § | | Certain corporate holdings underperformed, including Macy’s and Verizon. | |
KEY CHARACTERISTICS OF DODGE & COX
Independent Organization
Dodge & Cox is one of the largest privately owned investment managers in the world. We remain committed to independence, with a goal of providing the highest quality investment management service to our existing clients.
Over 85 Years of Investment Experience
Dodge & Cox was founded in 1930. We have a stable and well-qualified team of investment professionals, most of whom have spent their entire careers at Dodge & Cox.
Experienced Investment Team
The U.S. Fixed Income Investment Committee, which is the decision-making body for the Income Fund, is an eight-member committee with an average tenure at Dodge & Cox of 22 years.
One Business with a Single Research Office
Dodge & Cox manages equity (domestic, international, and global), fixed income (domestic and global), and balanced investments, operating from one office in San Francisco.
Consistent Investment Approach
Our team decision-making process involves thorough, bottom-up fundamental analysis of each investment.
Long-Term Focus and Low Expenses
We invest with a three- to five-year investment horizon, which has historically resulted in low turnover relative to our peers. We manage Funds that maintain low expense ratios.
Risks: The Fund invests in individual bonds whose yields and market values fluctuate, so that an investment may be worth more or less than its original cost. Debt securities are subject to interest rate risk, credit risk, and prepayment and call risk, all of which could have adverse effects on the value of the Fund. A low interest rate environment creates an elevated risk of future negative returns. Financial intermediaries may restrict their market making activities for certain debt securities, which may reduce the liquidity and increase the volatility of such securities. Please read the prospectus and summary prospectus for specific details regarding the Fund’s risk profile.
PAGE 4 § DODGE & COX INCOME FUND
GROWTH OF $10,000 OVER 10 YEARS
FOR AN INVESTMENT MADE ON JUNE 30, 2007
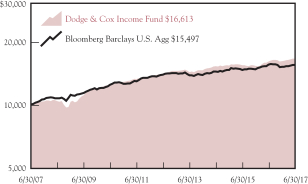
AVERAGE ANNUAL TOTAL RETURN
FOR PERIODS ENDED JUNE 30, 2017
| | | | | | | | | | | | | | | | |
| | | 1 Year | | | 5 Years | | | 10 Years | | | 20 Years | |
| | | | | | | | | | | | | | | | |
Dodge & Cox Income Fund | | | 3.24 | % | | | 3.45 | % | | | 5.20 | % | | | 5.77 | % |
Bloomberg Barclays U.S. Aggregate Bond Index (Bloomberg Barclays U.S. Agg) | | | –0.31 | | | | 2.21 | | | | 4.48 | | | | 5.24 | |
Returns represent past performance and do not guarantee future results. Investment return and share price will fluctuate with market conditions, and investors may have a gain or loss when shares are sold. Fund performance changes over time and currently may be significantly lower than stated. Performance is updated and published monthly. Visit the Fund’s website at dodgeandcox.com or call 800-621-3979 for current performance figures.
The Fund’s total returns include the reinvestment of dividend and capital gain distributions, but have not been adjusted for any income taxes payable by shareholders on these distributions or on Fund share redemptions. Index returns include interest income but, unlike Fund returns, do not reflect fees or expenses. The Bloomberg Barclays U.S. Aggregate Bond Index (Bloomberg Barclays U.S. Agg) is a widely recognized, unmanaged index of U.S. dollar-denominated, investment-grade, taxable debt securities.
Bloomberg is a registered trademark of Bloomberg Finance L.P. and its affiliates. Barclays® is a trademark of Barclays Bank PLC.
FUND EXPENSE EXAMPLE
As a Fund shareholder, you incur ongoing Fund costs, including management fees and other Fund expenses. All mutual funds have ongoing costs, sometimes referred to as operating expenses. The following example shows ongoing costs of investing in the Fund and can help you understand these costs and compare them with those of other mutual funds. The example assumes a $1,000 investment held for the six months indicated.
ACTUAL EXPENSES
The first line of the table below provides information about actual account values and expenses based on the Fund’s actual returns. You may use the information in this line, together with your account balance, to estimate the expenses that you paid over the period. Simply divide your account value by $1,000 (for example, an $8,600 account value divided by $1,000 = 8.6), then multiply the result by the number in the first line under the heading “Expenses Paid During Period” to estimate the expenses you paid on your account during this period.
HYPOTHETICAL EXAMPLE FOR COMPARISON WITH OTHER MUTUAL FUNDS
Information on the second line of the table can help you compare ongoing costs of investing in the Fund with those of other mutual funds. This information may not be used to estimate the actual ending account balance or expenses you paid during the period. The hypothetical “Ending Account Value” is based on the actual expense ratio of the Fund and an assumed 5% annual rate of return before expenses (not the Fund’s actual return). The amount under the heading “Expenses Paid During Period” shows the hypothetical expenses your account would have incurred under this scenario. You can compare this figure with the 5% hypothetical examples that appear in shareholder reports of other mutual funds.
| | | | | | | | | | | | |
Six Months Ended June 30, 2017 | | Beginning Account Value
1/1/2017 | | | Ending Account Value
6/30/17 | | | Expenses Paid
During Period* | |
Based on Actual Fund Return | | $ | 1,000.00 | | | $ | 1,027.10 | | | $ | 2.16 | |
Based on Hypothetical 5% Yearly Return | | | 1,000.00 | | | | 1,022.66 | | | | 2.15 | |
| * | | Expenses are equal to the Fund’s annualized expense ratio of 0.43%, multiplied by the average account value over the period, multiplied by 181/365 (to reflect the one-half year period). |
The expenses shown in the table highlight ongoing costs only and do not reflect any transactional fees or account maintenance fees. Though other mutual funds may charge such fees, please note that the Fund does not charge transaction fees (e.g., redemption fees, sales loads) or universal account maintenance fees (e.g., small account fees).
DODGE & COX INCOME FUND §PAGE 5
| | | | |
| FUND INFORMATION (unaudited) | �� | | June 30, 2017 | |
| | | | |
| GENERAL INFORMATION | | | |
Net Asset Value Per Share | | | $13.75 | |
Total Net Assets (billions) | | | $50.0 | |
Expense Ratio | | | 0.43% | |
Portfolio Turnover Rate (1/1/17 to 6/30/17, unannualized) | | | 8% | |
30-Day SEC Yield(a) | | | 2.66% | |
Number of Credit Issuers | | | 53 | |
Fund Inception | | | 1989 | |
No sales charges or distribution fees | | | | |
Investment Manager: Dodge & Cox, San Francisco. Managed by the U.S. Fixed Income Investment Committee, whose eight members’ average tenure at Dodge & Cox is 22 years.
| | | | | | | | |
| PORTFOLIO CHARACTERISTICS | | Fund | | | BBG Barclays
U.S. Agg | |
Effective Duration (years) | | | 4.2 | | | | 6.0 | |
| | | | |
| FIVE LARGEST CREDIT ISSUERS (%)(b) | | Fund | |
Bank of America Corp. | | | 2.0 | |
Charter Communications, Inc. | | | 2.0 | |
State of California GO | | | 1.9 | |
Petroleos Mexicanos | | | 1.8 | |
Telecom Italia SPA | | | 1.8 | |
| | | | | | | | |
| CREDIT QUALITY (%)(c) | | Fund | | | BBG Barclays
U.S. Agg | |
U.S. Treasury/Agency/GSE(d) | | | 48.3 | | | | 67.8 | |
Aaa | | | 1.8 | | | | 4.4 | |
Aa | | | 3.8 | | | | 3.6 | |
A | | | 3.5 | | | | 10.6 | |
Baa | | | 31.4 | | | | 13.6 | |
Ba | | | 6.8 | | | | 0.0 | |
B | | | 0.0 | | | | 0.0 | |
Caa | | | 1.5 | | | | 0.0 | |
Net Cash & Other(e) | | | 2.9 | | | | 0.0 | |
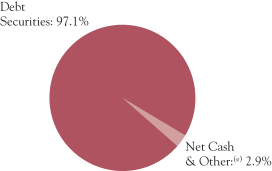
| | | | | | | | |
| SECTOR DIVERSIFICATION (%) | | Fund | | | BBG Barclays
U.S. Agg | |
U.S. Treasury(d) | | | 16.3 | | | | 37.0 | |
Government-Related | | | 6.7 | | | | 7.2 | |
Securitized | | | 35.2 | | | | 30.5 | |
Corporate | | | 38.9 | | | | 25.3 | |
Net Cash & Other(e) | | | 2.9 | | | | 0.0 | |
| | | | | | | | |
| MATURITY DIVERSIFICATION (%)(d) | | Fund | | | BBG Barclays
U.S. Agg | |
0-1 Years to Maturity | | | 7.5 | | | | 0.0 | (f) |
1-5 | | | 43.9 | | | | 40.2 | |
5-10 | | | 28.8 | | | | 44.2 | |
10-15 | | | 3.5 | | | | 1.5 | |
15-20 | | | 4.7 | | | | 2.0 | |
20-25 | | | 5.7 | | | | 3.9 | |
25 and Over | | | 5.9 | | | | 8.2 | |
| (a) | SEC Yield is an annualization of the Fund’s net investment income for the trailing 30-day period. Dividends paid by the Fund may be higher or lower than implied by the SEC Yield. |
| (b) | The Fund’s portfolio holdings are subject to change without notice. The mention of specific securities is not a recommendation to buy, sell, or hold any particular security and is not indicative of Dodge & Cox’s current or future trading activity. |
| (c) | The credit quality distributions shown for the Fund and the Index are based on the middle of Moody’s, S&P’s, and Fitch ratings, which is the methodology used by Bloomberg in constructing its indices. If a security is rated by only two agencies, the lower of the two ratings is used. Please note the Fund applies the highest of Moody’s, S&P’s, and Fitch ratings to determine compliance with the quality requirements stated in its prospectus. On that basis, the Fund held 4.0% in securities rated below investment grade. The credit quality of the investments in the portfolio does not apply to the stability or safety of the Fund or its shares. |
| (d) | Data as presented excludes the Fund’s position in Treasury futures contracts. |
| (e) | Net Cash & Other includes cash, short-term investments, derivatives, receivables, and payables. |
PAGE 6 § DODGE & COX INCOME FUND
| | | | |
| PORTFOLIO OF INVESTMENTS (unaudited) | | | June 30, 2017 | |
| | | | | | | | |
| DEBT SECURITIES: 97.1% | | | | | | |
| | |
| | | PAR VALUE | | | VALUE | |
| U.S. TREASURY: 16.3% | | | | | | | | |
U.S. Treasury Note/Bond | | | | | | | | |
1.00%, 12/31/17 | | $ | 125,000,000 | | | $ | 124,902,125 | |
0.875%, 1/15/18 | | | 600,000,000 | | | | 599,061,600 | |
0.75%, 2/28/18 | | | 500,000,000 | | | | 498,437,500 | |
0.625%, 6/30/18 | | | 250,000,000 | | | | 248,418,000 | |
0.75%, 7/31/18 | | | 500,000,000 | | | | 497,148,500 | |
0.75%, 8/31/18 | | | 350,000,000 | | | | 347,689,300 | |
1.50%, 8/31/18 | | | 250,000,000 | | | | 250,468,750 | |
0.875%, 10/15/18 | | | 300,000,000 | | | | 298,265,700 | |
1.25%, 12/31/18 | | | 165,000,000 | | | | 164,735,670 | |
1.125%, 2/28/19 | | | 600,000,000 | | | | 597,750,000 | |
1.50%, 2/28/19 | | | 496,995,000 | | | | 498,023,779 | |
0.875%, 4/15/19 | | | 350,000,000 | | | | 346,951,150 | |
1.625%, 7/31/19 | | | 600,000,000 | | | | 602,765,400 | |
0.75%, 8/15/19 | | | 350,000,000 | | | | 345,269,400 | |
0.875%, 9/15/19 | | | 600,000,000 | | | | 592,945,200 | |
1.375%, 12/15/19 | | | 165,000,000 | | | | 164,645,580 | |
1.625%, 12/31/19 | | | 500,000,000 | | | | 501,836,000 | |
1.375%, 1/15/20 | | | 250,000,000 | | | | 249,365,250 | |
1.50%, 5/31/20 | | | 175,000,000 | | | | 174,733,475 | |
1.625%, 6/30/20 | | | 200,000,000 | | | | 200,336,000 | |
1.375%, 5/31/21 | | | 450,000,000 | | | | 443,742,300 | |
1.125%, 7/31/21 | | | 250,000,000 | | | | 243,652,250 | |
2.00%, 12/31/21 | | | 165,000,000 | | | | 166,186,020 | |
| | | | | | | | |
| | | | | | | 8,157,328,949 | |
| | | | | | | | |
| | | | | | | 8,157,328,949 | |
| GOVERNMENT-RELATED: 6.7% | | | | | | | | |
FEDERAL AGENCY: 0.1% | | | | | | | | |
Small Business Admin. — 504 Program | | | | | | | | |
Series 1997-20H 1, 6.80%, 8/1/17 | | | 1,812 | | | | 1,820 | |
Series 1997-20J 1, 6.55%, 10/1/17 | | | 22,360 | | | | 22,499 | |
Series 1997-20L 1, 6.55%, 12/1/17 | | | 1,128 | | | | 1,135 | |
Series 1998-20B 1, 6.15%, 2/1/18 | | | 3,572 | | | | 3,609 | |
Series 1998-20C 1, 6.35%, 3/1/18 | | | 121,778 | | | | 123,263 | |
Series 1998-20H 1, 6.15%, 8/1/18 | | | 90,483 | | | | 91,421 | |
Series 1998-20L 1, 5.80%, 12/1/18 | | | 52,906 | | | | 53,353 | |
Series 1999-20C 1, 6.30%, 3/1/19 | | | 59,258 | | | | 60,171 | |
Series 1999-20E 1, 6.30%, 5/1/19 | | | 1,696 | | | | 1,723 | |
Series 1999-20G 1, 7.00%, 7/1/19 | | | 114,211 | | | | 117,190 | |
Series 1999-20I 1, 7.30%, 9/1/19 | | | 65,806 | | | | 68,074 | |
Series 2000-20C 1, 7.625%, 3/1/20 | | | 3,365 | | | | 3,494 | |
Series 2000-20G 1, 7.39%, 7/1/20 | | | 2,721 | | | | 2,821 | |
Series 2001-20G 1, 6.625%, 7/1/21 | | | 613,209 | | | | 645,329 | |
Series 2001-20L 1, 5.78%, 12/1/21 | | | 1,587,490 | | | | 1,657,265 | |
Series 2002-20A 1, 6.14%, 1/1/22 | | | 13,486 | | | | 14,281 | |
Series 2002-20L 1, 5.10%, 12/1/22 | | | 481,833 | | | | 507,431 | |
Series 2003-20G 1, 4.35%, 7/1/23 | | | 34,440 | | | | 35,754 | |
Series 2004-20L 1, 4.87%, 12/1/24 | | | 751,202 | | | | 789,764 | |
Series 2005-20B 1, 4.625%, 2/1/25 | | | 1,543,191 | | | | 1,614,387 | |
Series 2005-20D 1, 5.11%, 4/1/25 | | | 59,136 | | | | 62,641 | |
Series 2005-20E 1, 4.84%, 5/1/25 | | | 2,303,572 | | | | 2,419,767 | |
Series 2005-20G 1, 4.75%, 7/1/25 | | | 2,444,739 | | | | 2,562,978 | |
Series 2005-20H 1, 5.11%, 8/1/25 | | | 29,285 | | | | 31,022 | |
Series 2005-20I 1, 4.76%, 9/1/25 | | | 2,904,964 | | | | 3,049,260 | |
Series 2006-20A 1, 5.21%, 1/1/26 | | | 2,805,417 | | | | 2,993,677 | |
Series 2006-20B 1, 5.35%, 2/1/26 | | | 850,302 | | | | 908,878 | |
Series 2006-20C 1, 5.57%, 3/1/26 | | | 4,102,323 | | | | 4,394,017 | |
Series 2006-20G 1, 6.07%, 7/1/26 | | | 7,059,677 | | | | 7,639,332 | |
Series 2006-20H 1, 5.70%, 8/1/26 | | | 57,939 | | | | 62,140 | |
Series 2006-20I 1, 5.54%, 9/1/26 | | | 117,548 | | | | 125,871 | |
Series 2006-20J 1, 5.37%, 10/1/26 | | | 2,479,348 | | | | 2,654,551 | |
Series 2006-20L 1, 5.12%, 12/1/26 | | | 2,270,185 | | | | 2,419,896 | |
Series 2007-20A 1, 5.32%, 1/1/27 | | | 5,357,391 | | | | 5,721,446 | |
Series 2007-20C 1, 5.23%, 3/1/27 | | | 8,706,077 | | | | 9,279,986 | |
Series 2007-20D 1, 5.32%, 4/1/27 | | | 8,172,681 | | | | 8,725,717 | |
| | | | | | | | |
| | | PAR VALUE | | | VALUE | |
Series 2007-20G 1, 5.82%, 7/1/27 | | $ | 6,434,010 | | | $ | 6,943,119 | |
| | | | | | | | |
| | | | | | | 65,809,082 | |
FOREIGN AGENCY: 2.2% | | | | | | | | |
Petroleo Brasileiro SA (Brazil) | | | | | | | | |
5.375%, 1/27/21 | | | 118,335,000 | | | | 120,311,194 | |
4.375%, 5/20/23 | | | 38,625,000 | | | | 36,423,375 | |
6.25%, 3/17/24 | | | 31,505,000 | | | | 32,103,595 | |
Petroleos Mexicanos (Mexico) | | | | | | | | |
4.875%, 1/18/24 | | | 123,065,000 | | | | 124,652,538 | |
4.25%, 1/15/25 | | | 97,765,000 | | | | 95,076,463 | |
4.50%, 1/23/26 | | | 15,065,000 | | | | 14,643,632 | |
6.875%, 8/4/26 | | | 63,400,000 | | | | 70,247,200 | |
6.50%, 3/13/27(b) | | | 104,765,000 | | | | 112,543,801 | |
6.625%, 6/15/35 | | | 112,290,000 | | | | 116,079,788 | |
5.50%, 6/27/44 | | | 16,603,000 | | | | 14,677,052 | |
6.375%, 1/23/45 | | | 166,156,000 | | | | 162,002,100 | |
5.625%, 1/23/46 | | | 190,720,000 | | | | 169,073,280 | |
6.75%, 9/21/47 | | | 33,161,000 | | | | 33,488,631 | |
| | | | | | | | |
| | | | | | | 1,101,322,649 | |
LOCAL AUTHORITY: 4.3% | | | | | | | | |
L.A. Unified School District GO | | | | | | | | |
5.75%, 7/1/34 | | | 6,075,000 | | | | 7,673,090 | |
6.758%, 7/1/34 | | | 185,585,000 | | | | 255,548,689 | |
New Jersey Turnpike Authority RB | | | | | | | | |
7.414%, 1/1/40 | | | 41,065,000 | | | | 62,039,359 | |
7.102%, 1/1/41 | | | 148,277,000 | | | | 217,605,394 | |
New Valley Generation
4.929%, 1/15/21 | | | 247,539 | | | | 264,282 | |
State of California GO | | | | | | | | |
7.50%, 4/1/34 | | | 194,406,000 | | | | 282,979,318 | |
7.55%, 4/1/39 | | | 164,895,000 | | | | 251,748,494 | |
7.30%, 10/1/39 | | | 175,140,000 | | | | 255,846,263 | |
7.625%, 3/1/40 | | | 103,410,000 | | | | 157,984,627 | |
7.60%, 11/1/40 | | | 16,760,000 | | | | 26,088,784 | |
State of Illinois GO | | | | | | | | |
5.665%, 3/1/18 | | | 204,685,000 | | | | 208,031,600 | |
5.877%, 3/1/19 | | | 120,575,000 | | | | 124,768,599 | |
5.10%, 6/1/33 | | | 306,400,000 | | | | 286,827,168 | |
| | | | | | | | |
| | | | | | | 2,137,405,667 | |
SOVEREIGN: 0.1% | | | | | | | | |
Spain Government International (Spain)
4.00%, 3/6/18(b) | | | 55,790,000 | | | | 56,470,080 | |
| | | | | | | | |
| | | | | | | 3,361,007,478 | |
| SECURITIZED: 35.2% | | | | | | | | |
ASSET-BACKED: 3.3% | | | | | | | | |
Auto Loan: 0.4% | | | | | | | | |
Ford Credit Auto Owner Trust
Series 2015-1 A, 2.12%, 7/15/26(b) | | | 207,826,000 | | | | 208,644,502 | |
Credit Card: 0.9% | | | | | | | | |
American Express Master Trust | | | | | | | | |
Series 2017-3 A, 1.77%, 4/15/20 | | | 185,705,000 | | | | 185,401,075 | |
Series 2017-4 A, 1.64%, 12/15/21 | | | 246,302,000 | | | | 246,017,176 | |
Chase Issuance Trust
Series 2012-A4 A4, 1.58%, 8/16/21 | | | 14,693,000 | | | | 14,648,275 | |
| | | | | | | | |
| | | | | | | 446,066,526 | |
Other: 1.5% | | | | | | | | |
Rio Oil Finance Trust (Brazil) | | | | | | | | |
9.25%, 7/6/24(b) | | | 492,930,412 | | | | 500,447,601 | |
9.75%, 1/6/27(b) | | | 261,128,425 | | | | 266,350,993 | |
| | | | | | | | |
| | | | | | | 766,798,594 | |
Student Loan: 0.5% | | | | | | | | |
Navient Student Loan Trust (Private Loans) Series 2014-AA A2A, 2.74%, 2/15/29(b) | | | 31,043,958 | | | | 31,341,529 | |
| | |
| See accompanying Notes to Financial Statements | | DODGE & COX INCOME FUND §PAGE 7 |
| | | | |
| PORTFOLIO OF INVESTMENTS (unaudited) | | | June 30, 2017 | |
| | | | | | | | |
| DEBT SECURITIES (continued) | | | | | | |
| | |
| | | PAR VALUE | | | VALUE | |
SLM Student Loan Trust (Private Loans) | | | | | | | | |
Series 2013-A A2A, 1.77%, 5/17/27(b) | | $ | 57,987,939 | | | $ | 58,079,264 | |
Series 2012-B A2, 3.48%, 10/15/30(b) | | | 26,988,453 | | | | 27,262,394 | |
Series 2013-C A2A, 2.94%, 10/15/31(b) | | | 35,461,071 | | | | 35,891,515 | |
Series 2012-E A2A, 2.09%, 6/15/45(b) | | | 11,386,189 | | | | 11,394,562 | |
Series 2012-C A2, 3.31%, 10/15/46(b) | | | 54,466,530 | | | | 55,054,083 | |
| | | | | | | | |
| | | | | | | 219,023,347 | |
| | | | | | | | |
| | | | | | | 1,640,532,969 | |
CMBS: 0.1% | | | | | | | | |
Agency CMBS: 0.1% | | | | | | | | |
Fannie Mae Multifamily DUS | | | | | | | | |
Trust 2014-M13 ASQ2,
1.637%, 11/25/17 | | | 9,952,352 | | | | 9,945,634 | |
Pool AL6028, 2.963%, 7/1/21 | | | 2,297,009 | | | | 2,345,877 | |
Pool AL6455, 2.765%, 11/1/21 | | | 9,485,927 | | | | 9,475,714 | |
Pool AL6445, 2.58%, 1/1/22 | | | 8,592,570 | | | | 8,706,878 | |
| | | | | | | | |
| | | | | | | 30,474,103 | |
| | | | | | | | |
| | | | | | | 30,474,103 | |
MORTGAGE-RELATED: 31.8% | | | | | | | | |
Federal Agency CMO & REMIC: 2.1% | | | | | | | | |
Dept. of Veterans Affairs | | | | | | | | |
Series 1995-2D 4A, 9.293%, 5/15/25 | | | 100,185 | | | | 118,267 | |
Series 1997-2 Z, 7.50%, 6/15/27 | | | 7,614,934 | | | | 8,477,336 | |
Series 1998-2 2A, 8.637%, 8/15/27 | | | 31,145 | | | | 35,831 | |
Series 1998-1 1A, 8.185%, 3/15/28 | | | 171,958 | | | | 195,321 | |
Fannie Mae | | | | | | | | |
Trust 1998-58 PX, 6.50%, 9/25/28 | | | 299,357 | | | | 335,110 | |
Trust 1998-58 PC, 6.50%, 10/25/28 | | | 1,621,722 | | | | 1,818,780 | |
Trust 2001-69 PQ, 6.00%, 12/25/31 | | | 1,947,071 | | | | 2,168,306 | |
Trust 2002-33 A1, 7.00%, 6/25/32 | | | 2,113,353 | | | | 2,452,920 | |
Trust 2002-69 Z, 5.50%, 10/25/32 | | | 238,114 | | | | 265,106 | |
Trust 2008-24 GD, 6.50%, 3/25/37 | | | 1,010,000 | | | | 1,118,738 | |
Trust 2007-47 PE, 5.00%, 5/25/37 | | | 3,710,231 | | | | 3,988,539 | |
Trust 2009-53 QM, 5.50%, 5/25/39 | | | 1,958,935 | | | | 2,088,217 | |
Trust 2009-30 AG, 6.50%, 5/25/39 | | | 9,044,000 | | | | 10,024,239 | |
Trust 2009-40 TB, 6.00%, 6/25/39 | | | 4,123,114 | | | | 4,573,149 | |
Trust 2010-123 WT, 7.00%, 11/25/40 | | | 36,793,212 | | | | 42,771,391 | |
Trust 2001-T3 A1, 7.50%, 11/25/40 | | | 114,194 | | | | 134,405 | |
Trust 2001-T7 A1, 7.50%, 2/25/41 | | | 67,776 | | | | 79,212 | |
Trust 2001-T5 A2, 6.985%, 6/19/41 | | | 44,021 | | | | 51,049 | |
Trust 2001-T5 A3, 7.50%, 6/19/41 | | | 213,672 | | | | 255,094 | |
Trust 2011-58 AT, 4.00%, 7/25/41 | | | 9,397,556 | | | | 9,983,646 | |
Trust 2001-T4 A1, 7.50%, 7/25/41 | | | 1,896,147 | | | | 2,214,855 | |
Trust 2001-T10 A1, 7.00%, 12/25/41 | | | 2,220,501 | | | | 2,602,897 | |
Trust 2013-106 MA, 4.00%, 2/25/42 | | | 19,992,911 | | | | 21,120,061 | |
Trust 2002-W6 2A1, 6.083%, 6/25/42 | | | 2,601,053 | | | | 3,015,955 | |
Trust 2002-90 A1, 6.50%, 6/25/42 | | | 4,526,438 | | | | 5,254,136 | |
Trust 2002-W8 A2, 7.00%, 6/25/42 | | | 1,499,167 | | | | 1,761,197 | |
Trust 2003-W2 1A2, 7.00%, 7/25/42 | | | 7,107,031 | | | | 8,473,450 | |
Trust 2002-T16 A3, 7.50%, 7/25/42 | | | 3,384,799 | | | | 4,001,893 | |
Trust 2003-W4 3A, 6.165%, 10/25/42 | | | 2,153,824 | | | | 2,478,075 | |
Trust 2012-121 NB, 7.00%, 11/25/42 | | | 1,200,173 | | | | 1,383,661 | |
Trust 2012-134 FD, 1.566%, 12/25/42 | | | 1,129,647 | | | | 1,123,370 | |
Trust 2012-134 FT, 1.566%, 12/25/42 | | | 56,618,983 | | | | 56,510,535 | |
Trust 2012-133 HF, 1.566%, 12/25/42 | | | 41,480,555 | | | | 41,251,628 | |
Trust 2003-W1 2A, 6.123%, 12/25/42 | | | 2,714,680 | | | | 3,106,175 | |
Trust 2003-7 A1, 6.50%, 12/25/42 | | | 3,724,517 | | | | 4,244,935 | |
Trust 2013-98 FA, 1.766%, 9/25/43 | | | 40,275,325 | | | | 40,682,815 | |
Trust 2013-101 CF, 1.816%, 10/25/43 | | | 21,466,044 | | | | 21,640,769 | |
Trust 2013-101 FE, 1.816%, 10/25/43 | | | 34,018,230 | | | | 34,304,293 | |
Trust 2004-T1 1A2, 6.50%, 1/25/44 | | | 2,233,080 | | | | 2,566,700 | |
Trust 2004-W2 2A2, 7.00%, 2/25/44 | | | 106,909 | | | | 124,742 | |
Trust 2004-W2 5A, 7.50%, 3/25/44 | | | 4,808,039 | | | | 5,669,551 | |
Trust 2004-W8 3A, 7.50%, 6/25/44 | | | 3,528,726 | | | | 4,146,435 | |
Trust 2004-W14 1AF, 1.616%, 7/25/44 | | | 1,588,585 | | | | 1,531,653 | |
| | | | | | | | |
| | |
| | | PAR VALUE | | | VALUE | |
Trust 2004-W15 1A2, 6.50%, 8/25/44 | | $ | 812,978 | | | $ | 935,427 | |
Trust 2005-W1 1A3, 7.00%, 10/25/44 | | | 6,206,248 | | | | 7,208,984 | |
Trust 2001-79 BA, 7.00%, 3/25/45 | | | 705,255 | | | | 820,328 | |
Trust 2006-W1 1A1, 6.50%, 12/25/45 | | | 418,029 | | | | 478,996 | |
Trust 2006-W1 1A2, 7.00%, 12/25/45 | | | 2,909,695 | | | | 3,403,487 | |
Trust 2006-W1 1A3, 7.50%, 12/25/45 | | | 51,899 | | | | 61,827 | |
Trust 2006-W1 1A4, 8.00%, 12/25/45 | | | 3,620,418 | | | | 4,304,256 | |
Trust 2007-W10 1A, 6.309%, 8/25/47 | | | 12,086,660 | | | | 13,448,649 | |
Trust 2007-W10 2A, 6.356%, 8/25/47 | | | 3,560,811 | | | | 3,955,245 | |
Freddie Mac | | | | | | | | |
Series 3312 AB, 6.50%, 6/15/32 | | | 3,222,852 | | | | 3,675,083 | |
Series 2456 CJ, 6.50%, 6/15/32 | | | 185,983 | | | | 211,747 | |
Series T-41 2A, 5.481%, 7/25/32 | | | 251,094 | | | | 272,458 | |
Series 2587 ZU, 5.50%, 3/15/33 | | | 4,697,868 | | | | 5,225,228 | |
Series 2610 UA, 4.00%, 5/15/33 | | | 1,805,172 | | | | 1,892,875 | |
Series T-48 1A, 5.197%, 7/25/33 | | | 2,715,910 | | | | 2,979,501 | |
Series 2708 ZD, 5.50%, 11/15/33 | | | 18,116,020 | | | | 20,355,638 | |
Series 3204 ZM, 5.00%, 8/15/34 | | | 8,442,973 | | | | 9,186,330 | |
Series 3330 GZ, 5.50%, 6/15/37 | | | 2,752,979 | | | | 3,004,611 | |
Series 3427 Z, 5.00%, 3/15/38 | | | 3,489,075 | | | | 3,805,110 | |
Series 4091 JF, 1.659%, 6/15/41 | | | 24,048,750 | | | | 24,190,289 | |
Series 4120 YF, 1.509%, 10/15/42 | | | 63,684,039 | | | | 63,291,637 | |
Series 309 F4, 1.689%, 8/15/43 | | | 73,367,098 | | | | 73,284,272 | |
Series 311 F1, 1.709%, 8/15/43 | | | 88,629,314 | | | | 88,626,021 | |
Series T-51 1A, 6.50%, 9/25/43 | | | 61,059 | | | | 70,999 | |
Series 4283 DW, 4.50%, 12/15/43 | | | 92,682,572 | | | | 99,824,320 | |
Series 4283 EW, 4.50%, 12/15/43 | | | 55,329,476 | | | | 59,609,770 | |
Series 4281 BC, 4.50%, 12/15/43 | | | 152,561,837 | | | | 164,394,976 | |
Series 4310 FA, 1.709%, 2/15/44 | | | 2,541,701 | | | | 2,539,746 | |
Series 4319 MA, 4.50%, 3/15/44 | | | 29,792,664 | | | | 32,216,884 | |
| | | | | | | | |
| | | | | | | 1,053,419,131 | |
Federal Agency Mortgage Pass-Through: 29.7% | | | | | |
Fannie Mae, 15 Year | | | | | | | | |
6.00%, 7/1/17-3/1/23 | | | 34,138,807 | | | | 36,163,834 | |
6.50%, 7/1/17-12/1/19 | | | 37,524 | | | | 37,626 | |
7.00%, 11/1/17 | | | 25 | | | | 25 | |
5.50%, 1/1/18-7/1/25 | | | 122,103,498 | | | | 129,637,787 | |
4.00%, 9/1/25-5/1/29 | | | 233,176,382 | | | | 245,054,923 | |
5.00%, 9/1/25 | | | 47,111,926 | | | | 49,975,575 | |
3.50%, 10/1/25-2/1/31 | | | 1,043,047,100 | | | | 1,085,825,522 | |
4.50%, 3/1/29 | | | 29,838,101 | | | | 31,451,455 | |
Fannie Mae, 20 Year | | | | | | | | |
4.50%, 3/1/29-1/1/34 | | | 497,961,362 | | | | 535,248,036 | |
4.00%, 9/1/30-3/1/37 | | | 2,242,273,148 | | | | 2,378,730,280 | |
3.50%, 11/1/35-4/1/37 | | | 493,506,045 | | | | 511,977,034 | |
Fannie Mae, 30 Year | | | | | | | | |
6.00%, 11/1/28-2/1/39 | | | 125,707,469 | | | | 143,347,934 | |
7.00%, 4/1/32-2/1/39 | | | 76,114,559 | | | | 88,408,315 | |
6.50%, 12/1/32-8/1/39 | | | 51,955,494 | | | | 58,760,559 | |
5.50%, 2/1/33-11/1/39 | | | 189,259,719 | | | | 211,790,642 | |
4.50%, 11/1/35-6/1/47 | | | 2,664,596,588 | | | | 2,872,468,448 | |
5.00%, 7/1/37-7/1/40 | | | 31,426,796 | | | | 34,414,411 | |
4.00%, 10/1/40-8/1/41 | | | 59,529,050 | | | | 62,826,791 | |
Fannie Mae, 40 Year
4.50%, 1/1/52-6/1/56 | | | 199,529,847 | | | | 215,276,168 | |
Fannie Mae, Hybrid ARM | | | | | | | | |
2.787%, 10/1/33 | | | 2,115,650 | | | | 2,231,792 | |
3.309%, 7/1/34 | | | 2,246,491 | | | | 2,363,397 | |
2.739%, 8/1/34 | | | 536,877 | | | | 565,797 | |
2.762%, 8/1/34 | | | 1,975,663 | | | | 2,049,931 | |
2.508%, 9/1/34-5/1/46 | | | 14,407,927 | | | | 14,770,194 | |
2.814%, 10/1/34 | | | 1,452,086 | | | | 1,530,172 | |
2.863%, 1/1/35 | | | 1,897,205 | | | | 1,984,099 | |
3.511%, 1/1/35 | | | 1,082,878 | | | | 1,137,481 | |
3.138%, 4/1/35 | | | 3,559,285 | | | | 3,724,719 | |
3.558%, 6/1/35 | | | 743,205 | | | | 787,144 | |
| | |
| PAGE 8 § DODGE & COX INCOME FUND | | See accompanying Notes to Financial Statements |
| | | | |
| PORTFOLIO OF INVESTMENTS (unaudited) | | | June 30, 2017 | |
| | | | | | | | |
| DEBT SECURITIES (continued) | | | | | | |
| | |
| | | PAR VALUE | | | VALUE | |
2.826%, 7/1/35 | | $ | 718,492 | | | $ | 761,991 | |
2.97%, 7/1/35 | | | 1,259,783 | | | | 1,327,587 | |
3.282%, 7/1/35 | | | 1,613,694 | | | | 1,691,627 | |
3.472%, 7/1/35 | | | 1,614,259 | | | | 1,710,597 | |
2.644%, 8/1/35 | | | 1,728,625 | | | | 1,839,837 | |
2.666%, 8/1/35 | | | 5,714,486 | | | | 6,004,572 | |
3.038%, 8/1/35 | | | 3,312,456 | | | | 3,517,228 | |
3.033%, 9/1/35 | | | 2,671,376 | | | | 2,807,355 | |
2.94%, 10/1/35 | | | 2,814,771 | | | | 2,950,066 | |
3.023%, 10/1/35 | | | 1,559,301 | | | | 1,654,457 | |
2.945%, 11/1/35 | | | 2,111,933 | | | | 2,193,382 | |
3.109%, 12/1/35-12/1/43 | | | 8,205,176 | | | | 8,487,659 | |
3.018%, 1/1/36 | | | 15,114,935 | | | | 15,889,296 | |
3.106%, 1/1/36 | | | 2,936,196 | | | | 3,097,195 | |
3.196%, 1/1/36-4/1/44 | | | 30,722,934 | | | | 31,896,845 | |
3.121%, 7/1/36 | | | 65,881 | | | | 69,395 | |
3.388%, 11/1/36 | | | 1,638,140 | | | | 1,734,517 | |
2.954%, 12/1/36 | | | 2,681,677 | | | | 2,815,566 | |
3.205%, 12/1/36 | | | 1,213,989 | | | | 1,251,874 | |
3.671%, 2/1/37 | | | 6,868,586 | | | | 7,292,017 | |
3.678%, 4/1/37 | | | 364,832 | | | | 388,648 | |
3.606%, 8/1/37 | | | 1,894,297 | | | | 2,011,639 | |
4.815%, 8/1/37 | | | 266,535 | | | | 265,366 | |
3.812%, 11/1/37 | | | 758,124 | | | | 800,451 | |
5.082%, 4/1/38 | | | 227,437 | | | | 236,845 | |
3.315%, 5/1/38 | | | 150,548,286 | | | | 159,206,640 | |
5.012%, 5/1/38 | | | 2,179,545 | | | | 2,323,798 | |
3.122%, 9/1/38 | | | 852,940 | | | | 896,108 | |
3.082%, 10/1/38 | | | 4,250,605 | | | | 4,483,475 | |
3.098%, 10/1/38 | | | 7,290,639 | | | | 7,712,286 | |
3.23%, 10/1/38 | | | 1,608,417 | | | | 1,701,857 | |
4.662%, 6/1/39 | | | 656,015 | | | | 697,522 | |
4.105%, 12/1/39 | | | 2,871,703 | | | | 3,020,155 | |
2.599%, 4/1/42 | | | 13,574,624 | | | | 13,973,797 | |
2.376%, 9/1/42 | | | 11,318,074 | | | | 11,584,388 | |
2.51%, 11/1/42 | | | 10,519,084 | | | | 10,801,677 | |
2.283%, 12/1/42 | | | 18,736,680 | | | | 18,946,288 | |
2.384%, 2/1/43 | | | 17,851,017 | | | | 18,302,834 | |
3.129%, 2/1/43 | | | 4,670,660 | | | | 4,912,798 | |
2.289%, 5/1/43 | | | 4,194,267 | | | | 4,230,453 | |
1.895%, 6/1/43 | | | 4,552,691 | | | | 4,670,264 | |
1.941%, 9/1/43 | | | 11,207,126 | | | | 11,453,661 | |
2.941%, 9/1/43-2/1/44 | | | 17,951,491 | | | | 18,470,334 | |
2.307%, 10/1/43 | | | 45,432,888 | | | | 46,465,532 | |
2.638%, 11/1/43 | | | 14,900,408 | | | | 15,260,530 | |
2.897%, 11/1/43 | | | 15,776,574 | | | | 16,157,467 | |
2.41%, 2/1/44 | | | 2,614,167 | | | | 2,683,900 | |
2.741%, 2/1/44 | | | 6,509,947 | | | | 6,664,008 | |
2.441%, 4/1/44 | | | 48,209,165 | | | | 49,932,479 | |
2.661%, 4/1/44 | | | 19,393,094 | | | | 19,992,375 | |
2.952%, 4/1/44 | | | 7,197,819 | | | | 7,411,584 | |
2.985%, 4/1/44 | | | 6,292,370 | | | | 6,463,519 | |
2.474%, 5/1/44 | | | 16,924,343 | | | | 17,419,019 | |
3.048%, 5/1/44 | | | 31,331,764 | | | | 32,331,016 | |
2.862%, 7/1/44 | | | 14,111,214 | | | | 14,520,744 | |
2.874%, 7/1/44 | | | 19,773,766 | | | | 20,367,780 | |
2.936%, 7/1/44 | | | 10,346,689 | | | | 10,633,187 | |
2.946%, 7/1/44 | | | 7,824,446 | | | | 8,050,086 | |
2.966%, 7/1/44 | | | 7,682,774 | | | | 7,886,985 | |
3.09%, 7/1/44 | | | 15,146,416 | | | | 15,595,839 | |
2.802%, 8/1/44 | | | 12,964,230 | | | | 13,304,699 | |
2.809%, 8/1/44 | | | 27,563,406 | | | | 28,327,253 | |
2.907%, 8/1/44 | | | 8,155,171 | | | | 8,378,497 | |
3.004%, 8/1/44-12/1/44 | | | 20,317,041 | | | | 20,910,747 | |
2.681%, 9/1/44 | | | 11,036,226 | | | | 11,293,221 | |
2.765%, 9/1/44 | | | 12,778,367 | | | | 13,112,627 | |
2.842%, 9/1/44 | | | 40,856,500 | | | | 42,037,236 | |
| | | | | | | | |
| | |
| | | PAR VALUE | | | VALUE | |
2.857%, 9/1/44 | | $ | 6,461,914 | | | $ | 6,641,450 | |
2.962%, 9/1/44 | | | 21,519,991 | | | | 22,151,769 | |
2.996%, 9/1/44 | | | 9,031,905 | | | | 9,267,095 | |
2.484%, 10/1/44 | | | 8,638,940 | | | | 8,785,167 | |
2.646%, 10/1/44 | | | 10,043,096 | | | | 10,271,848 | |
2.673%, 10/1/44 | | | 17,551,695 | | | | 17,967,754 | |
2.757%, 10/1/44 | | | 39,099,247 | | | | 40,125,504 | |
2.784%, 10/1/44 | | | 32,567,391 | | | | 33,432,088 | |
2.854%, 10/1/44 | | | 17,753,614 | | | | 18,272,664 | |
2.859%, 10/1/44 | | | 9,439,880 | | | | 9,690,682 | |
2.87%, 10/1/44 | | | 14,505,762 | | | | 14,926,495 | |
2.905%, 10/1/44 | | | 6,130,083 | | | | 6,285,209 | |
2.915%, 10/1/44 | | | 23,367,904 | | | | 24,065,803 | |
2.957%, 10/1/44 | | | 12,202,866 | | | | 12,559,140 | |
2.732%, 11/1/44 | | | 7,120,891 | | | | 7,282,959 | |
2.779%, 11/1/44 | | | 10,562,835 | | | | 10,835,406 | |
2.84%, 11/1/44 | | | 19,978,125 | | | | 20,552,047 | |
2.848%, 11/1/44 | | | 21,763,506 | | | | 22,372,122 | |
2.917%, 11/1/44 | | | 19,630,079 | | | | 20,197,860 | |
2.933%, 11/1/44 | | | 18,549,579 | | | | 19,087,098 | |
2.713%, 12/1/44 | | | 6,833,465 | | | | 7,000,497 | |
2.722%, 12/1/44 | | | 5,689,189 | | | | 5,833,740 | |
2.763%, 12/1/44 | | | 6,477,033 | | | | 6,624,576 | |
2.769%, 12/1/44 | | | 37,721,924 | | | | 38,671,177 | |
2.821%, 12/1/44 | | | 14,874,823 | | | | 15,272,697 | |
2.926%, 1/1/45 | | | 16,502,139 | | | | 16,974,137 | |
2.735%, 2/1/45 | | | 22,087,110 | | | | 22,623,468 | |
3.013%, 3/1/45 | | | 199,287,007 | | | | 205,338,030 | |
3.081%, 3/1/45 | | | 5,748,569 | | | | 5,901,803 | |
2.588%, 4/1/45 | | | 6,979,908 | | | | 7,117,898 | |
2.85%, 4/1/45 | | | 46,036,413 | | | | 47,369,525 | |
2.641%, 8/1/45 | | | 15,410,087 | | | | 15,716,055 | |
2.708%, 8/1/45 | | | 15,084,527 | | | | 15,410,758 | |
2.839%, 10/1/45 | | | 32,246,664 | | | | 33,059,306 | |
2.633%, 11/1/45 | | | 24,495,428 | | | | 24,976,627 | |
2.944%, 3/1/46 | | | 7,532,380 | | | | 7,718,450 | |
2.45%, 4/1/46 | | | 46,678,082 | | | | 47,497,476 | |
2.676%, 4/1/46 | | | 7,195,408 | | | | 7,317,263 | |
2.736%, 4/1/46 | | | 8,132,902 | | | | 8,285,776 | |
2.812%, 4/1/46 | | | 20,686,189 | | | | 21,177,966 | |
2.916%, 4/1/46 | | | 6,743,592 | | | | 6,888,619 | |
2.702%, 6/1/46 | | | 10,778,587 | | | | 10,983,515 | |
2.758%, 6/1/46 | | | 3,742,849 | | | | 3,824,293 | |
2.721%, 7/1/46 | | | 3,964,130 | | | | 4,040,270 | |
2.30%, 12/1/46 | | | 9,672,575 | | | | 9,732,134 | |
3.046%, 6/1/47 | | | 9,991,328 | | | | 10,236,418 | |
3.142%, 6/1/47 | | | 30,435,594 | | | | 31,259,376 | |
3.189%, 6/1/47 | | | 35,415,402 | | | | 36,414,238 | |
3.174%, 7/1/47 | | | 10,466,295 | | | | 10,747,262 | |
Freddie Mac, Hybrid ARM | | | | | | | | |
3.029%, 9/1/33 | | | 6,135,084 | | | | 6,500,913 | |
2.979%, 2/1/34 | | | 4,578,729 | | | | 4,813,995 | |
3.055%, 8/1/34 | | | 941,501 | | | | 998,518 | |
2.864%, 11/1/34 | | | 1,273,576 | | | | 1,335,646 | |
3.25%, 1/1/35 | | | 673,863 | | | | 708,461 | |
3.107%, 2/1/35 | | | 933,812 | | | | 983,590 | |
3.472%, 3/1/35 | | | 1,240,687 | | | | 1,311,850 | |
2.875%, 4/1/35 | | | 706,272 | | | | 750,294 | |
3.12%, 8/1/35 | | | 2,744,000 | | | | 2,915,523 | |
3.208%, 8/1/35 | | | 1,403,368 | | | | 1,475,312 | |
3.072%, 9/1/35 | | | 1,955,819 | | | | 2,069,485 | |
2.956%, 10/1/35 | | | 2,456,914 | | | | 2,593,783 | |
2.273%, 1/1/36 | | | 2,571,352 | | | | 2,669,879 | |
2.865%, 1/1/36 | | | 6,467,599 | | | | 6,819,786 | |
3.14%, 1/1/36 | | | 2,229,877 | | | | 2,343,382 | |
3.545%, 4/1/36 | | | 3,695,828 | | | | 3,928,482 | |
2.967%, 8/1/36 | | | 2,707,465 | | | | 2,842,006 | |
| | |
| See accompanying Notes to Financial Statements | | DODGE & COX INCOME FUND §PAGE 9 |
| | | | |
| PORTFOLIO OF INVESTMENTS (unaudited) | | | June 30, 2017 | |
| | | | | | | | |
| DEBT SECURITIES (continued) | | | | | | |
| | |
| | | PAR VALUE | | | VALUE | |
3.267%, 12/1/36 | | $ | 1,507,616 | | | $ | 1,568,508 | |
3.398%, 1/1/37 | | | 2,412,006 | | | | 2,593,122 | |
3.245%, 3/1/37 | | | 3,548,402 | | | | 3,744,494 | |
3.292%, 4/1/37 | | | 1,451,116 | | | | 1,532,914 | |
3.51%, 4/1/37 | | | 2,033,859 | | | | 2,141,310 | |
3.444%, 5/1/37 | | | 2,918,549 | | | | 3,069,568 | |
2.907%, 7/1/37-11/1/44 | | | 18,110,466 | | | | 18,847,129 | |
6.239%, 10/1/37 | | | 306,784 | | | | 326,016 | |
5.786%, 1/1/38 | | | 1,076,165 | | | | 1,153,742 | |
3.021%, 2/1/38-10/1/44 | | | 26,541,359 | | | | 27,525,282 | |
3.506%, 4/1/38 | | | 7,008,435 | | | | 7,431,993 | |
3.561%, 4/1/38 | | | 9,660,146 | | | | 10,253,961 | |
5.213%, 5/1/38 | | | 2,112,323 | | | | 2,249,543 | |
3.393%, 6/1/38 | | | 3,574,721 | | | | 3,757,993 | |
4.74%, 6/1/38 | | | 731,944 | | | | 755,226 | |
3.266%, 10/1/38 | | | 760,632 | | | | 803,439 | |
3.31%, 10/1/38 | | | 2,720,426 | | | | 2,872,121 | |
4.093%, 11/1/39 | | | 2,276,262 | | | | 2,353,241 | |
3.041%, 7/1/43-7/1/44 | | | 12,222,926 | | | | 12,601,668 | |
1.864%, 8/1/43 | | | 65,031,287 | | | | 67,795,463 | |
2.753%, 10/1/43 | | | 3,089,775 | | | | 3,160,898 | |
2.933%, 1/1/44 | | �� | 5,231,553 | | | | 5,366,237 | |
3.136%, 1/1/44 | | | 5,584,844 | | | | 5,754,903 | |
2.90%, 2/1/44 | | | 12,734,806 | | | | 13,100,366 | |
3.128%, 4/1/44 | | | 7,632,464 | | | | 7,864,318 | |
3.154%, 4/1/44 | | | 4,107,567 | | | | 4,237,256 | |
3.012%, 5/1/44 | | | 116,962,597 | | | | 120,378,925 | |
2.806%, 6/1/44 | | | 8,038,518 | | | | 8,243,473 | |
3.109%, 6/1/44 | | | 25,313,605 | | | | 26,100,692 | |
3.052%, 7/1/44 | | | 6,798,714 | | | | 6,998,163 | |
2.86%, 8/1/44 | | | 10,691,482 | | | | 10,969,896 | |
3.042%, 8/1/44 | | | 11,466,614 | | | | 11,799,318 | |
3.097%, 8/1/44 | | | 12,905,527 | | | | 13,311,400 | |
2.76%, 9/1/44 | | | 12,847,460 | | | | 13,154,524 | |
2.765%, 9/1/44 | | | 15,128,462 | | | | 15,508,969 | |
2.856%, 9/1/44 | | | 10,259,407 | | | | 10,518,598 | |
2.808%, 10/1/44 | | | 7,614,636 | | | | 7,811,096 | |
2.821%, 10/1/44 | | | 19,277,338 | | | | 19,794,630 | |
2.829%, 10/1/44 | | | 17,095,705 | | | | 17,535,292 | |
3.015%, 10/1/44 | | | 16,663,126 | | | | 17,187,021 | |
2.724%, 11/1/44-8/1/45 | | | 67,219,247 | | | | 68,709,510 | |
2.811%, 11/1/44-9/1/45 | | | 29,003,155 | | | | 29,709,982 | |
2.817%, 11/1/44 | | | 9,928,205 | | | | 10,158,124 | |
2.928%, 11/1/44 | | | 17,364,459 | | | | 17,862,606 | |
2.93%, 11/1/44 | | | 9,550,011 | | | | 9,816,627 | |
2.931%, 11/1/44 | | | 30,981,883 | | | | 31,844,892 | |
2.936%, 11/1/44 | | | 7,846,709 | | | | 8,059,931 | |
2.941%, 11/1/44 | | | 12,047,415 | | | | 12,360,028 | |
2.948%, 11/1/44 | | | 21,934,102 | | | | 22,589,696 | |
2.963%, 11/1/44 | | | 15,092,457 | | | | 15,511,539 | |
2.798%, 12/1/44 | | | 6,009,294 | | | | 6,139,419 | |
2.861%, 12/1/44 | | | 25,643,974 | | | | 26,309,028 | |
2.886%, 12/1/44 | | | 16,370,417 | | | | 16,815,875 | |
2.903%, 12/1/44 | | | 22,662,792 | | | | 23,308,932 | |
2.927%, 12/1/44 | | | 11,720,607 | | | | 12,029,936 | |
2.688%, 1/1/45 | | | 16,792,659 | | | | 17,161,157 | |
2.832%, 1/1/45 | | | 13,218,276 | | | | 13,568,764 | |
2.879%, 1/1/45 | | | 11,476,772 | | | | 11,760,996 | |
2.899%, 1/1/45 | | | 19,703,742 | | | | 20,223,945 | |
3.085%, 1/1/45 | | | 37,519,737 | | | | 38,610,965 | |
2.917%, 2/1/45 | | | 19,044,103 | | | | 19,555,585 | |
2.705%, 4/1/45 | | | 9,949,439 | | | | 10,143,327 | |
2.618%, 5/1/45 | | | 56,376,719 | | | | 57,439,114 | |
2.749%, 6/1/45 | | | 6,916,644 | | | | 7,062,249 | |
2.631%, 8/1/45 | | | 14,197,526 | | | | 14,447,141 | |
2.786%, 8/1/45 | | | 11,260,348 | | | | 11,502,079 | |
| | | | | | | | |
| | |
| | | PAR VALUE | | | VALUE | |
2.742%, 5/1/46 | | $ | 292,293,777 | | | $ | 298,074,880 | |
2.754%, 5/1/46 | | | 21,568,842 | | | | 22,045,392 | |
2.643%, 7/1/46 | | | 30,154,434 | | | | 30,668,752 | |
2.55%, 9/1/46 | | | 54,646,964 | | | | 55,376,095 | |
3.164%, 6/1/47 | | | 15,134,656 | | | | 15,512,102 | |
Freddie Mac Gold, 15 Year | | | | | | | | |
6.00%, 7/1/17-11/1/23 | | | 13,018,598 | | | | 13,878,204 | |
6.50%, 7/1/17-9/1/18 | | | 4,045 | | | | 4,050 | |
5.50%, 10/1/20-12/1/24 | | | 6,429,254 | | | | 6,693,002 | |
4.50%, 3/1/25-6/1/26 | | | 15,815,510 | | | | 16,800,523 | |
4.00%, 6/1/26-6/1/27 | | | 246,563,631 | | | | 259,070,755 | |
Freddie Mac Gold, 20 Year | | | | | | | | |
6.50%, 10/1/26 | | | 2,749,579 | | | | 3,017,845 | |
6.00%, 12/1/27 | | | 21,846,124 | | | | 24,553,352 | |
4.50%, 5/1/30-1/1/34 | | | 125,182,990 | | | | 134,482,385 | |
4.00%, 9/1/31-10/1/35 | | | 551,671,749 | | | | 586,275,901 | |
3.50%, 7/1/35-1/1/36 | | | 209,183,109 | | | | 217,767,158 | |
Freddie Mac Gold, 30 Year | | | | | | | | |
7.90%, 2/17/21 | | | 176,959 | | | | 182,782 | |
7.00%, 4/1/31-11/1/38 | | | 4,387,024 | | | | 5,002,296 | |
6.50%, 12/1/32-10/1/38 | | | 13,983,552 | | | | 15,632,509 | |
6.00%, 2/1/33-2/1/39 | | | 25,607,704 | | | | 28,883,150 | |
5.50%, 3/1/34-12/1/38 | | | 64,862,862 | | | | 72,702,723 | |
4.50%, 3/1/39-4/1/46 | | | 1,261,879,309 | | | | 1,353,681,272 | |
Ginnie Mae, 20 Year
4.00%, 1/20/35 | | | 11,174,732 | | | | 11,760,737 | |
Ginnie Mae, 30 Year | | | | | | | | |
7.80%, 6/15/20-1/15/21 | | | 182,656 | | | | 189,550 | |
8.00%, 9/15/20 | | | 3,123 | | | | 3,257 | |
7.85%, 1/15/21 | | | 3,913 | | | | 3,925 | |
7.50%, 12/15/23-5/15/25 | | | 1,012,678 | | | | 1,134,498 | |
7.00%, 5/15/28 | | | 323,352 | | | | 366,172 | |
| | | | | | | | |
| | | | | | | 14,840,306,605 | |
Private Label CMO & REMIC: 0.0%(e) | | | | | | | | |
GSMPS Mortgage Loan Trust
Series 2004-4 1A4, 8.50%, 6/25/34(b) | | | 3,961,558 | | | | 4,328,747 | |
| | | | | | | | |
| | | | | | | 15,898,054,483 | |
| | | | | | | | |
| | | | | | | 17,569,061,555 | |
| CORPORATE: 38.9% | | | | | | | | |
FINANCIALS: 14.0% | | | | | | | | |
Bank of America Corp. | | | | | | | | |
7.625%, 6/1/19 | | | 226,367,000 | | | | 249,737,129 | |
5.625%, 7/1/20 | | | 135,861,000 | | | | 148,771,056 | |
4.20%, 8/26/24 | | | 163,140,000 | | | | 169,249,593 | |
4.25%, 10/22/26 | | | 127,024,000 | | | | 130,819,604 | |
6.625%, 5/23/36(a) | | | 244,578,000 | | | | 295,906,362 | |
Barclays PLC (United Kingdom) | | | | | | | | |
4.375%, 9/11/24 | | | 267,454,000 | | | | 270,688,054 | |
4.836%, 5/9/28 | | | 34,675,000 | | | | 35,451,581 | |
BNP Paribas SA (France) | | | | | | | | |
4.25%, 10/15/24 | | | 379,446,000 | | | | 395,779,633 | |
4.375%, 9/28/25(b) | | | 139,890,000 | | | | 145,017,248 | |
4.375%, 5/12/26(b) | | | 79,279,000 | | | | 82,106,882 | |
Boston Properties, Inc. | | | | | | | | |
5.875%, 10/15/19 | | | 48,079,000 | | | | 51,553,092 | |
5.625%, 11/15/20 | | | 79,385,000 | | | | 87,155,601 | |
4.125%, 5/15/21 | | | 52,852,000 | | | | 55,729,474 | |
3.85%, 2/1/23 | | | 76,031,000 | | | | 79,980,430 | |
3.125%, 9/1/23 | | | 19,500,000 | | | | 19,738,719 | |
3.80%, 2/1/24 | | | 64,024,000 | | | | 66,424,452 | |
Capital One Financial Corp. | | | | | | | | |
3.50%, 6/15/23 | | | 155,385,000 | | | | 158,482,600 | |
3.75%, 4/24/24 | | | 36,940,000 | | | | 37,749,392 | |
3.20%, 2/5/25 | | | 67,240,000 | | | | 65,824,531 | |
4.20%, 10/29/25 | | | 121,149,000 | | | | 122,170,771 | |
| | |
| PAGE 10 § DODGE & COX INCOME FUND | | See accompanying Notes to Financial Statements |
| | | | |
| PORTFOLIO OF INVESTMENTS (unaudited) | | | June 30, 2017 | |
| | | | | | | | |
| DEBT SECURITIES (continued) | | | | | | |
| | |
| | | PAR VALUE | | | VALUE | |
Cigna Corp. | | | | | | | | |
4.00%, 2/15/22 | | $ | 62,964,000 | | | $ | 66,547,848 | |
7.65%, 3/1/23 | | | 7,217,000 | | | | 8,891,496 | |
7.875%, 5/15/27 | | | 33,255,000 | | | | 44,626,181 | |
8.30%, 1/15/33 | | | 8,195,000 | | | | 11,396,614 | |
6.15%, 11/15/36 | | | 88,097,000 | | | | 111,757,387 | |
5.875%, 3/15/41 | | | 18,939,000 | | | | 23,839,826 | |
5.375%, 2/15/42 | | | 68,843,000 | | | | 82,881,465 | |
Citigroup, Inc. | | | | | | | | |
2.882%, 5/15/18 | | | 79,070,000 | | | | 80,073,477 | |
3.50%, 5/15/23 | | | 72,730,000 | | | | 73,726,256 | |
4.00%, 8/5/24 | | | 31,300,000 | | | | 32,216,871 | |
7.542%, 10/30/40(a) | | | 381,543,025 | | | | 396,804,746 | |
Equity Residential | | | | | | | | |
4.75%, 7/15/20 | | | 5,200,000 | | | | 5,543,335 | |
4.625%, 12/15/21 | | | 108,687,000 | | | | 117,430,652 | |
3.00%, 4/15/23 | | | 47,300,000 | | | | 47,494,119 | |
3.375%, 6/1/25 | | | 77,890,000 | | | | 78,380,006 | |
HSBC Holdings PLC (United Kingdom) | | | | | | | | |
5.10%, 4/5/21 | | | 85,935,000 | | | | 93,420,712 | |
9.30%, 6/1/21 | | | 100,000 | | | | 121,938 | |
4.30%, 3/8/26 | | | 116,100,000 | | | | 123,556,174 | |
6.50%, 5/2/36 | | | 184,105,000 | | | | 236,008,250 | |
6.50%, 9/15/37 | | | 201,366,000 | | | | 260,664,260 | |
6.80%, 6/1/38 | | | 32,000,000 | | | | 42,792,096 | |
JPMorgan Chase & Co. | | | | | | | | |
3.375%, 5/1/23 | | | 92,238,000 | | | | 93,586,889 | |
4.125%, 12/15/26 | | | 106,000,000 | | | | 110,115,344 | |
8.75%, 9/1/30(a) | | | 48,438,000 | | | | 72,475,358 | |
Lloyds Banking Group PLC (United Kingdom) | | | | | | | | |
4.50%, 11/4/24 | | | 218,317,000 | | | | 227,364,275 | |
4.582%, 12/10/25 | | | 24,585,000 | | | | 25,491,523 | |
4.65%, 3/24/26 | | | 118,232,000 | | | | 123,208,148 | |
Navient Corp. | | | | | | | | |
4.625%, 9/25/17 | | | 111,437,000 | | | | 111,715,592 | |
8.45%, 6/15/18 | | | 230,726,000 | | | | 242,954,478 | |
Royal Bank of Scotland Group PLC (United Kingdom) | | | | | | | | |
6.125%, 12/15/22 | | | 292,243,000 | | | | 319,920,458 | |
6.00%, 12/19/23 | | | 277,320,000 | | | | 305,948,298 | |
Unum Group | | | | | | | | |
7.19%, 2/1/28 | | | 11,295,000 | | | | 13,468,135 | |
7.25%, 3/15/28 | | | 25,060,000 | | | | 31,866,647 | |
6.75%, 12/15/28 | | | 8,107,000 | | | | 9,892,469 | |
Wells Fargo & Co. | | | | | | | | |
1.873%, 12/6/19 | | | 135,850,000 | | | | 137,439,173 | |
2.15%, 12/6/19 | | | 280,875,000 | | | | 282,188,933 | |
4.30%, 7/22/27 | | | 247,864,000 | | | | 259,920,105 | |
| | | | | | | | |
| | | | | | | 6,974,065,738 | |
INDUSTRIALS: 23.5% | | | | | | | | |
AT&T, Inc. | | | | | | | | |
8.25%, 11/15/31 | | | 100,978,000 | | | | 140,276,012 | |
5.35%, 9/1/40 | | | 59,744,000 | | | | 63,336,705 | |
4.75%, 5/15/46 | | | 77,670,000 | | | | 76,267,746 | |
5.65%, 2/15/47 | | | 120,390,000 | | | | 132,745,144 | |
5.45%, 3/1/47 | | | 60,375,000 | | | | 65,081,654 | |
4.50%, 3/9/48 | | | 235,175,000 | | | | 221,701,119 | |
BHP Billiton, Ltd. (Australia)
6.75%, 10/19/75(a)(b) | | | 231,972,000 | | | | 265,048,887 | |
Burlington Northern Santa Fe LLC(d) | | | | | | | | |
4.70%, 10/1/19 | | | 33,445,000 | | | | 35,558,055 | |
8.251%, 1/15/21 | | | 2,734,831 | | | | 2,952,420 | |
3.05%, 9/1/22 | | | 39,535,000 | | | | 40,795,811 | |
5.943%, 1/15/23 | | | 33,351 | | | | 35,114 | |
| | | | | | | | |
| | |
| | | PAR VALUE | | | VALUE | |
3.85%, 9/1/23 | | $ | 79,525,000 | | | $ | 85,246,028 | |
5.72%, 1/15/24 | | | 13,358,445 | | | | 14,718,267 | |
5.342%, 4/1/24 | | | 4,070,855 | | | | 4,431,241 | |
5.629%, 4/1/24 | | | 16,991,825 | | | | 18,646,591 | |
5.996%, 4/1/24 | | | 34,145,745 | | | | 38,162,511 | |
3.442%, 6/16/28(b) | | | 83,923,246 | | | | 84,785,305 | |
Cemex SAB de CV (Mexico) | | | | | | | | |
6.50%, 12/10/19(b) | | | 28,318,000 | | | | 29,804,695 | |
6.00%, 4/1/24(b) | | | 113,175,000 | | | | 120,259,755 | |
5.70%, 1/11/25(b) | | | 207,411,000 | | | | 220,114,924 | |
6.125%, 5/5/25(b) | | | 95,400,000 | | | | 102,793,500 | |
7.75%, 4/16/26(b) | | | 4,000,000 | | | | 4,575,000 | |
Charter Communications, Inc. | | | | | | | | |
8.75%, 2/14/19 | | | 130,460,000 | | | | 143,498,564 | |
8.25%, 4/1/19 | | | 237,543,000 | | | | 262,055,062 | |
5.00%, 2/1/20 | | | 20,700,000 | | | | 22,081,207 | |
4.125%, 2/15/21 | | | 33,095,000 | | | | 34,604,860 | |
4.00%, 9/1/21 | | | 40,609,000 | | | | 42,445,014 | |
4.908%, 7/23/25 | | | 122,505,000 | | | | 132,355,872 | |
6.55%, 5/1/37 | | | 46,188,000 | | | | 55,211,426 | |
6.75%, 6/15/39 | | | 112,072,000 | | | | 137,326,641 | |
6.484%, 10/23/45 | | | 106,321,000 | | | | 127,766,371 | |
5.375%, 5/1/47(b) | | | 33,210,000 | | | | 35,181,146 | |
Cox Enterprises, Inc. | | | | | | | | |
9.375%, 1/15/19(b) | | | 143,919,000 | | | | 158,522,605 | |
3.25%, 12/15/22(b) | | | 110,233,000 | | | | 109,988,613 | |
2.95%, 6/30/23(b) | | | 229,213,000 | | | | 223,532,873 | |
3.85%, 2/1/25(b) | | | 240,909,000 | | | | 242,745,449 | |
CRH PLC (Ireland)
3.875%, 5/18/25(b) | | | 196,754,000 | | | | 204,488,793 | |
CSX Corp. | | | | | | | | |
9.75%, 6/15/20 | | | 10,067,000 | | | | 12,136,564 | |
6.251%, 1/15/23 | | | 14,091,383 | | | | 16,152,248 | |
Dell Technologies, Inc. | | | | | | | | |
4.42%, 6/15/21(b) | | | 255,000,000 | | | | 268,801,365 | |
5.45%, 6/15/23(b) | | | 178,108,000 | | | | 193,253,236 | |
Dillard’s, Inc. | | | | | | | | |
7.13%, 8/1/18 | | | 23,565,000 | | | | 24,660,042 | |
7.875%, 1/1/23 | | | 275,000 | | | | 318,514 | |
7.75%, 7/15/26 | | | 21,016,000 | | | | 24,341,824 | |
7.75%, 5/15/27 | | | 12,848,000 | | | | 14,810,699 | |
7.00%, 12/1/28 | | | 28,225,000 | | | | 31,265,087 | |
Dow Chemical Co. | | | | | | | | |
7.375%, 11/1/29 | | | 69,100,000 | | | | 92,796,048 | |
9.40%, 5/15/39 | | | 144,913,000 | | | | 243,819,311 | |
5.25%, 11/15/41 | | | 35,928,000 | | | | 41,685,893 | |
FedEx Corp.
8.00%, 1/15/19 | | | 16,875,000 | | | | 18,396,231 | |
Ford Motor Credit Co. LLC(d) | | | | | | | | |
2.681%, 1/9/20 | | | 110,925,000 | | | | 111,662,873 | |
8.125%, 1/15/20 | | | 7,091,000 | | | | 8,060,815 | |
5.75%, 2/1/21 | | | 192,923,000 | | | | 212,264,109 | |
5.875%, 8/2/21 | | | 162,085,000 | | | | 180,729,800 | |
3.219%, 1/9/22 | | | 39,700,000 | | | | 40,048,725 | |
4.25%, 9/20/22 | | | 31,925,000 | | | | 33,534,212 | |
Imperial Brands PLC (United Kingdom) | | | | | | | | |
3.75%, 7/21/22(b) | | | 124,595,000 | | | | 129,706,011 | |
4.25%, 7/21/25(b) | | | 444,303,000 | | | | 469,003,137 | |
Kinder Morgan, Inc. | | | | | | | | |
4.30%, 6/1/25 | | | 119,770,000 | | | | 124,533,013 | |
6.50%, 2/1/37 | | | 50,861,000 | | | | 56,370,009 | |
6.95%, 1/15/38 | | | 92,139,000 | | | | 110,155,215 | |
6.50%, 9/1/39 | | | 72,546,000 | | | | 82,241,120 | |
5.00%, 8/15/42 | | | 57,054,000 | | | | 55,842,515 | |
| | |
| See accompanying Notes to Financial Statements | | DODGE & COX INCOME FUND §PAGE 11 |
| | | | |
| PORTFOLIO OF INVESTMENTS (unaudited) | | | June 30, 2017 | |
| | | | | | | | |
| DEBT SECURITIES (continued) | | | | | | |
| | |
| | | PAR VALUE | | | VALUE | |
5.00%, 3/1/43 | | $ | 71,101,000 | | | $ | 68,676,882 | |
5.50%, 3/1/44 | | | 80,632,000 | | | | 83,326,641 | |
5.40%, 9/1/44 | | | 39,504,000 | | | | 39,892,680 | |
Macy’s, Inc. | | | | | | | | |
6.65%, 7/15/24 | | | 52,526,000 | | | | 57,225,028 | |
7.00%, 2/15/28 | | | 24,800,000 | | | | 26,515,466 | |
6.70%, 9/15/28 | | | 34,115,000 | | | | 35,323,865 | |
6.90%, 4/1/29 | | | 81,337,000 | | | | 86,840,099 | |
6.90%, 1/15/32 | | | 28,618,000 | | | | 29,697,242 | |
6.70%, 7/15/34 | | | 143,960,000 | | | | 149,185,892 | |
4.50%, 12/15/34 | | | 154,923,000 | | | | 128,285,849 | |
6.375%, 3/15/37 | | | 41,543,000 | | | | 42,378,679 | |
Naspers, Ltd. (South Africa) | | | | | | | | |
6.00%, 7/18/20(b) | | | 220,010,000 | | | | 237,610,800 | |
5.50%, 7/21/25(b) | | | 257,875,000 | | | | 275,797,312 | |
4.85%, 7/6/27(b) | | | 64,000,000 | | | | 64,160,000 | |
Nordstrom, Inc.
6.95%, 3/15/28 | | | 20,107,000 | | | | 21,820,981 | |
RELX PLC (United Kingdom) | | | | | | | | |
8.625%, 1/15/19 | | | 28,613,000 | | | | 31,299,160 | |
3.125%, 10/15/22 | | | 144,337,000 | | | | 144,650,933 | |
Telecom Italia SPA (Italy) | | | | | | | | |
6.999%, 6/4/18 | | | 165,232,000 | | | | 172,460,900 | |
7.175%, 6/18/19 | | | 200,711,000 | | | | 219,025,879 | |
5.303%, 5/30/24(b) | | | 250,432,000 | | | | 268,588,320 | |
7.20%, 7/18/36 | | | 53,458,000 | | | | 61,977,869 | |
7.721%, 6/4/38 | | | 129,877,000 | | | | 157,151,170 | |
Time Warner, Inc. | | | | | | | | |
7.625%, 4/15/31 | | | 109,850,000 | | | | 149,844,408 | |
7.70%, 5/1/32 | | | 244,392,000 | | | | 340,254,273 | |
TransCanada Corp. (Canada) | | | | | | | | |
5.625%, 5/20/75(a) | | | 237,639,000 | | | | 251,020,452 | |
5.875%, 8/15/76(a) | | | 76,814,000 | | | | 83,358,553 | |
5.30%, 3/15/77(a) | | | 156,985,000 | | | | 161,380,580 | |
Twenty-First Century Fox, Inc. | | | | | | | | |
6.20%, 12/15/34 | | | 14,795,000 | | | | 18,234,127 | |
6.40%, 12/15/35 | | | 49,525,000 | | | | 62,827,415 | |
6.15%, 3/1/37 | | | 31,905,000 | | | | 39,903,871 | |
6.65%, 11/15/37 | | | 79,075,000 | | | | 104,433,325 | |
6.15%, 2/15/41 | | | 40,108,000 | | | | 50,683,958 | |
Ultrapar Participacoes SA (Brazil)
5.25%, 10/6/26(b) | | | 185,300,000 | | | | 185,022,050 | |
Union Pacific Corp. | | | | | | | | |
7.60%, 1/2/20 | | | 387,688 | | | | 428,202 | |
6.061%, 1/17/23 | | | 3,853,811 | | | | 4,185,775 | |
4.698%, 1/2/24 | | | 2,550,358 | | | | 2,709,755 | |
5.082%, 1/2/29 | | | 6,281,759 | | | | 6,837,532 | |
5.866%, 7/2/30 | | | 39,728,159 | | | | 45,269,443 | |
6.176%, 1/2/31 | | | 34,683,668 | | | | 40,270,687 | |
Verizon Communications, Inc. | | | | | | | | |
4.272%, 1/15/36 | | | 166,472,000 | | | | 160,849,908 | |
4.522%, 9/15/48 | | | 198,801,000 | | | | 188,487,403 | |
5.012%, 4/15/49(b) | | | 451,757,000 | | | | 456,873,148 | |
Vulcan Materials Co.
7.50%, 6/15/21 | | | 143,984,000 | | | | 169,909,903 | |
Xerox Corp. | | | | | | | | |
6.35%, 5/15/18 | | | 106,052,000 | | | | 109,996,180 | |
5.625%, 12/15/19 | | | 87,407,000 | | | | 93,268,076 | |
2.75%, 9/1/20 | | | 22,690,000 | | | | 22,632,617 | |
4.50%, 5/15/21 | | | 63,744,000 | | | | 66,762,725 | |
4.07%, 3/17/22(b) | | | 2,349,000 | | | | 2,408,808 | |
Zoetis, Inc. | | | | | | | | |
3.45%, 11/13/20 | | | 39,377,000 | | | | 40,719,480 | |
4.50%, 11/13/25 | | | 166,139,000 | | | | 181,399,366 | |
| | | | | | | | |
| | | | | | | 11,737,593,263 | |
| | | | | | | | |
| | |
| | | PAR VALUE | | | VALUE | |
UTILITIES: 1.4% | | | | | | | | |
Dominion Energy, Inc. | | | | | | | | |
2.962%, 7/1/19 | | $ | 10,000,000 | | | $ | 10,149,930 | |
4.104%, 4/1/21 | | | 97,451,000 | | | | 102,273,753 | |
5.75%, 10/1/54(a) | | | 232,036,000 | | | | 248,278,520 | |
Enel SPA (Italy) | | | | | | | | |
6.80%, 9/15/37(b) | | | 153,664,000 | | | | 197,082,992 | |
6.00%, 10/7/39(b) | | | 137,712,000 | | | | 163,961,560 | |
| | | | | | | | |
| | | | | | | 721,746,755 | |
| | | | | | | | |
| | | | | | | 19,433,405,756 | |
| | | | | | | | |
TOTAL DEBT SECURITIES
(Cost $47,041,831,877) | | | | | | $ | 48,520,803,738 | |
|
| SHORT-TERM INVESTMENTS: 2.3% | |
COMMERCIAL PAPER: 0.7% | | | | | | | | |
Anthem, Inc. | | | | | | | | |
7/5/17(b) | | $ | 50,000,000 | | | $ | 49,951,667 | |
7/7/17(b) | | | 75,000,000 | | | | 74,912,986 | |
7/13/17(b) | | | 48,200,000 | | | | 48,150,140 | |
Dominion Energy, Inc.
7/25/17(b) | | | 40,000,000 | | | | 39,962,133 | |
Mondelez International, Inc.
7/27/17(b) | | | 148,200,000 | | | | 148,062,997 | |
| | | | | | | | |
| | | | | | | 361,039,923 | |
MONEY MARKET FUND: 0.1% | | | | | | | | |
State Street Institutional Treasury Plus Money Market Fund | | | 49,944,257 | | | | 49,944,257 | |
|
REPURCHASE AGREEMENT: 1.5% | |
Fixed Income Clearing Corporation(c)
0.60%, dated 6/30/17, due 7/3/17, maturity value $718,358,916 | | | 718,323,000 | | | | 718,323,000 | |
| | | | | | | | |
TOTAL SHORT-TERM INVESTMENTS
(Cost $1,129,307,180) | | | $ | 1,129,307,180 | |
| | | | | | | | |
TOTAL INVESTMENTS
(Cost $48,171,139,057) | | | 99.4 | % | | $ | 49,650,110,918 | |
OTHER ASSETS LESS LIABILITIES | | | 0.6 | % | | | 341,292,143 | |
| | | | | | | | |
| NET ASSETS | | | 100.0 | % | | $ | 49,991,403,061 | |
| | | | | | | | |
| (b) | Security exempt from registration under Rule 144A of the Securities Act of 1933. The security may be resold in transactions exempt from registration, normally to qualified institutional buyers. As of June 30, 2017, all such securities in total represented $6,670,083,408 or 13.3% of net assets. These securities have been deemed liquid by Dodge & Cox, investment manager, pursuant to procedures approved by the Fund’s Board of Trustees. |
| (c) | Repurchase agreement is collateralized by U.S. Treasury Notes 1.375%-7.25%, 4/30/22-6/30/23. Total collateral value is $732,691,685. |
| (d) | Subsidiary (see below) |
Debt securities are grouped by parent company unless otherwise noted. Actual securities may be issued by the listed parent company or one of its subsidiaries. In determining a parent company’s country designation, the Fund generally references the country of incorporation.
ARM: Adjustable Rate Mortgage
CMO: Collateralized Mortgage Obligation
DUS: Delegated Underwriting and Servicing
GO: General Obligation
RB: Revenue Bond
REMIC: Real Estate Mortgage Investment Conduit
| | |
| PAGE 12 § DODGE & COX INCOME FUND | | See accompanying Notes to Financial Statements |
| | | | |
| PORTFOLIO OF INVESTMENTS (unaudited) | | | June 30, 2017 | |
FUTURES CONTRACTS
| | | | | | | | | | | | | | | | |
| Description | | Number of
Contracts | | | Expiration
Date | | | Notional Amount | | | Unrealized
Appreciation/
(Depreciation) | |
10 Year U.S. Treasury Note—Short Position | | | 13,511 | | | | Sep 2017 | | | $ | (1,696,052,719 | ) | | $ | 2,901,047 | |
Long Term U.S. Treasury Bond—Short Position | | | 3,594 | | | | Sep 2017 | | | | (596,154,750 | ) | | | (10,611,095 | ) |
| | | | | | | | | | | | | | | | |
| | | | | | | | | | | | | | $ | (7,710,048 | ) |
| | | | | | | | | | | | | | | | |
| | |
| See accompanying Notes to Financial Statements | | DODGE & COX INCOME FUND §PAGE 13 |
| | | | |
STATEMENT OF ASSETS AND LIABILITIES (unaudited) | |
| |
| | | June 30, 2017 | |
ASSETS: | | | | |
Investments, at value (cost $48,171,139,057) | | $ | 49,650,110,918 | |
Cash held at broker | | | 29,554,789 | |
Receivable for investments sold | | | 33,553,493 | |
Receivable from broker for variation margin | | | 10,094,494 | |
Receivable for Fund shares sold | | | 73,910,073 | |
Interest receivable | | | 362,491,189 | |
Prepaid expenses and other assets | | | 89,287 | |
| | | | |
| | | 50,159,804,243 | |
| | | | |
LIABILITIES: | | | | |
Payable for investments purchased | | | 108,602,473 | |
Payable for Fund shares redeemed | | | 40,656,599 | |
Management fees payable | | | 16,389,052 | |
Accrued expenses | | | 2,753,058 | |
| | | | |
| | | 168,401,182 | |
| | | | |
NET ASSETS | | $ | 49,991,403,061 | |
| | | | |
NET ASSETS CONSIST OF: | | | | |
Paid in capital | | $ | 48,484,459,782 | |
Undistributed net investment income | | | 7,291,614 | |
Undistributed net realized gain | | | 28,389,852 | |
Net unrealized appreciation | | | 1,471,261,813 | |
| | | | |
| | $ | 49,991,403,061 | |
| | | | |
Fund shares outstanding (par value $0.01 each, unlimited shares authorized) | | | 3,635,861,580 | |
Net asset value per share | | $ | 13.75 | |
|
STATEMENT OF OPERATIONS (unaudited) | |
| |
| | | Six Months Ended
June 30, 2017 | |
INVESTMENT INCOME: | | | | |
Dividends | | $ | 13,909,456 | |
Interest | | | 780,182,273 | |
| | | | |
| | | 794,091,729 | |
| | | | |
EXPENSES: | | | | |
Management fees | | | 96,147,821 | |
Custody and fund accounting fees | | | 368,131 | |
Transfer agent fees | | | 4,282,217 | |
Professional services | | | 98,448 | |
Shareholder reports | | | 1,094,223 | |
Registration fees | | | 623,509 | |
Trustees’ fees | | | 130,000 | |
Miscellaneous | | | 471,686 | |
| | | | |
| | | 103,216,035 | |
| | | | |
NET INVESTMENT INCOME | | | 690,875,694 | |
| | | | |
REALIZED AND UNREALIZED GAIN (LOSS): | | | | |
Net realized gain (loss) | | | | |
Investments | | | 93,526,917 | |
Futures contracts | | | (50,194,907 | ) |
Net change in unrealized appreciation/depreciation | | | | |
Investments | | | 588,655,767 | |
Futures contracts | | | (21,305,340 | ) |
| | | | |
Net realized and unrealized gain | | | 610,682,437 | |
| | | | |
NET CHANGE IN NET ASSETS FROM OPERATIONS | | $ | 1,301,558,131 | |
| | | | |
| | | | | | | | |
STATEMENT OF CHANGES IN NET ASSETS (unaudited) | |
| | |
| | | Six Months Ended June 30, 2017 | | | Year Ended
December 31, 2016 | |
OPERATIONS: | | | | | | | | |
Net investment income | | $ | 690,875,694 | | | $ | 1,412,514,115 | |
Net realized gain | | | 43,332,010 | | | | 179,878,274 | |
Net change in unrealized appreciation/depreciation | | | 567,350,427 | | | | 843,698,150 | |
| | | | | | | | |
| | | 1,301,558,131 | | | | 2,436,090,539 | |
| | | | | | | | |
| | |
DISTRIBUTIONS TO SHAREHOLDERS FROM: | | | | | | | | |
Net investment income | | | (698,865,241 | ) | | | (1,410,152,555 | ) |
Net realized gain | | | (39,156,481 | ) | | | (62,011,941 | ) |
| | | | | | | | |
Total distributions | | | (738,021,722 | ) | | | (1,472,164,496 | ) |
| | | | | | | | |
| | |
FUND SHARE TRANSACTIONS: | | | | | | | | |
Proceeds from sale of shares | | | 7,591,326,745 | | | | 11,299,892,007 | |
Reinvestment of distributions | | | 603,626,044 | | | | 1,208,984,389 | |
Cost of shares redeemed | | | (5,399,541,602 | ) | | | (9,965,599,733 | ) |
| | | | | | | | |
Net change from Fund share transactions | | | 2,795,411,187 | | | | 2,543,276,663 | |
| | | | | | | | |
Total change in net assets | | | 3,358,947,596 | | | | 3,507,202,706 | |
| | |
NET ASSETS: | | | | | | | | |
Beginning of period | | | 46,632,455,465 | | | | 43,125,252,759 | |
| | | | | | | | |
End of period (including undistributed net investment income of $7,291,614 and $15,281,161, respectively) | | $ | 49,991,403,061 | | | $ | 46,632,455,465 | |
| | | | | | | | |
| | |
SHARE INFORMATION: | | | | | | | | |
Shares sold | | | 553,895,368 | | | | 830,115,244 | |
Distributions reinvested | | | 44,077,589 | | | | 88,916,899 | |
Shares redeemed | | | (393,974,006 | ) | | | (732,099,399 | ) |
| | | | | | | | |
Net change in shares outstanding | | | 203,998,951 | | | | 186,932,744 | |
| | | | | | | | |
| | |
| PAGE 14 § DODGE & COX INCOME FUND | | See accompanying Notes to Financial Statements |
NOTES TO FINANCIAL STATEMENTS (unaudited)
NOTE 1—ORGANIZATION AND SIGNIFICANT ACCOUNTING POLICIES
Dodge & Cox Income Fund (the “Fund”) is one of the series constituting the Dodge & Cox Funds (the “Trust” or the “Funds”). The Trust is organized as a Delaware statutory trust and is registered under the Investment Company Act of 1940, as amended, as an open-end management investment company. The Fund commenced operations on January 3, 1989, and seeks high and stable current income consistent with long-term preservation of capital. Risk considerations and investment strategies of the Fund are discussed in the Fund’s Prospectus.
The financial statements have been prepared in conformity with accounting principles generally accepted in the United States of America, which require the use of estimates and assumptions by management. Actual results may differ from those estimates. Significant accounting policies are as follows:
Security valuation The Fund’s net assets are normally valued as of the scheduled close of trading on the New York Stock Exchange (NYSE), generally 4:00 p.m. Eastern Time, each day that the NYSE is open for business.
Debt securities and derivatives traded over the counter, are valued using prices received from independent pricing services which utilize dealer quotes, recent transaction data, pricing models, and other inputs to arrive at market-based valuations. Pricing models may consider quoted prices for similar securities, interest rates, cash flows (including prepayment speeds), and credit risk. Exchange-traded derivatives are valued at the settlement price determined by the relevant exchange. Short-term securities less than 60 days to maturity may be valued at amortized cost if amortized cost approximates current value. Mutual funds are valued at their respective net asset values. Security values are not discounted based on the size of the Fund’s position and may differ from the value a Fund receives upon sale of the securities. All securities held by the Fund are denominated in U.S. dollars.
If market quotations are not readily available or if normal valuation procedures produce valuations that are deemed unreliable or inappropriate under the circumstances existing at the time, the investment will be valued at fair value as determined in good faith by or under the direction of the Fund’s Board of Trustees. The Board of Trustees has appointed Dodge & Cox, the Fund’s investment manager, to make fair value determinations in accordance with the Dodge & Cox Funds Valuation Policies (“Valuation Policies”), subject to Board oversight. Dodge & Cox has established a Pricing Committee that is comprised of representatives from Treasury, Legal, Compliance, and Operations. The Pricing Committee is responsible for implementing the Valuation Policies, including determining the fair value of securities and other investments when necessary. The Pricing Committee considers relevant indications of value that are reasonably available to it in determining the fair value assigned to a particular security, such as the value of similar financial instruments, trading volumes, contractual restrictions on disposition, related corporate actions, and changes in economic conditions. In doing so, the Pricing Committee employs various
methods for calibrating fair valuation approaches, including a regular review of key inputs and assumptions, back-testing, and review of any related market activity.
Valuing securities through a fair value determination involves greater reliance on judgment than valuation of securities based on readily available market quotations. In some instances, lack of information and uncertainty as to the significance of information may lead to a conclusion that a prior valuation is the best indication of a security’s value. When fair value pricing is employed, the prices of securities used by the Fund to calculate its NAV may differ from quoted or published prices for the same securities.
Security transactions, investment income, expenses, and distributions Security transactions are recorded on the trade date. Realized gains and losses on securities sold are determined on the basis of identified cost.
Interest income is recorded on the accrual basis. Interest income includes coupon interest, amortization of premium and accretion of discount on debt securities, and gain/loss on paydowns. The ability of the issuers of the debt securities held by the Fund to meet their obligations may be affected by economic developments in a specific industry, state, or region. Debt obligations may be placed on non-accrual status and related interest income may be reduced by ceasing current accruals and writing off interest receivables when the collection of all or a portion of interest has become doubtful. A debt obligation is removed from non-accrual status when the issuer resumes interest payments or when collectibility of interest is reasonably assured. Dividend income is recorded on the ex-dividend date.
Expenses are recorded on the accrual basis. Some expenses of the Trust can be directly attributed to a specific series. Expenses which cannot be directly attributed are allocated among the Funds in the Trust using methodologies determined by the nature of the expense.
Distributions to shareholders are recorded on the ex-dividend date.
Repurchase agreements Repurchase agreements are transactions under which a Fund purchases a security from a dealer counterparty and agrees to resell the security to that counterparty on a specified future date at the same price, plus a specified interest rate. The Fund’s repurchase agreements are secured by U.S. government or agency securities. It is the Fund’s policy that its custodian take possession of the underlying collateral securities, the fair value of which exceeds the principal amount of the repurchase transaction, including accrued interest, at all times. In the event of default by the counterparty, the Fund has the contractual right to liquidate the securities and to apply the proceeds in satisfaction of the obligation.
Futures Contracts Futures contracts involve an obligation to purchase or sell (depending on whether the Fund has entered a long or short futures contract, respectively) an asset at a future date, at a price set at the time of the contract. Upon entering into a futures contract, the Fund is required to deposit an amount of cash or liquid assets (referred to as initial margin) in a segregated account with the clearing broker. Subsequent payments (referred
DODGE & COX INCOME FUND §PAGE 15
NOTES TO FINANCIAL STATEMENTS (unaudited)
to as variation margin) to and from the clearing broker are made on a daily basis based on changes in the market value of futures contracts. Futures contracts are traded publicly and their market value changes daily. Changes in the market value of open futures contracts are recorded as unrealized appreciation or depreciation in the Statement of Operations. Realized gains and losses on futures contracts are recorded in the Statement of Operations at the closing or expiration of the contracts. Cash deposited with a broker as initial margin is recorded on the Statement of Assets and Liabilities. A receivable and/or payable to brokers for daily variation margin is also recorded on the Statement of Assets and Liabilities.
Investments in futures contracts may include certain risks, which may be different from, and potentially greater than, those of the underlying securities. To the extent the Fund uses futures, it is exposed to additional volatility and potential losses resulting from leverage.
The Fund has maintained short Treasury futures contracts to assist with the management of the portfolio’s interest rate exposure. During the six months ended June 30, 2017, these Treasury futures contracts had notional values ranging from 4% to 6% of net assets.
Indemnification Under the Trust’s organizational documents, its officers and trustees are indemnified against certain liabilities arising out of the performance of their duties to the Trust. In addition, in the normal course of business the Trust enters into contracts that provide general indemnities to other parties. The Trust’s maximum exposure under these arrangements is unknown as this would involve future claims that may be made against the Trust that have not yet occurred.
NOTE 2—VALUATION MEASUREMENTS
Various inputs are used in determining the value of the Fund’s investments. These inputs are summarized in the three broad levels listed below.
| § | | Level 1: Quoted prices in active markets for identical securities |
| § | | Level 2: Other significant observable inputs (including quoted prices for similar securities, market indices, interest rates, credit risk, forward exchange rates, etc.) |
| § | | Level 3: Significant unobservable inputs (including Fund management’s assumptions in determining the fair value of investments) |
The inputs or methodology used for valuing securities are not necessarily an indication of the risk associated with investing in those securities.
The following is a summary of the inputs used to value the Fund’s holdings at June 30, 2017:
| | | | | | | | |
| Classification(a) | | LEVEL 1 (Quoted Prices) | | | LEVEL 2 (Other Significant Observable Inputs) | |
Securities | | | | | | | | |
Debt Securities | | | | | | | | |
U.S. Treasury | | $ | — | | | $ | 8,157,328,949 | |
Government-Related | | | — | | | | 3,361,007,478 | |
Securitized | | | — | | | | 17,569,061,555 | |
Corporate | | | — | | | | 19,433,405,756 | |
Short-term Investments | | | | | | | | |
Commercial Paper | | | — | | | | 361,039,923 | |
Money Market Fund | | | 49,944,257 | | | | — | |
Repurchase Agreement | | | — | | | | 718,323,000 | |
| | | | | | | | |
Total Securities | | $ | 49,944,257 | | | $ | 49,600,166,661 | |
| | | | | | | | |
Other Financial Instruments(b) | | | | | | | | |
Futures Contracts | | | | | | | | |
Appreciation | | $ | 2,901,047 | | | $ | — | |
Depreciation | | | (10,611,095 | ) | | | — | |
| | | | | | | | | |
| (a) | There were no transfers between Level 1 and Level 2 during the six months ended June 30, 2017. There were no Level 3 securities at June 30, 2017 and December 31, 2016 and there were no transfers to Level 3 during the period. |
NOTE 3—RELATED PARTY TRANSACTIONS
Management fees Under a written agreement approved by a unanimous vote of the Board of Trustees, the Fund pays an annual management fee of 0.50% of the Fund’s average daily net assets up to $100 million and 0.40% of the Fund’s average daily net assets in excess of $100 million to Dodge & Cox, investment manager of the Fund. The agreement further provides that Dodge & Cox shall waive its fee to the extent that such fee plus all other ordinary operating expenses of the Fund exceed 1% of the average daily net assets for the year.
Fund officers and trustees All officers and two of the trustees of the Trust are officers or employees of Dodge & Cox. The Trust pays a fee only to those trustees who are not affiliated with Dodge & Cox.
NOTE 4—INCOME TAX INFORMATION AND DISTRIBUTIONS TO SHAREHOLDERS
A provision for federal income taxes is not required since the Fund intends to continue to qualify as a regulated investment company under Subchapter M of the Internal Revenue Code and distribute all of its taxable income to shareholders. Distributions are determined in accordance with income tax regulations, and such amounts may differ from net investment income and realized gains for financial reporting purposes. Financial reporting records are adjusted for permanent book to tax differences at year end to reflect tax character.
Book to tax differences are primarily due to differing treatments of wash sales, net short-term realized gain (loss), and futures contracts. At June 30, 2017, the cost of investments for federal income tax purposes was $48,171,164,255.
PAGE 16 § DODGE & COX INCOME FUND
NOTES TO FINANCIAL STATEMENTS (unaudited)
Distributions during the periods noted below were characterized as follows for federal income tax purposes:
| | | | | | | | |
| | | Six Months Ended June 30, 2017 | | | Year Ended December 31, 2016 | |
Ordinary income | | $ | 698,865,241 | | | $ | 1,410,152,555 | |
| | ($ | 0.195 per share | ) | | ($ | 0.422 per share | ) |
Long-term capital gain | | $ | 39,156,481 | | | $ | 62,011,941 | |
| | ($ | 0.011 per share | ) | | ($ | 0.019 per share | ) |
At June 30, 2017, the tax basis components of distributable earnings were as follows:
| | | | |
Unrealized appreciation | | $ | 1,712,602,019 | |
Unrealized depreciation | | | (233,655,356 | ) |
| | | | |
Net unrealized appreciation | | | 1,478,946,663 | |
Undistributed ordinary income | | | 7,291,614 | |
Undistributed long-term capital gain | | | 20,705,002 | |
| | | | | |
Fund management has reviewed the tax positions for open periods (three years and four years, respectively, from filing the Fund’s Federal and State tax returns) as applicable to the Fund, and has determined that no provision for income tax is required in the Fund’s financial statements.
NOTE 5—LOAN FACILITIES
Pursuant to an exemptive order issued by the Securities and Exchange Commission (SEC), the Fund may participate in an interfund lending facility (Facility). The Facility allows the Fund to borrow money from or loan money to the Funds. Loans under the Facility are made for temporary or emergency purposes, such as to fund shareholder redemption requests. Interest on borrowings is the average of the current repurchase agreement rate and the bank loan rate. There was no activity in the Facility during the period.
All Funds in the Trust participate in a $500 million committed credit facility (Line of Credit) with State Street Bank and Trust Company, to be utilized for temporary or emergency purposes to fund shareholder redemptions or for other short-term liquidity purposes. The maximum amount available to the Fund is $250 million. Each Fund pays an annual commitment fee on its pro-rata portion of the Line of Credit. For the six months ended June 30, 2017, the Fund’s commitment fee amounted to $152,656 and is reflected as a Miscellaneous Expense in the Statement of Operations. Interest on borrowings is charged at the prevailing rate. There were no borrowings on the Line of Credit during the period.
NOTE 6—PURCHASES AND SALES OF INVESTMENTS
For the six months ended June 30, 2017, purchases and sales of securities, other than short-term securities and U.S. government securities, aggregated $1,947,668,077 and $1,703,096,789, respectively. For the six months ended June 30, 2017, purchases and sales of U.S. government securities aggregated $4,477,045,917 and $2,005,301,789, respectively.
NOTE 7—NEW ACCOUNTING GUIDANCE
In October 2016, the SEC issued a new rule, Investment Company Reporting Modernization, which, among other provisions, amends Regulation S-X to require standardized, enhanced disclosures, particularly related to derivatives, in investment company financial statements. Compliance with the guidance is required for financial statements for fiscal periods ending on or after August 1, 2017. Management is currently assessing the impact of this rule to the Fund’s financial statements and other filings and does not expect any impact to the Fund’s net assets or results of operations.
In March 2017, the Financial Accounting Standards Board issued an update to amend the amortization period for certain purchased callable debt securities held at a premium. The amendments shorten the amortization period for premiums to the earliest call date, but do not require an accounting change for securities held at a discount. The amendments are effective for financial statements for fiscal years beginning after December 15, 2018, and interim periods within those fiscal years. Management is evaluating the impact, if any, of this guidance on the Fund’s financial statements and disclosures.
NOTE 8—SUBSEQUENT EVENTS
Fund management has determined that no material events or transactions occurred subsequent to June 30, 2017, and through the date of the Fund’s financial statements issuance, which require additional disclosure in the Fund’s financial statements.
DODGE & COX INCOME FUND §PAGE 17
FINANCIAL HIGHLIGHTS (unaudited)
| | | | | | | | | | | | | | | | | | | | | | | | |
SELECTED DATA AND RATIOS (for a share outstanding throughout each period) | | Six Months Ended June 30, | | | Year Ended December 31, | |
| | | 2017 | | | 2016 | | | 2015 | | | 2014 | | | 2013 | | | 2012 | |
| | | | | | | | |
Net asset value, beginning of period | | | $13.59 | | | | $13.29 | | | | $13.78 | | | | $13.53 | | | | $13.86 | | | | $13.30 | |
Income from investment operations: | | | | | | | | | | | | | | | | | | | | | | | | |
Net investment income | | | 0.19 | | | | 0.42 | | | | 0.40 | | | | 0.39 | | | | 0.42 | | | | 0.48 | |
Net realized and unrealized gain (loss) | | | 0.18 | | | | 0.32 | | | | (0.48 | ) | | | 0.35 | | | | (0.33 | ) | | | 0.56 | |
| | | | | | | | |
Total from investment operations | | | 0.37 | | | | 0.74 | | | | (0.08 | ) | | | 0.74 | | | | 0.09 | | | | 1.04 | |
| | | | | | | | |
Distributions to shareholders from: | | | | | | | | | | | | | | | | | | | | | | | | |
Net investment income | | | (0.20 | ) | | | (0.42 | ) | | | (0.40 | ) | | | (0.39 | ) | | | (0.42 | ) | | | (0.48 | ) |
Net realized gain | | | (0.01 | ) | | | (0.02 | ) | | | (0.01 | ) | | | (0.10 | ) | | | — | | | | — | |
| | | | | | | | |
Total distributions | | | (0.21 | ) | | | (0.44 | ) | | | (0.41 | ) | | | (0.49 | ) | | | (0.42 | ) | | | (0.48 | ) |
| | | | | | | | |
Net asset value, end of period | | | $13.75 | | | | $13.59 | | | | $13.29 | | | | $13.78 | | | | $13.53 | | | | $13.86 | |
| | | | | | | | |
Total return | | | 2.71 | % | | | 5.62 | % | | | (0.59 | )% | | | 5.48 | % | | | 0.64 | % | | | 7.94 | % |
Ratios/supplemental data: | | | | | | | | | | | | | | | | | | | | | | | | |
Net assets, end of period (millions) | | | $49,991 | | | | $46,632 | | | | $43,125 | | | | $39,128 | | | | $24,654 | | | | $26,539 | |
Ratios of expenses to average net assets | | | 0.43 | %(a) | | | 0.43 | % | | | 0.43 | % | | | 0.44 | % | | | 0.43 | % | | | 0.43 | % |
Ratios of net investment income to average net assets | | | 2.87 | %(a) | | | 3.11 | % | | | 2.97 | % | | | 2.89 | % | | | 3.00 | % | | | 3.52 | % |
Portfolio turnover rate | | | 8 | % | | | 27 | % | | | 24 | % | | | 27 | % | | | 38 | % | | | 26 | % |
See accompanying Notes to Financial Statements
FUND HOLDINGS
The Fund provides a complete list of its holdings four times each fiscal year, as of the end of each quarter. The Fund files the lists with the Securities and Exchange Commission (SEC) on Form N-CSR (second and fourth quarters) and Form N-Q (first and third quarters). Shareholders may view the Fund’s Forms N-CSR and N-Q on the SEC’s website at sec.gov. Forms N-CSR and N-Q may also be reviewed and copied at the SEC’s Public Reference Room in Washington, DC. Information regarding the operations of the Public Reference Room may be obtained by calling 202-551-8090 (direct) or 800-732-0330 (general SEC number). A list of the Fund’s quarter-end holdings is also available at dodgeandcox.com on or about 15 days following each quarter end and remains available on the website until the list is updated in the subsequent quarter.
PROXY VOTING
For a free copy of the Fund’s proxy voting policies and procedures, please call 800-621-3979, visit the Fund’s website at dodgeandcox.com, or visit the SEC’s website at sec.gov. Information regarding how the Fund voted proxies relating to portfolio securities during the most recent 12-month period ending June 30 is also available at dodgeandcox.com or at sec.gov.
HOUSEHOLD MAILINGS
The Fund routinely mails shareholder reports and summary prospectuses to shareholders and, on occasion, proxy statements. In order to reduce the volume of mail, when possible, only one copy of these documents will be sent to shareholders who are part of the same family and share the same residential address.
If you have a direct account with the Funds and you do not want the mailing of shareholder reports and summary prospectuses combined with other members in your household, contact the Funds at 800-621-3979. Your request will be implemented within 30 days.
PAGE 18 § DODGE & COX INCOME FUND
TRUSTEES AND EXECUTIVE OFFICERS
Charles F. Pohl, Chairman and Trustee
Chairman, Dodge & Cox
Dana M. Emery, President and Trustee
Chief Executive Officer and President, Dodge & Cox
Thomas A. Larsen, Independent Trustee
Senior Counsel, Arnold & Porter Kaye Scholer LLP
Ann Mather, Independent Trustee
Former Executive Vice President, Chief Financial Officer, and Company Secretary, Pixar Animation Studios
Robert B. Morris III, Independent Trustee
Former Partner and Managing Director - Global Investment Research, Goldman Sachs, Former Advisory Director, The Presidio Group
Gary Roughead, Independent Trustee
Robert and Marion Oster Distinguished Fellow, Hoover Institution, and former U.S. Navy Chief of Naval Operations
Mark E. Smith, Independent Trustee
Former Executive Vice President and Managing Director-Fixed Income, Loomis Sayles & Company, L.P.
John B. Taylor, Independent Trustee
Professor of Economics, Stanford University; Senior Fellow, Hoover Institution; and former Under Secretary for International Affairs, United States Treasury
Diana S. Strandberg, Senior Vice President
Senior Vice President and Director of International Equity, Dodge & Cox
David H. Longhurst, Treasurer
Vice President and Assistant Treasurer, Dodge & Cox
Thomas M. Mistele, Secretary
Executive Vice President, Secretary, and Senior Counsel, Dodge & Cox
Katherine M. Primas, Chief Compliance Officer
Vice President and Chief Compliance Officer, Dodge & Cox
Roberta R.W. Kameda, Assistant Secretary
Vice President and General Counsel, Dodge & Cox
William W. Strickland, Assistant Secretary and Assistant Treasurer
Vice President and Chief Operating Officer, Dodge & Cox
Additional information about the Trust’s Trustees and Officers is available in the Trust’s Statement of Additional Information (SAI). You can get a free copy of the SAI by visiting the Funds’ website at dodgeandcox.com or calling 800-621-3979.
DODGE & COX INCOME FUND §PAGE 19
dodgeandcox.com
For Fund literature, transactions, and account
information, please visit the Funds’ website.
or write or call:
DODGE & COX FUNDS
c/o Boston Financial Data Services
P.O. Box 8422
Boston, Massachusetts 02266-8422
(800) 621-3979
INVESTMENT MANAGER
Dodge & Cox
555 California Street, 40th Floor
San Francisco, California 94104
(415) 981-1710
This report is submitted for the general information of the shareholders of the Fund. The report is not authorized for distribution to prospective investors in the Fund unless it is accompanied by a current prospectus.
This report reflects our views, opinions, and portfolio holdings as of June 30, 2017, the end of the reporting period. Any such views are subject to change at any time based upon market or other conditions and Dodge & Cox disclaims any responsibility to update such views. These views may not be relied on as investment advice and, because investment decisions for a Dodge & Cox Fund are based on numerous factors, may not be relied on as an indication of trading intent on behalf of any Dodge & Cox Fund.
DODGE & COX FUNDS®
Semi-Annual Report
June 30, 2017
Global Bond Fund
ESTABLISHED 2014
TICKER: DODLX
6/17 GBF SAR Printed on recycled paper
TO OUR SHAREHOLDERS
The Dodge & Cox Global Bond Fund had a total return of 5.8% for the six months ended June 30, 2017, compared to a return of 4.4% for the Bloomberg Barclays Global Aggregate Bond Index (Bloomberg Barclays Global Agg).
MARKET COMMENTARY
The combination of strong corporate bond performance, moderate depreciation of the U.S. dollar, and relatively stable interest rates drove positive global bond returns in the first half of 2017. Overall, risk sentiment remained positive despite lingering uncertainties regarding prospective central bank actions, scattered incidents of political conflict around the world, and evolving U.S. policies regarding tax, trade, and foreign relations.
Continuing a trend in place since early 2016, credit yield premiums(a) fell, ending the quarter at their lowest level since September 2014. The strong performance was broad based, with Basic Industry issuers (e.g., Metals & Mining, Paper) and sovereign bonds (mostly emerging market issuers) leading the way. Corporate issuance remained robust and new issue concessions were modest as deals continued to be met with strong demand. While credit valuations are less attractive than they have been in recent years, balance sheets and cash flow prospects are generally strong, and the economic backdrop appears to be on firm footing.
Low interest rates in major developed economies persisted, despite prospects for reductions in central bank asset purchase programs—a key pillar of the global low rate environment in recent years. Although recent inflation readings in the United States have been weaker than expected, unemployment is at its lowest level since 2001, and real wages are creeping up. In this environment, the U.S. Federal Reserve (Fed) hiked rates twice in the first half, signaled one more hike in 2017, and provided more details about how it might begin reducing its balance sheet later this year.
The U.S. dollar depreciated, particularly versus European currencies. The euro rose 9% amid subsiding concerns over a European Union (EU) break-up following a pro-EU victory in the French elections, as well as signals from the European Central Bank that its policies will be less expansionary going forward. Most emerging market currencies also appreciated, led by a 14% rise in the Mexican peso. The peso’s strength was driven by receding fears about trade relations with the United States, resilient domestic economic performance, and strong support from the central bank. On the other hand, Brazil’s currency depreciated and long-term interest rates rose as new corruption allegations against President Michel Temer swirled, threatening to impede progress to address key economic challenges including pension reform.
INVESTMENT STRATEGY
The Fund’s strong performance in the first half of 2017 is the result of all three primary dimensions of the Fund’s investment strategy—currency, credit, and interest rates—contributing positively to returns. The Fund’s sizable 53%(b) weighting in credit(c) boosted performance in an environment of declining credit yield premiums and continues to be an important driver of
the significant yield advantage of the Fund relative to the Bloomberg Barclays Global Agg (3.7% versus 1.6%). Meanwhile, the positive currency and interest rate performance was driven primarily by the Fund’s Latin American government bond holdings (Mexico, Colombia, and Peru).
Changes to the Fund’s holdings over the period were incremental—we reduced the Fund’s Mexican peso position by one percentage point, selectively trimmed a number of credit holdings (bringing our overall credit weighting down by four percentage points), and reduced the duration(d) of the Fund by 0.3 years. These changes and our market outlook are discussed below.
Credit: Continued Strength
Credit investing continues to be a key pillar of the Fund’s investment strategy. Broadly speaking, credit valuations are not as compelling as they were in 2015 and 2016, but we continue to believe they are significantly more attractive than those of ultra-low-yielding developed market government bonds. In our view, corporate fundamentals remain strong, with reasonable debt levels and cash positions, and a generally healthy banking system. We do not see signs of an impending broad-based deterioration in the credit environment. We are particularly confident about the Fund’s 39 corporate bond holdings which, on average, offer higher yield premiums than the broader market and, in many cases, also offer potential price appreciation. As always, we remain vigilant about downside risk and have carefully stress tested portfolio holdings to assess their ability to withstand difficult financial and economic environments.
Despite our broadly constructive outlook for credit, we have trimmed the Fund’s exposure to this segment of the market given the changing valuation landscape. Notably, the Fund’s corporate weighting is four percentage points lower year to date and 11 percentage points lower than one year ago. Trims in 2017 have been sourced from a variety of industries and include Cemex, Ford, Lafarge, Macy’s, and Wells Fargo.(e) Most of the proceeds from these sales have been invested in high-quality, short-maturity bonds, thus building the Fund’s dry powder for capitalizing on fixed income opportunities that emerge.
Rates: Opportunities in Latin America
We continue to believe that the market is underpricing upside risks to inflation and interest rates in the United States and a number of other developed markets. For example, U.S. labor and housing markets are strong, and both Fed policy and future fiscal stimulus could exert upward pressure on interest rates. In addition, growth and inflation are on the upswing in Europe. To mitigate potential performance headwinds due to rising interest rates, the Fund maintains a relatively low overall duration, or interest rate sensitivity (3.3 years). During the second quarter, we further hedged the Fund’s eurozone interest rate risk using German interest rate futures. Looking outside the developed markets, we are finding promising interest rate opportunities in Latin America.
In the fourth quarter of 2016, on the heels of a rise in global interest rates following Donald Trump’s victory in the U.S.
PAGE 2 § DODGE & COX GLOBAL BOND FUND
presidential election, we increased portfolio exposure to Latin American bonds through purchases of intermediate-term local-currency government bonds from Mexico, Colombia, and Peru. We believed that rate levels had moved up beyond what seemed justified by our assessment of fundamentals. Our evaluation framework for emerging market interest rates consists of three primary components: (1) predicted real (i.e., inflation-adjusted) short-term rates, (2) inflation expectations, and (3) a combination of the term premium and a country risk premium. We use both quantitative models (e.g., internally developed Taylor Rule models) as well as our qualitative judgment to formulate these views. Using this framework, we concluded that these Latin American securities offered long-term opportunity; we have been rewarded by strong performance as yields on these bonds have declined meaningfully. We continue to view Mexican and Peruvian interest rates favorably, but we have shortened the maturity of the Fund’s Colombian holding.
Currency: Mexican Peso Rebounds
The Fund’s U.S. dollar exposure is currently 87%, with the remaining exposure in the Mexican peso, the Indian rupee, the Colombian peso, and the Peruvian sol. This currency mix reflects our continuing bullish view of the U.S. dollar versus most other developed market currencies, although we believe further appreciation is likely to be modest and our view has become more balanced. On one hand, the Fed is well ahead of other central banks in raising its policy rate and exiting quantitative easing, which should continue to support the U.S. dollar relative to other major currencies. On the other hand, the U.S. dollar looks somewhat overvalued on a purchasing power basis and we recognize that we are many years into a dollar bull run. Overall, we have minimal exposure to developed market currencies as we do not find their risk-adjusted total return prospects as attractive when compared to the U.S. dollar and other currencies held in the Fund.
The Fund’s large exposure to the Mexican peso was one of the key contributors to year-to-date performance, as the peso reversed most of its 2016 depreciation in the first half of 2017. At many times during and since 2016, particularly after the election, we reevaluated this currency position, assessing our fundamental outlook and developing worst case scenarios against which to stress test our investment. This process of reflection and analysis resulted in our team’s conviction to hold the position through a period of short-term volatility. Following the peso’s strong recent performance and higher valuation, we reduced our exposure slightly. However, we continue to hold a 7% weighting and find the peso attractive given the high nominal and real yield levels, a compelling currency valuation, a credible and engaged central bank, an improving fiscal outlook, and long-term growth and economic reform potential. We believe current valuations provide adequate compensation for potential risks including NAFTA renegotiations, the 2018 general election in Mexico, and broader swings in emerging market risk sentiment.
IN CLOSING
The Fund recently celebrated its third anniversary as a public mutual fund and we are proud of the performance track record we have achieved. We remain optimistic about our differentiated and opportunistic approach to global bond investing, which features a total return orientation, a focus on credit opportunities, and a long-term investment horizon.
As we look forward, the current low level of interest rates and yield premiums temper our total return expectations. However, we believe the Fund is well positioned and we continue to find many compelling credit, interest rate, and currency investments across the globe. Thank you for your continued confidence in our firm. As always, we welcome your comments and questions.
For the Board of Trustees,
| | |
| |
|
Charles F. Pohl, Chairman | | Dana M. Emery, President |
July 31, 2017
| (a) | | Yield premiums are one way to measure a security’s valuation. Narrowing yield premiums result in a higher valuation. Widening yield premiums result in a lower valuation. |
| (b) | | Unless otherwise specified, all weightings and characteristics are as of June 30, 2017. |
| (c) | | Credit securities refers to corporate bonds and government-related securities, as classified by Bloomberg. |
| (d) | | Duration is a measure of a bond’s (or a bond portfolio’s) price sensitivity to changes in interest rates. |
| (e) | | The use of specific examples does not imply that they are more or less attractive investments than the Fund’s other holdings. |
DODGE & COX GLOBAL BOND FUND §PAGE 3
YEAR-TO-DATE PERFORMANCE REVIEW
The Fund outperformed the Barclays Global Agg by 1.4 percentage points year to date.
Key Contributors to Relative Results
| | § | | The Fund’s large position in the Mexican peso (8% versus 0.3% in the Bloomberg Barclays Global Agg) added to relative returns as the currency appreciated 14% versus the U.S. dollar. | |
| | § | | Security selection was strong, led by Brazil-related holdings including Petrobras and Rio Oil Finance Trust. Other notable outperformers include Republic of Indonesia, Royal Bank of Scotland, and Telecom Italia. | |
| | § | | The Fund benefited from holding longer-term bonds in Mexico, Colombia, and Peru (13% versus 0.3% in the Bloomberg Barclays Global Agg) as rates declined. | |
| | § | | The Fund’s large allocation to corporate bonds (49% versus 19% in the Bloomberg Barclays Global Agg) added to relative returns as credit yield premiums declined. | |
Key Detractors from Relative Results
| | § | | Currency positioning detracted from relative returns, predominantly because of the Fund’s lack of exposure to the euro (compared to 24% in the Bloomberg Barclays Global Agg), and also to the British pound and the Japanese yen (compared to combined 22% in the Bloomberg Barclays Global Agg). | |
| | § | | Certain credits underperformed including Macy’s and State of Illinois. | |
KEY CHARACTERISTICS OF DODGE & COX
Independent Organization
Dodge & Cox is one of the largest privately owned investment managers in the world. We remain committed to independence, with a goal of providing the highest quality investment management service to our existing clients.
Over 85 Years of Investment Experience
Dodge & Cox was founded in 1930. We have a stable and well-qualified team of investment professionals, most of whom have spent their entire careers at Dodge & Cox.
Experienced Investment Team
The Global Fixed Income Investment Committee, which is the decision-making body for the Global Bond Fund, is a six-member committee with an average tenure at Dodge & Cox of 22 years.
One Business with a Single Research Office
Dodge & Cox manages equity (domestic, international, and global), fixed income (domestic and global), and balanced investments, operating from one office in San Francisco.
Consistent Investment Approach
Our team decision-making process involves thorough, bottom-up fundamental analysis of each investment.
Long-Term Focus and Low Expenses
We invest with a three- to five-year investment horizon, which has historically resulted in low turnover relative to our peers. We manage Funds that maintain low expense ratios.
Risks: The yields and market values of the instruments in which the Fund invests may fluctuate. Accordingly, an investment may be worth more or less than its original cost. Debt securities are subject to interest rate risk, credit risk, and prepayment and call risk, all of which could have adverse effects on the value of the Fund. A low interest rate environment creates an elevated risk of future negative returns. Financial intermediaries may restrict their market making activities for certain debt securities, which may reduce the liquidity and increase the volatility of such securities. Investing in non-U.S. securities may entail risk due to foreign economic and political developments; this risk may be increased when investing in emerging markets. The Fund is also subject to currency risk. Please read the prospectus and summary prospectus for specific details regarding the Fund’s risk profile.
PAGE 4 § DODGE & COX GLOBAL BOND FUND
GROWTH OF $10,000 SINCE INCEPTION
FOR AN INVESTMENT MADE ON DECEMBER 5, 2012
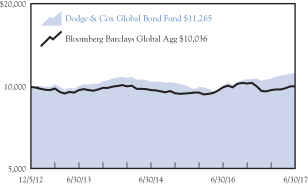
AVERAGE ANNUAL TOTAL RETURN
FOR PERIODS ENDED JUNE 30, 2017
| | | | | | | | | | | | |
| | | 1 Year | | | 3 Years | | | Since
Inception
(12/5/12) | |
| | | | | | | | | | | | |
Dodge & Cox Global Bond Fund(a) | | | 8.13 | % | | | 1.11 | % | | | 2.65 | % |
Bloomberg Barclays Global Aggregate Bond Index (Bloomberg Barclays Global Agg) | | | –2.18 | | | | –0.35 | | | | 0.09 | |
| (a) | | Expense reimbursements have been in effect for the Fund since its inception. Without the expense reimbursements, returns for the Fund would have been lower. The Fund’s returns since May 1, 2014 are as presented in the Financial Highlights. |
Returns represent past performance and do not guarantee future results. Investment return and share price will fluctuate with market conditions, and investors may have a gain or loss when shares are sold. Fund performance changes over time and currently may be significantly lower than stated. Performance is updated and published monthly. Visit the Fund’s website at dodgeandcox.com or call 800-621-3979 for current performance figures.
A private fund managed and funded by Dodge & Cox (the “Private Fund”) was reorganized into the Fund and the Fund commenced operations on May 1, 2014. The Private Fund commenced operations on December 5, 2012 and had an investment objective, policies, and strategies that were, in all material respects, the same as those of the Fund, and was managed in a manner that, in all material respects, complied with the investment guidelines and restrictions of the Fund. However, the Private Fund was not registered as an investment company under the Investment Company Act of 1940 (the “1940 Act”), and therefore was not subject to certain investment limitations, diversification requirements, liquidity requirements, and other restrictions imposed by the 1940 Act and the Internal Revenue Code, which, if applicable, may have adversely affected its performance.
The Fund’s total returns include the reinvestment of dividend and capital gain distributions, but have not been adjusted for any income taxes payable by shareholders on these distributions or on Fund share redemptions. Index returns include interest income but, unlike Fund returns, do not reflect fees or expenses. The Bloomberg Barclays Global Aggregate Bond Index (Bloomberg Barclays Global Agg) is a widely recognized, unmanaged index of multi-currency investment-grade, debt securities.
Bloomberg is a registered trademark of Bloomberg Finance L.P. and its affiliates. Barclays® is a trademark of Barclays Bank PLC.
FUND EXPENSE EXAMPLE
As a Fund shareholder, you incur ongoing Fund costs, including management fees and other Fund expenses. All mutual funds have ongoing costs, sometimes referred to as operating expenses. The following example shows ongoing costs of investing in the Fund and can help you understand these costs and compare them with those of other mutual funds. The example assumes a $1,000 investment held for the six months indicated.
ACTUAL EXPENSES
The first line of the table below provides information about actual account values and expenses based on the Fund’s actual returns. You may use the information in this line, together with your account balance, to estimate the expenses that you paid over the period. Simply divide your account value by $1,000 (for example, an $8,600 account value divided by $1,000 = 8.6), then multiply the result by the number in the first line under the heading “Expenses Paid During Period” to estimate the expenses you paid on your account during this period.
HYPOTHETICAL EXAMPLE FOR COMPARISON WITH OTHER MUTUAL FUNDS
Information on the second line of the table can help you compare ongoing costs of investing in the Fund with those of other mutual funds. This information may not be used to estimate the actual ending account balance or expenses you paid during the period. The hypothetical “Ending Account Value” is based on the actual expense ratio of the Fund and an assumed 5% annual rate of return before expenses (not the Fund’s actual return). The amount under the heading “Expenses Paid During Period” shows the hypothetical expenses your account would have incurred under this scenario. You can compare this figure with the 5% hypothetical examples that appear in shareholder reports of other mutual funds.
| | | | | | | | | | | | |
Six Months Ended June 30, 2017 | | Beginning Account Value
1/1/2017 | | | Ending Account Value
6/30/2017 | | | Expenses Paid
During Period* | |
Based on Actual Fund Return | | $ | 1,000.00 | | | $ | 1,058.10 | | | $ | 2.80 | |
Based on Hypothetical 5% Yearly Return | | | 1,000.00 | | | | 1,022.08 | | | | 2.75 | |
| * | | Expenses are equal to the Fund’s annualized net expense ratio of 0.55%, multiplied by the average account value over the period, multiplied by 181/365 (to reflect the one-half year period). |
The expenses shown in the table highlight ongoing costs only and do not reflect any transactional fees or account maintenance fees. Though other mutual funds may charge such fees, please note that the Fund does not charge transaction fees (e.g., redemption fees, sales loads) or universal account maintenance fees (e.g., small account fees).
DODGE & COX GLOBAL BOND FUND §PAGE 5
| | | | |
| FUND INFORMATION (unaudited) | | | June 30, 2017 | |
| | | | |
| GENERAL INFORMATION | | | |
Net Asset Value Per Share | | | $10.93 | |
Total Net Assets (millions) | | | $127.8 | |
Net Expense Ratio(a) | | | 0.45% | |
Gross Expense Ratio (1/1/17 to 6/30/17, annualized) | | | 1.09% | |
Portfolio Turnover Rate (1/1/17 to 6/30/17, unannualized) | | | 23% | |
30-Day SEC Yield (using net expenses)(a)(b) | | | 3.46% | |
30-Day SEC Yield (using gross expenses) | | | 2.82% | |
Number of Credit Issuers | | | 46 | |
Fund Inception | | | May 1, 2014 | |
No sales charges or distribution fees | | | | |
Investment Manager: Dodge & Cox, San Francisco. Managed by the Global Fixed Income Investment Committee, whose six members’ average tenure at Dodge & Cox is 22 years.
| | | | | | | | |
| PORTFOLIO CHARACTERISTICS | | Fund | | | BBG Barclays
Global Agg | |
Effective Duration (years) | | | 3.3 | | | | 7.0 | |
Emerging Markets(c) | | | 27.1% | | | | 5.0% | |
| | | | |
| FIVE LARGEST CREDIT ISSUERS (%)(d) | | Fund | |
Telecom Italia SPA | | | 2.0 | |
Kinder Morgan, Inc. | | | 2.0 | |
Indonesia Government International | | | 1.9 | |
Naspers, Ltd. | | | 1.9 | |
Millicom International Cellular SA | | | 1.9 | |
| | | | | | | | |
| CREDIT QUALITY (%)(e)(f) | | Fund | | | BBG Barclays
Global Agg | |
Aaa | | | 21.9 | | | | 40.0 | |
Aa | | | 0.4 | | | | 16.3 | |
A | | | 18.9 | | | | 26.8 | |
Baa | | | 41.5 | | | | 16.9 | |
Ba | | | 11.9 | | | | 0.0 | |
B | | | 0.0 | | | | 0.0 | |
Caa | | | 1.6 | | | | 0.0 | |
Net Cash & Other(g) | | | 3.8 | | | | 0.0 | |

| | | | | | | | |
| SECTOR DIVERSIFICATION (%)(f) | | Fund | | | BBG Barclays
Global Agg | |
Government | | | 23.0 | | | | 53.8 | |
Government-Related | | | 8.8 | | | | 12.2 | |
Securitized | | | 20.2 | | | | 15.3 | |
Corporate | | | 44.2 | | | | 18.7 | |
Net Cash & Other(g) | | | 3.8 | | | | 0.0 | |
| | | | | | | | |
| REGION DIVERSIFICATION (%)(c)(f) | | Fund | | | BBG Barclays
Global Agg | |
United States | | | 49.6 | | | | 38.9 | |
Latin America | | | 18.5 | | | | 1.1 | |
Europe (excluding United Kingdom) | | | 9.3 | | | | 25.8 | |
United Kingdom | | | 6.7 | | | | 5.5 | |
Pacific (excluding Japan) | | | 4.3 | | | | 5.2 | |
Japan | | | 3.5 | | | | 17.0 | |
Africa | | | 2.8 | | | | 0.2 | |
Canada | | | 1.5 | | | | 3.3 | |
Middle East | | | 0.0 | | | | 0.6 | |
Other | | | 0.0 | | | | 2.4 | |
| (a) | Effective May 1, 2017, Dodge & Cox has contractually agreed to reimburse the Fund for all ordinary expenses to the extent necessary to maintain Total Annual Fund Operating Expenses at 0.45% through April 30, 2018. The term of the agreement renews annually thereafter unless terminated with 30 days’ written notice by either party prior to the end of the term. For periods prior to May 1, 2017, the Fund’s Net Expense Ratio was 0.60%. |
| (b) | SEC Yield is an annualization of the Fund’s net investment income for the trailing 30-day period. Dividends paid by the Fund may be higher or lower than implied by the SEC Yield. |
| (c) | The Fund may classify an issuer in a different category than the Bloomberg Barclays Global Aggregate Bond Index. The Fund generally classifies a corporate issuer based on the country of incorporation of the parent company, but may designate a different country in certain circumstances. |
| (d) | The Fund’s portfolio holdings are subject to change without notice. The mention of specific securities is not a recommendation to buy, sell, or hold any particular security and is not indicative of Dodge & Cox’s current or future trading activity. |
| (e) | The credit quality distributions shown for the Fund and the Index are based on the middle of Moody’s, S&P’s, and Fitch ratings, which is the methodology used by Bloomberg in constructing its indices. If a security is rated by only two agencies, the lower of the two ratings is used. Please note the Fund applies the highest of Moody’s, S&P’s, and Fitch ratings to comply with the quality requirements stated in its prospectus. On that basis, the Fund held 13.5% in securities rated below investment grade. The credit quality of the investments in the portfolio does not apply to the stability or safety of the Fund or its shares. |
| (f) | Excludes the Fund’s derivative contracts. |
| (g) | Net Cash & Other includes cash, short-term investments, derivatives, receivables, and payables. |
PAGE 6 § DODGE & COX GLOBAL BOND FUND
| | | | |
| PORTFOLIO OF INVESTMENTS (unaudited) | | | June 30, 2017 | |
| | | | | | | | | | | | |
| DEBT SECURITIES: 96.2% | | | | | | | | | |
| | | |
| | | | | | PAR VALUE | | | VALUE | |
| GOVERNMENT: 23.0% | | | | | | | | | | | | |
Colombia Government (Colombia)
7.75%, 4/14/21 | | | COP | | | | 8,400,000,000 | | | $ | 2,947,834 | |
Czech Republic Government
(Czech Republic)
11/9/17 | | | CZK | | | | 58,000,000 | | | | 2,541,240 | |
India Government
(India)
8.12%, 12/10/20 | | | INR | | | | 150,000,000 | | | | 2,432,025 | |
Japan Treasury Discount Bill (Japan) | | | | | | | | | | | | |
8/10/17 | | | JPY | | | | 350,000,000 | | | | 3,112,014 | |
1/22/18 | | | JPY | | | | 150,000,000 | | | | 1,334,315 | |
Mexico Government (Mexico) | | | | | | | | | | | | |
2.00%, 6/9/22(a) | | | MXN | | | | 53,085,551 | | | | 2,778,657 | |
5.75%, 3/5/26 | | | MXN | | | | 121,400,000 | | | | 6,244,604 | |
Peru Government GDN
(Peru)
6.35%, 8/12/28(c) | | | PEN | | | | 7,850,000 | | | | 2,569,268 | |
U.S. Treasury Note/Bond
(United States)
0.875%, 5/31/18 | | | USD | | | | 5,480,000 | | | | 5,460,733 | |
| | | | | | | | | | | | |
| | | | | | | | | | | 29,420,690 | |
| GOVERNMENT-RELATED: 8.8% | |
Chicago Transit Authority RB
(United States)
6.899%, 12/1/40 | | | USD | | | | 1,800,000 | | | | 2,289,635 | |
Indonesia Government International
(Indonesia)
3.75%, 6/14/28(c) | | | EUR | | | | 1,975,000 | | | | 2,470,738 | |
Peru Government International
(Peru)
3.75%, 3/1/30 | | | EUR | | | | 900,000 | | | | 1,200,114 | |
Petroleo Brasileiro SA
(Brazil)
7.25%, 3/17/44 | | | USD | | | | 650,000 | | | | 639,113 | |
Petroleos Mexicanos (Mexico) | | | | | | | | | | | | |
2.75%, 4/21/27 | | | EUR | | | | 633,000 | | | | 650,683 | |
5.50%, 6/27/44 | | | USD | | | | 56,000 | | | | 49,504 | |
6.375%, 1/23/45 | | | USD | | | | 535,000 | | | | 521,625 | |
6.75%, 9/21/47 | | | USD | | | | 711,000 | | | | 718,025 | |
State of California GO
(United States)
7.30%, 10/1/39 | | | USD | | | | 400,000 | | | | 584,324 | |
State of Illinois GO (United States) | | | | | | | | | | | | |
5.665%, 3/1/18 | | | USD | | | | 800,000 | | | | 813,080 | |
5.877%, 3/1/19 | | | USD | | | | 700,000 | | | | 724,346 | |
5.10%, 6/1/33 | | | USD | | | | 600,000 | | | | 561,672 | |
| | | | | | | | | | | | |
| | | | | | | | | | | 11,222,859 | |
| SECURITIZED: 20.2% | | | | | | | | | | | | |
ASSET-BACKED: 5.4% | | | | | | | | | | | | |
Auto Loan: 0.8% | | | | | | | | | | | | |
Ford Credit Auto Owner Trust (United States) | | | | | | | | | | | | |
Series 2015-B A3, 1.16%, 11/15/19 | | | USD | | | | 501,219 | | | | 500,534 | |
Series 2015-1 A, 2.12%, 7/15/26(c) | | | USD | | | | 550,000 | | | | 552,166 | |
| | | | | | | | | | | | |
| | | | | | | | | | | 1,052,700 | |
Credit Card: 2.0% | | | | | | | | | | | | |
American Express Master Trust (United States)
Series 2017-3 A, 1.77%, 4/15/20 | | | USD | | | | 1,240,000 | | | | 1,237,971 | |
Chase Issuance Trust
(United States)
Series 2016-A5 A5, 1.27%, 7/15/21 | | | USD | | | | 1,330,000 | | | | 1,317,878 | |
| | | | | | | | | | | | |
| | | | | | | | | | | 2,555,849 | |
| | | | | | | | | | | | |
| | | |
| | | | | | PAR VALUE | | | VALUE | |
Other: 1.6% | | | | | | | | | | | | |
Rio Oil Finance Trust (Brazil) | | | | | | | | | | | | |
9.25%, 7/6/24(c) | | | USD | | | | 1,359,413 | | | $ | 1,380,144 | |
9.75%, 1/6/27(c) | | | USD | | | | 617,033 | | | | 629,374 | |
| | | | | | | | | | | | |
| | | | | | | | | | | 2,009,518 | |
Student Loan: 1.0% | | | | | | | | | | | | |
Navient Student Loan Trust (Private Loans)
(United States)
Series 2015-CA B, 3.25%, 5/15/40(c) | | | USD | | | | 1,350,000 | | | | 1,365,723 | |
| | | | | | | | | | | | |
| | | | | | | | | | | 1,365,723 | |
| | | | | | | | | | | | |
| | | | | | | | | | | 6,983,790 | |
MORTGAGE-RELATED: 14.8% | |
Federal Agency CMO & REMIC: 1.8% | |
Fannie Mae
(United States) Trust 2004-W9 1A3, 6.05%, 2/25/44 | | | USD | | | | 594,458 | | | | 669,299 | |
Freddie Mac (United States) | | | | | | | | | | | | |
Series 4283 EW, 4.50%, 12/15/43 | | | USD | | | | 162,557 | | | | 175,132 | |
Series 4319 MA, 4.50%, 3/15/44 | | | USD | | | | 571,187 | | | | 617,665 | |
Ginnie Mae
(United States)
Series 2010-169 JZ, 4.00%, 12/20/40 | | | USD | | | | 814,120 | | | | 847,513 | |
| | | | | | | | | | | | |
| | | | | | | | | | | 2,309,609 | |
Federal Agency Mortgage Pass-Through: 13.0% | |
Fannie Mae, 15 Year
(United States)
5.00%, 7/1/25 | | | USD | | | | 23,154 | | | | 24,645 | |
Fannie Mae, 20 Year (United States) | | | | | | | | | | | | |
4.00%, 11/1/30-9/1/35 | | | USD | | | | 1,583,143 | | | | 1,679,226 | |
3.50%, 3/1/37 | | | USD | | | | 2,233,217 | | | | 2,316,066 | |
Fannie Mae, 30 Year
(United States)
4.50%, 4/1/39-1/1/46 | | | USD | | | | 6,455,209 | | | | 6,970,670 | |
Fannie Mae, Hybrid ARM (United States) | | | | | | | | | | | | |
2.907%, 8/1/44 | | | USD | | | | 169,701 | | | | 174,349 | |
2.765%, 9/1/44 | | | USD | | | | 283,432 | | | | 290,846 | |
Freddie Mac, Hybrid ARM (United States) | | | | | | | | | | | | |
3.015%, 10/1/44 | | | USD | | | | 341,510 | | | | 352,247 | |
2.724%, 11/1/44 | | | USD | | | | 879,280 | | | | 900,696 | |
2.688%, 1/1/45 | | | USD | | | | 929,832 | | | | 950,236 | |
2.742%, 5/1/46 | | | USD | | | | 1,480,233 | | | | 1,509,510 | |
Freddie Mac Gold, 30 Year (United States) | | | | | | | | | | | | |
6.00%, 2/1/35 | | | USD | | | | 86,698 | | | | 97,512 | |
4.50%, 8/1/44-9/1/44 | | | USD | | | | 1,239,553 | | | | 1,329,210 | |
| | | | | | | | | | | | |
| | | | | | | | | | | 16,595,213 | |
| | | | | | | | | | | | |
| | | | | | | | | | | 18,904,822 | |
| | | | | | | | | | | | |
| | | | | | | | | | | 25,888,612 | |
| CORPORATE: 44.2% | | | | | | | | | | | | |
FINANCIALS: 11.0% | | | | | | | | | | | | |
Bank of America Corp.
(United States) | | | | | | | | | | | | |
4.25%, 10/22/26 | | | USD | | | | 825,000 | | | | 849,652 | |
6.625%, 5/23/36(b) | | | USD | | | | 325,000 | | | | 393,206 | |
Barclays PLC
(United Kingdom)
4.836%, 5/9/28 | | | USD | | | | 1,200,000 | | | | 1,226,875 | |
BNP Paribas SA
(France)
4.375%, 9/28/25(c) | | | USD | | | | 1,175,000 | | | | 1,218,066 | |
Capital One Financial Corp. (United States)
3.75%, 4/24/24 | | | USD | | | | 1,200,000 | | | | 1,226,293 | |
| | |
| See accompanying Notes to Financial Statements | | DODGE & COX GLOBAL BOND FUND §PAGE 7 |
| | | | |
| PORTFOLIO OF INVESTMENTS (unaudited) | | | June 30, 2017 | |
| | | | | | | | | | | | |
| DEBT SECURITIES (continued) | |
| | | |
| | | | | | PAR VALUE | | | VALUE | |
Citigroup, Inc.
(United States)
7.542%, 10/30/40(b) | | | USD | | | | 1,675,000 | | | $ | 1,742,000 | |
HSBC Holdings PLC
(United Kingdom) | | | | | | | | | | | | |
5.75%, 12/20/27 | | | GBP | | | | 550,000 | | | | 873,078 | |
6.00%, 3/29/40 | | | GBP | | | | 600,000 | | | | 1,033,316 | |
JPMorgan Chase & Co.
(United States) | | | | | | | | | | | | |
3.375%, 5/1/23 | | | USD | | | | 1,050,000 | | | | 1,065,355 | |
3.875%, 9/10/24 | | | USD | | | | 125,000 | | | | 128,979 | |
Lloyds Banking Group PLC
(United Kingdom) | | | | | | | | | | | | |
4.50%, 11/4/24 | | | USD | | | | 1,125,000 | | | | 1,171,621 | |
4.582%, 12/10/25 | | | USD | | | | 700,000 | | | | 725,811 | |
Navient Corp.
(United States) | | | | | | | | | | | | |
4.625%, 9/25/17 | | | USD | | | | 268,000 | | | | 268,670 | |
8.45%, 6/15/18 | | | USD | | | | 500,000 | | | | 526,500 | |
Royal Bank of Scotland Group PLC (United Kingdom) | | | | | | | | | | | | |
6.125%, 12/15/22 | | | USD | | | | 325,000 | | | | 355,780 | |
6.00%, 12/19/23 | | | USD | | | | 1,150,000 | | | | 1,268,717 | |
| | | | | | | | | | | | |
| | | | | | | | | | | 14,073,919 | |
INDUSTRIALS: 29.0% | | | | | | | | | | | | |
AT&T, Inc. (United States) | | | | | | | | | | | | |
4.75%, 5/15/46 | | | USD | | | | 625,000 | | | | 613,716 | |
4.50%, 3/9/48 | | | USD | | | | 1,425,000 | | | | 1,343,358 | |
BHP Billiton, Ltd. (Australia)
5.625%, 10/22/79(b) | | | EUR | | | | 425,000 | | | | 566,254 | |
Cemex SAB de CV (Mexico)
7.75%, 4/16/26(c) | | | USD | | | | 1,275,000 | | | | 1,458,281 | |
Charter Communications, Inc.
(United States) | | | | | | | | | | | | |
7.30%, 7/1/38 | | | USD | | | | 425,000 | | | | 543,783 | |
6.75%, 6/15/39 | | | USD | | | | 1,150,000 | | | | 1,409,144 | |
Cox Enterprises, Inc. (United States) | | | | | | | | | | | | |
3.25%, 12/15/22(c) | | | USD | | | | 765,000 | | | | 763,304 | |
2.95%, 6/30/23(c) | | | USD | | | | 1,050,000 | | | | 1,023,980 | |
Dell Technologies, Inc. (United States) | | | | | | | | | | | | |
4.42%, 6/15/21(c) | | | USD | | | | 650,000 | | | | 685,180 | |
5.45%, 6/15/23(c) | | | USD | | | | 550,000 | | | | 596,769 | |
Ford Motor Credit Co. LLC(d) (United States)
5.875%, 8/2/21 | | | USD | | | | 1,175,000 | | | | 1,310,161 | |
Grupo Televisa SAB (Mexico)
8.50%, 3/11/32 | | | USD | | | | 964,000 | | | | 1,246,710 | |
HCA Holdings, Inc. (United States)
4.75%, 5/1/23 | | | USD | | | | 1,775,000 | | | | 1,877,063 | |
Imperial Brands PLC (United Kingdom)
4.25%, 7/21/25(c) | | | USD | | | | 1,200,000 | | | | 1,266,712 | |
Kinder Morgan, Inc. (United States)
6.95%, 1/15/38 | | | USD | | | | 2,100,000 | | | | 2,510,619 | |
LafargeHolcim, Ltd. (Switzerland)
7.125%, 7/15/36 | | | USD | | | | 1,000,000 | | | | 1,287,258 | |
Macy’s, Inc. (United States) | | | | | | | | | | | | |
6.70%, 9/15/28 | | | USD | | | | 50,000 | | | | 51,772 | |
6.90%, 4/1/29 | | | USD | | | | 75,000 | | | | 80,074 | |
6.70%, 7/15/34 | | | USD | | | | 425,000 | | | | 440,428 | |
Millicom International Cellular SA (Luxembourg)
6.625%, 10/15/21(c) | | | USD | | | | 2,300,000 | | | | 2,392,000 | |
Molex Electronic Technologies LLC(d) (United States)
2.878%, 4/15/20(c) | | | USD | | | | 731,000 | | | | 736,212 | |
| | | | | | | | | | |
| | | |
| | | | | PAR VALUE | | | VALUE | |
MTN Group, Ltd. (South Africa)
4.755%, 11/11/24(c) | | USD | | | 1,200,000 | | | $ | 1,156,440 | |
Naspers, Ltd. (South Africa)
5.50%, 7/21/25(c) | | USD | | | 2,300,000 | | | | 2,459,850 | |
RELX PLC (United Kingdom) | | | | | | | | | | |
8.625%, 1/15/19 | | USD | | | 58,000 | | | | 63,445 | |
3.125%, 10/15/22 | | USD | | | 574,000 | | | | 575,248 | |
Telecom Italia SPA (Italy) | | | | | | | | | | |
6.375%, 6/24/19 | | GBP | | | 800,000 | | | | 1,137,560 | |
7.721%, 6/4/38 | | USD | | | 1,150,000 | | | | 1,391,500 | |
Time Warner, Inc. (United States)
6.20%, 3/15/40 | | USD | | | 1,025,000 | | | | 1,225,609 | |
TransCanada Corp. (Canada)
5.625%, 5/20/75(b) | | USD | | | 1,800,000 | | | | 1,901,358 | |
Twenty-First Century Fox, Inc. (United States) | | | | | | | | | | |
6.15%, 3/1/37 | | USD | | | 275,000 | | | | 343,945 | |
6.65%, 11/15/37 | | USD | | | 750,000 | | | | 990,515 | |
Ultrapar Participacoes SA (Brazil)
5.25%, 10/6/26(c) | | USD | | | 600,000 | | | | 599,100 | |
Verizon Communications, Inc.
(United States)
5.012%, 4/15/49(c) | | USD | | | 1,175,000 | | | | 1,188,307 | |
Vulcan Materials Co. (United States)
7.50%, 6/15/21 | | USD | | | 1,038,000 | | | | 1,224,903 | |
Zoetis, Inc. (United States)
4.50%, 11/13/25 | | USD | | | 525,000 | | | | 573,223 | |
| | | | | | | | | | |
| | | | | | | | | 37,033,781 | |
UTILITIES: 4.2% | | | | | | | | | | |
Dominion Energy, Inc. (United States)
5.75%, 10/1/54(b) | | USD | | | 1,750,000 | | | | 1,872,500 | |
Enel SPA (Italy) | | | | | | | | | | |
6.80%, 9/15/37(c) | | USD | | | 650,000 | | | | 833,663 | |
6.00%, 10/7/39(c) | | USD | | | 930,000 | | | | 1,107,269 | |
The Southern Co. (United States)
5.50%, 3/15/57(b) | | USD | | | 1,450,000 | | | | 1,529,203 | |
| | | | | | | | | | |
| | | | | | | | | 5,342,635 | |
| | | | | | | | | | |
| | | | | | | | | 56,450,335 | |
| | | | | | | | | | |
TOTAL DEBT SECURITIES
(Cost $118,544,682) | | | | | | | | $ | 122,982,496 | |
|
| SHORT-TERM INVESTMENTS: 3.9% | |
COMMERCIAL PAPER: 1.9% | | | | | | | | | | |
Anthem, Inc. (United States)
7/13/17(c) | | USD | | | 1,250,000 | | | $ | 1,248,707 | |
Mondelez International, Inc.
(United States)
7/27/17(c) | | USD | | | 1,250,000 | | | | 1,248,844 | |
| | | | | | | | | | |
| | | | | | | | | 2,497,551 | |
MONEY MARKET FUND: 0.1% | | | | | | | | | | |
State Street Institutional Treasury Plus Money Market Fund | | USD | | | 127,149 | | | | 127,149 | |
| |
REPURCHASE AGREEMENT: 1.9% | | | | | |
Fixed Income Clearing Corporation(e) 0.60%, dated 6/30/17, due 7/3/17, maturity value $2,372,119 | | USD | | | 2,372,000 | | | | 2,372,000 | |
| | | | | | | | | | |
TOTAL SHORT-TERM INVESTMENTS
(Cost $4,996,700) | | | $ | 4,996,700 | |
| | | | | | | | | | |
TOTAL INVESTMENTS
(Cost $123,541,382) | | | | | 100.1 | % | | $ | 127,979,196 | |
OTHER ASSETS LESS LIABILITIES | | | | | (0.1 | %) | | | (147,226 | ) |
| | | | | | | | | | |
| NET ASSETS | | | | | 100.0 | % | | $ | 127,831,970 | |
| | | | | | | | | | |
| | |
| PAGE 8 § DODGE & COX GLOBAL BOND FUND | | See accompanying Notes to Financial Statements |
| | | | |
| PORTFOLIO OF INVESTMENTS (unaudited) | | | June 30, 2017 | |
| (c) | Security exempt from registration under Rule 144A of the Securities Act of 1933. The security may be resold in transactions exempt from registration, normally to qualified institutional buyers. As of June 30, 2017, all such securities in total represented $28,950,097 or 22.6% of net assets. These securities have been deemed liquid by Dodge & Cox, investment manager, pursuant to procedures approved by the Fund’s Board of Trustees. |
| (d) | Subsidiary (see below) |
| (e) | Repurchase agreement is collateralized by U.S. Treasury Note 1.375%, 6/30/23. Total collateral value is $2,420,777. |
Debt securities are grouped by parent company unless otherwise noted. Actual securities may be issued by the listed parent company or one of its subsidiaries. In determining a parent company’s country designation, the Fund generally references the country of incorporation.
ARM: Adjustable Rate Mortgage
GDN: Global Depositary Note
CMO: Collateralized Mortgage Obligation
GO: General Obligation
RB: Revenue Bond
REMIC: Real Estate Mortgage Investment Conduit
COP: Colombian Peso
CZK: Czech Republic Koruna
EUR: Euro
GBP: British Pound
INR: Indian Rupee
JPY: Japanese Yen
MXN: Mexican Peso
PEN: Peruvian Sol
USD: United States Dollar
FUTURES CONTRACTS
| | | | | | | | | | | | | | | | |
| Description | | Number of
Contracts | | | Expiration
Date | | | Notional
Amount | | | Unrealized
Appreciation/
(Depreciation) | |
10 Year U.S. Treasury Note—Short Position | | | 108 | | | | Sep 2017 | | | $ | (13,557,375 | ) | | $ | 22,229 | |
Euro-Bund Future— Short Position | | | 26 | | | | Sep 2017 | | | | (4,806,874 | ) | | | 53,995 | |
Long Term U.S. Treasury Bond— Short Position | | | 27 | | | | Sep 2017 | | | | (4,149,562 | ) | | | 53,726 | |
| | | | | | | | | | | | | | | | |
| | | | | | | | | | | | | | $ | 129,950 | |
| | | | | | | | | | | | | | | | |
CENTRALLY CLEARED INTEREST RATE SWAPS
| | | | | | | | | | | | | | | | |
| | | | | | Contract Amount | | | | |
Notional
Amount | | Expiration
Date | | | Fixed
Rate | | | Floating Rate | | | Unrealized
Appreciation/
(Depreciation) | |
Pay Fixed/Receive Floating: | | | | | |
$ 825,000 | | | 5/6/24 | | | | 2.72 | % | | | USD LIBOR 3-Month | | | $ | (34,484 | ) |
825,000 | | | 8/22/24 | | | | 2.57 | % | | | USD LIBOR 3-Month | | | | (30,908 | ) |
1,750,000 | | | 7/29/45 | | | | 2.774 | % | | | USD LIBOR 3-Month | | | | (95,009 | ) |
945,000 | | | 9/20/47 | | | | 2.50 | % | | | USD LIBOR 3-Month | | | | 12,863 | |
| | | | | | | | | | | | | | | | |
| | | | | | | | | | | | | | $ | (147,538 | ) |
| | | | | | | | | | | | | | | | |
CURRENCY FORWARD CONTRACTS
| | | | | | | | | | | | | | | | |
| | | | | | Contract Amount | | | | |
| Counterparty | | Settle
Date | | | Receive
U.S. Dollar | | | Deliver
Foreign
Currency | | | Unrealized
Appreciation/
(Depreciation) | |
Contracts to sell CZK: | |
Citibank | | | 11/9/17 | | | | 2,353,514 | | | | 58,000,000 | | | $ | (204,521 | ) |
Contracts to sell EUR: | |
Bank of America | | | 7/12/17 | | | | 874,609 | | | | 815,000 | | | | (56,577 | ) |
Goldman Sachs | | | 8/16/17 | | | | 2,543,215 | | | | 2,375,000 | | | | (175,233 | ) |
Goldman Sachs | | | 8/16/17 | | | | 990,515 | | | | 925,000 | | | | (68,249 | ) |
Contracts to sell GBP: | |
Goldman Sachs | | | 7/12/17 | | | | 932,627 | | | | 765,000 | | | | (63,977 | ) |
Bank of America | | | 9/13/17 | | | | 614,641 | | | | 500,000 | | | | (37,972 | ) |
Bank of America | | | 9/13/17 | | | | 1,241,575 | | | | 1,010,000 | | | | (76,703 | ) |
Contracts to sell INR: | |
Barclays | | | 7/12/17 | | | | 2,089,115 | | | | 135,500,000 | | | | (5,247 | ) |
Barclays | | | 8/23/17 | | | | 368,381 | | | | 24,000,000 | | | | (594 | ) |
Contracts to sell JPY: | |
Bank of America | | | 8/10/17 | | | | 3,108,572 | | | | 350,000,000 | | | | (7,912 | ) |
Goldman Sachs | | | 1/22/18 | | | | 1,330,554 | | | | 150,000,000 | | | | (15,938 | ) |
| | | | |
| Counterparty | | Settle
Date | | | Deliver
U.S. Dollar | | | Receive
Foreign
Currency | | | Unrealized
Appreciation/
(Depreciation) | |
Contracts to buy INR: | |
Barclays | | | 7/12/17 | | | | 1,948,519 | | | | 135,500,000 | | | | 145,844 | |
Barclays | | | 8/23/17 | | | | 353,045 | | | | 24,000,000 | | | | 15,929 | |
| | | | | | | | | | | | | | | | |
| | | | | | | | | | | | | | $ | (551,150 | ) |
| | | | | | | | | | | | | | | | |
| | |
| See accompanying Notes to Financial Statements | | DODGE & COX GLOBAL BOND FUND §PAGE 9 |
| | | | |
STATEMENT OF ASSETS AND LIABILITIES (unaudited) | |
| |
| | | June 30, 2017 | |
ASSETS: | | | | |
Investments, at value (cost $123,541,382) | | $ | 127,979,196 | |
Unrealized appreciation on currency forward contracts | | | 161,773 | |
Cash denominated in foreign currency (cost $10) | | | 10 | |
Cash held at broker | | | 549,267 | |
Receivable for investments sold | | | 86,914 | |
Receivable from broker for variation margin | | | 96,686 | |
Receivable for Fund shares sold | | | 198,473 | |
Dividends and interest receivable | | | 1,100,707 | |
Expense reimbursement receivable | | | 60,523 | |
Prepaid expenses and other assets | | | 6,274 | |
| | | | |
| | | 130,239,823 | |
| | | | |
LIABILITIES: | | | | |
Unrealized depreciation on currency forward contracts | | | 712,923 | |
Payable for investments purchased | | | 1,517,139 | |
Payable for Fund shares redeemed | | | 15,488 | |
Management fees payable | | | 52,040 | |
Accrued expenses | | | 110,263 | |
| | | | |
| | | 2,407,853 | |
| | | | |
NET ASSETS | | $ | 127,831,970 | |
| | | | |
NET ASSETS CONSIST OF: | | | | |
Paid in capital | | $ | 123,655,246 | |
Undistributed net investment income | | | 703,737 | |
Accumulated net realized loss | | | (400,432 | ) |
Net unrealized appreciation | | | 3,873,419 | |
| | | | |
| | $ | 127,831,970 | |
| | | | |
Fund shares outstanding (par value $0.01 each, unlimited shares authorized) | | | 11,690,357 | |
Net asset value per share | | $ | 10.93 | |
|
STATEMENT OF OPERATIONS (unaudited) | |
| |
| | | Six Months Ended
June 30, 2017 | |
INVESTMENT INCOME: | | | | |
Dividends | | $ | 59,091 | |
Interest (net of foreign taxes of $5,880) | | | 2,388,184 | |
| | | | |
| | | 2,447,275 | |
| | | | |
EXPENSES: | | | | |
Management fees | | | 296,381 | |
Custody and fund accounting fees | | | 13,204 | |
Transfer agent fees | | | 15,839 | |
Professional services | | | 113,041 | |
Shareholder reports | | | 5,996 | |
Registration fees | | | 59,531 | |
Trustees’ fees | | | 130,000 | |
Miscellaneous | | | 15,421 | |
| | | | |
Total expenses | | | 649,413 | |
| | | | |
Expenses reimbursed by investment manager | | | (323,397 | ) |
| | | | |
Net expenses | | | 326,016 | |
| | | | |
NET INVESTMENT INCOME | | | 2,121,259 | |
| | | | |
REALIZED AND UNREALIZED GAIN (LOSS): | |
Net realized gain (loss) | | | | |
Investments | | | 273,612 | |
Futures contracts | | | (460,503 | ) |
Interest rate swaps | | | (88,550 | ) |
Currency forward contracts | | | 388,523 | |
Foreign currency transactions | | | (710 | ) |
Net change in unrealized appreciation/depreciation | | | | |
Investments | | | 5,451,121 | |
Futures contracts | | | 128,039 | |
Interest rate swaps | | | 7,938 | |
Currency forward contracts | | | (1,063,802 | ) |
Foreign currency translation | | | 14,845 | |
| | | | |
Net realized and unrealized gain | | | 4,650,513 | |
| | | | |
NET CHANGE IN NET ASSETS FROM OPERATIONS | | $ | 6,771,772 | |
| | | | |
| | | | | | | | |
STATEMENT OF CHANGES IN NET ASSETS (unaudited) | |
| | |
| | | Six Months Ended
June 30, 2017 | | | Year Ended
December 31, 2016 | |
OPERATIONS: | | | | | | | | |
Net investment income | | $ | 2,121,259 | | | $ | 2,907,554 | |
Net realized gain (loss) | | | 112,372 | | | | (2,032,686 | ) |
Net change in unrealized appreciation/depreciation | | | 4,538,141 | | | | 5,078,974 | |
| | | | | | | | |
| | | 6,771,772 | | | | 5,953,842 | |
| | | | | | | | |
| | |
DISTRIBUTIONS TO SHAREHOLDERS FROM: | | | | | | | | |
Net investment income | | | — | | | | (1,791,680 | ) |
Net realized gain | | | — | | | | — | |
| | | | | | | | |
Total distributions | | | — | | | | (1,791,680 | ) |
| | | | | | | | |
| | |
FUND SHARE TRANSACTIONS: | | | | | | | | |
Proceeds from sale of shares | | | 16,850,917 | | | | 64,939,219 | |
Reinvestment of distributions | | | — | | | | 1,748,223 | |
Cost of shares redeemed | | | (5,552,699 | ) | | | (28,749,476 | ) |
| | | | | | | | |
Net change from Fund share transactions | | | 11,298,218 | | | | 37,937,966 | |
| | | | | | | | |
Total change in net assets | | | 18,069,990 | | | | 42,100,128 | |
| | |
NET ASSETS: | | | | | | | | |
Beginning of period | | | 109,761,980 | | | | 67,661,852 | |
| | | | | | | | |
End of period (including undistributed net investment income of $703,737 and distributions in excess of net investment income of $(1,355,951), respectively) | | $ | 127,831,970 | | | $ | 109,761,980 | |
| | | | | | | | |
| | |
SHARE INFORMATION: | | | | | | | | |
Shares sold | | | 1,585,315 | | | | 6,359,396 | |
Distributions reinvested | | | — | | | | 169,730 | |
Shares redeemed | | | (521,473 | ) | | | (2,901,699 | ) |
| | | | | | | | |
Net change in shares outstanding | | | 1,063,842 | | | | 3,627,427 | |
| | | | | | | | |
| | |
| PAGE 10 § DODGE & COX GLOBAL BOND FUND | | See accompanying Notes to Financial Statements |
NOTES TO FINANCIAL STATEMENTS (unaudited)
NOTE 1—ORGANIZATION AND SIGNIFICANT ACCOUNTING POLICIES
Dodge & Cox Global Bond Fund (the “Fund”) is one of the series constituting the Dodge & Cox Funds (the “Trust” or the “Funds”). The Trust is organized as a Delaware statutory trust and is registered under the Investment Company Act of 1940, as amended, as an open-end management investment company. The Fund1 seeks a high rate of total return consistent with long-term preservation of capital. Foreign investing, especially in developing countries, has special risks such as currency and market volatility and political and social instability. These and other risk considerations are discussed in the Fund’s Prospectus.
The financial statements have been prepared in conformity with accounting principles generally accepted in the United States of America, which require the use of estimates and assumptions by management. Actual results may differ from those estimates. Significant accounting policies are as follows:
Security valuation The Fund’s net assets are normally valued as of the scheduled close of trading on the New York Stock Exchange (NYSE), generally 4:00 p.m. Eastern Time, each day that the NYSE is open for business.
Debt securities and derivatives traded over the counter, are valued using prices received from independent pricing services which utilize dealer quotes, recent transaction data, pricing models, and other inputs to arrive at market-based valuations. Pricing models may consider quoted prices for similar securities, interest rates, cash flows (including prepayment speeds), and credit risk. Exchange-traded derivatives are valued at the settlement price determined by the relevant exchange. Other financial instruments for which market quotes are readily available are valued at market value. Short-term securities less than 60 days to maturity may be valued at amortized cost if amortized cost approximates current value. Mutual funds are valued at their respective net asset values. Security values are not discounted based on the size of the Fund’s position and may differ from the value a Fund receives upon sale of the securities.
Investments initially valued in currencies other than the U.S. dollar are converted to the U.S. dollar using prevailing exchange rates. Currency forward contracts are valued based on the prevailing forward exchange rates of the underlying currencies. As a result, the Fund’s net assets may be affected by changes in the value of currencies in relation to the U.S. dollar.
If market quotations are not readily available or if normal valuation procedures produce valuations that are deemed unreliable or inappropriate under the circumstances existing at the time, the investment will be valued at fair value as determined in good faith by or under the direction of the Fund’s Board of Trustees.
| 1 | | The Fund’s predecessor, Dodge & Cox Global Bond Fund, L.L.C. (the “Private Fund”), was organized on August 31, 2012 and commenced operations on December 5, 2012 as a private investment fund that reorganized into, and had the same investment manager as, the Fund. The Fund commenced operations on May 1, 2014, upon the transfer of assets from the Private Fund. This transaction was accomplished through a transfer of Private Fund net assets valued at $10,725,688 in exchange for 1,000,000 shares of the Fund. Immediately after the transfer, the shares of the Fund were distributed to the sole owner of the Private Fund and the investment manager of the Fund, Dodge & Cox, which became the initial shareholder of the Fund. |
The Board of Trustees has appointed Dodge & Cox, the Fund’s investment manager, to make fair value determinations in accordance with the Dodge & Cox Funds Valuation Policies (“Valuation Policies”), subject to Board oversight. Dodge & Cox has established a Pricing Committee that is comprised of representatives from Treasury, Legal, Compliance, and Operations. The Pricing Committee is responsible for implementing the Valuation Policies, including determining the fair value of securities and other investments when necessary. The Pricing Committee considers relevant indications of value that are reasonably available to it in determining the fair value assigned to a particular security, such as the value of similar financial instruments, trading volumes, contractual restrictions on disposition, related corporate actions, and changes in economic conditions. In doing so, the Pricing Committee employs various methods for calibrating fair valuation approaches, including a regular review of key inputs and assumptions, back-testing, and review of any related market activity.
Valuing securities through a fair value determination involves greater reliance on judgment than valuation of securities based on readily available market quotations. In some instances, lack of information and uncertainty as to the significance of information may lead to a conclusion that a prior valuation is the best indication of a security’s value. When fair value pricing is employed, the prices of securities used by the Fund to calculate its NAV may differ from quoted or published prices for the same securities.
Security transactions, investment income, expenses, and distributions Security transactions are recorded on the trade date. Realized gains and losses on securities sold are determined on the basis of identified cost.
Interest income is recorded on the accrual basis. Interest income includes coupon interest, amortization of premium and accretion of discount on debt securities, gain/loss on paydowns, and inflation adjustments to the principal amount of inflation-indexed securities. The ability of the issuers of the debt securities held by the Fund to meet their obligations may be affected by economic developments in a specific industry, state, region, or country. Debt obligations may be placed on non-accrual status and related interest income may be reduced by ceasing current accruals and writing off interest receivables when the collection of all or a portion of interest has become doubtful. A debt obligation is removed from non-accrual status when the issuer resumes interest payments or when collectability of interest is reasonably assured. Dividend income is recorded on the ex-dividend date.
Expenses are recorded on the accrual basis. Some expenses of the Trust can be directly attributed to a specific series. Expenses which cannot be directly attributed are allocated among the Funds in the Trust using methodologies determined by the nature of the expense.
Distributions to shareholders are recorded on the ex-dividend date.
Foreign taxes The Fund is subject to foreign taxes which may be imposed by certain countries in which the Fund invests. The Fund endeavors to record foreign taxes based on applicable
DODGE & COX GLOBAL BOND FUND §PAGE 11
NOTES TO FINANCIAL STATEMENTS (unaudited)
foreign tax law. Withholding taxes are incurred on certain foreign receipts and are accrued at the time the associated interest income is recorded.
Capital gains taxes are incurred upon disposition of certain foreign securities. Expected capital gains taxes on appreciated securities are accrued as unrealized losses and incurred capital gains taxes are reflected as realized losses upon the sale of the related security. Currency taxes may be incurred when the Fund purchases certain foreign currencies related to securities transactions and are recorded as realized losses on foreign currency transactions.
Repurchase agreements Repurchase agreements are transactions under which a Fund purchases a security from a dealer counterparty and agrees to resell the security to that counterparty on a specified future date at the same price, plus a specified interest rate. The Fund’s repurchase agreements are secured by U.S. government or agency securities. It is the Fund’s policy that its custodian take possession of the underlying collateral securities, the fair value of which exceeds the principal amount of the repurchase transaction, including accrued interest, at all times. In the event of default by the counterparty, the Fund has the contractual right to liquidate the securities and to apply the proceeds in satisfaction of the obligation.
Futures Contracts Futures contracts involve an obligation to purchase or sell (depending on whether the Fund has entered a long or short futures contract, respectively) an asset at a future date, at a price set at the time of the contract. Upon entering into a futures contract, the Fund is required to deposit an amount of cash or liquid assets (referred to as initial margin) in a segregated account with the clearing broker. Subsequent payments (referred to as variation margin) to and from the clearing broker are made on a daily basis based on changes in the market value of futures contracts. Futures contracts are traded publicly and their market value changes daily. Changes in the market value of open futures contracts are recorded as unrealized appreciation or depreciation in the Statement of Operations. Realized gains and losses on futures contracts are recorded in the Statement of Operations at the closing or expiration of the contracts. Cash deposited with a broker as initial margin is recorded on the Statement of Assets and Liabilities. A receivable and/or payable to brokers for daily variation margin is also recorded on the Statement of Assets and Liabilities.
Investments in futures contracts may include certain risks, which may be different from, and potentially greater than, those of the underlying securities. To the extent the Fund uses futures, it is exposed to additional volatility and potential losses resulting from leverage.
The Fund has maintained short Treasury futures contracts and short Euro-Bund futures contracts to assist with the management of the portfolio’s interest rate exposure. During the six months ended June 30, 2017, these futures contracts had total notional values ranging from 15% to 18% of net assets.
Interest rate swaps Interest rate swaps are agreements that obligate two parties to exchange a series of cash flows at specified payment dates calculated by reference to specified interest rates, such as an exchange of floating rate payments for fixed rate payments. Upon entering into a centrally cleared interest rate swap, the Fund is required to post an amount of cash or liquid assets (referred to as initial margin) in a segregated account with
the clearing broker. Subsequent payments (referred to as variation
margin) to and from the clearing broker are made on a daily basis based on changes in the market value of each interest rate swap. Changes in the market value of open interest rate swaps are recorded as unrealized appreciation or depreciation in the Statement of Operations. Realized gains and losses on interest rate swaps are recorded in the Statement of Operations, both upon the exchange of cash flows on each specified payment date and upon the closing or expiration of the swap. Cash deposited with the clearing broker as initial margin is recorded on the Statement of Assets and Liabilities. A receivable and/or payable to brokers for daily variation margin is also recorded on the Statement of Assets and Liabilities.
Investments in interest rate swaps may include certain risks including unfavorable changes in interest rates, or a default or failure by the clearing broker or clearinghouse.
The Fund has maintained interest rate swaps in connection with the management of the portfolio’s interest rate exposure. During the six months ended June 30, 2017, these interest rate swaps had U.S. dollar notional values ranging from 3% to 5% of net assets.
Currency Forward contracts A currency forward contract represents an obligation to purchase or sell a specific foreign currency at a future date at a price set at the time of the contract. The values of the currency forward contracts are adjusted daily based on the prevailing forward exchange rates of the underlying currencies. Changes in the value of open contracts are recorded as unrealized appreciation or depreciation in the Statement of Operations. When the currency forward contract is closed, the Fund records a realized gain or loss in the Statement of Operations equal to the difference between the value at the time the contract was opened and the value at the time it was closed. Losses from these transactions may arise from unfavorable changes in currency values or if the counterparties do not perform under a contract’s terms.
The Fund has maintained Indian rupee currency forward contracts as a substitute for a direct investment in India. During the six months ended June 30, 2017, these Indian rupee currency forward contracts had U.S. dollar total values ranging from 0% to 3% of net assets.
The Fund has maintained currency forward contracts to hedge direct and/or indirect foreign currency exposure to the British pound, euro, and Japanese yen. During the six months ended June 30, 2017, these currency forward contracts had U.S. dollar total values ranging from 10% to 12% of net assets.
Foreign currency translation The books and records of the Fund are maintained in U.S. dollars. Foreign currency amounts are translated into U.S. dollars at the prevailing exchange rates of such currencies against the U.S. dollar. The market value of investment securities and other assets and liabilities are translated at the exchange rate as of the valuation date. Purchases and sales of investment securities, income, and expenses are translated at the exchange rate prevailing on the transaction date.
Reported realized and unrealized gain (loss) on investments includes foreign currency gain (loss) related to investment transactions.
Reported realized and unrealized gain (loss) on foreign currency transactions and translation include the following: holding/disposing of foreign currency, the difference between the
PAGE 12 § DODGE & COX GLOBAL BOND FUND
NOTES TO FINANCIAL STATEMENTS (unaudited)
trade and settlement dates on securities transactions, the difference between the accrual and payment dates on interest, and currency losses on the purchase of foreign currency in certain countries that impose taxes on such transactions.
Indemnification Under the Trust’s organizational documents, its officers and trustees are indemnified against certain liabilities arising out of the performance of their duties to the Trust. In addition, in the normal course of business the Trust enters into contracts that provide general indemnities to other parties. The Trust’s maximum exposure under these arrangements is unknown as this would involve future claims that may be made against the Trust that have not yet occurred.
NOTE 2—VALUATION MEASUREMENTS
Various inputs are used in determining the value of the Fund’s investments. These inputs are summarized in the three broad levels listed below.
| § | | Level 1: Quoted prices in active markets for identical securities |
| § | | Level 2: Other significant observable inputs (including quoted prices for similar securities, market indices, interest rates, credit risk, forward exchange rates, etc.) |
| § | | Level 3: Significant unobservable inputs (including Fund management’s assumptions in determining the fair value of investments) |
The inputs or methodology used for valuing securities are not necessarily an indication of the risk associated with investing in those securities.
The following is a summary of the inputs used to value the Fund’s holdings at June 30, 2017:
| | | | | | | | |
| Classification(a) | | LEVEL 1
(Quoted Prices) | | | LEVEL 2
(Other Significant
Observable Inputs) | |
Securities | | | | | | | | |
Debt Securities | | | | | | | | |
Government | | $ | — | | | $ | 29,420,690 | |
Government-Related | | | — | | | | 11,222,859 | |
Securitized | | | — | | | | 25,888,612 | |
Corporate | | | — | | | | 56,450,335 | |
Short-term Investments | | | | | | | | |
Commercial Paper | | | — | | | | 2,497,551 | |
Money Market Fund | | | 127,149 | | | | — | |
Repurchase Agreement | | | — | | | | 2,372,000 | |
| | | | | | | | |
Total Securities | | $ | 127,149 | | | $ | 127,852,047 | |
| | | | | | | | |
Other Financial Instruments | | | | | | | | |
Futures Contracts | | | | | | | | |
Appreciation | | $ | 129,950 | | | $ | — | |
Interest Rate Swaps | | | | | | | | |
Appreciation | | | — | | | | 12,863 | |
Depreciation | | | — | | | | (160,401 | ) |
Currency Forward Contracts | | | | | | | | |
Appreciation | | | — | | | | 161,773 | |
Depreciation | | | — | | | | (712,923 | ) |
| | | | | | | | | |
| (a) | There were no transfers between Level 1 and Level 2 during the six months ended June 30, 2017. There were no Level 3 securities at June 30, 2017 and December 31, 2016, and there were no transfers to Level 3 during the period. |
NOTE 3—RELATED PARTY TRANSACTIONS
Management fees Under a written agreement approved by a unanimous vote of the Board of Trustees, the Fund pays an annual management fee of 0.50% of the Fund’s average daily net assets to Dodge & Cox, investment manager of the Fund. Effective May 1, 2017, Dodge & Cox has contractually agreed to reimburse the Fund for all ordinary expenses to the extent necessary to maintain the ratio of total operating expenses to average net assets (“net expense ratio”) at 0.45% through April 30, 2018. The term of the agreement is renewable annually thereafter unless terminated with 30 days’ written notice by either party prior to the end of the term. For periods prior to May 1, 2017, the Fund’s net expense ratio was 0.60%.
Fund officers and trustees All officers and two of the trustees of the Trust are officers or employees of Dodge & Cox. The Trust pays a fee only to those trustees who are not affiliated with Dodge & Cox.
Share ownership At June 30, 2017, Dodge & Cox owned 12% of the Fund’s outstanding shares.
NOTE 4—INCOME TAX INFORMATION AND DISTRIBUTIONS TO SHAREHOLDERS
A provision for federal income taxes is not required since the Fund intends to continue to qualify as a regulated investment company under Subchapter M of the Internal Revenue Code and distribute all of its taxable income to shareholders. Distributions are determined in accordance with income tax regulations, and such amounts may differ from net investment income and realized gains for financial reporting purposes. Financial reporting records are adjusted for permanent book to tax differences at year end to reflect tax character.
Book to tax differences are primarily due to differing treatments of wash sales, net short-term realized gain (loss), foreign currency realized gain (loss), futures contracts, and interest rate swaps. At June 30, 2017, the cost of investments for federal income tax purposes was $124,088,090.
DODGE & COX GLOBAL BOND FUND §PAGE 13
NOTES TO FINANCIAL STATEMENTS (unaudited)
Distributions during the periods noted below were characterized as follows for federal income tax purposes:
| | | | | | | | |
| | | Six Months Ended
June 30, 2017 | | | Year Ended
December 31, 2016 | |
Ordinary income | | | — | | | $ | 1,791,680 | |
| | | | | | ($ | 0.175 per share | ) |
Long-term capital gain | | | — | | | | — | |
At June 30, 2017, the tax basis components of distributable earnings were as follows:
| | | | |
Unrealized appreciation | | $ | 4,859,888 | |
Unrealized depreciation | | | (968,782 | ) |
| | | | |
Net unrealized appreciation | | | 3,891,106 | |
Undistributed ordinary income | | | 1,872,469 | |
Accumulated capital loss(a) | | | (551,647 | ) |
Deferred loss(b) | | | (892,009 | ) |
| | | | | |
| (a) | Represents capital loss realized for tax purposes during the period from January 1, 2017 to June 30, 2017 |
| (b) | Represents net realized specified loss incurred between November 1, 2016 and December 31, 2016. As permitted by tax regulation, the Fund has elected to treat this loss as arising in 2017. |
Fund management has reviewed the tax positions for the open period applicable to the Fund, and has determined that no provision for income tax is required in the Fund’s financial statements.
NOTE 5—LOAN FACILITIES
Pursuant to an exemptive order issued by the Securities and Exchange Commission (SEC), the Fund may participate in an interfund lending facility (Facility). The Facility allows the Fund to borrow money from or loan money to the Funds. Loans under the Facility are made for temporary or emergency purposes, such as to fund shareholder redemption requests. Interest on borrowings is the average of the current repurchase agreement rate and the bank loan rate. There was no activity in the Facility during the period.
All Funds in the Trust participate in a $500 million committed credit facility (Line of Credit) with State Street Bank and Trust Company, to be utilized for temporary or emergency purposes to fund shareholder redemptions or for other short-term liquidity purposes. The maximum amount available to the Fund is $250 million. Each Fund pays an annual commitment fee on its pro-rata portion of the Line of Credit. For the six months ended June 30, 2017, the Fund’s commitment fee amounted to $368 and is reflected as a Miscellaneous Expense in the Statement of Operations. Interest on borrowings is charged at the prevailing rate. There were no borrowings on the Line of Credit during the period.
NOTE 6—PURCHASES AND SALES OF INVESTMENTS
For the six months ended June 30, 2017, purchases and sales of securities, other than short-term securities and U.S. government securities, aggregated $19,623,758 and $15,400,831, respectively. For the six months ended June 30, 2017, purchases and sales of U.S. government securities aggregated $13,599,485 and $9,827,514, respectively.
NOTE 7—NEW ACCOUNTING GUIDANCE
In October 2016, the SEC issued a new rule, Investment Company Reporting Modernization, which, among other provisions, amends Regulation S-X to require standardized, enhanced disclosures, particularly related to derivatives, in investment company financial statements. Compliance with the guidance is required for financial statements for fiscal periods ending on or after August 1, 2017. Management is currently assessing the impact of this rule to the Fund’s financial statements and other filings and does not expect any impact to the Fund’s net assets or results of operations.
In March 2017, the Financial Accounting Standards Board issued an update to amend the amortization period for certain purchased callable debt securities held at a premium. The amendments shorten the amortization period for premiums to the earliest call date, but do not require an accounting change for securities held at a discount. The amendments are effective for financial statements for fiscal years beginning after December 15, 2018, and interim periods within those fiscal years. Management is evaluating the impact, if any, of this guidance on the Fund’s financial statements and disclosures.
NOTE 8—SUBSEQUENT EVENTS
Fund management has determined that no material events or transactions occurred subsequent to June 30, 2017, and through the date of the Fund’s financial statements issuance, which require additional disclosure in the Fund’s financial statements.
PAGE 14 § DODGE & COX GLOBAL BOND FUND
NOTES TO FINANCIAL STATEMENTS (unaudited)
NOTE 9—ADDITIONAL DERIVATIVES INFORMATION
The Fund has entered into over-the-counter derivatives, such as currency forward contracts (each, a “Derivative”). Each Derivative is subject to a negotiated master agreement (based on a form published by the International Swaps and Derivatives Association (“ISDA”)) governing all Derivatives between the Fund and the relevant dealer counterparty. The master agreements specify (i) events of default and other events permitting a party to terminate some or all of the Derivatives thereunder and (ii) the process by which those Derivatives will be valued for purposes of determining termination payments. If some or all of the Derivatives under a master agreement are terminated because of an event of default or similar event, the values of all terminated Derivatives must be netted to determine a single payment owed by one party to the other. Some master agreements contain collateral terms requiring the parties to post collateral in respect of some or all of the Derivatives thereunder based on the net market value of those Derivatives, subject to a minimum exposure threshold. To the extent amounts owed to the Fund by its counterparties are not collateralized, the Fund is at risk of those counterparties’ non-performance. The Fund attempts to mitigate counterparty credit risk by entering into Derivatives only with counterparties it believes to be of good credit quality and by monitoring the financial stability of those counterparties.
For financial reporting purposes, the Fund does not offset financial assets and liabilities that are subject to a master netting arrangement in the Statement of Assets and Liabilities. Derivatives are presented on the Statement of Assets and Liabilities as unrealized appreciation/depreciation on currency forward contracts. Cash collateral pledged or received by the Fund for derivatives are reported gross on the Statement of Assets and Liabilities as collateral receivable/payable on currency forward contracts. Derivative information by counterparty is presented in the Portfolio of Investments.
The netting of assets and liabilities and the offsetting of collateral pledged or received are based on contractual netting/set-off provisions in the ISDA master agreement. The following table presents the Fund’s net exposure for derivative instruments that are subject to enforceable master netting arrangements as of June 30, 2017. The net amount represents the receivable from (payable to) the counterparty in the event of a default.
| | | | | | | | | | | | | | | | |
| Counterparty | | Gross
Derivative Assets | | | Gross
Derivative Liabilities | | | Cash Collateral
Pledged/(Received)(a) | | | Net Amount | |
Bank of America | | $ | — | | | $ | (179,164) | | | $ | — | | | $ | (179,164) | |
Barclays | | | 161,773 | | | | (5,841) | | | | — | | | | 155,932 | |
Citibank | | | — | | | | (204,521) | | | | — | | | | (204,521) | |
Goldman Sachs | | | — | | | | (323,397) | | | | — | | | | (323,397) | |
| | | | | | | | | | | | | | | | |
| | $ | 161,773 | | | $ | (712,923) | | | $ | — | | | $ | (551,150) | |
| | | | | | | | | | | | | | | | |
| | | | | | | | | | | | | | | | | |
| (a) | Cash collateral pledged/(received) in excess of derivative assets/liabilities, if any, is not presented in this table. The total cash collateral is presented on the Fund’s Statement of Assets and Liabilities. |
DODGE & COX GLOBAL BOND FUND §PAGE 15
FINANCIAL HIGHLIGHTS (unaudited)
| | | | | | | | | | | | | | | | |
SELECTED DATA AND RATIOS (for a share outstanding throughout each period) | | Six Months Ended
June 30, 2017 | | | Year Ended
December 31, 2016 | | | Year Ended
December 31, 2015 | | | Period from May 1, 2014
(commencement of Fund operations)
to December 31, 2014 | |
Net asset value, beginning of period | | | $10.33 | | | | $9.67 | | | | $10.31 | | | | $10.73 | |
Income from investment operations: | | | | | | | | | | | | | | | | |
Net investment income | | | 0.19 | | | | 0.30 | | | | 0.34 | | | | 0.16 | |
Net realized and unrealized gain (loss) | | | 0.41 | | | | 0.54 | | | | (0.98 | ) | | | (0.44 | ) |
| | | | | | | | | | | | | | | | |
Total from investment operations | | | 0.60 | | | | 0.84 | | | | (0.64 | ) | | | (0.28 | ) |
| | | | | | | | | | | | | | | | |
Distributions to shareholders from: | | | | | | | | | | | | | | | | |
Net investment income | | | — | | | | (0.18 | ) | | | — | | | | (0.14 | ) |
Net realized gain | | | — | | | | — | | | | — | | | | — | |
| | | | | | | | | | | | | | | | |
Total distributions | | | — | | | | (0.18 | ) | | | — | | | | (0.14 | ) |
| | | | | | | | | | | | | | | | |
Net asset value, end of period | | | $10.93 | | | | $10.33 | | | | $9.67 | | | | $10.31 | |
| | | | | | | | | | | | | | | | |
Total return | | | 5.81 | % | | | 8.64 | % | | | (6.21 | )% | | | (2.59 | )% |
Ratios/supplemental data: | | | | | | | | | | | | | | | | |
Net assets, end of period (millions) | | | $128 | | | | $110 | | | | $68 | | | | $65 | |
Ratios of expenses to average net assets | | | 0.55 | %(a) | | | 0.60 | % | | | 0.60 | % | | | 0.60 | %(a) |
Ratio of expenses to average net assets, before reimbursement by investment manager | | | 1.09 | %(a) | | | 1.33 | % | | | 1.41 | % | | | 2.18 | %(a) |
Ratios of net investment income to average net assets | | | 3.58 | %(a) | | | 3.77 | % | | | 3.39 | % | | | 2.83 | %(a) |
Portfolio turnover rate | | | 23 | % | | | 73 | % | | | 55 | % | | | 36 | % |
See accompanying Notes to Financial Statements
PAGE 16 § DODGE & COX GLOBAL BOND FUND
FUND HOLDINGS
The Fund provides a complete list of its holdings four times each fiscal year, as of the end of each quarter. The Fund files the lists with the Securities and Exchange Commission (SEC) on Form N-CSR (second and fourth quarters) and Form N-Q (first and third quarters). Shareholders may view the Fund’s Forms N-CSR and N-Q on the SEC’s website at sec.gov. Forms N-CSR and N-Q may also be reviewed and copied at the SEC’s Public Reference Room in Washington, DC. Information regarding the operations of the Public Reference Room may be obtained by calling 202-551-8090 (direct) or 800-732-0330 (general SEC number). A list of the Fund’s quarter-end holdings is also available at dodgeandcox.com on or about 15 days following each quarter end and remains available on the website until the list is updated in the subsequent quarter.
PROXY VOTING
For a free copy of the Fund’s proxy voting policies and procedures, please call 800-621-3979, visit the Fund’s website at dodgeandcox.com, or visit the SEC’s website at sec.gov. Information regarding how the Fund voted proxies relating to portfolio securities during the most recent 12-month period ending June 30 is also available at dodgeandcox.com or at sec.gov.
HOUSEHOLD MAILINGS
The Fund routinely mails shareholder reports and summary prospectuses to shareholders and, on occasion, proxy statements. In order to reduce the volume of mail, when possible, only one copy of these documents will be sent to shareholders who are part of the same family and share the same residential address.
If you have a direct account with the Funds and you do not want the mailing of shareholder reports and summary prospectuses combined with other members in your household, contact the Funds at 800-621-3979. Your request will be implemented within 30 days.
DODGE & COX GLOBAL BOND FUND §PAGE 17
THIS PAGE INTENTIONALLY LEFT BLANK
PAGE 18 § DODGE & COX GLOBAL BOND FUND
TRUSTEES AND EXECUTIVE OFFICERS
Charles F. Pohl, Chairman and Trustee
Chairman, Dodge & Cox
Dana M. Emery, President and Trustee
Chief Executive Officer and President, Dodge & Cox
Thomas A. Larsen, Independent Trustee
Senior Counsel, Arnold & Porter Kaye Scholer LLP
Ann Mather, Independent Trustee
Former Executive Vice President, Chief Financial Officer, and Company Secretary, Pixar Animation Studios
Robert B. Morris III, Independent Trustee
Former Partner and Managing Director - Global Investment Research, Goldman Sachs; Former Advisory Director, The Presidio Group
Gary Roughead, Independent Trustee
Robert and Marion Oster Distinguished Fellow, Hoover Institution, and former U.S. Navy Chief of Naval Operations
Mark E. Smith, Independent Trustee
Former Executive Vice President and Managing Director-Fixed Income, Loomis Sayles & Company, L.P.
John B. Taylor, Independent Trustee
Professor of Economics, Stanford University; Senior Fellow, Hoover Institution; and former Under Secretary for International Affairs, United States Treasury
Diana S. Strandberg, Senior Vice President
Senior Vice President and Director of International Equity, Dodge & Cox
David H. Longhurst, Treasurer
Vice President and Assistant Treasurer, Dodge & Cox
Thomas M. Mistele, Secretary
Executive Vice President, Secretary, and Senior Counsel, Dodge & Cox
Katherine M. Primas, Chief Compliance Officer
Vice President and Chief Compliance Officer, Dodge & Cox
Roberta R.W. Kameda, Assistant Secretary
Vice President and General Counsel, Dodge & Cox
William W. Strickland, Assistant Secretary and Assistant Treasurer
Vice President and Chief Operating Officer, Dodge & Cox
Additional information about the Trust’s Trustees and Officers is available in the Trust’s Statement of Additional Information (SAI). You can get a free copy of the SAI by visiting the Funds’ website at dodgeandcox.com or calling 800-621-3979.
DODGE & COX GLOBAL BOND FUND §PAGE 19
dodgeandcox.com
For Fund literature, transactions, and account
information, please visit the Funds’ website.
or write or call:
DODGE & COX FUNDS
c/o Boston Financial Data Services
P.O. Box 8422
Boston, Massachusetts 02266-8422
(800) 621-3979
INVESTMENT MANAGER
Dodge & Cox
555 California Street, 40th Floor
San Francisco, California 94104
(415) 981-1710
This report is submitted for the general information of the shareholders of the Fund. The report is not authorized for distribution to prospective investors in the Fund unless it is accompanied by a current prospectus.
This report reflects our views, opinions, and portfolio holdings as of June 30, 2017, the end of the reporting period. Any such views are subject to change at any time based upon market or other conditions and Dodge & Cox disclaims any responsibility to update such views. These views may not be relied on as investment advice and, because investment decisions for a Dodge & Cox Fund are based on numerous factors, may not be relied on as an indication of trading intent on behalf of any Dodge & Cox Fund.
ITEM 2. CODE OF ETHICS.
Not applicable for semi-annual report filings.
ITEM 3. AUDIT COMMITTEE FINANCIAL EXPERT.
Not applicable for semi-annual report filings.
ITEM 4. PRINCIPAL ACCOUNTANT FEES AND SERVICES.
Not applicable for semi-annual report filings.
ITEM 5. AUDIT COMMITTEE OF LISTED REGISTRANTS.
Not applicable.
ITEM 6. SCHEDULE OF INVESTMENTS.
Not applicable. The complete schedule of investments is included in Item 1 of this Form N-CSR.
ITEM 7. DISCLOSURE OF PROXY VOTING POLICIES AND PROCEDURES FOR CLOSED-END MANAGEMENT INVESTMENT COMPANIES.
Not applicable.
ITEM 8. PORTFOLIO MANAGERS OF CLOSED-END MANAGEMENT INVESTMENT COMPANIES.
Not applicable.
ITEM 9. PURCHASES OF EQUITY SECURITIES BY CLOSED-END MANAGEMENT INVESTMENT COMPANY AND AFFILIATED PURCHASERS.
Not applicable.
ITEM 10. SUBMISSION OF MATTERS TO A VOTE OF SECURITY HOLDERS.
During the reporting period, there were no material changes to the procedures by which shareholders may recommend nominees to the registrant’s board.
ITEM 11. CONTROLS AND PROCEDURES.
(a) An evaluation was performed within 90 days of the filing of this report, under the supervision and with the participation of the registrant’s management, including the principal executive officer and principal financial officer, of the effectiveness of the design and operation of the registrant’s disclosure controls and procedures. Based on that evaluation, the principal executive officer and principal financial officer concluded that the registrant’s disclosure controls and procedures were effective.
(b) The registrant’s principal executive officer and principal financial officer are aware of no changes in the registrant’s internal control over financial reporting that occurred during the registrant’s second fiscal quarter of the period covered by this report that have materially affected, or are reasonably likely to materially affect, the registrant’s internal control over financial reporting.
ITEM 12. EXHIBITS.
(a) (1) Not applicable for semi-annual report filings.
(a) (2) Certifications pursuant to Section 302 of the Sarbanes-Oxley Act of 2002 are attached. (EX.99A)
(a) (3) Not applicable.
(b) Certifications pursuant to Section 906 of the Sarbanes-Oxley Act of 2002 are attached. (EX.99B)
SIGNATURES
Pursuant to the requirements of the Securities Exchange Act of 1934 and the Investment Company Act of 1940, the registrant has duly caused this report to be signed on its behalf by the undersigned, thereunto duly authorized.
Dodge & Cox Funds
| | |
| |
| By | | /s/ Charles F. Pohl |
| | Charles F. Pohl |
| | Chairman – Principal Executive Officer |
Date August 21, 2017
Pursuant to the requirements of the Securities Exchange Act of 1934 and the Investment Company Act of 1940, this report has been signed below by the following persons on behalf of the registrant and in the capacities and on the dates indicated.
Dodge & Cox Funds
| | |
| |
| By | | /s/ Charles F. Pohl |
| | Charles F. Pohl |
| | Chairman – Principal Executive Officer |
| |
| By | | /s/ David H. Longhurst |
| | David H. Longhurst |
| | Treasurer – Principal Financial Officer |
Date August 21, 2017