UNITED STATES
SECURITIES AND EXCHANGE COMMISSION
Washington, D.C. 20549
FORM N-CSR
CERTIFIED SHAREHOLDER REPORT OF REGISTERED
MANAGEMENT INVESTMENT COMPANIES
Investment Company Act file number 811-173
DODGE & COX FUNDS
(Exact name of registrant as specified in charter)
555 California Street, 40th Floor
San Francisco, CA 94104
(Address of principal executive offices) (Zip code)
Thomas M. Mistele, Esq.
555 California Street, 40th Floor
San Francisco, CA 94104
(Name and address of agent for service)
Registrant’s telephone number, including area code: 415-981-1710
Date of fiscal year end: DECEMBER 31, 2014
Date of reporting period: JUNE 30, 2014
Form N-CSR is to be used by management investment companies to file reports with the Commission not later than 10 days after the transmission to stockholders of any report that is required to be transmitted to stockholders under Rule 30e-1 under the Investment Company Act of 1940 (17 CFR 270.30e-1). The Commission may use the information provided on Form N-CSR in its regulatory, disclosure review, inspection, and policymaking roles.
A registrant is required to disclose the information specified by Form N-CSR, and the Commission will make this information public. A registrant is not required to respond to the collection of information contained in Form N-CSR unless the Form displays a currently valid Office of Management and Budget (“OMB”) control number. Please direct comments concerning the accuracy of the information collection burden estimate and any suggestions for reducing the burden to Secretary, Securities and Exchange Commission, 450 Fifth Street, NW, Washington, DC 20549-0609. The OMB has reviewed this collection of information under the clearance requirements of 44 U.S.C. ss. 3507.
ITEM 1. REPORTS TO STOCKHOLDERS.
The following are the June 30, 2014 semi-annual reports for the Dodge & Cox Funds, a Delaware statutory trust, consisting of six series: Dodge & Cox Stock Fund, Dodge & Cox Global Stock Fund, Dodge & Cox International Stock Fund, Dodge & Cox Balanced Fund, Dodge & Cox Income Fund and Dodge & Cox Global Bond Fund. The reports of each series were transmitted to their respective shareholders on August 18, 2014.
| | | | |
 | | | |  |
www.dodgeandcox.com
For Fund literature, transactions, and account
information, please visit the Funds’ website.
or write or call:
DODGE & COX FUNDS
c/o Boston Financial Data Services
P.O. Box 8422
Boston, Massachusetts 02266-8422
(800) 621-3979
INVESTMENT MANAGER
Dodge & Cox
555 California Street, 40th Floor
San Francisco, California 94104
(415) 981-1710
This report is submitted for the general information of the shareholders of the Fund. The report is not authorized for distribution to prospective investors in the Fund unless it is accompanied by a current prospectus.
This report reflects our views, opinions, and portfolio holdings as of June 30, 2014, the end of the reporting period. Any such views are subject to change at any time based upon market or other conditions and Dodge & Cox disclaims any responsibility to update such views. These views may not be relied on as investment advice and, because investment decisions for a Dodge & Cox Fund are based on numerous factors, may not be relied on as an indication of trading intent on behalf of any Dodge & Cox Fund.
6/14 SF SAR  Printed on recycled paper
Semi-Annual Report
June 30, 2014
Stock Fund
ESTABLISHED 1965
TICKER: DODGX
TO OUR SHAREHOLDERS
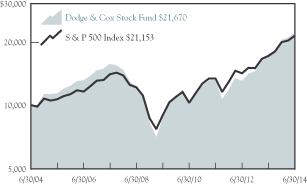
The Dodge & Cox Stock Fund had a total return of 7.0% for the six months ended June 30, 2014, compared to a return of 7.1% for the S&P 500 Index. On June 30, the Fund had net assets of $58.4 billion with a cash position of 0.8%.
MARKET COMMENTARY
After exceptionally strong returns in 2013, U.S. equity markets continued to rise during the first half of 2014: the quarter ended June 30 marked the S&P 500’s sixth consecutive quarter of gains. While every sector of the S&P 500 generated positive returns for the six-month period, Utilities and Energy were the strongest. Following a slow start to the year, growth in U.S. economic activity rebounded and assuaged concerns that the economy was losing momentum. The labor market and household spending showed further signs of improvement, and businesses invested more in fixed assets. However, the housing recovery remained slow and turmoil in the Middle East modestly increased oil prices.
Corporate balance sheets and cash flows are robust; we continue to be optimistic about the long-term prospects for corporate earnings growth. In our opinion, U.S. equity market valuations remain reasonable: the S&P 500 traded at 16 times forward estimated earnings, which is close to its 10-year average, with a 2.0% dividend yield.(a)
INVESTMENT STRATEGY:
FINDING OPPORTUNITIES IN MEDIA
We build the portfolio one security at a time, exercise a strict price discipline, and evaluate potential investments based on our three- to five-year investment horizon. Any sector over- or underweights are a result of our fundamental, bottom-up research process, which we have employed for decades.
To determine whether a company’s share price presents a compelling investment opportunity, we weigh the company’s valuation against its fundamentals (e.g., competitive positioning, financial strength, long-term growth prospects, management quality, and corporate governance). The Fund’s overweight position in the Media industry (10.9% compared to 3.6% for the S&P
500 industry) illustrates our investment process. Through individual security analysis, we have identified Media companies that we believe have durable business franchises, long-term growth prospects, and reasonable valuations. The Fund’s Media holdings fall into two broad categories: content and distribution.
Content-oriented holdings in the Fund include Time Warner, Twenty-First Century Fox, News Corp., and Time.(b) Such companies have growth opportunities in digital media, interactive content, and cable networks, however they must compensate for slow secular growth in mature media (newspapers and publishing) and loss of advertising market share to internet and other media outlets. The Fund’s distribution holdings (Comcast, Time Warner Cable, and DISH Network) stand to benefit from rising broadband penetration, stable financial conditions, and reasonable valuations, although they face an increasingly competitive video distribution environment. Time Warner, Comcast, and Time Warner Cable are highlighted in detail below.
Content: Time Warner
Time Warner, a strategically well-positioned media conglomerate, was a 2.7% position in the Fund on June 30. We believe its valuation of 16 times forward earnings is reasonable in relation to its earnings and free cash flow growth prospects. Some investors have questioned whether cable networks will be able to continue to push through price increases, but we believe this risk is modest. Time Warner’s television-related businesses are estimated to account for more than 90% of its cash flow, and the majority of the company’s businesses (e.g., cable networks, television licensing) are characterized by multi-year contracts with guaranteed annual revenue increases. In addition, the continued viewership migration from broadcast networks to cable networks is driving ad revenue, and the company’s film and television studios are increasing revenue by licensing content to newer digital distribution services.
We believe Time Warner’s management is one of the most disciplined capital allocators in the Media industry and is focused on maximizing returns for long-term shareholders. As evidence, they have repurchased over
PAGE 1 § DODGE & COX STOCK FUND
30% of the company’s shares since 2006 and have avoided large-scale mergers and acquisitions (M&A). Furthermore, since we initiated the Fund’s position in 2003, management has spun off businesses methodically to increase shareholder value. All of these spinoffs are still held in the Fund and have augmented returns: Time Warner Cable (up 559% since its March 2009 spin off), AOL (up 96% since its December 2009 spin off, including a $5.15 per share special dividend), and Time (up 4% since its early June 2014 spinoff). We continue to believe these businesses have attractive long-term growth opportunities; in total, Time Warner, Time Warner Cable, AOL, and Time accounted for 5.7% of the Fund on June 30.
Distribution: Comcast and Time Warner Cable
In response to evolving consumer habits, media companies are altering their long-term strategies and the industry is consolidating. Two of the Fund’s Media holdings have entered into a merger agreement: in February 2014, Comcast (the largest cable operator in the United States) agreed to acquire Time Warner Cable (the second largest) for $45 billion in stock at the time of the announcement.
What is Comcast’s rationale for the deal? Combining the companies presents significant opportunities for cost reductions, operating synergies, and enhanced revenue growth. Comcast and Time Warner Cable currently do not compete directly in any markets. If the merger is completed, Comcast will gain access to the premier New York and Los Angeles markets, and thereby have a national presence. The proposed new entity would be the dominant provider of pay-TV and wireline broadband services in the United States (reaching ~70% of U.S. households).
We believe the proposed deal could build long-term shareholder value, depending upon merger concessions. Comcast’s management team is astute and has a proven M&A track record. While they have already made deal concessions, substantial regulatory hurdles lie ahead: both the Federal Communications Commission and the Department of Justice need to approve the merger. On a standalone basis, Comcast and Time Warner Cable remain reasonably valued and were held in the Fund on June 30 with 3.1% and 2.3% positions, respectively.
IN CLOSING
We remain enthusiastic about the long-term prospects for the Fund’s holdings. In addition to Media, the Fund remains overweight in the Financials, Health Care, and Information Technology sectors, as well as the Energy Equipment & Services industry. The most significant underweight positions in the Fund are in Utilities, Consumer Staples, and Industrials. The Fund’s holdings collectively trade at a discount (14 times forward earnings) to the S&P 500 and have earnings growth and cash flow potential.
As evidenced by the Fund’s low portfolio turnover, we continue to invest with a long-term horizon. Acknowledging that stock prices can be volatile over the short term, we encourage shareholders to also remain focused on the long term.
Thank you for your continued confidence in our firm. As always, we welcome your comments and questions.
For the Board of Trustees,
| | |
 | |  |
Charles F. Pohl, Chairman | | Dana M. Emery, President |
July 29, 2014
| (a) | | Unless otherwise specified, all weightings and characteristics are as of June 30, 2014. |
| (b) | | The use of specific examples does not imply that they are more attractive investments than the Fund’s other holdings. |
DODGE & COX STOCK FUND §PAGE 2
YEAR-TO-DATE PERFORMANCE REVIEW
The Fund paced the S&P 500 year to date.
Key Detractors from Relative Results
| | § | | The Fund’s underweight position in the Utilities sector (no holdings compared to 3% for the S&P 500 sector), the strongest sector of the market (up 19%), hurt results. | |
| | § | | The Fund’s holdings in the Industrials sector (flat compared to up 4% for the S&P 500 sector) hindered performance. ADT Corp. (down 13%) was especially weak. | |
| | § | | Returns from holdings in the Information Technology sector (up 8% compared to up 9% for the S&P 500 sector) modestly detracted from results. NetApp (down 11%), eBay (down 9%), and Symantec (down 1%) lagged. | |
| | § | | Selected additional detractors included Coach (down 38%) and Goldman Sachs (down 5%). | |
Key Contributors to Relative Results
| | § | | The Fund’s holdings in the Energy sector (up 25% compared to up 13% for the S&P 500 sector) contributed significantly to results. Oil Services holdings, Weatherford International (up 48%), Baker Hughes (up 35%), and Schlumberger (up 32%) were particularly strong. | |
| | § | | The Fund’s holdings in the Materials sector (up 17% compared to up 8% for the S&P 500 sector) helped returns. Dow Chemical (up 18%) and Celanese (up 17%) performed well. | |
| | § | | Selected additional contributors included Forest Laboratories (up 52% to date of sale), Hewlett-Packard (up 22%), and Wells Fargo (up 17%). | |
KEY CHARACTERISTICS OF DODGE & COX
Independent Organization
Dodge & Cox is one of the largest privately owned investment managers in the world. We remain committed to independence, with a goal of providing the highest quality investment management service to our existing clients.
Over 80 Years of Investment Experience
Dodge & Cox was founded in 1930. We have a stable and well-qualified team of investment professionals, most of whom have spent their entire careers at Dodge & Cox.
Experienced Investment Team
The Investment Policy Committee, which is the decision-making body for the Stock Fund, is a nine-member committee with an average tenure at Dodge & Cox of 26 years.
One Business with a Single Research Office
Dodge & Cox manages equity (domestic, international, and global), fixed income (domestic and global), and balanced investments, operating from one office in San Francisco.
Consistent Investment Approach
Our team decision-making process involves thorough, bottom-up fundamental analysis of each investment.
Long-Term Focus and Low Expenses
We invest with a three- to five-year investment horizon, which has historically resulted in low turnover relative to our peers. We manage Funds that maintain low expense ratios.
Risks: The Fund is subject to stock market risk, meaning stocks in the Fund may decline in value for extended periods due to the financial prospects of individual companies, or due to general market and economic conditions. Please read the prospectus and summary prospectus for specific details regarding the Fund’s risk profile.
PAGE 3 § DODGE & COX STOCK FUND
GROWTH OF $10,000 OVER 10 YEARS
FOR AN INVESTMENT MADE ON JUNE 30, 2004
AVERAGE ANNUAL TOTAL RETURN
FOR PERIODS ENDED JUNE 30, 2014
| | | | | | | | | | | | | | | | |
| | | 1 Year | | | 5 Years | | | 10 Years | | | 20 Years | |
Dodge & Cox Stock Fund | | | 27.95 | % | | | 20.14 | % | | | 8.05 | % | | | 12.01 | % |
S&P 500 | | | 24.62 | | | | 18.84 | | | | 7.78 | | | | 9.79 | |
Returns represent past performance and do not guarantee future results. Investment return and share price will fluctuate with market conditions, and investors may have a gain or loss when shares are sold. Fund performance changes over time and currently may be significantly lower than stated. Performance is updated and published monthly. Visit the Fund’s website at www.dodgeandcox.com or call 800-621-3979 for current performance figures.
The Fund’s total returns include the reinvestment of dividend and capital gain distributions, but have not been adjusted for any income taxes payable by shareholders on these distributions or on Fund share redemptions. Index returns include dividends but, unlike Fund returns, do not reflect fees or expenses. The S&P 500 Index is a market capitalization-weighted index of 500 large-capitalization stocks commonly used to represent the U.S. equity market.
S&P 500® is a trademark of McGraw Hill Financial.
FUND EXPENSE EXAMPLE
As a Fund shareholder, you incur ongoing Fund costs, including management fees and other Fund expenses. All mutual funds have ongoing costs, sometimes referred to as operating expenses. The following example shows ongoing costs of investing in the Fund and can help you understand these costs and compare them with those of other mutual funds. The example assumes a $1,000 investment held for the six months indicated.
ACTUAL EXPENSES
The first line of the table below provides information about actual account values and expenses based on the Fund’s actual returns. You may use the information in this line, together with your account balance, to estimate the expenses that you paid over the period. Simply divide your account value by $1,000 (for example, an $8,600 account value divided by $1,000 = 8.6), then multiply the result by the number in the first line under the heading “Expenses Paid During Period” to estimate the expenses you paid on your account during this period.
HYPOTHETICAL EXAMPLE FOR COMPARISON WITH OTHER MUTUAL FUNDS
Information on the second line of the table can help you compare ongoing costs of investing in the Fund with those of other mutual funds. This information may not be used to estimate the actual ending account balance or expenses you paid during the period. The hypothetical “Ending Account Value” is based on the actual expense ratio of the Fund and an assumed 5% annual rate of return before expenses (not the Fund’s actual return). The amount under the heading “Expense Paid During the Period” shows the hypothetical expenses your account would have incurred under this scenario. You can compare this figure with the 5% hypothetical examples that appear in shareholder reports of other mutual funds.
| | | | | | | | | | | | |
Six Months Ended
June 30, 2014 | | Beginning Account Value
1/1/2014 | | | Ending Account Value
6/30/2014 | | | Expenses Paid
During Period* | |
Based on Actual Fund Return | | $ | 1,000.00 | | | $ | 1,070.20 | | | $ | 2.70 | |
Based on Hypothetical 5% Yearly Return | | | 1,000.00 | | | | 1,022.18 | | | | 2.64 | |
| * | | Expenses are equal to the Fund’s annualized expense ratio of 0.53%, multiplied by the average account value over the period, multiplied by 181/365 (to reflect the one-half year period). |
The expenses shown in the table highlight ongoing costs only and do not reflect any transactional fees or account maintenance fees. Though other mutual funds may charge such fees, please note that the Fund does not charge transaction fees (e.g., redemption fees, sales loads) or universal account maintenance fees (e.g., small account fees).
DODGE & COX STOCK FUND §PAGE 4
| | | | |
| FUND INFORMATION | | | June 30, 2014 | |
| | | | |
| GENERAL INFORMATION | | | |
Net Asset Value Per Share | | | $178.73 | |
Total Net Assets (billions) | | | $58.4 | |
2013 Expense Ratio (per 5/1/14 Prospectus) | | | 0.52% | |
Expense Ratio (1/1/14 to 6/30/14, annualized) | | | 0.53% | |
Portfolio Turnover Rate
(1/1/14 to 6/30/14, unannualized) | | | 7% | |
30-Day SEC Yield(a) | | | 1.27% | |
Fund Inception | | | 1965 | |
| No sales charges or distribution fees | | | | |
Investment Manager: Dodge & Cox, San Francisco. Managed by the Investment Policy Committee, whose nine members’ average tenure at Dodge & Cox is 26 years.
| | | | | | | | |
PORTFOLIO CHARACTERISTICS | | Fund | | | S&P 500 | |
Number of Equity Securities | | | 71 | | | | 501 | |
Median Market Capitalization (billions) | | | $36 | | | | $18 | |
Weighted Average Market Capitalization (billions) | | | $114 | | | | $125 | |
Price-to-Earnings Ratio(b) | | | 14.2x | | | | 15.6x | |
Foreign Securities not in the S&P 500(c) | | | 15.5% | | | | 0.0% | |
| | | | |
| TEN LARGEST HOLDINGS(d) | | Fund | |
Hewlett-Packard Co. | | | 4.1 | % |
Capital One Financial Corp. | | | 4.0 | |
Wells Fargo & Co. | | | 4.0 | |
Microsoft Corp. | | | 3.6 | |
Novartis AG (Switzerland) | | | 3.4 | |
Comcast Corp. | | | 3.1 | |
Schlumberger, Ltd. | | | 2.7 | |
Time Warner, Inc. | | | 2.7 | |
Bank of New York Mellon Corp. | | | 2.6 | |
Charles Schwab Corp. | | | 2.5 | |

| | | | | | | | |
| SECTOR DIVERSIFICATION | | Fund | | | S&P 500 | |
Financials | | | 23.1 | % | | | 16.1 | % |
Information Technology | | | 22.7 | | | | 18.8 | |
Health Care | | | 18.6 | | | | 13.3 | |
Consumer Discretionary | | | 14.3 | | | | 12.0 | |
Energy | | | 9.5 | | | | 10.9 | |
Industrials | | | 6.3 | | | | 10.5 | |
Consumer Staples | | | 2.5 | | | | 9.5 | |
Materials | | | 1.9 | | | | 3.4 | |
Telecommunication Services | | | 0.3 | | | | 2.4 | |
Utilities | | | 0.0 | | | | 3.1 | |
| (a) | SEC Yield is an annualization of the Fund’s total net investment income per share for the 30-day period ended on the last day of the month. |
| (b) | Price-to-earnings (P/E) ratios are calculated using 12-month forward earnings estimates from third-party sources. |
| (c) | Foreign stocks are U.S. dollar denominated. |
| (d) | The Fund’s portfolio holdings are subject to change without notice. The mention of specific securities is not a recommendation to buy, sell, or hold any particular security and is not indicative of Dodge & Cox’s current or future trading activity. |
PAGE 5 § DODGE & COX STOCK FUND
| | | | |
| PORTFOLIO OF INVESTMENTS (unaudited) | | | June 30, 2014 | |
| | | | | | | | |
| COMMON STOCKS: 99.2% | |
| | |
| | | SHARES | | | VALUE | |
| CONSUMER DISCRETIONARY: 14.3% | |
CONSUMER DURABLES & APPAREL: 1.3% | | | | | |
Coach, Inc. | | | 10,424,200 | | | $ | 356,403,398 | |
NVR, Inc.(a) | | | 79,700 | | | | 91,702,820 | |
Panasonic Corp. ADR(b) (Japan) | | | 23,861,597 | | | | 290,634,251 | |
| | | | | | | | |
| | | | 738,740,469 | |
MEDIA: 10.9% | |
Comcast Corp., Class A | | | 33,212,397 | | | | 1,782,841,471 | |
DISH Network Corp., Class A(a) | | | 6,587,549 | | | | 428,717,689 | |
News Corp., Class A(a) | | | 6,392,306 | | | | 114,677,969 | |
Time Warner Cable, Inc. | | | 9,284,910 | | | | 1,367,667,243 | |
Time Warner, Inc. | | | 22,430,732 | | | | 1,575,758,923 | |
Time, Inc.(a) | | | 4,803,841 | | | | 116,349,029 | |
Twenty-First Century Fox, Inc. | | | 28,508,826 | | | | 1,002,085,234 | |
| | | | | | | | |
| | | | 6,388,097,558 | |
RETAILING: 2.1% | |
CarMax, Inc.(a) | | | 4,874,350 | | | | 253,514,944 | |
Liberty Interactive, Series A(a) | | | 13,743,075 | | | | 403,496,682 | |
Target Corp. | | | 10,050,000 | | | | 582,397,500 | |
| | | | | | | | |
| | | | 1,239,409,126 | |
| | | | | | | | |
| | | | 8,366,247,153 | |
| CONSUMER STAPLES: 2.5% | |
FOOD & STAPLES RETAILING: 2.1% | |
Wal-Mart Stores, Inc. | | | 16,465,150 | | | | 1,236,038,811 | |
|
FOOD, BEVERAGE & TOBACCO: 0.4% | |
Unilever PLC ADR(b) (United Kingdom) | | | 5,305,500 | | | | 240,392,205 | |
| | | | | | | | |
| | | | 1,476,431,016 | |
| ENERGY: 9.5% | |
Apache Corp. | | | 10,564,428 | | | | 1,062,992,745 | |
Baker Hughes, Inc. | | | 10,223,850 | | | | 761,165,633 | |
Chevron Corp. | | | 6,559,980 | | | | 856,405,389 | |
National Oilwell Varco, Inc. | | | 8,450,000 | | | | 695,857,500 | |
Schlumberger, Ltd.(b) (Curacao/United States) | | | 13,606,645 | | | | 1,604,903,778 | |
Weatherford International PLC(a),(b) (Ireland) | | | 24,728,700 | | | | 568,760,100 | |
| | | | | | | | |
| | | | 5,550,085,145 | |
| FINANCIALS: 23.1% | |
BANKS: 9.4% | |
Bank of America Corp. | | | 84,078,900 | | | | 1,292,292,693 | |
BB&T Corp. | | | 10,362,144 | | | | 408,579,338 | |
HSBC Holdings PLC ADR(b) (United Kingdom) | | | 6,344,029 | | | | 322,276,673 | |
JPMorgan Chase & Co. | | | 13,040,900 | | | | 751,416,658 | |
SunTrust Banks, Inc. | | | 10,356,933 | | | | 414,898,736 | |
Wells Fargo & Co. | | | 44,216,341 | | | | 2,324,010,883 | |
| | | | | | | | |
| | | | 5,513,474,981 | |
| | | | | | | | |
| | |
| | | SHARES | | | VALUE | |
DIVERSIFIED FINANCIALS: 11.8% | |
Bank of New York Mellon Corp. | | | 40,793,824 | | | $ | 1,528,952,523 | |
Capital One Financial Corp.(c) | | | 28,462,711 | | | | 2,351,019,929 | |
Charles Schwab Corp. | | | 54,467,600 | | | | 1,466,812,468 | |
Goldman Sachs Group, Inc. | | | 7,490,600 | | | | 1,254,226,064 | |
McGraw Hill Financial, Inc. | | | 3,783,025 | | | | 314,104,566 | |
| | | | | | | | |
| | | | 6,915,115,550 | |
INSURANCE: 1.9% | |
AEGON NV(b) (Netherlands) | | | 66,305,587 | | | | 581,499,998 | |
MetLife, Inc. | | | 9,297,600 | | | | 516,574,656 | |
| | | | | | | | |
| | | | 1,098,074,654 | |
| | | | | | | | |
| | | | 13,526,665,185 | |
| HEALTH CARE: 18.6% | |
HEALTH CARE EQUIPMENT & SERVICES: 4.5% | |
Boston Scientific Corp.(a) | | | 26,998,600 | | | | 344,772,122 | |
Cigna Corp. | | | 3,907,184 | | | | 359,343,713 | |
Express Scripts Holding Co.(a) | | | 10,800,000 | | | | 748,764,000 | |
Medtronic, Inc. | | | 5,226,000 | | | | 333,209,760 | |
UnitedHealth Group, Inc. | | | 9,869,400 | | | | 806,823,450 | |
| | | | | | | | |
| | | | 2,592,913,045 | |
PHARMACEUTICALS, BIOTECHNOLOGY & LIFE SCIENCES: 14.1% | |
GlaxoSmithKline PLC ADR(b) (United Kingdom) | | | 24,435,300 | | | | 1,306,799,844 | |
Merck & Co., Inc. | | | 21,731,700 | | | | 1,257,178,845 | |
Novartis AG ADR(b) (Switzerland) | | | 21,936,900 | | | | 1,985,947,557 | |
Pfizer, Inc. | | | 30,081,264 | | | | 892,811,915 | |
Roche Holding AG ADR(b) (Switzerland) | | | 36,142,200 | | | | 1,348,104,060 | |
Sanofi ADR(b) (France) | | | 27,370,329 | | | | 1,455,280,393 | |
| | | | | | | | |
| | | | 8,246,122,614 | |
| | | | | | | | |
| | | | 10,839,035,659 | |
| INDUSTRIALS: 6.3% | |
CAPITAL GOODS: 2.4% | |
General Electric Co. | | | 41,023,675 | | | | 1,078,102,179 | |
Koninklijke Philips NV(b) (Netherlands) | | | 8,167,675 | | | | 259,405,358 | |
NOW, Inc.(a) | | | 2,112,500 | | | | 76,493,625 | |
| | | | | | | | |
| | | | 1,414,001,162 | |
COMMERCIAL & PROFESSIONAL SERVICES: 1.6% | |
ADT Corp.(c) | | | 11,942,537 | | | | 417,272,243 | |
Tyco International, Ltd.(b) (Switzerland) | | | 10,772,075 | | | | 491,206,620 | |
| | | | | | | | |
| | | | 908,478,863 | |
TRANSPORTATION: 2.3% | |
FedEx Corp. | | | 8,966,799 | | | | 1,357,394,032 | |
| | | | | | | | |
| | | | 3,679,874,057 | |
| | |
| See accompanying Notes to Financial Statements | | DODGE & COX STOCK FUND §PAGE 6 |
| | | | |
| PORTFOLIO OF INVESTMENTS (unaudited) | | | June 30, 2014 | |
| | | | | | | | |
| COMMON STOCKS (continued) | |
| | |
| | | SHARES | | | VALUE | |
| INFORMATION TECHNOLOGY: 22.7% | |
SEMICONDUCTORS & SEMICONDUCTOR EQUIPMENT: 0.7% | |
Maxim Integrated Products, Inc. | | | 12,859,440 | | | $ | 434,777,666 | |
|
SOFTWARE & SERVICES: 11.6% | |
Adobe Systems, Inc.(a) | | | 4,201,641 | | | | 304,030,743 | |
AOL, Inc.(a),(c) | | | 7,381,954 | | | | 293,727,950 | |
Cadence Design Systems, Inc.(a) | | | 11,467,600 | | | | 200,568,324 | |
Computer Sciences Corp. | | | 1,254,294 | | | | 79,271,381 | |
eBay, Inc.(a) | | | 14,346,609 | | | | 718,191,246 | |
Google, Inc., Class A(a) | | | 768,100 | | | | 449,085,027 | |
Google, Inc., Class C(a) | | | 1,538,100 | | | | 884,838,168 | |
Microsoft Corp. | | | 50,892,700 | | | | 2,122,225,590 | |
Symantec Corp.(c) | | | 51,653,700 | | | | 1,182,869,730 | |
Synopsys, Inc.(a),(c) | | | 14,022,569 | | | | 544,356,128 | |
| | | | | | | | |
| | | | 6,779,164,287 | |
TECHNOLOGY, HARDWARE & EQUIPMENT: 10.4% | |
Corning, Inc. | | | 34,626,400 | | | | 760,049,480 | |
EMC Corp. | | | 24,200,000 | | | | 637,428,000 | |
Hewlett-Packard Co. | | | 71,835,395 | | | | 2,419,416,104 | |
NetApp, Inc.(c) | | | 18,626,700 | | | | 680,247,084 | |
Nokia Corp. ADR(b) (Finland) | | | 96,379,400 | | | | 728,628,264 | |
TE Connectivity, Ltd.(b) (Switzerland) | | | 13,313,875 | | | | 823,330,030 | |
| | | | | | | | |
| | | | 6,049,098,962 | |
| | | | | | | | |
| | | | 13,263,040,915 | |
| MATERIALS: 1.9% | |
Celanese Corp., Series A(c) | | | 9,317,071 | | | | 598,901,324 | |
Dow Chemical Co. | | | 5,945,389 | | | | 305,949,718 | |
Vulcan Materials Co. | | | 2,881,115 | | | | 183,671,081 | |
| | | | | | | | |
| | | | 1,088,522,123 | |
| TELECOMMUNICATION SERVICES: 0.3% | |
Sprint Corp.(a) | | | 21,932,896 | | | | 187,087,603 | |
| | | | | | | | |
| |
TOTAL COMMON STOCKS
(Cost $39,317,938,638) | | | $ | 57,976,988,856 | |
| | | | | | | | |
| SHORT-TERM INVESTMENTS: 0.7% | |
| | |
| | | PAR VALUE | | | VALUE | |
MONEY MARKET FUND: 0.2% | |
SSgA U.S. Treasury Money
Market Fund | | $ | 116,890,314 | | | $ | 116,890,314 | |
|
REPURCHASE AGREEMENT: 0.5% | |
Fixed Income Clearing Corporation(d) 0.00%, dated 6/30/14, due 7/1/14, maturity value $288,622,592 | | | 288,622,592 | | | | 288,622,592 | |
| | | | | | | | |
TOTAL SHORT-TERM INVESTMENTS
(Cost $405,512,906) | | | $ | 405,512,906 | |
| | | | | | | | |
TOTAL INVESTMENTS
(Cost $39,723,451,544) | | | 99.9 | % | | $ | 58,382,501,762 | |
OTHER ASSETS LESS LIABILITIES | | | 0.1 | % | | | 66,340,406 | |
| | | | | | | | |
| NET ASSETS | | | 100.0 | % | | $ | 58,448,842,168 | |
| | | | | | | | |
| (b) | Security denominated in U.S. dollars |
| (c) | See Note 8 regarding holdings of 5% voting securities |
| (d) | Repurchase agreement is collateralized by U.S. Treasury Note 1.000%-1.625%, 2/28/19-6/30/19. Total collateral value is $294,398,525. |
In determining a company’s country designation, the Fund generally references the country of incorporation. In cases where the Fund considers the country of incorporation to be a “jurisdiction of convenience” chosen primarily for tax purposes, the Fund uses the country designation of an appropriate broad-based market index. In that circumstance, two countries are listed - the country of incorporation and the country designated by an appropriate index, respectively.
ADR: American Depositary Receipt
| | |
| PAGE 7 § DODGE & COX STOCK FUND | | See accompanying Notes to Financial Statements |
| | | | |
STATEMENT OF ASSETS AND LIABILITIES (unaudited) | |
| |
| | | June 30, 2014 | |
ASSETS: | | | | |
Investments, at value | | | | |
Unaffiliated issuers (cost $36,751,818,131) | | $ | 54,665,127,303 | |
Affiliated issuers (cost $2,971,633,413) | | | 3,717,374,459 | |
| | | | |
| | | 58,382,501,762 | |
Receivable for investments sold | | | 9,928,556 | |
Receivable for Fund shares sold | | | 47,427,870 | |
Dividends and interest receivable | | | 110,882,197 | |
Prepaid expenses and other assets | | | 180,125 | |
| | | | |
| | | 58,550,920,510 | |
| | | | |
LIABILITIES: | | | | |
Payable for investments purchased | | | 3,927,203 | |
Payable for Fund shares redeemed | | | 72,907,057 | |
Management fees payable | | | 23,694,003 | |
Accrued expenses | | | 1,550,079 | |
| | | | |
| | | 102,078,342 | |
| | | | |
NET ASSETS | | $ | 58,448,842,168 | |
| | | | |
NET ASSETS CONSIST OF: | | | | |
Paid in capital | | $ | 38,863,549,070 | |
Undistributed net investment income | | | 8,987,731 | |
Undistributed net realized gain | | | 917,255,149 | |
Net unrealized appreciation | | | 18,659,050,218 | |
| | | | |
| | $ | 58,448,842,168 | |
| | | | |
Fund shares outstanding (par value $0.01 each, unlimited shares authorized) | | | 327,028,293 | |
Net asset value per share | | $ | 178.73 | |
|
STATEMENT OF OPERATIONS
(unaudited) | |
| | | Six Months Ended June 30, 2014 | |
INVESTMENT INCOME: | | | | |
Dividends (net of foreign taxes of $29,669,786) | | | | |
Unaffiliated issuers | | $ | 720,049,981 | |
Affiliated issuers | | | 46,091,423 | |
Interest | | | 438 | |
| | | | |
| | | 766,141,842 | |
| | | | |
EXPENSES: | | | | |
Management fees | | | 136,832,396 | |
Custody and fund accounting fees | | | 628,370 | |
Transfer agent fees | | | 1,851,234 | |
Professional services | | | 97,017 | |
Shareholder reports | | | 2,799,840 | |
Registration fees | | | 217,508 | |
Trustees’ fees | | | 139,442 | |
Miscellaneous | | | 1,636,035 | |
| | | | |
| | | 144,201,842 | |
| | | | |
NET INVESTMENT INCOME | | | 621,940,000 | |
| | | | |
REALIZED AND UNREALIZED GAIN: | | | | |
Net realized gain | | | | |
Unaffiliated issuers | | | 1,331,302,852 | |
Affiliated issuers | | | 42,608,262 | |
Net change in unrealized appreciation/depreciation | | | 1,824,811,068 | |
| | | | |
Net realized and unrealized gain | | | 3,198,722,182 | |
| | | | |
NET INCREASE IN NET ASSETS FROM OPERATIONS | | $ | 3,820,662,182 | |
| | | | |
| | | | | | | | |
STATEMENT OF CHANGES IN NET ASSETS (unaudited) | |
| | |
| | | Six Months Ended June 30, 2014 | | | Year Ended
December 31, 2013 | |
OPERATIONS: | | | | | | | | |
Net investment income | | $ | 621,940,000 | | | $ | 691,471,816 | |
Net realized gain | | | 1,373,911,114 | | | | 2,942,196,702 | |
Net change in unrealized appreciation/depreciation | | | 1,824,811,068 | | | | 12,466,351,142 | |
| | | | | | | | |
| | | 3,820,662,182 | | | | 16,100,019,660 | |
| | | | | | | | |
| | |
DISTRIBUTIONS TO SHAREHOLDERS FROM: | | | | | | | | |
Net investment income | | | (620,954,392 | ) | | | (688,649,453 | ) |
Net realized gain | | | – | | | | — | |
| | | | | | | | |
Total distributions | | | (620,954,392 | ) | | | (688,649,453 | ) |
| | | | | | | | |
| | |
FUND SHARE TRANSACTIONS: | | | | | | | | |
Proceeds from sale of shares | | | 4,486,274,743 | | | | 7,505,695,700 | |
Reinvestment of distributions | | | 569,757,965 | | | | 638,450,488 | |
Cost of shares redeemed | | | (4,654,413,862 | ) | | | (8,549,348,435 | ) |
| | | | | | | | |
Net increase/(decrease) from Fund share transactions | | | 401,618,846 | | | | (405,202,247 | ) |
| | | | | | | | |
Total increase in net assets | | | 3,601,326,636 | | | | 15,006,167,960 | |
| | |
NET ASSETS: | | | | | | | | |
Beginning of period | | | 54,847,515,532 | | | | 39,841,347,572 | |
| | | | | | | | |
End of period (including undistributed net investment income of $8,987,731 and $8,002,123, respectively) | | $ | 58,448,842,168 | | | $ | 54,847,515,532 | |
| | | | | | | | |
| | |
SHARE INFORMATION: | | | | | | | | |
Shares sold | | | 26,367,125 | | | | 52,247,087 | |
Distributions reinvested | | | 3,294,318 | | | | 4,391,872 | |
Shares redeemed | | | (27,426,639 | ) | | | (58,685,059 | ) |
| | | | | | | | |
Net increase/(decrease) in shares outstanding | | | 2,234,804 | | | | (2,046,100 | ) |
| | | | | | | | |
| | |
| See accompanying Notes to Financial Statements | | DODGE & COX STOCK FUND §PAGE 8 |
NOTES TO FINANCIAL STATEMENTS (unaudited)
NOTE 1—ORGANIZATION AND SIGNIFICANT ACCOUNTING POLICIES
Dodge & Cox Stock Fund (the “Fund”) is one of the series constituting the Dodge & Cox Funds (the “Trust” or the “Funds”). The Trust is organized as a Delaware statutory trust and is registered under the Investment Company Act of 1940, as amended, as an open-end management investment company. The Fund commenced operations on January 4, 1965, and seeks long-term growth of principal and income. Risk considerations and investment strategies of the Fund are discussed in the Fund’s Prospectus.
The financial statements have been prepared in conformity with accounting principles generally accepted in the United States of America, which require the use of estimates and assumptions by management. Actual results may differ from those estimates. Significant accounting policies are as follows:
Security valuation The Fund’s net assets are valued as of the close of trading on the New York Stock Exchange (NYSE), generally 4:00 p.m. Eastern Time, each day that the NYSE is open for business. Portfolio securities and other financial instruments for which market quotes are readily available are valued at market value. Listed securities are generally valued using the official quoted close price or the last sale on the exchange that is determined to be the primary market for the security. Security values are not discounted based on the size of the Fund’s position. Securities for which market quotations are not readily available are valued at fair value as determined in good faith by or under the direction of the Board of Trustees. Short-term securities less than 60 days to maturity may be valued at amortized cost if amortized cost approximates current value. All securities held by the Fund are denominated in U.S. dollars.
The Board of Trustees has delegated authority to Dodge & Cox, the Fund’s investment manager, to make fair value determinations in accordance with the Dodge & Cox Funds Valuation Policies (“Valuation Policies”), subject to Board oversight. Dodge & Cox has established a Pricing Committee that is comprised of representatives from Treasury, Legal, Compliance, and Operations. The Pricing Committee is responsible for implementing the Valuation Policies, including determining the fair value of
securities when market quotations or market-based valuations are not readily available or are deemed unreliable. The Pricing Committee considers relevant indications of value that are reasonably available to it in determining the fair value assigned to a particular security, such as the value of similar financial instruments, trading volumes, contractual restrictions on disposition, related corporate actions, and changes in economic conditions.
Valuing securities at fair value involves greater reliance on judgment than valuation of securities based on readily available market quotations. In some instances, lack of information and uncertainty as to the significance of information may lead to a conclusion that a prior valuation is the best indication of a security’s present value. When fair value pricing is employed, the prices of securities used by the Fund to calculate its net asset value may differ from quoted or published prices for the same securities.
Security transactions, investment income, expenses, and distributions Security transactions are recorded on the trade date. Realized gains and losses on securities sold are determined on the basis of identified cost.
Dividend income and corporate action transactions are recorded on the ex-dividend date, or when the Fund first learns of the dividend/corporate action if the ex-dividend date has passed. Withholding taxes on foreign dividends have been provided for in accordance with the Fund’s understanding of the applicable country’s tax rules and rates. Non-cash dividends included in dividend income, if any, are recorded at the fair market value of the securities received. Dividends characterized as return of capital for U.S. tax purposes are recorded as a reduction of cost of investments and/or realized gain. Interest income is recorded on the accrual basis.
Expenses are recorded on the accrual basis. Most expenses of the Trust can be directly attributed to a specific series. Expenses which cannot be directly attributed are allocated among the Funds in the Trust based on relative net assets or other expense methodologies determined by the nature of the expense.
Distributions to shareholders are recorded on the ex-dividend date.
PAGE 9 § DODGE & COX STOCK FUND
NOTES TO FINANCIAL STATEMENTS (unaudited)
Repurchase agreements The Fund enters into repurchase agreements, secured by U.S. government or agency securities, which involve the purchase of securities from a counterparty with a simultaneous commitment to resell the securities at an agreed-upon date and price. It is the Fund’s policy that its custodian take possession of the underlying collateral securities, the fair value of which exceeds the principal amount of the repurchase transaction, including accrued interest, at all times. In the event of default by the counterparty, the Fund has the contractual right to liquidate the collateral securities and to apply the proceeds in satisfaction of the obligation.
Indemnification Under the Trust’s organizational documents, its officers and trustees are indemnified against certain liabilities arising out of the performance of their duties to the Trust. In addition, in the normal course of business the Trust enters into contracts that provide general indemnities to other parties. The Trust’s maximum exposure under these arrangements is unknown as this would involve future claims that may be made against the Trust that have not yet occurred.
NOTE 2—VALUATION MEASUREMENTS
Various inputs are used in determining the value of the Fund’s investments. These inputs are summarized in the three broad levels listed below.
| § | | Level 1: Quoted prices in active markets for identical securities |
| § | | Level 2: Other significant observable inputs (including quoted prices for similar securities, market indices, interest rates, credit risk, etc.) |
| § | | Level 3: Significant unobservable inputs (including Fund management’s assumptions in determining the fair value of investments) |
The inputs or methodology used for valuing securities are not necessarily an indication of the risk associated with investing in those securities.
The following is a summary of the inputs used to value the Fund’s holdings at June 30, 2014:
| | | | | | | | |
| Security Classification(a) | | LEVEL 1
(Quoted Prices) | | | LEVEL 2
(Other Significant
Observable Inputs) | |
Common Stocks(b) | | $ | 57,976,988,856 | | | $ | — | |
Short-term Investments | | | | | | | | |
Money Market Fund | | | 116,890,314 | | | | — | |
Repurchase Agreement | | | — | | | | 288,622,592 | |
| | | | | | | | |
Total | | $ | 58,093,879,170 | | | $ | 288,622,592 | |
| | | | | | | | |
| | | | | | | | | |
| (a) | There were no transfers between Level 1 and Level 2 during the six months ended June 30, 2014. There were no Level 3 securities at June 30, 2014 and December 31, 2013, and there were no transfers to Level 3 during the period. |
| (b) | All common stocks held in the Fund are Level 1 securities. For a detailed break-out of common stocks by major industry classification, please refer to the Portfolio of Investments. |
NOTE 3—RELATED PARTY TRANSACTIONS
Management fees Under a written agreement approved by a unanimous vote of the Board of Trustees, the Fund pays an annual management fee of 0.50% of the Fund’s average daily net assets to Dodge & Cox, investment manager of the Fund. The agreement further provides that Dodge & Cox shall waive its fee to the extent that such fee plus all other ordinary operating expenses of the Fund exceed 0.75% of the average daily net assets for the year.
Fund officers and trustees All officers and two of the trustees of the Trust are officers or employees of Dodge & Cox. The Trust pays a fee only to those trustees who are not affiliated with Dodge & Cox.
NOTE 4—INCOME TAX INFORMATION AND DISTRIBUTIONS TO SHAREHOLDERS
A provision for federal income taxes is not required since the Fund intends to continue to qualify as a regulated investment company under Subchapter M of the Internal Revenue Code and distribute all of its taxable income to shareholders. Distributions are determined in accordance with income tax regulations, and such amounts may differ from net investment income and realized gains for financial reporting purposes. Financial reporting records are adjusted for permanent book/tax differences at year end to reflect tax character.
DODGE & COX STOCK FUND §PAGE 10
NOTES TO FINANCIAL STATEMENTS (unaudited)
Book/tax differences are primarily due to differing treatments of wash sales, in-kind redemptions, and net short-term realized gain (loss). During the period, the Fund recognized net realized gains of $286,884,947 from the delivery of appreciated securities in an in-kind redemption transaction. For federal income tax purposes, this gain is not recognized as taxable income to the Fund and therefore will not be distributed to shareholders. At June 30, 2014, the cost of investments for federal income tax purposes was $39,739,481,281.
Distributions during the periods noted below were characterized as follows for federal income tax purposes:
| | | | | | |
| | | Six Months Ended June 30, 2014 | | Year Ended
December 31, 2013 | |
Ordinary income | | $620,954,392 | | | $688,649,453 | |
| | ($1.920 per share) | | | ($2.105 per share) | |
| | |
Long-term capital gain | | — | | | — | |
At June 30, 2014, the tax basis components of distributable earnings were as follows:
| | | | |
Unrealized appreciation | | $ | 19,412,897,623 | |
Unrealized depreciation | | | (769,877,142 | ) |
| | | | |
Net unrealized appreciation | | | 18,643,020,481 | |
Undistributed ordinary income | | | 8,987,731 | |
Accumulated capital gain(a) | | | 1,087,026,166 | |
Capital loss carryforward(b) | | | (440,626,227 | ) |
| (a) | Represents capital gain realized for tax purposes during the period January 1, 2014 to June 30, 2014. |
| (b) | Represents accumulated capital loss as of December 31, 2013, which may be carried forward to offset future capital gains. During 2013, the Fund utilized $2,791,744,593 of the capital loss carryforward. If not utilized, the remaining capital loss carryforward will expire in 2017. |
Under the Regulated Investment Company Modernization Act of 2010, capital losses incurred by the Fund after January 1, 2011, are not subject to expiration. In addition, such losses must be utilized prior to the losses incurred in the years preceding enactment.
Fund management has reviewed the tax positions for open periods (three years and four years, respectively, from filing the Fund’s Federal and State tax returns) as applicable to the Fund, and has determined that no provision for income tax is required in the Fund’s financial statements.
NOTE 5—LOAN FACILITIES
Pursuant to an exemptive order issued by the Securities and Exchange Commission (SEC), the Fund may participate in an interfund lending facility (Facility). The Facility allows the Fund to borrow money from or loan money to the Funds. Loans under the Facility are made for temporary or emergency purposes, such as to fund shareholder redemption requests. Interest on borrowings is the average of the current repurchase agreement rate and the bank loan rate. There was no activity in the Facility during the period.
All Funds in the Trust participate in a $500 million committed credit facility (Line of Credit) with State Street Bank and Trust Company, to be utilized for temporary or emergency purposes to fund shareholder redemptions or for other short-term liquidity purposes. The maximum amount available to the Fund is $250 million. Each Fund pays an annual commitment fee on its pro-rata portion of the Line of Credit. The Fund’s commitment fee for the six months ended June 30, 2014, amounted to $80,585 and is reflected as a Miscellaneous Expense in the Statement of Operations. Interest on borrowings is charged at the prevailing rate. There were no borrowings on the Line of Credit during the period.
NOTE 6—PURCHASES AND SALES OF INVESTMENTS
For the six months ended June 30, 2014, purchases and sales of securities, other than short-term securities, aggregated $5,697,747,715 and $4,862,413,754, respectively.
NOTE 7—SUBSEQUENT EVENTS
Fund management has determined that no material events or transactions occurred subsequent to June 30, 2014, and through the date of the Fund’s financial statements issuance, which require additional disclosure in the Fund’s financial statements.
PAGE 11 § DODGE & COX STOCK FUND
NOTES TO FINANCIAL STATEMENTS (unaudited)
NOTE 8—HOLDINGS OF 5% VOTING SECURITIES
Each of the companies listed below was considered to be an affiliate of the Fund because the Fund owned 5% or more of the company’s voting securities during all or part of the six months ended June 30, 2014. Purchase and sale transactions and dividend income earned during the period on these securities were as follows:
| | | | | | | | | | | | | | | | | | | | | | | | |
| | | Shares at
Beginning of Period | | | Additions | | | Reductions | | | Shares at
End of Period | | | Dividend
Income(a) | | | Value at
End of Period | |
ADT Corp. | | | 12,073,537 | | | | — | | | | (131,000 | ) | | | 11,942,537 | | | | 4,777,015 | | | | 417,272,243 | |
AOL, Inc. | | | 5,997,054 | | | | 1,550,000 | | | | (165,100 | ) | | | 7,381,954 | | | | — | (b) | | | 293,727,950 | |
Capital One Financial Corp. | | | 28,876,111 | | | | — | | | | (413,400 | ) | | | 28,462,711 | | | | 17,077,627 | | | | — | (c) |
Celanese Corp., Series A | | | 9,419,271 | | | | — | | | | (102,200 | ) | | | 9,317,071 | | | | 4,006,341 | | | | 598,901,324 | |
NetApp, Inc. | | | 14,635,500 | | | | 4,150,000 | | | | (158,800 | ) | | | 18,626,700 | | | | 4,809,330 | | | | 680,247,084 | |
Symantec Corp. | | | 50,304,000 | | | | 1,900,000 | | | | (550,300 | ) | | | 51,653,700 | | | | 15,421,110 | | | | 1,182,869,730 | |
Synopsys, Inc. | | | 13,596,636 | | | | 579,733 | | | | (153,800 | ) | | | 14,022,569 | | | | — | (b) | | | 544,356,128 | |
| | | | | | | | | | | | | | | | | | | | | | | | |
| | | | | | | | | | | | | | | | | | $ | 46,091,423 | | | $ | 3,717,374,459 | |
| | | | | | | | | | | | | | | | | | | | | | | | |
| | | | | | | | | | | | | | | | | | | | | | | | | |
| (a) | Net of foreign taxes, if any |
| (c) | Company was not an affiliate at period end |
FINANCIAL HIGHLIGHTS
| | | | | | | | | | | | | | | | | | | | | | | | |
SELECTED DATA AND RATIOS (for a share outstanding throughout each period) | | Six Months
Ended June 30, | | | Year Ended December 31, | |
| | | 2014 (a) | | | 2013 | | | 2012 | | | 2011 | | | 2010 | | | 2009 | |
| | | | | | | | |
Net asset value, beginning of period | | | $168.87 | | | | $121.90 | | | | $101.64 | | | | $107.76 | | | | $96.14 | | | | $74.37 | |
Income from investment operations: | | | | | | | | | | | | | | | | | | | | | | | | |
Net investment income | | | 1.92 | | | | 2.11 | | | | 1.98 | | | | 1.76 | | | | 1.23 | | | | 1.15 | |
Net realized and unrealized gain (loss) | | | 9.86 | | | | 46.97 | | | | 20.26 | | | | (6.13 | ) | | | 11.62 | | | | 21.82 | |
| | | | | | | | |
Total from investment operations | | | 11.78 | | | | 49.08 | | | | 22.24 | | | | (4.37 | ) | | | 12.85 | | | | 22.97 | |
| | | | | | | | |
Distributions to shareholders from: | | | | | | | | | | | | | | | | | | | | | | | | |
Net investment income | | | (1.92 | ) | | | (2.11 | ) | | | (1.98 | ) | | | (1.75 | ) | | | (1.23 | ) | | | (1.20 | ) |
Net realized gain | | | — | | | | — | | | | — | | | | — | | | | — | | | | — | |
| | | | | | | | |
Total distributions | | | (1.92 | ) | | | (2.11 | ) | | | (1.98 | ) | | | (1.75 | ) | | | (1.23 | ) | | | (1.20 | ) |
| | | | | | | | |
Net asset value, end of period | | | $178.73 | | | | $168.87 | | | | $121.90 | | | | $101.64 | | | | $107.76 | | | | $96.14 | |
| | | | | | | | |
Total return | | | 7.02 | % | | | 40.55 | % | | | 22.01 | % | | | (4.08 | )% | | | 13.48 | % | | | 31.27 | % |
Ratios/supplemental data: | | | | | | | | | | | | | | | | | | | | | | | | |
Net assets, end of period (millions) | | | $58,449 | | | | $54,848 | | | | $39,841 | | | | $36,562 | | | | $43,038 | | | | $39,991 | |
Ratio of expenses to average net assets | | | 0.53 | %(b) | | | 0.52 | % | | | 0.52 | % | | | 0.52 | % | | | 0.52 | % | | | 0.52 | % |
Ratio of net investment income to average net assets | | | 2.27 | %(b) | | | 1.45 | % | | | 1.72 | % | | | 1.62 | % | | | 1.25 | % | | | 1.42 | % |
Portfolio turnover rate | | | 7 | % | | | 15 | % | | | 11 | % | | | 16 | % | | | 12 | % | | | 18 | % |
See accompanying Notes to Financial Statements
DODGE & COX STOCK FUND §PAGE 12
SHAREHOLDER MEETING RESULTS (unaudited)
A special meeting of shareholders was held on April 23, 2014. At the meeting, proposals to elect Trustees to the Board of Trustees and to amend the Fund’s fundamental investment restrictions listed below were approved. The following is a report of the total votes cast by the Trust’s and the Fund’s shareholders.
| | | | | | | | | | | | | | |
| PROPOSAL | | | | AFFIRMATIVE | | | WITHHOLD | | | TOTAL | |
1 Elect Trustees to the Board of Trustees: | | | | | | | | | | | | | | |
| | | | |
| | Dana M. Emery | | | 2,724,363,325 | | | | 37,845,024 | | | | 2,762,208,349 | |
| | | | |
| | Charles F. Pohl | | | 2,724,265,808 | | | | 37,942,541 | | | | 2,762,208,349 | |
| | | | |
| | Thomas A. Larsen | | | 2,723,251,516 | | | | 38,956,833 | | | | 2,762,208,349 | |
| | | | |
| | Ann Mather | | | 2,696,172,728 | | | | 66,035,621 | | | | 2,762,208,349 | |
| | | | |
| | Robert B. Morris III | | | 2,722,376,906 | | | | 39,831,443 | | | | 2,762,208,349 | |
| | | | |
| | Gary Roughead | | | 2,721,551,032 | | | | 40,657,317 | | | | 2,762,208,349 | |
| | | | |
| | Mark E. Smith | | | 2,723,441,491 | | | | 38,766,858 | | | | 2,762,208,349 | |
| | | | |
| | John B. Taylor | | | 2,722,862,534 | | | | 39,345,815 | | | | 2,762,208,349 | |
| | | | | | | | | | | | | | | | | | | | |
| PROPOSAL | | AFFIRMATIVE | | | AGAINST | | | ABSTAIN | | | BROKER NON-VOTE | | | TOTAL | |
2 To remove the Fund’s fundamental investment restriction with respect to investing in any company for the purpose of exercising control or management. | | | 146,007,769 | | | | 9,131,886 | | | | 2,924,469 | | | | 22,526,075 | | | | 180,590,199 | |
| | | | | |
3 To remove the Fund’s fundamental investment restriction with respect to purchasing securities on margin and short selling. | | | 139,236,165 | | | | 15,825,412 | | | | 3,002,547 | | | | 22,526,075 | | | | 180,590,199 | |
| | | | | |
4 To remove the Fund’s fundamental investment restriction with respect to investments in securities that are illiquid and replace it with a uniform non-fundamental policy for all Funds. | | | 145,009,433 | | | | 9,880,686 | | | | 3,174,005 | | | | 22,526,075 | | | | 180,590,199 | |
| | | | | |
6 To amend the Fund’s fundamental investment restriction with respect to underwriting securities of other issuers. | | | 144,849,576 | | | | 9,943,566 | | | | 3,270,981 | | | | 22,526,075 | | | | 180,590,199 | |
PAGE 13 § DODGE & COX STOCK FUND
FUND HOLDINGS
The Fund provides a complete list of its holdings four times each fiscal year, as of the end of each quarter. The Fund files the lists with the Securities and Exchange Commission (SEC) on Form N-CSR (second and fourth quarters) and Form N-Q (first and third quarters). Shareholders may view the Fund’s Forms N-CSR and N-Q on the SEC’s website at www.sec.gov. Forms N-CSR and N-Q may also be reviewed and copied at the SEC’s Public Reference Room in Washington, DC. Information regarding the operations of the Public Reference Room may be obtained by calling 202-942-8090 (direct) or 800-732-0330 (general SEC number). A list of the Fund’s quarter-end holdings is also available at www.dodgeandcox.com on or about 15 days following each quarter end and remains available on the website until the list is updated in the subsequent quarter.
PROXY VOTING
For a free copy of the Fund’s proxy voting policies and procedures, please call 800-621-3979, visit the Fund’s website at www.dodgeandcox.com, or visit the SEC’s website at www.sec.gov. Information regarding how the Fund voted proxies relating to portfolio securities during the most recent 12-month period ending June 30 is also available at www.dodgeandcox.com or at www.sec.gov.
HOUSEHOLD MAILINGS
The Fund routinely mails shareholder reports and summary prospectuses to shareholders and, on occasion, proxy statements. In order to reduce the volume of mail, when possible, only one copy of these documents will be sent to shareholders who are part of the same family and share the same residential address.
If you have a direct account with the Funds and you do not want the mailing of shareholder reports and summary prospectuses combined with other members in your household, contact the Funds at 800-621-3979. Your request will be implemented within 30 days.
DODGE & COX STOCK FUND §PAGE 14
TRUSTEES AND EXECUTIVE OFFICERS
Charles F. Pohl, Chairman and Trustee
Chairman and Chief Investment Officer, Dodge & Cox
Dana M. Emery, President and Trustee
Chief Executive Officer, President, and Director of Fixed Income, Dodge & Cox
Thomas A. Larsen, Independent Trustee
Senior Counsel, Arnold & Porter LLP
Ann Mather, Independent Trustee
Former Executive Vice President, Chief Financial Officer, and Company Secretary of Pixar Studios
Robert B. Morris III, Independent Trustee
Former Partner and Managing Director of Global Research at Goldman Sachs & Co.
Gary Roughead, Independent Trustee
Annenberg Distinguished Visiting Fellow, Hoover Institution
Mark E. Smith, Independent Trustee
Former Executive Vice President, Managing Director - Fixed Income at Loomis Sayles & Company, L.P.
John B. Taylor, Independent Trustee
Professor of Economics, Stanford University; Senior Fellow, Hoover Institute and former Under Secretary for International Affairs, United States Treasury
John A. Gunn, Senior Vice President
Former Chairman and Chief Executive Officer, Dodge & Cox
Diana S. Strandberg, Senior Vice President
Senior Vice President and Director of International Equity, Dodge & Cox
David H. Longhurst, Treasurer
Vice President and Assistant Treasurer, Dodge & Cox
Thomas M. Mistele, Secretary
Chief Operating Officer, Secretary, and Senior Counsel, Dodge & Cox
Katherine M. Primas, Chief Compliance Officer
Chief Compliance Officer, Dodge & Cox
Additional information about the Trust’s Trustees and Officers is available in the Trust’s Statement of Additional Information (SAI). You can get a free copy of the SAI by visiting the Funds’ website at www.dodgeandcox.com or calling 800-621-3979.
PAGE 15 § DODGE & COX STOCK FUND
| | | | |
| | | | |
www.dodgeandcox.com
For Fund literature, transactions, and account information, please visit the Funds’ website.
or write or call:
DODGE & COX FUNDS
c/o Boston Financial Data Services
P.O. Box 8422
Boston, Massachusetts 02266-8422
(800) 621-3979
INVESTMENT MANAGER
Dodge & Cox
555 California Street, 40th Floor
San Francisco, California 94104
(415) 981-1710
This report is submitted for the general information of the shareholders of the Fund. The report is not authorized for distribution to prospective investors in the Fund unless it is accompanied by a current prospectus.
This report reflects our views, opinions, and portfolio holdings as of June 30, 2014, the end of the reporting period. Any such views are subject to change at any time based upon market or other conditions and Dodge & Cox disclaims any responsibility to update such views. These views may not be relied on as investment advice and, because investment decisions for a Dodge & Cox Fund are based on numerous factors, may not be relied on as an indication of trading intent on behalf of any Dodge & Cox Fund.
6/14 GSF SAR Printed on recycled paper
Semi-Annual Report
June 30, 2014
Global Stock
Fund
ESTABLISHED 2008
TICKER: DODWX
TO OUR SHAREHOLDERS
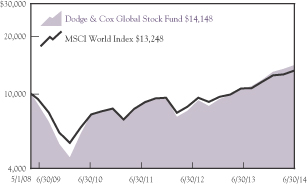
The Dodge & Cox Global Stock Fund had a total return of 8.7% for the six months ending June 30, 2014, compared to a return of 6.2% for the MSCI World Index. On June 30, the Fund had net assets of $5.4 billion with a cash position of 2.2%.
MARKET COMMENTARY
For the first half of 2014, global equity markets were strong: most developed and emerging markets appreciated in both U.S.-dollar and local currency terms. Every sector of the MSCI World generated positive returns. U.S. equity markets (up 7%) continued to rise: the quarter ended June 30 marked the S&P 500’s sixth consecutive quarter of gains. Following a slow start to the year, growth in U.S. economic activity rebounded and assuaged concerns that the economy was losing momentum. Europe (up 5% in local currency) showed encouraging signs of economic improvement in early 2014. However, manufacturing activity later slowed and economic sentiment fell amid concerns that turmoil in Iraq and an escalation of the Ukraine/Russia crisis could significantly increase oil prices and impact Eurozone growth. Japan (down 3% in local currency) was the worst performing region of the market as investors continued to weigh the efficacy of its structural reform proposals.
Emerging markets were volatile: after performing poorly in the first quarter, they rebounded and finished the six-month period up 5% in local currency. Turkey (up 19%), Indonesia (up 19%), and India (up 18%) were the region’s best performing countries; Russia (down 3%) and China (down 1%) lagged.
The U.S. dollar’s depreciation against the Japanese yen, British pound, and emerging market currencies was a tailwind to performance. While the U.S. dollar’s appreciation against the euro was a headwind, the Fund’s partial hedge of the euro reduced the negative currency impact.
INVESTMENT STRATEGY:
FINDING OPPORTUNITIES IN CONNECTIVITY
To construct the portfolio, we employ a consistent and disciplined investment approach that focuses on intensive bottom-up research, a three- to five-year investment horizon, and a strict price discipline. We seek to identify
well-established companies that have long-term earnings and cash flow prospects that are not reflected in the current valuation. While we primarily focus on company-specific factors, we also consider external factors (e.g., industry trends, impact of regulatory policies, legal backdrop) as a component of our research process. These factors are all evaluated in relation to the company’s current valuation, which helps us understand how much optimism or concern is reflected in the stock price.
Investment themes emerge from our bottom-up research. One such theme is connectivity: consumers want instant access to content and the ability to bring their digital world with them wherever they go. Companies are responding to that demand while also creating more ways for individuals to connect with each other. Around the world, cheaper, faster computing technology and improving communications networks are significantly changing the competitive landscape and fueling global consumption of media, internet, and telecommunication services. Over the long term, we believe these tectonic shifts create the potential for high growth for companies that are positioned to capitalize on the opportunities.
Due to faster economic growth, we believe media and internet consumption in emerging markets will continue to outpace that of the developed world. In developing markets, while the absolute number of internet users is large, the percentage of the total population that is using the internet remains low, which creates an attractive long-term growth opportunity. Increased demand for content and communications equipment should also impact future trends in mobile data, wireline broadband penetration, and online video consumption.
The Fund is invested in an array of reasonably valued holdings that are poised to take advantage of these global growth opportunities. Examples include media and internet companies (e.g., Naspers, Comcast, and Time Warner Cable(a)), telecom services providers (e.g., China Mobile), and network equipment providers (e.g., Ericsson), each of which is described in detail below. On June 30, 17.4% of the Fund was invested in companies driven by “connectivity,” compared to 7.5% for the MSCI World.(b)
PAGE 1 § DODGE & COX GLOBAL STOCK FUND
Naspers
Naspers, a South Africa-based media company, was one of the Fund’s largest holdings at 2.1% on June 30. The company is well positioned to benefit from changes in technology and consumer behavior through its three core businesses: satellite pay-TV distribution in Africa; internet businesses in emerging markets such as China, Russia, India, and Poland; and print media in South Africa and Brazil.
Over the past decade, Naspers’ management team has developed a track record of creating value through shrewd investments and partnerships in communication services, e-commerce, online games, and social media. For example, Naspers acquired a stake in Tencent for $32 million in 2001, which is now worth $48 billion. Tencent—the largest internet company in China (over 800 million users)—operates leading online gaming, social networking, communications, and internet portal businesses on both desktop and mobile platforms, and stands to benefit from growth in Chinese internet usage. Naspers’ internet investments also include minority stakes in Mail.Ru (Russia’s leading communications and social networking company), Flipkart (e-commerce in India), and Avito (internet classified sites in Russia), among others. While Tencent enjoys a high valuation, Naspers trades at a discount to the sum of its parts and is reasonably valued in our opinion.
Every company has risks, and Naspers is no exception. Naspers’ businesses are operationally complex and span dozens of countries, some of which are located in politically and economically unstable parts of the world. The competitive landscapes, local laws, and regulatory restrictions in these markets can change rapidly. So far, we believe Naspers’ strategy and operational control have enabled them to navigate these issues successfully and implement best practices across their portfolio of investments.
Comcast and Time Warner Cable
In the United States, the Fund has several holdings that stand to benefit from increased broadband penetration. U.S. media companies also are altering their long-term strategies, and the industry is consolidating. Two of the Fund’s Media holdings have entered into a merger agreement: in February 2014, Comcast (the largest cable
operator in the United States) agreed to acquire Time Warner Cable (the second largest) for $45 billion in stock at the time of the announcement.
What is Comcast’s rationale for the deal? Combining the companies presents significant opportunities for cost reductions, operating synergies, and enhanced revenue growth. Comcast and Time Warner Cable currently do not compete directly in any markets. If the merger is completed, Comcast will gain access to the premier New York and Los Angeles markets, and thereby have a national presence. The proposed new entity would be the dominant provider of pay-TV and wireline broadband services in the United States (reaching ~70% of U.S. households).
We believe the proposed deal could build long-term shareholder value, depending upon merger concessions. Comcast’s management team is astute and has a proven merger and acquisition track record. While they have already made deal concessions, substantial regulatory hurdles lie ahead: both the Federal Communications Commission and the Department of Justice need to approve the merger. On a standalone basis, Comcast and Time Warner Cable remain reasonably valued and were held in the Fund on June 30 with 1.2% and 2.0% positions, respectively.
China Mobile
During the second quarter of 2014, we initiated a position in China Mobile (the largest mobile telecommunications operator in China with over 60% market share and over 70% revenue share); on June 30, the holding represented 1.0% of the Fund. After following the company for years, we were presented with an opportunity to purchase China Mobile in the Fund at a historically low valuation (three times forward enterprise value to EBITDA(c)).
While the company faces intense competition, margin pressure, and regulatory uncertainty, we believe its scale, significant growth opportunities, and valuation outweigh these concerns. In the Chinese wireless telecom market, China Mobile is a leader in network size, service quality, brand recognition, and balance sheet strength. The company is poised to benefit from industry trends, which include increasing disposable income, urbanization, proliferation of low-cost smartphones, and online video consumption. Furthermore, Chinese telecommunication
DODGE & COX GLOBAL STOCK FUND §PAGE 2
services companies are currently shielded from foreign competition in their home market.
Ericsson
Over the past decade, global broadband penetration and time spent online have increased dramatically, and we believe this trend will continue. One Fund holding that stands to benefit from such demand growth is Ericsson, a 0.7% position on June 30. Ericsson has a strong presence in mobile broadband—one of the main growth drivers of connectivity. Based in Sweden, the company has developed mobile and fixed-line communication networks across the globe.
Competition is fierce and technological disruption is always a risk. However, Ericsson is well positioned to benefit from the ongoing rollout and higher utilization of next generation technology based on their share of new orders, large installed base, substantial research and development spending, and managed services operation. Ericsson has a large proportion of recurring revenue that provides some stability to earnings. Moreover, the company has a strong balance sheet, high cash flow, proactive management team with a track record of cutting costs, and reasonable valuation at 1.2 times sales.
IN CLOSING
We continue to be optimistic about the long-term opportunity for global equities as valuations remain reasonable relative to long-term averages: the MSCI World traded at 15.1 times forward earnings with a 2.4% dividend yield at quarter end. Corporate balance sheets and cash flows continue to be robust. The Fund is invested in companies that we believe have favorable long-term growth opportunities over our three- to five-year investment horizon. Acknowledging that markets can be volatile over the short term, we encourage shareholders to remain focused on the long term.
Thank you for your continued confidence in our firm. As always, we welcome your comments and questions.
For the Board of Trustees,
| | |
| |
|
Charles F. Pohl, Chairman | | Dana M. Emery, President |
July 29, 2014
| (a) | The use of specific examples does not imply that they are more attractive investments than the Fund’s other holdings. |
| (b) | Unless otherwise specified, all weightings and characteristics are as of June 30, 2014. We define “connectivity” to include Telecommunication Services, Cable & Satellite, Internet Software & Services, and Communications Equipment (including Nokia and Blackberry). |
| (c) | EBITDA: Earnings before interest, taxes, depreciation, and amortization. |
PAGE 3 § DODGE & COX GLOBAL STOCK FUND
YEAR-TO-DATE PERFORMANCE REVIEW
The Fund outperformed the MSCI World by 2.5 percentage points year to date.
Key Contributors to Relative Results
| | § | | The Fund’s holdings in the Financials sector (up 9% compared to up 4% for the MSCI World sector), especially in emerging markets, had a positive impact. Yapi Kredi (up 44% since date of purchase), ICICI Bank (up 35%), and Kasikornbank (up 33%) were particularly strong. | |
| | § | | The Fund’s holdings in the Energy sector (up 29% compared to up 14% for the MSCI World sector) contributed to results. Weatherford International (up 48%) and Schlumberger (up 32%) were notable contributors. | |
| | § | | Selected additional contributors included Telecom Italia (up 30%), Nidec (up 26%), and Hewlett-Packard (up 22%). | |
Key Detractors from Relative Results
| | § | | Relative returns in the Health Care sector (up 7% compared to up 11% for the MSCI World sector) had a negative impact. | |
| | § | | The Fund’s underweight position in the Utilities sector (no holdings versus average 3% for the MSCI World sector), the strongest sector of the market (up 16%), detracted from results. | |
| | § | | Selected additional detractors included Coach (down 38%), America Movil (down 11%), AEGON (down 6%), and Millicom International Cellular (down 6%). | |
KEY CHARACTERISTICS OF DODGE & COX
Independent Organization
Dodge & Cox is one of the largest privately owned investment managers in the world. We remain committed to independence, with a goal of providing the highest quality investment management service to our existing clients.
Over 80 Years of Investment Experience
Dodge & Cox was founded in 1930. We have a stable and well-qualified team of investment professionals, most of whom have spent their entire careers at Dodge & Cox.
Experienced Investment Team
The Global Stock Investment Policy Committee, which is the decision-making body for the Global Stock Fund, is a seven-member committee with an average tenure at Dodge & Cox of 18 years.
One Business with a Single Research Office
Dodge & Cox manages equity (domestic, international, and global), fixed income (domestic and global), and balanced investments, operating from one office in San Francisco.
Consistent Investment Approach
Our team decision-making process involves thorough, bottom-up fundamental analysis of each investment.
Long-Term Focus and Low Expenses
We invest with a three- to five-year investment horizon, which has historically resulted in low turnover relative to our peers. We manage Funds that maintain low expense ratios.
Risks: The Fund is subject to stock market risk, meaning stocks in the Fund may decline in value for extended periods due to the financial prospects of individual companies, or due to general market and economic conditions. Investing in non-U.S. securities may entail risk due to foreign economic and political developments; this risk may be increased when investing in emerging markets. The Fund is also subject to currency risk. Please read the prospectus and summary prospectus for specific details regarding the Fund’s risk profile.
DODGE & COX GLOBAL STOCK FUND §PAGE 4
GROWTH OF $10,000 SINCE INCEPTION
FOR AN INVESTMENT MADE ON MAY 1, 2008
AVERAGE ANNUAL TOTAL RETURN
FOR PERIODS ENDED JUNE 30, 2014
| | | | | | | | | | | | | | | | |
| | | 1 Year | | | 3 Years | | | 5 Years | | | Since
Inception
(5/1/08) | |
Dodge & Cox Global Stock Fund | | | 29.76 | % | | | 14.38 | % | | | 18.31 | % | | | 5.79 | % |
MSCI World Index | | | 24.05 | | | | 11.81 | | | | 14.99 | | | | 4.66 | |
Returns represent past performance and do not guarantee future results. Investment return and share price will fluctuate with market conditions, and investors may have a gain or loss when shares are sold. Fund performance changes over time and currently may be significantly lower than stated. Performance is updated and published monthly. Visit the Fund’s website at www.dodgeandcox.com or call 800-621-3979 for current performance figures.
The Fund’s total returns include the reinvestment of dividend and capital gain distributions, but have not been adjusted for any income taxes payable by shareholders on these distributions or on Fund share redemptions. Index returns include dividends but, unlike Fund returns, do not reflect fees or expenses. The MSCI World Index is a broad-based, unmanaged equity market index aggregated from 23 developed market country indices, including the United States. MSCI makes no express or implied warranties or representations and shall have no liability whatsoever with respect to any MSCI data contained herein. The MSCI data may not be further redistributed or used as a basis for other indices or any securities or financial products. This report is not approved, reviewed, or produced by MSCI.
MSCI World is a service mark of MSCI Barra.
FUND EXPENSE EXAMPLE
As a Fund shareholder, you incur ongoing Fund costs, including management fees and other Fund expenses. All mutual funds have ongoing costs, sometimes referred to as operating expenses. The following example shows ongoing costs of investing in the Fund and can help you understand these costs and compare them with those of other mutual funds. The example assumes a $1,000 investment held for the six months indicated.
ACTUAL EXPENSES
The first line of the table below provides information about actual account values and expenses based on the Fund’s actual returns. You may use the information in this line, together with your account balance, to estimate the expenses that you paid over the period. Simply divide your account value by $1,000 (for example, an $8,600 account value divided by $1,000 = 8.6), then multiply the result by the number in the first line under the heading “Expenses Paid During Period” to estimate the expenses you paid on your account during this period.
HYPOTHETICAL EXAMPLE FOR COMPARISON WITH OTHER MUTUAL FUNDS
Information on the second line of the table can help you compare ongoing costs of investing in the Fund with those of other mutual funds. This information may not be used to estimate the actual ending account balance or expenses you paid during the period. The hypothetical “Ending Account Value” is based on the actual expense ratio of the Fund and an assumed 5% annual rate of return before expenses (not the Fund’s actual return). The amount under the heading “Expense Paid During the Period” shows the hypothetical expenses your account would have incurred under this scenario. You can compare this figure with the 5% hypothetical examples that appear in shareholder reports of other mutual funds.
| | | | | | | | | | | | |
Six Months Ended June 30, 2014 | | Beginning Account Value
1/1/2014 | | | Ending Account Value
6/30/2014 | | | Expenses Paid During Period* | |
Based on Actual Fund Return | | $ | 1,000.00 | | | $ | 1,087.10 | | | $ | 3.43 | |
Based on Hypothetical 5% Yearly Return | | | 1,000.00 | | | | 1,021.51 | | | | 3.32 | |
| * | | Expenses are equal to the Fund’s annualized expense ratio of 0.66%, multiplied by the average account value over the period, multiplied by 181/365 (to reflect the one-half year period). |
The expenses shown in the table highlight ongoing costs only and do not reflect any transactional fees or account maintenance fees. Though other mutual funds may charge such fees, please note that the Fund does not charge transaction fees (e.g., redemption fees, sales loads) or universal account maintenance fees (e.g., small account fees).
PAGE 5 § DODGE & COX GLOBAL STOCK FUND
| | | | |
| FUND INFORMATION | | | June 30, 2014 | |
| | | | |
| GENERAL INFORMATION | | | |
Net Asset Value Per Share | | | $12.48 | |
Total Net Assets (billions) | | | $5.4 | |
2013 Expense Ratio (per 5/1/14 Prospectus) | | | 0.65% | |
Expense Ratio (1/1/14 to 6/30/14, annualized) | | | 0.66% | |
Portfolio Turnover Rate
(1/1/14 to 6/30/14, unannualized) | | | 6% | |
30-Day SEC Yield(a) | | | 1.24% | |
Fund Inception | | | 2008 | |
| No sales charges or distribution fees | | | | |
Investment Manager: Dodge & Cox, San Francisco. Managed by the Global Stock Investment Policy Committee, whose seven members’ average tenure at Dodge & Cox is 18 years.
| | | | | | | | |
| PORTFOLIO CHARACTERISTICS | | Fund | | | MSCI
World | |
Number of Equity Securities | | | 92 | | | | 1,611 | |
Median Market Capitalization (billions) | | | $34 | | | | $11 | |
Weighted Average Market Capitalization (billions) | | | $93 | | | | $90 | |
Price-to-Earnings Ratio(b) | | | 13.2x | | | | 15.1x | |
Countries Represented | | | 23 | | | | 23 | |
Emerging Markets (Brazil, China, India, Mexico, South Africa, South Korea, Thailand, Turkey) | | | 18.0% | | | | 0.0% | |
| | | | |
| TEN LARGEST HOLDINGS(c) | | Fund | |
Hewlett-Packard Co. (United States) | | | 3.3 | % |
Microsoft Corp. (United States) | | | 2.7 | |
Novartis AG (Switzerland) | | | 2.5 | |
Roche Holding AG (Switzerland) | | | 2.5 | |
Google, Inc. (United States) | | | 2.3 | |
Sanofi (France) | | | 2.3 | |
Samsung Electronics Co., Ltd. (South Korea) | | | 2.1 | |
Naspers, Ltd. (South Africa) | | | 2.1 | |
Time Warner Cable, Inc. (United States) | | | 2.0 | |
Schlumberger, Ltd. (United States) | | | 2.0 | |
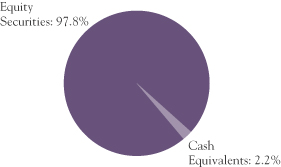
| | | | | | | | |
| REGION DIVERSIFICATION(d) | | Fund | | | MSCI
World | |
United States | | | 42.2 | % | | | 54.8 | % |
Europe (excluding United Kingdom) | | | 27.6 | | | | 18.6 | |
Pacific (excluding Japan) | | | 9.5 | | | | 5.0 | |
United Kingdom | | | 5.6 | | | | 8.8 | |
Latin America | | | 5.0 | | | | 0.0 | |
Japan | | | 4.9 | | | | 8.3 | |
Africa/Middle East | | | 3.0 | | | | 0.2 | |
Canada | | | 0.0 | | | | 4.3 | |
| | | | | | | | |
| SECTOR DIVERSIFICATION | | Fund | | | MSCI
World | |
Financials | | | 24.1 | % | | | 20.6 | % |
Information Technology | | | 19.5 | | | | 12.3 | |
Health Care | | | 14.2 | | | | 11.7 | |
Consumer Discretionary | | | 14.0 | | | | 11.9 | |
Energy | | | 7.8 | | | | 10.1 | |
Industrials | | | 6.0 | | | | 11.2 | |
Telecommunication Services | | | 5.4 | | | | 3.5 | |
Consumer Staples | | | 4.1 | | | | 9.7 | |
Materials | | | 2.7 | | | | 5.7 | |
Utilities | | | 0.0 | | | | 3.3 | |
| (a) | SEC Yield is an annualization of the Fund’s total net investment income per share for the 30-day period ended on the last day of the month. |
| (b) | Price-to-earnings (P/E) ratios are calculated using 12-month forward earnings estimates from third-party sources. |
| (c) | The Fund’s portfolio holdings are subject to change without notice. The mention of specific securities is not a recommendation to buy, sell, or hold any particular security and is not indicative of Dodge & Cox’s current or future trading activity. |
| (d) | The Fund may classify a company in a different category than the MSCI World. The Fund generally classifies a company based on its country of incorporation, but may designate a different country in certain circumstances. |
DODGE & COX GLOBAL STOCK FUND §PAGE 6
| | | | |
| CONSOLIDATED PORTFOLIO OF INVESTMENTS (unaudited) | | | June 30, 2014 | |
| | | | | | | | |
| COMMON STOCKS: 94.7% | |
| | |
| | | SHARES | | | VALUE | |
| CONSUMER DISCRETIONARY: 14.0% | |
AUTOMOBILES & COMPONENTS: 3.0% | | | | | |
Bayerische Motoren Werke AG (Germany) | | | 396,500 | | | $ | 50,285,951 | |
Honda Motor Co., Ltd. (Japan) | | | 1,423,800 | | | | 49,711,077 | |
Mahindra & Mahindra, Ltd. (India) | | | 2,398,426 | | | | 45,779,251 | |
Yamaha Motor Co., Ltd. (Japan) | | | 1,123,000 | | | | 19,321,741 | |
| | | | | | | | |
| | | | 165,098,020 | |
CONSUMER DURABLES & APPAREL: 1.5% | |
Coach, Inc. (United States) | | | 925,800 | | | | 31,653,102 | |
Panasonic Corp. (Japan) | | | 3,997,040 | | | | 48,688,094 | |
| | | | | | | | |
| | | | 80,341,196 | |
MEDIA: 8.5% | |
Comcast Corp., Class A (United States) | | | 1,180,600 | | | | 63,374,608 | |
DISH Network Corp., Class A(a) (United States) | | | 598,100 | | | | 38,924,348 | |
Grupo Televisa SAB ADR (Mexico) | | | 1,212,700 | | | | 41,607,737 | |
Naspers, Ltd. (South Africa) | | | 931,700 | | | | 109,683,912 | |
Television Broadcasts, Ltd. (Hong Kong) | | | 2,778,100 | | | | 18,029,835 | |
Time Warner Cable, Inc. (United States) | | | 740,071 | | | | 109,012,458 | |
Time Warner, Inc. (United States) | | | 925,966 | | | | 65,049,111 | |
Time, Inc.(a) (United States) | | | 453,495 | | | | 10,983,649 | |
| | | | | | | | |
| | | | 456,665,658 | |
RETAILING: 1.0% | |
Target Corp. (United States) | | | 959,900 | | | | 55,626,205 | |
| | | | | | | | |
| | | | 757,731,079 | |
| CONSUMER STAPLES: 4.1% | |
FOOD & STAPLES RETAILING: 2.0% | |
Wal-Mart Stores, Inc. (United States) | | | 1,406,900 | | | | 105,615,983 | |
|
FOOD, BEVERAGE & TOBACCO: 2.1% | |
Anadolu Efes Biracilik ve Malt Sanayii AS(a) (Turkey) | | | 4,098,485 | | | | 50,200,928 | |
Unilever PLC (United Kingdom) | | | 1,457,900 | | | | 66,143,769 | |
| | | | | | | | |
| | | | | | | 116,344,697 | |
| | | | | | | | |
| | | | | | | 221,960,680 | |
| ENERGY: 6.6% | | | | | | | | |
Apache Corp. (United States) | | | 276,932 | | | | 27,864,898 | |
Baker Hughes, Inc. (United States) | | | 561,387 | | | | 41,795,262 | |
National Oilwell Varco, Inc. (United States) | | | 774,500 | | | | 63,780,075 | |
Saipem SPA(a) (Italy) | | | 1,954,543 | | | | 52,724,219 | |
Schlumberger, Ltd. (Curacao/United States) | | | 903,500 | | | | 106,567,825 | |
Weatherford International PLC(a) (Ireland) | | | 2,819,975 | | | | 64,859,425 | |
| | | | | | | | |
| | | | 357,591,704 | |
| | | | | | | | |
| | |
| | | SHARES | | | VALUE | |
| FINANCIALS: 23.2% | |
BANKS: 9.4% | |
Banco Santander SA (Spain) | | | 4,741,614 | | | $ | 49,539,251 | |
Bank of America Corp. (United States) | | | 3,775,300 | | | | 58,026,361 | |
Barclays PLC (United Kingdom) | | | 10,223,400 | | | | 37,232,179 | |
HSBC Holdings PLC (United Kingdom) | | | 4,654,862 | | | | 47,232,370 | |
ICICI Bank, Ltd. (India) | | | 2,905,263 | | | | 68,382,003 | |
Kasikornbank PCL- Foreign (Thailand) | | | 8,948,100 | | | | 56,520,120 | |
Siam Commercial Bank PCL- Foreign (Thailand) | | | 4,537,100 | | | | 23,555,734 | |
Standard Chartered PLC (United Kingdom) | | | 2,025,746 | | | | 41,394,324 | |
Wells Fargo & Co. (United States) | | | 1,722,973 | | | | 90,559,461 | |
Yapi ve Kredi Bankasi AS (Turkey) | | | 16,421,817 | | | | 35,810,816 | |
| | | | | | | | |
| | | | 508,252,619 | |
DIVERSIFIED FINANCIALS: 8.4% | |
Bank of New York Mellon Corp. (United States) | | | 2,149,700 | | | | 80,570,756 | |
Capital One Financial Corp. (United States) | | | 1,178,200 | | | | 97,319,320 | |
Charles Schwab Corp. (United States) | | | 3,403,300 | | | | 91,650,869 | |
Credit Suisse Group AG (Switzerland) | | | 3,208,604 | | | | 91,757,101 | |
Goldman Sachs Group, Inc. (United States) | | | 309,200 | | | | 51,772,448 | |
Haci Omer Sabanci Holding AS (Turkey) | | | 8,386,388 | | | | 39,149,145 | |
| | | | | | | | |
| | | | 452,219,639 | |
INSURANCE: 2.7% | |
AEGON NV (Netherlands) | | | 7,242,669 | | | | 63,213,436 | |
Aviva PLC (United Kingdom) | | | 579,900 | | | | 5,066,410 | |
Dai-ichi Life Insurance Co., Ltd. (Japan) | | | 1,733,000 | | | | 25,814,096 | |
Swiss Life Holding AG (Switzerland) | | | 35,384 | | | | 8,391,131 | |
Swiss Re AG (Switzerland) | | | 508,000 | | | | 45,197,564 | |
| | | | | | | | |
| | | | 147,682,637 | |
REAL ESTATE: 2.7% | |
BR Malls Participacoes SA (Brazil) | | | 7,750,800 | | | | 65,949,328 | |
Hang Lung Group, Ltd. (Hong Kong) | | | 10,259,300 | | | | 55,529,732 | |
Hang Lung Properties, Ltd. (Hong Kong) | | | 7,768,300 | | | | 23,955,198 | |
| | | | | | | | |
| | | | | | | 145,434,258 | |
| | | | | | | | |
| | | | 1,253,589,153 | |
| HEALTH CARE: 14.2% | |
HEALTH CARE EQUIPMENT & SERVICES: 2.5% | |
Express Scripts Holding Co.(a) (United States) | | | 873,400 | | | | 60,552,822 | |
UnitedHealth Group, Inc. (United States) | | | 900,900 | | | | 73,648,575 | |
| | | | | | | | |
| | | | 134,201,397 | |
| | |
| PAGE 7 § DODGE & COX GLOBAL STOCK FUND | | See accompanying Notes to Consolidated Financial Statements |
| | | | |
| CONSOLIDATED PORTFOLIO OF INVESTMENTS (unaudited) | | | June 30, 2014 | |
| | | | | | | | |
| COMMON STOCKS (continued) | |
| | |
| | | SHARES | | | VALUE | |
PHARMACEUTICALS, BIOTECHNOLOGY & LIFE SCIENCES: 11.7% | |
Bayer AG (Germany) | | | 515,720 | | | $ | 72,842,007 | |
GlaxoSmithKline PLC (United Kingdom) | | | 2,351,500 | | | | 62,940,938 | |
GlaxoSmithKline PLC ADR (United Kingdom) | | | 782,100 | | | | 41,826,708 | |
Merck & Co., Inc. (United States) | | | 1,036,600 | | | | 59,967,310 | |
Novartis AG (Switzerland) | | | 909,000 | | | | 82,310,217 | |
Novartis AG ADR (Switzerland) | | | 609,700 | | | | 55,196,141 | |
Roche Holding AG (Switzerland) | | | 442,300 | | | | 131,921,910 | |
Sanofi (France) | | | 1,148,062 | | | | 121,958,989 | |
| | | | | | | | |
| | | | | | | 628,964,220 | |
| | | | | | | | |
| | | | 763,165,617 | |
| INDUSTRIALS: 6.0% | |
CAPITAL GOODS: 3.8% | |
Koninklijke Philips NV (Netherlands) | | | 971,670 | | | | 30,834,523 | |
Mitsubishi Electric Corp. (Japan) | | | 3,190,700 | | | | 39,369,972 | |
Nidec Corp. (Japan) | | | 783,900 | | | | 48,099,525 | |
NOW, Inc.(a) (United States) | | | 165,300 | | | | 5,985,513 | |
Schneider Electric SA (France) | | | 764,278 | | | | 71,948,669 | |
Wienerberger AG (Austria) | | | 425,205 | | | | 7,132,358 | |
| | | | | | | | |
| | | | 203,370,560 | |
COMMERCIAL & PROFESSIONAL SERVICES: 1.2% | |
ADT Corp. (United States) | | | 913,000 | | | | 31,900,220 | |
Tyco International, Ltd. (Switzerland) | | | 753,100 | | | | 34,341,360 | |
| | | | | | | | |
| | | | 66,241,580 | |
TRANSPORTATION: 1.0% | |
FedEx Corp. (United States) | | | 353,100 | | | | 53,452,278 | |
| | | | | | | | |
| | | | | | | 323,064,418 | |
| INFORMATION TECHNOLOGY: 18.5% | |
SEMICONDUCTORS & SEMICONDUCTOR EQUIPMENT: 1.2% | |
Samsung Electronics Co., Ltd. (South Korea) | | | 49,317 | | | | 64,436,721 | |
| | |
SOFTWARE & SERVICES: 9.2% | | | | | | | | |
AOL, Inc.(a) (United States) | | | 814,169 | | | | 32,395,785 | |
Baidu, Inc. ADR(a) (Cayman Islands/China) | | | 295,400 | | | | 55,183,674 | |
eBay, Inc.(a) (United States) | | | 989,700 | | | | 49,544,382 | |
Google, Inc., Class A(a) (United States) | | | 60,600 | | | | 35,431,002 | |
Google, Inc., Class C(a) (United States) | | | 154,500 | | | | 88,880,760 | |
Microsoft Corp. (United States) | | | 3,556,400 | | | | 148,301,880 | |
Nintendo Co., Ltd. (Japan) | | | 276,200 | | | | 33,057,845 | |
Symantec Corp. (United States) | | | 1,565,600 | | | | 35,852,240 | |
Synopsys, Inc.(a) (United States) | | | 366,800 | | | | 14,239,176 | |
| | | | | | | | |
| | | | 492,886,744 | |
| | | | | | | | |
| | |
| | | SHARES | | | VALUE | |
TECHNOLOGY, HARDWARE & EQUIPMENT: 8.1% | |
Corning, Inc. (United States) | | | 2,679,800 | | | $ | 58,821,610 | |
EMC Corp. (United States) | | | 1,644,400 | | | | 43,313,496 | |
Hewlett-Packard Co. (United States) | | | 5,333,400 | | | | 179,628,912 | |
NetApp, Inc. (United States) | | | 1,012,200 | | | | 36,965,544 | |
Nokia Oyj (Finland) | | | 4,483,525 | | | | 33,950,285 | |
TE Connectivity, Ltd. (Switzerland) | | | 769,115 | | | | 47,562,072 | |
Telefonaktiebolaget LM Ericsson (Sweden) | | | 3,153,747 | | | | 38,114,669 | |
| | | | | | | | |
| | | | | | | 438,356,588 | |
| | | | | | | | |
| | | | | | | 995,680,053 | |
| | |
| MATERIALS: 2.7% | | | | | | | | |
Akzo Nobel NV (Netherlands) | | | 326,204 | | | | 24,455,250 | |
Celanese Corp., Series A (United States) | | | 931,300 | | | | 59,863,964 | |
Lafarge SA (France) | | | 730,171 | | | | 63,388,801 | |
| | | | | | | | |
| | | | 147,708,015 | |
| TELECOMMUNICATION SERVICES: 5.4% | |
America Movil SAB de CV, Series L (Mexico) | | | 48,502,800 | | | | 50,396,404 | |
China Mobile, Ltd. (Hong Kong/China) | | | 5,325,600 | | | | 51,672,833 | |
Millicom International Cellular SA SDR (Luxembourg) | | | 786,900 | | | | 72,076,509 | |
MTN Group, Ltd. (South Africa) | | | 2,386,200 | | | | 50,257,164 | |
Sprint Corp.(a) (United States) | | | 1,964,691 | | | | 16,758,814 | |
Telecom Italia SPA- RSP (Italy) | | | 50,281,384 | | | | 49,675,501 | |
| | | | | | | | |
| | | | 290,837,225 | |
| | | | | | | | |
TOTAL COMMON STOCKS
(Cost $3,812,725,123) | | | $ | 5,111,327,944 | |
| | | | | |
| | |
| PREFERRED STOCKS: 3.1% | | | | | | |
| ENERGY: 1.2% | |
Petroleo Brasileiro SA ADR (Brazil) | | | 4,036,900 | | | | 63,137,116 | |
|
| FINANCIALS: 0.9% | |
BANKS: 0.9% | |
Itau Unibanco Holding SA (Brazil) | | | 3,476,330 | | | | 50,300,190 | |
|
| INFORMATION TECHNOLOGY: 1.0% | |
SEMICONDUCTORS & SEMICONDUCTOR EQUIPMENT: 1.0% | |
Samsung Electronics Co., Ltd. (South Korea) | | | 48,914 | | | | 51,244,159 | |
| | | | | | | | |
| |
TOTAL PREFERRED STOCKS
(Cost $154,555,556) | | | $ | 164,681,465 | |
| | |
| See accompanying Notes to Consolidated Financial Statements | | DODGE & COX GLOBAL STOCK FUND §PAGE 8 |
| | | | |
| CONSOLIDATED PORTFOLIO OF INVESTMENTS (unaudited) | | | June 30, 2014 | |
| | | | | | | | |
|
| SHORT-TERM INVESTMENTS: 2.4% | |
| | |
| | | PAR VALUE | | | VALUE | |
MONEY MARKET FUND: 0.2% | | | | | |
SSgA U.S. Treasury Money Market Fund | | $ | 10,586,315 | | | $ | 10,586,315 | |
| |
REPURCHASE AGREEMENT: 2.2% | | | | | |
Fixed Income Clearing Corporation(b) 0.00%, dated 6/30/14, due 7/1/14, maturity value $118,421,001 | | | 118,421,001 | | | | 118,421,001 | |
| |
TREASURY BILL: 0.0%(c) | | | | | |
Sweden Treasury Bill (Sweden) 9/17/14 | | | 70,000 | | | | 10,465 | |
| | | | | | | | |
TOTAL SHORT-TERM INVESTMENTS
(Cost $129,017,867) | | | $ | 129,017,781 | |
| | | | | | | | |
TOTAL INVESTMENTS
(Cost $4,096,298,546) | | | 100.2 | % | | $ | 5,405,027,190 | |
OTHER ASSETS LESS LIABILITIES | | | (0.2 | %) | | | (9,944,452 | ) |
| | | | | | | | |
| NET ASSETS | | | 100.0 | % | | $ | 5,395,082,738 | |
| | | | | | | | |
| (b) | Repurchase agreement is collateralized by U.S. Treasury Note 1.375%, 2/28/19. Total collateral value is $120,792,263. |
In determining a company’s country designation, the Fund generally references the country of incorporation. In cases where the Fund considers the country of incorporation to be a “jurisdiction of convenience” chosen primarily for tax purposes, the Fund uses the country designation of an appropriate broad-based market index. In that circumstance, two countries are listed - the country of incorporation and the country designated by an appropriate index, respectively.
ADR: American Depositary Receipt
SDR: Swedish Depository Receipt
FORWARD CURRENCY CONTRACTS
| | | | | | | | | | | | | | | | |
| | | | | | Contract Amount | | | | |
| Counterparty | | Settlement
Date | | | Receive
U.S.
Dollar | | | Deliver
Foreign
Currency | | | Unrealized
Appreciation/
(Depreciation) | |
Contracts to sell EUR: | | | | | |
Citibank | | | 8/6/14 | | | | 40,897,017 | | | | 29,500,000 | | | $ | 497,338 | |
JPMorgan | | | 8/13/14 | | | | 24,458,000 | | | | 17,500,000 | | | | 491,455 | |
UBS | | | 8/13/14 | | | | 27,126,743 | | | | 19,500,000 | | | | 421,164 | |
Credit Suisse | | | 8/27/14 | | | | 37,072,808 | | | | 27,250,000 | | | | (248,500 | ) |
Deutsche Bank | | | 9/10/14 | | | | 26,415,040 | | | | 19,400,000 | | | | (156,369 | ) |
Barclays | | | 9/17/14 | | | | 14,920,070 | | | | 11,000,000 | | | | (146,578 | ) |
HSBC | | | 9/17/14 | | | | 25,771,182 | | | | 19,000,000 | | | | (253,028 | ) |
| | | | | | | | | | | | | | | | |
| | | | | | | | | | | | | | $ | 605,482 | |
| | | | | | | | | | | | | | | | |
| | | | | | | | | | | | | | | | | |
| | |
| PAGE 9 § DODGE & COX GLOBAL STOCK FUND | | See accompanying Notes to Consolidated Financial Statements |
| | | | |
CONSOLIDATED STATEMENT OF ASSETS AND LIABILITIES (unaudited) | |
| |
| | | June 30, 2014 | |
ASSETS: | | | | |
Investments, at value (cost $4,096,298,546) | | $ | 5,405,027,190 | |
Cash | | | 100 | |
Cash denominated in foreign currency (cost $246,316) | | | 246,316 | |
Unrealized appreciation on forward currency contracts | | | 1,409,958 | |
Receivable for Fund shares sold | | | 9,048,569 | |
Dividends and interest receivable | | | 9,758,769 | |
Prepaid expenses and other assets | | | 12,412 | |
| | | | |
| | | 5,425,503,314 | |
| | | | |
LIABILITIES: | | | | |
Payable for investments purchased | | | 25,330,124 | |
Unrealized depreciation on forward currency contracts | | | 804,476 | |
Payable for Fund shares redeemed | | | 946,431 | |
Management fees payable | | | 2,604,557 | |
Accrued expenses | | | 734,988 | |
| | | | |
| | | 30,420,576 | |
| | | | |
NET ASSETS | | $ | 5,395,082,738 | |
| | | | |
NET ASSETS CONSIST OF: | | | | |
Paid in capital | | $ | 3,974,648,500 | |
Undistributed net investment income | | | 53,204,748 | |
Undistributed net realized gain | | | 57,837,894 | |
Net unrealized appreciation | | | 1,309,391,596 | |
| | | | |
| | $ | 5,395,082,738 | |
| | | | |
Fund shares outstanding (par value $0.01 each, unlimited shares authorized) | | | 432,297,247 | |
Net asset value per share | | $ | 12.48 | |
| | | | |
| |
CONSOLIDATED STATEMENT OF OPERATIONS (unaudited) | | | | |
| | | Six Months Ended
June 30, 2014 | |
INVESTMENT INCOME: | | | | |
Dividends (net of foreign taxes of $4,645,513) | | $ | 68,334,283 | |
| | | | |
| | | 68,334,283 | |
| | | | |
EXPENSES: | | | | |
Management fees | | | 13,673,186 | |
Custody and fund accounting fees | | | 357,374 | |
Transfer agent fees | | | 170,988 | |
Professional services | | | 190,676 | |
Shareholder reports | | | 173,569 | |
Registration fees | | | 279,331 | |
Trustees’ fees | | | 139,442 | |
Miscellaneous | | | 117,137 | |
| | | | |
| | | 15,101,703 | |
| | | | |
NET INVESTMENT INCOME | | | 53,232,580 | |
| | | | |
| |
REALIZED AND UNREALIZED GAIN (LOSS): | | | | |
Net realized gain (loss) (net of foreign taxes of $214,037) | | | | |
Investments | | | 51,512,264 | |
Forward currency contracts | | | (504,162 | ) |
Foreign currency transactions | | | (388,862 | ) |
Net change in unrealized appreciation/depreciation | | | | |
Investments | | | 297,621,957 | |
Forward currency contracts | | | 1,892,979 | |
Foreign currency translation | | | (25,766 | ) |
| | | | |
Net realized and unrealized gain | | | 350,108,410 | |
| | | | |
NET INCREASE IN NET ASSETS
FROM OPERATIONS | | $ | 403,340,990 | |
| | | | |
| | | | | | | | |
CONSOLIDATED STATEMENT OF CHANGES IN NET ASSETS
(unaudited) | |
| | |
| | | Six Months Ended
June 30, 2014 | | | Year Ended
December 31, 2013
| |
OPERATIONS: | | | | | | | | |
Net investment income | | $ | 53,232,580 | | | $ | 51,571,394 | |
Net realized gain | | | 50,619,240 | | | | 107,605,183 | |
Net change in unrealized appreciation/depreciation | | | 299,489,170 | | | | 776,996,647 | |
| | | | | | | | |
| | | 403,340,990 | | | | 936,173,224 | |
| | | | | | | | |
| | |
DISTRIBUTIONS TO SHAREHOLDERS FROM: | | | | | | | | |
Net investment income | | | — | | | | (51,208,519 | ) |
Net realized gain | | | — | | | | (100,724,648 | ) |
| | | | | | | | |
Total distributions | | | — | | | | (151,933,167 | ) |
| | | | | | | | |
| |
FUND SHARE
TRANSACTIONS: | | | | | |
Proceeds from sale of shares | | | 1,435,798,177 | | | | 867,041,207 | |
Reinvestment of distributions | | | — | | | | 147,064,049 | |
Cost of shares redeemed | | | (368,046,525 | ) | | | (569,072,368 | ) |
| | | | | | | | |
Net increase from Fund share transactions | | | 1,067,751,652 | | | | 445,032,888 | |
| | | | | | | | |
Total increase in net assets | | | 1,471,092,642 | | | | 1,229,272,945 | |
| |
NET ASSETS: | | | | | |
Beginning of period | | | 3,923,990,096 | | | | 2,694,717,151 | |
| | | | | | | | |
End of period (including undistributed net investment income of $53,204,748 and
$(27,832), respectively) | | $ | 5,395,082,738 | | | $ | 3,923,990,096 | |
| | | | | | | | |
| |
SHARE INFORMATION: | | | | | |
Shares sold | | | 121,232,124 | | | | 84,147,647 | |
Distributions reinvested | | | — | | | | 13,130,720 | |
Shares redeemed | | | (30,667,948 | ) | | | (55,260,639 | ) |
| | | | | | | | |
Net increase in shares outstanding | | | 90,564,176 | | | | 42,017,728 | |
| | | | | | | | |
| | |
| See accompanying Notes to Consolidated Financial Statements | | DODGE & COX GLOBAL STOCK FUND §PAGE 10 |
NOTES TO CONSOLIDATED FINANCIAL STATEMENTS (unaudited)
NOTE 1—ORGANIZATION AND SIGNIFICANT ACCOUNTING POLICIES
Dodge & Cox Global Stock Fund (the “Fund”) is one of the series constituting the Dodge & Cox Funds (the “Trust” or the “Funds”). The Trust is organized as a Delaware statutory trust and is registered under the Investment Company Act of 1940, as amended, as an open-end management investment company. The Fund commenced operations on May 1, 2008, and seeks long-term growth of principal and income. The Fund invests primarily in a diversified portfolio of U.S. and foreign equity securities. Foreign investing, especially in developing countries, has special risks such as currency and market volatility and political and social instability. These and other risk considerations are discussed in the Fund’s Prospectus.
The financial statements have been prepared in conformity with accounting principles generally accepted in the United States of America, which require the use of estimates and assumptions by management. Actual results may differ from those estimates. Significant accounting policies are as follows:
Security valuation The Fund’s net assets are valued as of the close of trading on the New York Stock Exchange (NYSE), generally 4:00 p.m. Eastern Time, each day that the NYSE is open for business. Portfolio securities and other financial investments for which market quotes are readily available are valued at market value. Listed securities are generally valued using the official quoted close price or the last sale on the exchange that is determined to be the primary market for the security. Security values are not discounted based on the size of the Fund’s position. Short-term securities less than 60 days to maturity may be valued at amortized cost if amortized cost approximates current value.
Investments initially valued in currencies other than the U.S. dollar are converted to the U.S. dollar using prevailing exchange rates. As a result, the Fund’s net assets may be affected by changes in the value of currencies in relation to the U.S. dollar.
If market quotations are not readily available or if a security’s value has materially changed after the close of the security’s primary market but before the close of trading on the NYSE, the security is valued at fair value as determined in good faith by or under the direction of the Board of Trustees. The Fund may use fair value pricing in
calculating its net asset value per share (NAV) when, for example, (i) the primary market for a security is closed or if trading of a security is suspended or limited, (ii) the Fund determines that the price provided by a pricing service is inaccurate or unreliable, or (iii) the Fund determines that a significant event affecting the value of a security has occurred before the close of the NYSE but after the close of the security’s primary market. An event is considered significant if there is both an affirmative expectation that the security’s value will materially change in response to the event and a reasonable basis exists for quantifying a resulting change in value. Because trading in securities on most foreign exchanges is normally completed before the close of the NYSE, the value of non-U.S. securities can change by the time the Fund calculates its NAV. To address these changes, the Fund may utilize adjustment factors provided by an independent pricing service to systematically value non-U.S. securities at fair value. These adjustment factors are based on statistical analyses of subsequent movements and changes in securities indices, specific security prices, and exchange rates in foreign markets.
The Board of Trustees has delegated authority to Dodge & Cox, the Fund’s investment manager, to make fair value determinations in accordance with the Dodge & Cox Funds Valuation Policies (“Valuation Policies”), subject to Board oversight. Dodge & Cox has established a Pricing Committee that is comprised of representatives from Treasury, Legal, Compliance, and Operations. The Pricing Committee is responsible for implementing the Valuation Policies, including determining the fair value of securities when market quotations or market-based valuations are not readily available or are deemed unreliable. The Pricing Committee considers relevant indications of value that are reasonably available to it in determining the fair value assigned to a particular security, such as the value of similar financial instruments, trading volumes, contractual restrictions on disposition, related corporate actions, and changes in economic conditions.
Valuing securities at fair value involves greater reliance on judgment than valuation of securities based on readily available market quotations. In some instances, lack of information and uncertainty as to the significance of information may lead to a conclusion that a prior valuation is the best indication of a security’s present value. When fair value pricing is employed, the prices of
PAGE 11 § DODGE & COX GLOBAL STOCK FUND
NOTES TO CONSOLIDATED FINANCIAL STATEMENTS (unaudited)
securities used by the Fund to calculate its net asset value may differ from quoted or published prices for the same securities.
Security transactions, investment income, expenses, and distributions Security transactions are recorded on the trade date. Realized gains and losses on securities sold are determined on the basis of identified cost.
Dividend income and corporate action transactions are recorded on the ex-dividend date, or when the Fund first learns of the dividend/corporate action if the ex-dividend date has passed. Non-cash dividends included in dividend income, if any, are recorded at the fair market value of the securities received. Dividends characterized as return of capital for U.S. tax purposes are recorded as a reduction of cost of investments and/or realized gain. Interest income is recorded on the accrual basis.
Expenses are recorded on the accrual basis. Most expenses of the Trust can be directly attributed to a specific series. Expenses which cannot be directly attributed are allocated among the Funds in the Trust based on relative net assets or other expense methodologies determined by the nature of the expense.
Distributions to shareholders are recorded on the ex-dividend date.
Foreign taxes The Fund is subject to foreign taxes which may be imposed by certain countries in which the Fund invests. The Fund endeavors to record foreign taxes based on applicable foreign tax law. Withholding taxes are incurred on certain foreign dividends and are accrued at the time the associated dividend is recorded. The Fund files withholding tax reclaims in certain jurisdictions to recover a portion of amounts previously withheld. The Fund records a reclaim receivable based on, among other things, a jurisdiction’s legal obligation to pay reclaims as well as payment history and market convention. In consideration of recent decisions rendered by European courts, the Fund has filed for additional reclaims related to prior years. However, a corresponding receivable amount has not yet been recorded because there is no historical precedent for collecting such reclaims and the amount, if any, that the Fund might recover is uncertain. Such amounts, if and when recorded, could result in an increase in the Fund’s net asset value per share.
Capital gains taxes are incurred upon disposition of certain foreign securities. Capital gains taxes on appreciated securities are accrued as unrealized losses and
are reflected as realized losses upon the sale of the related security. Currency taxes may be incurred when the Fund purchases certain foreign currencies related to securities transactions and are recorded as realized losses on foreign currency transactions.
Repurchase agreements The Fund enters into repurchase agreements, secured by U.S. government or agency securities, which involve the purchase of securities from a counterparty with a simultaneous commitment to resell the securities at an agreed-upon date and price. It is the Fund’s policy that its custodian take possession of the underlying collateral securities, the fair value of which exceeds the principal amount of the repurchase transaction, including accrued interest, at all times. In the event of default by the counterparty, the Fund has the contractual right to liquidate the collateral securities and to apply the proceeds in satisfaction of the obligation.
Forward currency contracts A forward currency contract represents an obligation to purchase or sell a specific foreign currency at a future date at a price set at the time of the contract. Losses from these transactions may arise from unfavorable changes in currency values or if the counterparties do not perform under a contract’s terms.
The values of the forward currency contracts are adjusted daily based on the applicable exchange rate of the underlying currency. Changes in the value of open contracts are recorded as unrealized appreciation or depreciation in the Consolidated Statement of Operations. When the forward currency contract is closed, the Fund records a realized gain or loss in the Consolidated Statement of Operations equal to the difference between the value at the time the contract was opened and the value at the time it was closed.
During the period, the Fund maintained forward currency contracts to hedge foreign currency risks associated with portfolio investments denominated in euro. These euro forward currency contracts had U.S. dollar total values ranging from 3% to 4% of net assets during the period.
Foreign currency translation The books and records of the Fund are maintained in U.S. dollars. Foreign currency amounts are translated into U.S. dollars at the prevailing exchange rates of such currencies against the U.S. dollar. The market value of investment securities and other assets and liabilities are translated at the exchange
DODGE & COX GLOBAL STOCK FUND §PAGE 12
NOTES TO CONSOLIDATED FINANCIAL STATEMENTS (unaudited)
rate as of the valuation date. Purchases and sales of investment securities, income, and expenses are translated at the exchange rate prevailing on the transaction date.
Reported realized and unrealized gain (loss) on investments include foreign currency gain (loss) related to investment transactions.
Reported realized and unrealized gain (loss) on foreign currency transactions and translation include the following: disposing/holding of foreign currency, the difference between the trade and settlement dates on securities transactions, the difference between the accrual and payment dates on dividends, and currency losses on the purchase of foreign currency in certain countries that impose taxes on such transactions.
Consolidation The Fund may invest in certain securities through its wholly-owned subsidiary, Dodge & Cox Global Stock Fund Cayman, Ltd. (the “Subsidiary”). The Subsidiary is a Cayman Islands exempted company and invests in certain securities consistent with the investment objective of the Fund. The Fund’s Consolidated Financial Statements, including the Consolidated Portfolio of Investments, consist of the holdings and accounts of the Fund and the Subsidiary. All intercompany transactions and balances have been eliminated. At June 30, 2014, the Subsidiary had net assets of $100, which represented less than 0.01% of the Fund’s consolidated net assets.
Indemnification Under the Trust’s organizational documents, its officers and trustees are indemnified against certain liabilities arising out of the performance of their duties to the Trust. In addition, in the normal course of business the Trust enters into contracts that provide general indemnities to other parties. The Trust’s maximum exposure under these arrangements is unknown as this would involve future claims that may be made against the Trust that have not yet occurred.
NOTE 2—VALUATION MEASUREMENTS
Various inputs are used in determining the value of the Fund’s investments and other financial instruments. These inputs are summarized in the three broad levels listed below.
| § | | Level 1: Quoted prices in active markets for identical securities |
| § | | Level 2: Other significant observable inputs (including quoted prices for similar securities, market indices, interest rates, credit risk, etc.) |
| § | | Level 3: Significant unobservable inputs (including Fund management’s assumptions in determining the fair value of investments) |
The inputs or methodology used for valuing securities are not necessarily an indication of the risk associated with investing in those securities.
The following is a summary of the inputs used to value the Fund’s holdings at June 30, 2014:
| | | | | | | | |
| Classification(a) | | LEVEL 1
(Quoted Prices) | | | LEVEL 2
(Other Significant
Observable Inputs) | |
Securities | | | | | | | | |
Common Stock | | | | | | | | |
Consumer Discretionary | | $ | 757,731,079 | | | $ | — | |
Consumer Staples | | | 221,960,680 | | | | — | |
Energy | | | 357,591,704 | | | | — | |
Financials | | | 1,253,589,153 | | | | — | |
Health Care | | | 763,165,617 | | | | — | |
Industrials | | | 323,064,418 | | | | — | |
Information Technology | | | 995,680,053 | | | | — | |
Materials | | | 147,708,015 | | | | — | |
Telecommunication Services | | | 290,837,225 | | | | — | |
Preferred Stocks | | | | | | | | |
Energy | | | 63,137,116 | | | | — | |
Financials | | | 50,300,190 | | | | — | |
Information Technology | | | 51,244,159 | | | | — | |
Short-term Investments | | | | | | | | |
Money Market Fund | | | 10,586,315 | | | | — | |
Repurchase Agreement | | | — | | | | 118,421,001 | |
Treasury Bill | | | — | | | | 10,465 | |
| | | | | | | | |
Total Securities | | $ | 5,286,595,724 | | | $ | 118,431,466 | |
| |
Other Financial Instruments | | | | | |
Forward Currency Contracts | | $ | — | | | $ | 605,482 | (b) |
| | | | | | | | | |
| (a) | | Transfers during the period between Level 1 and Level 2 relate to the use of systematic fair valuation. On days when systematic fair valuation is used, securities whose primary market closes before the NYSE are classified as Level 2. There were no Level 3 securities at June 30, 2014 and December 31, 2013, and there were no transfers to Level 3 during the period. |
| (b) | | Represents net unrealized appreciation/depreciation. |
PAGE 13 § DODGE & COX GLOBAL STOCK FUND
NOTES TO CONSOLIDATED FINANCIAL STATEMENTS (unaudited)
NOTE 3—ADDITIONAL DERIVATIVES INFORMATION
The Fund has entered into over-the-counter derivatives, such as forward currency contracts (each, a “Derivative”). Each Derivative is subject to a negotiated master agreement (based on a form published by the International Swaps and Derivatives Association (“ISDA”)) governing all Derivatives between the Fund and the relevant dealer counterparty. The master agreements specify (i) events of default and other events permitting a party to terminate some or all of the Derivatives thereunder and (ii) the process by which those Derivatives will be valued for purposes of determining termination payments. If some or all of the Derivatives under a master agreement are terminated because of an event of default or similar event, the values of all terminated Derivatives must be netted to determine a single payment owed by one party to the other. Some master agreements contain collateral terms requiring the parties to post collateral in respect of some or all of the Derivatives thereunder based on the net market value of those Derivatives, subject to a minimum exposure threshold. To the extent amounts owed to the Fund by its counterparties are not collateralized, the Fund is at risk of those counterparties’ non-performance. The Fund attempts to mitigate counterparty credit risk by entering into Derivatives only with counterparties it believes to be of good credit quality and by monitoring the financial stability of those counterparties.
For financial reporting purposes, the Fund does not offset financial assets and liabilities that are subject to an ISDA Master Agreement in the Statement of Assets and Liabilities. The net amount for Derivatives is disclosed on the Consolidated Portfolio of Investments. At June 30, 2014, there is no collateral pledged or received by the Fund for Derivatives.
NOTE 4—RELATED PARTY TRANSACTIONS
Management fees Under a written agreement approved by a unanimous vote of the Board of Trustees, the Fund pays an annual management fee of 0.60% of the Fund’s average daily net assets to Dodge & Cox, investment manager of the Fund.
Fund officers and trustees All officers and two of the trustees of the Trust are officers or employees of Dodge & Cox. The Trust pays a fee only to those trustees who are not affiliated with Dodge & Cox.
NOTE 5—INCOME TAX INFORMATION AND DISTRIBUTIONS TO SHAREHOLDERS
A provision for federal income taxes is not required since the Fund intends to qualify as a regulated investment company under Subchapter M of the Internal Revenue Code and distribute all of its taxable income to shareholders. Distributions are determined in accordance with income tax regulations, and such amounts may differ from net investment income and realized gains for financial reporting purposes. Financial reporting records are adjusted for permanent book/tax differences at year end to reflect tax character.
Book/tax differences are primarily due to differing treatments of wash sales, net short-term realized gain (loss) on investments, investments in passive foreign investment companies, foreign capital gain taxes, and foreign currency realized gain (loss). At June 30, 2014, the cost of investments for federal income tax purposes was $4,101,856,409.
Distributions during the periods noted below were characterized as follows for federal income tax purposes:
| | | | | | | | |
| | | Six Months Ended June 30, 2014 | | | Year Ended December 31, 2013 | |
Ordinary income | | | — | | | | $57,838,261 | |
| | | | | | | ($0.184 per share) | |
| | |
Long-term capital gain | | | — | | | | $94,094,906 | |
| | | | | | | ($0.296 per share) | |
At June 30, 2014, the tax basis components of distributable earnings were as follows:
| | | | |
Unrealized appreciation | | | $1,341,887,037 | |
Unrealized depreciation | | | (38,716,256 | ) |
| | | | |
Net unrealized appreciation | | | 1,303,170,781 | |
Undistributed ordinary income | | | 75,841,139 | |
Undistributed long-term capital gain | | | 41,364,848 | |
Fund management has reviewed the tax positions for open periods (three years and four years, respectively, from filing the Fund’s Federal and State tax returns) as applicable to the Fund, and has determined that no provision for income tax is required in the Fund’s financial statements.
DODGE & COX GLOBAL STOCK FUND §PAGE 14
NOTES TO CONSOLIDATED FINANCIAL STATEMENTS (unaudited)
NOTE 6—LOAN FACILITIES
Pursuant to an exemptive order issued by the Securities and Exchange Commission (SEC), the Fund may participate in an interfund lending facility (Facility). The Facility allows the Fund to borrow money from or loan money to the Funds. Loans under the Facility are made for temporary or emergency purposes, such as to fund shareholder redemption requests. Interest on borrowings is the average of the current repurchase agreement rate and the bank loan rate. There was no activity in the Facility during the period.
All Funds in the Trust participate in a $500 million committed credit facility (Line of Credit) with State Street Bank and Trust Company, to be utilized for temporary or emergency purposes to fund shareholder redemptions or for other short-term liquidity purposes. The maximum amount available to the Fund is $250 million. Each Fund pays an annual commitment fee on its pro-rata portion of the Line of Credit. The Fund’s commitment fee for the six months ended June 30, 2014, amounted to $6,527 and is reflected as a Miscellaneous Expense in the Consolidated Statement of Operations. Interest on borrowings is charged at the prevailing rate. There were no borrowings on the Line of Credit during the period.
NOTE 7—PURCHASES AND SALES OF INVESTMENTS
For the six months ended June 30, 2014, purchases and sales of securities, other than short-term securities, aggregated $1,421,888,765 and $257,621,712, respectively.
NOTE 8—SUBSEQUENT EVENTS
Fund management has determined that no material events or transactions occurred subsequent to June 30, 2014, and through the date of the Fund’s financial statements issuance, which require additional disclosure in the Fund’s financial statements.
PAGE 15 § DODGE & COX GLOBAL STOCK FUND
CONSOLIDATED FINANCIAL HIGHLIGHTS (unaudited)
| | | | | | | | | | | | | | | | | | | | | | | | |
SELECTED DATA AND RATIOS (for a share outstanding throughout the period) | | Six Months
Ended June 30, | | | Year Ended December 31, | |
| | | 2014 (a) | | | 2013 | | | 2012 | | | 2011 | | | 2010 | | | 2009 | |
| | | | | | | | |
Net asset value, beginning of period | | | $11.48 | | | | $8.99 | | | | $7.68 | | | | $8.90 | | | | $7.91 | | | | $5.34 | |
Income from investment operations: | | | | | | | | | | | | | | | | | | | | | | | | |
Net investment income | | | 0.12 | | | | 0.16 | | | | 0.15 | | | | 0.16 | | | | 0.08 | | | | 0.06 | |
Net realized and unrealized gain (loss) | | | 0.88 | | | | 2.81 | | | | 1.48 | | | | (1.18 | ) | | | 0.99 | | | | 2.57 | |
| | | | | | | | |
Total from investment operations | | | 1.00 | | | | 2.97 | | | | 1.63 | | | | (1.02 | ) | | | 1.07 | | | | 2.63 | |
| | | | | | | | |
Distributions to shareholders from: | | | | | | | | | | | | | | | | | | | | | | | | |
Net investment income | | | — | | | | (0.16 | ) | | | (0.15 | ) | | | (0.15 | ) | | | (0.08 | ) | | | (0.06 | ) |
Net realized gain | | | — | | | | (0.32 | ) | | | (0.17 | ) | | | (0.05 | ) | | | — | | | | — | |
| | | | | | | | |
Total distributions | | | — | | | | (0.48 | ) | | | (0.32 | ) | | | (0.20 | ) | | | (0.08 | ) | | | (0.06 | ) |
| | | | | | | | |
Net asset value, end of period | | | $12.48 | | | | $11.48 | | | | $8.99 | | | | $7.68 | | | | $8.90 | | | | $7.91 | |
| | | | | | | | |
Total return | | | 8.71 | % | | | 33.17 | % | | | 21.11 | % | | | (11.39 | )% | | | 13.51 | % | | | 49.18 | % |
Ratios/supplemental data: | | | | | | | | | | | | | | | | | | | | | | | | |
Net assets, end of period (millions) | | | $5,395 | | | | $3,924 | | | | $2,695 | | | | $1,875 | | | | $1,817 | | | | $914 | |
Ratio of expenses to average net assets | | | 0.66 | %(b) | | | 0.65 | % | | | 0.65 | % | | | 0.66 | % | | | 0.69 | % | | | 0.74 | % |
Ratio of net investment income to average net assets | | | 2.33 | %(b) | | | 1.58 | % | | | 1.93 | % | | | 1.94 | % | | | 1.19 | % | | | 1.09 | % |
Portfolio turnover rate | | | 6 | % | | | 24 | % | | | 12 | % | | | 19 | % | | | 14 | % | | | 20 | % |
See accompanying Notes to Financial Statements
DODGE & COX GLOBAL STOCK FUND §PAGE 16
SHAREHOLDER MEETING RESULTS (unaudited)
A special meeting of shareholders was held on April 23, 2014. At the meeting, proposals to elect Trustees to the Board of Trustees and to amend the Fund’s fundamental investment restrictions listed below were approved. The following is a report of the total votes cast by the Trust’s and the Fund’s shareholders.
| | | | | | | | | | | | | | |
| PROPOSAL | | | | AFFIRMATIVE | | | WITHHOLD | | | TOTAL | |
1 Elect Trustees to the Board of Trustees: | | | | | | | | | | | | | | |
| | | | |
| | Dana M. Emery | | | 2,724,363,325 | | | | 37,845,024 | | | | 2,762,208,349 | |
| | | | |
| | Charles F. Pohl | | | 2,724,265,808 | | | | 37,942,541 | | | | 2,762,208,349 | |
| | | | |
| | Thomas A. Larsen | | | 2,723,251,516 | | | | 38,956,833 | | | | 2,762,208,349 | |
| | | | |
| | Ann Mather | | | 2,696,172,728 | | | | 66,035,621 | | | | 2,762,208,349 | |
| | | | |
| | Robert B. Morris III | | | 2,722,376,906 | | | | 39,831,443 | | | | 2,762,208,349 | |
| | | | |
| | Gary Roughead | | | 2,721,551,032 | | | | 40,657,317 | | �� | | 2,762,208,349 | |
| | | | |
| | Mark E. Smith | | | 2,723,441,491 | | | | 38,766,858 | | | | 2,762,208,349 | |
| | | | |
| | John B. Taylor | | | 2,722,862,534 | | | | 39,345,815 | | | | 2,762,208,349 | |
| | | | | | | | | | | | | | | | | | | | |
| PROPOSAL | | AFFIRMATIVE | | | AGAINST | | | ABSTAIN | | | BROKER NON-VOTE | | | TOTAL | |
2 To remove the Fund’s fundamental investment restriction with respect to investing in any company for the purpose of exercising control or management. | | | 192,929,755 | | | | 9,941,163 | | | | 4,428,622 | | | | 44,283,992 | | | | 251,583,532 | |
| | | | | |
3 To remove the Fund’s fundamental investment restriction with respect to purchasing securities on margin and short selling. | | | 179,957,515 | | | | 20,426,862 | | | | 6,915,163 | | | | 44,283,992 | | | | 251,583,532 | |
| | | | | |
4 To remove the Fund’s fundamental investment restriction with respect to investments in securities that are illiquid and replace it with a uniform non-fundamental policy for all Funds. | | | 181,379,187 | | | | 19,278,236 | | | | 6,642,117 | | | | 44,283,992 | | | | 251,583,532 | |
| | | | | |
6 To amend the Fund’s fundamental investment restriction with respect to underwriting securities of other issuers. | | | 199,614,730 | | | | 3,012,320 | | | | 4,672,490 | | | | 44,283,992 | | | | 251,583,532 | |
PAGE 17 § DODGE & COX GLOBAL STOCK FUND
FUND HOLDINGS
The Fund provides a complete list of its holdings four times each fiscal year, as of the end of each quarter. The Fund files the lists with the Securities and Exchange Commission (SEC) on Form N-CSR (second and fourth quarters) and Form N-Q (first and third quarters). Shareholders may view the Fund’s Forms N-CSR and N-Q on the SEC’s website at www.sec.gov. Forms N-CSR and N-Q may also be reviewed and copied at the SEC’s Public Reference Room in Washington, DC. Information regarding the operations of the Public Reference Room may be obtained by calling 202-942-8090 (direct) or 800-732-0330 (general SEC number). A list of the Fund’s quarter-end holdings is also available at www.dodgeandcox.com on or about 15 days following each quarter end and remains available on the website until the list is updated in the subsequent quarter.
PROXY VOTING
For a free copy of the Fund’s proxy voting policies and procedures, please call 800-621-3979, visit the Fund’s website at www.dodgeandcox.com, or visit the SEC’s website at www.sec.gov. Information regarding how the Fund voted proxies relating to portfolio securities during the most recent 12-month period ending June 30 is also available at www.dodgeandcox.com or at www.sec.gov.
HOUSEHOLD MAILINGS
The Fund routinely mails shareholder reports and summary prospectuses to shareholders and, on occasion, proxy statements. In order to reduce the volume of mail, when possible, only one copy of these documents will be sent to shareholders who are part of the same family and share the same residential address.
If you have a direct account with the Funds and you do not want the mailing of shareholder reports and summary prospectuses combined with other members in your household, contact the Funds at 800-621-3979. Your request will be implemented within 30 days.
DODGE & COX GLOBAL STOCK FUND §PAGE 18
TRUSTEES AND EXECUTIVE OFFICERS
Charles F. Pohl, Chairman and Trustee
Chairman and Chief Investment Officer, Dodge & Cox
Dana M. Emery, President and Trustee
Chief Executive Officer, President, and Director of Fixed Income, Dodge & Cox
Thomas A. Larsen, Independent Trustee
Senior Counsel, Arnold & Porter LLP
Ann Mather, Independent Trustee
Former Executive Vice President, Chief Financial Officer, and Company Secretary of Pixar Studios
Robert B. Morris III, Independent Trustee
Former Partner and Managing Director of Global Research at Goldman Sachs & Co.
Gary Roughead, Independent Trustee
Annenberg Distinguished Visiting Fellow, Hoover Institution
Mark E. Smith, Independent Trustee
Former Executive Vice President, Managing Director - Fixed Income at Loomis Sayles & Company, L.P.
John B. Taylor, Independent Trustee
Professor of Economics, Stanford University; Senior Fellow, Hoover Institute and former Under Secretary for International Affairs, United States Treasury
John A. Gunn, Senior Vice President
Former Chairman and Chief Executive Officer, Dodge & Cox
Diana S. Strandberg, Senior Vice President
Senior Vice President and Director of International Equity, Dodge & Cox
David H. Longhurst, Treasurer
Vice President and Assistant Treasurer, Dodge & Cox
Thomas M. Mistele, Secretary
Chief Operating Officer, Secretary, and Senior Counsel, Dodge & Cox
Katherine M. Primas, Chief Compliance Officer
Chief Compliance Officer, Dodge & Cox
Additional information about the Trust’s Trustees and Officers is available in the Trust’s Statement of Additional Information (SAI). You can get a free copy of the SAI by visiting the Funds’ website at www.dodgeandcox.com or calling 800-621-3979.
PAGE 19 § DODGE & COX GLOBAL STOCK FUND
| | | | |
| | | | |
www.dodgeandcox.com
For Fund literature, transactions, and account information, please visit the Funds’ website.
or write or call:
DODGE & COX FUNDS
c/o Boston Financial Data Services
P.O. Box 8422
Boston, Massachusetts 02266-8422
(800) 621-3979
INVESTMENT MANAGER
Dodge & Cox
555 California Street, 40th Floor
San Francisco, California 94104
(415) 981-1710
This report is submitted for the general information of the shareholders of the Fund. The report is not authorized for distribution to prospective investors in the Fund unless it is accompanied by a current prospectus.
This report reflects our views, opinions, and portfolio holdings as of June 30, 2014, the end of the reporting period. Any such views are subject to change at any time based upon market or other conditions and Dodge & Cox disclaims any responsibility to update such views. These views may not be relied on as investment advice and, because investment decisions for a Dodge & Cox Fund are based on numerous factors, may not be relied on as an indication of trading intent on behalf of any Dodge & Cox Fund.
6/14 ISF SAR Printed on recycled paper
Semi-Annual Report
June 30, 2014
International Stock Fund
ESTABLISHED 2001
TICKER: DODFX
TO OUR SHAREHOLDERS
The Dodge & Cox International Stock Fund had a total return of 7.9% for the six months ending June 30, 2014, compared to a return of 4.8% for the MSCI EAFE (Europe, Australasia, Far East) Index. On June 30, the Fund had net assets of $62.8 billion with a cash position of 1.5%.
MARKET COMMENTARY
For the first half of 2014, global equity markets were strong: most developed and emerging markets appreciated in both U.S.-dollar and local currency terms. Every sector of the MSCI EAFE generated positive returns. Europe (up 5% in local currency) showed encouraging signs of economic improvement in early 2014. However, manufacturing activity later slowed and economic sentiment fell amid concerns that turmoil in Iraq and an escalation of the Ukraine/Russia crisis could significantly increase oil prices and impact Eurozone growth. Japan (down 3% in local currency) was the worst performing region of the market as investors continued to weigh the efficacy of its structural reform proposals.
Emerging markets were volatile: after performing poorly in the first quarter, they rebounded and finished the six-month period up 5% in local currency. Turkey (up 19%), Indonesia (up 19%), and India (up 18%) were the region’s best performing countries; Russia (down 3%) and China (down 1%) lagged.
The U.S. dollar’s depreciation against the Japanese yen, British pound, and emerging market currencies was a tailwind to performance. While the U.S. dollar’s appreciation against the euro was a headwind, the Fund’s partial hedge of the euro reduced the negative currency impact.
INVESTMENT STRATEGY: FINDING OPPORTUNITIES IN CONNECTIVITY
To construct the portfolio, we employ a consistent and disciplined investment approach that focuses on intensive bottom-up research, a three- to five-year investment horizon, and a strict price discipline. We seek to identify well-established companies that have long-term earnings and cash flow prospects that are not reflected in the current valuation. While we primarily focus on company-
specific factors, we also consider external factors (e.g., industry trends, impact of regulatory policies, legal backdrop) as a component of our research process. These factors are all evaluated in relation to the company’s current valuation, which helps us understand how much optimism or concern is reflected in the stock price.
Investment themes emerge from our bottom-up research. One such theme is connectivity: consumers want instant access to content and the ability to bring their digital world with them wherever they go. Companies are responding to that demand while also creating more ways for individuals to connect with each other. Around the world, cheaper, faster computing technology and improving communications networks are significantly changing the competitive landscape and fueling global consumption of media, internet, and telecommunication services. Over the long term, we believe these tectonic shifts create the potential for high growth for companies that are positioned to capitalize on the opportunities.
Due to faster economic growth, we believe media and internet consumption in emerging markets will continue to outpace that of the developed world. In developing markets, while the absolute number of internet users is large, the percentage of the total population that is using the internet remains low, which creates an attractive long-term growth opportunity. Increased demand for content and communications equipment in emerging markets should also impact future trends in mobile data, wireline broadband penetration, and online video consumption.
The Fund is invested in an array of reasonably valued holdings that are poised to take advantage of these growth opportunities. Examples include media and internet companies (e.g., Naspers(a) with its significant stake in Tencent), telecom services providers (e.g., China Mobile), and network equipment providers (e.g., Ericsson), each of which is described in detail below. On June 30, 16.3% of the Fund was invested in companies driven by “connectivity,” compared to 6.0% for the MSCI EAFE.(b)
PAGE 1 § DODGE & COX INTERNATIONAL STOCK FUND
Naspers
Naspers, a South Africa-based media company, was the Fund’s largest holding at 3.6% on June 30 and has been held in the Fund since 2007. The company is well positioned to benefit from changes in technology and consumer behavior through its three core businesses: satellite pay-TV distribution in Africa; internet businesses in emerging markets such as China, Russia, India, and Poland; and print media in South Africa and Brazil.
Over the past decade, Naspers’ management team has developed a track record of creating value through shrewd investments and partnerships in communication services, e-commerce, online games, and social media. For example, Naspers acquired a stake in Tencent for $32 million in 2001, which is now worth $48 billion. Tencent—the largest internet company in China (over 800 million users)—operates leading online gaming, social networking, communications, and internet portal businesses on both desktop and mobile platforms, and stands to benefit from growth in Chinese internet usage. Naspers’ internet investments also include minority stakes in Mail.Ru (Russia’s leading communications and social networking company), Flipkart (e-commerce in India), and Avito (internet classified sites in Russia), among others. While Tencent enjoys a high valuation, Naspers trades at a discount to the sum of its parts and is reasonably valued in our opinion.
Every company has risks, and Naspers is no exception. Naspers’ businesses are operationally complex and span dozens of countries, some of which are located in politically and economically unstable parts of the world. The competitive landscapes, local laws, and regulatory restrictions in these markets can change rapidly. So far, we believe Naspers’ strategy and operational control have enabled them to navigate these issues successfully and implement best practices across their portfolio of investments.
China Mobile
During the second quarter of 2014, we initiated a position in China Mobile (the largest mobile telecommunications operator in China with over 60% market share and over 70% revenue share); on June 30, the holding represented 0.9% of the Fund. After following the company for years, we were presented with an opportunity to purchase China
Mobile in the Fund at a historically low valuation (three times forward enterprise value to EBITDA(c)).
While the company faces intense competition, margin pressure, and regulatory uncertainty, we believe its scale, significant growth opportunities, and valuation outweigh these concerns. In the Chinese wireless telecom market, China Mobile is a leader in network size, service quality, brand recognition, and balance sheet strength. The company is poised to benefit from industry trends, which include increasing disposable income, urbanization, proliferation of low-cost smartphones, and online video consumption. Furthermore, Chinese telecommunication services companies are currently shielded from foreign competition in their home market.
Ericsson
Over the past decade, global broadband penetration and time spent online have increased dramatically, and we believe this trend will continue. One Fund holding that stands to benefit from such demand growth is Ericsson, a 1.9% position on June 30. Ericsson has a strong presence in mobile broadband—one of the main drivers of connectivity. Based in Sweden, the company has developed mobile and fixed-line communication networks across the globe.
Competition is fierce and technological disruption is always a risk. However, Ericsson is well positioned to benefit from the ongoing rollout and higher utilization of next generation technology based on their share of new orders, large installed base, substantial research and development spending, and managed services operation. Ericsson has a large proportion of recurring revenue that provides some stability to earnings. Moreover, the company has a strong balance sheet, high cash flow, proactive management team with a track record of cutting costs, and reasonable valuation at 1.2 times sales.
IN CLOSING
We continue to see long-term opportunity for international equities as valuations remain reasonable relative to long-term averages: the MSCI EAFE traded at 14.1 times forward estimated earnings and a 3.0% dividend yield on June 30. Corporate balance sheets and cash flows continue to be robust. The Fund is invested in reasonably valued companies that we believe have
DODGE & COX INTERNATIONAL STOCK FUND §PAGE 2
attractive long-term growth opportunities over our three- to five-year investment horizon. Acknowledging that markets can be volatile over the short term, we encourage shareholders to remain focused on the long term.
Thank you for your continued confidence in our firm. As always, we welcome your comments and questions.
For the Board of Trustees,
| | |
| |
|
Charles F. Pohl, Chairman | | Dana M. Emery, President |
July 29, 2014
| (a) | The use of specific examples does not imply that they are more attractive investments than the Fund’s other holdings. |
| (b) | Unless otherwise specified, all weightings and characteristics are as of June 30, 2014. We define “connectivity” to include Telecommunication Services, Cable & Satellite, Internet Software & Services, and Communications Equipment (including Nokia). |
| (c) | EBITDA: Earnings before interest, taxes, depreciation, and amortization. |
PAGE 3 § DODGE & COX INTERNATIONAL STOCK FUND
YEAR-TO-DATE PERFORMANCE REVIEW
The Fund outperformed the MSCI EAFE by 3.1 percentage points year to date.
Key Contributors to Relative Results
| | § | | The Fund’s holdings in emerging market Financials (up 26%) contributed to results. ICICI Bank (up 35%), Kasikornbank (up 33%), Yapi Kredi (up 28%), and Itau Unibanco (up 22%) were particularly strong. | |
| | § | | The Fund’s average underweight position (12% versus 20%) and holdings in Japan (up 7% compared to up 1% for the MSCI EAFE region), the weakest region of the market, aided performance. Fujitsu (up 46%) and Nidec (up 26%) were notable contributors. | |
| | § | | Strong returns from the Fund’s holdings in the Energy sector (up 26% compared to up 13% for the MSCI EAFE sector) helped results. Weatherford International (up 48%), Schlumberger (up 32%), and Saipem (up 26%) performed well. | |
| | § | | Selected additional contributors included Hewlett-Packard (up 22%), Lafarge (up 16%), and Naspers (up 12%). | |
Key Detractors from Relative Results
| | § | | In Europe & UK Financials, selected Fund holdings detracted from results, especially Barclays (down 18%), Standard Chartered (down 7%), and Credit Suisse Group (down 4%). | |
| | § | | Weak relative returns from the Fund’s holdings in the Health Care sector (up 6% compared to up 12% for the MSCI EAFE sector) hindered performance. Sanofi (up 3%) and Bayer (up 2%) lagged. | |
| | § | | The Fund’s underweight position in the Utilities sector (no holdings versus average 4% for the MSCI EAFE sector), the strongest sector of the market (up 14%), hurt results. | |
| | § | | Selected additional detractors included America Movil (down 11%), Philips (down 11%), and Nintendo (down 10%). | |
KEY CHARACTERISTICS OF DODGE & COX
Independent Organization
Dodge & Cox is one of the largest privately owned investment managers in the world. We remain committed to independence, with a goal of providing the highest quality investment management service to our existing clients.
Over 80 Years of Investment Experience
Dodge & Cox was founded in 1930. We have a stable and well-qualified team of investment professionals, most of whom have spent their entire careers at Dodge & Cox.
Experienced Investment Team
The International Investment Policy Committee, which is the decision-making body for the International Stock Fund, is an nine-member committee with an average tenure at Dodge & Cox of 24 years.
One Business with a Single Research Office
Dodge & Cox manages equity (domestic, international, and global), fixed income (domestic and global), and balanced investments, operating from one office in San Francisco.
Consistent Investment Approach
Our team decision-making process involves thorough, bottom-up fundamental analysis of each investment.
Long-Term Focus and Low Expenses
We invest with a three- to five-year investment horizon, which has historically resulted in low turnover relative to our peers. We manage Funds that maintain low expense ratios.
Risks: The Fund is subject to stock market risk, meaning stocks in the Fund may decline in value for extended periods due to the financial prospects of individual companies, or due to general market and economic conditions. Investing in non-U.S. securities may entail risk due to foreign economic and political developments; this risk may be increased when investing in emerging markets. The Fund is also subject to currency risk. Please read the prospectus and summary prospectus for specific details regarding the Fund’s risk profile.
DODGE & COX INTERNATIONAL STOCK FUND §PAGE 4
GROWTH OF $10,000 OVER 10 YEARS
FOR AN INVESTMENT MADE ON JUNE 30, 2004
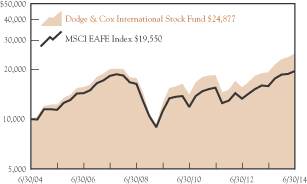
AVERAGE ANNUAL TOTAL RETURN
FOR PERIODS ENDED JUNE 30, 2014
| | | | | | | | | | | | | | | | |
| | | 1 Year | | | 3 Years | | | 5 Years | | | 10 Years | |
Dodge & Cox International
Stock Fund | | | 29.31 | % | | | 10.41 | % | | | 14.89 | % | | | 9.55 | % |
MSCI EAFE | | | 23.57 | | | | 8.10 | | | | 11.77 | | | | 6.93 | |
Returns represent past performance and do not guarantee future results. Investment return and share price will fluctuate with market conditions, and investors may have a gain or loss when shares are sold. Fund performance changes over time and currently may be significantly lower than stated. Performance is updated and published monthly. Visit the Fund’s website at www.dodgeandcox.com or call 800-621-3979 for current performance figures.
The Fund’s total returns include the reinvestment of dividend and capital gain distributions, but have not been adjusted for any income taxes payable by shareholders on these distributions or on Fund share redemptions. Index returns include dividends but, unlike Fund returns, do not reflect fees or expenses. The MSCI EAFE (Europe, Australasia, Far East) Index is a broad-based, unmanaged equity market index aggregated from 21 developed market country indices, excluding the United States and Canada. MSCI makes no express or implied warranties or representations and shall have no liability whatsoever with respect to any MSCI data contained herein. The MSCI data may not be further redistributed or used as a basis for other indices or any securities or financial products. This report is not approved, reviewed, or produced by MSCI.
MSCI EAFE is a service mark of MSCI Barra.
FUND EXPENSE EXAMPLE
As a Fund shareholder, you incur ongoing Fund costs, including management fees and other Fund expenses. All mutual funds have ongoing costs, sometimes referred to as operating expenses. The following example shows ongoing costs of investing in the Fund and can help you understand these costs and compare them with those of other mutual funds. The example assumes a $1,000 investment held for the six months indicated.
ACTUAL EXPENSES
The first line of the table below provides information about actual account values and expenses based on the Fund’s actual returns. You may use the information in this line, together with your account balance, to estimate the expenses that you paid over the period. Simply divide your account value by $1,000 (for example, an $8,600 account value divided by $1,000 = 8.6), then multiply the result by the number in the first line under the heading “Expenses Paid During Period” to estimate the expenses you paid on your account during this period.
HYPOTHETICAL EXAMPLE FOR COMPARISON WITH OTHER MUTUAL FUNDS
Information on the second line of the table can help you compare ongoing costs of investing in the Fund with those of other mutual funds. This information may not be used to estimate the actual ending account balance or expenses you paid during the period. The hypothetical “Ending Account Value” is based on the actual expense ratio of the Fund and an assumed 5% annual rate of return before expenses (not the Fund’s actual return). The amount under the heading “Expense Paid During the Period” shows the hypothetical expenses your account would have incurred under this scenario. You can compare this figure with the 5% hypothetical examples that appear in shareholder reports of other mutual funds.
| | | | | | | | | | | | |
Six Months Ended June 30, 2014 | | Beginning Account Value
1/1/2014 | | | Ending Account Value
6/30/2014 | | | Expenses Paid During Period* | |
Based on Actual Fund Return | | $ | 1,000.00 | | | $ | 1,079.00 | | | $ | 3.35 | |
Based on Hypothetical 5% Yearly Return | | | 1,000.00 | | | | 1,021.57 | | | | 3.26 | |
| * | Expenses are equal to the Fund’s annualized expense ratio of 0.65%, multiplied by the average account value over the period, multiplied by 181/365 (to reflect the one-half year period). |
The expenses shown in the table highlight ongoing costs only and do not reflect any transactional fees or account maintenance fees. Though other mutual funds may charge such fees, please note that the Fund does not charge transaction fees (e.g., redemption fees, sales loads) or universal account maintenance fees (e.g., small account fees).
PAGE 5 § DODGE & COX INTERNATIONAL STOCK FUND
| | | | |
| FUND INFORMATION | | | June 30, 2014 | |
| | | | |
| GENERAL INFORMATION | | | |
Net Asset Value Per Share | | | $46.44 | |
Total Net Assets (billions) | | | $62.8 | |
2013 Expense Ratio (per 5/1/14 Prospectus) | | | 0.64% | |
Expense Ratio (1/1/14 to 6/30/14, annualized) | | | 0.65% | |
Portfolio Turnover Rate
(1/1/14 to 6/30/14, unannualized) | | | 7% | |
30-Day SEC Yield(a) | | | 1.53% | |
Fund Inception | | | 2001 | |
No sales charges or distribution fees | | | | |
Investment Manager: Dodge & Cox, San Francisco. Managed by the International Investment Policy Committee, whose nine members’ average tenure at Dodge & Cox is 24 years.
| | | | | | | | |
| PORTFOLIO CHARACTERISTICS | | Fund | | | MSCI
EAFE | |
Number of Equity Securities | | | 79 | | | | 899 | |
Median Market Capitalization (billions) | | | $26 | | | | $9 | |
Weighted Average Market Capitalization (billions) | | | $76 | | | | $64 | |
Price-to-Earnings Ratio(b) | | | 12.4x | | | | 14.1x | |
Countries Represented | | | 24 | | | | 21 | |
Emerging Markets (Brazil, China, India, Mexico, South Africa, South Korea, Thailand, Turkey, United Arab Emirates) | | | 22.2% | | | | 0.0% | |
| | | | |
| TEN LARGEST HOLDINGS(c) | | Fund | |
Naspers, Ltd. (South Africa) | | | 3.6 | % |
Roche Holding AG (Switzerland) | | | 3.5 | |
Novartis AG (Switzerland) | | | 3.2 | |
Sanofi (France) | | | 3.0 | |
GlaxoSmithKline PLC (United Kingdom) | | | 2.9 | |
Lafarge SA (France) | | | 2.7 | |
Hewlett-Packard Co. (United States) | | | 2.6 | |
Credit Suisse Group AG (Switzerland) | | | 2.4 | |
Samsung Electronics Co., Ltd. (South Korea) | | | 2.4 | |
Schlumberger, Ltd. (United States) | | | 2.3 | |
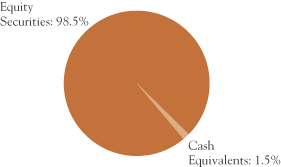
| | | | | | | | |
| REGION DIVERSIFICATION(d) | | Fund | | | MSCI
EAFE | |
Europe (excluding United Kingdom) | | | 45.4 | % | | | 45.7 | % |
United Kingdom | | | 14.1 | | | | 21.4 | |
Japan | | | 11.9 | | | | 20.2 | |
Pacific (excluding Japan) | | | 10.0 | | | | 12.2 | |
Africa/Middle East | | | 6.1 | | | | 0.5 | |
Latin America | | | 5.7 | | | | 0.0 | |
United States | | | 5.3 | | | | 0.0 | |
| | | | | | | | |
| SECTOR DIVERSIFICATION | | Fund | | | MSCI
EAFE | |
Financials | | | 25.4 | % | | | 25.3 | % |
Information Technology | | | 16.0 | | | | 4.4 | |
Health Care | | | 14.6 | | | | 10.5 | |
Consumer Discretionary | | | 12.4 | | | | 11.9 | |
Industrials | | | 7.9 | | | | 12.7 | |
Energy | | | 7.7 | | | | 7.3 | |
Telecommunication Services | | | 6.7 | | | | 4.9 | |
Materials | | | 4.5 | | | | 8.0 | |
Consumer Staples | | | 3.3 | | | | 11.1 | |
Utilities | | | 0.0 | | | | 3.9 | |
| (a) | SEC Yield is an annualization of the Fund’s total net investment income per share for the 30-day period ended on the last day of the month. |
| (b) | Price-to-earnings (P/E) ratios are calculated using 12-month forward earnings estimates from third-party sources. |
| (c) | The Fund’s portfolio holdings are subject to change without notice. The mention of specific securities is not a recommendation to buy, sell, or hold any particular security and is not indicative of Dodge & Cox’s current or future trading activity. |
| (d) | The Fund may classify a company in a different category than the MSCI EAFE. The Fund generally classifies a company based on its country of incorporation, but may designate a different country in certain circumstances. |
DODGE & COX INTERNATIONAL STOCK FUND §PAGE 6
| | | | |
| CONSOLIDATED PORTFOLIO OF INVESTMENTS (unaudited) | | | June 30, 2014 | |
| | | | | | | | |
| COMMON STOCKS: 95.4% | |
| | |
| | | SHARES | | | VALUE | |
| CONSUMER DISCRETIONARY: 12.4% | |
AUTOMOBILES & COMPONENTS: 4.7% | | | | | |
Bayerische Motoren Werke AG (Germany) | | | 7,886,400 | | | $ | 1,000,189,468 | |
Honda Motor Co., Ltd. (Japan) | | | 13,930,000 | | | | 486,357,139 | |
Honda Motor Co., Ltd. ADR (Japan) | | | 6,758,400 | | | | 236,476,416 | |
Mahindra & Mahindra, Ltd. (India) | | | 13,923,429 | | | | 265,759,357 | |
NGK Spark Plug Co., Ltd.(b) (Japan) | | | 16,720,000 | | | | 471,701,890 | |
Yamaha Motor Co., Ltd.(b) (Japan) | | | 28,851,100 | | | | 496,396,696 | |
| | | | | | | | |
| | | | | | | 2,956,880,966 | |
CONSUMER DURABLES & APPAREL: 1.6% | | | | | |
Panasonic Corp. (Japan) | | | 84,087,034 | | | | 1,024,267,311 | |
|
MEDIA: 6.1% | |
Grupo Televisa SAB ADR (Mexico) | | | 19,560,592 | | | | 671,123,912 | |
Liberty Global PLC, Series A(a) (United Kingdom) | | | 2,481,805 | | | | 109,745,417 | |
Liberty Global PLC, Series C(a) (United Kingdom) | | | 12,159,294 | | | | 514,459,729 | |
Naspers, Ltd. (South Africa) | | | 19,220,895 | | | | 2,262,770,149 | |
Television Broadcasts, Ltd.(b) (Hong Kong) | | | 40,022,900 | | | | 259,748,125 | |
| | | | | | | | |
| | | | | | | 3,817,847,332 | |
| | | | | | | | |
| | | | | | | 7,798,995,609 | |
| CONSUMER STAPLES: 3.3% | |
FOOD, BEVERAGE & TOBACCO: 3.3% | |
Anadolu Efes Biracilik ve Malt Sanayii AS(a) (Turkey) | | | 27,801,444 | | | | 340,530,290 | |
Imperial Tobacco Group PLC (United Kingdom) | | | 20,576,000 | | | | 926,121,951 | |
Unilever PLC (United Kingdom) | | | 17,694,000 | | | | 802,762,781 | |
| | | | | | | | |
| | | | 2,069,415,022 | |
| ENERGY: 6.6% | |
Royal Dutch Shell PLC ADR (United Kingdom) | | | 10,895,316 | | | | 897,447,179 | |
Saipem SPA(a) (Italy) | | | 21,970,000 | | | | 592,645,488 | |
Schlumberger, Ltd. (Curacao/United States) | | | 12,452,217 | | | | 1,468,738,995 | |
Total SA (France) | | | 6,218,600 | | | | 449,428,602 | |
Weatherford International PLC(a) (Ireland) | | | 31,300,592 | | | | 719,913,616 | |
| | | | | | | | |
| | | | | | | 4,128,173,880 | |
| FINANCIALS: 24.0% | |
BANKS: 14.9% | |
Banco Santander SA (Spain) | | | 56,745,750 | | | | 592,866,045 | |
Barclays PLC (United Kingdom) | | | 243,284,698 | | | | 886,008,515 | |
BNP Paribas SA (France) | | | 7,764,558 | | | | 526,763,010 | |
HSBC Holdings PLC (United Kingdom) | | | 120,904,921 | | | | 1,226,808,867 | |
ICICI Bank, Ltd. (India) | | | 42,074,757 | | | | 990,325,542 | |
| | | | | | | | |
| | |
| | | SHARES | | | VALUE | |
Kasikornbank PCL- Foreign(b) (Thailand) | | | 123,326,527 | | | $ | 778,984,379 | |
Lloyds Banking Group PLC(a) (United Kingdom) | | | 402,000,000 | | | | 510,827,171 | |
Mitsubishi UFJ Financial Group, Inc. (Japan) | | | 93,599,900 | | | | 573,767,710 | |
Siam Commercial Bank PCL- Foreign (Thailand) | | | 64,411,500 | | | | 334,411,886 | |
Standard Bank Group, Ltd. (South Africa) | | | 28,198,309 | | | | 384,462,135 | |
Standard Chartered PLC (United Kingdom) | | | 58,043,001 | | | | 1,186,057,280 | |
UniCredit SPA (Italy) | | | 104,607,464 | | | | 875,906,672 | |
Yapi ve Kredi Bankasi AS(b) (Turkey) | | | 234,711,168 | | | | 511,831,208 | |
| | | | | | | | |
| | | | | | | 9,379,020,420 | |
DIVERSIFIED FINANCIALS: 3.7% | |
Credit Suisse Group AG (Switzerland) | | | 52,647,105 | | | | 1,505,559,972 | |
Deutsche Boerse AG (Germany) | | | 5,992,000 | | | | 465,050,746 | |
Haci Omer Sabanci Holding AS (Turkey) | | | 75,195,354 | | | | 351,025,229 | |
| | | | | | | | |
| | | | 2,321,635,947 | |
INSURANCE: 3.5% | |
AEGON NV (Netherlands) | | | 84,800,199 | | | | 740,129,356 | |
Aviva PLC (United Kingdom) | | | 1,116,401 | | | | 9,753,656 | |
Dai-ichi Life Insurance Co., Ltd. (Japan) | | | 25,835,100 | | | | 384,829,632 | |
Swiss Life Holding AG (Switzerland) | | | 688,429 | | | | 163,257,351 | |
Swiss Re AG (Switzerland) | | | 10,171,868 | | | | 905,007,200 | |
| | | | | | | | |
| | | | 2,202,977,195 | |
REAL ESTATE: 1.9% | |
BR Malls Participacoes SA(b) (Brazil) | | | 54,767,300 | | | | 465,999,203 | |
Hang Lung Group, Ltd.(b) (Hong Kong) | | | 84,006,200 | | | | 454,693,963 | |
Hang Lung Properties, Ltd. (Hong Kong) | | | 77,426,300 | | | | 238,760,396 | |
| | | | | | | | |
| | | | 1,159,453,562 | |
| | | | | | | | |
| | | | 15,063,087,124 | |
| HEALTH CARE: 14.6% | |
PHARMACEUTICALS, BIOTECHNOLOGY & LIFE SCIENCES: 14.6% | |
Bayer AG (Germany) | | | 9,195,350 | | | | 1,298,781,805 | |
GlaxoSmithKline PLC (United Kingdom) | | | 27,520,000 | | | | 736,608,382 | |
GlaxoSmithKline PLC ADR (United Kingdom) | | | 19,853,749 | | | | 1,061,778,497 | |
Novartis AG (Switzerland) | | | 5,260,000 | | | | 476,294,542 | |
Novartis AG ADR (Switzerland) | | | 16,305,000 | | | | 1,476,091,650 | |
Roche Holding AG (Switzerland) | | | 7,395,400 | | | | 2,205,777,289 | |
Sanofi (France) | | | 17,944,120 | | | | 1,906,209,544 | |
| | | | | | | | |
| | | | 9,161,541,709 | |
| | |
| PAGE 7 § DODGE & COX INTERNATIONAL STOCK FUND | | See accompanying Notes to Consolidated Financial Statements |
| | | | |
| CONSOLIDATED PORTFOLIO OF INVESTMENTS (unaudited) | | | June 30, 2014 | |
| | | | | | | | |
| COMMON STOCKS (continued) | |
| | |
| | | SHARES | | | VALUE | |
| INDUSTRIALS: 7.9% | |
CAPITAL GOODS: 6.4% | |
Koninklijke Philips NV (Netherlands) | | | 39,128,780 | | | $ | 1,241,694,477 | |
Mitsubishi Electric Corp. (Japan) | | | 72,994,800 | | | | 900,681,111 | |
Nidec Corp.(b) (Japan) | | | 11,260,700 | | | | 690,948,238 | |
Schneider Electric SA (France) | | | 11,909,546 | | | | 1,121,157,452 | |
Wienerberger AG(b) (Austria) | | | 4,135,764 | | | | 69,373,010 | |
| | | | | | | | |
| | | | 4,023,854,288 | |
COMMERCIAL & PROFESSIONAL SERVICES: 1.2% | |
ADT Corp. (United States) | | | 7,476,860 | | | | 261,241,488 | |
Tyco International, Ltd. (Switzerland) | | | 11,478,920 | | | | 523,438,752 | |
| | | | | | | | |
| | | | 784,680,240 | |
TRANSPORTATION: 0.3% | |
DP World, Ltd. (United Arab Emirates) | | | 8,122,304 | | | | 160,009,389 | |
| | | | | | | | |
| | | | 4,968,543,917 | |
| INFORMATION TECHNOLOGY: 15.4% | |
SEMICONDUCTORS & SEMICONDUCTOR EQUIPMENT: 3.1% | |
Infineon Technologies AG(b) (Germany) | | | 63,788,456 | | | | 797,377,536 | |
Samsung Electronics Co., Ltd. (South Korea) | | | 866,892 | | | | 1,132,665,768 | |
| | | | | | | | |
| | | | 1,930,043,304 | |
SOFTWARE & SERVICES: 3.3% | |
Baidu, Inc. ADR(a) (Cayman Islands/China) | | | 3,666,487 | | | | 684,936,437 | |
Fujitsu, Ltd.(b) (Japan) | | | 103,523,000 | | | | 775,617,758 | |
Nintendo Co., Ltd. (Japan) | | | 5,248,000 | | | | 628,122,995 | |
| | | | | | | | |
| | | | 2,088,677,190 | |
TECHNOLOGY, HARDWARE & EQUIPMENT: 9.0% | |
Brother Industries, Ltd.(b) (Japan) | | | 18,185,100 | | | | 315,037,269 | |
Hewlett-Packard Co. (United States) | | | 48,309,204 | | | | 1,627,053,991 | |
Kyocera Corp. (Japan) | | | 10,467,800 | | | | 496,808,473 | |
Nokia Oyj (Finland) | | | 165,879,200 | | | | 1,256,075,552 | |
TE Connectivity, Ltd. (Switzerland) | | | 12,270,462 | | | | 758,805,370 | |
Telefonaktiebolaget LM Ericsson (Sweden) | | | 100,522,200 | | | | 1,214,862,966 | |
| | | | | | | | |
| | | | 5,668,643,621 | |
| | | | | | | | |
| | | | 9,687,364,115 | |
| MATERIALS: 4.5% | |
Akzo Nobel NV (Netherlands) | | | 4,514,675 | | | | 338,461,531 | |
Lafarge SA(b) (France) | | | 19,364,291 | | | | 1,681,084,553 | |
Lanxess AG (Germany) | | | 3,441,980 | | | | 232,332,472 | |
Linde AG (Germany) | | | 2,860,205 | | | | 608,229,271 | |
| | | | | | | | |
| | | | | | | 2,860,107,827 | |
| | | | | | | | |
| | |
| | | SHARES | | | VALUE | |
| TELECOMMUNICATION SERVICES: 6.7% | |
America Movil SAB de CV, Series L (Mexico) | | | 823,315,000 | | | $ | 855,458,142 | |
Bharti Airtel, Ltd. (India) | | | 39,912,904 | | | | 222,641,604 | |
China Mobile, Ltd. (Hong Kong/China) | | | 61,178,900 | | | | 593,602,044 | |
Millicom International Cellular SA SDR(b) (Luxembourg) | | | 9,571,863 | | | | 876,739,702 | |
MTN Group, Ltd. (South Africa) | | | 47,590,300 | | | | 1,002,327,344 | |
Telecom Italia SPA(a) (Italy) | | | 201,500,000 | | | | 255,220,457 | |
Telecom Italia SPA- RSP (Italy) | | | 316,735,486 | | | | 312,918,873 | |
Telekom Austria AG(e) (Austria) | | | 12,767,576 | | | | 124,826,089 | |
| | | | | | | | |
| | | | | | | 4,243,734,255 | |
| | | | | | | | |
TOTAL COMMON STOCKS
(Cost $48,831,390,908) | | | $ | 59,980,963,458 | |
|
| PREFERRED STOCKS: 3.1% | |
| ENERGY: 1.1% | |
Petroleo Brasileiro SA ADR (Brazil) | | | 42,536,000 | | | | 665,263,040 | |
|
| FINANCIALS: 1.4% | |
BANKS: 1.4% | |
Itau Unibanco Holding SA (Brazil) | | | 63,266,350 | | | | 915,422,136 | |
|
| INFORMATION TECHNOLOGY: 0.6% | |
SEMICONDUCTORS & SEMICONDUCTOR EQUIPMENT: 0.6% | |
Samsung Electronics Co., Ltd. (South Korea) | | | 339,887 | | | | 356,078,494 | |
| | | | | | | | |
TOTAL PREFERRED STOCKS
(Cost $1,847,359,576) | | | $ | 1,936,763,670 | |
| | |
| See accompanying Notes to Consolidated Financial Statements | | DODGE & COX INTERNATIONAL STOCK FUND §PAGE 8 |
| | | | |
| CONSOLIDATED PORTFOLIO OF INVESTMENTS (unaudited) | | | June 30, 2014 | |
| | | | | | | | |
|
| SHORT-TERM INVESTMENTS: 1.3% | |
| | |
| | | PAR VALUE | | | VALUE | |
MONEY MARKET FUND: 0.2% | |
SSgA U.S. Treasury Money
Market Fund | | $ | 124,629,876 | | | | 124,629,876 | |
|
REPURCHASE AGREEMENT: 1.1% | |
Fixed Income Clearing Corporation(c) 0.00%, dated 6/30/14, due 7/1/14, maturity value $660,254,373 | | | 660,254,373 | | | | 660,254,373 | |
|
TREASURY BILL: 0.0%(d) | |
Sweden Treasury Bill (Sweden) 9/17/14 | | | 131,955,000 | | | | 19,728,646 | |
| | | | | | | | |
TOTAL SHORT-TERM INVESTMENTS
(Cost $804,774,048) | | | $ | 804,612,895 | |
| | | | | | | | |
TOTAL INVESTMENTS
(Cost $51,483,524,532) | | | 99.8 | % | | $ | 62,722,340,023 | |
OTHER ASSETS LESS LIABILITIES | | | 0.2 | % | | | 102,240,207 | |
| | | | | | | | |
| NET ASSETS | | | 100.0 | % | | $ | 62,824,580,230 | |
| | | | | | | | |
| (b) | See Note 9 regarding holdings of 5% voting securities |
| (c) | Repurchase agreement is collateralized by U.S. Treasury Note 1.000%-3.375%, 2/18/19-1/31/20. Total collateral value is $673,466,841. |
| (e) | Security held by Dodge & Cox International Stock Fund Cayman, Ltd., a wholly-owned subsidiary of the Fund. See Note 1. |
In determining a company’s country designation, the Fund generally references the country of incorporation. In cases where the Fund considers the country of incorporation to be a “jurisdiction of convenience” chosen primarily for tax purposes, the Fund uses the country designation of an appropriate broad-based market index. In that circumstance, two countries are listed - the country of incorporation and the country designated by an appropriate index, respectively.
ADR: American Depositary Receipt
SDR: Swedish Depository Receipt
FORWARD CURRENCY CONTRACTS
| | | | | | | | | | | | | | | | |
| | | | | | Contract Amount | | | | |
| Counterparty | | Settlement
Date | | | Receive
U.S. Dollar | | | Deliver
Foreign
Currency | | | Unrealized
Appreciation/
(Depreciation) | |
Contracts to sell EUR: | | | | | |
Citibank | | | 8/6/2014 | | | | 970,445,100 | | | | 700,000,000 | | | $ | 11,808,659 | |
JPMorgan | | | 8/13/2014 | | | | 698,800,000 | | | | 500,000,000 | | | | 14,041,582 | |
UBS | | | 8/13/2014 | | | | 695,557,500 | | | | 500,000,000 | | | | 10,799,082 | |
Credit Suisse | | | 8/27/2014 | | | | 680,235,000 | | | | 500,000,000 | | | | (4,559,625 | ) |
Deutsche Bank | | | 9/10/2014 | | | | 680,800,000 | | | | 500,000,000 | | | | (4,030,142 | ) |
Barclays | | | 9/17/2014 | | | | 678,189,000 | | | | 500,000,000 | | | | (6,658,642 | ) |
HSBC | | | 9/17/2014 | | | | 406,911,000 | | | | 300,000,000 | | | | (3,997,585 | ) |
| | | | | | | | | | | | | | | | |
| | | | | | | | | | | | | | $ | 17,403,329 | |
| | | | | | | | | | | | | | | | |
| | | | | | | | | | | | | | | | | |
| | |
| PAGE 9 § DODGE & COX INTERNATIONAL STOCK FUND | | See accompanying Notes to Consolidated Financial Statements |
| | | | |
CONSOLIDATED STATEMENT OF ASSETS AND LIABILITIES
(unaudited) | |
| |
| | | June 30, 2014 | |
ASSETS: | | | | |
Investments, at value | | | | |
Unaffiliated issuers (cost $45,229,413,659) | | $ | 54,837,127,741 | |
Affiliated issuers (cost $6,254,110,873) | | | 7,885,212,282 | |
| | | | |
| | | 62,722,340,023 | |
Cash | | | 100 | |
Cash denominated in foreign currency (cost $15,555,230) | | | 15,556,510 | |
Unrealized appreciation on forward currency contracts | | | 36,649,323 | |
Receivable for Fund shares sold | | | 141,052,945 | |
Dividends and interest receivable | | | 198,965,645 | |
Prepaid expenses and other assets | | | 169,966 | |
| | | | |
| | | 63,114,734,512 | |
| | | | |
LIABILITIES: | | | | |
Payable for investments purchased | | | 164,514,669 | |
Unrealized depreciation on forward currency contracts | | | 19,245,994 | |
Payable for Fund shares redeemed | | | 69,952,738 | |
Management fees payable | | | 30,708,371 | |
Accrued expenses | | | 5,732,510 | |
| | | | |
| | | 290,154,282 | |
| | | | |
NET ASSETS | | $ | 62,824,580,230 | |
| | | | |
NET ASSETS CONSIST OF: | | | | |
Paid in capital | | $ | 54,950,784,422 | |
Undistributed net investment income | | | 1,253,566,428 | |
Accumulated net realized loss | | | (4,639,136,420 | ) |
Net unrealized appreciation | | | 11,259,365,800 | |
| | | | |
| | $ | 62,824,580,230 | |
| | | | |
Fund shares outstanding (par value $0.01 each, unlimited shares authorized) | | | 1,352,745,975 | |
Net asset value per share | | $ | 46.44 | |
|
CONSOLIDATED STATEMENT OF OPERATIONS
(unaudited) | |
| |
| | | Six Months Ended
June 30, 2014 | |
INVESTMENT INCOME: | | | | |
Dividends (net of foreign taxes of $92,072,155) | | | | |
Unaffiliated issuers | | $ | 1,340,505,850 | |
Affiliated issuers | | | 88,471,572 | |
Interest | | | 70,321 | |
| | | | |
| | | 1,429,047,743 | |
| | | | |
EXPENSES: | | | | |
Management fees | | | 169,895,555 | |
Custody and fund accounting fees | | | 3,485,825 | |
Transfer agent fees | | | 3,810,345 | |
Professional services | | | 299,451 | |
Shareholder reports | | | 4,187,982 | |
Registration fees | | | 841,550 | |
Trustees’ fees | | | 139,442 | |
Miscellaneous | | | 1,382,150 | |
| | | | |
| | | 184,042,300 | |
| | | | |
NET INVESTMENT INCOME | | | 1,245,005,443 | |
| | | | |
|
REALIZED AND UNREALIZED GAIN (LOSS): | |
Net realized gain (loss) | | | | |
Investments in unaffiliated issuers | | | 626,662,097 | |
Investments in affiliated issuers | | | 104,704,756 | |
Forward currency contracts | | | (16,148,522 | ) |
Foreign currency transactions | | | (1,228,980 | ) |
Net change in unrealized appreciation/depreciation | | | | |
Investments | | | 2,458,382,700 | |
Forward currency contracts | | | 50,309,127 | |
Foreign currency translation | | | 674,670 | |
| | | | |
Net realized and unrealized gain | | | 3,223,355,848 | |
| | | | |
NET INCREASE IN NET ASSETS
FROM OPERATIONS | | $ | 4,468,361,291 | |
| | | | |
| | | | | | | | |
CONSOLIDATED STATEMENT OF CHANGES IN NET ASSETS
(unaudited) | |
| | |
| | | Six Months Ended
June 30, 2014 | | | Year Ended
December 31, 2013 | |
OPERATIONS: | | | | | | | | |
Net investment income | | $ | 1,245,005,443 | | | $ | 857,085,157 | |
Net realized gain | | | 713,989,351 | | | | 1,263,721,541 | |
Net change in unrealized appreciation/depreciation | | | 2,509,366,497 | | | | 8,796,530,991 | |
| | | | | | | | |
| | | 4,468,361,291 | | | | 10,917,337,689 | |
| | | | | | | | |
| |
DISTRIBUTIONS TO
SHAREHOLDERS FROM: | | | | | |
Net investment income | | | — | | | | (852,149,250 | ) |
Net realized gain | | | — | | | | — | |
| | | | | | | | |
Total distributions | | | — | | | | (852,149,250 | ) |
| | | | | | | | |
| | |
FUND SHARE TRANSACTIONS: | | | | | | | | |
Proceeds from sale of shares | | | 8,246,663,441 | | | | 9,707,933,665 | |
Reinvestment of distributions | | | — | | | | 718,344,743 | |
Cost of shares redeemed | | | (3,506,661,460 | ) | | | (7,431,440,582 | ) |
| | | | | | | | |
Net increase from Fund share transactions | | | 4,740,001,981 | | | | 2,994,837,826 | |
| | | | | | | | |
Total increase in net assets | | | 9,208,363,272 | | | | 13,060,026,265 | |
| |
NET ASSETS: | | | | | |
Beginning of period | | | 53,616,216,958 | | | | 40,556,190,693 | |
| | | | | | | | |
End of period (including undistributed net investment income of $1,253,566,428 and $8,560,984, respectively) | | $ | 62,824,580,230 | | | $ | 53,616,216,958 | |
| | | | | | | | |
| | |
SHARE INFORMATION: | | | | | | | | |
Shares sold | | | 186,750,783 | | | | 250,919,903 | |
Distributions reinvested | | | — | | | | 17,172,926 | |
Shares redeemed | | | (79,810,234 | ) | | | (193,199,816 | ) |
| | | | | | | | |
Net increase in shares outstanding | | | 106,940,549 | | | | 74,893,013 | |
| | | | | | | | |
| | |
| See accompanying Notes to Consolidated Financial Statements | | DODGE & COX INTERNATIONAL STOCK FUND §PAGE 10 |
NOTES TO CONSOLIDATED FINANCIAL STATEMENTS (unaudited)
NOTE 1—ORGANIZATION AND SIGNIFICANT ACCOUNTING POLICIES
Dodge & Cox International Stock Fund (the “Fund”) is one of the series constituting the Dodge & Cox Funds (the “Trust” or the “Funds”). The Trust is organized as a Delaware statutory trust and is registered under the Investment Company Act of 1940, as amended, as an open-end management investment company. The Fund commenced operations on May 1, 2001, and seeks long-term growth of principal and income. The Fund invests primarily in a diversified portfolio of foreign equity securities. Foreign investing, especially in developing countries, has special risks such as currency and market volatility and political and social instability. These and other risk considerations are discussed in the Fund’s Prospectus.
The financial statements have been prepared in conformity with accounting principles generally accepted in the United States of America, which require the use of estimates and assumptions by management. Actual results may differ from those estimates. Significant accounting policies are as follows:
Security valuation The Fund’s net assets are valued as of the close of trading on the New York Stock Exchange (NYSE), generally 4:00 p.m. Eastern Time, each day that the NYSE is open for business. Portfolio securities and other financial instruments for which market quotes are readily available are valued at market value. Listed securities are generally valued using the official quoted close price or the last sale on the exchange that is determined to be the primary market for the security. Security values are not discounted based on the size of the Fund’s position. Short-term securities less than 60 days to maturity may be valued at amortized cost if amortized cost approximates current value.
Investments initially valued in currencies other than the U.S. dollar are converted to the U.S. dollar using prevailing exchange rates. As a result, the Fund’s net assets may be affected by changes in the value of currencies in relation to the U.S. dollar.
If market quotations are not readily available or if a security’s value has materially changed after the close of the security’s primary market but before the close of trading on the NYSE, the security is valued at fair value as determined in good faith by or under the direction of the
Board of Trustees. The Fund may use fair value pricing in calculating its net asset value per share (NAV) when, for example, (i) the primary market for a security is closed or if trading of a security is suspended or limited, (ii) the Fund determines that the price provided by a pricing service is inaccurate or unreliable, or (iii) the Fund determines that a significant event affecting the value of a security has occurred before the close of the NYSE but after the close of the security’s primary market. An event is considered significant if there is both an affirmative expectation that the security’s value will materially change in response to the event and a reasonable basis exists for quantifying a resulting change in value. Because trading in securities on most foreign exchanges is normally completed before the close of the NYSE, the value of non-U.S. securities can change by the time the Fund calculates its NAV. To address these changes, the Fund may utilize adjustment factors provided by an independent pricing service to systematically value non-U.S. securities at fair value. These adjustment factors are based on statistical analyses of subsequent movements and changes in securities indices, specific security prices, and exchange rates in foreign markets.
The Board of Trustees has delegated authority to Dodge & Cox, the Fund’s investment manager, to make fair value determinations in accordance with the Dodge & Cox Funds Valuation Policies (“Valuation Policies”), subject to Board oversight. Dodge & Cox has established a Pricing Committee that is comprised of representatives from Treasury, Legal, Compliance, and Operations. The Pricing Committee is responsible for implementing the Valuation Policies, including determining the fair value of securities when market quotations or market-based valuations are not readily available or are deemed unreliable. The Pricing Committee considers relevant indications of value that are reasonably available to it in determining the fair value assigned to a particular security, such as the value of similar financial instruments, trading volumes, contractual restrictions on disposition, related corporate actions, and changes in economic conditions.
Valuing securities at fair value involves greater reliance on judgment than valuation of securities based on readily available market quotations. In some instances, lack of information and uncertainty as to the significance of
PAGE 11 § DODGE & COX INTERNATIONAL STOCK FUND
NOTES TO CONSOLIDATED FINANCIAL STATEMENTS (unaudited)
information may lead to a conclusion that a prior valuation is the best indication of a security’s present value. When fair value pricing is employed, the prices of securities used by the Fund to calculate its net asset value may differ from quoted or published prices for the same securities.
Security transactions, investment income, expenses, and distributions Security transactions are recorded on the trade date. Realized gains and losses on securities sold are determined on the basis of identified cost.
Dividend income and corporate action transactions are recorded on the ex-dividend date, or when the Fund first learns of the dividend/corporate action if the ex-dividend date has passed. Non-cash dividends included in dividend income, if any, are recorded at the fair market value of the securities received. Dividends characterized as return of capital for U.S. tax purposes are recorded as a reduction of cost of investments and/or realized gain. Interest income is recorded on the accrual basis.
Expenses are recorded on the accrual basis. Most expenses of the Trust can be directly attributed to a specific series. Expenses which cannot be directly attributed are allocated among the Funds in the Trust based on relative net assets or other expense methodologies determined by the nature of the expense.
Distributions to shareholders are recorded on the ex-dividend date.
Foreign taxes The Fund is subject to foreign taxes which may be imposed by certain countries in which the Fund invests. The Fund endeavors to record foreign taxes based on applicable foreign tax law. Withholding taxes are incurred on certain foreign dividends and are accrued at the time the associated dividend is recorded. The Fund files withholding tax reclaims in certain jurisdictions to recover a portion of amounts previously withheld. The Fund records a reclaim receivable based on, among other things, a jurisdiction’s legal obligation to pay reclaims as well as payment history and market convention. In consideration of recent decisions rendered by European courts, the Fund has filed for additional reclaims related to prior years. However, a corresponding receivable amount has not yet been recorded because there is no historical precedent for collecting such reclaims and the amount, if any, that the Fund might recover is uncertain. Such amounts, if and when recorded, could result in an increase in the Fund’s net asset value per share.
Capital gains taxes are incurred upon disposition of certain foreign securities. Capital gains taxes on appreciated securities are accrued as unrealized losses and are reflected as realized losses upon the sale of the related security. Currency taxes may be incurred when the Fund purchases certain foreign currencies related to securities transactions and are recorded as realized losses on foreign currency transactions.
Repurchase agreements The Fund enters into repurchase agreements, secured by U.S. government or agency securities, which involve the purchase of securities from a counterparty with a simultaneous commitment to resell the securities at an agreed-upon date and price. It is the Fund’s policy that its custodian take possession of the underlying collateral securities, the fair value of which exceeds the principal amount of the repurchase transaction, including accrued interest, at all times. In the event of default by the counterparty, the Fund has the contractual right to liquidate the collateral securities and to apply the proceeds in satisfaction of the obligation.
Forward currency contracts A forward currency contract represents an obligation to purchase or sell a specific foreign currency at a future date at a price set at the time of the contract. Losses from these transactions may arise from unfavorable changes in currency values or if the counterparties do not perform under a contract’s terms.
The values of the forward currency contracts are adjusted daily based on the applicable exchange rate of the underlying currency. Changes in the value of open contracts are recorded as unrealized appreciation or depreciation in the Consolidated Statement of Operations. When the forward currency contract is closed, the Fund records a realized gain or loss in the Consolidated Statement of Operations equal to the difference between the value at the time the contract was opened and the value at the time it was closed.
During the period, the Fund maintained forward currency contracts to hedge foreign currency risks associated with portfolio investments denominated in euro. These euro forward currency contracts had U.S. dollar total values ranging from 6% to 8% of net assets during the period.
Foreign currency translation The books and records of the Fund are maintained in U.S. dollars. Foreign currency amounts are translated into U.S. dollars at the prevailing exchange rates of such currencies against the U.S. dollar. The market value of investment securities and
DODGE & COX INTERNATIONAL STOCK FUND §PAGE 12
NOTES TO CONSOLIDATED FINANCIAL STATEMENTS (unaudited)
other assets and liabilities are translated at the exchange rate as of the valuation date. Purchases and sales of investment securities, income, and expenses are translated at the exchange rate prevailing on the transaction date.
Reported realized and unrealized gain (loss) on investments include foreign currency gain (loss) related to investment transactions.
Reported realized and unrealized gain (loss) on foreign currency transactions and translation include the following: disposing/holding of foreign currency, the difference between the trade and settlement dates on securities transactions, the difference between the accrual and payment dates on dividends, and currency losses on the purchase of foreign currency in certain countries that impose taxes on such transactions.
Consolidation The Fund may invest in certain securities through its wholly-owned subsidiary, Dodge & Cox International Stock Fund Cayman, Ltd. (the “Subsidiary”). The Subsidiary is a Cayman Islands exempted company and invests in certain securities consistent with the investment objective of the Fund. The Fund’s Consolidated Financial Statements, including the Consolidated Portfolio of Investments, consist of the holdings and accounts of the Fund and the Subsidiary. All intercompany transactions and balances have been eliminated. At June 30, 2014, the Subsidiary had net assets of $124,826,189, which represented less than 1% of the Fund’s consolidated net assets.
Indemnification Under the Trust’s organizational documents, its officers and trustees are indemnified against certain liabilities arising out of the performance of their duties to the Trust. In addition, in the normal course of business the Trust enters into contracts that provide general indemnities to other parties. The Trust’s maximum exposure under these arrangements is unknown as this would involve future claims that may be made against the Trust that have not yet occurred.
NOTE 2—VALUATION MEASUREMENTS
Various inputs are used in determining the value of the Fund’s investments and other financial instruments. These inputs are summarized in the three broad levels listed below.
| § | | Level 1: Quoted prices in active markets for identical securities |
| § | | Level 2: Other significant observable inputs (including quoted prices for similar securities, market indices, interest rates, credit risk, etc.) |
| § | | Level 3: Significant unobservable inputs (including Fund management’s assumptions in determining the fair value of investments) |
The inputs or methodology used for valuing securities are not necessarily an indication of the risk associated with investing in those securities.
The following is a summary of the inputs used to value the Fund’s holdings at June 30, 2014:
| | | | | | | | |
| Classification(a) | | LEVEL 1
(Quoted Prices) | | | LEVEL 2
(Other Significant
Observable Inputs) | |
Securities | | | | | | | | |
Common Stock | | | | | | | | |
Consumer Discretionary | | $ | 7,798,995,609 | | | $ | — | |
Consumer Staples | | | 2,069,415,022 | | | | — | |
Energy | | | 4,128,173,880 | | | | — | |
Financials | | | 15,063,087,124 | | | | — | |
Health Care | | | 9,161,541,709 | | | | — | |
Industrials | | | 4,968,543,917 | | | | — | |
Information Technology | | | 9,687,364,115 | | | | — | |
Materials | | | 2,860,107,827 | | | | — | |
Telecommunication Services | | | 4,243,734,255 | | | | — | |
Preferred Stocks | | | | | | | | |
Energy | | | 665,263,040 | | | | — | |
Financials | | | 915,422,136 | | | | — | |
Information Technology | | | 356,078,494 | | | | — | |
Short-term Investments | | | | | | | | |
Money Market Fund | | | 124,629,876 | | | | — | |
Repurchase Agreement | | | — | | | | 660,254,373 | |
Treasury Bill | | | — | | | | 19,728,646 | |
| | | | | | | | |
Total Securities | | $ | 62,042,357,004 | | | $ | 679,983,019 | |
| |
Other Financial Instruments | | | | | |
Forward Currency Contracts | | $ | — | | | $ | 17,403,329 | (b) |
| | | | | | | | | |
| (a) | Transfers during the period between Level 1 and Level 2 relate to the use of systematic fair valuation. On days when systematic fair valuation is used, securities whose primary market closes before the NYSE are classified as Level 2. There were no Level 3 securities at June 30, 2014 and December 31, 2013, and there were no transfers to Level 3 during the period. |
| (b) | Represents net unrealized appreciation/depreciation. |
PAGE 13 § DODGE & COX INTERNATIONAL STOCK FUND
NOTES TO CONSOLIDATED FINANCIAL STATEMENTS (unaudited)
NOTE 3—ADDITIONAL DERIVATIVES INFORMATION
The Fund has entered into over-the-counter derivatives, such as forward currency contracts (each, a “Derivative”). Each Derivative is subject to a negotiated master agreement (based on a form published by the International Swaps and Derivatives Association (“ISDA”)) governing all Derivatives between the Fund and the relevant dealer counterparty. The master agreements specify (i) events of default and other events permitting a party to terminate some or all of the Derivatives thereunder and (ii) the process by which those Derivatives will be valued for purposes of determining termination payments. If some or all of the Derivatives under a master agreement are terminated because of an event of default or similar event, the values of all terminated Derivatives must be netted to determine a single payment owed by one party to the other. Some master agreements contain collateral terms requiring the parties to post collateral in respect of some or all of the Derivatives thereunder based on the net market value of those Derivatives, subject to a minimum exposure threshold. To the extent amounts owed to the Fund by its counterparties are not collateralized, the Fund is at risk of those counterparties’ non-performance. The Fund attempts to mitigate counterparty credit risk by entering into Derivatives only with counterparties it believes to be of good credit quality and by monitoring the financial stability of those counterparties.
For financial reporting purposes, the Fund does not offset financial assets and liabilities that are subject to an ISDA Master Agreement in the Statement of Assets and Liabilities. The net amount for Derivatives is disclosed on the Consolidated Portfolio of Investments. At June 30, 2014, there is no collateral pledged or received by the Fund for Derivatives.
NOTE 4—RELATED PARTY TRANSACTIONS
Management fees Under a written agreement approved by a unanimous vote of the Board of Trustees, the Fund pays an annual management fee of 0.60% of the Fund’s average daily net assets to Dodge & Cox, investment manager of the Fund.
Fund officers and trustees All officers and two of the trustees of the Trust are officers or employees of Dodge & Cox. The Trust pays a fee only to those trustees who are not affiliated with Dodge & Cox.
NOTE 5—INCOME TAX INFORMATION AND DISTRIBUTIONS TO SHAREHOLDERS
A provision for federal income taxes is not required since the Fund intends to continue to qualify as a regulated investment company under Subchapter M of the Internal Revenue Code and distribute all of its taxable income to shareholders. Distributions are determined in accordance with income tax regulations, and such amounts may differ from net investment income and realized gains for financial reporting purposes. Financial reporting records are adjusted for permanent book/tax differences at year end to reflect tax character.
Book/tax differences are primarily due to differing treatments of wash sales, net short-term realized gain (loss) on investments, investments in passive foreign investment companies, foreign capital gain taxes, and foreign currency realized gain (loss). At June 30, 2014, the cost of investments for federal income tax purposes was $51,534,424,585.
Distributions during the periods noted below were characterized as follows for federal income tax purposes.
| | | | | | | | |
| | | Six Months Ended June 30, 2014 | | | Year Ended
December 31, 2013 | |
Ordinary income | | | — | | | | $852,149,250 | |
| | | | | | | ($0.695 per share) | |
| | |
Long-term capital gain | | | — | | | | — | |
At June 30, 2014, the tax basis components of distributable earnings were as follows:
| | | | |
Unrealized appreciation | | $ | 14,820,692,433 | |
Unrealized depreciation | | | (3,632,776,995 | ) |
| | | | |
Net unrealized appreciation | | | 11,187,915,438 | |
Undistributed ordinary income | | | 1,263,425,548 | |
Accumulated capital gain(a) | | | 764,298,477 | |
Capital loss carryforward(b) | | | (5,344,990,635 | ) |
| (a) | Represents capital gain realized for tax purposes during the period from January 1, 2014 to June 30, 2014. |
| (b) | Represents accumulated capital loss as of December 31, 2013, which may be carried forward to offset future capital gains. During 2013, the Fund utilized $1,154,962,358 of the capital loss carryforward. If not utilized, the remaining capital loss carryforward will expire as follows: |
| | | | |
Expiring in 2017 | | $ | 4,224,870,406 | |
Expiring in 2018 | | | 1,120,120,229 | |
| | | | |
| | $ | 5,344,990,635 | |
| | | | |
DODGE & COX INTERNATIONAL STOCK FUND §PAGE 14
NOTES TO CONSOLIDATED FINANCIAL STATEMENTS (unaudited)
Under the Regulated Investment Company Modernization Act of 2010, capital losses incurred by the Fund after January 1, 2011, are not subject to expiration. In addition, such losses must be utilized prior to the losses incurred in the years preceding enactment.
Fund management has reviewed the tax positions for open periods (three years and four years, respectively, from filing the Fund’s Federal and State tax returns) as applicable to the Fund, and has determined that no provision for income tax is required in the Fund’s financial statements.
NOTE 6—LOAN FACILITIES
Pursuant to an exemptive order issued by the Securities and Exchange Commission (SEC), the Fund may participate in an interfund lending facility (Facility). The Facility allows the Fund to borrow money from or loan money to the Funds. Loans under the Facility are made for temporary or emergency purposes, such as to fund shareholder redemption requests. Interest on borrowings is the average of the current repurchase agreement rate and the bank loan rate. There was no activity in the Facility during the period.
All Funds in the Trust participate in a $500 million committed credit facility (Line of Credit) with State Street Bank and Trust Company, to be utilized for temporary or emergency purposes to fund shareholder redemptions or for other short-term liquidity purposes. The maximum amount available to the Fund is $250 million. Each Fund pays an annual commitment fee on its pro-rata portion of the Line of Credit. The Fund’s commitment fee for the six months ended June 30, 2014, amounted to $82,456 and is reflected as a Miscellaneous Expense in the Consolidated Statement of Operations. Interest on borrowings is charged at the prevailing rate. There were no borrowings on the Line of Credit during the period.
NOTE 7—PURCHASES AND SALES OF INVESTMENTS
For the six months ended June 30, 2014, purchases and sales of securities, other than short-term securities, aggregated $9,551,580,227 and $3,877,305,590 respectively.
NOTE 8—SUBSEQUENT EVENTS
Fund management has determined that no material events or transactions occurred subsequent to June 30, 2014, and through the date of the Fund’s financial statements issuance, which require additional disclosure in the Fund’s financial statements.
PAGE 15 § DODGE & COX INTERNATIONAL STOCK FUND
NOTES TO CONSOLIDATED FINANCIAL STATEMENTS (unaudited)
NOTE 9—HOLDINGS OF 5% VOTING SECURITIES
Each of the companies listed below was considered to be an affiliate of the Fund because the Fund owned 5% or more of the company’s voting securities during all or part of the six months ended June 30, 2014. Purchase and sale transactions and dividend income earned during the period on these securities were as follows:
| | | | | | | | | | | | | | | | | | | | | | | | |
| | | Shares at
Beginning of Period | | | Additions | | | Reductions | | | Shares at
End of Period | | | Dividend
Income(a) | | | Value at
End of Period | |
BR Malls Participacoes SA (Brazil) | | | 46,424,100 | | | | 8,343,200 | | | | — | | | | 54,767,300 | | | | 7,754,542 | | | | 465,999,203 | |
Brother Industries, Ltd. (Japan) | | | 18,185,100 | | | | — | | | | — | | | | 18,185,100 | | | | 1,922,371 | | | | 315,037,269 | |
Fujitsu, Ltd. (Japan) | | | 103,523,000 | | | | — | | | | — | | | | 103,523,000 | | | | 3,647,852 | | | | 775,617,758 | |
Hang Lung Group, Ltd. (Hong Kong) | | | 68,625,500 | | | | 15,380,700 | | | | — | | | | 84,006,200 | | | | 5,936,345 | | | | 454,693,963 | |
Infineon Technologies AG (Germany) | | | 63,788,456 | | | | — | | | | — | | | | 63,788,456 | | | | 10,476,101 | | | | 797,377,536 | |
Kasikornbank PCL- Foreign (Thailand) | | | 95,826,527 | | | | 27,500,000 | | | | — | | | | 123,326,527 | | | | 9,290,671 | | | | 778,984,379 | |
Lafarge SA (France) | | | 19,314,291 | | | | 250,000 | | | | (200,000 | ) | | | 19,364,291 | | | | — | | | | 1,681,084,553 | |
Millicom International Cellular SA SDR (Luxembourg) | | | 6,580,880 | | | | 2,990,983 | | | | — | | | | 9,571,863 | | | | 19,624,813 | | | | 876,739,702 | |
NGK Spark Plug Co., Ltd. (Japan) | | | 16,720,000 | | | | — | | | | — | | | | 16,720,000 | | | | 2,209,367 | | | | 471,701,890 | |
Nidec Corp. (Japan) | | | 7,290,500 | | | | 7,290,500 | | | | (3,320,300 | ) | | | 11,260,700 | | | | 3,532,323 | | | | — | (b) |
Television Broadcasts, Ltd. (Hong Kong) | | | 37,596,400 | | | | 2,426,500 | | | | — | | | | 40,022,900 | | | | 10,325,692 | | | | 259,748,125 | |
Wienerberger AG (Austria) | | | 13,185,029 | | | | — | | | | (9,049,265 | ) | | | 4,135,764 | | | | 577,742 | | | | — | (b) |
Yamaha Motor Co., Ltd. (Japan) | | | 28,851,100 | | | | — | | | | — | | | | 28,851,100 | | | | 4,811,915 | | | | 496,396,696 | |
Yapi ve Kredi Bankasi AS (Turkey) | | | 168,737,068 | | | | 65,974,100 | | | | — | | | | 234,711,168 | | | | 8,361,838 | | | | 511,831,208 | |
| | | | | | | | | | | | | | | | | | | | | | | | |
| | | | | | | | | | | | | | | | | | $ | 88,471,572 | | | $ | 7,885,212,282 | |
| | | | | | | | | | | | | | | | | | | | | | | | |
| | | | | | | | | | | | | | | | | | | | | | | | | |
| (a) | Net of foreign taxes, if any |
| (b) | Company was not an affiliate at period end |
CONSOLIDATED FINANCIAL HIGHLIGHTS
| | | | | | | | | | | | | | | | | | | | | | | | |
SELECTED DATA AND RATIOS (for a share outstanding throughout each period) | | Six Months
Ended June 30, | | | Year Ended December 31, | |
| | | 2014(a) | | | 2013 | | | 2012 | | | 2011 | | | 2010 | | | 2009 | |
| | | | | | | | |
Net asset value, beginning of period | | | $43.04 | | | | $34.64 | | | | $29.24 | | | | $35.71 | | | | $31.85 | | | | $21.90 | |
Income from investment operations: | | | | | | | | | | | | | | | | | | | | | | | | |
Net investment income | | | 0.92 | | | | 0.70 | | | | 0.76 | | | | 0.78 | | | | 0.51 | | | | 0.41 | |
Net realized and unrealized gain (loss) | | | 2.48 | | | | 8.40 | | | | 5.39 | | | | (6.49 | ) | | | 3.85 | | | | 9.98 | |
| | | | | | | | |
Total from investment operations | | | 3.40 | | | | 9.10 | | | | 6.15 | | | | (5.71 | ) | | | 4.36 | | | | 10.39 | |
| | | | | | | | |
Distributions to shareholders from: | | | | | | | | | | | | | | | | | | | | | | | | |
Net investment income | | | — | | | | (0.70 | ) | | | (0.75 | ) | | | (0.76 | ) | | | (0.50 | ) | | | (0.44 | ) |
Net realized gain | | | — | | | | — | | | | — | | | | — | | | | — | | | | — | |
| | | | | | | | |
Total distributions | | | — | | | | (0.70 | ) | | | (0.75 | ) | | | (0.76 | ) | | | (0.50 | ) | | | (0.44 | ) |
| | | | | | | | |
Net asset value, end of period | | | $46.44 | | | | $43.04 | | | | $34.64 | | | | $29.24 | | | | $35.71 | | | | $31.85 | |
| | | | | | | | |
Total return | | | 7.90 | % | | | 26.31 | % | | | 21.03 | % | | | (15.97 | )% | | | 13.69 | % | | | 47.46 | % |
Ratios/supplemental data: | | | | | | | | | | | | | | | | | | | | | | | | |
Net assets, end of period (millions) | | | $62,825 | | | | $53,616 | | | | $40,556 | | | | $35,924 | | | | $43,406 | | | | $36,748 | |
Ratio of expenses to average net assets | | | 0.65 | %(b) | | | 0.64 | % | | | 0.64 | % | | | 0.64 | % | | | 0.65 | % | | | 0.65 | % |
Ratio of net investment income to average net assets | | | 4.39 | %(b) | | | 1.85 | % | | | 2.31 | % | | | 2.23 | % | | | 1.58 | % | | | 1.58 | % |
Portfolio turnover rate | | | 7 | % | | | 13 | % | | | 10 | % | | | 16 | % | | | 15 | % | | | 21 | % |
See accompanying Notes to Consolidated Financial Statements
DODGE & COX INTERNATIONAL STOCK FUND §PAGE 16
SHAREHOLDER MEETING RESULTS (unaudited)
A special meeting of shareholders was held on April 23, 2014. At the meeting, proposals to elect Trustees to the Board of Trustees and to amend the Fund’s fundamental investment restrictions listed below were approved. The following is a report of the total votes cast by the Trust’s and the Fund’s shareholders.
| | | | | | | | | | | | | | |
| PROPOSAL | | | | AFFIRMATIVE | | | WITHHOLD | | | TOTAL | |
1 Elect Trustees to the Board of Trustees: | | | | | | | | | | | | | | |
| | | | |
| | Dana M. Emery | | | 2,724,363,325 | | | | 37,845,024 | | | | 2,762,208,349 | |
| | | | |
| | Charles F. Pohl | | | 2,724,265,808 | | | | 37,942,541 | | | | 2,762,208,349 | |
| | | | |
| | Thomas A. Larsen | | | 2,723,251,516 | | | | 38,956,833 | | | | 2,762,208,349 | |
| | | | |
| | Ann Mather | �� | | 2,696,172,728 | | | | 66,035,621 | | | | 2,762,208,349 | |
| | | | |
| | Robert B. Morris III | | | 2,722,376,906 | | | | 39,831,443 | | | | 2,762,208,349 | |
| | | | |
| | Gary Roughead | | | 2,721,551,032 | | | | 40,657,317 | | | | 2,762,208,349 | |
| | | | |
| | Mark E. Smith | | | 2,723,441,491 | | | | 38,766,858 | | | | 2,762,208,349 | |
| | | | |
| | John B. Taylor | | | 2,722,862,534 | | | | 39,345,815 | | | | 2,762,208,349 | |
| | | | | | | | | | | | | | | | | | | | |
| PROPOSAL | | AFFIRMATIVE | | | AGAINST | | | ABSTAIN | | | BROKER NON-VOTE | | | TOTAL | |
2 To remove the Fund’s fundamental investment restriction with respect to investing in any company for the purpose of exercising control or management. | | | 638,067,717 | | | | 42,268,814 | | | | 9,161,536 | | | | 134,639,539 | | | | 824,137,606 | |
| | | | | |
3 To remove the Fund’s fundamental investment restriction with respect to purchasing securities on margin and short selling. | | | 632,026,231 | | | | 49,150,179 | | | | 8,321,657 | | | | 134,639,539 | | | | 824,137,606 | |
| | | | | |
4 To remove the Fund’s fundamental investment restriction with respect to investments in securities that are illiquid and replace it with a uniform non-fundamental policy for all Funds. | | | 634,265,766 | | | | 44,673,944 | | | | 10,558,357 | | | | 134,639,539 | | | | 824,137,606 | |
| | | | | |
6 To amend the Fund’s fundamental investment restriction with respect to underwriting securities of other issuers. | | | 633,976,693 | | | | 39,137,750 | | | | 16,383,624 | | | | 134,639,539 | | | | 824,137,606 | |
PAGE 17 § DODGE & COX INTERNATIONAL STOCK FUND
FUND HOLDINGS
The Fund provides a complete list of its holdings four times each fiscal year, as of the end of each quarter. The Fund files the lists with the Securities and Exchange Commission (SEC) on Form N-CSR (second and fourth quarters) and Form N-Q (first and third quarters). Shareholders may view the Fund’s Forms N-CSR and N-Q on the SEC’s website at www.sec.gov. Forms N-CSR and N-Q may also be reviewed and copied at the SEC’s Public Reference Room in Washington, DC. Information regarding the operations of the Public Reference Room may be obtained by calling 202-942-8090 (direct) or 800-732-0330 (general SEC number). A list of the Fund’s quarter-end holdings is also available at www.dodgeandcox.com on or about 15 days following each quarter end and remains available on the website until the list is updated in the subsequent quarter.
PROXY VOTING
For a free copy of the Fund’s proxy voting policies and procedures, please call 800-621-3979, visit the Fund’s website at www.dodgeandcox.com, or visit the SEC’s website at www.sec.gov. Information regarding how the Fund voted proxies relating to portfolio securities during the most recent 12-month period ending June 30 is also available at www.dodgeandcox.com or at www.sec.gov.
HOUSEHOLD MAILINGS
The Fund routinely mails shareholder reports and summary prospectuses to shareholders and, on occasion, proxy statements. In order to reduce the volume of mail, when possible, only one copy of these documents will be sent to shareholders who are part of the same family and share the same residential address.
If you have a direct account with the Funds and you do not want the mailing of shareholder reports and summary prospectuses combined with other members in your household, contact the Funds at 800-621-3979. Your request will be implemented within 30 days.
DODGE & COX INTERNATIONAL STOCK FUND §PAGE 18
TRUSTEES AND EXECUTIVE OFFICERS
Charles F. Pohl, Chairman and Trustee
Chairman and Chief Investment Officer, Dodge & Cox
Dana M. Emery, President and Trustee
Chief Executive Officer, President, and Director of Fixed Income, Dodge & Cox
Thomas A. Larsen, Independent Trustee
Senior Counsel, Arnold & Porter LLP
Ann Mather, Independent Trustee
Former Executive Vice President, Chief Financial Officer, and Company Secretary of Pixar Studios
Robert B. Morris III, Independent Trustee
Former Partner and Managing Director of Global Research at Goldman Sachs & Co.
Gary Roughead, Independent Trustee
Annenberg Distinguished Visiting Fellow, Hoover Institution
Mark E. Smith, Independent Trustee
Former Executive Vice President, Managing Director-Fixed Income at Loomis Sayles & Company, L.P.
John B. Taylor, Independent Trustee
Professor of Economics, Stanford University; Senior Fellow, Hoover Institute and former Under Secretary for International Affairs, United States Treasury
John A. Gunn, Senior Vice President
Former Chairman and Chief Executive Officer, Dodge & Cox
Diana S. Strandberg, Senior Vice President
Senior Vice President and Director of International Equity, Dodge & Cox
David H. Longhurst, Treasurer
Vice President and Assistant Treasurer, Dodge & Cox
Thomas M. Mistele, Secretary
Chief Operating Officer, Secretary, and Senior Counsel, Dodge & Cox
Katherine M. Primas, Chief Compliance Officer
Chief Compliance Officer, Dodge & Cox
Additional information about the Trust’s Trustees and Officers is available in the Trust’s Statement of Additional Information (SAI). You can get a free copy of the SAI by visiting the Funds’ website at www.dodgeandcox.com or calling 800-621-3979.
PAGE 19 § DODGE & COX INTERNATIONAL STOCK FUND
| | | | |
| | | | |
www.dodgeandcox.com
For Fund literature, transactions, and account information, please visit the Funds’ website.
or write or call:
DODGE & COX FUNDS
c/o Boston Financial Data Services
P.O. Box 8422
Boston, Massachusetts 02266-8422
(800) 621-3979
INVESTMENT MANAGER
Dodge & Cox
555 California Street, 40th Floor
San Francisco, California 94104
(415) 981-1710
This report is submitted for the general information of the shareholders of the Fund. The report is not authorized for distribution to prospective investors in the Fund unless it is accompanied by a current prospectus.
This report reflects our views, opinions, and portfolio holdings as of June 30, 2014, the end of the reporting period. Any such views are subject to change at any time based upon market or other conditions and Dodge & Cox disclaims any responsibility to update such views. These views may not be relied on as investment advice and, because investment decisions for a Dodge & Cox Fund are based on numerous factors, may not be relied on as an indication of trading intent on behalf of any Dodge & Cox Fund.
6/14 BF SAR Printed on recycled paper
Semi-Annual Report
June 30, 2014
Balanced Fund
ESTABLISHED 1931
TICKER: DODBX
TO OUR SHAREHOLDERS
The Dodge & Cox Balanced Fund had a total return of 6.3% for six months ended June 30, 2014, compared to a return of 5.9% for the Combined Index(a) (a 60/40 blend of equity and debt securities). At quarter end, the Fund’s net assets of $15.2 billion were invested in 67.1% equity securities, 30.5% debt securities, and 2.4% cash.
MARKET COMMENTARY
After exceptionally strong returns in 2013, U.S. equity markets continued to rise during the first half of 2014. While every sector of the S&P 500 generated positive returns for the six-month period, Utilities and Energy were the strongest. Following a slow start to the year, growth in U.S. economic activity rebounded and assuaged concerns that the economy was losing momentum. The labor market and household spending showed further signs of improvement, and businesses invested more in fixed assets. However, the housing recovery remained slow and turmoil in the Middle East modestly increased oil prices. Corporate balance sheets and cash flows are robust; we continue to be optimistic about the long-term prospects for corporate earnings growth.
The U.S. bond markets performed well in the first half of 2014. Demand rose for U.S. Treasuries, which as a sector returned 2.7%(b) in the first half, reflecting growing expectations that the Federal Reserve (Fed) will raise the Fed funds rate at a slower pace compared to previous tightening cycles, and with a lower end target. Narrowing yield premiums supported strong performance for investment-grade corporate bonds, which returned 5.7% and outperformed comparable-duration(c) Treasuries by 1.5 percentage points.
INVESTMENT STRATEGY
We set the Fund’s asset allocation based on our three- to five-year outlook for the Fund’s equity and fixed income holdings. In our opinion, U.S. equity market valuations remain reasonable: the S&P 500 traded at 16 times forward estimated earnings, which is close to its 10-year average, with a 2.0% dividend yield.(d) We believe that prospective fixed income returns are less attractive than equities due to low current interest rates and reduced credit spreads. At June 30, the yield of the Barclays U.S. Aggregate was near historical lows (2.2%). At the same time, the duration of the Barclays U.S. Aggregate reached
a record high in the second quarter. For these reasons, we believe that a higher weighting in equities and a lower weighting in fixed income is appropriate.
Equity Strategy
We build the portfolio one security at a time, exercise a strict price discipline, and evaluate potential investments based on our long-term investment horizon. To determine whether a company’s share price presents a compelling investment opportunity, we weigh the company’s valuation against its fundamentals (e.g., competitive positioning, financial strength, long-term growth prospects, management quality, and corporate governance). The equity portfolio’s overweight position in the Media industry (10.9% compared to 3.6% for the S&P 500 industry) illustrates our fundamental, bottom-up research process. Through individual security analysis, we have identified Media companies that we believe have durable business franchises, long-term growth prospects, and reasonable valuations. The equity portfolio’s Media holdings fall into two broad categories: content and distribution.
Content-oriented holdings in the portfolio include Time Warner, Twenty-First Century Fox, News Corp., and Time.(e) Such companies have growth opportunities in digital media, interactive content, and cable networks, however they must compensate for slow secular growth in mature media (newspapers and publishing) and loss of advertising market share to internet and other media outlets. The portfolio’s distribution holdings (Comcast, Time Warner Cable, and DISH Network) stand to benefit from rising broadband penetration, stable financial conditions, and reasonable valuations, while also facing an increasingly competitive video distribution environment. Time Warner, Comcast, and Time Warner Cable are highlighted in detail below.
Content: Time Warner
Time Warner, a strategically well-positioned media conglomerate, was a 2.6% position in the equity portfolio on June 30. We believe its valuation of 16 times forward earnings is reasonable in relation to its earnings and free cash flow growth prospects. Time Warner’s television-related businesses are estimated to account for more than 90% of its cash flow, and the majority of the company’s
PAGE 1 § DODGE & COX BALANCED FUND
businesses (cable networks, television licensing) are characterized by multi-year contracts with guaranteed annual revenue increases.
We believe Time Warner’s management is one of the most disciplined capital allocators in the Media industry and is focused on maximizing returns for long-term shareholders. As evidence, they have repurchased over 30% of the company’s shares since 2006 and have avoided large-scale mergers and acquisitions (M&A). Furthermore, since we initiated the Fund’s equity position in 2003, management has spun off businesses methodically to increase shareholder value. All of these spinoffs are still held in the Fund and have augmented returns: Time Warner Cable (up 559% since its March 2009 spin off), AOL (up 96% since its December 2009 spin off, including a $5.15 per share special dividend), and Time (up 4% since its early June 2014 spinoff). We continue to believe these businesses have attractive long-term growth opportunities; in total, Time Warner, Time Warner Cable, AOL, and Time accounted for 5.7% of the equity portfolio on June 30.
Distribution: Comcast and Time Warner Cable
In response to evolving consumer habits, media companies are altering their long-term strategies and the industry is consolidating. Two of the equity porftolio’s Media holdings have entered into a merger agreement: in February 2014, Comcast (the largest cable operator in the United States) agreed to acquire Time Warner Cable (the second largest) for $45 billion in stock at the time of the announcement.
What is Comcast’s rationale for the deal? Combining the companies presents significant opportunities for cost reductions, operating synergies, and enhanced revenue growth. Comcast and Time Warner Cable currently do not compete directly in any markets. If the merger is completed, Comcast will gain access to the premier New York and Los Angeles markets, and thereby have a national presence. The proposed new entity would be the dominant provider of pay-TV and wireline broadband services in the United States (reaching ~70% of U.S. households).
We believe the proposed deal could build long-term shareholder value, depending upon merger concessions. Comcast’s management team is astute and has a proven M&A track record. While they have already made deal concessions, substantial regulatory hurdles lie ahead: both the Federal Communications Commission and the
Department of Justice need to approve the merger. On a standalone basis, Comcast and Time Warner Cable remain reasonably valued and were held in the equity portfolio on June 30 with 3.2% and 2.4% positions, respectively.
Fixed Income Strategy
The fixed income portfolio’s broad investment themes have been stable. We maintain an overweight to credit instruments, an emphasis on premium-coupon Agency MBS with relatively stable cash flow characteristics, and portfolio duration that is lower and a nominal yield that is higher than the Barclays U.S. Aggregate. At the same time, we made a number of important tactical adjustments in the first half of 2014 as valuations shifted.
Duration Positioning: Leaning Shorter
We have positioned the portfolio with a shorter relative duration than the Barclays U.S. Aggregate to mitigate the negative price effect associated with rising rates. Last summer we lengthened the portfolio’s duration from roughly 75% to 80% of the Barclays U.S. Aggregate’s duration as yields rose (to a level above current inflation for the first time in two years). In the first half of 2014, we reversed the duration extension of mid-2013 as rates declined to one-year lows. In our view, the current level of interest rates does not fully incorporate the more positive fundamentals of the U.S. economy or the possibility that Fed policy could deviate from the slow pace of tightening currently reflected in market expectations.
Credit Sector: Richer (But Still Reasonable) Valuations, Incremental Changes to Portfolio Composition
The credit sector performed well in the first half of 2014 and credit spreads have declined to pre-crisis levels. Although we believe valuations are reasonable given strong underlying fundamentals, it is difficult to be optimistic about future excess returns. During times such as these, with low volatility, narrowing yield premiums, and rising likelihood of adverse credit events, we seek to reduce downside risk in the Fund’s credit holdings while capturing incremental yield.
We have been reducing corporate sector weighting on a bottom-up basis and shifting the composition of the corporate portfolio. We have reduced the Financial sub-sector weighting by two percentage points over the past nine months, owing to richer valuations that more fully reflect the strong recovery in issuer and sector
DODGE & COX BALANCED FUND §PAGE 2
fundamentals. Notwithstanding the overall reduction to the Fund’s corporate bond weighting, we added several new positions. The fixed income portfolio has been increasing its weighting in non-U.S. issuers from 3% in late 2009 to 12% at June 30. This trend has been driven by attractive valuations compared to U.S. alternatives, as well as a higher amount of investable product as non-U.S. companies have increasingly issued bonds in U.S. dollars.
Elsewhere within the credit portfolio, we recently reduced a number of taxable municipal issuers following strong performance. Municipal valuations increasingly reflect meaningful improvements to issuer fundamentals. Our taxable municipal holdings are predominantly longer-duration securities and these trims also helped reduce portfolio duration.
Given recent changes in the markets (notably, high equity valuations, low rates, declining spreads, and a higher receptiveness to lower credit quality securities), management teams are able to increase leverage at a low cost. To address this risk, we recently completed a comprehensive review of the credit holdings in the fixed income portfolio to assess which companies are likely to alter their capital structure in a manner adverse to current bondholders; we made several marginal trims based on this analysis.
IN CLOSING
We are encouraged by the Fund’s performance results so far this year, and believe the equity and fixed income portfolios are well positioned for the future. In addition to Media, the equity portfolio remains overweight the Financials, Health Care, and Information Technology sectors, as well as the Energy Equipment & Services industry. The most significant underweight positions in the equity portfolio are in Utilities, Consumer Staples, and Industrials. The holdings in the equity portfolio collectively trade at a discount (14 times forward earnings) to the S&P 500 and have earnings growth potential.
While we are optimistic about the Fund’s long-term return prospects, near-term returns in the fixed income portfolio could be negatively impacted by low starting yields. We continue to be vigilant about shedding risk where the yield compensation is inadequate in our view, while at the same time seeking to identify new opportunities with attractive long-term return potential.
Thank you for your continued confidence in our firm. As always, we welcome your comments and questions.
For the Board of Trustees,
| | |
| |
|
Charles F. Pohl, Chairman | | Dana M. Emery, President |
July 29, 2014
| (a) | The Combined Index reflects an unmanaged portfolio (rebalanced monthly) of 60% of the S&P 500 Index, which is a market capitalization-weighted index of 500 large capitalization stocks commonly used to represent the U.S. equity market, and 40% of the Barclays U.S. Aggregate Bond Index (Barclays U.S. Aggregate), which is a widely recognized, unmanaged index of U.S. dollar-denominated, investment-grade, taxable fixed income securities. |
| (b) | Sector returns as calculated and reported by Barclays. |
| (c) | Duration is a measure of a bond’s (or a bond portfolio’s) price sensitivity to changes in interest rates. |
| (d) | Unless otherwise specified, all weightings and characteristics are as of June 30, 2014. |
| (e) | The use of specific examples does not imply that they are more attractive investments than the Fund’s other holdings. |
PAGE 3 § DODGE & COX BALANCED FUND
YEAR-TO-DATE PERFORMANCE REVIEW
The Fund outperformed the Combined Index by 0.4 percentage points year to date. The Fund’s higher allocation to equities had a negative impact on relative results.
EQUITY PORTFOLIO
| | § | | The portfolio’s underweight position in the Utilities sector (no holdings compared to 3% for the S&P 500 sector), the strongest sector of the market (up 19%), hurt results. | |
| | § | | The portfolio’s holdings in the Industrials sector (flat compared to up 4% for the S&P 500 sector) hindered performance. ADT Corp. (down 13%) was especially weak. | |
| | § | | The portfolio’s holdings in the Energy sector (up 26% compared to up 13% for the S&P 500 sector) contributed significantly to results. Oil Services holdings, Weatherford International (up 48%), Baker Hughes (up 35%), and Schlumberger (up 32%), were particularly strong. | |
| | § | | The portfolio’s holdings in the Materials sector (up 17% compared to up 8% for the S&P 500 sector) helped returns. Dow Chemical (up 18%) and Celanese (up 17%) performed well. | |
FIXED INCOME PORTFOLIO
| | § | | Many of the portfolio’s non-U.S. domiciled and/or lower-rated holdings performed well; notably strong performers included Enel, Kingdom of Spain, Pemex, Petrobras, and Telecom Italia. The State of California general obligation bonds and Macy’s also performed well. | |
| | § | | The portfolio’s overweight to corporate bonds (44% versus 22% for the Barclays U.S. Aggregate*) added to relative returns given the sector’s strong performance. | |
| | § | | The portfolio’s defensive duration positioning (approximately 84% of the Barclays U.S. Agg’s duration) hampered relative returns as interest rates declined. | |
| | * | | Unless otherwise noted, figures cited in this section denote portfolio positioning at the beginning of the period. | |
KEY CHARACTERISTICS OF DODGE & COX
Independent Organization
Dodge & Cox is one of the largest privately owned investment managers in the world. We remain committed to independence, with a goal of providing the highest quality investment management service to our existing clients.
Over 80 Years of Investment Experience
Dodge & Cox was founded in 1930. We have a stable and well-qualified team of investment professionals, most of whom have spent their entire careers at Dodge & Cox.
Experienced Investment Team
The Investment Policy Committee, which is the decision-making body for the equity portion of the Balanced Fund, is a nine-member committee with an average tenure at Dodge & Cox of 26 years. The Fixed Income Investment Policy Committee, which is the decision-making body for the Fixed Income portion of the Balanced Fund, is a nine-member committee with an average tenure of 18 years.
One Business with a Single Research Office
Dodge & Cox manages equity (domestic, international, and global), fixed income (domestic and global), and balanced investments, operating from one office in San Francisco.
Consistent Investment Approach
Our team decision-making process involves thorough, bottom-up fundamental analysis of each investment.
Long-Term Focus and Low Expenses
We invest with a three- to five-year investment horizon, which has historically resulted in low turnover relative to our peers. We manage Funds that maintain low expense ratios.
Risks: The Fund is subject to market risk, meaning stocks may decline in value for extended periods due to the financial prospects of individual companies or general market conditions. The Fund also invests in debt securities whose yields and market values fluctuate, so that an investment may be worth more or less than its original cost. Debt securities are subject to interest rate risk, credit risk, and prepayment risk, all of which could have adverse effects on the value of the Fund. A low interest rate environment creates an elevated risk of future negative returns. Financial intermediaries may restrict their market making activities for certain debt securities, which may reduce the liquidity and increase the volatility of such securities. Please read the prospectus and summary prospectus for specific details regarding the Fund’s risk profile.
DODGE & COX BALANCED FUND §PAGE 4
GROWTH OF $10,000 OVER 10 YEARS
FOR AN INVESTMENT MADE ON JUNE 30, 2004
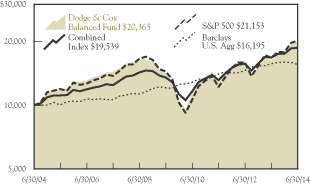
AVERAGE ANNUAL TOTAL RETURN
FOR PERIODS ENDED JUNE 30, 2014
| | | | | | | | | | | | | | | | |
| | | 1 Year | | | 5 Years | | | 10 Years | | | 20 Years | |
| | | | | | | | | | | | | | | | |
Dodge & Cox Balanced Fund | | | 21.14 | % | | | 16.49 | % | | | 7.38 | % | | | 10.34 | % |
Combined Index(a) | | | 16.23 | | | | 13.32 | | | | 6.92 | | | | 8.64 | |
S&P 500 | | | 24.62 | | | | 18.84 | | | | 7.78 | | | | 9.79 | |
Barclays U.S. Aggregate Bond Index (Barclays U.S. Agg) | | | 4.38 | | | | 4.87 | | | | 4.94 | | | | 6.16 | |
Returns represent past performance and do not guarantee future results. Investment return and share price will fluctuate with market conditions, and investors may have a gain or loss when shares are sold. Fund performance changes over time and currently may be significantly lower than stated. Performance is updated and published monthly. Visit the Fund’s website at www.dodgeandcox.com or call 800-621-3979 for current performance figures.
The Fund’s total returns include the reinvestment of dividend and capital gain distributions, but have not been adjusted for any income taxes payable by shareholders on these distributions or on Fund share redemptions. Index returns include dividends and/or interest income but, unlike Fund returns, do not reflect fees or expenses.
Standard & Poor’s, Standard & Poor’s 500, and S&P 500® are trademarks of McGraw Hill Financial. Barclays® is a trademark of Barclays Bank PLC.
| (a) | The Combined Index reflects an unmanaged portfolio (rebalanced monthly) of 60% of the S&P 500 Index, which is a market capitalization-weighted index of 500 large-capitalization stocks commonly used to represent the U.S. equity market, and 40% of the Barclays U.S. Aggregate Bond Index (Barclays U.S. Agg), which is a widely recognized, unmanaged index of U.S. dollar-denominated, investment-grade, taxable fixed income securities. The Fund may, however, invest up to 75% of its total assets in equity securities. |
FUND EXPENSE EXAMPLE
As a Fund shareholder, you incur ongoing Fund costs, including management fees and other Fund expenses. All mutual funds have ongoing costs, sometimes referred to as operating expenses. The following example shows ongoing costs of investing in the Fund and can help you understand these costs and compare them with those of other mutual funds. The example assumes a $1,000 investment held for the six months indicated.
ACTUAL EXPENSES
The first line of the table below provides information about actual account values and expenses based on the Fund’s actual returns. You may use the information in this line, together with your account balance, to estimate the expenses that you paid over the period. Simply divide your account value by $1,000 (for example, an $8,600 account value divided by $1,000 = 8.6), then multiply the result by the number in the first line under the heading “Expenses Paid During Period” to estimate the expenses you paid on your account during this period.
HYPOTHETICAL EXAMPLE FOR COMPARISON WITH OTHER MUTUAL FUNDS
Information on the second line of the table can help you compare ongoing costs of investing in the Fund with those of other mutual funds. This information may not be used to estimate the actual ending account balance or expenses you paid during the period. The hypothetical “Ending Account Value” is based on the actual expense ratio of the Fund and an assumed 5% annual rate of return before expenses (not the Fund’s actual return). The amount under the heading “Expense Paid During the Period” shows the hypothetical expenses your account would have incurred under this scenario. You can compare this figure with the 5% hypothetical examples that appear in shareholder reports of other mutual funds.
| | | | | | | | | | | | |
Six Months Ended
June 30, 2014 | | Beginning Account Value
1/1/2014 | | | Ending Account Value
6/30/2014 | | | Expenses Paid
During Period* | |
Based on Actual Fund Return | | $ | 1,000.00 | | | $ | 1,062.50 | | | $ | 2.72 | |
Based on Hypothetical 5% Yearly Return | | | 1,000.00 | | | | 1,022.15 | | | | 2.67 | |
| * | | Expenses are equal to the Fund’s annualized expense ratio of 0.53%, multiplied by the average account value over the period, multiplied by 181/365 (to reflect the one-half year period). |
The expenses shown in the table highlight ongoing costs only and do not reflect any transactional fees or account maintenance fees. Though other mutual funds may charge such fees, please note that the Fund does not charge transaction fees (e.g., redemption fees, sales loads) or universal account maintenance fees (e.g., small account fees).
PAGE 5 § DODGE & COX BALANCED FUND
| | | | |
FUND INFORMATION | |
| June 30, 2014
|
|
| | | | |
| GENERAL INFORMATION | | | |
Net Asset Value Per Share | | | $102.70 | |
Total Net Assets (billions) | | | $15.2 | |
30-Day SEC Yield(a) | | | 1.69% | |
Expense Ratio | | | 0.53% | |
Portfolio Turnover Rate
(1/1/14 to 6/30/14, unannualized) | | | 10% | |
Fund Inception | | | 1931 | |
No sales charges or distribution fees | | | | |
Investment Manager: Dodge & Cox, San Francisco. Managed by the Investment Policy Committee, whose nine members’ average tenure at Dodge & Cox is 26 years, and by the Fixed Income Investment Policy Committee, whose nine members’ average tenure is 18 years.
| | | | |
| EQUITY PORTFOLIO (67.1%) | | Fund | |
Number of Equity Securities | | | 70 | |
Median Market Capitalization (billions) | | | $36 | |
Price-to-Earnings Ratio(b) | | | 14.2x | |
Foreign Securities not in the S&P 500(c) | | | 10.3% | |
| | | | |
| SECTOR DIVERSIFICATION (FIVE LARGEST) | |
Information Technology | | | 15.6 | % |
Financials | | | 15.6 | |
Health Care | | | 12.3 | |
Consumer Discretionary | | | 9.8 | |
Energy | | | 6.5 | |
| | | | |
| TEN LARGEST EQUITY SECURITIES(d) | |
Hewlett-Packard Co. | | | 2.9 | % |
Capital One Financial Corp. | | | 2.8 | |
Wells Fargo & Co. | | | 2.7 | |
Microsoft Corp. | | | 2.6 | |
Novartis AG (Switzerland) | | | 2.2 | |
Comcast Corp. | | | 2.2 | |
Schlumberger, Ltd. | | | 1.8 | |
Charles Schwab Corp. | | | 1.8 | |
Bank of New York Mellon Corp. | | | 1.8 | |
Sanofi (France) | | | 1.8 | |
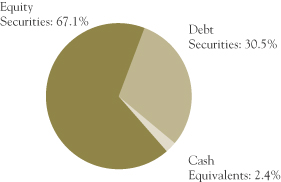
| | | | |
| FIXED INCOME PORTFOLIO (30.5%) | | Fund | |
Number of Debt Securities | | | 346 | |
Effective Duration (years) | | | 4.3 | |
| | | | |
| SECTOR DIVERSIFICATION | | | |
U.S. Treasury(e) | | | 3.4 | % |
Government-Related | | | 2.6 | |
Mortgage-Related | | | 10.6 | |
Corporate | | | 13.0 | |
Asset-Backed | | | 0.9 | |
| | | | |
| CREDIT QUALITY(f) | | | |
U.S. Treasury/Agency/GSE(e) | | | 14.2 | % |
Aaa | | | 0.6 | |
Aa | | | 0.6 | |
A | | | 3.2 | |
Baa | | | 8.6 | |
Ba | | | 2.6 | |
B | | | 0.7 | |
| | | | |
| FIVE LARGEST CORPORATE ISSUERS(d) | | | |
Verizon Communications, Inc. | | | 0.7 | % |
Bank of America Corp. | | | 0.6 | |
Cox Enterprises, Inc. | | | 0.6 | |
Ford Motor Credit Co. LLC | | | 0.5 | |
Time Warner Cable, Inc. | | | 0.5 | |
| (a) | SEC Yield is an annualization of the Fund’s total net investment income per share for the 30-day period ended on the last day of the month. |
| (b) | Price-to-earnings (P/E) ratio is calculated using 12-month forward earnings estimates from third-party sources. |
| (c) | Foreign stocks are U.S. dollar denominated. |
| (d) | The Fund’s portfolio holdings are subject to change without notice. The mention of specific securities is not a recommendation to buy, sell, or hold any particular security and is not indicative of Dodge & Cox’s current or future trading activity. |
| (e) | Data as presented excludes the effect of the Fund’s position in Treasury futures contracts. |
| (f) | The credit quality distribution shown for the Fund is based on the middle of Moody’s, S&P’s, and Fitch ratings, which is the methodology used by Barclays in constructing its indices. If a security is rated by only two agencies, the lower of the two ratings is used. Please note the Fund applies the highest of Moody’s, S&P’s, and Fitch ratings to determine compliance with the quality requirements stated in its prospectus. The credit quality of the investments in the portfolio does not apply to the stability or safety of the Fund or its shares. |
DODGE & COX BALANCED FUND §PAGE 6
| | | | |
| PORTFOLIO OF INVESTMENTS (unaudited) | | | June 30, 2014 | |
| | | | | | | | |
| COMMON STOCKS: 66.7% | |
| | |
| | | SHARES | | | VALUE | |
| CONSUMER DISCRETIONARY: 9.4% | |
CONSUMER DURABLES & APPAREL: 0.7% | | | | | |
Coach, Inc. | | | 1,815,036 | | | $ | 62,056,081 | |
Panasonic Corp. ADR(b) (Japan) | | | 3,797,887 | | | | 46,258,263 | |
| | | | | | | | |
| | | | 108,314,344 | |
MEDIA: 7.3% | |
Comcast Corp., Class A | | | 6,054,774 | | | | 325,020,268 | |
DISH Network Corp., Class A(a) | | | 1,145,032 | | | | 74,518,683 | |
News Corp., Class A(a) | | | 728,050 | | | | 13,061,217 | |
Time Warner Cable, Inc. | | | 1,635,883 | | | | 240,965,566 | |
Time Warner, Inc. | | | 3,717,066 | | | | 261,123,887 | |
Time, Inc.(a) | | | 864,633 | | | | 20,941,411 | |
Twenty-First Century Fox, Inc. | | | 4,832,200 | | | | 169,851,830 | |
| | | | | | | | |
| | | | 1,105,482,862 | |
RETAILING: 1.4% | |
CarMax, Inc.(a) | | | 801,000 | | | | 41,660,010 | |
Liberty Interactive, Series A(a) | | | 2,309,650 | | | | 67,811,324 | |
Target Corp. | | | 1,800,000 | | | | 104,310,000 | |
| | | | | | | | |
| | | | 213,781,334 | |
| | | | | | | | |
| | | | 1,427,578,540 | |
| CONSUMER STAPLES: 1.7% | |
FOOD & STAPLES RETAILING: 1.5% | |
Wal-Mart Stores, Inc. | | | 3,051,900 | | | | 229,106,133 | |
|
FOOD, BEVERAGE & TOBACCO: 0.2% | |
Unilever PLC ADR(b) (United Kingdom) | | | 602,400 | | | | 27,294,744 | |
| | | | | | | | |
| | | | 256,400,877 | |
| ENERGY: 6.5% | |
Apache Corp. | | | 1,952,278 | | | | 196,438,212 | |
Baker Hughes, Inc. | | | 1,747,579 | | | | 130,107,257 | |
Chevron Corp. | | | 1,108,579 | | | | 144,724,988 | |
National Oilwell Varco, Inc. | | | 1,480,000 | | | | 121,878,000 | |
Schlumberger, Ltd.(b) (Curacao/United States) | | | 2,379,021 | | | | 280,605,527 | |
Weatherford International PLC(a) (Ireland) | | | 4,600,000 | | | | 105,800,000 | |
| | | | | | | | |
| | | | 979,553,984 | |
| FINANCIALS: 15.6% | |
BANKS: 6.1% | |
Bank of America Corp. | | | 14,465,600 | | | | 222,336,272 | |
BB&T Corp. | | | 1,589,584 | | | | 62,677,297 | |
HSBC Holdings PLC ADR(b) (United Kingdom) | | | 970,561 | | | | 49,304,499 | |
JPMorgan Chase & Co. | | | 2,329,900 | | | | 134,248,838 | |
SunTrust Banks, Inc. | | | 1,384,490 | | | | 55,462,670 | |
Wells Fargo & Co. | | | 7,698,506 | | | | 404,633,475 | |
| | | | | | | | |
| | | | 928,663,051 | |
| | | | | | | | |
| | |
| | | SHARES | | | VALUE | |
DIVERSIFIED FINANCIALS: 8.1% | |
Bank of New York Mellon Corp. | | | 7,284,800 | | | $ | 273,034,304 | |
Capital One Financial Corp. | | | 5,082,659 | | | | 419,827,633 | |
Charles Schwab Corp. | | | 10,199,900 | | | | 274,683,307 | |
Goldman Sachs Group, Inc. | | | 1,297,000 | | | | 217,169,680 | |
McGraw Hill Financial, Inc. | | | 501,971 | | | | 41,678,652 | |
| | | | | | | | |
| | | | 1,226,393,576 | |
INSURANCE: 1.4% | |
AEGON NV(b) (Netherlands) | | | 12,102,502 | | | | 106,138,943 | |
MetLife, Inc. | | | 1,750,000 | | | | 97,230,000 | |
| | | | | | | | |
| | | | 203,368,943 | |
| | | | | | | | |
| | | | 2,358,425,570 | |
| HEALTH CARE: 12.3% | |
HEALTH CARE EQUIPMENT & SERVICES: 2.8% | |
Boston Scientific Corp.(a) | | | 3,791,300 | | | | 48,414,901 | |
Cigna Corp. | | | 666,216 | | | | 61,271,886 | |
Express Scripts Holding Co.(a) | | | 1,940,000 | | | | 134,500,200 | |
Medtronic, Inc. | | | 720,200 | | | | 45,919,952 | |
UnitedHealth Group, Inc. | | | 1,720,762 | | | | 140,672,293 | |
| | | | | | | | |
| | | | 430,779,232 | |
PHARMACEUTICALS, BIOTECHNOLOGY & LIFE SCIENCES: 9.5% | |
GlaxoSmithKline PLC ADR(b) (United Kingdom) | | | 4,760,600 | | | | 254,596,888 | |
Merck & Co., Inc. | | | 3,647,175 | | | | 210,989,074 | |
Novartis AG ADR(b) (Switzerland) | | | 3,754,900 | | | | 339,931,097 | |
Pfizer, Inc. | | | 5,248,417 | | | | 155,773,016 | |
Roche Holding AG ADR(b) (Switzerland) | | | 5,600,000 | | | | 208,880,000 | |
Sanofi ADR(b) (France) | | | 5,115,165 | | | | 271,973,323 | |
| | | | | | | | |
| | | | 1,442,143,398 | |
| | | | | | | | |
| | | | 1,872,922,630 | |
| INDUSTRIALS: 4.3% | |
CAPITAL GOODS: 1.6% | |
General Electric Co. | | | 7,056,700 | | | | 185,450,076 | |
Koninklijke Philips NV(b) (Netherlands) | | | 1,258,599 | | | | 39,973,104 | |
NOW, Inc.(a) | | | 370,000 | | | | 13,397,700 | |
| | | | | | | | |
| | | | 238,820,880 | |
COMMERCIAL & PROFESSIONAL SERVICES: 1.1% | |
ADT Corp. | | | 2,217,717 | | | | 77,487,032 | |
Tyco International, Ltd.(b) (Switzerland) | | | 2,145,434 | | | | 97,831,790 | |
| | | | | | | | |
| | | | 175,318,822 | |
TRANSPORTATION: 1.6% | |
FedEx Corp. | | | 1,572,954 | | | | 238,113,777 | |
| | | | | | | | |
| | | | 652,253,479 | |
| | |
| PAGE 7 § DODGE & COX BALANCED FUND | | See accompanying Notes to Financial Statements |
| | | | |
| PORTFOLIO OF INVESTMENTS (unaudited) | | | June 30, 2014 | |
| | | | | | | | |
| COMMON STOCKS (continued) | |
| | |
| | | SHARES | | | VALUE | |
| INFORMATION TECHNOLOGY: 15.6% | |
SEMICONDUCTORS & SEMICONDUCTOR EQUIPMENT: 0.5% | |
Maxim Integrated Products, Inc. | | | 2,093,791 | | | $ | 70,791,074 | |
|
SOFTWARE & SERVICES: 8.0% | |
Adobe Systems, Inc.(a) | | | 806,097 | | | | 58,329,179 | |
AOL, Inc.(a) | | | 1,319,074 | | | | 52,485,955 | |
Cadence Design Systems, Inc.(a) | | | 1,570,700 | | | | 27,471,543 | |
Computer Sciences Corp. | | | 150,207 | | | | 9,493,082 | |
eBay, Inc.(a) | | | 2,527,031 | | | | 126,503,172 | |
Google, Inc., Class A(a) | | | 138,000 | | | | 80,684,460 | |
Google, Inc., Class C(a) | | | 263,000 | | | | 151,298,640 | |
Microsoft Corp. | | | 9,594,900 | | | | 400,107,330 | |
Symantec Corp. | | | 9,494,000 | | | | 217,412,600 | |
Synopsys, Inc.(a) | | | 2,503,100 | | | | 97,170,342 | |
| | | | | | | | |
| | | | 1,220,956,303 | |
TECHNOLOGY, HARDWARE & EQUIPMENT: 7.1% | |
Corning, Inc. | | | 6,505,000 | | | | 142,784,750 | |
EMC Corp. | | | 4,650,000 | | | | 122,481,000 | |
Hewlett-Packard Co. | | | 12,951,412 | | | | 436,203,556 | |
NetApp, Inc. | | | 3,408,985 | | | | 124,496,132 | |
Nokia Corp. ADR(b) (Finland) | | | 14,040,260 | | | | 106,144,366 | |
TE Connectivity, Ltd.(b) (Switzerland) | | | 2,330,536 | | | | 144,120,346 | |
| | | | | | | | |
| | | | 1,076,230,150 | |
| | | | | | | | |
| | | | 2,367,977,527 | |
| MATERIALS: 1.1% | |
Celanese Corp., Series A | | | 1,555,960 | | | | 100,017,109 | |
Dow Chemical Co. | | | 936,954 | | | | 48,215,653 | |
Vulcan Materials Co. | | | 411,177 | | | | 26,212,533 | |
| | | | | | | | |
| | | | 174,445,295 | |
| TELECOMMUNICATION SERVICES: 0.2% | |
Sprint Corp.(a) | | | 3,734,101 | | | | 31,851,882 | |
| | | | | | | | |
TOTAL COMMON STOCKS
(Cost $6,568,716,708) | | | $ | 10,121,409,784 | |
| | |
| PREFERRED STOCKS: 0.4% | | | | | | |
| CONSUMER DISCRETIONARY: 0.4% | |
MEDIA: 0.4% | |
NBC Universal Enterprise, Inc. 5.25%(d) | | | 52,710 | | | | 55,081,950 | |
| | | | | | | | |
TOTAL PREFERRED STOCKS
(Cost $52,718,289) | | | $ | 55,081,950 | |
| | | | | | | | |
| DEBT SECURITIES: 30.5% | |
| | |
| | | PAR VALUE | | | VALUE | |
| U.S. TREASURY: 3.4% | |
U.S. Treasury Note | | | | | | | | |
0.25%, 1/15/15 | | $ | 55,000,000 | | | $ | 55,051,590 | |
0.25%, 11/30/15 | | | 155,000,000 | | | | 155,066,650 | |
1.50%, 7/31/16 | | | 125,000,000 | | | | 127,587,875 | |
0.625%, 2/15/17 | | | 114,500,000 | | | | 114,213,750 | |
1.50%, 2/28/19 | | | 66,675,000 | | | | 66,549,985 | |
| | | | | | | | |
| | | | | | | 518,469,850 | |
| GOVERNMENT-RELATED: 2.6% | |
FEDERAL AGENCY: 0.2% | |
Arkansas Dev. Finance Authority
9.75%, 11/15/14 | | | 22,222 | | | | 22,611 | |
Small Business Admin. — 504 Program | | | | | |
Series 1996-20L 1, 6.70%, 12/1/16 | | | 226,803 | | | | 235,866 | |
Series 1997-20F 1, 7.20%, 6/1/17 | | | 342,390 | | | | 363,701 | |
Series 1997-20I 1, 6.90%, 9/1/17 | | | 565,973 | | | | 600,210 | |
Series 1998-20D 1, 6.15%, 4/1/18 | | | 571,065 | | | | 600,625 | |
Series 1998-20I 1, 6.00%, 9/1/18 | | | 440,382 | | | | 463,877 | |
Series 1999-20F 1, 6.80%, 6/1/19 | | | 417,280 | | | | 451,259 | |
Series 2000-20D 1, 7.47%, 4/1/20 | | | 1,527,634 | | | | 1,678,119 | |
Series 2000-20E 1, 8.03%, 5/1/20 | | | 656,040 | | | | 730,845 | |
Series 2000-20G 1, 7.39%, 7/1/20 | | | 883,057 | | | | 964,691 | |
Series 2000-20I 1, 7.21%, 9/1/20 | | | 609,249 | | | | 668,460 | |
Series 2001-20E 1, 6.34%, 5/1/21 | | | 1,591,656 | | | | 1,730,690 | |
Series 2001-20G 1, 6.625%, 7/1/21 | | | 1,640,121 | | | | 1,794,277 | |
Series 2003-20J 1, 4.92%, 10/1/23 | | | 5,291,692 | | | | 5,718,489 | |
Series 2007-20F 1, 5.71%, 6/1/27 | | | 5,258,439 | | | | 5,865,126 | |
| | | | | | | | |
| | | | | | | 21,888,846 | |
FOREIGN AGENCY: 0.7% | |
Export-Import Bank of Korea(b) (South Korea)
4.00%, 1/11/17 | | | 15,000,000 | | | | 16,008,585 | |
Petroleo Brasileiro SA(b) (Brazil) | | | | | | | | |
5.375%, 1/27/21 | | | 28,735,000 | | | | 29,948,479 | |
4.375%, 5/20/23 | | | 29,800,000 | | | | 28,716,770 | |
6.25%, 3/17/24 | | | 8,400,000 | | | | 8,940,960 | |
Petroleos Mexicanos(b) (Mexico) | | | | | | | | |
6.625%, 6/15/35 | | | 3,075,000 | | | | 3,620,813 | |
6.375%, 1/23/45(d) | | | 13,225,000 | | | | 15,357,531 | |
| | | | | | | | |
| | | | | | | 102,593,138 | |
LOCAL AUTHORITY: 1.6% | |
L.A. Unified School District GO
6.758%, 7/1/34 | | | 19,000,000 | | | | 25,447,460 | |
New Jersey Turnpike Authority RB | | | | | | | | |
7.414%, 1/1/40 | | | 3,350,000 | | | | 4,830,197 | |
7.102%, 1/1/41 | | | 22,436,000 | | | | 31,428,573 | |
State of California GO | | | | | | | | |
7.50%, 4/1/34 | | | 33,470,000 | | | | 47,644,545 | |
7.55%, 4/1/39 | | | 19,025,000 | | | | 28,600,663 | |
7.30%, 10/1/39 | | | 13,730,000 | | | | 19,538,751 | |
7.625%, 3/1/40 | | | 8,790,000 | | | | 12,967,360 | |
| | |
| See accompanying Notes to Financial Statements | | DODGE & COX BALANCED FUND §PAGE 8 |
| | | | |
| PORTFOLIO OF INVESTMENTS (unaudited) | | | June 30, 2014 | |
| | | | | | | | |
| DEBT SECURITIES (continued) | |
| | |
| | | PAR VALUE | | | VALUE | |
State of Illinois GO | | | | | | | | |
4.961%, 3/1/16 | | $ | 3,215,000 | | | $ | 3,419,892 | |
5.365%, 3/1/17 | | | 37,215,000 | | | | 40,727,724 | |
5.665%, 3/1/18 | | | 26,160,000 | | | | 29,203,716 | |
| | | | | | | | |
| | | | | | | 243,808,881 | |
SOVEREIGN: 0.1% | |
Spain Government International(b) (Spain) | | | | | | | | |
4.00%, 3/6/18(d) | | | 18,350,000 | | | | 19,609,544 | |
| | | | | | | | |
| | | | | | | 387,900,409 | |
| MORTGAGE-RELATED: 10.6% | |
FEDERAL AGENCY CMO & REMIC: 2.7% | |
Dept. of Veterans Affairs | | | | | | | | |
Series 1995-1 1, 7.228%, 2/15/25 | | | 522,202 | | | | 592,181 | |
Series 1995-2C 3A, 8.793%, 6/15/25 | | | 230,003 | | | | 276,918 | |
Series 2002-1 2J, 6.50%, 8/15/31 | | | 13,278,238 | | | | 15,275,590 | |
Fannie Mae | | | | | | | | |
Trust 2001-T5 A3, 7.50%, 6/19/30 | | | 780,836 | | | | 918,220 | |
Trust 2002-33 A1, 7.00%, 6/25/32 | | | 2,458,267 | | | | 2,820,164 | |
Trust 2005-W4 1A2, 6.50%, 8/25/35 | | | 8,739,464 | | | | 9,906,261 | |
Trust 2009-66 ET, 6.00%, 5/25/39 | | | 9,441,510 | | | | 10,131,089 | |
Trust 2009-30 AG, 6.50%, 5/25/39 | | | 5,047,259 | | | | 5,492,614 | |
Trust 2001-T7 A1, 7.50%, 2/25/41 | | | 2,100,629 | | | | 2,424,036 | |
Trust 2001-T8 A1, 7.50%, 7/25/41 | | | 2,025,466 | | | | 2,359,635 | |
Trust 2001-T4 A1, 7.50%, 7/25/41 | | | 2,021,404 | | | | 2,413,247 | |
Trust 2001-W3 A, 6.964%, 9/25/41 | | | 1,610,179 | | | | 1,849,400 | |
Trust 2001-T10 A2, 7.50%, 12/25/41 | | | 1,810,327 | | | | 2,114,157 | |
Trust 2013-106 MA, 4.00%, 2/25/42 | | | 14,703,335 | | | | 15,532,177 | |
Trust 2002-W6 2A1, 6.474%, 6/25/42 | | | 2,124,787 | | | | 2,435,161 | |
Trust 2002-W8 A2, 7.00%, 6/25/42 | | | 2,528,619 | | | | 2,931,562 | |
Trust 2003-W2 1A1, 6.50%, 7/25/42 | | | 4,131,641 | | | | 4,734,211 | |
Trust 2003-W2 1A2, 7.00%, 7/25/42 | | | 1,632,486 | | | | 1,896,879 | |
Trust 2003-W4 4A, 7.051%, 10/25/42 | | | 2,469,203 | | | | 2,840,673 | |
Trust 2012-121 NB, 7.00%, 11/25/42 | | | 4,539,742 | | | | 5,053,754 | |
Trust 2012-134 FK, 0.502%, 12/25/42 | | | 17,953,102 | | | | 17,717,450 | |
Trust 2013-15 FA, 0.502%, 3/25/43 | | | 25,199,436 | | | | 24,996,833 | |
Trust 2013-98 FA, 0.702%, 9/25/43 | | | 12,019,826 | | | | 12,037,146 | |
Trust 2013-92 FA, 0.702%, 9/25/43 | | | 51,709,415 | | | | 51,466,019 | |
Trust 2004-T1 1A2, 6.50%, 1/25/44 | | | 2,761,386 | | | | 3,153,815 | |
Trust 2004-W2 5A, 7.50%, 3/25/44 | | | 6,054,577 | | | | 6,984,287 | |
Trust 2004-W8 3A, 7.50%, 6/25/44 | | | 973,734 | | | | 1,136,653 | |
Trust 2009-11 MP, 7.00%, 3/25/49 | | | 12,031,057 | | | | 13,399,446 | |
Freddie Mac | | | | | | | | |
Series 1078 GZ, 6.50%, 5/15/21 | | | 241,172 | | | | 254,013 | |
Series 16 PK, 7.00%, 8/25/23 | | | 3,409,375 | | | | 3,831,882 | |
Series T-48 1A4, 5.538%, 7/25/33 | | | 37,425,398 | | | | 41,403,830 | |
Series 4240 FA, 0.652%, 8/15/43 | | | 11,583,871 | | | | 11,640,168 | |
Series 314 F2, 0.762%, 9/15/43 | | | 25,071,569 | | | | 25,166,253 | |
Series T-51 1A, 6.50%, 9/25/43 | | | 246,161 | | | | 281,680 | |
Series T-59 1A1, 6.50%, 10/25/43 | | | 13,482,280 | | | | 15,411,621 | |
Series 4281 BC, 6.444%, 12/15/43 | | | 76,760,905 | | | | 86,625,833 | |
| | | | | | | | |
| | | | | | | 407,504,858 | |
| | | | | | | | |
| | |
| | | PAR VALUE | | | VALUE | |
FEDERAL AGENCY MORTGAGE PASS-THROUGH: 7.9% | |
Fannie Mae, 15 Year | | | | | | | | |
4.00%, 2/1/27 | | $ | 51,060,466 | | | $ | 54,667,751 | |
4.50%, 1/1/25-1/1/27 | | | 29,055,863 | | | | 31,153,233 | |
6.00%, 7/1/16-3/1/22 | | | 7,909,726 | | | | 8,318,731 | |
6.50%, 12/1/14-11/1/18 | | | 8,693,479 | | | | 9,107,284 | |
7.00%, 11/1/18 | | | 652,128 | | | | 683,487 | |
7.50%, 9/1/15-8/1/17 | | | 2,379,714 | | | | 2,448,050 | |
Fannie Mae, 20 Year | | | | | | | | |
4.00%, 11/1/30-11/1/31 | | | 152,401,193 | | | | 163,863,648 | |
4.50%, 1/1/31-5/1/32 | | | 90,108,682 | | | | 98,518,747 | |
6.50%, 1/1/22-10/1/26 | | | 3,882,260 | | | | 4,376,275 | |
Fannie Mae, 30 Year | | | | | | | | |
4.50%, 1/1/39-9/1/41 | | | 37,401,846 | | | | 40,528,181 | |
5.50%, 7/1/33-8/1/37 | | | 27,805,445 | | | | 31,254,396 | |
6.00%, 9/1/36-3/1/40 | | | 45,487,215 | | | | 51,339,227 | |
6.50%, 12/1/28-8/1/39 | | | 55,957,834 | | | | 62,979,902 | |
7.00%, 4/1/37-8/1/37 | | | 13,970,977 | | | | 15,593,369 | |
Fannie Mae, Hybrid ARM | | | | | | | | |
1.915%, 1/1/35 | | | 4,617,640 | | | | 4,866,259 | |
1.985%, 12/1/34 | | | 2,987,580 | | | | 3,135,976 | |
2.131%, 9/1/34 | | | 2,696,795 | | | | 2,863,384 | |
2.195%, 8/1/35 | | | 2,503,362 | | | | 2,653,257 | |
2.235%, 1/1/35 | | | 1,963,616 | | | | 2,097,351 | |
2.519%, 8/1/38 | | | 5,932,510 | | | | 6,328,353 | |
2.621%, 11/1/43 | | | 14,673,999 | | | | 15,176,742 | |
2.714%, 4/1/44 | | | 27,807,019 | | | | 28,753,545 | |
3.327%, 6/1/41 | | | 28,774,976 | | | | 30,331,554 | |
3.592%, 12/1/40 | | | 8,029,913 | | | | 8,423,633 | |
3.704%, 11/1/40 | | | 3,627,732 | | | | 3,811,186 | |
4.174%, 7/1/39 | | | 5,054,760 | | | | 5,354,194 | |
5.585%, 5/1/37 | | | 3,104,066 | | | | 3,214,198 | |
6.53%, 9/1/36 | | | 644,577 | | | | 671,204 | |
Fannie Mae, Multifamily DUS | | | | | | | | |
Pool 735387, 4.877%, 4/1/15 | | | 3,836,816 | | | | 3,893,278 | |
Pool 462086, 5.355%, 11/1/15 | | | 17,554,143 | | | | 18,297,431 | |
Freddie Mac, Hybrid ARM | | | | | | | | |
2.101%, 4/1/37 | | | 3,323,987 | | | | 3,509,217 | |
2.461%, 5/1/34 | | | 3,759,833 | | | | 4,011,898 | |
2.64%, 8/1/42 | | | 20,746,213 | | | | 21,410,032 | |
2.69%, 2/1/38 | | | 8,537,929 | | | | 9,185,552 | |
2.937%, 10/1/38 | | | 3,594,904 | | | | 3,767,799 | |
2.943%, 5/1/44 | | | 4,346,676 | | | | 4,490,814 | |
3.002%, 5/1/44 | | | 34,342,032 | | | | 35,522,890 | |
3.066%, 6/1/44 | | | 8,687,330 | | | | 9,003,640 | |
3.238%, 6/1/44 | | | 13,876,037 | | | | 14,471,617 | |
3.619%, 10/1/41 | | | 2,876,565 | | | | 3,006,316 | |
5.318%, 10/1/35 | | | 4,933,045 | | | | 5,171,283 | |
5.797%, 7/1/38 | | | 871,925 | | | | 922,908 | |
5.893%, 9/1/37 | | | 1,762,938 | | | | 1,892,582 | |
6.103%, 1/1/38 | | | 1,072,206 | | | | 1,142,797 | |
Freddie Mac Gold, 15 Year | | | | | | | | |
4.00%, 3/1/25-11/1/26 | | | 73,061,302 | | | | 78,199,386 | |
4.50%, 9/1/24-9/1/26 | | | 21,128,455 | | | | 22,770,876 | |
6.00%, 2/1/18 | | | 1,041,888 | | | | 1,090,469 | |
6.50%, 7/1/14-9/1/18 | | | 4,121,642 | | | | 4,296,976 | |
| | |
| PAGE 9 § DODGE & COX BALANCED FUND | | See accompanying Notes to Financial Statements |
| | | | |
| PORTFOLIO OF INVESTMENTS (unaudited) | | | June 30, 2014 | |
| | | | | | | | |
| DEBT SECURITIES (continued) | |
| | |
| | | PAR VALUE | | | VALUE | |
Freddie Mac Gold, 20 Year | | | | | | | | |
4.50%, 4/1/31-6/1/31 | | $ | 18,472,990 | | | $ | 20,115,364 | |
5.00%, 11/1/25 | | | 17,935,538 | | | | 20,061,437 | |
6.50%, 10/1/26 | | | 7,331,707 | | | | 8,260,261 | |
Freddie Mac Gold, 30 Year | | | | | | | | |
4.50%, 9/1/41-3/1/42 | | | 69,500,401 | | | | 75,204,062 | |
5.50%, 11/1/37-3/1/41 | | | 74,202,963 | | | | 82,847,555 | |
6.00%, 9/1/37-3/1/40 | | | 27,685,835 | | | | 31,089,126 | |
6.50%, 12/1/32-4/1/33 | | | 10,966,862 | | | | 12,439,576 | |
7.00%, 11/1/37-9/1/38 | | | 11,908,756 | | | | 13,141,254 | |
7.47%, 3/17/23 | | | 136,751 | | | | 145,194 | |
7.75%, 7/25/21 | | | 483,947 | | | | 537,702 | |
Ginnie Mae, 30 Year | | | | | | | | |
7.50%, 11/15/24-10/15/25 | | | 1,301,053 | | | | 1,521,207 | |
7.97%, 4/15/20-1/15/21 | | | 684,902 | | | | 749,335 | |
| | | | | | | | |
| | | | | | | 1,204,682,951 | |
| | | | | | | | |
| | | | | | | 1,612,187,809 | |
| ASSET-BACKED: 0.9% | | | | | | | | |
CREDIT CARD: 0.3% | | | | | | | | |
Chase Issuance Trust | | | | | | | | |
Series 2012-A8 A8, 0.54%, 10/16/17 | | | 43,983,000 | | | | 44,015,328 | |
Series 2013-A8 A8, 1.01%, 10/15/18 | | | 2,000,000 | | | | 2,005,976 | |
| | | | | | | | |
| | | | | | | 46,021,304 | |
OTHER: 0.3% | | | | | | | | |
Rio Oil Finance Trust(b),(d) (Brazil) Series 2014-1, 6.25%, 7/6/24 | | | 43,500,000 | | | | 45,670,345 | |
|
STUDENT LOAN: 0.3% | |
SLM Student Loan Trust Securities (Private Loans) | | | | | | | | |
Series 2012-E A2A, 2.09%, 6/15/45(d) | | | 13,775,000 | | | | 13,804,878 | |
Series 2012-C A2, 3.31%, 10/15/46(d) | | | 10,100,000 | | | | 10,550,086 | |
Series 2012-B A2, 3.48%, 10/15/30(d) | | | 9,725,000 | | | | 10,192,617 | |
Series 2014-A A2A, 2.59%, 1/15/26(d) | | | 5,250,000 | | | | 5,314,974 | |
| | | | | | | | |
| | | | | | | 39,862,555 | |
| | | | | | | | |
| | | | | | | 131,554,204 | |
| CORPORATE: 13.0% | | | | | | | | |
FINANCIALS: 4.6% | | | | | | | | |
Bank of America Corp. | | | | | | | | |
5.30%, 3/15/17 | | | 29,000,000 | | | | 31,890,865 | |
7.625%, 6/1/19 | | | 12,440,000 | | | | 15,363,537 | |
5.625%, 7/1/20 | | | 5,030,000 | | | | 5,785,707 | |
6.625%, 5/23/36(c) | | | 37,275,000 | | | | 42,103,939 | |
Boston Properties, Inc. | | | | | | | | |
5.625%, 4/15/15 | | | 5,900,000 | | | | 6,130,472 | |
5.875%, 10/15/19 | | | 7,960,000 | | | | 9,293,833 | |
5.625%, 11/15/20 | | | 3,850,000 | | | | 4,429,079 | |
3.85%, 2/1/23 | | | 7,800,000 | | | | 8,039,522 | |
3.125%, 9/1/23 | | | 17,550,000 | | | | 17,019,744 | |
3.80%, 2/1/24 | | | 11,175,000 | | | | 11,294,964 | |
Capital One Financial Corp. | | | | | | | | |
4.75%, 7/15/21 | | | 759,000 | | | | 844,015 | |
3.50%, 6/15/23 | | | 49,579,000 | | | | 49,717,722 | |
| | | | | | | | |
| | |
| | | PAR VALUE | | | VALUE | |
Cigna Corp. | | | | | | | | |
5.125%, 6/15/20 | | $ | 1,820,000 | | | $ | 2,057,657 | |
7.65%, 3/1/23 | | | 9,705,000 | | | | 12,016,100 | |
7.875%, 5/15/27 | | | 21,888,000 | | | | 28,481,279 | |
8.30%, 1/15/33 | | | 8,845,000 | | | | 11,495,864 | |
Citigroup, Inc. | | | | | | | | |
6.125%, 11/21/17 | | | 17,450,000 | | | | 19,955,070 | |
7.875%, 10/30/40(c) | | | 40,695,925 | | | | 44,960,858 | |
Equity Residential | | | | | | | | |
4.625%, 12/15/21 | | | 14,054,000 | | | | 15,462,885 | |
3.00%, 4/15/23 | | | 14,775,000 | | | | 14,402,345 | |
General Electric Co. | | | | | | | | |
5.50%, 1/8/20 | | | 25,095,000 | | | | 29,085,732 | |
4.375%, 9/16/20 | | | 8,475,000 | | | | 9,358,315 | |
4.625%, 1/7/21 | | | 5,750,000 | | | | 6,400,227 | |
4.65%, 10/17/21 | | | 9,825,000 | | | | 10,920,890 | |
Health Net, Inc.
6.375%, 6/1/17 | | | 13,275,000 | | | | 14,585,906 | |
HSBC Holdings PLC(b) (United Kingdom) | | | | | |
5.10%, 4/5/21 | | | 3,625,000 | | | | 4,117,297 | |
6.50%, 5/2/36 | | | 30,190,000 | | | | 37,031,930 | |
6.50%, 9/15/37 | | | 15,315,000 | | | | 18,856,471 | |
JPMorgan Chase & Co.
8.75%, 9/1/30(c) | | | 23,042,000 | | | | 31,258,109 | |
Legg Mason, Inc.
5.50%, 5/21/19 | | | 17,377,000 | | | | 20,080,427 | |
Navient Corp. | | | | | | | | |
3.875%, 9/10/15 | | | 7,625,000 | | | | 7,777,500 | |
6.00%, 1/25/17 | | | 14,285,000 | | | | 15,517,081 | |
4.625%, 9/25/17 | | | 5,450,000 | | | | 5,742,938 | |
8.45%, 6/15/18 | | | 11,855,000 | | | | 14,018,538 | |
Royal Bank of Scotland Group PLC(b) (United Kingdom) | | | | | | | | |
6.125%, 12/15/22 | | | 48,416,000 | | | | 52,928,904 | |
6.00%, 12/19/23 | | | 5,750,000 | | | | 6,213,680 | |
Unum Group | | | | | | | | |
7.19%, 2/1/28 | | | 8,305,000 | | | | 10,051,442 | |
7.25%, 3/15/28 | | | 2,030,000 | | | | 2,566,549 | |
6.75%, 12/15/28 | | | 11,368,000 | | | | 13,575,427 | |
WellPoint, Inc.
4.35%, 8/15/20 | | | 29,305,000 | | | | 31,975,242 | |
| | | | | | | | |
| | | | 692,808,062 | |
INDUSTRIALS: 8.4% | | | | | | | | |
AT&T, Inc. | | | | | | | | |
6.55%, 2/15/39 | | | 7,675,000 | | | | 9,498,143 | |
5.35%, 9/1/40 | | | 26,250,000 | | | | 28,505,977 | |
Boston Scientific Corp. | | | | | | | | |
6.25%, 11/15/15 | | | 1,055,000 | | | | 1,131,810 | |
6.40%, 6/15/16 | | | 24,811,000 | | | | 27,357,998 | |
Burlington Northern Santa Fe LLC(f) | | | | | | | | |
8.251%, 1/15/21 | | | 763,778 | | | | 909,956 | |
4.967%, 4/1/23 | | | 7,327,879 | | | | 8,005,214 | |
3.85%, 9/1/23 | | | 6,650,000 | | | | 6,923,468 | |
5.72%, 1/15/24 | | | 9,755,196 | | | | 11,154,704 | |
5.342%, 4/1/24 | | | 10,305,402 | | | | 11,366,446 | |
5.629%, 4/1/24 | | | 15,858,468 | | | | 17,880,575 | |
| | |
| See accompanying Notes to Financial Statements | | DODGE & COX BALANCED FUND §PAGE 10 |
| | | | |
| PORTFOLIO OF INVESTMENTS (unaudited) | | | June 30, 2014 | |
| | | | | | | | |
| DEBT SECURITIES (continued) | |
| | |
| | | PAR VALUE | | | VALUE | |
Canadian Pacific Railway, Ltd.(b) (Canada) | | | | | |
5.75%, 1/15/42 | | $ | 4,850,000 | | | $ | 5,889,277 | |
Cemex SAB de CV(b) (Mexico) | | | | | | | | |
6.50%, 12/10/19(d) | | | 22,500,000 | | | | 24,103,125 | |
6.00%, 4/1/24(d) | | | 10,575,000 | | | | 11,011,219 | |
Comcast Corp. | | | | | | | | |
6.30%, 11/15/17 | | | 5,865,000 | | | | 6,817,910 | |
5.875%, 2/15/18 | | | 4,475,000 | | | | 5,158,212 | |
6.45%, 3/15/37 | | | 4,998,000 | | | | 6,365,493 | |
6.95%, 8/15/37 | | | 1,700,000 | | | | 2,288,297 | |
Cox Enterprises, Inc. | | | | | | | | |
5.50%, 10/1/15 | | | 4,705,000 | | | | 4,980,139 | |
5.875%, 12/1/16(d) | | | 24,570,000 | | | | 27,146,730 | |
3.25%, 12/15/22(d) | | | 15,740,000 | | | | 15,405,336 | |
2.95%, 6/30/23(d) | | | 37,166,000 | | | | 35,260,462 | |
CSX Corp.
9.75%, 6/15/20 | | | 5,231,000 | | | | 7,076,978 | |
Dillard’s, Inc. | | | | | | | | |
7.13%, 8/1/18 | | | 3,606,000 | | | | 4,128,870 | |
7.875%, 1/1/23 | | | 8,660,000 | | | | 9,894,050 | |
7.75%, 7/15/26 | | | 50,000 | | | | 55,625 | |
7.75%, 5/15/27 | | | 540,000 | | | | 588,600 | |
7.00%, 12/1/28 | | | 15,135,000 | | | | 15,740,400 | |
Dow Chemical Co. | | | | | | | | |
8.55%, 5/15/19 | | | 21,553,000 | | | | 27,699,657 | |
7.375%, 11/1/29 | | | 17,000,000 | | | | 22,632,168 | |
9.40%, 5/15/39 | | | 9,677,000 | | | | 15,834,388 | |
5.25%, 11/15/41 | | | 3,845,000 | | | | 4,177,327 | |
Eaton Corp. PLC(b) (Ireland) | | | | | | | | |
1.50%, 11/2/17 | | | 2,885,000 | | | | 2,888,073 | |
2.75%, 11/2/22 | | | 7,500,000 | | | | 7,258,358 | |
Enel SPA(b) (Italy) | | | | | | | | |
6.80%, 9/15/37(d) | | | 18,700,000 | | | | 22,786,885 | |
6.00%, 10/7/39(d) | | | 3,500,000 | | | | 3,981,656 | |
8.75%, 9/24/73(d) | | | 8,100,000 | | | | 9,537,750 | |
FedEx Corp. | | | | | | | | |
8.00%, 1/15/19 | | | 6,965,000 | | | | 8,715,931 | |
6.72%, 7/15/23 | | | 11,169,454 | | | | 13,124,109 | |
Ford Motor Credit Co. LLC(f) | | | | | | | | |
5.625%, 9/15/15 | | | 19,250,000 | | | | 20,364,517 | |
8.125%, 1/15/20 | | | 8,320,000 | | | | 10,621,312 | |
5.75%, 2/1/21 | | | 17,700,000 | | | | 20,581,914 | |
5.875%, 8/2/21 | | | 11,350,000 | | | | 13,319,951 | |
4.25%, 9/20/22 | | | 9,593,000 | | | | 10,227,107 | |
4.375%, 8/6/23 | | | 3,775,000 | | | | 4,029,246 | |
HCA Holdings, Inc. | | | | | | | | |
6.375%, 1/15/15 | | | 10,375,000 | | | | 10,621,406 | |
6.50%, 2/15/16 | | | 43,180,000 | | | | 46,472,475 | |
Hewlett-Packard Co.
3.30%, 12/9/16 | | | 14,955,000 | | | | 15,736,862 | |
Lafarge SA(b) (France) | | | | | | | | |
6.20%, 7/9/15(d) | | | 4,600,000 | | | | 4,818,500 | |
6.50%, 7/15/16 | | | 35,915,000 | | | | 39,326,925 | |
| | | | | | | | |
| | |
| | | PAR VALUE | | | VALUE | |
Liberty Interactive Corp. | | | | | | | | |
8.50%, 7/15/29 | | $ | 9,462,000 | | | $ | 10,502,820 | |
8.25%, 2/1/30 | | | 7,291,000 | | | | 8,056,555 | |
Macy’s, Inc. | | | | | | | | |
6.90%, 4/1/29 | | | 4,282,000 | | | | 5,352,247 | |
6.90%, 1/15/32 | | | 49,699,000 | | | | 61,698,376 | |
6.70%, 7/15/34 | | | 1,390,000 | | | | 1,750,130 | |
Naspers, Ltd.(b) (South Africa)
6.00%, 7/18/20(d) | | | 21,900,000 | | | | 24,144,750 | |
Norfolk Southern Corp.
9.75%, 6/15/20 | | | 7,224,000 | | | | 9,773,292 | |
Reed Elsevier PLC(b) (United Kingdom) | | | | | | | | |
8.625%, 1/15/19 | | | 4,901,000 | | | | 6,201,647 | |
3.125%, 10/15/22 | | | 22,133,000 | | | | 21,816,919 | |
Sprint Corp.
6.00%, 12/1/16 | | | 15,150,000 | | | | 16,494,562 | |
Telecom Italia SPA(b) (Italy) | | | | | | | | |
6.999%, 6/4/18 | | | 17,100,000 | | | | 19,622,250 | |
7.175%, 6/18/19 | | | 27,527,000 | | | | 31,845,298 | |
7.20%, 7/18/36 | | | 11,596,000 | | | | 12,842,570 | |
7.721%, 6/4/38 | | | 7,062,000 | | | | 8,138,955 | |
Time Warner Cable, Inc. | | | | | | | | |
8.75%, 2/14/19 | | | 25,265,000 | | | | 32,310,044 | |
8.25%, 4/1/19 | | | 33,815,000 | | | | 42,842,320 | |
Time Warner, Inc. | | | | | | | | |
7.625%, 4/15/31 | | | 36,348,000 | | | | 49,882,941 | |
7.70%, 5/1/32 | | | 14,374,000 | | | | 19,935,746 | |
Twenty-First Century Fox, Inc. | | | | | | | | |
6.40%, 12/15/35 | | | 5,355,000 | | | | 6,659,457 | |
6.15%, 3/1/37 | | | 15,000,000 | | | | 18,009,195 | |
6.65%, 11/15/37 | | | 1,638,000 | | | | 2,079,484 | |
Union Pacific Corp. | | | | | | | | |
5.866%, 7/2/30 | | | 28,185,464 | | | | 32,735,726 | |
6.176%, 1/2/31 | | | 9,964,532 | | | | 11,675,222 | |
Verizon Communications, Inc. | | | | | | | | |
5.15%, 9/15/23 | | | 10,250,000 | | | | 11,464,574 | |
4.15%, 3/15/24 | | | 12,750,000 | | | | 13,305,301 | |
6.55%, 9/15/43 | | | 60,476,000 | | | | 75,980,293 | |
Vulcan Materials Co. | | | | | | | | |
6.50%, 12/1/16 | | | 704,000 | | | | 779,680 | |
7.50%, 6/15/21 | | | 13,905,000 | | | | 16,460,044 | |
Xerox Corp. | | | | | | | | |
6.35%, 5/15/18 | | | 28,585,000 | | | | 33,211,768 | |
5.625%, 12/15/19 | | | 13,665,000 | | | | 15,684,113 | |
4.50%, 5/15/21 | | | 19,161,000 | | | | 20,693,343 | |
| | | | | | | | |
| | | | 1,281,351,153 | |
| | | | | | | | |
| | | | 1,974,159,215 | |
| | | | | | | | |
TOTAL DEBT SECURITIES
(Cost $4,315,474,791) | | | $ | 4,624,271,487 | |
| | |
| PAGE 11 § DODGE & COX BALANCED FUND | | See accompanying Notes to Financial Statements |
| | | | |
| PORTFOLIO OF INVESTMENTS (unaudited) | | | June 30, 2014 | |
| | | | | | | | |
| SHORT-TERM INVESTMENTS: 2.3% | |
| | |
| | | PAR VALUE | | | VALUE | |
MONEY MARKET FUND: 0.2% | | | | | | | | |
SSgA U.S. Treasury Money Market Fund | | $ | 30,309,089 | | | $ | 30,309,089 | |
| |
REPURCHASE AGREEMENT: 2.1% | | | | | |
Fixed Income Clearing Corporation(e) 0.00%, dated 6/30/14, due 7/1/14, maturity value $320,591,108 | | | 320,591,108 | | | | 320,591,108 | |
| | | | | | | | |
TOTAL SHORT-TERM INVESTMENTS
(Cost $350,900,197) | | | $ | 350,900,197 | |
| | | | | | | | |
TOTAL INVESTMENTS
(Cost $11,287,809,985) | | | 99.9 | % | | $ | 15,151,663,418 | |
OTHER ASSETS LESS LIABILITIES | | | 0.1 | % | | | 9,638,787 | |
| | | | | | | | |
| NET ASSETS | | | 100.0 | % | | $ | 15,161,302,205 | |
| | | | | | | | |
| (b) | Security denominated in U.S. dollars |
| (c) | Cumulative preferred security |
| (d) | Security exempt from registration under Rule 144A of the Securities Act of 1933. The security may be resold in transactions exempt from registration, normally to qualified institutional buyers. As of June 30, 2014, all such securities in total represented $353,778,338 or 2.3% of net assets. These securities have been deemed liquid by Dodge & Cox, investment manager, pursuant to procedures approved by the Fund’s Board of Trustees. |
| (e) | Repurchase agreement is collateralized by U.S. Treasury Bill 0.00%, 7/24/14; Freddie Mac 0.00%-0.50%, 8/5/14-12/4/14. Total collateral value is $327,007,863. |
| (f) | Subsidiary (see below) |
In determining a company’s country designation, the Fund generally references the country of incorporation. In cases where the Fund considers the country of incorporation to be a “jurisdiction of convenience” chosen primarily for tax purposes, the Fund uses the country designation of an appropriate broad-based market index. In that circumstance, two countries are listed - the country of incorporation and the country designated by an appropriate index, respectively.
Debt securities are grouped by parent company unless otherwise noted. Actual securities may be issued by the listed parent company or one of its subsidiaries.
ADR: American Depositary Receipt
ARM: Adjustable Rate Mortgage
CMO: Collateralized Mortgage Obligation
DUS: Delegated Underwriting and Servicing
GO: General Obligation
RB: Revenue Bond
REMIC: Real Estate Mortgage Investment Conduit
FUTURES CONTRACTS
| | | | | | | | | | | | | | | | |
| Description | | Number of
Contracts | | | Expiration
Date | | | Notional
Amount | | | Unrealized
Depreciation | |
10 Year U.S. Treasury Note - Short Position | | | 1,428 | | | | Sep 2014 | | | $ | (178,745,438 | ) | | $ | (173,489 | ) |
Long-Term U.S. Treasury Bond - Short Position | | | 710 | | | | Sep 2014 | | | | (106,455,625 | ) | | | (846,090 | ) |
| | | | | | | | | | | | | | | | |
| | | | | | | | | | | | | | $ | (1,019,579 | ) |
| | | | | | | | | | | | | | | | |
| | | | | | | | | | | | | | | | | |
| | |
| See accompanying Notes to Financial Statements | | DODGE & COX BALANCED FUND §PAGE 12 |
| | | | |
STATEMENT OF ASSETS AND LIABILITIES
(unaudited) | |
| |
| | |
June 30, 2014 | |
ASSETS: | | | | |
Investments, at value (cost $11,287,809,985) | | $ | 15,151,663,418 | |
Cash held at broker | | | 3,915,438 | |
Receivable for investments sold | | | 3,631,778 | |
Receivable for Fund shares sold | | | 7,366,548 | |
Dividends and interest receivable | | | 57,500,408 | |
Prepaid expenses and other assets | | | 52,212 | |
| | | | |
| | | 15,224,129,802 | |
| | | | |
LIABILITIES: | | | | |
Payable for investments purchased | | | 48,130,594 | |
Payable for Fund shares redeemed | | | 7,156,779 | |
Payable to broker for variation margin | | | 577,507 | |
Management fees payable | | | 6,165,442 | |
Accrued expenses | | | 797,275 | |
| | | | |
| | | 62,827,597 | |
| | | | |
NET ASSETS | | $ | 15,161,302,205 | |
| | | | |
NET ASSETS CONSIST OF: | | | | |
Paid in capital | | $ | 11,107,722,753 | |
Undistributed net investment income | | | 2,938,713 | |
Undistributed net realized gain | | | 187,803,014 | |
Net unrealized appreciation | | | 3,862,837,725 | |
| | | | |
| | $ | 15,161,302,205 | |
| | | | |
Fund shares outstanding (par value $0.01 each, unlimited shares authorized) | | | 147,633,284 | |
Net asset value per share | | $ | 102.70 | |
|
STATEMENT OF OPERATIONS
(unaudited) | |
| | | Six Months Ended
June 30, 2014 | |
INVESTMENT INCOME: | | | | |
Dividends (net of foreign taxes of $5,177,868) | | $ | 130,504,591 | |
Interest | | | 81,485,089 | |
| | | | |
| | | 211,989,680 | |
| | | | |
EXPENSES: | | | | |
Management fees | | | 36,091,184 | |
Custody and fund accounting fees | | | 160,248 | |
Transfer agent fees | | | 1,030,292 | |
Professional services | | | 97,275 | |
Shareholder reports | | | 688,046 | |
Registration fees | | | 125,301 | |
Trustees’ fees | | | 139,442 | |
Miscellaneous | | | 108,187 | |
| | | | |
| | | 38,439,975 | |
| | | | |
NET INVESTMENT INCOME | | | 173,549,705 | |
| | | | |
|
REALIZED AND UNREALIZED GAIN (LOSS): | |
Net realized gain (loss) | | | | |
Investments | | | 193,789,447 | |
Treasury futures contracts | | | (5,072,292 | ) |
Net change in unrealized appreciation/depreciation | | | | |
Investments | | | 530,438,750 | |
Treasury futures contracts | | | (1,927,990 | ) |
| | | | |
Net realized and unrealized gain | | | 717,227,915 | |
| | | | |
NET INCREASE IN NET ASSETS FROM OPERATIONS | | $ | 890,777,620 | |
| | | | |
| | | | | | | | |
STATEMENT OF CHANGES IN NET ASSETS
(unaudited) | |
| | |
| | | Six Months Ended
June 30, 2014 | | | Year Ended
December 31, 2013 | |
OPERATIONS: | | | | | | | | |
Net investment income | | $ | 173,549,705 | | | $ | 247,794,566 | |
Net realized gain | | | 188,717,155 | | | | 1,099,230,936 | |
Net change in unrealized appreciation/depreciation | | | 528,510,760 | | | | 1,975,952,682 | |
| | | | | | | | |
| | | 890,777,620 | | | | 3,322,978,184 | |
| | | | | | | | |
| | |
DISTRIBUTIONS TO SHAREHOLDERS FROM: | | | | | | | | |
Net investment income | | | (174,243,719 | ) | | | (246,397,862 | ) |
Net realized gain | | | (73,757,923 | ) | | | (9,642,637 | ) |
| | | | | | | | |
Total distributions | | | (248,001,642 | ) | | | (256,040,499 | ) |
| | | | | | | | |
| | |
FUND SHARE TRANSACTIONS: | | | | | | | | |
Proceeds from sale of shares | | | 891,555,546 | | | | 1,558,477,176 | |
Reinvestment of distributions | | | 234,272,702 | | | | 242,306,286 | |
Cost of shares redeemed | | | (1,011,227,127 | ) | | | (2,681,100,500 | ) |
| | | | | | | | |
Net increase/(decrease) from Fund share transactions | | | 114,601,121 | | | | (880,317,038 | ) |
| | | | | | | | |
Total increase in net assets | | | 757,377,099 | | | | 2,186,620,647 | |
| | |
NET ASSETS: | | | | | | | | |
Beginning of period | | | 14,403,925,106 | | | | 12,217,304,459 | |
| | | | | | | | |
End of period (including undistributed net investment income of $2,938,713 and $3,632,727, respectively) | | $ | 15,161,302,205 | | | $ | 14,403,925,106 | |
| | | | | | | | |
| | |
SHARE INFORMATION: | | | | | | | | |
Shares sold | | | 8,981,288 | | | | 17,648,446 | |
Distributions reinvested | | | 2,346,555 | | | | 2,717,903 | |
Shares redeemed | | | (10,222,611 | ) | | | (30,347,088 | ) |
| | | | | | | | |
Net increase/(decrease) in shares outstanding | | | 1,105,232 | | | | (9,980,739 | ) |
| | | | | | | | |
| | |
| PAGE 13 § DODGE & COX BALANCED FUND | | See accompanying Notes to Financial Statements |
NOTES TO FINANCIAL STATEMENTS (unaudited)
NOTE 1—ORGANIZATION AND SIGNIFICANT ACCOUNTING POLICIES
Dodge & Cox Balanced Fund (the “Fund”) is one of the series constituting the Dodge & Cox Funds (the “Trust” or the “Funds”). The Trust is organized as a Delaware statutory trust and is registered under the Investment Company Act of 1940, as amended, as an open-end management investment company. The Fund commenced operations on June 26, 1931, and seeks regular income, conservation of principal, and an opportunity for long-term growth of principal and income. Risk considerations and investment strategies of the Fund are discussed in the Fund’s Prospectus.
The financial statements have been prepared in conformity with accounting principles generally accepted in the United States of America, which require the use of estimates and assumptions by management. Actual results may differ from those estimates. Significant accounting policies are as follows:
Security valuation The Fund’s net assets are valued as of the close of trading on the New York Stock Exchange (NYSE), generally 4:00 p.m. Eastern Time, each day that the NYSE is open for business. Portfolio securities and other financial instruments for which market quotes are readily available are valued at market value. Listed securities are generally valued using the official quoted close price or the last sale on the exchange that is determined to be the primary market for the security. Debt securities (including certain preferred stocks) are valued based on prices received from independent pricing services which utilize both dealer-supplied valuations and pricing models. Pricing models may consider quoted prices for similar securities, interest rates, prepayment speeds, and credit risk. Exchange-traded derivatives are valued at the settlement price determined by the relevant exchange. Security values are not discounted based on the size of the Fund’s position. Securities for which market quotations are not readily available are valued at fair value as determined in good faith by or under the direction of the Board of Trustees. Short-term securities less than 60 days to maturity may be valued at amortized cost if amortized cost approximates current value. All securities held by the Fund are denominated in U.S. dollars.
The Board of Trustees has delegated authority to Dodge & Cox, the Fund’s investment manager, to make
fair value determinations in accordance with the Dodge & Cox Funds Valuation Policies (“Valuation Policies”), subject to Board oversight. Dodge & Cox has established a Pricing Committee that is comprised of representatives from Treasury, Legal, Compliance, and Operations. The Pricing Committee is responsible for implementing the Valuation Policies, including determining the fair value of securities when market quotations or market-based valuations are not readily available or are deemed unreliable. The Pricing Committee considers relevant indications of value that are reasonably available to it in determining the fair value assigned to a particular security, such as the value of similar financial instruments, trading volumes, contractual restrictions on disposition, related corporate actions, and changes in economic conditions.
Valuing securities at fair value involves greater reliance on judgment than valuation of securities based on readily available market quotations. In some instances, lack of information and uncertainty as to the significance of information may lead to a conclusion that a prior valuation is the best indication of a security’s present value. When fair value pricing is employed, the prices of securities used by the Fund to calculate its net asset value may differ from quoted or published prices for the same securities.
Security transactions, investment income, expenses, and distributions Security transactions are recorded on the trade date. Realized gains and losses on securities sold are determined on the basis of identified cost.
Dividend income and corporate action transactions are recorded on the ex-dividend date, or when the Fund first learns of the dividend/corporate action if the ex-dividend date has passed. Withholding taxes on foreign dividends have been provided for in accordance with the Fund’s understanding of the applicable country’s tax rules and rates. Non-cash dividends included in dividend income, if any, are recorded at the fair market value of the securities received. Dividends characterized as return of capital for U.S. tax purposes are recorded as a reduction of cost of investments and/or realized gain.
Interest income is recorded on the accrual basis. Interest income includes coupon interest, amortization of premium and accretion of discount on debt securities, and gain/loss on paydowns of mortgage-backed securities. The
DODGE & COX BALANCED FUND §PAGE 14
NOTES TO FINANCIAL STATEMENTS (unaudited)
ability of the issuers of the debt securities held by the Fund to meet their obligations may be affected by economic developments in a specific industry, state, or region. Debt obligations may be placed on non-accrual status and related interest income may be reduced by ceasing current accruals and writing off interest receivables when the collection of all or a portion of interest has become doubtful. A debt obligation is removed from non-accrual status when the issuer resumes interest payments or when collectibility of interest is reasonably assured.
Expenses are recorded on the accrual basis. Most expenses of the Trust can be directly attributed to a specific series. Expenses which cannot be directly attributed are allocated among the Funds in the Trust based on relative net assets or other expense methodologies determined by the nature of the expense.
Distributions to shareholders are recorded on the ex-dividend date.
Repurchase agreements The Fund enters into repurchase agreements, secured by U.S. government or agency securities, which involve the purchase of securities from a counterparty with a simultaneous commitment to resell the securities at an agreed-upon date and price. It is the Fund’s policy that its custodian take possession of the underlying collateral securities, the fair value of which exceeds the principal amount of the repurchase transaction, including accrued interest, at all times. In the event of default by the counterparty, the Fund has the contractual right to liquidate the collateral securities and to apply the proceeds in satisfaction of the obligation.
Treasury Futures Contracts Futures contracts involve an obligation to purchase or sell (depending on whether the Fund has entered a long or short futures contract, respectively) an asset at a future date, at a price set at the time of the contract. Upon entering into a futures contract, the Fund is required to deposit an amount of cash or liquid assets (referred to as initial margin) in a segregated account with the clearing broker. Subsequent payments (referred to as variation margin) to and from the clearing broker are made on a daily basis based on changes in the market value of futures contracts. Futures are traded publicly and their market value changes daily. Changes in the market value of open futures contracts are recorded as unrealized appreciation or
depreciation in the Statement of Operations. Realized gains and losses on futures contracts are recorded in the Statement of Operations at the closing or expiration of futures contracts. Cash deposited with a broker as initial margin is recorded on the Statement of Assets and Liabilities. A receivable and/or payable to brokers for daily variation margin is also recorded on the Statement of Assets and Liabilities.
Investments in futures contracts may include certain risks, which may be different from, and potentially greater than, those of the underlying securities. To the extent the Fund uses Treasury futures, it is exposed to additional volatility and potential losses resulting from leverage.
The Fund has entered into short Treasury futures contracts to assist with the management of the portfolio’s interest rate exposure. During the six months ended June 30, 2014, these Treasury futures contracts had notional values ranging from less than 1% to 2% of net assets.
Indemnification Under the Trust’s organizational documents, its officers and trustees are indemnified against certain liabilities arising out of the performance of their duties to the Trust. In addition, in the normal course of business the Trust enters into contracts that provide general indemnities to other parties. The Trust’s maximum exposure under these arrangements is unknown as this would involve future claims that may be made against the Trust that have not yet occurred.
NOTE 2—VALUATION MEASUREMENTS
Various inputs are used in determining the value of the Fund’s investments. These inputs are summarized in the three broad levels listed below.
| § | | Level 1: Quoted prices in active markets for identical securities |
| § | | Level 2: Other significant observable inputs (including quoted prices for similar securities, market indices, interest rates, credit risk, etc.) |
| § | | Level 3: Significant unobservable inputs (including Fund management’s assumptions in determining the fair value of investments) |
The inputs or methodology used for valuing securities are not necessarily an indication of the risk associated with investing in those securities.
PAGE 15 § DODGE & COX BALANCED FUND
NOTES TO FINANCIAL STATEMENTS (unaudited)
The following is a summary of the inputs used to value the Fund’s holdings at June 30, 2014:
| | | | | | | | |
| Classification(a) | | LEVEL 1 (Quoted Prices) | | | LEVEL 2 (Other Significant Observable Inputs) | |
Securities | | | | | | | | |
Common Stock(b) | | $ | 10,121,409,784 | | | $ | — | |
Preferred Stocks | | | — | | | | 55,081,950 | |
Debt Securities | | | | | | | | |
U.S. Treasury | | | 518,469,850 | | | | — | |
Government-Related | | | — | | | | 387,900,409 | |
Mortgage-Related | | | — | | | | 1,612,187,809 | |
Asset-Backed | | | — | | | | 131,554,204 | |
Corporate | | | — | | | | 1,974,159,215 | |
Short-term Investments | | | | | | | | |
Money Market Fund | | | 30,309,089 | | | | — | |
Repurchase Agreement | | | — | | | | 320,591,108 | |
| | | | | | | | |
Total Securities | | $ | 10,670,188,723 | | | $ | 4,481,474,695 | |
| | | | | | | | |
| | |
Other Financial Instruments | | | | | | | | |
Treasury Futures Contracts | | $ | (1,019,579)(c) | | | $ | — | |
| | | | | | | | | |
| (a) | There were no transfers between Level 1 and Level 2 during the six months ended June 30, 2014. There were no Level 3 securities at June 30, 2014 and December 31, 2013, and there were no transfers to Level 3 during the period. |
| (b) | All common stocks held in the Fund are Level 1 securities. For a detailed break-out of common stocks by major industry classification, please refer to the Portfolio of Investments. |
| (c) | Represents net unrealized appreciation/depreciation. |
NOTE 3—RELATED PARTY TRANSACTIONS
Management fees Under a written agreement approved by a unanimous vote of the Board of Trustees, the Fund pays an annual management fee of 0.50% of the Fund’s average daily net assets to Dodge & Cox, investment manager of the Fund.
Fund officers and trustees All officers and two of the trustees of the Trust are officers or employees of Dodge & Cox. The Trust pays a fee only to those trustees who are not affiliated with Dodge & Cox.
NOTE 4—INCOME TAX INFORMATION AND DISTRIBUTIONS TO SHAREHOLDERS
A provision for federal income taxes is not required since the Fund intends to continue to qualify as a regulated investment company under Subchapter M of the Internal
Revenue Code and distribute all of its taxable income to shareholders. Distributions are determined in accordance with income tax regulations, and such amounts may differ from net investment income and realized gains for financial reporting purposes. Financial reporting records are adjusted for permanent book/tax differences at year end to reflect tax character.
Book/tax differences are primarily due to differing treatments of wash sales, net short-term realized gain (loss), and Treasury futures contracts. At June 30, 2014, the cost of investments for federal income tax purposes was $11,287,809,988.
Distributions during the periods noted below were characterized as follows for federal income tax purposes:
| | | | | | | | |
| | | Six Months Ended
June 30, 2014 | | | Year Ended
December 31, 2013 | |
Ordinary income | | | $174,243,719 | | | | $246,397,862 | |
| | | ($1.190 per share) | | | | ($1.650 per share) | |
| | |
Long-term capital gain | | | $73,757,923 | | | | $9,642,637 | |
| | | ($0.505 per share) | | | | ($0.066 per share) | |
At June 30, 2014, the tax basis components of distributable earnings were as follows:
| | | | |
Unrealized appreciation | | $ | 3,972,425,962 | |
Unrealized depreciation | | | (108,572,532 | ) |
| | | | |
Net unrealized appreciation | | | 3,863,853,430 | |
Undistributed ordinary income | | | 61,147,266 | |
Undistributed long-term capital gain | | | 128,578,756 | |
During 2013, the Fund utilized all of its capital loss carryforward, which amounted to $1,004,697,824.
Under the Regulated Investment Company Modernization Act of 2010, capital losses incurred by the Fund after January 1, 2011, are not subject to expiration. In addition, such losses must be utilized prior to the losses incurred in the years preceding enactment.
Fund management has reviewed the tax positions for open periods (three years and four years, respectively, from filing the Fund’s Federal and State tax returns) as applicable to the Fund, and has determined that no provision for income tax is required in the Fund’s financial statements.
DODGE & COX BALANCED FUND §PAGE 16
NOTES TO FINANCIAL STATEMENTS (unaudited)
NOTE 5—LOAN FACILITIES
Pursuant to an exemptive order issued by the Securities and Exchange Commission (SEC), the Fund may participate in an interfund lending facility (Facility). The Facility allows the Fund to borrow money from or loan money to the Funds. Loans under the Facility are made for temporary or emergency purposes, such as to fund shareholder redemption requests. Interest on borrowings is the average of the current repurchase agreement rate and the bank loan rate. There was no activity in the Facility during the period.
All Funds in the Trust participate in a $500 million committed credit facility (Line of Credit) with State Street Bank and Trust Company, to be utilized for temporary or emergency purposes to fund shareholder redemptions or for other short-term liquidity purposes. The maximum amount available to the Fund is $250 million. Each Fund pays an annual commitment fee on its pro-rata portion of the Line of Credit. The Fund’s commitment fee for the six months ended June 30, 2014, amounted to $20,330 and is reflected as a Miscellaneous Expense in the Statement of Operations. Interest on borrowings is charged at the prevailing rate. There were no borrowings on the Line of Credit during the period.
NOTE 6—PURCHASES AND SALES OF INVESTMENTS
For the six months ended June 30, 2014, purchases and sales of securities, other than short-term securities and U.S. government securities, aggregated $1,261,618,853 and $1,073,923,732, respectively. For the six months ended June 30, 2014, purchases and sales of U.S. government securities aggregated $876,725,491 and $670,882,378, respectively.
NOTE 7—SUBSEQUENT EVENTS
Fund management has determined that no material events or transactions occurred subsequent to June 30, 2014, and through the date of the Fund’s financial statements issuance, which require additional disclosure in the Fund’s financial statements.
PAGE 17 § DODGE & COX BALANCED FUND
FINANCIAL HIGHLIGHTS
| | | | | | | | | | | | | | | | | | | | | | | | |
SELECTED DATA AND RATIOS (for a share outstanding throughout each period) | | Six Months
Ended June 30, | | | Year Ended December 31, | |
| | | 2014(a) | | | 2013 | | | 2012 | | | 2011 | | | 2010 | | | 2009 | |
| | | | | | | | |
Net asset value, beginning of period | | | $98.30 | | | | $78.06 | | | | $67.45 | | | | $70.22 | | | | $64.03 | | | | $51.26 | |
Income from investment operations: | | | | | | | | | | | | | | | | | | | | | | | | |
Net investment income | | | 1.19 | | | | 1.66 | | | | 1.65 | | | | 1.62 | | | | 1.41 | | | | 1.46 | |
Net realized and unrealized gain (loss) | | | 4.91 | | | | 20.30 | | | | 10.62 | | | | (2.77 | ) | | | 6.30 | | | | 12.82 | |
| | | | | | | | |
Total from investment operations | | | 6.10 | | | | 21.96 | | | | 12.27 | | | | (1.15 | ) | | | 7.71 | | | | 14.28 | |
| | | | | | | | |
Distributions to shareholders from: | | | | | | | | | | | | | | | | | | | | | | | | |
Net investment income | | | (1.19 | ) | | | (1.65 | ) | | | (1.66 | ) | | | (1.62 | ) | | | (1.52 | ) | | | (1.51 | ) |
Net realized gain | | | (0.51 | ) | | | (0.07 | ) | | | — | | | | — | | | | — | | | | — | |
| | | | | | | | |
Total distributions | | | (1.70 | ) | | | (1.72 | ) | | | (1.66 | ) | | | (1.62 | ) | | | (1.52 | ) | | | (1.51 | ) |
| | | | | | | | |
Net asset value, end of period | | | $102.70 | | | | $98.30 | | | | $78.06 | | | | $67.45 | | | | $70.22 | | | | $64.03 | |
| | | | | | | | |
Total return | | | 6.25 | % | | | 28.37 | % | | | 18.32 | % | | | (1.66 | )% | | | 12.23 | % | | | 28.37 | % |
Ratios/supplemental data: | | | | | | | | | | | | | | | | | | | | | | | | |
Net assets, end of period (millions) | | | $15,161 | | | | $14,404 | | | | $12,217 | | | | $12,220 | | | | $14,849 | | | | $15,448 | |
Ratio of expenses to average net assets | | | 0.53 | %(b) | | | 0.53 | % | | | 0.53 | % | | | 0.53 | % | | | 0.53 | % | | | 0.53 | % |
Ratio of net investment income to average net assets | | | 2.40 | %(b) | | | 1.85 | % | | | 2.21 | % | | | 2.26 | % | | | 2.13 | % | | | 2.61 | % |
Portfolio turnover rate | | | 10 | % | | | 25 | % | | | 16 | % | | | 19 | % | | | 12 | % | | | 19 | % |
See accompanying Notes to Financial Statements
DODGE & COX BALANCED FUND §PAGE 18
SHAREHOLDER MEETING RESULTS (unaudited)
A special meeting of shareholders was held on April 23, 2014. At the meeting, proposals to elect Trustees to the Board of Trustees and to amend the Fund’s fundamental investment restrictions listed below were approved. The following is a report of the total votes cast by the Trust’s and the Fund’s shareholders.
| | | | | | | | | | | | | | |
| PROPOSAL | | | | AFFIRMATIVE | | | WITHHOLD | | | TOTAL | |
1 Elect Trustees to the Board of Trustees: | | | | | | | | | | | | | | |
| | | | |
| | Dana M. Emery | | | 2,724,363,325 | | | | 37,845,024 | | | | 2,762,208,349 | |
| | | | |
| | Charles F. Pohl | | | 2,724,265,808 | | | | 37,942,541 | | | | 2,762,208,349 | |
| | | | |
| | Thomas A. Larsen | | | 2,723,251,516 | | | | 38,956,833 | | | | 2,762,208,349 | |
| | | | |
| | Ann Mather | | | 2,696,172,728 | | | | 66,035,621 | | | | 2,762,208,349 | |
| | | | |
| | Robert B. Morris III | | | 2,722,376,906 | | | | 39,831,443 | | | | 2,762,208,349 | |
| | | | |
| | Gary Roughead | | | 2,721,551,032 | | | | 40,657,317 | | | | 2,762,208,349 | |
| | | | |
| | Mark E. Smith | | | 2,723,441,491 | | | | 38,766,858 | | | | 2,762,208,349 | |
| | | | |
| | John B. Taylor | | | 2,722,862,534 | | | | 39,345,815 | | | | 2,762,208,349 | |
| | | | | | | | | | | | | | | | | | | | |
| PROPOSAL | | AFFIRMATIVE | | | AGAINST | | | ABSTAIN | | | BROKER NON-VOTE | | | TOTAL | |
2 To remove the Fund’s fundamental investment restriction with respect to investing in any company for the purpose of exercising control or management. | | | 65,550,370 | | | | 5,603,056 | | | | 2,222,953 | | | | 11,510,902 | | | | 84,887,281 | |
| | | | | |
3 To remove the Fund’s fundamental investment restriction with respect to purchasing securities on margin and short selling. | | | 57,377,168 | | | | 11,884,740 | | | | 4,114,471 | | | | 11,510,902 | | | | 84,887,281 | |
| | | | | |
4 To remove the Fund’s fundamental investment restriction with respect to investments in securities that are illiquid and replace it with a uniform non-fundamental policy for all Funds. | | | 61,863,986 | | | | 9,264,739 | | | | 2,247,654 | | | | 11,510,902 | | | | 84,887,281 | |
| | | | | |
6 To amend the Fund’s fundamental investment restriction with respect to underwriting securities of other issuers. | | | 64,011,049 | | | | 7,052,425 | | | | 2,312,905 | | | | 11,510,902 | | | | 84,887,281 | |
PAGE 19 § DODGE & COX BALANCED FUND
FUND HOLDINGS
The Fund provides a complete list of its holdings four times each fiscal year, as of the end of each quarter. The Fund files the lists with the SEC on Form N-CSR (second and fourth quarters) and Form N-Q (first and third quarters). Shareholders may view the Fund’s Forms N-CSR and N-Q on the SEC’s website at www.sec.gov. Forms N-CSR and N-Q may also be reviewed and copied at the SEC’s Public Reference Room in Washington, DC. Information regarding the operations of the Public Reference Room may be obtained by calling 202-942-8090 (direct) or 800-732-0330 (general SEC number). A list of the Fund’s quarter-end holdings is also available at www.dodgeandcox.com on or about 15 days following each quarter end and remains available on the website until the list is updated in the subsequent quarter.
PROXY VOTING
For a free copy of the Fund’s proxy voting policies and procedures, please call 800-621-3979, visit the Fund’s website at www.dodgeandcox.com, or visit the SEC’s website at www.sec.gov. Information regarding how the Fund voted proxies relating to portfolio securities during the most recent 12-month period ending June 30 is also available at www.dodgeandcox.com or at www.sec.gov.
HOUSEHOLD MAILINGS
The Fund routinely mails shareholder reports and summary prospectuses to shareholders and, on occasion, proxy statements. In order to reduce the volume of mail, when possible, only one copy of these documents will be sent to shareholders who are part of the same family and share the same residential address.
If you have a direct account with the Funds and you do not want the mailing of shareholder reports and summary prospectuses combined with other members in your household, contact the Funds at 800-621-3979. Your request will be implemented within 30 days.
DODGE & COX BALANCED FUND §PAGE 20
THIS PAGE INTENTIONALLY LEFT BLANK
PAGE 21 § DODGE & COX BALANCED FUND
THIS PAGE INTENTIONALLY LEFT BLANK
DODGE & COX BALANCED FUND §PAGE 22
TRUSTEES AND EXECUTIVE OFFICERS
Charles F. Pohl, Chairman and Trustee
Chairman and Chief Investment Officer, Dodge & Cox
Dana M. Emery, President and Trustee
Chief Executive Officer, President, and Director of Fixed Income, Dodge & Cox
Thomas A. Larsen, Independent Trustee
Senior Counsel, Arnold & Porter LLP
Ann Mather, Independent Trustee
Former Executive Vice President, Chief Financial Officer, and Company Secretary of Pixar Studios
Robert B. Morris III, Independent Trustee
Former Partner and Managing Director of Global Research at Goldman Sachs & Co.
Gary Roughead, Independent Trustee
Annenberg Distinguished Visiting Fellow, Hoover Institution
Mark E. Smith, Independent Trustee
Former Executive Vice President, Managing Director-Fixed Income at Loomis Sayles & Company, L.P.
John B. Taylor, Independent Trustee
Professor of Economics, Stanford University; Senior Fellow, Hoover Institute and former Under Secretary for International Affairs, United States Treasury
John A. Gunn, Senior Vice President
Former Chairman and Chief Executive Officer, Dodge & Cox
Diana S. Strandberg, Senior Vice President
Senior Vice President and Director of International Equity, Dodge & Cox
David H. Longhurst, Treasurer
Vice President and Assistant Treasurer, Dodge & Cox
Thomas M. Mistele, Secretary
Chief Operating Officer, Secretary, and Senior Counsel, Dodge & Cox
Katherine M. Primas, Chief Compliance Officer
Chief Compliance Officer, Dodge & Cox
Additional information about the Trust’s Trustees and Officers is available in the Trust’s Statement of Additional Information (SAI). You can get a free copy of the SAI by visiting the Funds’ website at www.dodgeandcox.com or calling 800-621-3979.
PAGE 23 § DODGE & COX BALANCED FUND
| | | | |
| | | | |
www.dodgeandcox.com
For Fund literature, transactions, and account
information, please visit the Funds’ website.
or write or call:
DODGE & COX FUNDS
c/o Boston Financial Data Services
P.O. Box 8422
Boston, Massachusetts 02266-8422
(800) 621-3979
INVESTMENT MANAGER
Dodge & Cox
555 California Street, 40th Floor
San Francisco, California 94104
(415) 981-1710
This report is submitted for the general information of the shareholders of the Fund. The report is not authorized for distribution to prospective investors in the Fund unless it is accompanied by a current prospectus.
This report reflects our views, opinions, and portfolio holdings as of June 30, 2014, the end of the reporting period. Any such views are subject to change at any time based upon market or other conditions and Dodge & Cox disclaims any responsibility to update such views. These views may not be relied on as investment advice and, because investment decisions for a Dodge & Cox Fund are based on numerous factors, may not be relied on as an indication of trading intent on behalf of any Dodge & Cox Fund.
6/14 IF SAR Printed on recycled paper
Semi-Annual Report
June 30, 2014
Income Fund
ESTABLISHED 1989
TICKER: DODIX
TO OUR SHAREHOLDERS
The Dodge & Cox Income Fund had a total return of 4.6% for the six months ending June 30, 2014, compared to a return of 3.9% for the Barclays U.S. Aggregate Bond Index (Barclays U.S. Aggregate). On June 30, the Fund had net assets of $27.8 billion with a cash position of 3.2%.
MARKET COMMENTARY
The U.S. bond markets performed well in the first half of 2014. Narrowing yield premiums and low volatility supported strong performance for risk assets such as corporate bonds. Demand also rose for U.S. Treasuries, which as a sector returned 2.7%(a) in the first half, reflecting growing expectations that the Federal Reserve (Fed) will raise the Fed funds rate at a slower pace compared to previous tightening cycles, with a lower end target.
Following an unexpected 2.9% decline in first quarter GDP due largely to extreme winter weather, the U.S. economy improved in the second quarter. The improvement was led by robust labor market growth and an unemployment rate that declined to 6.1%, a nearly six-year low. Consensus GDP growth expectations are 3.4% for the second quarter. However, tepid wage growth and unimpressive consumption measures continued to concern policymakers, and housing market activity remained lower than expected at this point in the economic cycle. The Fed further reduced the pace of its monthly Treasury and mortgage-backed securities (MBS) purchases in the first half of the year; its unprecedented quantitative easing program is set to end by the fourth quarter of 2014, though the Fed funds rate is expected to remain near zero until at least early 2015. Inflation indicators have risen in recent months but remain in line with the Fed’s current targets.
Investment-grade corporate bonds returned 5.7%, outperforming comparable-duration(b) Treasuries by 1.5 percentage points. Mergers and acquisitions and other strategic activities have increased year to date, which has led to slightly higher leverage among U.S. industrial companies, but corporate profitability remained high with healthy balance sheets among investment-grade issuers. Agency-guaranteed(c) MBS returned 4.0%, outperforming
comparable-duration Treasuries by 0.7 percentage points. Prepayment speeds were largely in line with expectations and relatively muted among higher coupon MBS, reflecting continued HARP(d) burnout.
INVESTMENT STRATEGY
The Fund’s broad investment themes have been stable: we maintain an overweight to credit instruments, an emphasis on premium-coupon Agency MBS with relatively stable cashflow characteristics, and portfolio duration that is lower and a nominal yield that is higher than the Barclays U.S. Aggregate. At the same time, we made a number of important tactical adjustments in the first half of 2014 as valuations shifted.
Duration Positioning: Leaning Shorter
We have positioned the Fund with a shorter duration than the Barclays U.S. Aggregate, seeking to mitigate the negative price effect associated with rising rates. The magnitude of the Fund’s relative duration positioning changes over time based on our analysis of real (after-inflation) return potential, the shape of the yield curve, relative valuations between sectors, inflation expectations, and broader economic conditions, among other factors. For example, last summer we lengthened the Fund’s duration from roughly 75% to 80% of the Barclays U.S. Aggregate’s duration, as yields rose substantially (to a level above current inflation for the first time in two years) and we found individual opportunities to add yield, which came with added duration.
In the somewhat confounding environment of the first half of 2014—with a brightening macroeconomic outlook coinciding with rates declining to one-year lows—we reversed the duration extension of mid-2013. In our view, the current level of interest rates does not fully incorporate the more positive underlying fundamentals of the U.S. economy or the possibility that Fed policy could deviate from the glacial pace of tightening currently reflected in market expectations. We believe the labor market recovery, the shift away from consumer deleveraging, the shrinking effect of fiscal restraint on the economy, and growing optimism among the corporate and retail sectors bodes well for the future pace of economic
PAGE 1 § DODGE & COX INCOME FUND
growth. Given this backdrop, as well as rising inflation, we believe that interest rates are likely to rise over the next several years.
Credit Sector: Lower Weightings in the Wake of Higher Valuations
The corporate sector performed well in the first half of 2014, the result of robust corporate earnings, strong balance sheets, and continued improvement in the asset quality and capitalization of institutions in the financial sector. Credit spreads have declined to pre-crisis levels, although we believe valuations are both reasonable given strong underlying fundamentals and superior to lower-yielding alternatives. At the same time, we do not expect oversized excess returns from this sector. Leverage and shareholder rewards are increasing in the corporate sector, raising the prospect of adverse credit events for bondholders. During times such as these—with low volatility, narrowing yield premiums, and rising likelihood of adverse credit events—we seek to reduce downside risk in the Fund’s credit holdings while capturing incremental yield.
In the current environment, we have been reducing the corporate sector weighting on a bottom-up basis and shifting the composition of holdings. For example, we have reduced the Financial sub-sector weighting by nearly six percentage points over the past nine months, owing to richer valuations that more fully reflect the strong recovery in issuer and sector fundamentals. We have also made changes within the Industrials sub-sector. Given recent changes in the markets (notably, high equity valuations, low rates, declining spreads, and a growing receptiveness to lower credit quality securities), management teams are able to incur higher amounts of leverage at a low cost. This is a source of downside risk for holders of investment-grade corporate bonds. We recently completed a comprehensive review of Fund holdings to assess which companies are likely to alter their capital structure in a manner adverse to current bondholders; we made several marginal trims based on this analysis.
Notwithstanding the overall reduction to the Fund’s corporate bond weighting, we added several new positions. For example, the Fund has been increasing its weighting in non-U.S. issuers for some time, from 3% in late 2009 to 12% at June 30. This trend has been driven by attractive valuations compared to U.S. alternatives, as
well as a higher amount of investable product as non-U.S. companies have increasingly issued bonds in U.S. dollars. Below we highlight two recent purchases: Petroleos Mexicanos (Pemex) and Rio Oil Finance Trust (Rio Oil).(e)
Pemex
We initiated a 0.5% position in Pemex 30-year bonds in the first half of 2014. Pemex is the national oil company of Mexico and is 100% owned by the Mexican government, though their debt securities offer higher yield premiums than Mexican sovereign bonds. The company plays a critical role in Mexican government finances; taxes paid by Pemex account for approximately 30% of all government revenues. With a solid sovereign backdrop, a strong asset base, and looming energy reform that should help Pemex generate higher net income through a reduction of royalty and tax payments, we think the credit prospects for Pemex are good.
Rio Oil
Another recent oil-related position in the Fund is Rio Oil. The State of Rio de Janeiro came to market in June with a structured note backed by oil and gas royalties, most of which are payable by Petrobras, the Brazilian-owned oil company. The transaction came at an attractive incremental yield (over 400bps(f)), substantially more attractive than comparable-duration Petrobras bonds, which the Fund also holds. Although the BBB/BBB- rating was limited by the unsecured ratings of Brazil and Petrobras, we believe these obligations may be a superior credit risk compared to the Fund’s existing Petrobras holdings due to the senior nature of the Petrobras royalty obligation. Our due diligence included a review of the legal structure of the transaction and the robustness of the debt service coverage metrics under various adverse scenarios.
Elsewhere within the Fund’s credit portfolio, we recently reduced a number of taxable municipal issuers following strong performance. Municipal valuations increasingly reflect meaningful improvements to issuer fundamentals. The Fund’s taxable municipal holdings are predominantly longer-duration securities, thus these trims also helped reduce portfolio duration. While a smaller part of the Fund now, we view the risk/reward trade-off as attractive, with diversification benefits and additional downside protection relative to corporate alternatives.
DODGE & COX INCOME FUND §PAGE 2
Agency MBS: Incremental Shifts, but Opportunities Remain
We made small adjustments to the Fund’s Agency MBS holdings, shifting target weightings within the sector in response to relative valuation changes. Continued purchases of MBS by the Fed, low interest rate volatility, low primary issuance, and reasonable prepayment levels supported strong performance from the MBS sector. In light of these fuller valuations, we made two changes to the MBS portfolio: 1) reduced the overall weighting by two percentage points, to 34%; and 2) shifted the mix slightly, reducing 30-year premium MBS and increasing hybrid ARMs based on relative valuations. We continue to view the Fund’s MBS as offering attractive total return potential relative to comparable-duration alternatives. They also provide an important source of income and liquidity.
Compositionally the Fund’s MBS differ from those in the Barclays U.S. Aggregate. A prolonged period of low mortgage rates has recast the broad MBS universe into one heavily weighted to low coupons (which have greater interest rate sensitivity) and 30-year maturities (compared to MBS with shorter loan terms). In contrast, we utilize our bottom-up research to identify securities that exhibit relative cashflow stability as well as attractive total return prospects through a combination of loan type, loan term, seasoning, and other factors. We invest the Fund in 30-year conventional MBS but also are attracted to 15-year MBS, Hybrid ARMS, and stable CMO structures, among others. The result of our research efforts is a Fund MBS portfolio with a relatively short average duration (about 2.4 years), less than half of the duration of the MBS portion of the Barclays U.S. Aggregate (at 5.1 years). We believe that the Fund’s MBS are more attractive than comparable-duration Treasuries under a range of interest rate scenarios and market environments.
IN CLOSING
While we are optimistic about the Fund’s long-term return prospects, near-term returns could be negatively impacted by low starting yields. We continue to be vigilant about shedding risk where the yield compensation is inadequate in our view, while at the same time seeking to identify new opportunities with attractive long-term return potential.
Thank you for your continued confidence in our firm. As always, we welcome your comments and questions.
For the Board of Trustees,
| | |
| |
|
Charles F. Pohl, Chairman | | Dana M. Emery, President |
July 29, 2014
| (a) | Sector returns as calculated and reported by Barclays. |
| (b) | Duration is a measure of a bond’s (or a bond portfolio’s) price sensitivity to changes in interest rates. |
| (c) | The U.S. Government does not guarantee the Fund’s shares, yield, or net asset value. The agency guarantee (by, for example, Ginnie Mae, Fannie Mae, or Freddie Mac) does not eliminate market risk. |
| (d) | HARP = Home Affordable Refinance Program. |
| (e) | The use of specific examples does not imply that they are more attractive investments than the Fund’s other holdings. |
| (f) | bps=basis point. One basis point is equal to 1/100th of 1%. |
PAGE 3 § DODGE & COX INCOME FUND
YEAR-TO-DATE PERFORMANCE REVIEW
The Fund outperformed the Barclays U.S. Aggregate by 0.6 percentage points year to date.
Key Contributors To Relative Results
| | § | | Security selection was positive, particularly among the Fund’s non-U.S. domiciled and/or lower-rated holdings. Strong performers included Enel, Kingdom of Spain, Macy’s, Pemex, Petrobras, Telecom Italia, and Time Warner Cable. | |
| | § | | The Fund’s overweight to corporate bonds (47% versus 22% for the Barclays U.S. Aggregate*) added to relative returns given the sector’s strong performance. | |
| | § | | The Fund’s taxable municipal holdings (6% versus 1% for the Barclays U.S. Aggregate) performed well, benefiting returns. | |
| | § | | The Fund’s nominal yield advantage benefited returns. | |
Key Detractors From Relative Results
| | § | | The Fund’s defensive duration positioning (approximately 80% of the Barclays U.S. Aggregate’s duration) hampered relative returns as interest rates declined. | |
| | § | | The Fund’s overweight to Financial Institutions (17% versus 7% for the Barclays U.S. Aggregate) detracted slightly from relative returns given the relative underperformance of this sub-sector. | |
| | § | | The Fund’s Agency MBS holdings (36% versus 30% for the Barclays U.S. Aggregate) lagged longer-duration alternatives such as the MBS in the Barclays U.S. Aggregate due to compositional differences, although they outperformed similar short-duration Treasuries. | |
| | * | | Unless otherwise noted, figures cited in this section denote Fund positioning at the beginning of the period. | |
KEY CHARACTERISTICS OF DODGE & COX
Independent Organization
Dodge & Cox is one of the largest privately owned investment managers in the world. We remain committed to independence, with a goal of providing the highest quality investment management service to our existing clients.
Over 80 Years of Investment Experience
Dodge & Cox was founded in 1930. We have a stable and well-qualified team of investment professionals, most of whom have spent their entire careers at Dodge & Cox.
Experienced Investment Team
The Fixed Income Investment Policy Committee, which is the decision-making body for the Income Fund, is a nine-member committee with an average tenure at Dodge & Cox of 18 years.
One Business with a Single Research Office
Dodge & Cox manages equity (domestic, international, and global), fixed income (domestic and global), and balanced investments, operating from one office in San Francisco.
Consistent Investment Approach
Our team decision-making process involves thorough, bottom-up fundamental analysis of each investment.
Long-Term Focus and Low Expenses
We invest with a three- to five-year investment horizon, which has historically resulted in low turnover relative to our peers. We manage Funds that maintain low expense ratios.
Risks: The Fund invests in debt securities whose yields and market values fluctuate, so that an investment may be worth more or less than its original cost. Debt securities are subject to interest rate risk, credit risk, and prepayment risk, all of which could have adverse effects on the value of the Fund. A low interest rate environment creates an elevated risk of future negative returns. Financial intermediaries may restrict their market making activities for certain debt securities, which may reduce the liquidity and increase the volatility of such securities. Please read the prospectus and summary prospectus for specific details regarding the Fund’s risk profile.
DODGE & COX INCOME FUND §PAGE 4
GROWTH OF $10,000 OVER 10 YEARS
FOR AN INVESTMENT MADE ON JUNE 30, 2004
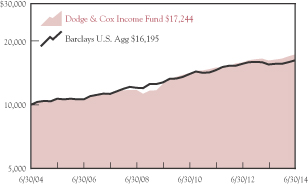
AVERAGE ANNUAL TOTAL RETURN
FOR PERIODS ENDED JUNE 30, 2014
| | | | | | | | | | | | | | | | |
| | | 1 Year | | | 5 Years | | | 10 Years | | | 20 Years | |
| | | | | | | | | | | | | | | | |
Dodge & Cox Income Fund | | | 6.62 | % | | | 6.55 | % | | | 5.60 | % | | | 6.70 | % |
Barclays U.S. Aggregate Bond Index (Barclays U.S. Agg) | | | 4.38 | | | | 4.87 | | | | 4.94 | | | | 6.16 | |
Returns represent past performance and do not guarantee future results. Investment return and share price will fluctuate with market conditions, and investors may have a gain or loss when shares are sold. Fund performance changes over time and currently may be significantly lower than stated. Performance is updated and published monthly. Visit the Fund’s website at www.dodgeandcox.com or call 800-621-3979 for current performance figures.
The Fund’s total returns include the reinvestment of dividend and capital gain distributions, but have not been adjusted for any income taxes payable by shareholders on these distributions or on Fund share redemptions. Index returns include interest income but, unlike Fund returns, do not reflect fees or expenses. The Barclays U.S. Aggregate Bond Index (Barclays U.S. Agg) is a widely recognized, unmanaged index of U.S. dollar-denominated, investment-grade, taxable debt securities.
Barclays® is a trademark of Barclays Bank PLC.
FUND EXPENSE EXAMPLE
As a Fund shareholder, you incur ongoing Fund costs, including management fees and other Fund expenses. All mutual funds have ongoing costs, sometimes referred to as operating expenses. The following example shows ongoing costs of investing in the Fund and can help you understand these costs and compare them with those of other mutual funds. The example assumes a $1,000 investment held for the six months indicated.
ACTUAL EXPENSES
The first line of the table below provides information about actual account values and expenses based on the Fund’s actual returns. You may use the information in this line, together with your account balance, to estimate the expenses that you paid over the period. Simply divide your account value by $1,000 (for example, an $8,600 account value divided by $1,000 = 8.6), then multiply the result by the number in the first line under the heading “Expenses Paid During Period” to estimate the expenses you paid on your account during this period.
HYPOTHETICAL EXAMPLE FOR COMPARISON WITH OTHER MUTUAL FUNDS
Information on the second line of the table can help you compare ongoing costs of investing in the Fund with those of other mutual funds. This information may not be used to estimate the actual ending account balance or expenses you paid during the period. The hypothetical “Ending Account Value” is based on the actual expense ratio of the Fund and an assumed 5% annual rate of return before expenses (not the Fund’s actual return). The amount under the heading “Expense Paid During the Period” shows the hypothetical expenses your account would have incurred under this scenario. You can compare this figure with the 5% hypothetical examples that appear in shareholder reports of other mutual funds.
| | | | | | | | | | | | |
Six Months Ended June 30, 2014 | | Beginning Account Value
1/1/2014 | | | Ending Account Value
6/30/2014 | | | Expenses Paid
During Period* | |
Based on Actual Fund Return | | $ | 1,000.00 | | | $ | 1,045.60 | | | $ | 2.26 | |
Based on Hypothetical 5% Yearly Return | | | 1,000.00 | | | | 1,022.58 | | | | 2.24 | |
| * | | Expenses are equal to the Fund’s annualized expense ratio of 0.45%, multiplied by the average account value over the period, multiplied by 181/365 (to reflect the one-half year period). |
The expenses shown in the table highlight ongoing costs only and do not reflect any transactional fees or account maintenance fees. Though other mutual funds may charge such fees, please note that the Fund does not charge transaction fees (e.g., redemption fees, sales loads) or universal account maintenance fees (e.g., small account fees).
PAGE 5 § DODGE & COX INCOME FUND
| | | | |
| FUND INFORMATION | | | June 30, 2014 | |
| | | | |
GENERAL INFORMATION | | | |
Net Asset Value Per Share | | | $13.89 | |
Total Net Assets (billions) | | | $27.8 | |
30-Day SEC Yield(a) | | | 2.46% | |
2013 Expense Ratio (per 5/1/14 Prospectus) | | | 0.43% | |
Expense Ratio (1/1/14 to 6/30/14, annualized) | | | 0.45% | |
Portfolio Turnover Rate
(1/1/14 to 6/30/14, unannualized) | | | 14% | |
Fund Inception | | | 1989 | |
No sales charges or distribution fees | | | | |
Investment Manager: Dodge & Cox, San Francisco. Managed by the Fixed Income Investment Policy Committee, whose nine members’ average tenure at Dodge & Cox is 18 years.
| | | | | | | | |
| PORTFOLIO CHARACTERISTICS | | Fund | | | Barclays
U.S. Agg | |
Number of Debt Securities | | | 797 | | | | 8,818 | |
Effective Duration (years) | | | 4.2 | | | | 5.6 | |
| | | | |
| FIVE LARGEST CORPORATE ISSUERS(c) | | Fund | |
Verizon Communications, Inc. | | | 1.9 | % |
Bank of America Corp. | | | 1.9 | |
Cox Enterprises, Inc. | | | 1.7 | |
Macys, Inc. | | | 1.6 | |
Time Warner, Inc. | | | 1.6 | |
| | | | | | | | |
| CREDIT QUALITY(d) | | Fund | | | Barclays
U.S. Agg | |
U.S. Treasury/Agency/GSE(b) | | | 46.1 | % | | | 67.8 | % |
Aaa | | | 1.7 | | | | 4.7 | |
Aa | | | 1.7 | | | | 3.9 | |
A | | | 10.8 | | | | 11.5 | |
Baa | | | 26.2 | | | | 12.1 | |
Ba | | | 7.9 | | | | 0.0 | |
B | | | 2.4 | | | | 0.0 | |
Caa | | | 0.0 | (f) | | | 0.0 | |
Cash Equivalents | | | 3.2 | | | | 0.0 | |
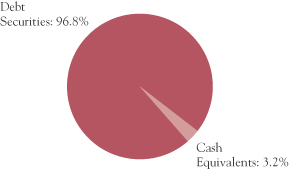
| | | | | | | | |
| SECTOR DIVERSIFICATION | | Fund | | | Barclays
U.S. Agg | |
U.S. Treasury(b) | | | 11.3 | % | | | 35.3 | % |
Government-Related | | | 8.7 | | | | 9.9 | |
Mortgage-Related | | | 34.2 | | | | 28.9 | |
Corporate | | | 39.9 | | | | 23.3 | |
Asset-Backed/Commercial Mortgage-Backed(e) | | | 2.7 | | | | 2.6 | |
Cash Equivalents | | | 3.2 | | | | 0.0 | |
| | | | | | | | |
MATURITY
DIVERSIFICATION(b) | | Fund | | | Barclays
U.S. Agg | |
0-1 Years to Maturity | | | 5.8 | % | | | 0.0 | % |
1-5 | | | 50.7 | | | | 45.5 | |
5-10 | | | 27.2 | | | | 41.4 | |
10-15 | | | 1.3 | | | | 1.4 | |
15-20 | | | 4.4 | | | | 1.7 | |
20-25 | | | 7.4 | | | | 3.0 | |
25 and Over | | | 3.2 | | | | 7.0 | |
| (a) | SEC Yield is an annualization of the Fund’s total net investment income per share for the 30-day period ended on the last day of the month. |
| (b) | Data as presented excludes the effect of the Fund’s position in Treasury futures contracts. |
| (c) | The Fund’s portfolio holdings are subject to change without notice. The mention of specific securities is not a recommendation to buy, sell, or hold any particular security and is not indicative of Dodge & Cox’s current or future trading activity. |
| (d) | The credit quality distributions shown for the Fund and the Index are based on the middle of Moody’s, S&P’s, and Fitch ratings, which is the methodology used by Barclays in constructing its indices. If a security is rated by only two agencies, the lower of the two ratings is used. Please note the Fund applies the highest of Moody’s, S&P’s, and Fitch ratings to determine compliance with the quality requirements stated in its prospectus. On that basis, the Fund held 6.3% in securities rated below investment grade. The credit quality of the investments in the portfolio does not apply to the stability or safety of the Fund or its shares. |
| (e) | Commercial mortgage-backed securities are a component of the Barclays U.S. Aggregate but are not currently held by the Fund. |
DODGE & COX INCOME FUND §PAGE 6
| | | | |
| PORTFOLIO OF INVESTMENTS (unaudited) | | | June 30, 2014 | |
| | | | | | | | |
| DEBT SECURITIES: 96.8% | |
| | |
| | | PAR VALUE | | | VALUE | |
| U.S. TREASURY: 11.3% | |
U.S. Treasury Note | | | | | | | | |
0.125%, 7/31/14 | | $ | 246,600,000 | | | $ | 246,600,000 | |
0.25%, 10/31/14 | | | 200,000,000 | | | | 200,125,000 | |
0.25%, 1/15/15 | | | 150,150,000 | | | | 150,290,841 | |
0.25%, 11/30/15 | | | 150,000,000 | | | | 150,064,500 | |
1.50%, 7/31/16 | | | 350,000,000 | | | | 357,246,050 | |
0.625%, 2/15/17 | | | 450,000,000 | | | | 448,875,000 | |
0.75%, 3/15/17 | | | 350,000,000 | | | | 349,945,400 | |
0.875%, 5/15/17 | | | 250,000,000 | | | | 250,312,500 | |
1.50%, 8/31/18 | | | 500,000,000 | | | | 502,539,000 | |
1.50%, 2/28/19 | | | 496,995,000 | | | | 496,063,134 | |
| | | | | | | | |
| | | | 3,152,061,425 | |
| GOVERNMENT-RELATED: 8.7% | |
FEDERAL AGENCY: 0.6% | |
Arkansas Dev. Finance Authority
9.75%, 11/15/14 | | | 2,766 | | | | 2,815 | |
Small Business Admin. — 504 Program | | | | | | | | |
Series 1994-20G 1, 8.00%, 7/1/14 | | | 28,350 | | | | 28,357 | |
Series 1994-20H 1, 7.95%, 8/1/14 | | | 15,655 | | | | 15,756 | |
Series 1994-20I 1, 7.85%, 9/1/14 | | | 10,253 | | | | 10,377 | |
Series 1994-20K 1, 8.65%, 11/1/14 | | | 13,129 | | | | 13,445 | |
Series 1994-20L 1, 8.40%, 12/1/14 | | | 11,762 | | | | 12,086 | |
Series 1995-20A 1, 8.50%, 1/1/15 | | | 14,125 | | | | 14,368 | |
Series 1995-20C 1, 8.10%, 3/1/15 | | | 24,524 | | | | 25,094 | |
Series 1997-20E 1, 7.30%, 5/1/17 | | | 93,078 | | | | 97,870 | |
Series 1997-20H 1, 6.80%, 8/1/17 | | | 17,753 | | | | 18,588 | |
Series 1997-20J 1, 6.55%, 10/1/17 | | | 247,535 | | | | 262,346 | |
Series 1997-20L 1, 6.55%, 12/1/17 | | | 10,024 | | | | 10,537 | |
Series 1998-20B 1, 6.15%, 2/1/18 | | | 31,811 | | | | 33,360 | |
Series 1998-20C 1, 6.35%, 3/1/18 | | | 883,305 | | | | 929,285 | |
Series 1998-20H 1, 6.15%, 8/1/18 | | | 418,463 | | | | 440,691 | |
Series 1998-20L 1, 5.80%, 12/1/18 | | | 236,075 | | | | 250,299 | |
Series 1999-20C 1, 6.30%, 3/1/19 | | | 234,241 | | | | 251,049 | |
Series 1999-20E 1, 6.30%, 5/1/19 | | | 6,591 | | | | 7,127 | |
Series 1999-20G 1, 7.00%, 7/1/19 | | | 412,415 | | | | 445,755 | |
Series 1999-20I 1, 7.30%, 9/1/19 | | | 181,977 | | | | 197,910 | |
Series 2000-20C 1, 7.625%, 3/1/20 | | | 14,245 | | | | 15,558 | |
Series 2000-20G 1, 7.39%, 7/1/20 | | | 9,368 | | | | 10,234 | |
Series 2001-20G 1, 6.625%, 7/1/21 | | | 1,977,718 | | | | 2,163,605 | |
Series 2001-20L 1, 5.78%, 12/1/21 | | | 5,280,661 | | | | 5,746,174 | |
Series 2002-20A 1, 6.14%, 1/1/22 | | | 35,138 | | | | 38,154 | |
Series 2002-20L 1, 5.10%, 12/1/22 | | | 1,438,627 | | | | 1,561,649 | |
Series 2003-20G 1, 4.35%, 7/1/23 | | | 93,792 | | | | 99,296 | |
Series 2004-20L 1, 4.87%, 12/1/24 | | | 2,386,577 | | | | 2,560,819 | |
Series 2005-20B 1, 4.625%, 2/1/25 | | | 3,773,206 | | | | 4,011,245 | |
Series 2005-20D 1, 5.11%, 4/1/25 | | | 172,478 | | | | 186,624 | |
Series 2005-20E 1, 4.84%, 5/1/25 | | | 6,192,718 | | | | 6,670,657 | |
Series 2005-20G 1, 4.75%, 7/1/25 | | | 6,346,829 | | | | 6,777,989 | |
Series 2005-20H 1, 5.11%, 8/1/25 | | | 86,405 | | | | 93,612 | |
Series 2005-20I 1, 4.76%, 9/1/25 | | | 7,520,715 | | | | 8,033,101 | |
| | | | | | | | |
| | |
| | | PAR VALUE | | | VALUE | |
Series 2006-20A 1, 5.21%, 1/1/26 | | $ | 7,746,673 | | | $ | 8,377,280 | |
Series 2006-20B 1, 5.35%, 2/1/26 | | | 2,360,331 | | | | 2,555,126 | |
Series 2006-20C 1, 5.57%, 3/1/26 | | | 10,560,929 | | | | 11,589,010 | |
Series 2006-20G 1, 6.07%, 7/1/26 | | | 20,422,934 | | | | 22,904,674 | |
Series 2006-20H 1, 5.70%, 8/1/26 | | | 163,225 | | | | 181,381 | |
Series 2006-20I 1, 5.54%, 9/1/26 | | | 352,098 | | | | 386,255 | |
Series 2006-20J 1, 5.37%, 10/1/26 | | | 6,476,404 | | | | 7,034,432 | |
Series 2006-20L 1, 5.12%, 12/1/26 | | | 5,057,620 | | | | 5,522,744 | |
Series 2007-20A 1, 5.32%, 1/1/27 | | | 11,816,209 | | | | 12,947,440 | |
Series 2007-20C 1, 5.23%, 3/1/27 | | | 17,791,584 | | | | 19,377,809 | |
Series 2007-20D 1, 5.32%, 4/1/27 | | | 18,343,441 | | | | 20,209,323 | |
Series 2007-20G 1, 5.82%, 7/1/27 | | | 12,116,749 | | | | 13,604,533 | |
| | | | | | | | |
| | | | | | | 165,725,839 | |
FOREIGN AGENCY: 2.6% | |
Export-Import Bank of Korea(c) (South Korea)
4.00%, 1/11/17 | | | 146,385,000 | | | | 156,227,781 | |
Petroleo Brasileiro SA(c) (Brazil) | | | | | | | | |
5.75%, 1/20/20 | | | 43,955,000 | | | | 46,979,104 | |
5.375%, 1/27/21 | | | 266,770,000 | | | | 278,035,697 | |
4.375%, 5/20/23 | | | 58,625,000 | | | | 56,493,981 | |
6.25%, 3/17/24 | | | 43,530,000 | | | | 46,333,332 | |
Petroleos Mexicanos(c) (Mexico) | | | | | | | | |
6.625%, 6/15/35 | | | 51,200,000 | | | | 60,288,000 | |
6.375%, 1/23/45(b) | | | 65,900,000 | | | | 76,526,375 | |
| | | | | | | | |
| | | | | | | 720,884,270 | |
LOCAL AUTHORITY: 5.0% | |
L.A. Unified School District GO
6.758%, 7/1/34 | | | 107,390,000 | | | | 143,831,723 | |
New Jersey Turnpike Authority RB | | | | | | | | |
7.414%, 1/1/40 | | | 31,485,000 | | | | 45,396,647 | |
7.102%, 1/1/41 | | | 98,983,000 | | | | 138,656,376 | |
New Valley Generation
4.929%, 1/15/21 | | | 383,260 | | | | 431,287 | |
State of California GO | | | | | | | | |
7.50%, 4/1/34 | | | 118,550,000 | | | | 168,755,925 | |
7.55%, 4/1/39 | | | 180,880,000 | | | | 271,920,522 | |
7.30%, 10/1/39 | | | 37,280,000 | | | | 53,052,050 | |
7.625%, 3/1/40 | | | 60,420,000 | | | | 89,134,001 | |
7.60%, 11/1/40 | | | 21,515,000 | | | | 32,528,313 | |
State of Illinois GO | | | | | | | | |
4.961%, 3/1/16 | | | 54,290,000 | | | | 57,749,902 | |
5.365%, 3/1/17 | | | 186,245,000 | | | | 203,824,665 | |
5.665%, 3/1/18 | | | 165,670,000 | | | | 184,945,704 | |
| | | | | | | | |
| | | | | | | 1,390,227,115 | |
SOVEREIGN: 0.5% | |
Spain Government International(c) (Spain)
4.00%, 3/6/18(b) | | | 141,165,000 | | | | 150,854,566 | |
| | | | | | | | |
| | | | 2,427,691,790 | |
| | |
| PAGE 7 § DODGE & COX INCOME FUND | | See accompanying Notes to Financial Statements |
| | | | |
| PORTFOLIO OF INVESTMENTS (unaudited) | | | June 30, 2014 | |
| | | | | | | | |
| DEBT SECURITIES (continued) | |
| | |
| | | PAR VALUE | | | VALUE | |
| MORTGAGE-RELATED: 34.2% | |
FEDERAL AGENCY CMO & REMIC: 7.2% | |
Dept. of Veterans Affairs | | | | | | | | |
Series 1995-2D 4A, 9.293%, 5/15/25 | | $ | 172,582 | | | $ | 210,147 | |
Series 1997-2 Z, 7.50%, 6/15/27 | | | 12,469,745 | | | | 14,275,876 | |
Series 1998-2 2A, 8.744%, 8/15/27 | | | 46,045 | | | | 55,038 | |
Series 1998-1 1A, 8.228%, 3/15/28 | | | 320,919 | | | | 364,960 | |
Fannie Mae | | | | | | | | |
Trust 1998-58 PX, 6.50%, 9/25/28 | | | 584,102 | | | | 655,414 | |
Trust 1998-58 PC, 6.50%, 10/25/28 | | | 3,160,134 | | | | 3,547,311 | |
Trust 2001-T5 A2, 6.99%, 2/19/30 | | | 62,854 | | | | 71,560 | |
Trust 2001-T5 A3, 7.50%, 6/19/30 | | | 298,411 | | | | 350,915 | |
Trust 2001-69 PQ, 6.00%, 12/25/31 | | | 3,712,292 | | | | 4,121,613 | |
Trust 2002-33 A1, 7.00%, 6/25/32 | | | 2,943,799 | | | | 3,377,173 | |
Trust 2002-69 Z, 5.50%, 10/25/32 | | | 547,931 | | | | 595,942 | |
Trust 2008-24 GD, 6.50%, 3/25/37 | | | 4,139,837 | | | | 4,600,647 | |
Trust 2009-30 AG, 6.50%, 5/25/39 | | | 21,500,970 | | | | 23,398,151 | |
Trust 2009-53 QM, 5.50%, 5/25/39 | | | 5,712,353 | | | | 6,173,739 | |
Trust 2009-40 TB, 6.00%, 6/25/39 | | | 10,904,122 | | | | 11,979,628 | |
Trust 2001-T3 A1, 7.50%, 11/25/40 | | | 158,957 | | | | 185,977 | |
Trust 2010-123 WT, 7.00%, 11/25/40 | | | 76,803,617 | | | | 87,300,674 | |
Trust 2001-T7 A1, 7.50%, 2/25/41 | | | 108,032 | | | | 124,665 | |
Trust 2001-T4 A1, 7.50%, 7/25/41 | | | 2,834,723 | | | | 3,384,225 | |
Trust 2011-58 AT, 4.00%, 7/25/41 | | | 17,327,047 | | | | 18,169,990 | |
Trust 2001-T10 A1, 7.00%, 12/25/41 | | | 3,200,000 | | | | 3,722,166 | |
Trust 2013-106 MA, 4.00%, 2/25/42 | | | 33,022,480 | | | | 34,883,990 | |
Trust 2002-T12 A3, 7.50%, 5/25/42 | | | 61,067 | | | | 71,664 | |
Trust 2002-90 A1, 6.50%, 6/25/42 | | | 6,419,189 | | | | 7,380,219 | |
Trust 2002-W6 2A1, 6.474%, 6/25/42 | | | 3,892,354 | | | | 4,460,922 | |
Trust 2002-W8 A2, 7.00%, 6/25/42 | | | 2,084,252 | | | | 2,416,384 | |
Trust 2002-T16 A3, 7.50%, 7/25/42 | | | 4,718,936 | | | | 5,384,452 | |
Trust 2003-W2 1A2, 7.00%, 7/25/42 | | | 10,233,136 | | | | 11,890,464 | |
Trust 2003-W4 3A, 6.595%, 10/25/42 | | | 3,549,928 | | | | 4,039,257 | |
Trust 2012-121 NB, 7.00%, 11/25/42 | | | 2,421,449 | | | | 2,695,617 | |
Trust 2003-7 A1, 6.50%, 12/25/42 | | | 5,244,791 | | | | 6,032,706 | |
Trust 2003-W1 2A, 6.633%, 12/25/42 | | | 3,781,950 | | | | 4,444,533 | |
Trust 2012-133 HF, 0.502%, 12/25/42 | | | 60,742,259 | | | | 59,964,819 | |
Trust 2012-133 JF, 0.502%, 12/25/42 | | | 21,049,769 | | | | 20,939,784 | |
Trust 2012-134 FD, 0.502%, 12/25/42 | | | 1,631,838 | | | | 1,622,396 | |
Trust 2012-134 FT, 0.502%, 12/25/42 | | | 85,764,090 | | | | 85,325,835 | |
Trust 2012-148 LF, 0.452%, 1/25/43 | | | 71,596,244 | | | | 70,434,524 | |
Trust 2013-6 FL, 0.552%, 2/25/43 | | | 192,831,186 | | | | 193,140,295 | |
Trust 2013-15 FA, 0.502%, 3/25/43 | | | 2,263,539 | | | | 2,245,341 | |
Trust 2013-98 FA, 0.702%, 9/25/43 | | | 54,923,143 | | | | 55,002,287 | |
Trust 2013-101 CF, 0.752%, 10/25/43 | | | 27,195,199 | | | | 27,325,083 | |
Trust 2013-101 FE, 0.752%, 10/25/43 | | | 43,361,979 | | | | 43,585,207 | |
Trust 2004-T1 1A2, 6.50%, 1/25/44 | | | 3,510,536 | | | | 4,009,429 | |
Trust 2004-W2 2A2, 7.00%, 2/25/44 | | | 205,450 | | | | 238,006 | |
Trust 2004-W2 5A, 7.50%, 3/25/44 | | | 9,555,483 | | | | 11,022,776 | |
Trust 2004-W8 3A, 7.50%, 6/25/44 | | | 6,919,351 | | | | 8,077,055 | |
Trust 2004-W14 1AF, 0.552%, 7/25/44 | | | 2,331,965 | | | | 2,285,697 | |
Trust 2004-W15 1A2, 6.50%, 8/25/44 | | | 1,619,569 | | | | 1,817,263 | |
Trust 2005-W1 1A3, 7.00%, 10/25/44 | | | 8,494,515 | | | | 9,748,849 | |
Trust 2001-79 BA, 7.00%, 3/25/45 | | | 1,071,259 | | | | 1,252,732 | |
| | | | | | | | |
| | |
| | | PAR VALUE | | | VALUE | |
Trust 2006-W1 1A1, 6.50%, 12/25/45 | | $ | 725,161 | | | $ | 821,855 | |
Trust 2006-W1 1A2, 7.00%, 12/25/45 | | | 5,451,153 | | | | 6,149,184 | |
Trust 2006-W1 1A3, 7.50%, 12/25/45 | | | 95,607 | | | | 110,859 | |
Trust 2006-W1 1A4, 8.00%, 12/25/45 | | | 6,420,469 | | | | 7,687,953 | |
Trust 2007-W10 1A, 6.281%, 8/25/47 | | | 25,912,920 | | | | 29,181,161 | |
Trust 2007-W10 2A, 6.293%, 8/25/47 | | | 7,535,329 | | | | 8,517,137 | |
Freddie Mac | | | | | | | | |
Series 2456 CJ, 6.50%, 6/15/32 | | | 350,756 | | | | 395,994 | |
Series 3312 AB, 6.50%, 6/15/32 | | | 6,209,748 | | | | 7,045,586 | |
Series T-41 2A, 6.505%, 7/25/32 | | | 375,711 | | | | 435,365 | |
Series 2587 ZU, 5.50%, 3/15/33 | | | 10,694,592 | | | | 11,634,294 | |
Series 2610 UA, 4.00%, 5/15/33 | | | 3,570,944 | | | | 3,743,260 | |
Series T-48 1A, 6.038%, 7/25/33 | | | 3,810,253 | | | | 4,331,793 | |
Series 2708 ZD, 5.50%, 11/15/33 | | | 41,913,015 | | | | 46,994,424 | |
Series 3330 GZ, 5.50%, 6/15/37 | | | 12,788,916 | | | | 13,838,042 | |
Series 4091 JF, 0.652%, 6/15/41 | | | 35,441,306 | | | | 35,519,951 | |
Series 4120 YF, 0.502%, 10/15/42 | | | 93,324,732 | | | | 92,242,725 | |
Series 4122 FP, 0.552%, 10/15/42 | | | 49,067,747 | | | | 48,666,078 | |
Series 309 F4, 0.682%, 8/15/43 | | | 96,153,083 | | | | 96,261,719 | |
Series 311 F1, 0.702%, 8/15/43 | | | 136,021,336 | | | | 136,088,944 | |
Series 4240 FA, 0.652%, 8/15/43 | | | 23,429,470 | | | | 23,543,337 | |
Series T-51 1A, 6.50%, 9/25/43 | | | 83,695 | | | | 95,771 | |
Series 4259 FA, 0.652%, 10/15/43 | | | 45,896,715 | | | | 45,898,963 | |
Series 4281 BC, 6.444%, 12/15/43 | | | 209,428,788 | | | | 236,343,529 | |
Series 4283 DW, 6.418%, 12/15/43 | | | 126,715,000 | | | | 142,922,102 | |
Series 4283 EW, 6.384%, 12/15/43 | | | 77,420,658 | | | | 85,764,282 | |
Series 4310 FA, 0.702%, 2/15/44 | | | 3,410,838 | | | | 3,380,741 | |
Series 4319 MA, 6.597%, 3/15/44 | | | 38,337,000 | | | | 43,038,611 | |
| | | | | | | | |
| | | | | | | 1,999,057,057 | |
FEDERAL AGENCY MORTGAGE PASS-THROUGH: 27.0% | |
Fannie Mae, 10 Year | | | | | | | | |
6.00%, 11/1/16 | | | 1,303,622 | | | | 1,359,002 | |
Fannie Mae, 15 Year | | | | | | | | |
4.00%, 9/1/25-2/1/27 | | | 117,967,789 | | | | 126,271,694 | |
5.00%, 9/1/25 | | | 121,202,191 | | | | 131,956,814 | |
5.50%, 1/1/18-7/1/25 | | | 330,890,175 | | | | 361,864,116 | |
6.00%, 7/1/16-3/1/23 | | | 139,185,365 | | | | 150,469,278 | |
6.50%, 12/1/14-12/1/19 | | | 17,693,920 | | | | 18,597,882 | |
7.00%, 9/1/14-11/1/17 | | | 46,037 | | | | 47,775 | |
7.50%, 11/1/14-8/1/17 | | | 838,958 | | | | 863,806 | |
Fannie Mae, 20 Year | | | | | | | | |
4.00%, 9/1/30-10/1/31 | | | 196,122,638 | | | | 210,856,052 | |
4.50%, 3/1/29-1/1/34 | | | 728,013,731 | | | | 795,780,812 | |
6.00%, 6/1/27-2/1/28 | | | 8,927,423 | | | | 10,087,689 | |
6.50%, 4/1/19-10/1/24 | | | 10,924,244 | | | | 12,314,344 | |
Fannie Mae, 30 Year | | | | | | | | |
4.50%, 6/1/36-11/1/43 | | | 294,174,536 | | | | 319,416,094 | |
5.00%, 7/1/37 | | | 24,345,890 | | | | 27,186,103 | |
5.50%, 2/1/33-11/1/39 | | | 409,117,276 | | | | 459,669,140 | |
6.00%, 11/1/28-6/1/40 | | | 459,310,678 | | | | 515,155,680 | |
6.50%, 12/1/32-8/1/39 | | | 188,220,661 | | | | 210,821,963 | |
7.00%, 4/1/32-2/1/39 | | | 172,469,144 | | | | 191,983,651 | |
Fannie Mae, 40 Year | | | | | | | | |
4.50%, 1/1/52 | | | 19,430,756 | | | | 20,873,764 | |
| | |
| See accompanying Notes to Financial Statements | | DODGE & COX INCOME FUND §PAGE 8 |
| | | | |
| PORTFOLIO OF INVESTMENTS (unaudited) | | | June 30, 2014 | |
| | | | | | | | |
| DEBT SECURITIES (continued) | |
| | |
| | | PAR VALUE | | | VALUE | |
Fannie Mae, Hybrid ARM | | | | | | | | |
1.794%, 8/1/34 | | $ | 3,064,953 | | | $ | 3,242,417 | |
1.87%, 1/1/35 | | | 4,442,253 | | | | 4,706,233 | |
1.879%, 6/1/43 | | | 7,872,270 | | | | 8,025,321 | |
1.945%, 11/1/35 | | | 3,382,113 | | | | 3,568,597 | |
1.954%, 9/1/43 | | | 17,448,854 | | | | 17,811,861 | |
1.983%, 10/1/34 | | | 3,566,819 | | | | 3,790,798 | |
1.998%, 4/1/35 | | | 5,467,904 | | | | 5,730,040 | |
2.025%, 7/1/35 | | | 2,745,624 | | | | 2,899,001 | |
2.041%, 7/1/35 | | | 2,435,793 | | | | 2,579,068 | |
2.053%, 8/1/35 | | | 3,243,052 | | | | 3,456,977 | |
2.109%, 7/1/35 | | | 3,111,744 | | | | 3,342,520 | |
2.12%, 9/1/34 | | | 4,645,967 | | | | 4,847,326 | |
2.145%, 8/1/35 | | | 10,892,568 | | | | 11,669,298 | |
2.215%, 1/1/37 | | | 5,318,141 | | | | 5,655,107 | |
2.246%, 1/1/36 | | | 6,986,142 | | | | 7,447,342 | |
2.249%, 12/1/35 | | | 3,152,119 | | | | 3,352,648 | |
2.25%, 6/1/35 | | | 1,777,458 | | | | 1,873,548 | |
2.257%, 10/1/38 | | | 11,500,882 | | | | 12,248,089 | |
2.26%, 11/1/36 | | | 4,353,304 | | | | 4,619,242 | |
2.268%, 8/1/34 | | | 926,401 | | | | 983,788 | |
2.269%, 10/1/33 | | | 4,170,668 | | | | 4,444,956 | |
2.273%, 12/1/36 | | | 4,875,999 | | | | 5,180,745 | |
2.276%, 7/1/35 | | | 2,395,149 | | | | 2,542,681 | |
2.289%, 7/1/34 | | | 4,044,673 | | | | 4,284,766 | |
2.29%, 10/1/35 | | | 5,152,440 | | | | 5,494,915 | |
2.314%, 10/1/38 | | | 6,513,639 | | | | 6,856,397 | |
2.345%, 2/1/44 | | | 6,950,810 | | | | 7,130,018 | |
2.354%, 1/1/36 | | | 7,697,002 | | | | 8,187,490 | |
2.373%, 10/1/35 | | | 3,267,834 | | | | 3,482,956 | |
2.391%, 9/1/42 | | | 24,898,069 | | | | 25,466,448 | |
2.409%, 9/1/35 | | | 4,221,806 | | | | 4,508,924 | |
2.437%, 2/1/43 | | | 28,892,874 | | | | 29,636,870 | |
2.467%, 8/1/35 | | | 6,298,267 | | | | 6,715,685 | |
2.494%, 11/1/42 | | | 18,512,101 | | | | 18,955,308 | |
2.511%, 9/1/38 | | | 1,242,663 | | | | 1,340,635 | |
2.517%, 5/1/44 | | | 38,870,528 | | | | 40,032,368 | |
2.565%, 1/1/35 | | | 2,046,630 | | | | 2,189,475 | |
2.637%, 2/1/37 | | | 12,499,161 | | | | 13,429,531 | |
2.689%, 4/1/44 | | | 40,374,333 | | | | 41,732,613 | |
2.696%, 2/1/43 | | | 16,196,954 | | | | 16,921,363 | |
2.735%, 11/1/43 | | | 34,647,987 | | | | 35,499,592 | |
2.904%, 2/1/44 | | | 15,412,644 | | | | 15,927,267 | |
2.92%, 9/1/43 | | | 17,755,240 | | | | 18,313,846 | |
2.958%, 4/1/44 | | | 15,163,468 | | | | 15,723,864 | |
2.96%, 6/1/44 | | | 24,037,689 | | | | 24,854,595 | |
3.454%, 10/1/38 | | | 3,401,324 | | | | 3,619,813 | |
3.477%, 7/1/41 | | | 113,188,015 | | | | 119,706,511 | |
4.132%, 12/1/39 | | | 5,725,411 | | | | 6,099,316 | |
4.956%, 5/1/38 | | | 6,053,577 | | | | 6,500,038 | |
5.015%, 4/1/38 | | | 1,477,631 | | | | 1,596,663 | |
5.217%, 8/1/37 | | | 866,735 | | | | 927,378 | |
5.554%, 11/1/37 | | | 3,043,114 | | | | 3,270,354 | |
| | | | | | | | |
| | |
| | | PAR VALUE | | | VALUE | |
5.566%, 4/1/37-6/1/39 | | $ | 3,397,454 | | | $ | 3,615,847 | |
5.621%, 7/1/36 | | | 72,432 | | | | 76,145 | |
5.837%, 12/1/36 | | | 2,177,364 | | | | 2,360,335 | |
5.852%, 8/1/37 | | | 5,388,099 | | | | 5,742,205 | |
Fannie Mae, Multifamily DUS | | | | | | | | |
Pool 735745, 5.012%, 1/1/17 | | | 101,413 | | | | 103,224 | |
Pool 745629, 5.205%, 1/1/18 | | | 254,969 | | | | 269,996 | |
Pool 462084, 5.275%, 11/1/15 | | | 124,952 | | | | 127,902 | |
Pool 888559, 5.452%, 6/1/17 | | | 21,252,255 | | | | 23,186,505 | |
Pool 888381, 5.508%, 4/1/17 | | | 626,462 | | | | 676,336 | |
Pool 888015, 5.538%, 11/1/16 | | | 38,802,468 | | | | 41,973,713 | |
Pool 745936, 6.084%, 8/1/16 | | | 786,849 | | | | 853,023 | |
Freddie Mac, Hybrid ARM | | | | | | | | |
1.79%, 1/1/36 | | | 4,638,358 | | | | 4,854,358 | |
1.992%, 8/1/36 | | | 4,690,869 | | | | 4,950,538 | |
2.101%, 4/1/37 | | | 2,079,603 | | | | 2,195,489 | |
2.122%, 2/1/38 | | | 13,854,799 | | | | 14,634,334 | |
2.125%, 5/1/37 | | | 6,329,776 | | | | 6,710,010 | |
2.195%, 3/1/37 | | | 6,861,012 | | | | 7,250,237 | |
2.219%, 4/1/37 | | | 3,430,549 | | | | 3,577,467 | |
2.23%, 1/1/36 | | | 5,173,886 | | | | 5,469,571 | |
2.25%, 1/1/35-4/1/35 | | | 4,295,406 | | | | 4,558,084 | |
2.253%, 6/1/38 | | | 7,626,817 | | | | 8,126,380 | |
2.295%, 4/1/38 | | | 11,415,865 | | | | 12,154,942 | |
2.296%, 10/1/35 | | | 5,179,172 | | | | 5,489,546 | |
2.346%, 1/1/37 | | | 4,940,734 | | | | 5,265,049 | |
2.353%, 7/1/37 | | | 13,175,483 | | | | 13,983,670 | |
2.364%, 8/1/35 | | | 2,985,451 | | | | 3,144,851 | |
2.37%, 1/1/36 | | | 13,241,813 | | | | 14,143,575 | |
2.375%, 2/1/34-2/1/35 | | | 10,326,847 | | | | 11,003,447 | |
2.387%, 3/1/35 | | | 2,322,675 | | | | 2,465,704 | |
2.412%, 10/1/38 | | | 4,512,753 | | | | 4,800,682 | |
2.432%, 4/1/38 | | | 14,585,867 | | | | 15,586,450 | |
2.434%, 9/1/33 | | | 10,982,041 | | | | 11,663,957 | |
2.448%, 8/1/34 | | | 1,896,926 | | | | 2,022,905 | |
2.454%, 9/1/35 | | | 4,956,473 | | | | 5,298,582 | |
2.47%, 4/1/36-7/1/43 | | | 23,587,968 | | | | 24,691,925 | |
2.527%, 8/1/35 | | | 4,605,846 | | | | 4,929,140 | |
2.779%, 10/1/43 | | | 6,575,513 | | | | 6,750,187 | |
2.937%, 10/1/38 | | | 1,770,591 | | | | 1,855,746 | |
2.974%, 1/1/44 | | | 15,791,476 | | | | 16,360,940 | |
3.053%, 5/1/44 | | | 287,384,825 | | | | 298,160,391 | |
3.087%, 4/1/44 | | | 22,480,017 | | | | 23,267,270 | |
3.114%, 6/1/44 | | | 59,480,212 | | | | 61,821,071 | |
3.13%, 7/1/44 | | | 21,580,289 | | | | 22,097,879 | |
3.20%, 1/1/44 | | | 15,072,216 | | | | 15,727,030 | |
3.619%, 6/1/41 | | | 16,546,820 | | | | 17,577,754 | |
3.716%, 9/1/41 | | | 22,504,743 | | | | 23,865,932 | |
5.014%, 6/1/38 | | | 2,538,336 | | | | 2,730,847 | |
5.106%, 11/1/34 | | | 2,451,533 | | | | 2,545,889 | |
5.429%, 11/1/39 | | | 7,574,150 | | | | 8,003,461 | |
5.786%, 1/1/38 | | | 2,371,426 | | | | 2,516,169 | |
6.127%, 10/1/37 | | | 1,812,900 | | | | 1,935,874 | |
6.13%, 12/1/36 | | | 3,656,155 | | | | 3,928,145 | |
| | |
| PAGE 9 § DODGE & COX INCOME FUND | | See accompanying Notes to Financial Statements |
| | | | |
| PORTFOLIO OF INVESTMENTS (unaudited) | | | June 30, 2014 | |
| | | | | | | | |
| DEBT SECURITIES (continued) | |
| | |
| | | PAR VALUE | | | VALUE | |
Freddie Mac Gold, 15 Year | | | | | | | | |
4.00%, 6/1/26-6/1/27 | | $ | 560,993,871 | | | $ | 600,673,415 | |
4.50%, 3/1/25-6/1/26 | | | 38,767,059 | | | | 41,767,969 | |
5.50%, 10/1/20-12/1/24 | | | 21,390,731 | | | | 23,213,887 | |
6.00%, 8/1/16-11/1/23 | | | 44,573,888 | | | | 48,273,326 | |
6.50%, 7/1/14-9/1/18 | | | 5,509,154 | | | | 5,761,677 | |
Freddie Mac Gold, 20 Year | | | | | | | | |
4.00%, 9/1/31 | | | 93,115,772 | | | | 99,926,772 | |
4.50%, 5/1/30-1/1/34 | | | 256,545,147 | | | | 279,557,124 | |
5.50%, 11/1/23 | | | 10,401,111 | | | | 11,602,615 | |
6.00%, 7/1/25-12/1/27 | | | 50,330,535 | | | | 56,489,904 | |
6.50%, 7/1/21-10/1/26 | | | 6,188,386 | | | | 6,972,139 | |
Freddie Mac Gold, 30 Year | | | | | | | | |
4.50%, 3/1/39-2/1/44 | | | 398,463,191 | | | | 432,463,466 | |
5.50%, 3/1/34-8/1/40 | | | 365,574,081 | | | | 409,067,563 | |
6.00%, 2/1/33-5/1/40 | | | 416,313,056 | | | | 467,630,310 | |
6.50%, 12/1/32-10/1/38 | | | 37,326,992 | | | | 41,791,844 | |
7.00%, 4/1/31-11/1/38 | | | 9,584,013 | | | | 10,932,424 | |
7.90%, 2/17/21 | | | 629,743 | | | | 686,468 | |
Ginnie Mae, 30 Year | | | | | | | | |
7.00%, 5/15/28 | | | 577,481 | | | | 669,141 | |
7.50%, 9/15/17-5/15/25 | | | 2,157,674 | | | | 2,509,986 | |
7.80%, 6/15/20-1/15/21 | | | 496,444 | | | | 540,723 | |
7.85%, 1/15/21-10/15/21 | | | 9,302 | | | | 9,417 | |
8.00%, 9/15/20 | | | 10,292 | | | | 11,660 | |
| | | | | | | | |
| | | | | | | 7,505,650,800 | |
PRIVATE LABEL CMO & REMIC: 0.0%(f) | |
GSMPS Mortgage Loan Trust | | | | | | | | |
Series 2004-4 1A4, 8.50%, 6/25/34 30 Year(b) | | | 6,027,722 | | | | 6,513,358 | |
| | | | | | | | |
| | | | 9,511,221,215 | |
| ASSET-BACKED: 2.7% | |
STUDENT LOAN: 0.7% | |
SLM Student Loan Trust Securities Series 2007-3 A2, 0.239%, 10/25/17 | | | 2,263,822 | | | | 2,259,836 | |
SLM Student Loan Trust Securities (Private Loans) | | | | | | | | |
Series 2013-A A2A, 1.77%, 5/17/27(b) | | | 9,116,000 | | | | 9,045,369 | |
Series 2012-B A2, 3.48%, 10/15/30(b) | | | 57,240,000 | | | | 59,992,328 | |
Series 2013-C A2A, 2.94%, 10/15/31(b) | | | 22,000,000 | | | | 22,662,332 | |
Series 2012-E A2A, 2.09%, 6/15/45(b) | | | 10,100,000 | | | | 10,121,907 | |
Series 2012-C A2, 3.31%, 10/15/46(b) | | | 88,513,000 | | | | 92,457,405 | |
| | | | | | | | |
| | | | 196,539,177 | |
OTHER: 1.0% | |
Rio Oil Finance Trust(b),(c) (Brazil) Series 2014-1, 6.25%, 7/6/24 | | | 260,750,000 | | | | 273,759,600 | |
|
CREDIT CARD: 1.0% | |
Chase Issuance Trust | | | | | | | | |
Series 2012-A8 A8, 0.54%, 10/16/17 | | | 262,460,000 | | | | 262,652,908 | |
Series 2013-A8 A8, 1.01%, 10/15/18 | | | 11,740,000 | | | | 11,775,079 | |
| | | | | | | | |
| | | | | | | 274,427,987 | |
| | | | | | | | |
| | | | 744,726,764 | |
| | | | | | | | |
| | |
| | | PAR VALUE | | | VALUE | |
| CORPORATE: 39.9% | |
FINANCIALS: 13.9% | |
Bank of America Corp. | | | | | | | | |
7.625%, 6/1/19 | | $ | 199,782,000 | | | $ | 246,732,968 | |
6.625%, 5/23/36(a) | | | 240,328,000 | | | | 271,462,252 | |
Boston Properties, Inc. | | | | | | | | |
5.625%, 4/15/15 | | | 34,510,000 | | | | 35,858,064 | |
3.70%, 11/15/18 | | | 28,620,000 | | | | 30,548,988 | |
5.875%, 10/15/19 | | | 48,079,000 | | | | 56,135,454 | |
5.625%, 11/15/20 | | | 64,385,000 | | | | 74,069,148 | |
4.125%, 5/15/21 | | | 23,365,000 | | | | 24,800,849 | |
3.85%, 2/1/23 | | | 20,666,000 | | | | 21,300,611 | |
3.125%, 9/1/23 | | | 23,745,000 | | | | 23,027,568 | |
3.80%, 2/1/24 | | | 55,900,000 | | | | 56,500,086 | |
Capital One Financial Corp. | | | | | | | | |
4.75%, 7/15/21 | | | 80,065,000 | | | | 89,033,001 | |
3.50%, 6/15/23 | | | 176,196,000 | | | | 176,688,996 | |
Cigna Corp. | | | | | | | | |
8.50%, 5/1/19 | | | 74,756,000 | | | | 95,579,658 | |
4.00%, 2/15/22 | | | 39,605,000 | | | | 42,008,469 | |
7.65%, 3/1/23 | | | 6,317,000 | | | | 7,821,299 | |
7.875%, 5/15/27 | | | 29,355,000 | | | | 38,197,548 | |
8.30%, 1/15/33 | | | 8,195,000 | | | | 10,651,058 | |
6.15%, 11/15/36 | | | 83,929,000 | | | | 103,445,850 | |
Citigroup, Inc. | | | | | | | | |
1.924%, 5/15/18 | | | 140,345,000 | | | | 145,778,457 | |
4.05%, 7/30/22 | | | 45,409,000 | | | | 46,498,407 | |
7.875%, 10/30/40(a) | | | 220,332,575 | | | | 243,423,429 | |
Equity Residential | | | | | | | | |
4.625%, 12/15/21 | | | 78,882,000 | | | | 86,789,763 | |
3.00%, 4/15/23 | | | 47,300,000 | | | | 46,106,999 | |
General Electric Co. | | | | | | | | |
5.50%, 1/8/20 | | | 176,920,000 | | | | 205,054,703 | |
4.375%, 9/16/20 | | | 64,160,000 | | | | 70,847,140 | |
4.65%, 10/17/21 | | | 47,950,000 | | | | 53,298,391 | |
Health Net, Inc. | | | | | | | | |
6.375%, 6/1/17 | | | 90,557,000 | | | | 99,499,504 | |
HSBC Holdings PLC(c) (United Kingdom) | | | | | |
5.10%, 4/5/21 | | | 52,270,000 | | | | 59,368,580 | |
9.30%, 6/1/21 | | | 100,000 | | | | 130,499 | |
6.50%, 5/2/36 | | | 131,906,000 | | | | 161,799,725 | |
6.50%, 9/15/37 | | | 81,937,000 | | | | 100,884,276 | |
JPMorgan Chase & Co. | | | | | | | | |
4.95%, 3/25/20 | | | 28,030,000 | | | | 31,557,968 | |
3.375%, 5/1/23 | | | 56,735,000 | | | | 55,656,184 | |
8.75%, 9/1/30(a) | | | 48,438,000 | | | | 65,709,586 | |
Legg Mason, Inc. | | | | | | | | |
5.50%, 5/21/19 | | | 136,480,000 | | | | 157,712,876 | |
Navient Corp. | | | | | | | | |
3.875%, 9/10/15 | | | 56,710,000 | | | | 57,844,200 | |
6.00%, 1/25/17 | | | 141,895,000 | | | | 154,133,444 | |
4.625%, 9/25/17 | | | 41,627,000 | | | | 43,864,451 | |
| | |
| See accompanying Notes to Financial Statements | | DODGE & COX INCOME FUND §PAGE 10 |
| | | | |
| PORTFOLIO OF INVESTMENTS (unaudited) | | | June 30, 2014 | |
| | | | | | | | |
| DEBT SECURITIES (continued) | |
| | |
| | | PAR VALUE | | | VALUE | |
Royal Bank of Scotland Group PLC(c) (United Kingdom) | | | | | | | | |
6.125%, 12/15/22 | | $ | 201,244,000 | | | $ | 220,002,154 | |
6.00%, 12/19/23 | | | 107,449,000 | | | | 116,113,687 | |
Unum Group | | | | | | | | |
6.85%, 11/15/15(b) | | | 10,588,000 | | | | 11,383,074 | |
7.19%, 2/1/28 | | | 11,295,000 | | | | 13,670,203 | |
7.25%, 3/15/28 | | | 25,060,000 | | | | 31,683,609 | |
6.75%, 12/15/28 | | | 8,107,000 | | | | 9,681,209 | |
WellPoint, Inc. | | | | | | | | |
5.25%, 1/15/16 | | | 50,133,000 | | | | 53,565,306 | |
5.875%, 6/15/17 | | | 16,016,000 | | | | 17,972,707 | |
7.00%, 2/15/19 | | | 83,470,000 | | | | 100,677,090 | |
| | | | | | | | |
| | | | 3,864,569,488 | |
INDUSTRIALS: 26.0% | |
AT&T, Inc. | | | | | | | | |
8.00%, 11/15/31 | | | 151,477,000 | | | | 222,144,959 | |
5.35%, 9/1/40 | | | 14,895,000 | | | | 16,175,106 | |
Boston Scientific Corp. | | | | | | | | |
6.25%, 11/15/15 | | | 14,550,000 | | | | 15,609,327 | |
6.40%, 6/15/16 | | | 109,769,000 | | | | 121,037,446 | |
6.00%, 1/15/20 | | | 15,690,000 | | | | 18,236,832 | |
Burlington Northern Santa Fe LLC(e) | | | | | |
4.70%, 10/1/19 | | | 75,445,000 | | | | 85,289,139 | |
7.57%, 1/2/21 | | | 13,011,122 | | | | 15,177,380 | |
8.251%, 1/15/21 | | | 4,941,376 | | | | 5,887,097 | |
4.10%, 6/1/21 | | | 5,820,000 | | | | 6,274,321 | |
3.05%, 9/1/22 | | | 14,780,000 | | | | 14,733,872 | |
5.943%, 1/15/23 | | | 68,198 | | | | 75,138 | |
3.85%, 9/1/23 | | | 70,425,000 | | | | 73,321,087 | |
5.72%, 1/15/24 | | | 17,065,790 | | | | 19,514,098 | |
5.342%, 4/1/24 | | | 5,722,378 | | | | 6,311,554 | |
5.629%, 4/1/24 | | | 23,544,538 | | | | 26,546,692 | |
5.996%, 4/1/24 | | | 45,214,323 | | | | 52,439,210 | |
Cemex SAB de CV(c) (Mexico) | | | | | | | | |
6.50%, 12/10/19(b) | | | 128,775,000 | | | | 137,950,219 | |
6.00%, 4/1/24(b) | | | 55,575,000 | | | | 57,867,469 | |
Comcast Corp. | | | | | | | | |
5.85%, 11/15/15 | | | 14,745,000 | | | | 15,818,407 | |
6.50%, 1/15/17 | | | 36,215,000 | | | | 41,188,152 | |
6.30%, 11/15/17 | | | 16,175,000 | | | | 18,803,017 | |
5.875%, 2/15/18 | | | 68,310,000 | | | | 78,739,093 | |
5.70%, 5/15/18 | | | 2,645,000 | | | | 3,046,728 | |
6.45%, 3/15/37 | | | 3,250,000 | | | | 4,139,226 | |
6.95%, 8/15/37 | | | 37,804,000 | | | | 50,886,339 | |
Cox Enterprises, Inc. | | | | | | | | |
5.45%, 12/15/14 | | | 14,915,000 | | | | 15,243,249 | |
5.50%, 10/1/15 | | | 265,000 | | | | 280,497 | |
5.875%, 12/1/16(b) | | | 76,215,000 | | | | 84,207,896 | |
9.375%, 1/15/19(b) | | | 145,119,000 | | | | 187,918,511 | |
3.25%, 12/15/22(b) | | | 67,799,000 | | | | 66,357,458 | |
2.95%, 6/30/23(b) | | | 137,355,000 | | | | 130,312,672 | |
| | | | | | | | |
| | |
| | | PAR VALUE | | | VALUE | |
CSX Corp. | | | | | | | | |
8.375%, 10/15/14 | | $ | 37,499 | | | $ | 38,334 | |
9.75%, 6/15/20 | | | 10,067,000 | | | | 13,619,564 | |
6.251%, 1/15/23 | | | 17,337,488 | | | | 20,371,548 | |
Dillard’s, Inc. | | | | | | | | |
7.13%, 8/1/18 | | | 23,565,000 | | | | 26,981,925 | |
7.875%, 1/1/23 | | | 275,000 | | | | 314,188 | |
7.75%, 7/15/26 | | | 21,016,000 | | | | 23,380,300 | |
7.75%, 5/15/27 | | | 12,848,000 | | | | 14,004,320 | |
7.00%, 12/1/28 | | | 28,225,000 | | | | 29,354,000 | |
Dow Chemical Co. | | | | | | | | |
8.55%, 5/15/19 | | | 107,035,000 | | | | 137,560,098 | |
7.375%, 11/1/29 | | | 48,989,000 | | | | 65,219,252 | |
9.40%, 5/15/39 | | | 122,658,000 | | | | 200,704,181 | |
Eaton Corp. PLC(c) (Ireland) | | | | | | | | |
1.50%, 11/2/17 | | | 22,630,000 | | | | 22,654,101 | |
2.75%, 11/2/22 | | | 61,835,000 | | | | 59,842,738 | |
Enel SPA(c) (Italy) | | | | | | | | |
6.80%, 9/15/37(b) | | | 99,629,000 | | | | 121,402,918 | |
6.00%, 10/7/39(b) | | | 46,581,000 | | | | 52,991,291 | |
8.75%, 9/24/73(b) | | | 33,050,000 | | | | 38,916,375 | |
FedEx Corp. | | | | | | | | |
8.00%, 1/15/19 | | | 18,050,000 | | | | 22,587,589 | |
6.72%, 7/15/23 | | | 16,724,303 | | | | 19,651,056 | |
7.65%, 7/15/24 | | | 2,103,350 | | | | 2,571,345 | |
Ford Motor Credit Co. LLC(e) | | | | | | | | |
5.625%, 9/15/15 | | | 49,025,000 | | | | 51,863,400 | |
8.125%, 1/15/20 | | | 6,525,000 | | | | 8,329,815 | |
5.75%, 2/1/21 | | | 136,841,000 | | | | 159,121,452 | |
5.875%, 8/2/21 | | | 80,875,000 | | | | 94,911,988 | |
4.25%, 9/20/22 | | | 44,075,000 | | | | 46,988,402 | |
4.375%, 8/6/23 | | | 27,875,000 | | | | 29,752,381 | |
HCA Holdings, Inc. | | | | | | | | |
6.375%, 1/15/15 | | | 80,218,000 | | | | 82,123,177 | |
6.50%, 2/15/16 | | | 235,325,000 | | | | 253,268,531 | |
Hewlett-Packard Co. | | | | | | | | |
3.30%, 12/9/16 | | | 90,750,000 | | | | 95,494,501 | |
Lafarge SA(c) (France) | | | | | | | | |
6.20%, 7/9/15(b) | | | 153,560,000 | | | | 160,854,100 | |
6.50%, 7/15/16 | | | 126,496,000 | | | | 138,513,120 | |
Liberty Interactive Corp. | | | | | | | | |
8.50%, 7/15/29 | | | 11,937,000 | | | | 13,250,070 | |
8.25%, 2/1/30 | | | 28,876,000 | | | | 31,907,980 | |
Macy’s, Inc. | | | | | | | | |
7.875%, 7/15/15 | | | 17,055,000 | | | | 18,319,304 | |
5.90%, 12/1/16 | | | 16,796,000 | | | | 18,716,085 | |
6.65%, 7/15/24 | | | 39,631,000 | | | | 48,967,905 | |
7.00%, 2/15/28 | | | 25,985,000 | | | | 32,686,038 | |
6.70%, 9/15/28 | | | 26,965,000 | | | | 32,525,722 | |
6.90%, 4/1/29 | | | 51,067,000 | | | | 63,830,737 | |
6.90%, 1/15/32 | | | 52,640,000 | | | | 65,349,454 | |
6.70%, 7/15/34 | | | 88,892,000 | | | | 111,922,673 | |
6.375%, 3/15/37 | | | 37,091,000 | | | | 46,054,930 | |
| | |
| PAGE 11 § DODGE & COX INCOME FUND | | See accompanying Notes to Financial Statements |
| | | | |
| PORTFOLIO OF INVESTMENTS (unaudited) | | | June 30, 2014 | |
| | | | | | | | |
| DEBT SECURITIES (continued) | |
| | |
| | | PAR VALUE | | | VALUE | |
Naspers, Ltd.(c) (South Africa) 6.00%, 7/18/20(b) | | $ | 125,047,000 | | | $ | 137,864,317 | |
Nordstrom, Inc. | | | | | | | | |
6.95%, 3/15/28 | | | 12,700,000 | | | | 16,474,808 | |
Norfolk Southern Corp. | | | | | | | | |
7.70%, 5/15/17 | | | 28,585,000 | | | | 33,684,821 | |
9.75%, 6/15/20 | | | 13,813,000 | | | | 18,687,497 | |
Reed Elsevier PLC(c) (United Kingdom) | | | | | | | | |
8.625%, 1/15/19 | | | 27,733,000 | | | | 35,092,894 | |
3.125%, 10/15/22 | | | 125,201,000 | | | | 123,413,005 | |
Sprint Corp. | | | | | | | | |
6.00%, 12/1/16 | | | 118,140,000 | | | | 128,624,925 | |
Telecom Italia SPA(c) (Italy) | | | | | | | | |
6.999%, 6/4/18 | | | 115,097,000 | | | | 132,073,807 | |
7.175%, 6/18/19 | | | 137,111,000 | | | | 158,620,288 | |
7.20%, 7/18/36 | | | 35,990,000 | | | | 39,858,925 | |
7.721%, 6/4/38 | | | 59,463,000 | | | | 68,531,107 | |
Time Warner Cable, Inc. | | | | | | | | |
8.75%, 2/14/19 | | | 81,834,000 | | | | 104,653,084 | |
8.25%, 4/1/19 | | | 221,583,000 | | | | 280,737,241 | |
5.00%, 2/1/20 | | | 8,200,000 | | | | 9,187,518 | |
4.00%, 9/1/21 | | | 4,095,000 | | | | 4,372,461 | |
Time Warner, Inc. | | | | | | | | |
7.625%, 4/15/31 | | | 162,843,000 | | | | 223,481,011 | |
7.70%, 5/1/32 | | | 154,808,000 | | | | 214,708,014 | |
Twenty-First Century Fox, Inc. | | | | | | | | |
6.20%, 12/15/34 | | | 7,440,000 | | | | 9,095,348 | |
6.40%, 12/15/35 | | | 29,170,000 | | | | 36,275,695 | |
6.15%, 3/1/37 | | | 29,205,000 | | | | 35,063,903 | |
6.65%, 11/15/37 | | | 22,560,000 | | | | 28,640,507 | |
6.15%, 2/15/41 | | | 29,795,000 | | | | 36,052,427 | |
Union Pacific Corp. | | | | | | | | |
4.875%, 1/15/15 | | | 10,449,000 | | | | 10,703,820 | |
6.85%, 1/2/19 | | | 2,816,599 | | | | 3,150,078 | |
6.70%, 2/23/19 | | | 4,069,610 | | | | 4,471,628 | |
7.60%, 1/2/20 | | | 1,332,079 | | | | 1,565,144 | |
4.163%, 7/15/22 | | | 29,962,000 | | | | 32,640,753 | |
6.061%, 1/17/23 | | | 8,154,908 | | | | 9,171,545 | |
4.698%, 1/2/24 | | | 4,060,984 | | | | 4,489,680 | |
3.646%, 2/15/24 | | | 42,961,000 | | | | 44,701,952 | |
5.082%, 1/2/29 | | | 8,807,511 | | | | 9,851,301 | |
5.866%, 7/2/30 | | | 46,508,282 | | | | 54,016,579 | |
6.176%, 1/2/31 | | | 34,255,540 | | | | 40,136,459 | |
Verizon Communications, Inc. | | | | | | | | |
5.15%, 9/15/23 | | | 72,195,000 | | | | 80,749,747 | |
4.15%, 3/15/24 | | | 66,000,000 | | | | 68,874,498 | |
6.55%, 9/15/43 | | | 314,350,000 | | | | 394,940,224 | |
Vulcan Materials Co. | | | | | | | | |
6.50%, 12/1/16 | | | 4,531,000 | | | | 5,018,082 | |
7.50%, 6/15/21 | | | 94,735,000 | | | | 112,142,556 | |
Xerox Corp. | | | | | | | | |
6.40%, 3/15/16 | | | 72,137,000 | | | | 78,795,029 | |
7.20%, 4/1/16 | | | 25,586,000 | | | | 28,218,467 | |
6.75%, 2/1/17 | | | 62,799,000 | | | | 71,240,504 | |
| | | | | | | | |
| | |
| | | PAR VALUE | | | VALUE | |
2.95%, 3/15/17 | | $ | 1,125,000 | | | $ | 1,174,174 | |
6.35%, 5/15/18 | | | 106,052,000 | | | | 123,217,577 | |
5.625%, 12/15/19 | | | 66,647,000 | | | | 76,494,627 | |
4.50%, 5/15/21 | | | 54,230,000 | | | | 58,566,882 | |
| | | | | | | | |
| | | | | | | 7,257,973,988 | |
| | | | | | | | |
| | | | | | | 11,122,543,476 | |
| | | | | | | | |
TOTAL DEBT SECURITIES
(Cost $25,173,768,914) | | | $ | 26,958,244,670 | |
|
| SHORT-TERM INVESTMENTS: 2.8% | |
MONEY MARKET FUND: 0.2% | |
SSgA U.S. Treasury Money
Market Fund | | | 55,528,809 | | | | 55,528,809 | |
|
REPURCHASE AGREEMENT: 2.6% | |
Fixed Income Clearing Corporation(d) 0.00%, dated 6/30/14, due 7/1/14, maturity value $710,724,647 | | | 710,724,647 | | | | 710,724,647 | |
| | | | | | | | |
TOTAL SHORT-TERM INVESTMENTS
(Cost $766,253,456) | | | $ | 766,253,456 | |
| | | | | | | | |
TOTAL INVESTMENTS
(Cost $25,940,022,370) | | | 99.6 | % | | $ | 27,724,498,126 | |
OTHER ASSETS LESS LIABILITIES | | | 0.4 | % | | | 110,574,249 | |
| | | | | | | | |
| NET ASSETS | | | 100.0 | % | | $ | 27,835,072,375 | |
| | | | | | | | |
| (a) | Cumulative preferred security |
| (b) | Security exempt from registration under Rule 144A of the Securities Act of 1933. The security may be resold in transactions exempt from registration, normally to qualified institutional buyers. As of June 30, 2014, all such securities in total represented $1,889,959,540 or 6.8% of net assets. These securities have been deemed liquid by Dodge & Cox, investment manager, pursuant to procedures approved by the Fund’s Board of Trustees. |
| (c) | Security denominated in U.S. dollars |
| (d) | Repurchase agreement is collateralized by U.S. Treasury Note 0.875%-3.500%, 6/30/19-9/30/20; U.S. Treasury Bill 0.00%, 7/24/14; and Freddie Mac 0.00%, 7/23/14. Total collateral value is $724,943,281. |
| (e) | Subsidiary (see below) |
Debt securities are grouped by parent company unless otherwise noted. Actual securities may be issued by the listed parent company or one of its subsidiaries.
ARM: Adjustable Rate Mortgage
CMO: Collateralized Mortgage Obligation
DUS: Delegated Underwriting and Servicing
GO: General Obligation
RB: Revenue Bond
REMIC: Real Estate Mortgage Investment Conduit
| | |
| See accompanying Notes to Financial Statements | | DODGE & COX INCOME FUND §PAGE 12 |
| | | | |
| PORTFOLIO OF INVESTMENTS (unaudited) | | | June 30, 2014 | |
FUTURES CONTRACTS
| | | | | | | | | | | | | | | | |
| Description | | Number of
Contracts | | | Expiration
Date | | | Notional
Amount | | | Unrealized
Depreciation | |
10 Year U.S. Treasury Note - Short Position | | | 4,773 | | | | Sep 2014 | | | $ | (597,445,359 | ) | | $ | (580,006 | ) |
Long-Term U.S. Treasury Bond - Short Position | | | 2,184 | | | | Sep 2014 | | | | (327,463,500 | ) | | | (2,603,649 | ) |
| | | | | | | | | | | | | | | | |
| | | | | | | | | | | | | | $ | (3,183,655 | ) |
| | | | | | | | | | | | | | | | |
| | | | | | | | | | | | | | | | | |
| | |
| PAGE 13 § DODGE & COX INCOME FUND | | See accompanying Notes to Financial Statements |
| | | | |
STATEMENT OF ASSETS AND LIABILITIES
(unaudited) | |
| |
| | | June 30, 2014 | |
ASSETS: | | | | |
Investments, at value (cost $25,940,022,370) | | $ | 27,724,498,126 | |
Cash held at broker | | | 12,538,638 | |
Receivable for investments sold | | | 16,384,632 | |
Receivable for Fund shares sold | | | 38,193,916 | |
Interest receivable | | | 225,670,758 | |
Prepaid expenses and other assets | | | 103,929 | |
| | | | |
| | | 28,017,389,999 | |
| | | | |
LIABILITIES: | | | | |
Payable for investments purchased | | | 156,748,273 | |
Payable for Fund shares redeemed | | | 12,806,689 | |
Payable to broker for variation margin | | | 1,806,165 | |
Management fees payable | | | 9,025,971 | |
Accrued expenses | | | 1,930,526 | |
| | | | |
| | | 182,317,624 | |
| | | | |
NET ASSETS | | $ | 27,835,072,375 | |
| | | | |
NET ASSETS CONSIST OF: | | | | |
Paid in capital | | $ | 25,934,045,373 | |
Undistributed net investment income | | | 1,394,287 | |
Undistributed net realized gain | | | 118,328,022 | |
Net unrealized appreciation | | | 1,781,304,693 | |
| | | | |
| | $ | 27,835,072,375 | |
| | | | |
Fund shares outstanding (par value $0.01 each, unlimited shares authorized) | | | 2,003,811,807 | |
Net asset value per share | | $ | 13.89 | |
|
STATEMENT OF OPERATIONS
(unaudited) | |
| |
| | | Six Months Ended
June 30, 2014 | |
INVESTMENT INCOME: | | | | |
Dividends | | $ | 8,673,832 | |
Interest | | | 446,511,304 | |
| | | | |
| | | 455,185,136 | |
| | | | |
EXPENSES: | | | | |
Management fees | | | 51,587,743 | |
Custody and fund accounting fees | | | 224,312 | |
Transfer agent fees | | | 2,289,523 | |
Professional services | | | 102,017 | |
Shareholder reports | | | 2,773,446 | |
Registration fees | | | 258,154 | |
Trustees’ fees | | | 139,442 | |
Miscellaneous | | | 87,013 | |
| | | | |
| | | 57,461,650 | |
| | | | |
NET INVESTMENT INCOME | | | 397,723,486 | |
| | | | |
|
REALIZED AND UNREALIZED GAIN (LOSS): | |
Net realized gain (loss) | | | | |
Investments | | | 143,517,811 | |
Treasury futures contracts | | | (14,417,304 | ) |
Net change in unrealized appreciation/depreciation | | | | |
Investments | | | 642,403,975 | |
Treasury futures contracts | | | (13,784,702 | ) |
| | | | |
Net realized and unrealized gain | | | 757,719,780 | |
| | | | |
NET INCREASE IN NET ASSETS
FROM OPERATIONS | | $ | 1,155,443,266 | |
| | | | |
| | | | | | | | |
STATEMENT OF CHANGES IN NET ASSETS
(unaudited) | |
| | |
| | | Six Months Ended
June 30, 2014 | | | Year Ended
December 31, 2013 | |
OPERATIONS: | | | | | | | | |
Net investment income | | $ | 397,723,486 | | | $ | 779,144,223 | |
Net realized gain | | | 129,100,507 | | | | 493,829,809 | |
Net change in unrealized appreciation/depreciation | | | 628,619,273 | | | | (1,121,487,569 | ) |
| | | | | | | | |
| | | 1,155,443,266 | | | | 151,486,463 | |
| | | | | | | | |
| | |
DISTRIBUTIONS TO SHAREHOLDERS FROM: | | | | | | | | |
Net investment income | | | (403,557,884 | ) | | | (778,582,064 | ) |
Net realized gain | | | (80,028,968 | ) | | | — | |
| | | | | | | | |
Total distributions | | | (483,586,852 | ) | | | (778,582,064 | ) |
| | | | | | | | |
| |
FUND SHARE
TRANSACTIONS: | | | | | |
Proceeds from sale of shares | | | 4,488,717,038 | | | | 6,918,977,679 | |
Reinvestment of distributions | | | 376,014,656 | | | | 617,308,718 | |
Cost of shares redeemed | | | (2,355,599,834 | ) | | | (8,793,657,789 | ) |
| | | | | | | | |
Net increase/(decrease) from Fund share transactions | | | 2,509,131,860 | | | | (1,257,371,392 | ) |
| | | | | | | | |
Total increase in net assets | | | 3,180,988,274 | | | | (1,884,466,993 | ) |
| |
NET ASSETS: | | | | | |
Beginning of period | | | 24,654,084,101 | | | | 26,538,551,094 | |
| | | | | | | | |
End of period (including undistributed net investment income of $1,394,287 and $7,228,684, respectively) | | $ | 27,835,072,375 | | | $ | 24,654,084,101 | |
| | | | | | | | |
| | |
SHARE INFORMATION: | | | | | | | | |
Shares sold | | | 325,257,329 | | | | 505,482,231 | |
Distributions reinvested | | | 27,317,338 | | | | 45,502,994 | |
Shares redeemed | | | (171,130,353 | ) | | | (643,772,319 | ) |
| | | | | | | | |
Net increase/(decrease) in shares outstanding | | | 181,444,314 | | | | (92,787,094 | ) |
| | | | | | | | |
| | |
| See accompanying Notes to Financial Statements | | DODGE & COX INCOME FUND §PAGE 14 |
NOTES TO FINANCIAL STATEMENTS (unaudited)
NOTE 1—ORGANIZATION AND SIGNIFICANT ACCOUNTING POLICIES
Dodge & Cox Income Fund (the “Fund”) is one of the series constituting the Dodge & Cox Funds (the “Trust” or the “Funds”). The Trust is organized as a Delaware statutory trust and is registered under the Investment Company Act of 1940, as amended, as an open-end management investment company. The Fund commenced operations on January 3, 1989, and seeks high and stable current income consistent with long-term preservation of capital. Risk considerations and investment strategies of the Fund are discussed in the Fund’s Prospectus.
The financial statements have been prepared in conformity with accounting principles generally accepted in the United States of America, which require the use of estimates and assumptions by management. Actual results may differ from those estimates. Significant accounting policies are as follows:
Security valuation The Fund’s net assets are valued as of the close of trading on the New York Stock Exchange (NYSE), generally 4:00 p.m. Eastern Time, each day that the NYSE is open for business. Debt securities are valued based on prices received from independent pricing services which utilize both dealer-supplied valuations and pricing models. Pricing models may consider quoted prices for similar securities, interest rates, prepayment speeds, and credit risk. Exchange-traded derivatives are valued at the settlement price determined by the relevant exchange. Security values are not discounted based on the size of the Fund’s position. Securities for which market quotations are not readily available are valued at fair value as determined in good faith by or under the direction of the Board of Trustees. Short-term securities less than 60 days to maturity may be valued at amortized cost if amortized cost approximates current value. All securities held by the Fund are denominated in U.S. dollars.
The Board of Trustees has delegated authority to Dodge & Cox, the Fund’s investment manager, to make fair value determinations in accordance with the Dodge & Cox Funds Valuation Policies (“Valuation Policies”), subject to Board oversight. Dodge & Cox has established a
Pricing Committee that is comprised of representatives from Treasury, Legal, Compliance, and Operations. The Pricing Committee is responsible for implementing the Valuation Policies, including determining the fair value of securities when market quotations or market-based valuations are not readily available or are deemed unreliable. The Pricing Committee considers relevant indications of value that are reasonably available to it in determining the fair value assigned to a particular security, such as the value of similar financial instruments, trading volumes, contractual restrictions on disposition, related corporate actions, and changes in economic conditions.
Valuing securities at fair value involves greater reliance on judgment than valuation of securities based on readily available market quotations. In some instances, lack of information and uncertainty as to the significance of information may lead to a conclusion that a prior valuation is the best indication of a security’s present value. When fair value pricing is employed, the prices of securities used by the Fund to calculate its net asset value may differ from quoted or published prices for the same securities.
Security transactions, investment income, expenses, and distributions Security transactions are recorded on the trade date. Realized gains and losses on securities sold are determined on the basis of identified cost.
Interest income is recorded on the accrual basis. Interest income includes coupon interest, amortization of premium and accretion of discount on debt securities, and gain/loss on paydowns of mortgage-backed securities. The ability of the issuers of the debt securities held by the Fund to meet their obligations may be affected by economic developments in a specific industry, state, or region. Debt obligations may be placed on non-accrual status and related interest income may be reduced by ceasing current accruals and writing off interest receivables when the collection of all or a portion of interest has become doubtful. A debt obligation is removed from non-accrual status when the issuer resumes interest payments or when collectibility of interest is reasonably assured.
Expenses are recorded on the accrual basis. Most expenses of the Trust can be directly attributed to a specific series. Expenses which cannot be directly
PAGE 15 § DODGE & COX INCOME FUND
NOTES TO FINANCIAL STATEMENTS (unaudited)
attributed are allocated among the Funds in the Trust based on relative net assets or other expense methodologies determined by the nature of the expense.
Distributions to shareholders are recorded on the ex-dividend date.
Repurchase agreements The Fund enters into repurchase agreements, secured by U.S. government or agency securities, which involve the purchase of securities from a counterparty with a simultaneous commitment to resell the securities at an agreed-upon date and price. It is the Fund’s policy that its custodian take possession of the underlying collateral securities, the fair value of which exceeds the principal amount of the repurchase transaction, including accrued interest, at all times. In the event of default by the counterparty, the Fund has the contractual right to liquidate the securities and to apply the proceeds in satisfaction of the obligation.
Treasury Futures Contracts Futures contracts involve an obligation to purchase or sell (depending on whether the Fund has entered a long or short futures contract, respectively) an asset at a future date, at a price set at the time of the contract. Upon entering into a futures contract, the Fund is required to deposit an amount of cash or liquid assets (referred to as initial margin) in a segregated account with the clearing broker. Subsequent payments (referred to as variation margin) to and from the clearing broker are made on a daily basis based on changes in the market value of futures contracts. Futures are traded publicly and their market value changes daily. Changes in the market value of open futures contracts are recorded as unrealized appreciation or depreciation in the Statement of Operations. Realized gains and losses on futures contracts are recorded in the Statement of Operations at the closing or expiration of futures contracts. Cash deposited with a broker as initial margin is recorded on the Statement of Assets and Liabilities. A receivable and/or payable to brokers for daily variation margin is also recorded on the Statement of Assets and Liabilities.
Investments in futures contracts may include certain risks, which may be different from, and potentially greater than, those of the underlying securities. To the extent the
Fund uses Treasury futures, it is exposed to additional volatility and potential losses resulting from leverage.
The Fund has entered into short Treasury futures contracts to assist with the management of the portfolio’s interest rate exposure. During the six months ended June 30, 2014, these Treasury futures contracts had notional values ranging from less than 1% to 4% of net assets.
Indemnification Under the Trust’s organizational documents, its officers and trustees are indemnified against certain liabilities arising out of the performance of their duties to the Trust. In addition, in the normal course of business the Trust enters into contracts that provide general indemnities to other parties. The Trust’s maximum exposure under these arrangements is unknown as this would involve future claims that may be made against the Trust that have not yet occurred.
NOTE 2—VALUATION MEASUREMENTS
Various inputs are used in determining the value of the Fund’s investments. These inputs are summarized in the three broad levels listed below.
| § | | Level 1: Quoted prices in active markets for identical securities |
| § | | Level 2: Other significant observable inputs (including quoted prices for similar securities, market indices, interest rates, credit risk, etc.) |
| § | | Level 3: Significant unobservable inputs (including Fund management’s assumptions in determining the fair value of investments) |
The inputs or methodology used for valuing securities are not necessarily an indication of the risk associated with investing in those securities.
DODGE & COX INCOME FUND §PAGE 16
NOTES TO FINANCIAL STATEMENTS (unaudited)
The following is a summary of the inputs used to value the Fund’s holdings at June 30, 2014:
| | | | | | | | |
| Classification(a) | | LEVEL 1 (Quoted Prices) | | | LEVEL 2 (Other Significant
Observable Inputs) | |
Securities | | | | | | | | |
Debt Securities | | | | | | | | |
U.S. Treasury | | $ | 3,152,061,425 | | | $ | — | |
Government-Related | | | — | | | | 2,427,691,790 | |
Mortgage-Related | | | — | | | | 9,511,221,215 | |
Asset-Backed | | | — | | | | 744,726,764 | |
Corporate | | | — | | | | 11,122,543,476 | |
Short-term Investments | | | | | | | | |
Money Market Fund | | | 55,528,809 | | | | — | |
Repurchase Agreement | | | — | | | | 710,724,647 | |
| | | | | | | | |
Total Securities | | $ | 3,207,590,234 | | | $ | 24,516,907,892 | |
| | | | | | | | |
Other Financial Instruments | | | | | |
Treasury Futures Contracts | | $ | (3,183,655 | )(b) | | $ | — | |
| | | | | | | | | |
| (a) | There were no transfers between Level 1 and Level 2 during the six months ended June 30, 2014. There were no Level 3 securities at June 30, 2014 and December 31, 2013, and there were no transfers to Level 3 during the period. |
| (b) | Represents net unrealized appreciation/depreciation. |
NOTE 3—RELATED PARTY TRANSACTIONS
Management fees Under a written agreement approved by a unanimous vote of the Board of Trustees, the Fund pays an annual management fee of 0.50% of the Fund’s average daily net assets up to $100 million and 0.40% of the Fund’s average daily net assets in excess of $100 million to Dodge & Cox, investment manager of the Fund. The agreement further provides that Dodge & Cox shall waive its fee to the extent that such fee plus all other ordinary operating expenses of the Fund exceed 1% of the average daily net assets for the year.
Fund officers and trustees All officers and two of the trustees of the Trust are officers or employees of Dodge & Cox. The Trust pays a fee only to those trustees who are not affiliated with Dodge & Cox.
NOTE 4—INCOME TAX INFORMATION AND DISTRIBUTIONS TO SHAREHOLDERS
A provision for federal income taxes is not required since the Fund intends to continue to qualify as a regulated investment company under Subchapter M of the Internal Revenue Code and distribute all of its taxable income to shareholders. Distributions are determined in accordance with income tax regulations, and such amounts may differ from net investment income and realized gains for financial reporting purposes. Financial reporting records are adjusted for permanent book/tax differences at year end to reflect tax character.
Book/tax differences are primarily due to differing treatments of wash sales, net short-term realized gain (loss), and Treasury futures contracts. At June 30, 2014, the cost of investments for federal income tax purposes was $25,940,071,716.
Distributions during the periods noted below were characterized as follows for federal income tax purposes:
| | | | | | | | |
| | | Six Months Ended June 30, 2014 | | | Year Ended December 31, 2013 | |
Ordinary income | | | $403,557,884 | | | | $778,582,064 | |
| | | ($0.210 per share) | | | | ($0.415 per share) | |
Long-term capital gain | | | $80,028,968 | | | | — | |
| | | ($0.043 per share) | | | | | |
At June 30, 2014, the tax basis components of distributable earnings were as follows:
| | | | |
Unrealized appreciation | | $ | 1,811,001,302 | |
Unrealized depreciation | | | (26,574,892 | ) |
| | | | |
Net unrealized appreciation | | | 1,784,426,410 | |
Undistributed ordinary income | | | 29,645,502 | |
Undistributed long-term capital gain | | | 86,955,090 | |
During 2013, the Fund utilized all of its capital loss carryforward, which amounted to $396,020,432.
Under the Regulated Investment Company Modernization Act of 2010, capital losses incurred by the Fund after January 1, 2011, are not subject to expiration. In addition, such losses must be utilized prior to the losses incurred in the years preceding enactment.
PAGE 17 § DODGE & COX INCOME FUND
NOTES TO FINANCIAL STATEMENTS (unaudited)
Fund management has reviewed the tax positions for open periods (three years and four years, respectively, from filing the Fund’s Federal and State tax returns) as applicable to the Fund, and has determined that no provision for income tax is required in the Fund’s financial statements.
NOTE 5—LOAN FACILITIES
Pursuant to an exemptive order issued by the Securities and Exchange Commission (SEC), the Fund may participate in an interfund lending facility (Facility). The Facility allows the Fund to borrow money from or loan money to the Funds. Loans under the Facility are made for temporary or emergency purposes, such as to fund shareholder redemption requests. Interest on borrowings is the average of the current repurchase agreement rate and the bank loan rate. There was no activity in the Facility during the period.
All Funds in the Trust participate in a $500 million committed credit facility (Line of Credit) with State Street Bank and Trust Company, to be utilized for temporary or emergency purposes to fund shareholder redemptions or for other short-term liquidity purposes. The maximum amount available to the Fund is $250 million. Each Fund pays an annual commitment fee on its pro-rata portion of the Line of Credit. The Fund’s commitment fee for the six months ended June 30, 2014, amounted to $19,077 and is reflected as a Miscellaneous Expense in the Statement of Operations. Interest on borrowings is charged at the prevailing rate. There were no borrowings on the Line of Credit during the period.
NOTE 6—PURCHASES AND SALES OF INVESTMENTS
For the six months ended June 30, 2014, purchases and sales of securities, other than short-term securities and U.S. government securities, aggregated $851,510,258 and $1,516,654,255, respectively. For the six months ended June 30, 2014, purchases and sales of U.S. government securities aggregated $4,767,432,843 and $1,928,656,787, respectively.
NOTE 7—SUBSEQUENT EVENTS
Fund management has determined that no material events or transactions occurred subsequent June 30, 2014, and through the date of the Fund’s financial statements issuance, which require additional disclosure in the Fund’s financial statements.
DODGE & COX INCOME FUND §PAGE 18
FINANCIAL HIGHLIGHTS
| | | | | | | | | | | | | | | | | | | | | | | | |
SELECTED DATA AND RATIOS (for a share outstanding throughout each period) | | Six Months
Ended June 30, | | | Year Ended December 31, | |
| | | 2014(a) | | | 2013 | | | 2012 | | | 2011 | | | 2010 | | | 2009 | |
| | | | | | | | |
Net asset value, beginning of period | | | $13.53 | | | | $13.86 | | | | $13.30 | | | | $13.23 | | | | $12.96 | | | | $11.79 | |
Income from investment operations: | | | | | | | | | | | | | | | | | | | | | | | | |
Net investment income | | | 0.21 | | | | 0.42 | | | | 0.48 | | | | 0.55 | | | | 0.57 | | | | 0.65 | |
Net realized and unrealized gain (loss) | | | 0.40 | | | | (0.33 | ) | | | 0.56 | | | | 0.07 | | | | 0.35 | | | | 1.20 | |
| | | | | | | | |
Total from investment operations | | | 0.61 | | | | 0.09 | | | | 1.04 | | | | 0.62 | | | | 0.92 | | | | 1.85 | |
| | | | | | | | |
Distributions to shareholders from: | | | | | | | | | | | | | | | | | | | | | | | | |
Net investment income | | | (0.21 | ) | | | (0.42 | ) | | | (0.48 | ) | | | (0.55 | ) | | | (0.65 | ) | | | (0.68 | ) |
Net realized gain | | | (0.04 | ) | | | — | | | | — | | | | — | | | | — | | | | — | |
| | | | | | | | |
Total distributions | | | (0.25 | ) | | | (0.42 | ) | | | (0.48 | ) | | | (0.55 | ) | | | (0.65 | ) | | | (0.68 | ) |
| | | | | | | | |
Net asset value, end of period | | | $13.89 | | | | $13.53 | | | | $13.86 | | | | $13.30 | | | | $13.23 | | | | $12.96 | |
| | | | | | | | |
Total return | | | 4.56 | % | | | 0.64 | % | | | 7.94 | % | | | 4.76 | % | | | 7.17 | % | | | 16.05 | % |
Ratios/supplemental data: | | | | | | | | | | | | | | | | | | | | | | | | |
Net assets, end of period (millions) | | | $27,835 | | | | $24,654 | | | | $26,539 | | | | $24,051 | | | | $22,381 | | | | $19,254 | |
Ratio of expenses to average net assets | | | 0.45 | %(b) | | | 0.43 | % | | | 0.43 | % | | | 0.43 | % | | | 0.43 | % | | | 0.43 | % |
Ratio of net investment income to average net assets | | | 3.08 | %(b) | | | 3.00 | % | | | 3.52 | % | | | 4.12 | % | | | 4.26 | % | | | 5.29 | % |
Portfolio turnover rate | | | 14 | % | | | 38 | % | | | 26 | % | | | 27 | % | | | 28 | % | | | 20 | % |
See accompanying Notes to Financial Statements
PAGE 19 § DODGE & COX INCOME FUND
SHAREHOLDER MEETING RESULTS (unaudited)
A special meeting of shareholders was held on April 23, 2014. At the meeting, proposals to elect Trustees to the Board of Trustees and to amend the Fund’s fundamental investment restrictions listed below were approved. The following is a report of the total votes cast by the Trust’s and the Fund’s shareholders.
| | | | | | | | | | | | | | |
| PROPOSAL | | | | AFFIRMATIVE | | | WITHHOLD | | | TOTAL | |
1 Elect Trustees to the Board of Trustees: | | | | | | | | | | | | | | |
| | | | |
| | Dana M. Emery | | | 2,724,363,325 | | | | 37,845,024 | | | | 2,762,208,349 | |
| | | | |
| | Charles F. Pohl | | | 2,724,265,808 | | | | 37,942,541 | | | | 2,762,208,349 | |
| | | | |
| | Thomas A. Larsen | | | 2,723,251,516 | | | | 38,956,833 | | | | 2,762,208,349 | |
| | | | |
| | Ann Mather | | | 2,696,172,728 | | | | 66,035,621 | | | | 2,762,208,349 | |
| | | | |
| | Robert B. Morris III | | | 2,722,376,906 | | | | 39,831,443 | | | | 2,762,208,349 | |
| | | | |
| | Gary Roughead | | | 2,721,551,032 | | | | 40,657,317 | | | | 2,762,208,349 | |
| | | | |
| | Mark E. Smith | | | 2,723,441,491 | | | | 38,766,858 | | | | 2,762,208,349 | |
| | | | |
| | John B. Taylor | | | 2,722,862,534 | | | | 39,345,815 | | | | 2,762,208,349 | |
| | | | | | | | | | | | | | | | | | | | |
| PROPOSAL | | AFFIRMATIVE | | | AGAINST | | | ABSTAIN | | | BROKER NON-VOTE | | | TOTAL | |
2 To remove the Fund’s fundamental investment restriction with respect to investing in any company for the purpose of exercising control or management. | | | 1,036,358,404 | | | | 50,907,520 | | | | 22,587,627 | | | | 311,156,180 | | | | 1,421,009,731 | |
| | | | | |
3 To remove the Fund’s fundamental investment restriction with respect to purchasing securities on margin and short selling. | | | 1,001,403,805 | | | | 84,829,193 | | | | 23,620,553 | | | | 311,156,180 | | | | 1,421,009,731 | |
| | | | | |
4 To remove the Fund’s fundamental investment restriction with respect to investments in securities that are illiquid and replace it with a uniform non-fundamental policy for all Funds. | | | 1,027,731,059 | | | | 57,799,498 | | | | 24,322,994 | | | | 311,156,180 | | | | 1,421,009,731 | |
| | | | | |
5 To remove the Dodge & Cox Income Fund’s fundamental investment restriction with respect to writing put or call options. | | | 967,689,290 | | | | 117,970,145 | | | | 24,194,116 | | | | 311,156,180 | | | | 1,421,009,731 | |
| | | | | |
6 To amend the Fund’s fundamental investment restriction with respect to underwriting securities of other issuers. | | | 1,029,220,531 | | | | 55,630,310 | | | | 25,002,710 | | | | 311,156,180 | | | | 1,421,009,731 | |
DODGE & COX INCOME FUND §PAGE 20
FUND HOLDINGS
The Fund provides a complete list of its holdings four times each fiscal year, as of the end of each quarter. The Fund files the lists with the Securities and Exchange Commission (SEC) on Form N-CSR (second and fourth quarters) and Form N-Q (first and third quarters). Shareholders may view the Fund’s Forms N-CSR and N-Q on the SEC’s website at www.sec.gov. Forms N-CSR and N-Q may also be reviewed and copied at the SEC’s Public Reference Room in Washington, DC. Information regarding the operations of the Public Reference Room may be obtained by calling 202-942-8090 (direct) or 800-732-0330 (general SEC number). A list of the Fund’s quarter-end holdings is also available at www.dodgeandcox.com on or about 15 days following each quarter end and remains available on the web site until the list is updated in the subsequent quarter.
PROXY VOTING
For a free copy of the Fund’s proxy voting policies and procedures, please call 800-621-3979, visit the Fund’s website at www.dodgeandcox.com, or visit the SEC’s website at www.sec.gov. Information regarding how the Fund voted proxies relating to portfolio securities during the most recent 12-month period ending June 30 is also available at www.dodgeandcox.com or at www.sec.gov.
HOUSEHOLD MAILINGS
The Fund routinely mails shareholder reports and summary prospectuses to shareholders and, on occasion, proxy statements. In order to reduce the volume of mail, when possible, only one copy of these documents will be sent to shareholders who are part of the same family and share the same residential address.
If you have a direct account with the Funds and you do not want the mailing of shareholder reports and summary prospectuses combined with other members in your household, contact the Funds at 800-621-3979. Your request will be implemented within 30 days.
PAGE 21 § DODGE & COX INCOME FUND
THIS PAGE INTENTIONALLY LEFT BLANK
DODGE & COX INCOME FUND §PAGE 22
TRUSTEES AND EXECUTIVE OFFICERS
Charles F. Pohl, Chairman and Trustee
Chairman and Chief Investment Officer, Dodge & Cox
Dana M. Emery, President and Trustee
Chief Executive Officer, President, and Director of Fixed Income, Dodge & Cox
Thomas A. Larsen, Independent Trustee
Senior Counsel, Arnold & Porter LLP
Ann Mather, Independent Trustee
Former Executive Vice President, Chief Financial Officer, and Company Secretary of Pixar Studios
Robert B. Morris III, Independent Trustee
Former Partner and Managing Director of Global Research at Goldman Sachs & Co.
Gary Roughead, Independent Trustee
Annenberg Distinguished Visiting Fellow, Hoover Institution
Mark E. Smith, Independent Trustee
Former Executive Vice President, Managing Director-Fixed Income at Loomis Sayles & Company, L.P.
John B. Taylor, Independent Trustee
Professor of Economics, Stanford University; Senior Fellow, Hoover Institute and former Under Secretary for International Affairs, United States Treasury
John A. Gunn, Senior Vice President
Former Chairman and Chief Executive Officer, Dodge & Cox
Diana S. Strandberg, Senior Vice President
Senior Vice President and Director of International Equity, Dodge & Cox
David H. Longhurst, Treasurer
Vice President and Assistant Treasurer, Dodge & Cox
Thomas M. Mistele, Secretary
Chief Operating Officer, Secretary, and Senior Counsel, Dodge & Cox
Katherine M. Primas, Chief Compliance Officer
Chief Compliance Officer, Dodge & Cox
Additional information about the Trust’s Trustees and Officers is available in the Trust’s Statement of Additional Information (SAI). You can get a free copy of the SAI by visiting the Funds’ website at www.dodgeandcox.com or calling 800-621-3979.
PAGE 23 § DODGE & COX INCOME FUND
| | | | |
| | | | |
www.dodgeandcox.com
For Fund literature, transactions, and account
information, please visit the Funds’ website.
or write or call:
DODGE & COX FUNDS
c/o Boston Financial Data Services
P.O. Box 8422
Boston, Massachusetts 02266-8422
(800) 621-3979
INVESTMENT MANAGER
Dodge & Cox
555 California Street, 40th Floor
San Francisco, California 94104
(415) 981-1710
This report is submitted for the general information of the shareholders of the Fund. The report is not authorized for distribution to prospective investors in the Fund unless it is accompanied by a current prospectus.
This report reflects our views, opinions, and portfolio holdings as of June 30, 2014, the end of the reporting period. Any such views are subject to change at any time based upon market or other conditions and Dodge & Cox disclaims any responsibility to update such views. These views may not be relied on as investment advice and, because investment decisions for a Dodge & Cox Fund are based on numerous factors, may not be relied on as an indication of trading intent on behalf of any Dodge & Cox Fund.
6/14 GBF SAR Printed on recycled paper
Semi-Annual Report
June 30, 2014
Global Bond Fund
ESTABLISHED 2014
TICKER: DODLX
TO OUR SHAREHOLDERS
Welcome to the Dodge & Cox Global Bond Fund: the sixth mutual fund Dodge & Cox has established since our firm’s founding in 1930. Our Global Bond strategy began as a private fund which commenced operations on December 5, 2012 and was reorganized into the Fund and opened to the public on May 1, 2014. We appreciate your confidence in our efforts.
For the first six months of 2014,(a) the Fund had a total return of 6.0%, compared to a return of 4.9% for the Barclays Global Aggregate Bond Index (the Index). Since the inception of the strategy in December 2012, the Fund has returned 5.6% compared to 0.9% for the Index. As of June 30, the Fund had net assets of $23.2 million with a cash position of 6.1%.
Why Invest in Global Bonds?
The global bond market, with outstanding debt of over $40 trillion, is the largest asset class in the world. Since economies, credit cycles, and interest rates do not all move in tandem, a global product gives us a broad range of permissible investments worldwide from which to select as valuations and/or fundamentals shift over time.
Furthermore, credit markets outside the United States have broadened and deepened substantially over the last decade, having grown from $2.3 trillion to $5.2 trillion.(b) For bottom-up managers such as Dodge & Cox, this creates a larger and more diverse investment universe compared to a decade ago, when global bond issuance was dominated by government bonds.
Capitalizing on our strong fundamental research capabilities, the Fund shares an emphasis on credit investments with the Dodge & Cox Income Fund. An additional feature of the Fund is its ability to seek returns via currency and non-U.S. rate investments. Investing in foreign currencies and rate products subjects the Fund to additional sources of volatility relative to funds that are invested only in U.S.-dollar denominated instruments.
INVESTMENT STRATEGY
The Global Bond Fund builds on the extensive investment experience that we have accumulated over decades of domestic and international investing. We employ the same consistent and disciplined investment
approach across the Dodge & Cox Funds, with a focus on fundamental research, individual security selection, and valuation. We rely on a team decision-making process, utilizing a three- to five-year investment horizon.
The Fund’s objective is to seek a high rate of total return consistent with long-term preservation of capital. In doing so, we look for attractive long-term investment opportunities in credit, interest rate, and currency markets across the globe. The Fund is managed by the Global Bond Investment Policy Committee, whose six members have an average tenure at Dodge & Cox of 19 years. Our large and integrated team develops investment ideas for the Fund. Our global industry analysts conduct research on behalf of all the firm’s strategies, and our fixed income analysts focus on downside analysis and relative value assessment. This in-depth, research-based process is applied across corporate, government-related, and sovereign issuers.
We have constructed a Fund portfolio with an emphasis on corporate bonds (51% versus 17% for the Index) and a defensive positioning with respect to interest rates (duration(c) of 3.7 years versus 6.4 for the Index). The Fund also has a large U.S. dollar weighting (64% versus 41% for the Index) and exposure to emerging market currencies (19% versus 3% for the Index). The Fund is invested in 58 issuers from 16 countries, with exposure to all major sectors of the bond market.
Opportunities in Global Credit
The Fund’s overweight position in the credit sector, including investments in corporate (51% of Fund) and government-related (8% of Fund) issuers, has been a significant contributor to absolute and relative returns since inception. While corporate yield premiums have declined meaningfully in recent years, we believe they remain attractive relative to government securities in most developed markets. Furthermore, corporate profitability is generally strong, with healthy balance sheets among investment-grade corporate issuers and continued improvement in the asset quality and capitalization of the financial sector. While the Fund’s overall credit weighting remained constant in the first half of 2014, we reduced the Fund’s exposure to peripheral European credits and increased the Fund’s emerging market credit exposure.
PAGE 1 § DODGE & COX GLOBAL BOND FUND
Within peripheral Europe, the Fund’s holdings in credits from Italy and Spain have been strong contributors to performance over the last year. The highly accommodative stance of the European Central Bank and improving macroeconomic fundamentals, particularly in Spain, have reduced the risk profile of these holdings. Current valuations reflect much of this improvement, thus we have scaled back our positions in this area from 9% to 6%. Fund holdings in the periphery include a regional government in Spain (the Region of Madrid), the incumbent telecommunications provider in Italy (Telecom Italia), and an Italian utility with Spanish and Latin American subsidiaries (Enel). We believe these holdings continue to provide attractive total return potential with positive fundamentals.
Meanwhile, as credit valuations in Western Europe have risen, emerging market valuations have become more attractive. We have recently initiated or added to a number of emerging market credits with both strong fundamentals and compelling valuations. Two recent examples are Pemex and Rio Oil Finance Trust.(d)
Currency Positioning: Another Source of Potential Return
Currency positioning is an important element of the Fund’s strategy. We make active currency decisions for the Fund’s portfolio and hedge our currency risk as we deem appropriate. Currencies we find attractive possess one or more of the following characteristics: undervaluation based on purchasing power parity or other fair value estimates; strong medium- to long-term fundamentals; and high real yields. In addition, we seek investments where our interests are aligned with those of policymakers (e.g., a weak currency is not consistent with policy objectives). Year to date and since inception, the Fund’s currency positioning has added to returns.
Among the G3(e) currencies, we are significantly overweight the U.S. dollar in the Fund. Currently 64% of the Fund is denominated in U.S. dollars and 6% in euros, with no exposure to the Japanese yen. In our opinion, the U.S. dollar is attractive relative to other major currencies for a number of reasons. First, the U.S. economy appears stronger than Europe and Japan from the standpoint of GDP growth and inflation measures, making U.S. interest rates likely to rise faster than rates in Europe and Japan.
Second, the valuation of the U.S. dollar is attractive. In addition, policymakers in both Japan and Europe have strong incentives to weaken their currency. In Japan, a weaker currency is likely needed to achieve the growth and inflation goals of Prime Minister Abe. In Europe, a weaker euro could help raise inflation and encourage economic growth needed to reduce heavy debt burdens in peripheral Europe. Finally, the U.S. dollar’s status as a global reserve currency could limit its downside when risk aversion increases.
While few developed market currencies look attractive relative to the U.S. dollar, we believe several emerging market currencies offer good value. Emerging market currencies, particularly those of countries with large current account deficits, underperformed in the fourth quarter of 2013 and January 2014, but have generally rebounded and performed well for the six months ended June 30.
The Fund’s largest emerging market currency exposure is the Mexican peso (5% of Fund). We believe the Mexican peso is attractively valued, offers favorable interest rates (10-year yields are 5.7% versus 2.5% in the United States), and is likely to benefit from both cyclical and structural tailwinds. Notably, Mexico’s manufacturing sector is well positioned in terms of international competitiveness and is levered to U.S. economic growth. Longer term, proposed energy reforms could lead to higher foreign direct investment, greater oil production, and lower domestic energy prices, all of which should support economic growth, productivity, and the strength of the peso.
Defensive Interest Rate Positioning
In determining the Fund’s duration positioning, we consider interest rate risk on a country-specific basis and analyze how the Fund’s holdings would perform across a range of economic scenarios. Nominal and real rates across the globe remain quite low, driven by accommodative monetary policies at the major central banks and slowing growth rates. While the magnitude and timing of interest rate normalization remains uncertain, we believe that global interest rates are likely to rise more than consensus expectations (i.e., the forward curve) over our investment horizon. Thus, the Fund is positioned defensively with respect to interest rate risk. The Fund’s
DODGE & COX GLOBAL BOND FUND §PAGE 2
duration is 3.7 years versus an Index duration of 6.4 years (3.6 years versus 5.6 years in the United States). We utilize both U.S. Treasury futures and centrally cleared interest rate swaps to efficiently implement our interest rate views.
IN CLOSING
We believe that the global bond universe offers many attractive investment opportunities and that our investment approach—based on a three- to five-year investment horizon, a rigorous fundamental research process framework, and an emphasis on valuation—will benefit the Fund over the long-term.
Thank you for your continued confidence in our firm. As always, we welcome your comments and questions.
For the Board of Trustees,
| | |
| |
|
Charles F. Pohl, Chairman | | Dana M. Emery, President |
July 29, 2014
| (a) | Prior to the Fund’s opening on May 1, 2014, Dodge & Cox managed a private fund with an investment objective, policies, and strategies that were, in all material respects, the same as those of the Fund. The performance figures and characteristics described in this report for periods prior to May 1, 2014 are those of the private fund. |
| (b) | Represents non-U.S. denominated debt outstanding. |
| (c) | Duration is a measure of a bond’s (or a bond portfolio’s) price sensitivity to changes in interest rates. |
| (d) | The use of specific examples does not imply that they are more attractive investments than the Fund’s other holdings. |
| (e) | G3 currencies are the U.S. dollar, the euro, and the Japanese yen. |
PAGE 3 § DODGE & COX GLOBAL BOND FUND
YEAR-TO-DATE PERFORMANCE REVIEW
The Fund outperformed the Barclays Global Aggregate Bond Index (Barclays Global Aggregate) by 1.1 percentage points year to date.
Key Contributors to Relative Results
| | § | | The Fund’s large overweight to corporate bonds (54% versus 17% for the Barclays Global Aggregate*) and an underweight position in U.S. Treasuries (0% versus 14%) contributed strongly to relative returns. | |
| | § | | Security selection was strong as many of the Fund’s credit holdings performed well, including Time Warner Cable, Enel, Autonomous Community of Madrid, Cemex, and Telecom Italia. | |
| | § | | The Fund’s currency positioning was a slight positive contributor to relative returns, particularly due to the Fund’s holdings of Brazilian government bonds denominated in reais. | |
Key Detractors from Relative Results
| | § | | The Fund’s significant underweight in the Japanese yen (0% versus 16%) detracted notably from relative returns as the yen appreciated by almost 4%. | |
| | § | | The Fund’s shorter relative duration in most markets detracted from returns as yields generally declined. | |
| | * | | Unless otherwise noted, figures cited in this section denote Fund positioning at the beginning of the period. | |
KEY CHARACTERISTICS OF DODGE & COX
Independent Organization
Dodge & Cox is one of the largest privately owned investment managers in the world. We remain committed to independence, with a goal of providing the highest quality investment management service to our existing clients.
Over 80 Years of Investment Experience
Dodge & Cox was founded in 1930. We have a stable and well-qualified team of investment professionals, most of whom have spent their entire careers at Dodge & Cox.
Experienced Investment Team
The Global Bond Investment Policy Committee, which is the decision-making body for the Global Bond Fund, is a six-member committee with an average tenure at Dodge & Cox of 19 years.
One Business with a Single Research Office
Dodge & Cox manages equity (domestic, international, and global), fixed income (domestic and global), and balanced investments, operating from one office in San Francisco.
Consistent Investment Approach
Our team decision-making process involves thorough, bottom-up fundamental analysis of each investment.
Long-Term Focus and Low Expenses
We invest with a three- to five-year investment horizon, which has historically resulted in low turnover relative to our peers. We manage Funds that maintain low expense ratios.
Risks: The Fund invests in debt securities whose yields and market values fluctuate, so that an investment may be worth more or less than its original cost. Debt securities are subject to interest rate risk, credit risk, and prepayment risk, all of which could have adverse effects on the value of the Fund. A low interest rate environment creates an elevated risk of future negative returns. Financial intermediaries may restrict their market making activities for certain debt securities, which may reduce the liquidity and increase the volatility of such securities. Investing in non-U.S. securities may entail risk due to foreign economic and political developments; this risk may be increased when investing in emerging markets. The Fund is also subject to currency risk. Please read the prospectus and summary prospectus for specific details regarding the Fund’s risk profile.
DODGE & COX GLOBAL BOND FUND §PAGE 4
GROWTH OF $10,000 SINCE INCEPTION
FOR AN INVESTMENT MADE ON DECEMBER 5, 2012
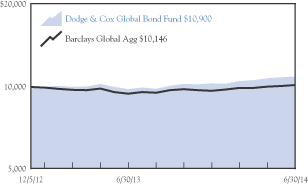
AVERAGE ANNUAL TOTAL RETURN
FOR PERIODS ENDED JUNE 30, 2014
| | | | | | | | |
| | | 1 Year | | | Since
Inception
(12/5/12) | |
| | | | | | | | |
Dodge & Cox Global Bond Fund | | | 11.34 | % | | | 5.64 | % |
Barclays Global Aggregate Bond Index
(Barclays Global Agg) | | | 7.39 | | | | 0.93 | |
Returns represent past performance and do not guarantee future results. Investment return and share price will fluctuate with market conditions, and investors may have a gain or loss when shares are sold. Fund performance changes over time and currently may be significantly lower than stated. Performance is updated and published monthly. Visit the Fund’s website at www.dodgeandcox.com or call 800-621-3979 for current performance figures.
A private fund managed and funded by Dodge & Cox (the “Private Fund”) was reorganized into the Fund and the Fund commenced operations on May 1, 2014. The Private Fund commenced operations on December 5, 2012 and had an investment objective, policies, and strategies that were, in all material respects, the same as those of the Fund, and was managed in a manner that, in all material respects, complied with the investment guidelines and restrictions of the Fund. However, the Private Fund was not registered as an investment company under the Investment Company Act of 1940 (the “1940 Act”), and therefore was not subject to certain investment limitations, diversification requirements, liquidity requirements, and other restrictions imposed by the 1940 Act and the Internal Revenue Code, which, if applicable, may have adversely affected its performance.
The Fund’s total returns include the reinvestment of dividend and capital gain distributions, but have not been adjusted for any income taxes payable by shareholders on these distributions or on Fund share redemptions. Index returns include interest income but, unlike Fund returns, do not reflect fees or expenses. The Barclays Global Aggregate Bond Index (Barclays Global Agg) is a widely recognized, unmanaged index of multi-currency investment-grade, debt securities.
Barclays® is a trademark of Barclays Bank PLC.
PAGE 5 § DODGE & COX GLOBAL BOND FUND
FUND EXPENSE EXAMPLE
As a Fund shareholder, you incur ongoing Fund costs, including management fees and other Fund expenses. All mutual funds have ongoing costs, sometimes referred to as operating expenses. The following example shows ongoing costs of investing in the Fund and can help you understand these costs and compare them with those of other mutual funds. The example assumes a $1,000 investment held for the period from May 1, 2014 (inception) to June 30, 2014.
ACTUAL EXPENSES
The first line of the table below provides information about actual account values and expenses based on the Fund’s actual returns. You may use the information in this line, together with your account balance, to estimate the expenses that you paid over the period. Simply divide your account value by $1,000 (for example, an $8,600 account value divided by $1,000 = 8.6), then multiply the result by the number in the first line under the heading “Expenses Paid During Period” to estimate the expenses you paid on your account during this period.
HYPOTHETICAL EXAMPLE FOR COMPARISON WITH OTHER MUTUAL FUNDS
Information on the second line of the table can help you compare ongoing costs of investing in the Fund with those of other mutual funds. This information may not be used to estimate the actual ending account balance or expenses you paid during the period. The hypothetical “Ending Account Value” is based on the actual expense ratio of the Fund and an assumed 5% annual rate of return before expenses (not the Fund’s actual return). The amount under the heading “Expense Paid During the Period” shows the hypothetical expenses your account would have incurred under this scenario. You can compare this figure with the 5% hypothetical examples that appear in shareholder reports of other mutual funds.
| | | | | | | | | | | | |
Two Months Ended June 30, 2014 | | Beginning Account Value
5/1/2014 | | | Ending Account Value
6/30/2014 | | | Expenses Paid
During Period* | |
Based on Actual Fund Return | | $ | 1,000.00 | | | $ | 1,015.90 | | | $ | 1.01 | |
Based on Hypothetical 5% Yearly Return | | | 1,000.00 | | | | 1,007.35 | | | | 1.01 | |
| * | | Expenses are equal to the Fund’s annualized expense ratio of 0.60%, multiplied by the average account value over the period, multiplied by 61 days of the period (from 5/1/14, inception, to 6/30/14) and divided by 365 days of the fiscal year. |
The expenses shown in the table highlight ongoing costs only and do not reflect any transactional fees or account maintenance fees. Though other mutual funds may charge such fees, please note that the Fund does not charge transaction fees (e.g., redemption fees, sales loads) or universal account maintenance fees (e.g., small account fees).
DODGE & COX GLOBAL BOND FUND §PAGE 6
| | | | |
| FUND INFORMATION | | | June 30, 2014 | |
| | | | |
| GENERAL INFORMATION | | | |
Net Asset Value Per Share | | | $10.87 | |
Total Net Assets (millions) | | | $23.2 | |
30-Day SEC Yield(a) | | | 2.78% | |
Gross Expense Ratio
(5/1/14 to 6/30/14, annualized) | | | 3.58% | |
Net Expense Ratio(b) | | | 0.60% | |
Portfolio Turnover Rate
(5/1/14 to 6/30/14, unannualized) | | | 13% | |
Fund Inception | | | May 1, 2014 | |
No sales charges or distribution fees | | | | |
Investment Manager: Dodge & Cox, San Francisco. Managed by the Global Bond Investment Policy Committee, whose six members’ average tenure at Dodge & Cox is 19 years.
| | | | | | | | |
| PORTFOLIO CHARACTERISTICS | | Fund | | | Barclays Global Agg | |
Number of Debt Securities | | | 85 | | | | 16,051 | |
Effective Duration (years) | | | 3.7 | | | | 6.4 | |
Emerging Markets(c) | | | 26.5% | | | | 5.4% | |
| | | | |
| FIVE LARGEST CORPORATE ISSUERS(d) | | Fund | |
Telecom Italia SPA | | | 2.2 | % |
General Electric Co. | | | 2.1 | |
Cemex SAB de CV | | | 2.1 | |
Millicom International Cellular SA | | | 2.1 | |
Enel SPA | | | 1.9 | |
| | | | | | | | |
| CREDIT QUALITY(e)(f) | | Fund | | | Barclays Global Agg | |
Aaa | | | 15.3 | % | | | 40.0 | % |
Aa | | | 2.8 | | | | 32.8 | |
A | | | 22.5 | | | | 10.8 | |
Baa | | | 40.5 | | | | 16.4 | |
Ba | | | 9.5 | | | | 0.0 | |
B | | | 3.3 | | | | 0.0 | |
Cash Equivalents | | | 6.1 | | | | 0.0 | |
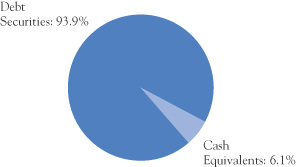
| | | | | | | | |
| SECTOR DIVERSIFICATION(f) | | Fund | | | Barclays Global Agg | |
Government | | | 22.5 | % | | | 54.0 | % |
Government-Related | | | 7.5 | | | | 13.7 | |
Securitized | | | 12.5 | | | | 15.2 | |
Corporate | | | 51.4 | | | | 17.1 | |
Cash Equivalents | | | 6.1 | | | | 0.0 | |
| | | | | | | | |
| REGION DIVERSIFICATION(c)(f) | | Fund | | | Barclays Global Agg | |
United States | | | 44.1 | % | | | 34.7 | % |
Latin America | | | 16.4 | | | | 1.4 | |
Europe (excluding United Kingdom) | | | 15.1 | | | | 29.3 | |
United Kingdom | | | 8.4 | | | | 6.4 | |
Pacific (excluding Japan) | | | 4.9 | | | | 4.6 | |
Africa/Middle East | | | 3.3 | | | | 0.9 | |
Canada | | | 1.7 | | | | 3.4 | |
Japan | | | 0.0 | | | | 16.8 | |
Other | | | 0.0 | | | | 2.5 | |
| (a) | SEC Yield is an annualization of the Fund’s total net investment income per share for the 30-day period ended on the last day of the month. |
| (b) | For the fiscal periods ending December 31, 2014 and 2015, Dodge & Cox has contractually agreed to reimburse the Fund for all ordinary expenses to the extent necessary to maintain Total Annual Fund Operating Expenses at 0.60%. The agreement is renewable annually thereafter and is subject to termination upon 30 days’ written notice by either party. |
| (c) | The Fund may classify an issuer in a different category than the Barclays Global Aggregate Bond Index. The Fund generally classifies a corporate issuer based on the country of incorporation of the parent company, but may designate a different country in certain circumstances. |
| (d) | The Fund’s portfolio holdings are subject to change without notice. The mention of specific securities is not a recommendation to buy, sell, or hold any particular security and is not indicative of Dodge & Cox’s current or future trading activity. |
| (e) | The credit quality distributions shown for the Fund and the Index are based on the middle of Moody’s, Standard & Poor’s, and Fitch ratings, which is the methodology used by Barclays in constructing its indices. If a security is rated by only two agencies, the lower of the two ratings is used. Please note the Fund applies the highest of Moody’s, Standard & Poor’s, and Fitch ratings to comply with the quality requirements stated in its prospectus. On that basis, the Fund held 9.3% in securities rated below investment grade. The credit quality of the investments in the portfolio does not apply to the stability or safety of the Fund or its shares. |
| (f) | Excludes the effect of the Fund’s derivative contracts. |
PAGE 7 § DODGE & COX GLOBAL BOND FUND
| | | | |
| PORTFOLIO OF INVESTMENTS (unaudited) | | | June 30, 2014 | |
| | | | | | | | | | | | |
| DEBT SECURITIES: 93.9% | |
| | | |
| | | | | | PAR VALUE | | | VALUE | |
| GOVERNMENT: 22.5% | | | | | | | | | | | | |
Brazil Government (Brazil) | | | | | | | | | | | | |
Series B, 6.00%, 8/15/20(a) | | | BRL | | | | 375,000 | | | $ | 418,684 | |
Series F, 10.00%, 1/1/21 | | | BRL | | | | 950,000 | | | | 392,869 | |
Chile Government GDN (Chile) 6.00%, 1/1/18(d) | | | CLP | | | | 120,000,000 | | | | 228,428 | |
Colombia Government (Colombia)
9.85%, 6/28/27 | | | COP | | | | 300,000,000 | | | | 209,193 | |
Malaysia Government (Malaysia)
3.172%, 7/15/16 | | | MYR | | | | 2,250,000 | | | | 699,052 | |
Mexico Government (Mexico) | | | | | | | | | | | | |
7.25%, 12/15/16 | | | MXN | | | | 8,340,000 | | | | 696,757 | |
8.00%, 12/7/23 | | | MXN | | | | 4,950,000 | | | | 445,757 | |
Poland Government (Poland)
5.25%, 10/25/17 | | | PLN | | | | 1,225,000 | | | | 435,400 | |
South Africa Government (South Africa)
13.50%, 9/15/15 | | | ZAR | | | | 3,500,000 | | | | 354,324 | |
South Korea Government (South Korea)
4.50%, 3/10/15 | | | KRW | | | | 425,000,000 | | | | 425,428 | |
U.S. Treasury Note (United States) | | | | | | | | | | | | |
0.375%, 5/31/16 | | | USD | | | | 350,000 | | | | 349,658 | |
0.625%, 10/15/16 | | | USD | | | | 550,000 | | | | 550,516 | |
| | | | | | | | | | | | |
| | | | | | | | | | | 5,206,066 | |
| GOVERNMENT-RELATED: 7.5% | | | | | | | | | |
Autonomous Community of Madrid Spain (Spain)
4.30%, 9/15/26 | | | EUR | | | | 235,000 | | | | 347,339 | |
Chicago Transit Authority RB (United States) | | | | | | | | | | | | |
6.20%, 12/1/40 | | | USD | | | | 50,000 | | | | 57,429 | |
6.899%, 12/1/40 | | | USD | | | | 350,000 | | | | 436,785 | |
Petroleo Brasileiro SA (Brazil) 7.25%, 3/17/44 | | | USD | | | | 150,000 | | | | 165,375 | |
Petroleos Mexicanos (Mexico) 6.375%, 1/23/45(d) | | | USD | | | | 200,000 | | | | 232,250 | |
State of California GO (United States) | | | | | | | | | | | | |
6.20%, 10/1/19 | | | USD | | | | 125,000 | | | | 149,920 | |
7.55%, 4/1/39 | | | USD | | | | 100,000 | | | | 150,332 | |
State of Illinois GO (United States)
5.665%, 3/1/18 | | | USD | | | | 175,000 | | | �� | 195,361 | |
| | | | | | | | | | | | |
| | | | | | | | | | | 1,734,791 | |
| SECURITIZED: 12.5% | | | | | | | | | | | | |
Chase Issuance Trust (United States) | | | | | | | | | | | | |
Series 2013-A8 A8, 1.01%, 10/15/18 | | | USD | | | | 200,000 | | | | 200,598 | |
Series 2007-A3 A3, 5.23%, 4/15/19 | | | USD | | | | 419,000 | | | | 463,226 | |
Fannie Mae, 15 Year (United States)
5.00%, 7/1/25 | | | USD | | | | 56,093 | | | | 60,178 | |
Fannie Mae, 20 Year (United States) | | | | | | | | | | | | |
4.00%, 8/1/31 | | | USD | | | | 176,165 | | | | 189,429 | |
4.00%, 2/1/32 | | | USD | | | | 258,609 | | | | 279,314 | |
| | | | | | | | | | | | |
| | | |
| | | | | | PAR VALUE | | | VALUE | |
Fannie Mae, 30 Year (United States)
6.00%, 5/1/37 | | | USD | | | | 182,866 | | | $ | 200,280 | |
Freddie Mac (United States) Series 4283 EW, 6.462%, 12/15/43 | | | USD | | | | 241,632 | | | | 267,673 | |
Freddie Mac Gold, 30 Year (United States) | | | | | | | | | | | | |
6.00%, 2/1/35 | | | USD | | | | 176,171 | | | | 200,416 | |
6.00%, 11/1/39 | | | USD | | | | 101,874 | | | | 114,419 | |
Rio Oil Finance Trust (Brazil) Series 2014-1, 6.25%, 7/6/24(d) | | | USD | | | | 250,000 | | | | 262,473 | |
Svenska Handelsbanken AB (Sweden)
6.00%, 9/21/16(b) | | | SEK | | | | 4,000,000 | | | | 665,793 | |
| | | | | | | | | | | | |
| | | | | | | | | | | 2,903,799 | |
| CORPORATE: 51.4% | | | | | | | | | | | | |
FINANCIALS: 15.9% | | | | | | | | | | | | |
Bank of America Corp. (United States) | | | | | | | | | | | | |
6.125%, 9/15/21 | | | GBP | | | | 100,000 | | | | 199,992 | |
6.625%, 5/23/36(c) | | | USD | | | | 175,000 | | | | 197,671 | |
Boston Properties, Inc. (United States)
5.625%, 11/15/20 | | | USD | | | | 175,000 | | | | 201,322 | |
Citigroup, Inc. (United States)
7.875%, 10/30/40(c) | | | USD | | | | 175,000 | | | | 193,340 | |
Equity Residential (United States)
4.75%, 7/15/20 | | | USD | | | | 200,000 | | | | 223,253 | |
General Electric Co. (United States) | | | | | | | | | | | | |
4.55%, 1/17/17 | | | CAD | | | | 200,000 | | | | 200,171 | |
5.50%, 6/7/21 | | | GBP | | | | 150,000 | | | | 292,647 | |
HSBC Holdings PLC (United Kingdom)
6.50%, 9/15/37 | | | USD | | | | 325,000 | | | | 400,154 | |
JPMorgan Chase & Co. (United States)
3.375%, 5/1/23 | | | USD | | | | 200,000 | | | | 196,197 | |
Legg Mason, Inc. (United States)
5.50%, 5/21/19 | | | USD | | | | 100,000 | | | | 115,557 | |
Lloyds Banking Group PLC (United Kingdom)
6.50%, 3/24/20 | | | EUR | | | | 175,000 | | | | 291,216 | |
Navient Corp. (United States)
6.00%, 1/25/17 | | | USD | | | | 220,000 | | | | 238,975 | |
Royal Bank of Scotland Group PLC (United Kingdom) | | | | | | | | | | | | |
6.934%, 4/9/18 | | | EUR | | | | 100,000 | | | | 158,492 | |
5.625%, 8/24/20 | | | USD | | | | 125,000 | | | | 143,212 | |
6.125%, 12/15/22 | | | USD | | | | 100,000 | | | | 109,321 | |
WellPoint, Inc. (United States)
7.00%, 2/15/19 | | | USD | | | | 175,000 | | | | 211,076 | |
Wells Fargo & Co. (United States)
2.774%, 2/9/17 | �� | | CAD | | | | 325,000 | | | | 311,669 | |
| | | | | | | | | | | | |
| | | | | | | | | | | 3,684,265 | |
| | |
| See accompanying Notes to Financial Statements | | DODGE & COX GLOBAL BOND FUND §PAGE 8 |
| | | | |
| PORTFOLIO OF INVESTMENTS (unaudited) | | | June 30, 2014 | |
| | | | | | | | | | | | |
| DEBT SECURITIES (continued) | | | | |
| | | |
| | | | | | PAR VALUE | | | VALUE | |
INDUSTRIALS: 35.5% | | | | | | | | | | | | |
AT&T, Inc. (United States)
5.875%, 4/28/17 | | | GBP | | | | 100,000 | | | $ | 188,625 | |
Boston Scientific Corp. (United States)
6.00%, 1/15/20 | | | USD | | | | 125,000 | | | | 145,290 | |
Canadian Pacific Railway, Ltd. (Canada)
6.25%, 6/1/18 | | | CAD | | | | 375,000 | | | | 404,211 | |
Cemex SAB de CV (Mexico) 7.25%, 1/15/21(d) | | | USD | | | | 450,000 | | | | 492,750 | |
Compagnie de Saint-Gobain SA (France)
3.625%, 3/28/22 | | | EUR | | | | 200,000 | | | | 311,095 | |
Cox Enterprises, Inc. (United States) | | | | | | | | | | | | |
3.25%, 12/15/22(d) | | | USD | | | | 165,000 | | | | 161,492 | |
2.95%, 6/30/23(d) | | | USD | | | | 200,000 | | | | 189,746 | |
Dow Chemical Co. (United States) | | | | | | | | | | | | |
8.55%, 5/15/19 | | | USD | | | | 75,000 | | | | 96,389 | |
3.00%, 11/15/22 | | | USD | | | | 150,000 | | | | 147,450 | |
Enel SPA (Italy)
6.80%, 9/15/37(d) | | | USD | | | | 350,000 | | | | 426,493 | |
Ford Motor Credit Co. LLC(e) (United States)
8.125%, 1/15/20 | | | USD | | | | 250,000 | | | | 319,150 | |
Grupo Televisa SAB (Mexico) 8.50%, 3/11/32 | | | USD | | | | 175,000 | | | | 242,235 | |
HCA Holdings, Inc. (United States)
6.50%, 2/15/16 | | | USD | | | | 250,000 | | | | 269,063 | |
Hewlett-Packard Co. (United States) | | | | | | | | | | | | |
2.65%, 6/1/16 | | | USD | | | | 150,000 | | | | 154,830 | |
2.60%, 9/15/17 | | | USD | | | | 75,000 | | | | 77,503 | |
Imperial Tobacco Group PLC (United Kingdom)
7.75%, 6/24/19 | | | GBP | | | | 200,000 | | | | 414,685 | |
Lafarge SA (France)
5.875%, 7/9/19 | | | EUR | | | | 200,000 | | | | 322,470 | |
Macy’s, Inc. (United States) | | | | | | | | | | | | |
6.70%, 9/15/28 | | | USD | | | | 50,000 | | | | 60,311 | |
6.90%, 4/1/29 | | | USD | | | | 75,000 | | | | 93,746 | |
6.375%, 3/15/37 | | | USD | | | | 175,000 | | | | 217,293 | |
Millicom International Cellular SA (Luxembourg)
6.625%, 10/15/21(d) | | | USD | | | | 450,000 | | | | 483,750 | |
Naspers, Ltd. (South Africa) 6.00%, 7/18/20(d) | | | USD | | | | 375,000 | | | | 413,438 | |
Reed Elsevier PLC (United Kingdom) | | | | | | | | | | | | |
5.625%, 10/20/16 | | | GBP | | | | 100,000 | | | | 185,271 | |
3.125%, 10/15/22 | | | USD | | | | 244,000 | | | | 240,515 | |
Telecom Italia SPA (Italy) | | | | | | | | | | | | |
6.375%, 6/24/19 | | | GBP | | | | 150,000 | | | | 279,372 | |
7.721%, 6/4/38 | | | USD | | | | 200,000 | | | | 230,500 | |
| | | | | | | | | | | | |
| | | |
| | | | | | PAR VALUE | | | VALUE | |
Time Warner Cable, Inc. (United States) | | | | | | | | | | | | |
8.75%, 2/14/19 | | | USD | | | | 175,000 | | | $ | 223,798 | |
6.75%, 6/15/39 | | | USD | | | | 100,000 | | | | 128,684 | |
Time Warner, Inc. (United States) | | | | | | | | | | | | |
7.625%, 4/15/31 | | | USD | | | | 50,000 | | | | 68,619 | |
7.70%, 5/1/32 | | | USD | | | | 200,000 | | | | 277,386 | |
Twenty-First Century Fox, Inc. (United States) | | | | | | | | | | | | |
6.15%, 3/1/37 | | | USD | | | | 75,000 | | | | 90,046 | |
6.65%, 11/15/37 | | | USD | | | | 200,000 | | | | 253,905 | |
Verizon Communications, Inc. (United States) | | | | | | | | | | | | |
5.15%, 9/15/23 | | | USD | | | | 100,000 | | | | 111,850 | |
6.55%, 9/15/43 | | | USD | | | | 100,000 | | | | 125,637 | |
Vulcan Materials Co. (United States)
7.50%, 6/15/21 | | | USD | | | | 125,000 | | | | 147,969 | |
Xerox Corp. (United States) 4.50%, 5/15/21 | | | USD | | | | 200,000 | | | | 215,994 | |
| | | | | | | | | | | | |
| | | | | | | | | | | 8,211,561 | |
| | | | | | | | | | | | |
| | | | | | | | | | | 11,895,826 | |
| | | | | | | | | | | | |
TOTAL DEBT SECURITIES
(Cost $21,520,614) | | | $ | 21,740,482 | |
| | |
| PAGE 9 § DODGE & COX GLOBAL BOND FUND | | See accompanying Notes to Financial Statements |
| | | | |
| PORTFOLIO OF INVESTMENTS (unaudited) | | | June 30, 2014 | |
| | | | | | | | | | | | |
| SHORT-TERM INVESTMENTS: 8.8% | |
| | | |
| | | | | | PAR VALUE | | | VALUE | |
MONEY MARKET FUND: 0.2% | | | | | | | | | |
SSgA U.S. Treasury Money Market Fund | | | USD | | | | 45,141 | | | $ | 45,141 | |
| | |
REPURCHASE AGREEMENT: 8.6% | | | | | | | | | |
Fixed Income Clearing Corporation(f) 0.00%, dated 6/30/14, due 7/1/14, maturity value $2,001,907 | | | USD | | | | 2,001,907 | | | | 2,001,907 | |
| | | | | | | | | | | | |
TOTAL SHORT-TERM INVESTMENTS
(Cost $2,047,048) | | | $ | 2,047,048 | |
| | | | | | | | | | | | |
TOTAL INVESTMENTS
(Cost $23,567,662) | | | | 102.7 | % | | $ | 23,787,530 | |
OTHER ASSETS LESS LIABILITIES | | | | (2.7 | %) | | | (623,929 | ) |
| | | | | | | | | | | | |
| NET ASSETS | | | | | | | 100.0 | % | | $ | 23,163,601 | |
| | | | | | | | | | | | |
| (c) | Cumulative preferred security |
| (d) | Security exempt from registration under Rule 144A of the Securities Act of 1933. The security may be resold in transactions exempt from registration, normally to Qualified Institutional Buyers. As of June 30, 2014, all such securities in total represented $2,890,820 or 12.5% of total net assets. These securities have been deemed liquid by Dodge & Cox, investment manager, pursuant to procedures approved by the Fund’s Board of Trustees. |
| (e) | Subsidiary (see below) |
| (f) | Repurchase agreement is collateralized by U.S. Treasury Bill 0.00%, 7/24/2014. Total collateral value is $2,043,978. |
Debt securities are grouped by parent company unless otherwise noted. Actual securities may be issued by the listed parent company or one of its subsidiaries.
GDN: Global Depositary Note
GO: General Obligation
RB: Revenue Bond
Currency Abbreviations:
BRL: Brazilian Real
CAD: Canadian Dollar
CLP: Chilean Peso
COP: Colombian Peso
EUR: Euro
GBP: British Pound
KRW: South Korean Won
MXN: Mexican Peso
MYR: Malaysian Ringgit
PLN: Polish Zloty
RUB: Russian Ruble
SEK: Swedish Krona
USD: United States Dollar
ZAR: South African Rand
FUTURES CONTRACTS
| | | | | | | | | | | | | | | | |
| Description | | Number of
Contracts | | | Expiration
Date | | | Notional
Amount | | | Unrealized
Depreciation | |
10 Year U.S. Treasury Note - Short Position | | | 3 | | | | Sep 2014 | | | $ | (375,516 | ) | | $ | (2,662 | ) |
Long-Term U.S. Treasury Bond - Short Position | | | 9 | | | | Sep 2014 | | | | (1,349,438 | ) | | | (14,525 | ) |
| | | | | | | | | | | | | | | | |
| | | | | | | | | | | | | | $ | (17,187 | ) |
| | | | | | | | | | | | | | | | |
| | | | | | | | | | | | | | | | | |
CENTRALLY-CLEARED INTEREST RATE SWAPS
| | | | | | | | | | | | | | | | |
| | | | | | Contract Amount | | | | |
| Notional Amount | | Expiration
Date | | | Fixed
Rate | | | Floating
Rate | | | Unrealized
Depreciation | |
Receive Floating/Pay Fixed: | | | | | | | | | |
$ 825,000 | | | 5/6/24 | | | | 2.72% | | |
| USD LIBOR
3-Month |
| | $ | (13,043 | ) |
| | | | | | | | | | | | | | | | | |
FORWARD CURRENCY CONTRACTS
| | | | | | | | | | | | | | | | |
| | | | | | Contract Amount | | | | |
| Counterparty | | Settlement
Date | | | Receive
U.S.
Dollar | | | Deliver
Foreign
Currency | | | Unrealized
Appreciation | |
Contracts to sell EUR: | | | | | | | | | | | | | | | | |
Barclays | | | 7/23/14 | | | | 312,099 | | | | 225,000 | | | $ | 3,982 | |
| | | | | | | | | | | | | | | | | |
| | | |
| | | | | | Contract Amount | | | | |
| Counterparty | | Settlement
Date | | | Deliver
U.S.
Dollar | | | Receive
Foreign
Currency | | | Unrealized
Appreciation/
(Depreciation) | |
Contracts to buy EUR: | | | | | | | | | | | | | | | | |
Barclays | | | 7/23/14 | | | | 312,099 | | | | 225,000 | | | $ | (3,982 | ) |
Contracts to buy RUB: | | | | | | | | | | | | | | | | |
Barclays | | | 11/5/14 | | | | 188,571 | | | | 6,800,000 | | | | 5,861 | |
| | | | | | | | | | | | | | | | |
| | | | | | | | | | | | | | $ | 1,879 | |
| | | | | | | | | | | | | | | | |
| | | | | | | | | | | | | | | | | |
| | |
| See accompanying Notes to Financial Statements | | DODGE & COX GLOBAL BOND FUND §PAGE 10 |
| | | | |
STATEMENT OF ASSETS AND LIABILITIES (unaudited) | |
| | | June 30, 2014 | |
ASSETS: | | | | |
Investments, at value (cost $23,567,662) | | $ | 23,787,530 | |
Cash denominated in foreign currency (cost $2,170) | | | 2,182 | |
Cash held at broker | | | 53,282 | |
Unrealized appreciation on forward currency contracts | | | 9,844 | |
Receivable for Fund shares sold | | | 422,199 | |
Dividends and interest receivable | | | 323,032 | |
Expense reimbursement receivable | | | 67,070 | |
| | | | |
| | | 24,665,139 | |
| | | | |
LIABILITIES: | | | | |
Payable for investments purchased | | | 1,428,180 | |
Unrealized depreciation on forward currency contracts | | | 3,982 | |
Payable to broker for variation margin | | | 12,310 | |
Accrued expenses | | | 57,066 | |
| | | | |
| | | 1,501,538 | |
| | | | |
NET ASSETS | | $ | 23,163,601 | |
| | | | |
NET ASSETS CONSIST OF: | | | | |
Paid in capital | | $ | 22,948,901 | |
Undistributed net investment income | | | 12,915 | |
Undistributed net realized gain | | | 5,511 | |
Net unrealized appreciation | | | 196,274 | |
| | | | |
| | $ | 23,163,601 | |
| | | | |
Fund shares outstanding (par value $0.01 each, unlimited shares authorized) | | | 2,130,259 | |
Net asset value per share | | $ | 10.87 | |
| |
STATEMENT OF OPERATIONS
(unaudited) | | | | |
| | | Period from May 1, 2014 to June 30, 2014 | |
INVESTMENT INCOME: | | | | |
Interest (net of foreign taxes of $758) | | $ | 89,818 | |
| | | | |
| | | 89,818 | |
| | | | |
EXPENSES: | | | | |
Management fees | | | 13,510 | |
Custody and fund accounting fees | | | 9,777 | |
Transfer agent fees | | | 1,207 | |
Professional services | | | 19,925 | |
Shareholder reports | | | 3,000 | |
Registration fees | | | 9,278 | |
Trustees’ fees | | | 40,087 | |
Miscellaneous | | | 8 | |
| | | | |
Total expenses | | | 96,792 | |
| | | | |
Expenses reimbursed by investment manager | | | (80,580 | ) |
| | | | |
Net expenses | | | 16,212 | |
| | | | |
NET INVESTMENT INCOME | | | 73,606 | |
| | | | |
|
REALIZED AND UNREALIZED GAIN (LOSS): | |
Net realized gain (loss) | | | | |
Investments | | | 9,786 | |
Treasury futures contracts | | | (9,345 | ) |
Forward currency contracts | | | 4,820 | |
Foreign currency transactions | | | 250 | |
Net change in unrealized appreciation/depreciation | | | | |
Investments | | | 219,868 | |
Treasury futures contracts | | | (17,164 | ) |
Interest rate swaps | | | (13,043 | ) |
Forward currency contracts | | | 5,861 | |
Foreign currency translation | | | 752 | |
| | | | |
Net realized and unrealized gain | | | 201,785 | |
| | | | |
NET INCREASE IN NET ASSETS
FROM OPERATIONS | | $ | 275,391 | |
| | | | |
| | | | |
STATEMENT OF CHANGES IN NET ASSETS
(unaudited) | |
| | | Period from
May 1, 2014 to
June 30, 2014 | |
OPERATIONS: | | | | |
Net investment income | | $ | 73,606 | |
Net realized gain | | | 5,511 | |
Net change in unrealized appreciation/depreciation | | | 196,274 | |
| | | | |
| | | 275,391 | |
| | | | |
| |
DISTRIBUTIONS TO SHAREHOLDERS FROM: | | | | |
Net investment income | | | (60,691 | ) |
Net realized gain | | | — | |
| | | | |
Total distributions | | | (60,691 | ) |
| | | | |
| |
FUND SHARE TRANSACTIONS: | | | | |
Proceeds from sale of shares | | | 23,123,902 | |
Reinvestment of distributions | | | 58,953 | |
Cost of shares redeemed | | | (233,954 | ) |
| | | | |
Net increase from Fund
share transactions | | | 22,948,901 | |
| | | | |
Total increase in net assets | | | 23,163,601 | |
| |
NET ASSETS: | | | | |
Beginning of period | | | — | |
| | | | |
End of period (including undistributed
net investment income of $12,915) | | $ | 23,163,601 | |
| | | | |
| |
SHARE INFORMATION: | | | | |
Shares sold | | | 2,146,444 | |
Distributions reinvested | | | 5,433 | |
Shares redeemed | | | (21,618 | ) |
| | | | |
Net increase in shares outstanding | | | 2,130,259 | |
| | | | |
| | |
| PAGE 11 § DODGE & COX GLOBAL BOND FUND | | See accompanying Notes to Financial Statements |
NOTES TO FINANCIAL STATEMENTS (unaudited)
NOTE 1—ORGANIZATION AND SIGNIFICANT ACCOUNTING POLICIES
Dodge & Cox Global Bond Fund (the “Fund”) is one of the series constituting the Dodge & Cox Funds (the “Trust” or the “Funds”). The Trust is organized as a Delaware statutory trust and is registered under the Investment Company Act of 1940, as amended, as an open-end management investment company. The Fund1 seeks a high rate of total return consistent with long-term preservation of capital. Foreign investing, especially in developing countries, has special risks such as currency and market volatility and political and social instability. These and other risk considerations are discussed in the Fund’s Prospectus.
The financial statements have been prepared in conformity with accounting principles generally accepted in the United States of America, which require the use of estimates and assumptions by management. Actual results may differ from those estimates. Significant accounting policies are as follows:
Security valuation The Fund’s net assets are valued as of the close of trading on the New York Stock Exchange (NYSE), generally 4:00 p.m. Eastern Time, each day that the NYSE is open for business. Debt securities are valued based on prices received from independent pricing services which utilize both dealer-supplied valuations and pricing models. Pricing models may consider quoted prices for similar securities, interest rates, prepayment speeds, and credit risk. Exchange-traded derivatives are valued at the settlement price determined by the relevant exchange. Interest rate swaps are valued daily based on prices received from independent pricing services, which represent the net present value of all future cash settlement amounts based on implied forward
| 1 | | The Fund’s predecessor, Dodge & Cox Global Bond Fund, L.L.C. (the “Private Fund”), was organized on August 31, 2012 and commenced operations on December 5, 2012 as a private investment fund that reorganized into, and had the same investment manager as, the Fund. The Fund commenced operations on May 1, 2014, upon the transfer of assets from the Private Fund. This transaction was accomplished through a transfer of Private Fund net assets valued at $10,725,688 in exchange for 1,000,000 shares of the Fund. Immediately after the transfer, the shares of the Fund were distributed to the sole owner of the Private Fund and the investment manager of the Fund, Dodge & Cox, which became the initial shareholder of the Fund. |
interest rates. Other financial instruments for which market quotes are readily available are valued at market value. Security values are not discounted based on the size of the Fund’s position. Securities for which market quotations are not readily available are valued at fair value as determined in good faith by or under the direction of the Board of Trustees. Short-term securities less than 60 days to maturity may be valued at amortized cost if amortized cost approximates current value.
Investments initially valued in currencies other than the U.S. dollar are converted to the U.S. dollar using prevailing exchange rates. As a result, the Fund’s net assets may be affected by changes in the value of currencies in relation to the U.S. dollar.
The Board of Trustees has delegated authority to Dodge & Cox, the Fund’s investment manager, to make fair value determinations in accordance with the Dodge & Cox Funds Valuation Policies (“Valuation Policies”), subject to Board oversight. Dodge & Cox has established a Pricing Committee that is comprised of representatives from Treasury, Legal, Compliance, and Operations. The Pricing Committee is responsible for implementing the Valuation Policies, including determining the fair value of securities when market quotations or market-based valuations are not readily available or are deemed unreliable. The Pricing Committee considers relevant indications of value that are reasonably available to it in determining the fair value assigned to a particular security, such as the value of similar financial instruments, trading volumes, contractual restrictions on disposition, related corporate actions, and changes in economic conditions.
Valuing securities at fair value involves greater reliance on judgment than valuation of securities based on readily available market quotations. In some instances, lack of information and uncertainty as to the significance of information may lead to a conclusion that a prior valuation is the best indication of a security’s present value. When fair value pricing is employed, the prices of securities used by the Fund to calculate its net asset value may differ from quoted or published prices for the same securities.
DODGE & COX GLOBAL BOND FUND §PAGE 12
NOTES TO FINANCIAL STATEMENTS (unaudited)
Security transactions, investment income, expenses, and distributions Security transactions are recorded on the trade date. Realized gains and losses on securities sold are determined on the basis of identified cost.
Interest income is recorded on the accrual basis. Interest income includes coupon interest, amortization of premium and accretion of discount on debt securities, gain/loss on paydowns of mortgage-backed securities, and inflation adjustments to the principal amount of inflation-indexed securities. The ability of the issuers of the debt securities held by the Fund to meet their obligations may be affected by economic developments in a specific industry, state, region, or country. Debt obligations may be placed on non-accrual status and related interest income may be reduced by ceasing current accruals and writing off interest receivables when the collection of all or a portion of interest has become doubtful. A debt obligation is removed from non-accrual status when the issuer resumes interest payments or when collectability of interest is reasonably assured. Dividend income is recorded on the ex-dividend date.
Expenses are recorded on the accrual basis. Most expenses of the Trust can be directly attributed to a specific series. Expenses which cannot be directly attributed are allocated among the Funds in the Trust based on relative net assets or other expense methodologies determined by the nature of the expense.
Distributions to shareholders are recorded on the ex-dividend date.
Foreign taxes The Fund is subject to foreign taxes which may be imposed by certain countries in which the Fund invests. The Fund endeavors to record foreign taxes based on applicable foreign tax law. Withholding taxes are incurred on certain foreign receipts and are accrued at the time the associated interest income is recorded.
Capital gains taxes are incurred upon disposition of certain foreign securities. Capital gains taxes on appreciated securities are accrued as unrealized losses and are reflected as realized losses upon the sale of the related security.
Repurchase agreements The Fund enters into repurchase agreements, secured by U.S. government or agency securities, which involve the purchase of securities from a counterparty with a simultaneous commitment to resell the securities at an agreed-upon date and price. It is
the Fund’s policy that its custodian take possession of the underlying collateral securities, the fair value of which exceeds the principal amount of the repurchase transaction, including accrued interest, at all times. In the event of default by the counterparty, the Fund has the contractual right to liquidate the securities and to apply the proceeds in satisfaction of the obligation.
Futures Contracts Futures contracts involve an obligation to purchase or sell (depending on whether the Fund has entered a long or short futures contract, respectively) an asset at a future date, at a price set at the time of the contract. Upon entering into a futures contract, the Fund is required to deposit an amount of cash or liquid assets (referred to as initial margin) in a segregated account with the clearing broker. Subsequent payments (referred to as variation margin) to and from the clearing broker are made on a daily basis based on changes in the market value of futures contracts. Futures are traded publicly and their market value changes daily. Changes in the market value of open futures contracts are recorded as unrealized appreciation or depreciation in the Statement of Operations. Realized gains and losses on futures contracts are recorded in the Statement of Operations at the closing or expiration of futures contracts. Cash deposited with a broker as initial margin is recorded on the Statement of Assets and Liabilities. A receivable and/or payable to brokers for daily variation margin is also recorded on the Statement of Assets and Liabilities.
Investments in futures contracts may include certain risks, which may be different from, and potentially greater than, those of the underlying securities. To the extent the Fund uses futures, it is exposed to additional volatility and potential losses resulting from leverage.
The Fund has entered into short Treasury futures contracts to assist with the management of the portfolio’s interest rate exposure. During the two months ended June 30, 2014, these Treasury futures contracts had notional values ranging from 0% to 8% of net assets.
Interest rate swaps Interest rate swaps are agreements that obligate two parties to exchange a series of cash flows at specified payment dates calculated by reference to specified interest rates, such as an exchange of floating rate payments for fixed rate payments. Upon entering into a centrally-cleared interest rate swap, the Fund is required to post an amount of cash or liquid assets
PAGE 13 § DODGE & COX GLOBAL BOND FUND
NOTES TO FINANCIAL STATEMENTS (unaudited)
(referred to as initial margin) in a segregated account with the clearing broker. Subsequent payments (referred to as variation margin) to and from the clearing broker are made on a daily basis based on changes in the market value of interest rate swaps. Changes in the market value on open interest rate swap contracts are recorded as unrealized appreciation or depreciation in the Statement of Operations. Realized gains and losses on interest rate swaps are recorded in the Statement of Operations, both upon the exchange of cash flows on each specified payment date and upon the closing or expiration of the swap. Cash deposited with the clearing broker as initial margin is recorded on the Statement of Assets and Liabilities. A receivable and/or payable to brokers for daily variation margin is also recorded on the Statement of Assets and Liabilities.
Investments in interest rate swaps may include certain risks including unfavorable changes in interest rates, or a default or failure by the clearing broker or clearinghouse.
The Fund entered into interest rate swaps in connection with the management of the interest rate exposure of its portfolio. During the two months ended June 30, 2014, the Fund invested in interest rate swaps with U.S. dollar notional values ranging from 0% to 6% of net assets.
Forward currency contracts A forward currency contract represents an obligation to purchase or sell a specific foreign currency at a future date at a price set at the time of the contract. Losses from these transactions may arise from unfavorable changes in currency values or if the counterparties do not perform under a contract’s terms.
The values of the forward currency contracts are adjusted daily based on the applicable exchange rate of the underlying currency. Changes in the value of open contracts are recorded as unrealized appreciation or depreciation in the Statement of Operations. When the forward currency contract is closed, the Fund records a realized gain or loss in the Statement of Operations equal to the difference between the value at the time the contract was opened and the value at the time it was closed.
The Fund entered into forward currency contracts to increase its portfolio exposure to the South Korean won and Russian ruble. During the two months ended June 30, 2014, the Fund’s South Korean won forward currency contracts had U.S. dollar total values of 2% of net assets
and were subsequently closed, and its Russian ruble forward currency contracts had U.S. dollar total values of less than 1% of net assets during the period. The Fund’s portfolio exposure from euro forward currency contracts was 0% of net assets during the period.
Foreign currency translation The books and records of the Fund are maintained in U.S. dollars. Foreign currency amounts are translated into U.S. dollars at the prevailing exchange rates of such currencies against the U.S. dollar. The market value of investment securities and other assets and liabilities are translated at the exchange rate as of the valuation date. Purchases and sales of investment securities, income, and expenses are translated at the exchange rate prevailing on the transaction date.
Reported realized and unrealized gain (loss) on investments includes foreign currency gain (loss) related to investment transactions.
Reported realized and unrealized gain (loss) on foreign currency transactions and translation include the following: holding/disposing of foreign currency, the difference between the trade and settlement dates on securities transactions, the difference between the accrual and payment dates on interest, and currency losses on the purchase of foreign currency in certain countries that impose taxes on such transactions.
Indemnification Under the Trust’s organizational documents, its officers and trustees are indemnified against certain liabilities arising out of the performance of their duties to the Trust. In addition, in the normal course of business the Trust enters into contracts that provide general indemnities to other parties. The Trust’s maximum exposure under these arrangements is unknown as this would involve future claims that may be made against the Trust that have not yet occurred.
DODGE & COX GLOBAL BOND FUND §PAGE 14
NOTES TO FINANCIAL STATEMENTS (unaudited)
NOTE 2—VALUATION MEASUREMENTS
Various inputs are used in determining the value of the Fund’s investments. These inputs are summarized in the three broad levels listed below.
| § | | Level 1: Quoted prices in active markets for identical securities |
| § | | Level 2: Other significant observable inputs (including quoted prices for similar securities, market indices, interest rates, credit risk, etc.) |
| § | | Level 3: Significant unobservable inputs (including Fund management’s assumptions in determining the fair value of investments) |
The inputs or methodology used for valuing securities are not necessarily an indication of the risk associated with investing in those securities.
The following is a summary of the inputs used to value the Fund’s holdings at June 30, 2014:
| | | | | | | | |
| Classification(a) | | LEVEL 1
(Quoted Prices) | | | LEVEL 2
(Other Significant
Observable Inputs) | |
Securities | | | | | | | | |
Debt Securities | | | | | | | | |
Government | | $ | 900,174 | | | $ | 4,305,892 | |
Government Related | | | — | | | | 1,734,791 | |
Securitized | | | — | | | | 2,903,799 | |
Corporate | | | — | | | | 11,895,826 | |
Short-term Investments | | | | | | | | |
Money Market Fund | | | 45,141 | | | | — | |
Repurchase Agreement | | | — | | | | 2,001,907 | |
| | | | | | | | |
Total Securities | | $ | 945,315 | | | $ | 22,842,215 | |
| | | | | | | | |
Other Financial Instruments | | | | | | | | |
Treasury Futures Contracts | | $ | (17,187 | )(b) | | $ | — | |
Interest Rate Swaps | | | — | | | | (13,043 | )(b) |
Forward Currency Contracts | | | — | | | | 5,861 | (b) |
| | | | | | | | |
Total Other Financial Instruments | | $ | (17,187 | ) | | $ | (7,182 | ) |
| | | | | | | | |
| | | | | | | | | |
| (a) | There were no transfers between Level 1 and Level 2 during the two months ended June 30, 2014. There were no Level 3 securities at June 30, 2014, and there were no transfers to Level 3 during the period. |
| (b) | Represents net unrealized appreciation/depreciation. |
NOTE 3—ADDITIONAL DERIVATIVES INFORMATION
The Fund has entered into over-the-counter derivatives, such as foreign exchange forwards (each, a “Derivative”). Each Derivative is subject to a negotiated master agreement (based on a form published by the International Swaps and Derivatives Association
(“ISDA”)) governing all Derivatives between the Fund and the relevant dealer counterparty. The master agreements specify (i) events of default and other events permitting a party to terminate some or all of the Derivatives thereunder and (ii) the process by which those Derivatives will be valued for purposes of determining termination payments. If some or all of the Derivatives under a master agreement are terminated because of an event of default or similar event, the values of all terminated Derivatives must be netted to determine a single payment owed by one party to the other. Some master agreements contain collateral terms requiring the parties to post collateral in respect of some or all of the Derivatives thereunder based on the net market value of those Derivatives, subject to a minimum exposure threshold. To the extent amounts owed to the Fund by its counterparties are not collateralized, the Fund is at risk of those counterparties’ non-performance. The Fund attempts to mitigate counterparty credit risk by entering into Derivatives only with counterparties it believes to be of good credit quality and by monitoring the financial stability of those counterparties.
For financial reporting purposes, the Fund does not offset financial assets and liabilities that are subject to an ISDA Master Agreement in the Statement of Assets and Liabilities. The net amount for Derivatives is disclosed on the Portfolio of Investments. At June 30, 2014, there is no collateral pledged or received by the Fund for Derivatives.
NOTE 4—RELATED PARTY TRANSACTIONS
Management fees Under a written agreement approved by a unanimous vote of the Board of Trustees, the Fund pays an annual management fee of 0.50% of the Fund’s average daily net assets to Dodge & Cox, investment manager of the Fund. Dodge & Cox has contractually agreed to reimburse the Fund to the extent that such fee plus all other ordinary operating expenses of the Fund exceed 0.60% of the average daily net assets for the fiscal periods ending December 31, 2014 and 2015.
Fund officers and trustees All officers and two of the trustees of the Trust are officers or employees of Dodge & Cox. The Trust pays a fee only to those trustees who are not affiliated with Dodge & Cox.
Share ownership At June 30, 2014, Dodge & Cox owned 47% of the Fund’s outstanding shares.
PAGE 15 § DODGE & COX GLOBAL BOND FUND
NOTES TO FINANCIAL STATEMENTS (unaudited)
NOTE 5—INCOME TAX INFORMATION AND DISTRIBUTIONS TO SHAREHOLDERS
A provision for federal income taxes is not required since the Fund intends to continue to qualify as a regulated investment company under Subchapter M of the Internal Revenue Code and distribute all of its taxable income to shareholders. Distributions are determined in accordance with income tax regulations, and such amounts may differ from net investment income and realized gains for financial reporting purposes. Financial reporting records are adjusted for permanent book/tax differences at year end to reflect tax character.
Book/tax differences are primarily due to differing treatments of wash sales, net short-term realized gain (loss), Treasury futures contracts, foreign capital gain taxes, foreign currency realized gain (loss), and interest rate swaps. At June 30, 2014, the cost of investments for federal income tax purposes was $23,567,662.
Distributions during the period noted below were characterized as follows for federal income tax purposes:
| | | | | | |
| | | | | Two Months Ended June 30, 2014 | |
Ordinary income | | | | | $60,691 | |
| | | | | ($0.030 per share) | |
Long-term capital gain | | | | | — | |
At June 30, 2014, the tax basis components of distributable earnings were as follows:
| | | | |
Unrealized appreciation | | $ | 236,307 | |
Unrealized depreciation | | | (16,439 | ) |
| | | | |
Net unrealized appreciation | | | 219,868 | |
Undistributed ordinary income | | | 13,909 | |
Accumulated long-term capital loss(a) | | | (6,774 | ) |
| (a) | Represents capital loss realized for tax purposes during the period from May 1, 2014 to June 30, 2014. |
Under the Regulated Investment Company Modernization Act of 2010, capital losses incurred by the Fund after January 1, 2011, are not subject to expiration. In addition, such losses must be utilized prior to the losses incurred in the years preceding enactment.
Fund management has reviewed the tax positions for open periods (three years and four years, respectively, from filing the Fund’s Federal and State tax returns) as applicable to the Fund, and has determined that no provision for income tax is required in the Fund’s financial statements.
NOTE 6—LOAN FACILITIES
Pursuant to an exemptive order issued by the Securities and Exchange Commission (SEC), the Fund may participate in an interfund lending facility (Facility). The Facility allows the Fund to borrow money from or loan money to the Funds. Loans under the Facility are made for temporary or emergency purposes, such as to fund shareholder redemption requests. Interest on borrowings is the average of the current repurchase agreement rate and the bank loan rate. There was no activity in the Facility during the period.
All Funds in the Trust participate in a $500 million committed credit facility (Line of Credit) with State Street Bank and Trust Company, to be utilized for temporary or emergency purposes to fund shareholder redemptions or for other short-term liquidity purposes. The maximum amount available to the Fund is $250 million. Each Fund pays an annual commitment fee on its pro-rata portion of the Line of Credit. The Fund’s commitment fee for the two months ended June 30, 2014, amounted to $8 and is reflected as a Miscellaneous Expense in the Statement of Operations. Interest on borrowings is charged at the prevailing rate. There were no borrowings on the Line of Credit during the period.
NOTE 7—PURCHASES AND SALES OF INVESTMENTS
For the two months ended June 30, 2014, purchases and sales of securities, other than short-term securities and U.S. government securities, aggregated $10,958,885 and $253,006, respectively. For the two months ended June 30, 2014, purchases and sales of U.S. government securities aggregated $2,430,526 and $1,709,345, respectively.
NOTE 8—SUBSEQUENT EVENTS
Fund management has determined that no material events or transactions occurred subsequent June 30, 2014, and through the date of the Fund’s financial statements issuance, which require additional disclosure in the Fund’s financial statements.
DODGE & COX GLOBAL BOND FUND §PAGE 16
FINANCIAL HIGHLIGHTS (unaudited)
| | | | |
SELECTED DATA AND RATIOS (for a share outstanding throughout the period) | | Two Months
Ended June 30, | |
| | | 2014 | |
| | | | |
Net asset value, beginning of period | | | $10.73 | |
Income from investment operations: | | | | |
Net investment income | | | 0.04 | |
Net realized and unrealized gain | | | 0.13 | |
| | | | |
Total from investment operations | | | 0.17 | |
| | | | |
Distributions to shareholders from: | | | | |
Net investment income | | | (0.03 | ) |
Net realized gain | | | — | |
| | | | |
Total distributions | | | (0.03 | ) |
| | | | |
Net asset value, end of period | | | $10.87 | |
| | | | |
Total return | | | 1.59 | % |
Ratios/supplemental data: | | | | |
Net assets, end of period (millions) | | | $23 | |
Ratio of expenses to average net assets | | | 0.60 | %(a) |
Ratio of expenses to average net assets, before reimbursement by investment manager | | | 3.58 | %(a) |
Ratio of net investment income to average net assets | | | 2.69 | %(a) |
Portfolio turnover rate | | | 13 | % |
See accompanying Notes to Financial Statements
PAGE 17 § DODGE & COX GLOBAL BOND FUND
BOARD APPROVAL OF FUNDS’ INVESTMENT MANAGEMENT AGREEMENTS AND MANAGEMENT FEES (unaudited)
The Board of Trustees is responsible for overseeing the performance of the Dodge & Cox Funds’ investment manager and determining whether to approve the Investment Management Agreement between the Dodge & Cox Global Bond Fund (the “Fund”) and Dodge & Cox (the “Agreement”). At a meeting of the Board of Trustees of the Trust held on February 25, 2014, the Trustees, by a unanimous vote (including a separate vote of those Trustees who are not “interested persons” (as defined in the Investment Company Act of 1940) (the “Independent Trustees”)), approved the Agreement with an initial term through December 31, 2015.
INFORMATION RECEIVED
The Board considered that at the meeting held on December 17, 2013 (the “December 2013 Meeting”), the Board unanimously voted to approve the renewal of the Investment Management Agreement for each of the Dodge & Cox Stock Fund, Global Stock Fund, International Stock Fund, Balanced Fund and Income Fund (the “Existing Funds”). The Board noted management’s representation that, with the exception of the management fee, the terms of the Agreement for the Fund were identical to the terms of the Investment Management Agreements for the Existing Funds. The Board considered that at the December Meeting and in the months preceding the December Meeting, the Board had requested, received and reviewed extensive materials relevant to the approval of the Agreement, including, but not limited to, materials relating to the nature, extent and quality of services provided to the Existing Funds by Dodge & Cox, the investment performance of each Existing Fund, the costs of services provided to the Existing Funds, profits to be realized by Dodge & Cox from its relationship with the Existing Funds and any associated fall out benefits and the fees charged to the Existing Funds and any economies of scale to be realized as the Existing Funds grow.
In advance of the meeting, the Board, including each of the Independent Trustees, requested, received, and reviewed materials relating to the Agreement, and the Fund’s management fee, including a Morningstar® report
regarding the world bond category of mutual funds with detailed advisory fee rates and expense ratios of comparable funds managed by other advisers identified by Morningstar®. The Board received copies of the Agreement and a memorandum from the independent legal counsel to the Independent Trustees discussing the factors generally regarded as appropriate to consider in evaluating advisory arrangements. The Board, including the Independent Trustees, subsequently concluded that the proposed Agreement is fair and reasonable and voted to approve the Agreement.
In considering the Agreement, the Board, including the Independent Trustees, did not identify any single factor or particular information as all-important or controlling. In reaching the decision to approve the Agreement, the Board considered several factors, discussed below, to be key factors and reached the conclusions described below.
NATURE, QUALITY, AND EXTENT
OF THE SERVICES
The Board considered that, similar to the services Dodge & Cox provides to the Existing Funds, Dodge & Cox is expected to provide extensive services to the Fund in addition to portfolio management, and that Dodge & Cox has consistently delivered a high level of service for the Existing Funds. The extensive nature of services provided by Dodge & Cox to the Existing Funds had been documented in materials provided to the Board and in presentations made to the Board throughout 2013. In particular, the Board considered the nature, quality, and extent of portfolio management, administrative, and shareholder services performed by Dodge & Cox, including: Dodge & Cox’s established long-term history of care and conscientiousness in the management of the Existing Funds; its demonstrated consistency in investment approach and depth; and the background and experience of the Dodge & Cox Global Bond Investment Policy Committee, which would be responsible for managing the Fund. The Board also considered frequent favorable recognition of Dodge & Cox in the media, industry publications and industry surveys with respect to corporate governance, operational capabilities, performance and reputation for integrity. In the area of administrative and shareholder services, the Board considered the excellent quality of Dodge & Cox’s work
DODGE & COX GLOBAL BOND FUND §PAGE 18
in areas such as compliance, legal services, trading, proxy voting, oversight of the Existing Funds’ transfer agent and custodian, tax compliance, and shareholder communication through the Existing Funds’ website and other means.
The Board also considered the favorable peer group comparisons of expense ratios and management fees prepared independently by Morningstar®. The Board noted that Dodge & Cox is an investment research-oriented firm with no other business endeavors to distract management’s attention from its research efforts, and that its investment professionals adhere to a consistent investment approach across the Existing Funds. In considering this information, the Board evaluated not only the information presented to the Board in connection with its consideration of the Agreement, but also the Board’s experience through past interactions with Dodge & Cox. The Board concluded that it was satisfied with the nature, extent and quality of investment management and other services to be provided to the Fund by Dodge & Cox.
INVESTMENT PERFORMANCE
The Board considered the investment performance of the Dodge & Cox Global Bond Fund, L.L.C., a private fund managed with Dodge & Cox proprietary assets since December 2012 (the “private fund”), as compared to both a relevant index and the performance of the Fund’s peer group universe. In reviewing the performance information prepared by Morningstar®, the Board noted that the private fund demonstrated favorable performance relative to the index and peer group. The Board noted that in connection with the December 2013 Meeting, it had received and reviewed information that demonstrated a consistent pattern of favorable long-term performance for investors in the Existing Funds. The Board considered that the performance of the Existing Funds is the result of an investment management process that emphasizes a long-term investment horizon, comprehensive independent research, price discipline and focus. The Board also considered Dodge & Cox’s success managing both U.S., global, and international investment mandates. The Board concluded that Dodge & Cox’s investment approach is consistent with the long-term investment strategies proposed for the Fund.
COSTS AND ANCILLARY BENEFITS
Costs of Services to the Fund: Fees and Expenses. The Board considered the Fund’s proposed management fee rate and anticipated gross and net expense ratios relative to industry averages for similar mutual funds and relative to management fees charged by Dodge & Cox to the Existing Funds. The Board considered that, for the initial term of the Agreement, Dodge & Cox agreed to waive a portion of its management fee and/or reimburse the Fund’s expenses to the extent that the Fund’s total expenses (before payment of any extraordinary expenses) would otherwise exceed 0.60% of the Fund’s average daily net assets.
The Board also evaluated the proposed operating structure of the Fund and Dodge & Cox, including the following factors: Dodge & Cox does not charge sales commissions or distribution fees and derives revenue solely from management fees; the Fund will receive numerous administrative, regulatory compliance, legal, technology, and shareholder support services from Dodge & Cox without any additional administrative fee; portfolio turnover and brokerage commissions for the existing Funds have been below industry averages; anticipated outsourcing of all non-essential Fund services to unaffiliated third-party service providers is efficient and less costly to investors. The Board noted that Dodge & Cox will bear all distribution-related expenses. The Board also considered the importance of Dodge & Cox remaining a privately-held company, which facilitates management continuity and employee retention, and that the employee compensation structure at Dodge & Cox supports such an outcome. The Board also noted that the Fund will be at or below the peer group median with respect to net expense ratios and management fee rates as documented by Morningstar® data. The Board reviewed the Morningstar® data showing that the few peer group funds with lower expense ratios than the Fund have other share classes with significantly higher expense ratios. The Board also noted the additional costs that Dodge & Cox would incur as a result of investing in a global investment mandate. The Board concluded that the Fund’s expected costs for the services it will receive (including the management fee to be paid to Dodge & Cox) are reasonable, and further that the fees are acceptable based upon the qualifications, experience,
PAGE 19 § DODGE & COX GLOBAL BOND FUND
reputation, and performance of Dodge & Cox and the low anticipated expense ratio of the Fund.
Profitability and Costs of Services to Dodge & Cox; “Fall-out” Benefits. The Board noted that at the December meeting, it reviewed reports of Dodge & Cox’s financial position, profitability, and estimated overall value, and considered Dodge & Cox’s overall profitability within its context as a private, employee-owned S-Corporation and relative to the services it will provide to the Fund. The Board recognized the importance of Dodge & Cox’s profitability—which is derived solely from management fees and does not include other business ventures—to maintain its unique culture. The Board also considered that the compensation/profit structure at Dodge & Cox is vital for remaining independent and facilitating retention of its management and investment professionals. The Board noted its belief that the profitability of Dodge & Cox is consistent with long-term stability of the organization and maintenance of high quality investment management services. The Board also noted that in the past Dodge & Cox has voluntarily limited growth of assets when deemed advisable and in the best interests of Existing Funds’ shareholders and separate account clients by Dodge & Cox, thereby forgoing significant profits.
The Board considered potential “fall-out” benefits (including the receipt of research from unaffiliated brokers and reputational benefits to non-U.S. funds sponsored and managed by Dodge & Cox) that Dodge & Cox might receive as a result of its association with the Fund and determined that they are not significant. The Board also considered that the magnitude of costs and risks borne by Dodge & Cox in rendering advisory services to the Fund (including risks in the regulatory compliance, securities valuation, and investment management processes) may increase, and that it was difficult to project with significant accuracy the profitability of a new series. The Board concluded that the expected profitability of Dodge & Cox’s relationship with the Fund (including fall-out benefits) was fair and reasonable.
THE BENEFIT OF ECONOMIES OF SCALE
The Board considered the extent to which economies of scale would be realized as the Fund grows and whether the proposed fee levels reflect these economies of scale for the benefit of the Fund’s investors. The Board considered
whether the management fee rate is reasonable in relation to the Fund’s anticipated assets and any economies of scale that may develop. The Board considered that Fund shareholders will have access to high quality investment management at a relatively low cost. The Board also noted that because Dodge & Cox had agreed to a voluntary fee waiver/reimbursement, the Fund’s net total expenses would be considerably less than its actual total expenses. The Board recognized that shareholders will benefit from the organizational efficiencies of Dodge & Cox’s investment management process and the avoidance of extensive distribution and marketing structures, the cost of which could ultimately be borne by the Fund. The Board noted ongoing improvements in technology and shareholder servicing. The Board also noted that Dodge & Cox has increased its research staff and investment resources over the years in order to enhance and expand its investment research capabilities, which is expected to benefit Fund shareholders. The Board also noted that the Existing Funds have an increasingly global exposure with increasing complexity, and that Dodge & Cox continues to make substantial expenditures in staff and information technology to enable it to integrate credit and equity analyses and implement the Fund’s strategy in a more effective and secure manner. The Board concluded that the proposed Dodge & Cox fee structure for the Fund is fair and reasonable and adequately reflects economies of scale.
CONCLUSION
Based on their evaluation of all material factors and assisted by the advice of independent legal counsel to the Independent Trustees, the Board, including the Independent Trustees, concluded that the Fund’s proposed management fee structure is fair and reasonable, that the Fund will pay a competitive fee for the services provided, that the scope and quality of Dodge & Cox’s services are anticipated to provide substantial value for Fund shareholders over the long-term, and that approval of the Agreement is in the best interest of the Fund and its shareholders.
DODGE & COX GLOBAL BOND FUND §PAGE 20
FUND HOLDINGS
The Fund provides a complete list of its holdings four times each fiscal year, as of the end of each quarter. The Fund files the lists with the Securities and Exchange Commission (SEC) on Form N-CSR (second and fourth quarters) and Form N-Q (first and third quarters). Shareholders may view the Fund’s Forms N-CSR and N-Q on the SEC’s website at www.sec.gov. Forms N-CSR and N-Q may also be reviewed and copied at the SEC’s Public Reference Room in Washington, DC. Information regarding the operations of the Public Reference Room may be obtained by calling 202-942-8090 (direct) or 800-732-0330 (general SEC number). A list of the Fund’s quarter-end holdings is also available at www.dodgeandcox.com on or about 15 days following each quarter end and remains available on the web site until the list is updated in the subsequent quarter.
PROXY VOTING
For a free copy of the Fund’s proxy voting policies and procedures, please call 800-621-3979, visit the Fund’s website at www.dodgeandcox.com, or visit the SEC’s website at www.sec.gov. Information regarding how the Fund voted proxies relating to portfolio securities during the most recent 2-month period ending June 30 is also available at www.dodgeandcox.com or at www.sec.gov.
HOUSEHOLD MAILINGS
The Fund routinely mails shareholder reports and summary prospectuses to shareholders and, on occasion, proxy statements. In order to reduce the volume of mail, when possible, only one copy of these documents will be sent to shareholders who are part of the same family and share the same residential address.
If you have a direct account with the Funds and you do not want the mailing of shareholder reports and summary prospectuses combined with other members in your household, contact the Funds at 800-621-3979. Your request will be implemented within 30 days.
PAGE 21 § DODGE & COX GLOBAL BOND FUND
THIS PAGE INTENTIONALLY LEFT BLANK
DODGE & COX GLOBAL BOND FUND §PAGE 22
TRUSTEES AND EXECUTIVE OFFICERS
Charles F. Pohl, Chairman and Trustee
Chairman and Chief Investment Officer, Dodge & Cox
Dana M. Emery, President and Trustee
Chief Executive Officer, President, and Director of Fixed Income, Dodge & Cox
Thomas A. Larsen, Independent Trustee
Senior Counsel, Arnold & Porter LLP
Ann Mather, Independent Trustee
Former Executive Vice President, Chief Financial Officer, and Company Secretary of Pixar Studios
Robert B. Morris III, Independent Trustee
Former Partner and Managing Director of Global Research at Goldman Sachs & Co.
Gary Roughead, Independent Trustee
Annenberg Distinguished Visting Fellow, Hoover Institution
Mark E. Smith, Independent Trustee
Former Executive Vice President, Managing Director-Fixed Income at Loomis Sayles & Company, L.P.
John B. Taylor, Independent Trustee
Professor of Economics, Stanford University; Senior Fellow, Hoover Institute and former Under Secretary for International Affairs, United States Treasury
John A. Gunn, Senior Vice President
Former Chairman and Chief Executive Officer, Dodge & Cox
Diana S. Strandberg, Senior Vice President
Senior Vice President and Director of International Equity, Dodge & Cox
David H. Longhurst, Treasurer
Vice President and Assistant Treasurer, Dodge & Cox
Thomas M. Mistele, Secretary
Chief Operating Officer, Secretary, and Senior Counsel, Dodge & Cox
Katherine M. Primas, Chief Compliance Officer
Chief Compliance Officer, Dodge & Cox
Additional information about the Trust’s Trustees and Officers is available in the Trust’s Statement of Additional Information (SAI). You can get a free copy of the SAI by visiting the Funds’ website at www.dodgeandcox.com or calling 800-621-3979.
PAGE 23 § DODGE & COX GLOBAL BOND FUND
ITEM 2. CODE OF ETHICS.
Not applicable for semi-annual report filings.
ITEM 3. AUDIT COMMITTEE FINANCIAL EXPERT.
Not applicable for semi-annual report filings.
ITEM 4. PRINCIPAL ACCOUNTANT FEES AND SERVICES.
Not applicable for semi-annual report filings.
ITEM 5. AUDIT COMMITTEE OF LISTED REGISTRANTS.
Not applicable.
ITEM 6. SCHEDULE OF INVESTMENTS.
Not applicable. The complete schedule of investments is included in Item 1 of this Form N-CSR.
ITEM 7. DISCLOSURE OF PROXY VOTING POLICIES AND PROCEDURES FOR CLOSED-END MANAGEMENT INVESTMENT COMPANIES.
Not applicable.
ITEM 8. PORTFOLIO MANAGERS OF CLOSED-END MANAGEMENT INVESTMENT COMPANIES.
Not applicable.
ITEM 9. PURCHASES OF EQUITY SECURITIES BY CLOSED-END MANAGEMENT INVESTMENT COMPANY AND AFFILIATED PURCHASERS.
Not applicable.
ITEM 10. SUBMISSION OF MATTERS TO A VOTE OF SECURITY HOLDERS.
During the reporting period, there were no material changes to the procedures by which shareholders may recommend nominees to the registrant’s board.
ITEM 11. CONTROLS AND PROCEDURES.
(a) An evaluation was performed within 90 days of the filing of this report, under the supervision and with the participation of the registrant’s management, including the principal executive officer and principal financial officer, of the effectiveness of the design and operation of the registrant’s disclosure controls and procedures. Based on that evaluation, the principal executive officer and principal financial officer concluded that the registrant’s disclosure controls and procedures were effective.
(b) The registrant’s principal executive officer and principal financial officer are aware of no changes in the registrant’s internal control over financial reporting that occurred during the registrant’s second fiscal quarter of the period covered by this report that have materially affected, or are reasonably likely to materially affect, the registrant’s internal control over financial reporting.
ITEM 12. EXHIBITS.
(a) (1) Not applicable for semi-annual report filings.
(a) (2) Certifications pursuant to Section 302 of the Sarbanes-Oxley Act of 2002 are attached. (EX.99A)
(a) (3) Not applicable.
(b) Certifications pursuant to Section 906 of the Sarbanes-Oxley Act of 2002 are attached. (EX.99B)
SIGNATURES
Pursuant to the requirements of the Securities Exchange Act of 1934 and the Investment Company Act of 1940, the registrant has duly caused this report to be signed on its behalf by the undersigned, thereunto duly authorized.
Dodge & Cox Funds
| | |
| By | | /s/ Charles F. Pohl |
| | Charles F. Pohl |
| | Chairman—Principal Executive Officer |
Date August 20, 2014
Pursuant to the requirements of the Securities Exchange Act of 1934 and the Investment Company Act of 1940, this report has been signed below by the following persons on behalf of the registrant and in the capacities and on the dates indicated.
Dodge & Cox Funds
| | |
| By | | /s/ Charles F. Pohl |
| | Charles F. Pohl |
| | Chairman—Principal Executive Officer |
| | |
| By | | /s/ David H. Longhurst |
| | David H. Longhurst |
| | Treasurer—Principal Financial Officer |
Date August 20, 2014