UNITED STATES
SECURITIES AND EXCHANGE COMMISSION
Washington, D.C. 20549
FORM N-CSR
CERTIFIED SHAREHOLDER REPORT OF REGISTERED MANAGEMENT
INVESTMENT COMPANIES
Investment Company Act file number 811-02201
Insight Select Income Fund
(Exact name of registrant as specified in charter)
200 Park Avenue, 7th Floor
New York, NY 10166
(Address of principal executive offices) (Zip code)
Clifford D. Corso
200 Park Avenue, 7th Floor
New York, NY 10166
(Name and address of agent for service)
Registrant’s telephone number, including area code: 212-527-1800
Date of fiscal year end: March 31
Date of reporting period: March 31, 2018
Item 1. Reports to Stockholders.
The Report to Shareholders is attached herewith.
INSIGHT SELECT INCOME FUND SHAREHOLDER LETTER
For the Year Ended 03/31/18
Annual shareholder’s letter
The US and global credit market occupied a ‘Goldilocks zone’ of improving economic activity and benign inflation. This saw credit spreads fall to levels around post-financial crisis tights. The labor market also continued to tighten with an unemployment rate falling to 4.1%, one of the lowest levels in history. Furthermore, manufacturing surveys and confidence indicators increased to cycle highs.
The strong economic backdrop prompted the Federal Reserve (Fed) to continue with its efforts to normalize policy (it regarded the lukewarm inflation backdrop to be ‘transitory’). It delivered three 25 basis points (bp) rate hikes during the period. In September, it also began the process of reducing its $4.55tn balance sheet by letting up to $10bn a month of securities run off (a ceiling that is scheduled to increase every quarter). This made 2017 the first year since the financial crisis that Fed interest rate projections came to fruition.
President Trump nominated Fed Governor Jerome Powell to succeed Janet Yellen as Fed Chair. In over five years at the Fed, he never dissented from a Fed policy decision. Expectations are that the central bank will continue raising policy rates each quarter over the next several quarters.
Politics continued to be a factor for markets. The Trump administration passed business-friendly tax reform and spending increases, likely to have direct and indirect consequences on credit markets. It also stepped up its protectionist rhetoric, introducing a number of tariffs, including many aimed squarely at China. This increased market concerns about such rhetoric potentially escalating into a trade war. Concerns surrounding North Korea’s nuclear weapons program were also a factor during the summer, although this appeared to die down with news that breakthrough diplomatic talks between the US and the North Korean regime had been arranged.
During 2017, government bond yields largely traded within ranges showing little in the way of directionality. Corporate bond spreads grinded tighter, exhibiting low volatility. Risk market volatility, as measured by the VIX Index, traded at its lowest average levels in a calendar year. However, in February 2018, yields began pushing higher which contributed to the largest one-day spike in the VIX Index on record. Volatility subsequently settled at higher levels (more in line with historical averages). This resulted in some modest weakness in credit spreads, but volatility did not rise commensurately (outside of the most equity-like structures such as credit default swaps and subordinated financials). Credit spreads ultimately remained at some of their lowest levels since the global financial crisis.
One nuance to consider when linking equity volatility to widening fixed income credit risk premiums is the source of that volatility. Again, it seems much of the volatility might be attributed to rising uncertainties in government policy rather than changes to the economic fundamental outlook. Equity markets were already trading at lofty valuations and had achieved several years of very strong returns. The market first wobbled when changes in White House staff coincided with sharpening rhetoric on protectionist trade policies. A correction seemed appropriate, if not overdue.
Looking ahead, we forecast economic growth of 2.5% to 3.0% through 2018, which we believe is supportive for credit. This is generally evidenced by the fact that earnings growth is on track around 14% to 16% in 2018 and 10% adjusted for taxes. Solid earnings growth, combined with issuers’ active efforts to extend their maturity walls, should keep credit conditions fairly benign for some time. While we maintain an overweight to credit, including securitized assets, we are positioned with an underweight to interest rate duration given the prevailing economic backdrop.
1
As of March 31, 2018, the Insight Select Income Fund (the “Fund”) had a net asset value (NAV) of $20.55 per share. This represents a -0.96% decrease from $20.75 per share on March 31, 2017. On March 31, 2018, the Fund’s closing price on the New York Stock Exchange was $19.37 per share, representing a 5.7% discount to NAV per share, compared with a 7.6% discount as of March 31, 2017. One of the primary objectives of the Fund is to maintain a high level of income. On March 7, 2018, the Board of Trustees declared a dividend payment of $0.20 per share payable on May 9, 2018 to shareholders of record on April 5, 2018. On an annualized basis, including the pending dividend, the Fund has paid a total of $0.80 per share in dividends, representing a 4.24% dividend yield based on the market price on April 18, 2018 of $18.86 per share. The dividend is evaluated on a quarterly basis and is based on the income generation capability of the portfolio and is not guaranteed for any period of time.
Total Return-Percentage Change (Annualized for periods longer than 1 year)
In Net Asset Value Per Share with All Distributions Reinvested1
| | | | | | | | | | | | | | | | |
| | | 1 Year
to
3/31/18 | | | 3 Years
to
3/31/18 | | | 5 Years
to
3/31/18 | | | 10 Years
to
3/31/18 | |
Insight Select Income Fund | | | 4.26 | % | | | 3.52 | % | | | 4.36 | % | | | 6.83 | % |
Bloomberg Barclays U.S. Credit Index2 | | | 2.59 | % | | | 2.16 | % | | | 2.83 | % | | | 5.15 | % |
1 – This is historical information and should not be construed as indicative of any likely future performance.
2 – Source: Bloomberg Barclays as of March 31, 2018. Comprised primarily of US investment grade corporate bonds (Fund’s Benchmark).
The Fund’s performance for the 10-year historical periods (shown above) reflects the 4.79% dilution of NAV resulting from the rights offering in the third quarter of 2009. After adjusting for the impact of the rights offering, we estimate the 10-year annualized return to be 7.34%. The returns noted in the table above are actual returns as calculated by the fund administrator, BNY Mellon, and do not adjust for the dilution from the rights offering.
Yield represents the major component of return in most fixed income portfolios. Given this Fund’s emphasis on income and the dividend, we generally will not have material exposure to low yielding US Treasuries and will maintain meaningful exposure to corporate bonds. When it comes to management of credit risk, we try to look through periods of volatility to focus on an investment’s long-term creditworthiness to assess whether it will provide an attractive yield to the Fund over time.
2
The Fund’s performance will continue to be subject to trends in long-term interest rates and to corporate yield spreads. Consistent with our investment discipline, we continue to emphasize diversification and risk management within the bounds of income stability. The pie chart below summarizes the portfolio quality of the Fund’s assets as of March 31, 2018:
Percent of Total Investment (Lower of S&P and Moody’s Ratings)3
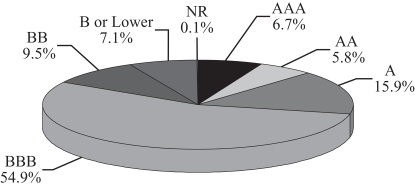
| 3 | For financial reporting purposes, credit quality ratings shown above reflect the lowest rating assigned by either Standard & Poor’s (“S&P”) or Moody’s Investors Service (“Moody’s”) if ratings differ. These rating agencies are independent, nationally recognized statistical rating organizations and are widely used. Investment grade ratings are credit ratings of BBB/Baa or higher. Below investment grade ratings are credit ratings of BB/Ba or lower. Investments designated NR are not rated by either rating agency. Unrated investments do not necessarily indicate low credit quality. Credit quality ratings and the Fund’s allocation to the ratings categories are subject to change at any time without notice. |
We would like to remind shareholders of the opportunities presented by the Fund’s dividend reinvestment plan referred to in the Shareholder Information section of this report. The dividend reinvestment plan affords shareholders a price advantage by allowing them to purchase shares at NAV or market price, whichever is lower. This means that the reinvestment price is at market price when the Fund is trading at a discount to NAV, as is currently the situation, or at NAV per share when market trading is at a premium to that value. To participate in the plan, please contact BNY Mellon Investment Servicing (US) Inc., the Fund’s Transfer Agent and Dividend Paying Agent, at 1-866-333-6685. The Fund’s investment adviser, Cutwater Investor Services Corp., may be reached at 1-212-527-1800.

Cliff Corso
Chief Executive Officer
Insight Select Income Fund
April 19, 2018
Mr. Corso’s comments reflect the investment adviser’s views generally regarding the market and the economy, and are compiled from the investment adviser’s research. These comments reflect opinions as of the date written and are subject to change at any time.
3
Opinions expressed herein are current opinions of Insight*, and are subject to change without notice. Insight* assumes no responsibility to update such information or to notify a client of any changes. Any outlooks, forecasts or portfolio weightings presented herein are as of the date appearing on this material only and are also subject to change without notice. Insight disclaims any responsibility to update such views. No forecasts can be guaranteed.
Information herein may contain, include or is based upon forward-looking statements within the meaning of the federal securities laws, specifically Section 21E of the Securities Exchange Act of 1934, as amended. Forward-looking statements include all statements, other than statements of historical fact, that address future activities, events or developments, including without limitation, business or investment strategy or measures to implement strategy, competitive strengths, goals expansion and growth of our business, plans, prospects and references to future or success. You can identify these statements by the fact that they do not relate strictly to historical or current facts. Words such as ‘anticipate,’ ‘estimate,’ ‘expect,’ ‘project,’ ‘intend,’ ‘plan,’ ‘believe,’ and other similar words are intended to identify these forward-looking statements. Forward-looking statements can be affected by inaccurate assumptions or by known or unknown risks and uncertainties. Many such factors will be important in determining our actual future results or outcomes. Consequently, no forward-looking statement can be guaranteed. Our actual results or outcomes may vary materially. Given these uncertainties, you should not place undue reliance on these forward-looking statements.
Past performance is not a guide to future performance, which will vary. The value of investments and any income from them will fluctuate and is not guaranteed (this may partly be due to exchange rate changes). Future returns are not guaranteed and a loss of principal may occur.
The quoted benchmarks within this presentation do not reflect deductions for fees, expenses or taxes. These benchmarks are unmanaged and cannot be purchased directly by investors. Benchmark performance is shown for illustrative purposes only and does not predict or depict the performance of any investment. There may be material factors relevant to any such comparison such as differences in volatility, and regulatory and legal restrictions between the indices shown and the strategy.
| * | Cutwater Investor Services Corp. (d/b/a Insight Investment and referred to herein as “Insight Investment” or the “Adviser”). |
4
REPORT OF INDEPENDENT REGISTERED PUBLIC ACCOUNTING FIRM
To the Shareholders and
Board of Trustees of
Insight Select Income Fund
Opinion on the Financial Statements
We have audited the accompanying statement of assets and liabilities of Insight Select Income Fund (the “Fund”), including the schedule of investments, as of March 31, 2018, the related statement of operations for the year then ended, the statements of changes in net assets for each of the two years in the period then ended, and financial highlights for each of the five years in the period then ended, and the related notes (collectively referred to as the “financial statements”). In our opinion, the financial statements present fairly, in all material respects, the financial position of the Fund as of March 31, 2018, the results of its operations for the year then ended, the changes in its net assets for each of the two years in the period then ended, and the financial highlights for each of the five years in the period then ended, in conformity with accounting principles generally accepted in the United States of America.
Basis for Opinion
These financial statements are the responsibility of the Fund’s management. Our responsibility is to express an opinion on the Fund’s financial statements based on our audits. We are a public accounting firm registered with the Public Company Accounting Oversight Board (United States) (“PCAOB”) and are required to be independent with respect to the Fund in accordance with the U.S. federal securities laws and the applicable rules and regulations of the Securities and Exchange Commission and the PCAOB. We have served as the Fund’s auditor since 2003.
We conducted our audits in accordance with the standards of the PCAOB. Those standards require that we plan and perform the audit to obtain reasonable assurance about whether the financial statements are free of material misstatement, whether due to error or fraud. The Fund is not required to have, nor were we engaged to perform, an audit of its internal control over financial reporting. As part of our audits we are required to obtain an understanding of internal control over financial reporting, but not for the purpose of expressing an opinion on the effectiveness of the Fund’s internal control over financial reporting. Accordingly, we express no such opinion.
Our audits included performing procedures to assess the risks of material misstatement of the financial statements, whether due to error or fraud, and performing procedures that respond to those risks. Such procedures included examining, on a test basis, evidence regarding the amounts and disclosures in the financial statements. Our audits also included evaluating the accounting principles used and significant estimates made by management, as well as evaluating the overall presentation of the financial statements. Our procedures included confirmation of securities owned as of March 31, 2018 by correspondence with the custodian and brokers; when replies were not received from brokers, we performed other auditing procedures. We believe that our audits provide a reasonable basis for our opinion.
TAIT, WELLER & BAKER LLP
Philadelphia, Pennsylvania
May 14, 2018
5
| | | | |
| SCHEDULE OF INVESTMENTS | | | March 31, 2018 | |
| | | | | | | | | | |
| | | Moody’s/
Standard &
Poor’s
Rating(a) | | Principal
Amount (000’s) | | | Value
(Note 1) | |
CORPORATE DEBT SECURITIES (78.01%) | | | | | | | | | | |
AUTOMOTIVE (1.68%) | | | | | | | | | | |
Ford Holdings LLC, Co. Gty., 9.30%, 03/01/30 | | Baa2/BBB | | $ | 1,000 | | | $ | 1,361,882 | |
Ford Motor Co., Sr. Unsec. Notes, 8.90%, 01/15/32 | | Baa2/BBB | | | 500 | | | | 667,196 | |
Ford Motor Credit Co. LLC, Sr. Unsec. Notes, 2.343%, 11/02/20 | | Baa2/BBB | | | 1,719 | | | | 1,673,813 | |
| | | | | | | | | | |
| | | | | | | | | 3,702,891 | |
| | | | | | | | | | |
CHEMICALS (1.82%) | | | | | | | | | | |
Dow Chemical Co., Sr. Unsec. Notes, 8.55%, 05/15/19 | | Baa2/BBB | | | 500 | | | | 530,710 | |
Mexichem SAB de CV, Co. Gty., 4.00%, 10/04/27, 144A(b) | | Baa3/BBB- | | | 467 | | | | 443,650 | |
OLIN Corp., Sr. Unsec. Notes, 5.00%, 02/01/30(b) | | Ba1/BB | | | 379 | | | | 362,892 | |
Union Carbide Corp., Sr. Unsec. Notes, 7.75%, 10/01/96 | | Baa2/BBB | | | 2,000 | | | | 2,658,316 | |
| | | | | | | | | | |
| | | | | | | | | 3,995,568 | |
| | | | | | | | | | |
COMMERCIAL SERVICES (0.25%) | | | | | | | | | | |
Global Partners LP, Co. Gty., Class Global Partners LP, 6.25%, 07/15/22(b) | | B2/B+ | | | 555 | | | | 552,225 | |
| | | | | | | | | | |
CONSUMER PRODUCTS (0.47%) | | | | | | | | | | |
Newell Brands, Inc., Sr. Unsec. Notes, 4.20%, 04/01/26(b) | | Baa3/BBB- | | | 1,036 | | | | 1,025,656 | |
| | | | | | | | | | |
DIVERSIFIED FINANCIAL SERVICES (12.91%) | | | | | | | | | | |
Bank of America Corp. Sr. Unsec. Notes, (3M LIBOR +0.79%), 3.004%, 12/20/23, 144A(b),(c) | | A3/A- | | | 758 | | | | 743,490 | |
Bank of America Corp. Sr. Unsec. Notes, (3M LIBOR +0.81%), 3.366%, 01/23/26(b),(c) | | A3/A- | | | 559 | | | | 543,794 | |
Bank of America Corp., Sub. Notes, 4.45%, 03/03/26 | | Baa2/BBB+ | | | 1,764 | | | | 1,801,996 | |
Bank of Nova Scotia, Jr. Sub. Notes, (3M LIBOR +2.648%), 4.65%, 10/12/22(b),(c),(d) | | Baa3/BBB- | | | 586 | | | | 553,037 | |
Barclays Bank PLC, Sr. Unsec. Notes, (3M LIBOR +0.46%), 2.165%, 01/11/21(b),(e) | | A1/A | | | 1,233 | | | | 1,232,036 | |
Barclays PLC, Sub. Notes, 4.836%, 05/09/28(b) | | Baa3/BB+ | | | 906 | | | | 890,923 | |
CDP Financial, Inc., Co. Gty., 4.40%, 11/25/19, 144A | | Aaa/AAA | | | 400 | | | | 411,121 | |
Citigroup, Inc., Sr. Unsec. Notes, (3M LIBOR +1.563%), 3.887%, 01/10/28(b),(c) | | Baa1/BBB+ | | | 1,100 | | | | 1,094,045 | |
Citigroup, Inc., Sr. Unsec. Notes, 8.125%, 07/15/39 | | Baa1/BBB+ | | | 70 | | | | 106,001 | |
Citigroup, Inc., Sub. Notes, 4.60%, 03/09/26 | | Baa3/BBB | | | 988 | | | | 1,013,439 | |
Citigroup, Inc., Sub. Notes, 5.30%, 05/06/44 | | Baa3/BBB | | | 926 | | | | 1,015,648 | |
Credit Agricole SA, Sub. Notes, (5Yr Swap +1.644%), 4.00%, 01/10/33, 144A(b),(c) | | Baa2/BBB | | | 1,025 | | | | 975,475 | |
Discover Financial Services, Sr. Unsec. Notes, 10.25%, 07/15/19 | | Ba1/BBB- | | | 200 | | | | 216,906 | |
GE Capital International Funding, Co. Gty., 4.418%, 11/15/35 | | A2/A | | | 588 | | | | 574,800 | |
General Electric Co., Jr. Sub. Notes, (3M LIBOR +3.33%), 5.00%, 01/21/21(b),(c),(d) | | Baa1/BBB+ | | | 1,009 | | | | 998,910 | |
General Electric Co., Sr. Unsec. Notes, 6.875%, 01/10/39 | | A2/A | | | 287 | | | | 371,738 | |
Goldman Sachs Group, Inc., Sr. Unsec. Notes, 3.50%, 11/16/26(b) | | A3/BBB+ | | | 1,040 | | | | 1,001,975 | |
Goldman Sachs Group, Inc., Sr. Unsec. Notes, (3M LIBOR +1.75%), 3.51%, 10/28/27(b),(e) | | A3/BBB+ | | | 550 | | | | 575,932 | |
HSBC Capital Funding LP, Co. Gty., (3M LIBOR +4.98%), 10.176%, 06/30/30, 144A(b),(c),(d) | | Baa2/BBB- | | | 2,180 | | | | 3,418,502 | |
Intesa Sanpaolo SpA, Sr. Unsec. Notes, 3.375%, 01/12/23, 144A | | Baa1/BBB | | | 425 | | | | 414,901 | |
Intesa Sanpaolo SpA, Sr. Unsec. Notes, 3.875%, 01/12/28, 144A | | Baa1/BBB | | | 428 | | | | 403,678 | |
JPMorgan Chase & Co., Jr. Sub. Notes, (3M LIBOR +3.47%), 7.90%, 07/30/18(b),(c),(d) | | Baa3/BBB- | | | 2,000 | | | | 2,010,200 | |
JPMorgan Chase & Co., Jr. Sub. Notes, (3M LIBOR +2.58%), 4.625%, 11/01/22(b),(c),(d) | | Baa3/NA | | | 1,159 | | | | 1,103,948 | |
Lincoln Finance, Ltd., Sr. Sec. Notes, 7.375%, 04/15/21, 144A(b) | | B1/BB+ | | | 225 | | | | 232,312 | |
Nasdaq, Inc., Sr. Unsec. Notes, 3.85%, 06/30/26(b) | | Baa2/BBB | | | 1,294 | | | | 1,276,501 | |
PNC Financial Services Group, Inc., Jr. Sub. Notes, (3M LIBOR +3.30%), 5.00%, 11/01/26(b),(c),(d) | | Baa2/BBB- | | | 1,587 | | | | 1,579,858 | |
Santander UK PLC, Sr. Unsec. Notes, (3M LIBOR +0.30%), 2.087%, 11/03/20(e) | | Aa3/A | | | 1,623 | | | | 1,619,920 | |
UBS AG, Sub. Notes, 7.625%, 08/17/22 | | NA/BBB+ | | | 2,000 | | | | 2,245,000 | |
| | | | | | | | | | |
| | | | | | | | | 28,426,086 | |
| | | | | | | | | | |
The accompanying notes are an integral part of these financial statements.
6
SCHEDULE OF INVESTMENTS—continued
| | | | | | | | | | |
| | | Moody’s/
Standard &
Poor’s
Rating(a) | | Principal
Amount (000’s) | | | Value
(Note 1) | |
CORPORATE DEBT SECURITIES (Continued) | | | | | | | | | | |
ENERGY (13.23%) | | | | | | | | | | |
Andeavor Logistics LP, Co. Gty., 4.25%, 12/01/27(b) | | Ba1/BBB- | | $ | 901 | | | $ | 878,366 | |
Cimarex Energy Co., Sr. Unsec. Notes, 3.90%, 05/15/27(b) | | Baa3/BBB- | | | 413 | | | | 407,298 | |
CITGO Petroleum Corp., Sr. Sec. Notes, 6.25%, 08/15/22, 144A(b) | | B3/B+ | | | 3,170 | | | | 3,142,263 | |
Continental Resources Inc., Sr. Unsec. Notes, 4.375%, 01/15/28, 144A(b) | | Ba2/BBB- | | | 1,655 | | | | 1,613,625 | |
Enbridge Inc., Sr. Unsec. Notes, 5.50%, 12/01/46(b) | | Baa3/BBB+ | | | 1,496 | | | | 1,667,996 | |
Enbridge Inc., Sub. Notes, (3M LIBOR +3.89%), 6.00%, 01/15/77(b),(c) | | Ba2/BBB- | | | 750 | | | | 738,750 | |
Endeavor Energy Resources LP, Sr. Unsec. Notes, 5.50%, 01/30/26, 144A(b) | | B3/BB- | | | 89 | | | | 88,555 | |
Endeavor Energy Resources LP, Sr. Unsec. Notes, 5.75%, 01/30/28, 144A(b) | | B3/BB- | | | 138 | | | | 137,483 | |
EnLink Midstream Partners LP, Jr. Sub. Notes, (3M LIBOR +4.11%), 6.00%, 12/15/22(b),(c),(d) | | Ba3/BB | | | 641 | | | | 597,733 | |
Enterprise Products Operating LLC, Co. Gty., (3M LIBOR +2.57%), 5.375%, 02/15/78(b),(c) | | Baa2/BBB- | | | 342 | | | | 327,560 | |
Florida Gas Transmission Co. LLC, Sr. Unsec. Notes, 9.19%, 11/01/24, 144A | | Baa2/BBB | | | 70 | | | | 78,588 | |
Kinder Morgan, Inc., Co. Gty., 8.05%, 10/15/30 | | Baa3/BBB- | | | 1,000 | | | | 1,219,417 | |
Kinder Morgan, Inc., Co. Gty., 5.55%, 06/01/45(b) | | Baa3/BBB- | | | 1,755 | | | | 1,841,799 | |
Marathon Petroleum Corp., Sr. Unsec. Notes, 4.75%, 09/15/44(b) | | Baa2/BBB | | | 1,266 | | | | 1,272,649 | |
Marathon Petroleum Corp., Sr. Unsec. Notes, 5.85%, 12/15/45(b) | | Baa2/BBB | | | 500 | | | | 550,517 | |
McDermott International Inc., Sec. Notes, 8.00%, 05/01/21, 144A(b) | | B2/BB- | | | 1,175 | | | | 1,199,969 | |
MPLX LP, Sr. Unsec. Notes, 5.20%, 03/01/47(b) | | Baa3/BBB | | | 641 | | | | 669,838 | |
MPLX LP, Sr. Unsec. Notes, 4.90%, 04/15/58(b) | | Baa3/BBB | | | 561 | | | | 539,654 | |
NGPL PipeCo PLC, Sr. Unsec. Notes, 7.768%, 12/15/37, 144A | | Ba1/BB+ | | | 505 | | | | 611,050 | |
Panhandle Eastern Pipe Line Co. LP, Sr. Unsec. Notes, 7.00%, 07/15/29 | | Baa3/BBB- | | | 1,000 | | | | 1,041,143 | |
Parkland Fuel Corp., Sr. Unsec. Notes, 6.00%, 04/01/26, 144A(b) | | B1/BB- | | | 225 | | | | 226,125 | |
PBF Holding Co. LLC, Co. Gty., 7.25%, 06/15/25(b) | | B1/BB | | | 1,985 | | | | 2,061,919 | |
Petroleos Mexicanos, Co. Gty., 8.00%, 05/03/19 | | Baa3/BBB+ | | | 250 | | | | 262,188 | |
Petroleos Mexicanos, Co. Gty., 6.00%, 03/05/20 | | Baa3/BBB+ | | | 478 | | | | 498,076 | |
Petroleos Mexicanos, Co. Gty., 6.75%, 09/21/47 | | Baa3/BBB+ | | | 1,415 | | | | 1,431,810 | |
Spectra Energy Partners LP, Sr. Unsec. Notes, 3.375%, 10/15/26(b) | | Baa2/BBB+ | | | 803 | | | | 757,885 | |
Sunoco LP, Co. Gty., 5.50%, 02/15/26, 144A(b) | | B1/BB- | | | 700 | | | | 675,500 | |
Valero Energy Corp., Co. Gty., 8.75%, 06/15/30 | | Baa2/BBB | | | 1,000 | | | | 1,356,151 | |
Valero Energy Corp., Sr. Unsec. Notes, 10.50%, 03/15/39 | | Baa2/BBB | | | 500 | | | | 824,446 | |
Williams Partners LP, Sr. Unsec. Notes, 4.30%, 03/04/24(b) | | Baa3/BBB | | | 1,670 | | | | 1,692,817 | |
Williams Partners LP, Sr. Unsec. Notes, 4.00%, 09/15/25(b) | | Baa3/BBB | | | 730 | | | | 718,258 | |
| | | | | | | | | | |
| | | | | | | | | 29,129,428 | |
| | | | | | | | | | |
FOOD AND BEVERAGE (0.70%) | | | | | | | | | | |
Anheuser-Busch InBev Finance, Inc., Co. Gty., 4.70%, 02/01/36(b) | | A3/A- | | | 645 | | | | 682,452 | |
Anheuser-Busch InBev Finance, Inc., Co. Gty., 4.90%, 02/01/46(b) | | A3/A- | | | 256 | | | | 276,099 | |
Anheuser-Busch InBev Worldwide, Inc., Co. Gty., 8.20%, 01/15/39 | | A3/A- | | | 27 | | | | 40,360 | |
Campbell Soup Co., Sr. Unsec. Notes, 4.15%, 03/15/28(b) | | Baa2/BBB | | | 551 | | | | 546,956 | |
| | | | | | | | | | |
| | | | | | | | | 1,545,867 | |
| | | | | | | | | | |
GAMING, LODGING & LEISURE (0.97%) | | | | | | | | | | |
Wyndham Worldwide Corp., Sr. Unsec. Notes, 4.50%, 04/01/27(b) | | Baa3/BBB- | | | 2,140 | | | | 2,125,671 | |
| | | | | | | | | | |
HEALTHCARE (0.76%) | | | | | | | | | | |
Allergan Funding SCS, Co. Gty., 4.75%, 03/15/45(b) | | Baa3/BBB | | | 61 | | | | 59,844 | |
CVS Health Corp., Sr. Unsec. Notes, 4.78%, 03/25/38(b) | | Baa1/BBB | | | 916 | | | | 928,394 | |
Mylan NV, Co. Gty., 3.95%, 06/15/26(b) | | Baa3/BBB- | | | 397 | | | | 385,058 | |
Mylan NV, Co. Gty., 5.25%, 06/15/46(b) | | Baa3/BBB- | | | 169 | | | | 172,358 | |
Valeant Pharmaceuticals International Inc., Sr. Sec. Notes, 5.50%, 11/01/25, 144A(b) | | Ba3/BB- | | | 132 | | | | 128,502 | |
| | | | | | | | | | |
| | | | | | | | | 1,674,156 | |
| | | | | | | | | | |
INDUSTRIAL (1.18%) | | | | | | | | | | |
Cleveland-Cliffs Inc., Sr. Sec. Notes, 4.875%, 01/15/24, 144A(b) | | Ba3/BB- | | | 744 | | | | 721,680 | |
Heathrow Funding, Ltd., Sr. Sec. Notes, 4.875%, 07/15/23, 144A | | NA/A- | | | 200 | | | | 210,996 | |
The accompanying notes are an integral part of these financial statements.
7
SCHEDULE OF INVESTMENTS—continued
| | | | | | | | | | | | |
| | | Moody’s/
Standard &
Poor’s
Rating(a) | | | Principal
Amount (000’s) | | | Value
(Note 1) | |
CORPORATE DEBT SECURITIES (Continued) | | | | | | | | | | | | |
INDUSTRIAL (Continued) | | | | | | | | | | | | |
Northrop Grumman Space & Mission Systems Corp., Co. Gty., 7.75%, 06/01/29 | | | Baa1/BBB+ | | | $ | 500 | | | $ | 642,172 | |
Sydney Airport Finance Co. Property, Ltd., Sr. Sec. Notes, 3.375%, 04/30/25, 144A(b) | | | Baa1/BBB+ | | | | 400 | | | | 389,168 | |
United Technologies Corp., Sr. Unsec. Notes, 3.75%, 11/01/46(b) | | | A3/A- | | | | 700 | | | | 631,227 | |
| | | | | | | | | | | | |
| | | | | | | | | | | 2,595,243 | |
| | | | | | | | | | | | |
INSURANCE (12.50%) | | | | | | | | | | | | |
Allstate Corp., Jr. Sub. Notes, (3M LIBOR +2.12%), 6.50%, 05/15/67(b),(c) | | | Baa1/BBB | | | | 2,200 | | | | 2,552,000 | |
American International Group, Inc., Jr. Sub. Notes, (3M LIBOR +4.195%), 8.175%, 05/15/68(b),(c) | | | Baa2/BBB- | | | | 2,500 | | | | 3,325,000 | |
Chubb Corp., Co. Gty., (3M LIBOR +2.25%), 3.972%, 03/29/67(b),(c) | | | Baa1/BBB+ | | | | 4,416 | | | | 4,414,675 | |
Farmers Exchange Capital, Sub. Notes, 7.20%, 07/15/48, 144A | | | Baa2/BBB+ | | | | 2,250 | | | | 2,813,017 | |
Guardian Life Insurance Co. of America, Sub. Notes, 4.85%, 01/24/77, 144A | | | A1/AA- | | | | 148 | | | | 152,516 | |
Liberty Mutual Group, Inc., Co. Gty., Sr. Unsec. Notes, (3M LIBOR +2.905%), 5.03%, 03/07/67, 144A(b),(c) | | | Baa3/BB+ | | | | 1,530 | | | | 1,505,138 | |
Liberty Mutual Group, Inc., Co. Gty., 7.00%, 03/15/34, 144A | | | Baa2/BBB | | | | 250 | | | | 314,195 | |
Liberty Mutual Group, Inc., Co. Gty., (3M LIBOR +7.12%), 10.75%, 06/15/88, 144A(b),(c) | | | Baa3/BB+ | | | | 1,000 | | | | 1,550,000 | |
Lincoln National Corp., Sr. Unsec. Notes, 3.80%, 03/01/28(b) | | | Baa1/A- | | | | 250 | | | | 247,851 | |
Massachusetts Mutual Life Insurance Co., Sub. Notes, 4.90%, 04/01/77, 144A | | | NA/AA- | | | | 980 | | | | 1,008,104 | |
Massachusetts Mutual Life Insurance Co., Sub. Notes, 8.875%, 06/01/39, 144A | | | A1/AA- | | | | 151 | | | | 237,303 | |
MetLife, Inc., Jr. Sub. Notes, 9.25%, 04/08/68, 144A(b) | | | Baa2/BBB | | | | 500 | | | | 680,000 | |
MetLife, Inc., Jr. Sub. Notes, (3M LIBOR + 2.205%), 6.40%, 12/15/66(c) | | | Baa2/BBB | | | | 637 | | | | 698,311 | |
MetLife, Inc., Jr. Sub. Notes, 10.75%, 08/01/69(b) | | | Baa2/BBB | | | | 1,000 | | | | 1,570,000 | |
Nationwide Mutual Insurance Co., Sub. Notes, 8.25%, 12/01/31, 144A | | | A3/A- | | | | 500 | | | | 685,775 | |
Nationwide Mutual Insurance Co., Sub. Notes, 9.375%, 08/15/39, 144A | | | A3/A- | | | | 215 | | | | 347,735 | |
New York Life Insurance Co., Sub. Notes, 6.75%, 11/15/39, 144A | | | Aa2/AA- | | | | 103 | | | | 139,738 | |
Pricoa Global Funding Inc., Sec. Notes, 2.45%, 09/21/22, 144A | | | A1/AA- | | | | 608 | | | | 589,900 | |
Prudential Financial, Inc., Jr. Sub. Notes, (3M LIBOR +3.04%), 5.20%, 03/15/44(b),(c) | | | Baa2/BBB+ | | | | 2,500 | | | | 2,543,750 | |
SAFG Retirement Services, Inc., Sr. Unsec. Notes, 8.125%, 04/28/23 | | | Baa1/BBB+ | | | | 1,800 | | | | 2,131,994 | |
| | | | | | | | | | | | |
| | | | | | | | | | | 27,507,002 | |
| | | | | | | | | | | | |
MEDIA (8.13%) | | | | | | | | | | | | |
21st Century Fox America, Inc., Co. Gty., 7.90%, 12/01/95 | | | Baa1/BBB+ | | | | 1,400 | | | | 2,036,379 | |
Altice France SA, Sr. Sec. Notes, 6.25%, 05/15/24, 144A(b) | | | B1/B+ | | | | 1,780 | | | | 1,677,650 | |
Comcast Corp., Co. Gty., 7.05%, 03/15/33 | | | A3/A- | | | | 2,000 | | | | 2,647,429 | |
Cox Communications, Inc., Sr. Unsec. Notes, 6.80%, 08/01/28 | | | Baa2/BBB | | | | 1,500 | | | | 1,756,165 | |
Cox Enterprises, Inc., Sr. Unsec. Notes, 7.375%, 07/15/27, 144A | | | Baa2/BBB- | | | | 500 | | | | 597,822 | |
Discovery Communications LLC, Co. Gty., 5.00%, 09/20/37(b) | | | Baa3/BBB- | | | | 374 | | | | 372,738 | |
Grupo Televisa SAB, Sr. Unsec. Notes, 5.00%, 05/13/45(b) | | | Baa1/BBB+ | | | | 557 | | | | 523,374 | |
Grupo Televisa SAB, Sr. Unsec. Notes, 6.625%, 01/15/40 | | | Baa1/BBB+ | | | | 159 | | | | 182,444 | |
RELX, Inc., Sr. Unsec. Notes, 8.875%, 06/01/22 | | | WR/BBB+ | | | | 2,000 | | | | 2,307,292 | |
Sirius XM Radio, Inc., Co. Gty., 5.00%, 08/01/27, 144A(b) | | | Ba3/BB | | | | 518 | | | | 486,920 | |
Time Warner Entertainment Co. LP, Sr. Sec. Notes, 8.375%, 07/15/33 | | | Ba1/BBB- | | | | 1,360 | | | | 1,769,844 | |
Viacom, Inc., Sr. Unsec. Notes, 6.875%, 04/30/36 | | | Baa3/BBB- | | | | 894 | | | | 1,062,790 | |
VTR Finance BV, Sr. Sec. Notes, 6.875%, 01/15/24, 144A(b) | | | B1/B+ | | | | 2,375 | | | | 2,473,586 | |
| | | | | | | | | | | | |
| | | | | | | | | | | 17,894,433 | |
| | | | | | | | | | | | |
MINING (2.11%) | | | | | | | | | | | | |
BHP Billiton Finance USA, Ltd. Co. Gty., (5Yr Swap +5.093%), 6.75%, 10/19/75, 144A(b),(c) | | | Baa2/BBB+ | | | | 972 | | | | 1,091,070 | |
Ferroglobe PLC, Co. Gty., 9.375%, 03/01/22, 144A(b) | | | B3/NA | | | | 652 | | | | 678,080 | |
First Quantum Minerals Ltd., Co. Gty., 7.25%, 04/01/23, 144A(b) | | | B3/B | | | | 538 | | | | 531,275 | |
Teck Resources, Ltd., Co. Gty., 6.00%, 08/15/40(b) | | | Ba3/BB+ | | | | 1,000 | | | | 1,030,000 | |
Teck Resources, Ltd., Co. Gty., 5.20%, 03/01/42(b) | | | Ba3/BB+ | | | | 1,415 | | | | 1,323,025 | |
| | | | | | | | | | | | |
| | | | | | | | | | | 4,653,450 | |
| | | | | | | | | | | | |
The accompanying notes are an integral part of these financial statements.
8
SCHEDULE OF INVESTMENTS—continued
| | | | | | | | | | | | |
| | | Moody’s/
Standard &
Poor’s
Rating(a) | | | Principal
Amount (000’s) | | | Value
(Note 1) | |
CORPORATE DEBT SECURITIES (Continued) | | | | | | | | | | | | |
PAPER (1.70%) | | | | | | | | | | | | |
Smurfit Kappa Treasury Funding, Ltd., Co. Gty., 7.50%, 11/20/25 | | | Ba1/BB+ | | | $ | 2,000 | | | $ | 2,405,000 | |
WestRock LLC, Co. Gty., 8.20%, 01/15/30 | | | Baa2/BBB | | | | 1,000 | | | | 1,347,066 | |
| | | | | | | | | | | | |
| | | | | | | | | | | 3,752,066 | |
| | | | | | | | | | | | |
RETAIL & RESTAURANT (0.07%) | | | | | | | | | | | | |
McDonald’s Corp., Sr. Unsec. Notes, 3.70%, 01/30/26(b) | | | Baa1/BBB+ | | | | 146 | | | | 146,823 | |
| | | | | | | | | | | | |
TECHNOLOGY (1.51%) | | | | | | | | | | | | |
j2 Cloud Services LLC, Co. Gty., 6.00%, 07/15/25, 144A(b) | | | Ba3/BB | | | | 564 | | | | 577,395 | |
NXP Funding LLC, Co. Gty., 3.875%, 09/01/22, 144A | | | Ba1/BBB- | | | | 2,213 | | | | 2,196,403 | |
Pitney Bowes, Inc., Sr. Unsec. Notes, 4.125%, 05/15/22(b),(f) | | | Ba1/BBB- | | | | 591 | | | | 558,495 | |
| | | | | | | | | | | | |
| | | | | | | | | | | 3,332,293 | |
| | | | | | | | | | | | |
TELECOMMUNICATIONS (6.43%) | | | | | | | | | | | | |
Altice Financing SA, Sr. Sec. Notes, 6.625%, 02/15/23, 144A(b) | | | B1/BB- | | | | 200 | | | | 198,000 | |
AT&T Inc., Sr. Unsec. Notes, 4.50%, 05/15/35(b) | | | Baa1/BBB+ | | | | 1,750 | | | | 1,718,769 | |
AT&T Inc., Sr. Unsec. Notes, 4.75%, 05/15/46(b) | | | Baa1/BBB+ | | | | 425 | | | | 412,779 | |
Centel Capital Corp., Co. Gty., 9.00%, 10/15/19 | | | Ba2/BBB- | | | | 1,000 | | | | 1,080,667 | |
Deutsche Telekom International Finance BV, Co. Gty., 8.75%, 06/15/30 | | | Baa1/BBB+ | | | | 2,000 | | | | 2,832,711 | |
Digicel, Ltd., Sr. Unsec. Notes, 6.00%, 04/15/21, 144A(b) | | | B1/NA | | | | 500 | | | | 469,375 | |
Frontier Communications Corp., Sr. Unsec. Notes, 8.125%, 10/01/18 | | | Caa1/B- | | | | 500 | | | | 505,100 | |
Qwest Corp., Sr. Unsec. Notes, 7.25%, 10/15/35(b) | | | Ba2/BBB- | | | | 500 | | | | 494,772 | |
Sprint Capital Corp., Co. Gty., 6.875%, 11/15/28 | | | B3/B | | | | 500 | | | | 466,250 | |
Sprint Capital Corp., Co. Gty., 8.75%, 03/15/32 | | | B3/B | | | | 1,000 | | | | 1,045,000 | |
Sprint Spectrum Co. LLC, Sr. Unsec. Notes, 4.738%, 09/20/29, 144A | | | Baa2/NA | | | | 1,100 | | | | 1,104,125 | |
Tencent Holdings, Ltd., Sr. Unsec. Notes, 3.595%, 01/19/28, 144A(b) | | | A1/A+ | | | | 1,954 | | | | 1,882,053 | |
Verizon Communications, Inc., Sr. Unsec. Notes, 4.812%, 03/15/39 | | | Baa1/BBB+ | | | | 1,898 | | | | 1,939,575 | |
| | | | | | | | | | | | |
| | | | | | | | | | | 14,149,176 | |
| | | | | | | | | | | | |
TRANSPORTATION (4.33%) | | | | | | | | | | | | |
American Airlines, Pass Through Certs., Series 2013-2, Class B, 5.60%, 01/15/22, 144A | | | NA/BBB- | | | | 1,674 | | | | 1,715,960 | |
American Airlines, Pass Through Certs., Series 2017-1, Class AA, 3.65%, 08/15/30 | | | Aa3/NA | | | | 1,059 | | | | 1,049,755 | |
American Airlines, Pass Through Certs., Series 2017-2, Class AA, 3.35%, 04/15/31 | | | Aa3/NA | | | | 1,587 | | | | 1,540,039 | |
BNSF Funding Trust I, Co. Gty., (3M LIBOR +2.35%), 6.613%, 12/15/55(b),(c) | | | Baa2/A | | | | 250 | | | | 278,750 | |
British Airways, Pass Through Certs., Series 2013-1, Class B, 5.625%, 12/20/21, 144A | | | A3/A- | | | | 712 | | | | 731,662 | |
Continental Airlines, Pass Through Certs., Series 1999-1, Class B, 6.795%, 02/02/20 | | | Ba1/BBB | | | | 23 | | | | 23,021 | |
Continental Airlines, Pass Through Certs., Series 2000-1, Class A1, 8.048%, 05/01/22 | | | Baa1/A- | | | | 359 | | | | 383,242 | |
Continental Airlines, Pass Through Certs., Series 2000-2, Class A1, 7.707%, 10/02/22 | | | Baa1/BBB | | | | 251 | | | | 268,882 | |
ERAC USA Finance LLC, Co. Gty., 7.00%, 10/15/37, 144A | | | Baa1/A- | | | | 1,500 | | | | 1,955,011 | |
JSL Europe SA, Co. Gty., 7.75%, 07/26/24, 144A(b) | | | NA/BB- | | | | 1,227 | | | | 1,246,939 | |
United Airlines, Pass Through Certs., Series 2013-1, Class B, 5.375%, 02/15/23 | | | NA/BBB- | | | | 340 | | | | 348,925 | |
| | | | | | | | | | | | |
| | | | | | | | | | | 9,542,186 | |
| | | | | | | | | | | | |
UTILITIES (7.26%) | | | | | | | | | | | | |
Black Hills Corp., Sr. Unsec. Notes, 3.95%, 01/15/26(b) | | | Baa2/BBB | | | | 1,082 | | | | 1,100,775 | |
Cleveland Electric Illuminating Co., Sr. Unsec. Notes, 3.50%, 04/01/28, 144A(b) | | | Baa3/BBB- | | | | 800 | | | | 764,761 | |
Duquesne Light Holdings, Inc., Sr. Unsec. Notes, 6.40%, 09/15/20, 144A | | | Baa3/BBB- | | | | 1,000 | | | | 1,070,062 | |
Electricite de France SA, Jr. Sub. Notes, (10Yr Swap +3.709%), 5.25%, 01/29/23, 144A(b),(c),(d) | | | Baa3/BB | | | | 1,000 | | | | 1,002,000 | |
Enel Finance International NV, Co. Gty., 2.75%, 04/06/23, 144A | | | Baa2/BBB+ | | | | 1,082 | | | | 1,045,578 | |
Exelon Corp., Sr. Unsec. Notes, 3.40%, 04/15/26(b) | | | Baa2/BBB- | | | | 505 | | | | 487,639 | |
FirstEnergy Corp., Sr. Unsec. Notes, 4.85%, 07/15/47(b) | | | Baa3/BB+ | | | | 1,570 | | | | 1,651,394 | |
Hydro-Quebec, 8.25%, 04/15/26 | | | Aa2/AA- | | | | 1,550 | | | | 2,026,523 | |
Kansas City Power & Light Co., Sr. Unsec. Notes, 4.20%, 06/15/47(b) | | | Baa1/BBB+ | | | | 917 | | | | 917,783 | |
MidAmerican Funding LLC, Sr. Sec. Notes, 6.927%, 03/01/29 | | | A2/A- | | | | 500 | | | | 644,457 | |
Ohio Power Co., Sr. Unsec. Notes, 5.375%, 10/01/21 | | | A2/A- | | | | 1,000 | | | | 1,076,128 | |
The accompanying notes are an integral part of these financial statements.
9
SCHEDULE OF INVESTMENTS—continued
| | | | | | | | | | | | |
| | | Moody’s/
Standard &
Poor’s
Rating(a) | | | Principal
Amount (000’s) | | | Value
(Note 1) | |
CORPORATE DEBT SECURITIES (Continued) | | | | | | | | | | | | |
UTILITIES (Continued) | | | | | | | | | | | | |
Southern Co. Gas Capital Corp., Co. Gty., 5.875%, 03/15/41(b) | | | Baa1/A- | | | $ | 992 | | | $ | 1,194,127 | |
Southern Co. Gas Capital Corp., Co. Gty., 3.95%, 10/01/46(b) | | | Baa1/A- | | | | 539 | | | | 511,384 | |
Southern Co. Gas Capital Corp., Co. Gty., 4.40%, 05/30/47(b) | | | Baa1/A- | | | | 1,164 | | | | 1,179,510 | |
Toledo Edison Co., 7.25%, 05/01/20 | | | Baa1/BBB+ | | | | 80 | | | | 85,806 | |
Transelec SA, Sr. Unsec. Notes, 4.25%, 01/14/25, 144A(b) | | | Baa1/BBB | | | | 750 | | | | 756,364 | |
Transelec SA, Sr. Unsec. Notes, 3.875%, 01/12/29, 144A(b) | | | Baa1/BBB | | | | 490 | | | | 470,400 | |
| | | | | | | | | | | | |
| | | | | | | | | | | 15,984,691 | |
| | | | | | | | | | | | |
TOTAL CORPORATE DEBT SECURITIES (Cost of $159,320,736) | | | | | | | | | | | 171,734,911 | |
| | | | | | | | | | | | |
ASSET BACKED SECURITIES (12.91%) | | | | | | | | | | | | |
Antares Ltd., Series 2017-1A, Class C, (3M LIBOR +3.10%), 4.845%, 07/20/28, 144A(b),(e) | | | NR/A | | | | 1,093 | | | | 1,104,253 | |
Arbor Realty Collateralized Loan Obligation, Ltd., Series 2017-FL3, Class A, (1M LIBOR +0.99%), 2.767%, 12/15/27, 144A(b),(e) | | | Aaa/NA | | | | 759 | | | | 759,759 | |
Arbor Realty Commercial Real Estate Notes, Ltd., Series 2017-FL2, Class A, (1M LIBOR +0.99%), 2.767%, 08/15/27, 144A(b),(e) | | | Aaa/NA | | | | 623 | | | | 625,197 | |
AVIS Budget Rental Car Funding AESOP LLC, Series 2015-2A, Class A, 2.63%, 12/20/21, 144A(b) | | | Aaa/NA | | | | 1,605 | | | | 1,590,010 | |
BCC Funding LLC, Series 2018-1A, Class A2, 2.96%, 06/20/23, 144A(b) | | | Aa2/NA | | | | 656 | | | | 654,778 | |
Carlyle Global Market Strategies, Ltd., Series 2014-3A, Class BR, (3M LIBOR +2.15%), 3.91%, 07/27/26, 144A(b),(e) | | | A1/NA | | | | 2,500 | | | | 2,500,740 | |
CPS Auto Receivables Trust, Series 2015-C, Class B, 2.55%, 02/18/20, 144A(b) | | | NA/AAA | | | | 550 | | | | 550,354 | |
DB Master Finance LLC, Series 2017-1A, Class A2I, 3.629%, 11/20/47, 144A(b) | | | NA/BBB | | | | 335 | | | | 333,655 | |
Domino’s Pizza Master Issuer LLC, Series 2015-1A, Class A21, 3.484%, 10/25/45, 144A(b) | | | NA/BBB+ | | | | 1,228 | | | | 1,225,988 | |
DRB Prime Student Loan Trust, Series 2016-B, Class A2, 2.89%, 06/25/40, 144A(b) | | | Aaa/NA | | | | 376 | | | | 369,685 | |
DRB Prime Student Loan Trust, Series 2017-A, Class A2B, 2.85%, 05/27/42, 144A(b) | | | Aaa/NA | | | | 2,130 | | | | 2,093,613 | |
Drive Auto Receivables Trust, Series 2016-CA, Class B, 2.37%, 11/16/20, 144A(b) | | | Aaa/AAA | | | | 531 | | | | 531,078 | |
DT Auto Owner Trust, Series 2017-3A, Class B, 2.40%, 05/17/21, 144A(b) | | | NA/AA | | | | 662 | | | | 658,766 | |
Golub Capital Partners Ltd., Series 2017-19RA, Class B, (3M LIBOR +2.55%), 3.921%, 07/26/29, 144A(b),(e) | | | A2/NA | | | | 1,935 | | | | 1,946,066 | |
Golub Capital Partners Ltd., Series 2018-36A, Class C, (3M LIBOR +2.10%), 4.189%, 02/05/31, 144A(b),(e) | | | NA/A | | | | 2,250 | | | | 2,245,421 | |
IVY Hill Middle Market Credit Fund Ltd., Series 12A, Class B, (3M LIBOR +3.00%), 4.745%, 07/20/29, 144A(b),(e) | | | A3/NR | | | | 866 | | | | 869,914 | |
Navient Private Education Loan Trust, Series 2017-A, Class A2B, (1M LIBOR+0.900%), 2.677%, 12/16/58, 144A(b),(e) | | | NA/AAA | | | | 782 | | | | 790,663 | |
NextGear Floorplan Master Owner Trust, Series 2017-1A, Class A2, 2.54%, 04/18/22, 144A(b) | | | Aaa/AAA | | | | 1,460 | | | | 1,447,840 | |
Option One Mortgage Loan Trust, Series 2007-FXD2, Class 2A1, 5.90%, 03/25/37(b),(f) | | | Ca/AA | | | | 35 | | | | 32,580 | |
SCF Equipment Leasing LLC, Series 2017-2A, Class A, 3.41%, 12/20/23, 144A(b) | | | A2/NA | | | | 571 | | | | 562,971 | |
Small Business Administration Participation Certificates, Series 2010-20F, Class 1, 3.88%, 06/01/30 | | | Aaa/AA+ | | | | 131 | | | | 134,827 | |
SMB Private Education Loan Trust, Series 2017-B, Class A2B, (1M LIBOR+0.750%), 2.527%, 10/15/35, 144A(b),(e) | | | Aaa/AAA | | | | 845 | | | | 849,222 | |
Sofi Consumer Loan Program LLC, Series 2017-3, Class A, 2.77%, 05/25/26, 144A(b) | | | NA/AA | | | | 1,292 | | | | 1,283,245 | |
Sofi Consumer Loan Program Trust, Series 2018-1, Class B, 3.65%, 02/25/27, 144A(b) | | | NA/A | | | | 793 | | | | 791,465 | |
Sofi Professional Loan Program Ltd., Series 2017-C, Class B, 3.56%, 07/25/40, 144A(b),(e) | | | NA/A+ | | | | 1,099 | | | | 1,060,164 | |
Spirit Master Funding LLC, Series 2014-2A, Class A, 5.76%, 03/20/41, 144A(b) | | | NA/A+ | | | | 1,542 | | | | 1,592,896 | |
TAL Advantage LLC, Series 2014-2A, Class A1, 1.70%, 05/20/39, 144A(b) | | | NA/A | | | | 11 | | | | 10,775 | |
Textainer Marine Containers Ltd., Series 2017-1A, Class A, 3.72%, 05/20/42, 144A(b) | | | NA/A | | | | 651 | | | | 650,766 | |
Triton Container Finance LLC, Series 2017-2A, Class A, 3.62%, 08/20/42, 144A(b) | | | NA/A | | | | 1,171 | | | | 1,155,982 | |
| | | | | | | | | | | | |
TOTAL ASSET BACKED SECURITIES (Cost of $28,544,632) | | | | | | | | | | | 28,422,673 | |
| | | | | | | | | | | | |
The accompanying notes are an integral part of these financial statements.
10
SCHEDULE OF INVESTMENTS—continued
| | | | | | | | | | | | |
| | | Moody’s/
Standard &
Poor’s
Rating(a) | | | Principal
Amount (000’s) | | | Value
(Note 1) | |
COMMERCIAL MORTGAGE-BACKED SECURITIES (3.50%) | | | | | | | | | | | | |
CGMS Commercial Mortgage Trust, Series 2017-MDRB, Class A, (1M LIBOR +1.10%), 2.877%, 07/15/30, 144A(e) | | | NR/AAA | | | $ | 137 | | | $ | 136,614 | |
Citigroup Commercial Mortgage Trust, Series 2013-375P, Class D, 3.518%, 05/10/35, 144A(e) | | | Baa1/NA | | | | 2,000 | | | | 1,960,611 | |
Citigroup Commercial Mortgage Trust, Series 2016-P6, Class C, 4.287%, 12/10/49(b),(e) | | | NA/NA | | | | 367 | | | | 363,406 | |
FREMF Mortgage Trust, Series 2015-K44, Class B, 3.684%, 01/25/48, 144A(b),(e) | | | NA/NA | | | | 535 | | | | 523,110 | |
FREMF Mortgage Trust, Series 2015-K45, Class B, 3.591%, 04/25/48, 144A(b),(e) | | | NA/NA | | | | 1,270 | | | | 1,258,535 | |
LMREC Inc., Series 2016-CRE2, Class A, (1M LIBOR +1.70%), 3.554%, 11/24/31, 144A(b),(e) | | | Aaa/NA | | | | 689 | | | | 689,000 | |
Morgan Stanley Bank of America Merrill Lynch Trust, Series 2012-CKSV, Class C, 4.288%, 10/15/30, 144A(e) | | | NA/A+ | | | | 2,710 | | | | 2,684,474 | |
MSDB Trust, Series 2017-712F, Class C, 3.628%, 07/11/39, 144A(e) | | | NA/A- | | | | 82 | | | | 80,269 | |
| | | | | | | | | | | | |
TOTAL COMMERCIAL MORTGAGE-BACKED SECURITIES (Cost of $7,694,046) | | | | | | | | | | | 7,696,019 | |
| | | | | | | | | | | | |
RESIDENTIAL MORTGAGE-BACKED SECURITIES (0.22%) | | | | | | | | | | | | |
FHLMC Pool # A15675, 6.00%, 11/01/33 | | | Aaa/AA+ | | | | 90 | | | | 101,115 | |
FHLMC Pool # G00182, 9.00%, 09/01/22(g) | | | Aaa/AA+ | | | | — | | | | 111 | |
FNMA Pool # 754791, 6.50%, 12/01/33 | | | Aaa/AA+ | | | | 232 | | | | 258,605 | |
FNMA Pool # 763852, 5.50%, 02/01/34 | | | Aaa/AA+ | | | | 106 | | | | 116,123 | |
GNSF Pool # 194228, 9.50%, 11/15/20 | | | Aaa/AA+ | | | | 4 | | | | 4,122 | |
GNSF Pool # 307527, 9.00%, 06/15/21 | | | Aaa/AA+ | | | | 6 | | | | 6,363 | |
GNSF Pool # 417239, 7.00%, 02/15/26 | | | Aaa/AA+ | | | | 6 | | | | 6,794 | |
GNSF Pool # 780374, 7.50%, 12/15/23 | | | Aaa/AA+ | | | | 3 | | | | 3,530 | |
| | | | | | | | | | | | |
TOTAL RESIDENTIAL MORTGAGE-BACKED SECURITIES
(Cost of $413,501) | | | | | | | | | | | 496,763 | |
| | | | | | | | | | | | |
MUNICIPAL BONDS (1.22%) | | | | | | | | | | | | |
Municipal Electric Authority of Georgia, Build America Bonds-Taxable-Plant Vogle Units 3&4, Series J, Revenue Bond, 6.637%, 04/01/57 | | | A2/A- | | | | 175 | | | | 217,383 | |
San Francisco City & County Public Utilities Commission, Water Revenue, Build America Bonds, 6.00%, 11/01/40 | | | Aa3/AA | | | | 145 | | | | 181,972 | |
State of California, Build America Bonds, GO, 7.625%, 03/01/40 | | | Aa3/AA | | | | 1,500 | | | | 2,284,245 | |
| | | | | | | | | | | | |
TOTAL MUNICIPAL BONDS (Cost of $1,856,261) | | | | | | | | | | | 2,683,600 | |
| | | | | | | | | | | | |
U.S. TREASURY SECURITIES (0.33%) | | | | | | | | | | | | |
U.S. Treasury Note, 2.00%, 10/31/22 | | | Aaa/AAA | | | | 735 | | | | 717,480 | |
| | | | | | | | | | | | |
TOTAL U.S. TREASURY SECURITIES (Cost of $731,113) | | | | | | | | | | | 717,480 | |
| | | | | | | | | | | | |
| | | | | | Shares | | | | |
COMMON STOCK (0.00%) | | | | | | | | | | | | |
MEDIA (0.00%) | | | | | | | | | | | | |
Quad/Graphics, Inc. | | | | | | | 89 | | | | 2,256 | |
| | | | | | | | | | | | |
TOTAL COMMON STOCK (Cost of $2,044) | | | | | | | | | | | 2,256 | |
| | | | | | | | | | | | |
PREFERRED STOCK (1.22%) | | | | | | | | | | | | |
CoBank ACB, Series F, 6.250%, (3M LIBOR +4.557%)(b),(c) | | | | | | | 20,000 | | | | 2,125,000 | |
US BANCORP, Series A, 3.500%, (3M LIBOR +1.02%)(b),(e) | | | | | | | 615 | | | | 567,338 | |
| | | | | | | | | | | | |
TOTAL PREFERRED STOCK (Cost of $2,521,650) | | | | | | | | | | | 2,692,338 | |
| | | | | | | | | | | | |
TOTAL INVESTMENTS (97.41%) | | | | | | | | | | | | |
(Cost $201,083,983) | | | | | | | | | | | 214,446,040 | |
| | | | | | | | | | | | |
OTHER ASSETS AND LIABILITIES (2.59%) | | | | | | | | | | | 5,695,023 | |
| | | | | | | | | | | | |
NET ASSETS (100.00%) | | | | | | | | | | $ | 220,141,063 | |
| | | | | | | | | | | | |
The accompanying notes are an integral part of these financial statements.
11
SCHEDULE OF INVESTMENTS—continued
At March 31, 2018, the Fund had the following open futures contracts:
| | | | | | | | | | | | | | | | | | | | |
| Short Futures Outstanding | | Expiration Month | | | Number of Contracts | | | Notional Amount | | | Value | | | Unrealized (Depreciation) | |
U.S. Treasury 5-Year Notes | | | 06/18 | | | | 12 | | | $ | (1,369,969 | ) | | $ | (1,373,531 | ) | | $ | (3,562 | ) |
U.S. Treasury 10-Year Notes | | | 06/18 | | | | 26 | | | | (3,115,328 | ) | | | (3,149,656 | ) | | | (34,328 | ) |
U.S. Treasury Long Bonds | | | 06/18 | | | | 18 | | | | (2,559,562 | ) | | | (2,639,250 | ) | | | (79,688 | ) |
U.S. Treasury Ultra 10-Year Notes | | | 06/18 | | | | 4 | | | | (508,594 | ) | | | (519,438 | ) | | | (10,844 | ) |
| | | | | | | | | | | | | | | | | | | | |
Net unrealized depreciation on open futures contracts | | | | | | | | | | | | | | $ | (128,422 | ) |
| | | | | | | | | | | | | | | | | | | | |
| (a) | Ratings for debt securities are unaudited. All ratings are as of March 31, 2018 and may have changed subsequently. |
| (b) | This security is callable. |
| (c) | Fixed to floating rate security. Fixed rate indicated is rate effective at March 31, 2018. Security will convert at a future date to a floating rate of reference rate and spread in the description above. |
| (d) | Security is perpetual. Date shown is next call date. |
| (e) | Variable rate security. Rate indicated is rate effective at March 31, 2018. |
| (f) | Multi-Step Coupon. Rate disclosed is as of March 31, 2018. |
| (g) | Principal amount less than $1,000. |
| 144A | Securities were purchased pursuant to Rule 144A under the Securities Act of 1933 and may not be resold subject to that rule except to qualified institutional buyers. At March 31, 2018, these securities amounted to $86,600,424 or 39.34% of net assets. |
Legend
Certs. - Certificates
Co. Gty. - Company Guaranty
FHLMC - Federal Home Loan Mortgage Corp.
FNMA - Federal National Mortgage Association
FREMF - Freddie Multi-Family
GNSF - Government National Mortgage Association (Single Family)
GO - General Obligation
Jr. - Junior
LIBOR - London Interbank Offered Rate
LLC - Limited Liability Company
LP - Limited Partnership
Ltd. - Limited
Sec. - Secured
Sr. - Senior
Sub. - Subordinated
Unsec. - Unsecured
Following is a description of the valuation techniques applied to the Fund’s major categories of assets measured at fair value on a recurring basis as of March 31, 2018.
| | | | | | | | | | | | | | | | |
| Assets: | | Total Market
Value at
03/31/18 | | | Level 1
Quoted
Price | | | Level 2
Significant
Observable
Inputs | | | Level 3
Significant
Unobservable
Inputs | |
CORPORATE DEBT SECURITIES | | $ | 171,734,911 | | | $ | — | | | $ | 171,734,911 | | | $ | — | |
ASSET BACKED SECURITIES | | | 28,422,673 | | | | — | | | | 28,422,673 | | | | — | |
COMMERCIAL MORTGAGE-BACKED SECURITIES | | | 7,696,019 | | | | — | | | | 7,696,019 | | | | — | |
RESIDENTIAL MORTGAGE-BACKED SECURITIES | | | 496,763 | | | | — | | | | 496,763 | | | | — | |
MUNICIPAL BONDS | | | 2,683,600 | | | | — | | | | 2,683,600 | | | | — | |
U.S. TREASURY SECURITIES | | | 717,480 | | | | — | | | | 717,480 | | | | — | |
COMMON STOCK | | | 2,256 | | | | 2,256 | | | | | | | | | |
PREFERRED STOCK | | | 2,692,338 | | | | 2,692,338 | | | | — | | | | — | |
TOTAL INVESTMENTS | | $ | 214,446,040 | | | $ | 2,694,594 | | | $ | 211,751,446 | | | $ | — | |
| | | | |
| Liabilities: | | | | | | | | | | | | |
FUTURES CONTRACTS | | $ | (128,422 | ) | | $ | (128,422 | ) | | $ | — | | | $ | — | |
For the year ended March 31, 2018, there were no transfers between Level 1, Level 2 and Level 3 for the Fund.
The accompanying notes are an integral part of these financial statements.
12
STATEMENT OF ASSETS AND LIABILITIES
March 31, 2018
| | | | |
Assets: | | | | |
Investment in securities, at value (amortized cost $201,083,983) (Note 1) | | $ | 214,446,040 | |
Cash | | | 3,590,917 | |
Deposits with brokers for open futures contracts | | | 235,684 | |
Receivables for investments sold | | | 72,149 | |
Interest receivable | | | 2,632,594 | |
Dividend receivable | | | 36,631 | |
Expense reimbursement due from the Adviser | | | 2,761 | |
Prepaid expenses | | | 23,297 | |
| | | | |
TOTAL ASSETS | | | 221,040,073 | |
| | | | |
Liabilities: | | | | |
Securities purchased | | | 548,809 | |
Payable to the Adviser | | | 83,063 | |
Payable to administration and accounting | | | 16,039 | |
Payable to transfer agency | | | 5,812 | |
Payable to custodian | | | 4,256 | |
Payable to CCO | | | 2,761 | |
Payable to broker – variation margin on open futures contracts | | | 128,422 | |
Accrued expenses payable | | | 109,848 | |
| | | | |
TOTAL LIABILITIES | | | 899,010 | |
| | | | |
Net assets: (equivalent to $20.55 per share based on 10,710,035 shares of capital stock outstanding) | | $ | 220,141,063 | |
| | | | |
NET ASSETS consisted of: | | | | |
Par value | | $ | 107,100 | |
Capital paid-in | | | 206,576,085 | |
Accumulated net investment loss | | | (1,347,857 | ) |
Accumulated net realized gain on investments and futures contracts | | | 1,572,100 | |
Net unrealized appreciation on investments and futures contracts | | | 13,233,635 | |
| | | | |
| | $ | 220,141,063 | |
| | | | |
The accompanying notes are an integral part of these financial statements.
13
STATEMENT OF OPERATIONS
For the year ended March 31, 2018
| | | | | | | | |
Investment Income: | | | | | | | | |
Interest | | | $ | 10,863,591 | |
Dividends | | | | 146,851 | |
| | | | | | | | |
Total Investment Income | | | | 11,010,442 | |
| | | | | | | | |
Expenses: | | | | | | | | |
Investment advisory fees (Note 4) | | $ | 1,000,209 | | | | | |
Administration fees | | | 191,885 | | | | | |
Trustees’ fees (Note 4) | | | 107,605 | | | | | |
Legal fees and expenses | | | 87,249 | | | | | |
Reports to shareholders | | | 56,256 | | | | | |
Transfer agent fees | | | 49,275 | | | | | |
Insurance | | | 40,994 | | | | | |
Custodian fees | | | 26,795 | | | | | |
NYSE fee | | | 25,602 | | | | | |
Audit fees | | | 25,000 | | | | | |
CCO fees | | | 16,154 | | | | | |
Miscellaneous | | | 61,843 | | | | | |
| | | | | | | | |
Total Expenses | | | | 1,688,867 | |
| | | | | | | | |
Expense reimbursement from the Adviser | | | | (16,154 | ) |
Net Expenses | | | | 1,672,713 | |
| | | | | | | | |
Net Investment Income | | | | 9,337,729 | |
| | | | | | | | |
Realized and unrealized gain (loss) from: | | | | | |
Net realized gain from: | | | | | |
Investment securities | | | | 3,261,100 | |
Futures contracts | | | | 55,629 | |
| | | | | | | | |
Net Realized Gain | | | | 3,316,729 | |
Change in net unrealized appreciation (depreciation) of: | | | | | | | | |
Investment securities | | | | (3,491,531 | ) |
Futures contracts | | | | (128,422 | ) |
| | | | | | | | |
Change in Net Unrealized Appreciation (Depreciation) | | | | (3,619,953 | ) |
Net loss on investments and futures contracts | | | | (303,224 | ) |
| | | | | | | | |
Net increase in net assets resulting from operations | | | $ | 9,034,505 | |
| | | | | | | | |
The accompanying notes are an integral part of these financial statements.
14
STATEMENTS OF CHANGES IN NET ASSETS
| | | | | | | | |
| | | Year ended
March 31, 2018 | | | Year ended
March 31, 2017 | |
Increase (decrease) in net assets: | | | | | | | | |
Operations: | | | | | | | | |
Net investment income | | $ | 9,337,729 | | | $ | 9,378,353 | |
Net realized gain (Note 2) | | | 3,316,729 | | | | 1,249,135 | |
Change in unrealized appreciation (depreciation) | | | (3,619,953 | ) | | | 4,934,240 | |
| | | | | | | | |
Net increase in net assets resulting from operations | | | 9,034,505 | | | | 15,561,728 | |
| | | | | | | | |
Distributions: | | | | | | | | |
From net investment income | | | (8,568,027 | ) | | | (9,638,349 | ) |
From realized gains | | | (2,583,260 | ) | | | — | |
| | | | | | | | |
Total Distributions | | | (11,151,287 | ) | | | (9,638,349 | ) |
| | | | | | | | |
Fund Share Transactions: | | | | | | | | |
Increase from shares issued under the dividend and distribution investment plan | | | — | | | | 30,298 | |
| | | | | | | | |
Increase (decrease) in net assets | | | (2,116,782 | ) | | | 5,953,677 | |
Net Assets: | | | | | | | | |
Beginning of year | | | 222,257,845 | | | | 216,304,168 | |
| | | | | | | | |
End of year | | $ | 220,141,063 | | | $ | 222,257,845 | |
| | | | | | | | |
Accumulated net investment loss | | $ | (1,347,857 | ) | | $ | (1,057,793 | ) |
| | | | | | | | |
The accompanying notes are an integral part of these financial statements.
15
FINANCIAL HIGHLIGHTS
The table below sets forth financial data for a share of capital stock outstanding throughout each period presented.
| | | | | | | | | | | | | | | | | | | | |
| | | Year ended March 31, | |
| | | 2018 | | | 2017 | | | 2016 | | | 2015 | | | 2014 | |
Per Share Operating Performance | | | | | | | | | | | | | | | | | | | | |
Net asset value, beginning of year | | $ | 20.75 | | | $ | 20.20 | | | $ | 21.52 | | | $ | 21.10 | | | $ | 21.53 | |
| | | | | | | | | | | | | | | | | | | | |
Net investment income | | | 0.87 | | | | 0.88 | | | | 0.93 | | | | 0.98 | | | | 1.05 | |
Net gain (loss) on investments and futures contracts | | | (0.03 | ) | | | 0.57 | | | | (1.23 | ) | | | 0.50 | | | | (0.42 | ) |
| | | | | | | | | | | | | | | | | | | | |
Total from investment operations | | | 0.84 | | | | 1.45 | | | | (0.30 | ) | | | 1.48 | | | | 0.63 | |
| | | | | | | | | | | | | | | | | | | | |
Capital share transaction: | | | | | | | | | | | | | | | | | | | | |
Impact of capital share transactions | | | — | | | | — | (1) | | | — | | | | — | | | | — | |
| | | | | | | | | | | | | | | | | | | | |
Less distributions: | | | | | | | | | | | | | | | | | | | | |
Dividends from net investment income | | | (0.80 | ) | | | (0.90 | ) | | | (1.02 | ) | | | (1.06 | ) | | | (1.06 | ) |
Dividends from net realized gain (loss) | | | (0.24 | ) | | | — | | | | — | | | | — | | | | — | |
| | | | | | | | | | | | | | | | | | | | |
Total distributions | | | (1.04 | ) | | | (0.90 | ) | | | (1.02 | ) | | | (1.06 | ) | | | (1.06 | ) |
| | | | | | | | | | | | | | | | | | | | |
Net asset value, end of year | | $ | 20.55 | | | $ | 20.75 | | | $ | 20.20 | | | $ | 21.52 | | | $ | 21.10 | |
| | | | | | | | | | | | | | | | | | | | |
Per share market price, end of year | | $ | 19.37 | | | $ | 19.16 | | | $ | 19.14 | | | $ | 20.01 | | | $ | 19.42 | |
| | | | | | | | | | | | | | | | | | | | |
Total Investment Return(2) | | | | | | | | | | | | | | | | | | | | |
Based on market value | | | 6.43 | % | | | 4.75 | % | | | 0.88 | % | | | 8.67 | % | | | 2.44 | % |
Ratios/Supplemental Data | | | | | | | | | | | | | | | | | | | | |
Net assets, end of year (in 000’s) | | $ | 220,141 | | | $ | 222,258 | | | $ | 216,304 | | | $ | 230,464 | | | $ | 225,979 | |
Ratio of expenses to average net assets | | | 0.74 | % | | | 0.75 | % | | | 0.77 | % | | | 0.74 | % | | | 0.75 | % |
Ratio of net investment income to average net assets | | | 4.15 | % | | | 4.24 | % | | | 4.52 | % | | | 4.58 | % | | | 5.08 | % |
Portfolio turnover rate | | | 55.62 | % | | | 44.32 | % | | | 26.60 | % | | | 30.73 | % | | | 16.10 | % |
Number of shares outstanding at the end of the year (in 000’s) | | | 10,710 | | | | 10,710 | | | | 10,709 | | | | 10,709 | | | | 10,709 | |
| (1) | There is less than $0.01 per share impact for shares reinvested under the dividend reinvestment plan. |
| (2) | Total investment return is calculated assuming a purchase of common shares at the market price on the first day and a sale at the market price on the last day of the period reported. Dividends and distributions, if any, are assumed for purposes of this calculation to be reinvested at prices obtained under the Fund’s dividend reinvestment plan. Total investment return does not reflect brokerage commissions. The total investment return, if for less than a full year, is not annualized. Past performance is not a guarantee of future results. |
The accompanying notes are an integral part of these financial statements.
16
NOTES TO FINANCIAL STATEMENTS
Note 1 – Significant Accounting Policies – The Insight Select Income Fund (the “Fund”), a Delaware statutory trust, is registered under the Investment Company Act of 1940, as amended (“1940 Act”), as a diversified closed-end, management investment company. The Fund’s investment objective is to seek a high rate of return, primarily from interest income and trading activity, from a portfolio principally consisting of debt securities. The Fund follows the accounting and reporting guidance under Financial Accounting Standards Board Accounting Standards Codification Topic 946, “Financial Services – Investment Companies”. The following is a summary of significant accounting policies consistently followed by the Fund in preparation of its financial statements. The policies are in conformity with generally accepted accounting principles within the United States of America (“GAAP”).
| A. | Security Valuation – In valuing the Fund’s net assets, all securities for which representative market quotations are available will be valued at the last quoted sales price on the security’s principal exchange on the day of valuation. If there are no sales of the relevant security on such day, the security will be valued at the bid price at the time of computation. For securities traded in the over-the-counter market, including listed debt and preferred securities, whose primary market is believed to be over-the-counter, the Fund uses recognized industry pricing services – approved by the Board of Trustees (“Board”) and unaffiliated with the Cutwater Investor Services Corp. (the “Adviser”) – and uses broker quotes provided by market makers of securities not valued by these and other recognized pricing sources. |
In the event that market quotations are not readily available, or when such quotations are deemed not to reflect current market value, the securities will be valued at their respective fair value as determined in good faith by the Adviser pursuant to certain procedures and reporting requirements established by the Board. The Adviser considers all relevant facts that are reasonably available when determining the fair value of a security, including but not limited to the last sale price or initial purchase price (if a when issued security) and subsequently adjusting the value based on changes in company specific fundamentals, changes in an appropriate securities index, or changes in the value of similar securities which may be further adjusted for any discounts related to security-specific resale restrictions. When possible, observable market inputs such as unadjusted quoted prices of similar securities, observable interest rates, currency rates and yield curves are utilized. At March 31, 2018, there were no securities valued using fair value procedures.
Fair Value Measurements – The Fund has adopted authoritative fair value accounting standards which establish a definition of fair value and set out a hierarchy for measuring fair value. These standards require additional disclosures about the various inputs and valuation techniques used to develop the measurements of fair value, a discussion in changes in valuation techniques and related inputs during the period and expanded disclosure of valuation levels for major security types. These inputs are summarized in the three broad levels listed below:
| | |
• Level 1 – | | Unadjusted quoted prices in active markets for identical assets or liabilities that the Fund has the ability to access. |
| |
• Level 2 – | | Observable inputs other than quoted prices included in level 1 that are observable for the asset or liability, either directly or indirectly. These inputs may include quoted prices for the identical instrument on an inactive market, prices for similar instruments, interest rates, prepayment speeds, credit risk, yield curves, default rates and similar data. |
| |
• Level 3 – | | Unobservable inputs for the asset or liability, to the extent relevant observable inputs are not available, representing the Fund’s own assumptions about the assumptions a market participant would use in valuing the asset or liability, and would be based on the best information available. |
17
NOTES TO FINANCIAL STATEMENTS — continued
At the end of each calendar quarter, management evaluates the Level 1, 2 and 3 assets and liabilities for changes in liquidity, including but not limited to: whether a broker is willing to execute at the quoted price, the depth and consistency of prices from third party services, and the existence of contemporaneous, observable trades in the market. Additionally, management evaluates Level 1 and 2 assets and liabilities on a quarterly basis for changes in listings or delistings on national exchanges. Due to the inherent uncertainty of determining the fair value of investments that do not have a readily available market value, the fair value of the Fund’s investments may fluctuate from period to period. Additionally, the fair value of investments may differ significantly from the values that would have been used had a ready market existed for such investments and may differ materially from the values the Fund may ultimately realize. Further, such investments may be subject to legal and other restrictions on resale or otherwise less liquid than publicly traded securities. Pursuant to the Fund’s policy, transfers between levels are considered to have occurred at the beginning of the reporting period.
Level 3 investments are categorized as Level 3 with values derived utilizing prices from prior transactions or third party pricing information without adjustment (broker quotes, pricing services and net asset values). A significant change in third party pricing information could result in a significantly lower or higher value in such Level 3 investments. As of March 31, 2018, the Fund did not hold any Level 3 securities.
When-Issued Securities – The Fund may enter into commitments to purchase securities on a forward or when-issued basis. When-issued securities are securities purchased for delivery beyond the normal settlement date at a stated price and yield. In the Fund’s case, these securities are subject to settlement within 45 days of the purchase date. The interest rate realized on these securities is fixed as of the purchase date. The Fund does not pay for such securities prior to the settlement date and no interest accrues to the Fund before settlement. These securities are subject to market fluctuation due to changes in market interest rates. The Fund will enter into these commitments with the intent of buying the security but may dispose of such security prior to settlement. At the time the commitment is entered into, the Fund will establish and maintain a segregated account in an amount sufficient to cover the obligation under the when-issued contract. At the time the Fund makes the commitment to purchase securities on a when-issued basis, it will record the transaction and thereafter reflect the value of such security purchased in determining its NAV. At the time of delivery of the security, its value may be more or less than the fixed purchase price.
Futures Contracts – The Fund uses futures contracts generally to gain exposure to, or hedge against, changes in interest rates or gain exposure to, or hedge against, changes in certain asset classes. A futures contract represents a commitment for the future purchase or sale of an asset at a specified price on a specified date.
Upon entering into a futures contract, the Fund is required to deposit cash or cash equivalents with a broker in an amount equal to a certain percentage of the contract amount. This is known as the ‘‘initial margin’’ and subsequent payments (‘‘variation margin’’) are made or received by the Fund each day, depending on the daily fluctuation in the value of the contract. For certain futures, including foreign denominated futures, variation margin is not settled daily, but is recorded as a net variation margin payable or receivable. The daily changes in contract value are recorded as unrealized gains or losses in the Statement of Operations and the Fund recognizes a realized gain or loss when the contract is closed.
Futures contracts involve, to varying degrees, risk of loss in excess of the amounts reflected in the financial statements. In addition, there is the risk that the Fund may not be able to enter into a closing transaction because of an illiquid secondary market.
18
NOTES TO FINANCIAL STATEMENTS — continued
The following table sets forth the fair value and the location of the Fund’s derivative financial instruments within the Statement of Assets and Liabilities by primary risk exposure as of March 31, 2018:
Fair Value of Derivative Investments as of March 31, 2018:
| | | | |
Derivatives not accounted for as hedging instruments under ASC 815 | | Assets | | Liabilities |
Futures — Interest Rate Contracts | | $— | | $(128,422) |
The following table sets forth the effect of the Fund’s derivative financial instruments by primary risk exposure on the Statements of Operations for the year ended March 31, 2018:
The Effect of Derivative Investments on the Statements of Operations for the year ended March 31, 2018:
| | | | |
Derivatives not accounted for as hedging instruments under ASC 815 | | Realized Gain (Loss) on Derivatives | | Change in Net Unrealized Appreciation (Depreciation) of Derivatives |
Futures — Interest Rate Contracts | | $55,629 | | $(128,422) |
The average notional value of short futures contracts held by the Fund throughout the year was $1,510,691. This is based on amounts held as of each quarter-end throughout the fiscal year.
| B. | Determination of Gains or Losses on Sale of Securities – Gains or losses on the sale of securities are calculated for financial reporting purposes and for federal tax purposes using the identified cost basis. The identified cost basis for financial reporting purposes differs from that used for federal tax purposes in that the amortized cost of the securities sold is used for financial reporting purposes and the original cost of the securities sold is used for federal tax purposes, except for those instances where tax regulations require the use of amortized cost. |
| C. | Federal Income Taxes – It is the Fund’s policy to continue to comply with the requirements of the Internal Revenue Code applicable to regulated investment companies and to distribute all of its taxable income to its shareholders. Therefore, no federal income tax provision is required. |
| | Management has analyzed the Fund’s tax positions taken on federal income tax returns for all open tax years (tax years March 31, 2015-2017) or expected to be taken on the Fund’s 2018 tax return, and has concluded that no provision for federal income tax is required in the Fund’s financial statements. The Fund’s federal and state income and federal excise tax returns for tax years for which the applicable statutes of limitations have not expired are subject to examination by the Internal Revenue Service and state departments of revenue. |
| D. | Other – Security transactions are accounted for on the trade date. Interest income is accrued daily. Premiums and discounts are amortized using the interest method. Paydown gains and losses on mortgage-backed and asset-backed securities are presented as an adjustment to interest income. Dividend income and distributions to shareholders are recorded on the ex-dividend date. |
| E. | Distributions to Shareholders and Book/Tax Differences – Distributions of net investment income will be made quarterly. Distributions of any net realized capital gains will be made annually. Income and capital gain distributions are determined in accordance with federal income tax regulations, which may |
19
NOTES TO FINANCIAL STATEMENTS — continued
| | differ from GAAP. These differences are primarily due to differing treatments for amortization of market premium and accretion of market discount. |
| | In order to reflect permanent book/tax differences that occurred during the fiscal year ended March 31, 2018, the following accounts were adjusted for the following amounts: |
| | | | | | | | | | |
Accumulated
Net Investment Loss | | Accumulated
Net Realized
Gain | | Paid-In
Capital |
| $(1,059,766) | | | $ | 1,059,766 | | | | $ | — | |
| | Distributions during the fiscal years ended March 31, 2018 and 2017 were characterized as follows for tax purposes: |
| | | | | | | | |
| | | Ordinary Income | | Return of Capital | | Capital Gain | | Total Distribution |
FY 2018 | | $ 10,032,088 | | $ — | | $ 1,119,199 | | $ 11,151,287 |
FY 2017 | | $ 9,638,349 | | $ — | | $ — | | $ 9,638,349 |
| | At March 31, 2018, the components of distributable earnings on a tax basis were as follows: |
| | | | | | | | |
Total | | Accumulated
Ordinary Income | | Undistributed
Long-Term
Capital Gains | | Late Year Losses
Deferred | | Net Unrealized
Appreciation |
$13,457,878 | | $129,466 | | $1,443,777 | | $ — | | $11,884,635 |
| | | | | | | | | |
| | The Regulated Investment Company Modernization Act of 2010 (the “Act”) was enacted on December 22, 2010. The Act makes changes to several tax rules impacting the Fund. In general, the provisions of the Act are in effect for the Fund’s fiscal year ended March 31, 2012. Although the Act provides several benefits, including the unlimited carryover of future capital losses, there may be a greater likelihood that all or a portion of the Fund’s pre-enactment capital loss carryovers may expire without being utilized due to the fact that post-enactment capital losses must be utilized before pre-enactment capital loss carryovers may be utilized. Under the Act, new capital losses may now be carried forward indefinitely, and retain the character of the original loss as compared with pre-enactment law, where capital losses could be carried forward for up to eight years, and carried forward as short-term capital losses, irrespective of the character of the original loss. As of March 31, 2018, there were no capital loss carryforwards. |
| | Capital loss carryforwards are subject to usage limitations. During the year ended March 31, 2018, capital loss carryforwards in the amount of $61,753 were utilized. |
| | Under current laws, certain capital losses realized after October 31 and certain ordinary losses realized after December 31 may be deferred and treated as occurring on the first day of the following fiscal year. For the year ended March 31, 2018, no losses were deferred. |
| | At March 31, 2018, the following table shows for federal tax purposes the aggregate cost of investments, the net unrealized appreciation of those investments, the aggregate gross unrealized appreciation of all |
20
NOTES TO FINANCIAL STATEMENTS — continued
| | securities with an excess of market value over tax cost and the aggregate gross unrealized depreciation of all securities with an excess of tax cost over market value: |
| | | | | | | | |
| | | Cost | | Gross
Unrealized
Appreciation | | Gross
Unrealized
Depreciation | | Net Unrealized
Appreciation
(Depreciation) |
Securities | | $202,561,405 | | $15,363,118 | | $(3,478,483) | | $11,884,635 |
| | The difference between book basis and tax-basis unrealized appreciation is attributable primarily to the differing treatments for wash sales, amortization of market premium and accretion of market discount. |
| F. | Use of Estimates in the Preparation of Financial Statements – The preparation of financial statements in conformity with GAAP requires management to make estimates and assumptions that may affect the reported amounts of assets and liabilities at the date of the financial statements and the reported amounts of revenue and expenses during the reporting period. Actual results could differ from those estimates. |
Note 2 – Portfolio Transactions – The following is a summary of the security transactions, other than short-term investments, for the year ended March 31, 2018:
| | | | | | | | |
| | | Cost of
Purchases | | | Proceeds from Sales
or Maturities | |
U.S. Government Securities | | $ | 32,403,162 | | | $ | 34,215,812 | |
Other Investment Securities | | $ | 94,712,765 | | | $ | 88,634,814 | |
Note 3 – Capital Stock – At March 31, 2018, there were an unlimited number of shares of beneficial interest ($0.01 par value) authorized, with 10,710,035 shares issued and outstanding.
Note 4 – Investment Advisory Contract, Accounting and Administration, Custodian, Transfer Agent and Trustee Compensation – Cutwater Investor Services Corp. (d/b/a Insight Investment) serves as investment adviser to the Fund. The Adviser is entitled to a fee at the annual rate of 0.50% on the first $100 million of the Fund’s month-end net assets and 0.40% on the Fund’s month-end net assets in excess of $100 million.
BNY Mellon Investment Servicing (US) Inc. (“BNY Mellon”), a member of The Bank of New York Mellon Corporation, provides accounting and administrative services to the Fund. The Bank of New York Mellon is the Fund’s custodian responsible for the custody of Fund’s assets. BNY Mellon is the contractual Transfer Agent to the Fund and has subcontracted with Computershare to provide transfer agency services to the Fund.
The Adviser is a wholly owned subsidiary of The Bank of New York Mellon Corporation. The Adviser works closely with and is administered by Insight Investment Management (Global) Limited (“Insight”), another of The Bank of New York Mellon Corporation’s investment management subsidiaries. The Adviser is subject to The Bank of New York Mellon Corporation’s Code of Conduct and various policies and procedures designed to address the potential for conflicts of interest that may arise in connection with the Adviser’s status as an affiliated person of The Bank of New York Mellon Corporation and its subsidiaries.
The Fund entered into a chief compliance officer outsourcing agreement (the “CCO Outsourcing Agreement”) with Lebisky Compliance Consulting LLC to serve as the Chief Compliance Officer (“CCO”) of the Fund dated as of October 3, 2017. For the services provided under the CCO Outsourcing Agreement, the Fund shall pay the CCO an annual base fee of $32,500.
21
NOTES TO FINANCIAL STATEMENTS — continued
The Fund has entered into a separate fee waiver and expense reimbursement agreement with the Adviser dated as of October 3, 2017. The Adviser has agreed to reimburse the Fund an amount equal to those expenses incurred by the Fund under the CCO Outsourcing Agreement. The fee waiver and expense reimbursement agreement may be terminated by either party without cause by giving the other party at least 60 days’ written notice of its intention to terminate, and shall terminate automatically upon termination of the CCO Outsourcing Agreement or the investment advisory agreement between the Fund and the Adviser.
For the eight months ended March 31, 2018, the Fund incurred $16,154 under the CCO Outsourcing Agreement which was reimbursed by the Adviser. As of March 31, 2018, the amount due from the Adviser under the fee waiver and expense reimbursement was $2,761.
The Trustees of the Fund receive an annual retainer, meeting fees and out of pocket expenses for meetings attended. The aggregate remuneration paid to the Trustees by the Fund during the year ended March 31, 2018 was $107,605. Certain officers of the Fund are also officers and/or employees of the investment adviser. None of the Fund’s officers receives compensation from the Fund. As of March 31, 2018, there were no amounts due to the Trustees.
Note 5 – Dividend and Distribution Reinvestment – In accordance with the terms of the Amended and Restated Automatic Dividend Investment Plan (the “Plan”), for shareholders who so elect, dividends and distributions are made in the form of previously unissued Fund shares at the net asset value if on the Friday preceding the payment date (the “Valuation Date”) the closing New York Stock Exchange price per share, plus the brokerage commissions applicable to one such share equals or exceeds the net asset value per share. However, if the net asset value is less than 95% of the market price on the Valuation Date, the shares issued will be valued at 95% of the market price. If the net asset value per share exceeds market price plus commissions, the dividend or distribution proceeds are used to purchase Fund shares on the open market for participants in the Plan. During the year ended March 31, 2018, the Fund did not issue any shares under this Plan.
Note 6 – Subsequent Event – The Adviser has notified the Board that it is undergoing certain internal corporate reorganizations and the Adviser anticipates merging into its affiliate, Insight North America, LLC (“INA”), on or about July 1, 2018 (the “Transition Date”). Following the Transition Date, the Fund’s investment management agreement will be with INA. The Bank of New York Mellon Corporation will remain INA’s ultimate parent company. The Adviser and INA have been operating under the same brand for some time, and this merger is not expected to have any material impact on the day-to-day management of the Fund. This internal reorganization will not result in a change of control of the Adviser under the Investment Company Act of 1940, as amended, and the rules thereunder.
Other than noted above, management has evaluated the impact of all subsequent events on the Fund through the date the financial statements were issued, and has determined that there were no additional subsequent events requiring recognition or disclosure in the financial statements.
22
SHAREHOLDER INFORMATION (Unaudited)
ADDITIONAL INFORMATION REGARDING THE FUND’S TRUSTEES AND OFFICERS
| | | | | | | | | | |
Name, Address and Age1 | | Position Held
With Fund | | Principal Occupation
During the Past 5 Years | | Number of
Funds Overseen
By Trustee | | Term of Office and Length
of Time Served | | Other
Directorships
Held by Trustee |
| | | | | |
W. Thacher Brown Born: December 1947 | | Trustee,
Board
Chairperson | | Retired | | 2 | | Shall serve until the next annual meeting or until his successor is qualified. Trustee since 1988. | | None. |
| | | | | |
Ellen D. Harvey Born: February 1954 | | Trustee | | Principal, Lindsay Criswell LLC beginning July 2008; Managing Director, Miller Investment Management beginning September 2008 | | 2 | | Shall serve until the next annual meeting or until her successor is qualified. Trustee since 2010. | | Director, Aetos Capital Funds (3 portfolios). |
| | | | | |
Thomas E. Spock Born: May 1956 | | Trustee | | Partner at Scalar Media Partners, LLC since June 2008. | | 2 | | Shall serve until the next annual meeting or until his successor is qualified. Trustee since 2013. | | None. |
| | | | | |
Suzanne P. Welsh Born: March 1953 | | Trustee | | Retired; Former Vice President for Finance and Treasurer, Swarthmore College from August 2002 to June 2014. | | 2 | | Shall serve until the next annual meeting or until her successor is qualified. Trustee since 2008. | | None. |
| | | | | |
Clifford D. Corso2 Born: October 1961 | | President | | Chief Executive Officer and Chief Investment Officer, Cutwater Investor Services Corp.; Director and officer of other affiliated entities of Cutwater Investor Services Corp. | | N/A. | | Shall serve until death, resignation, or removal. Officer since 2005. | | N/A. |
| | | | | |
Gautam Khanna2 Born: October 1969 | | Vice
President | | Officer of Cutwater Investor Services Corp. | | N/A. | | Shall serve until death, resignation, or removal. Officer since 2006. | | N/A. |
23
SHAREHOLDER INFORMATION (Unaudited) — continued
ADDITIONAL INFORMATION REGARDING THE FUND’S TRUSTEES AND OFFICERS
| | | | | | | | | | |
Name, Address and Age1 | | Position Held
With Fund | | Principal Occupation During the Past 5
Years | | Number of
Funds Overseen
By Trustee | | Term of
Office and
Length of
Time Served | | Other
Directorships
Held by
Trustee |
| | | | | |
Robert T. Claiborne2 Born: August 1955 | | Vice
President | | Officer of
Cutwater Investor
Services Corp. | | N/A. | | Shall serve until death, resignation, or removal. Officer since 2006. | | N/A. |
| | | | | |
Thomas E. Stabile2 Born: March 1974 | | Treasurer | | Officer of Cutwater Investor Services Corp. | | N/A. | | Shall serve until death, resignation, or removal. Officer since 2010. | | N/A. |
| | | | | |
David C. Lebisky Born: May 1972 | | Secretary
and Chief
Compliance
Officer | | President of Lebisky Compliance Consulting LLC (since October 2015). Consultant, Duff & Phelps Compliance Consulting (since 2016). Senior Consultant, Freeh Group International Solutions, LLC (a global risk management firm) (since 2015). Formerly, Director of Regulatory Administration, Scotia Institutional Investments US, LP (2010 to 2014). | | N/A. | | Shall serve until death, resignation, or removal. Officer since 2017. | | N/A. |
| 1 | The business address of each Trustee and Officer is c/o Insight Investment, 200 Park Avenue, New York, NY 10166. |
| 2 | Denotes an officer who is an “interested person” of the Fund as defined under the provisions of the Investment Company Act of 1940. Messrs. Corso, Khanna, Claiborne, and Stabile are “interested persons” by virtue of being employees of the Fund’s Adviser. Additional information about the Trustees is included in the Fund’s prospectus. |
HOW TO GET INFORMATION REGARDING PROXIES
The Fund has adopted the Adviser’s proxy voting policies and procedures to govern the voting of proxies relating to the voting securities of the Fund. You may obtain a copy of these proxy voting procedures, without charge, by emailing clientservicena@insightinvestment.com or on the Securities and Exchange Commission website at www.sec.gov.
Information regarding how the Fund voted proxies relating to portfolio securities during the most recent 12-month period ended June 30 is available, without charge, by emailing clientservicena@insightinvestment.com or on the SEC’s website at www.sec.gov.
24
SHAREHOLDER INFORMATION (Unaudited) — continued
QUARTERLY STATEMENT OF INVESTMENTS
The Fund files a complete statement of investments with the Security and Exchange Commission for the first and third quarters for each fiscal year on Form N-Q. Shareholders may view the filed Form N-Q by visiting the Commission’s website at www.sec.gov. The filed form may also be viewed and copied at the Commission’s Public Reference Room in Washington, D.C. Information on the operation of the Commission’s Public Reference Room may be obtained by calling 1-800-SEC-0330.
ADDITIONAL TAX INFORMATION
For corporate shareholders, the percentage of investment income (dividend income and short-term gains, if any) for the Fund that qualify for the dividends-received deductions for the year ended March 31, 2018 was 1.49%.
For the year ended March 31, 2018, certain dividends paid by the Fund may be subject to a maximum tax rate of 15%, as provided by the Jobs and Growth Tax Relief Reconciliation Act of 2003. Of the distributions made by the Fund, 1.49% represents the amount of each distribution which may qualify for the 15% dividend income tax rate. Shareholders should not use this tax information to prepare their tax returns. The information will be included with your Form 1099 DIV which will be sent to you separately in January 2019.
For the fiscal year ended March 31, 2018, the Fund designated long-term capital gains of $2,562,976.
DIVIDEND REINVESTMENT PLAN
The Fund has established a plan for the automatic investment of dividends and distributions pursuant to which dividends and capital gain distributions to shareholders will be paid in or reinvested in additional shares of the Fund. All shareholders of record are eligible to join the Plan. BNY Mellon acts as the agent (the “Agent”) for participants under the Plan.
Shareholders whose shares are registered in their own names may elect to participate in the Plan by completing an authorization form and returning it to the Agent. Shareholders whose shares are held in the name of a broker or nominee should contact such broker or nominee to determine whether or how they may participate in the Plan.
Dividends and distributions are reinvested under the Plan as follows. If the market price per share on the Friday before the payment date for the dividend or distribution (the “Valuation Date’’), plus the brokerage commissions applicable to one such share, equals or exceeds the net asset value per share on that date, the Fund will issue new shares to participants valued at the net asset value or, if the net asset value is less than 95% of the market price on the Valuation Date, then valued at 95% of the market price. If net asset value per share on the Valuation Date exceeds the market price per share on that date, plus the brokerage commissions applicable to one such share, the Agent will buy shares on the open market, on the New York Stock Exchange, for the participants’ accounts. If before the Agent has completed its purchases, the market price exceeds the net asset value of shares, the average per share purchase price paid by the Agent may exceed the net asset value of shares, resulting in the acquisition of fewer shares than if the dividend or distribution has been paid in shares issued by the Fund at net asset value.
There is no charge to participants for reinvesting dividends or distributions payable in either shares or cash. The Agent’s fees for handling of reinvestment of such dividends and distributions will be paid by the Fund. There will be no brokerage charges with respect to shares issued directly by the Fund as a result of dividends or distributions payable either in shares or cash. However, each participant will be charged by the Agent a pro rata share of brokerage commissions incurred with respect to Agent’s open market purchases in connection with the reinvestment of dividends or distributions payable only in cash.
25
SHAREHOLDER INFORMATION (Unaudited) — continued
For purposes of determining the number of shares to be distributed under the Plan, the net asset value is computed on the Valuation Date and compared to the market value of such shares on such date. The Plan may be terminated by a participant by delivery of written notice of termination to the Agent at the address shown below. Upon termination, the Agent will cause a certificate or certificates for the full shares held for a participant under the Plan and a check for any fractional shares to be delivered to the former participant.
Distributions of investment company taxable income that are invested in additional shares generally are taxable to shareholders as ordinary income. A capital gain distribution that is reinvested in shares is taxable to shareholders as long-term capital gain, regardless of the length of time a shareholder has held the shares or whether such gain was realized by the Fund before the shareholder acquired such shares and was reflected in the price paid for the shares.
Plan information and authorization forms are available from BNY Mellon Investment Servicing (US) Inc., P.O. Box 358035, Pittsburgh, PA 15252-8035.
PRIVACY POLICY
The Fund has adopted procedures designed to maintain and secure the non-public personal information of its clients from inappropriate disclosure to third parties. The Fund is committed to keeping personal information collected from potential, current, and former clients confidential and secure. The proper handling of personal information is one of our highest priorities. The Fund never sells information relating to its clients to any outside third parties.
Client Information
The Fund will only collect and keep information which is necessary for it to provide the services requested by its shareholders, and to administer a shareholder account.
The Fund may collect nonpublic personal information from clients or potential clients such as name, address, tax identification or social security number, assets, income, net worth, copies of financial documents and other information that we may receive on applications or other forms, correspondence or conversations, or via other methods in order to conduct business.
The Fund may also collect information about your transactions with the Fund, Adviser, Adviser’s affiliates, or others, including, but not limited to, your account number and balance, payments history, parties to transactions, cost basis information, and other financial information.
This information may be obtained as a result of transactions with the Fund, Adviser, Adviser’s affiliates, its clients, or others. This could include transactions completed with affiliates or information received from outside vendors to complete transactions or to effect financial goals.
Sharing Information
The Fund only shares the nonpublic personal information of its shareholders with non-affiliated companies or individuals (i) as permitted by law and as required to provide services to shareholders, such as with representatives within Adviser, securities clearing firms, the Fund or insurance companies, and other financial services providers; or (ii) to comply with legal or regulatory requirements. The Fund may also disclose nonpublic personal information to another financial services provider in connection with the transfer of an account to such financial services provider. Further, in the normal course of business, the Fund may disclose information it collects about shareholders to companies or individuals that contract with the Fund or Adviser to perform servicing functions including, but not limited to, recordkeeping, consulting, and/or technology services.
26
SHAREHOLDER INFORMATION (Unaudited) — continued
Companies hired to provide support services are not permitted to use personal information for their own purposes, and are contractually obligated to maintain strict confidentiality. The Fund limits the use of personal information to the performance of the specific service requested.
The Fund does not provide personally identifiable information to mailing list vendors or solicitors for any purpose. When the Fund provides personal information to service providers, it requires these providers to agree to safeguard such information, to use the information only for the intended purpose, and to abide by applicable law.
Employee Access to Information
Only employees with a valid business reason have the ability to access a clients’ personal information. These employees are educated on the importance of maintaining the confidentiality and security of this information. They are required to abide by our information handling practices.
Protection of Information
The Fund maintains security standards to protect shareholders’ information, whether written, spoken, physical, or electronic. The Fund updates and checks its physical mechanisms and electronic systems to ensure the protection and integrity of information.
Maintaining Accurate Information
The Fund’s goal is to maintain accurate, up to date client records in accordance with industry standards. The Fund has procedures in place to keep information current and complete, including timely correction of inaccurate information.
Disclosure of our Privacy Policy
The Fund recognizes and respects the privacy concerns of its potential, current, and former shareholders. The Fund, Adviser and Adviser’s affiliates are committed to safeguarding this information and may provide this Privacy Policy for informational purposes to shareholders and employees, and will distribute and update it as required by law. It is also available upon request.
The Fund seeks to carefully safeguard shareholder information and, to that end, restricts access to non-public personal information about our shareholders to those employees and other persons who need to know the information to enable the Fund to provide services to its shareholders. The Fund, Adviser and their service agents maintain physical, electronic, and procedural safeguards that comply with federal standards to guard your non-public personal information. In the event that you maintain an account through a financial intermediary, including, but not limited to, a broker-dealer, bank, or trust company, the privacy policy of your financial intermediary would govern how your non-public personal information would be shared with unaffiliated third parties.
ANNUAL CERTIFICATION
The Fund’s Chief Executive Officer (“CEO”) has submitted to the NYSE the required annual certification, and the Fund also has included the certifications of the Fund’s CEO and Treasurer required by Section 302 of the Sarbanes-Oxley Act of 2002 in the Fund’s Forms N-CSR filed with the Securities and Exchange Commission for the period of this report.
27
HOW TO GET ASSISTANCE WITH SHARE TRANSFER OR DIVIDENDS
Contact Your Transfer Agent:
BNY Mellon Investment Servicing (US) Inc.
P.O. Box 358035, Pittsburgh, PA 15252-8035, or call 1-866-333-6685
T R U S T E E S
W. THACHER BROWN
ELLEN D. HARVEY
THOMAS E. SPOCK
SUZANNE P. WELSH
O F F I C E R S
CLIFFORD D. CORSO
President
THOMAS E. STABILE
Treasurer
DAVID C. LEBISKY
Secretary and Chief Compliance Officer
ROBERT T. CLAIBORNE
Vice President
GAUTAM KHANNA
Vice President
I N V E S T M E N T A D V I S E R
CUTWATER INVESTOR SERVICES CORP.
200 PARK AVE, 7TH FLOOR
NEW YORK, NY 10166
C U S T O D I A N
THE BANK OF NEW YORK MELLON
2 HANSON PLACE
BROOKLYN, NY 11217
T R A N S F E R A G E N T
BNY MELLON INVESTMENT SERVICING (US) INC.
P.O. BOX 358035
PITTSBURGH, PA 15252-8035
1-866-333-6685
C O U N S E L
PEPPER HAMILTON LLP
3000 TWO LOGAN SQUARE
EIGHTEENTH & ARCH STREETS
PHILADELPHIA, PA 19103
I N D E P E N D E N T R E G I S T E R E D
P U B L I C A C C O U N T I N G F I R M
TAIT, WELLER & BAKER LLP
1818 MARKET STREET
SUITE 2400
PHILADELPHIA, PA 19103

Insight Select Income Fund
Annual Report
March 31, 2018

Item 2. Code of Ethics.
The registrant has adopted a code of ethics (the “Code of Ethics”) that applies to its principal executive officer, principal financial officer, principal accounting officer or controller, or persons performing similar functions (each a “Covered Person”). A copy of the Code of Ethics is included herein as Exhibit (a)(1). A copy of the Registrant’s Code of Ethics can be obtained without charge, upon request, by calling the Registrant at 1-866-333-6685. There were no amendments to the Code of Ethics during the reporting period. There were no waivers of a provision of the Code of Ethics granted to a Covered Person during the reporting period.
Item 3. Audit Committee Financial Expert.
The Board of Trustees of the registrant has determined that Suzanne P. Welsh, the Chair of the Board’s Audit Committee, possesses the technical attributes identified in Instruction 2(b) of Item 3 to Form N-CSR to qualify as an “audit committee financial expert,” and has designated Ms. Welsh as the Audit Committee’s financial expert. Ms. Welsh is an “independent” Trustee pursuant to paragraph (a)(2) of Item 3 to Form N-CSR. Under applicable securities laws, a person who is determined to be an audit committee financial expert will not be deemed an “expert” for any purpose, including without limitation for the purposes of Section 11 of the Securities Act of 1933, as a result of being designated or identified as an audit committee financial expert. The designation or identification of a person as an audit committee financial expert does not impose on such person any duties, obligations, or liabilities that are greater than the duties, obligations, and liabilities imposed on such person as a member of the audit committee and Board of Trustees in the absence of such designation or identification.
Item 4. Principal Accountant Fees and Services.
Audit Fees
| | (a) | The aggregate fees billed for each of the last two fiscal years for professional services rendered by the principal accountant for the audit of the registrant’s annual financial statements or services that are normally provided by the accountant in connection with statutory and regulatory filings or engagements for those fiscal years are $19,000 and $19,000 for the fiscal years ended March 31, 2018 and March 31, 2017, respectively. |
Audit-Related Fees
| | (b) | The aggregate fees billed in each of the last two fiscal years for assurance and related services by the principal accountant that are reasonably related to the performance of the audit of the registrant’s financial statements and are not reported under paragraph (a) of this Item are $3,000 and $3,000 for the fiscal years ended March 31, 2018 and March 31, 2017, respectively. The audit related fees relate to the 17f-2 custody audits required under the Investment Company Act of 1940, as amended. |
Tax Fees
| | (c) | The aggregate fees billed in each of the last two fiscal years for professional services rendered by the principal accountant for tax compliance, tax advice, and tax planning are $3,000 and $3,000 for the fiscal years ended March 31, 2018 and March 31, 2017, respectively. The tax fees relate to the review of the registrant’s tax filings and annual tax related disclosures in the financial statements. |
All Other Fees
| | (d) | The aggregate fees billed in each of the last two fiscal years for products and services provided by the principal accountant, other than the services reported in paragraphs (a) through (c) of this Item are $0 and $0 for the fiscal years ended March 31, 2018 and March 31, 2017, respectively. |
| | (e)(1) | The registrant’s audit committee has adopted policies and procedures relating to the pre-approval of services provided by the registrant’s principal accountant (the “Pre-Approval Policies”). The Pre-Approval Policies establish a framework intended to assist the audit committee in the proper discharge of its pre-approval responsibilities. As a general matter, the Pre-Approval Policies (i) specify certain types of audit, audit-related, tax, and other services determined to be pre-approved by the audit committee; and (ii) delineate specific procedures governing the mechanics of the pre-approval process, including the approval and monitoring of audit and non-audit service fees. Unless a service is specifically pre-approved under the Pre-Approval Policies, it must be separately pre-approved by the audit committee. |
| | (e)(2) | All services described in each of paragraphs (b) through (c) of this Item 4 were approved by the audit committee pursuant to paragraph (c)(7)(i)(A) of Rule 2-01 of Regulation S-X. Consequently, none of such services were required to be approved by the audit committee pursuant to paragraph (c)(7)(i)(C) of Rule 2-01 of Regulation S-X. |
| | (g) | The aggregate non-audit fees billed by the registrant’s accountant for services rendered to the registrant, and rendered to the registrant’s investment adviser (not including any sub-adviser whose role is primarily portfolio management and is subcontracted with or overseen by another investment adviser), and any entity controlling, controlled by, or under common control with the adviser that provides ongoing services to the registrant for each of the last two fiscal years of the registrant was $0 and $0 for the fiscal years ended March 31, 2018 and March 31, 2017, respectively. |
Item 5. Audit Committee of Listed Registrants.
The registrant has a separately designated audit committee consisting of all the independent trustees of the registrant. The members of the audit committee are: W. Thacher Brown, Ellen D. Harvey, Thomas E. Spock and Suzanne P. Welsh.
Item 6. Investments.
| (a) | Schedule of Investments in securities of unaffiliated issuers as of the close of the reporting period is included as part of the report to shareholders filed under Item 1 of this form. |
Item 7. Disclosure of Proxy Voting Policies and Procedures for Closed-End Management Investment Companies.
The registrant has adopted the proxy voting policies and procedures used by the Investment Adviser (Cutwater Investor Services Corp.). The Adviser works closely with and is administered by Insight Investment Management Limited (“Insight”), another of The Bank of New York Mellon Corporation’s investment management subsidiaries. The most current copy of that policy is attached herewith.
As a fixed income investment manager, Insight votes proxies for client securities on a relatively infrequent basis. Insight has adopted a proxy voting policy where it has been granted authority to vote such proxies and to ensure that proxies are voted in the best interest of each client. More frequently, Insight votes or consents to corporate actions, including tenders, exchanges, amendments, and restructurings which relate to individual fixed income holdings of client accounts. Determinations on voting of consents to these matters tend to be driven primarily by the Company’s view of whether the proposed action will result in an economic benefit for the affected client(s).
Voting Policy
We routinely vote on behalf of our clients with regard to the companies in which they have a shareholding. Insight retains the services of Manifest Information Services (Manifest) for the provision of proxy voting services and votes at all meetings where it is deemed appropriate and responsible to do so. Manifest analyse any resolution against Insight specific voting policy templates which will determine the direction of the vote. Where contentious issues are identified these are escalated to Insight for further review and direction. With regard to voting, the conflicts of interest policy is that Insight will always seek to act in the best interests of its clients when casting proxy votes on their behalf. Where BNY Mellon, Insight or the clients themselves have business relationships with investee companies, these will be disregarded by Insight in making its proxy voting decisions.
Generally our IMAs provide us with the authority to vote proxies on equity securities for our client accounts subject to any specific instructions from the client.
On an annual basis Insight publishes a report titled ‘Putting Principles into Practice’, available on our website, which includes a description on how we have exercised voting powers. Insight’s Voting Policy is also available on our website.
Item 8. Portfolio Managers of Closed-End Management Investment Companies.
(a)(1) Portfolio Management Team:
Gautam Khanna, CPA, CFA
Senior Portfolio Manager, Cutwater Investor Services Corp.
May 2003 - Present
Lead Portfolio Manager responsible for day-to-day management of portfolio
Jason Celente, CFA
Senior Portfolio Manager, Cutwater Investor Services Corp.
May 1999 - Present
Portfolio Manager responsible for management of portfolio
Gerard Berrigan
Head of US Fixed Income, Cutwater Investor Services Corp.
May 2003 - Present
Portfolio Manager responsible for management of portfolio
(a)(2) The table below identifies the number of accounts (other than the Fund) for which the Fund’s portfolio managers have day-to-day management responsibilities and total assets in such accounts, within each of the following categories: registered investment companies, other pooled investment vehicles, and other accounts. The Adviser currently does not manage any performance-based fee accounts.
| | | | |
| | | Number of Accounts | | Total assets of
Accounts |
| | | | | (in millions) |
Gautam Khanna, CPA, CFA | | | | |
Registered Investment Companies | | 2 | | $204.9 |
Other Pooled Investments | | - | | - |
Other Accounts | | 6 | | $562.4 |
Jason Celente, CFA | | | | |
Registered Investment Companies | | 3 | | $291.8 |
Other Pooled Investments | | - | | - |
Other Accounts | | 46 | | $2,265.5 |
E. Gerard Berrigan | | | | |
Registered Investment Companies | | 3 | | $291.8 |
Other Pooled Investments | | - | | - |
Other Accounts | | 15 | | $4,688.8 |
Potential Conflicts of Interests
Material conflicts of interest identified by the Adviser may arise in connection with a portfolio manager’s management of the Fund in addition to other fund and/or accounts managed. These potential conflicts of interest include material conflicts between the investment strategy of the Fund and the investment strategy of the other accounts managed by the portfolio manager and conflicts associated with the allocation of investment opportunities between the Fund and other accounts managed by the portfolio manager. For example, conflicts may arise in cases where multiple Firm and/or affiliate client accounts are invested in different parts of an issuer’s capital structure. Additionally, a portfolio manager may manage a separate account or other pooled investment vehicle that may have a materially higher or lower fee arrangement than the Fund or that may have a performance fee arrangement. The side-by-side management of these accounts may raise potential conflicts of interest relating to cross trading, the allocation of investment opportunities and the aggregation and allocation of trades. In addition, while portfolio managers generally only manage accounts with similar investment strategies, it is possible that due to varying investment restrictions among accounts and for other reasons that certain investments could be made for some accounts and not others or conflicting investment positions could be taken among accounts. The Adviser has a fiduciary responsibility to manage all client accounts in a fair and equitable manner. The Adviser seeks to provide best execution of all securities transactions and aggregates and then allocates securities to client accounts in a fair and timely manner. To this end, the Adviser has developed policies and procedures designed to mitigate and manage the potential conflicts of interest that may arise from side-by-side management.
(a)(3) Compensation Structure of Portfolio Manager(s) or Management Team Members
All employees of the Adviser, including the Portfolio Manager, are eligible to receive a variable component of pay in addition to their fixed compensation. The variable component is a combination of cash and Long Term Incentive Plan (LTIP) shares and is determined based on each individual’s performance rating in addition to the overall performance of the Adviser. The LTIP shares typically vest on a three-year schedule, with the aim of aligning each individual’s rewards with the success of the business.
Performance management and compensation are formally linked. Everyone participates in mid-year reviews which incorporate 360 degree feedback and an assessment of performance against objectives, as well as a formal end of year review. At that review, a performance rating is also agreed which is then a key factor in determining compensation. For investment professional, investment performance is an important, but not the only, factor.
(a)(4) Disclosure of Securities Ownership
The following table discloses the dollar range of equity securities of the Fund beneficially owned by each of the Fund’s portfolio managers as of March 31, 2018:
| | |
| | | Dollar range of
Equity Securities in
Fund (1) |
Gautam Khanna | | $10,001 to $50,000 |
Jason Celente | | NONE |
E. Gerard Berrigan | | NONE |
(1) Dollar ranges are as follows: None, $1- $10,000, $10,001-$50,000, $50,001-$100,000, $100,001-$500,000, $500,001- $1,000,000 or over $1,000,000.
(b) Not applicable.
Item 9. Purchases of Equity Securities by Closed-End Management Investment Company and Affiliated Purchasers.
Not applicable.
Item 10. Submission of Matters to a Vote of Security Holders.
There have been no material changes to the procedures by which the shareholders may recommend nominees to the registrant’s Board of Trustees during the period covered by the Annual Report included in Item 1 of this Form N-CSR.
Item 11. Controls and Procedures.
| | (a) | The registrant’s principal executive and principal financial officers, or persons performing similar functions, have concluded that the registrant’s disclosure controls and procedures (as defined in Rule 30a-3(c) under the Investment Company Act of 1940, as amended (the “1940 Act”) (17 CFR 270.30a-3(c))) are effective, as of a date within 90 days of the filing date of the report that includes the disclosure required by this paragraph, based on their evaluation of these controls and procedures required by Rule 30a-3(b) under the 1940 Act (17 CFR 270.30a-3(b)) and Rules 13a-15(b) or 15d-15(b) under the Securities Exchange Act of 1934, as amended (17 CFR 240.13a-15(b) or 240.15d-15(b)). |
| | (b) | There were no changes in the registrant’s internal control over financial reporting (as defined in Rule 30a-3(d) under the 1940 Act (17 CFR 270.30a-3(d)) that occurred during the registrant’s last fiscal quarter that has materially affected, or is reasonably likely to materially affect, the registrant’s internal control over financial reporting. |
Item 12. Disclosure of Securities Lending Activities for Closed-End Management Investment Companies.
Not applicable.
Item 13. Exhibits.
| | (a)(1) | Code of ethics, or any amendment thereto, that is the subject of disclosures required b Item 2 is attached hereto. |
| | (a)(2) | Certifications pursuant to Rule 30a-2(a) under the 1940 Act and Section 302 of the Sarbanes-Oxley Act of 2002 are attached hereto. |
| | (b) | Certifications pursuant to Rule 30a-2(b) under the 1940 Act and Section 906 of the Sarbanes-Oxley Act of 2002 are attached hereto. |
SIGNATURES
Pursuant to the requirements of the Securities Exchange Act of 1934 and the Investment Company Act of 1940, the registrant has duly caused this report to be signed on its behalf by the undersigned, thereunto duly authorized.
| | |
(Registrant) Insight Select Income Fund |
|
By (Signature and Title)* /s/ Clifford D. Corso |
Clifford D. Corso, President |
(Principal Executive Officer) |
|
| Date May 18, 2018 |
Pursuant to the requirements of the Securities Exchange Act of 1934 and the Investment Company Act of 1940, this report has been signed below by the following persons on behalf of the registrant and in the capacities and on the dates indicated.
|
|
By (Signature and Title)* /s/ Clifford D. Corso |
Clifford D. Corso, President |
(Principal Executive Officer) |
|
| Date May 18, 2018 |
|
By (Signature and Title)* /s/ Thomas E. Stabile |
Thomas E. Stabile, Treasurer |
(Principal Financial Officer) |
|
| Date May 18, 2018 |