UNITED STATES
SECURITIES AND EXCHANGE COMMISSION
Washington, D.C. 20549
FORM N-CSR
CERTIFIED SHAREHOLDER REPORT OF REGISTERED MANAGEMENT
INVESTMENT COMPANIES
Investment Company Act file number 811-02201
Insight Select Income Fund
(Exact name of registrant as specified in charter)
200 Park Avenue, 7th Floor
New York, NY 10166
(Address of principal executive offices) (Zip code)
Gautam Khanna
200 Park Avenue, 7th Floor
New York, NY 10166
(Name and address of agent for service)
Registrant’s telephone number, including area code: 212-527-1800
Date of fiscal year end: March 31
Date of reporting period: March 31, 2021
Item 1. Reports to Stockholders.
| | (a) | The Report to Shareholders is attached herewith. |
Online:
Visit www.computershare.com/investor to log into your account and select “Communication Preferences” to set your preference.
Telephone:
Contact the Fund at 866-333-6685
Overnight Mail:
Computershare Investor Services, 462 South 4th Street, Suite 1600, Louisville, KY, 40202
Regular Mail:
Computershare Investor Services, PO Box 505000, Louisville, KY, 40233-5000
1
INSIGHT SELECT INCOME FUND SHAREHOLDER LETTER
For the one-year Period Ended 03/31/21
April 17, 2021
DEAR SHAREHOLDERS:
The period under review was dominated by the global pandemic and the extraordinary monetary and fiscal response to contain the resulting economic disruption. This response led to a sharp recovery in risk assets and an impressive rebound in economic activity. Markets also paid close attention to the results of the presidential election, Senate races and the rapid distribution of new COVID-19 vaccines.
In its initial response to the pandemic, the Federal Reserve (Fed) eclipsed the scale of the entire past quantitative easing (QE) programs in weeks, committing to potentially unlimited purchases indefinitely. Additionally, the Fed purchased corporate bonds for the first time, although it did so in relatively low amounts and later ceased the purchases by the end of the period.
This helped support markets following a dramatic sell-off in March and April 2020. During this period, companies generally took advantage of the low interest rate environment to shore up their balance sheets, and markets readily absorbed elevated issuance. Stability in markets, ready access to liquidity and the forceful policy response resulted in a strong rebound in risk assets.
On the fiscal side, the CARES Act continued to work through the real economy and following the election of President Biden, with unexpected (albeit slim) majorities in both chambers of Congress, more aggressive fiscal stimulus entered the political agenda. The administration passed the $1.9 billion American Rescue Plan in February 2021, which included $1,400 stimulus checks, enhanced jobless benefits and funding for vaccines. Biden’s appointment of former Federal Reserve chair Janet Yellen as Secretary of the Treasury also hinted at heightened collaboration between monetary and fiscal authorities.
The FDA approved the first COVID-19 vaccines in late 2020, and close to 40% of the adult population received at least one dose of a vaccine by the end of the period.
This was all particularly good news for the real economy. Activity appeared to bottom in April 2020, when the country experienced its broadest shutdowns. Subsequently, payroll metrics largely beat expectations and the unemployment rate fell from 14.7% at the peak down to 6.2%. Longer-dated Treasuries sold off materially in the final months of the period under review as economic projections continued to improve.
Looking ahead, as our conviction around the level of economic activity and growth expectations has evolved, we have revised our forecasts accordingly. Our 2021 US GDP forecast now stands at 6.4%, up from 5%. We expect the unemployment rate to decline further from 6.2% at an accelerating pace. US GDP is likely to pass its pre-COVID levels during Q2 2021 and pass what would have been its pre-COVID trend level during Q2 2022. We anticipate inflation measures, due to base effects, to be temporarily elevated in the summer of 2021. However, we do not anticipate these elevated headline inflation numbers to be sustainable through 2022 and beyond. We do not forecast the first Fed rate hike until 2023 and maintain a 12-month forecast of 1.80% for the 10-year Treasury.
Due to these factors we remain constructive on corporate credit for the foreseeable future. Additionally, demand and supply dynamics remain constructive as we expect corporate issuance to slow while we expect demand to increase given interest rate stability and higher absolute yields. Yield-seeking foreign buyers, who face a dearth of income outside of the US, also remain a consistent buyer within our markets. Still, selectivity among the winners and losers
2
remains key along with discipline over valuations. We feel we are careful to rely on income generation from a variety of sources and we are therefore seeking what we believe are the most attractive opportunities across a range of sectors.
As a result, the Fund increased its allocation to high yield corporates during the reporting period based upon improving fundamentals and what we considered to be attractive value relative to other available income opportunities. While generally being overweight to the credit markets, we continue to adjust positioning to focus on the parts of the credit curve that we believe provide the best tradeoff between risk and reward, in a potentially volatile interest rate environment. We also continue to seek selective opportunities within emerging market debt, which has somewhat lagged developed markets for similar levels of risk. Balance remains paramount as there are risks on both sides of any forecast. Our performance was a function of navigating a difficult rate environment while positioning the Fund to effectively target durable and high-quality sources of predictable income from the now higher level of prevailing interest rates. We continue to resist the temptation to sacrifice portfolio liquidity in the hunt for yield, and we want to own assets we see exhibiting good visibility into the credit worthiness of issuers, stability of balance sheets, and overall staying power.
As of March 31, 2021, the Fund had a net asset value (NAV) of $21.25 per share. This represents an 8.03% increase from $19.67 per share on March 31, 2020. On March 31, 2021, the Fund’s closing price on the New York Stock Exchange was $20.45 per share, representing a 3.76% discount to NAV per share, compared with a 0.36% premium as of March 31, 2020. One of the primary objectives of the Fund is to maintain a high level of income. On March 10, 2021, the Board of Trustees declared a dividend payment of $0.20 per share payable on April 15, 2021 to shareholders of record on April 8, 2021. On an annualized basis, including the pending dividend, the annual dividend payment from ordinary income equates to a total of $0.80 per share, representing a 4.02% dividend yield based on the market price on April 16, 2021 of $19.92 per share. The dividend is evaluated on a quarterly basis and is based on the income generation capability of the portfolio and is not guaranteed for any period of time.
Total Return-Percentage Change (Annualized for periods longer than 1 year)
In Net Asset Value Per Share with All Distributions Reinvested1
| | | | | | | | | | | | | | | | | | | | |
| | | 6 Months
to
3/31/21 | | | 1 Year
to
3/31/21 | | | 3 Years
to
3/31/21 | | | 5 Years
to
3/31/21 | | | 10 Years
to
3/31/21 | |
Insight Select Income Fund | | | 1.17 | % | | | 14.71 | % | | | 6.76 | % | | | 6.41 | % | | | 6.15 | % |
Bloomberg Barclays U.S. Credit Index2 | | | -1.79 | % | | | 7.88 | % | | | 5.95 | % | | | 4.67 | % | | | 4.83 | % |
1 – Dividends and distributions, if any, are assumed for purposes of this calculation to be reinvested at prices obtained under the Fund’s dividend reinvestment plan. Total investment return does not reflect brokerage commissions. The total investment return, if for less than a full year, is not annualized. Past performance is not a guarantee of future results
2 – Source: Bloomberg Barclays as of March 31, 2021. Comprised primarily of US investment grade corporate bonds (Fund’s Benchmark).
Yield represents the major component of return in most fixed income portfolios. Given this Fund’s emphasis on income and the dividend, we generally will not have material exposure to low-yielding US Treasuries and will maintain meaningful exposure to corporate bonds. When it comes to management of credit risk, we try to look through periods of volatility to focus on an investment’s long-term creditworthiness to assess whether it will provide an attractive yield to the Fund over time.
3
The Fund’s performance will continue to be subject to trends in long-term interest rates and to corporate yield spreads. Consistent with our investment discipline, we continue to emphasize diversification and risk management within the bounds of income stability. The pie chart below summarizes the portfolio quality of the Fund’s assets as of March 31, 2021:
Percent of Total Investment (Lower of S&P and Moody’s Ratings)3
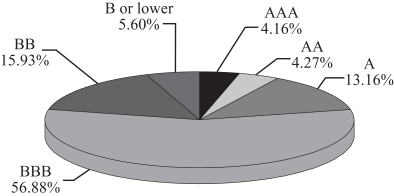
| 3 | For financial reporting purposes, credit quality ratings shown above reflect the lowest rating assigned by either Standard & Poor’s (“S&P”) or Moody’s Investors Service (“Moody’s”) if ratings differ. These rating agencies are independent, nationally recognized statistical rating organizations and are widely used. Investment grade ratings are credit ratings of BBB/Baa or higher. Below investment grade ratings are credit ratings of BB/Ba or lower. Investments designated NR are not rated by either rating agency. Unrated investments do not necessarily indicate low credit quality. Credit quality ratings and the Fund’s allocation to the ratings categories are subject to change at any time without notice. |
We would like to remind shareholders of the opportunities presented by the Fund’s dividend reinvestment plan
referred to in the Shareholder Information section of this report. The dividend reinvestment plan affords shareholders a price advantage by allowing them to purchase shares at NAV or market price, whichever is lower. This means that the reinvestment price is at market price when the Fund is trading at a discount to NAV, as is currently the situation, or at NAV per share when market trading is at a premium to that value. To participate in the plan, please contact Computershare Investor Services, the Fund’s Transfer Agent and Dividend Paying Agent, at 1-866-333-6685. The Fund’s investment adviser, Insight North America LLC, may be reached at 1-212-527-1800.

Gautam Khanna
President
Mr. Khanna’s comments reflect the investment adviser’s views generally regarding the market and the economy, and are compiled from the investment adviser’s research. These comments reflect opinions as of the date written and are subject to change at any time.
Opinions expressed herein are current opinions of Insight, and are subject to change without notice. Insight assumes no responsibility to update such information or to notify a client of any changes. Any outlooks, forecasts or portfolio weightings presented herein are as of the date appearing on this material only and are also subject to change without notice. Insight disclaims any responsibility to update such views. No forecasts can be guaranteed.
4
Information herein may contain, include or is based upon forward-looking statements within the meaning of the federal securities laws, specifically Section 21E of the Securities Exchange Act of 1934, as amended. Forward-looking statements include all statements, other than statements of historical fact, that address future activities, events or developments, including without limitation, business or investment strategy or measures to implement strategy, competitive strengths, goals expansion and growth of our business, plans, prospects and references to future or success. You can identify these statements by the fact that they do not relate strictly to historical or current facts. Words such as ‘anticipate,’ ‘estimate,’ ‘expect,’ ‘project,’ ‘intend,’ ‘plan,’ ‘believe,’ and other similar words are intended to identify these forward-looking statements. Forward-looking statements can be affected by inaccurate assumptions or by known or unknown risks and uncertainties. Many such factors will be important in determining our actual future results or outcomes. Consequently, no forward-looking statement can be guaranteed. Our actual results or outcomes may vary materially. Given these uncertainties, you should not place undue reliance on these forward-looking statements.
Past performance is not a guide to future performance, which will vary. The value of investments and any income from them will fluctuate and is not guaranteed (this may partly be due to exchange rate changes). Future returns are not guaranteed and a loss of principal may occur.
The quoted benchmarks within this presentation do not reflect deductions for fees, expenses or taxes. These benchmarks are unmanaged and cannot be purchased directly by investors. Benchmark performance is shown for illustrative purposes only and does not predict or depict the performance of any investment. There may be material factors relevant to any such comparison such as differences in volatility, and regulatory and legal restrictions between the indices shown and the strategy.
5
REPORT OF INDEPENDENT REGISTERED PUBLIC ACCOUNTING FIRM
To the Shareholders and
Board of Trustees of
Insight Select Income Fund
Opinion on the Financial Statements
We have audited the accompanying statement of assets and liabilities of Insight Select Income Fund (the “Fund”), including the schedule of investments, as of March 31, 2021, the related statement of operations for the year then ended, the statements of changes in net assets for each of the two years in the period then ended, and financial highlights for each of the five years in the period then ended, and the related notes (collectively referred to as the “financial statements”). In our opinion, the financial statements present fairly, in all material respects, the financial position of the Fund as of March 31, 2021, the results of its operations for the year then ended, the changes in its net assets for each of the two years in the period then ended, and the financial highlights for each of the five years in the period then ended, in conformity with accounting principles generally accepted in the United States of America.
Basis for Opinion
These financial statements are the responsibility of the Fund’s management. Our responsibility is to express an opinion on the Fund’s financial statements based on our audits. We are a public accounting firm registered with the Public Company Accounting Oversight Board (United States) (“PCAOB”) and are required to be independent with respect to the Fund in accordance with the U.S. federal securities laws and the applicable rules and regulations of the Securities and Exchange Commission and the PCAOB. We have served as the Fund’s auditor since 2003.
We conducted our audits in accordance with the standards of the PCAOB. Those standards require that we plan and perform the audit to obtain reasonable assurance about whether the financial statements are free of material misstatement, whether due to error or fraud. The Fund is not required to have, nor were we engaged to perform, an audit of its internal control over financial reporting. As part of our audits we are required to obtain an understanding of internal control over financial reporting, but not for the purpose of expressing an opinion on the effectiveness of the Fund’s internal control over financial reporting. Accordingly, we express no such opinion.
Our audits included performing procedures to assess the risks of material misstatement of the financial statements, whether due to error or fraud, and performing procedures that respond to those risks. Such procedures included examining, on a test basis, evidence regarding the amounts and disclosures in the financial statements. Our audits also included evaluating the accounting principles used and significant estimates made by management, as well as evaluating the overall presentation of the financial statements. Our procedures included confirmation of securities owned as of March 31, 2021 by correspondence with the custodian and brokers; when replies were not received from brokers, we performed other auditing procedures. We believe that our audits provide a reasonable basis for our opinion.
TAIT, WELLER & BAKER LLP
Philadelphia, Pennsylvania
May 10, 2021
6
SCHEDULE OF INVESTMENTS March 31, 2021
| | | | | | | | | | |
| | | Moody’s/
Standard &
Poor’s
Rating(a) | | Principal
Amount (000’s) | | | Value
(Note 1) | |
CORPORATE DEBT SECURITIES (85.61%) | |
|
AUTOMOTIVE (2.73%) | |
Allison Transmission Inc., Co. Gty., 3.75%, 01/30/31, 144A(b) | | Ba3/NA | | $ | 220 | | | $ | 213,125 | |
Ford Holdings LLC, Co. Gty., 9.30%, 03/01/30 | | Ba2/BB+ | | | 1,000 | | | | 1,320,000 | |
Ford Motor Co., Sr. Unsec. Notes, 8.50%, 04/21/23 | | Ba2/BB+ | | | 904 | | | | 1,007,960 | |
Ford Motor Co., Sr. Unsec. Notes, 8.90%, 01/15/32 | | Ba2/BB+ | | | 500 | | | | 666,723 | |
Ford Motor Credit Co. LLC, Sr. Unsec. Notes, 4.542%, 08/01/26(b) | | Ba2/BB+ | | | 1,356 | | | | 1,434,919 | |
General Motors Co., Sr. Unsec. Notes, 6.80%, 10/01/27(b) | | Baa3/BBB | | | 405 | | | | 502,171 | |
General Motors Financial Co. Inc., Sr. Unsec. Notes, 3.60%, 06/21/30(b) | | Baa3/BBB | | | 1,027 | | | | 1,082,566 | |
| | | | | | | | | | |
| | | | | | | | | 6,227,464 | |
| | | | | | | | | | |
CHEMICALS (3.25%) | |
Alpek SAB de CV, Co. Gty., 3.25%, 02/25/31, 144A(b) | | Baa3/BB+ | | | 418 | | | | 413,402 | |
Axalta Coating Systems LLC, Co. Gty., 4.75%, 06/15/27, 144A(b) | | B1/BB- | | | 150 | | | | 156,795 | |
Braskem Idesa SAPI, Sr. Sec. Notes, 7.45%, 11/15/29, 144A(b) | | NA/B | | | 473 | | | | 469,748 | |
Braskem Netherlands Finance BV, Co. Gty., 4.50%, 01/31/30, 144A | | NA/BB+ | | | 1,249 | | | | 1,254,833 | |
Braskem Netherlands Finance BV, Co. Gty., 5.875%, 01/31/50, 144A | | NA/BB+ | | | 1,181 | | | | 1,186,066 | |
INEOS Quattro Finance 2 Plc, Sr. Sec. Notes, 3.375%, 01/15/26, 144A(b) | | Ba3/BB | | | 200 | | | | 200,000 | |
Kraton Polymers LLC, Co. Gty., 4.25%, 12/15/25, 144A(b) | | B2/BB- | | | 290 | | | | 291,088 | |
Nutrition & Biosciences, Inc., Co. Gty., 1.832%, 10/15/27, 144A(b) | | Baa3/BBB | | | 267 | | | | 260,911 | |
Trinseo Materials Operating SCA, Co. Gty., 5.125%, 04/01/29, 144A(b) | | B2/B- | | | 105 | | | | 108,281 | |
Union Carbide Corp., Sr. Unsec. Notes, 7.75%, 10/01/96 | | Baa2/BBB- | | | 2,000 | | | | 3,051,369 | |
| | | | | | | | | | |
| | | | | | | | | 7,392,493 | |
| | | | | | | | | | |
COMMERCIAL SERVICES (0.10%) | |
Atento Luxco 1 SA, Sr. Sec. Notes, 8.00%, 02/10/26, 144A(b) | | Ba3/NA | | | 208 | | | | 217,975 | |
| | | | | | | | | | |
DIVERSIFIED FINANCIAL SERVICES (11.76%) | |
AerCap Ireland Capital DAC, Co. Gty., 6.50%, 07/15/25(b) | | Baa3/BBB | | | 560 | | | | 652,600 | |
AIB Group PLC, Sr. Unsec. Notes, (3M LIBOR +1.874%), 4.263%, 04/10/25, 144A(b),(c) | | Baa2/BBB- | | | 582 | | | | 632,876 | |
Citigroup Inc., Jr. Sub. Notes, (H15T5Y +3.597%), 4.00%, 12/10/25(b),(c),(d) | | Ba1/BB+ | | | 635 | | | | 641,191 | |
Citigroup, Inc., Sr. Unsec. Notes, (3M LIBOR +1.563%), 3.887%, 01/10/28(b),(c) | | A3/BBB+ | | | 1,100 | | | | 1,208,494 | |
Citigroup, Inc., Sr. Unsec. Notes, 8.125%, 07/15/39 | | A3/BBB+ | | | 70 | | | | 114,700 | |
Citigroup, Inc., Sub. Notes, 4.60%, 03/09/26 | | Baa2/BBB | | | 988 | | | | 1,114,883 | |
Citigroup, Inc., Sub. Notes, 5.30%, 05/06/44 | | Baa2/BBB | | | 926 | | | | 1,168,932 | |
Credit Agricole SA, Sub. Notes, (5Yr Swap +1.644%), 4.00%, 01/10/33, 144A(b),(c) | | Baa1/BBB+ | | | 1,025 | | | | 1,098,205 | |
Credit Suisse Group AG, Sr. Unsec. Notes, (SOFRRATE +1.56%),
2.593%, 09/11/25, 144A(b),(c) | | Baa1/BBB+ | | | 1,242 | | | | 1,287,813 | |
Danske Bank AS, Sr. Unsec. Notes, (H15T1Y +1.73%), 5.00%, 01/12/23, 144A(b),(c) | | Baa3/BBB+ | | | 739 | | | | 762,362 | |
GE Capital International Funding, Co. Gty., 4.418%, 11/15/35 | | Baa1/BBB+ | | | 588 | | | | 673,916 | |
General Electric Co., Sr. Unsec. Notes, 3.625%, 05/01/30(b) | | Baa1/BBB+ | | | 599 | | | | 643,999 | |
General Electric Co., Sr. Unsec. Notes, 6.875%, 01/10/39 | | Baa1/BBB+ | | | 287 | | | | 402,527 | |
General Electric Co., Sr. Unsec. Notes, 4.125%, 10/09/42 | | Baa1/BBB+ | | | 75 | | | | 80,469 | |
Goldman Sachs Group, Inc., Sr. Unsec. Notes, (3M LIBOR +1.75%),
1.969%, 10/28/27(b),(e) | | A2/BBB+ | | | 550 | | | | 575,568 | |
HSBC Capital Funding LP, Co. Gty., (3M LIBOR +4.98%),
10.176%, 06/30/30, 144A(b),(c),(d) | | Baa2/BB+ | | | 2,180 | | | | 3,566,654 | |
HSBC Holdings PLC, Sr. Unsec. Notes, 4.95%, 03/31/30 | | A2/A- | | | 499 | | | | 582,238 | |
LSEGA Financing PLC, Co. Gty., 1.375%, 04/06/26, 144A(b) | | A3/A | | | 612 | | | | 606,121 | |
LSEGA Financing PLC, Co. Gty., 2.50%, 04/06/31, 144A(b) | | A3/A | | | 264 | | | | 260,371 | |
Morgan Stanley, Jr. Sub. Notes, (3M LIBOR +3.61%), 3.851%, 07/15/21(b),(d),(e) | | Baa3/BB+ | | | 876 | | | | 877,309 | |
Morgan Stanley, Sub. Notes, 4.35%, 09/08/26 | | Baa1/BBB | | | 1,500 | | | | 1,695,563 | |
PNC Financial Services Group, Inc., Jr. Sub. Notes, (3M LIBOR +3.30%), 5.00%, 11/01/26(b),(c),(d) | | Baa2/BBB- | | | 757 | | | | 826,076 | |
SAFG Retirement Services, Inc., Sr. Unsec. Notes, 8.125%, 04/28/23 | | Baa1/BBB+ | | | 1,800 | | | | 2,040,584 | |
Truist Financial Corp., Jr. Sub. Notes, (H15T5Y +3.003%), 4.80%, 09/01/24(b),(c),(d) | | Baa2/BBB- | | | 1,136 | | | | 1,191,175 | |
The accompanying notes are an integral part of these financial statements.
7
SCHEDULE OF INVESTMENTS — continued
| | | | | | | | | | |
| | | Moody’s/
Standard &
Poor’s
Rating(a) | | Principal
Amount (000’s) | | | Value
(Note 1) | |
CORPORATE DEBT SECURITIES (Continued) | |
|
DIVERSIFIED FINANCIAL SERVICES (Continued) | |
UBS AG, Sub. Notes, 7.625%, 08/17/22 | | NR/BBB+ | | $ | 2,000 | | | $ | 2,179,930 | |
Wells Fargo & Co., Jr. Sub. Notes, (H15T5Y +3.453%), 3.90%, 03/15/26(b),(c),(d) | | Baa2/BB+ | | | 1,162 | | | | 1,173,504 | |
Westpac Banking Corp., Sub. Notes, (H15T5Y +1.750%), 2.668%, 11/15/35(b),(c) | | Baa1/BBB+ | | | 753 | | | | 714,522 | |
| | | | | | | | | | |
| | | | | | | | | 26,772,582 | |
| | | | | | | | | | |
ENERGY (10.33%) | |
Cleveland-Cliffs Inc., Co. Gty., 4.625%, 03/01/29, 144A(b) | | B3/NA | | | 323 | | | | 322,451 | |
Ecopetrol SA, Sr. Unsec. Notes, 6.875%, 04/29/30(b) | | Baa3/BBB- | | | 440 | | | | 535,656 | |
Enbridge, Inc., Sub. Notes, (3M LIBOR +3.89%), 6.00%, 01/15/77(b),(c) | | Ba1/BBB- | | | 750 | | | | 800,625 | |
Energy Transfer LP, Co. Gty., 3.75%, 05/15/30(b) | | Baa3/BBB- | | | 398 | | | | 410,050 | |
Enterprise Products Operating LLC, Co. Gty., (3M LIBOR +2.57%),
5.375%, 02/15/78(b),(c) | | Baa2/BBB- | | | 342 | | | | 342,627 | |
Exxon Mobil Corp., Sr. Unsec. Notes, 4.227%, 03/19/40(b) | | Aa2/AA- | | | 1,402 | | | | 1,579,914 | |
Florida Gas Transmission Co. LLC, Sr. Unsec. Notes, 9.19%, 11/01/24, 144A | | Baa2/BBB+ | | | 40 | | | | 43,096 | |
Global Partners LP, Co. Gty., 7.00%, 08/01/27(b) | | B2/B+ | | | 1,076 | | | | 1,135,180 | |
Kinder Morgan, Inc., Co. Gty., 8.05%, 10/15/30 | | Baa2/BBB | | | 1,000 | | | | 1,354,962 | |
Kinder Morgan, Inc., Co. Gty., 5.55%, 06/01/45(b) | | Baa2/BBB | | | 1,755 | | | | 2,082,565 | |
Leviathan Bond Ltd., Sr. Sec. Notes, 6.125%, 06/30/25, 144A(b) | | Ba3/BB- | | | 912 | | | | 987,240 | |
MPLX LP, Sr. Unsec. Notes, 4.25%, 12/01/27(b) | | Baa2/BBB | | | 901 | | | | 1,011,857 | |
MPLX LP, Sr. Unsec. Notes, 5.50%, 02/15/49(b) | | Baa2/BBB | | | 694 | | | | 813,183 | |
MPLX LP, Sr. Unsec. Notes, 4.90%, 04/15/58(b) | | Baa2/BBB | | | 561 | | | | 595,761 | |
NGPL PipeCo LLC, Sr. Unsec. Notes, 7.768%, 12/15/37, 144A | | Baa3/BBB- | | | 880 | | | | 1,165,565 | |
Panhandle Eastern Pipe Line Co. LP, Sr. Unsec. Notes, 7.00%, 07/15/29 | | Baa3/BBB- | | | 1,000 | | | | 1,222,111 | |
Parkland Corp., Sr. Unsec. Notes, 4.50%, 10/01/29, 144A(b) | | Ba3/BB | | | 667 | | | | 669,301 | |
Petrobras Global Finance BV, Co. Gty., 5.60%, 01/03/31(b) | | Ba2/BB- | | | 413 | | | | 435,219 | |
Petroleos del Peru SA, Sr. Unsec. Notes, 5.625%, 06/19/47, 144A | | NA/BBB- | | | 793 | | | | 832,412 | |
Petroleos Mexicanos, Co. Gty., 5.95%, 01/28/31(b) | | Ba2/BBB | | | 552 | | | | 529,920 | |
Petroleos Mexicanos, Co. Gty., 6.35%, 02/12/48 | | Ba2/BBB | | | 702 | | | | 584,485 | |
Petroleos Mexicanos, Co. Gty., 6.95%, 01/28/60(b) | | Ba2/BBB | | | 195 | | | | 168,188 | |
Saudi Arabian Oil Co., Sr. Unsec. Notes, 2.25%, 11/24/30, 144A(b) | | A1/NA | | | 853 | | | | 816,249 | |
Targa Resources Partners LP, Co. Gty., 5.50%, 03/01/30(b) | | Ba3/BB | | | 1,177 | | | | 1,235,850 | |
Transcontinental Gas Pipe Line Co. LLC, Sr. Unsec. Notes, 3.95%, 05/15/50(b) | | Baa2/BBB | | | 384 | | | | 391,545 | |
Valero Energy Corp., Co. Gty., 8.75%, 06/15/30 | | Baa2/BBB | | | 1,000 | | | | 1,403,417 | |
Valero Energy Corp., Sr. Unsec. Notes, 10.50%, 03/15/39 | | Baa2/BBB | | | 500 | | | | 842,035 | |
Williams Cos., Inc., Sr. Unsec. Notes, 7.50%, 01/15/31 | | Baa3/BBB | | | 911 | | | | 1,204,854 | |
| | | | | | | | | | |
| | | | | | | | | 23,516,318 | |
| | | | | | | | | | |
FOOD AND BEVERAGE (1.34%) | |
Albertsons Cos., Inc., Co. Gty., 3.50%, 03/15/29, 144A(b) | | B1/BB- | | | 698 | | | | 664,245 | |
Anheuser-Busch InBev Worldwide, Inc., Co. Gty., 4.70%, 02/01/36(b) | | Baa1/BBB+ | | | 645 | | | | 755,086 | |
Anheuser-Busch InBev Worldwide, Inc., Co. Gty., 4.90%, 02/01/46(b) | | Baa1/BBB+ | | | 446 | | | | 528,252 | |
Anheuser-Busch InBev Worldwide, Inc., Co. Gty., 8.20%, 01/15/39 | | Baa1/BBB+ | | | 27 | | | | 43,111 | |
Kraft Heinz Foods Co., Co. Gty., 5.50%, 06/01/50(b) | | Baa3/BB+ | | | 346 | | | | 424,944 | |
Kroger Co., Sr. Unsec. Notes, 5.40%, 01/15/49(b) | | Baa1/BBB | | | 68 | | | | 86,731 | |
MARB BondCo PLC, Co. Gty., 3.95%, 01/29/31, 144A(b) | | NA/BB- | | | 478 | | | | 455,295 | |
SEG Holding LLC, Sr. Sec. Notes, 5.625%, 10/15/28, 144A(b) | | B2/B+ | | | 80 | | | | 83,800 | |
| | | | | | | | | | |
| | | | | | | | | 3,041,464 | |
| | | | | | | | | | |
GAMING, LODGING & LEISURE (0.65%) | |
International Game Technology PLC, Sr. Sec. Notes, 4.125%, 04/15/26, 144A(b) | | Ba3/BB | | | 236 | | | | 242,509 | |
Lions Gate Capital Holdings LLC, Co. Gty., 5.50%, 04/15/29, 144A(b) | | B3/CCC+ | | | 386 | | | | 386,042 | |
Marriott International, Inc., Sr. Unsec. Notes, 5.75%, 05/01/25(b) | | Baa3/BBB- | | | 489 | | | | 560,928 | |
Travel + Leisure Co., Sr. Sec. Notes, 6.625%, 07/31/26, 144A(b) | | Ba3/BB- | | | 250 | | | | 283,838 | |
| | | | | | | | | | |
| | | | | | | | | 1,473,317 | |
| | | | | | | | | | |
The accompanying notes are an integral part of these financial statements.
8
SCHEDULE OF INVESTMENTS — continued
| | | | | | | | | | |
| | | Moody’s/
Standard &
Poor’s
Rating(a) | | Principal
Amount (000’s) | | | Value
(Note 1) | |
CORPORATE DEBT SECURITIES (Continued) | |
|
HEALTHCARE (2.58%) | |
AbbVie Inc., Sr. Unsec. Notes, 4.05%, 11/21/39(b) | | Baa2/BBB+ | | $ | 615 | | | $ | 686,556 | |
Bausch Health Cos., Inc., Co. Gty., 5.00%, 02/15/29, 144A(b) | | B3/B | | | 24 | | | | 23,700 | |
Bausch Health Cos., Inc., Co. Gty., 5.25%, 01/30/30, 144A(b) | | B3/B | | | 87 | | | | 87,349 | |
Bausch Health Cos., Inc., Co. Gty., 6.25%, 02/15/29, 144A(b) | | B3/B | | | 73 | | | | 77,471 | |
CommonSpirit Health, Sr. Sec. Notes, 2.782%, 10/01/30(b) | | Baa1/BBB+ | | | 432 | | | | 436,793 | |
DaVita, Inc., Co. Gty., 3.75%, 02/15/31, 144A(b) | | Ba3/B+ | | | 1,134 | | | | 1,086,599 | |
Endo Luxembourg Finance Co I Sarl, Sr. Sec. Notes, 6.125%, 04/01/29, 144A(b) | | B2/B+ | | | 278 | | | | 280,841 | |
Royalty Pharma PLC, Co. Gty., 2.20%, 09/02/30, 144A(b) | | Baa3/BBB- | | | 930 | | | | 886,825 | |
STERIS Irish FinCo UnLtd Co., Co. Gty., 2.70%, 03/15/31(b) | | Baa2/BBB- | | | 329 | | | | 326,281 | |
Takeda Pharmaceutical Co. Ltd., Sr. Unsec. Notes, 3.175%, 07/09/50(b) | | Baa2/BBB+ | | | 684 | | | | 648,093 | |
Takeda Pharmaceutical Co. Ltd., Sr. Unsec. Notes, 5.00%, 11/26/28(b) | | Baa2/BBB+ | | | 500 | | | | 591,401 | |
Tenet Healthcare Corp., Sr. Sec. Notes, 4.625%, 06/15/28, 144A(b) | | B1/BB- | | | 99 | | | | 101,473 | |
Teva Pharmaceutical Finance Netherlands III BV, Co. Gty., 7.125%, 01/31/25(b) | | Ba2/BB- | | | 577 | | | | 637,412 | |
| | | | | | | | | | |
| | | | | | | | | 5,870,794 | |
| | | | | | | | | | |
HOME BUILDERS (0.56%) | |
Meritage Homes Corp., Sr. Unsec. Notes, 3.875%, 04/15/29, 144A(b) | | Ba1/BB+ | | | 1,280 | | | | 1,280,000 | |
| | | | | | | | | | |
INDUSTRIAL (5.21%) | |
Altria Group, Inc., Co. Gty., 4.80%, 02/14/29(b) | | A3/BBB | | | 97 | | | | 111,610 | |
Altria Group, Inc., Co. Gty., 5.95%, 02/14/49(b) | | A3/BBB | | | 329 | | | | 409,178 | |
Ardagh Metal Packaging Finance USA LLC, Sr. Unsec. Notes,
4.00%, 09/01/29, 144A(b) | | B3/B+ | | | 200 | | | | 199,500 | |
BAT Capital Corp., Co. Gty, 3.984%, 09/25/50(b) | | Baa2/BBB+ | | | 1,274 | | | | 1,193,004 | |
BAT International Finance PLC, Co. Gty., 1.668%, 03/25/26(b) | | Baa2/BBB+ | | | 425 | | | | 420,506 | |
Boeing Co., Sr. Unsec. Notes, 4.875%, 05/01/25(b) | | Baa2/BBB- | | | 1,657 | | | | 1,844,331 | |
Boeing Co., Sr. Unsec. Notes, 5.805%, 05/01/50(b) | | Baa2/BBB- | | | 648 | | | | 817,133 | |
Carrier Global Corp., Sr. Unsec. Notes, 2.722%, 02/15/30(b) | | Baa3/BBB | | | 852 | | | | 859,162 | |
Cemex SAB de CV, Sr. Sec. Notes, 5.20%, 09/17/30, 144A(b) | | NA/BB | | | 907 | | | | 982,735 | |
Cemex SAB de CV, Sr. Sec. Notes, 3.875%, 07/11/31, 144A(b) | | NA/BB | | | 724 | | | | 706,624 | |
Cemex SAB de CV, Sr. Sec. Notes, 7.375%, 06/05/27, 144A(b) | | NA/BB | | | 200 | | | | 226,434 | |
GFL Environmental Inc., Sr. Sec. Notes, 3.50%, 09/01/28, 144A(b) | | Ba3/BB- | | | 338 | | | | 327,860 | |
Heathrow Funding, Ltd., Sr. Sec. Notes, 4.875%, 07/15/21, 144A | | NA/BBB+ | | | 200 | | | | 201,654 | |
Hillenbrand Inc., Co. Gty., 3.75%, 03/01/31(b) | | Ba1/BB+ | | | 499 | | | | 488,541 | |
Masco Corp., Sr. Unsec. Notes, 1.50%, 02/15/28(b) | | Baa2/BBB | | | 647 | | | | 620,929 | |
Northrop Grumman Space & Mission Systems Corp., Co. Gty., 7.75%, 06/01/29 | | Baa1/BBB+ | | | 500 | | | | 659,968 | |
Raytheon Technologies Corp., Sr. Unsec. Notes, 3.75%, 11/01/46(b) | | Baa1/A- | | | 700 | | | | 743,948 | |
Sensata Technologies BV, Co. Gty., 4.00%, 04/15/29, 144A(b) | | Ba3/BB+ | | | 200 | | | | 203,606 | |
SRM Escrow Issuer LLC, Sr. Sec. Notes, 6.00%, 11/01/28, 144A(b) | | B1/B+ | | | 397 | | | | 416,056 | |
Sydney Airport Finance Co. Property, Ltd., Sr. Sec. Notes, 3.375%, 04/30/25, 144A(b) | | Baa1/BBB+ | | | 400 | | | | 425,578 | |
| | | | | | | | | | |
| | | | | | | | | 11,858,357 | |
| | | | | | | | | | |
INSURANCE (9.71%) | |
Allianz SE, Jr. Sub. Notes, (H15T5Y +2.973%), 3.50%, 04/30/26, 144A(b),(c),(d) | | Baa1/A | | | 800 | | | | 812,000 | |
Allstate Corp., Jr. Sub. Notes, (3M LIBOR +2.12%), 6.50%, 05/15/57(b),(c) | | Baa1/BBB | | | 2,200 | | | | 2,821,500 | |
American International Group, Inc., Jr. Sub. Notes, (3M LIBOR +4.195%),
8.175%, 05/15/58(b),(c) | | Baa2/BBB- | | | 2,500 | | | | 3,461,751 | |
Brighthouse Financial, Inc., Sr. Unsec. Notes, 5.625%, 05/15/30(b) | | Baa3/BBB+ | | | 383 | | | | 447,702 | |
Farmers Exchange Capital, Sub. Notes, 7.20%, 07/15/48, 144A | | Baa2/BBB+ | | | 2,250 | | | | 2,968,741 | |
Guardian Life Insurance Co. of America, Sub. Notes, 4.85%, 01/24/77, 144A | | A1/AA- | | | 148 | | | | 171,305 | |
Liberty Mutual Group, Inc., Co. Gty., 3.951%, 10/15/50, 144A(b) | | Baa2/BBB | | | 250 | | | | 257,106 | |
Liberty Mutual Group, Inc., Co. Gty., (3M LIBOR +7.12%),
10.75%, 06/15/58, 144A(b),(c) | | Baa3/BB+ | | | 1,000 | | | | 1,416,400 | |
Massachusetts Mutual Life Insurance Co., Sub. Notes, 4.90%, 04/01/77, 144A | | A2/AA- | | | 980 | | | | 1,158,943 | |
The accompanying notes are an integral part of these financial statements.
9
SCHEDULE OF INVESTMENTS — continued
| | | | | | | | | | |
| | | Moody’s/
Standard &
Poor’s
Rating(a) | | Principal
Amount (000’s) | | | Value
(Note 1) | |
CORPORATE DEBT SECURITIES (Continued) | |
|
INSURANCE (Continued) | |
Massachusetts Mutual Life Insurance Co., Sub. Notes, 3.729%, 10/15/70, 144A | | A2/AA- | | $ | 243 | | | $ | 236,261 | |
MetLife, Inc., Jr. Sub. Notes, 9.25%, 04/08/38, 144A(b) | | Baa2/BBB | | | 1,059 | | | | 1,551,496 | |
MetLife, Inc., Jr. Sub. Notes, 6.40%, 12/15/36(b) | | Baa2/BBB | | | 637 | | | | 798,713 | |
MetLife, Inc., Jr. Sub. Notes, 10.75%, 08/01/39(b) | | Baa2/BBB | | | 1,000 | | | | 1,670,889 | |
Nationwide Mutual Insurance Co., Sub. Notes, 8.25%, 12/01/31, 144A | | A3/A- | | | 500 | | | | 671,212 | |
Nationwide Mutual Insurance Co., Sub. Notes, 9.375%, 08/15/39, 144A | | A3/A- | | | 215 | | | | 350,684 | |
New York Life Insurance Co., Sub. Notes, 6.75%, 11/15/39, 144A | | Aa2/AA- | | | 103 | | | | 146,704 | |
Principal Financial Group, Inc., Co. Gty., (3M LIBOR +3.044%), 3.242%, 05/15/55(b),(c) | | Baa2/BBB | | | 1,135 | | | | 1,115,138 | |
Prudential Financial, Inc., Jr. Sub. Notes, (3M LIBOR +3.92%), 5.625%, 06/15/43(b),(c) | | Baa1/BBB+ | | | 600 | | | | 642,856 | |
Prudential Financial, Inc., Jr. Sub. Notes, (3M LIBOR +2.665%), 5.70%, 09/15/48(b),(c) | | Baa1/BBB+ | | | 1,241 | | | | 1,417,280 | |
| | | | | | | | | | |
| | | | | | | | | 22,116,681 | |
| | | | | | | | | | |
MEDIA (9.42%) | |
AMC Networks Inc., Co. Gty., 4.25%, 02/15/29(b) | | Ba3/BB | | | 1,198 | | | | 1,165,055 | |
CCO Holdings LLC, Sr. Unsec. Notes, 4.25%, 02/01/31, 144A(b) | | B1/BB | | | 75 | | | | 75,167 | |
CCO Holdings LLC, Sr. Unsec. Notes, 4.50%, 05/01/32, 144A(b) | | B1/BB | | | 1,017 | | | | 1,029,713 | |
Charter Communications Operating LLC, Sr. Sec. Notes, 5.75%, 04/01/48(b) | | Ba1/BBB- | | | 774 | | | | 941,304 | |
Comcast Corp., Co. Gty., 7.05%, 03/15/33 | | A3/A- | | | 2,000 | | | | 2,851,116 | |
Cox Communications, Inc., Sr. Unsec. Notes, 6.80%, 08/01/28 | | Baa2/BBB | | | 1,500 | | | | 1,854,346 | |
Cox Enterprises, Inc., Sr. Unsec. Notes, 7.375%, 07/15/27, 144A | | Baa2/BBB | | | 500 | | | | 646,307 | |
CSC Holdings LLC, Co. Gty., 3.375%, 02/15/31, 144A(b) | | Ba3/BB | | | 636 | | | | 599,430 | |
CSC Holdings LLC, Co. Gty., 4.125%, 12/01/30, 144A(b) | | Ba3/BB | | | 448 | | | | 444,989 | |
CSC Holdings LLC, Co. Gty., 6.50%, 02/01/29, 144A(b) | | Ba3/BB | | | 954 | | | | 1,054,170 | |
CSC Holdings LLC, Sr. Unsec. Notes, 4.625%, 12/01/30, 144A(b) | | B3/B | | | 1,336 | | | | 1,314,110 | |
Gray Television Inc., Co. Gty., 4.75%, 10/15/30, 144A(b) | | B3/B+ | | | 21 | | | | 20,816 | |
Grupo Televisa SAB, Sr. Unsec. Notes, 5.00%, 05/13/45(b) | | Baa1/BBB+ | | | 557 | | | | 610,071 | |
Grupo Televisa SAB, Sr. Unsec. Notes, 6.625%, 01/15/40 | | Baa1/BBB+ | | | 159 | | | | 203,899 | |
Lamar Media Corp., Co. Gty., 3.625%, 01/15/31, 144A(b) | | B1/BB- | | | 211 | | | | 202,562 | |
Radiate Holdco LLC, Sr. Sec. Notes, 4.50%, 09/15/26, 144A(b) | | B1/B | | | 124 | | | | 125,395 | |
RELX, Inc., Sr. Unsec. Notes, 8.875%, 06/01/22 | | WR/BBB+ | | | 2,000 | | | | 2,187,642 | |
Scripps Escrow II Inc., Sr. Sec. Notes, 3.875%, 01/15/29, 144A(b) | | Ba3/BB- | | | 42 | | | | 41,265 | |
Time Warner Entertainment Co. LP, Sr. Sec. Notes, 8.375%, 07/15/33 | | Ba1/BBB- | | | 1,360 | | | | 1,966,848 | |
ViacomCBS, Inc., Sr. Unsec. Notes, 4.20%, 05/19/32(b) | | Baa2/BBB | | | 641 | | | | 718,505 | |
ViacomCBS, Inc., Sr. Unsec. Notes, 6.875%, 04/30/36 | | Baa2/BBB | | | 179 | | | | 246,991 | |
Virgin Media Finance PLC, Co. Gty., 5.00%, 07/15/30, 144A(b) | | B2/B | | | 200 | | | | 199,750 | |
VTR Finance NV, Sr. Unsec. Notes, 6.375%, 07/15/28, 144A(b) | | B1/B | | | 443 | | | | 478,440 | |
Walt Disney Co., Co. Gty., 7.90%, 12/01/95 | | A2/BBB+ | | | 1,400 | | | | 2,464,120 | |
| | | | | | | | | | |
| | | | | | | | | 21,442,011 | |
| | | | | | | | | | |
MINING (1.12%) | |
Anglo American Capital PLC, Co. Gty., 2.625%, 09/10/30, 144A(b) | | Baa2/BBB | | | 567 | | | | 555,360 | |
AngloGold Ashanti Holdings PLC, Co. Gty., 3.75%, 10/01/30(b) | | Baa3/BB+ | | | 339 | | | | 342,506 | |
FMG Resources August 2006 Pty Ltd., Co. Gty., 4.375%, 04/01/31, 144A(b) | | Ba1/BB+ | | | 366 | | | | 372,863 | |
IAMGOLD Corp., Co. Gty., 5.75%, 10/15/28, 144A(b) | | B2/B+ | | | 701 | | | | 709,973 | |
Newcrest Finance Pty Ltd., Co. Gty., 3.25%, 05/13/30, 144A(b) | | Baa2/BBB | | | 319 | | | | 333,565 | |
Volcan Cia Minera SAA, Sr. Unsec. Notes, 4.375%, 02/11/26, 144A(b) | | B1/NA | | | 222 | | | | 227,883 | |
| | | | | | | | | | |
| | | | | | | | | 2,542,150 | |
| | | | | | | | | | |
PAPER (0.70%) | |
Celulosa Arauco y Constitucion SA, Sr. Unsec. Notes, 4.20%, 01/29/30, 144A(b) | | Baa3/BBB- | | | 579 | | | | 623,149 | |
Inversiones CMPC SA, Co. Gty., 3.85%, 01/13/30, 144A(b) | | Baa3/BBB- | | | 580 | | | | 615,960 | |
Suzano Austria GmbH, Co. Gty., 3.75%, 01/15/31(b) | | NA/BBB- | | | 351 | | | | 362,846 | |
| | | | | | | | | | |
| | | | | | | | | 1,601,955 | |
| | | | | | | | | | |
The accompanying notes are an integral part of these financial statements.
10
SCHEDULE OF INVESTMENTS — continued
| | | | | | | | | | |
| | | Moody’s/
Standard &
Poor’s
Rating(a) | | Principal
Amount (000’s) | | | Value
(Note 1) | |
CORPORATE DEBT SECURITIES (Continued) | |
|
REAL ESTATE INVESTMENT TRUST (REIT) (1.41%) | |
Iron Mountain, Inc., Co. Gty., 5.00%, 07/15/28, 144A(b) | | Ba3/BB- | | $ | 59 | | | $ | 60,328 | |
Iron Mountain, Inc., Co. Gty., 4.875%, 09/15/29, 144A(b) | | Ba3/BB- | | | 398 | | | | 402,955 | |
Iron Mountain, Inc., Co. Gty., 5.25%, 07/15/30, 144A(b) | | Ba3/BB- | | | 578 | | | | 596,380 | |
Scentre Group Trust 2, Co. Gty., (H15T5Y +4.379%), 4.75%, 09/24/26, 144A(b),(c) | | Baa1/BBB+ | | | 2,007 | | | | 2,109,859 | |
WEA Finance LLC, Co. Gty., 4.625%, 09/20/48, 144A(b) | | Baa2/BBB+ | | | 36 | | | | 35,394 | |
| | | | | | | | | | |
| | | | | | | | | 3,204,916 | |
| | | | | | | | | | |
RETAIL & RESTAURANT (1.19%) | |
Lowe’s Cos Inc., Sr. Unsec. Notes, 3.00%, 10/15/50(b) | | Baa1/BBB+ | | | 385 | | | | 357,428 | |
Macy’s Retail Holdings LLC, Co. Gty., 5.875%, 04/01/29, 144A(b) | | B1/B | | | 78 | | | | 79,985 | |
Murphy Oil USA Inc., Co. Gty., 3.75%, 02/15/31, 144A(b) | | Ba2/BB+ | | | 119 | | | | 116,968 | |
Starbucks Corp., Sr. Unsec. Notes, 4.45%, 08/15/49(b) | | Baa1/BBB+ | | | 1,781 | | | | 2,060,365 | |
Superior Plus LP, Sr. Unsec. Notes, 4.50%, 03/15/29, 144A(b) | | Ba3/BB- | | | 98 | | | | 99,000 | |
| | | | | | | | | | |
| | | | | | | | | 2,713,746 | |
| | | | | | | | | | |
TECHNOLOGY (3.71%) | |
Broadcom, Inc., Co. Gty., 4.75%, 04/15/29(b) | | Baa3/BBB- | | | 1,109 | | | | 1,245,878 | |
Broadcom, Inc., Co. Gty., 3.75%, 02/15/51, 144A(b) | | Baa3/BBB- | | | 166 | | | | 159,425 | |
Broadcom, Inc., Sr. Unsec. Notes, 3.469%, 04/15/34, 144A(b) | | NA/BBB- | | | 1,655 | | | | 1,664,951 | |
Dell International LLC, Sr. Sec. Notes, 5.85%, 07/15/25, 144A(b) | | Baa3/BBB- | | | 342 | | | | 398,555 | |
Dell International LLC, Sr. Sec. Notes, 8.35%, 07/15/46, 144A(b) | | Baa3/BBB- | | | 845 | | | | 1,282,678 | |
Oracle Corp., Sr. Unsec. Notes, 2.30%, 03/25/28(b) | | Baa2/A | | | 1,130 | | | | 1,142,552 | |
Oracle Corp., Sr. Unsec. Notes, 3.60%, 04/01/40(b) | | Baa2/A | | | 2,331 | | | | 2,340,210 | |
Seagate HDD Cayman, Co. Gty., 3.125%, 07/15/29, 144A(b) | | Ba1/BB+ | | | 210 | | | | 202,823 | |
| | | | | | | | | | |
| | | | | | | | | 8,437,072 | |
| | | | | | | | | | |
TELECOMMUNICATIONS (4.94%) | |
AT&T, Inc., Sr. Unsec. Notes, 3.30%, 02/01/52(b) | | Baa2/BBB | | | 2,321 | | | | 2,097,829 | |
AT&T, Inc., Sr. Unsec. Notes, 4.50%, 05/15/35(b) | | Baa2/BBB | | | 515 | | | | 580,313 | |
AT&T, Inc., Sr. Unsec. Notes, 4.75%, 05/15/46(b) | | Baa2/BBB | | | 425 | | | | 485,740 | |
Consolidated Communications Inc., Sr. Sec. Notes, 5.00%, 10/01/28, 144A(b) | | B2/B+ | | | 194 | | | | 195,513 | |
Deutsche Telekom International Finance BV, Co. Gty., 8.75%, 06/15/30(f) | | Baa1/BBB | | | 2,000 | | | | 2,963,329 | |
Frontier Communications Corp., Sr. Sec. Notes, 5.00%, 05/01/28, 144A(b) | | B3/(P)B+ | | | 255 | | | | 259,463 | |
T-Mobile USA Inc., Co. Gty., 3.375%, 04/15/29(b) | | Ba3/BB | | | 1,108 | | | | 1,119,412 | |
Verizon Communications, Inc., Sr. Unsec. Notes, 2.55%, 03/21/31(b) | | Baa1/BBB+ | | | 457 | | | | 455,781 | |
Verizon Communications, Inc., Sr. Unsec. Notes, 3.55%, 03/22/51(b) | | Baa1/BBB+ | | | 674 | | | | 671,015 | |
Verizon Communications, Inc., Sr. Unsec. Notes, 4.812%, 03/15/39 | | Baa1/BBB+ | | | 1,898 | | | | 2,266,508 | |
Windstream Escrow LLC, Sr. Sec. Notes, 7.75%, 08/15/28, 144A(b) | | B3/B | | | 146 | | | | 148,373 | |
| | | | | | | | | | |
| | | | | | | | | 11,243,276 | |
| | | | | | | | | | |
TRANSPORTATION (6.17%) | |
Air Canada, Pass Through Certs., Series 2020-2, Class A, 5.25%, 04/01/29, 144A | | NA/A | | | 278 | | | | 298,678 | |
American Airlines Inc., Sr. Sec. Notes, 5.50%, 04/20/26, 144A | | Ba2/NA | | | 354 | | | | 369,045 | |
American Airlines Inc., Sr. Sec. Notes, 5.75%, 04/20/29, 144A | | Ba2/NA | | | 162 | | | | 172,660 | |
American Airlines, Pass Through Certs., Series 2017-1, Class AA, 3.65%, 02/15/29 | | Baa1/NA | | | 887 | | | | 893,755 | |
American Airlines, Pass Through Certs., Series 2017-2, Class AA, 3.35%, 10/15/29 | | Baa1/NA | | | 1,372 | | | | 1,385,155 | |
American Airlines, Pass Through Certs., Series 2019-1, Class AA, 3.15%, 02/15/32 | | Baa1/A | | | 770 | | | | 765,846 | |
Ashtead Capital, Inc., Co. Gty., 4.00%, 05/01/28, 144A(b) | | Baa3/BBB- | | | 555 | | | | 579,775 | |
Ashtead Capital, Inc., Co. Gty., 4.25%, 11/01/29, 144A(b) | | Baa3/BBB- | | | 200 | | | | 214,422 | |
Avis Budget Car Rental LLC, Co. Gty., 5.375%, 03/01/29, 144A(b) | | B3/B | | | 595 | | | | 615,483 | |
BNSF Funding Trust I, Co. Gty., (3M LIBOR +2.35%), 6.613%, 12/15/55(b),(c) | | Baa2/A- | | | 250 | | | | 286,452 | |
British Airlines, Pass Through Certs., Series 2020-1, Class A, Sr. Sec. Notes,
4.25%, 11/15/32, 144A | | NA/A | | | 197 | | | | 206,572 | |
Continental Airlines, Pass Through Certs., Series 2000-2, Class A1, 7.707%, 04/02/21 | | Baa1/BBB- | | | 72 | | | | 72,279 | |
The accompanying notes are an integral part of these financial statements.
11
SCHEDULE OF INVESTMENTS — continued
| | | | | | | | | | |
| | | Moody’s/
Standard &
Poor’s
Rating(a) | | Principal
Amount (000’s) | | | Value
(Note 1) | |
CORPORATE DEBT SECURITIES (Continued) | |
|
TRANSPORTATION (Continued) | |
Delta Air Lines, Inc., Sr. Sec. Notes, 4.50%, 10/20/25, 144A | | Baa1/NA | | $ | 120 | | | $ | 127,783 | |
Delta Air Lines, Inc., Sr. Sec. Notes, 4.75%, 10/20/28, 144A | | Baa1/NA | | | 209 | | | | 227,157 | |
ERAC USA Finance LLC, Co. Gty., 7.00%, 10/15/37, 144A | | Baa1/A- | | | 1,500 | | | | 2,158,616 | |
Hidrovias International Finance SARL, Sr. Unsec. Notes, 4.95%, 02/08/31, 144A(b) | | Ba3/NA | | | 200 | | | | 200,000 | |
JetBlue Airlines, Pass Through Certs., Series 2020-1, Class A, Sr. Sec. Notes,
4.00%, 11/15/32 | | A2/NA | | | 1,074 | | | | 1,157,868 | |
Prime Security Services Borrower LLC, Sr. Sec. Notes, 3.375%, 08/31/27, 144A(b) | | Ba3/BB- | | | 559 | | | | 542,230 | |
Simpar Europe SA, Co. Gty., 5.20%, 01/26/31, 144A(b) | | NA/BB- | | | 544 | | | | 532,755 | |
Union Pacific Corp., Sr. Unsec. Notes, 3.839%, 03/20/60(b) | | Baa1/A- | | | 503 | | | | 526,595 | |
United Airlines, Pass Through Certs., Series 2013-1, Class B, 5.375%, 08/15/21 | | NA/BB | | | 201 | | | | 203,375 | |
United Airlines, Pass Through Certs., Series 2018-1, Class B, 4.60%, 03/01/26 | | Baa2/NA | | | 699 | | | | 706,907 | |
United Airlines, Pass Through Certs., Series 2019-1, Class AA, 4.15%, 08/25/31 | | A1/NA | | | 397 | | | | 423,040 | |
United Airlines, Pass Through Certs., Series 2019-2, Class AA, 2.70%, 05/01/32 | | A1/NA | | | 1,077 | | | | 1,045,212 | |
United Airlines, Pass Through Certs., Series 2020-1, Class A, 5.875%, 10/15/27 | | A3/A | | | 310 | | | | 343,990 | |
| | | | | | | | | | |
| | | | | | | | | 14,055,650 | |
| | | | | | | | | | |
UTILITIES (8.73%) | |
AES Gener SA., Jr. Sub. Notes, (H15T5Y +4.917%), 6.35%, 10/07/79, 144A(b),(c) | | Ba2/BB | | | 878 | | | | 940,558 | |
AES Panama Generation Holdings SRL, Sr. Sec. Notes, 4.375%, 05/31/30, 144A(b) | | Baa3/NA | | | 549 | | | | 568,050 | |
Black Hills Corp., Sr. Unsec. Notes, 3.875%, 10/15/49(b) | | Baa2/BBB+ | | | 1,175 | | | | 1,175,246 | |
CMS Energy Corp., Jr. Sub. Notes, (H15T5Y +2.900%), 3.75%, 12/01/50(b),(c) | | Baa2/BBB- | | | 238 | | | | 235,620 | |
Consolidated Edison Co. of New York, Inc., Sr. Unsec. Notes, 3.95%, 04/01/50(b) | | Baa1/A- | | | 449 | | | | 483,512 | |
Consorcio Transmantaro SA, Sr. Unsec. Notes, 4.70%, 04/16/34, 144A | | Baa3/NA | | | 200 | | | | 225,752 | |
Edison International, Jr. Sub. Notes, (H15T5Y +4.698%), 5.375%, 03/15/26(b),(c),(d) | | Ba2/BB+ | | | 638 | | | | 649,165 | |
Edison International, Sr. Unsec. Notes, 3.55%, 11/15/24(b) | | Baa3/BBB- | | | 575 | | | | 617,776 | |
Enel Finance International NV, Co. Gty., 4.625%, 09/14/25, 144A | | Baa1/BBB+ | | | 1,458 | | | | 1,650,344 | |
Evergy Metro, Inc., Sr. Sec. Notes, 4.20%, 06/15/47(b) | | A2/A+ | | | 917 | | | | 1,017,917 | |
FirstEnergy Corp., Sr. Unsec. Notes, 5.35%, 07/15/47(b),(f) | | Ba1/BB | | | 1,570 | | | | 1,763,380 | |
Hydro-Quebec, 8.25%, 04/15/26 | | Aa2/AA- | | | 1,550 | | | | 2,034,120 | |
IPALCO Enterprises, Inc., Sr. Sec. Notes, 4.25%, 05/01/30, 144A(b) | | Baa3/BBB- | | | 462 | | | | 502,952 | |
MidAmerican Funding LLC, Sr. Sec. Notes, 6.927%, 03/01/29 | | A2/A- | | | 500 | | | | 656,510 | |
NiSource, Inc., Jr. Sub. Notes, (H15T5Y +2.843%), 5.65%, 06/15/23(b),(c),(d) | | NA/BBB- | | | 696 | | | | 718,620 | |
Pacific Gas and Electric Co., 2.10%, 08/01/27(b) | | Baa3/BBB- | | | 391 | | | | 382,714 | |
Pacific Gas and Electric Co., 3.50%, 08/01/50(b) | | Baa3/BBB- | | | 617 | | | | 537,546 | |
Piedmont Natural Gas Co. Inc., Sr. Unsec. Notes, 3.50%, 06/01/29(b) | | A3/BBB+ | | | 1,120 | | | | 1,207,527 | |
Southern Co. Gas Capital Corp., Co. Gty., 5.875%, 03/15/41(b) | | Baa1/A- | | | 992 | | | | 1,307,916 | |
Southern Co. Gas Capital Corp., Co. Gty., 3.95%, 10/01/46(b) | | Baa1/A- | | | 539 | | | | 556,246 | |
Southern Co. Gas Capital Corp., Co. Gty., 4.40%, 05/30/47(b) | | Baa1/A- | | | 1,164 | | | | 1,283,760 | |
Transelec SA, Sr. Unsec. Notes, 4.25%, 01/14/25, 144A(b) | | Baa1/BBB | | | 750 | | | | 817,500 | |
Transelec SA, Sr. Unsec. Notes, 3.875%, 01/12/29, 144A(b) | | Baa1/BBB | | | 490 | | | | 533,684 | |
| | | | | | | | | | |
| | | | | | | | | 19,866,415 | |
| | | | | | | | | | |
TOTAL CORPORATE DEBT SECURITIES (Cost of $175,169,042) | | | | | | | | | 194,874,636 | |
| | | | | | | | | | |
ASSET BACKED SECURITIES (6.60%) | |
Antares CLO Ltd., Series 2017-1, Class A, (3M LIBOR +2.70%),
2.893%, 04/20/33, 144A(b),(e) | | NA/A | | | 1,093 | | | | 1,091,943 | |
BCC Funding XVII LLC, Series 2020-1, Class A2, 0.91%, 08/20/25, 144A(b) | | Aaa/NA | | | 205 | | | | 205,776 | |
CF Hippolyta LLC, Series 2020-1, Class A1, 1.69%, 07/15/60, 144A(b) | | NA/AA- | | | 649 | | | | 653,682 | |
DB Master Finance LLC, Series 2017-1A, Class A2I, 3.629%, 11/20/47, 144A(b) | | NA/BBB | | | 326 | | | | 331,861 | |
DRB Prime Student Loan Trust, Series 2016-B, Class A2, 2.89%, 06/25/40, 144A(b) | | Aaa/NA | | | 73 | | | | 73,661 | |
DRB Prime Student Loan Trust, Series 2017-A, Class A2B, 2.85%, 05/27/42, 144A(b) | | Aaa/NA | | | 582 | | | | 587,622 | |
DT Auto Owner Trust, Series 2018-2A, Class C, 3.67%, 03/15/24, 144A(b) | | NA/AAA | | | 11 | | | | 11,481 | |
The accompanying notes are an integral part of these financial statements.
12
SCHEDULE OF INVESTMENTS — continued
| | | | | | | | | | |
| | | Moody’s/
Standard &
Poor’s
Rating(a) | | Principal
Amount (000’s) | | | Value
(Note 1) | |
ASSET BACKED SECURITIES (Continued) | |
Fortress Credit Opportunities IX CLO, Ltd., Series 2017-9A, Class A1T,
(3M LIBOR +1.55%), 1.744%, 11/15/29, 144A(b),(e) | | Aaa/AAA | | $ | 600 | | | $ | 598,944 | |
Golub Capital Partners Ltd., Series 2017-19RA, Class B, (3M LIBOR +2.55%),
2.765%, 07/26/29, 144A(b),(e) | | A2/NA | | | 1,935 | | | | 1,934,033 | |
Golub Capital Partners Ltd., Series 2018-36A, Class C, (3M LIBOR +2.10%),
2.295%, 02/05/31, 144A(b),(e) | | NA/A | | | 2,250 | | | | 2,167,922 | |
ITE Rail Fund Levered LP, Series 2021-1A, Class A, 2.25%, 02/28/51, 144A(b) | | NA/A | | | 202 | | | | 201,676 | |
IVY Hill Middle Market Credit Fund Ltd., Series 12A, Class B, (3M LIBOR +3.00%), 3.224%, 07/20/29, 144A(b),(e) | | A3/NR | | | 866 | | | | 858,807 | |
LoanCore Issuer, Ltd., Series 2018-CRE1, Class A, (1M LIBOR +1.13%),
1.236%, 05/15/28, 144A(b),(e) | | Aaa/NA | | | 240 | | | | 240,049 | |
Navient Private Education Refi Loan Trust, Series 2021-A, Class A,
0.84%, 05/15/69, 144A(b) | | NA/AAA | | | 224 | | | | 223,701 | |
PMT Issuer Trust, Series 2021-FT1, Class A, (1M LIBOR +3.00%),
2.992%, 03/25/26, 144A(b),(e) | | NA/NA | | | 566 | | | | 565,836 | |
Small Business Administration Participation Certificates, Series 2010-20F, Class 1,
3.88%, 06/01/30 | | Aaa/AA+ | | | 77 | | | | 83,006 | |
SMB Private Education Loan Trust, Series 2017-B, Class A2B, (1M LIBOR +0.75%), 0.856%, 10/15/35, 144A(b),(e) | | Aaa/AAA | | | 541 | | | | 542,983 | |
Sofi Consumer Loan Program Trust, Series 2018-1, Class B, 3.65%, 02/25/27, 144A(b) | | NA/AAA | | | 739 | | | | 751,812 | |
Sofi Professional Loan Program LLC, Series 2017-C, Class B,
3.56%, 07/25/40, 144A(b),(e) | | NA/AA+ | | | 1,099 | | | | 1,137,563 | |
Textainer Marine Containers VII Ltd., Series 2021-1A, Class A,
1.68%, 02/20/46, 144A(b) | | NA/A | | | 1,023 | | | | 992,683 | |
TIF Funding II LLC, Series 2021-1A, Class A, 1.65%, 02/20/46, 144A(b) | | NA/A | | | 544 | | | | 523,678 | |
Willis Engine Structured Trust IV, Series 2018-A, Class A, 4.75%, 09/15/43, 144A(b),(g) | | NA/NA | | | 1,252 | | | | 1,245,451 | |
| | | | | | | | | | |
TOTAL ASSET BACKED SECURITIES (Cost of $15,094,886) | | | | | | | | | 15,024,170 | |
| | | | | | | | | | |
COMMERCIAL MORTGAGE-BACKED SECURITIES (1.23%) | |
Angel Oak Mortgage Trust I LLC, Series 2019-2, Class A1,
3.628%, 03/25/49, 144A(b),(e) | | NA/NA | | | 121 | | | | 122,939 | |
CGMS Commercial Mortgage Trust, Series 2017-MDRB, Class A, (1M LIBOR +1.10%), 1.206%, 07/15/30, 144A(e) | | NA/AAA | | | 54 | | | | 53,710 | |
Citigroup Commercial Mortgage Trust, Series 2016-P6, Class C, 4.279%, 12/10/49(b),(e) | | NR/NA | | | 367 | | | | 354,154 | |
Lanark Master Issuer PLC, Series 2019-1A, Class 1A1, (3M LIBOR +0.77%),
0.952%, 12/22/69, 144A(b),(e) | | Aaa/AAA | | | 313 | | | | 313,249 | |
Morgan Stanley Bank of America Merrill Lynch Trust, Series 2012-CKSV, Class C, 4.284%, 10/15/30, 144A(b),(e) | | NA/BBB- | | | 2,710 | | | | 1,948,389 | |
| | | | | | | | | | |
TOTAL COMMERCIAL MORTGAGE-BACKED SECURITIES
(Cost of $3,548,306) | | | | | | | | | 2,792,441 | |
| | | | | | | | | | |
RESIDENTIAL MORTGAGE-BACKED SECURITIES (0.14%) | |
FHLMC Pool # A15675, 6.00%, 11/01/33 | | Aaa/AA+ | | | 65 | | | | 77,909 | |
FHLMC Pool # G00182, 9.00%, 09/01/22(h) | | Aaa/AA+ | | | — | | | | 1 | |
FNMA Pool # 754791, 6.50%, 12/01/33 | | Aaa/AA+ | | | 128 | | | | 147,636 | |
FNMA Pool # 763852, 5.50%, 02/01/34 | | Aaa/AA+ | | | 80 | | | | 92,921 | |
GNSF Pool # 307527, 9.00%, 06/15/21(h) | | Aaa/AA+ | | | — | | | | 99 | |
GNSF Pool # 417239, 7.00%, 02/15/26 | | Aaa/AA+ | | | 3 | | | | 2,786 | |
GNSF Pool # 780374, 7.50%, 12/15/23 | | Aaa/AA+ | | | 1 | | | | 919 | |
| | | | | | | | | | |
TOTAL RESIDENTIAL MORTGAGE-BACKED SECURITIES
(Cost of $262,500) | | | | | | | | | 322,271 | |
| | | | | | | | | | |
The accompanying notes are an integral part of these financial statements.
13
SCHEDULE OF INVESTMENTS — continued
| | | | | | | | | | | | |
| | | Moody’s/
Standard &
Poor’s
Rating(a) | | | Principal
Amount (000’s) | | | Value
(Note 1) | |
MUNICIPAL BONDS (1.14%) | |
San Francisco City & County Public Utilities Commission, Water Revenue, Build America Bonds, 6.00%, 11/01/40 | | | Aa2/AA- | | | $ | 145 | | | $ | 194,277 | |
State of California, Build America Bonds, GO, 7.625%, 03/01/40 | | | Aa2/AA- | | | | 1,500 | | | | 2,405,505 | |
| | | | | | | | | | | | |
TOTAL MUNICIPAL BONDS (Cost of $1,677,743) | | | | | | | | | | | 2,599,782 | |
| | | | | | | | | | | | |
U.S. TREASURY SECURITIES (1.09%) | |
United States Treasury Bond, 0.875%, 11/15/30 | | | Aaa/AA+ | | | | 165 | | | | 152,445 | |
United States Treasury Bond, 1.25%, 05/15/50 | | | Aaa/AA+ | | | | 600 | | | | 451,266 | |
United States Treasury Bond, 1.375%, 08/15/50 | | | Aaa/AA+ | | | | 615 | | | | 477,970 | |
United States Treasury Bond, 1.625%, 11/15/50 | | | Aaa/AA+ | | | | 597 | | | | 495,593 | |
United States Treasury Bond, 1.875%, 02/15/51 | | | Aaa/AA+ | | | | 1,024 | | | | 904,695 | |
| | | | | | | | | | | | |
TOTAL U.S. TREASURY SECURITIES (Cost of $2,529,348) | | | | | | | | | | | 2,481,969 | |
| | | | | | | | | | | | |
GOVERNMENT BONDS (1.96%) | |
Egypt Government International Bond, Sr. Unsec. Notes, 7.625%, 05/29/32, 144A | | | B2/B | | | | 526 | | | | 537,940 | |
Egypt Government International Bond, Sr. Unsec. Notes, 5.875%, 02/16/31, 144A | | | B2/B | | | | 380 | | | | 355,718 | |
Ghana Government International Bond, Sr. Unsec. Notes, 8.625%, 04/07/34, 144A | | | B3/B- | | | | 655 | | | | 643,276 | |
Mexico Government International Bond, Sr. Unsec. Notes, 5.00%, 04/27/51(b) | | | Baa1/BBB | | | | 711 | | | | 767,297 | |
Morocco Government International Bond, Sr. Unsec. Notes, 3.00%, 12/15/32, 144A | | | Ba1/BBB- | | | | 764 | | | | 716,088 | |
Oman Government International Bond, Sr. Unsec. Notes, 7.00%, 01/25/51, 144A | | | Ba3/NA | | | | 350 | | | | 344,750 | |
Peruvian Government International Bond, Sr. Unsec. Notes, 2.783%, 01/23/31(b) | | | A3/BBB+ | | | | 548 | | | | 547,457 | |
Ukraine Government International Bond, Sr. Unsec. Notes, 7.253%, 03/15/33, 144A | | | NA/B | | | | 551 | | | | 548,135 | |
| | | | | | | | | | | | |
TOTAL GOVERNMENT BOND (Cost of $4,443,472) | | | | | | | | | | | 4,460,661 | |
| | | | | | | | | | | | |
| | | | | | Shares | | | | |
PREFERRED STOCK (0.92%) | |
CoBank ACB, Series F, 6.250%, (3M LIBOR +4.557%)(b),(c),(d) | | | NA/BBB+ | | | | 20,000 | | | | 2,105,000 | |
| | | | | | | | | | | | |
TOTAL PREFERRED STOCK (Cost of $2,085,000) | | | | | | | | | | | 2,105,000 | |
| | | | | | | | | | | | |
TOTAL INVESTMENTS (98.69%) | | | | | |
(Cost $204,810,297) | | | | | | | | | | | 224,660,930 | |
| | | | | | | | | | | | |
OTHER ASSETS AND LIABILITIES (1.31%) | | | | | | | | | | | 2,976,189 | |
| | | | | | | | | | | | |
NET ASSETS (100.00%) | | | | | | | | | | $ | 227,637,119 | |
| | | | | | | | | | | | |
At March 31, 2021, the Fund had the following open futures contracts:
| | | | | | | | | | | | | | | | | | | | |
| Long Futures Outstanding | | Expiration
Month | | | Number of
Contracts | | | Notional
Amount | | | Value | | | Unrealized
Appreciation
(Depreciation) | |
U.S. Treasury 5-Year Notes | | | 06/21 | | | | 62 | | | $ | 7,686,575 | | | $ | 7,650,703 | | | $ | (35,872 | ) |
U.S. Treasury 2-Year Notes | | | 06/21 | | | | 7 | | | | 1,546,664 | | | | 1,545,086 | | | | (1,578 | ) |
U.S. Treasury Long Bonds | | | 06/21 | | | | 94 | | | | 15,183,377 | | | | 14,531,813 | | | | (651,564 | ) |
| | | | | | | | | | | | | | | | | | | | |
| | | | | | | | | | | | | | | | | | | (689,014 | ) |
| | | | | | | | | | | | | | | | | | | | |
| Short Futures Outstanding | | | | | | | | | | | | | | | |
U.S. Treasury 10-Year Notes | | | 06/21 | | | | 89 | | | | (11,834,118 | ) | | | (11,653,438 | ) | | | 180,680 | |
U.S. Treasury 10-Year Ultra Bonds | | | 06/21 | | | | 169 | | | | (24,936,173 | ) | | | (24,283,188 | ) | | | 652,985 | |
U.S. Treasury Ultra Bonds | | | 06/21 | | | | 7 | | | | (1,312,218 | ) | | | (1,268,531 | ) | | | 43,687 | |
| | | | | | | | | | | | | | | | | | | | |
| | | | | | | | | | | | | | | | | | | 877,352 | |
| | | | | | | | | | | | | | | | | | | | |
Net unrealized appreciation on open futures contracts | | | | | | | | | | | | | | $ | 188,338 | |
| | | | | | | | | | | | | | | | | | | | |
The accompanying notes are an integral part of these financial statements.
14
SCHEDULE OF INVESTMENTS — continued
| (a) | Ratings for debt securities are unaudited. All ratings are as of March 31, 2021 and may have changed subsequently. |
| (b) | This security is callable. |
| (c) | Fixed to floating rate security. Fixed rate indicated is rate effective at March 31, 2021. Security will convert at a future date to a floating rate of reference rate and spread in the description above. |
| (d) | Security is perpetual. Date shown is next call date. |
| (e) | Variable rate security. Rate indicated is rate effective at March 31, 2021. |
| (f) | Multi-Step Coupon. Rate disclosed is as of March 31, 2021. |
| (g) | Denotes a step-up bond. The rate indicated is the current coupon as of March 31, 2021. |
| (h) | Principal amount less than $1,000. |
| 144A | Securities were purchased pursuant to Rule 144A under the Securities Act of 1933 and may not be resold subject to that rule except to qualified institutional buyers. At March 31, 2021, these securities amounted to $86,686,717 or 38.08% of net assets. |
Legend
Certs. - Certificates
CLO - Collateralized Loan Obligation
Co. Gty. - Company Guaranty
FHLMC - Federal Home Loan Mortgage Corp.
FNMA - Federal National Mortgage Association
GNSF - Government National Mortgage Association (Single Family)
GO - General Obligation
H15T5Y - US Treasury Yield Curve Rate T Note Constant Maturity 5 Year
Jr. - Junior
LIBOR - London Interbank Offered Rate
LLC - Limited Liability Company
LP - Limited Partnership
Ltd. - Limited
PLC - Public Limited Company
REIT - Real Estate Investment trust
Sec. - Secured
SOFRRATE - Secured Overnight Financing Rate
Sr. - Senior
Sub. - Subordinated
Unsec. - Unsecured
The accompanying notes are an integral part of these financial statements.
15
SCHEDULE OF INVESTMENTS — continued
Following is a description of the valuation techniques applied to the Fund’s major categories of assets measured at fair value on a recurring basis as of March 31, 2021.
| | | | | | | | | | | | | | | | |
| Assets: | | Total Market
Value at
3/31/21 | | | Level 1
Quoted
Price | | | Level 2
Significant
Observable
Inputs | | | Level 3
Significant
Unobservable
Inputs | |
CORPORATE DEBT SECURITIES | | $ | 194,874,636 | | | $ | — | | | $ | 194,874,636 | | | $ | — | |
ASSET BACKED SECURITIES | | | 15,024,170 | | | | — | | | | 15,024,170 | | | | — | |
COMMERCIAL MORTGAGE-BACKED SECURITIES | | | 2,792,441 | | | | — | | | | 2,792,441 | | | | — | |
RESIDENTIAL MORTGAGE-BACKED SECURITIES | | | 322,271 | | | | — | | | | 322,271 | | | | — | |
MUNICIPAL BONDS | | | 2,599,782 | | | | — | | | | 2,599,782 | | | | — | |
U.S. TREASURY SECURITIES | | | 2,481,969 | | | | — | | | | 2,481,969 | | | | — | |
GOVERNMENT BONDS | | | 4,460,661 | | | | — | | | | 4,460,661 | | | | — | |
PREFERRED STOCK | | | 2,105,000 | | | | 2,105,000 | | | | — | | | | — | |
FUTURES CONTRACTS | | | 877,352 | | | | 877,352 | | | | — | | | | — | |
TOTAL ASSETS | | $ | 225,538,282 | | | $ | 2,982,352 | | | $ | 222,555,930 | | | $ | — | |
| | | | |
| Liabilities: | | | | | | | | | | | | |
FUTURES CONTRACTS | | $ | 689,014 | | | $ | 689,014 | | | $ | — | | | $ | — | |
The accompanying notes are an integral part of these financial statements.
16
STATEMENT OF ASSETS AND LIABILITIES
March 31, 2021
| | | | |
Assets: | | | | |
Investment in securities, at value (amortized cost $204,810,297) (Note 1) | | $ | 224,660,930 | |
Cash | | | 1,430,681 | |
Interest receivable | | | 2,456,282 | |
Receivables for investments sold | | | 2,874,847 | |
Receivable from broker—variation margin on open futures contracts | | | 877,352 | |
Dividend receivable | | | 31,250 | |
Deposits with brokers for open futures contracts | | | 321,468 | |
Prepaid expenses | | | 36,491 | |
| | | | |
TOTAL ASSETS | | | 232,689,301 | |
| | | | |
Liabilities: | | | | |
Securities purchased | | | 4,185,602 | |
Payable to broker variation on open futures contracts | | | 689,014 | |
Payable to the Adviser | | | 85,777 | |
Payable to administration and accounting | | | 16,969 | |
Payable to custodian | | | 9,655 | |
Payable to transfer agency | | | 4,496 | |
Accrued expenses payable | | | 60,669 | |
| | | | |
TOTAL LIABILITIES | | | 5,052,182 | |
| | | | |
Net assets: (equivalent to $21.25 per share based on 10,710,035 shares of capital stock outstanding) | | $ | 227,637,119 | |
| | | | |
NET ASSETS consisted of: | | | | |
Par value | | $ | 107,100 | |
Capital paid-in | | | 206,576,087 | |
Distributable earnings | | | 20,953,932 | |
| | | | |
| | $ | 227,637,119 | |
| | | | |
The accompanying notes are an integral part of these financial statements.
17
STATEMENT OF OPERATIONS
For the year ended March 31, 2021
| | | | | | | | |
Investment Income: | |
Interest | | | $ | 9,917,871 | |
Dividends | | | | 125,000 | |
| | | | | | | | |
Total Investment Income | | | | 10,042,871 | |
| | | | | | | | |
Expenses: | |
Investment advisory fees (Note 4) | | $ | 1,025,509 | | | | | |
Administration fees | | | 194,648 | | | | | |
Trustees’ fees (Note 4) | | | 119,500 | | | | | |
Legal fees and expenses | | | 116,925 | | | | | |
Proxy fee | | | 99,066 | | | | | |
Reports to shareholders | | | 54,100 | | | | | |
Custodian fees | | | 41,925 | | | | | |
Transfer agent fees | | | 34,247 | | | | | |
Audit fees | | | 30,500 | | | | | |
Insurance | | | 28,828 | | | | | |
NYSE fee | | | 22,933 | | | | | |
ICI fees | | | 18,042 | | | | | |
Miscellaneous | | | 84,819 | | | | | |
| | | | | | | | |
Total Expenses | | | | 1,871,042 | |
| | | | | |
Expense reimbursement from the Adviser (Note 4) | | | | (49,533 | ) |
| | | | | | | | |
Net Expenses | | | | 1,821,509 | |
| | | | | |
Net Investment Income | | | | 8,221,362 | |
| | | | | | | | |
Realized and unrealized gain (loss) from: | |
Net realized gain (loss) from: | | | | | | | | |
Investment securities | | | | | | | 5,536,752 | |
Futures contracts | | | | | | | (146,294 | ) |
| | | | | | | | |
Net Realized Gain | | | | | | | 5,390,458 | |
| | | | | | | | |
Change in net unrealized appreciation (depreciation) of: | | | | | | | | |
Investment securities | | | | | | | 17,175,044 | |
Futures contracts | | | | | | | 57,093 | |
| | | | | | | | |
Change in Net Unrealized Appreciation | | | | | | | 17,232,137 | |
| | | | | | | | |
Net gain on investments and futures contracts | | | | | | | 22,622,595 | |
| | | | | | | | |
Net increase in net assets resulting from operations | | | | | | $ | 30,843,957 | |
| | | | | | | | |
The accompanying notes are an integral part of these financial statements.
18
STATEMENTS OF CHANGES IN NET ASSETS
| | | | | | | | |
| | | Year ended
March 31, 2021 | | | Year ended
March 31, 2020 | |
Increase (decrease) in net assets: | | | | | | | | |
Operations: | | | | | | | | |
Net investment income | | $ | 8,221,362 | | | $ | 8,518,770 | |
Net realized gain | | | 5,390,458 | | | | 4,564,465 | |
Change in unrealized appreciation (depreciation) | | | 17,232,137 | | | | (9,998,855 | ) |
| | | | | | | | |
Net increase in net assets resulting from operations | | | 30,843,957 | | | | 3,084,380 | |
| | | | | | | | |
Distributions: | | | | | | | | |
From distributed earnings | | | (13,838,436 | ) | | | (12,808,131 | ) |
| | | | | | | | |
Total Distributions | | | (13,838,436 | ) | | | (12,808,131 | ) |
| | | | | | | | |
Increase (decrease) in net assets | | | 17,005,521 | | | | (9,723,751 | ) |
Net Assets: | | | | | | | | |
Beginning of year | | | 210,631,598 | | | | 220,355,349 | |
| | | | | | | | |
End of year | | $ | 227,637,119 | | | $ | 210,631,598 | |
| | | | | | | | |
The accompanying notes are an integral part of these financial statements.
19
FINANCIAL HIGHLIGHTS
The table below sets forth financial data for a share of capital stock outstanding throughout each period presented.
| | | | | | | | | | | | | | | | | | | | |
| | | Year ended March 31, | |
| | | 2021 | | | 2020 | | | 2019 | | | 2018 | | | 2017 | |
Per Share Operating Performance | | | | | | | | | | | | | | | | | | | | |
Net asset value, beginning of year | | $ | 19.67 | | | $ | 20.57 | | | $ | 20.55 | | | $ | 20.75 | | | $ | 20.20 | |
| | | | | | | | | | | | | | | | | | | | |
Net investment income | | | 0.77 | | | | 0.79 | | | | 0.85 | | | | 0.87 | | | | 0.88 | |
Net gain (loss) on investments and futures contracts | | | 2.10 | | | | (0.50 | ) | | | (0.03 | ) | | | (0.03 | ) | | | 0.57 | |
| | | | | | | | | | | | | | | | | | | | |
Total from investment operations | | | 2.87 | | | | 0.29 | | | | 0.82 | | | | 0.84 | | | | 1.45 | |
| | | | | | | | | | | | | | | | | | | | |
| | | | | |
Less distributions: | | | | | | | | | | | | | | | | | | | | |
Dividends from net investment income | | | (0.80 | ) | | | (0.97 | ) | | | (0.67 | ) | | | (0.80 | ) | | | (0.90 | ) |
Distributions from net realized gains | | | (0.49 | ) | | | (0.22 | ) | | | (0.13 | ) | | | (0.24 | ) | | | — | |
| | | | | | | | | | | | | | | | | | | | |
Total distributions | | | (1.29 | ) | | | (1.19 | ) | | | (0.80 | ) | | | (1.04 | ) | | | (0.90 | ) |
| | | | | | | | | | | | | | | | | | | | |
Net asset value, end of year | | $ | 21.25 | | | $ | 19.67 | | | $ | 20.57 | | | $ | 20.55 | | | $ | 20.75 | �� |
| | | | | | | | | | | | | | | | | | | | |
Per share market price, end of year | | $ | 20.45 | | | $ | 19.74 | | | $ | 19.22 | | | $ | 19.37 | | | $ | 19.16 | |
| | | | | | | | | | | | | | | | | | | | |
Total Investment Return(1) | | | | | | | | | | | | | | | | | | | | |
Based on net asset value | | | 14.71 | % | | | 1.51 | % | | | 4.52 | % | | | 4.26 | % | | | 7.48 | % |
Based on market value | | | 10.00 | % | | | 9.03 | % | | | 3.60 | % | | | 6.43 | % | | | 4.75 | % |
Ratios/Supplemental Data | | | | | | | | | | | | | | | | | | | | |
Net assets, end of year (in 000’s) | | $ | 227,637 | | | $ | 210,632 | | | $ | 220,355 | | | $ | 220,141 | | | $ | 222,258 | |
Ratio of expenses to average net assets (gross of waivers/reimbursements) | | | 0.81 | % | | | 0.76 | % | | | 0.80 | % | | | 0.75 | % | | | 0.75 | % |
Ratio of expenses to average net assets (net of waivers/reimbursements) | | | 0.79 | % | | | 0.76 | % | | | 0.77 | % | | | 0.74 | % | | | 0.75 | % |
Ratio of net investment income to average net assets | | | 3.56 | % | | | 3.76 | % | | | 4.24 | % | | | 4.15 | % | | | 4.24 | % |
Portfolio turnover rate | | | 88.81 | % | | | 59.99 | % | | | 63.00 | % | | | 55.62 | % | | | 44.32 | % |
Number of shares outstanding at the end of the year (in 000’s) | | | 10,710 | | | | 10,710 | | | | 10,710 | | | | 10,710 | | | | 10,710 | |
| (1) | Total investment return is calculated assuming a purchase of common shares at the market price on the first day and a sale at the market price on the last day of the period reported. Dividends and distributions, if any, are assumed for purposes of this calculation to be reinvested at prices obtained under the Fund’s dividend reinvestment plan. Total investment return does not reflect brokerage commissions. The total investment return, if for less than a full year, is not annualized. Past performance is not a guarantee of future results. |
The accompanying notes are an integral part of these financial statements.
20
NOTES TO FINANCIAL STATEMENTS
Note 1 – Significant Accounting Policies – The Insight Select Income Fund (the “Fund”), a Delaware statutory trust, is registered under the Investment Company Act of 1940, as amended (“1940 Act”), as a diversified closed-end, management investment company. The Fund’s investment objective is to seek a high rate of return, primarily from interest income and trading activity, from a portfolio principally consisting of debt securities. The Fund follows the accounting and reporting guidance under Financial Accounting Standards Board Accounting Standards Codification Topic 946, “Financial Services – Investment Companies”. The following is a summary of significant accounting policies consistently followed by the Fund in preparation of its financial statements. The policies are in conformity with generally accepted accounting principles within the United States of America (“GAAP”).
| A. | Security Valuation – In valuing the Fund’s net assets, all securities for which representative market quotations are available will be valued at the last quoted sales price on the security’s principal exchange on the day of valuation. If there are no sales of the relevant security on such day, the security will be valued at the bid price at the time of computation. For securities traded in the over-the-counter market, including listed debt and preferred securities, whose primary market is believed to be over-the-counter, the Fund uses recognized industry pricing services – approved by the Board of Trustees (“Board”) and unaffiliated with Insight North America LLC (“INA” or the “Adviser”) – and uses broker quotes provided by market makers of securities not valued by these and other recognized pricing sources. |
In the event that market quotations are not readily available, or when such quotations are deemed not to reflect current market value, the securities will be valued at their respective fair value as determined in good faith by the Adviser pursuant to certain procedures and reporting requirements established by the Board. The Adviser considers all relevant facts that are reasonably available when determining the fair value of a security, including but not limited to the last sale price or initial purchase price (if a when issued security) and subsequently adjusting the value based on changes in company specific fundamentals, changes in an appropriate securities index, or changes in the value of similar securities which may be further adjusted for any discounts related to security-specific resale restrictions. When possible, observable market inputs such as unadjusted quoted prices of similar securities, observable interest rates, currency rates and yield curves are utilized. At March 31, 2021, there were no securities valued using fair value procedures.
Fair Value Measurements – The Fund has adopted authoritative fair value accounting standards which establish a definition of fair value and set out a hierarchy for measuring fair value. These standards require additional disclosures about the various inputs and valuation techniques used to develop the measurements of fair value, a discussion in changes in valuation techniques and related inputs during the period and expanded disclosure of valuation levels for major security types. These inputs are summarized in the three broad levels listed below:
| | |
• Level 1 – | | Unadjusted quoted prices in active markets for identical assets or liabilities that the Fund has the ability to access. |
| |
• Level 2 – | | Observable inputs other than quoted prices included in level 1 that are observable for the asset or liability, either directly or indirectly. These inputs may include quoted prices for the identical instrument on an inactive market, prices for similar instruments, interest rates, prepayment speeds, credit risk, yield curves, default rates and similar data. |
| |
• Level 3 – | | Unobservable inputs for the asset or liability, to the extent relevant observable inputs are not available, representing the Fund’s own assumptions about the assumptions a market participant would use in valuing the asset or liability, and would be based on the best information available. |
21
NOTES TO FINANCIAL STATEMENTS — continued
At the end of each calendar quarter, management evaluates the Level 1, 2 and 3 assets and liabilities for changes in liquidity, including but not limited to: whether a broker is willing to execute at the quoted price, the depth and consistency of prices from third party services, and the existence of contemporaneous, observable trades in the market. Additionally, management evaluates Level 1 and 2 assets and liabilities on a quarterly basis for changes in listings or delistings on national exchanges. Due to the inherent uncertainty of determining the fair value of investments that do not have a readily available market value, the fair value of the Fund’s investments may fluctuate from period to period. Additionally, the fair value of investments may differ significantly from the values that would have been used had a ready market existed for such investments and may differ materially from the values the Fund may ultimately realize. Further, such investments may be subject to legal and other restrictions on resale or otherwise less liquid than publicly traded securities.
Level 3 investments are categorized as Level 3 with values derived utilizing prices from prior transactions or third party pricing information without adjustment (broker quotes, pricing services and net asset values). A significant change in third party pricing information could result in a significantly lower or higher value in such Level 3 investments. As of March 31, 2021, the Fund did not hold any Level 3 securities.
When-Issued Securities – The Fund may enter into commitments to purchase securities on a forward or when-issued basis. When-issued securities are securities purchased for delivery beyond the normal settlement date at a stated price and yield. In the Fund’s case, these securities are subject to settlement within 45 days of the purchase date. The interest rate realized on these securities is fixed as of the purchase date. The Fund does not pay for such securities prior to the settlement date and no interest accrues to the Fund before settlement. These securities are subject to market fluctuation due to changes in market interest rates. The Fund will enter into these commitments with the intent of buying the security but may dispose of such security prior to settlement. At the time the commitment is entered into, the Fund will establish and maintain a segregated account in an amount sufficient to cover the obligation under the when-issued contract. At the time the Fund makes the commitment to purchase securities on a when-issued basis, it will record the transaction and thereafter reflect the value of such security purchased in determining its net asset value (“NAV”). At the time of delivery of the security, its value may be more or less than the fixed purchase price.
Futures Contracts – The Fund uses futures contracts generally to gain exposure to, or hedge against, changes in interest rates or gain exposure to, or hedge against, changes in certain asset classes. A futures contract represents a commitment for the future purchase or sale of an asset at a specified price on a specified date.
Upon entering into a futures contract, the Fund is required to deposit cash or cash equivalents with a broker in an amount equal to a certain percentage of the contract amount. This is known as the ‘‘initial margin’’ and subsequent payments (‘‘variation margin’’) are made or received by the Fund each day, depending on the daily fluctuation in the value of the contract. For certain futures, including foreign denominated futures, variation margin is not settled daily, but is recorded as a net variation margin payable or receivable. The daily changes in contract value are recorded as unrealized gains or losses in the Statement of Operations and the Fund recognizes a realized gain or loss when the contract is closed.
Futures contracts involve, to varying degrees, risk of loss in excess of the amounts reflected in the financial statements. In addition, there is the risk that the Fund may not be able to enter into a closing transaction because of an illiquid secondary market.
22
NOTES TO FINANCIAL STATEMENTS — continued
The following table sets forth the fair value and the location of the Fund’s derivative financial instruments within the Statement of Assets and Liabilities by primary risk exposure as of March 31, 2021:
Fair Value of Derivative Investments as of March 31, 2021:
| | | | |
Derivatives not accounted for as hedging instruments under ASC 815 | | Assets | | Liabilities |
Futures — Interest Rate Contracts | | $877,352 | | $(689,014) |
The following table sets forth the effect of the Fund’s derivative financial instruments by primary risk exposure on the Statements of Operations for the year ended March 31, 2021:
The Effect of Derivative Investments on the Statements of Operations for the year ended March 31, 2021:
| | | | |
Derivatives not accounted for as hedging instruments under ASC 815 | | Realized Gain (Loss) on Derivatives | | Change in Net Unrealized Appreciation (Depreciation) of Derivatives |
Futures — Interest Rate Contracts | | $(146,294) | | $57,093 |
The average notional value of long and short futures contracts held by the Fund throughout the period was $13,179,211 and $17,896,642, respectively. This is based on amounts held as of each quarter-end throughout the fiscal year.
| B. | Determination of Gains or Losses on Sale of Securities – Gains or losses on the sale of securities are calculated for financial reporting purposes and for federal tax purposes using the identified cost basis. The identified cost basis for financial reporting purposes differs from that used for federal tax purposes in that the amortized cost of the securities sold is used for financial reporting purposes and the original cost of the securities sold is used for federal tax purposes, except for those instances where tax regulations require the use of amortized cost. |
| C. | Federal Income Taxes – It is the Fund’s policy to continue to comply with the requirements of the Internal Revenue Code applicable to regulated investment companies and to distribute all of its taxable income to its shareholders. Therefore, no federal income tax provision is required. |
| | Management has analyzed the Fund’s tax positions taken on federal income tax returns for all open tax years (tax years March 31, 2018-2020) or expected to be taken on the Fund’s 2021 tax return, and has concluded that no provision for federal income tax is required in the Fund’s financial statements. The Fund’s federal and state income and federal excise tax returns for tax years for which the applicable statutes of limitations have not expired are subject to examination by the Internal Revenue Service and state departments of revenue. |
| D. | Other – Security transactions are accounted for on the trade date. Interest income is accrued daily. Premiums and discounts are amortized using the interest method. Paydown gains and losses on mortgage-backed and asset-backed securities are presented as an adjustment to interest income. Dividend income and distributions to shareholders are recorded on the ex-dividend date. |
| E. | Distributions to Shareholders and Book/Tax Differences – Distributions of net investment income will be made quarterly. Distributions of any net realized capital gains will be made annually. Income and capital gain distributions are determined in accordance with federal income tax regulations, which may |
23
NOTES TO FINANCIAL STATEMENTS — continued
| | differ from GAAP. These differences are primarily due to differing treatments for amortization of market premium and accretion of market discount. |
| | Distributions during the fiscal years ended March 31, 2021 and 2020 were characterized as follows for tax purposes: |
| | | | | | | | |
| | | Ordinary Income | | Return of Capital | | Capital Gain | | Total Distribution |
FY 2021 | | $ 10,586,870 | | $ — | | $ 3,251,566 | | $ 13,838,436 |
FY 2020 | | $ 11,814,240 | | $ — | | $ 993,891 | | $ 12,808,131 |
| | At March 31, 2021, the components of distributable earnings on a tax basis were as follows: |
| | | | | | | | |
Total | | Accumulated
Ordinary Income | | Undistributed
Long-Term
Capital Gains | | Late Year Losses
Deferred | | Net Unrealized
Appreciation |
$20,953,932 | | $1,575,585 | | $1,345,392 | | $— | | $18,032,955 |
| | | | | | | | | |
| | Realized net capital gains can be offset by capital loss carryforwards from prior years. As of March 31, 2021, there were no capital loss carryforwards. |
| | Under current laws, certain capital losses realized after October 31 and certain ordinary losses realized after December 31 may be deferred and treated as occurring on the first day of the following fiscal year. For the year ended March 31, 2021, no losses were deferred. |
| | At March 31, 2021, the following table shows for federal tax purposes the aggregate cost of investments, the net unrealized appreciation of those investments, the aggregate gross unrealized appreciation of all securities with an excess of market value over tax cost and the aggregate gross unrealized depreciation of all securities with an excess of tax cost over market value: |
| | | | | | | | |
| | | Cost | | Gross
Unrealized
Appreciation | | Gross
Unrealized
Depreciation | | Net Unrealized
Appreciation
(Depreciation) |
Securities | | $206,627,975 | | $20,508,140 | | $(2,475,185) | | $18,032,955 |
| | The difference between book basis and tax-basis unrealized appreciation is attributable primarily to the differing treatments for wash sales, amortization of market premium and accretion of market discount. |
| F. | Use of Estimates in the Preparation of Financial Statements – The preparation of financial statements in conformity with GAAP requires management to make estimates and assumptions that may affect the reported amounts of assets and liabilities at the date of the financial statements and the reported amounts of revenue and expenses during the reporting period. Actual results could differ from those estimates. |
Note 2 – Portfolio Transactions – The following is a summary of the security transactions, other than short-term investments, for the year ended March 31, 2021:
| | | | | | | | |
| | | Cost of
Purchases | | | Proceeds from Sales
or Maturities | |
U.S. Government Securities | | $ | 124,087,883 | | | $ | 130,318,127 | |
Other Investment Securities | | $ | 77,102,731 | | | $ | 76,628,385 | |
24
NOTES TO FINANCIAL STATEMENTS — continued
Note 3 – Capital Stock – At March 31, 2021, there were an unlimited number of shares of beneficial interest ($0.01 par value) authorized, with 10,710,035 shares issued and outstanding.
Note 4 – Investment Advisory Contract, Accounting and Administration, Custodian, Transfer Agent and Trustee Compensation – INA serves as investment adviser to the Fund. The Adviser is entitled to a monthly investment advisory fee at the annualized rate of 0.50% of the first $100,000,000 of the Fund’s average daily Managed Assets and 0.40% of the Fund’s average daily Managed Assets in excess of $100,000,000. The “Managed Assets” of the Fund shall be defined as the total assets of the Fund, less its liabilities other than Fund liabilities incurred for investment purposes.
BNY Mellon Investment Servicing (US) Inc. (“BNY Mellon”), an indirect wholly-owned subsidiary of The Bank of New York Mellon Corporation, provides accounting and administrative services to the Fund. The Bank of New York Mellon is the Fund’s custodian responsible for the custody of Fund’s assets. Computershare Investor Services (“Computershare”) is the contractual Transfer Agent to the Fund.
The Adviser is a wholly owned subsidiary of The Bank of New York Mellon Corporation. The Adviser works closely with and is administered by Insight Investment Management (Global) Limited (“Insight”), another of The Bank of New York Mellon Corporation’s investment management subsidiaries. The Adviser is subject to The Bank of New York Mellon Corporation’s Code of Conduct and various policies and procedures designed to address the potential for conflicts of interest that may arise in connection with the Adviser’s status as an affiliated person of The Bank of New York Mellon Corporation and its subsidiaries.
In connection with the Special Meeting of Shareholders held on November 5, 2020, the costs of solicitation of proxies and expenses incurred in the preparation of proxy materials of $99,066, are being borne by the Fund and the Adviser equally.
The Trustees of the Fund receive an annual retainer, meeting fees and out of pocket expenses for meetings attended. The aggregate remuneration paid to the Trustees by the Fund during the year ended March 31, 2021 was $123,500, $119,500 which was disclosed as trustee expenses and also $4,000 for the special shareholder meeting which is included in the proxy expenses line. All officers of the Fund are also officers and/or employees of the investment adviser. None of the Fund’s officers on the Statement of Operations receives compensation from the Fund.
Note 5 – Dividend and Distribution Reinvestment – In accordance with the terms of the Amended and Restated Automatic Dividend Investment Plan (the “Plan”), for shareholders who so elect, dividends and distributions are made in the form of previously unissued Fund shares at the net asset value if on the Friday preceding the payment date (the “Valuation Date”) the closing New York Stock Exchange price per share, plus the brokerage commissions applicable to one such share equals or exceeds the net asset value per share. However, if the net asset value is less than 95% of the market price on the Valuation Date, the shares issued will be valued at 95% of the market price. If the net asset value per share exceeds market price plus commissions, the dividend or distribution proceeds are used to purchase Fund shares on the open market for participants in the Plan. During the year ended March 31, 2021 the Fund did not issue any shares under this Plan.
Note 6 – Principal Risks – An investment in the Fund is not a bank deposit. It is not insured or guaranteed by the Federal Deposit Insurance Corporation (FDIC) or any other government agency. It is not a complete investment program. The fund’s share price fluctuates, sometimes dramatically, which means you could lose money.
25
NOTES TO FINANCIAL STATEMENTS — continued
Fixed-income market risk. The market value of a fixed-income security may decline due to general market conditions that are not specifically related to a particular company, such as real or perceived adverse economic conditions, changes in the outlook for corporate earnings, changes in interest or currency rates or adverse investor sentiment generally. The fixed-income securities market can be susceptible to increases in volatility and decreases in liquidity. Liquidity can decline unpredictably in response to overall economic conditions or credit tightening. Increases in volatility and decreases in liquidity may be caused by a rise in interest rates (or the expectation of a rise in interest rates). Federal Reserve policy in response to market conditions, including with respect to interest rates, may adversely affect the value, volatility and liquidity of dividend and interest paying securities. Policy and legislative changes worldwide are affecting many aspects of financial regulation. The impact of these changes on the markets and the practical implications for market participants may not be fully known for some time.
Interest rate risk. Prices of bonds and other fixed rate fixed-income securities tend to move inversely with changes in interest rates. Typically, a rise in rates will adversely affect fixed-income securities and, accordingly, will cause the value of the Fund’s investments in these securities to decline. During periods of very low interest rates, which occur from time to time due to market forces or actions of governments and/or their central banks, including the Board of Governors of the Federal Reserve System in the U.S., the Fund may be subject to a greater risk of principal decline from rising interest rates. When interest rates fall, the Fund’s investments in new securities may be at lower yields and may reduce the Fund’s income. The magnitude of these fluctuations in the market price of fixed-income securities is generally greater for securities with longer effective maturities and durations because such instruments do not mature, reset interest rates or become callable for longer periods of time. The change in the value of a fixed-income security or portfolio can be approximated by multiplying its duration by a change in interest rates. For example, the market price of a fixed-income security with a duration of three years would be expected to decline 3% if interest rates rose 1%. Conversely, the market price of the same security would be expected to increase 3% if interest rates fell 1%.
Credit risk. Failure of an issuer of a security to make timely interest or principal payments when due, or a decline or perception of a decline in the credit quality of the security, can cause the security’s price to fall. The lower a security’s credit rating, the greater the chance that the issuer of the security will default or fail to meet its payment obligations.
Coronavirus and Pandemic Risk. An outbreak of respiratory disease caused by a novel coronavirus, first detected in China in December 2019 and its subsequent spread internationally, has resulted in border restrictions, enhanced health screenings, healthcare service preparation and delivery, quarantines, cancellations, disruptions to supply chains, workflow operations and customer activity, as well as general concern and uncertainty. The impact of this coronavirus may last for an extended period of time and result in a substantial economic downturn. The impact of this outbreak, and other epidemics and pandemics that may arise in the future, could negatively affect the worldwide economy, as well as the economies of individual countries, individual companies (including Fund service providers) and the market in general in significant and unforeseen ways. Any such impact could adversely affect the Fund’s performance.
Derivatives Risk. The Fund may utilize a variety of derivative instruments. Generally, derivatives are financial contracts whose values depend on, or are derived from, the value of an underlying asset, reference rate or index. The underlying security, measure or other instrument on which a derivative is based, or the derivative itself, may not perform as expected. In addition, derivatives are subject to a number of risks, such as liquidity risk, interest rate risk, credit risk and management risk. Derivatives are also subject to counterparty risk, which is the risk that the other party in the transaction will not fulfill its contractual obligation. Changes in the credit quality of the companies that
26
NOTES TO FINANCIAL STATEMENTS — continued
serve as the Fund’s counterparties with respect to its derivative transactions will affect the value of those instruments. If the Fund invests in a derivative instrument, it could lose more than the principal amount invested.
ETF and other investment company risk. To the extent the Fund invests in pooled investment vehicles, such as ETFs and other investment companies, the Fund will be affected by the investment policies, practices and performance of such entities in direct proportion to the amount of assets the Fund has invested therein. The risks of investing in other investment companies, including ETFs, typically reflect the risks associated with the types of instruments in which the investment companies invest. When the Fund invests in an ETF or other investment company, shareholders of the Fund will bear indirectly their proportionate share of the expenses of the ETF or other investment company (including management fees) in addition to the expenses of the Fund.
Foreign investment risk. To the extent the Fund invests in foreign securities, the Fund’s performance will be influenced by political, social and economic factors affecting investments in foreign issuers. Special risks associated with investments in foreign issuers include exposure to currency fluctuations, less liquidity, less developed or less efficient trading markets, lack of comprehensive company information, political and economic instability and differing auditing and legal standards. Investments denominated in foreign currencies are subject to the risk that such currencies will decline in value relative to the U.S. dollar and affect the value of these investments held by the Fund.
Government securities risk. Not all obligations of the U.S. government, its agencies and instrumentalities are backed by the full faith and credit of the U.S. Treasury. Some obligations are backed only by the credit of the issuing agency or instrumentality, and in some cases there may be some risk of default by the issuer. Any guarantee by the U.S. government or its agencies or instrumentalities of a security held by the Fund does not apply to the market value of such security or to shares of the Fund itself.
High yield securities risk. High yield (“junk”) securities involve greater credit risk, including the risk of default, than investment grade securities, and are considered predominantly speculative with respect to the issuer’s ability to make principal and interest payments. The prices of high yield securities can fall in response to bad news about the issuer or its industry, or the economy in general, to a greater extent than those of higher rated securities.
Issuer risk. A security’s market value may decline for a number of reasons which directly relate to the issuer, such as management performance, financial leverage and reduced demand for the issuer’s products or services, or factors that affect the issuer’s industry, such as labor shortages or increased production costs and competitive conditions within an industry.
Leverage Risk. The use of leverage (borrowing money to purchase properties or securities) will cause the Fund to incur additional expenses and significantly magnify losses in the event of underperformance of the assets purchased with borrowed money. In addition, a lender may terminate or refuse to renew any credit facility. If the Fund is unable to access additional credit, it may be forced to sell investments at inopportune times, which may further depress the returns of the Fund.
Liquidity risk. When there is little or no active trading market for specific types of securities, it can become more difficult to sell the securities in a timely manner at or near their perceived value. In such a market, the value of such securities and the Fund’s share price may fall dramatically. Investments that are illiquid or that trade in lower volumes may be more difficult to value. The market for below investment grade securities may be less liquid and therefore these securities may be harder to value or sell at an acceptable price, especially during times of market
27
NOTES TO FINANCIAL STATEMENTS — continued
volatility or decline. Investments in foreign securities tend to have greater exposure to liquidity risk than domestic securities.
Management risk. The investment process used by the Fund’s portfolio managers could fail to achieve the Fund’s investment goal and cause your fund investment to lose value.
Market risk. The value of the securities in which the Fund invests may be affected by political, regulatory, economic and social developments, and developments that impact specific economic sectors, industries or segments of the market. In addition, turbulence in financial markets and reduced liquidity in equity, credit and/or fixed income markets may negatively affect many issuers, which could adversely affect the Fund. Global economies and financial markets are becoming increasingly interconnected, and conditions and events in one country, region or financial market may adversely impact issuers in a different country, region or financial market. These risks may be magnified if certain events or developments adversely interrupt the global supply chain; in these and other circumstances, such risks might affect companies world-wide. Recent examples include pandemic risks related to COVID-19 and aggressive measures taken world-wide in response by governments, including closing borders, restricting international and domestic travel, and the imposition of prolonged quarantines of large populations, and by businesses, including changes to operations and reducing staff.
Risk of Market Price Discount From Net Asset Value. Shares of closed-end funds frequently trade at a market price that is below their NAV. This is commonly referred to as “trading at a discount.” This characteristic of shares of closed-end funds is a risk separate and distinct from the risk that the Fund’s NAV may decrease. The risk of purchasing shares of a closed-end fund that might trade at a discount or unsustainable premium is more pronounced for investors who wish to sell their shares in a relatively short period of time after purchasing them because, for those investors, realization of a gain or loss on their investments is likely to be more dependent upon the existence of a premium or discount than upon portfolio performance.
Valuation Risk. When market quotations are not readily available or are deemed to be unreliable, the Fund values its investments at fair value as determined in good faith pursuant to policies and procedures approved by the Board of Trustees. Fair value pricing may require subjective determinations about the value of a security or other asset. As a result, there can be no assurance that fair value pricing will result in adjustments to the prices of securities or other assets, or that fair value pricing will reflect actual market value, and it is possible that the fair value determined for a security or other asset will be materially different from quoted or published prices, from the prices used by others for the same security or other asset and/or from the value that actually could be or is realized upon the sale of that security or other asset.
Note 7 – Subsequent Event – Management has evaluated the impact of all subsequent events on the Fund through the date the financial statements were issued, and has determined that there were no additional subsequent events requiring recognition or disclosure in the financial statements.
28
SHAREHOLDER INFORMATION (Unaudited)
The following information in this annual report is a summary of certain information about the Fund and changes that occurred during the prior fiscal year. (the “prior disclosure date”). This information may not reflect all of the changes that have occurred since you purchased the Fund.
Summary of information regarding the Fund (unaudited)
INVESTMENT OBJECTIVE AND POLICIES
Investment Objective
There have been no changes in the Fund’s investment objective since the prior disclosure date.
The Fund’s investment objective is to seek a high rate of return, primarily from interest income and trading activity, from a portfolio principally consisting of debt securities. The Fund’s investment objective may be changed by the Board of Trustees of the Fund without shareholder approval. There can be no assurance that the Fund will achieve its objective.
Principal Investment Strategies and Policies
There have been no material changes in the Fund’s Principal Investment Strategies and Policies since the prior disclosure that have not been approved by shareholders.
Under normal market conditions, the Fund invests at least 80% of its Managed Assets (defined below) in debt securities (the “80% Policy”). Seventy-five percent of the Fund’s Managed Assets will be invested in following types of higher quality, non-convertible debt securities (including bonds and debentures):
| | • | | debt securities (with or without attached warrants) rated, at the time of purchase, within the four highest grades as determined by a nationally recognized statistical ratings organization, such as Moody’s (i.e., Aaa, Aa, A or Baa) or Standard & Poor’s (i.e., AAA, AA, A or BBB) (collectively, the “NRSRO Rated Securities”); |
| | • | | short-term debt securities (“debentures”) which are not NRSRO Rated Securities, but which are obligations of issuers having, at the time of purchase, any NRSRO Rated Securities and which debentures are considered by the Adviser to have an investment quality comparable to NRSRO Rated Securities; |
| | • | | obligations of the United States Government, its agencies or instrumentalities; and |
| | • | | bank debt securities (with or without attached warrants) which, although not NRSRO Rated Securities, are considered by the Adviser to have an investment quality comparable NRSRO Rated Securities. |
“Managed Assets” means net assets, plus the proceeds from borrowings and the issuance of senior securities for investment purposes. The ratings criteria described above apply at the time of acquisition of the security. In the event that a security held in this portion of the Fund’s portfolio is downgraded to below Baa or BBB, the Fund will no longer include such security in this portion of the Fund’s portfolio. The Fund does not expect that the value of warrants in this part of its portfolio will often be significant.
The balance of the Fund’s investments is expected to be principally in debt securities that do not meet the standards described above and in preferred stocks which may be convertible or may be accompanied by warrants or other
29
SHAREHOLDER INFORMATION (Unaudited) — continued
equity securities. Any securities in this part of the portfolio may be of lower quality and may not be rated by any NRSRO. Fixed-income securities rated below Baa/BBB are considered below investment grade (“high yield” or “junk” bonds). All warrants remaining after sale of the securities to which they were attached and common stocks acquired on conversion or exercise of warrants will be included in this part of the Fund’s portfolio. Any such warrants or common stocks may be held until a long-term holding period has been established for tax purposes, after which they ordinarily will be sold.
From time to time, the Fund may also purchase futures contracts, including interest rate futures, (“futures contracts”) and related options thereon, to hedge the Funds interest rate risk and/or duration risk. A futures contract sale creates an obligation by the Fund, as a seller, to deliver the specific type of instrument called for in the contract at a specified future time for a specified price. A futures contract purchase creates an obligation by the Fund, as purchaser, to take delivery of the specific type of financial instrument at a specified future time at a specified price.
It is anticipated that the Fund will establish a credit facility secured by the Fund’s assets from which the Fund will be able to borrow money to be invested pursuant to the Fund’s investment strategy. The Fund is permitted to borrow up to the limit permitted under the 1940 Act.
The Fund focuses on a relative value strategy. The Fund seeks to identify opportunities to purchase securities with high risk-adjusted yields across various fixed income sectors in order to maintain and increase the Fund’s income, and therefore the Fund’s dividend payment. In constructing the Fund’s portfolio, the Adviser relies primarily on proprietary, internally-generated credit research. This credit research focuses on both industry/sector analysis and detailed individual security selection. The fund’s Adviser seeks to identify investment opportunities for the Fund based on its evaluation of the relative value of securities. The Adviser analyzes individual issuer credit risk based on factors such as management depth and experience, competitive advantage, market and product position and overall financial strength. The Adviser may supplement its internal research with external, third-party credit research and related credit tools.
The Fund’s average duration is expected to be near the duration of the Barclays Capital U.S. Corporate Investment Grade Credit Index which is the Fund’s benchmark. On March 31, 2021, the Fund’s duration was 7.63 years and the duration of the Fund’s benchmark was 8.23 years. The Adviser expects that the Fund’s duration will remain between 4 and 8 years; however, the Fund’s duration may be lengthened or shortened depending on market conditions. Duration is a measure of the expected life of a debt security that is used to determine the sensitivity of the security’s price to changes in interest rates. Generally, the longer the Fund’s duration, the more sensitive the Fund will be to changes in interest rates. For example, the price of a fixed income fund with a duration of five years would be expected to fall approximately 5% if interest rates rose 1%.
The type of fixed-income securities in which the Fund may invest include: (i) securities issued or guaranteed by the U.S. government, its agencies or government sponsored enterprises (U.S. government securities); (ii) corporate debt securities, including bonds, notes, debentures, convertible securities, preferred stock and corporate commercial paper; issued by U.S. and non-U.S. corporations and other entities, such as master limited partnerships; (iii) mortgage-related securities; (iv) asset-backed securities; (v) inflation indexed bonds issued by governments or corporations; (vi) structured notes (i.e., specially designed debt instruments whose return is determined by reference to an index or security); (vii) bank loans, including participations and assignments; (viii) delayed funding loans and revolving credit facilities; (ix) bank certificates of deposit, fixed time deposits and bankers’ acceptances; (x) repurchase agreements and reverse repurchase agreements; (xi) debt securities issued by states or local governments or their agencies, authorities or other government sponsored enterprises (municipal securities); (xii) obligations of foreign governments or their subdivisions, agencies or government sponsored enterprises; and
30
SHAREHOLDER INFORMATION (Unaudited) — continued
(xiii) obligations of international agencies or supranational entities. These securities may have all types of interest rate payment and reset terms, including fixed rate, adjustable rate, floating rate, zero coupon, contingent, deferred, payment in kind and auction rate features.
The Fund’s 80% policy set forth above may be changed upon 60 days written notice to shareholders.
When the Adviser believes that market conditions make it appropriate, for temporary, defensive purposes the Fund may invest up to 100% of its assets in cash, high quality short-term money market instruments, and in bills, notes or bonds issued by the U.S. Treasury Department or by other agencies of the U.S. Government. When the Fund makes investments for defensive purposes, it may not achieve its investment objective.
Investment Restrictions
The Fund is subject to a number of investment restrictions, some of which are deemed fundamental and may not be changed without the affirmative vote of a majority of the outstanding voting securities of the Fund, and some of which are not fundamental and may be changed by the Fund’s Board. The Fund’s fundamental investment policies may be changed only with the approval of the holders of a “majority of the Fund’s outstanding voting securities,” which, as used in this prospectus, means the lesser of (1) 67% of the Shares represented at a meeting at which more than 50% of the outstanding Shares are present in person or by proxy, or (2) more than 50% of the outstanding Shares. Any investment policy or restriction which involves a maximum percentage of securities or assets is not considered to be violated unless an excess over the percentage occurs immediately after an acquisition of securities or utilization of assets and results therefrom. The Fund’s fundamental policies are set forth below.
| | 1. | The Fund will not borrow money, except to the extent permitted under the 1940 Act, as such may be interpreted or modified by regulatory authorities having jurisdiction, from time to time. |
| | 2. | The Fund will not issue senior securities, except to the extent permitted under the 1940 Act, as such may be interpreted or modified by regulatory authorities having jurisdiction, from time to time. |
| | 3. | The Fund will not act as an underwriter of securities within the meaning of the Securities Act of 1933, as amended, except to the extent permitted under the 1940 Act, as such may be interpreted or modified by regulatory authorities having jurisdiction, from time to time. |
| | 4. | The Fund will not “concentrate” its investments in an industry, except to the extent permitted under the 1940 Act, as such may be interpreted or modified by regulatory authorities having jurisdiction, from time to time. |
| | 5. | The Fund will not purchase or sell real estate, except to the extent permitted under the 1940 Act, as such may be interpreted or modified by regulatory authorities having jurisdiction, from time to time. |
| | 6. | The Fund will not purchase or sell commodities, except to the extent permitted under the 1940 Act, as such may be interpreted or modified by regulatory authorities having jurisdiction, from time to time. |
| | 7. | The Fund will not make loans to other persons, except to the extent permitted under the 1940 Act, as such may be interpreted or modified by regulatory authorities having jurisdiction, from time to time. |
31
SHAREHOLDER INFORMATION (Unaudited) — continued
The foregoing policies are fundamental and may not be changed without shareholder approval.
The Fund’s policies which are not deemed fundamental and which may be changed by the Board without shareholder approval are set forth below:
| | 1. | The Fund will not invest in companies for the purpose of exercising control or management. |
| | 2. | The Fund may not invest in the securities of other investment companies, except that it may invest in securities of no-load open-end money market investment companies and investment companies that invest in high yield debt securities if, immediately after any purchase of the securities of any such investment company: (i) securities issued by such investment company and all other investment companies owned by the Fund do not have an aggregate value in excess of 10% of the value of the total assets of the Fund; (ii) the Fund does not own more than three percent of the total outstanding voting stock of such investment company; and (iii) the Fund does not own securities issued by such investment company having an aggregate value in excess of 5% of the value of the total assets of the Fund. The Fund’s investment in securities of other investment companies will be subject to the proportionate share of the management fees and other expenses attributable to such securities of other investment companies. |
| | 3. | The Fund will not invest in the securities of foreign issuers, except for (i) those securities of the Canadian Government, its provinces and municipalities which are payable in United States currency, and (ii) securities of foreign issuers which are payable in United States dollars (“Yankee Bonds”). The Fund may also invest in Euro-dollar obligations with maturities up to one year, but the Fund will not acquire Yankee Bonds or Euro-dollar obligations if the acquisition would cause more than 15% of the Fund’s assets to be invested in Yankee Bonds and Euro-dollar obligations. |
| | 4. | The Fund will not invest more than 2% of the value of its total assets in warrants (valued at the lower of cost or market), except warrants acquired on initial issuance where the warrants are attached to or otherwise in a unit with other securities. |
Principal Risks
An investment in the Fund is not a bank deposit. It is not insured or guaranteed by the Federal Deposit Insurance Corporation (FDIC) or any other government agency. It is not a complete investment program. The fund’s share price fluctuates, sometimes dramatically, which means you could lose money.
For a discussion of the principal risk factors associated with an investment in the Fund, refer to Note 6 to the Fund’s financial statements in this Annual Report.
32
SHAREHOLDER INFORMATION (Unaudited) — continued
ADDITIONAL INFORMATION REGARDING THE FUND’S TRUSTEES AND OFFICERS
| | | | | | | | | | |
Name, Address and Age1 | | Position Held
With Fund | | Principal Occupation
During the Past 5 Years | | Number of
Funds Overseen
By Trustee | | Term of Office and Length
of Time Served | | Other
Directorships
Held by Trustee |
| | | | | |
W. Thacher Brown Born: December 1947 | | Trustee,
Board
Chairperson | | Retired | | 1 | | Shall serve until the next annual meeting or until his successor is qualified. Trustee since 1988. | | None. |
| | | | | |
Ellen D. Harvey Born: February 1954 | | Trustee | | Principal, Lindsay Criswell LLC beginning July 2008; Managing Director, Miller Investment Management from September 2008 to June 2018. | | 1 | | Shall serve until the next annual meeting or until her successor is qualified. Trustee since 2010. | | Director, Aetos Capital Funds (3 portfolios). |
| | | | | |
Thomas E. Spock Born: May 1956 | | Trustee | | Partner at Scalar Media Partners, LLC since June 2008. | | 1 | | Shall serve until the next annual meeting or until his successor is qualified. Trustee since 2013. | | None. |
| | | | | |
Suzanne P. Welsh Born: March 1953 | | Trustee | | Retired; Former Vice President for Finance and Treasurer, Swarthmore College from August 2002 to June 2014. | | 1 | | Shall serve until the next annual meeting or until her successor is qualified. Trustee since 2008. | | None. |
| | | | | |
Gautam Khanna2 Born: October 1969 | | President
| | Senior Portfolio Manager, Insight North America LLC and its predecessor firms since 2003. | | N/A. | | Shall serve until death, resignation, or removal. Officer since 2006. | | N/A. |
| | | | | |
James DiChiaro2 Born: November 1976 | | Vice
President | | Senior Portfolio Manager, Insight North America LLC and its predecessor firms since 1999. | | N/A. | | Shall serve until death, resignation, or removal. Officer since 2019. | | N/A. |
33
SHAREHOLDER INFORMATION (Unaudited) — continued
| | | | | | | | | | |
Name, Address and Age1 | | Position Held
With Fund | | Principal Occupation
During the Past 5 Years | | Number of
Funds Overseen
By Trustee | | Term of Office and Length
of Time Served | | Other
Directorships
Held by Trustee |
| | | | | |
Thomas E. Stabile2 Born: March 1974 | | Treasurer
and Vice
President | | Head of Operations, Insight North America LLC since January 2015. | | N/A. | | Shall serve until death, resignation, or removal. Officer since 2010. | | N/A. |
| | | | | |
Seth Gelman2 Born: August 1975 | | Secretary
and Chief
Compliance
Officer | | Chief Compliance Officer, Insight North America LLC since October 2017. Chief Compliance Officer, Insight Investment International Limited since October 2017. Chief Compliance Officer, Brookfield Investment Management, Inc. from May 2009 to October 2017. Chief Compliance Officer, Brookfield Investment Funds from May 2009 to October 2017. | | N/A. | | Shall serve until death, resignation, or removal. Officer since January 2019. | | N/A. |
| 1 | The business address of each Trustee and Officer is c/o Insight Investment, 200 Park Avenue, New York, NY 10166. |
| 2 | Denotes an officer who is an “interested person” of the Fund as defined under the provisions of the Investment Company Act of 1940. Messrs. Khanna, DiChiaro, Stabile, and Gelman are “interested persons” by virtue of being employees of the Fund’s Adviser. Additional information about the Trustees is included in the Fund’s prospectus. On May 6, 2021, the Board of Trustees of the Fund appointed Gautam Khanna as President of the Fund, succeeding Clifford Corso. As of date of this report, the portfolio managers of the Fund are Gautam Khanna, CPA, CFA, President and Senior Portfolio Manager and James DiChiaro, Vice President and Senior Portfolio Manager. Mr. Khanna is the lead portfolio manager responsible for day-to-day management of the portfolio. Mr. Khanna has been with INA and its predecessor firms since May 2003, and Mr. DiChiaro has been with INA and its predecessor firms since September 1999. |
34
SHAREHOLDER INFORMATION (Unaudited) — continued
RESULTS OF SPECIAL SHAREHOLDER MEETING
NOVEMBER 24, 2020
A special meeting of shareholders was held on November 24, 2020 (the “Special Meeting”). The Special Meeting was reconvened on such date after an adjournment on November 5, 2020. At the Special Meeting, shareholders voted on and approved each of the following proposals:
| | | | | | | | |
| | | Proposal | | Votes For | | Votes
Against | | Abstentions |
| 1. | | To approve an amendment to the investment advisory agreement between Insight North America LLC and Insight Select Income Fund to provide that fees paid under that agreement will be based on average daily managed assets; | | 4,820,685 | | 299,798 | | 423,670 |
| | | | |
| 2. | | In connection with the addition of leverage to the Fund, to approve revisions to the Fund’s fundamental investment policy relating to borrowing money; and | | 4,321,775 | | 801,405 | | 420,973 |
| | | | |
| 3. | | To approve revisions to the Fund’s fundamental investment policies required by the 1940 Act and the elimination of certain of the Fund’s fundamental investment policies not required by the 1940 Act or other applicable laws: | | N/A | | N/A | | N/A |
| | | | |
| 3.1 | | Revise the Fund’s fundamental investment policy related to issuing senior securities | | 4,341,383 | | 773,437 | | 429,333 |
| | | | |
| 3.2 | | Revise the Fund’s fundamental investment policy related to underwriting securities issued by other persons. | | 4,322,904 | | 790,773 | | 430,476 |
| | | | |
| 3.3 | | Revise the Fund’s fundamental investment policy related to investment concentration. | | 4,328,665 | | 776,834 | | 438,654 |
| | | | |
| 3.4 | | Revise the Fund’s fundamental investment policy related to purchasing or selling real estate. | | 4,346,233 | | 782,247 | | 415,673 |
| | | | |
| 3.5 | | Revise the Fund’s fundamental investment policy related to purchasing or selling commodities. | | 4,334,451 | | 794,921 | | 414,781 |
| | | | |
| 3.6 | | Revise the Fund’s fundamental investment policy related to making loans to other persons. | | 4,295,504 | | 839,065 | | 409,584 |
| | | | |
| 3.7 | | The elimination of certain of the Fund’s fundamental investment policies not required by law. | | N/A | | N/A | | N/A |
| | | | |
| 3.7.1 | | Eliminate the fundamental investment policy limiting put and call options on fixed income securities and futures contracts on fixed income securities. | | 4,303,868 | | 815,014 | | 425,271 |
| | | | |
| 3.7.2 | | Eliminate the fundamental investment policy limiting acquisition of Stand-by Commitments. | | 4,302,109 | | 823,441 | | 418,603 |
| | | | |
| 3.7.3 | | Eliminate the fundamental investment policy limiting purchases of securities on margin. | | 4,283,614 | | 848,982 | | 411,557 |
| | | | |
| 3.7.4 | | Eliminate the fundamental investment policy limiting short sales. | | 4,273,188 | | 859,098 | | 411,867 |
| | | | |
| 3.7.5 | | Eliminate the fundamental investment policy limiting purchases and sales of interest rate futures contracts. | | 4,297,156 | | 811,284 | | 435,713 |
35
SHAREHOLDER INFORMATION (Unaudited) — continued
| | | | | | | | |
| | | Proposal | | Votes For | | Votes
Against | | Abstentions |
| | | | |
| 3.7.6 | | Eliminate the fundamental investment policy limiting mortgaging, pledging, or hypothecation of its assets to secure borrowing. | | 4,750,334 | | 380,689 | | 413,130 |
| | | | |
| 3.7.7 | | Eliminate as a fundamental investment policy requiring that the Fund invest at least 75% of the value of its total assets in (A) cash and cash items, (B) government securities and (C) other securities (limited in respect of any one issuer to an amount not exceeding 5% of the value of its total assets). | | 4,305,834 | | 804,434 | | 433,885 |
| | | | |
| 3.7.8 | | Eliminate the fundamental investment policy prohibiting the Fund from purchasing more than 10% of the outstanding voting securities of any one issuer. | | 4,324,677 | | 812,146 | | 407,330 |
| | | | |
| 3.7.9 | | Eliminate the fundamental investment policy related to purchases of securities where one or more officers or directors of the Fund or of the Adviser own more than 0.5%, and those owning more than 0.5% together own more than 5%, of the outstanding securities of such issuer | | 4,300,176 | | 825,693 | | 418,284 |
| | | | |
| 3.7.10 | | Eliminate the fundamental investment policy related to purchases of securities by issuers with less than three years’ continuous operations. | | 4,323,326 | | 796,142 | | 424,685 |
| | | | |
| 3.7.11 | | Eliminate the fundamental investment policy related to the Fund’s participation on a joint or joint and several basis in any securities trading account. | | 4,327,355 | | 790,219 | | 426,579 |
| | | | |
| 3.7.12 | | Eliminate the fundamental investment policy related to restricted securities. | | 4,313,731 | | 793,042 | | 437,380 |
HOW TO GET INFORMATION REGARDING PROXIES
The Fund has adopted the Adviser’s proxy voting policies and procedures to govern the voting of proxies relating to the voting securities of the Fund. You may obtain a copy of these proxy voting procedures, without charge, by emailing clientservicena@insightinvestment.com or on the Securities and Exchange Commission website at www.sec.gov.
Information regarding how the Fund voted proxies relating to portfolio securities during the most recent 12-month period ended June 30 is available, without charge, by emailing clientservicena@insightinvestment.com or on the SEC’s website at www.sec.gov.
QUARTERLY STATEMENT OF INVESTMENTS
The Fund files quarterly schedules of portfolio holdings with the Securities and Exchange Commission (SEC) for the first and third quarters of each fiscal year as an exhibit to its report on Form N-PORT. The Fund’s Form N-PORT reports are available on the SEC’s EDGAR database at www.sec.gov.
ADDITIONAL TAX INFORMATION
For corporate shareholders, the percentage of investment income (dividend income and short-term gains, if any) for the Fund that qualify for the dividends-received deductions for the year ended March 31, 2021 was 1.20%.
36
SHAREHOLDER INFORMATION (Unaudited) — continued
For the year ended March 31, 2021, certain dividends paid by the Fund may be subject to a maximum tax rate of 15%, as provided by the Jobs and Growth Tax Relief Reconciliation Act of 2003. Of the distributions made by the Fund, 1.20% represents the amount of each distribution which may qualify for the 15% dividend income tax rate. Shareholders should not use this tax information to prepare their tax returns. The information will be included with your Form 1099 DIV which will be sent to you separately in January 2022.
For the fiscal year ended March 31, 2021, the Fund designated long-term capital gains of $3,706,555.
DIVIDEND REINVESTMENT PLAN
The Fund has established a plan for the automatic investment of dividends and distributions pursuant to which dividends and capital gain distributions to shareholders will be paid in or reinvested in additional shares of the Fund. All shareholders of record are eligible to join the Plan. Computershare Investor Services acts as the agent (the “Agent”) for participants under the Plan.
Shareholders whose shares are registered in their own names may elect to participate in the Plan by completing an authorization form and returning it to the Agent. Shareholders whose shares are held in the name of a broker or nominee should contact such broker or nominee to determine whether or how they may participate in the Plan.
Dividends and distributions are reinvested under the Plan as follows. If the market price per share on the Friday before the payment date for the dividend or distribution (the “Valuation Date”), plus this brokerage commissions applicable to one such share, equals or exceeds the net asset value per share on that date, the Fund will issue new shares to participants valued at the net asset value or, if the net asset value is less than 95% of the market price on the Valuation Date, then valued at 95% of the market price. If net asset value per share on the Valuation Date exceeds the market price per share on that date, plus the brokerage commissions applicable to one such share, the Agent will buy shares on the open market, on the New York Stock Exchange, for the participants’ accounts. If before the Agent has completed its purchases, the market price exceeds the net asset value of shares, the average per share purchase price paid by the Agent may exceed the net asset value of shares, resulting in the acquisition of fewer shares than if the dividend or distribution has been paid in shares issued by the Fund at net asset value.
There is no charge to participants for reinvesting dividends or distributions payable in either shares or cash. The Agent’s fees for handling of reinvestment of such dividends and distributions will be paid by the Fund. There will be no brokerage charges with respect to shares issued directly by the Fund as a result of dividends or distributions payable either in shares or cash. However, each participant will be charged by the Agent a pro rata share of brokerage commissions incurred with respect to Agent’s open market purchases in connection with the reinvestment of dividends or distributions payable only in cash.
For purposes of determining the number of shares to be distributed under the Plan, the net asset value is computed on the Valuation Date and compared to the market value of such shares on such date. The Plan may be terminated by a participant by delivery of written notice of termination to the Agent at the address shown below. Upon termination, the Agent will cause a certificate or certificates for the full shares held for a participant under the Plan and a check for any fractional shares to be delivered to the former participant.
Distributions of investment company taxable income that are invested in additional shares generally are taxable to shareholders as ordinary income. A capital gain distribution that is reinvested in shares is taxable to shareholders as long-term capital gain, regardless of the length of time a shareholder has held the shares or whether such gain was realized by the Fund before the shareholder acquired such shares and was reflected in the price paid for the shares.
Plan information and authorization forms are available from Computershare Investor Services, PO Box 505000, Louisville, KY 40233-5000.
37
SHAREHOLDER INFORMATION (Unaudited) — continued
PRIVACY POLICY
The Fund has adopted procedures designed to maintain and secure the non-public personal information of its clients from inappropriate disclosure to third parties. The Fund is committed to keeping personal information collected from potential, current, and former clients confidential and secure. The proper handling of personal information is one of our highest priorities. The Fund never sells information relating to its clients to any outside third parties.
Client Information
The Fund will only collect and keep information which is necessary for it to provide the services requested by its shareholders, and to administer a shareholder account.
The Fund may collect nonpublic personal information from clients or potential clients such as name, address, tax identification or social security number, assets, income, net worth, copies of financial documents and other information that we may receive on applications or other forms, correspondence or conversations, or via other methods in order to conduct business.
The Fund may also collect information about your transactions with the Fund, Adviser, Adviser’s affiliates, or others, including, but not limited to, your account number and balance, payments history, parties to transactions, cost basis information, and other financial information.
This information may be obtained as a result of transactions with the Fund, Adviser, Adviser’s affiliates, its clients, or others. This could include transactions completed with affiliates or information received from outside vendors to complete transactions or to effect financial goals.
Sharing Information
The Fund only shares the nonpublic personal information of its shareholders with non-affiliated companies or individuals (i) as permitted by law and as required to provide services to shareholders, such as with representatives within Adviser, securities clearing firms, the Fund or insurance companies, and other financial services providers; or (ii) to comply with legal or regulatory requirements. The Fund may also disclose nonpublic personal information to another financial services provider in connection with the transfer of an account to such financial services provider. Further, in the normal course of business, the Fund may disclose information it collects about shareholders to companies or individuals that contract with the Fund or Adviser to perform servicing functions including, but not limited to, recordkeeping, consulting, and/or technology services.
Companies hired to provide support services are not permitted to use personal information for their own purposes, and are contractually obligated to maintain strict confidentiality. The Fund limits the use of personal information to the performance of the specific service requested.
The Fund does not provide personally identifiable information to mailing list vendors or solicitors for any purpose. When the Fund provides personal information to service providers, it requires these providers to agree to safeguard such information, to use the information only for the intended purpose, and to abide by applicable law.
Employee Access to Information
Only employees with a valid business reason have the ability to access a clients’ personal information. These employees are educated on the importance of maintaining the confidentiality and security of this information. They are required to abide by our information handling practices.
38
SHAREHOLDER INFORMATION (Unaudited) — continued
Protection of Information
The Fund maintains security standards to protect shareholders’ information, whether written, spoken, physical, or electronic. The Fund updates and checks its physical mechanisms and electronic systems to ensure the protection and integrity of information.
Maintaining Accurate Information
The Fund’s goal is to maintain accurate, up to date client records in accordance with industry standards. The Fund has procedures in place to keep information current and complete, including timely correction of inaccurate information.
Disclosure of our Privacy Policy
The Fund recognizes and respects the privacy concerns of its potential, current, and former shareholders. The Fund, Adviser and Adviser’s affiliates are committed to safeguarding this information and may provide this Privacy Policy for informational purposes to shareholders and employees, and will distribute and update it as required by law. It is also available upon request.
The Fund seeks to carefully safeguard shareholder information and, to that end, restricts access to non-public personal information about our shareholders to those employees and other persons who need to know the information to enable the Fund to provide services to its shareholders. The Fund, Adviser and their service agents maintain physical, electronic, and procedural safeguards that comply with federal standards to guard your non-public personal information. In the event that you maintain an account through a financial intermediary, including, but not limited to, a broker-dealer, bank, or trust company, the privacy policy of your financial intermediary would govern how your non-public personal information would be shared with unaffiliated third parties.
39
HOW TO GET ASSISTANCE WITH SHARE TRANSFER OR DIVIDENDS
Contact Your Transfer Agent:
Computershare Investor Services
PO Box 505000, Louisville, KY 40233-5000, or call 1-866-333-6685
T R U S T E E S
W. THACHER BROWN
ELLEN D. HARVEY
THOMAS E. SPOCK
SUZANNE P. WELSH
O F F I C E R S
GAUTAM KHANNA
President
JAMES DICHIARO
Vice President
THOMAS E. STABILE
Treasurer and Vice President
SETH GELMAN
Secretary and Chief Compliance Officer
I N V E S T M E N T A D V I S E R
INSIGHT NORTH AMERICA LLC
200 PARK AVE, 7TH FLOOR
NEW YORK, NY 10166
C U S T O D I A N
THE BANK OF NEW YORK MELLON
2 HANSON PLACE
BROOKLYN, NY 11217
T R A N S F E R A G E N T
COMPUTERSHARE INVESTOR SERVICES
PO Box 505000,
Louisville, KY 40233-5000
866-333-6685
C O U N S E L
TROUTMAN PEPPER HAMILTON SANDERS LLP
3000 TWO LOGAN SQUARE
EIGHTEENTH & ARCH STREETS
PHILADELPHIA, PA 19103
I N D E P E N D E N T R E G I S T E R E D
P U B L I C A C C O U N T I N G F I R M
TAIT, WELLER & BAKER LLP
50 SOUTH 16TH STREET
SUITE 2900
PHILADELPHIA, PA 19102

Insight Select Income Fund
Annual Report
March 31, 2021

Item 2. Code of Ethics.
The registrant has adopted a code of ethics (the “Code of Ethics”) that applies to its principal executive officer, principal financial officer, principal accounting officer or controller, or persons performing similar functions (each a “Covered Person”). A copy of the Registrant’s Code of Ethics can be obtained without charge, upon request, by calling the Registrant at 1-866-333-6685. There were no amendments to the Code of Ethics during the reporting period. There were no waivers of a provision of the Code of Ethics granted to a Covered Person during the reporting period.
A copy of the registrant’s Code of Ethics is filed herewith as Exhibit 13(a)(1).
Item 3. Audit Committee Financial Expert.
The Board of Trustees of the registrant has determined that Suzanne P. Welsh, the Chair of the Board’s Audit Committee, possesses the technical attributes identified in Instruction 2(b) of Item 3 to Form N-CSR to qualify as an “audit committee financial expert,” and has designated Ms. Welsh as the Audit Committee’s financial expert. Ms. Welsh is an “independent” Trustee pursuant to paragraph (a)(2) of Item 3 to Form N-CSR. Under applicable securities laws, a person who is determined to be an audit committee financial expert will not be deemed an “expert” for any purpose, including without limitation for the purposes of Section 11 of the Securities Act of 1933, as a result of being designated or identified as an audit committee financial expert. The designation or identification of a person as an audit committee financial expert does not impose on such person any duties, obligations, or liabilities that are greater than the duties, obligations, and liabilities imposed on such person as a member of the audit committee and Board of Trustees in the absence of such designation or identification. The designation or identification of a person as an audit committee financial expert does not affect the duties, obligations, or liability of any other members of the audit committee or board of trustees.
Item 4. Principal Accountant Fees and Services.
Audit Fees
| | (a) | The aggregate fees billed for each of the last two fiscal years for professional services rendered by the principal accountant for the audit of the registrant’s annual financial statements or services that are normally provided by the accountant in connection with statutory and regulatory filings or engagements for those fiscal years are $20,000 and $20,000 for the fiscal years ended March 31, 2021 and March 31, 2020, respectively. |
Audit-Related Fees
| | (b) | The aggregate fees billed in each of the last two fiscal years for assurance and related services by the principal accountant that are reasonably related to the performance of the audit of the registrant’s financial statements and are not reported under paragraph (a) of this Item are $3,000 and $3,000 for the fiscal years |
| | ended March 31, 2021 and March 31, 2020, respectively. The audit related fees relate to the 17f-2 custody audits required under the Investment Company Act of 1940, as amended. |
Tax Fees
The aggregate fees billed in each of the last two fiscal years for professional services rendered by the principal accountant for tax compliance, tax advice, and tax planning are $3,500 and $3,500 for the fiscal years ended March 31, 2021 and March 31, 2020, respectively. The tax fees relate to the review of the registrant’s tax filings and annual tax related disclosures in the financial statements.
All Other Fees
| | (d) | The aggregate fees billed in each of the last two fiscal years for products and services provided by the principal accountant, other than the services reported in paragraphs (a) through (c) of this Item are $0 and $0 for the fiscal years ended March 31, 2021 and March 31, 2020, respectively. |
| | (e)(1) | The registrant’s audit committee has adopted policies and procedures relating to the pre-approval of services provided by the registrant’s principal accountant (the “Pre-Approval Policies”). The Pre-Approval Policies establish a framework intended to assist the audit committee in the proper discharge of its pre-approval responsibilities. As a general matter, the Pre-Approval Policies (i) specify certain types of audit, audit-related, tax, and other services determined to be pre-approved by the audit committee; and (ii) delineate specific procedures governing the mechanics of the pre-approval process, including the approval and monitoring of audit and non-audit service fees. Unless a service is specifically pre-approved under the Pre-Approval Policies, it must be separately pre-approved by the audit committee. |
| | (e)(2) | All of the services described in each of paragraphs (b) through (d) of this Item were approved by the audit committee pursuant to paragraph (c)(7)(i)(C) of Rule 2-01 of Regulation S-X. |
| | (g) | The aggregate non-audit fees billed by the registrant’s accountant for services rendered to the registrant, and rendered to the registrant’s investment adviser (not including any sub-adviser whose role is primarily portfolio management and is subcontracted with or overseen by another investment adviser), and any entity controlling, controlled by, or under common control with the adviser that provides ongoing services to the registrant for each of the last two fiscal years of the registrant was $0 and $0 for the fiscal years ended March 31, 2021 and March 31, 2020, respectively. |
Item 5. Audit Committee of Listed Registrants.
The registrant has a separately-designated standing audit committee consisting of all the independent trustees of the registrant. The members of the audit committee are: W. Thacher Brown, Ellen D. Harvey, Thomas E. Spock and Suzanne P. Welsh, constituting the entire board.
Item 6. Investments.
| (a) | Schedule of Investments in securities of unaffiliated issuers as of the close of the reporting period is included as part of the report to shareholders filed under Item 1(a) of this form. |
Item 7. Disclosure of Proxy Voting Policies and Procedures for Closed-End Management Investment Companies.
The registrant has adopted the proxy voting policies and procedures used by the Investment Adviser (Insight North America LLC or “Insight” or the “Adviser”).
As a fixed income investment manager, Insight votes proxies for client securities on a relatively infrequent basis. Insight has adopted a proxy voting policy where it has been granted authority to vote such proxies and to ensure that proxies are voted in the best interest of each client. More frequently, Insight votes or consents to corporate actions, including tenders, exchanges, amendments, and restructurings which relate to individual fixed income holdings of client accounts. Determinations on voting of consents to these matters tend to be driven primarily by the Company’s view of whether the proposed action will result in an economic benefit for the affected client(s).
Voting Policy
We routinely vote on behalf of our clients with regard to the companies in which they have a shareholding. Insight retains the services of Manifest Information Services (Manifest) for the provision of proxy voting services and votes at all meetings where it is deemed appropriate and responsible to do so. Manifest analyse any resolution against Insight specific voting policy templates which will determine the direction of the vote. Where contentious issues are identified these are escalated to Insight for further review and direction. With regard to voting, the conflicts of interest policy is that Insight will always seek to act in the best interests of its clients when casting proxy votes on their behalf. Where Bank of New York Mellon, Insight or the clients themselves have business relationships with investee companies, these will be disregarded by Insight in making its proxy voting decisions.
Generally, our IMAs provide us with the authority to vote proxies on equity securities for our client accounts subject to any specific instructions from the client.
On an annual basis, Insight publishes a report titled ‘Putting Principles into Practice’, available on our website at https://www.insightinvestment.com/globalassets/documents/us-redesign-documents/responsible-investment-reports/us-responsible-
horizons-2020-ri-report.pdf, which includes a description on how we have exercised voting powers.
Item 8. Portfolio Managers of Closed-End Management Investment Companies.
| | (1) | Portfolio Management Team: |
Gautam Khanna, CPA, CFA
Senior Portfolio Manager, Insight North America LLC
May 2003 - Present
Lead Portfolio Manager responsible for day-to-day management of portfolio
James DiChiaro
Senior Portfolio Manager, Insight North America LLC
September 1999 - Present
Portfolio Manager responsible for management of portfolio
| | (2) | The table below identifies the number of accounts (other than the Fund) for which the Fund’s portfolio managers have day-to-day management responsibilities and total assets in such accounts, within each of the following categories: registered investment companies, other pooled investment vehicles, and other accounts. The Adviser currently does not manage any performance-based fee accounts. |
| | | | |
| | | As of March 31, 2021 |
| | | Number of
Accounts | | Total Assets of
Accounts |
| | | | | (in millions) |
Gautam Khanna, CPA, CFA | | | | |
Registered Investment Companies | | 2 | | $1,698.8 |
Other Pooled Investments | | - | | - |
Other Accounts | | 16 | | $1,831.0 |
James DiChiaro | | | | |
Registered Investment Companies | | 2 | | $1,698.8 |
Other Pooled Investments | | - | | - |
Other Accounts | | 16 | | $1,831.0 |
Potential Conflicts of Interests
Material conflicts of interest identified by the Adviser may arise in connection with a portfolio manager’s management of the Fund in addition to other fund and/or accounts managed. These potential conflicts of interest include material conflicts between the investment strategy of the Fund and the investment strategy of the other accounts managed by the portfolio manager and conflicts associated with the allocation of investment opportunities between the Fund and other accounts managed by the portfolio manager. For example, conflicts may arise in cases where multiple Firm and/or affiliate client accounts are invested in different parts of an issuer’s capital structure. Additionally, a portfolio manager may manage a separate account or other pooled investment vehicle that may have a materially higher or lower fee arrangement than the Fund or that may have a performance fee arrangement. The side-by-side management of these accounts may raise potential conflicts of interest relating to cross trading, the allocation of investment opportunities and the aggregation and allocation of trades. In addition, while portfolio managers generally only manage accounts with similar investment strategies, it is possible that due to varying investment restrictions among accounts and for other reasons that certain investments could be made for some accounts and not others or conflicting investment positions could be taken among accounts. The Adviser has a fiduciary responsibility to manage all client accounts in a fair and equitable manner. The Adviser seeks to provide best execution of all securities transactions and aggregates and then allocates securities to client accounts in a fair and timely manner. To this end, the Adviser has developed policies and procedures designed to mitigate and manage the potential conflicts of interest that may arise from side-by-side management.
| (a)(3) | All employees of the Adviser, including the portfolio managers, are eligible to receive a variable component of pay in addition to their fixed compensation. The variable component is a combination of cash and Long Term Incentive Plan (LTIP) shares and is determined based on each individual’s performance rating in addition to the overall performance of the Adviser. The LTIP shares typically vest on a three-year schedule, with the aim of aligning each individual’s rewards with the success of the business. |
Performance management and compensation are formally linked. Everyone participates in mid-year reviews which incorporate 360 degree feedback and an assessment of performance against objectives, as well as a formal end of year review. At that review, a performance rating is also
agreed which is then a key factor in determining compensation. For investment professionals, investment performance is an important, but not the only, factor.
| (a)(4) | The following table discloses the dollar range of equity securities of the Fund beneficially owned by each of the Fund’s portfolio managers as of March 31, 2021: |
| | |
| | | Dollar range of Equity
Securities in Fund (1) |
| | | |
Gautam Khanna | | $10,001 to $50,000 |
| |
James DiChiaro | | NONE |
|
| (1) Dollar ranges are as follows: None, $1- $10,000, $10,001-$50,000, $50,001-$100,000, $100,001-$500,000, $500,001- $1,000,000 or over $1,000,000. |
| (b) | N/A- filing is an annual report. |
Item 9. Purchases of Equity Securities by Closed-End Management Investment Company and Affiliated Purchasers.
Not applicable.
Item 10. Submission of Matters to a Vote of Security Holders.
There have been no material changes to the procedures by which the shareholders may recommend nominees to the registrant’s Board of Trustees during the period covered by the Annual Report included in Item 1 of this Form N-CSR.
Item 11. Controls and Procedures.
| | (a) | The registrant’s principal executive and principal financial officers, or persons performing similar functions, have concluded that the registrant’s disclosure controls and procedures (as defined in Rule 30a-3(c) under the Investment Company Act of 1940, as amended (the “1940 Act”) (17 CFR 270.30a-3(c)) are effective, as of a date within 90 days of the filing date of the report that includes the disclosure required by this paragraph, based on their evaluation of these controls and procedures required by Rule 30a-3(b) under the 1940 Act (17 CFR 270.30a-3(b)) and Rules 13a-15(b) or 15d-15(b) under the Securities Exchange Act of 1934, as amended (17 CFR 240.13a-15(b) or 240.15d-15(b)). |
| | (b) | There were no changes in the registrant’s internal control over financial reporting (as defined in Rule 30a-3(d) under the 1940 Act (17 CFR 270.30a-3(d)) that occurred during the period covered by this report that has materially affected, or is reasonably likely to materially affect, the registrant’s internal control over financial reporting. |
Item 12. Disclosure of Securities Lending Activities for Closed-End Management Investment Companies.
Not applicable.
Item 13. Exhibits.
SIGNATURES
Pursuant to the requirements of the Securities Exchange Act of 1934 and the Investment Company Act of 1940, the registrant has duly caused this report to be signed on its behalf by the undersigned, thereunto duly authorized.
(Registrant) Insight Select Income Fund
By (Signature and Title)* /s/ Gautam Khanna
Gautam Khanna, President
(Principal Executive Officer)
Date May 14, 2021
Pursuant to the requirements of the Securities Exchange Act of 1934 and the Investment Company Act of 1940, this report has been signed below by the following persons on behalf of the registrant and in the capacities and on the dates indicated.
By (Signature and Title)* /s/ Gautam Khanna
Gautam Khanna, President
(Principal Executive Officer)
Date May 14, 2021
By (Signature and Title)* /s/ Thomas E. Stabile
Thomas E. Stabile, Treasurer
(Principal Financial Officer)
Date May 14, 2021