UNITED STATES
SECURITIES AND EXCHANGE COMMISSION
Washington, D.C. 20549
FORMN-CSR
CERTIFIED SHAREHOLDER REPORT OF REGISTERED MANAGEMENT
INVESTMENT COMPANIES
Investment Company Act file number 811-02201
Insight Select Income Fund
(Exact name of registrant as specified in charter)
200 Park Avenue, 7th Floor
New York, NY 10166
(Address of principal executive offices) (Zip code)
Clifford D. Corso
200 Park Avenue, 7th Floor
New York, NY 10166
(Name and address of agent for service)
Registrant’s telephone number, including area code: 212-527-1800
Date of fiscal year end: March 31
Date of reporting period: March 31, 2019
Item 1. Reports to Stockholders.
The Report to Shareholders is attached herewith.
Beginning on January 1, 2021, as permitted by regulations adopted by the Securities and Exchange Commission, paper copies of the Fund’s annual and semi-annual shareholder reports may no longer be sent by mail, unless you specifically request paper copies of the reports. Instead, the reports will be made available on the Fund’s website, and you will be notified by mail each time a report is posted and provided with a website link to access the report.
If you invest through a financial intermediary, and you already elected to receive a shareholder reports electronically (“edelivery”), you will not be affected by this change and you need not take any action. If you have not already elected edelivery, you may elect to receive shareholder reports and other communications from the Fund electronically by contacting your financial intermediary.
You may elect to receive all future reports in paper free of charge. If you invest through a financial intermediary, you can contact your financial intermediary to request that you continue to receive paper copies of your shareholder reports. Your election to receive reports in paper will apply to all funds held in your account if you invest through your financial intermediary. If you invest directly with the Fund, you can make your preference known through the means below.
Online:
Visitwww-us.computershare.com/investor to log into your account and select “Communication Preferences” to set your preference.
Telephone:
Contact the Fund at1-866-333-6685
Overnight Mail:
Computershare Investor Services, 462 South 4th Street, Suite 1600, Louisville, KY, 40202
Regular Mail:
Computershare Investor Services, PO Box 505000, Louisville, KY, 40233-5000
1
INSIGHT SELECT INCOME FUND SHAREHOLDER LETTER
For the Year Ended 03/31/19
April 15, 2019
DEAR SHAREHOLDERS:
Over the last twelve months, the US economy has grown strongly, underpinned by 4% consumption growth, continued business investment and an acceleration of government spending. Alongside this, unemployment has moved below 4%, which has helped push wage growth north of 3%. US GDP growth for the fourth quarter was 2.2% and a very respectable 2.9% for the full year. Corporate profitability has also been strong, aided significantly by the 2017 tax cuts. Given this robust domestic economic backdrop, 2018 was actually a breakout year for growth, which was one of the contributing factors behind the Federal Reserve (Fed) increasing the funds rate four times, ending the year with their target rate at a range of 2.25% to 2.5%. Let us not forget that, post financial crisis, GDP growth in the US averaged less than 2% from 2009 to 2017.
Concerns about global growth have increased, given mounting trade tensions between the US and China and the potential implications for Europe and the emerging markets. We envision US GDP growth for 2019 to be slightly above trend at 2.3%. Our base case is one in which the US economy remains in a self-sustaining expansion, although growth will be somewhat slower than the 2018 pace. US growth in this cycle has remained below trend at around 2% since the financial crisis; and inpost-war history, this cycle has exhibited the shallowest growth trajectory post-recession. Perhaps the slower growth and elevated skepticism throughout most of this expansion has reduced the potentialbuild-up of excesses in the economy, which could help further prolong this expansion. While Chairman Jerome Powell is perhaps less sensitive to market volatility than his predecessors, we believe this Fed does remain data-dependent and a deterioration in the outlook would halt additional monetary policy tightenings altogether.
The mood in the market was somber at the start of the year, as was the case for most of 4th quarter of 2018, resulting in arguably oversold conditions. The negative sentiment was based on a concern that the Fed would continue to raise rates, as evidenced by their dot plot at the time – all in the face of a growing concern that the global economy was slowing. The narrative around a global growth slowdown was fueled by negative economic data out of Europe with PMI data signaling contraction in many countries including Germany. The ongoing trade negotiations with China didn’t help matters as concerns over a derailment in progress there would also contribute to a slowing global economy.
In early 2019, the Fed communicated its intention to take a pause from additional rate hikes and during its March meeting also stated that their balance sheet reduction program would slow in May and end in September. At the same time, the trade dispute between the US and China still remains outstanding, but there have been rumors that negotiations are heading in the right direction. Both of these factors weighed on investor sentiment, resulting in a strong rally in risk assets in the first quarter of 2019. Equity markets led from the front returning 13.6% during the first quarter, generally erasing equity losses in the 4th quarter of 2018. In credit markets, both investment grade and high yield corporate bonds exhibited robust performance generating returns of 5.14% and 7.26%, respectively. This optimistic outlook in the credit markets was not shared in the rates market as interest rates remained depressed globally. German10-year bunds traded to negative yields joining Japan and Switzerland. The US rates market remained well bid, shifting the entire rate curve lower. Specifically, during the quarter the2-year US Treasury yield fell by 23bp,10-year yield fell by 28bp and30-year yield fell by 20bp. Volatility declined and remained below recent averages. The labor market remains relatively strong, registering 541,000 newnon-farm payrolls during the first quarter coupled with an unemployment rate of merely 3.8%. Wage growth continues to improve and has edged above 3%.
2
Looking ahead at 2019 in more detail, we believe the domestic economy will continue to perform given strong consumption and the continued effects of fiscal stimulus. Economic growth forecasts have dipped across the board, particularly for Europe and China, with US expected to slow from 2018 levels toward 2%. Global inflation is expected to moderate to 3.1% and within developed markets inflation is expected to remain below the typical 2% central bank target. A further escalation of trade-related tensions and a cyclical slowdown in Europe are downside risks to our base case. While these events could slow growth, we don’t believe they are likely to tip the US into a recession, given the relatively strong domestic economic momentum.
We continue to reduce the fund’s exposure to corporate credit and have migrated the fund’s investments up the ratings’ spectrum in terms of credit quality, while emphasizing improving credits or those that we believe represent stable sources of income. We recognize that high yield valuations have come a long way since the start of the year and we remain cautious on generic market beta, while focusing on idiosyncratic opportunities within the sector. Recent shifts in the portfolio have included an increase in allocation to the securitized sectors that potentially outperform late in an economic cycle and offer structural protections. We continue to scrutinize investment grade credits that have levered up in this cycle due to mergers and acquisitions or share repurchases to assess whether their balance sheets are on a stable footing. These efforts are aimed at minimizing price effects from negative credit migration. The duration of the portfolio remains near neutral, relative to the index, given global macro risk events that continue to weigh on market sentiment.
As of March 31, 2019, the Fund had a net asset value (NAV) of $20.57 per share. This represents a 0.10% increase from $20.55 per share on March 31, 2018. On March 31, 2019, the Fund’s closing price on the New York Stock Exchange was $19.22 per share, representing a 6.56% discount to NAV per share, compared with a 5.74% discount as of March 31, 2018. One of the primary objectives of the Fund is to maintain a high level of income. On March 18, 2019, the Board of Trustees declared a dividend payment of $0.20 and an additional cash dividend of $0.14 per share payable on May 8, 2019 to shareholders of record on April 5, 2019. On an annualized basis, including the pending dividend, the annual dividend payment from ordinary income equates to a total of $0.80 per share, representing a 4.30% dividend yield based on the market price on April 15, 2019 of $18.61 per share. The one-time additional cash dividend of $0.14 is in addition to the quarterly dividend and will be paid out of the Fund’s undistributed taxable income (“spillover income”, or taxable net income in excess of dividends paid) as of December 31, 2018. The dividend is evaluated on a quarterly basis and is based on the income generation capability of the portfolio and is not guaranteed for any period of time.
Total Return-Percentage Change (Annualized for periods longer than 1 year)
In Net Asset Value Per Share with All Distributions Reinvested1
| 6 Months to 3/31/19 | 1 Year to 3/31/19 | 3 Years to 3/31/19 | 5 Years to 3/31/19 | 10 Years to 3/31/19 | ||||||||||||||||
Insight Select Income Fund | 4.12 | % | 4.52 | % | 5.41 | % | 4.52 | % | 8.63 | % | ||||||||||
Bloomberg Barclays U.S. Credit Index2 | 4.89 | % | 4.89 | % | 3.48 | % | 3.61 | % | 6.22 | % | ||||||||||
1 – This is historical information and should not be construed as indicative of any likely future performance.
2 – Source: Bloomberg Barclays as of March 31, 2019. Comprised primarily of US investment grade corporate bonds (Fund’s Benchmark).
The Fund’s performance for the 10-year historical periods (shown above) reflects the 4.79% dilution of NAV resulting from the rights offering in the third quarter of 2009. After adjusting for the impact of the rights offering, we estimate the 10-year annualized return to be 9.12%. The returns noted in the table above are actual returns as calculated by the fund administrator, BNY Mellon Investment Servicing (US) Inc., and do not adjust for the dilution from the rights offering.
3
Yield represents the major component of return in most fixed income portfolios. Given this Fund’s emphasis on income and the dividend, we generally will not have material exposure to low yielding US Treasuries and will maintain meaningful exposure to corporate bonds. When it comes to management of credit risk, we try to look through periods of volatility to focus on an investment’s long-term creditworthiness to assess whether it will provide an attractive yield to the Fund over time.
The Fund’s performance will continue to be subject to trends in long-term interest rates and to corporate yield spreads. Consistent with our investment discipline, we continue to emphasize diversification and risk management within the bounds of income stability. The pie chart below summarizes the portfolio quality of the Fund’s assets as of March 31, 2019:
Percent of Total Investment (Lower of S&P and Moody’s Ratings)3
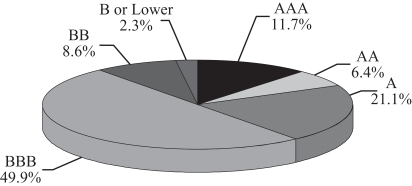
| 3 | For financial reporting purposes, credit quality ratings shown above reflect the lowest rating assigned by either Standard & Poor’s (“S&P”) or Moody’s Investors Service (“Moody’s”) if ratings differ. These rating agencies are independent, nationally recognized statistical rating organizations and are widely used. Investment grade ratings are credit ratings of BBB/Baa or higher. Below investment grade ratings are credit ratings of BB/Ba or lower. Investments designated NR are not rated by either rating agency. Unrated investments do not necessarily indicate low credit quality. Credit quality ratings and the Fund’s allocation to the ratings categories are subject to change at any time without notice. |
We would like to remind shareholders of the opportunities presented by the Fund’s dividend reinvestment plan referred to in the Shareholder Information section of this report. The dividend reinvestment plan affords shareholders a price advantage by allowing them to purchase shares at NAV or market price, whichever is lower. This means that the reinvestment price is at market price when the Fund is trading at a discount to NAV, as is currently the situation, or at NAV per share when market trading is at a premium to that value. To participate in the plan, please contact BNY Mellon Investment Servicing (US) Inc. the Fund’s Transfer Agent and Dividend Paying Agent, at 1-866-333-6685. The Fund’s investment adviser, Insight North America LLC, may be reachedat 1-212-527-1800.

Cliff Corso
President
Mr. Corso’s comments reflect the investment adviser’s views generally regarding the market and the economy, and are compiled from the investment adviser’s research. These comments reflect opinions as of the date written and are subject to change at any time.
4
Opinions expressed herein are current opinions of Insight, and are subject to change without notice. Insight assumes no responsibility to update such information or to notify a client of any changes. Any outlooks, forecasts or portfolio weightings presented herein are as of the date appearing on this material only and are also subject to change without notice. Insight disclaims any responsibility to update such views. No forecasts can be guaranteed.
Information herein may contain, include or is based upon forward-looking statements within the meaning of the federal securities laws, specifically Section 21E of the Securities Exchange Act of 1934, as amended. Forward- looking statements include all statements, other than statements of historical fact, that address future activities, events or developments, including without limitation, business or investment strategy or measures to implement strategy, competitive strengths, goals expansion and growth of our business, plans, prospects and references to future or success. You can identify these statements by the fact that they do not relate strictly to historical or current facts. Words such as ‘anticipate,’ ‘estimate,’ ‘expect,’ ‘project,’ ‘intend,’ ‘plan,’ ‘believe,’ and other similar words are intended to identify these forward-looking statements. Forward-looking statements can be affected by inaccurate assumptions or by known or unknown risks and uncertainties. Many such factors will be important in determining our actual future results or outcomes. Consequently, no forward-looking statement can be guaranteed. Our actual results or outcomes may vary materially. Given these uncertainties, you should not place undue reliance on these forward-looking statements.
Past performance is not a guide to future performance, which will vary. The value of investments and any income from them will fluctuate and is not guaranteed (this may partly be due to exchange rate changes). Future returns are not guaranteed and a loss of principal may occur.
The quoted benchmarks within this presentation do not reflect deductions for fees, expenses or taxes. These benchmarks are unmanaged and cannot be purchased directly by investors. Benchmark performance is shown for illustrative purposes only and does not predict or depict the performance of any investment. There may be material factors relevant to any such comparison such as differences in volatility, and regulatory and legal restrictions between the indices shown and the strategy.
5
REPORT OF INDEPENDENT REGISTERED PUBLIC ACCOUNTING FIRM
To the Shareholders and
Board of Trustees of
Insight Select Income Fund
Opinion on the Financial Statements
We have audited the accompanying statement of assets and liabilities of Insight Select Income Fund (the “Fund”), including the schedule of investments, as of March 31, 2019, the related statement of operations for the year then ended, the statements of changes in net assets for each of the two years in the period then ended, and financial highlights for each of the five years in the period then ended, and the related notes (collectively referred to as the “financial statements”). In our opinion, the financial statements present fairly, in all material respects, the financial position of the Fund as of March 31, 2019, the results of its operations for the year then ended, the changes in its net assets for each of the two years in the period then ended, and the financial highlights for each of the five years in the period then ended, in conformity with accounting principles generally accepted in the United States of America.
Basis for Opinion
These financial statements are the responsibility of the Fund’s management. Our responsibility is to express an opinion on the Fund’s financial statements based on our audits. We are a public accounting firm registered with the Public Company Accounting Oversight Board (United States) (“PCAOB”) and are required to be independent with respect to the Fund in accordance with the U.S. federal securities laws and the applicable rules and regulations of the Securities and Exchange Commission and the PCAOB. We have served as the Fund’s auditor since 2003.
We conducted our audits in accordance with the standards of the PCAOB. Those standards require that we plan and perform the audit to obtain reasonable assurance about whether the financial statements are free of material misstatement, whether due to error or fraud. The Fund is not required to have, nor were we engaged to perform, an audit of its internal control over financial reporting. As part of our audits we are required to obtain an understanding of internal control over financial reporting, but not for the purpose of expressing an opinion on the effectiveness of the Fund’s internal control over financial reporting. Accordingly, we express no such opinion.
Our audits included performing procedures to assess the risks of material misstatement of the financial statements, whether due to error or fraud, and performing procedures that respond to those risks. Such procedures included examining, on a test basis, evidence regarding the amounts and disclosures in the financial statements. Our audits also included evaluating the accounting principles used and significant estimates made by management, as well as evaluating the overall presentation of the financial statements. Our procedures included confirmation of securities owned as of March 31, 2019 by correspondence with the custodian and brokers; when replies were not received from brokers, we performed other auditing procedures. We believe that our audits provide a reasonable basis for our opinion.
TAIT, WELLER & BAKER LLP
Philadelphia, Pennsylvania
May 9, 2019
6
SCHEDULE OF INVESTMENTS March 31, 2019
| Moody’s/ Standard & Poor’s Rating(a) | Principal Amount (000’s) | Value (Note 1) | ||||||||||
CORPORATE DEBT SECURITIES (75.70%) | ||||||||||||
AUTOMOTIVE (2.51%) | ||||||||||||
Ford Holdings LLC, Co. Gty., 9.30%, 03/01/30 | Baa3/BBB | $ | 1,000 | $ | 1,183,561 | |||||||
Ford Motor Co., Sr. Unsec. Notes, 8.90%, 01/15/32 | Baa3/BBB | 500 | 575,220 | |||||||||
Ford Motor Credit Co. LLC, Sr. Unsec. Notes, 2.343%, 11/02/20 | Baa3/BBB | 1,719 | 1,680,817 | |||||||||
General Motors Financial Co. Inc., Sr. Unsec. Notes, (3M LIBOR +1.10%), 3.838%, 11/06/21(e) | Baa3/BBB | 2,115 | 2,099,747 | |||||||||
|
| |||||||||||
| 5,539,345 | ||||||||||||
|
| |||||||||||
CHEMICALS (1.27%) | ||||||||||||
Nutrien, Ltd., Sr. Unsec. Notes, 4.20%, 04/01/29(b) | Baa2/BBB | 319 | 328,482 | |||||||||
Union Carbide Corp., Sr. Unsec. Notes, 7.75%, 10/01/96 | Baa2/BBB | 2,000 | 2,464,166 | |||||||||
|
| |||||||||||
| 2,792,648 | ||||||||||||
|
| |||||||||||
DIVERSIFIED FINANCIAL SERVICES (11.87%) | ||||||||||||
AerCap Ireland Capital DAC, Co. Gty., 4.45%, 04/03/26(b) | Baa3/BBB- | 317 | 317,537 | |||||||||
American Express Co., Sr. Unsec. Notes, 3.40%, 02/22/24(b) | A3/BBB+ | 2,151 | 2,185,617 | |||||||||
Bank of America Corp., Sr. Unsec. Notes, (3M LIBOR +0.79%), 3.004%, 12/20/23(b),(c) | A2/A- | 758 | 754,981 | |||||||||
Bank of America Corp., Sr. Unsec. Notes, (3M LIBOR +0.81%), 3.366%, 01/23/26(b),(c) | A2/A- | 559 | 559,392 | |||||||||
Barclays Bank PLC, Sr. Unsec. Notes, (3M LIBOR +0.46%), 3.259%, 01/11/21(b),(e) | A2/A | 1,233 | 1,224,914 | |||||||||
Barclays PLC, Sub. Notes, 4.836%, 05/09/28(b) | Ba1/BB+ | 906 | 896,228 | |||||||||
CDP Financial, Inc., Co. Gty., 4.40%, 11/25/19, 144A | Aaa/AAA | 400 | 404,533 | |||||||||
Citigroup, Inc., Sr. Unsec. Notes, (3M LIBOR +1.563%), 3.887%, 01/10/28(b),(c) | A3/BBB+ | 1,100 | 1,117,033 | |||||||||
Citigroup, Inc., Sr. Unsec. Notes, 8.125%, 07/15/39 | A3/BBB+ | 70 | 105,228 | |||||||||
Citigroup, Inc., Sub. Notes, 4.60%, 03/09/26 | Baa2/BBB | 988 | 1,032,062 | |||||||||
Citigroup, Inc., Sub. Notes, 5.30%, 05/06/44 | Baa2/BBB | 926 | 1,020,299 | |||||||||
Credit Agricole SA, Sub. Notes, (5Yr Swap +1.644%), 4.00%, 01/10/33, 144A(b),(c) | Baa2/BBB+ | 1,025 | 989,249 | |||||||||
Danske Bank A/S, Sr. Unsec. Notes, 5.00%, 01/12/22, 144A | Baa2/BBB+ | 739 | 757,873 | |||||||||
Discover Financial Services, Sr. Unsec. Notes, 10.25%, 07/15/19 | Baa3/BBB- | 200 | 204,010 | |||||||||
GE Capital International Funding, Co. Gty., 4.418%, 11/15/35 | Baa1/BBB+ | 588 | 543,598 | |||||||||
General Electric Co., Sr. Unsec. Notes, 6.875%, 01/10/39 | Baa1/BBB+ | 287 | 339,369 | |||||||||
General Electric Co., Sr. Unsec. Notes, 4.125%, 10/09/42 | Baa1/BBB+ | 940 | 815,749 | |||||||||
Goldman Sachs Group, Inc., Sr. Unsec. Notes, 3.50%, 11/16/26(b) | A3/BBB+ | 1,040 | 1,026,114 | |||||||||
Goldman Sachs Group, Inc., Sr. Unsec. Notes, (3M LIBOR +1.75%), 4.515%, 10/28/27(b),(e) | A3/BBB+ | 550 | 555,464 | |||||||||
HSBC Capital Funding LP, Co. Gty., (3M LIBOR +4.98%), 10.176%, 06/30/30, 144A(b),(c),(d) | Baa2/BBB- | 2,180 | 3,204,164 | |||||||||
JPMorgan Chase & Co., Jr. Sub. Notes, (3M LIBOR +2.58%), 4.625%, 11/01/22(b),(c),(d) | Baa2/BBB- | 1,159 | 1,077,870 | |||||||||
Lincoln Finance, Ltd., Sr. Sec. Notes, 7.375%, 04/15/21, 144A(b) | B1/BB+ | 225 | 229,387 | |||||||||
Morgan Stanley, Sub. Notes, 4.35%, 09/08/26 | Baa2/BBB | 1,500 | 1,538,913 | |||||||||
Nuveen LLC, Co. Gty., 4.00%, 11/01/28, 144A(b) | Aa2/AA | 642 | 684,858 | |||||||||
PNC Financial Services Group, Inc., Jr. Sub. Notes, (3M LIBOR +3.30%), 5.00%, 11/01/26(b),(c),(d) | Baa2/BBB- | 757 | 745,645 | |||||||||
Santander UK PLC, Sr. Unsec. Notes, (3M LIBOR +0.30%), 3.038%, 11/03/20(e) | Aa3/A | 1,623 | 1,620,908 | |||||||||
UBS AG, Sub. Notes, 7.625%, 08/17/22 | NR/BBB+ | 2,000 | 2,202,360 | |||||||||
|
| |||||||||||
| 26,153,355 | ||||||||||||
|
| |||||||||||
ENERGY (10.37%) | ||||||||||||
Andeavor Logistics LP, Co. Gty., 4.25%, 12/01/27(b) | Ba1/BBB- | 901 | 905,344 | |||||||||
Antero Midstream Partners LP, Sr. Unsec. Notes, 5.75%, 03/01/27, 144A(b) | Ba3/BB+ | 681 | 691,215 | |||||||||
CITGO Petroleum Corp., Sr. Sec. Notes, 6.25%, 08/15/22, 144A(b) | B3/B+ | 3,633 | 3,610,294 | |||||||||
Enbridge, Inc., Sr. Unsec. Notes, 5.50%, 12/01/46(b) | Baa2/BBB+ | 1,496 | 1,785,397 | |||||||||
Enbridge, Inc., Sub. Notes, (3M LIBOR +3.89%), 6.00%, 01/15/77(b),(c) | Ba1/BBB- | 750 | 744,375 | |||||||||
Enterprise Products Operating LLC, Co. Gty., (3M LIBOR +2.57%), 5.375%, 02/15/78(b),(c) | Baa2/BBB- | 342 | 305,081 | |||||||||
Florida Gas Transmission Co. LLC, Sr. Unsec. Notes, 9.19%, 11/01/24, 144A | Baa2/BBB+ | 60 | 67,477 | |||||||||
The accompanying notes are an integral part of these financial statements.
7
SCHEDULE OF INVESTMENTS — continued
| Moody’s/ Standard & Poor’s Rating(a) | Principal Amount (000’s) | Value (Note 1) | ||||||||||
CORPORATE DEBT SECURITIES (Continued) | ||||||||||||
ENERGY (Continued) | ||||||||||||
Kinder Morgan, Inc., Co. Gty., 8.05%, 10/15/30 | Baa2/BBB | $ | 1,000 | $ | 1,278,030 | |||||||
Kinder Morgan, Inc., Co. Gty., 5.55%, 06/01/45(b) | Baa2/BBB | 1,755 | 1,914,054 | |||||||||
Marathon Petroleum Corp., Sr. Unsec. Notes, 4.75%, 09/15/44(b) | Baa2/BBB | 1,266 | 1,260,364 | |||||||||
Marathon Petroleum Corp., Sr. Unsec. Notes, 5.85%, 12/15/45(b) | Baa2/BBB | 500 | 535,637 | |||||||||
MPLX LP, Sr. Unsec. Notes, 5.20%, 03/01/47(b) | Baa3/BBB | 641 | 650,414 | |||||||||
MPLX LP, Sr. Unsec. Notes, 5.50%, 02/15/49(b) | Baa3/BBB | 694 | 740,262 | |||||||||
MPLX LP, Sr. Unsec. Notes, 4.90%, 04/15/58(b) | Baa3/BBB | 561 | 527,743 | |||||||||
NGPL PipeCo LLC, Sr. Unsec. Notes, 7.768%, 12/15/37, 144A | Ba1/BBB- | 505 | 606,000 | |||||||||
Panhandle Eastern Pipe Line Co. LP, Sr. Unsec. Notes, 7.00%, 07/15/29 | Baa3/BBB- | 1,000 | 1,152,817 | |||||||||
Petroleos Mexicanos, Co. Gty., 8.00%, 05/03/19 | Baa3/BBB+ | 250 | 250,750 | |||||||||
Petroleos Mexicanos, Co. Gty., 6.00%, 03/05/20 | Baa3/BBB+ | 478 | 488,970 | |||||||||
Spectra Energy Partners LP, Co. Gty., 3.375%, 10/15/26(b) | Baa2/BBB+ | 803 | 789,748 | |||||||||
Sunoco LP, Co. Gty., 5.50%, 02/15/26(b) | B1/BB- | 700 | 693,000 | |||||||||
USA Compression Partners LP, Sr. Unsec. Notes, 6.875%, 09/01/27, 144A(b) | B3/B+ | 554 | 563,002 | |||||||||
Valero Energy Corp., Co. Gty., 8.75%, 06/15/30 | Baa2/BBB | 1,000 | 1,350,159 | |||||||||
Valero Energy Corp., Sr. Unsec. Notes, 10.50%, 03/15/39 | Baa2/BBB | 500 | 797,660 | |||||||||
Williams Cos., Inc., Sr. Unsec. Notes, 7.50%, 01/15/31 | Baa3/BBB | 911 | 1,144,247 | |||||||||
|
| |||||||||||
| 22,852,040 | ||||||||||||
|
| |||||||||||
FOOD AND BEVERAGE (1.49%) | ||||||||||||
Anheuser-Busch InBev Worldwide, Inc., Co. Gty., 4.70%, 02/01/36, 144A(b) | Baa1/A- | 645 | 644,346 | |||||||||
Anheuser-Busch InBev Worldwide, Inc., Co. Gty., 4.90%, 02/01/46, 144A(b) | Baa1/A- | 256 | 257,123 | |||||||||
Anheuser-Busch InBev Worldwide, Inc., Co. Gty., 8.20%, 01/15/39 | Baa1/A- | 27 | 37,471 | |||||||||
Campbell Soup Co., Sr. Unsec. Notes, 4.15%, 03/15/28(b) | Baa2/BBB- | 551 | 548,894 | |||||||||
General Mills, Inc., Sr. Unsec. Notes, 3.20%, 04/16/21 | Baa2/BBB | 220 | 221,908 | |||||||||
Grupo Bimbo SAB de CV, Sub. Notes, (H15T5Y +3.28%), 5.95%, 04/17/23, 144A(b),(c),(d) | Ba1/BB+ | 1,020 | 1,048,560 | |||||||||
Mars, Inc., Co. Gty., 3.95%, 04/01/49, 144A(b) | A1/NA | 518 | 523,531 | |||||||||
|
| |||||||||||
| 3,281,833 | ||||||||||||
|
| |||||||||||
GAMING, LODGING & LEISURE (0.96%) | ||||||||||||
Wyndham Destinations, Inc., Sr. Sec. Notes, 5.75%, 04/01/27(b) | Ba2/BB- | 2,140 | 2,122,666 | |||||||||
|
| |||||||||||
HEALTHCARE (0.17%) | ||||||||||||
Mylan NV, Co. Gty., 3.95%, 06/15/26(b) | Baa3/BBB- | 397 | 378,749 | |||||||||
|
| |||||||||||
INDUSTRIAL (2.94%) | ||||||||||||
3M Co., Sr. Unsec. Notes, 4.00%, 09/14/48(b) | A1/AA- | 1,019 | 1,066,017 | |||||||||
Altria Group, Inc., Co. Gty., 4.80%, 02/14/29(b) | A3/BBB | 527 | 543,287 | |||||||||
Altria Group, Inc., Co. Gty., 5.95%, 02/14/49(b) | A3/BBB | 329 | 353,035 | |||||||||
Elanco Animal Health, Inc., Sr. Unsec. Notes, 4.272%, 08/28/23, 144A(b) | Baa3/BB+ | 717 | 738,966 | |||||||||
General Dynamics Corp. Co. Gty., 2.875%, 05/11/20 | A2/A+ | 1,217 | 1,221,028 | |||||||||
Heathrow Funding, Ltd., Sr. Sec. Notes, 4.875%, 07/15/21, 144A | NA/A- | 200 | 205,325 | |||||||||
Northrop Grumman Space & Mission Systems Corp., Co. Gty., 7.75%, 06/01/29 | Baa1/BBB | 500 | 636,761 | |||||||||
Sydney Airport Finance Co. Property, Ltd., Sr. Sec. Notes, 3.375%, 04/30/25, 144A(b) | Baa1/BBB+ | 400 | 393,319 | |||||||||
TransDigm, Inc., Sr. Sec. Notes, 6.25%, 03/15/26, 144A(b) | Ba3/B+ | 641 | 667,602 | |||||||||
United Technologies Corp., Sr. Unsec. Notes, 3.75%, 11/01/46(b) | Baa1/BBB+ | 700 | 642,905 | |||||||||
|
| |||||||||||
| 6,468,245 | ||||||||||||
|
| |||||||||||
INSURANCE (10.02%) | ||||||||||||
Allstate Corp., Jr. Sub. Notes, (3M LIBOR +2.12%), 6.50%, 05/15/57(b),(c) | Baa1/BBB | 2,200 | 2,420,000 | |||||||||
American International Group, Inc., Jr. Sub. Notes, (3M LIBOR +4.195%), 8.175%, 05/15/58(b),(c) | Baa2/BBB- | 2,500 | 3,006,250 | |||||||||
Berkshire Hathaway Finance Corp., Co. Gty., 4.20%, 08/15/48(b) | Aa2/AA | 1,104 | 1,143,825 | |||||||||
Farmers Exchange Capital, Sub. Notes, 7.20%, 07/15/48, 144A | Baa2/BBB+ | 2,250 | 2,651,572 | |||||||||
Guardian Life Insurance Co. of America, Sub. Notes, 4.85%, 01/24/77, 144A | A1/AA- | 148 | 155,433 | |||||||||
The accompanying notes are an integral part of these financial statements.
8
SCHEDULE OF INVESTMENTS — continued
| Moody’s/ Standard & Poor’s Rating(a) | Principal Amount (000’s) | Value (Note 1) | ||||||||||
CORPORATE DEBT SECURITIES (Continued) | ||||||||||||
INSURANCE (Continued) | ||||||||||||
Liberty Mutual Group, Inc., Co. Gty., (3M LIBOR +2.905%), 5.516%, 03/15/37, 144A(b),(c) | Baa3/BB+ | $ | 1,530 | $ | 1,449,675 | |||||||
Liberty Mutual Group, Inc., Co. Gty., 7.00%, 03/15/34, 144A | Baa2/BBB | 250 | 309,679 | |||||||||
Liberty Mutual Group, Inc., Co. Gty., (3M LIBOR +7.12%), 10.75%, 06/15/58, 144A(b),(c) | Baa3/BB+ | 1,000 | 1,460,000 | |||||||||
Lincoln National Corp., Sr. Unsec. Notes, 3.80%, 03/01/28(b) | Baa1/A- | 250 | 253,356 | |||||||||
Massachusetts Mutual Life Insurance Co., Sub. Notes, 4.90%, 04/01/77, 144A | A1/AA- | 980 | 1,036,641 | |||||||||
Massachusetts Mutual Life Insurance Co., Sub. Notes, 8.875%, 06/01/39, 144A | A1/AA- | 151 | 237,377 | |||||||||
MetLife, Inc., Jr. Sub. Notes, 9.25%, 04/08/38, 144A(b) | Baa2/BBB | 500 | 672,500 | |||||||||
MetLife, Inc., Jr. Sub. Notes, 6.40%, 12/15/36(b) | Baa2/BBB | 637 | 683,182 | |||||||||
MetLife, Inc., Jr. Sub. Notes, 10.75%, 08/01/39(b) | Baa2/BBB | 1,000 | 1,510,000 | |||||||||
Nationwide Mutual Insurance Co., Sub. Notes, 8.25%, 12/01/31, 144A | A3/A- | 500 | 694,577 | |||||||||
Nationwide Mutual Insurance Co., Sub. Notes, 9.375%, 08/15/39, 144A | A3/A- | 215 | 338,976 | |||||||||
New York Life Insurance Co., Sub. Notes, 6.75%, 11/15/39, 144A | Aa2/AA- | 103 | 141,184 | |||||||||
Pricoa Global Funding, Inc., Sec. Notes, 2.45%, 09/21/22, 144A | A1/AA- | 608 | 601,023 | |||||||||
Prudential Financial, Inc., Jr. Sub. Notes, (3M LIBOR +2.665%), 5.70%, 09/15/48(b),(c) | Baa2/BBB+ | 1,241 | 1,255,954 | |||||||||
SAFG Retirement Services, Inc., Sr. Unsec. Notes, 8.125%, 04/28/23 | Baa1/BBB+ | 1,800 | 2,055,851 | |||||||||
|
| |||||||||||
| 22,077,055 | ||||||||||||
|
| |||||||||||
MEDIA (8.56%) | ||||||||||||
Charter Communications Operating LLC, Sr. Sec. Notes, 5.75%, 04/01/48(b) | Ba1/BBB- | 774 | 808,509 | |||||||||
Comcast Corp., Co. Gty., 3.70%, 04/15/24(b) | A3/A- | 1,080 | 1,115,667 | |||||||||
Comcast Corp., Co. Gty., 4.15%, 10/15/28(b) | A3/A- | 255 | 268,397 | |||||||||
Comcast Corp., Co. Gty., 4.70%, 10/15/48(b) | A3/A- | 297 | 321,980 | |||||||||
Comcast Corp., Co. Gty., 7.05%, 03/15/33 | A3/A- | 2,000 | 2,656,749 | |||||||||
Cox Communications, Inc., Sr. Unsec. Notes, 6.80%, 08/01/28 | Baa2/BBB | 1,500 | 1,757,154 | |||||||||
Cox Enterprises, Inc., Sr. Unsec. Notes, 7.375%, 07/15/27, 144A | Baa2/BBB- | 500 | 606,497 | |||||||||
CSC Holdings LLC, Co. Gty., 6.50%, 02/01/29, 144A(b) | Ba3/BB | 954 | 1,016,010 | |||||||||
Grupo Televisa SAB, Sr. Unsec. Notes, 5.00%, 05/13/45(b) | Baa1/BBB+ | 557 | 544,933 | |||||||||
Grupo Televisa SAB, Sr. Unsec. Notes, 6.625%, 01/15/40 | Baa1/BBB+ | 159 | 185,569 | |||||||||
RELX, Inc., Sr. Unsec. Notes, 8.875%, 06/01/22 | WR/BBB+ | 2,000 | 2,290,011 | |||||||||
Sirius XM Radio, Inc., Co. Gty., 5.00%, 08/01/27, 144A(b) | Ba3/BB | 518 | 518,311 | |||||||||
Time Warner Entertainment Co. LP, Sr. Sec. Notes, 8.375%, 07/15/33 | Ba1/BBB- | 1,360 | 1,773,182 | |||||||||
Viacom, Inc., Sr. Unsec. Notes, 6.875%, 04/30/36 | Baa3/BBB- | 179 | 210,031 | |||||||||
VTR Finance BV, Sr. Sec. Notes, 6.875%, 01/15/24, 144A(b) | B1/B+ | 2,176 | 2,230,400 | |||||||||
Walt Disney Co., Co. Gty., 7.90%, 12/01/95, 144A | A2/A | 1,400 | 2,548,743 | |||||||||
|
| |||||||||||
| 18,852,143 | ||||||||||||
|
| |||||||||||
MINING (1.96%) | ||||||||||||
BHP Billiton Finance USA, Ltd. Co. Gty., (5Yr Swap +5.093%), 6.75%, 10/19/75, 144A(b),(c) | Baa1/BBB+ | 3,899 | 4,316,388 | |||||||||
|
| |||||||||||
PAPER (1.63%) | ||||||||||||
Smurfit Kappa Treasury Funding, Ltd., Co. Gty., 7.50%, 11/20/25 | Ba1/BB+ | 2,000 | 2,280,000 | |||||||||
WestRock LLC, Co. Gty., 8.20%, 01/15/30 | Baa2/BBB | 1,000 | 1,306,828 | |||||||||
|
| |||||||||||
| 3,586,828 | ||||||||||||
|
| |||||||||||
TECHNOLOGY (2.51%) | ||||||||||||
Broadcom, Inc., Co. Gty., 4.25%, 04/15/26, 144A(b) | Baa3/BBB- | 1,655 | 1,642,769 | |||||||||
Broadcom, Inc., Co. Gty., 4.75%, 04/15/29, 144A(b) | Baa3/BBB- | 1,655 | 1,647,139 | |||||||||
NXP Funding LLC, Co. Gty., 3.875%, 09/01/22, 144A | Baa3/BBB- | 2,213 | 2,244,270 | |||||||||
|
| |||||||||||
| 5,534,178 | ||||||||||||
|
| |||||||||||
The accompanying notes are an integral part of these financial statements.
9
SCHEDULE OF INVESTMENTS — continued
| Moody’s/ Standard & Poor’s Rating(a) | Principal Amount (000’s) | Value (Note 1) | ||||||||||
CORPORATE DEBT SECURITIES (Continued) | ||||||||||||
TELECOMMUNICATIONS (5.39%) | ||||||||||||
AT&T, Inc., Sr. Unsec. Notes, 4.50%, 05/15/35(b) | Baa2/BBB | $ | 515 | $ | 507,385 | |||||||
AT&T, Inc., Sr. Unsec. Notes, 4.75%, 05/15/46(b) | Baa2/BBB | 425 | 415,304 | |||||||||
Centel Capital Corp., Co. Gty., 9.00%, 10/15/19 | Ba2/BBB- | 1,000 | 1,029,669 | |||||||||
Deutsche Telekom International Finance BV, Co. Gty., 8.75%, 06/15/30(f) | Baa1/BBB+ | 2,000 | 2,751,299 | |||||||||
Millicom International Cellular SA, Sr. Unsec. Notes, 6.25%, 03/25/29, 144A(b) | Ba2/NA | 566 | 575,797 | |||||||||
Sprint Capital Corp., Co. Gty., 6.875%, 11/15/28 | B3/B | 500 | 480,625 | |||||||||
Sprint Capital Corp., Co. Gty., 8.75%, 03/15/32 | B3/B | 1,000 | 1,055,100 | |||||||||
Sprint Spectrum Co. LLC, Sr. Sec. Notes, 4.738%, 03/20/25, 144A | Baa2/NA | 1,100 | 1,112,375 | |||||||||
Tencent Holdings, Ltd., Sr. Unsec. Notes, 3.595%, 01/19/28, 144A(b) | A1/A+ | 1,954 | 1,927,867 | |||||||||
Verizon Communications, Inc., Sr. Unsec. Notes, 4.812%, 03/15/39 | Baa1/BBB+ | 1,898 | 2,033,151 | |||||||||
|
| |||||||||||
| 11,888,572 | ||||||||||||
|
| |||||||||||
TRANSPORTATION (5.12%) | ||||||||||||
American Airlines, Pass Through Certs., Series2013-2, Class B, 5.60%, 07/15/20, 144A | NA/BBB- | 1,136 | 1,152,946 | |||||||||
American Airlines, Pass Through Certs., Series2017-1, Class AA, 3.65%, 02/15/29 | Aa3/NA | 992 | 996,408 | |||||||||
American Airlines, Pass Through Certs., Series2017-2, Class AA, 3.35%, 10/15/29 | Aa3/NA | 1,544 | 1,508,276 | |||||||||
BNSF Funding Trust I, Co. Gty., (3M LIBOR +2.35%), 6.613%, 12/15/55(b),(c) | Baa2/A | 250 | 270,000 | |||||||||
British Airways, Pass Through Certs., Series2013-1, Class B, 5.625%, 06/20/20, 144A | A3/A- | 395 | 401,261 | |||||||||
Continental Airlines, Pass Through Certs., Series2000-1, Class A1, 8.048%, 11/01/22 | Baa1/A | 283 | 291,019 | |||||||||
Continental Airlines, Pass Through Certs., Series2000-2, Class A1, 7.707%, 04/02/21 | Baa1/BBB+ | 196 | 201,932 | |||||||||
ERAC USA Finance LLC, Co. Gty., 7.00%, 10/15/37, 144A | Baa1/A- | 1,500 | 1,924,260 | |||||||||
JSL Europe SA, Co. Gty., 7.75%, 07/26/24, 144A(b) | NA/BB- | 713 | 704,230 | |||||||||
Penske Truck Leasing Co. LP, Sr. Unsec. Notes, 3.65%, 07/29/21, 144A(b) | Baa2/BBB | 669 | 678,042 | |||||||||
Ryder System, Inc., Sr. Unsec. Notes, 3.50%, 06/01/21 | Baa1/NA | 941 | 949,686 | |||||||||
Union Pacific Corp., Sr. Unsec. Notes, 4.50%, 09/10/48(b) | Baa1/A- | 503 | 533,868 | |||||||||
United Airlines, Pass Through Certs., Series2013-1, Class B, 5.375%, 08/15/21 | NA/BBB | 293 | 300,950 | |||||||||
United Airlines, Pass Through Certs., Series2018-1, Class B, 4.60%, 03/01/26 | Baa2/NA | 871 | 884,204 | |||||||||
United Airlines, Pass Through Certs., Series2019-1, Class AA, 4.15%, 08/25/31 | Aa3/NA | 471 | 487,653 | |||||||||
|
| |||||||||||
| 11,284,735 | ||||||||||||
|
| |||||||||||
UTILITIES (8.93%) | ||||||||||||
AES Gener SA, Jr. Sub. Notes, (5Yr Swap +4.644%), 7.125%, 03/26/79, 144A(b),(c) | Ba2/BB | 506 | 517,385 | |||||||||
Black Hills Corp., Sr. Unsec. Notes, 3.95%, 01/15/26(b) | Baa2/BBB+ | 1,082 | 1,099,129 | |||||||||
Cleveland Electric Illuminating Co., Sr. Unsec. Notes, 3.50%, 04/01/28, 144A(b) | Baa3/BBB | 800 | 785,530 | |||||||||
Duke Energy Carolinas LLC, 3.95%, 11/15/28(b) | Aa2/A | 1,185 | 1,261,747 | |||||||||
Duquesne Light Holdings, Inc., Sr. Unsec. Notes, 6.40%, 09/15/20, 144A | Baa3/BBB- | 1,000 | 1,043,799 | |||||||||
Enel Finance International NV, Co. Gty., 2.75%, 04/06/23, 144A | Baa2/BBB+ | 1,082 | 1,047,416 | |||||||||
Enel Finance International NV, Co. Gty., 4.625%, 09/14/25, 144A | Baa2/BBB+ | 1,458 | 1,507,935 | |||||||||
Exelon Corp., Sr. Unsec. Notes, 3.40%, 04/15/26(b) | Baa2/BBB | 505 | 504,887 | |||||||||
FirstEnergy Corp., Sr. Unsec. Notes, 4.85%, 07/15/47(b) | Baa3/BBB- | 1,570 | 1,683,657 | |||||||||
Hydro-Quebec, 8.25%, 04/15/26 | Aa2/AA- | 1,550 | 2,062,552 | |||||||||
Kansas City Power & Light Co., Sr. Unsec. Notes, 4.20%, 06/15/47(b) | A2/A | 917 | 954,509 | |||||||||
MidAmerican Funding LLC, Sr. Sec. Notes, 6.927%, 03/01/29 | A2/A- | 500 | 635,448 | |||||||||
NiSource, Inc., Jr. Sub. Notes, (H15T5Y +2.843%), 5.65%, 06/15/23(b),(c),(d) | NA/BBB- | 696 | 678,600 | |||||||||
Ohio Power Co., Sr. Unsec. Notes, 5.375%, 10/01/21 | A2/A- | 1,000 | 1,065,072 | |||||||||
South Carolina Electric & Gas, Co., 4.25%, 08/15/28(b) | Baa1/A | 619 | 668,287 | |||||||||
Southern Co. Gas Capital Corp., Co. Gty., 5.875%, 03/15/41(b) | Baa1/A- | 992 | 1,178,590 | |||||||||
Southern Co. Gas Capital Corp., Co. Gty., 3.95%, 10/01/46(b) | Baa1/A- | 539 | 505,530 | |||||||||
Southern Co. Gas Capital Corp., Co. Gty., 4.40%, 05/30/47(b) | Baa1/A- | 1,164 | 1,169,879 | |||||||||
Toledo Edison Co., 7.25%, 05/01/20 | Baa1/A- | 80 | 83,285 | |||||||||
The accompanying notes are an integral part of these financial statements.
10
SCHEDULE OF INVESTMENTS — continued
| Moody’s/ Standard & Poor’s Rating(a) | Principal Amount (000’s) | Value (Note 1) | ||||||||||
CORPORATE DEBT SECURITIES (Continued) | ||||||||||||
UTILITIES (Continued) | ||||||||||||
Transelec SA, Sr. Unsec. Notes, 4.25%, 01/14/25, 144A(b) | Baa1/BBB | $ | 750 | $ | 756,945 | |||||||
Transelec SA, Sr. Unsec. Notes, 3.875%, 01/12/29, 144A(b) | Baa1/BBB | 490 | 471,630 | |||||||||
|
| |||||||||||
| 19,681,812 | ||||||||||||
|
| |||||||||||
TOTAL CORPORATE DEBT SECURITIES (Cost of $155,123,630) | 166,810,592 | |||||||||||
|
| |||||||||||
ASSET BACKED SECURITIES (11.87%) | ||||||||||||
Antares Ltd., Series2017-1A, Class C, (3M LIBOR +3.10%), 5.861%, 07/20/28, 144A(b),(e) | NR/A | 1,093 | 1,069,367 | |||||||||
Arbor Realty Collateralized Loan Obligation, Ltd., Series2017-FL3, Class A, (1M LIBOR +0.99%), 3.474%, 12/15/27, 144A(b),(e) | Aaa/NA | 759 | 756,628 | |||||||||
Arbor Realty Commercial Real Estate Notes, Ltd., Series2017-FL2, Class A, (1M LIBOR +0.99%), 3.474%, 08/15/27, 144A(b),(e) | Aaa/NA | 623 | 621,053 | |||||||||
AVIS Budget Rental Car Funding AESOP LLC, Series2015-2A, Class A, 2.63%, 12/20/21, 144A(b) | Aaa/NA | 1,605 | 1,596,462 | |||||||||
BCC Funding LLC, Series2018-1A, Class A2, 2.96%, 06/20/23, 144A(b) | Aa2/NA | 550 | 550,417 | |||||||||
CLI Funding LLC, Series2018-1A, Class A, 4.03%, 04/18/43, 144A(b) | NA/A | 151 | 152,281 | |||||||||
DB Master Finance LLC, Series2017-1A, Class A2I, 3.629%, 11/20/47, 144A(b) | NA/BBB | 332 | 332,029 | |||||||||
DRB Prime Student Loan Trust, Series2016-B, Class A2, 2.89%, 06/25/40, 144A(b) | Aaa/NA | 269 | 268,614 | |||||||||
DRB Prime Student Loan Trust, Series2017-A, Class A2B, 2.85%, 05/27/42, 144A(b) | Aaa/NA | 2,077 | 2,050,177 | |||||||||
DT Auto Owner Trust, Series2018-2A, Class C, 3.67%, 03/15/24, 144A(b) | NA/A | 781 | 786,147 | |||||||||
DT Auto Owner Trust, Series2019-1A, Class A, 3.08%, 09/15/22, 144A(b) | NA/AAA | 1,009 | 1,010,269 | |||||||||
Golub Capital Partners Ltd., Series 2017-19RA, Class B, (3M LIBOR +2.55%), 5.315%, 07/26/29, 144A(b),(e) | A2/NA | 1,935 | 1,895,396 | |||||||||
Golub Capital Partners Ltd., Series2018-36A, Class C, (3M LIBOR +2.10%), 4.833%, 02/05/31, 144A(b),(e) | NA/A | 2,250 | 2,107,753 | |||||||||
IVY Hill Middle Market Credit Fund Ltd., Series 12A, Class B, (3M LIBOR +3.00%), 5.761%, 07/20/29, 144A(b),(e) | A3/NR | 866 | 836,768 | |||||||||
LoanCore Issuer, Ltd., Series 2018-CRE1, Class A, (1M LIBOR +1.13%), 3.614%, 05/15/28, 144A(b),(e) | Aaa/NA | 500 | 499,562 | |||||||||
Navient Private Education Loan Trust, Series2017-A, Class A2B, (1M LIBOR+0.90%), 3.384%, 12/16/58, 144A(b),(e) | NA/AAA | 782 | 780,633 | |||||||||
NextGear Floorplan Master Owner Trust, Series2017-1A, Class A2, 2.54%, 04/18/22, 144A(b) | Aaa/AAA | 1,460 | 1,455,146 | |||||||||
Option One Mortgage Loan Trust, Series 2007-FXD2, Class 2A1, 5.90%, 03/25/37(b),(f) | Ca/AA | 29 | 28,972 | |||||||||
SCF Equipment Leasing LLC, Series2017-2A, Class A, 3.41%, 12/20/23, 144A(b) | A2/NA | 377 | 377,440 | |||||||||
Small Business Administration Participation Certificates, Series2010-20F, Class 1, 3.88%, 06/01/30 | Aaa/AA+ | 114 | 117,607 | |||||||||
SMB Private Education Loan Trust, Series2017-B, Class A2B, (1M LIBOR+0.75%), 3.234%, 10/15/35, 144A(b),(e) | Aaa/AAA | 845 | 845,163 | |||||||||
Sofi Consumer Loan Program LLC, Series2017-3, Class A, 2.77%, 05/25/26, 144A(b) | NA/AA | 761 | 758,948 | |||||||||
Sofi Consumer Loan Program Trust, Series2018-1, Class B, 3.65%, 02/25/27, 144A(b) | NA/A | 793 | 801,526 | |||||||||
Sofi Professional Loan Program LLC, Series2019-A, Class A1FX, 3.18%, 06/15/48, 144A(b) | Aaa/AAA | 312 | 313,675 | |||||||||
Sofi Professional Loan Program Ltd., Series2017-C, Class B, 3.56%, 07/25/40, 144A(b),(e) | NA/A+ | 1,099 | 1,090,721 | |||||||||
Spirit Master Funding LLC, Series2014-2A, Class A, 5.76%, 03/20/41, 144A(b) | NA/A+ | 1,514 | 1,564,288 | |||||||||
Tesla Auto Lease Trust, Series2018-B, Class A, 3.71%, 08/20/21, 144A(b) | Aaa/NA | 371 | 375,266 | |||||||||
Textainer Marine Containers Ltd., Series2017-1A, Class A, 3.72%, 05/20/42, 144A(b) | NA/A | 587 | 585,932 | |||||||||
Triton Container Finance LLC, Series2017-2A, Class A, 3.62%, 08/20/42, 144A(b) | NA/A | 1,057 | 1,050,264 | |||||||||
Willis Engine Structured Trust IV, Series2018-A, Class A, 4.75%, 09/15/43, 144A(b),(f) | NA/A | 1,454 | 1,484,716 | |||||||||
|
| |||||||||||
TOTAL ASSET BACKED SECURITIES (Cost of $26,410,140) | 26,163,220 | |||||||||||
|
| |||||||||||
The accompanying notes are an integral part of these financial statements.
11
SCHEDULE OF INVESTMENTS — continued
| Moody’s/ Standard & Poor’s Rating(a) | Principal Amount (000’s) | Value (Note 1) | ||||||||||
COMMERCIAL MORTGAGE-BACKED SECURITIES (4.44%) | ||||||||||||
Angel Oak Mortgage Trust I LLC, Series2019-2, Class A1, 3.628%, 03/25/49, 144A(b),(e) | NA/NA | $ | 340 | $ | 341,070 | |||||||
Bancorp Commercial Mortgage Trust, Series 2018-CRE4, Class A, (1M LIBOR +0.90%), 3.384%, 09/15/35, 144A(b),(e) | Aaa/NA | 119 | 118,207 | |||||||||
Bellemeade Re Ltd., Series2018-2A, Class M1B, (1M LIBOR +1.35%), 3.836%, 08/25/28, 144A(b),(e) | NA/NA | 484 | 484,137 | |||||||||
CGMS Commercial Mortgage Trust, Series 2017-MDRB, Class A, (1M LIBOR +1.10%), 3.584%, 07/15/30, 144A(e) | NA/AAA | 71 | 70,982 | |||||||||
Citigroup Commercial Mortgage Trust, Series 2013-375P, Class D, 3.518%, 05/10/35, 144A(e) | Baa1/NA | 2,000 | 1,991,487 | |||||||||
Citigroup Commercial Mortgage Trust, Series2016-P6, Class C, 4.284%, 12/10/49(b),(e) | NR/NA | 367 | 362,269 | |||||||||
FREMF Mortgage Trust, Series2015-K44, Class B, 3.683%, 01/25/48, 144A(b),(e) | NA/NA | 535 | 540,146 | |||||||||
FREMF Mortgage Trust, Series2015-K45, Class B, 3.591%, 04/25/48, 144A(b),(e) | NA/NA | 1,270 | 1,272,964 | |||||||||
Lanark Master Issuer PLC, Series2019-1A, Class 1A1, (3M LIBOR +0.77%), 3.467%, 12/22/69, 144A(b),(e) | Aaa/AAA | 552 | 553,411 | |||||||||
LMREC, Inc., Series 2015-CRE1, Class AR, (1M LIBOR +0.98%), 3.471%, 02/22/32, 144A(b),(e) | Aaa/NA | 688 | 681,660 | |||||||||
LMREC, Inc., Series 2016-CRE2, Class A, (1M LIBOR +1.70%), 4.19%, 11/24/31, 144A(b),(e) | Aaa/NA | 596 | 595,705 | |||||||||
Morgan Stanley Bank of America Merrill Lynch Trust, Series 2012-CKSV, Class C, 4.287%, 10/15/30, 144A(e) | NA/A+ | 2,710 | 2,695,820 | |||||||||
MSDB Trust, Series 2017-712F, Class C, 3.628%, 07/11/39, 144A(e) | NA/A- | 82 | 81,110 | |||||||||
|
| |||||||||||
TOTAL COMMERCIAL MORTGAGE-BACKED SECURITIES (Cost of $9,721,894) | 9,788,968 | |||||||||||
|
| |||||||||||
RESIDENTIAL MORTGAGE-BACKED SECURITIES (0.20%) | ||||||||||||
FHLMC Pool # A15675, 6.00%, 11/01/33 | Aaa/AA+ | 84 | 92,496 | |||||||||
FHLMC Pool # G00182, 9.00%, 09/01/22(g) | Aaa/AA+ | — | 31 | |||||||||
FNMA Pool # 754791, 6.50%, 12/01/33 | Aaa/AA+ | 208 | 229,448 | |||||||||
FNMA Pool # 763852, 5.50%, 02/01/34 | Aaa/AA+ | 90 | 98,834 | |||||||||
GNSF Pool # 194228, 9.50%, 11/15/20 | Aaa/AA+ | 3 | 2,587 | |||||||||
GNSF Pool # 307527, 9.00%, 06/15/21 | Aaa/AA+ | 4 | 3,918 | |||||||||
GNSF Pool # 417239, 7.00%, 02/15/26 | Aaa/AA+ | 5 | 5,267 | |||||||||
GNSF Pool # 780374, 7.50%, 12/15/23 | Aaa/AA+ | 2 | 2,579 | |||||||||
|
| |||||||||||
TOTAL RESIDENTIAL MORTGAGE-BACKED SECURITIES (Cost of $367,187) | 435,160 | |||||||||||
|
| |||||||||||
MUNICIPAL BONDS (1.11%) | ||||||||||||
San Francisco City & County Public Utilities Commission, Water Revenue, Build America Bonds, 6.00%, 11/01/40 | Aa3/AA- | 145 | 183,144 | |||||||||
State of California, Build America Bonds, GO, 7.625%, 03/01/40 | Aa3/AA- | 1,500 | 2,272,020 | |||||||||
|
| |||||||||||
TOTAL MUNICIPAL BONDS (Cost of $1,679,243) | 2,455,164 | |||||||||||
|
| |||||||||||
U.S. TREASURY SECURITIES (4.74%) | ||||||||||||
United States Treasury Bond, 3.50%, 02/15/39 | Aaa/AA+ | 2,603 | 2,949,310 | |||||||||
United States Treasury Bond, 3.00%, 02/15/49 | Aaa/AA+ | 1,992 | 2,063,795 | |||||||||
United States Treasury Floating Rate Note, (US Treasury +0.043%), 2.438%, 07/31/20(e) | Aaa/AA+ | 3,090 | 3,087,138 | |||||||||
United States Treasury Note, 2.50%, 01/31/24 | Aaa/AA+ | 511 | 516,948 | |||||||||
United States Treasury Note, 2.375%, 02/29/24 | Aaa/AA+ | 228 | 229,487 | |||||||||
United States Treasury Note, 2.50%, 02/28/26 | Aaa/AA+ | 267 | 270,035 | |||||||||
United States Treasury Note, 3.125%, 11/15/28 | Aaa/AA+ | 1,246 | 1,321,791 | |||||||||
|
| |||||||||||
TOTAL U.S. TREASURY SECURITIES (Cost of $10,186,826) | 10,438,504 | |||||||||||
|
| |||||||||||
GOVERNMENT BONDS (0.84%) | ||||||||||||
Colombia Government International Bond, Sr. Unsec. Notes, 5.20%, 05/15/49(b) | Baa2/BBB- | 508 | 546,507 | |||||||||
Perusahaan Penerbit SBSN Indonesia III, Sr. Unsec. Notes, 4.45%, 02/20/29, 144A | Baa2/BBB- | 424 | 436,224 | |||||||||
The accompanying notes are an integral part of these financial statements.
12
SCHEDULE OF INVESTMENTS — continued
| Moody’s/ Standard & Poor’s Rating(a) | Principal Amount (000’s) | Value (Note 1) | ||||||||||
GOVERNMENT BONDS (Continued) | ||||||||||||
Qatar Government International Bond, Sr. Unsec. Notes, 4.00%, 03/14/29, 144A | Aa3/AA- | $ | 842 | $ | 867,775 | |||||||
|
| |||||||||||
TOTAL GOVERNMENT BOND (Cost of $1,769,561) | 1,850,506 | |||||||||||
|
| |||||||||||
| Shares | ||||||||||||
PREFERRED STOCK (1.16%) | ||||||||||||
CoBank ACB, Series F, 6.250%, (3M LIBOR +4.557%)(b),(c) | 20,000 | 2,065,000 | ||||||||||
US BANCORP, Series A, 3.500%, (3M LIBOR +1.02%)(b),(e) | 615 | 489,620 | ||||||||||
|
| |||||||||||
TOTAL PREFERRED STOCK (Cost of $2,521,650) | 2,554,620 | |||||||||||
|
| |||||||||||
TOTAL INVESTMENTS (100.06%) | ||||||||||||
(Cost $207,780,131) | 220,496,734 | |||||||||||
|
| |||||||||||
OTHER ASSETS AND LIABILITIES ((0.06)%) | (141,385 | ) | ||||||||||
|
| |||||||||||
NET ASSETS (100.00%) | $ | 220,355,349 | ||||||||||
|
| |||||||||||
At March 31, 2019, the Fund had the following open futures contracts:
| Long Futures Outstanding | Expiration Month | Number of Contracts | Notional Amount | Value | Unrealized Appreciation (Depreciation) | |||||||||||||||
U.S. Treasury 5-Year Notes | 06/19 | 22 | $ | 2,525,875 | $ | 2,548,219 | $ | 22,344 | ||||||||||||
U.S. Treasury Ultra Bonds | 06/19 | 24 | 3,884,148 | 4,032,000 | 147,852 | |||||||||||||||
|
| |||||||||||||||||||
| 170,196 | ||||||||||||||||||||
|
| |||||||||||||||||||
| Short Futures Outstanding | ||||||||||||||||||||
U.S. Treasury 10-Year Notes | 06/19 | 42 | (5,135,681 | ) | (5,217,188 | ) | (81,507 | ) | ||||||||||||
U.S. Treasury Ultra 10-Year Notes | 06/19 | 10 | (1,328,210 | ) | (1,327,813 | ) | 397 | |||||||||||||
|
| |||||||||||||||||||
| (81,110 | ) | |||||||||||||||||||
|
| |||||||||||||||||||
Net unrealized appreciation on open futures contracts | $ | 89,086 | ||||||||||||||||||
|
| |||||||||||||||||||
| (a) | Ratings for debt securities are unaudited. All ratings are as of March 31, 2019 and may have changed subsequently. |
| (b) | This security is callable. |
| (c) | Fixed to floating rate security. Fixed rate indicated is rate effective at March 31, 2019. Security will convert at a future date to a floating rate of reference rate and spread in the description above. |
| (d) | Security is perpetual. Date shown is next call date. |
| (e) | Variable rate security. Rate indicated is rate effective at March 31, 2019. |
| (f) | Multi-Step Coupon. Rate disclosed is as of March 31, 2019. |
| (g) | Principal amount less than $1,000. |
| 144A | Securities were purchased pursuant to Rule 144A under the Securities Act of 1933 and may not be resold subject to that rule except to qualified institutional buyers. At March 31, 2019, these securities amounted to $94,160,745 or 42.73% of net assets. |
Legend
Certs. - Certificates
Co. Gty. - Company Guaranty
FHLMC - Federal Home Loan Mortgage Corp.
FNMA - Federal National Mortgage Association
FREMF - Freddie Multi-Family
GNSF - Government National Mortgage Association (Single Family)
GO - General Obligation
The accompanying notes are an integral part of these financial statements.
13
SCHEDULE OF INVESTMENTS — continued
H15T5Y - US Treasury Yield Curve Rate T Note Constant Maturity 5 Year
Jr. - Junior
LIBOR - London Interbank Offered Rate
LLC - Limited Liability Company
LP - Limited Partnership
Ltd. - Limited
Sec. - Secured
Sr. - Senior
Sub. - Subordinated
Unsec. - Unsecured
Following is a description of the valuation techniques applied to the Fund’s major categories of assets measured at fair value on a recurring basis as of March 31, 2019.
| Assets: | Total Market Value at 03/31/19 | Level 1 Quoted Price | Level 2 Significant Observable Inputs | Level 3 Significant Unobservable Inputs | ||||||||||||
CORPORATE DEBT SECURITIES | $ | 166,810,592 | $ | — | $ | 166,810,592 | $ | — | ||||||||
ASSET BACKED SECURITIES | 26,163,220 | — | 26,163,220 | — | ||||||||||||
COMMERCIAL MORTGAGE-BACKED SECURITIES | 9,788,968 | — | 9,788,968 | — | ||||||||||||
RESIDENTIAL MORTGAGE-BACKED SECURITIES | 435,160 | — | 435,160 | — | ||||||||||||
MUNICIPAL BONDS | 2,455,164 | — | 2,455,164 | — | ||||||||||||
U.S. TREASURY SECURITIES | 10,438,504 | — | 10,438,504 | — | ||||||||||||
GOVERNMENT BOND | 1,850,506 | — | 1,850,506 | — | ||||||||||||
PREFERRED STOCK | 2,554,620 | 2,554,620 | — | — | ||||||||||||
FUTURES CONTRACTS | 170,593 | 170,593 | — | — | ||||||||||||
TOTAL INVESTMENTS | $ | 220,667,327 | $ | 2,725,213 | $ | 217,942,114 | $ | — | ||||||||
| Liabilities: | ||||||||||||||||
FUTURES CONTRACTS | $ | 81,507 | $ | 81,507 | $ | — | $ | — | ||||||||
The accompanying notes are an integral part of these financial statements.
14
STATEMENT OF ASSETS AND LIABILITIES
March 31, 2019
Assets: | ||||
Investment in securities, at value (amortized cost $207,780,131) (Note 1) | $ | 220,496,734 | ||
Cash | 105,734 | |||
Interest receivable | 2,446,401 | |||
Receivables for investments sold | 2,239,795 | |||
Receivable from broker—variation margin on open futures contracts | 170,593 | |||
Receivable from affiliates | 42,773 | |||
Dividend receivable | 37,104 | |||
Deposits with brokers for open futures contracts | 21,786 | |||
Prepaid expenses | 4,462 | �� | ||
|
| |||
TOTAL ASSETS | $ | 225,565,382 | ||
|
| |||
Liabilities: | ||||
Securities purchased | 4,916,414 | |||
Payable to the Adviser | 82,321 | |||
Payable to broker—variation margin on futures contracts | 81,507 | |||
Payable to administration and accounting | 15,925 | |||
Payable to transfer agency | 14,532 | |||
Payable to custodian | 1,753 | |||
Accrued expenses payable | 97,581 | |||
|
| |||
TOTAL LIABILITIES | 5,210,033 | |||
|
| |||
Net assets: (equivalent to $20.57 per share based on 10,710,035 shares of capital stock outstanding) | $ | 220,355,349 | ||
|
| |||
NET ASSETS consisted of: | ||||
Par value | $ | 107,100 | ||
Capitalpaid-in | 206,576,085 | |||
Distributable earnings | 13,672,164 | |||
|
| |||
| $ | 220,355,349 | |||
|
|
The accompanying notes are an integral part of these financial statements.
15
STATEMENT OF OPERATIONS
For the year ended March 31, 2019
Investment Income: | ||||||||
Interest |
| $ | 10,602,509 | |||||
Dividends |
| 147,377 | ||||||
|
| |||||||
Total Investment Income |
| 10,749,886 | ||||||
|
| |||||||
Expenses: | ||||||||
Investment advisory fees (Note 4) | $ | 958,834 | ||||||
Administration fees | 184,471 | |||||||
Trustees’ fees (Note 4) | 117,530 | |||||||
Legal fees and expenses | 87,325 | |||||||
Reports to shareholders | 81,077 | |||||||
Transfer agent fees | 45,878 | |||||||
Excise Tax | 42,773 | |||||||
Insurance | 42,112 | |||||||
Audit fees | 28,500 | |||||||
CCO fees (Note 4) | 26,352 | |||||||
Custodian fees | 24,979 | |||||||
NYSE fee | 18,834 | |||||||
Miscellaneous | 59,035 | |||||||
|
| |||||||
Total Expenses |
| 1,717,700 | ||||||
|
| |||||||
Expense reimbursement from affiliates |
| (42,773 | ) | |||||
Expense reimbursement from the Adviser |
| (26,294 | ) | |||||
|
| |||||||
Total Expense Reimbursements |
| (69,067 | ) | |||||
Net Expenses |
| 1,648,633 | ||||||
|
| |||||||
Net Investment Income |
| 9,101,253 | ||||||
|
| |||||||
Realized and unrealized gain (loss) from: |
| |||||||
Net realized gain from: |
| |||||||
Investment securities |
| 63,994 | ||||||
Futures contracts |
| 45,013 | ||||||
|
| |||||||
Net Realized Gain |
| 109,007 | ||||||
Change in net unrealized appreciation (depreciation) of: |
| |||||||
Investment securities |
| (645,454 | ) | |||||
Futures contracts |
| 217,508 | ||||||
|
| |||||||
Change in Net Unrealized Appreciation (Depreciation) |
| (427,946 | ) | |||||
Net loss on investments and futures contracts |
| (318,939 | ) | |||||
|
| |||||||
Net increase in net assets resulting from operations |
| $ | 8,782,314 | |||||
|
| |||||||
The accompanying notes are an integral part of these financial statements.
16
STATEMENTS OF CHANGES IN NET ASSETS
| Year ended March 31, 2019 | Year ended March 31, 2018 | |||||||
Increase (decrease) in net assets: | ||||||||
Operations: | ||||||||
Net investment income | $ | 9,101,253 | $ | 9,337,729 | ||||
Net realized gain | 109,007 | 3,316,729 | ||||||
Change in unrealized depreciation | (427,946 | ) | (3,619,953 | ) | ||||
|
|
|
| |||||
Net increase in net assets resulting from operations | 8,782,314 | 9,034,505 | ||||||
|
|
|
| |||||
Distributions(1): | ||||||||
From distributed earnings | (8,568,028 | ) | — | |||||
From net investment income | — | (8,568,027 | ) | |||||
From realized gains | — | (2,583,260 | ) | |||||
|
|
|
| |||||
Total Distributions | (8,568,028 | ) | (11,151,287 | ) | ||||
|
|
|
| |||||
Increase (decrease) in net assets | 214,286 | (2,116,782 | ) | |||||
Net Assets: | ||||||||
Beginning of year | 220,141,063 | 222,257,845 | ||||||
|
|
|
| |||||
End of year | $ | 220,355,349 | $ | 220,141,063 | ||||
|
|
|
| |||||
Accumulated net investment loss(1) | $ | N/A | $ | (1,347,857 | ) | |||
|
|
|
| |||||
| (1) | The presentation of Distributions and Accumulated net investment loss have been updated to reflect the changes prescribed in amendments toRegulation S-X, effective November 5, 2018. The March 31, 2018 presentation was not revised. |
The accompanying notes are an integral part of these financial statements.
17
FINANCIAL HIGHLIGHTS
The table below sets forth financial data for a share of capital stock outstanding throughout each year presented.
| Year ended March 31, | ||||||||||||||||||||
| 2019 | 2018 | 2017 | 2016 | 2015 | ||||||||||||||||
Per Share Operating Performance | ||||||||||||||||||||
Net asset value, beginning of year | $ | 20.55 | $ | 20.75 | $ | 20.20 | $ | 21.52 | $ | 21.10 | ||||||||||
|
|
|
|
|
|
|
|
|
| |||||||||||
Net investment income | 0.85 | 0.87 | 0.88 | 0.93 | 0.98 | |||||||||||||||
Net gain (loss) on investments and futures contracts | (0.03 | ) | (0.03 | ) | 0.57 | (1.23 | ) | 0.50 | ||||||||||||
|
|
|
|
|
|
|
|
|
| |||||||||||
Total from investment operations | 0.82 | 0.84 | 1.45 | (0.30 | ) | 1.48 | ||||||||||||||
|
|
|
|
|
|
|
|
|
| |||||||||||
Capital shares transactions: | ||||||||||||||||||||
Impact of capital share transactions | — | — | — | (1) | — | — | ||||||||||||||
Less distributions: | ||||||||||||||||||||
Dividends from net investment income | (0.67 | ) | (0.80 | ) | (0.90 | ) | (1.02 | ) | (1.06 | ) | ||||||||||
Distributions from net realized gains | (0.13 | ) | (0.24 | ) | — | — | — | |||||||||||||
|
|
|
|
|
|
|
|
|
| |||||||||||
Total distributions | (0.80 | ) | (1.04 | ) | (0.90 | ) | (1.02 | ) | (1.06 | ) | ||||||||||
|
|
|
|
|
|
|
|
|
| |||||||||||
Net asset value, end of year | $ | 20.57 | $ | 20.55 | $ | 20.75 | $ | 20.20 | $ | 21.52 | ||||||||||
|
|
|
|
|
|
|
|
|
| |||||||||||
Per share market price, end of year | $ | 19.22 | $ | 19.37 | $ | 19.16 | $ | 19.14 | $ | 20.01 | ||||||||||
|
|
|
|
|
|
|
|
|
| |||||||||||
Total Investment Return(2) | ||||||||||||||||||||
Based on net asset value | 4.52 | % | 4.26 | % | 7.48 | % | (1.00 | )% | 7.57 | % | ||||||||||
Based on market value | 3.60 | % | 6.43 | % | 4.75 | % | 0.88 | % | 8.67 | % | ||||||||||
Ratios/Supplemental Data | ||||||||||||||||||||
Net assets, end of year (in 000’s) | $ | 220,355 | $ | 220,141 | $ | 222,258 | $ | 216,304 | $ | 230,464 | ||||||||||
Ratio of expenses to average net assets (gross of waivers/reimbursements) | 0.80 | % | 0.75 | % | 0.75 | % | 0.77 | % | 0.74 | % | ||||||||||
Ratio of expenses to average net assets (net of waivers/reimbursements) | 0.77 | % | 0.74 | % | 0.75 | % | 0.77 | % | 0.74 | % | ||||||||||
Ratio of net investment income to average net assets | 4.24 | % | 4.15 | % | 4.24 | % | 4.52 | % | 4.58 | % | ||||||||||
Portfolio turnover rate | 63.00 | % | 55.62 | % | 44.32 | % | 26.60 | % | 30.73 | % | ||||||||||
Number of shares outstanding at the end of the year (in 000’s) | 10,710 | 10,710 | 10,710 | 10,709 | 10,709 | |||||||||||||||
| (1) | There is less than $0.01 per share impact for shares reinvested under the dividend reinvestment plan. |
| (2) | Total investment return is calculated assuming a purchase of common shares at the market price on the first day and a sale at the market price on the last day of the period reported. Dividends and distributions, if any, are assumed for purposes of this calculation to be reinvested at prices obtained under the Fund’s dividend reinvestment plan. Total investment return does not reflect brokerage commissions. The total investment return, if for less than a full year, is not annualized. Past performance is not a guarantee of future results. |
The accompanying notes are an integral part of these financial statements.
18
NOTES TO FINANCIAL STATEMENTS
Note 1 –Significant Accounting Policies– The Insight Select Income Fund (the “Fund”), a Delaware statutory trust, is registered under the Investment Company Act of 1940, as amended (“1940 Act”), as a diversified closed-end, management investment company. The Fund’s investment objective is to seek a high rate of return, primarily from interest income and trading activity, from a portfolio principally consisting of debt securities. The Fund follows the accounting and reporting guidance under Financial Accounting Standards Board Accounting Standards Codification Topic 946, “Financial Services – Investment Companies”. The following is a summary of significant accounting policies consistently followed by the Fund in preparation of its financial statements. The policies are in conformity with generally accepted accounting principles within the United States of America (“GAAP”).
| A. | Security Valuation– In valuing the Fund’s net assets, all securities for which representative market quotations are available will be valued at the last quoted sales price on the security’s principal exchange on the day of valuation. If there are no sales of the relevant security on such day, the security will be valued at the bid price at the time of computation. For securities traded in the over-the-counter market, including listed debt and preferred securities, whose primary market is believed to be over-the-counter, the Fund uses recognized industry pricing services – approved by the Board of Trustees (“Board”) and unaffiliated with Insight North America LLC (“INA” or the “Adviser”) – and uses broker quotes provided by market makers of securities not valued by these and other recognized pricing sources. |
In the event that market quotations are not readily available, or when such quotations are deemed not to reflect current market value, the securities will be valued at their respective fair value as determined in good faith by the Adviser pursuant to certain procedures and reporting requirements established by the Board. The Adviser considers all relevant facts that are reasonably available when determining the fair value of a security, including but not limited to the last sale price or initial purchase price (if a when issued security) and subsequently adjusting the value based on changes in company specific fundamentals, changes in an appropriate securities index, or changes in the value of similar securities which may be further adjusted for any discounts related to security-specific resale restrictions. When possible, observable market inputs such as unadjusted quoted prices of similar securities, observable interest rates, currency rates and yield curves are utilized. At March 31, 2019, there were no securities valued using fair value procedures.
Fair Value Measurements– The Fund has adopted authoritative fair value accounting standards which establish a definition of fair value and set out a hierarchy for measuring fair value. These standards require additional disclosures about the various inputs and valuation techniques used to develop the measurements of fair value, a discussion in changes in valuation techniques and related inputs during the period and expanded disclosure of valuation levels for major security types. These inputs are summarized in the three broad levels listed below:
• Level 1 – | Unadjusted quoted prices in active markets for identical assets or liabilities that the Fund has the ability to access. | |
• Level 2 – | Observable inputs other than quoted prices included in level 1 that are observable for the asset or liability, either directly or indirectly. These inputs may include quoted prices for the identical instrument on an inactive market, prices for similar instruments, interest rates, prepayment speeds, credit risk, yield curves, default rates and similar data. | |
• Level 3 – | Unobservable inputs for the asset or liability, to the extent relevant observable inputs are not available, representing the Fund’s own assumptions about the assumptions a market participant would use in valuing the asset or liability, and would be based on the best information available. | |
19
NOTES TO FINANCIAL STATEMENTS — continued
At the end of each calendar quarter, management evaluates the Level 1, 2 and 3 assets and liabilities for changes in liquidity, including but not limited to: whether a broker is willing to execute at the quoted price, the depth and consistency of prices from third party services, and the existence of contemporaneous, observable trades in the market. Additionally, management evaluates Level 1 and 2 assets and liabilities on a quarterly basis for changes in listings or delistings on national exchanges. Due to the inherent uncertainty of determining the fair value of investments that do not have a readily available market value, the fair value of the Fund’s investments may fluctuate from period to period. Additionally, the fair value of investments may differ significantly from the values that would have been used had a ready market existed for such investments and may differ materially from the values the Fund may ultimately realize. Further, such investments may be subject to legal and other restrictions on resale or otherwise less liquid than publicly traded securities.
Level 3 investments are categorized as Level 3 with values derived utilizing prices from prior transactions or third party pricing information without adjustment (broker quotes, pricing services and net asset values). A significant change in third party pricing information could result in a significantly lower or higher value in such Level 3 investments. As of March 31, 2019, the Fund did not hold any Level 3 securities.
When-Issued Securities – The Fund may enter into commitments to purchase securities on a forward or when-issued basis. When-issued securities are securities purchased for delivery beyond the normal settlement date at a stated price and yield. In the Fund’s case, these securities are subject to settlement within 45 days of the purchase date. The interest rate realized on these securities is fixed as of the purchase date. The Fund does not pay for such securities prior to the settlement date and no interest accrues to the Fund before settlement. These securities are subject to market fluctuation due to changes in market interest rates. The Fund will enter into these commitments with the intent of buying the security but may dispose of such security prior to settlement. At the time the commitment is entered into, the Fund will establish and maintain a segregated account in an amount sufficient to cover the obligation under the when-issued contract. At the time the Fund makes the commitment to purchase securities on a when-issued basis, it will record the transaction and thereafter reflect the value of such security purchased in determining its NAV. At the time of delivery of the security, its value may be more or less than the fixed purchase price.
Futures Contracts – The Fund uses futures contracts generally to gain exposure to, or hedge against, changes in interest rates or gain exposure to, or hedge against, changes in certain asset classes. A futures contract represents a commitment for the future purchase or sale of an asset at a specified price on a specified date.
Upon entering into a futures contract, the Fund is required to deposit cash or cash equivalents with a broker in an amount equal to a certain percentage of the contract amount. This is known as the ‘‘initial margin’’ and subsequent payments (‘‘variation margin’’) are made or received by the Fund each day, depending on the daily fluctuation in the value of the contract. For certain futures, including foreign denominated futures, variation margin is not settled daily, but is recorded as a net variation margin payable or receivable. The daily changes in contract value are recorded as unrealized gains or losses in the Statement of Operations and the Fund recognizes a realized gain or loss when the contract is closed.
Futures contracts involve, to varying degrees, risk of loss in excess of the amounts reflected in the financial statements. In addition, there is the risk that the Fund may not be able to enter into a closing transaction because of an illiquid secondary market.
20
NOTES TO FINANCIAL STATEMENTS — continued
The following table sets forth the fair value and the location of the Fund’s derivative financial instruments within the Statement of Assets and Liabilities by primary risk exposure as of March 31, 2019:
Fair Value of Derivative Investments as of March 31, 2019:
Derivatives not accounted for as hedging instruments under ASC 815 | Assets | Liabilities | ||
Futures — Interest Rate Contracts | $170,593 | $(81,507) |
The following table sets forth the effect of the Fund’s derivative financial instruments by primary risk exposure on the Statements of Operations for the year ended March 31, 2019:
The Effect of Derivative Investments on the Statements of Operations for the year ended March 31, 2019:
Derivatives not accounted for as hedging instruments under ASC 815 | Realized Gain (Loss) on Derivatives | Change in Net Unrealized Appreciation (Depreciation) of Derivatives | ||
Futures — Interest Rate Contracts | $45,013 | $217,508 |
The average notional value of long and short futures contracts held by the Fund throughout the period was $5,673,831 and $7,340,968, respectively. This is based on amounts held as of eachquarter-end throughout the fiscal year.
| B. | Determination of Gains or Losses on Sale of Securities– Gains or losses on the sale of securities are calculated for financial reporting purposes and for federal tax purposes using the identified cost basis. The identified cost basis for financial reporting purposes differs from that used for federal tax purposes in that the amortized cost of the securities sold is used for financial reporting purposes and the original cost of the securities sold is used for federal tax purposes, except for those instances where tax regulations require the use of amortized cost. |
| C. | Federal Income Taxes– It is the Fund’s policy to continue to comply with the requirements of the Internal Revenue Code applicable to regulated investment companies and to distribute all of its taxable income to its shareholders. Therefore, no federal income tax provision is required. |
Management has analyzed the Fund’s tax positions taken on federal income tax returns for all open tax years (tax years March 31, 2016-2018) or expected to be taken on the Fund’s 2019 tax return, and has concluded that no provision for federal income tax is required in the Fund’s financial statements. The Fund’s federal and state income and federal excise tax returns for tax years for which the applicable statutes of limitations have not expired are subject to examination by the Internal Revenue Service and state departments of revenue. |
| D. | Other– Security transactions are accounted for on the trade date. Interest income is accrued daily. Premiums and discounts are amortized using the interest method. Paydown gains and losses on mortgage-backed and asset-backed securities are presented as an adjustment to interest income. Dividend income and distributions to shareholders are recorded on theex-dividend date. |
| E. | Distributions to Shareholders and Book/Tax Differences– Distributions of net investment income will be made quarterly. Distributions of any net realized capital gains will be made annually. Income and capital gain distributions are determined in accordance with federal income tax regulations, which may |
21
NOTES TO FINANCIAL STATEMENTS — continued
| differ from GAAP. These differences are primarily due to differing treatments for amortization of market premium and accretion of market discount. |
Distributions during the fiscal years ended March 31, 2019 and 2018 were characterized as follows for tax purposes: |
| Ordinary Income | Return of Capital | Capital Gain | Total Distribution | |||||
FY 2019 | $ 7,124,251 | $ — | $ 1,443,777 | $ 8,568,028 | ||||
FY 2018 | $ 10,032,088 | $ — | $ 1,119,199 | $ 11,151,287 |
At March 31, 2019, the components of distributable earnings on a tax basis were as follows: |
Total | Accumulated Ordinary Income | Undistributed Long-Term Capital Gains | Late Year Losses Deferred | Net Unrealized Appreciation | ||||
$13,672,164 | $2,380,754 | $55,224 | $ — | $11,236,186 | ||||
|
|
|
|
Realized net capital gains can be offset by capital loss carryforwards from prior years. As of March 31, 2019, there were no capital loss carryforwards. |
Under current laws, certain capital losses realized after October 31 and certain ordinary losses realized after December 31 may be deferred and treated as occurring on the first day of the following fiscal year. For the year ended March 31, 2019, no losses were deferred. |
At March 31, 2019, the following table shows for federal tax purposes the aggregate cost of investments, the net unrealized appreciation of those investments, the aggregate gross unrealized appreciation of all securities with an excess of market value over tax cost and the aggregate gross unrealized depreciation of all securities with an excess of tax cost over market value: |
Cost | Gross | Gross | Net Unrealized | |||||
Securities | $209,260,548 | $14,142,811 | $(2,906,625) | $11,236,186 |
The difference between book basis andtax-basis unrealized appreciation is attributable primarily to the differing treatments for wash sales, amortization of market premium and accretion of market discount. |
| F. | Use of Estimates in the Preparation of Financial Statements– The preparation of financial statements in conformity with GAAP requires management to make estimates and assumptions that may affect the reported amounts of assets and liabilities at the date of the financial statements and the reported amounts of revenue and expenses during the reporting period. Actual results could differ from those estimates. |
Note 2 –Portfolio Transactions– The following is a summary of the security transactions, other than short-term investments, for the year ended March 31, 2019:
| Cost of Purchases | Proceeds from Sales or Maturities | |||||||
U.S. Government Securities | $ | 77,314,373 | $ | 67,939,423 | ||||
Other Investment Securities | $ | 62,657,745 | $ | 65,158,680 | ||||
22
NOTES TO FINANCIAL STATEMENTS — continued
Note 3 –Capital Stock– At March 31, 2019, there were an unlimited number of shares of beneficial interest ($0.01 par value) authorized, with 10,710,035 shares issued and outstanding.
Note 4 –Investment Advisory Contract, Accounting and Administration, Custodian, Transfer Agent and Trustee Compensation– INA serves as investment adviser to the Fund. The Adviser is entitled to a fee at the annual rate of 0.50% on the first $100 million of the Fund’s month-end net assets and 0.40% on the Fund’smonth-end net assets in excess of $100 million. As previously disclosed as part of an internal reorganization, Cutwater Investor Services Corp. merged into its affiliate, INA, on July 2, 2018. Effective July 2, 2018, the Fund’s investment management agreement was transferred to INA. The Bank of New York Mellon Corporation remains INA’s ultimate parent company. Historically, the Adviser and INA have operated under the same brand for some time and this merger is not expected to have any material impact on the day-to-day management of the Fund. This reorganization did not result in a change of control of the Adviser under the Investment Advisers Act of 1940, as amended, and the rules thereunder.
BNY Mellon Investment Servicing (US) Inc. (“BNY Mellon”), an indirect wholly-owned subsidiary of The Bank of New York Mellon Corporation, provides accounting and administrative services to the Fund. The Bank of New York Mellon is the Fund’s custodian responsible for the custody of Fund’s assets. BNY Mellon is the contractual Transfer Agent to the Fund and has subcontracted with Computershare to provide transfer agency services to the Fund.
The Adviser is a wholly owned subsidiary of The Bank of New York Mellon Corporation. The Adviser works closely with and is administered by Insight Investment Management (Global) Limited (“Insight”), another of The Bank of New York Mellon Corporation’s investment management subsidiaries. The Adviser is subject to The Bank of New York Mellon Corporation’s Code of Conduct and various policies and procedures designed to address the potential for conflicts of interest that may arise in connection with the Adviser’s status as an affiliated person of The Bank of New York Mellon Corporation and its subsidiaries.
Prior to January 2, 2019, the Fund entered into a chief compliance officer outsourcing agreement (the “CCO Outsourcing Agreement”) with Lebisky Compliance Consulting LLC pursuant to which the Fund retained its Chief Compliance Officer. For the year ended March 31, 2019, the Fund incurred $26,352 under the CCO Outsourcing Agreement of which $26,294 was reimbursed by the Adviser. Effective January 2, 2019, chief compliance officer services were provided by the Adviser at no additional cost to the Fund.
The Trustees of the Fund receive an annual retainer, meeting fees and out of pocket expenses for meetings attended. The aggregate remuneration paid to the Trustees by the Fund during the year ended March 31, 2019 was $117,530. All officers of the Fund are also officers and/or employees of the investment adviser. None of the Fund’s officers receives compensation from the Fund.
Note 5 –Dividend and Distribution Reinvestment– In accordance with the terms of the Amended and Restated Automatic Dividend Investment Plan (the “Plan”), for shareholders who so elect, dividends and distributions are made in the form of previously unissued Fund shares at the net asset value if on the Friday preceding the payment date (the “Valuation Date”) the closing New York Stock Exchange price per share, plus the brokerage commissions applicable to one such share equals or exceeds the net asset value per share. However, if the net asset value is less than 95% of the market price on the Valuation Date, the shares issued will be valued at 95% of the market price. If the net asset value per share exceeds market price plus commissions, the dividend or distribution proceeds are used to purchase Fund shares on the open market for participants in the Plan. During the year ended March 31, 2019, the Fund did not issue any shares under this Plan.
23
NOTES TO FINANCIAL STATEMENTS — continued
Note 6 –Regulatory Updates – In August 2018, the Securities and Exchange Commission (the “SEC”) released its Final Rule Release No. 33-10532, Disclosure Update and Simplification (“Final Rules”) which were intended to simplify an issuer’s disclosure compliance efforts by removing redundant or outdate disclosure requirements without significant altering the mix of information provided to investors. The Final Rules were effective November 5, 2018. Effective with the current reporting period, the Fund adopted the Final Rule with the most notable impacts being that the Fund is no longer required to present the components of distributable earnings on the Statement of Assets and Liabilities or the amount of undistributed net investment income on the Statement of Changes in Net Assets.
In August 2018, the Financial Accounting Standards Board issued Accounting Standards Update (“ASU”)No. 2018-13, Fair Value Measurement (Topic 820): Disclosure Framework—Changes to the Disclosure Requirements for Fair Value Measurement, which amends and eliminates certain disclosure requirements for fair value as part of its framework project. The ASU is effective for annual and interim periods beginning after December 15, 2019. The early adoption of the removal or modification of disclosures and delay of adoption of the additional disclosures is permitted. As of March 31, 2019, the Fund has adopted the removal of applicable disclosures.
Note7–Subsequent Event– Management has evaluated the impact of all subsequent events on the Fund through the date the financial statements were issued, and has determined that there were no additional subsequent events requiring recognition or disclosure in the financial statements.
24
SHAREHOLDER INFORMATION (Unaudited)
ADDITIONAL INFORMATION REGARDING THE FUND’S TRUSTEES AND OFFICERS
Name, Address and Age1 | Position Held With Fund | Principal Occupation | Number of Funds Overseen By Trustee | Term of Office and Length | Other | |||||
| W. Thacher Brown Born: December 1947 | Trustee, Board Chairperson | Retired | 1 | Shall serve until the next annual meeting or until his successor is qualified. Trustee since 1988. | None. | |||||
Ellen D. Harvey Born: February 1954 | Trustee | Principal, Lindsay Criswell LLC beginning July 2008; Managing Director, Miller Investment Management from September 2008 to June 2018. | 1 | Shall serve until the next annual meeting or until her successor is qualified. Trustee since 2010. | Director, Aetos Capital Funds (3 portfolios). | |||||
Thomas E. Spock Born: May 1956 | Trustee | Partner at Scalar Media Partners, LLC since June 2008. | 1 | Shall serve until the next annual meeting or until his successor is qualified. Trustee since 2013. | None. | |||||
Suzanne P. Welsh Born: March 1953 | Trustee | Retired; Former Vice President for Finance and Treasurer, Swarthmore College from August 2002 to June 2014. | 1 | Shall serve until the next annual meeting or until her successor is qualified. Trustee since 2008. | None. | |||||
Clifford D. Corso2 Born: October 1961 | President | Executive Chairman, Insight North America LLC since October 2018, President, Insight North America LLC from October 2016 to October 2018. Chief Executive Officer, President and Board Member, Cutwater Investor Services Corp. from January 2015 to July 2018. Director and officer of other affiliated entities of Cutwater Investor Services Corp. from January 2015 to July 2018. | N/A. | Shall serve until death, resignation, or removal. Officer since 2005. | N/A. | |||||
25
SHAREHOLDER INFORMATION (Unaudited) — continued
Name, Address and Age1 | Position Held With Fund | Principal Occupation | Number of Funds Overseen By Trustee | Term of Office and Length | Other | |||||
Gautam Khanna2 Born: October 1969 | Vice President | Senior Portfolio Manager, Insight North America LLC since January 2015; Officer of the Adviser since 2006. | N/A. | Shall serve until death, resignation, or removal. Officer since 2006. | N/A. | |||||
| Thomas E. Stabile2 Born: March 1974 | Treasurer and Vice President | Head of Operations, Insight North America since January 2015; Officer of the Adviser since 2005; and Director of Accounting and Reporting of the Adviser from 2005 to 2015. | N/A. | Shall serve until death, resignation, or removal. Officer since 2010. | N/A. | |||||
Seth Gelman2 Born: August 1975 | Secretary and Chief Compliance Officer | Chief Compliance Officer, Insight North America LLC since October 2017. Chief Compliance Officer, Insight Investment International Limited since October 2017. Chief Compliance Officer, Brookfield Investment Management, Inc. from May 2009 to October 2017. Chief Compliance Officer, Brookfield Investment Funds from May 2009 to October 2017. | Shall serve until death, resignation, or removal. Officer since January 2019. | N/A | ||||||
| 1 | The business address of each Trustee and Officer is c/o Insight Investment, 200 Park Avenue, New York, NY 10166. |
| 2 | Denotes an officer who is an “interested person” of the Fund as defined under the provisions of the Investment Company Act of 1940. Messrs. Corso, Khanna, Stabile, and Gelman are “interested persons” by virtue of being employees of the Fund’s Adviser. Additional information about the Trustees is included in the Fund’s prospectus. As of date of this report, the portfolio managers of the Fund are Gautam Khanna, CPA, CFA, Senior Portfolio Manager, Jason Celente, CFA, Senior Portfolio Manager, and Gerard Berrigan, Head of US Fixed Income. Mr. Khanna is the lead portfolio manager responsible for day-to-day management of the portfolio. Messrs. Khanna and Berrigan have been with INA since May 2003, and Mr. Celente has been with INA since May 1999. |
26
SHAREHOLDER INFORMATION (Unaudited) — continued
HOW TO GET INFORMATION REGARDING PROXIES
The Fund has adopted the Adviser’s proxy voting policies and procedures to govern the voting of proxies relating to the voting securities of the Fund. You may obtain a copy of these proxy voting procedures, without charge, by emailing clientservicena@insightinvestment.com or on the Securities and Exchange Commission website at www.sec.gov.
Information regarding how the Fund voted proxies relating to portfolio securities during the most recent12-month period ended June 30 is available, without charge, by emailing clientservicena@insightinvestment.com or on the SEC’s website at www.sec.gov.
QUARTERLY STATEMENT OF INVESTMENTS
The Fund files a complete statement of investments with the Security and Exchange Commission for the first and third quarters for each fiscal year onForm N-Q. Shareholders may view the filedForm N-Q by visiting the Commission’s website at http://www.sec.gov. Form N-Q is being rescinded. Once Form N-Q is rescinded, disclosure of the Fund’s complete holdings will be required to be made monthly on Form N-PORT, with every third month made available to the public by the Commission 60 days after the end of the Fund’s fiscal quarter.
ADDITIONAL TAX INFORMATION
For corporate shareholders, the percentage of investment income (dividend income and short-term gains, if any) for the Fund that qualify for the dividends-received deductions for the year ended March 31, 2019 was 1.57%.
For the year ended March 31, 2019, certain dividends paid by the Fund may be subject to a maximum tax rate of 15%, as provided by the Jobs and Growth Tax Relief Reconciliation Act of 2003. Of the distributions made by the Fund, 1.57% represents the amount of each distribution which may qualify for the 15% dividend income tax rate. Shareholders should not use this tax information to prepare their tax returns. The information will be included with your Form 1099 DIV which will be sent to you separately in January 2020.
For the fiscal year ended March 31, 2019, the Fund designated long-term capital gains of $55,224.
DIVIDEND REINVESTMENT PLAN
The Fund has established a plan for the automatic investment of dividends and distributions pursuant to which dividends and capital gain distributions to shareholders will be paid in or reinvested in additional shares of the Fund. All shareholders of record are eligible to join the Plan. BNY Mellon acts as the agent (the “Agent”) for participants under the Plan.
Shareholders whose shares are registered in their own names may elect to participate in the Plan by completing an authorization form and returning it to the Agent. Shareholders whose shares are held in the name of a broker or nominee should contact such broker or nominee to determine whether or how they may participate in the Plan.
Dividends and distributions are reinvested under the Plan as follows. If the market price per share on the Friday before the payment date for the dividend or distribution (the “Valuation Date’’), plus the brokerage commissions applicable to one such share, equals or exceeds the net asset value per share on that date, the Fund will issue new shares to participants valued at the net asset value or, if the net asset value is less than 95% of the market price on the Valuation Date, then valued at 95% of the market price. If net asset value per share on the Valuation Date exceeds the market price per share on that date, plus the brokerage commissions applicable to one such share, the Agent will buy shares on the open market, on the New York Stock Exchange, for the participants’ accounts. If before the Agent has completed its purchases, the market price exceeds the net asset value of shares, the average per
27
SHAREHOLDER INFORMATION (Unaudited) — continued
share purchase price paid by the Agent may exceed the net asset value of shares, resulting in the acquisition of fewer shares than if the dividend or distribution has been paid in shares issued by the Fund at net asset value.
There is no charge to participants for reinvesting dividends or distributions payable in either shares or cash. The Agent’s fees for handling of reinvestment of such dividends and distributions will be paid by the Fund. There will be no brokerage charges with respect to shares issued directly by the Fund as a result of dividends or distributions payable either in shares or cash. However, each participant will be charged by the Agent a pro rata share of brokerage commissions incurred with respect to Agent’s open market purchases in connection with the reinvestment of dividends or distributions payable only in cash.
For purposes of determining the number of shares to be distributed under the Plan, the net asset value is computed on the Valuation Date and compared to the market value of such shares on such date. The Plan may be terminated by a participant by delivery of written notice of termination to the Agent at the address shown below. Upon termination, the Agent will cause a certificate or certificates for the full shares held for a participant under the Plan and a check for any fractional shares to be delivered to the former participant.
Distributions of investment company taxable income that are invested in additional shares generally are taxable to shareholders as ordinary income. A capital gain distribution that is reinvested in shares is taxable to shareholders as long-term capital gain, regardless of the length of time a shareholder has held the shares or whether such gain was realized by the Fund before the shareholder acquired such shares and was reflected in the price paid for the shares.
Plan information and authorization forms are available from BNY Mellon Investment Servicing (US) Inc., P.O. Box 358035, Pittsburgh, PA 15252-8035.
PRIVACY POLICY
The Fund has adopted procedures designed to maintain and secure the non-public personal information of its clients from inappropriate disclosure to third parties. The Fund is committed to keeping personal information collected from potential, current, and former clients confidential and secure. The proper handling of personal information is one of our highest priorities. The Fund never sells information relating to its clients to any outside third parties.
Client Information
The Fund will only collect and keep information which is necessary for it to provide the services requested by its shareholders, and to administer a shareholder account.
The Fund may collect nonpublic personal information from clients or potential clients such as name, address, tax identification or social security number, assets, income, net worth, copies of financial documents and other information that we may receive on applications or other forms, correspondence or conversations, or via other methods in order to conduct business.
The Fund may also collect information about your transactions with the Fund, Adviser, Adviser’s affiliates, or others, including, but not limited to, your account number and balance, payments history, parties to transactions, cost basis information, and other financial information.
This information may be obtained as a result of transactions with the Fund, Adviser, Adviser’s affiliates, its clients, or others. This could include transactions completed with affiliates or information received from outside vendors to complete transactions or to effect financial goals.
28
SHAREHOLDER INFORMATION (Unaudited) — continued
Sharing Information
The Fund only shares the nonpublic personal information of its shareholders with non-affiliated companies or individuals (i) as permitted by law and as required to provide services to shareholders, such as with representatives within Adviser, securities clearing firms, the Fund or insurance companies, and other financial services providers; or (ii) to comply with legal or regulatory requirements. The Fund may also disclose nonpublic personal information to another financial services provider in connection with the transfer of an account to such financial services provider. Further, in the normal course of business, the Fund may disclose information it collects about shareholders to companies or individuals that contract with the Fund or Adviser to perform servicing functions including, but not limited to, recordkeeping, consulting, and/or technology services.
Companies hired to provide support services are not permitted to use personal information for their own purposes, and are contractually obligated to maintain strict confidentiality. The Fund limits the use of personal information to the performance of the specific service requested.
The Fund does not provide personally identifiable information to mailing list vendors or solicitors for any purpose. When the Fund provides personal information to service providers, it requires these providers to agree to safeguard such information, to use the information only for the intended purpose, and to abide by applicable law.
Employee Access to Information
Only employees with a valid business reason have the ability to access a clients’ personal information. These employees are educated on the importance of maintaining the confidentiality and security of this information. They are required to abide by our information handling practices.
Protection of Information
The Fund maintains security standards to protect shareholders’ information, whether written, spoken, physical, or electronic. The Fund updates and checks its physical mechanisms and electronic systems to ensure the protection and integrity of information.
Maintaining Accurate Information
The Fund’s goal is to maintain accurate, up to date client records in accordance with industry standards. The Fund has procedures in place to keep information current and complete, including timely correction of inaccurate information.
Disclosure of our Privacy Policy
The Fund recognizes and respects the privacy concerns of its potential, current, and former shareholders. The Fund, Adviser and Adviser’s affiliates are committed to safeguarding this information and may provide this Privacy Policy for informational purposes to shareholders and employees, and will distribute and update it as required by law. It is also available upon request.
The Fund seeks to carefully safeguard shareholder information and, to that end, restricts access to non-public personal information about our shareholders to those employees and other persons who need to know the information to enable the Fund to provide services to its shareholders. The Fund, Adviser and their service agents maintain physical, electronic, and procedural safeguards that comply with federal standards to guard your non-public personal information. In the event that you maintain an account through a financial intermediary, including,
29
SHAREHOLDER INFORMATION (Unaudited) — continued
but not limited to, a broker-dealer, bank, or trust company, the privacy policy of your financial intermediary would govern how your non-public personal information would be shared with unaffiliated third parties.
ANNUAL CERTIFICATION
The Fund’s Chief Executive Officer (“CEO”) has submitted to the NYSE the required annual certification, and the Fund also has included the certifications of the Fund’s CEO and Treasurer required by Section 302 of the Sarbanes- Oxley Act of 2002 in the Fund’s FormsN-CSR filed with the Securities and Exchange Commission for the period of this report.
30
HOW TO GET ASSISTANCE WITH SHARE TRANSFER OR DIVIDENDS
Contact Your Transfer Agent:
BNY Mellon Investment Servicing (US) Inc.
P.O. Box 358035, Pittsburgh, PA 15252-8035, or call1-866-333-6685
T R U S T E E S
W. THACHER BROWN
ELLEN D. HARVEY
THOMAS E. SPOCK
SUZANNE P. WELSH
O F F I C E R S
CLIFFORD D. CORSO
President
THOMAS E. STABILE
Treasurer and Vice President
SETH GELMAN
Secretary and Chief Compliance Officer
GAUTAM KHANNA
Vice President
I N V E S T M E N T A D V I S E R
INSIGHT NORTH AMERICA LLC
200 PARK AVE, 7TH FLOOR
NEW YORK, NY 10166
C U S T O D I A N
THE BANK OF NEW YORK MELLON
2 HANSON PLACE
BROOKLYN, NY 11217
T R A N S F E R A G E N T
BNY MELLON INVESTMENT SERVICING (US) INC.
P.O. BOX 358035
PITTSBURGH, PA 15252-8035
1-866-333-6685
C O U N S E L
PEPPER HAMILTON LLP
3000 TWO LOGAN SQUARE
EIGHTEENTH & ARCH STREETS
PHILADELPHIA, PA 19103
I N D E P E N D E N T R E G I S T E R E D
P U B L I C A C C O U N T I N G F I R M
TAIT, WELLER & BAKER LLP
50 SOUTH 16TH STREET
SUITE 2900
PHILADELPHIA, PA 19102

Insight Select Income Fund
Annual Report
March 31, 2019

Item 2. Code of Ethics.
The registrant has adopted a code of ethics (the “Code of Ethics”) that applies to its principal executive officer, principal financial officer, principal accounting officer or controller, or persons performing similar functions (each a “Covered Person”). A copy of the Registrant’s Code of Ethics can be obtained without charge, upon request, by calling the Registrant at1-866-333-6685. There were no amendments to the Code of Ethics during the reporting period. There were no waivers of a provision of the Code of Ethics granted to a Covered Person during the reporting period.
Item 3. Audit Committee Financial Expert.
The Board of Trustees of the registrant has determined that Suzanne P. Welsh, the Chair of the Board’s Audit Committee, possesses the technical attributes identified in Instruction 2(b) of Item 3 to FormN-CSR to qualify as an “audit committee financial expert,” and has designated Ms. Welsh as the Audit Committee’s financial expert. Ms. Welsh is an “independent” Trustee pursuant to paragraph (a)(2) of Item 3 to FormN-CSR. Under applicable securities laws, a person who is determined to be an audit committee financial expert will not be deemed an “expert” for any purpose, including without limitation for the purposes of Section 11 of the Securities Act of 1933, as a result of being designated or identified as an audit committee financial expert. The designation or identification of a person as an audit committee financial expert does not impose on such person any duties, obligations, or liabilities that are greater than the duties, obligations, and liabilities imposed on such person as a member of the audit committee and Board of Trustees in the absence of such designation or identification. The designation or identification of a person as an audit committee financial expert does not affect the duties, obligations, or liability of any other members of the audit committee or board of trustees.
Item 4. Principal Accountant Fees and Services.
Audit Fees
| (a) | The aggregate fees billed for each of the last two fiscal years for professional services rendered by the principal accountant for the audit of the registrant’s annual financial statements or services that are normally provided by the accountant in connection with statutory and regulatory filings or engagements for those fiscal years are $22,000 and $19,000 for the fiscal years ended March 31, 2019 and March 31, 2018, respectively. |
Audit-Related Fees
| (b) | The aggregate fees billed in each of the last two fiscal years for assurance and related services by the principal accountant that are reasonably related to the performance of the audit of the registrant’s financial statements and are not reported under paragraph (a) of this Item are $3,000 and $3,000 for the fiscal years ended March 31, 2019 and March 31, 2018, respectively. The audit related fees relate to the17f-2 custody audits required under the Investment Company Act of 1940, as amended. |
Tax Fees
| (c) | The aggregate fees billed in each of the last two fiscal years for professional services rendered by the principal accountant for tax compliance, tax advice, and tax planning are $3,500 and $3,000 for the fiscal years ended March 31, 2019 and March 31, 2018, respectively. The tax fees relate to the review of the registrant’s tax filings and annual tax related disclosures in the financial statements. |
All Other Fees
| (d) | The aggregate fees billed in each of the last two fiscal years for products and services provided by the principal accountant, other than the services reported in paragraphs (a) through (c) of this Item are $0 and $0 for the fiscal years ended March 31, 2019 and March 31, 2018, respectively. |
| (e)(1) | The registrant’s audit committee has adopted policies and procedures relating to thepre-approval of services provided by the registrant’s principal accountant (the“Pre-Approval Policies”). ThePre-Approval Policies establish a framework intended to assist the audit committee in the proper discharge of itspre-approval responsibilities. As a general matter, thePre-Approval Policies (i) specify certain types of audit, audit-related, tax, and other services determined to bepre-approved by the audit committee; and (ii) delineate specific procedures governing the mechanics of thepre-approval process, including the approval and monitoring of audit andnon-audit service fees. Unless a service is specificallypre-approved under thePre-Approval Policies, it must be separatelypre-approved by the audit committee. |
| (e)(2) | All of the services described in each of paragraphs (b) through (d) of this Item that were approved by the audit committee pursuant to paragraph (c)(7)(i)(C) of Rule2-01 of RegulationS-X. |
| (f) | Not applicable. |
| (g) | The aggregatenon-audit fees billed by the registrant’s accountant for services rendered to the registrant, and rendered to the registrant’s investment adviser (not including anysub-adviser whose role is primarily portfolio management and is subcontracted with or overseen by another investment adviser), and any entity controlling, controlled by, or under common control with the adviser that provides ongoing services to the registrant for each of the last two fiscal years of the registrant was $0 and $0 for the fiscal years ended March 31, 2019 and March 31, 2018, respectively. |
| (h) | Not applicable. |
Item 5. Audit Committee of Listed Registrants.
The registrant has a separately-designated standing audit committee consisting of all the independent trustees of the registrant. The members of the audit committee are: W. Thacher Brown, Ellen D. Harvey, Thomas E. Spock and Suzanne P. Welsh, constituting the entire board.
Item 6. Investments.
| (a) | Schedule of Investments in securities of unaffiliated issuers as of the close of the reporting period is included as part of the report to shareholders filed under Item 1 of this form. |
| (b) | Not applicable. |
Item 7. Disclosure of Proxy Voting Policies and Procedures forClosed-End Management Investment Companies.
The registrant has adopted the proxy voting policies and procedures used by the Investment Adviser (Insight North America LLC or “Insight” or the “Adviser”).
As a fixed income investment manager, Insight votes proxies for client securities on a relatively infrequent basis. Insight has adopted a proxy voting policy where it has been granted authority to vote such proxies and to ensure that proxies are voted in the best interest of each client. More frequently, Insight votes or consents to corporate actions, including tenders, exchanges, amendments, and restructurings which relate to individual fixed income holdings of client accounts. Determinations on voting of consents to these matters tend to be driven primarily by the Company’s view of whether the proposed action will result in an economic benefit for the affected client(s).
Voting Policy
We routinely vote on behalf of our clients with regard to the companies in which they have a shareholding. Insight retains the services of Manifest Information Services (Manifest) for the provision of proxy voting services and votes at all meetings where it is deemed appropriate and responsible to do so. Manifest analyse any resolution against Insight specific voting policy templates which will determine the direction of the vote. Where contentious issues are identified these are escalated to Insight for further review and direction. With regard to voting, the conflicts of interest policy is that Insight will always seek to act in the best interests of its clients when casting proxy votes on their behalf. Where Bank of New York Mellon, Insight or the clients themselves have business relationships with investee companies, these will be disregarded by Insight in making its proxy voting decisions.
Generally, our IMAs provide us with the authority to vote proxies on equity securities for our client accounts subject to any specific instructions from the client.
On an annual basis, Insight publishes a report titled ‘Putting Principles into Practice’, available on our website athttps://www.insightinvestment.com/globalassets/documents/responsible-investment/responsible-investment-reports/uk-aus-ri-report-2018.pdf, which includes a description on how we have exercised voting powers.
Item 8. Portfolio Managers ofClosed-End Management Investment Companies.
| (a)(1) | Portfolio Management Team: |
Gautam Khanna, CPA, CFA
Senior Portfolio Manager, Insight North America LLC
May 2003 - Present
Lead Portfolio Manager responsible forday-to-day management of portfolio
Jason Celente, CFA
Senior Portfolio Manager, Insight North America LLC
May 1999 - Present
Portfolio Manager responsible for management of portfolio
Gerard Berrigan
Head of US Fixed Income, Insight North America LLC
May 2003 - Present
Portfolio Manager responsible for management of portfolio
| (a)(2) | The table below identifies the number of accounts (other than the Fund) for which the Fund’s portoflio managers haveday-to-day management responsiblities and total assets in such accounts, within each of the following categories: registered investment companies, ohter pooled investment vehiciles, and other accounts. The Adviser currently does not manage any performance-based fee accounts. |
| As of March 31, 2019 | ||||
| Number of Accounts | Total Assets of Accounts | |||
| (in millions) | ||||
Gautam Khanna, CPA, CFA | ||||
Registered Investment Companies | 2 | $703.1 | ||
Other Pooled Investments | - | - | ||
Other Accounts | 17 | $1,497.0 | ||
Jason Celente, CFA | ||||
Registered Investment Companies | 2 | $703.1 | ||
Other Pooled Investments | - | - | ||
Other Accounts | 24 | $1,445.9 | ||
E. Gerard Berrigan | ||||
Registered Investment Companies | 2 | $703.1 | ||
Other Pooled Investments | - | - | ||
Other Accounts | 17 | $6,581.8 | ||
Potential Conflicts of Interests
Material conflicts of interest identified by the Adviser may arise in connection with a portfolio manager’s management of the Fund in addition to other fund and/or accounts managed. These potential conflicts of interest include material conflicts between the investment strategy of the Fund and the investment strategy of the other accounts managed by the portfolio manager and conflicts associated with the allocation of investment opportunities between the Fund and other accounts managed by the portfolio manager. For example, conflicts may arise in cases where multiple Firm and/or affiliate client accounts are invested in different parts of an issuer’s capital structure. Additionally, a portfolio manager may manage a separate account or other pooled investment vehicle that may have a materially higher or lower fee arrangement than the Fund or that may have a performance fee arrangement.The side-by-side management of these accounts may raise potential conflicts of interest relating to cross trading, the allocation of investment opportunities and the aggregation and allocation of trades. In addition, while portfolio managers generally only manage accounts with similar investment strategies, it is possible that due to varying investment restrictions among accounts and for other reasons that certain investments could be made for some accounts and not others or conflicting investment positions could be taken among accounts. The Adviser has a fiduciary responsibility to manage all client accounts in a fair and equitable manner. The Adviser seeks to provide best execution of all securities transactions and aggregates and then allocates securities to client accounts in a fair and timely manner. To this end, the Adviser has developed policies and procedures designed to mitigate and manage the potential conflicts of interest that may arise from side-by-side management.
| (a)(3) | All employees of the Adviser, including the Portfolio Manager, are eligible to receive a variable component of pay in addition to their fixed compensation. The variable component is a combination of cash and Long Term Incentive Plan (LTIP) shares and is determined based on each individual’s performance rating in addition to the overall performance of the Adviser. The LTIP shares typically vest on a three-year schedule, with the aim of aligning each individual’s rewards with the success of the business. |
Performance management and compensation are formally linked. Everyone participates inmid-year reviews which incorporate 360 degree feedback and an assessment of performance against objectives, as well as a formal end of year review. At that review, a performance rating is also
agreed which is then a key factor in determining compensation. For investment professional, investment performance is an important, but not the only, factor.
| (a)(4) | The following table discloses the dollar range of equity securities of the Fund beneficially owned by each of the Fund’s portfolio managers as of March 31, 2019: |
| Dollar range of Equity Securities in Fund (1)
| ||
Gautam Khanna
|
$10,001 to $50,000
| |
Jason Celente
| NONE
| |
E. Gerard Berrigan
| NONE
| |
| ||
| (1) Dollar ranges are as follows: None,$1- $10,000,$10,001-$50,000,$50,001-$100,000,$100,001-$500,000,$500,001- $1,000,000 or over $1,000,000. | ||
| (b) | N/A. Filing is an annual report. |
| Item 9. | Purchases of Equity Securities byClosed-End Management Investment Company and Affiliated Purchasers. |
Not applicable.
Item 10. Submission of Matters to a Vote of Security Holders.
There have been no material changes to the procedures by which the shareholders may recommend nominees to the registrant’s Board of Trustees during the period covered by the Annual Report included in Item 1 of this FormN-CSR.
Item 11. Controls and Procedures.
| (a) | The registrant’s principal executive and principal financial officers, or persons performing similar functions, have concluded that the registrant’s disclosure controls and procedures (as defined in Rule30a-3(c) under the Investment Company Act of 1940, as amended (the “1940 Act”) (17 CFR270.30a-3(c))) are effective, as of a date within 90 days of the filing date of the report that includes the disclosure required by this paragraph, based on their evaluation of these controls and procedures required by Rule30a-3(b) under the 1940 Act (17 CFR270.30a-3(b)) and Rules13a-15(b) or15d-15(b) under the Securities Exchange Act of 1934, as amended (17 CFR240.13a-15(b) or240.15d-15(b)). |
| (b) | There were no changes in the registrant’s internal control over financial reporting (as defined in Rule30a-3(d) under the 1940 Act (17 CFR270.30a-3(d)) that occurred during the registrant’s last fiscal quarterthat has materially affected, or is reasonably likely to materially affect, the registrant’s internal control over financial reporting. |
| Item 12. | Disclosure of Securities Lending Activities forClosed-End Management Investment Companies. |
Not applicable.
Item 13. Exhibits.
| (a)(1) | Code of Ethics attached hereto. |
| (a)(2) | Certifications pursuant to Rule30a-2(a) under the 1940 Act and Section 302 of the Sarbanes-Oxley Act of 2002 are attached hereto. |
| (a)(3) | Not applicable. |
| (a)(4) | Not applicable. |
| (b) | Certifications pursuant to Rule30a-2(b) under the 1940 Act and Section 906 of the Sarbanes-Oxley Act of 2002 are attached hereto. |
SIGNATURES
Pursuant to the requirements of the Securities Exchange Act of 1934 and the Investment Company Act of 1940, the registrant has duly caused this report to be signed on its behalf by the undersigned, thereunto duly authorized.
(Registrant) Insight Select Income Fund
By (Signature and Title)* /s/ Clifford D. Corso
Clifford D. Corso, President
(Principal Executive Officer)
Date May 14, 2019
Pursuant to the requirements of the Securities Exchange Act of 1934 and the Investment Company Act of 1940, this report has been signed below by the following persons on behalf of the registrant and in the capacities and on the dates indicated.
By (Signature and Title)* /s/ Clifford D. Corso
Clifford D. Corso, President
(Principal Executive Officer)
Date May 14, 2019
By (Signature and Title)* /s/ Thomas E. Stabile
Thomas E. Stabile, Treasurer
(Principal Financial Officer)
Date May 14, 2019