U. S.
SECURITIES AND EXCHANGE COMMISSION
WASHINGTON, D. C. 20549
FORM N-CSR
CERTIFIED SHAREHOLDER REPORT OF REGISTERED
MANAGEMENT INVESTMENT COMPANIES
Investment Company Act file number 811-2918
DUPREE MUTUAL FUNDS
(Exact Name of Registrant as Specified in Charter)
125 South Mill Street, Vine Center, Suite 100
Lexington, Kentucky 40507
(Address of Principal Executive Offices) (Zip Code)
Allen E. Grimes, III
125 South Mill Street, Vine Center, Suite 100
Lexington, Kentucky 40507
(Name and address of agent for service)
Registrant’s Telephone Number, including Area Code (859) 254-7741
Date of fiscal year end: June 30, 2016
Date of reporting period: July 1, 2015 through June 30, 2016
Item 1. Report to Stockholders

June 30, 2016
ANNUAL REPORT
TO SHAREHOLDERS
ABOUT DUPREE MUTUAL FUNDS
In 1941, Dupree & Company, Inc. began business in Harlan, Kentucky as a small securities brokerage firm specializing in tax-exempt municipal bonds.
Over the years the firm, which in 1963 moved its offices to Lexington, Kentucky, grew to become a regional leader in public finance, helping to structure complex and innovative municipal bond financing for some of the largest public projects in the Commonwealth of Kentucky.
In 1979, Dupree & Company began what is now Dupree Mutual Funds with the Kentucky Tax-Free Income Series and became the Fund’s investment adviser. The Fund was one of the first single-state municipal bond funds in the country, and the first mutual fund to invest solely in Kentucky municipal bonds. Since then, several new offerings have been added to the Dupree Mutual Funds family:
Kentucky Tax-Free Short-to-Medium Series in 1987;
Intermediate Government Bond Series in 1992;
Tennessee Tax-Free Income Series in 1993;
Tennessee Tax-Free Short-to-Medium Series in 1994;
North Carolina Tax-Free Income Series in 1995;
North Carolina Tax-Free Short-to-Medium Series in 1995;
Alabama Tax-Free Income Series in 2000;
Mississippi Tax-Free Income Series in 2000; and
Taxable Municipal Bond Series in 2010.
Today, after more than 60 years in business, Dupree continues to be a pioneer in the industry. Our Kentucky, Tennessee, and Mississippi Series are currently the ONLY 100% “no-load” municipal bond funds available in those states. No-load means simply that shares of the funds are offered directly to investors with no front or back-end sales charges, as opposed to load funds, which are sold through brokerage firms or other institutions that typically carry sales charges.
At Dupree Mutual Funds, our goal is a simple one: to offer investors a high-quality, low-cost way to invest in municipal and government bonds while providing superior service to our shareholders. We encourage you to let us know how we’re doing.
TABLE OF CONTENTS
Management’s Discussion of Fund Performance: | Unaudited |
Twelve Months Ended June 30, 2016i
The investment objective of our tax-free municipal bond funds is to provide a high level of tax-free income derived from state-specific municipal bonds without incurring undue risk to principal. The investment objective of our government bond fund is to provide a high level of taxable income derived from securities of the U.S. government and its agencies without incurring undue risk to principal. Similarly, the investment objective of the taxable municipal bond fund is to provide a high level of taxable income derived from taxable municipal securities without incurring undue risk to principal.
This report covers the 12-month period from July 1, 2015 through June 30, 2016 (the “reporting period”). During the first six months of the reporting period, the economy grew at a moderate pace. Real gross domestic product (GDP) increased at a 2.0 percent annual rate during the third quarter of 2015 and at a 0.9 percent annual rate in the fourth quarter of 2015. Real GDP increased at an annual rate of 0.8 percent during the first quarter of 2016. Economic growth ticked up slightly in the second quarter of 2016 with real GDP increasing at a 1.2 percent annual rate (advance estimate). All four of the quarterly GDP readings during the review period came in well below the trend growth rate. Economic growth during the first half of 2016 was anemic.
In the labor market, the national unemployment rate has fallen more than 5 percentage points from its peak and was 4.9 percent at the end of June. The labor participation rate (which measures the number of people actively seeking employment) was 62.7 percent at the end of June which is elevated by historical standards. Average hourly earnings increased at an annual rate of 2.6 percent through June.
Key measures of inflation remained subdued during the reporting period. The consumer price index (CPI) increased 1.0 percent on a year-over-year basis through June. Excluding food and energy, the core CPI increased 2.3 percent year-over-year. The personal consumption expenditure price index (PCE) increased 0.9 percent on a year-over-year basis through June. The core PCE (less food and energy) increased 1.6 percent year-over year. The core PCE has remained below the 2 percent target rate set by the Federal Reserve. Near-term and long-term inflation expectations remained well anchored.
The Federal Open Market Committee (FOMC) continued to maintain a highly accommodative stance during the period under review. The FOMC raised the federal funds target rate 25 basis points in December from 0-0.25 percent to 0.25 to 0.5 percent. This increase marked the end of a seven-year period during which the federal funds rate was held near zero. The FOMC left the fed funds target rate unchanged since its December meeting.
State and local governments have continued to successfully address ongoing fiscal challenges. However, state tax revenue growth slowed significantly in the second half of 2015 and in the first quarter of 2016. According to data compiled by the Rockefeller Institute, state and local government revenue from major taxes tracked by the Census Bureau grew by 4.2 percent in the fourth quarter of 2015, a substantial slowing from the 5.8 percent average for the four previous quarters. Total state tax revenue from all sources grew by 1.9 percent in the fourth quarter of 2015 and preliminary data for the first quarter of 2016 indicate another quarter of 1.9 percent growth.
Slowing revenue growth combined with volatile financial markets and increasing pension liabilities suggest that the outlook for state budgets in the 2016-17 state fiscal year will be less certain. Medicaid spending by states has continued to rise as a percentage of total state spending, growing from 20.5 percent in fiscal 2008 to an estimated 27.4 percent in fiscal 2015 (Source: National Association of State Budget Officers’ State Spending Report, 2015). State spending on Medicaid is expected to continue to increase in the coming years as federal funding is decreased under the Affordable Care Act.
Returns in the municipal bond market were very strong for the 12-month period under review. The Barclays Capital Municipal Bond Index (“BCMBI”), which tracks investment grade municipal securities across all sectors and maturities, had a total return of 7.65 percent for the twelve month period ended June 30, 2016. As of June 30, the BCMBI had a modified adjusted duration of 5.55 years.
A number of factors including declining interest rates, improving credit quality, and favorable supply/demand patterns led to lower yields and higher bond prices during the reporting period. Duration was the key factor in performance during the reporting period, with bonds with longer maturities significantly outperforming those with shorter maturities. Additionally, with a couple of exceptions (Puerto Rican bonds being a notable example) lower rated bonds generally outperformed higher rated bonds during the review period. As in the past, none of our single-state municipal bonds hold any Puerto Rican bonds.
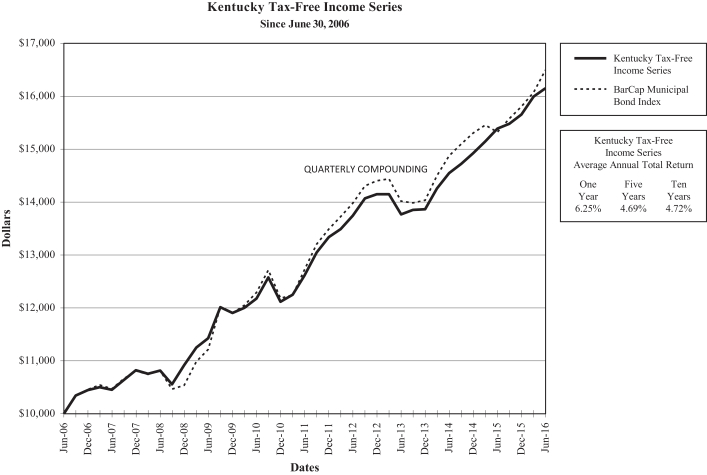
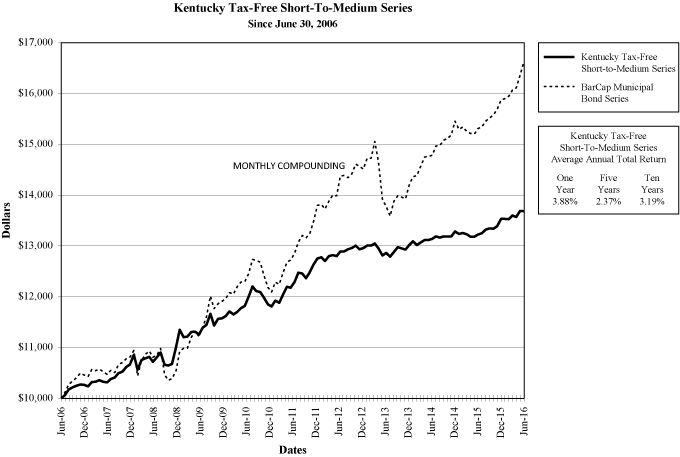
The Kentucky Tax-Free Income Series provided shareholders a total return of 6.25 percent for the twelve months ended June 30, 2016. The Kentucky Tax-Free Short-to-Medium Series provided shareholders with a total return of 3.88 percent during
i
the period under review. The shorter duration of the funds (Kentucky Tax-Free Income Series had a modified adjusted duration of 4.65 years and the Kentucky Tax-Free Short-to-Medium Series had a modified adjusted duration of 3.82 years as of June 30) as compared to the index led to the relative underperformance of the funds during the reporting period.
Kentucky’s economy has continued to rebound from the recession in 2009. Kentucky’s General Fund receipts have risen for six consecutive years. For the fiscal year that ended June 30, 2016, General Fund receipts were 3.7 percent more than FY 15 tax collections. General Fund revenues exceeded the official revenue estimate by $49.0 million. Road Fund collections for FY 16 decreased by 2.9 percent from the previous fiscal year but still exceeded estimates by $36.6 million. The state’s annual average unemployment rate declined during the reporting period and stood at 5.0 percent at the end of June. In 2015, Kentucky had a per capita personal income of $38,989 which was well below the national average of $48,703.
The state’s appropriation supported debt was rated Aa3 by Moody’s and A by Standard & Poor’s as of June 30, 2016. Kentucky had net tax-supported debt per capita of $1,954 as of calendar year-end 2015, which was substantially above the state net tax-supported debt median of $1,025 (Source: Moody’s Investors Services, Medians-Total Debt Remains Static in 2016,State Debt Medians 2016, May 6, 2016).
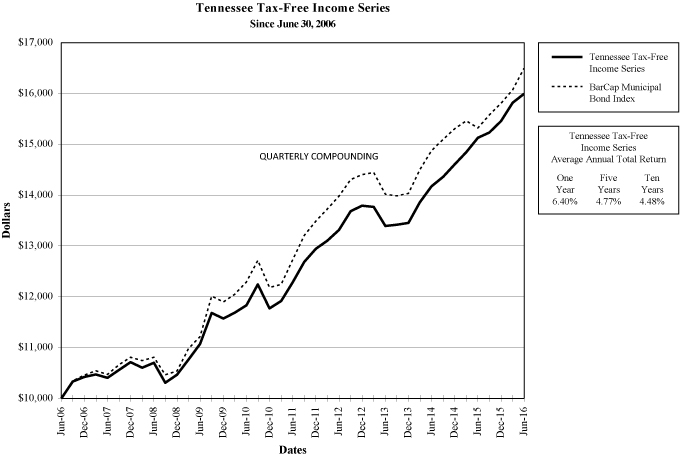
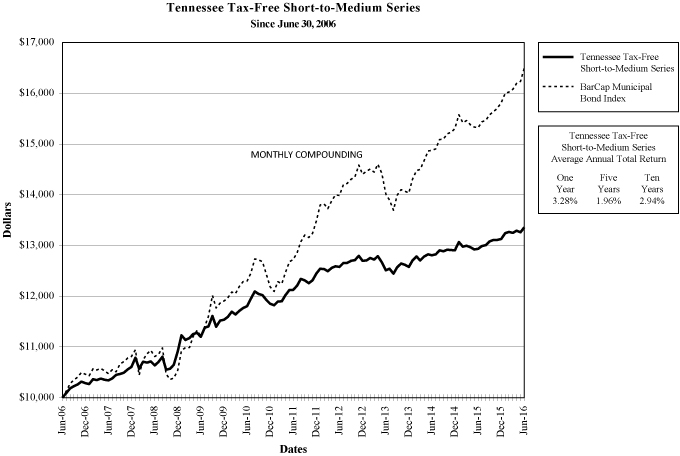
The Tennessee Tax-Free Income Series provided shareholders with a total return of 6.40 percent for the twelve months ended June 30, 2016. The Tennessee Tax-Free Short-to-Medium Series had a total return of 3.28 percent for the period under review. The shorter duration of the funds (Tennessee Tax-Free Income Series had a modified adjusted duration of 4.60 years and Tennessee Tax-Free Short-to-Medium Series had a modified adjusted duration of 3.56 years as of June 30) as compared to the index led to the relative underperformance of the funds during the reporting period.
Economic growth in Tennessee has largely mirrored that of the U.S. in recent years. Both the state and the nation have now had more than six years of growth since the end of the Great Recession. In Tennessee, inflation-adjusted gross domestic product (GDP) expanded by 2.4 percent in 2015 and is projected to increase at an annual rate of 2.3 percent in 2016. The state has continued to diversify its manufacturing base by adding high-tech employers. Automobile manufacturing continues to be an important part of the state’s economy. The state’s annual average unemployment rate at the end of June was 4.1 percent. In 2015, the state had a per capita personal income of $42,069 which was below the national average of $48,703.
Tennessee relies on a combination of a state sales tax, corporate income taxes, franchise and excise taxes, and the Hall income tax for its revenue. Total state revenue collections through June (on an accrual basis June is the eleventh month in the 2015-2016 fiscal year) were $911.2 million more than the budgeted estimate. The general fund recorded revenues in the amount of $841.1 million more than the budgeted estimate, and the four other funds $70.1 million more than the budgeted estimate.
Tennessee’s general obligation (G.O.) bonds were rated Aaa by Moody’s and AAA by Standard & Poor’s as of June 30, 2016. Tennessee had net tax-supported debt per capita of $298 as of calendar year-end 2015, which was substantially below the state net tax-supported debt median of $1,025 (Source: Moody’s Investors Services, Medians-Total Debt Remains Static in 2016, State Debt Medians 2016, May 6, 2016).
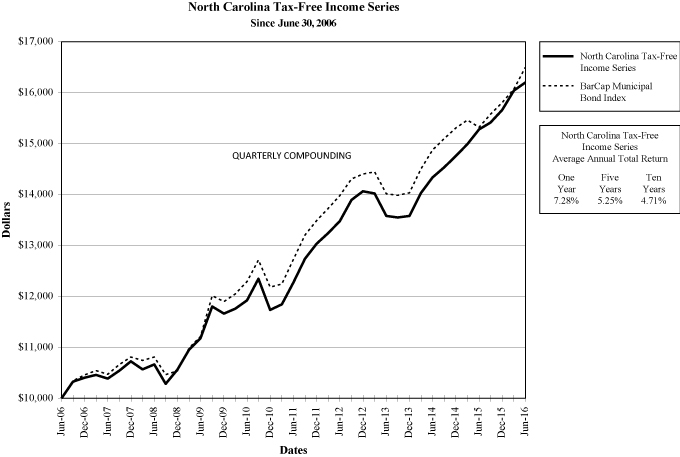
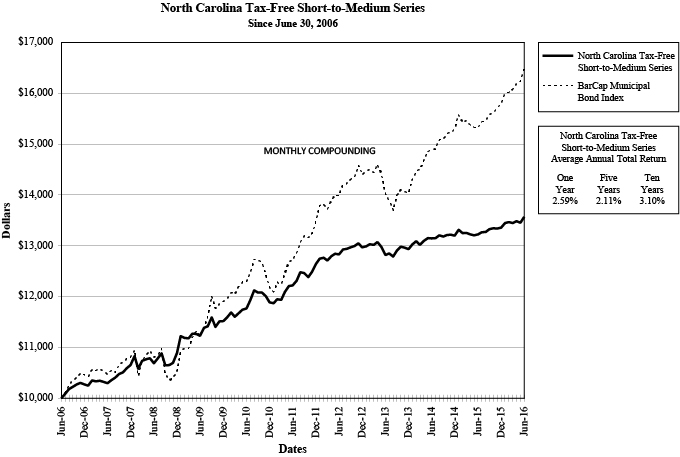
The North Carolina Tax-Free Income Series provided shareholders with a total return of 7.28 percent for the twelve months ended June 30, 2016. The North Carolina Tax-Free Short-to-Medium Series provided shareholders with a total return of 2.59 percent for the period under review. The shorter duration of the funds (North Carolina Tax-Free Income Series had a modified adjusted duration of 5.38 years and North Carolina Tax-Free Short-to-Medium Series had a modified adjusted duration of 3.61 years as of June 30) led to the relative underperformance of the funds during the reporting period.
North Carolina’s economy has rebounded strongly from the national recession. The state finished FY 15 with a budget surplus of approximately $400 million. The state’s average annual unemployment rate at the end of June was 4.9 percent. In 2015, North Carolina had a per capita personal income of $40,656 which was below the national average of $48,703.
North Carolina’s general obligation (G.O.) bonds were rated Aaa by Moody’s and AAA by Standard & Poor’s as of June 30, 2016. North Carolina had net tax-supported debt per capita of $721 as of calendar year-end 2015, which was below the state net tax-supported debt median of $1,025 (Source: Moody’s Investors Services, Medians- Total Debt Remains Static in 2016, State Debt Medians 2016, May 6, 2016).
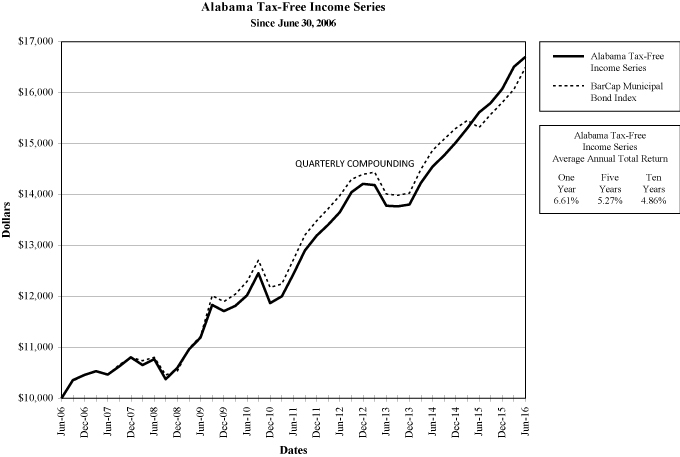
The Alabama Tax-Free Income Series provided shareholders with a total return of 6.61 percent for the twelve months ended June 30, 2016. The shorter duration of the fund (4.09 years as of June 30) as compared to the index led to the relative underperformance of the fund during the reporting period.
ii
Alabama is finally beginning to see growth accelerate following years of relatively subdued recovery. Manufacturing, professional, and business services have led the recent improvement. Tuscaloosa is a bright spot for the state as it is home to the University of Alabama and a Mercedes plant that has recently undergone an expansion. An Airbus jetliner plant is being built in Mobile which will help the state’s manufacturing sector to continue to grow. The state’s average annual unemployment rate at the end of June stood at 6.0 percent. In 2015, Alabama had a per capita personal income of $38,965 which was below the national average of $48,703.
Alabama’s G.O. bonds were rated Aa1 by Moody’s and AA by Standard & Poor’s as of June 30, 2016. Alabama had net tax-supported debt per capita of $849 as of calendar year-end 2015, which was lower than the state net tax-supported debt median of $1,025 (Source: Moody’s Investors Services, Medians-Total Debt Remains Static in 2016,State Debt Medians 2016, May 6, 2016).
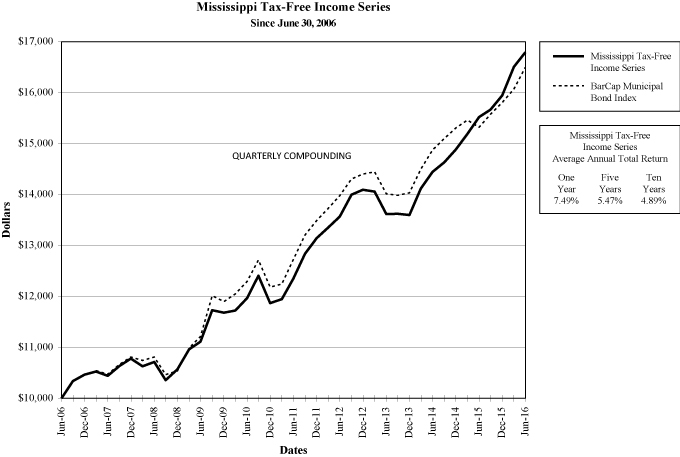
The Mississippi Tax-Free Income Series had a total return of 7.49 percent for the twelve month period ended June 30, 2016. The shorter duration of the fund (4.79 years as of June 30) as compared to the index led to the relative underperformance of the fund during the reporting period.
Mississippi’s economic recovery has also continued to lag behind the nation. Employment across all levels of government, the largest employer of Mississippians, has remained relatively flat. Out-migration has weighed on local industries, most notably retail, financial services and construction. The manufacturing sector has showed some signs of improvement. The shipbuilding industry continues to be negatively impacted by policies that would allow more competition for U.S. shipbuilding. The state’s average annual unemployment rate at the end of June was 5.9 percent. In 2015, Mississippi had a per capita personal income of $35,444 which was the lowest in the nation.
The state’s G.O. bonds were rated Aa2 by Moody’s and AA by Standard & Poor’s as of June 30, 2016. Mississippi has net tax-supported debt per capita of $1,707 as of calendar year-end 2015, which was higher than the state net tax-supported debt median of $1,025 (Source: Moody’s Investors Services, Medians-Total Debt Remains Static in 2016, State Debt Medians 2016, May 6, 2016).
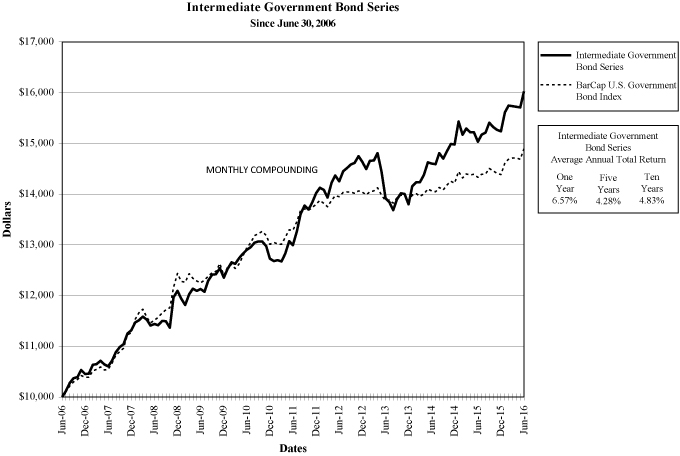
The Intermediate Government Bond Series had a total return of 6.57 percent for the twelve months ended June 30, 2016. The Barclays Capital U.S. Intermediate Government Bond Index had a total return of 3.93 percent for the one year period ended June 30, 2016. The longer duration of the fund (5.87 years as of June 30 compared to 3.89 years for the index) led to the relative outperformance of the fund during the reporting period.
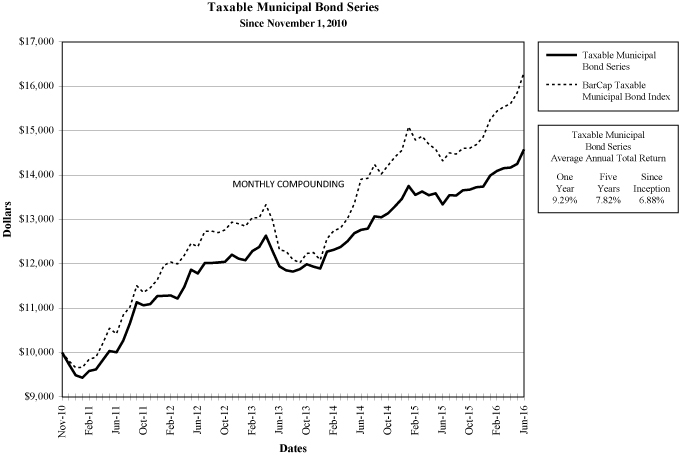
The Taxable Municipal Bond Series had a total return of 9.29 percent for the twelve month period ended June 30, 2016. The Barclays Capital Municipal Bond Taxable Index had a total return of 12.71 percent for the same period. The shorter duration of the fund (7.10 years as of June 30 compared to 9.73 for the index) led to the relative underperformance of the fund during the reporting period.
Please note that index information is provided for reference only. No index can perfectly match the investments that make up a fund’s portfolio. In making investment decisions for our portfolios we do not attempt to track indices. The Barclays Capital Municipal Bond index is national in scope and does not necessarily reflect the performance of state-specific municipal bond funds. Indices do not take into account any operating expenses or transaction costs. An investment cannot be made directly in an index.
i Data are from the Bureau of Economic Analysis, the U.S. Department of Labor Bureau of Labor Statistics, and various other sources management deems to be reliable. Some of the quoted data are preliminary in nature and may be subject to revision. Any opinions expressed herein are those of the funds’ portfolio management and are current as of June 30, 2016. They are not guarantees of performance or investment results and should not be taken as investment advice. Past performance is not a guarantee of future performance and you may lose money investing in the funds.
iii
The illustrations below provide each Fund’s sector allocation and | Unaudited |
summarize key information about each Fund’s investments.
| | | | |
Kentucky Tax-Free Income Series | |
| CREDIT QUALITY* | | % of Net Assets
at Fair Value | |
Aaa/AAA | | | 2.68% | |
Aa/AA | | | 82.38% | |
A | | | 11.97% | |
B | | | 0.31% | |
Not Rated | | | 2.66% | |
| | | | | |
| | | | 100.00% | |
| | | | | |
| COMPOSITION | | | |
| | | % of Net Assets | |
Prerefunded | | | 23.17% | |
Miscellaneous Public Improvement | | | 18.22% | |
Municipal Utility Revenue | | | 11.81% | |
Refunded | | | 9.08% | |
Turnpikes and Toll Roads Revenue | | | 8.74% | |
School Improvements | | | 7.80% | |
University Consolidated Education and Building Revenue | | | 7.53% | |
Hospital and Healthcare Revenue | | | 6.52% | |
Public Facilities Revenue | | | 3.82% | |
Airport Revenue | | | 1.11% | |
State and Local Mortgage Revenue | | | 1.09% | |
Miscellaneous Revenue | | | 0.24% | |
Other Assets Less Liabilities | | | 0.87% | |
| | | | | |
| | | | 100.00% | |
| | | | | |
| | | | |
Kentucky Tax-Free Short-to-Medium Series | |
| CREDIT QUALITY* | | % of Net Assets
at Fair Value | |
Aaa/AAA | | | 1.19% | |
Aa/AA | | | 84.44% | |
A | | | 14.37% | |
| | | | | |
| | | | 100.00% | |
| | | | | |
| COMPOSITION | | | |
| | | % of Net Assets | |
Miscellaneous Public Improvement | | | 22.66% | |
School Improvements | | | 14.88% | |
Refunded | | | 14.45% | |
Public Facilities Revenue | | | 11.56% | |
Prerefunded | | | 8.72% | |
Turnpikes and Toll Roads Revenue | | | 8.59% | |
University Consolidated Education and Building Revenue | | | 6.21% | |
Municipal Utility Revenue | | | 5.52% | |
Hospital and Healthcare Revenue | | | 5.04% | |
State and Local Mortgage Revenue | | | 0.92% | |
Other Assets Less Liabilities | | | 1.45% | |
| | | | | |
| | | | 100.00% | |
| | | | | |
| | | | |
Alabama Tax-Free Income Series | |
| CREDIT QUALITY* | | % of Net Assets
at Fair Value | |
Aaa/AAA | | | 0.40% | |
Aa/AA | | | 75.30% | |
A | | | 21.89% | |
Not Rated | | | 2.41% | |
| | | | | |
| | | | 100.00% | |
| | | | | |
| COMPOSITION | | | |
| | | % of Net Assets | |
School Improvement Revenue | | | 19.76% | |
Prerefunded | | | 19.49% | |
Municipal Utility Revenue | | | 19.11% | |
Public Facilities Revenue | | | 11.79% | |
University Consolidated Education and Building Revenue | | | 11.56% | |
Miscellaneous Public Improvement | | | 6.91% | |
Refunded | | | 5.80% | |
Hospital and Healthcare Revenue | | | 3.55% | |
State and Local Mortgage Revenue | | | 0.39% | |
Industrial Revenue | | | 0.07% | |
Other Assets Less Liabilities | | | 1.57% | |
| | | | | |
| | | | 100.00% | |
| | | | | |
| | | | |
Mississippi Tax-Free Income Series | |
| CREDIT QUALITY* | | % of Net Assets
at Fair Value | |
Aaa/AAA | | | 0.22% | |
Aa/AA | | | 59.13% | |
A | | | 40.56% | |
Not Rated | | | 0.09% | |
| | | | | |
| | | | 100.00% | |
| | | | | |
| COMPOSITION | | | |
| | | % of Net Assets | |
Prerefunded | | | 28.84% | |
University Consolidated Education and Building Revenue | | | 26.13% | |
Public Facilities Revenue | | | 15.59% | |
Municipal Utility Revenue | | | 12.83% | |
Turnpikes and Toll Roads Revenue | | | 6.08% | |
School Improvement Revenue | | | 4.93% | |
Hospital and Healthcare Revenue | | | 3.40% | |
Refunded | | | 1.87% | |
Miscellaneous Public Improvement | | | 1.39% | |
State and Local Mortgage Revenue | | | 0.22% | |
Other Liabilities in Excess of Assets | | | (1.28 | )% |
| | | | | |
| | | | 100.00% | |
| | | | | |
iv
The illustrations below provide each Fund’s sector allocation and | Unaudited |
summarize key information about each Fund’s investments.
| | | | |
Tennessee Tax-Free Income Series | |
| CREDIT QUALITY* | | % of Net Assets
at Fair Value | |
Aaa/AAA | | | 2.34% | |
Aa/AA | | | 78.78% | |
A | | | 15.70% | |
Not Rated | | | 3.18% | |
| | | | | |
| | | | 100.00% | |
| | | | | |
| COMPOSITION | | | |
| | | % of Net Assets | |
Municipal Utility Revenue | | | 39.83% | |
Prerefunded | | | 16.11% | |
Public Facilities Revenue | | | 12.20% | |
University Consolidated Education and Building Revenue | | | 7.98% | |
Hospital and Healthcare Revenue | | | 7.45% | |
Refunded | | | 7.28% | |
State and Local Mortgage Revenue | | | 2.18% | |
Miscellaneous Public Improvement | | | 2.04% | |
Airport Revenue | | | 1.83% | |
School Improvement Revenue | | | 1.40% | |
Industrial Revenue | | | 0.84% | |
Escrowed to Maturity | | | 0.07% | |
Other Assets Less Liabilities | | | 0.79% | |
| | | | | |
| | | | 100.00% | |
| | | | | |
| | | | |
Tennessee Tax-Free Short-to-Medium Series | |
| CREDIT QUALITY* | | % of Net Assets
at Fair Value | |
Aa/AA | | | 69.89% | |
A | | | 26.48% | |
Not Rated | | | 3.63% | |
| | | | | |
| | | | 100.00% | |
| | | | | |
| COMPOSITION | | | |
| | | % of Net Assets | |
Prerefunded | | | 21.78% | |
Public Facilities Revenue | | | 16.69% | |
Municipal Utility Revenue | | | 14.27% | |
Refunded | | | 12.69% | |
School Improvement Revenue | | | 9.13% | |
Miscellaneous Public Improvement | | | 7.80% | |
University Consolidated Education and Building Revenue | | | 6.02% | |
State and Local Mortgage Revenue | | | 2.98% | |
Hospital and Healthcare Revenue | | | 2.55% | |
Airport Revenue | | | 1.04% | |
Escrowed to Maturity | | | 0.23% | |
Other Assets Less Liabilities | | | 4.82% | |
| | | | | |
| | | | 100.00% | |
| | | | | |
| | | | |
North Carolina Tax-Free Income Series | |
| CREDIT QUALITY* | | % of Net Assets
at Fair Value | |
Aaa/AAA | | | 3.04% | |
Aa/AA | | | 79.51% | |
A | | | 15.45% | |
Baa/BBB | | | 0.92% | |
Not Rated | | | 1.08% | |
| | | | | |
| | | | 100.00% | |
| | | | | |
| COMPOSITION | | | |
| | | % of Net Assets | |
Prefunded | | | 18.69% | |
University Consolidated Education and Building Revenue | | | 16.90% | |
Municipal Utility Revenue | | | 13.28% | |
Hospital and Healthcare | | | 13.20% | |
Refunded | | | 10.13% | |
School Improvement Revenue | | | 7.23% | |
Public Facilities Revenue | | | 5.83% | |
Miscellaneous Public Improvement | | | 4.12% | |
Airport Revenue | | | 3.22% | |
Turnpikes and Toll Roads Revenue | | | 1.64% | |
Escrowed to Maturity | | | 1.49% | |
Lease Revenue | | | 1.23% | |
Miscellaneous Revenue | | | 0.41% | |
Other Assets Less Liabilities | | | 2.63% | |
| | | | | |
| | | | 100.00% | |
| | | | | |
| | | | |
North Carolina Tax-Free Short-to-Medium Series | |
| CREDIT QUALITY* | | % of Net Assets
at Fair Value | |
Aaa/AAA | | | 0.62% | |
Aa/AA | | | 86.98% | |
A | | | 12.20% | |
Not Rated | | | 0.20% | |
| | | | | |
| | | | 100.00% | |
| | | | | |
| COMPOSITION | | | |
| | | % of Net Assets | |
Prefunded | | | 22.05% | |
Refunded | | | 21.11% | |
Municipal Utility Revenue | | | 14.41% | |
School Improvement Revenue | | | 8.65% | |
Hospital and Healthcare Revenue | | | 7.97% | |
University Consolidated Education and Building Revenue | | | 5.18% | |
Miscellaneous Public Improvement | | | 5.08% | |
Public Facilities Revenue | | | 4.88% | |
Escrowed to Maturity | | | 3.76% | |
Turnpikes and Toll Roads Revenue | | | 1.36% | |
Ad Valorem Property | | | 1.24% | |
Lease Revenue | | | 1.12% | |
Airport Revenue | | | 0.84% | |
Other Assets Less Liabilities | | | 2.35% | |
| | | | | |
| | | | 100.00% | |
| | | | | |
v
The illustrations below provide each Fund’s sector allocation and | Unaudited |
summarize key information about each Fund’s investments.
| | | | |
Intermediate Government Bond Series | |
| CREDIT QUALITY* | | % of Net Assets
at Fair Value | |
Aaa/AAA | | | 100.00% | |
| | | | | |
| COMPOSITION | | | |
| | | % of Net Assets | |
Federal Farm Credit | | | 59.97% | |
Federal Home Loan Bank | | | 30.49% | |
Federal National Mortgage Association | | | 6.98% | |
Other Assets Less Liabilities | | | 2.56% | |
| | | | | |
| | | | 100.00% | |
| | | | | |
| | | | |
Taxable Municipal Bond Series | |
| CREDIT QUALITY* | | % of Net Assets
at Fair Value | |
Aa/AA | | | 82.77% | |
A | | | 17.23% | |
| | | | | |
| | | | 100.00% | |
| | | | | |
| COMPOSITION | | | |
| | | % of Net Assets | |
Public Facilities Revenue | | | 30.56% | |
Municipal Utility Revenue | | | 26.35% | |
School Improvement Revenue | | | 13.68% | |
Miscellaneous Public Improvement | | | 10.22% | |
Hospital and Healthcare Revenue | | | 4.35% | |
Turnpikes and Toll Roads Revenue | | | 3.54% | |
Marina and Port Authority Revenue | | | 2.27% | |
Sales Tax Revenue | | | 2.13% | |
University Consolidated Education and Building Revenue | | | 1.13% | |
Other Assets Less Liabilities | | | 5.77% | |
| | | | | |
| | | | 100.00% | |
| | | | | |
| | * | | Ratings by Moody’s Investors Services, Inc. unless noted otherwise. See Schedule of Portfolio Investments for individual bond ratings. |
vi
PERFORMANCE COMPARISON (Unaudited)
The following graphs compare the change in value of a $10,000 investment in each series of Dupree Mutual Funds with the change in value of a $10,000 investment in a comparable index. The comparisons are made over 10 years or since the inception of the series, if shorter than ten years. Results are for the fiscal years ended June 30.
Notes on Graphs:
Results reflect reinvestment of all dividend and capital gain distributions. No index can perfectly match the investments that make up a fund’s portfolio. For each series, we have selected an index that we believe gives the most accurate picture of how the series performed during the reporting period. The investor should understand that an index is a mathematical hypothesis and does not reflect a real market situation. For example, the portfolio of each index is replaced with an entirely different portfolio each year without reflecting operating expenses or transaction costs, an impossibility in reality. On the other hand, the fund’s performance reflects not only these factors but management costs as well. Past performance is not indicative of future results.
The performance tables and the graphs above do not reflect the deduction of taxes that a shareholder would pay on fund distributions or the redemption of fund shares.
Please note that all legacy Lehman Brothers benchmark indices were rebranded as Barclays Capital (“BarCap”) indices in November 2008.
vii
viii
ix
x
xi
xii
xiii
xiv
xv
xvi
xvii
DUPREE MUTUAL FUNDS — ALABAMA TAX-FREE INCOME SERIES
SCHEDULE OF PORTFOLIO INVESTMENTS
Alabama Municipal Bonds — 100% of Net Assets
June 30, 2016
| | | | | | | | | | | | | | | | | | |
| Bond Description | | Coupon | | | Maturity
Date | | | Rating# | | Par Value | | | Fair Value | |
| SCHOOL IMPROVEMENT BONDS | | | | | | | | | | | | | | | | | | |
| 19.76% of Net Assets | | | | | | | | | | | |
Alabaster AL Board of Education Special Tax Warrants | | | 5.000 | % | | | 09/01/2039 | | | A1 | | $ | 600,000 | | | $ | 716,556 | |
Decatur City AL Board of Education Special Tax | | | 5.000 | | | | 02/01/2040 | | | Aa3 | | | 225,000 | | | | 269,564 | |
Etowah County AL Board of Education Capital Outlay Tax | | | 5.000 | | | | 09/01/2037 | | | A+* | | | 200,000 | | | | 231,760 | |
Jasper AL Warrants | | | 5.000 | | | | 03/01/2032 | | | A2 | | | 450,000 | | | | 536,711 | |
Limestone County AL Board of Education | | | 5.000 | | | | 07/01/2033 | | | AA* | | | 255,000 | | | | 304,241 | |
Madison County AL Board of Education Capital Outlay | | | 5.000 | | | | 09/01/2031 | | | Aa3 | | | 660,000 | | | | 815,621 | |
Marshall County AL Board of Education Special Tax School Warrants | | | 4.000 | | | | 03/01/2033 | | | A2 | | | 250,000 | | | | 279,520 | |
Montgomery AL Warrants | | | 5.000 | | | | 03/01/2028 | | | Aa1 | | | 35,000 | | | | 35,977 | |
Montgomery County AL Board of Education Capital Outlay School Warrants | | | 5.000 | | | | 09/01/2039 | | | AA* | | | 150,000 | | | | 176,363 | |
Morgan County AL Board of Education Capital Outlay Warrants | | | 5.000 | | | | 03/01/2035 | | | AA-* | | | 1,050,000 | | | | 1,228,983 | |
Opelika AL Warrants | | | 5.000 | | | | 11/01/2031 | | | Aa2 | | | 150,000 | | | | 176,486 | |
Phenix City AL School Warrants | | | 5.000 | | | | 08/01/2024 | | | AA-* | | | 80,000 | | | | 81,918 | |
Shelby County AL Board of Education Capital Outlay Warrants | | | 5.000 | | | | 02/01/2031 | | | Aa2 | | | 615,000 | | | | 705,922 | |
Shelby County AL Board of Education Special Tax School Warrants | | | 5.000 | | | | 02/01/2025 | | | Aa3 | | | 5,000 | | | | 5,015 | |
Sumter County AL Limited Obligation School Warrants | | | 5.100 | | | | 02/01/2034 | | | NR | | | 100,000 | | | | 104,247 | |
Sumter County AL Limited Obligation School Warrants | | | 5.200 | | | | 02/01/2039 | | | NR | | | 95,000 | | | | 99,341 | |
Troy AL Public Educational Building Authority | | | 5.250 | | | | 12/01/2036 | | | A2 | | | 30,000 | | | | 34,653 | |
| | | | | | | | | | | | | | | | | | |
| | | | | | | | | | | | | | | | | 5,802,875 | |
| PREREFUNDED BONDS | | | | | | | | | | | |
| 19.49’% of Net Assets | | | | | | | | | | | | | | | | | | |
AL State Public School & College Authority Capital Improvement | | | 5.000 | | | | 12/01/2024 | | | Aa1 | | | 100,000 | | | | 106,165 | |
AL State Public School & College Authority Capital Improvement | | | 5.000 | | | | 12/01/2025 | | | Aa1 | | | 640,000 | | | | 679,456 | |
AL State Public School & College Authority Refinancing | | | 5.000 | | | | 05/01/2024 | | | Aa1 | | | 125,000 | | | | 139,766 | |
Albertville AL Warrants | | | 5.000 | | | | 02/01/2035 | | | AA* | | | 110,000 | | | | 121,950 | |
Auburn University AL General Fee Revenue | | | 5.000 | | | | 06/01/2027 | | | Aa2 | | | 300,000 | | | | 312,054 | |
Auburn University AL General Fee Revenue | | | 5.000 | | | | 06/01/2033 | | | Aa2 | | | 420,000 | | | | 436,876 | |
Auburn University AL General Fee Revenue | | | 5.000 | | | | 06/01/2038 | | | Aa2 | | | 600,000 | | | | 624,108 | |
Auburn University AL General Fee Revenue | | | 5.000 | | | | 06/01/2022 | | | Aa2 | | | 50,000 | | | | 54,102 | |
Elmore County AL Public Education Cooperative | | | 5.000 | | | | 08/01/2032 | | | Aa3 | | | 50,000 | | | | 52,356 | |
Fort Payne AL Waterworks Board Water Revenue | | | 4.750 | | | | 07/01/2034 | | | AA-* | | | 100,000 | | | | 111,760 | |
Huntsville AL Public Building Authority Lease Revenue | | | 5.000 | | | | 10/01/2027 | | | Aa1 | | | 130,000 | | | | 134,289 | |
Huntsville AL Public Building Authority Lease Revenue | | | 5.000 | | | | 10/01/2033 | | | Aa1 | | | 65,000 | | | | 67,144 | |
Jacksonville AL State University | | | 5.125 | | | | 12/01/2033 | | | AA* | | | 235,000 | | | | 259,663 | |
Madison County AL Board of Education Capital Outlay Tax | | | 4.950 | | | | 09/01/2025 | | | Aa3 | | | 100,000 | | | | 109,134 | |
Madison County AL Board of Education Capital Outlay Tax | | | 5.100 | | | | 09/01/2028 | | | Aa3 | | | 285,000 | | | | 312,015 | |
Madison County AL Board of Education Capital Outlay Tax | | | 5.125 | | | | 09/01/2034 | | | Aa3 | | | 505,000 | | | | 553,142 | |
Mobile AL Public Education Building Authority | | | 5.000 | | | | 03/01/2033 | | | A3 | | | 200,000 | | | | 214,490 | |
Montgomery AL Warrants | | | 5.000 | | | | 03/01/2028 | | | Aa1 | | | 140,000 | | | | 144,117 | |
Muscle Shoals AL Utilities Board Water & Sewer | | | 5.750 | | | | 12/01/2033 | | | NR | | | 330,000 | | | | 369,402 | |
North Marshall AL Utilities Board Water Revenue | | | 5.100 | | | | 10/01/2030 | | | AA* | | | 375,000 | | | | 412,343 | |
Phenix City AL School Warrants | | | 5.000 | | | | 02/01/2017 | | | NR | | | 120,000 | | | | 123,106 | |
Troy AL Public Educational Building Authority | | | 5.250 | | | | 12/01/2036 | | | A2 | | | 195,000 | | | | 231,483 | |
West Morgan — East Lawrence Water Authority AL Water Revenue | | | 5.000 | | | | 08/15/2025 | | | A2 | | | 150,000 | | | | 158,372 | |
| | | | | | | | | | | | | | | | | | |
| | | | | | | | | | | | | | | | | 5,727,291 | |
| MUNICIPAL UTILITY REVENUE BONDS | | | | | | | | | | | |
| 19.11% of Net Assets | | | | | | | | | | | | | | | | | | |
Auburn AL Waterworks Board Water Revenue | | | 5.000 | | | | 09/01/2036 | | | Aa2 | | | 250,000 | | | | 305,278 | |
Bessemer AL Governmental Utility Services Water Supply | | | 4.750 | | | | 06/01/2033 | | | A2 | | | 100,000 | | | | 103,329 | |
Birmingham AL Waterworks Board Water Revenue | | | 4.750 | | | | 01/01/2036 | | | Aa2 | | | 215,000 | | | | 243,909 | |
Birmingham AL Waterworks Board Water Revenue | | | 5.000 | | | | 01/01/2026 | | | Aa2 | | | 80,000 | | | | 92,943 | |
Birmingham AL Waterworks Board Water Revenue | | | 5.000 | | | | 01/01/2040 | | | Aa2 | | | 150,000 | | | | 180,860 | |
Birmingham AL Waterworks Board Water Revenue | | | 5.000 | | | | 01/01/2038 | | | Aa2 | | | 550,000 | | | | 639,579 | |
Chatom AL Industrial Board Gulf Opportunity Zone | | | 5.000 | | | | 08/01/2037 | | | A3 | | | 150,000 | | | | 170,220 | |
Cullman AL Utility Board Water Revenue | | | 4.750 | | | | 09/01/2037 | | | A1 | | | 400,000 | | | | 439,408 | |
Huntsville AL Water Systems Revenue Bonds | | | 5.000 | | | | 11/01/2033 | | | Aa1 | | | 300,000 | | | | 321,888 | |
Jasper AL Waterworks and Sewer Board Utility Revenue | | | 5.000 | | | | 06/01/2030 | | | A+* | | | 455,000 | | | | 521,944 | |
The accompanying notes are an integral part of the financial statements.
1
DUPREE MUTUAL FUNDS — ALABAMA TAX-FREE INCOME SERIES
SCHEDULE OF PORTFOLIO INVESTMENTS
Alabama Municipal Bonds — 100% of Net Assets
June 30, 2016
| | | | | | | | | | | | | | | | | | |
| Bond Description | | Coupon | | | Maturity
Date | | | Rating# | | Par Value | | | Fair Value | |
Limestone County AL Water & Sewer Authority | | | 5.000 | % | | | 12/01/2033 | | | A* | | $ | 300,000 | | | $ | 354,939 | |
Limestone County AL Water & Sewer Authority | | | 4.750 | | | | 12/01/2034 | | | AA* | | | 375,000 | | | | 455,948 | |
Limestone County AL Water & Sewer Authority | | | 5.000 | | | | 12/01/2034 | | | A* | | | 250,000 | | | | 305,520 | |
Limestone County AL Water & Sewer Authority | | | 4.750 | | | | 12/01/2035 | | | AA* | | | 400,000 | | | | 463,664 | |
Muscle Shoals AL Utilities Board Water & Sewer | | | 5.750 | | | | 12/01/2033 | | | AA-* | | | 100,000 | | | | 111,096 | |
Opelika AL Water Board Revenue | | | 5.000 | | | | 06/01/2037 | | | Aa3 | | | 250,000 | | | | 280,213 | |
Opelika AL Water Board Revenue | | | 5.250 | | | | 06/01/2036 | | | Aa3 | | | 70,000 | | | | 79,840 | |
Phenix City AL Water and Sewer | | | 5.000 | | | | 08/15/2034 | | | A3 | | | 90,000 | | | | 100,047 | |
Tallassee AL Water Gas and Sewer Warrants | | | 5.125 | | | | 05/01/2036 | | | A2 | | | 75,000 | | | | 84,113 | |
West Morgan East Lawrence AL Water & Sewer | | | 4.850 | | | | 08/15/2035 | | | AA* | | | 250,000 | | | | 275,360 | |
West Morgan East Lawrence AL Water & Sewer | | | 4.750 | | | | 08/15/2030 | | | AA* | | | 75,000 | | | | 83,756 | |
| | | | | | | | | | | | | | | | | | |
| | | | | | | | | | | | | | | | | 5,613,851 | |
| PUBLIC FACILITIES REVENUE BONDS | | | | | | | | | | | |
| 11.79% of Net Assets | | | | | | | | | | | | | | | | | | |
Anniston AL Public Building Authority | | | 5.000 | | | | 03/01/2032 | | | A2 | | | 400,000 | | | | 457,264 | |
Anniston AL Public Building Authority DHR Project | | | 5.250 | | | | 05/01/2030 | | | AA-* | | | 50,000 | | | | 57,185 | |
Anniston AL Public Building Authority DHR Project | | | 5.500 | | | | 05/01/2033 | | | AA-* | | | 200,000 | | | | 230,518 | |
Bessemer AL Public Educational Building Authority Revenue | | | 5.000 | | | | 07/01/2030 | | | AA* | | | 250,000 | | | | 283,975 | |
Huntsville AL Public Building Authority Lease Revenue | | | 5.000 | | | | 10/01/2027 | | | Aa1 | | | 245,000 | | | | 252,328 | |
Huntsville AL Public Building Authority Lease Revenue | | | 5.000 | | | | 10/01/2033 | | | Aa1 | | | 110,000 | | | | 113,391 | |
Lowndes County AL Warrants | | | 5.250 | | | | 02/01/2037 | | | A2 | | | 250,000 | | | | 282,735 | |
Montgomery AL Warrants | | | 5.000 | | | | 02/01/2030 | | | A1 | | | 300,000 | | | | 338,877 | |
Trussville AL Warrants | | | 5.000 | | | | 10/01/2039 | | | Aa2 | | | 1,220,000 | | | | 1,448,701 | |
| | | | | | | | | | | | | | | | | | |
| | | | | | | | | | | | | | | | | 3,464,974 | |
| UNIVERSITY CONSOLIDATED EDUCATION AND BUILDING REVENUE BONDS | | | | | | | | | | | |
| 11.56% of Net Assets | | | | | | | | | | | | | | | | | | |
AL State Private Colleges & Universities Tuskegee University | | | 4.750 | | | | 09/01/2026 | | | AA* | | | 500,000 | | | | 501,630 | |
Auburn University AL General Fee Revenue | | | 5.000 | | | | 06/01/2036 | | | Aa2 | | | 150,000 | | | | 174,188 | |
Jacksonville AL State University | | | 5.125 | | | | 12/01/2033 | | | AA* | | | 215,000 | | | | 237,837 | |
Troy University AL Facilities Revenue | | | 5.000 | | | | 11/01/2028 | | | A1 | | | 250,000 | | | | 307,958 | |
Tuscaloosa AL Public Education Building Authority Student Housing | | | 6.375 | | | | 07/01/2028 | | | AA* | | | 250,000 | | | | 275,895 | |
Tuscaloosa AL Public Education Building Authority Student Housing | | | 6.750 | | | | 07/01/2033 | | | AA* | | | 495,000 | | | | 549,311 | |
University of AL Birmingham | | | 5.000 | | | | 10/01/2037 | | | Aa2 | | | 225,000 | | | | 272,383 | |
University of Alabama General Revenue | | | 5.000 | | | | 07/01/2034 | | | Aa2 | | | 250,000 | | | | 269,780 | |
University of South AL University Revenues Facilities | | | 5.000 | | | | 08/01/2029 | | | Aa1 | | | 550,000 | | | | 593,758 | |
University of South AL University Revenues Facilities | | | 4.750 | | | | 08/01/2033 | | | Aa1 | | | 100,000 | | | | 107,291 | |
University of South AL University Revenues Refunding Tuition | | | 5.000 | | | | 12/01/2029 | | | Aa1 | | | 105,000 | | | | 106,855 | |
| | | | | | | | | | | | | | | | | | |
| | | | | | | | | | | | | | | | | 3,396,886 | |
| MISCELLANEOUS PUBLIC IMPROVEMENT BONDS | | | | | | | | | | | |
| 6.91% of Net Assets | | | | | | | | | | | | | | | | | | |
AL Incentives Financing Authority Special Obligation | | | 5.000 | | | | 09/01/2029 | | | A+* | | | 125,000 | | | | 139,810 | |
Daphne AL Warrants | | | 5.000 | | | | 04/01/2023 | | | Aa2 | | | 75,000 | | | | 75,197 | |
Jasper AL Warrants | | | 5.000 | | | | 03/01/2031 | | | A2 | | | 250,000 | | | | 299,733 | |
Madison AL Warrants | | | 5.000 | | | | 04/01/2035 | | | Aa2 | | | 350,000 | | | | 422,979 | |
Mobile AL Refunding Warrants | | | 5.000 | | | | 02/15/2027 | | | Aa2 | | | 335,000 | | | | 369,445 | |
Tuscaloosa AL Warrants | | | 5.000 | | | | 10/15/2034 | | | Aa1 | | | 175,000 | | | | 191,667 | |
Tuscaloosa AL Warrants | | | 5.125 | | | | 01/01/2039 | | | Aa1 | | | 150,000 | | | | 164,786 | |
Tuscaloosa AL Warrants | | | 5.000 | | | | 07/01/2034 | | | Aa1 | | | 300,000 | | | | 365,508 | |
| | | | | | | | | | | | | | | | | | |
| | | | | | | | | | | | | | | | | 2,029,123 | |
| REFUNDING BONDS | | | | | | | | | | | |
| 5.80% of Net Assets | | | | | | | | | | | | | | | | | | |
Enterprise AL Warrants | | | 4.500 | | | | 11/01/2032 | | | Aa3 | | | 115,000 | | | | 128,040 | |
Northport AL Warrants | | | 5.000 | | | | 08/01/2040 | | | AA-* | | | 735,000 | | | | 873,496 | |
Shelby County Alabama | | | 4.000 | | | | 08/15/2038 | | | AA+* | | | 250,000 | | | | 278,510 | |
Tuscaloosa AL Warrants | | | 5.000 | | | | 01/01/2032 | | | Aa1 | | | 350,000 | | | | 424,718 | |
| | | | | | | | | | | | | | | | | | |
| | | | | | | | | | | | | | | | | 1,704,764 | |
The accompanying notes are an integral part of the financial statements.
2
DUPREE MUTUAL FUNDS — ALABAMA TAX-FREE INCOME SERIES
SCHEDULE OF PORTFOLIO INVESTMENTS
Alabama Municipal Bonds — 100% of Net Assets
June 30, 2016
| | | | | | | | | | | | | | | | | | |
| Bond Description | | Coupon | | | Maturity
Date | | | Rating# | | Par Value | | | Fair Value | |
| HOSPITAL AND HEALTHCARE BONDS | | | | | | | | | | | |
| 3.55% of Net Assets | | | | | | | | | | | | | | | | | | |
Chilton County AL Health Care Authority Chilton County Hospital | | | 5.000 | % | | | 11/01/2035 | | | AA-@ | | $ | 550,000 | | | $ | 672,040 | |
Chilton County AL Health Care Authority Limited Obligation Sales Tax | | | 5.000 | | | | 11/01/2032 | | | AA-@ | | | 300,000 | | | | 370,251 | |
| | | | | | | | | | | | | | | | | | |
| | | | | | | | | | | | | | | | | 1,042,291 | |
| STATE AND LOCAL MORTGAGE/HOUSING BONDS | | | | | | | | | | | |
| .39% of Net Assets | | | | | | | | | | | | | | | | | | |
AL Housing Finance Authority Single Family Mortgage Revenue | | | 5.375 | | | | 10/01/2033 | | | Aaa | | | 110,000 | | | | 114,981 | |
| | | | | | | | | | | | | | | | | | |
| INDUSTRIAL REVENUE/POLLUTION CONTROL BONDS | | | | | | | | | | | |
| .07% of Net Assets | | | | | | | | | | | | | | | | | | |
Auburn AL Industrial Development Board Facilities Revenue | | | 6.200 | | | | 11/01/2020 | | | A* | | | 20,000 | | | | 20,024 | |
| | | | | | | | | | | | | | | | | | |
Total Investments 98.43% of Net Assets (cost $26,887,711) (See (a) below for further explanation) | | | | | | | | | $ | 28,917,059 | |
| | | | | | | | | | | | | | | | | | |
Other assets in excess of liabilities 1.57% | | | | | | | | | | | | | | | | | 461,419 | |
| | | | | | | | | | | | | | | | | | |
Net Assets 100% | | | | | | | | | | | | | | | | $ | 29,378,478 | |
| | | | | | | | | | | | | | | | | | |
| | # | | Ratings by Moody’s Investors Services, Inc. unless noted otherwise. |
| | | | Bond ratings are unaudited and not covered by Report of Independent Registered Public Accounting Firm. |
| | | | All ratings are as of the date indicated and do not reflect subsequent changes. |
| | * | | Rated by Standard & Poor’s Corporation |
| | @ | | Fitch’s Investors Service |
| (a) | | Cost for federal income tax purposes is $26,887,557 and net unrealized appreciation of investments is as follows: |
| | | | | | |
| | Unrealized appreciation | | | $ 2,029,588 | |
| | Unrealized depreciation | | | (86 | ) |
| | | | | | |
| | Net unrealized appreciation | | | $ 2,029,502 | |
| | | | | | |
Other Information
The following is a summary of the inputs used, as of June 30, 2016, involving the Fund’s investments in securities carried at fair value. The inputs or methodology used for valuing securities may not be an indication of the risk associated with investing in those securities. For more information on valuation inputs, and their aggregation into the levels used in the table below, please refer to the Security Valuation section in the accompanying Notes to Financial Statements.
| | | | | | |
| | | Valuation Inputs | | Municipal Bonds | |
Level 1 | | Quoted Prices | | $ | — | |
Level 2 | | Other Significant Observable Inputs | | | 28,917,059 | |
Level 3 | | Significant Unobservable Inputs | | | — | |
| | | | | | |
| | | | $ | 28,917,059 | |
| | | | | | |
The accompanying notes are an integral part of the financial statements.
3
ALABAMA TAX-FREE INCOME SERIES
STATEMENT OF ASSETS AND LIABILITIES
June 30, 2016
| | | | | | | | |
ASSETS: | | | | | | | | |
Investments in securities, at fair value (Cost: $26,887,711) | | | | | | $ | 28,917,059 | |
Cash | | | | | | | 243,199 | |
Interest receivable | | | | | | | 365,590 | |
| | | | | | | | |
Total assets | | | | | | | 29,525,848 | |
LIABILITIES: | | | | | | | | |
Payable for: | | | | | | | | |
Distributions to shareholders | | | 106,544 | | | | | |
Fund shares redeemed | | | 12,087 | | | | | |
Investment advisory fee | | | 10,449 | | | | | |
Transfer agent fee | | | 4,020 | | | | | |
Accrued expenses | | | 14,270 | | | | | |
| | | | | | | | |
Total liabilities | | | | | | | 147,370 | |
| | | | | | | | |
NET ASSETS: | | | | | | | | |
Capital | | | | | | | 27,385,291 | |
Accumulated net investment income | | | | | | | 156 | |
Accumulated net realized loss on investment transactions | | | | | | | (36,317 | ) |
Net unrealized appreciation in value of investments | | | | | | | 2,029,348 | |
| | | | | | | | |
Net assets at value | | | | | | $ | 29,378,478 | |
| | | | | | | | |
NET ASSET VALUE, offering price and redemption price per share
(2,300,814 shares outstanding; unlimited number of shares authorized; no par value) | | | | | | $ | 12.77 | |
| | | | | | | | |
STATEMENT OF OPERATIONS
For the year ended June 30, 2016
| | | | |
Net investment income: | | | | |
Interest income | | $ | 1,029,268 | |
| | | | |
Expenses: | | | | |
Investment advisory fee | | | 133,595 | |
Transfer agent fee | | | 38,063 | |
Custodian expense | | | 9,030 | |
Professional fees | | | 5,730 | |
Trustees fees | | | 2,670 | |
Other expenses | | | 20,250 | |
| | | | |
Total expenses | | | 209,338 | |
Fees waived by Adviser (Note 2) | | | (19,398 | ) |
Custodian expense reduction | | | (46 | ) |
| | | | |
Net expenses | | | 189,894 | |
| | | | |
Net investment income | | | 839,374 | |
| | | | |
Realized and unrealized gain on investments: | | | | |
Net realized gain | | | 7,105 | |
Net change in unrealized appreciation/depreciation | | | 879,042 | |
| | | | |
Net realized and unrealized gain on investments | | | 886,147 | |
| | | | |
Net increase in net assets resulting from operations | | $ | 1,725,521 | |
| | | | |
The accompanying notes are an integral part of the financial statements.
4
ALABAMA TAX-FREE INCOME SERIES
STATEMENTS OF CHANGES IN NET ASSETS
For the years ended June 30, 2016 and 2015
| | | | | | | | |
| | | 2016 | | | 2015 | |
Operations: | | | | | | | | |
Net investment income | | $ | 839,374 | | | $ | 825,995 | |
Net realized gain on investments | | | 7,105 | | | | 60,994 | |
Net change in unrealized appreciation/depreciation | | | 879,042 | | | | 16,768 | |
| | | | | | | | |
Net increase in net assets resulting from operations | | | 1,725,521 | | | | 903,757 | |
Distributions from net investment income (Note 6) | | | (839,350 | ) | | | (825,972 | ) |
Net fund share transactions (Note 4) | | | 2,981,730 | | | | 2,074,414 | |
| | | | | | | | |
Total increase | | | 3,867,901 | | | | 2,152,199 | |
Net assets: | | | | | | | | |
Beginning of year | | | 25,510,577 | | | | 23,358,378 | |
| | | | | | | | |
End of year | | $ | 29,378,478 | | | $ | 25,510,577 | |
| | | | | | | | |
Accumulated net investment income | | $ | 156 | | | $ | 132 | |
| | | | | | | | |
FINANCIAL HIGHLIGHTS
| | | | | | | | | | | | | | | | | | | | |
| Selected data for a share outstanding: | | For the years ended June 30, | |
| | | 2016 | | | 2015 | | | 2014 | | | 2013 | | | 2012 | |
Net asset value, beginning of year | | | $12.36 | | | | $12.32 | | | | $12.10 | | | | $12.41 | | | | $11.72 | |
| | | | | | | | | | | | | | | | | | | | |
Income from investment operations: | | | | | | | | | | | | | | | | | | | | |
Net investment income | | | 0.39 | | | | 0.41 | | | | 0.42 | | | | 0.43 | | | | 0.44 | |
Net gains/(losses) on securities | | | 0.41 | | | | 0.04 | | | | 0.23 | | | | (0.30 | ) | | | 0.70 | |
| | | | | | | | | | | | | | | | | | | | |
Total from investment operations | | | 0.80 | | | | 0.45 | | | | 0.65 | | | | 0.13 | | | | 1.14 | |
Less distributions: | | | | | | | | | | | | | | | | | | | | |
Distributions from net investment income | | | (0.39 | ) | | | (0.41 | ) | | | (0.42 | ) | | | (0.43 | ) | | | (0.44 | ) |
Distributions from capital gains | | | — | | | | — | | | | (0.01 | ) | | | (0.01 | ) | | | (0.01 | ) |
| | | | | | | | | | | | | | | | | | | | |
Total distributions | | | (0.39 | ) | | | (0.41 | ) | | | (0.43 | ) | | | (0.44 | ) | | | (0.45 | ) |
| | | | | | | | | | | | | | | | | | | | |
Net asset value, end of year | | | $12.77 | | | | $12.36 | | | | $12.32 | | | | $12.10 | | | | $12.41 | |
| | | | | | | | | | | | | | | | | | | | |
Total return | | | 6.61% | | | | 3.64% | | | | 5.56% | | | | 0.94% | | | | 9.81% | |
Net assets, end of year (in thousands) | | | $29,378 | | | | $25,511 | | | | $23,358 | | | | $24,300 | | | | $22,911 | |
Ratio of net expenses to average net assets (a) | | | 0.71% | | | | 0.71% | | | | 0.72% | | | | 0.70% | | | | 0.68% | |
Ratio of gross expenses to average net assets | | | 0.78% | | | | 0.79% | | | | 0.81% | | | | 0.78% | | | | 0.78% | |
Ratio of net investment income to average net assets | | | 3.14% | | | | 3.26% | | | | 3.48% | | | | 3.40% | | | | 3.59% | |
Portfolio turnover | | | 5.37% | | | | 9.65% | | | | 10.48% | | | | 6.46% | | | | 7.80% | |
| (a) | | Percentages are after expense waivers and reductions by the Adviser and Custodian. The Adviser and Custodian have agreed not to seek recovery of these waivers and reductions. |
The accompanying notes are an integral part of the financial statements.
5
DUPREE MUTUAL FUNDS — KENTUCKY TAX-FREE INCOME SERIES
SCHEDULE OF PORTFOLIO INVESTMENTS
Kentucky Municipal Bonds — 100% of Net Assets
June 30, 2016
| | | | | | | | | | | | | | | | | | |
| Bond Description | | Coupon | | | Maturity
Date | | | Rating# | | Par Value | | | Fair Value | |
| PREREFUNDED BONDS | | | | | | | | | | | | | | | | | | |
| 23.17% of Net Assets | | | | | | | | | | | |
Franklin County KY School Building Revenue | | | 4.750 | % | | | 05/01/2027 | | | Aa3 | | $ | 3,570,000 | | | $ | 3,693,344 | |
Hardin County KY School District Finance Corporation | | | 4.750 | | | | 06/01/2027 | | | Aa3 | | | 1,250,000 | | | | 1,296,775 | |
Jefferson County KY School District Finance Corporation | | | 4.750 | | | | 12/01/2026 | | | Aa3 | | | 3,770,000 | | | | 3,836,541 | |
Jefferson County KY School District Finance Corporation | | | 4.750 | | | | 06/01/2027 | | | Aa3 | | | 3,000,000 | | | | 3,113,700 | |
Kenton County KY School District Finance Corporation | | | 5.000 | | | | 02/01/2029 | | | Aa3 | | | 3,270,000 | | | | 3,625,253 | |
KY Asset Liability Commission University of KY Project Note | | | 5.000 | | | | 10/01/2024 | | | Aa2 | | | 5,445,000 | | | | 5,742,787 | |
KY Asset Liability Commission University of KY Project Note | | | 5.000 | | | | 10/01/2026 | | | Aa2 | | | 6,090,000 | | | | 6,423,062 | |
KY Development Finance Authority — St. Elizabeth | | | 5.500 | | | | 05/01/2039 | | | AA* | | | 1,000,000 | | | | 1,131,830 | |
KY Development Finance Authority — St. Elizabeth | | | 5.125 | | | | 05/01/2029 | | | AA* | | | 2,750,000 | | | | 3,082,833 | |
KY Development Finance Authority — St. Elizabeth | | | 5.375 | | | | 05/01/2034 | | | AA* | | | 2,560,000 | | | | 2,888,525 | |
KY Infrastructure Authority Wastewater and Drinking Water | | | 5.000 | | | | 02/01/2027 | | | Aaa | | | 2,500,000 | | | | 2,871,400 | |
KY Infrastructure Authority Wastewater and Drinking Water | | | 5.000 | | | | 02/01/2028 | | | Aaa | | | 2,000,000 | | | | 2,297,120 | |
KY State Property & Building #87 | | | 5.000 | | | | 03/01/2019 | | | Aa3 | | | 2,965,000 | | | | 3,051,815 | |
KY State Property & Building #87 | | | 5.000 | | | | 03/01/2022 | | | Aa3 | | | 1,635,000 | | | | 1,682,873 | |
KY State Property & Building #87 | | | 5.000 | | | | 03/01/2023 | | | Aa3 | | | 5,080,000 | | | | 5,228,742 | |
KY State Property & Building #87 | | | 5.000 | | | | 03/01/2025 | | | AA-* | | | 14,565,000 | | | | 14,991,463 | |
KY State Property & Building #87 | | | 5.000 | | | | 03/01/2026 | | | AA-* | | | 8,060,000 | | | | 8,295,997 | |
KY State Property & Building #87 | | | 5.000 | | | | 03/01/2027 | | | AA-* | | | 10,125,000 | | | | 10,421,460 | |
KY State Property & Building #88 | | | 5.000 | | | | 11/01/2024 | | | Aa3 | | | 1,355,000 | | | | 1,434,213 | |
KY State Property & Building #88 | | | 4.750 | | | | 11/01/2027 | | | Aa3 | | | 5,800,000 | | | | 6,112,620 | |
KY State Property & Building #89 | | | 5.000 | | | | 11/01/2025 | | | Aa3 | | | 5,000,000 | | | | 5,496,050 | |
KY State Property & Building #89 | | | 5.000 | | | | 11/01/2026 | | | Aa3 | | | 13,390,000 | | | | 14,728,197 | |
KY State Property & Building #89 | | | 5.000 | | | | 11/01/2027 | | | Aa3 | | | 4,900,000 | | | | 5,383,728 | |
KY State Property & Building #90 | | | 5.375 | | | | 11/01/2023 | | | NR | | | 1,060,000 | | | | 1,173,049 | |
KY State Property & Building #90 | | | 5.500 | | | | 11/01/2028 | | | NR | | | 21,955,000 | | | | 24,376,197 | |
KY State Property & Building #91 | | | 5.750 | | | | 04/01/2029 | | | A1 | | | 210,000 | | | | 228,711 | |
KY State Property & Building #93 | | | 4.875 | | | | 02/01/2028 | | | AA* | | | 440,000 | | | | 486,517 | |
KY State Property & Building #93 | | | 5.250 | | | | 02/01/2025 | | | AA* | | | 6,425,000 | | | | 7,165,867 | |
KY State Property & Building #93 | | | 5.250 | | | | 02/01/2028 | | | AA* | | | 9,305,000 | | | | 10,377,960 | |
KY State Property & Building #93 | | | 5.000 | | | | 02/01/2029 | | | AA* | | | 445,000 | | | | 493,465 | |
KY State Property & Building #93 | | | 5.250 | | | | 02/01/2029 | | | AA* | | | 20,060,000 | | | | 22,373,119 | |
KY State Turnpike Economic Development Road Revenue | | | 5.000 | | | | 07/01/2025 | | | Aa2 | | | 3,225,000 | | | | 3,500,996 | |
KY State Turnpike Economic Development Road Revenue | | | 5.000 | | | | 07/01/2027 | | | Aa2 | | | 9,530,000 | | | | 10,345,577 | |
KY State Turnpike Economic Development Road Revenue | | | 5.000 | | | | 07/01/2028 | | | Aa2 | | | 2,460,000 | | | | 2,670,527 | |
KY State Turnpike Economic Development Road Revenue | | | 5.000 | | | | 07/01/2026 | | | Aa2 | | | 4,440,000 | | | | 4,995,000 | |
KY State Turnpike Economic Development Road Revenue | | | 5.000 | | | | 07/01/2027 | | | Aa2 | | | 3,080,000 | | | | 3,466,971 | |
KY State Turnpike Economic Development Road Revenue | | | 5.000 | | | | 07/01/2029 | | | Aa2 | | | 10,035,000 | | | | 11,295,797 | |
Laurel County School District Finance Corporation | | | 4.750 | | | | 06/01/2026 | | | Aa3 | | | 1,000,000 | | | | 1,037,520 | |
Louisville & Jefferson County Metropolitan Health — St. Marys | | | 6.125 | | | | 02/01/2037 | | | NR | | | 1,300,000 | | | | 1,412,333 | |
Louisville & Jefferson County Waterworks | | | 5.000 | | | | 11/15/2027 | | | Aaa | | | 2,000,000 | | | | 2,033,580 | |
Louisville & Jefferson County Waterworks | | | 5.000 | | | | 11/15/2031 | | | Aaa | | | 10,695,000 | | | | 10,874,569 | |
Taylor County KY Detention Facility | | | 4.750 | | | | 09/01/2027 | | | A1 | | | 2,110,000 | | | | 2,125,551 | |
| | | | | | | | | | | | | | | | | | |
| | | | | | | | | | | | | | | | | 237,263,632 | |
| MISCELLANEOUS PUBLIC IMPROVEMENT BONDS | | | | | | | | | | | |
| 18.22% of Net Assets | | | | | | | | | | | | | | | | | | |
KY Association of Counties | | | 5.000 | | | | 02/01/2030 | | | AA-* | | | 625,000 | | | | 715,388 | |
KY Association of Counties | | | 5.000 | | | | 02/01/2032 | | | AA-* | | | 1,000,000 | | | | 1,140,760 | |
KY Association of Counties | | | 5.000 | | | | 02/01/2035 | | | AA-* | | | 995,000 | | | | 1,126,171 | |
KY Bond Corporation Finance Program | | | 5.500 | | | | 02/01/2031 | | | AA-* | | | 1,115,000 | | | | 1,315,187 | |
KY State Property & Building #76 | | | 5.500 | | | | 08/01/2021 | | | Aa3 | | | 1,400,000 | | | | 1,682,352 | |
KY State Property & Building #83 | | | 5.000 | | | | 10/01/2017 | | | Aa3 | | | 5,000,000 | | | | 5,265,050 | |
KY State Property & Building #87 | | | 5.000 | | | | 03/01/2019 | | | Aa3 | | | 35,000 | | | | 36,006 | |
KY State Property & Building #87 | | | 5.000 | | | | 03/01/2022 | | | Aa3 | | | 30,000 | | | | 30,848 | |
KY State Property & Building #87 | | | 5.000 | | | | 03/01/2023 | | | Aa3 | | | 95,000 | | | | 97,618 | |
KY State Property & Building #87 | | | 5.000 | | | | 03/01/2025 | | | Aa3 | | | 270,000 | | | | 277,700 | |
KY State Property & Building #87 | | | 5.000 | | | | 03/01/2026 | | | Aa3 | | | 170,000 | �� | | | 174,791 | |
KY State Property & Building #87 | | | 5.000 | | | | 03/01/2027 | | | Aa3 | | | 165,000 | | | | 169,571 | |
The accompanying notes are an integral part of the financial statements.
6
DUPREE MUTUAL FUNDS — KENTUCKY TAX-FREE INCOME SERIES
SCHEDULE OF PORTFOLIO INVESTMENTS
Kentucky Municipal Bonds — 100% of Net Assets
June 30, 2016
| | | | | | | | | | | | | | | | | | |
| Bond Description | | Coupon | | | Maturity
Date | | | Rating# | | Par Value | | | Fair Value | |
KY State Property & Building #90 | | | 5.375 | % | | | 11/01/2023 | | | Aa3 | | $ | 140,000 | | | $ | 154,038 | |
KY State Property & Building #90 | | | 5.500 | | | | 11/01/2028 | | | Aa3 | | | 2,850,000 | | | | 3,141,185 | |
KY State Property & Building #93 | | | 4.875 | | | | 02/01/2028 | | | AA* | | | 60,000 | | | | 65,421 | |
KY State Property & Building #93 | | | 5.250 | | | | 02/01/2025 | | | AA* | | | 825,000 | | | | 912,722 | |
KY State Property & Building #93 | | | 5.250 | | | | 02/01/2028 | | | AA* | | | 1,195,000 | | | | 1,319,149 | |
KY State Property & Building #93 | | | 5.000 | | | | 02/01/2029 | | | AA* | | | 55,000 | | | | 60,188 | |
KY State Property & Building #93 | | | 5.250 | | | | 02/01/2029 | | | AA* | | | 2,580,000 | | | | 2,849,429 | |
KY State Property & Building #96 | | | 5.000 | | | | 11/01/2029 | | | Aa3 | | | 5,000,000 | | | | 5,572,450 | |
KY State Property & Building #98 | | | 5.000 | | | | 08/01/2021 | | | Aa3 | | | 2,505,000 | | | | 2,882,353 | |
KY State Property & Building #100 | | | 5.000 | | | | 08/01/2026 | | | Aa3 | | | 2,000,000 | | | | 2,346,880 | |
KY State Property & Building #100 | | | 5.000 | | | | 08/01/2027 | | | Aa3 | | | 1,710,000 | | | | 2,001,093 | |
KY State Property & Building #100 | | | 5.000 | | | | 08/01/2028 | | | Aa3 | | | 4,000,000 | | | | 4,674,520 | |
KY State Property & Building #100 | | | 5.000 | | | | 08/01/2029 | | | Aa3 | | | 2,500,000 | | | | 2,909,600 | |
KY State Property & Building #100 | | | 5.000 | | | | 08/01/2030 | | | Aa3 | | | 9,980,000 | | | | 11,599,155 | |
KY State Property & Building #100 | | | 5.000 | | | | 08/01/2031 | | | Aa3 | | | 5,100,000 | | | | 5,913,960 | |
KY State Property & Building #105 | | | 4.750 | | | | 04/01/2031 | | | A1 | | | 2,110,000 | | | | 2,432,978 | |
KY State Property & Building #105 | | | 4.750 | | | | 04/01/2032 | | | A1 | | | 2,205,000 | | | | 2,535,066 | |
KY State Property & Building #105 | | | 4.750 | | | | 04/01/2033 | | | A1 | | | 2,310,000 | | | | 2,651,118 | |
KY State Property & Building #106 | | | 5.000 | | | | 10/01/2029 | | | Aa3 | | | 4,130,000 | | | | 4,990,362 | |
KY State Property & Building #106 | | | 5.000 | | | | 10/01/2032 | | | Aa3 | | | 6,275,000 | | | | 7,521,152 | |
KY State Property & Building #106 | | | 5.000 | | | | 10/01/2030 | | | Aa3 | | | 7,165,000 | | | | 8,625,370 | |
KY State Property & Building #106 | | | 5.000 | | | | 10/01/2031 | | | Aa3 | | | 4,910,000 | | | | 5,896,026 | |
KY State Property & Building #106 | | | 5.000 | | | | 10/01/2033 | | | Aa3 | | | 4,870,000 | | | | 5,811,761 | |
KY State Property & Building #108 | | | 5.000 | | | | 08/01/2031 | | | Aa3 | | | 8,290,000 | | | | 10,161,468 | |
KY State Property & Building #108 | | | 5.000 | | | | 08/01/2034 | | | Aa3 | | | 4,900,000 | | | | 5,952,226 | |
KY State Property & Building #108 | | | 5.000 | | | | 08/01/2026 | | | Aa3 | | | 955,000 | | | | 1,198,248 | |
KY State Property & Building #108 | | | 5.000 | | | | 08/01/2032 | | | Aa3 | | | 8,820,000 | | | | 10,770,543 | |
KY State Property & Building #108 | | | 5.000 | | | | 08/01/2033 | | | Aa3 | | | 5,270,000 | | | | 6,420,968 | |
KY State Property & Building #108 | | | 5.000 | | | | 08/01/2030 | | | Aa3 | | | 5,000,000 | | | | 6,137,950 | |
KY State Property & Building #108 | | | 5.000 | | | | 08/01/2028 | | | Aa3 | | | 2,670,000 | | | | 3,309,892 | |
KY State Property & Building #110 | | | 5.000 | | | | 08/01/2029 | | | Aa3 | | | 4,200,000 | | | | 5,202,666 | |
KY State Property & Building #110 | | | 5.000 | | | | 08/01/2032 | | | Aa3 | | | 1,515,000 | | | | 1,850,042 | |
KY State Property & Building #110 | | | 5.000 | | | | 08/01/2033 | | | Aa3 | | | 1,000,000 | | | | 1,218,400 | |
KY State Property & Building #110 | | | 5.000 | | | | 08/01/2034 | | | Aa3 | | | 1,900,000 | | | | 2,309,754 | |
KY State Property & Building #110 | | | 5.000 | | | | 08/01/2035 | | | Aa3 | | | 3,030,000 | | | | 3,672,390 | |
KY State Property & Building #112 | | | 5.000 | | | | 11/01/2028 | | | Aa3 | | | 2,500,000 | | | | 3,130,800 | |
KT State Property & Building #112 | | | 5.000 | | | | 02/01/2036 | | | Aa3 | | | 7,920,000 | | | | 9,516,038 | |
KY State Property & Building #112 | | | 5.000 | | | | 02/01/2035 | | | Aa3 | | | 8,325,000 | | | | 10,049,690 | |
Lexington Fayette Urban County Government | | | 5.000 | | | | 01/01/2033 | | | Aa2 | | | 1,685,000 | | | | 2,076,965 | |
Lexington Fayette Urban County Government | | | 5.000 | | | | 01/01/2028 | | | Aa2 | | | 820,000 | | | | 1,028,223 | |
Lexington Fayette Urban County Government | | | 5.000 | | | | 01/01/2029 | | | Aa2 | | | 345,000 | | | | 431,371 | |
Pendleton County KY Multi-County Lease Revenue | | | 6.400 | | | | 03/01/2019 | | | B* | | | 3,000,000 | | | | 3,195,240 | |
| | | | | | | | | | | | | | | | | | |
| | | | | | | | | | | | | | | | | 186,530,290 | |
| MUNICIPAL UTILITY REVENUE BONDS | | | | | | | | | | | |
| 11.81% of Net Assets | | | | | | | | | | | | | | | | | | |
Campbell and Kenton Counties Sanitary Sewer | | | 5.000 | | | | 08/01/2025 | | | Aa2 | | | 2,395,000 | | | | 2,501,410 | |
Campbell and Kenton Counties Sanitary Sewer | | | 5.000 | | | | 08/01/2026 | | | Aa2 | | | 4,175,000 | | | | 4,360,955 | |
Campbell and Kenton Counties Sanitary Sewer | | | 5.000 | | | | 08/01/2027 | | | Aa2 | | | 4,385,000 | | | | 4,581,799 | |
Campbell and Kenton Counties Sanitary Sewer | | | 5.000 | | | | 08/01/2037 | | | Aa2 | | | 11,220,000 | | | | 11,691,016 | |
Frankfort KY Electric & Water | | | 4.750 | | | | 12/01/2034 | | | AA* | | | 695,000 | | | | 834,660 | |
Frankfort KY Electric & Water | | | 4.750 | | | | 12/01/2035 | | | AA* | | | 725,000 | | | | 869,449 | |
Frankfort KY Electric & Water | | | 4.750 | | | | 12/01/2038 | | | AA* | | | 835,000 | | | | 990,761 | |
Frankfort KY Electric & Water | | | 4.750 | | | | 12/01/2036 | | | AA* | | | 760,000 | | | | 905,624 | |
Frankfort KY Electric & Water | | | 4.750 | | | | 12/01/2037 | | | AA* | | | 800,000 | | | | 948,560 | |
KY Rural Water Financing Corporation | | | 5.125 | | | | 02/01/2035 | | | A+* | | | 525,000 | | | | 583,417 | |
KY Rural Water Financing Corporation | | | 5.375 | | | | 02/01/2020 | | | A+* | | | 245,000 | | | | 245,652 | |
KY Rural Water Financing Corporation | | | 4.500 | | | | 02/01/2023 | | | A+* | | | 1,085,000 | | | | 1,277,219 | |
KY Rural Water Financing Corporation | | | 4.500 | | | | 02/01/2024 | | | A+* | | | 880,000 | | | | 1,040,116 | |
Louisville & Jefferson County Metropolitan Sewer | | | 5.000 | | | | 05/15/2031 | | | Aa3 | | | 2,465,000 | | | | 2,994,211 | |
The accompanying notes are an integral part of the financial statements.
7
DUPREE MUTUAL FUNDS — KENTUCKY TAX-FREE INCOME SERIES
SCHEDULE OF PORTFOLIO INVESTMENTS
Kentucky Municipal Bonds — 100% of Net Assets
June 30, 2016
| | | | | | | | | | | | | | | | | | |
| Bond Description | | Coupon | | | Maturity
Date | | | Rating# | | Par Value | | | Fair Value | |
Louisville & Jefferson County Metropolitan Sewer | | | 4.750 | % | | | 05/15/2034 | | | Aa3 | | $ | 2,230,000 | | | $ | 2,668,373 | |
Louisville & Jefferson County Metropolitan Sewer | | | 4.750 | | | | 05/15/2036 | | | Aa3 | | | 2,795,000 | | | | 3,334,994 | |
Louisville & Jefferson County Metropolitan Sewer | | | 4.750 | | | | 05/15/2035 | | | Aa3 | | | 2,245,000 | | | | 2,676,848 | |
Louisville & Jefferson County Metropolitan Sewer | | | 5.000 | | | | 05/15/2035 | | | Aa3 | | | 4,825,000 | | | | 5,959,116 | |
Louisville & Jefferson County Metropolitan Sewer | | | 5.000 | | | | 05/15/2034 | | | Aa3 | | | 4,595,000 | | | | 5,692,608 | |
Louisville & Jefferson County Metropolitan Sewer | | | 5.000 | | | | 05/15/2024 | | | Aa3 | | | 7,000,000 | | | | 7,405,160 | |
Louisville & Jefferson County Metropolitan Sewer | | | 5.000 | | | | 05/15/2025 | | | Aa3 | | | 5,185,000 | | | | 5,579,319 | |
Louisville & Jefferson County Metropolitan Sewer | | | 5.000 | | | | 05/15/2021 | | | Aa3 | | | 2,865,000 | | | | 3,257,677 | |
Louisville & Jefferson County Metropolitan Sewer | | | 5.000 | | | | 05/15/2023 | | | Aa3 | | | 2,500,000 | | | | 2,838,175 | |
Louisville & Jefferson County Metropolitan Sewer | | | 5.000 | | | | 05/15/2034 | | | Aa3 | | | 27,730,000 | | | | 32,676,477 | |
Northern KY Water District | | | 6.000 | | | | 02/01/2028 | | | Aa3 | | | 1,010,000 | | | | 1,117,100 | |
Northern KY Water District | | | 6.000 | | | | 02/01/2031 | | | Aa3 | | | 1,000,000 | | | | 1,110,000 | |
Northern KY Water District | | | 6.500 | | | | 02/01/2033 | | | Aa3 | | | 1,585,000 | | | | 1,769,763 | |
Northern KY Water District | | | 5.000 | | | | 02/01/2033 | | | Aa3 | | | 3,580,000 | | | | 4,100,747 | |
Northern KY Water District | | | 5.000 | | | | 02/01/2026 | | | Aa3 | | | 1,000,000 | | | | 1,185,090 | |
Northern KY Water District | | | 5.000 | | | | 02/01/2027 | | | Aa3 | | | 4,315,000 | | | | 5,085,832 | |
Owensboro KY Water Revenue | | | 5.000 | | | | 09/15/2025 | | | A1 | | | 545,000 | | | | 592,862 | |
| | | | | | | | | | | | | | | | | | |
| | | | | | | | | | | | | | | | | 120,874,989 | |
| REFUNDED BONDS | | | | | | | | | | | |
| 9.08% of Net Assets | | | | | | | | | | | | | | | | | | |
KY State Property & Building #80 | | | 5.250 | | | | 05/01/2018 | | | Aa3 | | | 2,940,000 | �� | | | 3,181,903 | |
KY State Property & Building #80 | | | 5.250 | | | | 05/01/2020 | | | Aa3 | | | 1,000,000 | | | | 1,153,820 | |
KY State Property & Building #83 | | | 5.000 | | | | 10/01/2018 | | | Aa3 | | | 17,750,000 | | | | 19,356,553 | |
KY State Property & Building #83 | | | 5.250 | | | | 10/01/2020 | | | Aa3 | | | 24,220,000 | | | | 28,208,792 | |
KY State Property & Building #84 | | | 5.000 | | | | 08/01/2019 | | | Aa3 | | | 10,000,000 | | | | 11,212,500 | |
KY State Property & Building #84 | | | 5.000 | | | | 08/01/2021 | | | Aa3 | | | 310,000 | | | | 365,769 | |
KY State Property & Building #84 | | | 5.000 | | | | 08/01/2022 | | | Aa3 | | | 18,000,000 | | | | 21,639,600 | |
KY State Property & Building #102 | | | 5.000 | | | | 05/01/2024 | | | Aa3 | | | 405,000 | | | | 492,278 | |
KY State Property & Building #104 | | | 5.000 | | | | 11/01/2021 | | | A1 | | | 2,085,000 | | | | 2,455,505 | |
KY State Property & Building #104 | | | 5.000 | | | | 11/01/2022 | | | A1 | | | 1,290,000 | | | | 1,545,510 | |
KY State Property & Building #108 | | | 5.000 | | | | 08/01/2025 | | | Aa3 | | | 2,690,000 | | | | 3,347,275 | |
| | | | | | | | | | | | | | | | | | |
| | | | | | | | | | | | | | | | | 92,959,503 | |
| TURNPIKES/TOLLROAD/HIGHWAY BONDS | | | | | | | | | | | |
| 8.74% of Net Assets | | | | | | | | | | | | | | | | | | |
KY Asset Liability Commission Federal Highway | | | 5.250 | | | | 09/01/2019 | | | A2 | | | 1,765,000 | | | | 1,992,509 | |
KY Asset Liability Commission Federal Highway | | | 5.000 | | | | 09/01/2021 | | | A2 | | | 1,570,000 | | | | 1,806,364 | |
Ky Asset Liability Commission Federal Highway | | | 5.000 | | | | 09/01/2022 | | | A2 | | | 3,500,000 | | | | 4,013,100 | |
KY Asset Liability Commission Federal Highway | | | 5.250 | | | | 09/01/2025 | | | A2 | | | 3,400,000 | | | | 4,198,456 | |
KY Asset Liability Commission Federal Highway | | | 5.000 | | | | 09/01/2027 | | | A2 | | | 9,760,000 | | | | 12,229,475 | |
KY State Turnpike Economic Development Road Revenue | | | 5.000 | | | | 07/01/2025 | | | Aa2 | | | 3,775,000 | | | | 4,453,405 | |
KY State Turnpike Economic Development Road Revenue | | | 5.000 | | | | 07/01/2029 | | | Aa2 | | | 5,165,000 | | | | 6,030,447 | |
KY State Turnpike Economic Development Road Revenue | | | 5.000 | | | | 07/01/2030 | | | Aa2 | | | 1,845,000 | | | | 2,152,211 | |
KY State Turnpike Economic Development Road Revenue | | | 5.000 | | | | 07/01/2028 | | | Aa2 | | | 4,930,000 | | | | 5,923,247 | |
KY State Turnpike Economic Development Road Revenue | | | 5.000 | | | | 07/01/2030 | | | Aa2 | | | 1,465,000 | | | | 1,765,765 | |
KY State Turnpike Economic Development Road Revenue | | | 5.000 | | | | 07/01/2031 | | | Aa2 | | | 9,350,000 | | | | 11,198,121 | |
KY State Turnpike Economic Development Road Revenue | | | 5.000 | | | | 07/01/2029 | | | Aa2 | | | 7,235,000 | | | | 8,724,976 | |
KY State Turnpike Economic Development Road Revenue | | | 5.000 | | | | 07/01/2032 | | | Aa2 | | | 8,755,000 | | | | 10,463,363 | |
KY State Turnpike Economic Development Road Revenue | | | 5.000 | | | | 07/01/2032 | | | Aa2 | | | 1,315,000 | | | | 1,611,822 | |
KY State Turnpike Economic Development Road Revenue | | | 5.000 | | | | 07/01/2033 | | | Aa2 | | | 5,000,000 | | | | 6,051,950 | |
KY State Turnpike Economic Development Road Revenue | | | 5.000 | | | | 07/01/2029 | | | Aa2 | | | 4,000,000 | | | | 5,029,320 | |
KY State Turnpike Economic Development Road Revenue | | | 5.000 | | | | 07/01/2024 | | | Aa2 | | | 1,500,000 | | | | 1,829,175 | |
| | | | | | | | | | | | | | | | | | |
| | | | | | | | | | | | | | | | | 89,473,705 | |
| SCHOOL IMPROVEMENT BONDS | | | | | | | | | | | |
| 7.80% of Net Assets | | | | | | | | | | | | | | | | | | |
Fayette County KY School District Finance Corporation | | | 5.000 | | | | 06/01/2031 | | | A1 | | | 3,705,000 | | | | 4,289,093 | |
Fayette County KY School District Finance Corporation | | | 5.000 | | | | 08/01/2028 | | | Aa3 | | | 1,330,000 | | | | 1,651,235 | |
Fayette County KY School District Finance Corporation | | | 5.000 | | | | 10/01/2028 | | | A1 | | | 2,875,000 | | | | 3,484,788 | |
Fayette County KY School District Finance Corporation | | | 5.000 | | | | 10/01/2029 | | | A1 | | | 3,660,000 | | | | 4,427,978 | |
Fayette County KY School District Finance Corporation | | | 5.000 | | | | 10/01/2032 | | | A1 | | | 3,615,000 | | | | 4,357,232 | |
The accompanying notes are an integral part of the financial statements.
8
DUPREE MUTUAL FUNDS — KENTUCKY TAX-FREE INCOME SERIES
SCHEDULE OF PORTFOLIO INVESTMENTS
Kentucky Municipal Bonds — 100% of Net Assets
June 30, 2016
| | | | | | | | | | | | | | | | | | |
| Bond Description | | Coupon | | | Maturity
Date | | | Rating# | | Par Value | | | Fair Value | |
Fayette County KY School District Finance Corporation | | | 5.000 | % | | | 10/01/2033 | | | A1 | | $ | 4,385,000 | | | $ | 5,255,817 | |
Fayette County KY School District Finance Corporation | | | 4.750 | | | | 11/01/2031 | | | Aa3 | | | 1,730,000 | | | | 2,090,636 | |
Fayette County KY School District Finance Corporation | | | 5.000 | | | | 08/01/2032 | | | Aa3 | | | 10,600,000 | | | | 12,963,588 | |
Fayette County KY School District Finance Corporation | | | 5.000 | | | | 08/01/2034 | | | Aa3 | | | 8,750,000 | | | | 10,628,975 | |
Hardin County KY School District Finance Corporation | | | 5.000 | | | | 05/01/2030 | | | Aa3 | | | 450,000 | | | | 521,145 | |
Hardin County KY School District Finance Corporation | | | 5.000 | | | | 05/01/2031 | | | Aa3 | | | 470,000 | | | | 544,547 | |
Jefferson County KY School District Finance Corporation | | | 5.000 | | | | 05/01/2032 | | | Aa3 | | | 4,230,000 | | | | 5,132,386 | |
Jefferson County KY School District Finance Corporation | | | 5.000 | | | | 05/01/2033 | | | Aa3 | | | 5,145,000 | | | | 6,234,299 | |
Jefferson County KY School District Finance Corporation | | | 5.000 | | | | 05/01/2034 | | | Aa3 | | | 5,405,000 | | | | 6,527,619 | |
Jefferson County KY School District Finance Corporation | | | 5.000 | | | | 04/01/2030 | | | Aa3 | | | 975,000 | | | | 1,199,962 | |
Jefferson County KY School District Finance Corporation | | | 5.000 | | | | 04/01/2031 | | | Aa3 | | | 1,025,000 | | | | 1,257,829 | |
Jefferson County KY School District Finance Corporation | | | 4.750 | | | | 04/01/2034 | | | Aa3 | | | 1,165,000 | | | | 1,392,117 | |
Jefferson County KY School District Finance Corporation | | | 4.750 | | | | 04/01/2035 | | | Aa3 | | | 1,220,000 | | | | 1,452,508 | |
Scott County KY School District Finance Corporation | | | 4.500 | | | | 01/01/2025 | | | Aa3 | | | 4,890,000 | | | | 5,922,328 | |
Shelby County KY School District Finance Corporation | | | 5.000 | | | | 02/01/2028 | | | Aa3 | | | 500,000 | | | | 546,355 | |
| | | | | | | | | | | | | | | | | | |
| | | | | | | | | | | | | | | | | 79,880,434 | |
| UNIVERSITY CONSOLIDATED EDUCATION AND BUILDING REVENUE BONDS | | | | | | | | | | | |
| 7.53% of Net Assets | | | | | | | | | | | | | | | | | | |
Boyle County KY College Improvement — Centre College — A | | | 4.750 | | | | 06/01/2032 | | | A3 | | | 5,330,000 | | | | 5,510,954 | |
Eastern KY University | | | 5.000 | | | | 04/01/2033 | | | Aa3 | | | 910,000 | | | | 1,119,964 | |
KY State Property & Building #114 | | | 5.000 | | | | 10/01/2032 | | | Aa3 | | | 2,795,000 | | | | 3,443,328 | |
KY State Property & Building #114 | | | 5.000 | | | | 10/01/2033 | | | Aa3 | | | 2,940,000 | | | | 3,606,998 | |
KY State Property & Building #114 | | | 5.000 | | | | 10/01/2034 | | | Aa3 | | | 3,090,000 | | | | 3,775,362 | |
KY State Property & Building #114 | | | 5.000 | | | | 10/01/2035 | | | Aa3 | | | 1,945,000 | | | | 2,370,508 | |
Louisville & Jefferson County Univeristy of Louisville | | | 4.750 | | | | 03/01/2028 | | | Aa3 | | | 3,250,000 | | | | 3,447,340 | |
Morehead State University | | | 5.000 | | | | 04/01/2028 | | | Aa3 | | | 1,780,000 | | | | 2,231,123 | |
Morehead State University | | | 5.000 | | | | 04/01/2029 | | | Aa3 | | | 870,000 | | | | 1,084,124 | |
Murray State University | | | 5.000 | | | | 03/01/2032 | | | Aa3 | | | 2,220,000 | | | | 2,710,087 | |
University of Kentucky General Receipts | | | 5.000 | | | | 04/01/2037 | | | Aa2 | | | 7,180,000 | | | | 8,668,055 | |
University of Kentucky General Receipts | | | 5.000 | | | | 04/01/2038 | | | Aa2 | | | 7,395,000 | | | | 8,915,856 | |
University of Kentucky General Receipts | | | 5.000 | | | | 04/01/2030 | | | Aa2 | | | 5,490,000 | | | | 6,886,436 | |
University of Kentucky General Receipts | | | 5.000 | | | | 04/01/2036 | | | Aa2 | | | 4,820,000 | | | | 5,826,609 | |
University of Kentucky Higher Educational | | | 4.750 | | | | 04/01/2034 | | | Aa2 | | | 5,435,000 | | | | 6,542,381 | |
University of Louisville General Receipts | | | 5.000 | | | | 09/01/2029 | | | Aa3 | | | 2,280,000 | | | | 2,677,951 | |
University of Louisville General Receipts | | | 5.000 | | | | 09/01/2030 | | | Aa3 | | | 440,000 | | | | 515,121 | |
University of Louisville General Receipts | | | 5.000 | | | | 09/01/2031 | | | Aa3 | | | 2,580,000 | | | | 3,017,697 | |
Western KY University | | | 4.750 | | | | 09/01/2033 | | | Aa3 | | | 2,505,000 | | | | 2,973,961 | |
Western KY University | | | 5.000 | | | | 05/01/2032 | | | Aa3 | | | 1,500,000 | | | | 1,760,220 | |
| | | | | | | | | | | | | | | | | | |
| | | | | | | | | | | | | | | | | 77,084,076 | |
| HOSPITAL AND HEALTHCARE BONDS | | | | | | | | | | | |
| 6.52% of Net Assets | | | | | | | | | | | | | | | | | | |
KY Bond Development Corporation Hospital Facilities — St. Elizabeth | | | 5.000 | | | | 05/01/2039 | | | AA* | | | 7,185,000 | | | | 8,819,875 | |
KY Development Corporation Hospital Facilities — St. Elizabeth | | | 4.000 | | | | 05/01/2036 | | | AA* | | | 1,200,000 | | | | 1,339,428 | |
KY Development Finance Authority — Baptist Healthcare | | | 5.625 | | | | 08/15/2027 | | | A3 | | | 4,855,000 | | | | 5,300,058 | |
KY Development Finance Authority — Baptist Heathcare | | | 5.375 | | | | 08/15/2024 | | | A3 | | | 1,205,000 | | | | 1,311,293 | |
KY Development Finance Authority — Catholic Health | | | 5.000 | | | | 05/01/2029 | | | A3 | | | 2,410,000 | | | | 2,637,673 | |
KY Development Finance Authority — Catholic Health | | | 5.375 | | | | 01/01/2040 | | | A3 | | | 300,000 | | | | 349,902 | |
Lexington Fayette Urban County Government | | | 5.250 | | | | 06/01/2032 | | | Aa3 | | | 1,500,000 | | | | 1,737,330 | |
Lexington Fayette Urban County Government Healthcare | | | 5.250 | | | | 06/01/2028 | | | Aa3 | | | 1,000,000 | | | | 1,163,760 | |
Lexington-Fayette Urban County Government Public Facilities | | | 5.000 | | | | 06/01/2033 | | | Aa3 | | | 5,260,000 | | | | 5,990,456 | |
Louisville & Jefferson County Catholic Health Initiatives | | | 5.000 | | | | 12/01/2030 | | | A3 | | | 2,000,000 | | | | 2,306,780 | |
Louisville & Jefferson County Catholic Health Initiatives | | | 5.000 | | | | 12/01/2035 | | | A3 | | | 14,785,000 | | | | 16,815,424 | |
Louisville & Jefferson County Catholic Health Initiatives | | | 5.000 | | | | 12/01/2031 | | | A3 | | | 2,750,000 | | | | 3,161,950 | |
Louisville & Jefferson County Metropolitan Health — Norton Health | | | 5.500 | | | | 10/01/2033 | | | A-* | | | 2,000,000 | | | | 2,450,660 | |
Louisville & Jefferson County Metropolitan Health — Norton Health | | | 5.000 | | | | 10/01/2030 | | | A-* | | | 2,000,000 | | | | 2,019,120 | |
Louisville & Jefferson County Metropolitan Health — Norton Health | | | 5.250 | | | | 10/01/2036 | | | A-* | | | 3,460,000 | | | | 3,492,697 | |
Louisville & Jefferson Metropolitan Government Health | | | 5.000 | | | | 10/01/2026 | | | A-* | | | 530,000 | | | | 535,740 | |
Warren County KY Hospital | | | 5.000 | | | | 04/01/2028 | | | A+* | | | 6,225,000 | | | | 7,266,194 | |
| | | | | | | | | | | | | | | | | | |
| | | | | | | | | | | | | | | | | 66,698,339 | |
The accompanying notes are an integral part of the financial statements.
9
DUPREE MUTUAL FUNDS — KENTUCKY TAX-FREE INCOME SERIES
SCHEDULE OF PORTFOLIO INVESTMENTS
Kentucky Municipal Bonds — 100% of Net Assets
June 30, 2016
| | | | | | | | | | | | | | | | | | |
| Bond Description | | Coupon | | | Maturity
Date | | | Rating# | | Par Value | | | Fair Value | |
| PUBLIC FACILITIES REVENUE BONDS | | | | | | | | | | | |
| 3.82% of Net Assets | | | | | | | | | | | | | | | | | | |
Bracken County KY Public Property | | | 5.000 | % | | | 08/01/2029 | | | Aa3 | | $ | 840,000 | | | $ | 978,071 | |
Bracken County KY Public Property | | | 5.000 | | | | 08/01/2030 | | | Aa3 | | | 1,110,000 | | | | 1,294,216 | |
Franklin County KY Public Properties Justice Center | | | 5.000 | | | | 04/01/2029 | | | Aa3 | | | 2,630,000 | | | | 3,033,705 | |
KY State Certificates of Participation | | | 5.000 | | | | 06/15/2034 | | | Aa3 | | | 1,640,000 | | | | 1,987,746 | |
KY State Certificates of Participation | | | 5.000 | | | | 06/15/2038 | | | Aa3 | | | 7,535,000 | | | | 9,058,577 | |
Louisville & Jefferson County Metropolitan Parking | | | 5.000 | | | | 12/01/2022 | | | Aa2 | | | 625,000 | | | | 708,381 | |
Louisville & Jefferson County Metropolitan Parking | | | 5.750 | | | | 12/01/2034 | | | Aa2 | | | 2,750,000 | | | | 3,183,978 | |
Owensboro KY Public Property | | | 4.500 | | | | 04/01/2034 | | | A2 | | | 1,165,000 | | | | 1,291,927 | |
River City, Inc. Parking Authority | | | 4.750 | | | | 06/01/2027 | | | Aa2 | | | 750,000 | | | | 894,405 | |
River City, Inc. Parking Authority | | | 4.750 | | | | 06/01/2028 | | | Aa2 | | | 940,000 | | | | 1,118,967 | |
River City, Inc. Parking Authority | | | 4.750 | | | | 06/01/2030 | | | Aa2 | | | 1,025,000 | | | | 1,212,831 | |
River City, Inc. Parking Authority | | | 4.750 | | | | 06/01/2029 | | | Aa2 | | | 1,160,000 | | | | 1,376,700 | |
River City, Inc. Parking Authority | | | 4.750 | | | | 06/01/2031 | | | Aa2 | | | 1,270,000 | | | | 1,498,219 | |
River City, Inc. Parking Authority | | | 4.750 | | | | 06/01/2029 | | | Aa2 | | | 980,000 | | | | 1,163,074 | |
River City, Inc. Parking Authority | | | 5.000 | | | | 06/01/2033 | | | Aa2 | | | 1,395,000 | | | | 1,658,209 | |
River City, Inc. Parking Authority | | | 5.000 | | | | 06/01/2031 | | | Aa2 | | | 1,080,000 | | | | 1,291,464 | |
River City, Inc. Parking Authority | | | 5.000 | | | | 06/01/2032 | | | Aa2 | | | 1,130,000 | | | | 1,347,220 | |
Warren County KY Downtown Economic Development Authority | | | 5.000 | | | | 06/01/2038 | | | AA-* | | | 2,345,000 | | | | 2,737,389 | |
Wolfe County KY Public Property | | | 5.000 | | | | 04/01/2030 | | | Aa3 | | | 2,855,000 | | | | 3,255,271 | |
| | | | | | | | | | | | | | | | | | |
| | | | | | | | | | | | | | | | | 39,090,347 | |
| AIRPORT BONDS | | | | | | | | | | | |
| 1.11% of Net Assets | | | | | | | | | | | | | | | | | | |
Kenton County Airport | | | 5.000 | | | | 01/01/2033 | | | A2 | | | 1,210,000 | | | | 1,487,441 | |
Kenton County Airport | | | 5.000 | | | | 01/01/2031 | | | A2 | | | 425,000 | | | | 524,901 | |
Kenton County Airport | | | 5.000 | | | | 01/01/2032 | | | A2 | | | 750,000 | | | | 924,128 | |
Lexington Fayette Urban County Airport Board | | | 5.000 | | | | 07/01/2030 | | | Aa2 | | | 1,250,000 | | | | 1,494,700 | |
Lexington Fayette Urban County Airport Board | | | 5.000 | | | | 07/01/2032 | | | Aa2 | | | 1,430,000 | | | | 1,705,418 | |
Lexington Fayette Urban County Airport Board | | | 5.000 | | | | 07/01/2033 | | | Aa2 | | | 1,520,000 | | | | 1,809,879 | |
Lexington Fayette Urban County Airport Board | | | 5.000 | | | | 07/01/2038 | | | Aa2 | | | 1,720,000 | | | | 2,030,770 | |
Lexington-Fayette Urban County Airport Board | | | 5.000 | | | | 07/01/2028 | | | Aa2 | | | 1,170,000 | | | | 1,403,485 | |
| | | | | | | | | | | | | | | | | | |
| | | | | | | | | | | | | | | | | 11,380,721 | |
| STATE AND LOCAL MORTGAGE/HOUSING BONDS | | | | | | | | | | | |
| 1.09% of Net Assets | | | | | | | | | | | | | | | | | | |
Greater KY Housing Assistance Corporation-Chenowith Woods | | | 6.100 | | | | 01/01/2024 | | | A3 | | | 315,000 | | | | 315,939 | |
KY Economic Development Finance Authority-Christian Care | | | 5.375 | | | | 11/20/2035 | | | AA+* | | | 660,000 | | | | 680,605 | |
KY Housing Corporation | | | 4.750 | | | | 07/01/2032 | | | Aaa | | | 1,265,000 | | | | 1,279,257 | |
KY Housing Corporation | | | 4.875 | | | | 07/01/2023 | | | Aaa | | | 770,000 | | | | 804,365 | |
KY Housing Corporation | | | 4.850 | | | | 07/01/2029 | | | Aaa | | | 2,975,000 | | | | 3,148,800 | |
KY Housing Corporation | | | 4.750 | | | | 07/01/2035 | | | Aaa | | | 3,610,000 | | | | 3,872,014 | |
KY Housing Corporation Country Place Apartments | | | 4.750 | | | | 04/20/2031 | | | AA+* | | | 935,000 | | | | 1,013,007 | |
| | | | | | | | | | | | | | | | | | |
| | | | | | | | | | | | | | | | | 11,113,986 | |
| MISCELLANEOUS REVENUE BONDS | | | | | | | | | | | | | | | | | | |
| .24% of Net Assets | | | | | | | | | | | | | | | | | | |
KY State Property & Building #106 | | | 5.000 | | | | 10/01/2028 | | | Aa3 | | | 2,030,000 | | | | 2,459,020 | |
| | | | | | | | | | | | | | | | | | |
Total Investments 99.13% of Net Assets (cost $936,781,509) (See (a) below for further explanation) | | | | | | | | | $ | 1,014,809,042 | |
| | | | | | | | | | | | | | | | | | |
Other assets in excess of liabilities .87% | | | | | | | | | | | | | | | | | 8,935,502 | |
| | | | | | | | | | | | | | | | | | |
Net Assets 100% | | | | | | | | | | | | | | | | $ | 1,023,744,544 | |
| | | | | | | | | | | | | | | | | | |
| | # | | Ratings by Moody’s Investors Services, Inc. unless noted otherwise. |
| | | | Bond ratings are unaudited and not covered by Report of Independent Registered Public Accounting Firm. |
| | | | All ratings are as of the date indicated and do not reflect subsequent changes. |
| | * | | Rated by Standard & Poor’s Corporation |
| | @ | | Fitch’s Investors Service |
The accompanying notes are an integral part of the financial statements.
10
DUPREE MUTUAL FUNDS — KENTUCKY TAX-FREE INCOME SERIES
SCHEDULE OF PORTFOLIO INVESTMENTS
Kentucky Municipal Bonds — 100% of Net Assets
June 30, 2016
| (a) | | Cost for federal income tax purposes is $936,725,529 and net unrealized appreciation of investments is as follows: |
| | | | | | |
| | Unrealized appreciation | | $ | 78,083,513 | |
| | Unrealized depreciation | | | — | |
| | | | | | |
| | Net unrealized appreciation | | $ | 78,083,513 | |
| | | | | | |
Other Information
The following is a summary of the inputs used, as of June 30, 2016, involving the Fund’s investments in securities carried at fair value. The inputs or methodology used for valuing securities may not be an indication of the risk associated with investing in those securities. For more information on valuation inputs, and their aggregation into the levels used in the table below, please refer to the Security Valuation section in the accompanying Notes to Financial Statements.
| | | | | | |
| | | Valuation Inputs | | Municipal Bonds | |
Level 1 | | Quoted Prices | | $ | — | |
Level 2 | | Other Significant Observable Inputs | | | 1,014,809,042 | |
Level 3 | | Significant Unobservable Inputs | | | — | |
| | | | | | |
| | | | $ | 1,014,809,042 | |
| | | | | | |
The accompanying notes are an integral part of the financial statements.
11
KENTUCKY TAX-FREE INCOME SERIES
STATEMENT OF ASSETS AND LIABILITIES
June 30, 2016
| | | | | | | | |
ASSETS: | | | | | | | | |
Investments in securities, at fair value (Cost: $936,781,509) | | | $ | 1,014,809,042 | |
Cash | | | | | | | 317,118 | |
Receivable for fund shares sold | | | | | | | 35,667 | |
Interest receivable | | | | | | | 12,984,874 | |
| | | | | | | | |
Total assets | | | | | | | 1,028,146,701 | |
LIABILITIES: | | | | | | | | |
Payable for: | | | | | | | | |
Distributions to shareholders | | | 3,225,289 | | | | | |
Fund shares redeemed | | | 480,733 | | | | | |
Investment advisory fee | | | 310,851 | | | | | |
Transfer agent fee | | | 100,471 | | | | | |
Trustees fees | | | 52,396 | | | | | |
Accrued expenses | | | 232,417 | | | | | |
| | | | | | | | |
Total liabilities | | | | | | | 4,402,157 | |
| | | | | | | | |
NET ASSETS: | | | | | | | | |
Capital | | | | | | | 945,486,702 | |
Accumulated net investment income | | | | 55,980 | |
Accumulated net realized gain on investment transactions | | | | | | | 174,329 | |
Net unrealized appreciation in value of investments | | | | 78,027,533 | |
| | | | | | | | |
Net assets at value | | | | | | $ | 1,023,744,544 | |
| | | | | | | | |
NET ASSET VALUE, offering price and redemption price per share
(126,944,113 shares outstanding; unlimited number of shares authorized; no par value) | | | | | | $ | 8.06 | |
| | | | | | | | |
STATEMENT OF OPERATIONS
For the year ended June 30, 2016
| | | | |
Net investment income: | | | | |
Interest income | | $ | 36,822,247 | |
| | | | |
Expenses: | | | | |
Investment advisory fee | | | 3,737,514 | |
Transfer agent fee | | | 1,201,763 | |
Custodian expense | | | 95,586 | |
Professional fees | | | 210,949 | |
Trustees fees | | | 101,015 | |
Other expenses | | | 117,572 | |
| | | | |
Total expenses | | | 5,464,399 | |
Custodian expense reduction | | | (490 | ) |
| | | | |
Net expenses | | | 5,463,909 | |
| | | | |
Net investment income | | | 31,358,338 | |
| | | | |
Realized and unrealized gain on investments: | | | | |
Net realized gain | | | 239,102 | |
Net change in unrealized appreciation/depreciation | | | 29,781,496 | |
| | | | |
Net realized and unrealized gain on investments | | | 30,020,598 | |
| | | | |
Net increase in net assets resulting from operations | | $ | 61,378,936 | |
| | | | |
The accompanying notes are an integral part of the financial statements.
12
KENTUCKY TAX-FREE INCOME SERIES
STATEMENTS OF CHANGES IN NET ASSETS
For the years ended June 30, 2016 and 2015
| | | | | | | | |
| | | 2016 | | | 2015 | |
Operations: | | | | | | | | |
Net investment income | | $ | 31,358,338 | | | $ | 32,471,978 | |
Net realized gain on investments | | | 239,102 | | | | 215,331 | |
Net change in unrealized appreciation/depreciation | | | 29,781,496 | | | | (8,192,046 | ) |
| | | | | | | | |
Net increase in net assets resulting from operations | | | 61,378,936 | | | | 24,495,263 | |
Distributions from net investment income (Note 6) | | | (31,348,902 | ) | | | (32,463,029 | ) |
Distributions from capital gains (Note 6) | | | (258,021 | ) | | | (402,816 | ) |
Net fund share transactions (Note 4) | | | 4,342,562 | | | | 28,451,332 | |
| | | | | | | | |
Total increase | | | 34,114,575 | | | | 20,080,750 | |
Net assets: | | | | | | | | |
Beginning of year | | | 989,629,969 | | | | 969,549,219 | |
| | | | | | | | |
End of year | | $ | 1,023,744,544 | | | $ | 989,629,969 | |
| | | | | | | | |
Accumulated net investment income | | $ | 55,980 | | | $ | 46,544 | |
| | | | | | | | |
FINANCIAL HIGHLIGHTS
| | | | | | | | | | | | | | | | | | | | |
| Selected data for a share outstanding: | | For the years ended June 30, | |
| | | 2016 | | | 2015 | | | 2014 | | | 2013 | | | 2012 | |
Net asset value, beginning of year | | | $7.83 | | | | $7.89 | | | | $7.74 | | | | $7.99 | | | | $7.63 | |
| | | | | | | | | | | | | | | | | | | | |
Income from investment operations: | | | | | | | | | | | | | | | | | | | | |
Net investment income | | | 0.25 | | | | 0.26 | | | | 0.27 | | | | 0.27 | | | | 0.28 | |
Net gains/(losses) on securities | | | 0.23 | | | | (0.06 | ) | | | 0.16 | | | | (0.25 | ) | | | 0.39 | |
| | | | | | | | | | | | | | | | | | | | |
Total from investment operations | | | 0.48 | | | | 0.20 | | | | 0.43 | | | | 0.02 | | | | 0.67 | |
Less distributions: | | | | | | | | | | | | | | | | | | | | |
Distributions from net investment income | | | (0.25 | ) | | | (0.26 | ) | | | (0.27 | ) | | | (0.27 | ) | | | (0.28 | ) |
Distributions from capital gains | | | 0.00 | (b) | | | 0.00 | (b) | | | (0.01 | ) | | | 0.00 | (b) | | | (0.03 | ) |
| | | | | | | | | | | | | | | | | | | | |
Total distributions | | | (0.25 | ) | | | (0.26 | ) | | | (0.28 | ) | | | (0.27 | ) | | | (0.31 | ) |
| | | | | | | | | | | | | | | | | | | | |
Net asset value, end of year | | | $8.06 | | | | $7.83 | | | | $7.89 | | | | $7.74 | | | | $7.99 | |
| | | | | | | | | | | | | | | | | | | | |
Total return | | | 6.25% | | | | 2.60% | | | | 5.65% | | | | 0.17% | | | | 8.97% | |
Net assets, end of year (in thousands) | | | $1,023,745 | | | | $989,630 | | | | $969,549 | | | | $948,276 | | | | $989,404 | |
Ratio of net expenses to average net assets (a) | | | 0.55% | | | | 0.55% | | | | 0.57% | | | | 0.57% | | | | 0.57% | |
Ratio of gross expenses to average net assets | | | 0.55% | | | | 0.55% | | | | 0.57% | | | | 0.57% | | | | 0.57% | |
Ratio of net investment income to average net assets | | | 3.15% | | | | 3.29% | | | | 3.45% | | | | 3.35% | | | | 3.60% | |
Portfolio turnover | | | 11.53% | | | | 7.80% | | | | 9.43% | | | | 7.02% | | | | 8.39% | |
| (a) | | Percentages are after custodian reduction for which no recovery will be sought. |
| (b) | | Rounds to less than $0.01. |
The accompanying notes are an integral part of the financial statements.
13
DUPREE MUTUAL FUNDS — KENTUCKY TAX-FREE SHORT-TO-MEDIUM SERIES
SCHEDULE OF PORTFOLIO INVESTMENTS
Kentucky Municipal Bonds — 100% of Net Assets
June 30, 2016
| | | | | | | | | | | | | | | | | | |
| Bond Description | | Coupon | | | Maturity Date | | | Rating# | | Par Value | | | Fair Value | |
| MISCELLANEOUS PUBLIC IMPROVEMENT BONDS | |
| 22.66% of Net Assets | | | | | | | | | | | | | | | | | | |
KY Association of Counties | | | 4.250 | % | | | 02/01/2017 | | | AA-* | | $ | 500,000 | | | $ | 509,885 | |
KY Association of Counties | | | 4.000 | | | | 02/01/2018 | | | AA-* | | | 115,000 | | | | 120,787 | |
KY Association of Counties | | | 4.250 | | | | 02/01/2019 | | | AA-* | | | 255,000 | | | | 275,762 | |
KY State Property & Building #76 | | | 5.500 | | | | 08/01/2017 | | | Aa3 | | | 190,000 | | | | 199,806 | |
KY State Property & Building #76 | | | 5.500 | | | | 08/01/2018 | | | Aa3 | | | 1,415,000 | | | | 1,549,821 | |
KY State Property & Building #83 | | | 5.000 | | | | 10/01/2017 | | | Aa3 | | | 100,000 | | | | 105,301 | |
KY State Property & Building #87 | | | 5.000 | | | | 03/01/2017 | | | Aa3 | | | 850,000 | | | | 874,769 | |
KY State Property & Building #87 | | | 5.000 | | | | 03/01/2020 | | | Aa3 | | | 95,000 | | | | 97,833 | |
KY State Property & Building #89 | | | 3.750 | | | | 11/01/2017 | | | Aa3 | | | 100,000 | | | | 104,062 | |
KY State Property & Building #90 | | | 5.000 | | | | 11/01/2018 | | | Aa3 | | | 250,000 | | | | 273,273 | |
KY State Property & Building #90 | | | 5.750 | | | | 11/01/2019 | | | Aa3 | | | 200,000 | | | | 222,174 | |
KY State Property & Building #90 | | | 5.000 | | | | 11/01/2020 | | | Aa3 | | | 495,000 | | | | 540,718 | |
KY State Property & Building #93 | | | 5.250 | | | | 02/01/2018 | | | Aa3 | | | 510,000 | | | | 545,108 | |
KY State Property & Building #93 | | | 5.250 | | | | 02/01/2021 | | | AA* | | | 25,000 | | | | 27,706 | |
KY State Property & Building #94 | | | 5.000 | | | | 05/01/2017 | | | Aa2 | | | 500,000 | | | | 517,675 | |
KY State Property & Building #95 | | | 5.000 | | | | 08/01/2017 | | | Aa3 | | | 200,000 | | | | 209,354 | |
KY State Property & Building #100 | | | 5.000 | | | | 08/01/2019 | | | Aa3 | | | 100,000 | | | | 111,866 | |
KY State Property & Building #100 | | | 5.000 | | | | 08/01/2017 | | | Aa3 | | | 500,000 | | | | 523,385 | |
KY State Property & Building #100 | | | 5.000 | | | | 08/01/2025 | | | Aa3 | | | 500,000 | | | | 589,680 | |
KY State Property & Building #100 | | | 5.000 | | | | 08/01/2024 | | | Aa3 | | | 750,000 | | | | 885,735 | |
KY State Property & Building #106 | | | 5.000 | | | | 10/01/2021 | | | Aa3 | | | 750,000 | | | | 884,595 | |
KY State Property & Building #106 | | | 5.000 | | | | 10/01/2023 | | | Aa3 | | | 540,000 | | | | 659,448 | |
KY State Property & Building #106 | | | 5.000 | | | | 10/01/2024 | | | Aa3 | | | 750,000 | | | | 922,275 | |
KY State Property & Building #106 | | | 5.000 | | | | 10/01/2025 | | | Aa3 | | | 2,365,000 | | | | 2,909,872 | |
KY State Property & Building #108 | | | 5.000 | | | | 08/01/2023 | | | Aa3 | | | 2,000,000 | | | | 2,434,360 | |
KY State Property & Building #108 | | | 5.000 | | | | 08/01/2023 | | | Aa3 | | | 875,000 | | | | 1,064,376 | |
KY State Property & Building #110 | | | 5.000 | | | | 08/01/2023 | | | Aa3 | | | 1,750,000 | | | | 2,130,065 | |
| | | | | | | | | | | | | | | | | | |
| | | | | | | | | | | | | | | | | 19,289,691 | |
| SCHOOL IMPROVEMENT BONDS | |
| 14.88% of Net Assets | | | | | | | | | | | | | | | | | | |
Barren County KY School District Finance Corporation | | | 5.000 | | | | 08/01/2023 | | | Aa3 | | | 500,000 | | | | 611,950 | |
Barren County KY School District Finance Corporation | | | 5.000 | | | | 08/01/2022 | | | Aa3 | | | 1,055,000 | | | | 1,265,599 | |
Bullitt County KY School District Finance Corporation | | | 5.000 | | | | 09/01/2022 | | | Aa3 | | | 300,000 | | | | 360,078 | |
Fayette County KY School District Finance Corporation | | | 5.000 | | | | 08/01/2023 | | | Aa3 | | | 1,000,000 | | | | 1,220,160 | |
Fayette County KY School District Finance Corporation | | | 4.000 | | | | 06/01/2022 | | | A1 | | | 1,000,000 | | | | 1,114,100 | |
Fayette County KY School District Finance Corporation | | | 5.000 | | | | 06/01/2023 | | | Aa3 | | | 500,000 | | | | 612,030 | |
Grant County KY School District Finance Corporation | | | 3.750 | | | | 06/01/2017 | | | Aa3 | | | 190,000 | | | | 191,450 | |
Hardin County KY School District | | | 5.000 | | | | 03/01/2023 | | | Aa3 | | | 770,000 | | | | 936,058 | |
Jefferson County KY School District Finance Corporation | | | 5.250 | | | | 01/01/2017 | | | Aa3 | | | 200,000 | | | | 204,652 | |
Jefferson County KY School District Finance Corporation | | | 4.000 | | | | 12/01/2023 | | | Aa3 | | | 1,000,000 | | | | 1,177,210 | |
Jessamine County KY School District Finance Corporation | | | 5.000 | | | | 02/01/2023 | | | Aa3 | | | 575,000 | | | | 699,948 | |
Johnson County KY School District Finance Corporation | | | 3.000 | | | | 12/01/2019 | | | Aa3 | | | 180,000 | | | | 190,760 | |
Laurel County KY School District Finance Corporation | | | 4.000 | | | | 06/01/2024 | | | Aa3 | | | 465,000 | | | | 540,558 | |
Laurel County KY School District Finance Corporation | | | 4.000 | | | | 06/01/2022 | | | Aa3 | | | 890,000 | | | | 1,011,245 | |
Pendleton County KY School District Finance Corporation | | | 4.000 | | | | 02/01/2020 | | | Aa3 | | | 450,000 | | | | 458,109 | |
Pike County School District Finance Corporation | | | 5.000 | | | | 02/01/2025 | | | Aa3 | | | 900,000 | | | | 1,124,910 | |
Warren County KY School District Finance Corporation | | | 4.000 | | | | 04/01/2018 | | | Aa3 | | | 125,000 | | | | 131,768 | |
Warren County KY School District Finance Corporation | | | 4.000 | | | | 06/01/2022 | | | Aa3 | | | 725,000 | | | | 823,332 | |
| | | | | | | | | | | | | | | | | | |
| | | | | | | | | | | | | | | | | 12,673,916 | |
| REFUNDED BONDS | |
| 14.45% of Net Assets | | | | | | | | | | | | | | | | | | |
KY State Property & Building #82 | | | 5.250 | | | | 10/01/2017 | | | Aa3 | | | 1,260,000 | | | | 1,332,185 | |
KY State Property & Building #83 | | | 5.000 | | | | 10/01/2016 | | | Aa3 | | | 775,000 | | | | 783,990 | |
KY State Property & Building #83 | | | 5.000 | | | | 10/01/2019 | | | Aa3 | | | 1,750,000 | | | | 1,969,258 | |
KY State Property & Building #84 | | | 5.000 | | | | 08/01/2019 | | | Aa3 | | | 1,000,000 | | | | 1,121,250 | |
KY State Property & Building #101 | | | 5.000 | | | | 10/01/2019 | | | Aa3 | | | 1,050,000 | | | | 1,181,555 | |
The accompanying notes are an integral part of the financial statements.
14
DUPREE MUTUAL FUNDS — KENTUCKY TAX-FREE SHORT-TO-MEDIUM SERIES
SCHEDULE OF PORTFOLIO INVESTMENTS
Kentucky Municipal Bonds — 100% of Net Assets
June 30, 2016
| | | | | | | | | | | | | | | | | | |
| Bond Description | | Coupon | | | Maturity Date | | | Rating# | | Par Value | | | Fair Value | |
KY State Property & Building #104 | | | 5.000 | % | | | 11/01/2021 | | | A1 | | $ | 1,000,000 | | | $ | 1,177,700 | |
KY State Property & Building #106 | | | 5.000 | | | | 10/01/2026 | | | Aa3 | | | 1,000,000 | | | | 1,221,960 | |
KY State Property & Building #108 | | | 5.000 | | | | 08/01/2022 | | | Aa3 | | | 200,000 | | | | 239,796 | |
KY State Property & Building #112 | | | 5.000 | | | | 11/01/2024 | | | Aa3 | | | 2,500,000 | | | | 3,097,000 | |
Lexington Fayette Urban County Government Public Property | | | 4.000 | | | | 05/01/2017 | | | Aa2 | | | 180,000 | | | | 182,068 | |
| | | | | | | | | | | | | | | | | | |
| | | | | | | | | | | | | | | | | 12,306,762 | |
| PUBLIC FACILITIES REVENUE BONDS | |
| 11.56% of Net Assets | | | | | | | | | | | | | | | | | | |
KY State Certificates of Participation | | | 4.000 | | | | 06/15/2023 | | | Aa3 | | | 940,000 | | | | 1,085,315 | |
KY State Certificates of Participation | | | 4.000 | | | | 06/15/2022 | | | Aa3 | | | 1,000,000 | | | | 1,145,670 | |
KY State Certificates of Participation | | | 4.000 | | | | 06/15/2024 | | | Aa3 | | | 300,000 | | | | 349,455 | |
KY State Property & Building #109 | | | 5.000 | | | | 10/01/2022 | | | Aa3 | | | 1,000,000 | | | | 1,202,840 | |
Laurel County KY Justice Center | | | 5.000 | | | | 03/01/2023 | | | Aa3 | | | 600,000 | | | | 735,354 | |
Lexington-Fayette Urban County Government Public Facilities | | | 4.000 | | | | 10/01/2018 | | | Aa3 | | | 1,540,000 | | | | 1,551,612 | |
Livingston County KY Public Properties | | | 5.000 | | | | 08/01/2022 | | | Aa3 | | | 500,000 | | | | 598,845 | |
Livingston County KY Public Properties | | | 5.000 | | | | 08/01/2023 | | | Aa3 | | | 525,000 | | | | 642,941 | |
Livingston County KY Public Properties | | | 5.000 | | | | 08/01/2024 | | | Aa3 | | | 555,000 | | | | 689,027 | |
Todd County KY Public Properties Court House | | | 3.250 | | | | 06/01/2019 | | | Aa3 | | | 100,000 | | | | 105,893 | |
Warren County KY Justice Center Expansion Corporation | | | 5.000 | | | | 09/01/2023 | | | Aa3 | | | 1,250,000 | | | | 1,527,288 | |
Whitley County KY Public Properties — Justice Center | | | 3.375 | | | | 09/01/2019 | | | Aa3 | | | 200,000 | | | | 214,392 | |
| | | | | | | | | | | | | | | | | | |
| | | | | | | | | | | | | | | | | 9,848,631 | |
| PREREFUNDED BONDS | |
| 8.72% of Net Assets | | | | | | | | | | | | | | | | | | |
Adair County KY Public Properties | | | 4.000 | | | | 12/01/2022 | | | Aa3 | | | 170,000 | | | | 178,131 | |
Daviess Co KY School District Finance Corporation | | | 4.250 | | | | 08/01/2019 | | | Aa3 | | | 100,000 | | | | 103,867 | |
KY Asset Liability Comission Revenue University of Kentucky | | | 4.125 | | | | 10/01/2019 | | | Aa2 | | | 150,000 | | | | 156,473 | |
KY Asset Liability Universityof Kentucky Project Notes | | | 5.000 | | | | 10/01/2019 | | | Aa2 | | | 320,000 | | | | 337,626 | |
KY Asset Liablity Commission University of Kentucky | | | 5.000 | | | | 10/01/2020 | | | Aa2 | | | 150,000 | | | | 158,282 | |
KY Infrastructure Authority Wastewater & Drinking Water | | | 5.000 | | | | 02/01/2025 | | | Aaa | | | 175,000 | | | | 212,406 | |
KY State Property & Building #87 | | | 5.000 | | | | 03/01/2018 | | | AA-* | | | 100,000 | | | | 102,948 | |
KY State Property & Building #87 | | | 5.000 | | | | 03/01/2020 | | | Aa3 | | | 3,755,000 | | | | 3,864,421 | |
KY State Property & Building #89 | | | 5.000 | | | | 11/01/2020 | | | Aa3 | | | 200,000 | | | | 219,842 | |
KY State Property & Building #93 | | | 5.250 | | | | 02/01/2021 | | | AA* | | | 175,000 | | | | 195,227 | |
KY Turnpike Economic Development Road Revenue | | | 4.125 | | | | 07/01/2019 | | | Aa2 | | | 105,000 | | | | 112,162 | |
Oldham County KY School Building Corporation | | | 4.375 | | | | 06/01/2018 | | | Aa3 | | | 1,730,000 | | | | 1,788,976 | |
| | | | | | | | | | | | | | | | | | |
| | | | | | | | | | | | | | | | | 7,430,359 | |
| TURNPIKES/TOLLROAD/HIGHWAY BONDS | |
| 8.59% of Net Assets | | | | | | | | | | | | | | | | | | |
KY Asset Liability Commission Federal Highway | | | 5.000 | | | | 09/01/2026 | | | A2 | | | 1,450,000 | | | | 1,807,251 | |
KY Asset Liability Commission Federal Highway | | | 5.250 | | | | 09/01/2025 | | | A2 | | | 675,000 | | | | 833,517 | |
KY Asset Liability Commission Federal Highway | | | 5.000 | | | | 09/01/2024 | | | A2 | | | 500,000 | | | | 620,610 | |
KY Asset Liability Project Notes | | | 4.500 | | | | 09/01/2016 | | | A2 | | | 175,000 | | | | 176,166 | |
KY Asset Liability Project Notes | | | 5.000 | | | | 09/01/2017 | | | A2 | | | 1,500,000 | | | | 1,573,350 | |
KY Asset Liability Project Notes | | | 4.000 | | | | 09/01/2023 | | | A2 | | | 250,000 | | | | 288,835 | |
KY Turnpike Ecomonic Development Road Revenue | | | 5.000 | | | | 07/01/2024 | | | Aa2 | | | 1,000,000 | | | | 1,185,040 | |
KY Turnpike Economic Development Road Revenue | | | 5.000 | | | | 07/01/2023 | | | Aa2 | | | 600,000 | | | | 728,958 | |
KY Turpnike Economic Development Road Revenue | | | 5.000 | | | | 07/01/2024 | | | Aa2 | | | 85,000 | | | | 103,653 | |
| | | | | | | | | | | | | | | | | | |
| | | | | | | | | | | | | | | | | 7,317,380 | |
| UNIVERSITY CONSOLIDATED EDUCATION AND BUILDING REVENUE BONDS | |
| 6.21% of Net Assets | | | | | | | | | | | | | | | | | | |
Boyle County KY Centre College | | | 5.000 | | | | 06/01/2018 | | | A3 | | | 200,000 | | | | 207,472 | |
Boyle County KY Centre College | | | 5.000 | | | | 06/01/2020 | | | A3 | | | 150,000 | | | | 155,505 | |
KY Asset Liability — University of Kentucky | | | 4.000 | | | | 10/01/2019 | | | Aa2 | | | 100,000 | | | | 100,924 | |
KY State Property & Building #114 | | | 5.000 | | | | 10/01/2024 | | | Aa3 | | | 1,415,000 | | | | 1,749,775 | |
Louisville & Jefferson County University of Louisville | | | 4.000 | | | | 03/01/2020 | | | Aa3 | | | 300,000 | | | | 314,655 | |
Morehead State University | | | 5.000 | | | | 10/01/2022 | | | Aa3 | | | 310,000 | | | | 376,793 | |
Northern Ky University General Receipts | | | 4.000 | | | | 09/01/2018 | | | Aa3 | | | 150,000 | | | | 159,365 | |
Western KY University | | | 4.000 | | | | 09/01/2017 | | | Aa3 | | | 2,145,000 | | | | 2,223,957 | |
| | | | | | | | | | | | | | | | | | |
| | | | | | | | | | | | | | | | | 5,288,445 | |
The accompanying notes are an integral part of the financial statements.
15
DUPREE MUTUAL FUNDS — KENTUCKY TAX-FREE SHORT-TO-MEDIUM SERIES
SCHEDULE OF PORTFOLIO INVESTMENTS
Kentucky Municipal Bonds — 100% of Net Assets
June 30, 2016
| | | | | | | | | | | | | | | | | | |
| Bond Description | | Coupon | | | Maturity Date | | | Rating# | | Par Value | | | Fair Value | |
| MUNICIPAL UTILITY REVENUE BONDS | |
| 5.52% of Net Assets | | | | | | | | | | | | | | | | | | |
Bourbon County KY Public Project | | | 3.800 | % | | | 02/01/2019 | | | A2 | | $ | 260,000 | | | $ | 264,443 | |
Frankfort Electric & Water | | | 4.000 | | | | 12/01/2023 | | | AA* | | | 440,000 | | | | 516,622 | |
KY Rural Water Finance Corporation | | | 3.000 | | | | 02/01/2018 | | | A+* | | | 300,000 | | | | 309,609 | |
KY Rural Water Finance Corporation | | | 3.000 | | | | 02/01/2019 | | | A+* | | | 250,000 | | | | 262,668 | |
KY Rural Water Finance Corporation | | | 3.000 | | | | 02/01/2018 | | | A+* | | | 530,000 | | | | 546,976 | |
KY Rural Water Finance Corporation | | | 3.000 | | | | 08/01/2019 | | | A+* | | | 545,000 | | | | 576,163 | |
KY Rural Water Finance Corporation | | | 4.500 | | | | 08/01/2021 | | | A3 | | | 100,000 | | | | 103,982 | |
Lawrenceburg KY Water and Sewer | | | 3.000 | | | | 10/01/2018 | | | A1 | | | 375,000 | | | | 391,661 | |
Northern KY Water | | | 5.000 | | | | 02/01/2026 | | | Aa3 | | | 815,000 | | | | 995,042 | |
Owensboro KY Electric Light &Power | | | 5.000 | | | | 01/01/2024 | | | A2 | | | 650,000 | | | | 733,044 | |
| | | | | | | | | | | | | | | | | | |
| | | | | | | | | | | | | | | | | 4,700,209 | |
| HOSPITAL AND HEALTHCARE | |
| 5.04% of Net Assets | | | | | | | | | | | | | | | | | | |
KY Asset Liability Commission General Receipts | | | 4.000 | | | | 10/01/2018 | | | Aa2 | | | 105,000 | | | | 109,139 | |
KY Economic Development — Baptist Healthcare System | | | 4.750 | | | | 08/15/2019 | | | A3 | | | 110,000 | | | | 118,289 | |
Lexington-Fayette Urban County Government | | | 5.000 | | | | 06/01/2024 | | | Aa3 | | | 2,800,000 | | | | 3,268,832 | |
Warren County Hospital | | | 4.000 | | | | 04/01/2020 | | | A+* | | | 195,000 | | | | 206,776 | |
Warren County Hospital | | | 5.000 | | | | 04/01/2023 | | | A+* | | | 500,000 | | | | 590,830 | |
| | | | | | | | | | | | | | | | | | |
| | | | | | | | | | | | | | | | | 4,293,866 | |
| STATE AND LOCAL MORTGAGE/HOUSING BONDS | |
| .92% of Net Assets | | | | | | | | | | | | | | | | | | |
KY Housing Corporation | | | 5.000 | | | | 07/01/2023 | | | Aaa | | | 750,000 | | | | 783,473 | |
| | | | | | | | | | | | | | | | | | |
Total Investments 98.55% of Net Assets (cost $80,722,364 (See (a) below for further explanation) | | | | | | | | | $ | 83,932,732 | |
| | | | | | | | | | | | | | | | | | |
Other assets in excess of liabilities 1.45% | | | | | | | | | | | | | | | | | 1,235,951 | |
| | | | | | | | | | | | | | | | | | |
Net Assets 100% | | | | | | | | | | | | | | | | $ | 85,168,683 | |
| | | | | | | | | | | | | | | | | | |
| | # | | Ratings by Moody’s Investors Services, Inc. unless noted otherwise. |
| | | | Bond ratings are unaudited and not covered by Report of Independent Registered Public Accounting Firm. |
| | | | All ratings are as of the date indicated and do not reflect subsequent changes. |
| | * | | Rated by Standard & Poor’s Corporation |
| | @ | | Fitch’s Investors Service |
| (a) | | Cost for federal income tax purposes is $80,722,364 and net unrealized appreciation of investments is as follows: |
| | | | | | |
| | Unrealized appreciation | | $ | 3,210,368 | |
| | Unrealized depreciation | | | — | |
| | | | | | |
| | Net unrealized appreciation | | $ | 3,210,368 | |
| | | | | | |
Other Information
The following is a summary of the inputs used, as of June 30, 2016, involving the Fund’s investments in securities carried at fair value. The inputs or methodology used for valuing securities may not be an indication of the risk associated with investing in those securities. For more information on valuation inputs, and their aggregation into the levels used in the table below, please refer to the Security Valuation section in the accompanying Notes to Financial Statements.
| | | | | | |
| | | Valuation Inputs | | Municipal Bonds | |
Level 1 | | Quoted Prices | | $ | — | |
Level 2 | | Other Significant Observable Inputs | | | 83,932,732 | |
Level 3 | | Significant Unobservable Inputs | | | — | |
| | | | | | |
| | | | $ | 83,932,732 | |
| | | | | | |
The accompanying notes are an integral part of the financial statements.
16
KENTUCKY TAX-FREE SHORT-TO-MEDIUM SERIES
STATEMENT OF ASSETS AND LIABILITIES
June 30, 2016
| | | | | | | | |
ASSETS: | | | | | | | | |
Investments in securities, at fair value (Cost: $80,722,364) | | | $ | 83,932,732 | |
Cash | | | | | | | 373,237 | |
Interest receivable | | | | | | | 1,000,388 | |
| | | | | | | | |
Total assets | | | | | | | 85,306,357 | |
LIABILITIES: | | | | | | | | |
Payable for: | | | | | | | | |
Distributions to shareholders | | | 63,402 | | | | | |
Fund shares redeemed | | | 1,963 | | | | | |
Investment advisory fee | | | 35,554 | | | | | |
Transfer agent fee | | | 15,667 | | | | | |
Trustees fees | | | 2,864 | | | | | |
Accrued expenses | | | 18,224 | | | | | |
| | | | | | | | |
Total liabilities | | | | | | | 137,674 | |
| | | | | | | | |
NET ASSETS: | | | | | | | | |
Capital | | | | | | | 82,184,661 | |
Accumulated net realized loss on investment transactions | | | | (226,346 | ) |
Net unrealized appreciation in value of investments | | | | 3,210,368 | |
| | | | | | | | |
Net assets at value | | | | | | $ | 85,168,683 | |
| | | | | | | | |
NET ASSET VALUE, offering price and redemption price per share
(15,622,571 shares outstanding; unlimited number of shares authorized; no par value) | | | | | | $ | 5.45 | |
| | | | | | | | |
STATEMENT OF OPERATIONS
For the year ended June 30, 2016
| | | | |
Net investment income: | | | | |
Interest income | | $ | 2,253,735 | |
| | | | |
Expenses: | | | | |
Investment advisory fee | | | 420,648 | |
Transfer agent fee | | | 106,956 | |
Custodian expense | | | 18,371 | |
Professional fees | | | 17,687 | |
Trustees fees | | | 8,450 | |
Pricing | | | 5,001 | |
Other expenses | | | 30,898 | |
| | | | |
Total expenses | | | 608,011 | |
Custodian expense reduction | | | (94 | ) |
| | | | |
Net expenses | | | 607,917 | |
| | | | |
Net investment income | | | 1,645,818 | |
| | | | |
Realized and unrealized gain on investments: | | | | |
Net realized gain | | | 57,349 | |
Net change in unrealized appreciation/depreciation | | | 1,482,281 | |
| | | | |
Net realized and unrealized gain on investments | | | 1,539,630 | |
| | | | |
Net increase in net assets resulting from operations | | $ | 3,185,448 | |
| | | | |
The accompanying notes are an integral part of the financial statements.
17
KENTUCKY TAX-FREE SHORT-TO-MEDIUM SERIES
STATEMENTS OF CHANGES IN NET ASSETS
For the years ended June 30, 2016 and 2015
| | | | | | | | |
| | | 2016 | | | 2015 | |
Operations: | | | | | | | | |
Net investment income | | $ | 1,645,818 | | | $ | 1,726,545 | |
Net realized gain on investments | | | 57,349 | | | | 115,898 | |
Net change in unrealized appreciation/depreciation | | | 1,482,281 | | | | (1,462,819 | ) |
| | | | | | | | |
Net increase in net assets resulting from operations | | | 3,185,448 | | | | 379,624 | |
Distributions from net investment income (Note 6) | | | (1,645,818 | ) | | | (1,726,545 | ) |
Net fund share transactions (Note 4) | | | 3,574,000 | | | | (815,873 | ) |
| | | | | | | | |
Total increase/(decrease) | | | 5,113,630 | | | | (2,162,794 | ) |
Net assets: | | | | | | | | |
Beginning of year | | | 80,055,053 | | | | 82,217,847 | |
| | | | | | | | |
End of year | | $ | 85,168,683 | | | $ | 80,055,053 | |
| | | | | | | | |
FINANCIAL HIGHLIGHTS
| | | | | | | | | | | | | | | | | | | | |
| Selected data for a share outstanding: | | For the years ended June 30, | |
| | | 2016 | | | 2015 | | | 2014 | | | 2013 | | | 2012 | |
Net asset value, beginning of year | | | $5.35 | | | | $5.44 | | | | $5.43 | | | | $5.54 | | | | $5.39 | |
| | | | | | | | | | | | | | | | | | | | |
Income from investment operations: | | | | | | | | | | | | | | | | | | | | |
Net investment income | | | 0.11 | | | | 0.12 | | | | 0.12 | | | | 0.12 | | | | 0.12 | |
Net gains/(losses) on securities | | | 0.10 | | | | (0.09 | ) | | | 0.01 | | | | (0.11 | ) | | | 0.15 | |
| | | | | | | | | | | | | | | | | | | | |
Total from investment operations | | | 0.21 | | | | 0.03 | | | | 0.13 | | | | 0.01 | | | | 0.27 | |
Less distributions: | | | | | | | | | | | | | | | | | | | | |
Distributions from net investment income | | | (0.11 | ) | | | (0.12 | ) | | | (0.12 | ) | | | (0.12 | ) | | | (0.12 | ) |
| | | | | | | | | | | | | | | | | | | | |
Net asset value, end of year | | | $5.45 | | | | $5.35 | | | | $5.44 | | | | $5.43 | | | | $5.54 | |
| | | | | | | | | | | | | | | | | | | | |
Total return | | | 3.88% | | | | 0.50% | | | | 2.35% | | | | 0.11% | | | | 5.10% | |
Net assets, end of year (in thousands) | | | $85,169 | | | | $80,055 | | | | $82,218 | | | | $89,403 | | | | $89,528 | |
Ratio of net expenses to average net assets (a) | | | 0.72% | | | | 0.73% | | | | 0.74% | | | | 0.72% | | | | 0.73% | |
Ratio of gross expenses to average net assets | | | 0.72% | | | | 0.73% | | | | 0.74% | | | | 0.72% | | | | 0.73% | |
Ratio of net investment income to average net assets | | | 1.96% | | | | 2.17% | | | | 2.14% | | | | 2.12% | | | | 2.22% | |
Portfolio turnover | | | 26.49% | | | | 20.19% | | | | 9.06% | | | | 6.63% | | | | 4.73% | |
| (a) | | Percentages are after custodian reduction for which no recovery will be sought. |
The accompanying notes are an integral part of the financial statements.
18
DUPREE MUTUAL FUNDS — MISSISSIPPI TAX-FREE INCOME SERIES
SCHEDULE OF PORTFOLIO INVESTMENTS
Mississippi Municipal Bonds — 100% of Net Assets
June 30, 2016
| | | | | | | | | | | | | | | | | | |
| Bond Description | | Coupon | | | Maturity
Date | | | Rating# | | Par Value | | | Fair Value | |
| PREREFUNDED BONDS | | | | | | | | | | | |
| 28.84% of Net Assets | | | | | | | | | | | | | | | | | | |
Alcorn State University Educational Building | | | 5.125 | % | | | 09/01/2034 | | | Aa2 | | $ | 95,000 | | | $ | 107,961 | |
MS Development Bank Special Obligation Canton | | | 5.750 | | | | 10/01/2031 | | | A2 | | | 370,000 | | | | 459,281 | |
MS Development Bank Special Obligation Capital Improvement | | | 5.250 | | | | 07/01/2026 | | | A2 | | | 125,000 | | | | 130,725 | |
MS Development Bank Special Obligation Desoto County | | | 4.750 | | | | 01/01/2035 | | | Aa3 | | | 225,000 | | | | 238,739 | |
MS Development Bank Special Obligation Desoto County | | | 5.000 | | | | 07/01/2032 | | | A* | | | 45,000 | | | | 47,000 | |
MS Development Bank Special Obligation Desoto County | | | 5.250 | | | | 07/01/2031 | | | A* | | | 225,000 | | | | 225,032 | |
MS Development Bank Special Obligation Highway Construction | | | 5.000 | | | | 01/01/2027 | | | Aa3 | | | 125,000 | | | | 133,119 | |
MS Development Bank Special Obligation Highway Construction | | | 5.000 | | | | 01/01/2027 | | | Aa3 | | | 245,000 | | | | 260,913 | |
MS Development Bank Special Obligation Highway Construction | | | 4.750 | | | | 01/01/2031 | | | Aa3 | | | 125,000 | | | | 132,633 | |
MS Development Bank Special Obligation Hinds College | | | 5.000 | | | | 10/01/2026 | | | Aa2 | | | 85,000 | | | | 96,468 | |
MS Development Bank Special Obligation Hinds College | | | 5.125 | | | | 10/01/2028 | | | Aa2 | | | 100,000 | | | | 113,893 | |
MS Development Bank Special Obligation Hinds College | | | 5.375 | | | | 10/01/2033 | | | Aa2 | | | 60,000 | | | | 68,816 | |
MS Development Bank Special Obligation Jackson Public | | | 5.375 | | | | 04/01/2028 | | | A2 | | | 70,000 | | | | 75,587 | |
MS Development Bank Special Obligation Jones County Junior College | | | 5.100 | | | | 03/01/2028 | | | AA* | | | 55,000 | | | | 61,311 | |
MS Development Bank Special Obligation Jones County Junior College | | | 5.000 | | | | 03/01/2033 | | | AA* | | | 150,000 | | | | 166,815 | |
MS Development Bank Special Obligation Jones County Junior College | | | 5.125 | | | | 03/01/2039 | | | AA* | | | 45,000 | | | | 50,193 | |
MS Development Bank Special Obligation Lowndes County | | | 5.000 | | | | 07/01/2022 | | | A2 | | | 80,000 | | | | 83,465 | |
MS Development Bank Special Obligation Lowndes County | | | 5.000 | | | | 07/01/2027 | | | A2 | | | 150,000 | | | | 156,497 | |
MS Development Bank Special Obligation Rankin Utilities | | | 5.000 | | | | 01/01/2028 | | | A2 | | | 55,000 | | | | 58,572 | |
MS Development Bank Special Obligation Southaven Water | | | 5.000 | | | | 03/01/2025 | | | A+* | | | 325,000 | | | | 334,692 | |
MS Development Bank Special Obligation Madison County Highway | | | 5.000 | | | | 01/01/2027 | | | Aa3 | | | 95,000 | | | | 95,013 | |
University Southern MS Educational Building Athletics | | | 5.000 | | | | 03/01/2034 | | | Aa2 | | | 105,000 | | | | 108,038 | |
University Southern MS Educational Building Corporation | | | 5.125 | | | | 09/01/2029 | | | Aa2 | | | 100,000 | | | | 113,541 | |
| | | | | | | | | | | | | | | | | | |
| | | | | | | | | | | | | | | | | 3,318,301 | |
| UNIVERSITY CONSOLIDATED EDUCATION AND BUILDING REVENUE BONDS | | | | | | | | | | | |
| 26.13% of Net Assets | | | | | | | | | | | | | | | | | | |
Delta MS State University Educational Building Corporation^ | | | 4.000 | | | | 12/01/2038 | | | Aa2 | | | 250,000 | | | | 278,860 | |
Jackson State University Educational Building | | | 5.000 | | | | 03/01/2034 | | | Aa2 | | | 250,000 | | | | 302,773 | |
Jackson State University Educational Building | | | 5.000 | | | | 03/01/2034 | | | Aa2 | | | 175,000 | | | | 196,786 | |
Mississippi State University Educational Building | | | 5.000 | | | | 11/01/2032 | | | Aa2 | | | 125,000 | | | | 154,985 | |
MS Development Bank Special Obligation Hinds College | | | 5.000 | | | | 04/01/2036 | | | A2 | | | 250,000 | | | | 284,810 | |
MS State University Educational Building Corporation Revenue | | | 5.250 | | | | 08/01/2033 | | | Aa2 | | | 50,000 | | | | 56,295 | |
MS State University Educational Building Corporation Revenue | | | 5.000 | | | | 08/01/2036 | | | Aa2 | | | 175,000 | | | | 203,114 | |
MS State University Educational Building Corporation Revenue** | | | 5.250 | | | | 08/01/2038 | | | Aa2 | | | 300,000 | | | | 367,221 | |
Southern Mississippi Educational Building Corporation | | | 5.000 | | | | 03/01/2038 | | | Aa2 | | | 600,000 | | | | 701,640 | |
University of Mississippi Educational Building Corporation | | | 5.000 | | | | 10/01/2028 | | | Aa2 | | | 200,000 | | | | 234,896 | |
University of Mississippi Educational Building Corporation | | | 4.000 | | | | 11/01/2039 | | | Aa2 | | | 200,000 | | | | 224,362 | |
| | | | | | | | | | | | | | | | | | |
| | | | | | | | | | | | | | | | | 3,005,741 | |
| PUBLIC FACILITIES REVENUE BONDS | | | | | | | | | | | |
| 15.59% of Net Assets | | | | | | | | | | | | | | | | | | |
MS Development Bank Special Obligation Department of Corrections | | | 5.250 | | | | 08/01/2027 | | | AA-* | | | 50,000 | | | | 57,726 | |
MS Development Bank Special Obligation Department of Corrections | | | 5.250 | | | | 08/01/2027 | | | AA-* | | | 305,000 | | | | 352,129 | |
MS State Capital Improvement Projects | | | 5.000 | | | | 10/01/2029 | | | Aa2 | | | 145,000 | | | | 172,478 | |
MS State Capital Improvement Projects | | | 5.000 | | | | 10/01/2036 | | | Aa2 | | | 480,000 | | | | 564,542 | |
MS State Development Bank Special Obligation Alcorn County | | | 4.750 | | | | 07/01/2031 | | | AA* | | | 100,000 | | | | 109,415 | |
MS State Development Bank Special Obligation Brandon Public Improvement | | | 5.000 | | | | 11/01/2033 | | | A1 | | | 150,000 | | | | 180,810 | |
MS State Development Bank Special Obligation City of Jackson Convention Center | | | 5.000 | | | | 03/01/2027 | | | A3 | | | 125,000 | | | | 157,576 | |
MS State Development Bank Special Obligation Refunding — City of Jackson | | | 5.000 | | | | 03/01/2036 | | | A3 | | | 150,000 | | | | 198,636 | |
| | | | | | | | | | | | | | | | | | |
| | | | | | | | | | | | | | | | | 1,793,312 | |
| MUNICIPAL UTILITY REVENUE BONDS | | | | | | | | | | | |
| 12.83% of Net Assets | | | | | | | | | | | | | | | | | | |
MS Development Bank Special Obligation Hattiesburg Water & Sewer | | | 4.750 | | | | 12/01/2038 | | | A3 | | | 700,000 | | | | 818,433 | |
MS State Development Bank Special Obligation Jackson Water & Sewer | | | 6.875 | | | | 12/01/2040 | | | A3 | | | 250,000 | | | | 340,238 | |
MS State Development Bank Special Obligation Jackson Water & Sewer | | | 5.000 | | | | 09/01/2030 | | | A2 | | | 125,000 | | | | 148,576 | |
MS State Development Bank Special Obligation Jackson Water & Sewer | | | 5.000 | | | | 12/01/2033 | | | A* | | | 50,000 | | | | 58,490 | |
The accompanying notes are an integral part of the financial statements.
19
DUPREE MUTUAL FUNDS — MISSISSIPPI TAX-FREE INCOME SERIES
SCHEDULE OF PORTFOLIO INVESTMENTS
Mississippi Municipal Bonds — 100% of Net Assets
June 30, 2016
| | | | | | | | | | | | | | | | | | |
| Bond Description | | Coupon | | | Maturity
Date | | | Rating# | | Par Value | | | Fair Value | |
MS State Development Bank Special Obligation Jackson Water & Sewer | | | 4.500 | % | | | 09/01/2034 | | | A2 | | $ | 100,000 | | | $ | 110,405 | |
| | | | | | | | | | | | | | | | | | |
| | | | | | | | | | | | | | | | | 1,476,142 | |
| TURNPIKES/TOLLROAD/HIGHWAY BONDS | | | | | | | | | | | |
| 6.08% of Net Assets | | | | | | | | | | | | | | | | | | |
MS Development Bank Desoto County Highway | | | 5.000 | | | | 01/01/2030 | | | Aa3 | | | 100,000 | | | | 118,878 | |
MS Development Bank Special Obligation Highway | | | 5.000 | | | | 01/01/2025 | | | Aa3 | | | 200,000 | | | | 253,130 | |
MS Development Bank Special Obligation Marshall County | | | 5.000 | | | | 01/01/2028 | | | Aa3 | | | 200,000 | | | | 235,568 | |
MS Development Bank Special Obligation Marshall County | | | 5.000 | | | | 01/01/2030 | | | Aa3 | | | 75,000 | | | | 91,595 | |
| | | | | | | | | | | | | | | | | | |
| | | | | | | | | | | | | | | | | 699,171 | |
| SCHOOL IMPROVEMENT BONDS | | | | | | | | | | | |
| 4.93% of Net Assets | | | | | | | | | | | | | | | | | | |
MS State Development Bank Special Obligation — Canton School District | | | 5.000 | | | | 12/01/2033 | | | A1 | | | 100,000 | | | | 121,613 | |
MS State Development Bank Special Obligation — Jackson Schools | | | 5.000 | | | | 04/01/2028 | | | A+* | | | 375,000 | | | | 445,980 | |
| | | | | | | | | | | | | | | | | | |
| | | | | | | | | | | | | | | | | 567,593 | |
| HOSPITAL AND HEALTHCARE REVENUE BONDS | | | | | | | | | | | |
| 3.40% of Net Assets | | | | | | | | | | | | | | | | | | |
Medical Center Educational Building Corporation — University of Mississippi | | | 5.000 | | | | 06/01/2034 | | | Aa2 | | | 100,000 | | | | 110,626 | |
Medical Center Educational Building Corporation MS Revenue | | | 5.500 | | | | 12/01/2023 | | | Aa2 | | | 120,000 | | | | 141,616 | |
MS Development Bank Special Obligation Jones County Rest Home | | | 5.250 | | | | 04/01/2028 | | | A2 | | | 120,000 | | | | 139,428 | |
| | | | | | | | | | | | | | | | | | |
| | | | | | | | | | | | | | | | | 391,670 | |
| REFUNDED BONDS | | | | | | | | | | | |
| 1.87% of Net Assets | | | | | | | | | | | | | | | | | | |
MS State Development Bank Special Obligation Lowndes County | | | 5.125 | | | | 12/01/2027 | | | AA* | | | 135,000 | | | | 157,612 | |
MS State Refunding | | | 5.250 | | | | 11/01/2019 | | | Aa2 | | | 50,000 | | | | 57,256 | |
| | | | | | | | | | | | | | | | | | |
| | | | | | | | | | | | | | | | | 214,868 | |
| MISCELLANEOUS PUBLIC IMPROVEMENT BONDS | | | | | | | | | | | |
| 1.39% of Net Assets | | | | | | | | | | | | | | | | | | |
Mississippi State Gaming Tax Revenue | | | 5.000 | | | | 10/15/2035 | | | A3 | | | 125,000 | | | | 150,075 | |
MS Development Bank Special Obligation Capital Projects | | | 5.875 | | | | 07/01/2024 | | | NR | | | 5,000 | | | | 5,250 | |
MS Development Bank Special Obligation Capital Projects | | | 5.000 | | | | 07/01/2024 | | | NR | | | 5,000 | | | | 5,150 | |
| | | | | | | | | | | | | | | | | | |
| | | | | | | | | | | | | | | | | 160,475 | |
| STATE AND LOCAL MORTGAGE/HOUSING BONDS | | | | | | | | | | | |
| .22% of Net Assets | | | | | | | | | | | | | | | | | | |
MS Home Corporation Single Family Mortgage | | | 5.050 | | | | 12/01/2028 | | | Aaa | | | 25,000 | | | | 25,652 | |
| | | | | | | | | | | | | | | | | | |
Total Investments 101.28% of Net Assets (cost $10,720,126) (See (a) below for further explanation) | | | | | | | | | $ | 11,652,925 | |
| | | | | | | | | | | | | | | | | | |
Other liabilities in excess of assets -1.28% | | | | | | | | | | | | | | | | | (147,903 | ) |
| | | | | | | | | | | | | | | | | | |
Net Assets 100% | | | | | | | | | | | | | | | | $ | 11,505,022 | |
| | | | | | | | | | | | | | | | | | |
| | # | | Ratings by Moody’s Investors Services, Inc. unless noted otherwise. |
| | | | Bond ratings are unaudited and not covered by Report of Independent Registered Public Accounting Firm. |
| | | | All ratings are as of the date indicated and do not reflect subsequent changes. |
| | * | | Rated by Standard & Poor’s Corporation |
| | @ | | Fitch’s Investors Service |
| | ^ | | When-issued security or extended settlement — see footnote 1(D) |
| | ** | | Security is segregated — see footnote 1(D) |
| (a) | | Cost for federal income tax purposes is $10,719,754 and net unrealized appreciation of investments is as follows: |
| | | | | | |
| | Unrealized appreciation | | $ | 934,022 | |
| | Unrealized depreciation | | | (851 | ) |
| | | | | | |
| | Net unrealized appreciation | | $ | 933,171 | |
| | | | | | |
The accompanying notes are an integral part of the financial statements.
20
DUPREE MUTUAL FUNDS — MISSISSIPPI TAX-FREE INCOME SERIES
SCHEDULE OF PORTFOLIO INVESTMENTS
Mississippi Municipal Bonds — 100% of Net Assets
June 30, 2016
Other Information
The following is a summary of the inputs used, as of June 30, 2016, involving the Fund’s investments in securities carried at fair value. The inputs or methodology used for valuing securities may not be an indication of the risk associated with investing in those securities. For more information on valuation inputs, and their aggregation into the levels used in the table below, please refer to the Security Valuation section in the accompanying Notes to Financial Statements.
| | | | | | |
| | | Valuation Inputs | | Municipal Bonds | |
Level 1 | | Quoted Prices | | $ | — | |
Level 2 | | Other Significant Observable Inputs | | | 11,652,925 | |
Level 3 | | Significant Unobservable Inputs | | | — | |
| | | | | | |
| | | | $ | 11,652,925 | |
| | | | | | |
The accompanying notes are an integral part of the financial statements.
21
MISSISSIPPI TAX-FREE INCOME SERIES
STATEMENT OF ASSETS AND LIABILITIES
June 30, 2016
| | | | | | | | |
ASSETS: | | | | | | | | |
Investments in securities, at fair value (Cost: $10,720,126) | | | $ | 11,652,925 | |
Cash | | | | 47,530 | |
Interest receivable | | | | 153,795 | |
| | | | | | | | |
Total assets | | | | | | | 11,854,250 | |
LIABILITIES: | | | | | | | | |
Payable for: | | | | | | | | |
Investments purchased | | | 279,625 | | | | | |
Distributions to shareholders | | | 52,759 | | | | | |
Investment advisory fee | | | 3,092 | | | | | |
Transfer agent fee | | | 3,065 | | | | | |
Accrued expenses | | | 10,687 | | | | | |
| | | | | | | | |
Total liabilities | | | | | | | 349,228 | |
| | | | | | | | |
NET ASSETS: | | | | | | | | |
Capital | | | | | | | 10,567,553 | |
Accumulated net investment income | | | | | | | 306 | |
Net accumulated gain on investment transactions | | | | | | | 4,364 | |
Net unrealized appreciation in value of investments | | | | | | | 932,799 | |
| | | | | | | | |
Net assets at value | | | | | | $ | 11,505,022 | |
| | | | | | | | |
NET ASSET VALUE, offering price and redemption price per share
(916,373 shares outstanding; unlimited number of shares authorized; no par value) | | | | | | $ | 12.55 | |
| | | | | | | | |
STATEMENT OF OPERATIONS
For the year ended June 30, 2016
| | | | |
Net investment income: | | | | |
Interest income | | $ | 409,836 | |
| | | | |
Expenses: | | | | |
Investment advisory fee | | | 55,778 | |
Transfer agent fee | | | 16,733 | |
Custodian expense | | | 6,489 | |
Professional fees | | | 2,430 | |
Trustees fees | | | 1,132 | |
Pricing expense | | | 5,000 | |
Registration fees | | | 6,011 | |
Other expenses | | | 4,312 | |
| | | | |
Total expenses | | | 97,885 | |
Fees waived by Adviser (Note 2) | | | (19,398 | ) |
Custodian expense reduction | | | (33 | ) |
| | | | |
Net expenses | | | 78,454 | |
| | | | |
Net investment income | | | 331,382 | |
| | | | |
Realized and unrealized gain on investments: | | | | |
Net realized gain | | | 4,364 | |
Net change in unrealized appreciation/depreciation | | | 473,931 | |
| | | | |
Net realized and unrealized gain on investments | | | 478,295 | |
| | | | |
Net increase in net assets resulting from operations | | $ | 809,677 | |
| | | | |
The accompanying notes are an integral part of the financial statements.
22
MISSISSIPPI TAX-FREE INCOME SERIES
STATEMENTS OF CHANGES IN NET ASSETS
For the years ended June 30, 2016 and 2015
| | | | | | | | |
| | | 2016 | | | 2015 | |
Operations: | | | | | | | | |
Net investment income | | $ | 331,382 | | | $ | 337,233 | |
Net realized gain on investments | | | 4,364 | | | | 10,004 | |
Net change in unrealized appreciation/depreciation | | | 473,931 | | | | 53,973 | |
| | | | | | | | |
Net increase in net assets resulting from operations | | | 809,677 | | | | 401,210 | |
Distributions from net investment income (Note 6) | | | (331,306 | ) | | | (337,157 | ) |
Distributions from capital gains (Note 6) | | | (2,937 | ) | | | — | |
Net fund share transactions (Note 4) | | | 113,758 | | | | 401,625 | |
| | | | | | | | |
Total increase | | | 589,192 | | | | 465,678 | |
Net assets: | | | | | | | | |
Beginning of year | | | 10,915,830 | | | | 10,450,152 | |
| | | | | | | | |
End of year | | $ | 11,505,022 | | | $ | 10,915,830 | |
| | | | | | | | |
Accumulated net investment income | | $ | 306 | | | $ | 230 | |
| | | | | | | | |
FINANCIAL HIGHLIGHTS
| | | | | | | | | | | | | | | | | | | | |
| Selected data for a share outstanding: | | For the years ended June 30, | |
| | | 2016 | | | 2015 | | | 2014 | | | 2013 | | | 2012 | |
Net asset value, beginning of year | | | $12.03 | | | | $11.95 | | | | $11.65 | | | | $12.01 | | | | $11.33 | |
| | | | | | | | | | | | | | | | | | | | |
Income from investment operations: | | | | | | | | | | | | | | | | | | | | |
Net investment income | | | 0.36 | | | | 0.37 | | | | 0.38 | | | | 0.39 | | | | 0.42 | |
Net gains/(losses) on securities | | | 0.52 | | | | 0.08 | | | | 0.31 | | | | (0.33 | ) | | | 0.68 | |
| | | | | | | | | | | | | | | | | | | | |
Total from investment operations | | | 0.88 | | | | 0.45 | | | | 0.69 | | | | 0.06 | | | | 1.10 | |
Less distributions: | | | | | | | | | | | | | | | | | | | | |
Distributions from net investment income | | | (0.36 | ) | | | (0.37 | ) | | | (0.38 | ) | | | (0.42 | ) | | | (0.42 | ) |
Distributions from capital gains | | | 0.00 | (b) | | | 0.00 | | | | (0.01 | ) | | | — | | | | — | |
| | | | | | | | | | | | | | | | | | | | |
Total distributions | | | (0.36 | ) | | | (0.37 | ) | | | (0.39 | ) | | | (0.42 | ) | | | (0.42 | ) |
| | | | | | | | | | | | | | | | | | | | |
Net asset value, end of year | | | $12.55 | | | | $12.03 | | | | $11.95 | | | | $11.65 | | | | $12.01 | |
| | | | | | | | | | | | | | | | | | | | |
Total return | | | 7.49% | | | | 3.80% | | | | 6.08% | | | | 0.38% | | | | 9.87% | |
Net assets, end of year (in thousands) | | | $11,505 | | | | $10,916 | | | | $10,450 | | | | $8,309 | | | | $7,712 | |
Ratio of net expenses to average net assets (a) | | | 0.70% | | | | 0.69% | | | | 0.69% | | | | 0.66% | | | | 0.65% | |
Ratio of gross expenses to average net assets | | | 0.88% | | | | 0.86% | | | | 0.90% | | | | 0.89% | | | | 0.92% | |
Ratio of net investment income to average net assets | | | 2.97% | | | | 3.07% | | | | 3.26% | | | | 3.22% | | | | 3.59% | |
Portfolio turnover | | | 3.26% | | | | 6.47% | | | | 1.96% | | | | 13.81% | | | | 9.99% | |
| (a) | | Percentages are after expense waivers and reductions by the Adviser and Custodian. The Adviser and Custodian have agreed not to seek recovery of these waivers and reductions. |
| (b) | | Rounds to less than $0.01. |
The accompanying notes are an integral part of the financial statements.
23
DUPREE MUTUAL FUNDS — NORTH CAROLINA TAX-FREE INCOME SERIES
SCHEDULE OF PORTFOLIO INVESTMENTS
North Carolina Municipal Bonds — 100% of Net Assets
June 30, 2016
| | | | | | | | | | | | | | | | | | |
| Bond Description | | Coupon | | | Maturity
Date | | | Rating# | | Par Value | | | Fair Value | |
| PREREFUNDED BONDS | | | | | | | | | | | |
| 18.69’% of Net Assets | | | | | | | | | | | | | | | | | | |
Asheville NC Water System Revenue | | | 4.750 | % | | | 08/01/2027 | | | Aa2 | | $ | 1,000,000 | | | $ | 1,044,850 | |
Cabarrus County NC Certificates of Participation | | | 5.000 | | | | 06/01/2025 | | | Aa2 | | | 1,000,000 | | | | 1,082,440 | |
Cabarrus County NC Certificates of Participation | | | 5.000 | | | | 01/01/2029 | | | Aa2 | | | 750,000 | | | | 829,080 | |
Charlotte NC Water & Sewer Systems Revenue | | | 4.500 | | | | 07/01/2028 | | | Aaa | | | 750,000 | | | | 750,083 | |
Harnett County NC Certificates of Participation | | | 5.000 | | | | 06/01/2027 | | | A1 | | | 300,000 | | | | 337,026 | |
Johnston NC Memorial Hospital Authority | | | 5.250 | | | | 10/01/2028 | | | A2 | | | 490,000 | | | | 529,396 | |
Lee County NC Certificates of Participation | | | 5.000 | | | | 04/01/2025 | | | Aa3 | | | 550,000 | | | | 568,315 | |
Mecklenburg County NC Certificates of Participation | | | 5.000 | | | | 02/01/2028 | | | Aa1 | | | 415,000 | | | | 460,426 | |
Mecklenburg County NC Certificates of Participation | | | 5.000 | | | | 02/01/2026 | | | NR | | | 450,000 | | | | 480,465 | |
Montgomery County NC Certificates of Participation | | | 5.000 | | | | 02/01/2030 | | | A* | | | 1,680,000 | | | | 1,723,378 | |
Mooresville NC Certificates of Participation | | | 5.000 | | | | 09/01/2032 | | | AA-* | | | 1,890,000 | | | | 1,984,235 | |
NC Eastern Municipal Power Agency | | | 6.000 | | | | 01/01/2025 | | | A3 | | | 1,150,000 | | | | 1,582,642 | |
NC Eastern Municipal Power Agency Power System | | | 6.000 | | | | 01/01/2026 | | | NR | | | 275,000 | | | | 347,262 | |
NC Infrastructure Finance Corporation Certificates of Participation | | | 5.000 | | | | 02/01/2024 | | | Aa1 | | | 1,000,000 | | | | 1,026,000 | |
NC Municipal Power Agency #1 Catawba Electric Revenue | | | 4.750 | | | | 01/01/2030 | | | AAA@ | | | 210,000 | | | | 230,899 | |
NC Municipal Power Agency #1 Catawba Electric Revenue | | | 5.000 | | | | 01/01/2030 | | | AAA@ | | | 1,815,000 | | | | 2,006,864 | |
Randolph County NC Certificates of Participation | | | 5.000 | | | | 02/01/2027 | | | Aa3 | | | 1,000,000 | | | | 1,025,820 | |
Rockingham County NC Certificates of Participation | | | 5.000 | | | | 04/01/2032 | | | Aa3 | | | 1,325,000 | | | | 1,424,547 | |
Sampson County NC Certificates of Participation | | | 5.000 | | | | 06/01/2022 | | | A2 | | | 1,250,000 | | | | 1,300,225 | |
Sampson County NC Certificates of Participation | | | 5.000 | | | | 06/01/2026 | | | A2 | | | 1,000,000 | | | | 1,040,180 | |
University of NC Chapel Hill | | | 5.000 | | | | 12/01/2031 | | | Aaa | | | 1,215,000 | | | | 1,290,269 | |
University of NC System Pool Revenue | | | 5.000 | | | | 10/01/2026 | | | A1 | | | 1,000,000 | | | | 1,095,930 | |
University of NC System Pool Revenue | | | 5.000 | | | | 10/01/2034 | | | Aa2 | | | 1,950,000 | | | | 2,213,776 | |
University of North Carolina | | | 5.000 | | | | 10/01/2033 | | | A1 | | | 515,000 | | | | 564,403 | |
University of North Carolina | | | 5.000 | | | | 10/01/2033 | | | A1 | | | 340,000 | | | | 372,616 | |
University of North Carolina | | | 5.000 | | | | 10/01/2033 | | | Aa3 | | | 145,000 | | | | 146,398 | |
University of North Carolina | | | 5.000 | | | | 10/01/2033 | | | Aa3 | | | 235,000 | | | | 237,710 | |
University of North Carolina | | | 5.000 | | | | 10/01/2033 | | | Aa3 | | | 50,000 | | | | 50,582 | |
Wake County NC Limited Obligation | | | 5.000 | | | | 06/01/2032 | | | Aa1 | | | 1,500,000 | | | | 1,683,285 | |
Wilmington NC Certificates of Participation | | | 5.000 | | | | 06/01/2038 | | | Aa2 | | | 250,000 | | | | 270,510 | |
Wilmington NC Storm Water Fee Revenue | | | 5.000 | | | | 06/01/2028 | | | NR | | | 385,000 | | | | 400,435 | |
| | | | | | | | | | | | | | | | | | |
| | | | | | | | | | | | | | | | | 28,100,045 | |
| UNIVERSITY CONSOLIDATED EDUCATION AND BUILDING REVENUE BONDS | | | | | | | | | | | |
| 16.90% of Net Assets | | | | | | | | | | | | | | | | | | |
Iredell County NC Community College | | | 5.000 | | | | 04/01/2026 | | | Aa1 | | | 225,000 | | | | 241,166 | |
Iredell County NC Community College | | | 5.000 | | | | 04/01/2027 | | | Aa1 | | | 325,000 | | | | 348,351 | |
NC Capital Facilities Financial Agency Education Duke University | | | 5.000 | | | | 10/01/2038 | | | Aa1 | | | 500,000 | | | | 555,030 | |
NC Capital Facilities Financial Agency Education Wake Forest | | | 5.000 | | | | 01/01/2031 | | | Aa3 | | | 500,000 | | | | 549,835 | |
NC Capital Facilities Financial Agency Education Wake Forest | | | 5.000 | | | | 01/01/2038 | | | Aa3 | | | 1,250,000 | | | | 1,373,613 | |
NC State Capital Facilities Davidson College | | | 5.000 | | | | 03/01/2032 | | | AA+* | | | 310,000 | | | | 370,428 | |
NC State Capital Facilities Duke University | | | 5.000 | | | | 10/01/2041 | | | Aa1 | | | 2,000,000 | | | | 2,498,720 | |
NC State Capital Facilities Finance Agency Davidson College | | | 4.750 | | | | 03/01/2035 | | | AA+* | | | 1,000,000 | | | | 1,142,640 | |
NC State University at Raleigh | | | 5.000 | | | | 10/01/2042 | | | Aa1 | | | 750,000 | | | | 909,075 | |
Pitt County NC Limited Obligation | | | 5.000 | | | | 04/01/2035 | | | Aa2 | | | 105,000 | | | | 117,461 | |
University of NC Charlotte | | | 5.000 | | | | 04/01/2040 | | | Aa3 | | | 2,650,000 | | | | 3,247,204 | |
University of NC Charlotte | | | 5.000 | | | | 04/01/2035 | | | Aa3 | | | 595,000 | | | | 711,727 | |
University of NC Charlotte | | | 5.000 | | | | 04/01/2043 | | | Aa3 | | | 1,500,000 | | | | 1,787,205 | |
University of NC Charlotte | | | 5.000 | | | | 04/01/2031 | | | Aa3 | | | 750,000 | | | | 880,133 | |
University of NC Charlotte | | | 5.000 | | | | 04/01/2038 | | | Aa3 | | | 1,000,000 | | | | 1,194,610 | |
University of NC Greensboro** | | | 5.000 | | | | 04/01/2039 | | | Aa3 | | | 2,870,000 | | | | 3,448,879 | |
University of NC Greensboro | | | 5.000 | | | | 04/01/2036 | | | Aa3 | | | 500,000 | | | | 587,950 | |
University of NC Greensboro | | | 5.000 | | | | 04/01/2031 | | | Aa3 | | | 500,000 | | | | 593,065 | |
University of NC Greensboro | | | 5.000 | | | | 04/01/2033 | | | Aa3 | | | 900,000 | | | | 1,095,867 | |
University of NC Wilmington Limited Obligation | | | 5.000 | | | | 06/01/2033 | | | A1 | | | 550,000 | | | | 661,260 | |
University of NC Wilmington Limited Obligation^ | | | 4.000 | | | | 06/01/2034 | | | A1 | | | 500,000 | | | | 568,345 | |
University of North Carolina | | | 5.000 | | | | 10/01/2033 | | | A1 | | | 145,000 | | | | 157,411 | |
The accompanying notes are an integral part of the financial statements.
24
DUPREE MUTUAL FUNDS — NORTH CAROLINA TAX-FREE INCOME SERIES
SCHEDULE OF PORTFOLIO INVESTMENTS
North Carolina Municipal Bonds — 100% of Net Assets
June 30, 2016
| | | | | | | | | | | | | | | | | | |
| Bond Description | | Coupon | | | Maturity
Date | | | Rating# | | Par Value | | | Fair Value | |
University of North Carolina Wilmington Limited Obligation^ | | | 4.000 | % | | | 06/01/2033 | | | A1 | | $ | 1,200,000 | | | $ | 1,366,296 | |
Western Carolina University | | | 5.000 | | | | 10/01/2045 | | | Aa3 | | | 825,000 | | | | 1,006,591 | |
| | | | | | | | | | | | | | | | | | |
| | | | | | | | | | | | | | | | | 25,412,861 | |
| MUNICIPAL UTILITY REVENUE BONDS | | | | | | | | | | | |
| 13.28% of Net Assets | | | | | | | | | | | | | | | | | | |
Brunswick County NC Enterprise System Revenue** | | | 5.000 | | | | 04/01/2031 | | | Aa3 | | | 500,000 | | | | 622,605 | |
Buncombe County NC Metropolitan Sewerage District | | | 5.000 | | | | 07/01/2039 | | | Aa1 | | | 550,000 | | | | 665,583 | |
Concord NC Utilities System Revenue | | | 4.500 | | | | 12/01/2034 | | | Aa2 | | | 1,000,000 | | | | 1,206,920 | |
Fuquay-Varina NC Combined Utilities Revenue | | | 5.000 | | | | 04/01/2040 | | | Aa2 | | | 1,000,000 | | | | 1,246,520 | |
Gastonia NC Combined Utilities System Revenue | | | 5.000 | | | | 05/01/2034 | | | Aa2 | | | 570,000 | | | | 705,250 | |
Gastonia NC Combined Utilities System Revenue | | | 5.000 | | | | 05/01/2035 | | | Aa2 | | | 250,000 | | | | 308,413 | |
Greenville NC Combined Enterprise System Revenue | | | 5.000 | | | | 04/01/2034 | | | Aa2 | | | 500,000 | | | | 627,760 | |
High Point NC Combined Enterprise | | | 5.000 | | | | 11/01/2039 | | | Aa2 | | | 750,000 | | | | 912,315 | |
Jacksonville NC Enterprise System Revenue | | | 5.250 | | | | 05/01/2030 | | | Aa3 | | | 300,000 | | | | 411,213 | |
Jacksonville NC Enterprise System Revenue | | | 5.250 | | | | 05/01/2031 | | | Aa3 | | | 225,000 | | | | 311,459 | |
Martin County NC Limited Obligation Water and Sewer District | | | 4.750 | | | | 06/01/2034 | | | A2 | | | 1,150,000 | | | | 1,358,380 | |
Moore County NC | | | 5.000 | | | | 06/01/2031 | | | Aa3 | | | 2,750,000 | | | | 3,130,765 | |
Mooresville NC Limited Obligation | | | 5.000 | | | | 11/01/2031 | | | AA-* | | | 1,250,000 | | | | 1,517,325 | |
NC Eastern Municipal Power Agency #1 Catawba Electric Revenue | | | 5.000 | | | | 01/01/2031 | | | A2 | | | 500,000 | | | | 587,765 | |
NC Municipal Power Agency #1 Catawba Electric Revenue | | | 5.000 | | | | 01/01/2032 | | | A* | | | 500,000 | | | | 622,375 | |
NC Municipal Power Agency #1 Catawba Electric Revenue | | | 5.000 | | | | 01/01/2030 | | | A* | | | 500,000 | | | | 637,980 | |
NC Municipal Power Agency #1 Catawba Electric Revenue | | | 4.750 | | | | 01/01/2030 | | | A2 | | | 80,000 | | | | 87,023 | |
NC Municipal Power Agency #1 Catawba Electric Revenue | | | 5.000 | | | | 01/01/2030 | | | A2 | | | 730,000 | | | | 801,803 | |
Sampson County NC Water & Sewer District | | | 5.000 | | | | 06/01/2037 | | | A1 | | | 920,000 | | | | 1,112,657 | |
Wilmington NC Storm Water Fee Revenue | | | 5.000 | | | | 06/01/2028 | | | AA+* | | | 115,000 | | | | 119,393 | |
Wilson NC Certificates of Participation Public Facilities | | | 5.000 | | | | 05/01/2021 | | | A1 | | | 780,000 | | | | 806,972 | |
Wilson NC Certificates of Participation Public Facilities | | | 5.000 | | | | 05/01/2025 | | | A1 | | | 750,000 | | | | 774,840 | |
Wilson NC Certificates of Participation Public Facilities | | | 5.000 | | | | 05/01/2029 | | | A1 | | | 1,355,000 | | | | 1,397,913 | |
| | | | | | | | | | | | | | | | | | |
| | | | | | | | | | | | | | | | | 19,973,228 | |
| HOSPITAL AND HEALTHCARE | | | | | | | | | | | |
| 13.20% of Net Assets | | | | | | | | | | | | | | | | | | |
Charlotte Mecklenburg NC Hospital Healthcare System | | | 5.000 | | | | 01/15/2039 | | | Aa3 | | | 1,500,000 | | | | 1,790,865 | |
Charlotte Mecklenburg NC Hospital Healthcare System | | | 5.000 | | | | 01/15/2031 | | | Aa3 | | | 450,000 | | | | 460,566 | |
Charlotte Mecklenburg NC Hospital Healthcare System | | | 5.000 | | | | 01/15/2027 | | | Aa3 | | | 1,090,000 | | | | 1,150,321 | |
Charlotte Mecklenburg NC Hospital Healthcare System | | | 5.250 | | | | 01/15/2039 | | | Aa3 | | | 750,000 | | | | 823,230 | |
NC State Medical Care Commission Duke University Health | | | 5.000 | | | | 06/01/2035 | | | Aa2 | | | 500,000 | | | | 586,385 | |
NC State Medical Care Commission Health Care Facilities | | | 5.000 | | | | 06/01/2034 | | | Aa2 | | | 1,670,000 | | | | 1,875,594 | |
NC State Medical Care Commission Health Care Facilities | | | 5.000 | | | | 07/01/2030 | | | A2 | | | 500,000 | | | | 566,490 | |
NC State Medical Care Commission Health Care Facilities Mission Health | | | 5.000 | | | | 10/01/2036 | | | Aa3 | | | 3,045,000 | | | | 3,720,929 | |
NC State Medical Care Commission Health Care Facilities Rex Hospital | | | 5.000 | | | | 07/01/2033 | | | A2 | | | 750,000 | | | | 905,693 | |
NC State Medical Care Commission Health Care Facilities Vidant Health | | | 5.000 | | | | 06/01/2040 | | | A1 | | | 1,385,000 | | | | 1,668,870 | |
NC State Medical Care Commission Health Care Facilities Vidant Health | | | 5.000 | | | | 06/01/2036 | | | A1 | | | 1,000,000 | | | | 1,155,790 | |
NC State Medical Care Commission Health Care Facilities Wake Medical | | | 5.000 | | | | 10/01/2038 | | | A2 | | | 200,000 | | | | 234,710 | |
NC State Medical Care Commission Hospital Revenue NC Baptist Hospital | | | 5.250 | | | | 06/01/2029 | | | A2 | | | 645,000 | | | | 740,441 | |
NC State Medical Care Commission Wake Forest Baptist Hospital | | | 5.000 | | | | 12/01/2033 | | | A2 | | | 1,000,000 | | | | 1,175,920 | |
NC State Medical Care Commission Wake Medical | | | 5.000 | | | | 10/01/2031 | | | A2 | | | 1,000,000 | | | | 1,174,830 | |
NC State Medical Care Community Hospital Revenue NC Baptist Hospital | | | 5.000 | | | | 06/01/2034 | | | A2 | | | 1,225,000 | | | | 1,377,145 | |
NC State Medical Care Community Hospital Revenue NC Baptist Hospital | | | 4.750 | | | | 06/01/2030 | | | A2 | | | 405,000 | | | | 444,690 | |
| | | | | | | | | | | | | | | | | | |
| | | | | | | | | | | | | | | | | 19,852,467 | |
| REFUNDING BONDS | | | | | | | | | | | |
| 10.13% of Net Assets | | | | | | | | | | | | | | | | | | |
Buncombe County NC Limited Obligation | | | 5.000 | | | | 06/01/2035 | | | Aa2 | | | 2,000,000 | | | | 2,469,500 | |
Charlotte NC Certificates of Participation | | | 5.000 | | | | 06/01/2033 | | | Aa2 | | | 840,000 | | | | 1,015,955 | |
Charlotte NC Certificates of Participation | | | 5.000 | | | | 06/01/2034 | | | Aa2 | | | 750,000 | | | | 910,418 | |
Charlotte NC Certificates of Participation | | | 5.000 | | | | 06/01/2026 | | | Aa2 | | | 1,455,000 | | | | 1,565,362 | |
Charlotte NC Certificates of Participation | | | 5.000 | | | | 06/01/2027 | | | Aa2 | | | 775,000 | | | | 833,017 | |
Chatham County NC | | | 5.000 | | | | 11/01/2032 | | | Aa2 | | | 825,000 | | | | 1,025,269 | |
Dare County NC Limited Obligation Refunding | | | 5.000 | | | | 06/01/2029 | | | Aa3 | | | 100,000 | | | | 118,013 | |
The accompanying notes are an integral part of the financial statements.
25
DUPREE MUTUAL FUNDS — NORTH CAROLINA TAX-FREE INCOME SERIES
SCHEDULE OF PORTFOLIO INVESTMENTS
North Carolina Municipal Bonds — 100% of Net Assets
June 30, 2016
| | | | | | | | | | | | | | | | | | |
| Bond Description | | Coupon | | | Maturity
Date | | | Rating# | | Par Value | | | Fair Value | |
Durham Capital Financing Corporation Limited Obligation | | | 5.000 | % | | | 06/01/2034 | | | Aa1 | | $ | 500,000 | | | $ | 604,735 | |
Johnston County NC Installment Financing Contract | | | 5.000 | | | | 10/15/2027 | | | Aa2 | | | 570,000 | | | | 657,746 | |
Monroe NC Limited Obligation | | | 5.000 | | | | 03/01/2035 | | | Aa3 | | | 390,000 | | | | 486,946 | |
Monroe NC Limited Obligation | | | 5.000 | | | | 03/01/2039 | | | Aa3 | | | 1,715,000 | | | | 2,126,103 | |
New Hanover County NC Limited Obligation | | | 5.000 | | | | 12/01/2027 | | | Aa1 | | | 505,000 | | | | 614,853 | |
Pitt County NC Certificates of Participation | | | 5.000 | | | | 04/01/2027 | | | Aa2 | | | 500,000 | | | | 591,555 | |
Rockingham County NC Limited Obligation | | | 4.500 | | | | 04/01/2032 | | | Aa3 | | | 500,000 | | | | 597,680 | |
Rockingham County NC Limited Obligation | | | 5.000 | | | | 04/01/2027 | | | Aa3 | | | 250,000 | | | | 316,360 | |
Thomasville NC Combined Enterprise System Revenue | | | 4.750 | | | | 05/01/2028 | | | A1 | | | 435,000 | | | | 505,779 | |
Union County NC Limited Obligation Refunding | | | 5.000 | | | | 12/01/2024 | | | Aa1 | | | 125,000 | | | | 159,141 | |
Wake County NC Limited Obligation | | | 5.000 | | | | 12/01/2035 | | | Aa1 | | | 500,000 | | | | 637,205 | |
| | | | | | | | | | | | | | | | | | |
| | | | | | | | | | | | | | | | | 15,235,635 | |
| SCHOOL IMPROVEMENT BONDS | | | | | | | | | | | |
| 7.23% of Net Assets | | | | | | | | | | | | | | | | | | |
Brunswick County NC Limited Obligation | | | 5.000 | | | | 06/01/2030 | | | Aa3 | | | 250,000 | | | | 310,525 | |
Brunswick County NC Limited Obligation | | | 5.000 | | | | 06/01/2031 | | | Aa3 | | | 250,000 | | | | 309,145 | |
Cabarrus County NC Limited Obligation | | | 5.000 | | | | 04/01/2035 | | | Aa2 | | | 1,435,000 | | | | 1,778,797 | |
Davidson County NC Limited Obligation | | | 5.000 | | | | 06/01/2032 | | | Aa3 | | | 500,000 | | | | 632,290 | |
Duplin County Limited Obligation | | | 5.000 | | | | 04/01/2034 | | | A2 | | | 235,000 | | | | 289,217 | |
Duplin County NC Limited Obligation | | | 5.000 | | | | 04/01/2032 | | | A2 | | | 750,000 | | | | 930,428 | |
Franklin County NC Certificates of Participation | | | 5.000 | | | | 09/01/2027 | | | Aa3 | | | 750,000 | | | | 783,525 | |
Nash County NC Limited Obligation | | | 5.000 | | | | 10/01/2030 | | | Aa3 | | | 2,045,000 | | | | 2,356,106 | |
Onslow County NC Limited Obligation | | | 5.000 | | | | 06/01/2033 | | | Aa3 | | | 500,000 | | | | 613,725 | |
Sampson County NC Limited Obligation | | | 5.000 | | | | 12/01/2033 | | | A1 | | | 1,975,000 | | | | 2,437,446 | |
Wilkes County NC Limited Obligation | | | 5.000 | | | | 06/01/2031 | | | A1 | | | 350,000 | | | | 428,334 | |
| | | | | | | | | | | | | | | | | | |
| | | | | | | | | | | | | | | | | 10,869,537 | |
| PUBLIC FACILITIES REVENUE BONDS | | | | | | | | | | | |
| 5.83% of Net Assets | | | | | | | | | | | | | | | | | | |
Charlotte NC Certificates of Participation Convention Facilities | | | 5.000 | | | | 06/01/2034 | | | Aa2 | | | 900,000 | | | | 996,453 | |
Forsyth County NC Limited Tax | | | 5.000 | | | | 04/01/2031 | | | Aa1 | | | 335,000 | | | | 402,864 | |
Henderson County NC Limited Obligation | | | 5.000 | | | | 10/01/2030 | | | Aa3 | | | 250,000 | | | | 311,625 | |
Henderson County NC Limited Obligation | | | 5.000 | | | | 10/01/2031 | | | Aa3 | | | 500,000 | | | | 620,870 | |
Jacksonville Public Facilities Corporation Limited Obligation | | | 5.000 | | | | 04/01/2031 | | | A1 | | | 265,000 | | | | 310,980 | |
Jacksonville Public Facilities Corporation Limited Obligation | | | 5.000 | | | | 04/01/2032 | | | A1 | | | 100,000 | | | | 117,112 | |
Kannapolis NC Limited Obligation | | | 5.000 | | | | 04/01/2032 | | | Aa3 | | | 500,000 | | | | 602,435 | |
Mecklenburg County NC Certificates Participation | | | 5.000 | | | | 02/01/2026 | | | Aa1 | | | 550,000 | | | | 584,529 | |
Onslow County NC Limited Obligation | | | 5.000 | | | | 06/01/2032 | | | Aa3 | | | 500,000 | | | | 616,000 | |
Raleigh NC Limited Obligation | | | 5.000 | | | | 10/01/2034 | | | Aa1 | | | 1,420,000 | | | | 1,738,932 | |
Raleigh NC Limited Obligation | | | 5.000 | | | | 10/01/2038 | | | Aa1 | | | 500,000 | | | | 598,175 | |
Watauga NC Public Facilities Corporation Limited Obligation | | | 5.000 | | | | 06/01/2027 | | | Aa3 | | | 750,000 | | | | 890,198 | |
Winston Salem NC Limited Obligation | | | 5.000 | | | | 06/01/2031 | | | Aa2 | | | 800,000 | | | | 976,896 | |
| | | | | | | | | | | | | | | | | | |
| | | | | | | | | | | | | | | | | 8,767,069 | |
| MISCELLANEOUS PUBLIC IMPROVEMENT BONDS | | | | | | | | | | | |
| 4.12% of Net Assets | | | | | | | | | | | | | | | | | | |
Buncombe County NC Limited Obligation** | | | 5.000 | | | | 06/01/2030 | | | Aa2 | | | 250,000 | | | | 299,695 | |
Buncombe County NC Limited Obligation | | | 5.000 | | | | 06/01/2033 | | | Aa2 | | | 600,000 | | | | 741,396 | |
Buncombe County NC Limited Obligation | | | 5.000 | | | | 06/01/2034 | | | Aa2 | | | 365,000 | | | | 449,016 | |
Buncombe County NC Limited Obligation | | | 5.000 | | | | 06/01/2032 | | | Aa2 | | | 250,000 | | | | 298,445 | |
Buncombe County NC Limited Obligation | | | 5.000 | | | | 06/01/2034 | | | Aa2 | | | 1,100,000 | | | | 1,340,570 | |
Charlotte NC Certificates of Participation | | | 5.000 | | | | 12/01/2029 | | | Aa1 | | | 340,000 | | | | 404,053 | |
Johnston County NC Limited Obligation | | | 4.750 | | | | 06/01/2033 | | | Aa2 | | | 500,000 | | | | 575,870 | |
Orange County NC Public Facilities Company Limited Obligation | | | 4.750 | | | | 10/01/2032 | | | Aa1 | | | 750,000 | | | | 875,918 | |
Winston Salem NC Certificates of Participation | | | 4.750 | | | | 06/01/2031 | | | Aa1 | | | 620,000 | | | | 621,420 | |
Winston Salem NC Limited Obligation | | | 4.500 | | | | 06/01/2034 | | | Aa2 | | | 500,000 | | | | 586,725 | |
| | | | | | | | | | | | | | | | | | |
| | | | | | | | | | | | | | | | | 6,193,107 | |
The accompanying notes are an integral part of the financial statements.
26
DUPREE MUTUAL FUNDS — NORTH CAROLINA TAX-FREE INCOME SERIES
SCHEDULE OF PORTFOLIO INVESTMENTS
North Carolina Municipal Bonds — 100% of Net Assets
June 30, 2016
| | | | | | | | | | | | | | | | | | |
| Bond Description | | Coupon | | | Maturity
Date | | | Rating# | | Par Value | | | Fair Value | |
| AIRPORT BONDS | | | | | | | | | | | |
| 3.22% of Net Assets | | | | | | | | | | | | | | | | | | |
Charlotte NC Douglas International Airport | | | 5.000 | % | | | 07/01/2030 | | | Aa3 | | $ | 1,095,000 | | | $ | 1,345,908 | |
Charlotte NC Douglas International Airport | | | 5.000 | | | | 07/01/2025 | | | Aa3 | | | 1,000,000 | | | | 1,041,760 | |
Raleigh Durham NC Airport | | | 5.000 | | | | 05/01/2029 | | | Aa3 | | | 235,000 | | | | 268,664 | |
Raleigh Durham NC Airport | | | 5.000 | | | | 05/01/2036 | | | Aa3 | | | 1,480,000 | | | | 1,680,081 | |
Raleigh Durham NC Airport | | | 5.000 | | | | 05/01/2032 | | | Aa3 | | | 440,000 | | | | 500,012 | |
| | | | | | | | | | | | | | | | | | |
| | | | | | | | | | | | | | | | | 4,836,425 | |
| TURNPIKES/TOLLROAD/HIGHWAY BONDS | | | | | | | | | | | |
| 1.64% of Net Assets | | | | | | | | | | | | | | | | | | |
NC State Grant Anticipation Revenue Vehicle Garvee | | | 5.000 | | | | 03/01/2030 | | | A2 | | | 200,000 | | | | 247,176 | |
NC State Turnpike Authority Monroe Connector System | | | 5.000 | | | | 07/01/2029 | | | Aa2 | | | 500,000 | | | | 587,470 | |
NC State Turnpike Authority Monroe Connector System | | | 5.000 | | | | 07/01/2031 | | | Aa2 | | | 1,385,000 | | | | 1,624,356 | |
| | | | | | | | | | | | | | | | | | |
| | | | | | | | | | | | | | | | | 2,459,002 | |
| ESCROWED TO MATURITY BONDS | | | | | | | | | | | |
| 1.49% of Net Assets | | | | | | | | | | | | | | | | | | |
NC Eastern Municipal Power Agency | | | 6.000 | | | | 01/01/2022 | | | A3 | | | 915,000 | | | | 1,155,435 | |
NC Eastern Municipal Power Agency | | | 6.000 | | | | 01/01/2018 | | | AAA@ | | | 1,000,000 | | | | 1,080,190 | |
| | | | | | | | | | | | | | | | | | |
| | | | | | | | | | | | | | | | | 2,235,625 | |
| LEASE REVENUE BONDS | | | | | | | | | | | |
| 1.23% of Net Assets | | | | | | | | | | | | | | | | | | |
Buncombe County NC Limited Obligation | | | 5.000 | | | | 06/01/2032 | | | Aa2 | | | 1,500,000 | | | | 1,844,085 | |
| | | | | | | | | | | | | | | | | | |
| MISCELLANEOUS REVENUE BONDS | | | | | | | | | | | |
| .41% of Net Assets | | | | | | | | | | | |
Wilmington NC Storm Water Revenue | | | 5.000 | | | | 06/01/2035 | | | Aa2 | | | 500,000 | | | | 617,375 | |
| | | | | | | | | | | | | | | | | | |
Total Investments 97.37% of Net Assets (cost $136,367,162 (See (a) below for further explanation) | | | | | | | | | $ | 146,396,461 | |
| | | | | | | | | | | | | | | | | | |
Other assets in excess of liabilities 2.63% | | | | | | | | | | 3,950,585 | |
| | | | | | | | | | | | | | | | | | |
Net Assets 100% | | | | | | | | | $ | 150,347,046 | |
| | | | | | | | | | | | | | | | | | |
| | # | | Ratings by Moody’s Investors Services, Inc. unless noted otherwise. |
| | | | Bond ratings are unaudited and not covered by Report of Independent Registered Public Accounting Firm. |
| | | | All ratings are as of the date indicated and do not reflect subsequent changes. |
| | * | | Rated by Standard & Poor’s Corporation |
| | @ | | Fitch’s Investors Service |
| | ^ | | When-issued security or extended settlement — see footnote 1(D) |
| | ** | | Security is segregated — see footnote 1(D) |
| (a) | | Cost for federal income tax purposes is $136,364,019 and net unrealized appreciation of investments is as follows: |
| | | | | | |
| | Unrealized appreciation | | $ | 10,032,442 | |
| | Unrealized depreciation | | | — | |
| | | | | | |
| | Net unrealized appreciation | | $ | 10,032,442 | |
| | | | | | |
Other Information
The following is a summary of the inputs used, as of June 30, 2016, involving the Fund’s investments in securities carried at fair value. The inputs or methodology used for valuing securities may not be an indication of the risk associated with investing in those securities. For more information on valuation inputs, and their aggregation into the levels used in the table below, please refer to the Security Valuation section in the accompanying Notes to Financial Statements.
| | | | | | |
| | | Valuation Inputs | | Municipal Bonds | |
Level 1 | | Quoted Prices | | $ | — | |
Level 2 | | Other Significant Observable Inputs | | | 146,396,461 | |
Level 3 | | Significant Unobservable Inputs | | | — | |
| | | | | | |
| | | | $ | 146,396,461 | |
| | | | | | |
The accompanying notes are an integral part of the financial statements.
27
NORTH CAROLINA TAX-FREE INCOME SERIES
STATEMENT OF ASSETS AND LIABILITIES
June 30, 2016
| | | | | | | | |
ASSETS: | | | | | | | | |
Investments in securities, at fair value (Cost: $136,367,162) | | | $ | 146,396,461 | |
Cash | | | | | | | 4,922,021 | |
Receivable for fund shares sold | | | | | | | 30,000 | |
Interest receivable | | | | | | | 1,469,661 | |
| | | | | | | | |
Total assets | | | | | | | 152,818,143 | |
LIABILITIES: | | | | | | | | |
Payable for: | | | | | | | | |
Investments purchased | | | 1,913,418 | | | | | |
Distributions to shareholders | | | 320,904 | | | | | |
Fund shares redeemed | | | 132,541 | | | | | |
Investment advisory fee | | | 60,451 | | | | | |
Transfer agent fee | | | 25,767 | | | | | |
Accrued expenses | | | 18,016 | | | | | |
| | | | | | | | |
Total liabilities | | | | | | | 2,471,097 | |
| | | | | | | | |
NET ASSETS: | | | | | | | | |
Capital | | | | 140,879,145 | |
Accumulated net investment income | | | | 3,143 | |
Accumulated net realized loss on investment transactions | | | | (564,541 | ) |
Net unrealized appreciation in value of investments | | | | 10,029,299 | |
| | | | | | | | |
Net assets at value | | | | | | $ | 150,347,046 | |
| | | | | | | | |
NET ASSET VALUE, offering price and redemption price per share
(12,511,061 shares outstanding; unlimited number of shares authorized; no par value) | | | | | | $ | 12.02 | |
| | | | | | | | |
STATEMENT OF OPERATIONS
For the year ended June 30, 2016
| | | | |
Net investment income: | | | | |
Interest income | | $ | 4,793,688 | |
| | | | |
Expenses: | | | | |
Investment advisory fee | | | 654,493 | |
Transfer agent fee | | | 167,198 | |
Custodian expense | | | 21,071 | |
Professional fees | | | 28,474 | |
Trustees fees | | | 13,274 | |
Other expenses | | | 49,928 | |
| | | | |
Total expenses | | | 934,438 | |
Custodian expense reduction | | | (108 | ) |
| | | | |
Net expenses | | | 934,330 | |
| | | | |
Net investment income | | | 3,859,358 | |
| | | | |
Realized and unrealized gain on investments: | | | | |
Net realized gain | | | 2,054 | |
Net change in unrealized appreciation/depreciation | | | 5,728,384 | |
| | | | |
Net realized and unrealized gain on investments | | | 5,730,438 | |
| | | | |
Net increase in net assets resulting from operations | | $ | 9,589,796 | |
| | | | |
The accompanying notes are an integral part of the financial statements.
28
NORTH CAROLINA TAX-FREE INCOME SERIES
STATEMENTS OF CHANGES IN NET ASSETS
For the years ended June 30, 2016 and 2015
| | | | | | | | |
| | | 2016 | | | 2015 | |
Operations: | | | | | | | | |
Net investment income | | $ | 3,859,358 | | | $ | 3,363,838 | |
Net realized gain on investments | | | 2,054 | | | | 14,631 | |
Net change in unrealized appreciation/depreciation | | | 5,728,384 | | | | (437,611 | ) |
| | | | | | | | |
Net increase in net assets resulting from operations | | | 9,589,796 | | | | 2,940,858 | |
Distributions from net investment income (Note 6) | | | (3,858,780 | ) | | | (3,362,896 | ) |
Net fund share transactions (Note 4) | | | 20,898,699 | | | | 25,260,770 | |
| | | | | | | | |
Total increase | | | 26,629,715 | | | | 24,838,732 | |
Net assets: | | | | | | | | |
Beginning of year | | | 123,717,331 | | | | 98,878,599 | |
| | | | | | | | |
End of year | | $ | 150,347,046 | | | $ | 123,717,331 | |
| | | | | | | | |
Accumulated net investment income | | $ | 3,143 | | | $ | 2,565 | |
| | | | | | | | |
FINANCIAL HIGHLIGHTS
| | | | | | | | | | | | | | | | | | | | |
| Selected data for a share outstanding: | | For the years ended June 30, | |
| | | 2016 | | | 2015 | | | 2014 | | | 2013 | | | 2012 | |
Net asset value, beginning of year | | | $11.53 | | | | $11.54 | | | | $11.31 | | | | $11.59 | | | | $10.92 | |
| | | | | | | | | | | | | | | | | | | | |
Income from investment operations: | | | | | | | | | | | | | | | | | | | | |
Net investment income | | | 0.34 | | | | 0.36 | | | | 0.37 | | | | 0.36 | | | | 0.39 | |
Net gains/(losses) on securities | | | 0.49 | | | | (0.01 | ) | | | 0.24 | | | | (0.26 | ) | | | 0.67 | |
| | | | | | | | | | | | | | | | | | | | |
Total from investment operations | | | 0.83 | | | | 0.35 | | | | 0.61 | | | | 0.10 | | | | 1.06 | |
Less distributions: | | | | | | | | | | | | | | | | | | | | |
Distributions from net investment income | | | (0.34 | ) | | | (0.36 | ) | | | (0.37 | ) | | | (0.36 | ) | | | (0.39 | ) |
Distributions from capital gains | | | — | | | | — | | | | (0.01 | ) | | | (0.02 | ) | | | — | |
| | | | | | | | | | | | | | | | | | | | |
Total distributions | | | (0.34 | ) | | | (0.36 | ) | | | (0.38 | ) | | | (0.38 | ) | | | (0.39 | ) |
| | | | | | | | | | | | | | | | | | | | |
Net asset value, end of year | | | $12.02 | | | | $11.53 | | | | $11.54 | | | | $11.31 | | | | $11.59 | |
| | | | | | | | | | | | | | | | | | | | |
Total return | | | 7.28% | | | | 3.00% | | | | 5.57% | | | | 0.76% | | | | 9.87% | |
Net assets, end of year (in thousands) | | | $150,347 | | | | $123,717 | | | | $98,879 | | | | $95,127 | | | | $88,304 | |
Ratio of net expenses to average net assets (a) | | | 0.70% | | | | 0.71% | | | | 0.72% | | | | 0.71% | | | | 0.71% | |
Ratio of gross expenses to average net assets | | | 0.70% | | | | 0.71% | | | | 0.72% | | | | 0.71% | | | | 0.71% | |
Ratio of net investment income to average net assets | | | 2.87% | | | | 3.04% | | | | 3.29% | | | | 3.07% | | | | 3.46% | |
Portfolio turnover | | | 6.09% | | | | 4.56% | | | | 9.73% | | | | 3.59% | | | | 5.94% | |
| (a) | | Percentages are after Custodian reduction for which no recovery will be sought. |
The accompanying notes are an integral part of the financial statements.
29
DUPREE MUTUAL FUNDS — NORTH CAROLINA TAX-FREE SHORT-TO-MEDIUM SERIES
SCHEDULE OF PORTFOLIO INVESTMENTS
North Carolina Municipal Bonds — 100% of Net Assets
June 30, 2016
| | | | | | | | | | | | | | | | | | |
| Bond Description | | Coupon | | | Maturity
Date | | | Rating# | | Par Value | | | Fair Value | |
| PREREFUNDED BONDS | | | | | | | | | | | |
| 22.05% of Net Assets | | | | | | | | | | | | | | | | | | |
Brunswick County NC Community College | | | 4.250 | % | | | 05/01/2022 | | | Aa2 | | $ | 125,000 | | | $ | 128,724 | |
Cabarrus County NC Certificates of Participation | | | 5.000 | | | | 06/01/2019 | | | Aa2 | | | 420,000 | | | | 454,289 | |
Cabarrus County NC Certificates of Participation | | | 5.000 | | | | 01/01/2021 | | | Aa2 | | | 200,000 | | | | 221,088 | |
Durham County NC Certificates of Participation | | | 5.000 | | | | 06/01/2020 | | | Aa1 | | | 435,000 | | | | 488,688 | |
Durham County NC Certificates of Participation | | | 5.000 | | | | 06/01/2021 | | | Aa1 | | | 240,000 | | | | 269,621 | |
Harnett County NC Certificates of Participation | | | 5.000 | | | | 12/01/2021 | | | A1 | | | 200,000 | | | | 212,272 | |
Johnston NC Memorial Hospital Authority Mortgage Revenue | | | 5.000 | | | | 10/01/2018 | | | A2 | | | 175,000 | | | | 188,148 | |
Lee County NC Certificates of Participation | | | 5.000 | | | | 04/01/2018 | | | Aa3 | | | 225,000 | | | | 232,493 | |
Mooreville NC Certificates of Participation | | | 4.125 | | | | 09/01/2018 | | | AA-* | | | 250,000 | | | | 260,223 | |
NC Eastern Municipal Power Agency | | | 5.250 | | | | 01/01/2019 | | | A3 | | | 550,000 | | | | 588,033 | |
NC Infrastructure Certificates of Participation | | | 5.000 | | | | 02/01/2020 | | | Aa1 | | | 425,000 | | | | 435,846 | |
NC Medical Care Duke University Health Systems | | | 3.000 | | | | 06/01/2019 | | | Aa2 | | | 150,000 | | | | 159,279 | |
NC Municipal Power Agency #1 Catawba Electric | | | 5.000 | | | | 01/01/2021 | | | AAA@ | | | 45,000 | | | | 49,769 | |
NC State Capital Improvement Obligation | | | 5.000 | | | | 05/01/2022 | | | Aa1 | | | 155,000 | | | | 173,217 | |
NC State Capital Improvement Obligation | | | 5.000 | | | | 05/01/2022 | | | Aa1 | | | 100,000 | | | | 107,849 | |
Onslow NC Water & Sewer | | | 4.250 | | | | 06/01/2022 | | | A3 | | | 150,000 | | | | 160,134 | |
Randolph County NC Certificates of Participation | | | 5.000 | | | | 02/01/2018 | | | Aa3 | | | 200,000 | | | | 205,104 | |
Rockingham County NC Certificates of Participation | | | 4.000 | | | | 04/01/2019 | | | Aa3 | | | 100,000 | | | | 105,901 | |
Rutherford County NC Certificates of Participation | | | 5.000 | | | | 12/01/2018 | | | A1 | | | 205,000 | | | | 217,548 | |
Rutherford County NC Certificates of Participation | | | 5.000 | | | | 12/01/2020 | | | A1 | | | 100,000 | | | | 106,121 | |
Rutherford NC Certificates of Participation | | | 4.000 | | | | 12/01/2019 | | | A1 | | | 200,000 | | | | 209,566 | |
Sampson County NC Certificates of Participation | | | 5.000 | | | | 06/01/2020 | | | A2 | | | 400,000 | | | | 415,924 | |
University of North Carolina | | | 4.250 | | | | 10/01/2021 | | | A1 | | | 20,000 | | | | 21,575 | |
University of North Carolina | | | 4.250 | | | | 10/01/2021 | | | A1 | | | 20,000 | | | | 21,584 | |
Wilmington NC Certificates of Participation | | | 4.200 | | | | 06/01/2019 | | | Aa2 | | | 100,000 | | | | 106,661 | |
| | | | | | | | | | | | | | | | | | |
| | | | | | | | | | | | | | | | | 5,539,654 | |
| REFUNDING BONDS | | | | | | | | | | | |
| 21.11% of Net Assets | | | | | | | | | | | | | | | | | | |
Bertie County Limited Obligation | | | 4.000 | | | | 06/01/2022 | | | A1 | | | 200,000 | | | | 226,520 | |
Cabarrus County NC Certificates of Participation | | | 5.000 | | | | 04/01/2021 | | | AA* | | | 150,000 | | | | 171,506 | |
Charlotte NC Certificate of Participation | | | 5.000 | | | | 12/01/2024 | | | Aa2 | | | 250,000 | | | | 318,735 | |
Charlotte NC Certificates of Participation | | | 4.000 | | | | 06/01/2022 | | | Aa2 | | | 125,000 | | | | 144,323 | |
Charlotte NC Certificates of Participation | | | 4.000 | | | | 06/01/2025 | | | Aa2 | | | 300,000 | | | | 348,045 | |
Charlotte NC Certificates of Participation** | | | 5.000 | | | | 06/01/2023 | | | Aa2 | | | 625,000 | | | | 774,744 | |
Cumberland County NC Certificates of Participation | | | 5.000 | | | | 12/01/2017 | | | Aa2 | | | 350,000 | | | | 371,217 | |
Cumberland County NC Certificates of Participation | | | 3.500 | | | | 12/01/2020 | | | Aa2 | | | 185,000 | | | | 199,471 | |
Dare County NC Limited Obligation | | | 5.000 | | | | 06/01/2024 | | | Aa3 | | | 335,000 | | | | 402,643 | |
Dare County NC Limited Obligation | | | 4.000 | | | | 06/01/2019 | | | Aa3 | | | 100,000 | | | | 108,882 | |
Durham NC Refunding | | | 5.000 | | | | 09/01/2022 | | | Aaa | | | 125,000 | | | | 154,335 | |
Johnston County NC Limited Obligation | | | 5.000 | | | | 06/01/2029 | | | Aa2 | | | 350,000 | | | | 436,706 | |
Pender County NC Limited Obligation | | | 3.000 | | | | 06/01/2019 | | | Aa3 | | | 220,000 | | | | 232,694 | |
Raleigh NC Limited Obligation | | | 5.000 | | | | 10/01/2023 | | | Aa2 | | | 250,000 | | | | 312,643 | |
Richmond County NC Limited Obligation | | | 4.000 | | | | 04/01/2019 | | | A1 | | | 225,000 | | | | 242,388 | |
Rockingham County Limited Obligation | | | 5.000 | | | | 04/01/2023 | | | Aa3 | | | 250,000 | | | | 308,338 | |
Rockingham County NC Limited Obligation | | | 4.000 | | | | 04/01/2024 | | | Aa3 | | | 105,000 | | | | 122,138 | |
Sampson County NC Limited Obligation | | | 5.000 | | | | 12/01/2023 | | | A1 | | | 165,000 | | | | 203,448 | |
Union County NC Limited Obligation | | | 3.000 | | | | 12/01/2018 | | | Aa1 | | | 100,000 | | | | 104,941 | |
Warren County NC Limited Obligation | | | 5.000 | | | | 06/01/2023 | | | A1 | | | 100,000 | | | | 122,406 | |
| | | | | | | | | | | | | | | | | | |
| | | | | | | | | | | | | | | | | 5,306,121 | |
| MUNICIPAL UTILITY REVENUE BONDS | | | | | | | | | | | |
| 14.41% of Net Assets | | | | | | | | | | | | | | | | | | |
Brunswick County NC Enterprise System Revenue | | | 5.000 | | | | 04/01/2027 | | | Aa3 | | | 350,000 | | | | 444,861 | |
Columbus County NC Limited Obligation | | | 5.000 | | | | 06/01/2023 | | | A1 | | | 355,000 | | | | 432,202 | |
Gastonia North Carolina Combined Utilities System | | | 4.000 | | | | 05/01/2023 | | | Aa2 | | | 150,000 | | | | 176,516 | |
Monroe NC Certificates of Participation | | | 4.000 | | | | 03/01/2019 | | | Aa3 | | | 100,000 | | | | 107,717 | |
Moore County NC | | | 5.000 | | | | 06/01/2017 | | | Aa3 | | | 685,000 | | | | 712,270 | |
The accompanying notes are an integral part of the financial statements.
30
DUPREE MUTUAL FUNDS — NORTH CAROLINA TAX-FREE SHORT-TO-MEDIUM SERIES
SCHEDULE OF PORTFOLIO INVESTMENTS
North Carolina Municipal Bonds — 100% of Net Assets
June 30, 2016
| | | | | | | | | | | | | | | | | | |
| Bond Description | | Coupon | | | Maturity
Date | | | Rating# | | Par Value | | | Fair Value | |
Moore County NC | | | 5.000 | % | | | 06/01/2021 | | | Aa3 | | $ | 200,000 | | | $ | 229,342 | |
Mooresville NC Limited Obligation | | | 5.000 | | | | 11/01/2021 | | | AA-* | | | 350,000 | | | | 415,352 | |
NC Municipal Power Agency #1 Catawba Electric | | | 5.250 | | | | 01/01/2017 | | | A2 | | | 130,000 | | | | 132,950 | |
NC Municipal Power Agency #1 Catawba Electric | | | 5.000 | | | | 01/01/2021 | | | A2 | | | 205,000 | | | | 225,754 | |
NC Municipal Power Agency #1Catawba Electric | | | 5.250 | | | | 01/01/2018 | | | A2 | | | 95,000 | | | | 101,406 | |
Union County NC Enterprise System Revenue | | | 4.000 | | | | 12/01/2022 | | | Aa1 | | | 100,000 | | | | 114,875 | |
Wilson NC Certificates of Participation | | | 5.000 | | | | 05/01/2018 | | | A1 | | | 160,000 | | | | 165,629 | |
Wilson NC Certificates of Participation** | | | 5.000 | | | | 05/01/2022 | | | A1 | | | 350,000 | | | | 361,743 | |
| | | | | | | | | | | | | | | | | | |
| | | | | | | | | | | | | | | | | 3,620,615 | |
| SCHOOL IMPROVEMENT BONDS | | | | | | | | | | | |
| 8.65% of Net Assets | | | | | | | | | | | | | | | | | | |
Cabarrus County NC Certificates of Participation | | | 4.250 | | | | 06/01/2017 | | | Aa2 | | | 175,000 | | | | 180,682 | |
Cabarrus County NC Certificates of Participation | | | 5.000 | | | | 01/01/2017 | | | Aa2 | | | 150,000 | | | | 153,248 | |
Cabarrus County NC Certificates of Participation | | | 5.000 | | | | 01/01/2019 | | | Aa2 | | | 100,000 | | | | 110,281 | |
Cabarrus County NC Limited Obligation | | | 5.000 | | | | 04/01/2024 | | | Aa2 | | | 350,000 | | | | 440,794 | |
Davidson County NC Limited Obligation | | | 5.000 | | | | 06/01/2024 | | | Aa3 | | | 200,000 | | | | 253,964 | |
Montgomery County NC Certificates of Participation | | | 5.000 | | | | 02/01/2017 | | | A* | | | 125,000 | | | | 127,854 | |
Nash County NC Limited Obligation | | | 5.000 | | | | 10/01/2018 | | | Aa3 | | | 150,000 | | | | 163,754 | |
New Hanover County North Carolina | | | 4.000 | | | | 02/01/2028 | | | Aaa | | | 100,000 | | | | 118,740 | |
Onslow County NC Limted Obligation | | | 5.000 | | | | 06/01/2023 | | | Aa3 | | | 250,000 | | | | 308,783 | |
Rutherford County NC Certificates of Participation | | | 5.000 | | | | 12/01/2017 | | | A1 | | | 105,000 | | | | 111,273 | |
Wilkes County NC Limited Obligation | | | 5.000 | | | | 06/01/2024 | | | A1 | | | 165,000 | | | | 205,046 | |
| | | | | | | | | | | | | | | | | | |
| | | | | | | | | | | | | | | | | 2,174,417 | |
| HOSPITAL AND HEALTHCARE REVENUE BONDS | | | | | | | | | | | |
| 7.97% of Net Assets | | | | | | | | | | | | | | | | | | |
Charlotte-Mecklenburg Hospital | | | 5.000 | | | | 01/15/2018 | | | Aa3 | | | 200,000 | | | | 204,950 | |
Charlotte-Mecklenburg Hospital | | | 5.000 | | | | 01/15/2019 | | | Aa3 | | | 200,000 | | | | 205,006 | |
Charlotte-Mecklenburg Hospital | | | 4.375 | | | | 01/15/2019 | | | Aa3 | | | 150,000 | | | | 157,701 | |
NC Medical Care Caromont Health | | | 3.250 | | | | 02/15/2018 | | | A1 | | | 370,000 | | | | 384,911 | |
NC Medical Care Duke University | | | 5.000 | | | | 06/01/2026 | | | Aa2 | | | 165,000 | | | | 197,799 | |
NC State Medical Care Commission Health Care Facilitities | | | 4.000 | | | | 06/01/2024 | | | Aa2 | | | 200,000 | | | | 237,860 | |
NC State Medical Care Commission Health Care Facilitities | | | 4.000 | | | | 06/01/2025 | | | Aa2 | | | 250,000 | | | | 299,915 | |
North Carolina State Medical Care Commission — Mission Health System | | | 5.000 | | | | 10/01/2024 | | | Aa3 | | | 250,000 | | | | 313,925 | |
| | | | | | | | | | | | | | | | | | |
| | | | | | | | | | | | | | | | | 2,002,067 | |
| UNIVERSITY CONSOLIDATED EDUCATION AND BUILDING REVENUE BONDS | | | | | | | | | | | |
| 5.18% of Net Assets | | | | | | | | | | | | | | | | | | |
Appalachian NC State University^ | | | 5.000 | | | | 10/01/2025 | | | Aa3 | | | 235,000 | | | | 302,758 | |
University NC System Pool Revenue | | | 5.000 | | | | 10/01/2016 | | | Aa2 | | | 250,000 | | | | 252,883 | |
University NC System Pool Revenue Asheville Wilmington | | | 5.000 | | | | 10/01/2016 | | | A1 | | | 230,000 | | | | 232,686 | |
University of NC at Greensboro | | | 5.000 | | | | 04/01/2025 | | | Aa3 | | | 100,000 | | | | 117,553 | |
University of NC Wilmington Limited Obligation^ | | | 5.000 | | | | 06/01/2024 | | | A1 | | | 265,000 | | | | 332,662 | |
University of North Carolina | | | 4.250 | | | | 10/01/2021 | | | A1 | | | 60,000 | | | | 64,291 | |
| | | | | | | | | | | | | | | | | | |
| | | | | | | | | | | | | | | | | 1,302,833 | |
| MISCELLANEOUS PUBLIC IMPROVEMENT BONDS | | | | | | | | | | | |
| 5.08% of Net Assets | | | | | | | | | | | | | | | | | | |
Johnston County NC Limited Obligation | | | 4.000 | | | | 06/01/2019 | | | Aa2 | | | 150,000 | | | | 163,686 | |
NC Infrastructure Finance Certificates of Participation | | | 5.000 | | | | 02/01/2017 | | | Aa1 | | | 150,000 | | | | 153,765 | |
NC State Capital Improvement Obligation | | | 4.000 | | | | 05/01/2025 | | | Aa1 | | | 105,000 | | | | 115,616 | |
NC State Capital Improvement Obligation | | | 5.000 | | | | 05/01/2021 | | | Aa1 | | | 350,000 | | | | 403,414 | |
NC State Capital Improvement Obligation | | | 4.000 | | | | 05/01/2020 | | | Aa1 | | | 120,000 | | | | 126,917 | |
Salisbury NC Certificates of Participation | | | 5.000 | | | | 03/01/2019 | | | A3 | | | 145,000 | | | | 159,673 | |
Winston Salem NC Limited Obligation | | | 5.000 | | | | 06/01/2023 | | | Aa2 | | | 125,000 | | | | 154,670 | |
| | | | | | | | | | | | | | | | | | |
| | | | | | | | | | | | | | | | | 1,277,739 | |
| PUBLIC FACILITIES REVENUE BONDS | | | | | | | | | | | |
| 4.88% of Net Assets | | | | | | | | | | | | | | | | | | |
Charlotte NC Certificates of Participation | | | 4.000 | | | | 12/01/2022 | | | Aa1 | | | 170,000 | | | | 194,135 | |
Chatham County NC Limited Obligation | | | 5.000 | | | | 11/01/2025 | | | Aa2 | | | 500,000 | | | | 640,695 | |
The accompanying notes are an integral part of the financial statements.
31
DUPREE MUTUAL FUNDS — NORTH CAROLINA TAX-FREE SHORT-TO-MEDIUM SERIES
SCHEDULE OF PORTFOLIO INVESTMENTS
North Carolina Municipal Bonds — 100% of Net Assets
June 30, 2016
| | | | | | | | | | | | | | | | | | |
| Bond Description | | Coupon | | | Maturity
Date | | | Rating# | | Par Value | | | Fair Value | |
Mecklenburg NC Certificates of Participation | | | 5.000 | % | | | 02/01/2017 | | | Aa1 | | $ | 60,000 | | | $ | 61,517 | |
Watauga NC Public Facillities Corporation Limited Obligation | | | 5.000 | | | | 06/01/2023 | | | Aa3 | | | 275,000 | | | | 330,358 | |
| | | | | | | | | | | | | | | | | | |
| | | | | | | | | | | | | | | | | 1,226,704 | |
| ESCROWED TO MATURITY BONDS | | | | | | | | | | | |
| 3.76% of Net Assets | | | | | | | | | | | | | | | | | | |
Mecklenburg NC Certificates of Participation | | | 5.000 | | | | 02/01/2017 | | | NR | | | 45,000 | | | | 46,148 | |
NC Eastern Municipal Power Agency | | | 6.000 | | | | 01/01/2022 | | | A3 | | | 220,000 | | | | 277,809 | |
NC Eastern Municipal Power Agency | | | 5.000 | | | | 01/01/2021 | | | AAA@ | | | 125,000 | | | | 146,961 | |
NC Eastern Municipal Power Agency | | | 6.000 | | | | 01/01/2022 | | | AAA@ | | | 125,000 | | | | 157,694 | |
NC Eastern Municipal Power Agency | | | 6.500 | | | | 01/01/2018 | | | A3 | | | 100,000 | | | | 108,671 | |
NC Municipal Power Agency #1 Catawba Electric | | | 5.250 | | | | 01/01/2017 | | | AAA@ | | | 70,000 | | | | 71,639 | |
NC Municipal Power Agency #1 Catawba Electric | | | 5.250 | | | | 01/01/2018 | | | AAA@ | | | 30,000 | | | | 32,070 | |
University NC Wilmington Certificates of Participation | | | 4.000 | | | | 06/01/2017 | | | A1 | | | 100,000 | | | | 103,000 | |
| | | | | | | | | | | | | | | | | | |
| | | | | | | | | | | | | | | | | 943,992 | |
| TURNPIKES/TOLLROAD/HIGHWAY BONDS | | | | | | | | | | | |
| 1.36% of Net Assets | | | | | | | | | | | | | | | | | | |
NC State Grant Anticipation Revenue Vehicle | | | 5.000 | | | | 03/01/2021 | | | A2 | | | 310,000 | | | | 343,012 | |
| | | | | | | | | | | | | | | | | | |
| AD VALOREM PROPERTY BONDS | | | | | | | | | | | |
| 1.24% of Net Assets | | | | | | | | | | | | | | | | | | |
Smithville Township NC | | | 5.000 | | | | 06/01/2024 | | | A1 | | | 250,000 | | | | 312,353 | |
| | | | | | | | | | | | | | | | | | |
| LEASE REVENUE BONDS | | | | | | | | | | | |
| 1.12% of Net Assets | | | | | | | | | | | | | | | | | | |
Edgecombe County NC Limited Obligation | | | 4.000 | | | | 06/01/2022 | | | A2 | | | 250,000 | | | | 282,398 | |
| | | | | | | | | | | | | | | | | | |
| AIRPORT BONDS | | | | | | | | | | | |
| 0.84% of Net Assets | | | | | | | | | | | | | | | | | | |
Charlotte NC Airport — Charlotte Douglas International | | | 4.125 | | | | 07/01/2016 | | | Aa3 | | | 100,000 | | | | 100,011 | |
Raleigh Durham NC Airport Authority | | | 5.000 | | | | 11/01/2017 | | | Aa3 | | | 105,000 | | | | 111,036 | |
| | | | | | | | | | | | | | | | | | |
| | | | | | | | | | | | | | | | | 211,047 | |
| STATE AND LOCAL MORTGAGE/HOUSING BONDS | | | | | | | | | | | |
| .40% of Net Assets | | | | | | | | | | | | | | | | | | |
NC Housing Finance Agency | | | 3.850 | | | | 01/01/2017 | | | Aa2 | | | 100,000 | | | | 101,450 | |
| | | | | | | | | | | | | | | | | | |
Total Investments 98.05% of Net Assets (cost $23,915,256) (See (a) below for further explanation) | | | | | | | | | $ | 24,644,401 | |
| | | | | | | | | | | | | | | | | | |
Other assets in excess of liabilities 1.95% | | | | | | | | | | 489,616 | |
| | | | | | | | | | | | | | | | | | |
Net Assets 100% | | | | | | | | | $ | 25,134,017 | |
| �� | | | | | | | | | | | | | | | | | |
| | # | | Ratings by Moody’s Investors Services, Inc. unless noted otherwise. |
| | | | Bond ratings are unaudited and not covered by Report of Independent Registered Public Accounting Firm. |
| | | | All ratings are as of the date indicated and do not reflect subsequent changes. |
| | * | | Rated by Standard & Poor’s Corporation |
| | @ | | Fitch’s Investors Service |
| | ^ | | When-issued security or extended settlement — see footnote 1(D) |
| | ** | | Security is segregated — see footnote 1(D) |
| (a) | | Cost for federal income tax purposes is $23,915,256 and net unrealized appreciation of investments is as follows: |
| | | | | | |
| | Unrealized appreciation | | $ | 729,145 | |
| | Unrealized depreciation | | | — | |
| | | | | | |
| | Net unrealized appreciation | | $ | 729,145 | |
| | | | | | |
The accompanying notes are an integral part of the financial statements.
32
DUPREE MUTUAL FUNDS — NORTH CAROLINA TAX-FREE SHORT-TO-MEDIUM SERIES
SCHEDULE OF PORTFOLIO INVESTMENTS
North Carolina Municipal Bonds — 100% of Net Assets
June 30, 2016
Other Information
The following is a summary of the inputs used, as of June 30, 2016, involving the Fund’s investments in securities carried at fair value. The inputs or methodology used for valuing securities may not be an indication of the risk associated with investing in those securities. For more information on valuation inputs, and their aggregation into the levels used in the table below, please refer to the Security Valuation section in the accompanying Notes to Financial Statements.
| | | | | | |
| | | Valuation Inputs | | Municipal Bonds | |
Level 1 | | Quoted Prices | | $ | — | |
Level 2 | | Other Significant Observable Inputs | | | 24,644,401 | |
Level 3 | | Significant Unobservable Inputs | | | — | |
| | | | | | |
| | | | $ | 24,644,401 | |
| | | | | | |
The accompanying notes are an integral part of the financial statements.
33
NORTH CAROLINA TAX-FREE SHORT-TO-MEDIUM SERIES
STATEMENT OF ASSETS AND LIABILITIES
June 30, 2016
| | | | | | | | |
ASSETS: | | | | | | | | |
Investments in securities, at fair value (Cost: $23,915,256) | | | $ | 24,644,401 | |
Cash | | | | 942,456 | |
Interest receivable | | | | 213,654 | |
| | | | | | | | |
Total assets | | | | | | | 25,800,511 | |
LIABILITIES: | | | | | | | | |
Payable for: | | | | | | | | |
Investments purchased | | | 625,421 | | | | | |
Distributions to shareholders | | | 5,984 | | | | | |
Fund shares redeemed | | | 5,072 | | | | | |
Investment advisory fee | | | 10,042 | | | | | |
Transfer agent fee | | | 2,896 | | | | | |
Trustees fees | | | 830 | | | | | |
Accrued expenses | | | 16,249 | | | | | |
| | | | | | | | |
Total liabilities | | | | | | | 666,494 | |
| | | | | | | | |
NET ASSETS: | | | | | | | | |
Capital | | | | | | | 24,406,452 | |
Accumulated net realized loss on investment transactions | | | | | | | (1,580 | ) |
Net unrealized appreciation in value of investments | | | | | | | 729,145 | |
| | | | | | | | |
Net assets at value | | | | | | $ | 25,134,017 | |
| | | | | | | | |
NET ASSET VALUE, offering price and redemption price per share
(2,274,430 shares outstanding; unlimited number of shares authorized; no par value) | | | | | | $ | 11.05 | |
| | | | | | | | |
STATEMENT OF OPERATIONS
For the year ended June 30, 2016
| | | | |
Net investment income: | | | | |
Interest income | | $ | 570,909 | |
| | | | |
Expenses: | | | | |
Investment advisory fee | | | 119,306 | |
Transfer agent fee | | | 34,634 | |
Custodian expense | | | 9,357 | |
Pricing fees | | | 9,999 | |
Professional fees | | | 5,217 | |
Trustees fees | | | 2,430 | |
Other expenses | | | 17,551 | |
| | | | |
Total expenses | | | 198,494 | |
Custodian expense reduction | | | (48 | ) |
| | | | |
Net expenses | | | 198,446 | |
| | | | |
Net investment income | | | 372,463 | |
| | | | |
Realized and unrealized gain/(loss) on investments: | | | | |
Net realized loss | | | (54 | ) |
Net change in unrealized appreciation/depreciation | | | 243,375 | |
| | | | |
Net realized and unrealized gain on investments | | | 243,321 | |
| | | | |
Net increase in net assets resulting from operations | | $ | 615,784 | |
| | | | |
The accompanying notes are an integral part of the financial statements.
34
NORTH CAROLINA TAX-FREE SHORT-TO-MEDIUM SERIES
STATEMENTS OF CHANGES IN NET ASSETS
For the years ended June 30, 2015 and 2016
| | | | | | | | |
| | | 2016 | | | 2015 | |
Operations: | | | | | | | | |
Net investment income | | $ | 372,463 | | | $ | 427,514 | |
Net realized gain/(loss) on investments | | | (54 | ) | | | 1,485 | |
Net change in unrealized appreciation/depreciation | | | 243,375 | | | | (274,238 | ) |
| | | | | | | | |
Net increase in net assets resulting from operations | | | 615,784 | | | | 154,761 | |
Distributions from net investment income (Note 6) | | | (372,463 | ) | | | (427,514 | ) |
Net fund share transactions (Note 4) | | | 427,588 | | | | (1,215,800 | ) |
| | | | | | | | |
Total increase/(decrease) | | | 670,909 | | | | (1,488,553 | ) |
Net assets: | | | | | | | | |
Beginning of year | | | 24,463,108 | | | | 25,951,661 | |
| | | | | | | | |
End of year | | $ | 25,134,017 | | | $ | 24,463,108 | |
| | | | | | | | |
FINANCIAL HIGHLIGHTS
| | | | | | | | | | | | | | | | | | | | |
| Selected data for a share outstanding: | | For the years ended June 30, | |
| | | 2016 | | | 2015 | | | 2014 | | | 2013 | | | 2012 | |
Net asset value, beginning of year | | | $10.94 | | | | $11.06 | | | | $11.00 | | | | $11.23 | | | | $10.93 | |
| | | | | | | | | | | | | | | | | | | | |
Income from investment operations: | | | | | | | | | | | | | | | | | | | | |
Net investment income | | | 0.17 | | | | 0.19 | | | | 0.20 | | | | 0.21 | | | | 0.24 | |
Net gains/(losses) on securities | | | 0.11 | | | | (0.12 | ) | | | 0.08 | | | | (0.21 | ) | | | 0.30 | |
| | | | | | | | | | | | | | | | | | | | |
Total from investment operations | | | 0.28 | | | | 0.07 | | | | 0.28 | | | | 0.00 | | | | 0.54 | |
Less distributions: | | | | | | | | | | | | | | | | | | | | |
Distributions from net investment income | | | (0.17 | ) | | | (0.19 | ) | | | (0.20 | ) | | | (0.21 | ) | | | (0.24 | ) |
Distributions from capital gains | | | 0.00 | | | | 0.00 | | | | (0.02 | ) | | | (0.02 | ) | | | — | |
| | | | | | | | | | | | | | | | | | | | |
Total distributions | | | (0.17 | ) | | | (0.19 | ) | | | (0.22 | ) | | | (0.23 | ) | | | (0.24 | ) |
| | | | | | | | | | | | | | | | | | | | |
Net asset value, end of year | | | $11.05 | | | | $10.94 | | | | $11.06 | | | | $11.00 | | | | $11.23 | |
| | | | | | | | | | | | | | | | | | | | |
Total return | | | 2.59% | | | | 0.60% | | | | 2.53% | | | | (0.06 | )% | | | 4.98% | |
Net assets, end of year (in thousands) | | | $25,134 | | | | $24,463 | | | | $25,952 | | | | $26,333 | | | | $24,734 | |
Ratio of net expenses to average net assets (a) | | | 0.83% | | | | 0.83% | | | | 0.81% | | | | 0.78% | | | | 0.78% | |
Ratio of gross expenses to average net assets | | | 0.83% | | | | 0.83% | | | | 0.81% | | | | 0.78% | | | | 0.78% | |
Ratio of net investment income to average net assets | | | 1.56% | | | | 1.69% | | | | 1.80% | | | | 1.87% | | | | 2.15% | |
Portfolio turnover | | | 24.05% | | | | 9.79% | | | | 7.10% | | | | 10.19% | | | | 12.31% | |
| (a) | | Percentages are after custodian reduction for which no recovery will be sought. |
The accompanying notes are an integral part of the financial statements.
35
DUPREE MUTUAL FUNDS — TENNESSEE TAX-FREE INCOME SERIES
SCHEDULE OF PORTFOLIO INVESTMENTS
Tennessee Municipal Bonds — 100% of Net Assets
June 30, 2016
| | | | | | | | | | | | | | | | | | |
| Bond Description | | Coupon | | | Maturity
Date | | | Rating# | | Par Value | | | Fair Value | |
| MUNICIPAL UTILITY REVENUE BONDS | |
| 39.83% of Net Assets | | | | | | | | | | | | | | | | | | |
Blount County TN Public Building Authority Local Government | | | 5.000 | % | | | 06/01/2032 | | | Aa3 | | $ | 750,000 | | | $ | 780,353 | |
Bristol TN Electric Revenue | | | 5.000 | | | | 09/01/2038 | | | AA-* | | | 1,525,000 | | | | 1,820,133 | |
Chattanooga TN Electric Revenue | | | 5.000 | | | | 09/01/2035 | | | AA+* | | | 250,000 | | | | 311,593 | |
Chattanooga TN Electric Revenue | | | 5.000 | | | | 09/01/2040 | | | AA+* | | | 1,825,000 | | | | 2,257,416 | |
Citizens Gas Utility District TN Gas Revenue Refunding | | | 5.000 | | | | 05/01/2029 | | | A* | | | 250,000 | | | | 274,203 | |
Clarksville TN Electric Systems Revenue | | | 5.000 | | | | 09/01/2028 | | | Aa2 | | | 1,000,000 | | | | 1,155,840 | |
Clarksville TN Electric Systems Revenue | | | 5.000 | | | | 09/01/2032 | | | Aa2 | | | 480,000 | | | | 552,475 | |
Clarksville TN Electric Systems Revenue | | | 5.000 | | | | 09/01/2033 | | | Aa2 | | | 2,000,000 | | | | 2,295,840 | |
Clarksville TN Water Sewer & Gas Revenue | | | 5.000 | | | | 02/01/2038 | | | Aa2 | | | 1,000,000 | | | | 1,173,460 | |
Clarksville TN Water Sewer & Gas Revenue | | | 5.000 | | | | 02/01/2036 | | | Aa2 | | | 500,000 | | | | 624,315 | |
Clarksville TN Water Sewer & Gas Revenue | | | 5.000 | | | | 02/01/2041 | | | Aa2 | | | 2,750,000 | | | | 3,406,810 | |
Clarksville TN Water Sewer & Gas Revenue | | | 5.000 | | | | 02/01/2033 | | | Aa2 | | | 500,000 | | | | 593,820 | |
Columbia TN Waterworks Revenue | | | 5.000 | | | | 12/01/2032 | | | Aa3 | | | 885,000 | | | | 1,030,096 | |
Franklin TN Water & Sewer Revenue and Tax Authority | | | 5.000 | | | | 04/01/2024 | | | Aaa | | | 750,000 | | | | 958,455 | |
Hallsdale-Powell Utility District Knox County Water & Sewer | | | 5.000 | | | | 04/01/2026 | | | A3 | | | 1,000,000 | | | | 1,031,750 | |
Hallsdale-Powell Utility District Knox County Water & Sewer | | | 5.000 | | | | 04/01/2031 | | | A3 | | | 740,000 | | | | 762,585 | |
Harpeth Valley TN Utilities District | | | 5.000 | | | | 09/01/2034 | | | AA* | | | 500,000 | | | | 605,810 | |
Harpeth Valley TN Utilities District | | | 5.000 | | | | 09/01/2040 | | | AA* | | | 1,000,000 | | | | 1,187,320 | |
Knox Chapman TN Utility District | | | 5.250 | | | | 01/01/2036 | | | AA-* | | | 700,000 | | | | 812,560 | |
Knox Chapman TN Utility District | | | 4.500 | | | | 01/01/2027 | | | AA-* | | | 1,000,000 | | | | 1,169,670 | |
Knox Chapman TN Utility District | | | 5.000 | | | | 01/01/2031 | | | AA-* | | | 250,000 | | | | 311,473 | |
Knox Chapman TN Utility District | | | 5.000 | | | | 01/01/2033 | | | AA-* | | | 250,000 | | | | 309,258 | |
Memphis TN Electric System Revenue | | | 5.000 | | | | 12/01/2031 | | | Aa2 | | | 225,000 | | | | 281,212 | |
Memphis TN Electric System Revenue | | | 5.000 | | | | 12/01/2034 | | | Aa2 | | | 1,250,000 | | | | 1,546,875 | |
Metropolitan Government Nashville & Davidson County Electric | | | 5.000 | | | | 05/15/2036 | | | AA+* | | | 3,085,000 | | | | 3,587,547 | |
Metropolitan Government Nashville & Davidson County Electric | | | 5.000 | | | | 05/15/2036 | | | AA+* | | | 500,000 | | | | 610,000 | |
Metropolitan Government Nashville & Davidson County Electric | | | 5.000 | | | | 05/15/2039 | | | AA+* | | | 500,000 | | | | 608,375 | |
Metropolitan Government Nashville & Davidson County Electric | | | 5.000 | | | | 05/15/2033 | | | AA+* | | | 500,000 | | | | 623,715 | |
Metropolitan Government Nashville & Davidson County Water & Sewer | | | 5.000 | | | | 07/01/2031 | | | Aa3 | | | 500,000 | | | | 615,175 | |
Metropolitan Government Nashville & Davidson County Water & Sewer | | | 5.000 | | | | 07/01/2030 | | | Aa3 | | | 3,250,000 | | | | 4,003,480 | |
Metropolitan Government Nashville & Davidson County Water & Sewer | | | 5.000 | | | | 07/01/2033 | | | Aa3 | | | 575,000 | | | | 704,456 | |
Metropolitan Government Nashville & Davidson County Water & Sewer | | | 5.000 | | | | 07/01/2040 | | | Aa3 | | | 2,265,000 | | | | 2,705,339 | |
South Blount County TN UtilityDistrict Waterworks | | | 5.000 | | | | 12/01/2028 | | | A2 | | | 765,000 | | | | 865,949 | |
Watauga River Tn Regional Water Authority Waterworks | | | 5.000 | | | | 07/01/2034 | | | A* | | | 500,000 | | | | 578,020 | |
West Wilson TN Utility District Waterworks | | | 4.750 | | | | 06/01/2028 | | | NR | | | 1,165,000 | | | | 1,205,426 | |
West Wilson Utility District TN Waterworks | | | 5.000 | | | | 06/01/2033 | | | Aa3 | | | 1,170,000 | | | | 1,353,854 | |
White House Utility District TN Water & Sewer | | | 5.000 | | | | 01/01/2028 | | | Aa3 | | | 1,235,000 | | | | 1,260,602 | |
White House Utility District TN Water & Sewer | | | 5.000 | | | | 01/01/2030 | | | Aa3 | | | 2,505,000 | | | | 2,556,152 | |
| | | | | | | | | | | | | | | | | | |
| | | | | | | | | | | | | | | | | 46,531,407 | |
| PREREFUNDED BONDS | |
| 16.11% of Net Assets | | | | | | | | | | | | | | | | | | |
Chattanooga TN Electric Revenue | | | 5.000 | | | | 09/01/2026 | | | AA+* | | | 250,000 | | | | 268,155 | |
Clarksville TN Electric System Revenue Bonds | | | 5.000 | | | | 09/01/2032 | | | Aa2 | | | 1,250,000 | | | | 1,313,388 | |
Gallatin TN Water & Sewer Revenue | | | 5.000 | | | | 01/01/2028 | | | Aa3 | | | 2,540,000 | | | | 2,704,973 | |
Gallatin TN Water & Sewer Revenue | | | 5.000 | | | | 01/01/2032 | | | AA* | | | 235,000 | | | | 291,532 | |
Harpeth Valley TN Utilities District | | | 5.000 | | | | 09/01/2032 | | | Aa3 | | | 1,420,000 | | | | 1,493,371 | |
Jackson TN Energy Authority Gas System Revenue Bonds | | | 5.000 | | | | 10/01/2028 | | | Aa2 | | | 1,000,000 | | | | 1,054,570 | |
Johnson City TN Health & Educational Facilities Escrowed | | | 5.125 | | | | 07/01/2025 | | | AA-* | | | 190,000 | | | | 190,357 | |
Metropolitan Government Nashville & Davidson County TN | | | 4.750 | | | | 05/15/2028 | | | AA+* | | | 460,000 | | | | 495,089 | |
Metropolitan Government Nashville & Davidson County TN | | | 5.000 | | | | 01/01/2025 | | | Aa2 | | | 3,000,000 | | | | 3,194,370 | |
Metropolitan Government Nashville & Davidson County TN | | | 5.000 | | | | 05/15/2017 | | | Aa2 | | | 205,000 | | | | 212,675 | |
Metropolitan Government Nashville & Davidson County TN | | | 5.000 | | | | 05/15/2017 | | | Aa2 | | | 35,000 | | | | 36,326 | |
Metropolitan Government Nashville & Davidson County TN | | | 5.000 | | | | 05/15/2027 | | | Aa2 | | | 1,195,000 | | | | 1,240,279 | |
Metropolitan Government Nashville & Davidson County TN | | | 5.000 | | | | 05/15/2028 | | | Aa2 | | | 205,000 | | | | 212,767 | |
Metropolitan Government Nashville & Davidson County TN | | | 5.000 | | | | 10/01/2034 | | | NR | | | 210,000 | | | | 238,333 | |
Shelby County TN Health Education and Housing Facilities | | | 5.250 | | | | 09/01/2027 | | | A1 | | | 1,000,000 | | | | 1,074,680 | |
The accompanying notes are an integral part of the financial statements.
36
DUPREE MUTUAL FUNDS — TENNESSEE TAX-FREE INCOME SERIES
SCHEDULE OF PORTFOLIO INVESTMENTS
Tennessee Municipal Bonds — 100% of Net Assets
June 30, 2016
| | | | | | | | | | | | | | | | | | |
| Bond Description | | Coupon | | | Maturity
Date | | | Rating# | | Par Value | | | Fair Value | |
South Blount County TN UtilityDistrict Waterworks | | | 5.000 | % | | | 12/01/2028 | | | A2 | | $ | 360,000 | | | $ | 411,030 | |
TN State School Board Authority Higher Education Facilities | | | 5.000 | | | | 05/01/2028 | | | Aa1 | | | 1,000,000 | | | | 1,078,490 | |
TN State School Board Authority Higher Education Facilities | | | 5.000 | | | | 05/01/2034 | | | Aa1 | | | 500,000 | | | | 559,515 | |
TN State School Board Authority Higher Education Facilities | | | 5.125 | | | | 05/01/2033 | | | NR | | | 235,000 | | | | 253,800 | |
TN State School Board Authority Higher Education Facilities | | | 5.125 | | | | 05/01/2033 | | | Aa1 | | | 1,065,000 | | | | 1,151,840 | |
West Wilson TN Utility District Waterworks | | | 4.750 | | | | 06/01/2028 | | | NR | | | 1,295,000 | | | | 1,343,459 | |
| | | | | | | | | | | | | | | | | | |
| | | | | | | | | | | | | | | | | 18,818,999 | |
| PUBLIC FACILITIES REVENUE BONDS | |
| 12.20% of Net Assets | | | | | | | | | | | | | | | | | | |
Blount County TN Public Building Authority Local Government | | | 5.000 | | | | 06/01/2025 | | | Aa2 | | | 100,000 | | | | 111,572 | |
Blount County TN Public Building Authority Local Government | | | 5.000 | | | | 06/01/2027 | | | Aa2 | | | 1,500,000 | | | | 1,668,990 | |
Blount County TN Public Building Authority Local Government | | | 4.750 | | | | 06/01/2031 | | | Aa2 | | | 750,000 | | | | 825,240 | |
Memphis Shelby County Sports Authority | | | 5.250 | | | | 11/01/2026 | | | Aa3 | | | 500,000 | | | | 569,545 | |
Memphis Shelby County Sports Authority | | | 5.250 | | | | 11/01/2027 | | | Aa3 | | | 750,000 | | | | 853,785 | |
Memphis TN Refunding General Improvement | | | 5.000 | | | | 04/01/2031 | | | Aa2 | | | 800,000 | | | | 986,400 | |
Metropolitan Government Nashville & Davidson County Convention Center | | | 5.000 | | | | 07/01/2026 | | | A1 | | | 630,000 | | | | 714,300 | |
Metropolitan Government Nashville & Davidson County Sports Authority | | | 5.000 | | | | 08/01/2031 | | | Aa3 | | | 1,500,000 | | | | 1,820,190 | |
Metropolitan Government Nashville & Davidson County Sports Authority | | | 5.000 | | | | 08/01/2038 | | | Aa3 | | | 755,000 | | | | 896,804 | |
Pigeon Forge Industrial Development Board | | | 5.000 | | | | 06/01/2024 | | | AA* | | | 600,000 | | | | 707,022 | |
Pigeon Forge Industrial Development Board | | | 5.000 | | | | 06/01/2027 | | | AA* | | | 1,400,000 | | | | 1,643,138 | |
Pigeon Forge Industrial Development Board | | | 5.000 | | | | 06/01/2029 | | | AA* | | | 2,120,000 | | | | 2,468,401 | |
Pigeon Forge Industrial Development Board | | | 5.000 | | | | 06/01/2034 | | | AA* | | | 850,000 | | | | 983,569 | |
| | | | | | | | | | | | | | | | | | |
| | | | | | | | | | | | | | | | | 14,248,956 | |
| UNIVERSITY CONSOLIDATED EDUCATION AND BUILDING REVENUE BONDS | |
| 7.98% of Net Assets | | | | | | | | | | | | | | | | | | |
Franklin County TN Health & Education Facilities Board Revenue | | | 5.000 | | | | 09/01/2030 | | | A+* | | | 200,000 | | | | 237,980 | |
Metropolitan Government Nashville & Davidson County Vanderbilt University | | | 5.000 | | | | 10/01/2028 | | | Aa2 | | | 1,150,000 | | | | 1,406,255 | |
Metropolitan Government Nashville & Davidson County Vanderbilt University | | | 5.000 | | | | 10/01/2034 | | | Aa2 | | | 790,000 | | | | 891,412 | |
Shelby County TN Health Education & Housing Facilities Board Rhodes College | | | 5.000 | | | | 08/01/2030 | | | A1 | | | 500,000 | | | | 581,650 | |
Shelby County TN Health Education & Housing Facilities Board Rhodes College | | | 5.000 | | | | 08/01/2040 | | | A1 | | | 650,000 | | | | 791,960 | |
TN State School Bond Authority | | | 5.000 | | | | 11/01/2043 | | | Aa1 | | | 1,000,000 | | | | 1,203,400 | |
TN State School Bond Authority Higher Educational Facilities | | | 5.000 | | | | 11/01/2037 | | | Aa1 | | | 1,400,000 | | | | 1,733,102 | |
TN State School Bond Authority Higher Educational Facilities | | | 5.000 | | | | 11/01/2040 | | | Aa1 | | | 2,000,000 | | | | 2,481,680 | |
| | | | | | | | | | | | | | | | | | |
| | | | | | | | | | | | | | | | | 9,327,439 | |
| HOSPITAL AND HEALTHCARE | |
| 7.45% of Net Assets | | | | | | | | | | | | | | | | | | |
Chattanooga TN Health Educational and Housing Facilities Board | | | 5.000 | | | | 01/01/2033 | | | A3 | | | 500,000 | | | | 576,540 | |
Jackson TN Hospital Revenue Jackson Madison County Hospital | | | 5.000 | | | | 04/01/2036 | | | A1 | | | 500,000 | | | | 589,950 | |
Metropolitan Government Nashville & Davidson County TN Health | | | 5.000 | | | | 07/01/2035 | | | A3 | | | 1,705,000 | | | | 2,076,809 | |
Metropolitan Government Nashville & Davidson County TN Health | | | 5.000 | | | | 07/01/2040 | | | A3 | | | 950,000 | | | | 1,150,612 | |
Rutherford County TN Health &Educational Facilities Ascension Health | | | 5.000 | | | | 11/15/2040 | | | Aa2 | | | 1,500,000 | | | | 1,695,945 | |
Shelby County TN Health Education and Housing Facilities | | | 5.000 | | | | 05/01/2027 | | | A1 | | | 750,000 | | | | 866,183 | |
Shelby County TN Health Education and Housing Facilities | | | 5.000 | | | | 07/01/2031 | | | Aa1 | | | 1,750,000 | | | | 1,750,333 | |
| | | | | | | | | | | | | | | | | | |
| | | | | | | | | | | | | | | | | 8,706,371 | |
| REFUNDING BONDS | |
| 7.28% of Net Assets | | | | | | | | | | | | | | | | | | |
Chattanooga TN Industrial Development Board Lease Rent Revenue | | | 5.000 | | | | 10/01/2027 | | | A2 | | | 1,000,000 | | | | 1,051,210 | |
Greene County TN General Obligation — Series B | | | 5.000 | | | | 06/01/2024 | | | A1 | | | 505,000 | | | | 505,394 | |
Manchester TN Refunding General Obligation | | | 5.000 | | | | 06/01/2038 | | | A2 | | | 100,000 | | | | 113,887 | |
Memphis TN General Improvement | | | 5.000 | | | | 04/01/2034 | | | Aa2 | | | 500,000 | | | | 610,025 | |
Memphis TN General Improvement | | | 5.000 | | | | 04/01/2039 | | | Aa2 | | | 250,000 | | | | 302,410 | |
Memphis TN Refunding | | | 5.000 | | | | 04/01/2030 | | | Aa2 | | | 1,000,000 | | | | 1,237,910 | |
Memphis TN Refunding | | | 5.000 | | | | 04/01/2035 | | | Aa2 | | | 250,000 | | | | 304,408 | |
Memphis TN Refunding | | | 5.000 | | | | 04/01/2033 | | | Aa2 | | | 250,000 | | | | 306,223 | |
Memphis TN Refunding | | | 5.000 | | | | 04/01/2040 | | | Aa2 | | | 500,000 | | | | 604,420 | |
Metropolitan Government Nashville & Davidson County TN | | | 5.000 | | | | 01/01/2033 | | | Aa2 | | | 750,000 | | | | 956,183 | |
Pigeon Forge TN Refunding Series A | | | 4.900 | | | | 06/01/2028 | | | Aa3 | | | 1,000,000 | | | | 1,072,560 | |
The accompanying notes are an integral part of the financial statements.
37
DUPREE MUTUAL FUNDS — TENNESSEE TAX-FREE INCOME SERIES
SCHEDULE OF PORTFOLIO INVESTMENTS
Tennessee Municipal Bonds — 100% of Net Assets
June 30, 2016
| | | | | | | | | | | | | | | | | | |
| Bond Description | | Coupon | | | Maturity
Date | | | Rating# | | Par Value | | | Fair Value | |
Shelby County TN Refunding Series A | | | 5.000 | % | | | 03/01/2026 | | | Aa1 | | $ | 1,200,000 | | | $ | 1,444,080 | |
| | | | | | | | | | | | | | | | | | |
| | | | | | | | | | | | | | | | | 8,508,708 | |
| STATE AND LOCAL MORTGAGE/HOUSING BONDS | |
| 2.18% of Net Assets | | | | | | | | | | | | | | | | | | |
Oak Ridge TN Industrial Development Board Refunding Revenue | | | 5.250 | | | | 08/20/2018 | | | NR | | | 135,000 | | | | 135,008 | |
TN Housing Development Agency | | | 5.000 | | | | 07/01/2029 | | | Aa1 | | | 385,000 | | | | 397,898 | |
TN Housing Development Agency Homeownership Program 1 | | | 5.000 | | | | 07/01/2029 | | | Aa1 | | | 490,000 | | | | 512,413 | |
TN Housing Development Agency Homeownership Program 2 | | | 4.700 | | | | 07/01/2027 | | | Aa1 | | | 920,000 | | | | 969,956 | |
TN Housing Development Agency Housing Finance Program | | | 4.850 | | | | 01/01/2025 | �� | | Aa2 | | | 495,000 | | | | 535,902 | |
| | | | | | | | | | | | | | | | | | |
| | | | | | | | | | | | | | | | | 2,551,176 | |
| MISCELLANEOUS PUBLIC IMPROVEMENT BONDS | |
| 2.04% of Net Assets | | | | | | | | | | | | | | | | | | |
Memphis Shelby County TN Port Authority Community Development | | | 5.000 | | | | 04/01/2035 | | | Aa3 | | | 625,000 | | | | 720,938 | |
Memphis TN Refunding and General Impact General Obligation | | | 5.000 | | | | 05/01/2036 | | | Aa2 | | | 850,000 | | | | 987,828 | |
Springfield TN Public Improvement | | | 4.500 | | | | 03/01/2024 | | | A1 | | | 565,000 | | | | 669,033 | |
| | | | | | | | | | | | | | | | | | |
| | | | | | | | | | | | | | | | | 2,377,798 | |
| AIRPORT BONDS | |
| 1.83% of Net Assets | | | | | | | | | | | | | | | | | | |
Metropolitan Nashville Airport Authority | | | 5.000 | | | | 07/01/2034 | | | A1 | | | 800,000 | | | | 982,776 | |
Metropolitan Nashville Airport Authority | | | 5.000 | | | | 07/01/2035 | | | A1 | | | 250,000 | | | | 305,745 | |
Metropolitan Nashville Airport Authority | | | 5.000 | | | | 07/01/2040 | | | A1 | | | 700,000 | | | | 854,812 | |
| | | | | | | | | | | | | | | | | | |
| | | | | | | | | | | | | | | | | 2,143,333 | |
| SCHOOL IMPROVEMENT BONDS | |
| 1.40% of Net Assets | | | | | | | | | | | | | | | | | | |
Rhea County TN | | | 5.000 | | | | 04/01/2029 | | | A1 | | | 1,385,000 | | | | 1,630,284 | |
| | | | | | | | | | | | | | | | | | |
| INDUSTRIAL REVENUE BONDS | |
| .84% of Net Assets | | | | | | | | | | | | | | | | | | |
Industrial Development Board TN Blount County | | | 5.000 | | | | 06/01/2027 | | | Aa3 | | | 850,000 | | | | 982,702 | |
| | | | | | | | | | | | | | | | | | |
| ESCROWED TO MATURITY BONDS | |
| .07% of Net Assets | | | | | | | | | | | | | | | | | | |
Johnson City TN Health & Educational Facilities Medical Center | | | 5.000 | | | | 07/01/2018 | | | AA-* | | | 80,000 | | | | 80,235 | |
| | | | | | | | | | | | | | | | | | |
Total Investments 99.21% of Net Assets (cost $107,415,835) (See (a) below for further explanation) | | | $ | 115,907,408 | |
| | | | | | | | | | | | | | | | | | |
Other assets in excess of liabilities .79% | | | | | | | | | | | | | | | | | 923,266 | |
| | | | | | | | | | | | | | | | | | |
Net Assets 100% | | | | | | | | | | | | | | | | $ | 116,830,674 | |
| | | | | | | | | | | | | | | | | | |
| | # | | Ratings by Moody’s Investors Services, Inc. unless noted otherwise. |
| | | | Bond ratings are unaudited and not covered by Report of Independent Registered Public Accounting Firm. |
| | | | All ratings are as of the date indicated and do not reflect subsequent changes. |
| | * | | Rated by Standard & Poor’s Corporation |
| | @ | | Fitch’s Investors Service |
| (a) | | Cost for federal income tax purposes is $107,415,835 and net unrealized appreciation of investments is as follows: |
| | | | | | |
| | Unrealized appreciation | | $ | 8,491,573 | |
| | Unrealized depreciation | | | — | |
| | | | | | |
| | Net unrealized appreciation | | $ | 8,491,573 | |
| | | | | | |
The accompanying notes are an integral part of the financial statements.
38
DUPREE MUTUAL FUNDS — TENNESSEE TAX-FREE INCOME SERIES
SCHEDULE OF PORTFOLIO INVESTMENTS
Tennessee Municipal Bonds — 100% of Net Assets
June 30, 2016
Other Information
The following is a summary of the inputs used, as of June 30, 2016, involving the Fund’s investments in securities carried at fair value. The inputs or methodology used for valuing securities may not be an indication of the risk associated with investing in those securities. For more information on valuation inputs, and their aggregation into the levels used in the table below, please refer to the Security Valuation section in the accompanying Notes to Financial Statements.
| | | | | | |
| | | Valuation Inputs | | Municipal Bonds | |
Level 1 | | Quoted Prices | | $ | — | |
Level 2 | | Other Significant Observable Inputs | | | 115,907,408 | |
Level 3 | | Significant Unobservable Inputs | | | — | |
| | | | | | |
| | | | $ | 115,907,408 | |
| | | | | | |
The accompanying notes are an integral part of the financial statements.
39
TENNESSEE TAX-FREE INCOME SERIES
STATEMENT OF ASSETS AND LIABILITIES
June 30, 2016
| | | | | | | | |
ASSETS: | | | | | | | | |
Investments in securities, at fair value (Cost: $107,415,835) | | | $ | 115,907,408 | |
Cash | | | | | | | 24,523 | |
Interest receivable | | | | | | | 1,388,571 | |
| | | | | | | | |
Total assets | | | | | | | 117,320,502 | |
LIABILITIES: | | | | | | | | |
Payable for: | | | | | | | | |
Distributions to shareholders | | | 251,986 | | | | | |
Fund shares redeemed | | | 124,866 | | | | | |
Investment advisory fee | | | 48,296 | | | | | |
Transfer agent fee | | | 12,117 | | | | | |
Trustees fees | | | 1,985 | | | | | |
Accrued expenses | | | 50,578 | | | | | |
| | | | | | | | |
Total liabilities | | | | | | | 489,828 | |
| | | | | | | | |
NET ASSETS: | | | | | | | | |
Capital | | | | | | | 108,924,902 | |
Accumulated net realized loss on investment transactions | | | | (585,801 | ) |
Net unrealized appreciation in value of investments | | | | 8,491,573 | |
| | | | | | | | |
Net assets at value | | | | | | $ | 116,830,674 | |
| | | | | | | | |
NET ASSET VALUE, offering price and redemption price per share
(9,823,487 shares outstanding; unlimited number of shares authorized; no par value) | | | | | | $ | 11.89 | |
| | | | | | | | |
STATEMENT OF OPERATIONS
For the year ended June 30, 2016
| | | | |
Net investment income: | | | | |
Interest income | | $ | 4,115,193 | |
| | | | |
Expenses: | | | | |
Investment advisory fee | | | 555,461 | |
Transfer agent fee | | | 140,790 | |
Custodian expense | | | 20,881 | |
Professional fees | | | 24,433 | |
Trustees fees | | | 11,351 | |
Other expenses | | | 39,394 | |
| | | | |
Total expenses | | | 792,310 | |
Custodian expense reduction | | | (107 | ) |
| | | | |
Net expenses | | | 792,203 | |
| | | | |
Net investment income | �� | | 3,322,990 | |
| | | | |
Realized and unrealized gain on investments: | | | | |
Net realized gain | | | 54,354 | |
Net change in unrealized appreciation/depreciation | | | 3,628,186 | |
| | | | |
Net realized and unrealized gain on investments | | | 3,682,540 | |
| | | | |
Net increase in net assets resulting from operations | | $ | 7,005,530 | |
| | | | |
The accompanying notes are an integral part of the financial statements.
40
TENNESSEE TAX-FREE INCOME SERIES
STATEMENTS OF CHANGES IN NET ASSETS
For the years ended June 30, 2016 and 2015
| | | | | | | | |
| | | 2016 | | | 2015 | |
Operations: | | | | | | | | |
Net investment income | | $ | 3,322,990 | | | $ | 3,376,320 | |
Net realized gain on investments | | | 54,354 | | | | 29,899 | |
Net change in unrealized appreciation/depreciation | | | 3,628,186 | | | | (391,648 | ) |
| | | | | | | | |
Net increase in net assets resulting from operations | | | 7,005,530 | | | | 3,014,571 | |
Distributions from net investment income (Note 6) | | | (3,322,990 | ) | | | (3,376,320 | ) |
Net fund share transactions (Note 4) | | | 3,475,886 | | | | 5,139,706 | |
| | | | | | | | |
Total increase | | | 7,158,426 | | | | 4,777,957 | |
Net assets: | | | | | | | | |
Beginning of year | | | 109,672,248 | | | | 104,894,291 | |
| | | | | | | | |
End of year | | $ | 116,830,674 | | | $ | 109,672,248 | |
| | | | | | | | |
FINANCIAL HIGHLIGHTS
| | | | | | | | | | | | | | | | | | | | |
| Selected data for a share outstanding: | | For the years ended June 30, | |
| | | 2016 | | | 2015 | | | 2014 | | | 2013 | | | 2012 | |
Net asset value, beginning of year | | | $11.51 | | | | $11.55 | | | | $11.27 | | | | $11.56 | | | | $11.04 | |
| | | | | | | | | | | | | | | | | | | | |
Income from investment operations: | | | | | | | | | | | | | | | | | | | | |
Net investment income | | | 0.34 | | | | 0.36 | | | | 0.37 | | | | 0.36 | | | | 0.40 | |
Net gains/(losses) on securities | | | 0.38 | | | | (0.04 | ) | | | 0.28 | | | | (0.29 | ) | | | 0.52 | |
| | | | | | | | | | | | | | | | | | | | |
Total from investment operations | | | 0.72 | | | | 0.32 | | | | 0.65 | | | | 0.07 | | | | 0.92 | |
Less distributions: | | | | | | | | | | | | | | | | | | | | |
Distributions from net investment income | | | (0.34 | ) | | | (0.36 | ) | | | (0.37 | ) | | | (0.36 | ) | | | (0.40 | ) |
| | | | | | | | | | | | | | | | | | | | |
Net asset value, end of year | | | $11.89 | | | | $11.51 | | | | $11.55 | | | | $11.27 | | | | $11.56 | |
| | | | | | | | | | | | | | | | | | | | |
Total return | | | 6.40% | | | | 2.77% | | | | 5.86% | | | | 0.56% | | | | 8.44% | |
Net assets, end of year (in thousands) | | | $116,831 | | | | $109,672 | | | | $104,894 | | | | $105,696 | | | | $100,583 | |
Ratio of net expenses to average net assets (a) | | | 0.71% | | | | 0.70% | | | | 0.71% | | | | 0.65% | | | | 0.70% | |
Ratio of gross expenses to average net assets | | | 0.71% | | | | 0.70% | | | | 0.71% | | | | 0.69% | | | | 0.70% | |
Ratio of net investment income to average net assets | | | 2.96% | | | | 3.08% | | | | 3.25% | | | | 3.10% | | | | 3.50% | |
Portfolio turnover | | | 9.67% | | | | 7.01% | | | | 14.44% | | | | 7.37% | | | | 8.39% | |
| (a) | | Percentages are after expense waivers and reductions by the Adviser and Custodian. The Adviser and Custodian have agreed not to seek recovery of these waivers and reductions. |
The accompanying notes are an integral part of the financial statements.
41
DUPREE MUTUAL FUNDS — TENNESSEE TAX-FREE SHORT-TO-MEDIUM SERIES
SCHEDULE OF PORTFOLIO INVESTMENTS
Tennessee Municipal Bonds — 100% of Net Assets
June 30, 2016
| | | | | | | | | | | | | | | | | | |
| Bond Description | | Coupon | | | Maturity
Date | | | Rating# | | Par Value | | | Fair Value | |
| PREREFUNDED BONDS | |
| 21.78% of Net Assets | | | | | | | | | | | | | | | | | | |
Chattanooga TN Electric Revenue | | | 5.000 | % | | | 09/01/2021 | | | AA+* | | $ | 400,000 | | | $ | 428,771 | |
Memphis TN | | | 5.000 | | | | 04/01/2024 | | | Aa2 | | | 200,000 | | | | 206,474 | |
Memphis TN General Improvement | | | 5.000 | | | | 04/01/2022 | | | Aa2 | | | 185,000 | | | | 206,327 | |
Memphis TN General Obligation | | | 5.000 | | | | 05/01/2020 | | | Aa2 | | | 250,000 | | | | 279,908 | |
Metropolitan Government Nashville & Davidson County TN | | | 5.000 | | | | 01/01/2019 | | | Aa2 | | | 200,000 | | | | 212,990 | |
Metropolitan Government Nashville & Davidson County TN | | | 5.000 | | | | 05/15/2017 | | | NR | | | 35,000 | | | | 36,314 | |
Metropolitan Government Nashville & Davidson County TN | | | 5.000 | | | | 05/15/2019 | | | Aa2 | | | 215,000 | | | | 223,069 | |
Metropolitan Government Nashville & Davidson County TN | | | 4.000 | | | | 07/01/2024 | | | NR | | | 20,000 | | | | 23,297 | |
Metropolitan Government Nashville & Davidson County TN | | | 4.000 | | | | 07/01/2023 | | | NR | | | 140,000 | | | | 157,319 | |
Robertson County TN School | | | 4.000 | | | | 06/01/2020 | | | Aa3 | | | 250,000 | | | | 265,700 | |
Shelby County TN Health Educational & Housing Facilities | | | 5.250 | | | | 09/01/2020 | | | A1 | | | 400,000 | | | | 430,360 | |
| | | | | | | | | | | | | | | | | | |
| | | | | | | | | | | | | | | | | 2,470,528 | |
| PUBLIC FACILITIES REVENUE BONDS | |
| 16.69% of Net Assets | | | | | | | | | | | | | | | | | | |
Memphis TN Center City Revenue Finance Corporation | | | 5.250 | | | | 11/01/2025 | | | Aa3 | | | 100,000 | | | | 119,670 | |
Memphis TN Center City Revenue Finance Corporation Sports Facility | | | 4.000 | | | | 02/01/2021 | | | Aa3 | | | 100,000 | | | | 111,651 | |
Memphis TN Center City Revenue Finance Corporation Sports Facility | | | 4.000 | | | | 02/01/2022 | | | Aa3 | | | 220,000 | | | | 248,105 | |
Memphis-Shelby County TN Sports Authority Memphis Arena | | | 5.000 | | | | 11/01/2017 | | | Aa3 | | | 275,000 | | | | 290,051 | |
Metropolitan Government Nashville & Davidson County TN Convention | | | 3.750 | | | | 07/01/2018 | | | A1 | | | 100,000 | | | | 105,235 | |
Metropolitan Government Nashville & Davidson County TN Sports Authority | | | 5.250 | | | | 08/01/2025 | | | Aa3 | | | 195,000 | | | | 242,204 | |
Metropolitan Government Nashville & Davidson County TN Sports Authority | | | 5.000 | | | | 07/01/2023 | | | Aa3 | | | 125,000 | | | | 154,074 | |
Metropolitan Government Nashville & Davidson County TN Sports Authority | | | 5.250 | | | | 08/01/2024 | | | Aa3 | | | 190,000 | | | | 238,452 | |
Pigeon Forge Industrial Development Board | | | 5.000 | | | | 06/01/2024 | | | AA* | | | 175,000 | | | | 206,215 | |
Pigeon Forge Public Facilities | | | 5.000 | | | | 06/01/2023 | | | AA* | | | 150,000 | | | | 176,991 | |
| | | | | | | | | | | | | | | | | | |
| | | | | | | | | | | | | | | | | 1,892,647 | |
| MUNICIPAL UTILITY REVENUE BONDS | |
| 14.27% of Net Assets | | | | | | | | | | | | | | | | | | |
Castalian Springs — Bethpage TN Waterworks | | | 3.000 | | | | 01/01/2019 | | | A+* | | | 260,000 | | | | 267,795 | |
Chattanooga TN Electric Revenue | | | 5.000 | | | | 09/01/2023 | | | AA+* | | | 250,000 | | | | 314,095 | |
Columbia TN Electric System Revenue | | | 5.000 | | | | 09/01/2021 | | | Aa3 | | | 165,000 | | | | 179,761 | |
Cross Anchor TN Utility District | | | 4.250 | | | | 12/01/2016 | | | AA* | | | 65,000 | | | | 65,862 | |
Harpeth Valley TN Utilities District Davidson & Williamson Counties | | | 4.000 | | | | 09/01/2024 | | | AA* | | | 225,000 | | | | 269,624 | |
Johnson City TN Electric Revenue | | | 4.000 | | | | 05/01/2022 | | | Aa2 | | | 100,000 | | | | 102,729 | |
Johnson City TN Electric Revenue | | | 4.500 | | | | 05/01/2021 | | | Aa2 | | | 50,000 | | | | 53,251 | |
Metropolitan Government Nashville & Davidson County TN Water & Sewer | | | 5.000 | | | | 07/01/2026 | | | Aa3 | | | 100,000 | | | | 123,859 | |
Metropolitan Government Nashville & Davidson County TN Water & Sewer | | | 5.250 | | | | 01/01/2019 | | | Aa2 | | | 125,000 | | | | 138,789 | |
New Market Utility District Jefferson County TN Waterworks | | | 4.000 | | | | 06/01/2017 | | | A3 | | | 100,000 | | | | 102,888 | |
| | | | | | | | | | | | | | | | | | |
| | | | | | | | | | | | | | | | | 1,618,653 | |
| REFUNDING BONDS | |
| 12.69% of Net Assets | | | | | | | | | | | | | | | | | | |
Memphis TN General Improvement | | | 5.000 | | | | 11/01/2023 | | | Aa2 | | | 350,000 | | | | 439,772 | |
Metropolitan Government Nashville & Davidson County TN | | | 5.000 | | | | 07/01/2021 | | | Aa2 | | | 175,000 | | | | 202,921 | |
Metropolitan Government Nashville & Davidson County TN | | | 4.000 | | | | 07/01/2024 | | | Aa2 | | | 80,000 | | | | 92,185 | |
Metropolitan Government Nashville & Davidson County TN | | | 4.000 | | | | 07/01/2023 | | | Aa2 | | | 110,000 | | | | 122,002 | |
Polk County TN Refinancing | | | 5.000 | | | | 05/01/2020 | | | A2 | | | 150,000 | | | | 155,264 | |
Rhea County TN | | | 3.000 | | | | 04/01/2018 | | | A1 | | | 200,000 | | | | 207,250 | |
Unicoi County TN Refunding | | | 5.250 | | | | 04/01/2019 | | | A1 | | | 200,000 | | | | 219,180 | |
| | | | | | | | | | | | | | | | | | |
| | | | | | | | | | | | | | | | | 1,438,573 | |
| SCHOOL IMPROVEMENT BONDS | |
| 9.13% of Net Assets | | | | | | | | | | | | | | | | | | |
Gibson County Special School District | | | 5.000 | | | | 04/01/2021 | | | AA* | | | 250,000 | | | | 294,770 | |
Lincoln County TN | | | 5.250 | | | | 04/01/2019 | | | Aa3 | | | 200,000 | | | | 223,078 | |
Rhea County TN | | | 4.000 | | | | 04/01/2025 | | | A1 | | | 250,000 | | | | 280,505 | |
Robertson County TN School and Public Improvement | | | 4.000 | | | | 06/01/2019 | | | AA* | | | 100,000 | | | | 109,398 | |
Sumner County TN | | | 5.000 | | | | 12/01/2025 | | | AA+* | | | 100,000 | | | | 127,949 | |
| | | | | | | | | | | | | | | | | | |
| | | | | | | | | | | | | | | | | 1,035,700 | |
The accompanying notes are an integral part of the financial statements.
42
DUPREE MUTUAL FUNDS — TENNESSEE TAX-FREE SHORT-TO-MEDIUM SERIES
SCHEDULE OF PORTFOLIO INVESTMENTS
Tennessee Municipal Bonds — 100% of Net Assets
June 30, 2016
| | | | | | | | | | | | | | | | | | |
| Bond Description | | Coupon | | | Maturity
Date | | | Rating# | | Par Value | | | Fair Value | |
| MISCELLANEOUS PUBLIC IMPROVEMENT BONDS | |
| 7.80% of Net Assets | | | | | | | | | | | | | | | | | | |
Blount County TN Public Building Authority | | | 4.000 | % | | | 06/01/2020 | | | Aa2 | | $ | 150,000 | | | $ | 163,050 | |
Blount County TN Public Building Authority | | | 5.000 | | | | 06/01/2021 | | | Aa2 | | | 175,000 | | | | 195,519 | |
Claiborne County TN Public Improvement | | | 5.000 | | | | 04/01/2017 | | | NR | | | 145,000 | | | | 149,560 | |
Gallatin County Capital Outlay Notes | | | 4.625 | | | | 01/01/2019 | | | AA+* | | | 100,000 | | | | 109,355 | |
Memphis TN Refunding General Improvement | | | 5.000 | | | | 10/01/2017 | | | Aa2 | | | 100,000 | | | | 105,418 | |
Sevier County TN Public Building Authority | | | 5.000 | | | | 06/01/2018 | | | AA-* | | | 150,000 | | | | 161,916 | |
| | | | | | | | | | | | | | | | | | |
| | | | | | | | | | | | | | | | | 884,818 | |
| UNIVERSITY CONSOLIDATED EDUCATION AND BUILDING REVENUE BONDS | |
| 6.02% of Net Assets | | | | | | | | | | | | | | | | | | |
Franklin County TN Health & Educational Facilities Board | | | 4.000 | | | | 09/01/2019 | | | A+* | | | 350,000 | | | | 383,362 | |
Franklin County TN Health & Educational Facilities Board | | | 4.000 | | | | 09/01/2024 | | | A+* | | | 135,000 | | | | 153,959 | |
Shelby County TN Health Educational & Housing Facilities Rhodes College | | | 5.000 | | | | 08/01/2022 | | | A1 | | | 120,000 | | | | 145,820 | |
| | | | | | | | | | | | | | | | | | |
| | | | | | | | | | | | | | | | | 683,142 | |
| STATE AND LOCAL MORTGAGE/HOUSING BONDS | |
| 2.98% of Net Assets | | | | | | | | | | | | | | | | | | |
TN Housing Development Agency | | | 4.800 | % | | | 07/01/2024 | | | Aa1 | | | 120,000 | | | | 123,311 | |
TN Housing Development Agency Homeownership Program | | | 1.900 | | | | 07/01/2019 | | | Aa1 | | | 210,000 | | | | 214,322 | |
| | | | | | | | | | | | | | | | | | |
| | | | | | | | | | | | | | | | | 337,633 | |
| HOSPITAL AND HEALTHCARE | |
| 2.55% of Net Assets | | | | | | | | | | | | | | | | | | |
Shelby County TN Health Educational & Housing Facilities | | | 4.250 | | | | 09/01/2020 | | | A-* | | | 265,000 | | | | 289,279 | |
| | | | | | | | | | | | | | | | | | |
| AIRPORT BONDS | |
| 1.04% of Net Assets | | | | | | | | | | | | | | | | | | |
Metropolitan Nashville Airport Authority | | | 4.000 | | | | 07/01/2023 | | | A1 | | | 100,000 | | | | 117,504 | |
| | | | | | | | | | | | | | | | | | |
| ESCROWED TO MATURITY BONDS | |
| .23% of Net Assets | | | | | | | | | | | | | | | | | | |
Claiborne County TN Public Improvement | | | 5.000 | | | | 04/01/2017 | | | NR | | | 25,000 | | | | 25,809 | |
| | | | | | | | | | | | | | | | | | |
Total Investments 95.18% of Net Assets (cost $10,399,945) (See (a) below for further explanation) | | | $ | 10,794,287 | |
| | | | | | | | | | | | | | | | | | |
Other assets in excess of liabilities 4.82% | | | | | | | | | | | | | | | | | 546,164 | |
| | | | | | | | | | | | | | | | | | |
Net Assets 100% | | | | | | | | | | | | | | | | $ | 11,340,451 | |
| | | | | | | | | | | | | | | | | | |
| | # | | Ratings by Moody’s Investors Services, Inc. unless noted otherwise. |
| | | | Bond ratings are unaudited and not covered by Report of Independent Registered Public Accounting Firm. |
| | | | All ratings are as of the date indicated and do not reflect subsequent changes. |
| | * | | Rated by Standard & Poor’s Corporation |
| | @ | | Fitch’s Investors Service |
| (a) | | Cost for federal income tax purposes is $10,399,945 and net unrealized appreciation of investments is as follows: |
| | | | | | |
| | Unrealized appreciation | | $ | 394,456 | |
| | Unrealized depreciation | | | (114 | ) |
| | | | | | |
| | Net unrealized appreciation | | $ | 394,342 | |
| | | | | | |
Other Information
The following is a summary of the inputs used, as of June 30, 2016, involving the Fund’s investments in securities carried at fair value. The inputs or methodology used for valuing securities may not be an indication of the risk associated with investing in those securities. For more information on valuation inputs, and their aggregation into the levels used in the table below, please refer to the Security Valuation section in the accompanying Notes to Financial Statements.
| | | | | | |
| | | Valuation Inputs | | Municipal Bonds | |
Level 1 | | Quoted Prices | | $ | — | |
Level 2 | | Other Significant Observable Inputs | | | 10,794,287 | |
Level 3 | | Significant Unobservable Inputs | | | — | |
| | | | | | |
| | | | $ | 10,794,287 | |
| | | | | | |
The accompanying notes are an integral part of the financial statements.
43
TENNESSEE TAX-FREE SHORT-TO-MEDIUM SERIES
STATEMENT OF ASSETS AND LIABILITIES
June 30, 2016
| | | | | | | | |
ASSETS: | | | | | | | | |
Investments in securities, at fair value (Cost: $10,399,945) | | | $ | 10,794,287 | |
Cash | | | | | | | 435,572 | |
Interest receivable | | | | | | | 127,919 | |
| | | | | | | | |
Total assets | | | | | | | 11,357,778 | |
LIABILITIES: | | | | | | | | |
Payable for: | | | | | | | | |
Distributions to shareholders | | | 2,578 | | | | | |
Fund shares redeemed | | | 2,145 | | | | | |
Investment advisory fee | | | 4,967 | | | | | |
Transfer agent fee | | | 1,498 | | | | | |
Trustees fees | | | 417 | | | | | |
Accrued expenses | | | 5,722 | | | | | |
| | | | | | | | |
Total liabilities | | | | | | | 17,327 | |
| | | | | | | | |
NET ASSETS: | | | | | | | | |
Capital | | | | | | | 11,173,813 | |
Accumulated net realized loss on investment transactions | | | | (227,704 | ) |
Net unrealized appreciation in value of investments | | | | 394,342 | |
| | | | | | | | |
Net assets at value | | | | | | $ | 11,340,451 | |
| | | | | | | | |
NET ASSET VALUE, offering price and redemption price per share
(1,037,771 shares outstanding; unlimited number of shares authorized; no par value) | | | | | | $ | 10.93 | |
| | | | | | | | |
STATEMENT OF OPERATIONS
For the year ended June 30, 2016
| | | | |
Net investment income: | | | | |
Interest income | | $ | 264,169 | |
| | | | |
Expenses: | | | | |
Investment advisory fee | | | 56,587 | |
Transfer agent fee | | | 16,976 | |
Custodian expense | | | 7,555 | |
Professional fees | | | 2,472 | |
Trustees fees | | | 1,152 | |
Pricing | | | 3,001 | |
Other expenses | | | 9,694 | |
| | | | |
Total expenses | | | 97,437 | |
Custodian expense reduction | | | (39 | ) |
| | | | |
Net expenses | | | 97,398 | |
| | | | |
Net investment income | | | 166,771 | |
| | | | |
Realized and unrealized gain on investments: | | | | |
Net realized gain | | | 6,408 | |
Net change in unrealized appreciation/depreciation | | | 190,782 | |
| | | | |
Net realized and unrealized gain on investments | | | 197,190 | |
| | | | |
Net increase in net assets resulting from operations | | $ | 363,961 | |
| | | | |
The accompanying notes are an integral part of the financial statements.
44
TENNESSEE TAX-FREE SHORT-TO-MEDIUM SERIES
STATEMENTS OF CHANGES IN NET ASSETS
For the years ended June 30, 2016 and 2015
| | | | | | | | |
| | | 2016 | | | 2015 | |
Operations: | | | | | | | | |
Net investment income | | $ | 166,771 | | | $ | 178,683 | |
Net realized gain on investments | | | 6,408 | | | | 485 | |
Net change in unrealized appreciation/depreciation | | | 190,782 | | | | (78,224 | ) |
| | | | | | | | |
Net increase in net assets resulting from operations | | | 363,961 | | | | 100,944 | |
Distributions from net investment income (Note 6) | | | (166,771 | ) | | | (178,683 | ) |
Net fund share transactions (Note 4) | | | 109,789 | | | | 326,636 | |
| | | | | | | | |
Total increase | | | 306,979 | | | | 248,897 | |
Net assets: | | | | | | | | |
Beginning of year | | | 11,033,472 | | | | 10,784,575 | |
| | | | | | | | |
End of year | | $ | 11,340,451 | | | $ | 11,033,472 | |
| | | | | | | | |
FINANCIAL HIGHLIGHTS
| | | | | | | | | | | | | | | | | | | | |
| Selected data for a share outstanding: | | For the years ended June 30, | |
| | | 2016 | | | 2015 | | | 2014 | | | 2013 | | | 2012 | |
Net asset value, beginning of year | | | $10.74 | | | | $10.81 | | | | $10.75 | | | | $11.01 | | | | $10.85 | |
| | | | | | | | | | | | | | | | | | | | |
Income from investment operations: | | | | | | | | | | | | | | | | | | | | |
Net investment income | | | 0.16 | | | | 0.18 | | | | 0.19 | | | | 0.20 | | | | 0.24 | |
Net gains/(losses) on securities both realized and unrealized | | | 0.19 | | | | (0.07 | ) | | | 0.06 | | | | (0.26 | ) | | | 0.16 | |
| | | | | | | | | | | | | | | | | | | | |
Total from investment operations | | | 0.35 | | | | 0.11 | | | | 0.25 | | | | (0.06 | ) | | | 0.40 | |
Less distributions: | | | | | | | | | | | | | | | | | | | | |
Distributions from net investment income | | | (0.16 | ) | | | (0.18 | ) | | | (0.19 | ) | | | (0.20 | ) | | | (0.24 | ) |
| | | | | | | | | | | | | | | | | | | | |
Net asset value, end of year | | | $10.93 | | | | $10.74 | | | | $10.81 | | | | $10.75 | | | | $11.01 | |
| | | | | | | | | | | | | | | | | | | | |
Total return | | | 3.28% | | | | 0.99% | | | | 2.36% | | | | (0.53)% | | | | 3.74% | |
Net assets, end of year (in thousands) | | | $11,340 | | | | $11,033 | | | | $10,785 | | | | $11,021 | | | | $12,026 | |
Ratio of net expenses to average net assets (a) | | | 0.86% | | | | 0.85% | | | | 0.86% | | | | 0.86% | | | | 0.87% | |
Ratio of gross expenses to average net assets | | | 0.86% | | | | 0.85% | | | | 0.86% | | | | 0.86% | | | | 0.87% | |
Ratio of net investment income to average net assets | | | 1.47% | | | | 1.64% | | | | 1.78% | | | | 1.86% | | | | 2.21% | |
Portfolio turnover | | | 7.37% | | | | 14.32% | | | | 11.38% | | | | 20.56% | | | | 1.86% | |
| (a) | | Percentages are after expense waivers and reductions by the Adviser and Custodian. The Adviser and Custodian have agreed not to seek recovery of these waivers and reductions. |
The accompanying notes are an integral part of the financial statements.
45
DUPREE MUTUAL FUNDS — INTERMEDIATE GOVERNMENT BOND SERIES
SCHEDULE OF PORTFOLIO INVESTMENTS
U.S. Government Securities and Agencies — 100% of Net Assets
June 30, 2016
| | | | | | | | | | | | | | | | | | |
| Bond Description | | Coupon | | | Maturity
Date | | | Rating# | | Par Value | | | Fair Value | |
| FEDERAL FARM CREDIT | | | | | | | | | | | | | | | | | | |
| 59.97% of Net Assets | | | | | | | | | | | | | | | | | | |
Federal Farm Credit Bank | | | 5.250 | % | | | 10/25/2022 | | | Aaa | | $ | 1,500,000 | | | $ | 1,836,729 | |
Federal Farm Credit Bank | | | 5.050 | | | | 12/21/2021 | | | Aaa | | | 370,000 | | | | 444,003 | |
Federal Farm Credit Bank | | | 5.840 | | | | 07/20/2022 | | | Aaa | | | 2,650,000 | | | | 3,327,584 | |
Federal Farm Credit Bank | | | 5.250 | | | | 05/10/2022 | | | Aaa | | | 2,000,000 | | | | 2,429,122 | |
Federal Farm Credit Bank | | | 5.125 | | | | 11/28/2022 | | | Aaa | | | 2,000,000 | | | | 2,441,672 | |
| | | | | | | | | | | | | | | | | | |
| | | | | | | | | | | | | | | | | 10,479,110 | |
| FEDERAL HOME LOAN BANK | | | | | | | | | | | | | | | | | | |
| 30.49% of Net Assets | | | | | | | | | | | | | | | | | | |
Federal Home Loan Bank | | | 5.365 | | | | 09/09/2024 | | | Aaa | | | 1,750,000 | | | | 2,231,525 | |
Federal Home Loan Bank | | | 5.000 | | | | 12/10/2021 | | | Aaa | | | 500,000 | | | | 597,770 | |
Federal Home Loan Bank | | | 5.750 | | | | 06/10/2022 | | | Aaa | | | 2,000,000 | | | | 2,500,048 | |
| | | | | | | | | | | | | | | | | | |
| | | | | | | | | | | | | | | | | 5,329,342 | |
| FEDERAL NATIONAL MORTGAGE ASSOCIATION | | | | | | | | | | | | | | | | | | |
| 6.98% of Net Assets | | | | | | | | | | | | | | | | | | |
Federal National Mortgage Association | | | 8.100 | | | | 08/12/2019 | | | Aaa | | | 1,000,000 | | | | 1,220,443 | |
| | | | | | | | | | | | | | | | | | |
Total Investments 97.44% of Net Assets (cost $15,437,368) (See (a) below for further explanation) | | | | | | $ | 17,028,895 | |
| | | | | | | | | | | | | | | | | | |
Other assets in excess of liabilities 2.56% | | | | | | | | | | | | | | | | | 447,587 | |
| | | | | | | | | | | | | | | | | | |
Net Assets 100% | | | | | | | | | | | | | | | | $ | 17,476,482 | |
| | | | | | | | | | | | | | | | | | |
| | # | | Ratings by Moody’s Investors Services, Inc. unless noted otherwise. |
| | | | Bond ratings are unaudited and not covered by Report of Independent Registered Public Accounting Firm. |
| | | | All ratings are as of the date indicated and do not reflect subsequent changes. |
| | * | | Rated by Standard & Poor’s Corporation |
| | @ | | Fitch’s Investors Service |
| (a) | | Cost for federal income tax purposes is $15,437,368 and net unrealized appreciation of investments is as follows: |
| | | | | | |
| | Unrealized appreciation | | $ | 1,591,527 | |
| | Unrealized depreciation | | | — | |
| | | | | | |
| | Net unrealized appreciation | | $ | 1,591,527 | |
| | | | | | |
Other Information
The following is a summary of the inputs used, as of June 30, 2016, involving the Fund’s investments in securities carried at fair value. The inputs or methodology used for valuing securities may not be an indication of the risk associated with investing in those securities. For more information on valuation inputs, and their aggregation into the levels used in the table below, please refer to the Security Valuation section in the accompanying Notes to Financial Statements.
| | | | | | |
| | | Valuation Inputs | | Government Agencies | |
Level 1 | | Quoted Prices | | | — | |
Level 2 | | Other Significant Observable Inputs | | $ | 17,028,895 | |
Level 3 | | Significant Unobservable Inputs | | | — | |
| | | | | | |
| | | | $ | 17,028,895 | |
| | | | | | |
The accompanying notes are an integral part of the financial statements.
46
INTERMEDIATE GOVERNMENT BOND SERIES
STATEMENT OF ASSETS AND LIABILITIES
June 30, 2016
| | | | | | | | |
ASSETS: | | | | | | | | |
Investments in securities, at fair value (Cost: $15,437,368) | | | | | | $ | 17,028,895 | |
Cash | | | | | | | 300,372 | |
Interest receivable | | | | | | | 176,807 | |
| | | | | | | | |
Total assets | | | | | | | 17,506,074 | |
LIABILITIES: | | | | | | | | |
Payable for: | | | | | | | | |
Distributions to shareholders | | | 7,449 | | | | | |
Fund shares redeemed | | | 4,845 | | | | | |
Investment advisory fee | | | 2,853 | | | | | |
Transfer agent fee | | | 4,570 | | | | | |
Trustee fee | | | 1,145 | | | | | |
Accrued expenses | | | 8,730 | | | | | |
| | | | | | | | |
Total liabilities | | | | | | | 29,592 | |
| | | | | | | | |
NET ASSETS: | | | | | | | | |
Capital | | | | | | | 16,075,839 | |
Accumulated net realized loss on investment transactions | | | | | | | (190,884 | ) |
Net unrealized appreciation in value of investments | | | | | | | 1,591,527 | |
| | | | | | | | |
Net assets at value | | | | | | $ | 17,476,482 | |
| | | | | | | | |
NET ASSET VALUE, offering price and redemption price per share
(1,633,917 shares outstanding; unlimited number of shares authorized; no par value) | | | | | | $ | 10.70 | |
| | | | | | | | |
STATEMENT OF OPERATIONS
For the year ended June 30, 2016
| | | | |
Net investment income: | | | | |
Interest income | | $ | 540,840 | |
| | | | |
Expenses: | | | | |
Investment advisory fee | | | 36,136 | |
Transfer agent fee | | | 27,102 | |
Custodian expense | | | 8,557 | |
Professional fees | | | 4,041 | |
Trustees fees | | | 1,887 | |
Pricing fees | | | 5,000 | |
Postage expense | | | 5,000 | |
Registration fees | | | 4,771 | |
Other expenses | | | 2,879 | |
| | | | |
Total expenses | | | 95,373 | |
Custodian expense reduction | | | (44 | ) |
| | | | |
Net expenses | | | 95,329 | |
| | | | |
Net investment income | | | 445,511 | |
| | | | |
Realized and unrealized gain on investments: | | | | |
Net realized gain | | | 93,021 | |
Net change in unrealized appreciation/depreciation | | | 602,867 | |
| | | | |
Net realized and unrealized gain on investments | | | 695,888 | |
| | | | |
Net increase in net assets resulting from operations | | $ | 1,141,399 | |
| | | | |
The accompanying notes are an integral part of the financial statements.
47
INTERMEDIATE GOVERNMENT BOND SERIES
STATEMENTS OF CHANGES IN NET ASSETS
For the years ended June 30, 2016 and 2015
| | | | | | | | |
| | | 2016 | | | 2015 | |
Operations: | | | | | | | | |
Net investment income | | $ | 445,511 | | | $ | 535,178 | |
Net realized gain/(loss) on investments | | | 93,021 | | | | (22,908 | ) |
Net change in unrealized appreciation/depreciation | | | 602,867 | | | | 130,410 | |
| | | | | | | | |
Net increase in net assets resulting from operations | | | 1,141,399 | | | | 642,680 | |
Distributions from net investment income (Note 6) | | | (445,511 | ) | | | (535,178 | ) |
Net fund share transactions (Note 4) | | | (1,947,283 | ) | | | (2,603,197 | ) |
| | | | | | | | |
Total decrease | | | (1,251,395 | ) | | | (2,495,695 | ) |
Net assets: | | | | | | | | |
Beginning of year | | | 18,727,877 | | | | 21,223,572 | |
| | | | | | | | |
End of year | | $ | 17,476,482 | | | $ | 18,727,877 | |
| | | | | | | | |
FINANCIAL HIGHLIGHTS
| | | | | | | | | | | | | | | | | | | | |
| Selected data for a share outstanding: | | For the years ended June 30, | |
| | | 2016 | | | 2015 | | | 2014 | | | 2013 | | | 2012 | |
Net asset value, beginning of year | | | $10.29 | | | | $10.25 | | | | $10.05 | | | | $10.58 | | | | $9.96 | |
| | | | | | | | | | | | | | | | | | | | |
Income from investment operations: | | | | | | | | | | | | | | | | | | | | |
Net investment income | | | 0.26 | | | | 0.26 | | | | 0.28 | | | | 0.30 | | | | 0.34 | |
Net gains/(losses) on securities | | | 0.41 | | | | 0.04 | | | | 0.20 | | | | (0.53 | ) | | | 0.62 | |
| | | | | | | | | | | | | | | | | | | | |
Total from investment operations | | | 0.67 | | | | 0.30 | | | | 0.48 | | | | (0.23 | ) | | | 0.96 | |
Less distributions: | | | | | | | | | | | | | | | | | | | | |
Distributions from net investment income | | | (0.26 | ) | | | (0.26 | ) | | | (0.28 | ) | | | (0.30 | ) | | | (0.34 | ) |
| | | | | | | | | | | | | | | | | | | | |
Net asset value, end of year | | | $10.70 | | | | $10.29 | | | | $10.25 | | | | $10.05 | | | | $10.58 | |
| | | | | | | | | | | | | | | | | | | | |
Total return | | | 6.57% | | | | 2.96% | | | | 4.89% | | | | (2.34)% | | | | 9.72% | |
Net assets, end of year (in thousands) | | | $17,476 | | | | $18,728 | | | | $21,224 | | | | $23,395 | | | | $25,830 | |
Ratio of net expenses to average net assets (a) | | | 0.53% | | | | 0.51% | | | | 0.56% | | | | 0.48% | | | | 0.52% | |
Ratio of gross expenses to average net assets | | | 0.53% | | | | 0.51% | | | | 0.56% | | | | 0.54% | | | | 0.52% | |
Ratio of net investment income to average net assets | | | 2.47% | | | | 2.54% | | | | 2.81% | | | | 2.77% | | | | 3.25% | |
Portfolio turnover | | | 0.00% | | | | 2.44% | | | | 15.33% | | | | 16.02% | | | | 8.94% | |
| (a) | | Percentages are after expenses waived by Adviser and Custodian reduction. No recovery of these waivers and reductions will be sought. |
The accompanying notes are an integral part of the financial statements.
48
DUPREE MUTUAL FUNDS — TAXABLE MUNICIPAL BOND SERIES
SCHEDULE OF PORTFOLIO INVESTMENTS
Taxable Municipal Bonds — 100% of Net Assets
June 30, 2016
| | | | | | | | | | | | | | | | | | |
| Bond Description | | Coupon | | | Maturity
Date | | | Rating# | | Par Value | | | Fair Value | |
| PUBLIC FACILITIES REVENUE BONDS | | | | | | | | | | | | | | | | | | |
| 30.56’% of Net Assets | | | | | | | | | | | | | | | | | | |
Buncombe County NC Limited Obligation Build America | | | 6.800 | % | | | 06/01/2030 | | | Aa2 | | $ | 250,000 | | | $ | 289,587 | |
Colorado State Certificates of Participation Build America | | | 6.450 | | | | 09/15/2039 | | | Aa2 | | | 130,000 | | | | 174,502 | |
Decatur GA Urban Redevelopment Agency Revenue Build America | | | 6.920 | | | | 01/01/2038 | | | Aa2 | | | 150,000 | | | | 175,076 | |
Franklin County OH Convention Facilities Authority | | | 6.640 | | | | 12/01/2042 | | | Aa2 | | | 240,000 | | | | 321,636 | |
Grand Junction CO Certificates of Participation Build America | | | 7.500 | | | | 12/01/2030 | | | A+* | | | 500,000 | | | | 586,130 | |
Metropolitan Government Nashville & Davidson County TN | | | 7.431 | | | | 07/01/2043 | | | A1 | | | 90,000 | | | | 124,592 | |
Pennington County SD Certificates of Participation Build America | | | 7.200 | | | | 06/01/2037 | | | Aa2 | | | 750,000 | | | | 876,735 | |
Pompano Beach FL Certificates of Participation | | | 5.579 | | | | 01/01/2040 | | | A1 | | | 225,000 | | | | 248,517 | |
Rhode Island Convention Center | | | 6.060 | | | | 05/15/2035 | | | Aa3 | | | 70,000 | | | | 84,791 | |
Sarasota County FL Capital Improvement Revenue Build America | | | 7.016 | | | | 10/01/2040 | | | AA+* | | | 710,000 | | | | 840,768 | |
| | | | | | | | | | | | | | | | | | |
| | | | | | | | | | | | | | | | | 3,722,332 | |
| MUNICIPAL UTILITY REVENUE BONDS | | | | | | | | | | | | | | | | | | |
| 26.35% of Net Assets | | | | | | | | | | | | | | | | | | |
Altoona PA Water Authority Sewer Revenue Build America | | | 7.064 | | | | 12/01/2040 | | | AA* | | | 500,000 | | | | 579,910 | |
American Municipal Power Ohio Incoporated | | | 7.834 | | | | 02/15/2041 | | | A3 | | | 110,000 | | | | 168,234 | |
Davie FL Water & Sewer Revenue Build America | | | 6.849 | | | | 10/01/2040 | | | Aa3 | | | 40,000 | | | | 47,473 | |
FL State Utility Revenue | | | 6.548 | | | | 10/01/2040 | | | A2 | | | 60,000 | | | | 68,954 | |
Heber UT Light & Power Build America | | | 7.000 | | | | 12/15/2030 | | | A2 | | | 375,000 | | | | 432,585 | |
Metrolpolitan Government Nashville & Davidson County TN Recovery Zone | | | 6.693 | | | | 07/01/2041 | | | Aa3 | | | 200,000 | | | | 289,526 | |
Pigeon Forge TN Build America Recovery Zone | | | 7.125 | | | | 06/01/2040 | | | AA* | | | 300,000 | | | | 395,931 | |
Sedalia MO Certificates of Participation Build America | | | 7.300 | | | | 06/01/2035 | | | AA* | | | 500,000 | | | | 558,900 | |
West Knox Utilities District Knox County TN Water and Sewer | | | 6.900 | | | | 06/01/2040 | | | AA+* | | | 400,000 | | | | 490,344 | |
Williamsport PA Municipal Water Authority Build America | | | 6.100 | | | | 01/01/2040 | | | A2 | | | 60,000 | | | | 64,201 | |
York County VA Sewer Revenue Build America | | | 6.607 | | | | 06/01/2040 | | | Aa3 | | | 100,000 | | | | 113,320 | |
| | | | | | | | | | | | | | | | | | |
| | | | | | | | | | | | | | | | | 3,209,378 | |
| SCHOOL IMPROVEMENT BONDS | | | | | | | | | | | | | | | | | | |
| 13.68% of Net Assets | | | | | | | | | | | | | | | | | | |
Armstrong School District PA Build America | | | 7.000 | | | | 03/15/2041 | | | AA* | | | 750,000 | | | | 891,285 | |
CO State Building Excellent Schools Today Certificates of Participation | | | 7.017 | | | | 03/15/2031 | | | Aa2 | | | 400,000 | | | | 478,192 | |
Jefferson County TN Build America Bonds | | | 6.625 | | | | 06/01/2040 | | | Aa3 | | | 250,000 | | | | 296,620 | |
| | | | | | | | | | | | | | | | | | |
| | | | | | | | | | | | | | | | | 1,666,097 | |
| MISCELLANEOUS PUBLIC IMPROVEMENT BONDS | | | | | | | | | | | | | | | | | | |
| 10.22% of Net Assets | | | | | | | | | | | | | | | | | | |
KY State Property & Buildings Build America | | | 5.921 | | | | 11/01/2030 | | | Aa3 | | | 250,000 | | | | 305,378 | |
Lincoln AL Build America Recovery Zone | | | 6.800 | | | | 06/01/2040 | | | AA* | | | 500,000 | | | | 580,595 | |
Scottsboro AL Build America Bonds | | | 6.400 | | | | 11/01/2040 | | | A2 | | | 250,000 | | | | 283,980 | |
Utah County UT Excise Tax Revenue | | | 7.130 | | | | 12/01/2039 | | | AA-* | | | 65,000 | | | | 75,057 | |
| | | | | | | | | | | | | | | | | | |
| | | | | | | | | | | | | | | | | 1,245,009 | |
| HOSPITAL AND HEALTHCARE REVENUE BONDS | | | | | | | | | | | | | | | | | | |
| 4.35% of Net Assets | | | | | | | | | | | | | | | | | | |
Midland County TX Hospital District | | | 6.440 | | | | 05/15/2039 | | | Aa2 | | | 185,000 | | | | 242,591 | |
University NC Chapel Hill Hospital Revenue Build America | | | 6.329 | | | | 02/01/2031 | | | Aa3 | | | 250,000 | | | | 287,715 | |
| | | | | | | | | | | | | | | | | | |
| | | | | | | | | | | | | | | | | 530,306 | |
| TURNPIKES/TOLLROAD/HIGHWAY BONDS | | | | | | | | | | | | | | | | | | |
| 3.54% of Net Assets | | | | | | | | | | | | | | | | | | |
FL State Turnpike Authority Turnpike Revenue Build America | | | 6.800 | | | | 07/01/2039 | | | Aa2 | | | 300,000 | | | | 344,604 | |
MS Development Bank Special Obligation Build America | | | 6.413 | | | | 01/01/2040 | | | Aa3 | | | 65,000 | | | | 86,237 | |
| | | | | | | | | | | | | | | | | | |
| | | | | | | | | | | | | | | | | 430,841 | |
| MARINA/PORT AUTHORITY REVENUE BONDS | | | | | | | | | | | | | | | | | | |
| 2.27% of Net Assets | | | | | | | | | | | | | | | | | | |
Miami Dade County FL Special Obligation | | | 7.500 | | | | 04/01/2040 | | | Aa3 | | | 200,000 | | | | 277,084 | |
| | | | | | | | | | | | | | | | | | |
| SALES TAX REVENUE | | | | | | | | | | | | | | | | | | |
| 2.13% of Net Assets | | | | | | | | | | | | | | | | | | |
Amarillo TX Hotel Occupancy Tax Revenue | | | 4.250 | | | | 08/15/2043 | | | AA* | | | 250,000 | | | | 259,388 | |
| | | | | | | | | | | | | | | | | | |
The accompanying notes are an integral part of the financial statements.
49
DUPREE MUTUAL FUNDS — TAXABLE MUNICIPAL BOND SERIES
SCHEDULE OF PORTFOLIO INVESTMENTS
Taxable Municipal Bonds — 100% of Net Assets
June 30, 2016
| | | | | | | | | | | | | | | | | | |
| Bond Description | | Coupon | | | Maturity
Date | | | Rating# | | Par Value | | | Fair Value | |
| UNIVERSITY CONSOLIDATED EDUCATION AND BUILDING REVENUE BONDS | | | | | | | | | | | | | | | |
| 1.13% of Net Assets | | | | | | | | | | | | | | | | | | |
Mesa State College CO Auxiliary Facilities Build America | | | 6.746 | % | | | 05/15/2042 | | | Aa2 | | $ | 100,000 | | | $ | 137,762 | |
| | | | | | | | | | | | | | | | | | |
Total Investments 94.23% of Net Assets (cost $9,882,481) (See (a) below for further explanation) | | | | | | $ | 11,478,197 | |
| | | | | | | | | | | | | | | | | | |
Other assets in excess of liabilities 5.77% | | | | | | | | | | | | | | | | | 702,262 | |
| | | | | | | | | | | | | | | | | | |
Net Assets 100% | | | | | | | | | | | | | | | | $ | 12,180,459 | |
| | | | | | | | | | | | | | | | | | |
| | # | | Ratings by Moody’s Investors Services, Inc. unless noted otherwise. |
| | | | Bond ratings are unaudited and not covered by Report of Independent Registered Public Accounting Firm. |
| | | | All ratings are as of the date indicated and do not reflect subsequent changes. |
| | * | | Rated by Standard & Poor’s Corporation |
| | @ | | Fitch’s Investors Service |
| (a) | | Cost for federal income tax purposes is $9,882,481 and net unrealized appreciation of investments is as follows: |
| | | | | | |
| | Unrealized appreciation | | $ | 1,595,716 | |
| | Unrealized depreciation | | | — | |
| | | | | | |
| | Net unrealized appreciation | | $ | 1,595,716 | |
| | | | | | |
Other Information
The following is a summary of the inputs used, as of June 30, 2016, involving the Fund’s investments in securities carried at fair value. The inputs or methodology used for valuing securities may not be an indication of the risk associated with investing in those securities. For more information on valuation inputs, and their aggregation into the levels used in the table below, please refer to the Security Valuation section in the accompanying Notes to Financial Statements.
| | | | | | |
| | | Valuation Inputs | | Taxable Municipal
Bonds | |
Level 1 | | Quoted Prices | | $ | — | |
Level 2 | | Other Significant Observable Inputs | | | 11,478,197 | |
Level 3 | | Significant Unobservable Inputs | | | — | |
| | | | | | |
| | | | $ | 11,478,197 | |
| | | | | | |
The accompanying notes are an integral part of the financial statements.
50
TAXABLE MUNICIPAL BOND SERIES
STATEMENT OF ASSETS AND LIABILITIES
June 30, 2016
| | | | | | | | |
ASSETS: | | | | | | | | |
Investments in securities, at fair value (Cost: $9,882,481) | | | | | | $ | 11,478,197 | |
Cash | | | | | | | 603,866 | |
Interest receivable | | | | | | | 125,934 | |
| | | | | | | | |
Total assets | | | | | | | 12,207,997 | |
LIABILITIES: | | | | | | | | |
Payable for: | | | | | | | | |
Distributions to shareholders | | | 12,944 | | | | | |
Investment advisory fee | | | 4,864 | | | | | |
Transfer agent fee | | | 1,411 | | | | | |
Trustees fees | | | 227 | | | | | |
Accrued expenses | | | 8,092 | | | | | |
| | | | | | | | |
Total liabilities | | | | | | | 27,538 | |
| | | | | | | | |
| NET ASSETS: | | | | | | | | |
Capital | | | | | | | 10,545,477 | |
Accumulated net realized gain on investment transactions | | | | | | | 39,266 | |
Net unrealized appreciation in value of investments | | | | | | | 1,595,716 | |
| | | | | | | | |
Net assets at value | | | | | | $ | 12,180,459 | |
| | | | | | | | |
NET ASSET VALUE, offering price and redemption price per share
(1,109,660 shares outstanding; unlimited number of shares authorized; no par value) | | | | | | $ | 10.98 | |
| | | | | | | | |
STATEMENT OF OPERATIONS
For the year ended June 30, 2016
| | | | |
Net investment income: | | | | |
Interest income | | $ | 644,207 | |
| | | | |
Expenses: | | | | |
Investment advisory fee | | | 57,844 | |
Transfer agent fee | | | 17,353 | |
Custodian expense | | | 7,335 | |
Professional fees | | | 811 | |
Trustees fees | | | 1,192 | |
Registration fees | | | 6,367 | |
Pricing | | | 3,499 | |
Other expenses | | | 4,683 | |
| | | | |
Total expenses | | | 99,084 | |
Custodian expense reduction | | | (38 | ) |
| | | | |
Net expenses | | | 99,046 | |
| | | | |
Net investment income | | | 545,161 | |
| | | | |
Realized and unrealized gain on investments: | | | | |
Net realized gain | | | 66,135 | |
Net change in unrealized appreciation/depreciation | | | 431,560 | |
| | | | |
Net realized and unrealized gain on investments | | | 497,695 | |
| | | | |
Net increase in net assets resulting from operations | | $ | 1,042,856 | |
| | | | |
The accompanying notes are an integral part of the financial statements.
51
TAXABLE MUNICIPAL BOND SERIES
STATEMENT OF CHANGES IN NET ASSETS
For the years ended June 30, 2016 and 2015
| | | | | | | | |
| | | 2016 | | | 2015 | |
Operations: | | | | | | | | |
Net investment income | | $ | 545,161 | | | $ | 603,910 | |
Net realized gain on investments | | | 66,135 | | | | 10,924 | |
Net change in unrealized appreciation/depreciation | | | 431,560 | | | | (65,832 | ) |
| | | | | | | | |
Net increase in net assets resulting from operations | | | 1,042,856 | | | | 549,002 | |
Distributions from net investment income (Note 6) | | | (545,161 | ) | | | (603,910 | ) |
Net fund share transactions (Note 4) | | | 380,217 | | | | (1,011,672 | ) |
| | | | | | | | |
Total increase/(decrease) | | | 877,912 | | | | (1,066,580 | ) |
Net assets: | | | | | | | | |
Beginning of year | | | 11,302,547 | | | | 12,369,127 | |
| | | | | | | | |
End of year | | $ | 12,180,459 | | | $ | 11,302,547 | |
| | | | | | | | |
FINANCIAL HIGHLIGHTS
| | | | | | | | | | | | | | | | | | | | |
| Selected data for a share outstanding: | | For the years ended June 30, | |
| | | 2016 | | | 2015 | | | 2014 | | | 2013 | | | 2012 | |
Net asset value, beginning of year | | | $10.53 | | | | $10.57 | | | | $10.45 | | | | $10.82 | | | | $9.65 | |
| | | | | | | | | | | | | | | | | | | | |
Income from investment operations: | | | | | | | | | | | | | | | | | | | | |
Net investment income | | | 0.50 | | | | 0.52 | | | | 0.51 | | | | 0.51 | | | | 0.52 | |
Net gains/(losses) on securities | | | 0.45 | | | | (0.04 | ) | | | 0.18 | | | | (0.36 | ) | | | 1.17 | |
| | | | | | | | | | | | | | | | | | | | |
Total from investment operations | | | 0.95 | | | | 0.48 | | | | 0.69 | | | | 0.15 | | | | 1.69 | |
Less distributions: | | | | | | | | | | | | | | | | | | | | |
Distributions from net investment income | | | (0.50 | ) | | | (0.52 | ) | | | (0.51 | ) | | | (0.51 | ) | | | (0.52 | ) |
Distributions from capital gains | | | — | | | | — | | | | (0.06 | ) | | | (0.01 | ) | | | — | |
| | | | | | | | | | | | | | | | | | | | |
Total distributions | | | (0.50 | ) | | | (0.52 | ) | | | (0.57 | ) | | | (0.52 | ) | | | (0.52 | ) |
| | | | | | | | | | | | | | | | | | | | |
Net asset value, end of year | | | $10.98 | | | | $10.53 | �� | | | $10.57 | | | | $10.45 | | | | $10.82 | |
| | | | | | | | | | | | | | | | | | | | |
Total return | | | 9.29% | | | | 4.49% | | | | 6.90% | | | | 1.35% | | | | 17.77% | |
Net assets, end of year (in thousands) | | | $12,180 | | | | $11,303 | | | | $12,369 | | | | $16,006 | | | | $16,042 | |
Ratio of net expenses to average net assets (a) | | | 0.86% | | | | 0.83% | | | | 0.89% | | | | 0.83% | | | | 0.85% | |
Ratio of gross expenses to average net assets | | | 0.86% | | | | 0.83% | | | | 0.89% | | | | 0.83% | | | | 0.86% | |
Ratio of net investment income to average net assets | | | 4.71% | | | | 4.80% | | | | 4.95% | | | | 4.71% | | | | 4.95% | |
Portfolio turnover | | | 10.55% | | | | 8.45% | | | | 9.71% | | | | 9.57% | | | | 0.00% | |
| (a) | | Percentages are after expense waivers and reductions by the Adviser and Custodian. The Adviser and Custodian have agreed not to seek recovery of these waivers and reductions. |
The accompanying notes are an integral part of the financial statements.
52
DUPREE MUTUAL FUNDS
NOTES TO FINANCIAL STATEMENTS
June 30, 2016
| 1. | | Organization and Significant Accounting Policies |
Dupree Mutual Funds is registered under the Investment Company Act of 1940, as amended, as a no-load, open-end investment company. The Declaration of Trust of Dupree Mutual Funds (the “Trust”) permits the Trustees to create an unlimited number of series of investment portfolios (each a “Fund” and collectively, the “Funds”) and with respect to each series to issue an unlimited number of full or fractional shares of a single class. The Trust currently offers ten series:
Alabama Tax-Free Income Series
Kentucky Tax-Free Income Series
Kentucky Tax-Free Short-to-Medium Series
Mississippi Tax-Free Income Series
North Carolina Tax-Free Income Series
North Carolina Tax-Free Short-to-Medium Series
Tennessee Tax-Free Income Series
Tennessee Tax-Free Short-to-Medium Series
Intermediate Government Bond Series
Taxable Municipal Bond Series
The investment strategy of the eight state tax-free funds is to maintain 100% of their investments in their respective states of Alabama, Kentucky, Mississippi, North Carolina, or Tennessee municipal securities.
The Intermediate Government Bond Series’ investment strategy is to invest only in obligations of the U.S. Treasury and Agencies of the U.S. Government. The Intermediate Government Bond Series will buy bonds and notes that will maintain an average maturity of no more than ten years.
The Taxable Municipal Bond Series’ investment strategy is to invest in taxable municipal bonds of investment grade quality.
The following is a summary of significant accounting policies consistently followed by the Funds in the preparation of their financial statements. The policies are in conformity with accounting principles generally accepted in the United States (“U.S. GAAP”). The Trust operates as an investment company and accordingly follows the investment company accounting and reporting guidance of the Financial Accounting Standards Board (“FASB”) Accounting Standards Codification Topic 946 Financial Services — Investment Companies.
Securities held by the Intermediate Government Bond Series are valued using market quotations as provided by an independent pricing service. Securities held by the nine municipal bond funds are valued as determined in good faith in accordance with consistently applied procedures established by and under the general supervision of the Board of Trustees. These procedures involve the use of matrix pricing models which take into consideration price quotations or appraisals for these securities, yield, stability, risk, quality, coupon rate, maturity, type of issue, trading characteristics, special circumstances of a security or trading market, and any other factors or market data considered relevant in determining the value. The procedures also include weekly verification of market quotations provided by two independent pricing services. A bond valuation that is not supported by a valuation source requires management to fair value the security in consultation with the Trust’s Board of Trustee’s Valuation Committee. The Board of Trustees of the Trust (the “Board”) has adopted policies and procedures for the valuation of the Trust’s investments (the “Valuation Procedures”). Pursuant to the Valuation Procedures, the Board has delegated to a valuation committee, consisting of all of the Trustees the day-to-day responsibility for implementing the Valuation Procedures, including, under most circumstances, the responsibility for determining the fair value of the Trust’s securities or other assets. The Valuation Committee convenes as needed and reviews the valuation of all assets which have been fair valued for reasonableness. Shares of open-end mutual funds in which the Funds invest, if any, are valued at their respective net asset values as reported by the underlying funds.
The Funds have adopted the provisions of Financial Accounting Standards Board (FASB) Accounting Standards Codification (ASC) 820, “Fair Value Measurements and Disclosures”. ASC 820 establishes a hierarchy that prioritizes the
53
DUPREE MUTUAL FUNDS
NOTES TO FINANCIAL STATEMENTS
June 30, 2016
| 1. | | Organization and Significant Accounting Policies, continued |
inputs to valuation techniques giving the highest priority to readily available unadjusted quoted prices in active markets for identical assets (level 1 measurements) and the lowest priority to unobservable inputs (level 3 measurements) when market prices are not readily available or reliable. The three levels of the hierarchy under ASC 820 are described as follows:
| | |
| Level 1: | | Unadjusted quoted prices in active markets for identical securities. |
| Level 2: | | Prices determined using other significant observable inputs. Observable inputs, either directly or indirectly, are inputs that other market participants may use in pricing a security. These may include quoted prices for similar securities, interest rates, prepayment speeds, credit risk and others. |
| Level 3: | | Price determined using significant unobservable inputs. In situations where quoted prices or observable inputs are unavailable or deemed less relevant (for example, where there is little or no market activity for an investment at the end of the period), unobservable inputs may be used. Unobservable inputs reflect the Fund’s own assumptions about the factors market participants would use in pricing a security, and would be based on the best information available. |
The aggregate value by input level, as of June 30, 2016, for the Funds’ investments is included at the end of the Funds’ Schedules of Portfolio Investments. The Funds recognize transfers at the end of the reporting period. There were no transfers in and out of level 1, 2 or 3 during the year ended June 30, 2016.
| | B. | Investment Transactions |
Security transactions are accounted for on a trade date basis. Realized gains and losses on securities sold are determined on an identified cost basis.
Interest income, which includes the amortization of premiums and the accretion of discounts, is recorded on an accrual basis. Discounts or premiums on debt securities purchased are accreted or amortized to interest income over the lives of the respective securities using the effective interest method.
| | D. | When-Issued and Extended Settlement Securities |
The Funds may purchase securities with delivery or payment to occur at a later date. At the time the Funds enter into a commitment to purchase a security, the transaction is recorded and the value of the security is reflected in the net asset value. The value of the security may vary with market fluctuations. No interest accrues to the Funds until the security is delivered and payment takes place. At the time the Funds enter this type of transaction, they are required to segregate cash or other liquid assets equal to the value of the securities purchased. Losses may occur on these transactions due to changes in market conditions or the failure of counterparties to perform under the contract.
It is each Fund’s policy to qualify as a regulated investment company by complying with the requirements of the Internal Revenue Code (the “code”) applicable to regulated investment companies, including the distribution of all or substantially all taxable and tax-exempt income to their shareholders. The Funds have met the requirements of the code applicable to regulated investment companies for the year ended June 30, 2016. Therefore, no federal income tax provision is required. Management has analyzed the Funds’ tax positions for all open tax years and all major jurisdictions, and has concluded that as of June 30, 2016, no provision for income taxes is required in the financial statements. Therefore, no additional tax expense, including any interest and penalties, was recorded in the current year and no adjustments were made to prior periods. To the extent the Funds recognize interest and penalties, they are included in interest expense and other expenses, respectively, in the Statement of Operations. Open tax years are those that are open for examination by taxing authorities (i.e. generally the last three tax year ends and the interim tax period since then).
Substantially all of the net investment income of the Funds is declared as a dividend to shareholders of record as of the close of business each day. Any net realized long term capital gains are distributed annually to shareholders. Distributions are payable in cash or in additional shares at the net asset value on the payable date. Distributions are determined in accordance with income tax regulations, which may differ from U.S. GAPP.
54
DUPREE MUTUAL FUNDS
NOTES TO FINANCIAL STATEMENTS
June 30, 2016
| 1. | | Organization and Significant Accounting Policies, continued |
Distributions are payable:
| | |
| Monthly for: | | Kentucky Tax-Free Short-to-Medium Series North Carolina Tax-Free Short-to-Medium Series Tennessee Tax-Free Short-to-Medium Series Intermediate Government Bond Series Taxable Municipal Bond Series |
| |
| Quarterly for: | | Alabama Tax-Free Income Series Kentucky Tax-Free Income Series Mississippi Tax-Free Income Series North Carolina Tax-Free Income Series Tennessee Tax-Free Income Series |
The preparation of these financial statements in conformity with generally accepted accounting principles in the United States requires management to make estimates and assumptions that affect the reported amounts and disclosures. Actual amounts could differ from those estimates.
Subsequent events occurring after June 30, 2016 have been evaluated by the Adviser for potential impact to this report through the date the financial statements were issued. The Adviser has determined that there were no material subsequent events that require recognition or disclosure in the Funds’ financial statements.
| 2. | | Investment Advisory Fee and Other Transactions with Affiliates |
Subject to the direction of the Trustees, Dupree & Company, Inc. (the Adviser) is responsible for the management of the Funds’ portfolios. Under the terms of the Investment Advisory Agreements, the Funds (except the Intermediate Government Bond Series) have agreed to pay to the Adviser as compensation for all services rendered, facilities furnished and expenses paid or assumed by it under the Agreements, a fee at the annual rate of .50 of 1% of the first $100,000,000 average daily net assets of each Fund determined separately; .45 of 1% of the average daily net assets between $100,000,001 and $150,000,000 of each Fund determined separately; .40 of 1% of the average daily net assets between $150,000,001 and $500,000,000 of each Fund determined separately; .35 of 1% of the average daily net assets between $500,000,001 and 750,000,000; and .30 of 1% of the average daily net assets between $750,000,001 and 1,000,000,000; and .25 of 1% of the average daily net assets in excess of $1,000,000,000. The Intermediate Government Bond Series has agreed to pay to the Adviser, as compensation for all services rendered, facilities furnished and expenses paid or assumed by it under the Agreement, a fee at the annual rate of .20 of 1% of average daily net assets.
The Adviser may voluntarily waive investment advisory fees payable to it under the Investment Advisory Agreement with each Fund, and assume and pay other operating expenses. The Adviser will not seek to recoup any waived fees or other operating expenses it has assumed.
For the year ended June 30, 2016, fees voluntarily waived by the Adviser were as follows:
| | | | |
| | | Fees waived by Adviser | |
Alabama Tax-Free Income Series | | $ | 19,398 | |
Mississippi Tax-Free Income Series | | | 19,398 | |
In addition, each Fund has entered into a Shareholder Service Agreement with Dupree & Company, Inc, the Funds’ transfer agent. The agreement provides for a fee computed on the average daily net asset value at the annual rate of .15 of 1% on the first $20,000,000 of average net assets and .12 of 1% of all amounts in excess of $20,000,000 of average net assets for each Fund.
55
DUPREE MUTUAL FUNDS
NOTES TO FINANCIAL STATEMENTS
June 30, 2016
| 2. | | Investment Advisory Fee and Other Transactions with Affiliates, continued |
For the fiscal year ended June 30, 2016, each member of the Board of Trustees who is not an “interested person” of the Funds (the “Independent Trustees”), as defined by the 1940 Act, received a fee of $25,000 per year plus $2,000 for each Audit Committee meeting attended. In addition, all Independent Trustees are reimbursed by the Funds for all reasonable out-of-pocket expenses incurred by them in performing their duties. The fees are allocated on an average net asset basis for each Fund. The Independent Trustees fees for each Fund are disclosed on the Funds’ Statement of Operations.
| 3. | | Purchases and Sales of Securities |
During the year ended June 30, 2016, the cost of purchases and the proceeds from sales/calls and maturities of securities (excluding short-term securities and U.S. government obligations, except for the Intermediate Government Bond Series which are all U.S. government obligations) for each of the Funds were as follows:
| | | | | | | | |
| | | Purchases | | | Sales/Calls | |
Alabama Tax-Free Income Series | | $ | 4,342,011 | | | $ | 1,415,541 | |
Kentucky Tax-Free Income Series | | | 121,134,375 | | | | 114,260,583 | |
Kentucky Tax-Free Short-to-Medium Series | | | 26,581,130 | | | | 22,017,407 | |
Mississippi Tax-Free Income Series | | | 838,618 | | | | 360,100 | |
North Carolina Tax-Free Income Series | | | 27,779,215 | | | | 8,070,891 | |
North Carolina Tax-Free Short-to-Medium Series | | | 6,220,357 | | | | 5,687,240 | |
Tennessee Tax-Free Income Series | | | 14,670,144 | | | | 9,918,426 | |
Tennessee Tax-Free Short-to-Medium Series | | | 808,120 | | | | 941,648 | |
Intermediate Government Bond Series | | | -0- | | | | 1,524,548 | |
Taxable Municipal Bond Series | | | 1,229,201 | | | | 1,092,414 | |
As of June 30, 2016 and 2015, there were an unlimited number of shares of beneficial interest authorized. Transactions in capital shares were as follows:
| | | | | | | | | | | | | | | | |
| ALABAMA TAX-FREE INCOME SERIES | | Year Ended June 30, 2016 | | | Year Ended June 30, 2015 | |
| | | SHARES | | | AMOUNT | | | SHARES | | | AMOUNT | |
Shares sold | | | 330,008 | | | $ | 4,138,437 | | | | 348,252 | | | $ | 4,338,373 | |
Shares reinvested | | | 32,626 | | | | 409,976 | | | | 32,772 | | | | 409,254 | |
Shares redeemed | | | (125,116 | ) | | | (1,566,683 | ) | | | (213,988 | ) | | | (2,673,213 | ) |
Net increase | | | 237,518 | | | $ | 2,981,730 | | | | 167,036 | | | $ | 2,074,414 | |
| | | | | | | | | | | | | | | | |
| KENTUCKY TAX-FREE INCOME SERIES | | Year Ended June 30, 2016 | | | Year Ended June 30, 2015 | |
| | | SHARES | | | AMOUNT | | | SHARES | | | AMOUNT | |
Shares sold | | | 8,721,953 | | | $ | 69,077,836 | | | | 11,235,815 | | | $ | 89,064,324 | |
Shares reinvested | | | 2,313,486 | | | | 18,380,958 | | | | 2,409,836 | | | | 19,091,862 | |
Shares redeemed | | | (10,507,020 | ) | | | (83,116,232 | ) | | | (10,054,449 | ) | | | (79,704,854 | ) |
Net increase | | | 528,419 | | | $ | 4,342,562 | | | | 3,591,202 | | | $ | 28,451,332 | |
| | | | | | | | | | | | | | | | |
KENTUCKY TAX-FREE
SHORT-TO-MEDIUM SERIES | | Year Ended June 30, 2016 | | | Year Ended June 30, 2015 | |
| | | SHARES | | | AMOUNT | | | SHARES | | | AMOUNT | |
Shares sold | | | 4,222,604 | | | $ | 22,772,484 | | | | 3,001,267 | | | $ | 16,255,332 | |
Shares reinvested | | | 172,866 | | | | 932,860 | | | | 207,625 | | | | 1,123,674 | |
Shares redeemed | | | (3,727,024 | ) | | | (20,131,344 | ) | | | (3,359,239 | ) | | | (18,194,879 | ) |
Net increase/(decrease) | | | 668,446 | | | $ | 3,574,000 | | | | (150,347 | ) | | $ | (815,873 | ) |
| | | | | | | | | | | | | | | | |
56
DUPREE MUTUAL FUNDS
NOTES TO FINANCIAL STATEMENTS
June 30, 2016
| 4. | | Capital Shares, continued |
| | | | | | | | | | | | | | | | |
| MISSISSIPPI TAX-FREE INCOME SERIES | | Year Ended June 30, 2016 | | | Year Ended June 30, 2015 | |
| | | SHARES | | | AMOUNT | | | SHARES | | | AMOUNT | |
Shares sold | | | 65,087 | | | $ | 797,613 | | | | 100,220 | | | $ | 1,222,632 | |
Shares reinvested | | | 9,347 | | | | 115,180 | | | | 9,388 | | | | 114,056 | |
Shares redeemed | | | (65,257 | ) | | | (799,035 | ) | | | (77,047 | ) | | | (935,063 | ) |
Net increase | | | 9,177 | | | $ | 113,758 | | | | 32,561 | | | $ | 401,625 | |
| | | | | | | | | | | | | | | | |
NORTH CAROLINA TAX-FREE
INCOME SERIES | | Year Ended June 30, 2016 | | | Year Ended June 30, 2015 | |
| | | SHARES | | | AMOUNT | | | SHARES | | | AMOUNT | |
Shares sold | | | 2,991,113 | | | $ | 35,075,635 | | | | 3,088,138 | | | $ | 36,022,454 | |
Shares reinvested | | | 215,757 | | | | 2,542,539 | | | | 184,173 | | | | 2,145,388 | |
Shares redeemed | | | (1,425,542 | ) | | | (16,719,475 | ) | | | (1,109,825 | ) | | | (12,907,072 | ) |
Net increase | | | 1,781,328 | | | $ | 20,898,699 | | | | 2,162,486 | | | $ | 25,260,770 | |
| | | | | | | | | | | | | | | | |
NORTH CAROLINA TAX-FREE
SHORT-TO-MEDIUM SERIES | | Year Ended June 30, 2016 | | | Year Ended June 30, 2015 | |
| | | SHARES | | | AMOUNT | | | SHARES | | | AMOUNT | |
Shares sold | | | 317,756 | | | $ | 3,497,671 | | | | 255,618 | | | $ | 2,817,986 | |
Shares reinvested | | | 26,967 | | | | 296,253 | | | | 30,368 | | | | 334,675 | |
Shares redeemed | | | (306,621 | ) | | | (3,366,336 | ) | | | (396,396 | ) | | | (4,368,461 | ) |
Net increase/(decrease) | | | 38,102 | | | $ | 427,588 | | | | (110,410 | ) | | $ | (1,215,800 | ) |
| | | | | | | | | | | | | | | | |
| TENNESSEE TAX-FREE INCOME SERIES | | Year Ended June 30, 2016 | | | Year Ended June 30, 2015 | |
| | | SHARES | | | AMOUNT | | | SHARES | | | AMOUNT | |
Shares sold | | | 1,554,220 | | | $ | 18,100,583 | | | | 1,037,008 | | | $ | 12,075,002 | |
Shares reinvested | | | 194,475 | | | | 2,276,847 | | | | 198,391 | | | | 2,311,270 | |
Shares redeemed | | | (1,450,426 | ) | | | (16,901,544 | ) | | | (793,632 | ) | | | (9,246,566 | ) |
Net increase | | | 298,269 | | | $ | 3,475,886 | | | | 441,767 | | | $ | 5,139,706 | |
| | | | | | | | | | | | | | | | |
TENNESSEE TAX-FREE
SHORT-TO-MEDIUM SERIES | | Year Ended June 30, 2016 | | | Year Ended June 30, 2015 | |
| | | SHARES | | | AMOUNT | | | SHARES | | | AMOUNT | |
Shares sold | | | 132,588 | | | $ | 1,440,238 | | | | 73,983 | | | $ | 801,525 | |
Shares reinvested | | | 12,623 | | | | 136,957 | | | | 13,478 | | | | 145,797 | |
Shares redeemed | | | (134,818 | ) | | | (1,467,406 | ) | | | (57,469 | ) | | | (620,686 | ) |
Net increase | | | 10,393 | | | $ | 109,789 | | | | 29,992 | | | $ | 326,636 | |
| | | | | | | | | | | | | | | | |
| INTERMEDIATE GOVERNMENT BOND SERIES | | Year Ended June 30, 2016 | | | Year Ended June 30, 2015 | |
| | | SHARES | | | AMOUNT | | | SHARES | | | AMOUNT | |
Shares sold | | | 84,097 | | | $ | 878,394 | | | | 92,710 | | | $ | 966,480 | |
Shares reinvested | | | 33,468 | | | | 350,358 | | | | 41,002 | | | | 426,297 | |
Shares redeemed | | | (302,898 | ) | | | (3,176,035 | ) | | | (385,931 | ) | | | (3,995,974 | ) |
Net decrease | | | (185,333 | ) | | $ | (1,947,283 | ) | | | (252,219 | ) | | $ | (2,603,197 | ) |
| | | | | | | | | | | | | | | | |
57
DUPREE MUTUAL FUNDS
NOTES TO FINANCIAL STATEMENTS
June 30, 2016
| 4. | | Capital Shares, continued |
| | | | | | | | | | | | | | | | |
| TAXABLE MUNICIPAL BOND SERIES | | Year Ended June 30, 2016 | | | Year Ended June 30, 2015 | |
| | | SHARES | | | AMOUNT | | | SHARES | | | AMOUNT | |
Shares sold | | | 346,871 | | | $ | 3,701,866 | | | | 109,450 | | | $ | 1,178,580 | |
Shares reinvested | | | 32,945 | | | | 352,944 | | | | 35,388 | | | | 381,058 | |
Shares redeemed | | | (343,782 | ) | | | (3,674,593 | ) | | | (241,897 | ) | | | (2,571,310 | ) |
Net increase/(decrease) | | | 36,034 | | | $ | 380,217 | | | | (97,059 | ) | | $ | (1,011,672 | ) |
| 5. | | Concentration of Credit Risk |
The Alabama Tax-Free Income Series, Kentucky Tax-Free Income Series, Kentucky Tax-Free Short-to-Medium Series, Mississippi Tax-Free Income Series, North Carolina Tax-Free Income Series, North Carolina Tax-Free Short-to-Medium Series, Tennessee Tax-Free Income Series, and Tennessee Tax-Free Short-to-Medium Series each invest solely in debt obligations issued by the states of Alabama, Kentucky, Mississippi, North Carolina, and Tennessee, respectively, and their respective political subdivisions, agencies and public authorities to obtain funds for various public purposes. Each of these state-specific Funds is more susceptible to economic and political factors adversely affecting issuers of their states’ respective municipal securities than a fund that is not concentrated in these issuers to the same extent.
At June 30, 2016, the Funds’ capital loss carry-forwards expire as follows:
| | | | | | | | | | | | | | | | | | | | | | | | |
| | | Short-term Expiring | | | No Expiration | | | | |
| | | 2017 | | | 2018 | | | 2019 | | | Short-term | | | Long-term | | | Total | |
Alabama Tax Free Income Series | | $ | — | | | $ | — | | | $ | — | | | $ | 36,314 | | | $ | — | | | $ | 36,314 | |
Kentucky Tax-Free Short-to-Medium Series | | | 223,976 | | | | — | | | | — | | | | — | | | | — | | | | 223,976 | |
North Carolina Tax-Free Income Series | | | — | | | | — | | | | — | | | | 564,541 | | | | — | | | | 564,541 | |
North Carolina Tax-Free Short-to-Medium Series | | | — | | | | — | | | | — | | | | — | | | | 1,580 | | | | 1,580 | |
Tennessee Tax-Free Income Series | | | — | | | | 371,142 | | | | — | | | | 214,659 | | | | — | | | | 585,801 | |
Tennessee Tax-Free Short-to-Medium Series | | | — | | | | — | | | | — | | | | — | | | | 227,704 | | | | 227,704 | |
Intermediate Government Bond Series | | | — | | | | — | | | | — | | | | 120,261 | | | | 70,623 | | | | 190,884 | |
During the year ended June 30, 2016, the following Funds utilized capital loss carry-forwards as follows:
| | | | |
| | | Amount | |
Alabama Tax-Free Income Series | | $ | 7,105 | |
Kentucky Tax-Free Short-to-Medium Series | | | 59,718 | |
North Carolina Tax-Free Income Series | | | 2,054 | |
Tennessee Tax-Free Income Series | | | 54,354 | |
Tennessee Tax-Free Short-to-Medium Series | | | 6,408 | |
Intermediate Government Bond Series | | | 69,993 | |
Taxable Municipal Bond Series | | | 14,681 | |
During the year ended June 30, 2016, the following Funds had capital losses expire:
| | | | |
| | | Amount | |
Kentucky Tax-Free Short-to-Medium Series | | $ | 168,214 | |
Tennessee Tax-Free Short-to-Medium Series | | | 23,418 | |
Capital losses incurred after October 31 (“Post-October” losses) within the taxable year are deemed to arise on the first business day of the Fund’s next taxable year. The following Fund incurred and will elect to defer net capital losses during the fiscal year 2016 as follows:
| | | | |
| | | Post October Losses | |
Kentucky Tax-Free Short-to-Medium Series | | $ | (2,369 | ) |
58
DUPREE MUTUAL FUNDS
NOTES TO FINANCIAL STATEMENTS
June 30, 2016
| 6. | | Federal Income Taxes, continued |
During the year ended June 30, 2016, as a result of permanent book to tax differences, the Funds’ incurred differences that affected undistributed (accumulated) net investment income (loss), accumulated net realized gain (loss) on investments and aggregate paid in capital by the amounts in the table below. The differences are due to expiration of capital loss carryforwards. Net assets were not affected by these reclassifications.
| | | | | | | | |
| | | Accumulated Net
Realized Gain/Loss | | | Paid in Capital | |
Kentucky Tax-Free Short-to-Medium Series | | $ | 168,214 | | | $ | (168,214 | ) |
Tennessee Tax-Free Short-to-Medium Series | | | 23,418 | | | | (23,418 | ) |
The tax character of distributions paid for the years ended June 30, 2016 and 2015 were as follows:
| | | | | | | | | | | | | | | | | | | | | | | | |
| | | 2016 | | | 2015 | |
| | | Tax
Exempt
Income | | | Ordinary
Income | | | Long-Term
Capital
Gain | | | Tax
Exempt
Income | | | Ordinary
Income | | | Long-Term
Capital
Gain | |
Alabama Tax-Free Income Series | | $ | 839,350 | | | $ | — | | | $ | — | | | $ | 825,972 | | | $ | — | | | $ | — | |
Kentucky Tax-Free Income Series | | | 31,348,902 | | | | — | | | | 258,021 | | | | 32,463,029 | | | | — | | | | 402,816 | |
Kentucky Tax-Free
Short-to-Medium Series | | | 1,645,818 | | | | — | | | | — | | | | 1,726,545 | | | | — | | | | — | |
Mississippi Tax-Free Income Series | | | 331,306 | | | | — | | | | 2,937 | | | | 337,157 | | | | — | | | | — | |
North Carolina Tax-Free Income Series | | | 3,858,780 | | | | — | | | | — | | | | 3,362,896 | | | | — | | | | — | |
North Carolina Tax-Free
Short-to-Medium Series | | | 372,463 | | | | — | | | | — | | | | 427,514 | | | | — | | | | — | |
Tennessee Tax-Free Income Series | | | 3,322,990 | | | | — | | | | — | | | | 3,376,320 | | | | — | | | | — | |
Tennessee Tax-Free
Short-to-Medium Series | | | 166,771 | | | | — | | | | — | | | | 178,683 | | | | — | | | | — | |
Intermediate Government Bond Series | | | — | | | | 445,511 | | | | — | | | | — | | | | 535,178 | | | | — | |
Taxable Municipal Bond Series | | | — | | | | 545,161 | | | | — | | | | — | | | | 603,910 | | | | — | |
At June 30, 2016, the Funds’ components of distributable earnings (accumulated losses) on a tax basis were as follows:
| | | | | | | | | | | | | | | | |
| | | Undistributed
Ordinary
Income | | | Undistributed
Tax Exempt
Income | | | Undistributed Net
Long-term
Capital Gain | | | Net Unrealized
Appreciation on
Investments | |
Alabama Tax-Free Income | | $ | — | | | $ | 106,544 | | | $ | — | | | $ | 2,029,504 | |
Kentucky Tax-Free Income | | | — | | | | 3,225,289 | | | | 174,329 | | | | 78,083,513 | |
Kentucky Tax-Free Short-to-Medium | | | — | | | | 63,402 | | | | — | | | | 3,210,368 | |
Mississippi Tax-Free Income | | | — | | | | 52,695 | | | | 4,364 | | | | 933,169 | |
North Carolina Tax-Free Income | | | — | | | | 320,904 | | | | — | | | | 10,032,443 | |
North Carolina Tax-Free Short-to-Medium | | | — | | | | 5,984 | | | | — | | | | 729,145 | |
Tennessee Tax-Free Income | | | — | | | | 251,984 | | | | — | | | | 8,491,573 | |
Tennessee Tax-Free Short-to-Medium | | | — | | | | 2,578 | | | | — | | | | 394,342 | |
Intermediate Government Bond | | | 7,449 | | | | — | | | | — | | | | 1,591,527 | |
Taxable Municipal Bond Series | | | 12,944 | | | | — | | | | 39,266 | | | | 1,595,716 | |
59
DUPREE MUTUAL FUNDS
NOTES TO FINANCIAL STATEMENTS
June 30, 2016
| 6. | | Federal Income Taxes, continued |
| | | | | | | | | | | | |
| | | Accumulated
Capital and
Other Losses | | | Other
Temporary
Differences | | | Total
Accumulated Earnings | |
Alabama Tax-Free Income | | $ | (36,317 | ) | | $ | (106,544 | ) | | $ | 1,993,187 | |
Kentucky Tax-Free Income | | | | | | | (3,225,289 | ) | | | 78,257,842 | |
Kentucky Tax-Free Short-to-Medium | | | (226,346 | ) | | | (63,402 | ) | | | 2,984,022 | |
Mississippi Tax-Free Income | | | — | | | | (52,759 | ) | | | 937,469 | |
North Carolina Tax-Free Income | | | (564,541 | ) | | | (320,904 | ) | | | 9,467,901 | |
North Carolina Tax-Free Short-to-Medium | | | (1,580 | ) | | | (5,984 | ) | | | 727,565 | |
Tennessee Tax-Free Income | | | (585,801 | ) | | | (251,984 | ) | | | 7,905,772 | |
Tennessee Tax-Free Short-to-Medium | | | (227,704 | ) | | | (2,578 | ) | | | 166,638 | |
Intermediate Government Bond | | | (190,884 | ) | | | (7,449 | ) | | | 1,400,643 | |
Taxable Municipal Bond Series | | | — | | | | (12,944 | ) | | | 1,634,982 | |
| 7. | | Contingencies and Commitments |
The Funds indemnify the Trust’s officers and Trustees for certain liabilities that might arise from their performance of their duties to the Funds. Additionally, in the normal course of business, the Funds enter into contracts that contain a variety of representations and warranties and which may provide for indemnification. The Funds’ maximum exposure under these arrangements is unknown, as this would involve predicting future claims that may be made against the Funds, if any. However, based on experience, the Funds believe the risk of loss is remote.
| 8. | | Line of Credit Agreement and Custodian Agreement |
Under the terms of an agreement with the Funds’ custodian, principal amounts up to 5% of a Fund’s net assets are available on a committed line of credit. The principal amounts borrowed are due on demand. The agreement expires on August 31, 2016, but may be renewed annually. Interest is payable based on the published prime rate of the bank. Securities with a minimum value of three times the loan proceeds will be assigned as collateral until the balance of the note and unpaid interest is paid in full and terminated.
At June 30, 2016, the Funds had an aggregate unused line of credit amount of $25,000,000. During the year ended June 30, 2016, the average interest rate on borrowings was 3.37% and the daily weighted average borrowings for each Fund with borrowings were as follows:
| | | | |
| | | Weighted
average
borrowings | |
Alabama Tax-Free Income Series | | $ | 3,527 | |
Kentucky Tax Free Income Series | | | 57,637 | |
Kentucky Tax-Free Short-to-Medium Series | | | 34,243 | |
Mississippi Tax-Free Income Series | | | 571 | |
North Carolina Tax-Free Income Series | | | 1,309 | |
North Carolina Tax-Free Short-to-Medium Series | | | 5,505 | |
Tennessee Tax-Free Income Series | | | 36,145 | |
Intermediate Government Bond Series | | | 1,705 | |
The Tennessee Tax-Free Short-to-Medium Series and the Taxable Municipal Bond Series did not draw on the line of credit during the fiscal year.
The Funds have a contractual agreement with the custodian whereby the Funds compensate the custodian for custodial services incurred exceeding the credits realized as a result of uninvested cash balances. Credits realized as a result of uninvested cash balances are used to reduce each Fund’s expenses. During the year, these credits reduced each of the Fund’s expenses by the amount shown on the Statement of Operations as “Custodian expense reduction.”
60
Report of Independent Registered Public Accounting Firm
The Board of Trustees and Shareholders
Dupree Mutual Funds
We have audited the accompanying statements of assets and liabilities, including the schedules of portfolio investments, of Dupree Mutual Funds (comprising the Alabama Tax-Free Income Series, Kentucky Tax-Free Income Series, Kentucky Tax-Free Short-to-Medium Series, Mississippi Tax-Free Income Series, North Carolina Tax-Free Income Series, North Carolina Tax-Free Short-to-Medium Series, Tennessee Tax-Free Income Series, Tennessee Tax-Free Short-to-Medium Series, Intermediate Government Bond Series, and Taxable Municipal Bond Series) (collectively, the “Funds”) as of June 30, 2016, and the related statements of operations for the year then ended, the statements of changes in net assets for each of the two years in the period then ended, and the financial highlights for each of the five years in the period then ended. These financial statements and financial highlights are the responsibility of the Funds’ management. Our responsibility is to express an opinion on these financial statements and financial highlights based on our audits.
We conducted our audits in accordance with the standards of the Public Company Accounting Oversight Board (United States). Those standards require that we plan and perform the audit to obtain reasonable assurance about whether the financial statements and financial highlights are free of material misstatement. We were not engaged to perform an audit of the Funds’ internal control over financial reporting. Our audits included consideration of internal control over financial reporting as a basis for designing audit procedures that are appropriate in the circumstances, but not for the purpose of expressing an opinion on the effectiveness of the Funds’ internal control over financial reporting. Accordingly, we express no such opinion. An audit also includes examining, on a test basis, evidence supporting the amounts and disclosures in the financial statements and financial highlights, assessing the accounting principles used and significant estimates made by management, and evaluating the overall financial statement presentation. Our procedures included confirmation of securities owned as of June 30, 2016, by correspondence with the custodian and brokers. We believe that our audits provide a reasonable basis for our opinion.
In our opinion, the financial statements and financial highlights referred to above present fairly, in all material respects, the financial position of each of the respective funds constituting Dupree Mutual Funds at June 30, 2016, the results of their operations for the year then ended, the changes in their net assets for each of the two years in the period then ended, and the financial highlights for each of the five years in the period then ended in conformity with U.S. generally accepted accounting principles.

Cincinnati, Ohio
August 29, 2016
61
DUPREE MUTUAL FUNDS
OTHER UNAUDITED INFORMATION
June 30, 2016
Trustee and officer information
The following table sets forth information as to the Trustees and officers:
| | | | | | | | | | |
| Name, Address and Age | | Position(s) Held
with Funds | | Term of Office and
Length of Time Served | | Principal Occupation(s)
During Past 5 Years | | Number of
Portfolios in
Fund Complex
Overseen by
Trustee | | Other
Directorships
Held in publicly
traded companies |
| Officers: | | | | | | | | | | |
Thomas P. Dupree Sr. 125 South Mill Street Lexington, KY 40507 Age: 85 | | President | | Annual Term;
37 years of service | | Chairman of the Board of Dupree & Company, Inc. | | N/A | | N/A |
Gay M. Elste P.O. Box 28 Versailles, KY 40383 Age: 65 | | Compliance Officer | | Annual Term;
12 years of service | | Attorney at Law, Darsie & Elste. Anstruther Farm, beef cattle farming | | N/A | | N/A |
Allen E. Grimes, III 125 South Mill Street Lexington, KY 40507 Age: 53 | | Executive Vice President | | Annual Term;
11 years of service | | President, Dupree & Company, Inc. | | N/A | | N/A |
Michelle M. Dragoo 125 South Mill Street Lexington, KY 40507 Age: 55 | | Vice President, Secretary, Treasurer | | Annual Term;
18 years of service as Vice President, 16 years of service as Secretary, Treasurer | | Vice President, Secretary, Treasurer of Dupree & Company, Inc. | | N/A | | N/A |
Vincent H. Harrison 125 South Mill Street Lexington, KY 40507 Age: 45 | | Assistant Secretary, Assistant Treasurer | | Annual Term;
1 year of service | | Vice President Dupree & Company, Inc. | | N/A | | N/A |
| Trustees: | | | | | | | | | | |
William A. Combs, Jr. 111 Woodland Ave.,
#510
Lexington, KY 40502 Age: 76 | | Chairman, Trustee | | Annual Term; 15 years of service as Chairman;
27 years of service as Trustee | | Officer, Director: Mercedes-Benz of Cincinnati, Ohio; Mercedes-Benz of West Chester, Ohio (until 2016) | | 10 | | N/A |
James C. Baughman, Jr. 1999 Richmond Road Suite 2A Lexington, KY 40502 Age: 53 | | Trustee | | Annual Term 9 Years of Service | | President, CJN Advisors, LLC (2013 – present; business consulting); President, Blue Horse Entries, LLC (2014 to present; online business support services for equestrian events); Chief Executive Officer, Secretary, Treasurer, Director Office Suites Plus, Inc. (1998-2013; executive office space rental) | | 10 | | Advisory Board, Community Trust Bank |
C. Timothy Cone 201 West Short Street Lexington, KY 40507 Age: 72 | | Trustee Chair, Nominating Committee | | Annual Term; 14 years of service | | President, Gess, Mattingly & Atchison, P.S.C. (law firm) | | 10 | | N/A |
Ann Rosenstein Giles 343 Waller Avenue Suite 100 Lexington, KY 40504 Age: 64 | | Trustee Chair, Valuation Committee | | Annual Term; 5 years of service | | AJ Marketing Partners (self-employed marketing consultant) | | 10 | | N/A |
Marc A. Mathews 2104 Lakeside Drive Lexington, KY 40502 Age: 58 | | Trustee Chair, Audit Committee | | Annual Term; 5 years of service | | Vice President for Finance and Business, Transylvania University | | 10 | | Director, Bank of the Bluegrass |
As of June 30, 2016, none of the Trustees or members of their immediate family held any beneficial interest in the Trust’s Investment Adviser. Further, the Trust does not have an underwriter.
62
DUPREE MUTUAL FUNDS
OTHER UNAUDITED INFORMATION
June 30, 2016
Trustee and officer information, continued
The Statement of Additional Information (“SAI”) includes additional information about Trustees and officers and is available upon request without charge. Please call (800) 866-0614 to request the SAI.
Proxy Voting Information
A description of the policies and procedures that the Funds use to determine how to vote proxies relating to portfolio securities is available without charge upon request by calling (800) 866-0614, or on the Securities and Exchange Commission’s website at http://www.sec.gov. For the year ending June 30, 2016, the Funds exercised no proxy votes due to the fact that the debt instruments in which the Funds invest carry no voting rights.
Quarterly Portfolio Disclosure
The Trust files with the Securities and Exchange Commission a complete listing of portfolio holdings for each Fund as of the end of the first and third quarters of each fiscal year on Form N-Q. The complete listing (i) is available on the commission’s website and (ii) will be made available to shareholders upon request by calling (800) 866-0614. Information on the operation of the S.E.C.’s Public Reference Room may be obtained by calling 1-800-SEC-0300.
63
DUPREE MUTUAL FUNDS
OTHER UNAUDITED INFORMATION
June 30, 2016
Schedule of Shareholder Expenses
As a shareholder of the Funds, you incur transaction costs including investment advisory fees and other Fund expenses. The following examples are intended to help you understand your ongoing costs (in dollars) of investing in the Funds and to compare these costs with the ongoing costs of investing in other mutual funds.
Actual Expenses
The first line of the table below provides information about actual account values and actual expenses. You may use the information in this line, together with the amount you invested, to estimate the expenses that you paid over the period. Simply divide your account value by $1,000 (for example, an $8,600 account value divided by $1,000 = 8.6), then multiply the result by the number in the first line under the heading entitled “Expenses Paid During the Six Months Ended June 30, 2016” to estimate the expenses you paid on your account during this period.
Hypothetical Example for Comparison Purposes
The second line of the table below provides information about hypothetical account values and hypothetical expenses based on each Fund’s actual expense ratio and an assumed rate of return of 5% per year before expenses which is not the Funds’ actual ending account balance or expenses you paid for the period. You may use this information to compare the ongoing costs of investing in the Funds and other funds. To do so, compare this 5% hypothetical example with the 5% hypothetical examples that appear in the shareholder reports of other funds.
| | | | | | | | | | | | | | | | |
| | | Net Expense
Ratio
Annualized
June 30, 2016 | | | Beginning
Account Value
January 1, 2016* | | | Ending
Account Value
June 30, 2016** | | | Expenses Paid During
the Six Months
Ended June 30, 2016 | |
Alabama Tax-Free Income Series | | | | | | | | | | | | | | | | |
| Actual | | | .71 | % | | $ | 1,000.00 | | | $ | 1,032.87 | | | $ | 3.55 | |
| Hypothetical | | | .71 | | | | 1,000.00 | | | | 1,024.86 | | | | 3.54 | |
Kentucky Tax-Free Income Series | | | | | | | | | | | | | | | | |
| Actual | | | .55 | | | | 1,000.00 | | | | 1,031.08 | | | | 2.75 | |
| Hypothetical | | | .55 | | | | 1,000.00 | | | | 1,024.86 | | | | 2.74 | |
Kentucky Tax-Free Short-to-Medium Series | | | | | | | | | | | | | | | | |
| Actual | | | .72 | | | | 1,000.00 | | | | 1,019.29 | | | | 3.58 | |
| Hypothetical | | | .72 | | | | 1,000.00 | | | | 1,024.86 | | | | 3.59 | |
Mississippi Tax-Free Income Series | | | | | | | | | | | | | | | | |
| Actual | | | .70 | | | | 1,000.00 | | | | 1,037.25 | | | | 3.54 | |
| Hypothetical | | | .70 | | | | 1,000.00 | | | | 1,024.86 | | | | 3.52 | |
North Carolina Tax-Free Income Series | | | | | | | | | | | | | | | | |
| Actual | | | .70 | | | | 1,000.00 | | | | 1,036.20 | | | | 3.48 | |
| Hypothetical | | | .70 | | | | 1,000.00 | | | | 1,024.86 | | | | 3.46 | |
North Carolina Tax-Free Short-to-Medium Series | | | | | | | | | | | | | | | | |
| Actual | | | .83 | | | | 1,000.00 | | | | 1,012.88 | | | | 4.13 | |
| Hypothetical | | | .83 | | | | 1,000.00 | | | | 1,024.86 | | | | 4.16 | |
Tennessee Tax-Free Income Series | | | | | | | | | | | | | | | | |
| Actual | | | .71 | | | | 1,000.00 | | | | 1,031.83 | | | | 3.53 | |
| Hypothetical | | | .71 | | | | 1,000.00 | | | | 1,024.86 | | | | 3.52 | |
Tennessee Tax-Free Short-to-Medium Series | | | | | | | | | | | | | | | | |
| Actual | | | .86 | | | | 1,000.00 | | | | 1,016.31 | | | | 4.27 | |
| Hypothetical | | | .86 | | | | 1,000.00 | | | | 1,024.86 | | | | 4.29 | |
64
DUPREE MUTUAL FUNDS
OTHER UNAUDITED INFORMATION
June 30, 2016
Schedule of Shareholder Expenses , continued
| | | | | | | | | | | | | | | | |
| | | Net Expense
Ratio
Annualized
June 30, 2016 | | | Beginning
Account Value
January 1, 2016* | | | Ending
Account Value
June 30, 2016** | | | Expenses Paid During
the Six Months
Ended June 30, 2016 | |
Intermediate Government Bond Series | | | | | | | | | | | | | | | | |
| Actual | | | .53 | % | | $ | 1,000.00 | | | $ | 1,032.67 | | | $ | 2.68 | |
| Hypothetical | | | .53 | | | | 1,000.00 | | | | 1,024.86 | | | | 2.67 | |
Taxable Municipal Bond Series | | | | | | | | | | | | | | | | |
| Actual | | | .86 | | | | 1,000.00 | | | | 1,046.20 | | | | 4.35 | |
| Hypothetical | | | .86 | | | | 1,000.00 | | | | 1,024.86 | | | | 4.30 | |
| * | | The example is based on an investment of $1,000 invested at the beginning of the period. |
| ** | | Expenses are equal to the Fund’s annualized expense ratio, multiplied by the average account value over the period multiplied by [182/366] (to reflect one-half year period). |
65
Item 2. Code of Ethics: The registrant has adopted a code of ethics that applies to the principal executive officer, principal financial officer, principal accounting officer and persons performing similar functions. There have been no waivers from the Code of Ethics during the reporting period. The Registrant’s Code of Ethics is posted on its web site at http://www.dupree-funds.com. A copy of the Code of Ethics will be provided to any person free of charge upon request by telephoning or writing the Registrant.
Item 3. Audit Committee Financial Expert: The board does not have a financial expert serving on the audit committee. The registrant’s audit committee is comprised of all Trustees all of who are non-interested and independent. The audit committee believes that the collective experience and expertise of the members in assessing the performance of companies and the evaluation of financial statements is sufficient to assess the issues which can reasonably be expected to be raised by the Trust’s financial statements.
Item 4. Principal Accountant Fees and Services:
(a) Audit Fees. Fees for audit services provided to the Registrant were $141,900 and $133,800 for the fiscal years ended June 30, 2016 and 2015, respectively.
(b) Audit Related Fees. There were no fees for audit related-services that are reasonably related to the performance of the audit of the Registrant’s financial statements and are not reported under paragraph (a) of this item.
(c) Tax Fees for tax services billed by the Registrant’s Accountant to the Registrant, which fees consisted of income and excise tax compliance services, were $39,500 and $38,300 for the fiscal years ended June 30, 2016 and 2015 respectively. Fees for tax compliance services billed by the Registrant’s Accountant to the Registrant’s Transfer Agent, Dupree & Co., were $0 and $11,000 for the fiscal years ended June 30, 2016 and 2015 respectively.
(d) All Other Fees. Fees for all other services, which for fiscal year ended June 30, 2016 totaled $37,400 and consisted of examination of transfer agent ($10,300); Anti-Money Laundering Advisory services ($7,900); Internal control agreed upon procedures ($10,500) and Review of Semi-Annual report ($8,700) and for fiscal year ended June 30, 2015 totaled $36,300 and consisted of review of Transfer Agent ($10,000); Anti-Money Laundering services ($7,700); Internal control agreed upon procedures ($10,200); and Review of Semi-Annual report ($8,400).
(e)(1) (2) The Registrant’s Audit Committee must pre-approve all audit services and non-audit services that the principal accountant provides to the Registrant. The Audit committee must also pre-approve any engagement of the principal accountant to provide non-audit services to the Registrant’s investment adviser, or any affiliate of the adviser that provides ongoing services to the Registrant, if such non-audit services directly impact the Registrant’s operations and financial reporting.
(f) The Registrant has been advised by the Principal Accountant that no persons other than full time permanent employees have been engaged to audit the Registrant’s Financial Statements for the fiscal year ended June 30, 2016.
(g) The aggregate non audit fees billed by the Registrant’s Accountant to the Registrant’s Transfer Agent, Dupree & Co., were $0 and $11,000 for the fiscal years ended June 30, 2016 and 2015 respectively. The aggregate non audit fees billed by the Registrant’s Accountant to the Registrant were $76,900 and $74,600 for the fiscal years ended June 30, 2016 and 2015 respectively.
(h) Services were pre-approved by the Registrant’s Audit Committee.
Item 5. Not applicable.
Item 6. Included as part of item 1.
Item 7. Not applicable
Item 8. Not applicable.
Item 9. Not applicable
Item 10. There have been no changes to the procedures by which shareholders may recommend nominees to the board of trustees nominating committee.
Item 11. Controls and Procedures:
On August 24, 2016 the Registrant’s Executive Vice President and Treasurer assessed the disclosure controls and procedures to evaluate the effectiveness of the Registrant’s disclosure controls and procedures designed to ensure that information required to be disclosed by the investment company on Form N-CSR is recorded, processed, summarized and reported within the time periods specified in the Securities and Exchange Commission’s rules and forms. Disclosure controls and procedures include, without limitation, controls and procedures designed to ensure that information required to be disclosed by an investment company in the reports that it files on Form N-CSR is accumulated and communicated to the investment company’s management, including its principal executive and principal financial officers or persons performing similar functions, as appropriate to allow timely decisions regarding required disclosure.
Further, on August 24, 2016 the Registrant’s Executive Vice President and Treasurer assessed the internal control over financial reporting to provide reasonable assurance regarding the reliability of financial reporting and the preparation of financial statements for external purposes in accordance with generally accepted accounting principles and includes those policies and procedures that: (1) pertain to the maintenance of records that in reasonable detail accurately and fairly reflect the transactions and dispositions of the assets of the investment company; (2) provide reasonable assurance that transactions are recorded as necessary to permit preparation of financial statements in accordance with generally accepted accounting principles, and that receipts and expenditures of the investment company are being made only in accordance with authorizations of management and trustees of the investment company; and (3) provide reasonable assurance regarding prevention or timely detection of unauthorized acquisition, use, or disposition of the investment company’s assets that could have a material effect on the financial statements.
The Registrant’s Executive Vice President and Treasurer have deemed the disclosure controls and procedures and the internal control over financial reporting effective. There were no changes in the Registrant’s disclosure controls and procedures or internal control over financial reporting that occurred during the fourth quarter of the fiscal year that materially affected or is reasonably likely to materially affect the Registrant’s financial statements.
Item 12. Exhibits
(a)
(1) Not applicable
(2) Certifications
(3) Not applicable
SIGNATURES
Pursuant to the requirements of the Securities Exchange Act of 1934 and the Investment Company Act of 1940, the registrant has duly caused this report to be signed on its behalf by the undersigned thereunto duly authorized.
| | |
| Dupree Mutual Funds |
| |
| By: | | /s/ Michelle M. Dragoo |
| | Michelle M. Dragoo, |
| | Treasurer |
|
| Date: September 15, 2016 |
Pursuant to the requirements of the Securities Exchange Act of 1934 and the Investment Company Act of 1940, this report has been signed below by the following persons on behalf of the registrant and in the capacities and on the dates indicated.
| | |
| By: | | /s/ Allen E. Grimes, III |
| | Allen E. Grimes, III, |
| | Executive Vice President |
|
| Date: September 15, 2016 |
| |
| By: | | /s/ Michelle M. Dragoo |
| | Michelle M. Dragoo |
| | Vice President, Secretary, Treasurer |
|
| Date: September 15, 2016 |