UNITED STATES
SECURITIES AND EXCHANGE COMMISSION
Washington, D.C. 20549
Form N-CSR
CERTIFIED SHAREHOLDER REPORT OF REGISTERED
MANAGEMENT INVESTMENT COMPANIES
Investment Company Act File Number: 811-01545
Eaton Vance Special Investment Trust
(Exact Name of Registrant as Specified in Charter)
Two International Place, Boston, Massachusetts 02110
(Address of Principal Executive Offices)
Deidre E. Walsh
Two International Place, Boston, Massachusetts 02110
(Name and Address of Agent for Services)
(617) 482-8260
(Registrant’s Telephone Number)
December 31
Date of Fiscal Year End
December 31, 2021
Date of Reporting Period
Item 1. Reports to Stockholders

Eaton Vance
Balanced Fund
Annual Report
December 31, 2021

Commodity Futures Trading Commission Registration. The Commodity Futures Trading Commission (“CFTC”) has adopted regulations that subject registered investment companies and advisers to regulation by the CFTC if a fund invests more than a prescribed level of its assets in certain CFTC-regulated instruments (including futures, certain options and swap agreements) or markets itself as providing investment exposure to such instruments. The investment adviser has claimed an exclusion from the definition of “commodity pool operator” under the Commodity Exchange Act with respect to its management of the Fund. Accordingly, neither the Fund nor the adviser with respect to the operation of the Fund is subject to CFTC regulation. Because of its management of other strategies, the Fund’s adviser is registered with the CFTC as a commodity pool operator. The adviser is also registered as a commodity trading advisor.
Fund shares are not insured by the FDIC and are not deposits or other obligations of, or guaranteed by, any depository institution. Shares are subject to investment risks, including possible loss of principal invested.
This report must be preceded or accompanied by a current summary prospectus or prospectus. Before investing, investors should consider carefully the investment objective, risks, and charges and expenses of a mutual fund. This and other important information is contained in the summary prospectus and prospectus, which can be obtained from a financial intermediary. Prospective investors should read the prospectus carefully before investing. For further information, please call 1-800-262-1122.
Annual Report December 31, 2021
Eaton Vance
Balanced Fund
| 2 | ||||
| 4 | ||||
| 5 | ||||
| 6 | ||||
| 7 | ||||
| 8 | ||||
| 22 and 34 | ||||
| 23 | ||||
| 35 | ||||
| 38 | ||||
| 40 |
Eaton Vance
Balanced Fund
December 31, 2021
Management’s Discussion of Fund Performance1
Economic and Market Conditions
The 12-month period ended December 31, 2021, was notable for a U.S. equity rally that lasted most of the year. Broad-market indexes posted strong returns as investors cheered the reopening of businesses affected by the pandemic and the rollout of several highly effective COVID-19 vaccines. The virus, however, continued to have a firm grip on the U.S. economy. Global supply-chain disruptions combined with high demand led to higher year-over-year inflation than the U.S. had seen in decades.
Still, investor optimism about a recovering economy drove stock prices up during most of the period. A significant pullback occurred in September 2021 when virtually every major U.S. stock index reported negative returns. Unexpectedly weak job creation in August and the U.S. Federal Reserve’s (the Fed’s) announcement that it might soon begin tapering its monthly bond purchases combined to drive stock prices lower.
In the final quarter of 2021, however, stock prices came roaring back. Even news in November of a more transmissible COVID-19 variant — Omicron — caused only a temporary market retreat. The Fed’s actions to tamp down inflation were applauded by investors, with stocks gaining ground after the central bank announced that tapering would be accelerated and that three interest rate hikes were forecast for 2022. Just two trading days before year-end, the S&P 500® Index, a broad measure of the U.S. stock market, closed at its 70th all-time high for the period.
Performance of fixed-income asset classes, meanwhile, ebbed and flowed as the virus advanced and retreated. For the period as a whole, low interest rates across the fixed-income spectrum made equities in general a more attractive investment. The bond assets that fared best during the period were those that stood to benefit from a U.S. and global economic revival, while so-called “safe-haven” assets fared worst as investors appeared to become more comfortable taking on increased risk.
As a result, U.S. Treasurys were one of the worst-performing fixed-income asset classes during the period, with the Bloomberg U.S. Treasury Index returning -2.32%. The Bloomberg U.S. Aggregate Bond Index, a broad measure of the U.S. fixed-income market, was dragged down in part by its Treasury component and returned -1.54%. The Bloomberg U.S. Corporate Bond Index fared modestly better, but still declined 1.04%.
High yield bonds, in contrast, were a standout asset class during the period. Several industries prominent within the high yield space — airlines, restaurants, retail, and travel & leisure — were among the hardest-hit businesses early in the pandemic and the biggest beneficiaries of the subsequent economic recovery. Reflecting investors’ increasing confidence in the recovery, as well as their search for yield in a historically low-yield environment, the Bloomberg U.S. Corporate High Yield Index returned 5.28% during the period.
Fund Performance
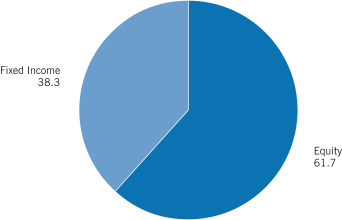
For the 12-month period ended December 31, 2021, Eaton Vance Balanced Fund (the Fund) returned 14.01% for Class A shares at net asset value (NAV), underperforming its primary benchmark, the S&P 500® Index (the Index), which returned 28.71%. At period-end, 62% of the Fund was invested in equities, while 38% was invested in fixed-income securities.
In the Fund’s equity allocation, stock selections in the information technology (IT), consumer discretionary, and energy sectors detracted from Fund performance versus the Index. In the IT sector, the Fund’s underweight position relative to the Index in NVIDIA Corp. (NVIDIA), a global semiconductor manufacturer, hurt returns relative to the Index. NVIDIA’s stock price more than doubled during the period, driven by long-term tailwinds — growth in the gaming, artificial intelligence, and autonomous vehicle industries — and by a sharp increase in gaming and data center demand during the pandemic.
In the consumer discretionary sector, the Fund’s overweight position in e-commerce giant Amazon.com, Inc. (Amazon) also detracted from performance relative to the Index. Amazon’s stock underperformed the Index as growth decelerated from the company’s peak levels earlier in the pandemic.
In contrast, the Stock Portfolio’s stock selections in the health care and communication services sectors contributed to Fund performance versus the Index. In the health care sector, the Fund’s overweight position in health insurer Anthem, Inc. (Anthem) contributed to performance versus the Index. Anthem’s position as the exclusive Blue Cross Blue Shield licensee in numerous states, as well as its acquisition of a top-tier Medicare/Medicaid insurer, helped the company deliver strong earnings growth and stock performance during the period. Higher membership figures and a premium rate increase boosted Anthem’s earnings as well.
In the communication services sector, the Fund’s overweight position in Alphabet, Inc. (Alphabet), parent company of search engine Google, performed strongly as positive e-commerce trends drove increased demand for search engine advertising and engagement. In addition, growth in viewership and ad sales on video sharing platform YouTube, an Alphabet subsidiary, exceeded analyst expectations during the period and provided an additional tailwind for Alphabet’s stock price.
See Endnotes and Additional Disclosures in this report.
Past performance is no guarantee of future results. Returns are historical and are calculated by determining the percentage change in net asset value (NAV) or offering price (as applicable) with all distributions reinvested. Investment return and principal value will fluctuate so that shares, when redeemed, may be worth more or less than their original cost. Performance for periods less than or equal to one year is cumulative. Performance is for the stated time period only; due to market volatility, current Fund performance may be lower or higher than the quoted return. For performance as of the most recent month-end, please refer to eatonvance.com.
| 2 |
Eaton Vance
Balanced Fund
December 31, 2021
Management’s Discussion of Fund Performance1 — continued
Within the Fund’s fixed-income allocation, security selection and sector allocation helped returns relative to the Fund’s secondary benchmark, the Bloomberg U.S. Aggregate Bond Index (the Secondary Index). Security selections in commercial mortgage-backed securities, asset-backed securities, and investment-grade corporate bonds contributed to performance relative to the Secondary Index. The Fund’s out-of-Secondary-Index allocations to Treasury Inflation-Protected Securities and high yield corporate bonds also aided relative returns. An underweight position in U.S. Treasurys — one of the worst-performing fixed-income asset classes during the period — positively impacted returns relative to the Secondary Index as well.
In contrast, the Core Bond Portfolio’s fixed-income allocation yield-curve positioning — which was shorter on average than that of the Secondary Index — detracted from performance relative to the Secondary Index as short-term interest rates generally rose while long-term rates generally fell during the period.
See Endnotes and Additional Disclosures in this report.
Past performance is no guarantee of future results. Returns are historical and are calculated by determining the percentage change in net asset value (NAV) or offering price (as applicable) with all distributions reinvested. Investment return and principal value will fluctuate so that shares, when redeemed, may be worth more or less than their original cost. Performance for periods less than or equal to one year is cumulative. Performance is for the stated time period only; due to market volatility, current Fund performance may be lower or higher than the quoted return. For performance as of the most recent month-end, please refer to eatonvance.com.
| 3 |
Eaton Vance
Balanced Fund
December 31, 2021
Portfolio Manager(s) Charles B. Gaffney, Vishal Khanduja, CFA and Brian S. Ellis, CFA
| % Average Annual Total Returns | Class Inception Date | Performance Inception Date | One Year | Five Years | Ten Years | |||||||||||||||
Class A at NAV | 04/01/1932 | 04/01/1932 | 14.01 | % | 12.03 | % | 10.84 | % | ||||||||||||
Class A with 5.75% Maximum Sales Charge | — | — | 7.42 | 10.71 | 10.19 | |||||||||||||||
Class C at NAV | 11/02/1993 | 04/01/1932 | 13.21 | 11.19 | 10.19 | |||||||||||||||
Class C with 1% Maximum Sales Charge | — | — | 12.21 | 11.19 | 10.19 | |||||||||||||||
Class I at NAV | 09/28/2012 | 04/01/1932 | 14.28 | 12.30 | 11.09 | |||||||||||||||
Class R at NAV | 05/02/2016 | 04/01/1932 | 13.71 | 11.74 | 10.69 | |||||||||||||||
Class R6 at NAV | 05/02/2016 | 04/01/1932 | 14.42 | 12.35 | 11.13 | |||||||||||||||
| ||||||||||||||||||||
S&P 500® Index | — | — | 28.71 | % | 18.46 | % | 16.54 | % | ||||||||||||
Bloomberg U.S. Aggregate Bond Index | — | — | –1.54 | 3.57 | 2.90 | |||||||||||||||
Blended Index | — | — | 15.86 | 12.61 | 11.13 | |||||||||||||||
| % Total Annual Operating Expense Ratios4 | Class A | Class C | Class I | Class R | Class R6 | |||||||||||||||
| 0.96 | % | 1.71 | % | 0.71 | % | 1.21 | % | 0.67 | % | |||||||||||
Growth of $10,000
This graph shows the change in value of a hypothetical investment of $10,000 in Class A of the Fund for the period indicated. For comparison, the same investment is shown in the indicated index.
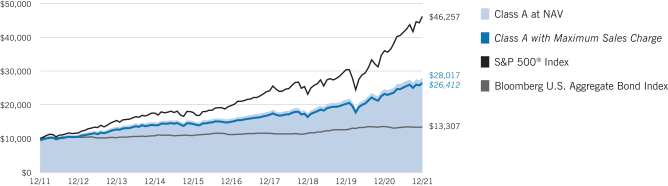
| Growth of Investment3 | Amount Invested | Period Beginning | At NAV | With Maximum Sales Charge | ||||||||||||
Class C | $10,000 | 12/31/2011 | $26,412 | N.A. | ||||||||||||
Class I | $250,000 | 12/31/2011 | $716,389 | N.A. | ||||||||||||
Class R | $10,000 | 12/31/2011 | $27,626 | N.A. | ||||||||||||
Class R6 | $1,000,000 | 12/31/2011 | $2,876,231 | N.A. | ||||||||||||
See Endnotes and Additional Disclosures in this report.
Past performance is no guarantee of future results. Returns are historical and are calculated by determining the percentage change in net asset value (NAV) or offering price (as applicable) with all distributions reinvested. Investment return and principal value will fluctuate so that shares, when redeemed, may be worth more or less than their original cost. Performance for periods less than or equal to one year is cumulative. Performance is for the stated time period only; due to market volatility, current Fund performance may be lower or higher than the quoted return. For performance as of the most recent month-end, please refer to eatonvance.com.
| 4 |
Eaton Vance
Balanced Fund
December 31, 2021
Asset Allocation (% of total investments)
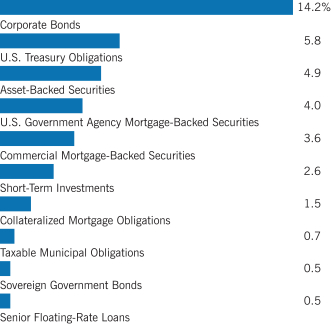
Fixed Income Allocation (% of total investments)
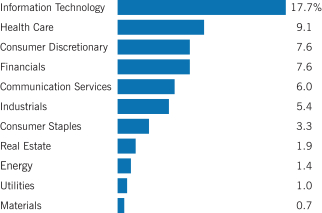
Equity Investments Sector Allocation (% of total investments)
See Endnotes and Additional Disclosures in this report.
| 5 |
Eaton Vance
Balanced Fund
December 31, 2021
Endnotes and Additional Disclosures
| 1 | The views expressed in this report are those of the portfolio manager(s) and are current only through the date stated at the top of this page. These views are subject to change at any time based upon market or other conditions, and Eaton Vance and the Fund(s) disclaim any responsibility to update such views. These views may not be relied upon as investment advice and, because investment decisions are based on many factors, may not be relied upon as an indication of trading intent on behalf of any Eaton Vance fund. This commentary may contain statements that are not historical facts, referred to as “forward-looking statements.” The Fund’s actual future results may differ significantly from those stated in any forward-looking statement, depending on factors such as changes in securities or financial markets or general economic conditions, the volume of sales and purchases of Fund shares, the continuation of investment advisory, administrative and service contracts, and other risks discussed from time to time in the Fund’s filings with the Securities and Exchange Commission. |
| 2 | S&P 500® Index is an unmanaged index of large-cap stocks commonly used as a measure of U.S. stock market performance. S&P Dow Jones Indices are a product of S&P Dow Jones Indices LLC (“S&P DJI”) and have been licensed for use. S&P® and S&P 500® are registered trademarks of S&P DJI; Dow Jones® is a registered trademark of Dow Jones Trademark Holdings LLC (“Dow Jones”); S&P DJI, Dow Jones and their respective affiliates do not sponsor, endorse, sell or promote the Fund, will not have any liability with respect thereto and do not have any liability for any errors, omissions, or interruptions of the S&P Dow Jones Indices. Bloomberg U.S. Aggregate Bond Index is an unmanaged index of domestic investment-grade bonds, including corporate, government and mortgage-backed securities. The Blended Index consists of 60% S&P 500® Index and 40% Bloomberg U.S. Aggregate Bond Index, rebalanced monthly. Unless otherwise stated, index returns do not reflect the effect of any applicable sales charges, commissions, expenses, taxes or leverage, as applicable. It is not possible to invest directly in an index. |
| 3 | Total Returns at NAV do not include applicable sales charges. If sales charges were deducted, the returns would be lower. Total Returns shown with maximum sales charge reflect the stated maximum sales charge. Unless otherwise stated, performance does not reflect the deduction of taxes on Fund distributions or redemptions of Fund shares. |
Effective November 5, 2020, Class C shares automatically convert to Class A shares eight years after purchase. The average annual total returns listed for Class C reflect conversion to Class A shares after eight years. Prior to November 5, 2020, Class C shares automatically converted to Class A shares ten years after purchase.
Performance prior to the inception date of a class may be linked to the performance of an older class of the Fund. This linked performance is adjusted for any applicable sales charge, but is not adjusted for class expense differences. If adjusted for such differences, the performance would be different. The performance of Class I and Class R is linked to Class A and the performance of Class R6 is linked to Class I. Performance presented in the Financial Highlights included in the financial statements is not linked.
| 4 | Source: Fund prospectus. The expense ratios for the current reporting period can be found in the Financial Highlights section of this report. |
| 5 | Fund invests in one or more affiliated investment companies (Portfolios). References to investments are to the aggregate holdings of the Fund, including its pro rata share of each Portfolio in which it invests. |
Fund profile subject to change due to active management.
Additional Information
The Bloomberg U.S. Treasury Index measures the performance of U.S. Treasuries with a maturity of one year or more. Bloomberg U.S. Corporate Bond Index measures the performance of investment-grade U.S. corporate securities with a maturity of one year or more. Bloomberg U.S. Corporate High Yield Index measures USD-denominated, non-investment grade corporate securities.
Yield curve is a graphical representation of the yields offered by bonds of various maturities. The yield curve flattens when long-term interest rates fall and/or short-term interest rates increase, and the yield curve steepens when long-term interest rates increase and/or short-term interest rates fall.
| 6 |
Eaton Vance
Balanced Fund
December 31, 2021
Example: As a Fund shareholder, you incur two types of costs: (1) transaction costs, including sales charges (loads) on purchases and redemption fees (if applicable); and (2) ongoing costs, including management fees; distribution and/or service fees; and other Fund expenses. This Example is intended to help you understand your ongoing costs (in dollars) of Fund investing and to compare these costs with the ongoing costs of investing in other mutual funds. The Example is based on an investment of $1,000 invested at the beginning of the period and held for the entire period (July 1, 2021 – December 31, 2021).
Actual Expenses: The first section of the table below provides information about actual account values and actual expenses. You may use the information in this section, together with the amount you invested, to estimate the expenses that you paid over the period. Simply divide your account value by $1,000 (for example, an $8,600 account value divided by $1,000 = 8.6), then multiply the result by the number in the first section under the heading entitled “Expenses Paid During Period” to estimate the expenses you paid on your account during this period.
Hypothetical Example for Comparison Purposes: The second section of the table below provides information about hypothetical account values and hypothetical expenses based on the actual Fund expense ratio and an assumed rate of return of 5% per year (before expenses), which is not the actual Fund return. The hypothetical account values and expenses may not be used to estimate the actual ending account balance or expenses you paid for the period. You may use this information to compare the ongoing costs of investing in your Fund and other funds. To do so, compare this 5% hypothetical example with the 5% hypothetical examples that appear in the shareholder reports of the other funds.
Please note that the expenses shown in the table are meant to highlight your ongoing costs only and do not reflect any transactional costs, such as sales charges (loads) or redemption fees (if applicable). Therefore, the second section of the table is useful in comparing ongoing costs only, and will not help you determine the relative total costs of owning different funds. In addition, if these transactional costs were included, your costs would be higher.
| Beginning Account Value (7/1/21) | Ending Account Value (12/31/21) | Expenses Paid During Period* (7/1/21 – 12/31/21) | Annualized Expense Ratio | |||||||||||||
Actual |
| |||||||||||||||
Class A | $ | 1,000.00 | $ | 1,052.10 | $ | 4.91 | 0.95 | % | ||||||||
Class C | $ | 1,000.00 | $ | 1,048.10 | $ | 8.78 | 1.70 | % | ||||||||
Class I | $ | 1,000.00 | $ | 1,052.40 | $ | 3.62 | 0.70 | % | ||||||||
Class R | $ | 1,000.00 | $ | 1,050.20 | $ | 6.20 | 1.20 | % | ||||||||
Class R6 | $ | 1,000.00 | $ | 1,053.60 | $ | 3.42 | 0.66 | % | ||||||||
Hypothetical |
| |||||||||||||||
(5% return per year before expenses) |
| |||||||||||||||
Class A | $ | 1,000.00 | $ | 1,020.42 | $ | 4.84 | 0.95 | % | ||||||||
Class C | $ | 1,000.00 | $ | 1,016.64 | $ | 8.64 | 1.70 | % | ||||||||
Class I | $ | 1,000.00 | $ | 1,021.68 | $ | 3.57 | 0.70 | % | ||||||||
Class R | $ | 1,000.00 | $ | 1,019.16 | $ | 6.11 | 1.20 | % | ||||||||
Class R6 | $ | 1,000.00 | $ | 1,021.88 | $ | 3.36 | 0.66 | % | ||||||||
| * | Expenses are equal to the Fund’s annualized expense ratio for the indicated Class, multiplied by the average account value over the period, multiplied by 184/365 (to reflect the one-half year period). The Example assumes that the $1,000 was invested at the net asset value per share determined at the close of business on June 30, 2021. The Example reflects the expenses of both the Fund and the Portfolios. |
| 7 |
Eaton Vance
Balanced Fund
December 31, 2021
Statement of Assets and Liabilities
| Assets | December 31, 2021 | |||
Investment in Core Bond Portfolio, at value (identified cost, $432,555,258) | $ | 433,947,119 | ||
Investment in Stock Portfolio, at value (identified cost, $497,717,440) | 758,491,010 | |||
Receivable for Fund shares sold | 2,402,188 | |||
Total assets | $ | 1,194,840,317 | ||
| Liabilities | ||||
Payable for Fund shares redeemed | $ | 56,675,716 | ||
Payable to affiliates: | ||||
Administration fee | 39,897 | |||
Distribution and service fees | 316,496 | |||
Trustees’ fees | 125 | |||
Accrued expenses | 196,847 | |||
Total liabilities | $ | 57,229,081 | ||
Net Assets | $ | 1,137,611,236 | ||
| Sources of Net Assets |
| |||
Paid-in capital | $ | 823,964,360 | ||
Distributable earnings | 313,646,876 | |||
Net Assets | $ | 1,137,611,236 | ||
| Class A Shares | ||||
Net Assets | $ | 448,683,591 | ||
Shares Outstanding | 39,021,908 | |||
Net Asset Value and Redemption Price Per Share | ||||
(net assets ÷ shares of beneficial interest outstanding) | $ | 11.50 | ||
Maximum Offering Price Per Share | ||||
(100 ÷ 94.25 of net asset value per share) | $ | 12.20 | ||
| Class C Shares |
| |||
Net Assets | $ | 258,309,117 | ||
Shares Outstanding | 22,361,687 | |||
Net Asset Value and Offering Price Per Share* | ||||
(net assets ÷ shares of beneficial interest outstanding) | $ | 11.55 | ||
| Class I Shares |
| |||
Net Assets | $ | 409,900,247 | ||
Shares Outstanding | 35,629,016 | |||
Net Asset Value, Offering Price and Redemption Price Per Share | ||||
(net assets ÷ shares of beneficial interest outstanding) | $ | 11.50 | ||
| Class R Shares |
| |||
Net Assets | $ | 15,587,165 | ||
Shares Outstanding | 1,361,203 | |||
Net Asset Value, Offering Price and Redemption Price Per Share | ||||
(net assets ÷ shares of beneficial interest outstanding) | $ | 11.45 | ||
| Class R6 Shares |
| |||
Net Assets | $ | 5,131,116 | ||
Shares Outstanding | 445,908 | |||
Net Asset Value, Offering Price and Redemption Price Per Share | ||||
(net assets ÷ shares of beneficial interest outstanding) | $ | 11.51 | ||
On sales of $50,000 or more, the offering price of Class A shares is reduced.
| * | Redemption price per share is equal to the net asset value less any applicable contingent deferred sales charge. |
| 8 | See Notes to Financial Statements. |
Eaton Vance
Balanced Fund
December 31, 2021
Statement of Operations
| Investment Income | Year Ended December 31, 2021 | |||
Dividends allocated from Portfolios (net of foreign taxes, $135,634) | $ | 8,753,364 | ||
Interest allocated from Portfolios (net of foreign taxes, $498) | 10,435,143 | |||
Expenses allocated from Portfolios | (6,606,678 | ) | ||
Total investment income from Portfolios | $ | 12,581,829 | ||
| Expenses | ||||
Administration fee | $ | 456,879 | ||
Distribution and service fees | ||||
Class A | 1,057,109 | |||
Class C | 2,545,689 | |||
Class R | 59,010 | |||
Trustees’ fees and expenses | 500 | |||
Custodian fee | 62,010 | |||
Transfer and dividend disbursing agent fees | 640,840 | |||
Legal and accounting services | 55,914 | |||
Printing and postage | 51,111 | |||
Registration fees | 94,081 | |||
Miscellaneous | 19,265 | |||
Total expenses | $ | 5,042,408 | ||
Net investment income | $ | 7,539,421 | ||
| Realized and Unrealized Gain (Loss) from Portfolios | ||||
Net realized gain (loss) — | ||||
Investment transactions | $ | 112,811,530 | (1) | |
Financial futures contracts | 248,601 | |||
Foreign currency transactions | (10,190 | ) | ||
Net realized gain | $ | 113,049,941 | ||
Change in unrealized appreciation (depreciation) — | ||||
Investments | $ | 28,105,314 | ||
Financial futures contracts | (120,374 | ) | ||
Foreign currency | (6,619 | ) | ||
Net change in unrealized appreciation (depreciation) | $ | 27,978,321 | ||
Net realized and unrealized gain | $ | 141,028,262 | ||
Net increase in net assets from operations | $ | 148,567,683 | ||
| (1) | Includes $2,669,216 of net realized gains from redemptions in-kind. |
| 9 | See Notes to Financial Statements. |
Eaton Vance
Balanced Fund
December 31, 2021
Statements of Changes in Net Assets
| Year Ended December 31, | ||||||||
| Increase (Decrease) in Net Assets | 2021 | 2020 | ||||||
From operations — | ||||||||
Net investment income | $ | 7,539,421 | $ | 9,990,462 | ||||
Net realized gain | 113,049,941 | (1) | 27,126,195 | |||||
Net change in unrealized appreciation (depreciation) | 27,978,321 | 91,553,371 | ||||||
Net increase in net assets from operations | $ | 148,567,683 | $ | 128,670,028 | ||||
Distributions to shareholders — | ||||||||
Class A | $ | (34,488,656 | ) | $ | (10,456,739 | ) | ||
Class C | (18,132,108 | ) | (5,130,327 | ) | ||||
Class I | (32,432,173 | ) | (11,253,330 | ) | ||||
Class R | (1,117,168 | ) | (196,176 | ) | ||||
Class R6 | (5,018,451 | ) | (1,477,889 | ) | ||||
Total distributions to shareholders | $ | (91,188,556 | ) | $ | (28,514,461 | ) | ||
Transactions in shares of beneficial interest — | ||||||||
Proceeds from sale of shares | ||||||||
Class A | $ | 48,400,186 | $ | 47,620,940 | ||||
Class C | 32,200,851 | 43,428,512 | ||||||
Class I | 80,302,215 | 150,692,083 | ||||||
Class R | 7,932,531 | 4,816,779 | ||||||
Class R6 | 14,450,535 | 12,562,344 | ||||||
Net asset value of shares issued to shareholders in payment of distributions declared | ||||||||
Class A | 31,529,862 | 9,554,240 | ||||||
Class C | 17,713,688 | 4,944,091 | ||||||
Class I | 29,817,055 | 9,709,480 | ||||||
Class R | 1,117,168 | 196,176 | ||||||
Class R6 | 5,017,767 | 1,477,889 | ||||||
Cost of shares redeemed | ||||||||
Class A | (48,517,965 | ) | (66,273,917 | ) | ||||
Class C | (48,505,470 | ) | (49,282,812 | ) | ||||
Class I | (119,943,608 | ) | (116,788,976 | ) | ||||
Class R | (2,777,477 | ) | (2,754,390 | ) | ||||
Class R6 | (71,829,035 | ) | (6,706,016 | ) | ||||
Net asset value of shares converted | ||||||||
Class A | 4,679,426 | 10,809,311 | ||||||
Class C | (4,679,426 | ) | (10,809,311 | ) | ||||
Net increase (decrease) in net assets from Fund share transactions | $ | (23,091,697 | ) | $ | 43,196,423 | |||
Other capital — | ||||||||
Portfolio transaction fee contributed to Stock Portfolio | $ | (502,642 | ) | $ | (236,591 | ) | ||
Portfolio transaction fee allocated from Stock Portfolio | 494,318 | 236,978 | ||||||
Net increase (decrease) in net assets from other capital | $ | (8,324 | ) | $ | 387 | |||
Net increase in net assets | $ | 34,279,106 | $ | 143,352,377 | ||||
| Net Assets |
| |||||||
At beginning of year | $ | 1,103,332,130 | $ | 959,979,753 | ||||
At end of year | $ | 1,137,611,236 | $ | 1,103,332,130 | ||||
| (1) | Includes $2,669,216 of net realized gains from redemptions in-kind. |
| 10 | See Notes to Financial Statements. |
Eaton Vance
Balanced Fund
December 31, 2021
Financial Highlights
| Class A | ||||||||||||||||||||
| Year Ended December 31, | ||||||||||||||||||||
| 2021 | 2020 | 2019 | 2018 | 2017 | ||||||||||||||||
Net asset value — Beginning of year | $ | 10.930 | $ | 9.850 | $ | 8.280 | $ | 9.110 | $ | 8.410 | ||||||||||
| Income (Loss) From Operations | ||||||||||||||||||||
Net investment income(1) | $ | 0.085 | $ | 0.110 | $ | 0.125 | $ | 0.132 | $ | 0.124 | ||||||||||
Net realized and unrealized gain (loss) | 1.430 | 1.266 | 1.819 | (0.424 | ) | 1.003 | ||||||||||||||
Total income (loss) from operations | $ | 1.515 | $ | 1.376 | $ | 1.944 | $ | (0.292 | ) | $ | 1.127 | |||||||||
| Less Distributions | ||||||||||||||||||||
From net investment income | $ | (0.127 | ) | $ | (0.118 | ) | $ | (0.127 | ) | $ | (0.146 | ) | $ | (0.139 | ) | |||||
From net realized gain | (0.818 | ) | (0.178 | ) | (0.247 | ) | (0.392 | ) | (0.288 | ) | ||||||||||
Total distributions | $ | (0.945 | ) | $ | (0.296 | ) | $ | (0.374 | ) | $ | (0.538 | ) | $ | (0.427 | ) | |||||
Portfolio transaction fee, net(1) | $ | (0.000 | )(2) | $ | 0.000 | (2) | $ | (0.000 | )(2) | $ | (0.000 | )(2) | $ | 0.000 | (2) | |||||
Net asset value — End of year | $ | 11.500 | $ | 10.930 | $ | 9.850 | $ | 8.280 | $ | 9.110 | ||||||||||
Total Return(3) | 14.01 | % | 14.20 | %(4) | 23.63 | % | (3.43 | )%(4) | 13.53 | %(4) | ||||||||||
| Ratios/Supplemental Data | ||||||||||||||||||||
Net assets, end of year (000’s omitted) | $ | 448,684 | $ | 391,745 | $ | 353,169 | $ | 294,742 | $ | 333,860 | ||||||||||
Ratios (as a percentage of average daily net assets):(5) | ||||||||||||||||||||
Expenses | 0.95 | % | 0.96 | %(4) | 0.98 | % | 0.98 | %(4) | 0.98 | %(4) | ||||||||||
Net investment income | 0.73 | % | 1.10 | % | 1.34 | % | 1.45 | % | 1.41 | % | ||||||||||
Portfolio Turnover of the Fund(6) | 7 | % | 11 | % | 12 | % | 7 | % | 4 | % | ||||||||||
| (1) | Computed using average shares outstanding. |
| (2) | Amount is less than $0.0005 or $(0.0005), as applicable. |
| (3) | Returns are historical and are calculated by determining the percentage change in net asset value with all distributions reinvested and do not reflect the effect of sales charges. |
| (4) | The administrator of the Fund reimbursed certain operating expenses (equal to less than 0.005%, 0.03% and 0.01% of average daily net assets for the years ended December 31, 2020, 2018 and 2017, respectively). Absent this reimbursement, total return would be lower. |
| (5) | Includes the Fund’s share of the Portfolios’ allocated expenses. |
| (6) | Percentage is based on the Fund’s contributions to and withdrawals from the Portfolios and excludes the investment activity of the Portfolios. |
| 11 | See Notes to Financial Statements. |
Eaton Vance
Balanced Fund
December 31, 2021
Financial Highlights — continued
| Class C | ||||||||||||||||||||
| Year Ended December 31, | ||||||||||||||||||||
| 2021 | 2020 | 2019 | 2018 | 2017 | ||||||||||||||||
Net asset value — Beginning of year | $ | 10.970 | $ | 9.900 | $ | 8.310 | $ | 9.140 | $ | 8.440 | ||||||||||
| Income (Loss) From Operations | ||||||||||||||||||||
Net investment income (loss)(1) | $ | (0.002 | ) | $ | 0.036 | $ | 0.055 | $ | 0.064 | $ | 0.058 | |||||||||
Net realized and unrealized gain (loss) | 1.442 | 1.257 | 1.837 | (0.426 | ) | 1.001 | ||||||||||||||
Total income (loss) from operations | $ | 1.440 | $ | 1.293 | $ | 1.892 | $ | (0.362 | ) | $ | 1.059 | |||||||||
| Less Distributions | ||||||||||||||||||||
From net investment income | $ | (0.042 | ) | $ | (0.045 | ) | $ | (0.055 | ) | $ | (0.076 | ) | $ | (0.071 | ) | |||||
From net realized gain | (0.818 | ) | (0.178 | ) | (0.247 | ) | (0.392 | ) | (0.288 | ) | ||||||||||
Total distributions | $ | (0.860 | ) | $ | (0.223 | ) | $ | (0.302 | ) | $ | (0.468 | ) | $ | (0.359 | ) | |||||
Portfolio transaction fee, net(1) | $ | (0.000 | )(2) | $ | 0.000 | (2) | $ | (0.000 | )(2) | $ | (0.000 | )(2) | $ | 0.000 | (2) | |||||
Net asset value — End of year | $ | 11.550 | $ | 10.970 | $ | 9.900 | $ | 8.310 | $ | 9.140 | ||||||||||
Total Return(3) | 13.21 | % | 13.21 | %(4) | 22.71 | % | (4.03 | )%(4) | 12.63 | %(4) | ||||||||||
| Ratios/Supplemental Data | ||||||||||||||||||||
Net assets, end of year (000’s omitted) | $ | 258,309 | $ | 248,249 | $ | 236,215 | $ | 221,669 | $ | 258,844 | ||||||||||
Ratios (as a percentage of average daily net assets):(5) | ||||||||||||||||||||
Expenses | 1.70 | % | 1.71 | %(4) | 1.73 | % | 1.73 | %(4) | 1.73 | %(4) | ||||||||||
Net investment income (loss) | (0.02 | )% | 0.36 | % | 0.59 | % | 0.70 | % | 0.65 | % | ||||||||||
Portfolio Turnover of the Fund(6) | 7 | % | 11 | % | 12 | % | 7 | % | 4 | % | ||||||||||
| (1) | Computed using average shares outstanding. |
| (2) | Amount is less than $0.0005 or $(0.0005), as applicable. |
| (3) | Returns are historical and are calculated by determining the percentage change in net asset value with all distributions reinvested and do not reflect the effect of sales charges. |
| (4) | The administrator of the Fund reimbursed certain operating expenses (equal to less than 0.005%, 0.03% and 0.01% of average daily net assets for the years ended December 31, 2020, 2018 and 2017, respectively). Absent this reimbursement, total return would be lower. |
| (5) | Includes the Fund’s share of the Portfolios’ allocated expenses. |
| (6) | Percentage is based on the Fund’s contributions to and withdrawals from the Portfolios and excludes the investment activity of the Portfolios. |
| 12 | See Notes to Financial Statements. |
Eaton Vance
Balanced Fund
December 31, 2021
Financial Highlights — continued
| Class I | ||||||||||||||||||||
| Year Ended December 31, | ||||||||||||||||||||
| 2021 | 2020 | 2019 | 2018 | 2017 | ||||||||||||||||
Net asset value — Beginning of year | $ | 10.930 | $ | 9.860 | $ | 8.280 | $ | 9.110 | $ | 8.410 | ||||||||||
| Income (Loss) From Operations | ||||||||||||||||||||
Net investment income(1) | $ | 0.114 | $ | 0.134 | $ | 0.149 | $ | 0.156 | $ | 0.147 | ||||||||||
Net realized and unrealized gain (loss) | 1.430 | 1.257 | 1.830 | (0.425 | ) | 1.002 | ||||||||||||||
Total income (loss) from operations | $ | 1.544 | $ | 1.391 | $ | 1.979 | $ | (0.269 | ) | $ | 1.149 | |||||||||
| Less Distributions | ||||||||||||||||||||
From net investment income | $ | (0.156 | ) | $ | (0.143 | ) | $ | (0.152 | ) | $ | (0.169 | ) | $ | (0.161 | ) | |||||
From net realized gain | (0.818 | ) | (0.178 | ) | (0.247 | ) | (0.392 | ) | (0.288 | ) | ||||||||||
Total distributions | $ | (0.974 | ) | $ | (0.321 | ) | $ | (0.399 | ) | $ | (0.561 | ) | $ | (0.449 | ) | |||||
Portfolio transaction fee, net(1) | $ | (0.000 | )(2) | $ | 0.000 | (2) | $ | (0.000 | )(2) | $ | (0.000 | )(2) | $ | 0.000 | (2) | |||||
Net asset value — End of year | $ | 11.500 | $ | 10.930 | $ | 9.860 | $ | 8.280 | $ | 9.110 | ||||||||||
Total Return(3) | 14.28 | % | 14.36 | %(4) | 24.07 | % | (3.19 | )%(4) | 13.81 | %(4) | ||||||||||
| Ratios/Supplemental Data | ||||||||||||||||||||
Net assets, end of year (000’s omitted) | $ | 409,900 | $ | 399,991 | $ | 322,436 | $ | 208,740 | $ | 220,522 | ||||||||||
Ratios (as a percentage of average daily net assets):(5) | ||||||||||||||||||||
Expenses | 0.70 | % | 0.71 | %(4) | 0.73 | % | 0.73 | %(4) | 0.73 | %(4) | ||||||||||
Net investment income | 0.98 | % | 1.34 | % | 1.59 | % | 1.70 | % | 1.66 | % | ||||||||||
Portfolio Turnover of the Fund(6) | 7 | % | 11 | % | 12 | % | 7 | % | 4 | % | ||||||||||
| (1) | Computed using average shares outstanding. |
| (2) | Amount is less than $0.0005 or $(0.0005), as applicable. |
| (3) | Returns are historical and are calculated by determining the percentage change in net asset value with all distributions reinvested. |
| (4) | The administrator of the Fund reimbursed certain operating expenses (equal to less than 0.005%, 0.03% and 0.01% of average daily net assets for the years ended December 31, 2020, 2018 and 2017, respectively). Absent this reimbursement, total return would be lower. |
| (5) | Includes the Fund’s share of the Portfolios’ allocated expenses. |
| (6) | Percentage is based on the Fund’s contributions to and withdrawals from the Portfolios and excludes the investment activity of the Portfolios. |
| 13 | See Notes to Financial Statements. |
Eaton Vance
Balanced Fund
December 31, 2021
Financial Highlights — continued
| Class R | ||||||||||||||||||||
| Year Ended December 31, | ||||||||||||||||||||
| 2021 | 2020 | 2019 | 2018 | 2017 | ||||||||||||||||
Net asset value — Beginning of year | $ | 10.890 | $ | 9.820 | $ | 8.260 | $ | 9.090 | $ | 8.400 | ||||||||||
| Income (Loss) From Operations | ||||||||||||||||||||
Net investment income(1) | $ | 0.055 | $ | 0.083 | $ | 0.102 | $ | 0.115 | $ | 0.104 | ||||||||||
Net realized and unrealized gain (loss) | 1.425 | 1.261 | 1.812 | (0.423 | ) | 0.996 | ||||||||||||||
Total income (loss) from operations | $ | 1.480 | $ | 1.344 | $ | 1.914 | $ | (0.308 | ) | $ | 1.100 | |||||||||
| Less Distributions | ||||||||||||||||||||
From net investment income | $ | (0.102 | ) | $ | (0.096 | ) | $ | (0.107 | ) | $ | (0.130 | ) | $ | (0.122 | ) | |||||
From net realized gain | (0.818 | ) | (0.178 | ) | (0.247 | ) | (0.392 | ) | (0.288 | ) | ||||||||||
Total distributions | $ | (0.920 | ) | $ | (0.274 | ) | $ | (0.354 | ) | $ | (0.522 | ) | $ | (0.410 | ) | |||||
Portfolio transaction fee, net(1) | $ | (0.000 | )(2) | $ | 0.000 | (2) | $ | (0.000 | )(2) | $ | (0.000 | )(2) | $ | 0.000 | (2) | |||||
Net asset value — End of year | $ | 11.450 | $ | 10.890 | $ | 9.820 | $ | 8.260 | $ | 9.090 | ||||||||||
Total Return(3) | 13.71 | % | 13.89 | %(4) | 23.31 | % | (3.61 | )%(4) | 13.22 | %(4) | ||||||||||
| Ratios/Supplemental Data | ||||||||||||||||||||
Net assets, end of year (000’s omitted) | $ | 15,587 | $ | 8,958 | $ | 5,905 | $ | 2,514 | $ | 561 | ||||||||||
Ratios (as a percentage of average daily net assets):(5) | ||||||||||||||||||||
Expenses | 1.20 | % | 1.21 | %(4) | 1.23 | % | 1.23 | %(4) | 1.23 | %(4) | ||||||||||
Net investment income | 0.47 | % | 0.84 | % | 1.08 | % | 1.27 | % | 1.17 | % | ||||||||||
Portfolio Turnover of the Fund(6) | 7 | % | 11 | % | 12 | % | 7 | % | 4 | % | ||||||||||
| (1) | Computed using average shares outstanding. |
| (2) | Amount is less than $0.0005 or $(0.0005), as applicable. |
| (3) | Returns are historical and are calculated by determining the percentage change in net asset value with all distributions reinvested. |
| (4) | The administrator of the Fund reimbursed certain operating expenses (equal to less than 0.005%, 0.03% and 0.01% of average daily net assets for the years ended December 31, 2020, 2018 and 2017, respectively). Absent this reimbursement, total return would be lower. |
| (5) | Includes the Fund’s share of the Portfolios’ allocated expenses. |
| (6) | Percentage is based on the Fund’s contributions to and withdrawals from the Portfolios and excludes the investment activity of the Portfolios. |
| 14 | See Notes to Financial Statements. |
Eaton Vance
Balanced Fund
December 31, 2021
Financial Highlights — continued
| Class R6 | ||||||||||||||||||||
| Year Ended December 31, | ||||||||||||||||||||
| 2021 | 2020 | 2019 | 2018 | 2017 | ||||||||||||||||
Net asset value — Beginning of year | $ | 10.930 | $ | 9.860 | $ | 8.280 | $ | 9.110 | $ | 8.420 | ||||||||||
| Income (Loss) From Operations | ||||||||||||||||||||
Net investment income(1) | $ | 0.119 | $ | 0.139 | $ | 0.153 | $ | 0.160 | $ | 0.146 | ||||||||||
Net realized and unrealized gain (loss) | 1.440 | 1.256 | 1.829 | (0.423 | ) | 0.999 | ||||||||||||||
Total income (loss) from operations | $ | 1.559 | $ | 1.395 | $ | 1.982 | $ | (0.263 | ) | $ | 1.145 | |||||||||
| Less Distributions | ||||||||||||||||||||
From net investment income | $ | (0.161 | ) | $ | (0.147 | ) | $ | (0.155 | ) | $ | (0.175 | ) | $ | (0.167 | ) | |||||
From net realized gain | (0.818 | ) | (0.178 | ) | (0.247 | ) | (0.392 | ) | (0.288 | ) | ||||||||||
Total distributions | $ | (0.979 | ) | $ | (0.325 | ) | $ | (0.402 | ) | $ | (0.567 | ) | $ | (0.455 | ) | |||||
Portfolio transaction fee, net(1) | $ | (0.000 | )(2) | $ | 0.000 | (2) | $ | (0.000 | )(2) | $ | (0.000 | )(2) | $ | 0.000 | (2) | |||||
Net asset value — End of year | $ | 11.510 | $ | 10.930 | $ | 9.860 | $ | 8.280 | $ | 9.110 | ||||||||||
Total Return(3) | 14.42 | % | 14.41 | %(4) | 24.11 | % | (3.13 | )%(4) | 13.75 | %(4) | ||||||||||
| Ratios/Supplemental Data | ||||||||||||||||||||
Net assets, end of year (000’s omitted) | $ | 5,131 | $ | 54,388 | $ | 42,255 | $ | 28,215 | $ | 27,492 | ||||||||||
Ratios (as a percentage of average daily net assets):(5) | ||||||||||||||||||||
Expenses | 0.66 | % | 0.67 | %(4) | 0.68 | % | 0.69 | %(4) | 0.69 | %(4) | ||||||||||
Net investment income | 1.02 | % | 1.39 | % | 1.63 | % | 1.74 | % | 1.62 | % | ||||||||||
Portfolio Turnover of the Fund(6) | 7 | % | 11 | % | 12 | % | 7 | % | 4 | % | ||||||||||
| (1) | Computed using average shares outstanding. |
| (2) | Amount is less than $0.0005 or $(0.0005), as applicable. |
| (3) | Returns are historical and are calculated by determining the percentage change in net asset value with all distributions reinvested. |
| (4) | The administrator of the Fund reimbursed certain operating expenses (equal to less than 0.005%, 0.03% and 0.01% of average daily net assets for the years ended December 31, 2020, 2018 and 2017, respectively). Absent this reimbursement, total return would be lower. |
| (5) | Includes the Fund’s share of the Portfolios’ allocated expenses. |
| (6) | Percentage is based on the Fund’s contributions to and withdrawals from the Portfolios and excludes the investment activity of the Portfolios. |
| 15 | See Notes to Financial Statements. |
Eaton Vance
Balanced Fund
December 31, 2021
Notes to Financial Statements
1 Significant Accounting Policies
Eaton Vance Balanced Fund (the Fund) is a diversified series of Eaton Vance Special Investment Trust (the Trust). The Trust is a Massachusetts business trust registered under the Investment Company Act of 1940, as amended (the 1940 Act), as an open-end management investment company. The Fund offers five classes of shares. Class A shares are generally sold subject to a sales charge imposed at time of purchase. Class C shares are sold at net asset value and are generally subject to a contingent deferred sales charge (see Note 5). Effective January 25, 2019, Class C shares generally automatically convert to Class A shares ten years after their purchase and, effective November 5, 2020, automatically convert to Class A shares eight years after their purchase as described in the Fund’s prospectus. Class I, Class R and Class R6 shares are sold at net asset value and are not subject to a sales charge. Each class represents a pro-rata interest in the Fund, but votes separately on class-specific matters and (as noted below) is subject to different expenses. Realized and unrealized gains and losses and net investment income and losses, other than class-specific expenses, are allocated daily to each class of shares based on the relative net assets of each class to the total net assets of the Fund. Sub-accounting, recordkeeping and similar administrative fees payable to financial intermediaries, which are a component of transfer and dividend disbursing agent fees on the Statement of Operations, are not allocated to Class R6 shares. Each class of shares differs in its distribution plan and certain other class-specific expenses. The Fund’s investment objective is to provide current income and long-term growth of capital. The Fund currently pursues its objective by investing all of its investable assets in interests in two portfolios managed by Eaton Vance Management (EVM) or its affiliates (the Portfolios), which are Massachusetts business trusts. The value of the Fund’s investments in the Portfolios reflects the Fund’s proportionate interest in their net assets. The Fund’s proportionate interest in each of the Portfolio’s net assets at December 31, 2021 were as follows: Core Bond Portfolio (76.0%) and Stock Portfolio (87.1%). The performance of the Fund is directly affected by the performance of the Portfolios. The financial statements of Stock Portfolio, including the portfolio of investments, are included elsewhere in this report and should be read in conjunction with the Fund’s financial statements. A copy of Core Bond Portfolio’s financial statements is available by calling Eaton Vance at 1-800-262-1122 or in the EDGAR database on the Securities and Exchange Commission’s website at www.sec.gov.
The following is a summary of significant accounting policies of the Fund. The policies are in conformity with accounting principles generally accepted in the United States of America (U.S. GAAP). The Fund is an investment company and follows accounting and reporting guidance in the Financial Accounting Standards Board (FASB) Accounting Standards Codification Topic 946.
A Investment Valuation — Valuation of securities by Stock Portfolio is discussed in Note 1A of the Portfolio’s Notes to Financial Statements, which are included elsewhere in this report. Such policies are consistent with those of Core Bond Portfolio.
Additional valuation policies for Core Bond Portfolio (the Portfolio) are as follows:
Debt Obligations. Debt obligations are generally valued on the basis of valuations provided by third party pricing services, as derived from such services’ pricing models. Inputs to the models may include, but are not limited to, reported trades, executable bid and ask prices, broker/dealer quotations, prices or yields of securities with similar characteristics, interest rates, anticipated prepayments, benchmark curves or information pertaining to the issuer, as well as industry and economic events. The pricing services may use a matrix approach, which considers information regarding securities with similar characteristics to determine the valuation for a security. Short-term debt obligations purchased with a remaining maturity of sixty days or less for which a valuation from a third party pricing service is not readily available may be valued at amortized cost, which approximates fair value.
Preferred Securities. Preferred securities that are not listed or traded in the over-the-counter market are valued by a third party pricing service that uses various techniques that consider factors including, but not limited to, prices or yields of securities with similar characteristics, benchmark yields, broker/dealer quotes, quotes of underlying common stock, issuer spreads, as well as industry and economic events.
Senior Floating-Rate Loans. Interests in senior floating-rate loans (Senior Loans) for which reliable market quotations are readily available are valued generally at the average mean of bid and ask quotations obtained from a third party pricing service.
Derivatives. U.S. exchange-traded options are valued at the mean between the bid and ask prices at valuation time as reported by the Options Price Reporting Authority. Non-U.S. exchange-traded options and over-the-counter options are valued by a third party pricing service using techniques that consider factors including the value of the underlying instrument, the volatility of the underlying instrument and the period of time until option expiration.
Financial futures contracts are valued at the closing settlement price established by the board of trade or exchange on which they are traded.
B Income — The Fund’s net investment income or loss consists of the Fund’s pro-rata share of the net investment income or loss of the Portfolios, less all actual and accrued expenses of the Fund.
C Federal Taxes — The Fund’s policy is to comply with the provisions of the Internal Revenue Code applicable to regulated investment companies and to distribute to shareholders each year substantially all of its net investment income, and all or substantially all of its net realized capital gains. Accordingly, no provision for federal income or excise tax is necessary.
As of December 31, 2021, the Fund had no uncertain tax positions that would require financial statement recognition, de-recognition, or disclosure. The Fund files a U.S. federal income tax return annually after its fiscal year-end, which is subject to examination by the Internal Revenue Service for a period of three years from the date of filing.
D Expenses — The majority of expenses of the Trust are directly identifiable to an individual fund. Expenses which are not readily identifiable to a specific fund are allocated taking into consideration, among other things, the nature and type of expense and the relative size of the funds.
| 16 |
Eaton Vance
Balanced Fund
December 31, 2021
Notes to Financial Statements — continued
E Use of Estimates — The preparation of the financial statements in conformity with U.S. GAAP requires management to make estimates and assumptions that affect the reported amounts of assets and liabilities at the date of the financial statements and the reported amounts of income and expense during the reporting period. Actual results could differ from those estimates.
F Indemnifications — Under the Trust’s organizational documents, its officers and Trustees may be indemnified against certain liabilities and expenses arising out of the performance of their duties to the Fund. Under Massachusetts law, if certain conditions prevail, shareholders of a Massachusetts business trust (such as the Trust) could be deemed to have personal liability for the obligations of the Trust. However, the Trust’s Declaration of Trust contains an express disclaimer of liability on the part of Fund shareholders and the By-laws provide that the Trust shall assume, upon request by the shareholder, the defense on behalf of any Fund shareholders. Moreover, the By-laws also provide for indemnification out of Fund property of any shareholder held personally liable solely by reason of being or having been a shareholder for all loss or expense arising from such liability. Additionally, in the normal course of business, the Fund enters into agreements with service providers that may contain indemnification clauses. The Fund’s maximum exposure under these arrangements is unknown as this would involve future claims that may be made against the Fund that have not yet occurred.
G Other — Investment transactions are accounted for on a trade date basis.
2 Distributions to Shareholders and Income Tax Information
It is the present policy of the Fund to make quarterly distributions of all or substantially all of its net investment income and to distribute annually all or substantially all of its net realized capital gains. Distributions to shareholders are recorded on the ex-dividend date. Distributions are declared separately for each class of shares. Shareholders may reinvest income and capital gain distributions in additional shares of the same class of the Fund at the net asset value as of the ex-dividend date or, at the election of the shareholder, receive distributions in cash. Distributions to shareholders are determined in accordance with income tax regulations, which may differ from U.S. GAAP. As required by U.S. GAAP, only distributions in excess of tax basis earnings and profits are reported in the financial statements as a return of capital. Permanent differences between book and tax accounting relating to distributions are reclassified to paid-in capital. For tax purposes, distributions from short-term capital gains are considered to be from ordinary income.
The tax character of distributions declared for the years ended December 31, 2021 and December 31, 2020 was as follows:
| Year Ended December 31, | ||||||||
| 2021 | 2020 | |||||||
Ordinary income | $ | 18,106,165 | $ | 13,009,583 | ||||
Long-term capital gains | $ | 73,082,391 | $ | 15,504,878 | ||||
During the year ended December 31, 2021, distributable earnings was decreased by $7,055,263 and paid-in capital was increased by $7,055,263 due to the Fund’s use of equalization accounting. Tax equalization accounting allows the Fund to treat as a distribution that portion of redemption proceeds representing a redeeming shareholder’s portion of undistributed taxable income and net capital gains. These reclassifications had no effect on the net assets or net asset value per share of the Fund.
As of December 31, 2021, the components of distributable earnings (accumulated loss) on a tax basis were as follows:
Undistributed long-term capital gains | $ | 34,136,963 | ||
Net unrealized appreciation | 279,509,913 | |||
Distributable earnings | $ | 313,646,876 | ||
3 Investment Adviser Fee and Other Transactions with Affiliates
The investment adviser fee is earned by EVM as compensation for investment advisory services rendered to the Fund. On March 1, 2021, Morgan Stanley acquired Eaton Vance Corp. (the “Transaction”) and EVM became an indirect, wholly-owned subsidiary of Morgan Stanley. In connection with the Transaction, the Fund entered into a new investment advisory agreement (the “New Agreement”) with EVM, which took effect on March 1, 2021. Pursuant to the New Agreement (and the Fund’s investment advisory agreement with EVM in effect prior to March 1, 2021), the investment adviser fee is computed
| 17 |
Eaton Vance
Balanced Fund
December 31, 2021
Notes to Financial Statements — continued
at an annual rate based on the Fund’s average daily net assets that are not invested in other investment companies for which EVM or its affiliates serve as investment adviser and receive an advisory fee as follows and is payable monthly:
For equity securities: | ||||
| Average Daily Net Assets | Annual Fee Rate | |||
Up to $500 million | 0.600 | % | ||
$500 million but less than $1 billion | 0.575 | % | ||
$1 billion but less than $2.5 billion | 0.550 | % | ||
$2.5 billion but less than $5 billion | 0.530 | % | ||
$5 billion and over | 0.515 | % | ||
For income securities and cash: | ||||
| Average Daily Net Assets | Annual Fee Rate | |||
Less than $1 billion | 0.450 | % | ||
$1 billion up to $2 billion | 0.425 | % | ||
$2 billion up to $5 billion | 0.415 | % | ||
$5 billion and over | 0.405 | % | ||
For the year ended December 31, 2021, the Fund incurred no investment adviser fee on such assets. To the extent the Fund’s assets are invested in the Portfolios, the Fund is allocated its pro rata share of the Portfolios’ investment adviser fees. The Portfolios have engaged Boston Management and Research (BMR), an affiliate of EVM and, effective March 1, 2021, an indirect, wholly-owned subsidiary of Morgan Stanley, to render investment advisory services. See Note 2 of the Portfolios’ Notes to Financial Statements. For the year ended December 31, 2021, the Fund’s allocated portion of investment adviser fees paid by the Portfolios amounted to $6,159,556 or 0.54% of the Fund’s average daily net assets. The administration fee is earned by EVM as compensation for administrative services rendered to the Fund. The fee is computed at an annual rate of 0.04% of the Fund’s average daily net assets. For the year ended December 31, 2021, the administration fee amounted to $456,879.
EVM provides sub-transfer agency and related services to the Fund pursuant to a Sub-Transfer Agency Support Services Agreement. For the year ended December 31, 2021, EVM earned $89,640 from the Fund pursuant to such agreement, which is included in transfer and dividend disbursing agent fees on the Statement of Operations. The Fund was informed that Eaton Vance Distributors, Inc. (EVD), an affiliate of EVM, received $87,434 as its portion of the sales charge on sales of Class A shares for the year ended December 31, 2021. The Fund was informed that Morgan Stanley affiliated broker-dealers, which may be deemed to be affiliates of EVM and EVD, also received a portion of the sales charge on sales of Class A shares from March 1, 2021 through December 31, 2021 in the amount of $3,763. EVD also received distribution and service fees from Class A, Class C and Class R shares (see Note 4) and contingent deferred sales charges (see Note 5).
Trustees and officers of the Fund and the Portfolios who are members of EVM’s or BMR’s organizations receive remuneration for their services to the Fund out of the investment adviser fee. Certain officers and Trustees of the Fund and the Portfolios are officers of the above organizations.
4 Distribution Plans
The Fund has in effect a distribution plan for Class A shares (Class A Plan) pursuant to Rule 12b-1 under the 1940 Act. Pursuant to the Class A Plan, the Fund pays EVD a distribution and service fee of 0.25% per annum of its average daily net assets attributable to Class A shares for distribution services and facilities provided to the Fund by EVD, as well as for personal services and/or the maintenance of shareholder accounts. Distribution and service fees paid or accrued to EVD for the year ended December 31, 2021 amounted to $1,057,109 for Class A shares.
The Fund also has in effect distribution plans for Class C shares (Class C Plan) and Class R shares (Class R Plan) pursuant to Rule 12b-1 under the 1940 Act. Pursuant to the Class C Plan, the Fund pays EVD amounts equal to 0.75% per annum of its average daily net assets attributable to Class C shares for providing ongoing distribution services and facilities to the Fund. For the year ended December 31, 2021, the Fund paid or accrued to EVD $1,909,267 for Class C shares.
The Class R Plan requires the Fund to pay EVD an amount up to 0.50% per annum of its average daily net assets attributable to Class R shares for providing ongoing distribution services and facilities to the Fund. The Trustees of the Trust have currently limited Class R distribution payments to 0.25%
| 18 |
Eaton Vance
Balanced Fund
December 31, 2021
Notes to Financial Statements — continued
per annum of the average daily net assets attributable to Class R shares. For the year ended December 31, 2021, the Fund paid or accrued to EVD $29,505 for Class R shares.
Pursuant to the Class C and Class R Plans, the Fund also makes payments of service fees to EVD, financial intermediaries and other persons in amounts equal to 0.25% per annum of its average daily net assets attributable to that class. Service fees paid or accrued are for personal services and/or the maintenance of shareholder accounts. They are separate and distinct from the sales commissions and distribution fees payable to EVD. Service fees paid or accrued for the year ended December 31, 2021 amounted to $636,422 and $29,505 for Class C and Class R shares, respectively.
Distribution and service fees are subject to the limitations contained in the Financial Industry Regulatory Authority Rule 2341(d).
5 Contingent Deferred Sales Charges
A contingent deferred sales charge (CDSC) of 1% generally is imposed on redemptions of Class C shares made within 12 months of purchase. Class A shares may be subject to a 1% CDSC if redeemed within 18 months of purchase (depending on the circumstances of purchase). Generally, the CDSC is based upon the lower of the net asset value at date of redemption or date of purchase. No charge is levied on shares acquired by reinvestment of dividends or capital gain distributions. For the year ended December 31, 2021, the Fund was informed that EVD received approximately $5,000 and $9,000 of CDSCs paid by Class A and Class C shareholders, respectively.
6 Investment Transactions
For the year ended December 31, 2021, increases and decreases in the Fund’s investments in the Portfolios were as follows:
| Portfolio | Contributions | Withdrawals | ||||||
Core Bond Portfolio | $ | 57,504,492 | $ | 41,508,368 | ||||
Stock Portfolio | 22,505,193 | 103,144,916 | ||||||
In addition, a Portfolio transaction fee is imposed by Stock Portfolio on the combined daily inflows or outflows of the Fund and Stock Portfolio’s other investors as more fully described at Note 1H of Stock Portfolio’s financial statements included herein. Such fee is allocated to the Fund based on its pro-rata interest in Stock Portfolio. The amount of the Portfolio transaction fee imposed on the Fund, if any, and the allocation of such fee are presented as Other capital on the Statements of Changes in Net Assets.
7 Shares of Beneficial Interest
The Fund’s Declaration of Trust permits the Trustees to issue an unlimited number of full and fractional shares of beneficial interest (without par value). Such shares may be issued in a number of different series (such as the Fund) and classes. Transactions in Fund shares were as follows:
| Year Ended December 31, | ||||||||
| Class A | 2021 | 2020 | ||||||
Sales | 4,176,035 | 4,813,211 | ||||||
Issued to shareholders electing to receive payments of distributions in Fund shares | 2,770,703 | 930,732 | ||||||
Redemptions | (4,184,607 | ) | (6,790,102 | ) | ||||
Converted from Class C shares | 404,790 | 1,053,868 | ||||||
Net increase | 3,166,921 | 7,709 | ||||||
| 19 |
Eaton Vance
Balanced Fund
December 31, 2021
Notes to Financial Statements — continued
| Year Ended December 31, | ||||||||
| Class C | 2021 | 2020 | ||||||
Sales | 2,781,836 | 4,375,005 | ||||||
Issued to shareholders electing to receive payments of distributions in Fund shares | 1,550,042 | 476,999 | ||||||
Redemptions | (4,188,082 | ) | (5,047,848 | ) | ||||
Converted to Class A shares | (403,119 | ) | (1,049,710 | ) | ||||
Net decrease | (259,323 | ) | (1,245,554 | ) | ||||
| Year Ended December 31, | ||||||||
| Class I | 2021 | 2020 | ||||||
Sales | 6,952,216 | 15,325,303 | ||||||
Issued to shareholders electing to receive payments of distributions in Fund shares | 2,617,006 | 945,942 | ||||||
Redemptions | (10,534,372 | ) | (12,394,401 | ) | ||||
Net increase (decrease) | (965,150 | ) | 3,876,844 | |||||
| Year Ended December 31, | ||||||||
| Class R | 2021 | 2020 | ||||||
Sales | 682,829 | 479,598 | ||||||
Issued to shareholders electing to receive payments of distributions in Fund shares | 98,543 | 19,119 | ||||||
Redemptions | (243,016 | ) | (277,171 | ) | ||||
Net increase | 538,356 | 221,546 | ||||||
| Year Ended December 31, | ||||||||
| Class R6 | 2021 | 2020 | ||||||
Sales | 1,253,295 | 1,232,668 | ||||||
Issued to shareholders electing to receive payments of distributions in Fund shares | 440,316 | 143,855 | ||||||
Redemptions | (6,222,460 | ) | (688,563 | ) | ||||
Net increase (decrease) | (4,528,849 | ) | 687,960 | |||||
8 Fair Value Measurements
Under generally accepted accounting principles for fair value measurements, a three-tier hierarchy to prioritize the assumptions, referred to as inputs, is used in valuation techniques to measure fair value. The three-tier hierarchy of inputs is summarized in the three broad levels listed below.
| • | Level 1 – quoted prices in active markets for identical investments |
| • | Level 2 – other significant observable inputs (including quoted prices for similar investments, interest rates, prepayment speeds, credit risk, etc.) |
• Level 3 – significant unobservable inputs (including a fund’s own assumptions in determining the fair value of investments)
In cases where the inputs used to measure fair value fall in different levels of the fair value hierarchy, the level disclosed is determined based on the lowest level input that is significant to the fair value measurement in its entirety. The inputs or methodology used for valuing securities are not necessarily an indication of the risk associated with investing in those securities. At December 31, 2021 and December 31, 2020, the Fund’s investment in Core Bond
| 20 |
Eaton Vance
Balanced Fund
December 31, 2021
Notes to Financial Statements — continued
Portfolio, whose financial statements are not included but are available elsewhere as discussed in Note 1, and in Stock Portfolio were valued based on Level 1 inputs.
9 Risks and Uncertainties
Pandemic Risk
An outbreak of respiratory disease caused by a novel coronavirus was first detected in China in late 2019 and subsequently spread internationally. This coronavirus has resulted in closing borders, enhanced health screenings, changes to healthcare service preparation and delivery, quarantines, cancellations, disruptions to supply chains and customer activity, as well as general concern and uncertainty. Health crises caused by outbreaks, such as the coronavirus outbreak, may exacerbate other pre-existing political, social and economic risks and disrupt normal market conditions and operations. The impact of this outbreak has negatively affected the worldwide economy, the economies of individual countries, individual companies, and the market in general, and may continue to do so in significant and unforeseen ways, as may other epidemics and pandemics that may arise in the future. Any such impact could adversely affect the Fund’s performance, or the performance of the securities in which the Fund invests.
| 21 |
Eaton Vance
Balanced Fund
December 31, 2021
Report of Independent Registered Public Accounting Firm
To the Trustees of Eaton Vance Special Investment Trust and Shareholders of Eaton Vance Balanced Fund:
Opinion on the Financial Statements and Financial Highlights
We have audited the accompanying statement of assets and liabilities of Eaton Vance Balanced Fund (the “Fund”) (one of the funds constituting Eaton Vance Special Investment Trust), as of December 31, 2021, the related statement of operations for the year then ended, the statements of changes in net assets for each of the two years in the period then ended, the financial highlights for each of the five years in the period then ended, and the related notes. In our opinion, the financial statements and financial highlights present fairly, in all material respects, the financial position of the Fund as of December 31, 2021, and the results of its operations for the year then ended, the changes in its net assets for each of the two years in the period then ended, and the financial highlights for each of the five years in the period then ended in conformity with accounting principles generally accepted in the United States of America.
Basis for Opinion
These financial statements and financial highlights are the responsibility of the Fund’s management. Our responsibility is to express an opinion on the Fund’s financial statements and financial highlights based on our audits. We are a public accounting firm registered with the Public Company Accounting Oversight Board (United States) (PCAOB) and are required to be independent with respect to the Fund in accordance with the U.S. federal securities laws and the applicable rules and regulations of the Securities and Exchange Commission and the PCAOB.
We conducted our audits in accordance with the standards of the PCAOB. Those standards require that we plan and perform the audit to obtain reasonable assurance about whether the financial statements and financial highlights are free of material misstatement, whether due to error or fraud. The Fund is not required to have, nor were we engaged to perform, an audit of its internal control over financial reporting. As part of our audits, we are required to obtain an understanding of internal control over financial reporting but not for the purpose of expressing an opinion on the effectiveness of the Fund’s internal control over financial reporting. Accordingly, we express no such opinion.
Our audits included performing procedures to assess the risks of material misstatement of the financial statements and financial highlights, whether due to error or fraud, and performing procedures that respond to those risks. Such procedures included examining, on a test basis, evidence regarding the amounts and disclosures in the financial statements and financial highlights. Our audits also included evaluating the accounting principles used and significant estimates made by management, as well as evaluating the overall presentation of the financial statements and financial highlights. We believe that our audits provide a reasonable basis for our opinion.
/s/ Deloitte & Touche LLP
Boston, Massachusetts
February 23, 2022
We have served as the auditor of one or more Eaton Vance investment companies since 1959.
| 22 |
Eaton Vance
Balanced Fund
December 31, 2021
Federal Tax Information (Unaudited)
The Form 1099-DIV you received in February 2022 showed the tax status of all distributions paid to your account in calendar year 2021. Shareholders are advised to consult their own tax adviser with respect to the tax consequences of their investment in the Fund. As required by the Internal Revenue Code and/or regulations, shareholders must be notified regarding the status of qualified dividend income for individuals, the dividends received deduction for
corporations and capital gains dividends.
Qualified Dividend Income. For the fiscal year ended December 31, 2021, the Fund designates approximately $8,090,995, or up to the maximum amount of such dividends allowable pursuant to the Internal Revenue Code, as qualified dividend income eligible for the reduced tax rate of 15%.
Dividends Received Deduction. Corporate shareholders are generally entitled to take the dividends received deduction on the portion of the Fund’s dividend distribution that qualifies under tax law. For the Fund’s fiscal 2021 ordinary income dividends, 42.77% qualifies for the corporate dividends received deduction.
Capital Gains Dividends. The Fund hereby designates as a capital gain dividend with respect to the taxable year ended December 31, 2021, $97,615,521 or, if subsequently determined to be different, the net capital gain of such year.
| 23 |
Stock Portfolio
December 31, 2021
Portfolio of Investments
| Common Stocks — 94.9% |
| |||||||
| Security | Shares | Value | ||||||
| Auto Components — 1.6% | ||||||||
Aptiv PLC(1) | 86,456 | $ | 14,260,917 | |||||
| $ | 14,260,917 | |||||||
| Automobiles — 0.9% | ||||||||
Tesla, Inc.(1) | 7,200 | $ | 7,608,816 | |||||
| $ | 7,608,816 | |||||||
| Banks — 4.4% | ||||||||
PNC Financial Services Group, Inc. (The) | 90,970 | $ | 18,241,304 | |||||
Wells Fargo & Co. | 417,210 | 20,017,736 | ||||||
| $ | 38,259,040 | |||||||
| Beverages — 3.4% | ||||||||
Coca-Cola Co. (The) | 257,246 | $ | 15,231,536 | |||||
Coca-Cola Europacific Partners PLC | 250,060 | 13,985,856 | ||||||
| $ | 29,217,392 | |||||||
| Biotechnology — 3.1% | ||||||||
AbbVie, Inc. | 144,416 | $ | 19,553,926 | |||||
Neurocrine Biosciences, Inc.(1) | 89,416 | 7,615,561 | ||||||
| $ | 27,169,487 | |||||||
| Building Products — 1.1% | ||||||||
AZEK Co., Inc. (The)(1) | 200,950 | $ | 9,291,928 | |||||
| $ | 9,291,928 | |||||||
| Capital Markets — 7.3% | ||||||||
Goldman Sachs Group, Inc. (The) | 31,190 | $ | 11,931,735 | |||||
Intercontinental Exchange, Inc. | 110,204 | 15,072,601 | ||||||
S&P Global, Inc. | 40,636 | 19,177,347 | ||||||
Tradeweb Markets, Inc., Class A | 171,429 | 17,166,900 | ||||||
| $ | 63,348,583 | |||||||
| Commercial Services & Supplies — 1.2% | ||||||||
Waste Management, Inc. | 61,978 | $ | 10,344,128 | |||||
| $ | 10,344,128 | |||||||
| Containers & Packaging — 1.0% | ||||||||
AptarGroup, Inc. | 72,454 | $ | 8,874,166 | |||||
| $ | 8,874,166 | |||||||
| Security | Shares | Value | ||||||
| Electric Utilities — 1.6% | ||||||||
NextEra Energy, Inc. | 148,440 | $ | 13,858,358 | |||||
| $ | 13,858,358 | |||||||
| Electrical Equipment — 1.2% | ||||||||
AMETEK, Inc. | 73,256 | $ | 10,771,562 | |||||
| $ | 10,771,562 | |||||||
| Electronic Equipment, Instruments & Components — 1.4% | ||||||||
TE Connectivity, Ltd. | 76,400 | $ | 12,326,376 | |||||
| $ | 12,326,376 | |||||||
| Entertainment — 1.2% | ||||||||
Walt Disney Co. (The)(1) | 66,982 | $ | 10,374,842 | |||||
| $ | 10,374,842 | |||||||
| Equity Real Estate Investment Trusts (REITs) — 2.8% | ||||||||
EastGroup Properties, Inc. | 46,522 | $ | 10,600,038 | |||||
Lamar Advertising Co., Class A | 112,290 | 13,620,777 | ||||||
| $ | 24,220,815 | |||||||
| Food & Staples Retailing — 1.7% | ||||||||
Sysco Corp. | 189,990 | $ | 14,923,715 | |||||
| $ | 14,923,715 | |||||||
| Health Care Equipment & Supplies — 1.9% | ||||||||
Boston Scientific Corp.(1) | 254,436 | $ | 10,808,441 | |||||
Teleflex, Inc. | 18,500 | 6,076,880 | ||||||
| $ | 16,885,321 | |||||||
| Health Care Providers & Services — 1.8% | ||||||||
Anthem, Inc. | 33,224 | $ | 15,400,653 | |||||
| $ | 15,400,653 | |||||||
| Hotels, Restaurants & Leisure — 1.3% | ||||||||
Marriott International, Inc., Class A(1) | 69,128 | $ | 11,422,711 | |||||
| $ | 11,422,711 | |||||||
| Interactive Media & Services — 6.7% | ||||||||
Alphabet, Inc., Class C(1) | 16,589 | $ | 48,001,764 | |||||
Meta Platforms, Inc., Class A(1) | 32,076 | 10,788,763 | ||||||
| $ | 58,790,527 | |||||||
| 24 | See Notes to Financial Statements. |
Stock Portfolio
December 31, 2021
Portfolio of Investments — continued
| Security | Shares | Value | ||||||
| Internet & Direct Marketing Retail — 5.4% | ||||||||
Amazon.com, Inc.(1) | 13,996 | $ | 46,667,423 | |||||
| $ | 46,667,423 | |||||||
| IT Services — 3.7% | ||||||||
Automatic Data Processing, Inc. | 60,796 | $ | 14,991,078 | |||||
Visa, Inc., Class A | 81,030 | 17,560,011 | ||||||
| $ | 32,551,089 | |||||||
| Life Sciences Tools & Services — 3.9% | ||||||||
Danaher Corp. | 51,992 | $ | 17,105,888 | |||||
Thermo Fisher Scientific, Inc. | 25,034 | 16,703,686 | ||||||
| $ | 33,809,574 | |||||||
| Machinery — 1.1% | ||||||||
Stanley Black & Decker, Inc. | 51,938 | $ | 9,796,546 | |||||
| $ | 9,796,546 | |||||||
| Oil, Gas & Consumable Fuels — 2.1% | ||||||||
ConocoPhillips | 251,256 | $ | 18,135,658 | |||||
| $ | 18,135,658 | |||||||
| Pharmaceuticals — 3.4% | ||||||||
Eli Lilly & Co. | 49,100 | $ | 13,562,402 | |||||
Pfizer, Inc. | 96,400 | 5,692,420 | ||||||
Zoetis, Inc. | 41,922 | 10,230,226 | ||||||
| $ | 29,485,048 | |||||||
| Professional Services — 2.2% | ||||||||
Booz Allen Hamilton Holding Corp. | 113,090 | $ | 9,588,901 | |||||
Clarivate PLC(1) | 421,188 | 9,906,342 | ||||||
| $ | 19,495,243 | |||||||
| Road & Rail — 1.5% | ||||||||
Union Pacific Corp. | 52,424 | $ | 13,207,178 | |||||
| $ | 13,207,178 | |||||||
| Semiconductors & Semiconductor Equipment — 6.3% | ||||||||
Analog Devices, Inc. | 91,086 | $ | 16,010,186 | |||||
Lam Research Corp. | 16,200 | 11,650,230 | ||||||
NVIDIA Corp. | 25,500 | 7,499,805 | ||||||
Taiwan Semiconductor Manufacturing Co., Ltd. ADR | 69,039 | 8,306,082 | ||||||
Texas Instruments, Inc. | 62,347 | 11,750,539 | ||||||
| $ | 55,216,842 | |||||||
| Security | Shares | Value | ||||||
| Software — 9.9% | ||||||||
Bill.com Holdings, Inc.(1) | 31,200 | $ | 7,773,480 | |||||
Intuit, Inc. | 24,254 | 15,600,658 | ||||||
Microsoft Corp. | 187,598 | 63,092,959 | ||||||
| $ | 86,467,097 | |||||||
| Specialty Retail — 1.7% | ||||||||
TJX Cos., Inc. (The) | 198,134 | $ | 15,042,333 | |||||
| $ | 15,042,333 | |||||||
| Technology Hardware, Storage & Peripherals — 6.0% | ||||||||
Apple, Inc. | 293,484 | $ | 52,113,954 | |||||
| $ | 52,113,954 | |||||||
| Textiles, Apparel & Luxury Goods — 0.9% | ||||||||
Deckers Outdoor Corp.(1) | 20,518 | $ | 7,515,949 | |||||
| $ | 7,515,949 | |||||||
| Wireless Telecommunication Services — 1.2% | ||||||||
T-Mobile US, Inc.(1) | 86,208 | $ | 9,998,404 | |||||
| $ | 9,998,404 | |||||||
Total Common Stocks |
| $ | 826,851,675 | |||||
| Short-Term Investments — 0.3% |
| |||||||
| Description | Units | Value | ||||||
Eaton Vance Cash Reserves Fund, LLC, 0.08%(2) | 2,248,701 | $ | 2,248,476 | |||||
Total Short-Term Investments |
| $ | 2,248,476 | |||||
Total Investments — 95.2% |
| $ | 829,100,151 | |||||
Other Assets, Less Liabilities — 4.8% |
| $ | 42,209,395 | |||||
Net Assets — 100.0% |
| $ | 871,309,546 | |||||
The percentage shown for each investment category in the Portfolio of Investments is based on net assets.
| (1) | Non-income producing security. |
| (2) | Affiliated investment company, available to Eaton Vance portfolios and funds, which invests in high quality, U.S. dollar denominated money market instruments. The rate shown is the annualized seven-day yield as of December 31, 2021. |
Abbreviations:
| ADR | – | American Depositary Receipt | ||
| 25 | See Notes to Financial Statements. |
Stock Portfolio
December 31, 2021
Statement of Assets and Liabilities
| Assets | December 31, 2021 | |||
Unaffiliated investments, at value (identified cost, $507,783,336) | $ | 826,851,675 | ||
Affiliated investment, at value (identified cost, $2,248,476) | 2,248,476 | |||
Dividends receivable | 244,593 | |||
Dividends receivable from affiliated investment | 93 | |||
Receivable for investments sold | 42,354,951 | |||
Tax reclaims receivable | 135,816 | |||
Total assets | $ | 871,835,604 | ||
| Liabilities | ||||
Payable to affiliates: | ||||
Investment adviser fee | $ | 429,926 | ||
Trustees’ fees | 10,295 | |||
Accrued expenses | 85,837 | |||
Total liabilities | $ | 526,058 | ||
Net Assets applicable to investors’ interest in Portfolio | $ | 871,309,546 | ||
| 26 | See Notes to Financial Statements. |
Stock Portfolio
December 31, 2021
Statement of Operations
| Investment Income | Year Ended December 31, 2021 | |||
Dividends (net of foreign taxes, $154,516) | $ | 9,906,044 | ||
Dividends from affiliated investment | 1,479 | |||
Total investment income | $ | 9,907,523 | ||
| Expenses | ||||
Investment adviser fee | $ | 4,970,765 | ||
Trustees’ fees and expenses | 41,836 | |||
Custodian fee | 204,317 | |||
Legal and accounting services | 52,438 | |||
Miscellaneous | 24,624 | |||
Total expenses | $ | 5,293,980 | ||
Net investment income | $ | 4,613,543 | ||
| Realized and Unrealized Gain (Loss) | ||||
Net realized gain (loss) — | ||||
Investment transactions | $ | 123,850,522 | (1) | |
Investment transactions — affiliated investment | (1,372 | ) | ||
Foreign currency transactions | (11,938 | ) | ||
Net realized gain | $ | 123,837,212 | ||
Change in unrealized appreciation (depreciation) — | ||||
Investments | $ | 46,450,706 | ||
Foreign currency | (7,691 | ) | ||
Net change in unrealized appreciation (depreciation) | $ | 46,443,015 | ||
Net realized and unrealized gain | $ | 170,280,227 | ||
Net increase in net assets from operations | $ | 174,893,770 | ||
| (1) | Includes $3,096,043 of net realized gains from redemptions in-kind. |
| 27 | See Notes to Financial Statements. |
Stock Portfolio
December 31, 2021
Statements of Changes in Net Assets
| Year Ended December 31, | ||||||||
| Increase (Decrease) in Net Assets | 2021 | 2020 | ||||||
From operations — | ||||||||
Net investment income | $ | 4,613,543 | $ | 5,837,934 | ||||
Net realized gain | 123,837,212 | (1) | 18,275,199 | |||||
Net change in unrealized appreciation (depreciation) | 46,443,015 | 96,276,139 | ||||||
Net increase in net assets from operations | $ | 174,893,770 | $ | 120,389,272 | ||||
Capital transactions — | ||||||||
Contributions | $ | 23,356,815 | $ | 78,327,454 | ||||
Withdrawals | (131,961,931 | ) | (78,095,172 | ) | ||||
Portfolio transaction fee | 574,923 | 276,897 | ||||||
Net increase (decrease) in net assets from capital transactions | $ | (108,030,193 | ) | $ | 509,179 | |||
Net increase in net assets | $ | 66,863,577 | $ | 120,898,451 | ||||
| Net Assets | ||||||||
At beginning of year | $ | 804,445,969 | $ | 683,547,518 | ||||
At end of year | $ | 871,309,546 | $ | 804,445,969 | ||||
| (1) | Includes $3,096,043 of net realized gains from redemptions in-kind. |
| 28 | See Notes to Financial Statements. |
Stock Portfolio
December 31, 2021
Financial Highlights
| Year Ended December 31, | ||||||||||||||||||||
| Ratios/Supplemental Data | 2021 | 2020 | 2019 | 2018 | 2017 | |||||||||||||||
Ratios (as a percentage of average daily net assets): | ||||||||||||||||||||
Expenses | 0.63 | % | 0.64 | % | 0.63 | % | 0.64 | % | 0.64 | % | ||||||||||
Net investment income | 0.55 | % | 0.84 | % | 0.99 | % | 1.14 | % | 1.38 | % | ||||||||||
Portfolio Turnover | 44 | % | 70 | % | 55 | % | 90 | % | 101 | % | ||||||||||
Total Return | 23.21 | % | 18.61 | % | 35.47 | % | (5.57 | )% | 20.31 | % | ||||||||||
Net assets, end of year (000’s omitted) | $ | 871,310 | $ | 804,446 | $ | 683,548 | $ | 516,615 | $ | 647,405 | ||||||||||
| 29 | See Notes to Financial Statements. |
Stock Portfolio
December 31, 2021
Notes to Financial Statements
1 Significant Accounting Policies
Stock Portfolio (the Portfolio) is a Massachusetts business trust registered under the Investment Company Act of 1940, as amended (the 1940 Act), as a diversified, open-end management investment company. The Portfolio’s investment objective is to achieve long-term capital appreciation by investing in a diversified portfolio of equity securities. The Declaration of Trust permits the Trustees to issue interests in the Portfolio. At December 31, 2021, Eaton Vance Stock Fund, Eaton Vance Stock NextShares and Eaton Vance Balanced Fund held an interest of 12.8%, 0.2% and 87.1%, respectively, in the Portfolio.
The following is a summary of significant accounting policies of the Portfolio. The policies are in conformity with accounting principles generally accepted in the United States of America (U.S. GAAP). The Portfolio is an investment company and follows accounting and reporting guidance in the Financial Accounting Standards Board (FASB) Accounting Standards Codification Topic 946.
A Investment Valuation — The following methodologies are used to determine the market value or fair value of investments.
Equity Securities. Equity securities listed on a U.S. securities exchange generally are valued at the last sale or closing price on the day of valuation or, if no sales took place on such date, at the mean between the closing bid and ask prices on the exchange where such securities are principally traded. Equity securities listed on the NASDAQ National Market System are valued at the NASDAQ official closing price. Unlisted or listed securities for which closing sales prices or closing quotations are not available are valued at the mean between the latest available bid and ask prices.
Foreign Securities and Currencies. Foreign securities and currencies are valued in U.S. dollars, based on foreign currency exchange rate quotations supplied by a third party pricing service. The pricing service uses a proprietary model to determine the exchange rate. Inputs to the model include reported trades and implied bid/ask spreads. The daily valuation of exchange-traded foreign securities generally is determined as of the close of trading on the principal exchange on which such securities trade. Events occurring after the close of trading on foreign exchanges may result in adjustments to the valuation of foreign securities to more accurately reflect their fair value as of the close of regular trading on the New York Stock Exchange. When valuing foreign equity securities that meet certain criteria, the Portfolio’s Trustees have approved the use of a fair value service that values such securities to reflect market trading that occurs after the close of the applicable foreign markets of comparable securities or other instruments that have a strong correlation to the fair-valued securities.
Affiliated Fund. The Portfolio may invest in Eaton Vance Cash Reserves Fund, LLC (Cash Reserves Fund), an affiliated investment company managed by Eaton Vance Management (EVM). While Cash Reserves Fund is not a registered money market mutual fund, it conducts all of its investment activities in accordance with the requirements of Rule 2a-7 under the 1940 Act. Investments in Cash Reserves Fund are valued at the closing net asset value per unit on the valuation day. Cash Reserves Fund generally values its investment securities based on available market quotations provided by a third party pricing service.
Fair Valuation. Investments for which valuations or market quotations are not readily available or are deemed unreliable are valued at fair value using methods determined in good faith by or at the direction of the Trustees of the Portfolio in a manner that most fairly reflects the security’s “fair value”, which is the amount that the Portfolio might reasonably expect to receive for the security upon its current sale in the ordinary course. Each such determination is based on a consideration of relevant factors, which are likely to vary from one pricing context to another. These factors may include, but are not limited to, the type of security, the existence of any contractual restrictions on the security’s disposition, the price and extent of public trading in similar securities of the issuer or of comparable companies or entities, quotations or relevant information obtained from broker/dealers or other market participants, information obtained from the issuer, analysts, and/or the appropriate stock exchange (for exchange-traded securities), an analysis of the company’s or entity’s financial statements, and an evaluation of the forces that influence the issuer and the market(s) in which the security is purchased and sold.
B Investment Transactions — Investment transactions for financial statement purposes are accounted for on a trade date basis. Realized gains and losses on investments sold are determined on the basis of identified cost.
C Income — Dividend income is recorded on the ex-dividend date for dividends received in cash and/or securities. However, if the ex-dividend date has passed, certain dividends from foreign securities are recorded as the Portfolio is informed of the ex-dividend date. Withholding taxes on foreign dividends and capital gains have been provided for in accordance with the Portfolio’s understanding of the applicable countries’ tax rules and rates.
D Federal Taxes — The Portfolio has elected to be treated as a partnership for federal tax purposes. No provision is made by the Portfolio for federal or state taxes on any taxable income of the Portfolio because each investor in the Portfolio is ultimately responsible for the payment of any taxes on its share of taxable income. Since at least one of the Portfolio’s investors is a regulated investment company that invests all or substantially all of its assets in the Portfolio, the Portfolio normally must satisfy the applicable source of income and diversification requirements (under the Internal Revenue Code) in order for its investors to satisfy them. The Portfolio will allocate, at least annually among its investors, each investor’s distributive share of the Portfolio’s net investment income, net realized capital gains and losses and any other items of income, gain, loss, deduction or credit.
As of December 31, 2021, the Portfolio had no uncertain tax positions that would require financial statement recognition, de-recognition, or disclosure. The Portfolio files a U.S. federal income tax return annually after its fiscal year-end, which is subject to examination by the Internal Revenue Service for a period of three years from the date of filing.
E Foreign Currency Translation — Investment valuations, other assets, and liabilities initially expressed in foreign currencies are translated each business day into U.S. dollars based upon current exchange rates. Purchases and sales of foreign investment securities and income and expenses denominated in
| 30 |
Stock Portfolio
December 31, 2021
Notes to Financial Statements — continued
foreign currencies are translated into U.S. dollars based upon currency exchange rates in effect on the respective dates of such transactions. Recognized gains or losses on investment transactions attributable to changes in foreign currency exchange rates are recorded for financial statement purposes as net realized gains and losses on investments. That portion of unrealized gains and losses on investments that results from fluctuations in foreign currency exchange rates is not separately disclosed.
F Use of Estimates — The preparation of the financial statements in conformity with U.S. GAAP requires management to make estimates and assumptions that affect the reported amounts of assets and liabilities at the date of the financial statements and the reported amounts of income and expense during the reporting period. Actual results could differ from those estimates.
G Indemnifications — Under the Portfolio’s organizational documents, its officers and Trustees may be indemnified against certain liabilities and expenses arising out of the performance of their duties to the Portfolio. Under Massachusetts law, if certain conditions prevail, interestholders in the Portfolio could be deemed to have personal liability for the obligations of the Portfolio. However, the Portfolio’s Declaration of Trust contains an express disclaimer of liability on the part of Portfolio interestholders. Additionally, in the normal course of business, the Portfolio enters into agreements with service providers that may contain indemnification clauses. The Portfolio’s maximum exposure under these arrangements is unknown as this would involve future claims that may be made against the Portfolio that have not yet occurred.
H Capital Transactions — To seek to protect the Portfolio (and, indirectly, other investors in the Portfolio) against the costs of accommodating investor inflows and outflows, the Portfolio imposes a fee (“Portfolio transaction fee”) on inflows and outflows by Portfolio investors. The Portfolio transaction fee is sized to cover the estimated cost to the Portfolio of, in connection with issuing interests, converting the cash and/or other instruments it receives to the desired composition and, in connection with redeeming its interests, converting Portfolio holdings to cash and/or other instruments to be distributed. Such fee, which may vary over time, is limited to amounts that have been authorized by the Board of Trustees and determined by EVM to be appropriate. The maximum Portfolio transaction fee is 2% of the amount of net contributions or withdrawals. The Portfolio transaction fee is recorded as a component of capital transactions on the Statements of Changes in Net Assets.
2 Investment Adviser Fee and Other Transactions with Affiliates
The investment adviser fee is earned by Boston Management and Research (BMR) as compensation for investment advisory services rendered to the Portfolio. On March 1, 2021, Morgan Stanley acquired Eaton Vance Corp. (the “Transaction”) and BMR became an indirect, wholly-owned subsidiary of Morgan Stanley. In connection with the Transaction, the Portfolio entered into a new investment advisory agreement (the “New Agreement”) with BMR, which took effect on March 1, 2021. The Portfolio’s prior fee reduction agreement was incorporated into the New Agreement. Pursuant to the New Agreement (and the Portfolio’s investment advisory agreement and related fee reduction agreement with BMR in effect prior to March 1, 2021), the fee is computed at an annual rate as a percentage of the Portfolio’s average daily net assets as follows and is payable monthly:
| Average Daily Net Assets | Annual Fee Rate | |||
Up to $500 million | 0.600 | % | ||
$500 million but less than $1 billion | 0.575 | % | ||
$1 billion but less than $2.5 billion | 0.550 | % | ||
$2.5 billion but less than $5 billion | 0.530 | % | ||
$5 billion and over | 0.515 | % | ||
For the year ended December 31, 2021, the Portfolio’s investment adviser fee amounted to $4,970,765 or 0.59% of the Portfolio’s average daily net assets. The Portfolio may invest its cash in Cash Reserves Fund. EVM does not currently receive a fee for advisory services provided to Cash Reserves Fund.
Trustees and officers of the Portfolio who are members of EVM’s or BMR’s organizations receive remuneration for their services to the Portfolio out of the investment adviser fee. Trustees of the Portfolio who are not affiliated with the investment adviser may elect to defer receipt of all or a percentage of their annual fees in accordance with the terms of the Trustees Deferred Compensation Plan. For the year ended December 31, 2021, no significant amounts have been deferred. Certain officers and Trustees of the Portfolio are officers of the above organizations.
3 Purchases and Sales of Investments
Purchases and sales of investments, other than short-term obligations and in-kind transactions, aggregated $368,242,025 and $508,852,092, respectively, for the year ended December 31, 2021. In-kind contributions and withdrawals for the year ended December 31, 2021 aggregated none and $6,582,209, respectively.
| 31 |
Stock Portfolio
December 31, 2021
Notes to Financial Statements — continued
4 Federal Income Tax Basis of Investments
The cost and unrealized appreciation (depreciation) of investments of the Portfolio at December 31, 2021, as determined on a federal income tax basis, were as follows:
Aggregate cost | $ | 511,667,420 | ||
Gross unrealized appreciation | $ | 323,672,440 | ||
Gross unrealized depreciation | (6,239,709 | ) | ||
Net unrealized appreciation | $ | 317,432,731 | ||
5 Line of Credit
The Portfolio participates with other portfolios and funds managed by EVM and its affiliates in an $800 million unsecured line of credit agreement with a group of banks, which is in effect through October 25, 2022. Borrowings are made by the Portfolio solely for temporary purposes related to redemptions and other short-term cash needs. Interest is charged to the Portfolio based on its borrowings at an amount above either the Secured Overnight Financing Rate (SOFR) or Federal Funds rate. In addition, a fee computed at an annual rate of 0.15% on the daily unused portion of the line of credit is allocated among the participating portfolios and funds at the end of each quarter. In connection with the renewal of the agreement in October 2021, an arrangement fee totaling $150,000 was incurred that was allocated to the participating portfolios and funds. Because the line of credit is not available exclusively to the Portfolio, it may be unable to borrow some or all of its requested amounts at any particular time. The Portfolio did not have any significant borrowings or allocated fees during the year ended December 31, 2021.
6 Investments in Affiliated Funds
At December 31, 2021, the value of the Portfolio’s investment in affiliated funds was $2,248,476, which represents 0.3% of the Portfolio’s net assets. Transactions in affiliated funds by the Portfolio for the year ended December 31, 2021 were as follows:
| Name | Value, beginning of period | Purchases | Sales proceeds | Net realized gain (loss) | Change in unrealized appreciation (depreciation) | Value, end of period | Dividend income | Units, end of period | ||||||||||||||||||||||||
Short-Term Investments |
| |||||||||||||||||||||||||||||||
Eaton Vance Cash Reserves Fund, LLC | $ | 6,475,259 | $ | 122,109,454 | $ | (126,334,865 | ) | $ | (1,372 | ) | $ | — | $ | 2,248,476 | $ | 1,479 | 2,248,701 | |||||||||||||||
7 Fair Value Measurements
Under generally accepted accounting principles for fair value measurements, a three-tier hierarchy to prioritize the assumptions, referred to as inputs, is used in valuation techniques to measure fair value. The three-tier hierarchy of inputs is summarized in the three broad levels listed below.
| • | Level 1 – quoted prices in active markets for identical investments |
| • | Level 2 – other significant observable inputs (including quoted prices for similar investments, interest rates, prepayment speeds, credit risk, etc.) |
| • | Level 3 – significant unobservable inputs (including a fund’s own assumptions in determining the fair value of investments) |
In cases where the inputs used to measure fair value fall in different levels of the fair value hierarchy, the level disclosed is determined based on the lowest level input that is significant to the fair value measurement in its entirety. The inputs or methodology used for valuing securities are not necessarily an indication of the risk associated with investing in those securities.
| 32 |
Stock Portfolio
December 31, 2021
Notes to Financial Statements — continued
At December 31, 2021, the hierarchy of inputs used in valuing the Portfolio’s investments, which are carried at value, were as follows:
| Asset Description | Level 1 | Level 2 | Level 3 | Total | ||||||||||||
Common Stocks | $ | 826,851,675 | * | $ | — | $ | — | $ | 826,851,675 | |||||||
Short-Term Investments | — | 2,248,476 | — | 2,248,476 | ||||||||||||
Total Investments | $ | 826,851,675 | $ | 2,248,476 | $ | — | $ | 829,100,151 | ||||||||
| * | The level classification by major category of investments is the same as the category presentation in the Portfolio of Investments. |
8 Risks and Uncertainties
Pandemic Risk
An outbreak of respiratory disease caused by a novel coronavirus was first detected in China in late 2019 and subsequently spread internationally. This coronavirus has resulted in closing borders, enhanced health screenings, changes to healthcare service preparation and delivery, quarantines, cancellations, disruptions to supply chains and customer activity, as well as general concern and uncertainty. Health crises caused by outbreaks, such as the coronavirus outbreak, may exacerbate other pre-existing political, social and economic risks and disrupt normal market conditions and operations. The impact of this outbreak has negatively affected the worldwide economy, the economies of individual countries, individual companies, and the market in general, and may continue to do so in significant and unforeseen ways, as may other epidemics and pandemics that may arise in the future. Any such impact could adversely affect the Portfolio’s performance, or the performance of the securities in which the Portfolio invests.
| 33 |
Eaton Vance
Stock Portfolio
December 31, 2021
Report of Independent Registered Public Accounting Firm
To the Trustees and Investors of Stock Portfolio:
Opinion on the Financial Statements and Financial Highlights
We have audited the accompanying statement of assets and liabilities of Stock Portfolio (the “Portfolio”), including the portfolio of investments, as of December 31, 2021, the related statement of operations for the year then ended, the statements of changes in net assets for each of the two years in the period then ended, the financial highlights for each of the five years in the period then ended, and the related notes. In our opinion, the financial statements and financial highlights present fairly, in all material respects, the financial position of the Portfolio as of December 31, 2021, and the results of its operations for the year then ended, the changes in its net assets for each of the two years in the period then ended, and the financial highlights for each of the five years in the period then ended, in conformity with accounting principles generally accepted in the United States of America.
Basis for Opinion
These financial statements and financial highlights are the responsibility of the Portfolio’s management. Our responsibility is to express an opinion on the Portfolio’s financial statements and financial highlights based on our audits. We are a public accounting firm registered with the Public Company Accounting Oversight Board (United States) (PCAOB) and are required to be independent with respect to the Portfolio in accordance with the U.S. federal securities laws and the applicable rules and regulations of the Securities and Exchange Commission and the PCAOB.
We conducted our audits in accordance with the standards of the PCAOB. Those standards require that we plan and perform the audit to obtain reasonable assurance about whether the financial statements and financial highlights are free of material misstatement, whether due to error or fraud. The Portfolio is not required to have, nor were we engaged to perform, an audit of its internal control over financial reporting. As part of our audits, we are required to obtain an understanding of internal control over financial reporting but not for the purpose of expressing an opinion on the effectiveness of the Portfolio’s internal control over financial reporting. Accordingly, we express no such opinion.
Our audits included performing procedures to assess the risks of material misstatement of the financial statements and financial highlights, whether due to error or fraud, and performing procedures that respond to those risks. Such procedures included examining, on a test basis, evidence regarding the amounts and disclosures in the financial statements and financial highlights. Our audits also included evaluating the accounting principles used and significant estimates made by management, as well as evaluating the overall presentation of the financial statements and financial highlights. Our procedures included confirmation of securities owned as of December 31, 2021, by correspondence with the custodian and brokers; when replies were not received from brokers, we performed other auditing procedures. We believe that our audits provide a reasonable basis for our opinion.
/s/ Deloitte & Touche LLP
Boston, Massachusetts
February 23, 2022
We have served as the auditor of one or more Eaton Vance investment companies since 1959.
| 34 |
Eaton Vance
Balanced Fund
December 31, 2021
Fund Management. The Trustees of Eaton Vance Special Investment Trust (the Trust), Core Bond Portfolio and Stock Portfolio (the Portfolios) are responsible for the overall management and supervision of the Trust and each Portfolio’s affairs. The Board members and officers of the Trust and each Portfolio are listed below. Except as indicated, each individual has held the office shown or other offices in the same company for the last five years. Board members hold indefinite terms of office. Each Trustee holds office until his or her successor is elected and qualified, subject to a prior death, resignation, retirement, disqualification or removal. Under the terms of the Fund’s and the Portfolios’ current Trustee retirement policy, an Independent Trustee must retire and resign as a Trustee on the earlier of: (i) the first day of July following his or her 74th birthday; or (ii), with limited exception, December 31st of the 20th year in which he or she has served as a Trustee. However, if such retirement and resignation would cause the Fund or Portfolios to be out of compliance with Section 16 of the 1940 Act or any other regulations or guidance of the SEC, then such retirement and resignation will not become effective until such time as action has been taken for the Fund or Portfolios to be in compliance therewith. The “noninterested Trustees” consist of those Trustees who are not “interested persons” of the Trust and each Portfolio, as that term is defined under the 1940 Act. The business address of each Board member and officer is Two International Place, Boston, Massachusetts 02110. As used below, “BMR” refers to Boston Management and Research, “EVC” refers to Eaton Vance Corp., “EV” refers to EV LLC, “EVM” refers to Eaton Vance Management and “EVD” refers to Eaton Vance Distributors, Inc. EV is the trustee of each of EVM and BMR. Effective March 1, 2021, each of EVM, BMR, EVD and EV are indirect, wholly owned subsidiaries of Morgan Stanley. Each officer affiliated with EVM may hold a position with other EVM affiliates that is comparable to his or her position with EVM listed below. Each Trustee oversees 138 funds (with the exception of Messrs. Faust and Wennerholm and Ms. Frost who oversee 137 funds) in the Eaton Vance fund complex (including both funds and portfolios in a hub and spoke structure).
| Name and Year of Birth | Trust/Portfolio Position(s) | Length of Service | Principal Occupation(s) and Other Directorships During Past Five Years and Other Relevant Experience | |||
| Interested Trustee | ||||||
Thomas E. Faust Jr. 1958 | Trustee | Since 2007 | Chairman of Morgan Stanley Investment Management, Inc. (MSIM), member of the Board of Managers and President of EV, Chief Executive Officer of EVM and BMR, and Director of EVD. Formerly, Chairman, Chief Executive Officer and President of EVC. Mr. Faust is an interested person because of his positions with MSIM, BMR, EVM, EVD, and EV, which are affiliates of the Trust and each Portfolio, and his former position with EVC, which was an affiliate of the Trust and each Portfolio prior to March 1, 2021. Other Directorships. Formerly, Director of EVC (2007-2021) and Hexavest Inc. (investment management firm) (2012-2021). | |||
| Noninterested Trustees | ||||||
Mark R. Fetting 1954 | Trustee | Since 2016 | Private investor. Formerly held various positions at Legg Mason, Inc. (investment management firm) (2000-2012), including President, Chief Executive Officer, Director and Chairman (2008-2012), Senior Executive Vice President (2004-2008) and Executive Vice President (2001-2004). Formerly, President of Legg Mason family of funds (2001-2008). Formerly, Division President and Senior Officer of Prudential Financial Group, Inc. and related companies (investment management firm) (1991-2000). Other Directorships. None. | |||
Cynthia E. Frost 1961 | Trustee | Since 2014 | Private investor. Formerly, Chief Investment Officer of Brown University (university endowment) (2000-2012). Formerly, Portfolio Strategist for Duke Management Company (university endowment manager) (1995-2000). Formerly, Managing Director, Cambridge Associates (investment consulting company) (1989-1995). Formerly, Consultant, Bain and Company (management consulting firm) (1987-1989). Formerly, Senior Equity Analyst, BA Investment Management Company (1983-1985). Other Directorships. None. | |||
George J. Gorman 1952 | Chairperson of the Board and Trustee | Since 2021 (Chairperson) and 2014 (Trustee) | Principal at George J. Gorman LLC (consulting firm). Formerly, Senior Partner at Ernst & Young LLP (a registered public accounting firm) (1974-2009). Other Directorships. None. | |||
| 35 |
Eaton Vance
Balanced Fund
December 31, 2021
Management and Organization — continued
| Name and Year of Birth | Trust/Portfolio Position(s) | Length of Service | Principal Occupation(s) and Other Directorships During Past Five Years and Other Relevant Experience | |||
| Noninterested Trustees (continued) | ||||||
Valerie A. Mosley 1960 | Trustee | Since 2014 | Chairwoman and Chief Executive Officer of Valmo Ventures (a consulting and investment firm). Founder of Upward Wealth, Inc., dba BrightUP, a fintech platform. Formerly, Partner and Senior Vice President, Portfolio Manager and Investment Strategist at Wellington Management Company, LLP (investment management firm) (1992-2012). Formerly, Chief Investment Officer, PG Corbin Asset Management (1990-1992). Formerly worked in institutional corporate bond sales at Kidder Peabody (1986-1990). Other Directorships. Director of DraftKings, Inc. (digital sports entertainment and gaming company) (since September 2020). Director of Groupon, Inc. (e-commerce provider) (since April 2020). Director of Envestnet, Inc. (provider of intelligent systems for wealth management and financial wellness) (since 2018). Formerly, Director of Dynex Capital, Inc. (mortgage REIT) (2013-2020). | |||
William H. Park 1947 | Trustee | Since 2003 | Private investor. Formerly, Consultant (management and transactional) (2012-2014). Formerly, Chief Financial Officer, Aveon Group L.P. (investment management firm) (2010-2011). Formerly, Vice Chairman, Commercial Industrial Finance Corp. (specialty finance company) (2006-2010). Formerly, President and Chief Executive Officer, Prizm Capital Management, LLC (investment management firm) (2002-2005). Formerly, Executive Vice President and Chief Financial Officer, United Asset Management Corporation (investment management firm) (1982-2001). Formerly, Senior Manager, Price Waterhouse (now PricewaterhouseCoopers) (a registered public accounting firm) (1972-1981). Other Directorships. None. | |||
Helen Frame Peters 1948 | Trustee | Since 2008 | Professor of Finance, Carroll School of Management, Boston College. Formerly, Dean, Carroll School of Management, Boston College (2000-2002). Formerly, Chief Investment Officer, Fixed Income, Scudder Kemper Investments (investment management firm) (1998-1999). Formerly, Chief Investment Officer, Equity and Fixed Income, Colonial Management Associates (investment management firm) (1991-1998). Other Directorships. None. | |||
Keith Quinton 1958 | Trustee | Since 2018 | Private investor, researcher and lecturer. Formerly, Independent Investment Committee Member at New Hampshire Retirement System (2017-2021). Formerly, Portfolio Manager and Senior Quantitative Analyst at Fidelity Investments (investment management firm) (2001-2014). Other Directorships. Formerly, Director (2016-2021) and Chairman (2019-2021) of New Hampshire Municipal Bond Bank. | |||
Marcus L. Smith 1966 | Trustee | Since 2018 | Private investor. Formerly, Portfolio Manager at MFS Investment Management (investment management firm) (1994-2017). Other Directorships. Director of First Industrial Realty Trust, Inc. (an industrial REIT) (since 2021). Director of MSCI Inc. (global provider of investment decision support tools) (since 2017). Formerly, Director of DCT Industrial Trust Inc. (logistics real estate company) (2017-2018). | |||
Susan J. Sutherland 1957 | Trustee | Since 2015 | Private investor. Director of Ascot Group Limited and certain of its subsidiaries (insurance and reinsurance) (since 2017). Formerly, Director of Hagerty Holding Corp. (insurance) (2015-2018) and Montpelier Re Holdings Ltd. (insurance and reinsurance) (2013-2015). Formerly, Associate, Counsel and Partner at Skadden, Arps, Slate, Meagher & Flom LLP (law firm) (1982-2013). Other Directorships. Director of Kairos Acquisition Corp. (insurance/InsurTech acquisition company) (since 2021). | |||
Scott E. Wennerholm 1959 | Trustee | Since 2016 | Private investor. Formerly, Trustee at Wheelock College (postsecondary institution) (2012-2018). Formerly, Consultant at GF Parish Group (executive recruiting firm) (2016-2017). Formerly, Chief Operating Officer and Executive Vice President at BNY Mellon Asset Management (investment management firm) (2005-2011). Formerly, Chief Operating Officer and Chief Financial Officer at Natixis Global Asset Management (investment management firm) (1997-2004). Formerly, Vice President at Fidelity Investments Institutional Services (investment management firm) (1994-1997). Other Directorships. None. | |||
| 36 |
Eaton Vance
Balanced Fund
December 31, 2021
Management and Organization — continued
| Name and Year of Birth | Trust/Portfolio Position(s) | Length of Service | Principal Occupation(s) During Past Five Years | |||
| Principal Officers who are not Trustees | ||||||
Eric A. Stein 1980 | President of the Trust | Since 2020 | Vice President and Chief Investment Officer, Fixed Income of EVM and BMR. Prior to November 1, 2020, Mr. Stein was a co-Director of Eaton Vance’s Global Income Investments. Also Vice President of Calvert Research and Management (“CRM”). | |||
Edward J. Perkin 1972 | President of Stock Portfolio | Since 2014 | Chief Equity Investment Officer and Vice President of EVM and BMR since 2014. Also Vice President of CRM. | |||
Deidre E. Walsh 1971 | Vice President and Chief Legal Officer | Since 2009 | Vice President of EVM and BMR. Also Vice President of CRM. | |||
James F. Kirchner 1967 | Treasurer | Since 2007 | Vice President of EVM and BMR. Also Vice President of CRM. | |||
Jill R. Damon 1984 | Secretary | Since 2022 | Vice President of EVM and BMR since 2017. Formerly, associate at Dechert LLP (2009-2017). | |||
Richard F. Froio 1968 | Chief Compliance Officer | Since 2017 | Vice President of EVM and BMR since 2017. Formerly, Deputy Chief Compliance Officer (Adviser/Funds) and Chief Compliance Officer (Distribution) at PIMCO (2012-2017) and Managing Director at BlackRock/Barclays Global Investors (2009-2012). | |||
The SAI for the Fund includes additional information about the Trustees and officers of the Trust and each Portfolio and can be obtained without charge on Eaton Vance’s website at www.eatonvance.com or by calling 1-800-262-1122.
| 37 |
Eaton Vance Funds
| Privacy Notice | April 2021 |
| FACTS | WHAT DOES EATON VANCE DO WITH YOUR PERSONAL INFORMATION? | |
| Why? | Financial companies choose how they share your personal information. Federal law gives consumers the right to limit some but not all sharing. Federal law also requires us to tell you how we collect, share, and protect your personal information. Please read this notice carefully to understand what we do. | |
| What? | The types of personal information we collect and share depend on the product or service you have with us. This information can include:
∎ Social Security number and income ∎ investment experience and risk tolerance ∎ checking account number and wire transfer instructions | |
| How? | All financial companies need to share customers’ personal information to run their everyday business. In the section below, we list the reasons financial companies can share their customers’ personal information; the reasons Eaton Vance chooses to share; and whether you can limit this sharing. | |
| Reasons we can share your personal information | Does Eaton Vance share? | Can you limit this sharing? | ||
| For our everyday business purposes — such as to process your transactions, maintain your account(s), respond to court orders and legal investigations, or report to credit bureaus | Yes | No | ||
| For our marketing purposes — to offer our products and services to you | Yes | No | ||
| For joint marketing with other financial companies | No | We don’t share | ||
| For our investment management affiliates’ everyday business purposes — information about your transactions, experiences, and creditworthiness | Yes | Yes | ||
| For our affiliates’ everyday business purposes — information about your transactions and experiences | Yes | No | ||
| For our affiliates’ everyday business purposes — information about your creditworthiness | No | We don’t share | ||
| For our investment management affiliates to market to you | Yes | Yes | ||
| For our affiliates to market to you | No | We don’t share | ||
| For nonaffiliates to market to you | No | We don’t share |
| To limit our sharing | Call toll-free 1-800-262-1122 or email: EVPrivacy@eatonvance.com
Please note:
If you are a new customer, we can begin sharing your information 30 days from the date we sent this notice. When you are no longer our customer, we continue to share your information as described in this notice. However, you can contact us at any time to limit our sharing. | |
| Questions? | Call toll-free 1-800-262-1122 or email: EVPrivacy@eatonvance.com | |
| 38 |
Eaton Vance Funds
| Privacy Notice — continued | April 2021 |
| Page 2 |
| Who we are | ||
| Who is providing this notice? | Eaton Vance Management, Eaton Vance Distributors, Inc., Eaton Vance Trust Company, Eaton Vance Management (International) Limited, Eaton Vance Advisers International Ltd., Eaton Vance Global Advisors Limited, Eaton Vance Management’s Real Estate Investment Group, Boston Management and Research, Calvert Research and Management, Eaton Vance and Calvert Fund Families and our investment advisory affiliates (“Eaton Vance”) (see Investment Management Affiliates definition below) | |
| What we do | ||
| How does Eaton Vance protect my personal information? | To protect your personal information from unauthorized access and use, we use security measures that comply with federal law. These measures include computer safeguards and secured files and buildings. We have policies governing the proper handling of customer information by personnel and requiring third parties that provide support to adhere to appropriate security standards with respect to such information. | |
| How does Eaton Vance collect my personal information? | We collect your personal information, for example, when you
∎ open an account or make deposits or withdrawals from your account ∎ buy securities from us or make a wire transfer ∎ give us your contact information
We also collect your personal information from others, such as credit bureaus, affiliates, or other companies. | |
| Why can’t I limit all sharing? | Federal law gives you the right to limit only
∎ sharing for affiliates’ everyday business purposes — information about your creditworthiness ∎ affiliates from using your information to market to you ∎ sharing for nonaffiliates to market to you
State laws and individual companies may give you additional rights to limit sharing. See below for more on your rights under state law. | |
| Definitions | ||
| Investment Management Affiliates | Eaton Vance Investment Management Affiliates include registered investment advisers, registered broker-dealers, and registered and unregistered funds. Investment Management Affiliates does not include entities associated with Morgan Stanley Wealth Management, such as Morgan Stanley Smith Barney LLC and Morgan Stanley & Co. | |
| Affiliates | Companies related by common ownership or control. They can be financial and nonfinancial companies.
∎ Our affiliates include companies with a Morgan Stanley name and financial companies such as Morgan Stanley Smith Barney LLC and Morgan Stanley & Co. | |
| Nonaffiliates | Companies not related by common ownership or control. They can be financial and nonfinancial companies.
∎ Eaton Vance does not share with nonaffiliates so they can market to you. | |
| Joint marketing | A formal agreement between nonaffiliated financial companies that together market financial products or services to you.
∎ Eaton Vance doesn’t jointly market. | |
| Other important information | ||
Vermont: Except as permitted by law, we will not share personal information we collect about Vermont residents with Nonaffiliates unless you provide us with your written consent to share such information.
California: Except as permitted by law, we will not share personal information we collect about California residents with Nonaffiliates and we will limit sharing such personal information with our Affiliates to comply with California privacy laws that apply to us. | ||
| 39 |
Eaton Vance Funds
Delivery of Shareholder Documents. The Securities and Exchange Commission (SEC) permits funds to deliver only one copy of shareholder documents, including prospectuses, proxy statements and shareholder reports, to fund investors with multiple accounts at the same residential or post office box address. This practice is often called “householding” and it helps eliminate duplicate mailings to shareholders. Eaton Vance, or your financial intermediary, may household the mailing of your documents indefinitely unless you instruct Eaton Vance, or your financial intermediary, otherwise. If you would prefer that your Eaton Vance documents not be householded, please contact Eaton Vance at 1-800-262-1122, or contact your financial intermediary. Your instructions that householding not apply to delivery of your Eaton Vance documents will typically be effective within 30 days of receipt by Eaton Vance or your financial intermediary.
Portfolio Holdings. Each Eaton Vance Fund and its underlying Portfolio(s) (if applicable) files a schedule of portfolio holdings on Part F to Form N-PORT with the SEC. Certain information filed on Form N-PORT may be viewed on the Eaton Vance website at www.eatonvance.com, by calling Eaton Vance at 1-800-262-1122 or in the EDGAR database on the SEC’s website at www.sec.gov.
Proxy Voting. From time to time, funds are required to vote proxies related to the securities held by the funds. The Eaton Vance Funds or their underlying Portfolios (if applicable) vote proxies according to a set of policies and procedures approved by the Funds’ and Portfolios’ Boards. You may obtain a description of these policies and procedures and information on how the Funds or Portfolios voted proxies relating to portfolio securities during the most recent 12-month period ended June 30, without charge, upon request, by calling 1-800-262-1122 and by accessing the SEC’s website at www.sec.gov.
| 40 |
Investment Adviser of Core Bond Portfolio and Stock Portfolio
Boston Management and Research
Two International Place
Boston, MA 02110
Investment Adviser and Administrator of Eaton Vance Balanced Fund
Eaton Vance Management
Two International Place
Boston, MA 02110
Principal Underwriter*
Eaton Vance Distributors, Inc.
Two International Place
Boston, MA 02110
(617) 482-8260
Custodian
State Street Bank and Trust Company
State Street Financial Center, One Lincoln Street
Boston, MA 02111
Transfer Agent
BNY Mellon Investment Servicing (US) Inc.
Attn: Eaton Vance Funds
P.O. Box 9653
Providence, RI 02940-9653
(800) 262-1122
Independent Registered Public Accounting Firm
Deloitte & Touche LLP
200 Berkeley Street
Boston, MA 02116-5022
Fund Offices
Two International Place
Boston, MA 02110
| * | FINRA BrokerCheck. Investors may check the background of their Investment Professional by contacting the Financial Industry Regulatory Authority (FINRA). FINRA BrokerCheck is a free tool to help investors check the professional background of current and former FINRA-registered securities firms and brokers. FINRA BrokerCheck is available by calling 1-800-289-9999 and at www.FINRA.org. The FINRA BrokerCheck brochure describing this program is available to investors at www.FINRA.org. |
162 12.31.21

Eaton Vance
Core Bond Fund
Annual Report
December 31, 2021

Commodity Futures Trading Commission Registration. The Commodity Futures Trading Commission (“CFTC”) has adopted regulations that subject registered investment companies and advisers to regulation by the CFTC if a fund invests more than a prescribed level of its assets in certain CFTC-regulated instruments (including futures, certain options and swap agreements) or markets itself as providing investment exposure to such instruments. The investment adviser has claimed an exclusion from the definition of “commodity pool operator” under the Commodity Exchange Act with respect to its management of the Fund. Accordingly, neither the Fund nor the adviser with respect to the operation of the Fund is subject to CFTC regulation. Because of its management of other strategies, the Fund’s adviser is registered with the CFTC as a commodity pool operator. The adviser is also registered as a commodity trading advisor.
Fund shares are not insured by the FDIC and are not deposits or other obligations of, or guaranteed by, any depository institution. Shares are subject to investment risks, including possible loss of principal invested.
This report must be preceded or accompanied by a current summary prospectus or prospectus. Before investing, investors should consider carefully the investment objective, risks, and charges and expenses of a mutual fund. This and other important information is contained in the summary prospectus and prospectus, which can be obtained from a financial intermediary. Prospective investors should read the prospectus carefully before investing. For further information, please call 1-800-262-1122.
Annual Report December 31, 2021
Eaton Vance
Core Bond Fund
| 2 | ||||
| 3 | ||||
| 4 | ||||
| 5 | ||||
| 6 | ||||
| 7 | ||||
| 15 and 36 | ||||
| 16 | ||||
| 37 | ||||
| 40 | ||||
| 42 |
Eaton Vance
Core Bond Fund
December 31, 2021
Management’s Discussion of Fund Performance1
Economic and Market Conditions
During the 12-month period ended December 31, 2021, the U.S. fixed-income market was influenced by several key events: a change in U.S. federal government leadership, the introduction of COVID-19 vaccines, and the reopening of the U.S. economy. Against that background, fixed-income returns were generally weak, while equity markets posted strong returns as optimism about the economic reopening returned to the market.
The period began with multiple drugmakers announcing successful clinical trials in the development of COVID-19 vaccines. During the first quarter of the period, the U.S. Federal Reserve (the Fed) maintained accommodative monetary policies and Congress passed $900 billion in additional fiscal stimulus. Stocks performed well, credit spreads tightened, and long-term U.S. Treasury yields rose as the U.S. dollar weakened during the first quarter. Bond markets suffered in the first quarter as the Bloomberg U.S. Aggregate Bond Index posted its worst quarterly return in 40 years.
During the second quarter of 2021, global equity markets grew in value, while fixed-income markets staged a bounce back as the U.S. Treasury yield curve flattened. The tighter monetary stance taken by the Fed in June raised expectations of potential interest rate hikes to help manage inflation. At the same time, the Fed announced plans to taper its monthly bond purchases.
As 2021 progressed, inflation became a growing concern among investors. Strong demand for goods and services, ongoing supply-side constraints, and rising commodity prices contributed to inflationary fears. As a result, many central banks worldwide began to take less accommodative postures.
In the fall, the Fed accelerated the tapering of its bond-buying policy and in December indicated it might raise interest rates as much as three times in 2022. Although this caused a further flattening of the U.S. Treasury yield curve, it was not accompanied by the significant yield spread widening that typically comes with a flattening curve. Investment-grade corporate credit spreads widened modestly during the fourth quarter, while high yield bond spreads tightened. The Bloomberg U.S. Aggregate Bond Index was essentially flat during the final quarter of the period, capping a year of weak returns.
The Bloomberg U.S. Aggregate Bond Index returned -1.54% in 2021, which was its first calendar-year loss since 2013. The ICE BofA U.S. High Yield and S&P/LSTA Leveraged Loan indexes gained 5.36% and 5.20%, respectively, during the period. The S&P 500® Index returned 28.71% and the Nasdaq Composite Index returned 22.18% during the period.
Fund Performance
For the 12-month period ended December 31, 2021, Eaton Vance Core Bond Fund (the Fund) returned 0.36% for Class A shares at net asset value (NAV), outperforming its benchmark, the Bloomberg U.S. Aggregate Bond Index (the Index), which returned -1.54%.
The Fund’s security selections contributed most to returns relative to the Index during the period. Selections within commercial mortgage-backed securities, investment-grade corporate bonds, and asset-backed securities were particularly beneficial.
Sector allocation positioning in the Fund further contributed to relative performance. Out-of-Index allocations to U.S. Treasury Inflation-Protected Securities and high yield corporate securities, and an underweight exposure to U.S. Treasurys contributed most to returns relative to the Index during the period.
Duration and yield-curve positioning within the Fund detracted from performance relative to the Index. The Fund’s use of derivatives was a minor detractor from relative performance as well. An overweight exposure to asset-backed securities and security selections within U.S. Treasurys also had negative impacts on relative returns during the period.
See Endnotes and Additional Disclosures in this report.
Past performance is no guarantee of future results. Returns are historical and are calculated by determining the percentage change in net asset value (NAV) or offering price (as applicable) with all distributions reinvested. Investment return and principal value will fluctuate so that shares, when redeemed, may be worth more or less than their original cost. Performance for periods less than or equal to one year is cumulative. Performance is for the stated time period only; due to market volatility, current Fund performance may be lower or higher than the quoted return. For performance as of the most recent month-end, please refer to eatonvance.com.
| 2 |
Eaton Vance
Core Bond Fund
December 31, 2021
Portfolio Manager(s) Vishal Khanduja, CFA and Brian S. Ellis, CFA
| % Average Annual Total Returns | Class Inception Date | Performance Inception Date | One Year | Five Years | Ten Years | |||||||||||||||
Class A at NAV | 01/05/2009 | 03/07/2000 | 0.36 | % | 4.09 | % | 3.11 | % | ||||||||||||
Class A with 4.75% Maximum Sales Charge | — | — | -4.39 | 3.09 | 2.61 | |||||||||||||||
Class I at NAV | 03/21/2007 | 03/07/2000 | 0.71 | 4.35 | 3.37 | |||||||||||||||
| ||||||||||||||||||||
Bloomberg U.S. Aggregate Bond Index | — | — | -1.54 | % | 3.57 | % | 2.90 | % | ||||||||||||
| % Total Annual Operating Expense Ratios4 | Class A | Class I | ||||||||||||||||||
Gross | 0.86 | % | 0.61 | % | ||||||||||||||||
Net | 0.74 | 0.49 | ||||||||||||||||||
Growth of $10,000
This graph shows the change in value of a hypothetical investment of $10,000 in Class A of the Fund for the period indicated. For comparison, the same investment is shown in the indicated index.
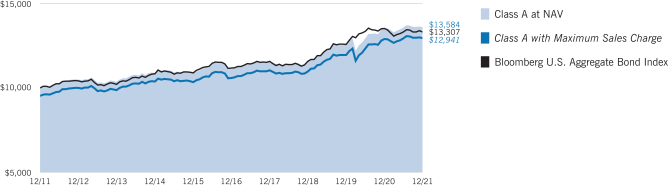
| Growth of Investment | Amount Invested | Period Beginning | At NAV | With Maximum Sales Charge | ||||||||||||
Class I | $250,000 | 12/31/2011 | $348,191 | N.A. | ||||||||||||
See Endnotes and Additional Disclosures in this report.
Past performance is no guarantee of future results. Returns are historical and are calculated by determining the percentage change in net asset value (NAV) or offering price (as applicable) with all distributions reinvested. Investment return and principal value will fluctuate so that shares, when redeemed, may be worth more or less than their original cost. Performance for periods less than or equal to one year is cumulative. Performance is for the stated time period only; due to market volatility, current Fund performance may be lower or higher than the quoted return. For performance as of the most recent month-end, please refer to eatonvance.com.
| 3 |
Eaton Vance
Core Bond Fund
December 31, 2021
Asset Allocation (% of total investments)
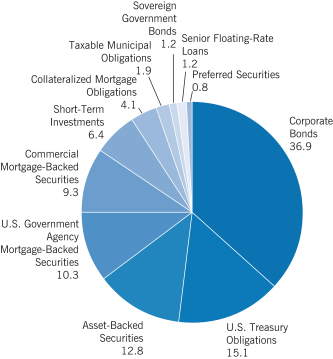
See Endnotes and Additional Disclosures in this report.
| 4 |
Eaton Vance
Core Bond Fund
December 31, 2021
Endnotes and Additional Disclosures
| 1 | The views expressed in this report are those of the portfolio manager(s) and are current only through the date stated at the top of this page. These views are subject to change at any time based upon market or other conditions, and Eaton Vance and the Fund(s) disclaim any responsibility to update such views. These views may not be relied upon as investment advice and, because investment decisions are based on many factors, may not be relied upon as an indication of trading intent on behalf of any Eaton Vance fund. This commentary may contain statements that are not historical facts, referred to as “forward-looking statements.” The Fund’s actual future results may differ significantly from those stated in any forward-looking statement, depending on factors such as changes in securities or financial markets or general economic conditions, the volume of sales and purchases of Fund shares, the continuation of investment advisory, administrative and service contracts, and other risks discussed from time to time in the Fund’s filings with the Securities and Exchange Commission. |
| 2 | Bloomberg U.S. Aggregate Bond Index is an unmanaged index of domestic investment-grade bonds, including corporate, government and mortgage-backed securities. Unless otherwise stated, index returns do not reflect the effect of any applicable sales charges, commissions, expenses, taxes or leverage, as applicable. It is not possible to invest directly in an index. |
| 3 | Total Returns at NAV do not include applicable sales charges. If sales charges were deducted, the returns would be lower. Total Returns shown with maximum sales charge reflect the stated maximum sales charge. Unless otherwise stated, performance does not reflect the deduction of taxes on Fund distributions or redemptions of Fund shares. |
| 4 | Source: Fund prospectus. Net expense ratios reflect a contractual expense reimbursement that continues through 4/30/22. The expense ratios for the current reporting period can be found in the Financial Highlights section of this report. Performance reflects expenses waived and/or reimbursed, if applicable. Without such waivers and/or reimbursements, performance would have been lower. |
| 5 | Fund invests in an affiliated investment company (Portfolio) with the same objective(s) and policies as the Fund. References to investments are to the Portfolio’s holdings. |
Fund profile subject to change due to active management.
Additional Information
ICE BofA U.S. High Yield Index is an unmanaged index of below investment grade U.S. corporate bonds. ICE® BofA® indices are not for redistribution or other uses; provided “as is”, without warranties, and with no liability. Eaton Vance has prepared this report and ICE Data Indices, LLC does not endorse it, or guarantee, review, or endorse Eaton Vance’s products. BofA® is a licensed registered trademark of Bank of America Corporation in the United States and other countries. S&P/LSTA Leveraged Loan Index is an unmanaged index of the institutional leveraged loan market. S&P 500® Index is an unmanaged index of large-cap stocks commonly used as a measure of U.S. stock market performance. S&P/LSTA Leveraged Loan indices and S&P Dow Jones Indices are products of S&P Dow Jones Indices LLC (“S&P DJI”) and have been licensed for use. S&P® and S&P 500® are registered trademarks of S&P DJI; Dow Jones® is a registered trademark of Dow Jones Trademark Holdings LLC (“Dow Jones”); LSTA is a trademark of Loan Syndications and Trading Association, Inc. S&P DJI, Dow Jones, their respective affiliates and their third party licensors do not sponsor, endorse, sell or promote the Fund, will not have any liability with respect thereto and do not have any liability for any errors, omissions, or interruptions of the S&P Dow Jones Indices. Nasdaq Composite Index is a market capitalization-weighted index of all domestic and international securities listed on Nasdaq. Source: Nasdaq, Inc. The information is provided by Nasdaq (with its affiliates, are referred to as the “Corporations”) and Nasdaq’s third party licensors on an “as is” basis and the Corporations make no guarantees and bear no liability of any kind with respect to the information or the Fund.
Credit spread is the difference in yield between a U.S. Treasury bond and another debt security of the same maturity but different credit quality.
Yield curve is a graphical representation of the yields offered by bonds of various maturities. The yield curve flattens when long-term interest rates fall and/or short-term interest rates increase, and the yield curve steepens when long-term interest rates increase and/or short-term interest rates fall.
Duration is a measure of the expected change in price of a bond — in percentage terms — given a one percent change in interest rates, all else being constant. Securities with lower durations tend to be less sensitive to interest rate changes.
| 5 |
Eaton Vance
Core Bond Fund
December 31, 2021
Example: As a Fund shareholder, you incur two types of costs: (1) transaction costs, including sales charges (loads) on purchases and redemption fees (if applicable); and (2) ongoing costs, including management fees; distribution and/or service fees; and other Fund expenses. This Example is intended to help you understand your ongoing costs (in dollars) of Fund investing and to compare these costs with the ongoing costs of investing in other mutual funds. The Example is based on an investment of $1,000 invested at the beginning of the period and held for the entire period (July 1, 2021 – December 31, 2021).
Actual Expenses: The first section of the table below provides information about actual account values and actual expenses. You may use the information in this section, together with the amount you invested, to estimate the expenses that you paid over the period. Simply divide your account value by $1,000 (for example, an $8,600 account value divided by $1,000 = 8.6), then multiply the result by the number in the first section under the heading entitled “Expenses Paid During Period” to estimate the expenses you paid on your account during this period.
Hypothetical Example for Comparison Purposes: The second section of the table below provides information about hypothetical account values and hypothetical expenses based on the actual Fund expense ratio and an assumed rate of return of 5% per year (before expenses), which is not the actual Fund return. The hypothetical account values and expenses may not be used to estimate the actual ending account balance or expenses you paid for the period. You may use this information to compare the ongoing costs of investing in your Fund and other funds. To do so, compare this 5% hypothetical example with the 5% hypothetical examples that appear in the shareholder reports of the other funds.
Please note that the expenses shown in the table are meant to highlight your ongoing costs only and do not reflect any transactional costs, such as sales charges (loads) or redemption fees (if applicable). Therefore, the second section of the table is useful in comparing ongoing costs only, and will not help you determine the relative total costs of owning different funds. In addition, if these transactional costs were included, your costs would be higher.
| Beginning Account Value (7/1/21) | Ending Account Value (12/31/21) | Expenses Paid During Period* (7/1/21 – 12/31/21) | Annualized Expense Ratio | |||||||||||||
Actual | ||||||||||||||||
Class A | $ | 1,000.00 | $ | 1,001.10 | $ | 3.73 | ** | 0.74 | % | |||||||
Class I | $ | 1,000.00 | $ | 1,003.30 | $ | 2.47 | ** | 0.49 | % | |||||||
Hypothetical | ||||||||||||||||
(5% return per year before expenses) | ||||||||||||||||
Class A | $ | 1,000.00 | $ | 1,021.48 | $ | 3.77 | ** | 0.74 | % | |||||||
Class I | $ | 1,000.00 | $ | 1,022.74 | $ | 2.50 | ** | 0.49 | % | |||||||
| * | Expenses are equal to the Fund’s annualized expense ratio for the indicated Class, multiplied by the average account value over the period, multiplied by 184/365 (to reflect the one-half year period). The Example assumes that the $1,000 was invested at the net asset value per share determined at the close of business on June 30, 2021. The Example reflects the expenses of both the Fund and the Portfolio. |
| ** | Absent an allocation of certain expenses to affiliates, expenses would be higher. |
| 6 |
Eaton Vance
Core Bond Fund
December 31, 2021
Statement of Assets and Liabilities
| Assets | December 31, 2021 | |||
Investment in Core Bond Portfolio, at value (identified cost, $135,626,162) | $ | 136,924,979 | ||
Receivable for Fund shares sold | 487,914 | |||
Receivable from affiliate | 9,067 | |||
Total assets | $ | 137,421,960 | ||
| Liabilities |
| |||
Payable for Fund shares redeemed | $ | 13,284,694 | ||
Distributions payable | 1,578 | |||
Payable to affiliates: | ||||
Distribution and service fees | 3,717 | |||
Trustees’ fees | 125 | |||
Accrued expenses | 39,387 | |||
Total liabilities | $ | 13,329,501 | ||
Net Assets | $ | 124,092,459 | ||
| Sources of Net Assets |
| |||
Paid-in capital | $ | 124,293,103 | ||
Accumulated loss | (200,644 | ) | ||
Net Assets | $ | 124,092,459 | ||
| Class A Shares |
| |||
Net Assets | $ | 17,408,942 | ||
Shares Outstanding | 1,745,338 | |||
Net Asset Value and Redemption Price Per Share | ||||
(net assets ÷ shares of beneficial interest outstanding) | $ | 9.97 | ||
Maximum Offering Price Per Share | ||||
(100 ÷ 95.25 of net asset value per share) | $ | 10.47 | ||
| Class I Shares |
| |||
Net Assets | $ | 106,683,517 | ||
Shares Outstanding | 10,713,202 | |||
Net Asset Value, Offering Price and Redemption Price Per Share | ||||
(net assets ÷ shares of beneficial interest outstanding) | $ | 9.96 | ||
On sales of $50,000 or more, the offering price of Class A shares is reduced.
| 7 | See Notes to Financial Statements. |
Eaton Vance
Core Bond Fund
December 31, 2021
Statement of Operations
| Investment Income | Year Ended December 31, 2021 | |||
Interest allocated from Portfolio (net of foreign taxes, $162) | $ | 3,678,020 | ||
Dividends allocated from Portfolio (net of foreign taxes, $966) | 80,781 | |||
Expenses allocated from Portfolio | (722,939 | ) | ||
Total investment income from Portfolio | $ | 3,035,862 | ||
| Expenses | ||||
Distribution and shareholder service fees | ||||
Class A | $ | 48,693 | ||
Trustees’ fees and expenses | 500 | |||
Custodian fee | 19,382 | |||
Transfer and dividend disbursing agent fees | 50,111 | |||
Legal and accounting services | 32,236 | |||
Printing and postage | 13,658 | |||
Registration fees | 40,684 | |||
Miscellaneous | 9,336 | |||
Total expenses | $ | 214,600 | ||
Deduct — | ||||
Allocation of expenses to affiliate | $ | 165,802 | ||
Total expense reductions | $ | 165,802 | ||
Net expenses | $ | 48,798 | ||
Net investment income | $ | 2,987,064 | ||
| Realized and Unrealized Gain (Loss) from Portfolio |
| |||
Net realized gain (loss) — | ||||
Investment transactions | $ | 2,161,081 | ||
Financial futures contracts | 62,368 | |||
Net realized gain | $ | 2,223,449 | ||
Change in unrealized appreciation (depreciation) — | ||||
Investments | $ | (4,141,164 | ) | |
Financial futures contracts | (25,871 | ) | ||
Net change in unrealized appreciation (depreciation) | $ | (4,167,035 | ) | |
Net realized and unrealized loss | $ | (1,943,586 | ) | |
Net increase in net assets from operations | $ | 1,043,478 | ||
| 8 | See Notes to Financial Statements. |
Eaton Vance
Core Bond Fund
December 31, 2021
Statements of Changes in Net Assets
| Year Ended December 31, | ||||||||
| Increase (Decrease) in Net Assets | 2021 | 2020 | ||||||
From operations — | ||||||||
Net investment income | $ | 2,987,064 | $ | 4,089,331 | ||||
Net realized gain | 2,223,449 | 5,096,232 | ||||||
Net change in unrealized appreciation (depreciation) | (4,167,035 | ) | 1,176,021 | |||||
Net increase in net assets from operations | $ | 1,043,478 | $ | 10,361,584 | ||||
Distributions to shareholders — | ||||||||
Class A | $ | (604,619 | ) | $ | (1,146,231 | ) | ||
Class I | (4,330,652 | ) | (7,554,364 | ) | ||||
Total distributions to shareholders | $ | (4,935,271 | ) | $ | (8,700,595 | ) | ||
Transactions in shares of beneficial interest — | ||||||||
Proceeds from sale of shares | ||||||||
Class A | $ | 1,738,879 | $ | 8,170,627 | ||||
Class I | 29,318,252 | 65,035,083 | ||||||
Net asset value of shares issued to shareholders in payment of distributions declared | ||||||||
Class A | 573,920 | 1,095,803 | ||||||
Class I | 4,318,831 | 7,431,122 | ||||||
Cost of shares redeemed | ||||||||
Class A | (6,145,314 | ) | (16,300,986 | ) | ||||
Class I | (63,415,971 | ) | (111,324,880 | ) | ||||
Net decrease in net assets from Fund share transactions | $ | (33,611,403 | ) | $ | (45,893,231 | ) | ||
Net decrease in net assets | $ | (37,503,196 | ) | $ | (44,232,242 | ) | ||
| Net Assets |
| |||||||
At beginning of year | $ | 161,595,655 | $ | 205,827,897 | ||||
At end of year | $ | 124,092,459 | $ | 161,595,655 | ||||
| 9 | See Notes to Financial Statements. |
Eaton Vance
Core Bond Fund
December 31, 2021
Financial Highlights
| Class A | ||||||||||||||||||||
| Year Ended December 31, | ||||||||||||||||||||
| 2021 | 2020 | 2019 | 2018 | 2017 | ||||||||||||||||
Net asset value — Beginning of year | $ | 10.260 | $ | 10.010 | $ | 9.490 | $ | 9.840 | $ | 9.690 | ||||||||||
| Income (Loss) From Operations | ||||||||||||||||||||
Net investment income(1) | $ | 0.184 | $ | 0.226 | $ | 0.260 | $ | 0.273 | $ | 0.217 | ||||||||||
Net realized and unrealized gain (loss) | (0.148 | ) | 0.550 | 0.587 | (0.338 | ) | 0.187 | |||||||||||||
Total income (loss) from operations | $ | 0.036 | $ | 0.776 | $ | 0.847 | $ | (0.065 | ) | $ | 0.404 | |||||||||
| Less Distributions | ||||||||||||||||||||
From net investment income | $ | (0.205 | ) | $ | (0.249 | ) | $ | (0.278 | ) | $ | (0.285 | ) | $ | (0.254 | ) | |||||
From net realized gain | (0.121 | ) | (0.277 | ) | (0.049 | ) | — | — | ||||||||||||
Total distributions | $ | (0.326 | ) | $ | (0.526 | ) | $ | (0.327 | ) | $ | (0.285 | ) | $ | (0.254 | ) | |||||
Net asset value — End of year | $ | 9.970 | $ | 10.260 | $ | 10.010 | $ | 9.490 | $ | 9.840 | ||||||||||
Total Return(2)(3) | 0.36 | % | 7.88 | % | 9.00 | % | (0.64 | )% | 4.20 | % | ||||||||||
| Ratios/Supplemental Data | ||||||||||||||||||||
Net assets, end of year (000’s omitted) | $ | 17,409 | $ | 21,770 | $ | 28,309 | $ | 25,158 | $ | 34,064 | ||||||||||
Ratios (as a percentage of average daily net assets):(4) | ||||||||||||||||||||
Expenses(3) | 0.74 | % | 0.74 | % | 0.74 | % | 0.74 | % | 0.75 | % | ||||||||||
Net investment income | 1.81 | % | 2.23 | % | 2.63 | % | 2.85 | % | 2.21 | % | ||||||||||
Portfolio Turnover of the Portfolio | 122 | % | 93 | % | 89 | % | 65 | % | 123 | % | ||||||||||
| (1) | Computed using average shares outstanding. |
| (2) | Returns are historical and are calculated by determining the percentage change in net asset value with all distributions reinvested and do not reflect the effect of sales charges. |
| (3) | The investment adviser of the Portfolio and/or the administrator reimbursed certain operating expenses (equal to 0.12%, 0.12%, 0.11%, 0.11% and 0.11% of average daily net assets for the years ended December 31, 2021, 2020, 2019, 2018 and 2017, respectively). Absent this reimbursement, total return would be lower. |
| (4) | Includes the Fund’s share of the Portfolio’s allocated expenses. |
| 10 | See Notes to Financial Statements. |
Eaton Vance
Core Bond Fund
December 31, 2021
Financial Highlights — continued
| Class I | ||||||||||||||||||||
| Year Ended December 31, | ||||||||||||||||||||
| 2021 | 2020 | 2019 | 2018 | 2017 | ||||||||||||||||
Net asset value — Beginning of year | $ | 10.240 | $ | 9.990 | $ | 9.470 | $ | 9.830 | $ | 9.680 | ||||||||||
| Income (Loss) From Operations | ||||||||||||||||||||
Net investment income(1) | $ | 0.209 | $ | 0.251 | $ | 0.283 | $ | 0.282 | $ | 0.241 | ||||||||||
Net realized and unrealized gain (loss) | (0.138 | ) | 0.550 | 0.588 | (0.333 | ) | 0.187 | |||||||||||||
Total income (loss) from operations | $ | 0.071 | $ | 0.801 | $ | 0.871 | $ | (0.051 | ) | $ | 0.428 | |||||||||
| Less Distributions | ||||||||||||||||||||
From net investment income | $ | (0.230 | ) | $ | (0.274 | ) | $ | (0.302 | ) | $ | (0.309 | ) | $ | (0.278 | ) | |||||
From net realized gain | (0.121 | ) | (0.277 | ) | (0.049 | ) | — | — | ||||||||||||
Total distributions | $ | (0.351 | ) | $ | (0.551 | ) | $ | (0.351 | ) | $ | (0.309 | ) | $ | (0.278 | ) | |||||
Net asset value — End of year | $ | 9.960 | $ | 10.240 | $ | 9.990 | $ | 9.470 | $ | 9.830 | ||||||||||
Total Return(2)(3) | 0.71 | % | 8.16 | % | 9.29 | % | (0.50 | )% | 4.47 | % | ||||||||||
| Ratios/Supplemental Data | ||||||||||||||||||||
Net assets, end of year (000’s omitted) | $ | 106,684 | $ | 139,826 | $ | 177,519 | $ | 149,220 | $ | 130,714 | ||||||||||
Ratios (as a percentage of average daily net assets):(4) | ||||||||||||||||||||
Expenses(3) | 0.49 | % | 0.49 | % | 0.49 | % | 0.49 | % | 0.50 | % | ||||||||||
Net investment income | 2.06 | % | 2.47 | % | 2.87 | % | 2.95 | % | 2.46 | % | ||||||||||
Portfolio Turnover of the Portfolio | 122 | % | 93 | % | 89 | % | 65 | % | 123 | % | ||||||||||
| (1) | Computed using average shares outstanding. |
| (2) | Returns are historical and are calculated by determining the percentage change in net asset value with all distributions reinvested. |
| (3) | The investment adviser of the Portfolio and/or the administrator reimbursed certain operating expenses (equal to 0.12%, 0.12%, 0.11%, 0.11% and 0.11% of average daily net assets for the years ended December 31, 2021, 2020, 2019, 2018 and 2017, respectively). Absent this reimbursement, total return would be lower. |
| (4) | Includes the Fund’s share of the Portfolio’s allocated expenses. |
| 11 | See Notes to Financial Statements. |
Eaton Vance
Core Bond Fund
December 31, 2021
Notes to Financial Statements
1 Significant Accounting Policies
Eaton Vance Core Bond Fund (the Fund) is a diversified series of Eaton Vance Special Investment Trust (the Trust). The Trust is a Massachusetts business trust registered under the Investment Company Act of 1940, as amended (the 1940 Act), as an open-end management investment company. The Fund offers two classes of shares. Class A shares are generally sold subject to a sales charge imposed at time of purchase. Class I shares are sold at net asset value and are not subject to a sales charge. Each class represents a pro-rata interest in the Fund, but votes separately on class-specific matters and (as noted below) is subject to different expenses. Realized and unrealized gains and losses are allocated daily to each class of shares based on the relative net assets of each class to the total net assets of the Fund. Net investment income, other than class-specific expenses, is allocated daily to each class of shares based upon the ratio of the value of each class’s paid shares to the total value of all paid shares. Each class of shares differs in its distribution plan and certain other class-specific expenses. The Fund invests all of its investable assets in interests in Core Bond Portfolio (the Portfolio), a Massachusetts business trust, having the same investment objectives and policies as the Fund. The value of the Fund’s investment in the Portfolio reflects the Fund’s proportionate interest in the net assets of the Portfolio (24.0% at December 31, 2021). The performance of the Fund is directly affected by the performance of the Portfolio. The financial statements of the Portfolio, including the portfolio of investments, are included elsewhere in this report and should be read in conjunction with the Fund’s financial statements.
The following is a summary of significant accounting policies of the Fund. The policies are in conformity with accounting principles generally accepted in the United States of America (U.S. GAAP). The Fund is an investment company and follows accounting and reporting guidance in the Financial Accounting Standards Board (FASB) Accounting Standards Codification Topic 946.
A Investment Valuation — Valuation of securities by the Portfolio is discussed in Note 1A of the Portfolio’s Notes to Financial Statements, which are included elsewhere in this report.
B Income — The Fund’s net investment income or loss consists of the Fund’s pro-rata share of the net investment income or loss of the Portfolio, less all actual and accrued expenses of the Fund.
C Federal Taxes — The Fund’s policy is to comply with the provisions of the Internal Revenue Code applicable to regulated investment companies and to distribute to shareholders each year substantially all of its net investment income, and all or substantially all of its net realized capital gains. Accordingly, no provision for federal income or excise tax is necessary.
As of December 31, 2021, the Fund had no uncertain tax positions that would require financial statement recognition, de-recognition, or disclosure. The Fund files a U.S. federal income tax return annually after its fiscal year-end, which is subject to examination by the Internal Revenue Service for a period of three years from the date of filing.
D Expenses — The majority of expenses of the Trust are directly identifiable to an individual fund. Expenses which are not readily identifiable to a specific fund are allocated taking into consideration, among other things, the nature and type of expense and the relative size of the funds.
E Use of Estimates — The preparation of the financial statements in conformity with U.S. GAAP requires management to make estimates and assumptions that affect the reported amounts of assets and liabilities at the date of the financial statements and the reported amounts of income and expense during the reporting period. Actual results could differ from those estimates.
F Indemnifications — Under the Trust’s organizational documents, its officers and Trustees may be indemnified against certain liabilities and expenses arising out of the performance of their duties to the Fund. Under Massachusetts law, if certain conditions prevail, shareholders of a Massachusetts business trust (such as the Trust) could be deemed to have personal liability for the obligations of the Trust. However, the Trust’s Declaration of Trust contains an express disclaimer of liability on the part of Fund shareholders and the By-laws provide that the Trust shall assume, upon request by the shareholder, the defense on behalf of any Fund shareholders. Moreover, the By-laws also provide for indemnification out of Fund property of any shareholder held personally liable solely by reason of being or having been a shareholder for all loss or expense arising from such liability. Additionally, in the normal course of business, the Fund enters into agreements with service providers that may contain indemnification clauses. The Fund’s maximum exposure under these arrangements is unknown as this would involve future claims that may be made against the Fund that have not yet occurred.
G Other — Investment transactions are accounted for on a trade date basis.
2 Distributions to Shareholders and Income Tax Information
The Fund declares dividends daily to shareholders of record at the time of declaration. Distributions are generally paid monthly. Distributions of realized capital gains are made at least annually. Distributions are declared separately for each class of shares. Shareholders may reinvest income and capital gain distributions in additional shares of the same class of the Fund at the net asset value as of the reinvestment date or, at the election of the shareholder, receive distributions in cash. Distributions to shareholders are determined in accordance with income tax regulations, which may differ from U.S. GAAP. As required by U.S. GAAP, only distributions in excess of tax basis earnings and profits are reported in the financial statements as a return of capital. Permanent differences between book and tax accounting relating to distributions are reclassified to paid-in capital. For tax purposes, distributions from short-term capital gains are considered to be from ordinary income.
| 12 |
Eaton Vance
Core Bond Fund
December 31, 2021
Notes to Financial Statements — continued
The tax character of distributions declared for the years ended December 31, 2021 and December 31, 2020 was as follows:
| Year Ended December 31, | ||||||||
| 2021 | 2020 | |||||||
Ordinary income | $ | 3,431,588 | $ | 6,983,447 | ||||
Long-term capital gains | $ | 1,503,683 | $ | 1,717,148 | ||||
During the year ended December 31, 2021, distributable earnings was decreased by $217,525 and paid-in capital was increased by $217,525 due to the Fund’s use of equalization accounting. Tax equalization accounting allows the Fund to treat as a distribution that portion of redemption proceeds representing a redeeming shareholder’s portion of undistributed taxable income and net capital gains. These reclassifications had no effect on the net assets or net asset value per share of the Fund.
As of December 31, 2021, the components of distributable earnings (accumulated loss) on a tax basis were as follows:
Undistributed long-term capital gains | $ | 272,817 | ||
Post October capital losses | (101,679 | ) | ||
Net unrealized depreciation | (370,204 | ) | ||
Distributions payable | (1,578 | ) | ||
Accumulated loss | $ | (200,644 | ) | |
At December 31, 2021, the Fund had a net capital loss of $101,679 attributable to security transactions incurred after October 31, 2021 that it has elected to defer. This net capital loss is treated as arising on the first day of the Fund’s taxable year ending December 31, 2022.
3 Investment Adviser Fee and Other Transactions with Affiliates
Effective March 1, 2021, the Fund entered into an investment advisory agreement with Eaton Vance Management (EVM). Pursuant to the agreement, the Fund pays an investment adviser fee on its average daily net assets that are not invested in other investment companies for which EVM or its affiliates serve as investment adviser and receive an advisory fee, at a per annum rate as follows and is payable monthly:
| Average Daily Net Assets | Annual Fee Rate | |||
Up to $1 billion | 0.450 | % | ||
$1 billion up to $2 billion | 0.425 | % | ||
$2 billion up to $5 billion | 0.415 | % | ||
$5 billion and over | 0.405 | % | ||
For the year ended December 31, 2021, the Fund incurred no investment adviser fee on such assets. To the extent the Fund’s assets are invested in the Portfolio, the Fund is allocated its share of the Portfolio’s investment adviser fee. The Portfolio has engaged Boston Management and Research (BMR) to render investment advisory services. See Note 2 of the Portfolio’s Notes to Financial Statements which are included elsewhere in this report. EVM also serves as the administrator of the Fund, but receives no compensation.
EVM has agreed to reimburse the Fund’s expenses to the extent that total annual operating expenses (relating to ordinary operating expenses only and excluding such expenses as borrowing costs, taxes or litigation expenses) exceed 0.74% and 0.49% of the Fund’s average daily net assets for Class A and Class I, respectively. This agreement may be changed or terminated after April 30, 2022. Pursuant to this agreement, EVM was allocated $165,802 of the Fund’s operating expenses for the year ended December 31, 2021.
EVM provides sub-transfer agency and related services to the Fund pursuant to a Sub-Transfer Agency Support Services Agreement. For the year ended December 31, 2021, EVM earned $5,940 from the Fund pursuant to such agreement, which is included in transfer and dividend disbursing agent fees on the Statement of Operations. The Fund was informed that Eaton Vance Distributors, Inc. (EVD), an affiliate of EVM and the Fund’s principal underwriter, received $3,616 as its portion of the sales charge on sales of Class A shares for the year ended December 31, 2021. EVD also received distribution and service fees from Class A shares (see Note 4).
| 13 |
Eaton Vance
Core Bond Fund
December 31, 2021
Notes to Financial Statements — continued
Trustees and officers of the Fund who are members of EVM’s or BMR’s organizations receive remuneration for their services to the Fund out of the investment adviser fee. Certain officers and Trustees of the Fund and the Portfolio are officers of the above organizations.
4 Distribution Plan
The Fund has in effect a distribution plan for Class A shares (Class A Plan) pursuant to Rule 12b-1 under the 1940 Act. Pursuant to the Class A Plan, the Fund pays EVD a distribution and service fee of 0.25% per annum of its average daily net assets attributable to Class A shares for distribution services and facilities provided to the Fund by EVD, as well as for personal services and/or the maintenance of shareholder accounts. Distribution and service fees paid or accrued to EVD for the year ended December 31, 2021 amounted to $48,693 for Class A shares.
Distribution and service fees are subject to the limitations contained in the Financial Industry Regulatory Authority Rule 2341(d).
5 Contingent Deferred Sales Charges
Class A shares may be subject to a 1% contingent deferred sales charge (CDSC) if redeemed within 18 months of purchase (depending on the circumstances of purchase). Generally, the CDSC is based upon the lower of the net asset value at date of redemption or date of purchase. No charge is levied on shares acquired by reinvestment of dividends or capital gain distributions. For the year ended December 31, 2021, the Fund was informed that EVD received no CDSCs paid by Class A shareholders.
6 Investment Transactions
For the year ended December 31, 2021, increases and decreases in the Fund’s investment in the Portfolio aggregated $16,250,981 and $41,457,751, respectively.
7 Shares of Beneficial Interest
The Fund’s Declaration of Trust permits the Trustees to issue an unlimited number of full and fractional shares of beneficial interest (without par value). Such shares may be issued in a number of different series (such as the Fund) and classes. Transactions in Fund shares were as follows:
| Year Ended December 31, | ||||||||
| Class A | 2021 | 2020 | ||||||
Sales | 170,928 | 806,682 | ||||||
Issued to shareholders electing to receive payments of distributions in Fund shares | 56,919 | 107,536 | ||||||
Redemptions | (605,106 | ) | (1,620,291 | ) | ||||
Net decrease | (377,259 | ) | (706,073 | ) | ||||
| Year Ended December 31, | ||||||||
| Class I | 2021 | 2020 | ||||||
Sales | 2,900,652 | 6,414,484 | ||||||
Issued to shareholders electing to receive payments of distributions in Fund shares | 428,735 | 730,554 | ||||||
Redemptions | (6,271,622 | ) | (11,253,009 | ) | ||||
Net decrease | (2,942,235 | ) | (4,107,971 | ) | ||||
At December 31, 2021, donor advised and pooled income funds (established and maintained by a public charity) managed by EVM owned in the aggregate 42.0% of the value of the outstanding shares of the Fund.
| 14 |
Eaton Vance
Core Bond Fund
December 31, 2021
Report of Independent Registered Public Accounting Firm
To the Trustees of Eaton Vance Special Investment Trust and Shareholders of Eaton Vance Core Bond Fund:
Opinion on the Financial Statements and Financial Highlights
We have audited the accompanying statement of assets and liabilities of Eaton Vance Core Bond Fund (the “Fund”) (one of the funds constituting Eaton Vance Special Investment Trust), as of December 31, 2021, the related statement of operations for the year then ended, the statements of changes in net assets for each of the two years in the period then ended, the financial highlights for each of the five years in the period then ended, and the related notes. In our opinion, the financial statements and financial highlights present fairly, in all material respects, the financial position of the Fund as of December 31, 2021, and the results of its operations for the year then ended, the changes in its net assets for each of the two years in the period then ended, and the financial highlights for each of the five years in the period then ended, in conformity with accounting principles generally accepted in the United States of America.
Basis for Opinion
These financial statements and financial highlights are the responsibility of the Fund’s management. Our responsibility is to express an opinion on the Fund’s financial statements and financial highlights based on our audits. We are a public accounting firm registered with the Public Company Accounting Oversight Board (United States) (PCAOB) and are required to be independent with respect to the Fund in accordance with the U.S. federal securities laws and the applicable rules and regulations of the Securities and Exchange Commission and the PCAOB.
We conducted our audits in accordance with the standards of the PCAOB. Those standards require that we plan and perform the audit to obtain reasonable assurance about whether the financial statements and financial highlights are free of material misstatement, whether due to error or fraud. The Fund is not required to have, nor were we engaged to perform, an audit of its internal control over financial reporting. As part of our audits, we are required to obtain an understanding of internal control over financial reporting but not for the purpose of expressing an opinion on the effectiveness of the Fund’s internal control over financial reporting. Accordingly, we express no such opinion.
Our audits included performing procedures to assess the risks of material misstatement of the financial statements and financial highlights, whether due to error or fraud, and performing procedures that respond to those risks. Such procedures included examining, on a test basis, evidence regarding the amounts and disclosures in the financial statements and financial highlights. Our audits also included evaluating the accounting principles used and significant estimates made by management, as well as evaluating the overall presentation of the financial statements and financial highlights. We believe that our audits provide a reasonable basis for our opinion.
/s/ Deloitte & Touche LLP
Boston, Massachusetts
February 23, 2022
We have served as the auditor of one or more Eaton Vance investment companies since 1959.
| 15 |
Eaton Vance
Core Bond Fund
December 31, 2021
Federal Tax Information (Unaudited)
The Form 1099-DIV you received in February 2022 showed the tax status of all distributions paid to your account in calendar year 2021. Shareholders are advised to consult their own tax adviser with respect to the tax consequences of their investment in the Fund. As required by the Internal Revenue Code and/or regulations, shareholders must be notified regarding the status of 163(j) interest dividends and capital gains dividends.
163(j) Interest Dividends. For the fiscal year ended December 31, 2021, the Fund designates 94.26% of distributions from net investment income as a 163(j) interest dividend.
Capital Gains Dividends. The Fund hereby designates as a capital gain dividend with respect to the taxable year ended December 31, 2021, $1,955,483 or, if subsequently determined to be different, the net capital gain of such year.
| 16 |
Core Bond Portfolio
December 31, 2021
Portfolio of Investments
| Asset-Backed Securities — 13.3% |
| |||||||
| Security | Principal Amount (000’s omitted) | Value | ||||||
Adams Outdoor Advertising L.P., Series 2018-1, Class A, 4.81%, 11/15/48(1) | $ | 689 | $ | 711,408 | ||||
Affirm Asset Securitization Trust, Series 2021-A, Class A, 0.88%, 8/15/25(1) | 505 | 505,198 | ||||||
Aligned Data Centers Issuer, LLC, Series 2021-1A, Class A2, 1.937%, 8/15/46(1) | 1,011 | 996,563 | ||||||
Coinstar Funding, LLC, Series 2017-1A, Class A2, 5.216%, 4/25/47(1) | 2,262 | 2,261,170 | ||||||
| Conn’s Receivables Funding, LLC: | ||||||||
Series 2021-A, Class A, 1.05%, 5/15/26(1) | 2,609 | 2,608,036 | ||||||
Series 2021-A, Class B, 2.87%, 5/15/26(1) | 1,260 | 1,257,016 | ||||||
DataBank Issuer, Series 2021-2A, Class A2, 2.40%, 10/25/51(1) | 1,186 | 1,176,480 | ||||||
DB Master Finance, LLC, Series 2017-1A, Class A2II, 4.03%, 11/20/47(1) | 327 | 343,049 | ||||||
| Diamond Infrastructure Funding, LLC: | ||||||||
Series 2021-1A, Class A, 1.76%, 4/15/49(1) | 1,460 | 1,436,144 | ||||||
Series 2021-1A, Class C, 3.475%, 4/15/49(1) | 313 | 311,969 | ||||||
Driven Brands Funding, LLC, Series 2018-1A, Class A2, 4.739%, 4/20/48(1) | 1,119 | 1,168,448 | ||||||
FOCUS Brands Funding, LLC, Series 2017-1A, Class A2II, 5.093%, 4/30/47(1) | 955 | 1,009,241 | ||||||
Foundation Finance Trust, Series 2017-1A, Class A, 3.30%, 7/15/33(1) | 274 | 276,787 | ||||||
Horizon Aircraft Finance III, Ltd., Series 2019-2, Class A, 3.425%, 11/15/39(1) | 1,485 | 1,461,044 | ||||||
Jack in the Box Funding, LLC, Series 2019-1A, Class A2I, 3.982%, 8/25/49(1) | 1,573 | 1,586,510 | ||||||
Jersey Mike’s Funding, Series 2019-1A, Class A2, 4.433%, 2/15/50(1) | 1,039 | 1,095,670 | ||||||
| JPMorgan Chase Bank, NA: | ||||||||
Series 2021-2, Class B, 0.889%, 12/26/28(1) | 1,673 | 1,664,746 | ||||||
Series 2021-3, Class B, 0.76%, 2/26/29(1) | 1,308 | 1,300,064 | ||||||
LL ABS Trust, Series 2020-1A, Class A, 2.33%, 1/17/28(1) | 131 | 131,235 | ||||||
Lunar Aircraft, Ltd., Series 2020-1A, Class B, 4.335%, 2/15/45(1) | 330 | 300,963 | ||||||
Marlette Funding Trust, Series 2021-1A, Class A, 0.60%, 6/16/31(1) | 134 | 133,611 | ||||||
Neighborly Issuer, LLC, Series 2021-1A, Class A2, 3.584%, 4/30/51(1) | 1,363 | 1,374,640 | ||||||
NRZ Excess Spread-Collateralized Notes, Series 2021-GNT1, Class A, 3.474%, 11/25/26(1) | 2,320 | 2,320,419 | ||||||
OneMain Financial Issuance Trust, Series 2018-1A, Class A, 3.30%, 3/14/29(1) | 668 | 668,445 | ||||||
Oportun Funding XIV, LLC, Series 2021-A, Class B, 1.76%, 3/8/28(1) | 419 | 418,201 | ||||||
| Security | Principal Amount (000’s omitted) | Value | ||||||
| Oportun Issuance Trust: | ||||||||
Series 2021-B, Class A, 1.47%, 5/8/31(1) | $ | 1,547 | $ | 1,538,403 | ||||
Series 2021-C, Class A, 2.18%, 10/8/31(1) | 4,685 | 4,660,030 | ||||||
| Pagaya AI Debt Selection Trust: | ||||||||
Series 2021-2, 3.00%, 1/25/29(1) | 1,716 | 1,716,938 | ||||||
Series 2021-3, Class A, 1.15%, 5/15/29(1) | 3,232 | 3,218,380 | ||||||
Series 2021-HG1, Class A, 1.22%, 1/16/29(1) | 1,006 | 1,001,719 | ||||||
| Planet Fitness Master Issuer, LLC: | ||||||||
Series 2018-1A, Class A2I, 4.262%, 9/5/48(1) | 1,959 | 1,966,748 | ||||||
Series 2019-1A, Class A2, 3.858%, 12/5/49(1) | 1,019 | 1,049,641 | ||||||
| ServiceMaster Funding, LLC: | ||||||||
Series 2020-1, Class A2I, 2.841%, 1/30/51(1) | 556 | 553,434 | ||||||
Series 2020-1, Class A2II, 3.337%, 1/30/51(1) | 648 | 655,369 | ||||||
SERVPRO Master Issuer, LLC, Series 2019-1A, Class A2, 3.882%, 10/25/49(1) | 3,673 | 3,768,689 | ||||||
Small Business Lending Trust, Series 2020-A, Class A, 2.62%, 12/15/26(1) | 75 | 74,987 | ||||||
Sonic Capital, LLC, Series 2020-1A, Class A2I, 3.845%, 1/20/50(1) | 1,806 | 1,877,643 | ||||||
SpringCastle America Funding, LLC, Series 2020-AA, Class A, 1.97%, 9/25/37(1) | 1,519 | 1,513,300 | ||||||
| Stack Infrastructure Issuer, LLC: | ||||||||
Series 2019-1A, Class A2, 4.54%, 2/25/44(1) | 8,662 | 8,983,524 | ||||||
Series 2019-2A, Class A2, 3.08%, 10/25/44(1) | 750 | 765,183 | ||||||
Sunnova Helios II Issuer, LLC, Series 2021-A, Class A, 1.80%, 2/20/48(1) | 262 | 258,620 | ||||||
Sunnova Sol II Issuer, LLC, Series 2020-2A, Class A, 2.73%, 11/1/55(1) | 2,480 | 2,486,068 | ||||||
Tesla Auto Lease Trust, Series 2019-A, Class A3, 2.16%, 10/20/22(1) | 3,419 | 3,433,657 | ||||||
Theorem Funding Trust, Series 2021-1A, Class A, 1.21%, 12/15/27(1) | 2,347 | 2,343,427 | ||||||
Towd Point Asset Trust, Series 2018-SL1, Class A, 0.703%, (1 mo. USD LIBOR + 0.60%), 1/25/46(1)(2) | 2,251 | 2,250,457 | ||||||
| Vantage Data Centers Issuer, LLC: | ||||||||
Series 2019-1A, Class A2, 3.188%, 7/15/44(1) | 1,140 | 1,165,267 | ||||||
Series 2020-2A, Class A2, 1.992%, 9/15/45(1) | 2,220 | 2,181,155 | ||||||
Series 2021-1A, Class A2, 2.165%, 10/15/46(1) | 869 | 867,619 | ||||||
| Willis Engine Structured Trust V: | ||||||||
Series 2020-A, Class B, 4.212%, 3/15/45(1) | 952 | 888,347 | ||||||
Series 2020-A, Class C, 6.657%, 3/15/45(1) | 283 | 205,649 | ||||||
Total Asset-Backed Securities |
| $ | 75,941,311 | |||||
| 17 | See Notes to Financial Statements. |
Core Bond Portfolio
December 31, 2021
Portfolio of Investments — continued
| Collateralized Mortgage Obligations — 4.3% |
| |||||||
| Security | Principal Amount (000’s omitted) | Value | ||||||
| Bellemeade Re, Ltd.: | ||||||||
Series 2021-1A, Class M1A, 1.80%, (30-day average SOFR + 1.75%), 3/25/31(1)(2) | $ | 550 | $ | 552,597 | ||||
Series 2021-1A, Class M1B, 2.25%, (30-day average SOFR + 2.20%), 3/25/31(1)(2) | 390 | 394,023 | ||||||
Series 2021-2A, Class M1A, 1.25%, (30-day average SOFR + 1.20%), 6/25/31(1)(2) | 2,112 | 2,108,790 | ||||||
Series 2021-3A, Class A2, 1.05%, (30-day average SOFR + 1.00%), 9/25/31(1)(2) | 830 | 826,012 | ||||||
| Federal Home Loan Mortgage Corp. Structured Agency Credit Risk Debt Notes: | ||||||||
Series 2017-DNA3, Class M2, 2.603%, (1 mo. USD LIBOR + 2.50%), 3/25/30(2) | 752 | 767,761 | ||||||
Series 2018-DNA1, Class M2AT, 1.153%, (1 mo. USD LIBOR + 1.05%), 7/25/30(2) | 1,029 | 1,032,163 | ||||||
Series 2019-DNA3, Class M2, 2.153%, (1 mo. USD LIBOR + 2.05%), 7/25/49(1)(2) | 1,879 | 1,895,366 | ||||||
Series 2019-DNA4, Class M2, 2.053%, (1 mo. USD LIBOR + 1.95%), 10/25/49(1)(2) | 338 | 339,339 | ||||||
Series 2020-DNA5, Class M2, 2.85%, (30-day average SOFR + 2.80%), 10/25/50(1)(2) | 333 | 336,203 | ||||||
Series 2020-DNA6, Class M2, 2.05%, (30-day average SOFR + 2.00%), 12/25/50(1)(2) | 1,215 | 1,223,085 | ||||||
Series 2021-DNA3, Class M1, 0.80%, (30-day average SOFR + 0.75%), 10/25/33(1)(2) | 938 | 939,727 | ||||||
| Federal National Mortgage Association: | ||||||||
Series 2005-58, Class MA, 5.50%, 7/25/35 | 99 | 109,709 | ||||||
Series 2011-135, Class PK, 4.50%, 5/25/40 | 190 | 193,282 | ||||||
Series 2013-6, Class HD, 1.50%, 12/25/42 | 67 | 67,429 | ||||||
Series 2014-70, Class KP, 3.50%, 3/25/44 | 462 | 481,554 | ||||||
Series 2018-M4, Class A2, 3.059%, 3/25/28(3) | 596 | 646,529 | ||||||
Series 2019-M1, Class A2, 3.552%, 9/25/28(3) | 2,771 | 3,091,958 | ||||||
Series 2020-M1, Class A2, 2.444%, 10/25/29 | 4,434 | 4,672,501 | ||||||
| Federal National Mortgage Association Connecticut Avenue Securities: | ||||||||
Series 2013-C01, Class M2, 5.353%, (1 mo. USD LIBOR + 5.25%), 10/25/23(2) | 618 | 643,546 | ||||||
Series 2014-C02, Class 2M2, 2.703%, (1 mo. USD LIBOR + 2.60%), 5/25/24(2) | 270 | 274,553 | ||||||
Series 2014-C03, Class 2M2, 3.003%, (1 mo. USD LIBOR + 2.90%), 7/25/24(2) | 486 | 493,864 | ||||||
Series 2018-R07, Class 1M2, 2.502%, (1 mo. USD LIBOR + 2.40%), 4/25/31(1)(2) | 219 | 220,480 | ||||||
Series 2019-R05, Class 1M2, 2.103%, (1 mo. USD LIBOR + 2.00%), 7/25/39(1)(2) | 31 | 30,979 | ||||||
FMC GMSR Issuer Trust, Series 2021-GT2, Class A, 3.85%, 10/25/26(1)(3) | 1,225 | 1,218,062 | ||||||
| Security | Principal Amount (000’s omitted) | Value | ||||||
Home Re, Ltd., Series 2021-1, Class M1B, 1.652%, (1 mo. USD LIBOR + 1.55%), 7/25/33(1)(2) | $ | 1,135 | $ | 1,131,602 | ||||
Toorak Mortgage Corp., Ltd., Series 2020-1, Class A1, 2.734% to 1/25/23, 3/25/23(1)(4) | 730 | 731,853 | ||||||
Total Collateralized Mortgage Obligations |
| $ | 24,422,967 | |||||
| Commercial Mortgage-Backed Securities — 9.6% |
| |||||||
| Security | Principal Amount (000’s omitted) | Value | ||||||
| BAMLL Commercial Mortgage Securities Trust: | ||||||||
Series 2019-BPR, Class DNM, 3.719%, 11/5/32(1)(3) | $ | 3,325 | $ | 3,208,605 | ||||
Series 2019-BPR, Class FNM, 3.719%, 11/5/32(1)(3) | 1,635 | 1,312,337 | ||||||
| BX Commercial Mortgage Trust: | ||||||||
Series 2019-XL, Class A, 1.026%, (1 mo. USD LIBOR + 0.92%), 10/15/36(1)(2) | 2,770 | 2,772,957 | ||||||
Series 2019-XL, Class B, 1.186%, (1 mo. USD LIBOR + 1.08%), 10/15/36(1)(2) | 1,122 | 1,121,721 | ||||||
Series 2021-VOLT, Class B, 1.059%, (1 mo. USD LIBOR + 0.95%), 9/15/36(1)(2) | 3,103 | 3,082,971 | ||||||
Series 2021-VOLT, Class C, 1.209%, (1 mo. USD LIBOR + 1.10%), 9/15/36(1)(2) | 1,461 | 1,446,339 | ||||||
Series 2021-VOLT, Class D, 1.759%, (1 mo. USD LIBOR + 1.65%), 9/15/36(1)(2) | 1,074 | 1,067,090 | ||||||
| CFCRE Commercial Mortgage Trust: | ||||||||
Series 2016-C7, Class C, 4.402%, 12/10/54(3) | 1,250 | 1,221,793 | ||||||
Series 2016-C7, Class D, 4.402%, 12/10/54(1)(3) | 2,000 | 1,802,560 | ||||||
CGMS Commercial Mortgage Trust, Series 2017-MDRB, Class C, 2.61%, (1 mo. USD LIBOR + 2.50%), 7/15/30(1)(2) | 3,000 | 2,989,924 | ||||||
CHT COSMO Mortgage Trust, Series 2017-CSMO, Class E, 3.11%, (1 mo. USD LIBOR + 3.00%), 11/15/36(1)(2) | 1,685 | 1,688,571 | ||||||
COMM Mortgage Trust, Series 2014-CR21, Class C, 4.421%, 12/10/47(3) | 500 | 511,228 | ||||||
Credit Suisse Mortgage Trust, Series 2016-NXSR, Class C, 4.455%, 12/15/49(3) | 1,775 | 1,561,175 | ||||||
| Extended Stay America Trust: | ||||||||
Series 2021-ESH, Class A, 1.19%, (1 mo. USD LIBOR + 1.08%), 7/15/38(1)(2) | 495 | 496,179 | ||||||
Series 2021-ESH, Class C, 1.81%, (1 mo. USD LIBOR + 1.70%), 7/15/38(1)(2) | 1,729 | 1,732,373 | ||||||
Federal National Mortgage Association Multifamily Connecticut Avenue Securities Trust, Series 2020-01, Class M10, 3.852%, (1 mo. USD LIBOR + 3.75%), 3/25/50(1)(2) | 1,260 | 1,282,079 | ||||||
Hawaii Hotel Trust, Series 2019-MAUI, Class A, 1.26%, (1 mo. USD LIBOR + 1.15%), 5/15/38(1)(2) | 2,443 | 2,446,382 | ||||||
| 18 | See Notes to Financial Statements. |
Core Bond Portfolio
December 31, 2021
Portfolio of Investments — continued
| Security | Principal Amount (000’s omitted) | Value | ||||||
| JPMBB Commercial Mortgage Securities Trust: | ||||||||
Series 2014-C22, Class D, 4.553%, 9/15/47(1)(3) | $ | 990 | $ | 784,639 | ||||
Series 2014-C25, Class D, 3.941%, 11/15/47(1)(3) | 1,960 | 1,586,224 | ||||||
| JPMorgan Chase Commercial Mortgage Securities Trust: | ||||||||
Series 2011-C5, Class D, 5.733%, 8/15/46(1)(3) | 217 | 216,233 | ||||||
Series 2012-CIBX, Class AS, 4.271%, 6/15/45 | 3,325 | 3,358,980 | ||||||
Series 2013-C13, Class D, 4.077%, 1/15/46(1)(3) | 2,000 | 2,017,670 | ||||||
Morgan Stanley Bank of America Merrill Lynch Trust, Series 2016-C29, Class C, 4.729%, 5/15/49(3)(5) | 993 | 1,014,911 | ||||||
| Morgan Stanley Capital I Trust: | ||||||||
Series 2016-UBS12, Class D, 3.312%, 12/15/49(1)(5) | 1,745 | 1,017,226 | ||||||
Series 2019-BPR, Class A, 1.51%, (1 mo. USD LIBOR + 1.40%), 5/15/36(1)(2)(5) | 2,521 | 2,493,382 | ||||||
Natixis Commercial Mortgage Securities Trust, Series 2018-FL1, Class C, 2.31%, (1 mo. USD LIBOR + 2.20%), 6/15/35(1)(2) | 5,000 | 4,669,268 | ||||||
SLG Office Trust, Series 2021-OVA, Class A, 2.585%, 7/15/41(1) | 2,427 | 2,489,773 | ||||||
| VMC Finance, LLC: | ||||||||
Series 2021-HT1, Class A, 1.753%, (1 mo. USD LIBOR + 1.65%), 1/18/37(1)(2) | 1,989 | 1,994,394 | ||||||
Series 2021-HT1, Class B, 4.603%, (1 mo. USD LIBOR + 4.50%), 1/18/37(1)(2) | 2,000 | 2,002,363 | ||||||
| Wells Fargo Commercial Mortgage Trust: | ||||||||
Series 2015-LC22, Class C, 4.557%, 9/15/58(3) | 900 | 933,819 | ||||||
Series 2016-C35, Class D, 3.142%, 7/15/48(1) | 500 | 425,154 | ||||||
Total Commercial Mortgage-Backed Securities |
| $ | 54,748,320 | |||||
| U.S. Government Agency Mortgage-Backed Securities — 10.7% |
| |||||||
| Security | Principal Amount (000’s omitted) | Value | ||||||
| Federal Home Loan Mortgage Corp.: | ||||||||
Pool #A93547, 4.50%, 8/1/40 | $ | 382 | $ | 421,256 | ||||
Pool #C03490, 4.50%, 8/1/40 | 214 | 235,897 | ||||||
Pool #C09031, 2.50%, 2/1/43 | 795 | 816,213 | ||||||
Pool #G07589, 5.50%, 6/1/41 | 1,327 | 1,523,589 | ||||||
Pool #G08596, 4.50%, 7/1/44 | 336 | 368,685 | ||||||
Pool #G08670, 3.00%, 10/1/45 | 477 | 501,451 | ||||||
Pool #G08701, 3.00%, 4/1/46 | 637 | 666,538 | ||||||
Pool #G60608, 4.00%, 5/1/46 | 1,439 | 1,555,300 | ||||||
Pool #G60761, 3.00%, 10/1/43 | 852 | 898,684 | ||||||
Pool #Q17453, 3.50%, 4/1/43 | 832 | 892,005 | ||||||
Pool #Q34310, 3.50%, 6/1/45 | 526 | 562,001 | ||||||
Pool #Q40264, 3.50%, 5/1/46 | 446 | 474,935 | ||||||
Pool #Q45051, 3.00%, 12/1/46 | 1,711 | 1,806,937 | ||||||
| Security | Principal Amount (000’s omitted) | Value | ||||||
| Federal Home Loan Mortgage Corp.: (continued) | ||||||||
Pool #Q46889, 3.50%, 3/1/47 | $ | 1,288 | $ | 1,384,805 | ||||
Pool #Q47999, 4.00%, 5/1/47 | 1,432 | 1,553,489 | ||||||
Pool #ZT0383, 3.50%, 3/1/48 | 555 | 589,655 | ||||||
| $ | 14,251,440 | |||||||
| Federal National Mortgage Association: | ||||||||
2.50%, 30-Year, TBA(6) | $ | 24,521 | $ | 25,042,082 | ||||
3.00%, 30-Year, TBA(6) | 6,075 | 6,296,880 | ||||||
Pool #AB3678, 3.50%, 10/1/41 | 2,056 | 2,196,339 | ||||||
Pool #AL7524, 5.00%, 7/1/41 | 313 | 351,360 | ||||||
Pool #AS3892, 4.00%, 11/1/44 | 446 | 481,819 | ||||||
Pool #AS5332, 4.00%, 7/1/45 | 463 | 501,137 | ||||||
Pool #AS6014, 4.00%, 10/1/45 | 278 | 301,379 | ||||||
Pool #BA0891, 3.50%, 1/1/46 | 1,049 | 1,115,741 | ||||||
Pool #BA3938, 3.50%, 1/1/46 | 639 | 679,997 | ||||||
Pool #BD1183, 3.50%, 12/1/46 | 387 | 411,964 | ||||||
Pool #BE2316, 3.50%, 1/1/47 | 1,188 | 1,263,985 | ||||||
Pool #BM1144, 2.50%, 3/1/47 | 915 | 943,606 | ||||||
Pool #FM7023, 3.00%, 7/1/49 | 1,169 | 1,214,033 | ||||||
Pool #MA1789, 4.50%, 2/1/44 | 331 | 363,192 | ||||||
Pool #MA2653, 4.00%, 6/1/46 | 691 | 746,258 | ||||||
| $ | 41,909,772 | |||||||
| Government National Mortgage Association: | ||||||||
Pool #AQ1784, 3.50%, 12/20/45 | $ | 1,129 | $ | 1,216,060 | ||||
Pool #CB2653, 2.50%, 3/20/51 | 1,439 | 1,482,213 | ||||||
Pool #CB8629, 2.50%, 4/20/51 | 2,111 | 2,182,164 | ||||||
| $ | 4,880,437 | |||||||
Total U.S. Government Agency Mortgage-Backed Securities | $ | 61,041,649 | ||||||
| Corporate Bonds — 38.3% |
| |||||||
| Security | Principal Amount (000’s omitted) | Value | ||||||
| Aerospace & Defense — 0.4% | ||||||||
Delta Air Lines, Inc., 3.625%, 3/15/22 | $ | 914 | $ | 914,034 | ||||
Delta Air Lines, Inc./SkyMiles IP, Ltd., 4.75%, 10/20/28(1) | 1,436 | 1,569,235 | ||||||
| $ | 2,483,269 | |||||||
| Automotive — 0.5% | ||||||||
General Motors Co., 4.20%, 10/1/27 | $ | 2,383 | $ | 2,609,852 | ||||
| $ | 2,609,852 | |||||||
| 19 | See Notes to Financial Statements. |
Core Bond Portfolio
December 31, 2021
Portfolio of Investments — continued
| Security | Principal Amount (000’s omitted) | Value | ||||||
| Banks — 14.4% | ||||||||
Australia & New Zealand Banking Group, Ltd., | $ | 2,150 | $ | 2,204,541 | ||||
Banco de Chile, 2.99%, 12/9/31(1) | 1,171 | 1,156,228 | ||||||
Banco Safra S.A., 4.125%, 2/8/23(1) | 1,210 | 1,239,724 | ||||||
Banco Santander S.A., 1.722% to 9/14/26, 9/14/27(7) | 1,200 | 1,178,842 | ||||||
| Bank of America Corp.: | ||||||||
1.53% to 12/6/24, 12/6/25(7) | 2,700 | 2,706,136 | ||||||
1.734% to 7/22/26, 7/22/27(7) | 4,426 | 4,396,205 | ||||||
1.898% to 7/23/30, 7/23/31(7) | 2,400 | 2,299,560 | ||||||
1.922% to 10/24/30, 10/24/31(7) | 1,806 | 1,731,160 | ||||||
2.087% to 6/14/28, 6/14/29(7) | 1,881 | 1,869,207 | ||||||
2.299% to 7/21/31, 7/21/32(7) | 2,050 | 2,017,771 | ||||||
2.456% to 10/22/24, 10/22/25(7) | 963 | 989,695 | ||||||
2.572% to 10/20/31, 10/20/32(7) | 1,560 | 1,568,629 | ||||||
BankUnited, Inc., 5.125%, 6/11/30 | 490 | 558,693 | ||||||
| Barclays PLC: | ||||||||
2.852% to 5/7/25, 5/7/26(7) | 1,281 | 1,322,205 | ||||||
4.836%, 5/9/28 | 1,610 | 1,774,877 | ||||||
| BBVA Bancomer S.A./Texas: | ||||||||
1.875%, 9/18/25(1) | 1,165 | 1,156,327 | ||||||
5.125% to 1/18/28, 1/18/33(1)(7) | 1,000 | 1,027,865 | ||||||
Capital One Financial Corp., 3.30%, 10/30/24 | 1,759 | 1,852,477 | ||||||
| Citigroup, Inc.: | ||||||||
1.281% to 11/3/24, 11/3/25(7) | 451 | 450,069 | ||||||
3.106% to 4/8/25, 4/8/26(7) | 1,447 | 1,517,928 | ||||||
3.668% to 7/24/27, 7/24/28(7) | 1,889 | 2,038,912 | ||||||
3.70%, 1/12/26 | 1,000 | 1,082,250 | ||||||
4.00% to 12/10/25(7)(8) | 1,090 | 1,100,900 | ||||||
4.075% to 4/23/28, 4/23/29(7) | 1,855 | 2,047,336 | ||||||
Discover Bank, 4.682% to 8/9/23, 8/9/28(7) | 1,193 | 1,247,241 | ||||||
| Goldman Sachs Group, Inc. (The): | ||||||||
1.948% to 10/21/26, 10/21/27(7) | 3,719 | 3,704,333 | ||||||
2.65% to 10/21/31, 10/21/32(7) | 2,315 | 2,331,806 | ||||||
3.75%, 2/25/26 | 970 | 1,045,571 | ||||||
| HSBC Holdings PLC: | ||||||||
2.251% to 11/22/26, 11/22/27(7) | 1,966 | 1,971,251 | ||||||
2.357% to 8/18/30, 8/18/31(7) | 982 | 960,474 | ||||||
International Bank for Reconstruction & Development, 0.18%, (SOFR + 0.13%), 1/13/23(2) | 2,756 | 2,757,711 | ||||||
| JPMorgan Chase & Co.: | ||||||||
0.63%, (SOFR + 0.58%), 3/16/24(2) | 482 | 483,062 | ||||||
1.47% to 9/22/26, 9/22/27(7) | 2,098 | 2,057,447 | ||||||
2.522% to 4/22/30, 4/22/31(7) | 1,500 | 1,517,722 | ||||||
2.739% to 10/15/29, 10/15/30(7) | 3,235 | 3,327,257 | ||||||
2.956% to 5/13/30, 5/13/31(7) | 634 | 657,121 | ||||||
5.625%, 8/16/43 | 628 | 879,671 | ||||||
| Security | Principal Amount (000’s omitted) | Value | ||||||
| Banks (continued) | ||||||||
Lloyds Banking Group PLC, 2.438% to 2/5/25, 2/5/26(7) | $ | 1,030 | $ | 1,050,807 | ||||
| Macquarie Bank, Ltd.: | ||||||||
3.052% to 3/3/31, 3/3/36(1)(7) | 1,331 | 1,313,753 | ||||||
3.624%, 6/3/30(1) | 762 | 795,932 | ||||||
National Bank of Canada, 0.55% to 11/15/23, 11/15/24(7) | 1,294 | 1,279,491 | ||||||
PPTT, 2006-A GS, Class A, 5.877%(1)(8)(9) | 259 | 289,247 | ||||||
| Santander Holdings USA, Inc.: | ||||||||
3.45%, 6/2/25 | 1,788 | 1,877,391 | ||||||
4.50%, 7/17/25 | 712 | 771,392 | ||||||
Societe Generale S.A., 4.75% to 5/26/26(1)(7)(8) | 777 | 790,916 | ||||||
| Standard Chartered PLC: | ||||||||
1.319% to 10/14/22, 10/14/23(1)(7) | 800 | 800,799 | ||||||
1.456% to 1/14/26, 1/14/27(1)(7) | 808 | 783,233 | ||||||
1.822% to 11/23/24, 11/23/25(1)(7) | 929 | 928,472 | ||||||
| Synovus Bank/Columbus, GA: | ||||||||
2.289% to 2/10/22, 2/10/23(7) | 1,314 | 1,315,061 | ||||||
4.00% to 10/29/25, 10/29/30(7) | 940 | 979,850 | ||||||
Synovus Financial Corp., 3.125%, 11/1/22 | 622 | 632,151 | ||||||
Texas Capital Bancshares, Inc., | 655 | 677,563 | ||||||
| Truist Financial Corp.: | ||||||||
1.267% to 3/2/26, 3/2/27(7) | 433 | 425,055 | ||||||
5.10% to 3/1/30(7)(8) | 1,427 | 1,598,240 | ||||||
UBS AG, 1.25%, 6/1/26(1) | 1,442 | 1,409,893 | ||||||
UBS Group AG, 2.095% to 2/11/31, 2/11/32(1)(7) | 1,652 | 1,600,416 | ||||||
Westpac Banking Corp., 3.02% to 11/18/31, 11/18/36(7) | 867 | 858,001 | ||||||
| $ | 82,405,867 | |||||||
| Beverages — 0.1% | ||||||||
Coca-Cola Europacific Partners PLC, 1.50%, 1/15/27(1) | $ | 541 | $ | 530,539 | ||||
| $ | 530,539 | |||||||
| Biotechnology — 0.3% | ||||||||
Royalty Pharma PLC, 3.35%, 9/2/51 | $ | 1,588 | $ | 1,522,695 | ||||
| $ | 1,522,695 | |||||||
| Building Materials — 0.9% | ||||||||
Builders FirstSource, Inc., 5.00%, 3/1/30(1) | $ | 2,715 | $ | 2,916,752 | ||||
Owens Corning, 3.95%, 8/15/29 | 2,207 | 2,420,360 | ||||||
| $ | 5,337,112 | |||||||
| 20 | See Notes to Financial Statements. |
Core Bond Portfolio
December 31, 2021
Portfolio of Investments — continued
| Security | Principal Amount (000’s omitted) | Value | ||||||
| Chemicals — 0.4% | ||||||||
| Alpek SAB de CV: | ||||||||
3.25%, 2/25/31(1) | $ | 1,200 | $ | 1,198,722 | ||||
4.25%, 9/18/29(1) | 920 | 979,970 | ||||||
| $ | 2,178,692 | |||||||
| Commercial Services — 1.0% | ||||||||
Ashtead Capital, Inc., 4.25%, 11/1/29(1) | $ | 1,752 | $ | 1,869,756 | ||||
Block Financial, LLC, 3.875%, 8/15/30 | 1,362 | 1,458,865 | ||||||
Ford Foundation (The), 2.415%, 6/1/50 | 650 | 615,959 | ||||||
Western Union Co. (The), 6.20%, 11/17/36 | 1,275 | 1,576,105 | ||||||
| $ | 5,520,685 | |||||||
| Computers — 1.0% | ||||||||
DXC Technology Co., 2.375%, 9/15/28 | $ | 1,181 | $ | 1,155,409 | ||||
Kyndryl Holdings, Inc., 2.05%, 10/15/26(1) | 1,472 | 1,434,093 | ||||||
| Seagate HDD Cayman: | ||||||||
3.375%, 7/15/31 | 870 | 850,277 | ||||||
4.091%, 6/1/29 | 463 | 480,048 | ||||||
5.75%, 12/1/34 | 1,473 | 1,699,724 | ||||||
| $ | 5,619,551 | |||||||
| Consumer Products — 0.2% | ||||||||
Natura Cosmeticos S.A., 4.125%, 5/3/28(1) | $ | 1,117 | $ | 1,097,866 | ||||
| $ | 1,097,866 | |||||||
| Diversified Financial Services — 3.5% | ||||||||
| AerCap Ireland Capital DAC/AerCap Global Aviation Trust: | ||||||||
4.50%, 9/15/23 | $ | 1,246 | $ | 1,307,375 | ||||
6.50%, 7/15/25 | 742 | 848,505 | ||||||
Affiliated Managers Group, Inc., 3.30%, 6/15/30 | 1,810 | 1,917,105 | ||||||
Air Lease Corp., 2.875%, 1/15/26 | 700 | 722,699 | ||||||
Alliance Data Systems Corp., 4.75%, 12/15/24(1) | 1,140 | 1,164,396 | ||||||
Banco BTG Pactual S.A./Cayman Islands, 4.50%, 1/10/25(1) | 3,000 | 3,029,880 | ||||||
Brookfield Finance, LLC, 3.45%, 4/15/50 | 1,258 | 1,314,153 | ||||||
| CI Financial Corp.: | ||||||||
3.20%, 12/17/30 | 1,403 | 1,441,198 | ||||||
4.10%, 6/15/51 | 1,090 | 1,184,040 | ||||||
| Ford Motor Credit Co., LLC: | ||||||||
2.979%, 8/3/22 | 1,083 | 1,089,915 | ||||||
4.14%, 2/15/23 | 300 | 307,515 | ||||||
KKR Group Finance Co. VII, LLC, 3.625%, 2/25/50(1) | 1,350 | 1,453,561 | ||||||
KKR Group Finance Co. X, LLC, 3.25%, 12/15/51(1) | 420 | 419,596 | ||||||
| Security | Principal Amount (000’s omitted) | Value | ||||||
| Diversified Financial Services (continued) | ||||||||
Neuberger Berman Group, LLC/Neuberger Berman Finance Corp., 4.875%, 4/15/45(1) | $ | 1,157 | $ | 1,374,170 | ||||
Stifel Financial Corp., 4.00%, 5/15/30 | 1,408 | 1,545,754 | ||||||
UniCredit SpA, 5.459% to 6/30/30, 6/30/35(1)(7) | 611 | 666,396 | ||||||
| $ | 19,786,258 | |||||||
| Electric Utilities — 0.9% | ||||||||
AES Corp. (The), 2.45%, 1/15/31 | $ | 2,342 | $ | 2,284,253 | ||||
Enel Finance International N.V., 1.375%, 7/12/26(1) | 873 | 851,028 | ||||||
ITC Holdings Corp., 4.05%, 7/1/23 | 680 | 704,484 | ||||||
NextEra Energy Capital Holdings, Inc., 1.90%, 6/15/28 | 1,240 | 1,227,879 | ||||||
NextEra Energy Operating Partners, L.P., 4.25%, 9/15/24(1) | 38 | 39,463 | ||||||
| $ | 5,107,107 | |||||||
| Electrical and Electronic Equipment — 1.1% | ||||||||
| Jabil, Inc.: | ||||||||
3.00%, 1/15/31 | $ | 2,773 | $ | 2,852,944 | ||||
3.60%, 1/15/30 | 2,207 | 2,378,386 | ||||||
4.70%, 9/15/22 | 934 | 958,865 | ||||||
| $ | 6,190,195 | |||||||
| Foods — 0.9% | ||||||||
JBS USA LUX S.A./JBS USA Food Co./JBS USA Finance, Inc., 3.75%, 12/1/31(1) | $ | 1,587 | $ | 1,613,082 | ||||
Kraft Heinz Foods Co., 4.375%, 6/1/46 | 1,757 | 2,061,927 | ||||||
| Smithfield Foods, Inc.: | ||||||||
2.625%, 9/13/31(1) | 1,120 | 1,084,852 | ||||||
3.00%, 10/15/30(1) | 210 | 209,391 | ||||||
| $ | 4,969,252 | |||||||
| Health Care — 0.6% | ||||||||
| Centene Corp.: | ||||||||
2.50%, 3/1/31 | $ | 1,583 | $ | 1,543,710 | ||||
3.375%, 2/15/30 | 784 | 799,723 | ||||||
4.25%, 12/15/27 | 798 | 833,296 | ||||||
| $ | 3,176,729 | |||||||
| Insurance — 0.8% | ||||||||
Athene Global Funding, 2.45%, 8/20/27(1) | $ | 1,294 | $ | 1,319,748 | ||||
Liberty Mutual Group, Inc., 4.125% to 9/15/26, 12/15/51(1)(7) | 823 | 822,156 | ||||||
| 21 | See Notes to Financial Statements. |
Core Bond Portfolio
December 31, 2021
Portfolio of Investments — continued
| Security | Principal Amount (000’s omitted) | Value | ||||||
| Insurance (continued) | ||||||||
Primerica, Inc., 2.80%, 11/19/31 | $ | 856 | $ | 866,186 | ||||
Stewart Information Services Corp., 3.60%, 11/15/31 | 1,286 | 1,303,557 | ||||||
| $ | 4,311,647 | |||||||
| Lodging and Gaming — 0.1% | ||||||||
| Hyatt Hotels Corp.: | ||||||||
1.30%, 10/1/23 | $ | 577 | $ | 577,198 | ||||
1.80%, 10/1/24 | 237 | 237,251 | ||||||
| $ | 814,449 | |||||||
| Machinery — 0.3% | ||||||||
Valmont Industries, Inc., 5.25%, 10/1/54 | $ | 1,373 | $ | 1,756,059 | ||||
| $ | 1,756,059 | |||||||
| Media — 1.3% | ||||||||
| Charter Communications Operating, LLC/Charter Communications Operating Capital: | ||||||||
2.80%, 4/1/31 | $ | 1,473 | $ | 1,459,332 | ||||
4.80%, 3/1/50 | 2,895 | 3,249,289 | ||||||
| Comcast Corp.: | ||||||||
2.887%, 11/1/51(1) | 2,240 | 2,172,354 | ||||||
2.937%, 11/1/56(1) | 832 | 794,678 | ||||||
| $ | 7,675,653 | |||||||
| Miscellaneous Manufacturing — 0.0%(10) | ||||||||
Hexcel Corp., 4.20%, 2/15/27 | $ | 229 | $ | 246,055 | ||||
| $ | 246,055 | |||||||
| Oil and Gas — 0.5% | ||||||||
NOV, Inc., 3.60%, 12/1/29 | $ | 961 | $ | 993,683 | ||||
| Patterson-UTI Energy, Inc.: | ||||||||
3.95%, 2/1/28 | 1,601 | 1,610,115 | ||||||
5.15%, 11/15/29 | 212 | 215,342 | ||||||
| $ | 2,819,140 | |||||||
| Other Revenue — 0.8% | ||||||||
BlueHub Loan Fund, Inc., 3.099%, 1/1/30 | $ | 3,160 | $ | 3,273,036 | ||||
OneMain Finance Corp., 3.50%, 1/15/27 | 1,146 | 1,134,523 | ||||||
| $ | 4,407,559 | |||||||
| Pharmaceuticals — 0.2% | ||||||||
CVS Health Corp., 3.00%, 8/15/26 | $ | 1,236 | $ | 1,306,508 | ||||
| $ | 1,306,508 | |||||||
| Security | Principal Amount (000’s omitted) | Value | ||||||
| Real Estate Investment Trusts (REITs) — 2.5% | ||||||||
Agree, L.P., 2.00%, 6/15/28 | $ | 520 | $ | 509,822 | ||||
Corporate Office Properties, L.P., 2.90%, 12/1/33 | 872 | 853,465 | ||||||
Digital Realty Trust, L.P., 3.70%, 8/15/27 | 1,272 | 1,379,524 | ||||||
Extra Space Storage, L.P., 2.55%, 6/1/31 | 1,011 | 996,073 | ||||||
HAT Holdings I, LLC/HAT Holdings II, LLC, 3.375%, 6/15/26(1) | 1,436 | 1,452,284 | ||||||
| Iron Mountain, Inc.: | ||||||||
4.50%, 2/15/31(1) | 977 | 989,213 | ||||||
5.00%, 7/15/28(1) | 339 | 348,833 | ||||||
Life Storage, L.P., 2.40%, 10/15/31 | 1,473 | 1,449,495 | ||||||
Newmark Group, Inc., 6.125%, 11/15/23 | 2,890 | 3,095,190 | ||||||
Sabra Health Care, L.P., 3.20%, 12/1/31 | 1,435 | 1,403,903 | ||||||
SITE Centers Corp., 3.625%, 2/1/25 | 874 | 915,770 | ||||||
| Sun Communities Operating, L.P.: | ||||||||
2.30%, 11/1/28 | 543 | 542,762 | ||||||
2.70%, 7/15/31 | 455 | 451,797 | ||||||
| $ | 14,388,131 | |||||||
| Retail – Specialty and Apparel — 0.9% | ||||||||
7-Eleven, Inc., 0.80%, 2/10/24(1) | $ | 1,003 | $ | 992,011 | ||||
Macy’s Retail Holdings, LLC, 2.875%, 2/15/23 | 1,182 | 1,195,363 | ||||||
| Nordstrom, Inc.: | ||||||||
4.25%, 8/1/31 | 819 | 805,912 | ||||||
4.375%, 4/1/30 | 1,040 | 1,050,712 | ||||||
5.00%, 1/15/44 | 1,508 | 1,408,563 | ||||||
| $ | 5,452,561 | |||||||
| Technology — 0.2% | ||||||||
CDW, LLC/CDW Finance Corp., 3.276%, 12/1/28 | $ | 731 | $ | 750,379 | ||||
Western Digital Corp., 4.75%, 2/15/26 | 439 | 480,597 | ||||||
| $ | 1,230,976 | |||||||
| Telecommunications — 2.7% | ||||||||
| AT&T, Inc.: | ||||||||
3.55%, 9/15/55 | $ | 1,251 | $ | 1,257,653 | ||||
3.65%, 6/1/51 | 3,037 | 3,152,137 | ||||||
3.65%, 9/15/59 | 372 | 376,410 | ||||||
3.80%, 12/1/57 | 2,258 | 2,356,078 | ||||||
| Nokia Oyj: | ||||||||
4.375%, 6/12/27 | 981 | 1,060,672 | ||||||
6.625%, 5/15/39 | 1,242 | 1,720,331 | ||||||
SES Global Americas Holdings GP, 5.30%, 3/25/44(1) | 661 | 757,238 | ||||||
SES S.A., 5.30%, 4/4/43(1) | 393 | 451,233 | ||||||
| 22 | See Notes to Financial Statements. |
Core Bond Portfolio
December 31, 2021
Portfolio of Investments — continued
| Security | Principal Amount (000’s omitted) | Value | ||||||
| Telecommunications (continued) | ||||||||
| T-Mobile USA, Inc.: | ||||||||
2.25%, 11/15/31 | $ | 278 | $ | 270,060 | ||||
2.55%, 2/15/31 | 646 | 643,268 | ||||||
2.625%, 4/15/26 | 1,594 | 1,604,050 | ||||||
4.50%, 4/15/50 | 1,511 | 1,771,029 | ||||||
| $ | 15,420,159 | |||||||
| Transportation — 0.3% | ||||||||
FedEx Corp., 4.55%, 4/1/46 | $ | 500 | $ | 600,639 | ||||
SMBC Aviation Capital Finance DAC, 3.55%, 4/15/24(1) | 1,200 | 1,253,500 | ||||||
| $ | 1,854,139 | |||||||
| Utilities — 1.5% | ||||||||
| American Water Capital Corp.: | ||||||||
2.30%, 6/1/31 | $ | 2,740 | $ | 2,742,856 | ||||
2.95%, 9/1/27 | 1,426 | 1,505,676 | ||||||
Southern Co. (The), Series B, | 1,704 | 1,746,600 | ||||||
| Southern Co. Gas Capital Corp.: | ||||||||
2.45%, 10/1/23 | 1,060 | 1,082,499 | ||||||
3.95%, 10/1/46 | 1,270 | 1,397,403 | ||||||
| $ | 8,475,034 | |||||||
Total Corporate Bonds | $ | 218,693,739 | ||||||
| Preferred Securities — 0.9% |
| |||||||
| Security | Shares | Value | ||||||
| Oil, Gas & Consumable Fuels — 0.1% | ||||||||
NuStar Energy, L.P., Series B, 7.625% to 6/15/22(7) | 24,632 | $ | 554,220 | |||||
| $ | 554,220 | |||||||
| Real Estate Management & Development — 0.4% | ||||||||
Brookfield Property Partners, L.P., Series A, 5.75% | 85,000 | $ | 2,002,600 | |||||
| $ | 2,002,600 | |||||||
| Wireless Telecommunication Services — 0.4% | ||||||||
United States Cellular Corp., 5.50% | 90,800 | $ | 2,397,120 | |||||
| $ | 2,397,120 | |||||||
Total Preferred Securities | $ | 4,953,940 | ||||||
| Senior Floating-Rate Loans — 1.2%(11) |
| |||||||
| Borrower/Description | Principal Amount (000’s omitted) | Value | ||||||
| Building and Development — 0.2% | ||||||||
Cushman & Wakefield U.S. Borrower, LLC, Term Loan, 2.852%, (1 mo. USD LIBOR + 2.75%), 8/21/25 | $ | 1,213 | $ | 1,206,710 | ||||
| $ | 1,206,710 | |||||||
| Electronics/Electrical — 0.3% | ||||||||
Hyland Software, Inc., Term Loan, 4.25%, (1 mo. USD LIBOR + 3.50%, Floor 0.75%), 7/1/24 | $ | 1,002 | $ | 1,004,417 | ||||
MA FinanceCo., LLC, Term Loan, 2.854%, (1 mo. USD LIBOR + 2.75%), 6/21/24 | 76 | 75,677 | ||||||
Seattle Spinco, Inc., Term Loan, 2.854%, (1 mo. USD LIBOR + 2.75%), 6/21/24 | 514 | 511,063 | ||||||
| $ | 1,591,157 | |||||||
| Equipment Leasing — 0.1% | ||||||||
Avolon TLB Borrower 1 (US), LLC, Term Loan, 2.50%, (1 mo. USD LIBOR + 1.75%, Floor 0.75%), 1/15/25 | $ | 631 | $ | 632,306 | ||||
| $ | 632,306 | |||||||
| Health Care — 0.1% | ||||||||
Change Healthcare Holdings, LLC, Term Loan, 3.50%, (1 mo. USD LIBOR + 2.50%, Floor 1.00%), 3/1/24 | $ | 722 | $ | 721,931 | ||||
| $ | 721,931 | |||||||
| Insurance — 0.1% | ||||||||
| Asurion, LLC: | ||||||||
Term Loan, 3.229%, (1 mo. USD LIBOR + 3.125%), 11/3/23 | $ | 432 | $ | 431,466 | ||||
Term Loan, 3.354%, (1 mo. USD LIBOR + 3.25%), 12/23/26 | 248 | 246,082 | ||||||
| $ | 677,548 | |||||||
| Leisure Goods/Activities/Movies — 0.1% | ||||||||
Bombardier Recreational Products, Inc., Term Loan, 2.101%, (1 mo. USD LIBOR + 2.00%), 5/24/27 | $ | 243 | $ | 239,932 | ||||
| $ | 239,932 | |||||||
| Telecommunications — 0.3% | ||||||||
CenturyLink, Inc., Term Loan, 2.354%, (1 mo. USD LIBOR + 2.25%), 3/15/27 | $ | 490 | $ | 484,756 | ||||
Level 3 Financing, Inc., Term Loan, 1.854%, (1 mo. USD LIBOR + 1.75%), 3/1/27 | 250 | 246,658 | ||||||
| 23 | See Notes to Financial Statements. |
Core Bond Portfolio
December 31, 2021
Portfolio of Investments — continued
| Borrower/Description | Principal Amount (000’s omitted) | Value | ||||||
| Telecommunications (continued) | ||||||||
Ziggo Financing Partnership, Term Loan, 2.61%, (1 mo. USD LIBOR + 2.50%), 4/30/28 | $ | 1,000 | $ | 990,625 | ||||
| $ | 1,722,039 | |||||||
Total Senior Floating-Rate Loans | $ | 6,791,623 | ||||||
| Sovereign Government Bonds — 1.2% |
| |||||||
| Security | Principal Amount (000’s omitted) | Value | ||||||
Kreditanstalt fuer Wiederaufbau, 2.00%, 9/29/22 | $ | 7,000 | $ | 7,082,768 | ||||
Total Sovereign Government Bonds | $ | 7,082,768 | ||||||
| Taxable Municipal Obligations — 2.0% |
| |||||||
| Security | Principal Amount (000’s omitted) | Value | ||||||
| Special Tax Revenue — 0.3% | ||||||||
California Health Facilities Financing Authority, (No Place Like Home Program), 3.034%, 6/1/34 | $ | 1,430 | $ | 1,490,789 | ||||
| $ | 1,490,789 | |||||||
| Water and Sewer — 1.7% | ||||||||
| Narragansett Bay Commission, RI, Wastewater System Revenue: | ||||||||
Green Bonds, 2.094%, 9/1/30 | $ | 820 | $ | 832,800 | ||||
Green Bonds, 2.184%, 9/1/31 | 650 | 658,840 | ||||||
Green Bonds, 2.264%, 9/1/32 | 585 | 591,938 | ||||||
Green Bonds, 2.344%, 9/1/33 | 635 | 639,922 | ||||||
San Francisco City and County Public Utilities Commission, CA, Water Revenue, Green Bonds, 3.303%, 11/1/39 | 6,750 | 6,983,550 | ||||||
| $ | 9,707,050 | |||||||
Total Taxable Municipal Obligations | $ | 11,197,839 | ||||||
| U.S. Treasury Obligations — 15.6% |
| |||||||
| Security | Principal Amount (000’s omitted) | Value | ||||||
| U.S. Treasury Bonds: | ||||||||
1.375%, 8/15/50 | $ | 2,806 | $ | 2,459,086 | ||||
1.625%, 11/15/50 | 8,674 | 8,083,914 | ||||||
1.875%, 2/15/51 | 7,427 | 7,350,989 | ||||||
2.00%, 8/15/51 | 347 | 353,832 | ||||||
2.25%, 5/15/41 | 4,238 | 4,453,873 | ||||||
| U.S. Treasury Notes: | ||||||||
0.25%, 6/15/24 | 978 | 963,909 | ||||||
0.25%, 5/31/25 | 3,310 | 3,220,268 | ||||||
0.375%, 11/30/25 | 1,414 | 1,371,414 | ||||||
0.375%, 12/31/25 | 10,941 | 10,606,787 | ||||||
0.375%, 1/31/26 | 8,006 | 7,747,369 | ||||||
0.50%, 2/28/26 | 3,144 | 3,055,207 | ||||||
0.625%, 7/31/26 | 6,812 | 6,624,404 | ||||||
0.75%, 11/15/24 | 400 | 397,813 | ||||||
0.75%, 4/30/26 | 4,821 | 4,725,898 | ||||||
1.00%, 7/31/28 | 5,244 | 5,106,550 | ||||||
1.125%, 2/29/28 | 5,780 | 5,697,364 | ||||||
1.125%, 8/31/28 | 1,045 | 1,024,998 | ||||||
1.25%, 3/31/28 | 2,415 | 2,394,057 | ||||||
1.25%, 4/30/28 | 8,955 | 8,875,594 | ||||||
1.25%, 6/30/28 | 1,455 | 1,440,450 | ||||||
1.375%, 10/31/28 | 2,510 | 2,500,587 | ||||||
1.625%, 5/15/31 | 898 | 909,716 | ||||||
Total U.S. Treasury Obligations | $ | 89,364,079 | ||||||
| Short-Term Investments — 6.7% |
| |||||||
| Description | Units | Value | ||||||
Eaton Vance Cash Reserves Fund, LLC, 0.08%(12) | 38,100,244 | $ | 38,096,434 | |||||
Total Short-Term Investments |
| $ | 38,096,434 | |||||
Total Investments — 103.8% |
| $ | 592,334,669 | |||||
Other Assets, Less Liabilities — (3.8)% |
| $ | (21,462,356 | ) | ||||
Net Assets — 100.0% |
| $ | 570,872,313 | |||||
The percentage shown for each investment category in the Portfolio of Investments is based on net assets.
| 24 | See Notes to Financial Statements. |
Core Bond Portfolio
December 31, 2021
Portfolio of Investments — continued
| (1) | Security exempt from registration under Rule 144A of the Securities Act of 1933, as amended. These securities may be sold in certain transactions in reliance on an exemption from registration (normally to qualified institutional buyers). At December 31, 2021, the aggregate value of these securities is $184,389,185 or 32.3% of the Portfolio’s net assets. |
| (2) | Variable rate security. The stated interest rate represents the rate in effect at December 31, 2021. |
| (3) | Weighted average fixed-rate coupon that changes/updates monthly. Rate shown is the rate at December 31, 2021. |
| (4) | Step coupon security. Interest rate represents the rate in effect at December 31, 2021. |
| (5) | Represents an investment in an issuer that may be deemed to be an affiliate effective March 1, 2021 (see Note 7). |
| (6) | TBA (To Be Announced) securities are purchased on a forward commitment basis with an approximate principal amount and maturity date. The actual principal amount and maturity date are determined upon settlement. |
| (7) | Security converts to variable rate after the indicated fixed-rate coupon period. |
| (8) | Perpetual security with no stated maturity date but may be subject to calls by the issuer. |
| (9) | Variable rate security. The stated interest rate, which resets quarterly, is determined at auction and represents the rate in effect at December 31, 2021. |
| (10) | Amount is less than 0.05%. |
| (11) | Senior floating-rate loans (Senior Loans) often require prepayments from excess cash flows or permit the borrowers to repay at their election. The degree to which borrowers repay, whether as a contractual requirement or at their election, cannot be predicted with accuracy. As a result, the actual remaining maturity may be substantially less than the stated maturities shown. However, Senior Loans will typically have an expected average life of approximately two to four years. Senior Loans typically have rates of interest which are redetermined periodically by reference to a base lending rate, plus a spread. These base lending rates are primarily the London Interbank Offered Rate (“LIBOR”) and secondarily, the prime rate offered by one or more major United States banks (the “Prime Rate”). Base lending rates may be subject to a floor, or a minimum rate. Senior Loans are generally subject to contractual restrictions that must be satisfied before they can be bought or sold. |
| (12) | Affiliated investment company, available to Eaton Vance portfolios and funds, which invests in high quality, U.S. dollar denominated money market instruments. The rate shown is the annualized seven-day yield as of December 31, 2021. |
| Futures Contracts | ||||||||||||||||||||
| Description | Number of Contracts | Position | Expiration Date | Notional Amount | Value/Unrealized Appreciation (Depreciation) | |||||||||||||||
Interest Rate Futures | ||||||||||||||||||||
| U.S. 2-Year Treasury Note | 278 | Long | 3/31/22 | $ | 60,651,781 | $ | (20,713 | ) | ||||||||||||
| U.S. 5-Year Treasury Note | 126 | Long | 3/31/22 | 15,243,047 | 33,651 | |||||||||||||||
| U.S. 10-Year Treasury Note | 38 | Long | 3/22/22 | 4,957,812 | 56,051 | |||||||||||||||
| U.S. Ultra-Long Treasury Bond | 109 | Long | 3/22/22 | 21,486,625 | 495,583 | |||||||||||||||
| U.S. Ultra 10-Year Treasury Note | (320 | ) | Short | 3/22/22 | (46,860,000 | ) | (794,052 | ) | ||||||||||||
| $ | (229,480 | ) | ||||||||||||||||||
Abbreviations:
| LIBOR | – | London Interbank Offered Rate | ||
| PPTT | – | Preferred Pass-Through Trust | ||
| SOFR | – | Secured Overnight Financing Rate | ||
| TBA | – | To Be Announced | ||
| Currency Abbreviations: | ||||
| USD | – | United States Dollar | ||
| 25 | See Notes to Financial Statements. |
Core Bond Portfolio
December 31, 2021
Statement of Assets and Liabilities
| Assets | December 31, 2021 | |||
Unaffiliated investments, at value (identified cost, $545,325,163) | $ | 549,712,716 | ||
Affiliated investments, at value (identified cost, $43,004,533) | 42,621,953 | |||
Cash | 50,456 | |||
Deposits for derivatives collateral — financial futures contracts | 681,942 | |||
Interest receivable | 2,518,946 | |||
Interest and dividends receivable from affiliated investments | 10,816 | |||
Receivable for investments sold | 6,779,416 | |||
Receivable for variation margin on open financial futures contracts | 156,949 | |||
Total assets | $ | 602,533,194 | ||
| Liabilities | ||||
Payable for when-issued/delayed delivery/forward commitment securities | $ | 31,340,523 | ||
Payable to affiliates: | ||||
Investment adviser fee | 219,005 | |||
Trustees’ fees | 6,878 | |||
Other | 125 | |||
Accrued expenses | 94,350 | |||
Total liabilities | $ | 31,660,881 | ||
Net Assets applicable to investors’ interest in Portfolio | $ | 570,872,313 | ||
| 26 | See Notes to Financial Statements. |
Core Bond Portfolio
December 31, 2021
Statement of Operations
| Investment Income | Year Ended December 31, 2021 | |||
Interest (net of foreign taxes, $659) | $ | 13,974,476 | ||
Dividends (net of foreign taxes, $3,910) | 298,692 | |||
Interest and dividends from affiliated investments | 153,142 | |||
Total investment income | $ | 14,426,310 | ||
| Expenses | ||||
Investment adviser fee | $ | 2,548,345 | ||
Trustees’ fees and expenses | 27,413 | |||
Custodian fee | 152,476 | |||
Legal and accounting services | 69,351 | |||
Miscellaneous | 14,974 | |||
Total expenses | $ | 2,812,559 | ||
Deduct — | ||||
Allocation of expenses to affiliate | $ | 35,527 | ||
Total expense reductions | $ | 35,527 | ||
Net expenses | $ | 2,777,032 | ||
Net investment income | $ | 11,649,278 | ||
| Realized and Unrealized Gain (Loss) | ||||
Net realized gain (loss) — | ||||
Investment transactions | $ | 8,019,256 | ||
Investment transactions — affiliated investments | 182,763 | |||
Financial futures contracts | 310,967 | |||
Net realized gain | $ | 8,512,986 | ||
Change in unrealized appreciation (depreciation) — | ||||
Investments | $ | (15,693,080 | ) | |
Investments — affiliated investments | (193,439 | ) | ||
Financial futures contracts | (146,244 | ) | ||
Net change in unrealized appreciation (depreciation) | $ | (16,032,763 | ) | |
Net realized and unrealized loss | $ | (7,519,777 | ) | |
Net increase in net assets from operations | $ | 4,129,501 | ||
| 27 | See Notes to Financial Statements. |
Core Bond Portfolio
December 31, 2021
Statements of Changes in Net Assets
| Year Ended December 31, | ||||||||
| Increase (Decrease) in Net Assets | 2021 | 2020 | ||||||
From operations — | ||||||||
Net investment income | $ | 11,649,278 | $ | 13,749,867 | ||||
Net realized gain | 8,512,986 | 16,372,622 | ||||||
Net change in unrealized appreciation (depreciation) | (16,032,763 | ) | 10,973,429 | |||||
Net increase in net assets from operations | $ | 4,129,501 | $ | 41,095,918 | ||||
Capital transactions — | ||||||||
Contributions | $ | 73,755,473 | $ | 80,326,660 | ||||
Withdrawals | (82,966,119 | ) | (135,858,908 | ) | ||||
Net decrease in net assets from capital transactions | $ | (9,210,646 | ) | $ | (55,532,248 | ) | ||
Net decrease in net assets | $ | (5,081,145 | ) | $ | (14,436,330 | ) | ||
| Net Assets | ||||||||
At beginning of year | $ | 575,953,458 | $ | 590,389,788 | ||||
At end of year | $ | 570,872,313 | $ | 575,953,458 | ||||
| 28 | See Notes to Financial Statements. |
Core Bond Portfolio
December 31, 2021
Financial Highlights
| Year Ended December 31, | ||||||||||||||||||||
| Ratios/Supplemental Data | 2021 | 2020 | 2019 | 2018 | 2017 | |||||||||||||||
Ratios (as a percentage of average daily net assets): | ||||||||||||||||||||
Expenses(1) | 0.49 | % | 0.49 | % | 0.49 | % | 0.49 | % | 0.49 | % | ||||||||||
Net investment income | 2.06 | % | 2.46 | % | 2.86 | % | 2.98 | % | 2.46 | % | ||||||||||
Portfolio Turnover | 122 | %(2) | 93 | %(2) | 89 | % | 65 | % | 123 | % | ||||||||||
Total Return(1) | 0.70 | % | 8.16 | % | 9.28 | % | (0.50 | )% | 4.48 | % | ||||||||||
Net assets, end of year (000’s omitted) | $ | 570,872 | $ | 575,953 | $ | 590,390 | $ | 506,016 | $ | 479,364 | ||||||||||
| (1) | The investment adviser reimbursed certain operating expenses (equal to 0.01%, 0.01%, 0.01%, 0.02% and 0.01% of average daily net assets for the years ended December 31, 2021, 2020, 2019, 2018 and 2017, respectively). Absent this reimbursement, total return would be lower. |
| (2) | Includes the effect of To Be Announced (TBA) transactions. |
| 29 | See Notes to Financial Statements. |
Core Bond Portfolio
December 31, 2021
Notes to Financial Statements
1 Significant Accounting Policies
Core Bond Portfolio (the Portfolio) is a Massachusetts business trust registered under the Investment Company Act of 1940, as amended (the 1940 Act), as a diversified, open-end management investment company. The Portfolio’s investment objectives are to seek current income and total return. The Declaration of Trust permits the Trustees to issue interests in the Portfolio. At December 31, 2021, Eaton Vance Balanced Fund and Eaton Vance Core Bond Fund held an interest of 76.0% and 24.0%, respectively, in the Portfolio.
The following is a summary of significant accounting policies of the Portfolio. The policies are in conformity with accounting principles generally accepted in the United States of America (U.S. GAAP). The Portfolio is an investment company and follows accounting and reporting guidance in the Financial Accounting Standards Board (FASB) Accounting Standards Codification Topic 946.
A Investment Valuation — The following methodologies are used to determine the market value or fair value of investments.
Debt Obligations. Debt obligations are generally valued on the basis of valuations provided by third party pricing services, as derived from such services’ pricing models. Inputs to the models may include, but are not limited to, reported trades, executable bid and ask prices, broker/dealer quotations, prices or yields of securities with similar characteristics, interest rates, anticipated prepayments, benchmark curves or information pertaining to the issuer, as well as industry and economic events. The pricing services may use a matrix approach, which considers information regarding securities with similar characteristics to determine the valuation for a security. Short-term debt obligations purchased with a remaining maturity of sixty days or less for which a valuation from a third party pricing service is not readily available may be valued at amortized cost, which approximates fair value.
Preferred Securities. Preferred securities listed on a U.S. securities exchange generally are valued at the last sale or closing price on the day of valuation or, if no sales took place on such date, at the mean between the closing bid and ask prices on the exchange where such securities are principally traded. Preferred securities listed on the NASDAQ National Market System are valued at the NASDAQ official closing price. Preferred securities that are not listed or traded in the over-the-counter market are valued by a third party pricing service that uses various techniques that consider factors including, but not limited to, prices or yields of securities with similar characteristics, benchmark yields, broker/dealer quotes, quotes of underlying common stock, issuer spreads, as well as industry and economic events.
Senior Floating-Rate Loans. Interests in senior floating-rate loans (Senior Loans) for which reliable market quotations are readily available are valued generally at the average mean of bid and ask quotations obtained from a third party pricing service.
Derivatives. U.S. exchange-traded options are valued at the mean between the bid and ask prices at valuation time as reported by the Options Price Reporting Authority. Non-U.S. exchange-traded options and over-the-counter options are valued by a third party pricing service using techniques that consider factors including the value of the underlying instrument, the volatility of the underlying instrument and the period of time until option expiration. Financial futures contracts are valued at the closing settlement price established by the board of trade or exchange on which they are traded.
Affiliated Fund. The Portfolio may invest in Eaton Vance Cash Reserves Fund, LLC (Cash Reserves Fund), an affiliated investment company managed by Eaton Vance Management (EVM). While Cash Reserves Fund is not a registered money market mutual fund, it conducts all of its investment activities in accordance with the requirements of Rule 2a-7 under the 1940 Act. Investments in Cash Reserves Fund are valued at the closing net asset value per unit on the valuation day. Cash Reserves Fund generally values its investment securities based on available market quotations provided by a third party pricing service.
Fair Valuation. Investments for which valuations or market quotations are not readily available or are deemed unreliable are valued at fair value using methods determined in good faith by or at the direction of the Trustees of the Portfolio in a manner that most fairly reflects the security’s “fair value”, which is the amount that the Portfolio might reasonably expect to receive for the security upon its current sale in the ordinary course. Each such determination is based on a consideration of relevant factors, which are likely to vary from one pricing context to another. These factors may include, but are not limited to, the type of security, the existence of any contractual restrictions on the security’s disposition, the price and extent of public trading in similar securities of the issuer or of comparable companies or entities, quotations or relevant information obtained from broker/dealers or other market participants, information obtained from the issuer, analysts, and/or the appropriate stock exchange (for exchange-traded securities), an analysis of the company’s or entity’s financial statements, and an evaluation of the forces that influence the issuer and the market(s) in which the security is purchased and sold.
B Investment Transactions — Investment transactions for financial statement purposes are accounted for on a trade date basis. Realized gains and losses on investments sold are determined on the basis of identified cost.
C Income — Interest income is recorded on the basis of interest accrued, adjusted for amortization of premium or accretion of discount. Inflation adjustments to the principal amount of inflation-adjusted bonds and notes are reflected as interest income. Deflation adjustments to the principal amount of an inflation-adjusted bond or note are reflected as reductions to interest income to the extent of interest income previously recorded on such bond or note. Dividend income is recorded on the ex-dividend date for dividends received in cash and/or securities. Withholding taxes on foreign interest and dividends have been provided for in accordance with the Portfolio’s understanding of the applicable countries’ tax rules and rates.
D Federal Taxes — The Portfolio has elected to be treated as a partnership for federal tax purposes. No provision is made by the Portfolio for federal or state taxes on any taxable income of the Portfolio because each investor in the Portfolio is ultimately responsible for the payment of any taxes on its share of taxable income. Since at least one of the Portfolio’s investors is a regulated investment company that invests all or substantially all of its assets in the Portfolio, the Portfolio normally must satisfy the applicable source of income and diversification requirements (under the Internal Revenue Code) in order
| 30 |
Core Bond Portfolio
December 31, 2021
Notes to Financial Statements — continued
for its investors to satisfy them. The Portfolio will allocate, at least annually among its investors, each investor’s distributive share of the Portfolio’s net investment income, net realized capital gains and losses and any other items of income, gain, loss, deduction or credit.
As of December 31, 2021, the Portfolio had no uncertain tax positions that would require financial statement recognition, de-recognition, or disclosure. The Portfolio files a U.S. federal income tax return annually after its fiscal year-end, which is subject to examination by the Internal Revenue Service for a period of three years from the date of filing.
E Unfunded Loan Commitments — The Portfolio may enter into certain loan agreements all or a portion of which may be unfunded. The Portfolio is obligated to fund these commitments at the borrower’s discretion. These commitments, if any, are disclosed in the accompanying Portfolio of Investments.
F Use of Estimates — The preparation of the financial statements in conformity with U.S. GAAP requires management to make estimates and assumptions that affect the reported amounts of assets and liabilities at the date of the financial statements and the reported amounts of income and expense during the reporting period. Actual results could differ from those estimates.
G Indemnifications — Under the Portfolio’s organizational documents, its officers and Trustees may be indemnified against certain liabilities and expenses arising out of the performance of their duties to the Portfolio. Under Massachusetts law, if certain conditions prevail, interestholders in the Portfolio could be deemed to have personal liability for the obligations of the Portfolio. However, the Portfolio’s Declaration of Trust contains an express disclaimer of liability on the part of Portfolio interestholders. Additionally, in the normal course of business, the Portfolio enters into agreements with service providers that may contain indemnification clauses. The Portfolio’s maximum exposure under these arrangements is unknown as this would involve future claims that may be made against the Portfolio that have not yet occurred.
H Financial Futures Contracts — Upon entering into a financial futures contract, the Portfolio is required to deposit with the broker, either in cash or securities, an amount equal to a certain percentage of the contract amount (initial margin). Subsequent payments, known as variation margin, are made or received by the Portfolio each business day, depending on the daily fluctuations in the value of the underlying security, and are recorded as unrealized gains or losses by the Portfolio. Gains (losses) are realized upon the expiration or closing of the financial futures contracts. Should market conditions change unexpectedly, the Portfolio may not achieve the anticipated benefits of the financial futures contracts and may realize a loss. Futures contracts have minimal counterparty risk as they are exchange traded and the clearinghouse for the exchange is substituted as the counterparty, guaranteeing counterparty performance.
I Purchased Options — Upon the purchase of a call or put option, the premium paid by the Portfolio is included in the Statement of Assets and Liabilities as an investment. The amount of the investment is subsequently marked-to-market to reflect the current market value of the option purchased, in accordance with the Portfolio’s policies on investment valuations discussed above. As the purchaser of an index option, the Portfolio has the right to receive a cash payment equal to any depreciation in the value of the index below the exercise price of the option (in the case of a put) or equal to any appreciation in the value of the index over the exercise price of the option (in the case of a call) as of the valuation date of the option. If an option which the Portfolio had purchased expires on the stipulated expiration date, the Portfolio will realize a loss in the amount of the cost of the option. If the Portfolio enters into a closing sale transaction, the Portfolio will realize a gain or loss, depending on whether the sales proceeds from the closing sale transaction are greater or less than the cost of the option. If the Portfolio exercises a put option on a security, it will realize a gain or loss from the sale of the underlying security, and the proceeds from such sale will be decreased by the premium originally paid. If the Portfolio exercises a call option on a security, the cost of the security which the Portfolio purchases upon exercise will be increased by the premium originally paid. The risk associated with purchasing options is limited to the premium originally paid. Purchased options traded over-the-counter involve risk that the issuer or counterparty will fail to perform its contractual obligations.
J When-Issued Securities and Delayed Delivery Transactions — The Portfolio may purchase securities on a delayed delivery, when-issued or forward commitment basis, including TBA (To Be Announced) securities. Payment and delivery may take place after the customary settlement period for that security. At the time the transaction is negotiated, the price of the security that will be delivered is fixed. The Portfolio maintains cash and/or security positions for these commitments such that sufficient liquid assets will be available to make payments upon settlement. Securities purchased on a delayed delivery, when-issued or forward commitment basis are marked-to-market daily and begin earning interest on settlement date. Such security purchases are subject to the risk that when delivered they will be worth less than the agreed upon payment price. Losses may arise if the counterparty does not perform under the contract. A forward purchase commitment may be closed by entering into an offsetting commitment. If an offsetting commitment is entered into, the Portfolio will realize a gain or loss on investments based on the price established when the Portfolio entered into the commitment.
2 Investment Adviser Fee and Other Transactions with Affiliates
The investment adviser fee is earned by Boston Management and Research (BMR) as compensation for investment advisory services rendered to the Portfolio. On March 1, 2021, Morgan Stanley acquired Eaton Vance Corp. (the “Transaction”) and BMR became an indirect, wholly-owned subsidiary of Morgan Stanley. In connection with the Transaction, the Portfolio entered into a new investment advisory agreement (the “New Agreement”) with BMR, which took effect on March 1, 2021. The Portfolio’s prior fee reduction agreement was incorporated into the New Agreement. Pursuant to the New
| 31 |
Core Bond Portfolio
December 31, 2021
Notes to Financial Statements — continued
Agreement (and the Portfolio’s investment advisory agreement and related fee reduction agreement with BMR in effect prior to March 1, 2021), the investment adviser fee is computed at an annual rate as a percentage of the Portfolio’s average daily net assets as follows and is payable monthly:
| Average Daily Net Assets | Annual Fee Rate | |||
Up to $1 billion | 0.450 | % | ||
$1 billion up to $2 billion | 0.425 | % | ||
$2 billion up to $5 billion | 0.415 | % | ||
$5 billion and over | 0.405 | % | ||
For the year ended December 31, 2021, the Portfolio’s investment adviser fee amounted to $2,548,345 or 0.45% of the Portfolio’s average daily net assets. Pursuant to an expense reimbursement, BMR was allocated $35,527 of the Portfolio’s operating expenses for the year ended December 31, 2021. The Portfolio may invest its cash in Cash Reserves Fund. EVM does not currently receive a fee for advisory services provided to Cash Reserves Fund.
Trustees and officers of the Portfolio who are members of EVM’s or BMR’s organizations receive remuneration for their services to the Portfolio out of the investment adviser fee. Trustees of the Portfolio who are not affiliated with the investment adviser may elect to defer receipt of all or a percentage of their annual fees in accordance with the terms of the Trustees Deferred Compensation Plan. For the year ended December 31, 2021, no significant amounts have been deferred. Certain officers and Trustees of the Portfolio are officers of the above organizations.
3 Purchases and Sales of Investments
Purchases and sales of investments, other than short-term obligations and including maturities, paydowns, principal repayments on Senior Loans and TBA transactions, for the year ended December 31, 2021 were as follows:
| Purchases | Sales | |||||||
Investments (non-U.S. Government) | $ | 188,586,742 | $ | 194,213,982 | ||||
U.S. Government and Agency Securities | 514,396,239 | 510,676,933 | ||||||
| $ | 702,982,981 | $ | 704,890,915 | |||||
4 Federal Income Tax Basis of Investments
The cost and unrealized appreciation (depreciation) of investments, including open derivative contracts, of the Portfolio at December 31, 2021, as determined on a federal income tax basis, were as follows:
Aggregate cost | $ | 588,776,345 | ||
Gross unrealized appreciation | $ | 8,976,610 | ||
Gross unrealized depreciation | (5,418,286 | ) | ||
Net unrealized appreciation | $ | 3,558,324 | ||
5 Financial Instruments
The Portfolio may trade in financial instruments with off-balance sheet risk in the normal course of its investing activities. These financial instruments may include futures contracts and may involve, to a varying degree, elements of risk in excess of the amounts recognized for financial statement purposes. The notional or contractual amounts of these instruments represent the investment the Portfolio has in particular classes of financial instruments and do not necessarily represent the amounts potentially subject to risk. The measurement of the risks associated with these instruments is meaningful only when all related and offsetting transactions are considered. A summary of obligations under these financial instruments at December 31, 2021 is included in the Portfolio of Investments. At December 31, 2021, the Portfolio had sufficient cash and/or securities to cover commitments under these contracts.
| 32 |
Core Bond Portfolio
December 31, 2021
Notes to Financial Statements — continued
The Portfolio is subject to interest rate risk in the normal course of pursuing its investment objectives. Because the Portfolio holds fixed-rate bonds, the value of these bonds may decrease if interest rates rise. The Portfolio enters into U.S. Treasury futures contracts and options thereon to hedge against fluctuations in interest rates.
The fair value of open derivative instruments (not considered to be hedging instruments for accounting disclosure purposes) and whose primary underlying risk exposure is interest rate risk at December 31, 2021 was as follows:
| Fair Value | ||||||||
| Derivative | Asset Derivative(1) | Liability Derivative(1) | ||||||
Financial futures contracts | $ | 585,285 | $ | (814,765 | ) | |||
| (1) | Only the current day’s variation margin on open futures contracts is reported within the Statement of Assets and Liabilities as Receivable or Payable for variation margin on open financial futures contracts, as applicable. |
The effect of derivative instruments (not considered to be hedging instruments for accounting disclosure purposes) on the Statement of Operations and whose primary underlying risk exposure is interest rate risk for the year ended December 31, 2021 was as follows:
| Derivative | Realized Gain (Loss) on Derivatives Recognized in Income(1) | Change in Unrealized Appreciation (Depreciation) on Derivatives Recognized in Income(2) | ||||||
Purchased options | $ | (43,749 | ) | $ | — | |||
Financial futures contracts | 310,967 | (146,244 | ) | |||||
Total | $ | 267,218 | $ | (146,244 | ) | |||
| (1) | Statement of Operations location: Net realized gain (loss) – Investment transactions and Financial futures contracts, respectively. |
| (2) | Statement of Operations location: Change in unrealized appreciation (depreciation) – Financial futures contracts. |
The average notional cost of futures contracts outstanding during the year ended December 31, 2021, which is indicative of the volume of this derivative type, was approximately as follows:
| Futures Contracts — Long | Futures Contracts — Short | |||||
| $60,261,000 | $ | 64,450,000 | ||||
The average number of purchased options contracts outstanding during the year ended December 31, 2021, which is indicative of the volume of this derivative type, was 15 contracts.
6 Line of Credit
The Portfolio participates with other portfolios and funds managed by EVM and its affiliates in an $800 million unsecured line of credit agreement with a group of banks, which is in effect through October 25, 2022. Borrowings are made by the Portfolio solely for temporary purposes related to redemptions and other short-term cash needs. Interest is charged to the Portfolio based on its borrowings at an amount above either the Secured Overnight Financing Rate (SOFR) or Federal Funds rate. In addition, a fee computed at an annual rate of 0.15% on the daily unused portion of the line of credit is allocated among the participating portfolios and funds at the end of each quarter. In connection with the renewal of the agreement in October 2021, an arrangement fee totaling $150,000 was incurred that was allocated to the participating portfolios and funds. Because the line of credit is not available exclusively to the Portfolio, it may be unable to borrow some or all of its requested amounts at any particular time. The Portfolio did not have any significant borrowings or allocated fees during the year ended December 31, 2021.
| 33 |
Core Bond Portfolio
December 31, 2021
Notes to Financial Statements — continued
7 Investments in Affiliated Issuers and Funds
The Portfolio invested in issuers that may be deemed to be affiliated with Morgan Stanley. At December 31, 2021, the value of the Portfolio’s investment in affiliated issuers and funds was $42,621,953, which represents 7.5% of the Portfolio’s net assets. Transactions in affiliated issuers and funds by the Portfolio for the year ended December 31, 2021 were as follows:
| Name | Value, beginning of period | Purchases | Sales proceeds | Net realized gain (loss) | Change in unrealized appreciation (depreciation) | Value, end of period | Interest/ Dividend | Principal amount/ Units, end of period | ||||||||||||||||||||||||
Commercial Mortgage-Backed Securities | ||||||||||||||||||||||||||||||||
Morgan Stanley Bank of America Merrill Lynch Trust, Series 2016-C29, Class C, 4.729%, 5/15/49(1) | $ | — | $ | — | $ | — | $ | — | $ | (35,084 | ) | $ | 1,014,911 | $ | 39,863 | $ | 993,200 | |||||||||||||||
Morgan Stanley Capital I Trust: | ||||||||||||||||||||||||||||||||
Series 2016-UBS12, Class D, 3.312%, 12/15/49(1) | — | — | — | — | 4,730 | 1,017,226 | 60,360 | 1,745,000 | ||||||||||||||||||||||||
Series 2019-BPR, Class A, 1.51%, (1 mo. USD LIBOR + 1.40%), 5/15/36(1) | — | — | — | — | 40,991 | 2,493,382 | 32,165 | 2,521,000 | ||||||||||||||||||||||||
Corporate Bonds | ||||||||||||||||||||||||||||||||
Morgan Stanley: | ||||||||||||||||||||||||||||||||
0.71%, (SOFR + 0.70%), 1/20/23(1) | — | — | (4,546,503 | ) | 12,503 | (21,490 | ) | — | 2,375 | — | ||||||||||||||||||||||
3.772% to 1/24/28, 1/24/29(1) | — | — | (1,142,216 | ) | 122,216 | (125,574 | ) | — | 214 | — | ||||||||||||||||||||||
4.875%, 11/1/22(1) | — | — | (1,207,629 | ) | 50,463 | (57,012 | ) | — | 3,716 | — | ||||||||||||||||||||||
Short-Term Investments | ||||||||||||||||||||||||||||||||
Eaton Vance Cash Reserves Fund, LLC | 52,287,209 | 255,377,689 | (269,566,045 | ) | (2,419 | ) | — | 38,096,434 | 14,449 | 38,100,244 | ||||||||||||||||||||||
Totals | $ | 182,763 | $ | (193,439 | ) | $ | 42,621,953 | $ | 153,142 | |||||||||||||||||||||||
| (1) | Affiliated issuer/May be deemed to be an affiliated issuer as of March 1, 2021 (see Note 2). |
8 Fair Value Measurements
Under generally accepted accounting principles for fair value measurements, a three-tier hierarchy to prioritize the assumptions, referred to as inputs, is used in valuation techniques to measure fair value. The three-tier hierarchy of inputs is summarized in the three broad levels listed below.
| • | Level 1 – quoted prices in active markets for identical investments |
| • | Level 2 – other significant observable inputs (including quoted prices for similar investments, interest rates, prepayment speeds, credit risk, etc.) |
| • | Level 3 – significant unobservable inputs (including a fund’s own assumptions in determining the fair value of investments) |
In cases where the inputs used to measure fair value fall in different levels of the fair value hierarchy, the level disclosed is determined based on the lowest level input that is significant to the fair value measurement in its entirety. The inputs or methodology used for valuing securities are not necessarily an indication of the risk associated with investing in those securities.
| 34 |
Core Bond Portfolio
December 31, 2021
Notes to Financial Statements — continued
At December 31, 2021, the hierarchy of inputs used in valuing the Portfolio’s investments and open derivative instruments, which are carried at value, were as follows:
| Asset Description | Level 1 | Level 2 | Level 3 | Total | ||||||||||||
Asset-Backed Securities | $ | — | $ | 75,941,311 | $ | — | $ | 75,941,311 | ||||||||
Collateralized Mortgage Obligations | — | 24,422,967 | — | 24,422,967 | ||||||||||||
Commercial Mortgage-Backed Securities | — | 54,748,320 | — | 54,748,320 | ||||||||||||
U.S. Government Agency Mortgage-Backed Securities | — | 61,041,649 | — | 61,041,649 | ||||||||||||
Corporate Bonds | — | 218,693,739 | — | 218,693,739 | ||||||||||||
Preferred Securities | 4,953,940 | — | — | 4,953,940 | ||||||||||||
Senior Floating-Rate Loans | — | 6,791,623 | — | 6,791,623 | ||||||||||||
Sovereign Government Bonds | — | 7,082,768 | — | 7,082,768 | ||||||||||||
Taxable Municipal Obligations | — | 11,197,839 | — | 11,197,839 | ||||||||||||
U.S. Treasury Obligations | — | 89,364,079 | — | 89,364,079 | ||||||||||||
Short-Term Investments | — | 38,096,434 | — | 38,096,434 | ||||||||||||
Total Investments | $ | 4,953,940 | $ | 587,380,729 | $ | — | $ | 592,334,669 | ||||||||
Futures Contracts | $ | 585,285 | $ | — | $ | — | $ | 585,285 | ||||||||
Total | $ | 5,539,225 | $ | 587,380,729 | $ | — | $ | 592,919,954 | ||||||||
Liability Description | ||||||||||||||||
Futures Contracts | $ | (814,765 | ) | $ | — | $ | — | $ | (814,765 | ) | ||||||
Total | $ | (814,765 | ) | $ | — | $ | — | $ | (814,765 | ) | ||||||
9 Risks and Uncertainties
Pandemic Risk
An outbreak of respiratory disease caused by a novel coronavirus was first detected in China in late 2019 and subsequently spread internationally. This coronavirus has resulted in closing borders, enhanced health screenings, changes to healthcare service preparation and delivery, quarantines, cancellations, disruptions to supply chains and customer activity, as well as general concern and uncertainty. Health crises caused by outbreaks, such as the coronavirus outbreak, may exacerbate other pre-existing political, social and economic risks and disrupt normal market conditions and operations. The impact of this outbreak has negatively affected the worldwide economy, the economies of individual countries, individual companies, and the market in general, and may continue to do so in significant and unforeseen ways, as may other epidemics and pandemics that may arise in the future. Any such impact could adversely affect the Portfolio’s performance, or the performance of the securities in which the Portfolio invests.
| 35 |
Core Bond Portfolio
December 31, 2021
Report of Independent Registered Public Accounting Firm
To the Trustees and Investors of Core Bond Portfolio:
Opinion on the Financial Statements and Financial Highlights
We have audited the accompanying statement of assets and liabilities of Core Bond Portfolio (the “Portfolio”), including the portfolio of investments, as of December 31, 2021, the related statement of operations for the year then ended, the statements of changes in net assets for each of the two years in the period then ended, the financial highlights for each of the five years in the period then ended, and the related notes. In our opinion, the financial statements and financial highlights present fairly, in all material respects, the financial position of the Portfolio as of December 31, 2021, and the results of its operations for the year then ended, the changes in its net assets for each of the two years in the period then ended, and the financial highlights for each of the five years in the period then ended, in conformity with accounting principles generally accepted in the United States of America.
Basis for Opinion
These financial statements and financial highlights are the responsibility of the Portfolio’s management. Our responsibility is to express an opinion on the Portfolio’s financial statements and financial highlights based on our audits. We are a public accounting firm registered with the Public Company Accounting Oversight Board (United States) (PCAOB) and are required to be independent with respect to the Portfolio in accordance with the U.S. federal securities laws and the applicable rules and regulations of the Securities and Exchange Commission and the PCAOB.
We conducted our audits in accordance with the standards of the PCAOB. Those standards require that we plan and perform the audit to obtain reasonable assurance about whether the financial statements and financial highlights are free of material misstatement, whether due to error or fraud. The Portfolio is not required to have, nor were we engaged to perform, an audit of its internal control over financial reporting. As part of our audits, we are required to obtain an understanding of internal control over financial reporting but not for the purpose of expressing an opinion on the effectiveness of the Portfolio’s internal control over financial reporting. Accordingly, we express no such opinion.
Our audits included performing procedures to assess the risks of material misstatement of the financial statements and financial highlights, whether due to error or fraud, and performing procedures that respond to those risks. Such procedures included examining, on a test basis, evidence regarding the amounts and disclosures in the financial statements and financial highlights. Our audits also included evaluating the accounting principles used and significant estimates made by management, as well as evaluating the overall presentation of the financial statements and financial highlights. Our procedures included confirmation of securities and senior loans owned as of December 31, 2021, by correspondence with the custodian, brokers and selling or agent banks; when replies were not received from brokers and selling or agent banks, we performed other auditing procedures. We believe that our audits provide a reasonable basis for our opinion.
/s/ Deloitte & Touche LLP
Boston, Massachusetts
February 23, 2022
We have served as the auditor of one or more Eaton Vance investment companies since 1959.
| 36 |
Eaton Vance
Core Bond Fund
December 31, 2021
Fund Management. The Trustees of Eaton Vance Special Investment Trust (the Trust) and Core Bond Portfolio (the Portfolio) are responsible for the overall management and supervision of the Trust and the Portfolio’s affairs. The Board members and officers of the Trust and the Portfolio are listed below. Except as indicated, each individual has held the office shown or other offices in the same company for the last five years. Board members hold indefinite terms of office. Each Trustee holds office until his or her successor is elected and qualified, subject to a prior death, resignation, retirement, disqualification or removal. Under the terms of the Fund’s and the Portfolio’s current Trustee retirement policy, an Independent Trustee must retire and resign as a Trustee on the earlier of: (i) the first day of July following his or her 74th birthday; or (ii), with limited exception, December 31st of the 20th year in which he or she has served as a Trustee. However, if such retirement and resignation would cause the Fund or Portfolio to be out of compliance with Section 16 of the 1940 Act or any other regulations or guidance of the SEC, then such retirement and resignation will not become effective until such time as action has been taken for the Fund or Portfolio to be in compliance therewith. The “noninterested Trustees” consist of those Trustees who are not “interested persons” of the Trust and the Portfolio, as that term is defined under the 1940 Act. The business address of each Board member and officer is Two International Place, Boston, Massachusetts 02110. As used below, “BMR” refers to Boston Management and Research, “EVC” refers to Eaton Vance Corp., “EV” refers to EV LLC, “EVM” refers to Eaton Vance Management and “EVD” refers to Eaton Vance Distributors, Inc. EV is the trustee of each of EVM and BMR. Effective March 1, 2021, each of EVM, BMR, EVD and EV are indirect, wholly owned subsidiaries of Morgan Stanley. Each officer affiliated with EVM may hold a position with other EVM affiliates that is comparable to his or her position with EVM listed below. Each Trustee oversees 138 funds (with the exception of Messrs. Faust and Wennerholm and Ms. Frost who oversee 137 funds) in the Eaton Vance fund complex (including both funds and portfolios in a hub and spoke structure).
| Name and Year of Birth | Trust/Portfolio Position(s) | Length of Service | Principal Occupation(s) and Other Directorships During Past Five Years and Other Relevant Experience | |||
| Interested Trustee | ||||||
Thomas E. Faust Jr. 1958 | Trustee | Since 2007 | Chairman of Morgan Stanley Investment Management, Inc. (MSIM), member of the Board of Managers and President of EV, Chief Executive Officer of EVM and BMR, and Director of EVD. Formerly, Chairman, Chief Executive Officer and President of EVC. Mr. Faust is an interested person because of his positions with MSIM, BMR, EVM, EVD, and EV, which are affiliates of the Trust and the Portfolio, and his former position with EVC, which was an affiliate of the Trust and the Portfolio prior to March 1, 2021. Other Directorships. Formerly, Director of EVC (2007-2021) and Hexavest Inc. (investment management firm) (2012-2021). | |||
| Noninterested Trustees | ||||||
Mark R. Fetting 1954 | Trustee | Since 2016 | Private investor. Formerly held various positions at Legg Mason, Inc. (investment management firm) (2000-2012), including President, Chief Executive Officer, Director and Chairman (2008-2012), Senior Executive Vice President (2004-2008) and Executive Vice President (2001-2004). Formerly, President of Legg Mason family of funds (2001-2008). Formerly, Division President and Senior Officer of Prudential Financial Group, Inc. and related companies (investment management firm) (1991-2000). Other Directorships. None. | |||
Cynthia E. Frost 1961 | Trustee | Since 2014 | Private investor. Formerly, Chief Investment Officer of Brown University (university endowment) (2000-2012). Formerly, Portfolio Strategist for Duke Management Company (university endowment manager) (1995-2000). Formerly, Managing Director, Cambridge Associates (investment consulting company) (1989-1995). Formerly, Consultant, Bain and Company (management consulting firm) (1987-1989). Formerly, Senior Equity Analyst, BA Investment Management Company (1983-1985). Other Directorships. None. | |||
George J. Gorman 1952 | Chairperson of the Board and Trustee | Since 2021 (Chairperson) and 2014 (Trustee) | Principal at George J. Gorman LLC (consulting firm). Formerly, Senior Partner at Ernst & Young LLP (a registered public accounting firm) (1974-2009). Other Directorships. None. | |||
Valerie A. Mosley 1960 | Trustee | Since 2014 | Chairwoman and Chief Executive Officer of Valmo Ventures (a consulting and investment firm). Founder of Upward Wealth, Inc., dba BrightUP, a fintech platform. Formerly, Partner and Senior Vice President, Portfolio Manager and Investment Strategist at Wellington Management Company, LLP (investment management firm) (1992-2012). Formerly, Chief Investment Officer, PG Corbin Asset Management (1990-1992). Formerly worked in institutional corporate bond sales at Kidder Peabody (1986-1990). Other Directorships. Director of DraftKings, Inc. (digital sports entertainment and gaming company) (since September 2020). Director of Groupon, Inc. (e-commerce provider) (since April 2020). Director of Envestnet, Inc. (provider of intelligent systems for wealth management and financial wellness) (since 2018). Formerly, Director of Dynex Capital, Inc. (mortgage REIT) (2013-2020). | |||
| 37 |
Eaton Vance
Core Bond Fund
December 31, 2021
Management and Organization — continued
| Name and Year of Birth | Trust/Portfolio Position(s) | Length of Service | Principal Occupation(s) and Other Directorships During Past Five Years and Other Relevant Experience | |||
| Noninterested Trustees (continued) | ||||||
William H. Park 1947 | Trustee | Since 2003 | Private investor. Formerly, Consultant (management and transactional) (2012-2014). Formerly, Chief Financial Officer, Aveon Group L.P. (investment management firm) (2010-2011). Formerly, Vice Chairman, Commercial Industrial Finance Corp. (specialty finance company) (2006-2010). Formerly, President and Chief Executive Officer, Prizm Capital Management, LLC (investment management firm) (2002-2005). Formerly, Executive Vice President and Chief Financial Officer, United Asset Management Corporation (investment management firm) (1982-2001). Formerly, Senior Manager, Price Waterhouse (now PricewaterhouseCoopers) (a registered public accounting firm) (1972-1981). Other Directorships. None. | |||
Helen Frame Peters 1948 | Trustee | Since 2008 | Professor of Finance, Carroll School of Management, Boston College. Formerly, Dean, Carroll School of Management, Boston College (2000-2002). Formerly, Chief Investment Officer, Fixed Income, Scudder Kemper Investments (investment management firm) (1998-1999). Formerly, Chief Investment Officer, Equity and Fixed Income, Colonial Management Associates (investment management firm) (1991-1998). Other Directorships. None. | |||
Keith Quinton 1958 | Trustee | Since 2018 | Private investor, researcher and lecturer. Formerly, Independent Investment Committee Member at New Hampshire Retirement System (2017-2021). Formerly, Portfolio Manager and Senior Quantitative Analyst at Fidelity Investments (investment management firm) (2001-2014). Other Directorships. Formerly, Director (2016-2021) and Chairman (2019-2021) of New Hampshire Municipal Bond Bank. | |||
Marcus L. Smith 1966 | Trustee | Since 2018 | Private investor. Formerly, Portfolio Manager at MFS Investment Management (investment management firm) (1994-2017). Other Directorships. Director of First Industrial Realty Trust, Inc. (an industrial REIT) (since 2021). Director of MSCI Inc. (global provider of investment decision support tools) (since 2017). Formerly, Director of DCT Industrial Trust Inc. (logistics real estate company) (2017-2018). | |||
Susan J. Sutherland 1957 | Trustee | Since 2015 | Private investor. Director of Ascot Group Limited and certain of its subsidiaries (insurance and reinsurance) (since 2017). Formerly, Director of Hagerty Holding Corp. (insurance) (2015-2018) and Montpelier Re Holdings Ltd. (insurance and reinsurance) (2013-2015). Formerly, Associate, Counsel and Partner at Skadden, Arps, Slate, Meagher & Flom LLP (law firm) (1982-2013). Other Directorships. Director of Kairos Acquisition Corp. (insurance/InsurTech acquisition company) (since 2021). | |||
Scott E. Wennerholm 1959 | Trustee | Since 2016 | Private investor. Formerly, Trustee at Wheelock College (postsecondary institution) (2012-2018). Formerly, Consultant at GF Parish Group (executive recruiting firm) (2016-2017). Formerly, Chief Operating Officer and Executive Vice President at BNY Mellon Asset Management (investment management firm) (2005-2011). Formerly, Chief Operating Officer and Chief Financial Officer at Natixis Global Asset Management (investment management firm) (1997-2004). Formerly, Vice President at Fidelity Investments Institutional Services (investment management firm) (1994-1997). Other Directorships. None. | |||
| Name and Year of Birth | Trust/Portfolio Position(s) | Length of Service | Principal Occupation(s) During Past Five Years | |||
| Principal Officers who are not Trustees | ||||||
Eric A. Stein 1980 | President of the Trust | Since 2020 | Vice President and Chief Investment Officer, Fixed Income of EVM and BMR. Prior to November 1, 2020, Mr. Stein was a co-Director of Eaton Vance’s Global Income Investments. Also Vice President of Calvert Research and Management (“CRM”). | |||
Deidre E. Walsh 1971 | Vice President and Chief Legal Officer | Since 2009 | Vice President of EVM and BMR. Also Vice President of CRM. | |||
| 38 |
Eaton Vance
Core Bond Fund
December 31, 2021
Management and Organization — continued
| Name and Year of Birth | Trust/Portfolio Position(s) | Length of Service | Principal Occupation(s) During Past Five Years | |||
| Principal Officers who are not Trustees (continued) | ||||||
James F. Kirchner 1967 | Treasurer | Since 2007 | Vice President of EVM and BMR. Also Vice President of CRM. | |||
Jill R. Damon 1984 | Secretary | Since 2022 | Vice President of EVM and BMR since 2017. Formerly, associate at Dechert LLP (2009-2017). | |||
Richard F. Froio 1968 | Chief Compliance Officer | Since 2017 | Vice President of EVM and BMR since 2017. Formerly, Deputy Chief Compliance Officer (Adviser/Funds) and Chief Compliance Officer (Distribution) at PIMCO (2012-2017) and Managing Director at BlackRock/Barclays Global Investors (2009-2012). | |||
The SAI for the Fund includes additional information about the Trustees and officers of the Trust and the Portfolio and can be obtained without charge on Eaton Vance’s website at www.eatonvance.com or by calling 1-800-262-1122.
| 39 |
Eaton Vance Funds
| Privacy Notice | April 2021 |
| FACTS | WHAT DOES EATON VANCE DO WITH YOUR PERSONAL INFORMATION? | |
| Why? | Financial companies choose how they share your personal information. Federal law gives consumers the right to limit some but not all sharing. Federal law also requires us to tell you how we collect, share, and protect your personal information. Please read this notice carefully to understand what we do. | |
| What? | The types of personal information we collect and share depend on the product or service you have with us. This information can include:
∎ Social Security number and income ∎ investment experience and risk tolerance ∎ checking account number and wire transfer instructions | |
| How? | All financial companies need to share customers’ personal information to run their everyday business. In the section below, we list the reasons financial companies can share their customers’ personal information; the reasons Eaton Vance chooses to share; and whether you can limit this sharing. | |
| Reasons we can share your personal information | Does Eaton Vance share? | Can you limit this sharing? | ||
| For our everyday business purposes — such as to process your transactions, maintain your account(s), respond to court orders and legal investigations, or report to credit bureaus | Yes | No | ||
| For our marketing purposes — to offer our products and services to you | Yes | No | ||
| For joint marketing with other financial companies | No | We don’t share | ||
| For our investment management affiliates’ everyday business purposes — information about your transactions, experiences, and creditworthiness | Yes | Yes | ||
| For our affiliates’ everyday business purposes — information about your transactions and experiences | Yes | No | ||
| For our affiliates’ everyday business purposes — information about your creditworthiness | No | We don’t share | ||
| For our investment management affiliates to market to you | Yes | Yes | ||
| For our affiliates to market to you | No | We don’t share | ||
| For nonaffiliates to market to you | No | We don’t share |
| To limit our sharing | Call toll-free 1-800-262-1122 or email: EVPrivacy@eatonvance.com
Please note:
If you are a new customer, we can begin sharing your information 30 days from the date we sent this notice. When you are no longer our customer, we continue to share your information as described in this notice. However, you can contact us at any time to limit our sharing. | |
| Questions? | Call toll-free 1-800-262-1122 or email: EVPrivacy@eatonvance.com | |
| 40 |
Eaton Vance Funds
| Privacy Notice — continued | April 2021 |
| Page 2 |
| Who we are | ||
| Who is providing this notice? | Eaton Vance Management, Eaton Vance Distributors, Inc., Eaton Vance Trust Company, Eaton Vance Management (International) Limited, Eaton Vance Advisers International Ltd., Eaton Vance Global Advisors Limited, Eaton Vance Management’s Real Estate Investment Group, Boston Management and Research, Calvert Research and Management, Eaton Vance and Calvert Fund Families and our investment advisory affiliates (“Eaton Vance”) (see Investment Management Affiliates definition below) | |
| What we do | ||
| How does Eaton Vance protect my personal information? | To protect your personal information from unauthorized access and use, we use security measures that comply with federal law. These measures include computer safeguards and secured files and buildings. We have policies governing the proper handling of customer information by personnel and requiring third parties that provide support to adhere to appropriate security standards with respect to such information. | |
| How does Eaton Vance collect my personal information? | We collect your personal information, for example, when you
∎ open an account or make deposits or withdrawals from your account ∎ buy securities from us or make a wire transfer ∎ give us your contact information
We also collect your personal information from others, such as credit bureaus, affiliates, or other companies. | |
| Why can’t I limit all sharing? | Federal law gives you the right to limit only
∎ sharing for affiliates’ everyday business purposes — information about your creditworthiness ∎ affiliates from using your information to market to you ∎ sharing for nonaffiliates to market to you
State laws and individual companies may give you additional rights to limit sharing. See below for more on your rights under state law. | |
| Definitions | ||
| Investment Management Affiliates | Eaton Vance Investment Management Affiliates include registered investment advisers, registered broker-dealers, and registered and unregistered funds. Investment Management Affiliates does not include entities associated with Morgan Stanley Wealth Management, such as Morgan Stanley Smith Barney LLC and Morgan Stanley & Co. | |
| Affiliates | Companies related by common ownership or control. They can be financial and nonfinancial companies.
∎ Our affiliates include companies with a Morgan Stanley name and financial companies such as Morgan Stanley Smith Barney LLC and Morgan Stanley & Co. | |
| Nonaffiliates | Companies not related by common ownership or control. They can be financial and nonfinancial companies.
∎ Eaton Vance does not share with nonaffiliates so they can market to you. | |
| Joint marketing | A formal agreement between nonaffiliated financial companies that together market financial products or services to you.
∎ Eaton Vance doesn’t jointly market. | |
| Other important information | ||
Vermont: Except as permitted by law, we will not share personal information we collect about Vermont residents with Nonaffiliates unless you provide us with your written consent to share such information.
California: Except as permitted by law, we will not share personal information we collect about California residents with Nonaffiliates and we will limit sharing such personal information with our Affiliates to comply with California privacy laws that apply to us. | ||
| 41 |
Eaton Vance Funds
Delivery of Shareholder Documents. The Securities and Exchange Commission (SEC) permits funds to deliver only one copy of shareholder documents, including prospectuses, proxy statements and shareholder reports, to fund investors with multiple accounts at the same residential or post office box address. This practice is often called “householding” and it helps eliminate duplicate mailings to shareholders. Eaton Vance, or your financial intermediary, may household the mailing of your documents indefinitely unless you instruct Eaton Vance, or your financial intermediary, otherwise. If you would prefer that your Eaton Vance documents not be householded, please contact Eaton Vance at 1-800-262-1122, or contact your financial intermediary. Your instructions that householding not apply to delivery of your Eaton Vance documents will typically be effective within 30 days of receipt by Eaton Vance or your financial intermediary.
Portfolio Holdings. Each Eaton Vance Fund and its underlying Portfolio(s) (if applicable) files a schedule of portfolio holdings on Part F to Form N-PORT with the SEC. Certain information filed on Form N-PORT may be viewed on the Eaton Vance website at www.eatonvance.com, by calling Eaton Vance at 1-800-262-1122 or in the EDGAR database on the SEC’s website at www.sec.gov.
Proxy Voting. From time to time, funds are required to vote proxies related to the securities held by the funds. The Eaton Vance Funds or their underlying Portfolios (if applicable) vote proxies according to a set of policies and procedures approved by the Funds’ and Portfolios’ Boards. You may obtain a description of these policies and procedures and information on how the Funds or Portfolios voted proxies relating to portfolio securities during the most recent 12-month period ended June 30, without charge, upon request, by calling 1-800-262-1122 and by accessing the SEC’s website at www.sec.gov.
| 42 |
This Page Intentionally Left Blank
This Page Intentionally Left Blank
Investment Adviser of Core Bond Portfolio
Boston Management and Research
Two International Place
Boston, MA 02110
Investment Adviser and Administrator of Eaton Vance Core Bond Fund
Eaton Vance Management
Two International Place
Boston, MA 02110
Principal Underwriter*
Eaton Vance Distributors, Inc.
Two International Place
Boston, MA 02110
(617) 482-8260
Custodian
State Street Bank and Trust Company
State Street Financial Center, One Lincoln Street
Boston, MA 02111
Transfer Agent
BNY Mellon Investment Servicing (US) Inc.
Attn: Eaton Vance Funds
P.O. Box 9653
Providence, RI 02940-9653
(800) 262-1122
Independent Registered Public Accounting Firm
Deloitte & Touche LLP
200 Berkeley Street
Boston, MA 02116-5022
Fund Offices
Two International Place
Boston, MA 02110
| * | FINRA BrokerCheck. Investors may check the background of their Investment Professional by contacting the Financial Industry Regulatory Authority (FINRA). FINRA BrokerCheck is a free tool to help investors check the professional background of current and former FINRA-registered securities firms and brokers. FINRA BrokerCheck is available by calling 1-800-289-9999 and at www.FINRA.org. The FINRA BrokerCheck brochure describing this program is available to investors at www.FINRA.org. |
2978 12.31.21

Eaton Vance
Dividend Builder Fund
Annual Report
December 31, 2021

Commodity Futures Trading Commission Registration. The Commodity Futures Trading Commission (“CFTC”) has adopted regulations that subject registered investment companies and advisers to regulation by the CFTC if a fund invests more than a prescribed level of its assets in certain CFTC-regulated instruments (including futures, certain options and swap agreements) or markets itself as providing investment exposure to such instruments. The investment adviser has claimed an exclusion from the definition of “commodity pool operator” under the Commodity Exchange Act with respect to its management of the Fund. Accordingly, neither the Fund nor the adviser with respect to the operation of the Fund is subject to CFTC regulation. Because of its management of other strategies, the Fund’s adviser is registered with the CFTC as a commodity pool operator. The adviser is also registered as a commodity trading advisor.
Fund shares are not insured by the FDIC and are not deposits or other obligations of, or guaranteed by, any depository institution. Shares are subject to investment risks, including possible loss of principal invested.
This report must be preceded or accompanied by a current summary prospectus or prospectus. Before investing, investors should consider carefully the investment objective, risks, and charges and expenses of a mutual fund. This and other important information is contained in the summary prospectus and prospectus, which can be obtained from a financial intermediary. Prospective investors should read the prospectus carefully before investing. For further information, please call 1-800-262-1122.
Annual Report December 31, 2021
Eaton Vance
Dividend Builder Fund
| 2 | ||||
| 3 | ||||
| 4 | ||||
| 5 | ||||
| 6 | ||||
| 7 | ||||
| 21 | ||||
| 22 | ||||
| 23 | ||||
| 26 | ||||
| 28 |
Eaton Vance
Dividend Builder Fund
December 31, 2021
Management’s Discussion of Fund Performance1
Economic and Market Conditions
The 12-month period starting January 1, 2021, was notable for a U.S. equity rally that lasted for most of the period and resulted in U.S. stocks outperforming most other stock markets in developed economies. Except for temporary retreats in September and November, broad-market indexes generally posted strong returns during the period. Investors cheered the reopening of businesses that had been affected by the pandemic and the rollout of several highly effective COVID-19 vaccines.
COVID-19, however, continued to have a firm grip on the U.S. economy. Disease rates advanced and declined with second, third, and fourth waves of infections. Worker shortages led to global supply-chain disruptions. From computer chips to shipping containers, scarcities of key items led to temporary factory shutdowns and empty store shelves. Those shortages — combined with high demand from consumers eager to spend money saved earlier in the pandemic — led to higher year-over-year inflation than the U.S. had seen in decades.
Still, investor optimism about a recovering economy drove stock prices up during most of the period. A significant pullback, however, occurred in September 2021 when virtually every major U.S. stock index reported negative returns. Unexpectedly weak job creation in August and the U.S. Federal Reserve’s (the Fed’s) announcement that it might soon begin tapering its monthly bond purchases — which had stimulated the economy earlier — combined to drive stocks into negative territory. Rising COVID-19 infections also weighed on equity performance in September.
In the final quarter of 2021, however, stock prices came roaring back. Even the late-November news of a new and more transmissible COVID-19 variant — Omicron — caused only a temporary market retreat. The Fed’s actions to tamp down inflation were applauded by investors, with stocks gaining ground after the central bank announced that tapering would be accelerated and that three possible interest rate hikes were forecast for 2022. Just two trading days before year-end, the S&P 500® Index closed at its 70th new all-time high for the period, and the Dow Jones Industrial Average® (DJIA) closed at an all-time high as well.
For the period as a whole, the broad-market S&P 500® Index returned 28.71%; the blue-chip DJIA was up 20.95%; and the technology-laden Nasdaq Composite Index rose 22.18%. Large-cap U.S. stocks, as measured by the Russell 1000® Index, outperformed their small-cap counterparts, as measured by the Russell 2000® Index. In the large-cap space, growth stocks modestly outperformed value stocks, but in the small-cap space, value stocks strongly outperformed growth stocks during the period.
Fund Performance
For the 12-month period ended December 31, 2021, Eaton Vance Dividend Builder Fund (the Fund) returned 24.42% for Class A shares at net asset value (NAV), underperforming its primary benchmark, the S&P 500® Index (the Index), which returned 28.71%.
Stock selections and an overweight position relative to the Index in the industrials sector, along with stock selections in the energy and materials sectors, detracted from performance versus the Index during the period.
In the industrials sector, the Fund’s overweight position in industrial software firm Honeywell International, Inc. (Honeywell) detracted from relative returns. Honeywell, which provides industry-specific solutions for the aerospace and automotive industries, saw its stock price decline under the weight of higher operating expenses and costs of sales, as well as slowing sales in its defense and space business.
An out-of-Index holding in Anglo-Australian mining giant Rio Tinto PLC (Rio Tinto) detracted from relative performance in the materials sector. Rio Tinto’s share price fell as the firm experienced local opposition to mining projects in several countries, including the U.S. and Serbia.
Elsewhere in the portfolio, not owning Index component NVIDIA Corp. (NVIDIA), a maker of computer graphics processing units used in gaming, data center, and self-driving vehicle applications, hurt relative returns. NVIDIA’s stock price more than doubled during the period, driven by growth in the gaming, artificial intelligence, and autonomous vehicle industries and by a sharp increase in gaming and data center demand during the pandemic.
In contrast, stock selections and an underweight position in the communication services sector contributed to Fund performance versus the Index, as did an underweight position in the utilities sector — the worst-performing sector in the Index during the period.
In the communication services sector, not owning Index component and diversified entertainment and media firm The Walt Disney Co (Disney) helped relative performance during the period. Slower-than-expected subscriber growth for its Disney+ streaming service, combined with competitive pressure from other streaming services, led Disney’s stock price to decline.
Significant contributors to relative performance in other sectors included the Fund’s overweight positions in S&P Global, Inc. (S&P Global) in the financials sector and Home Depot, Inc. (Home Depot) in the consumer discretionary sector. S&P Global, which provides independent ratings, benchmarks, analytics, and data to capital and commodity markets worldwide, delivered strong earnings growth that drove up its stock price during the period. As many Americans worked from home during the pandemic and increased spending on home improvements and do-it-yourself projects, retailer Home Depot benefited from strong sales of building materials and home products.
See Endnotes and Additional Disclosures in this report.
Past performance is no guarantee of future results. Returns are historical and are calculated by determining the percentage change in net asset value (NAV) or offering price (as applicable) with all distributions reinvested. Investment return and principal value will fluctuate so that shares, when redeemed, may be worth more or less than their original cost. Performance for periods less than or equal to one year is cumulative. Performance is for the stated time period only; due to market volatility, current Fund performance may be lower or higher than the quoted return. For performance as of the most recent month-end, please refer to eatonvance.com.
| 2 |
Eaton Vance
Dividend Builder Fund
December 31, 2021
Portfolio Manager(s) Charles B. Gaffney
| % Average Annual Total Returns | Class Inception Date | Performance Inception Date | One Year | Five Years | Ten Years | |||||||||||||||
Class A at NAV | 12/18/1981 | 12/18/1981 | 24.42 | % | 15.55 | % | 13.91 | % | ||||||||||||
Class A with 5.75% Maximum Sales Charge | — | — | 17.26 | 14.19 | 13.24 | |||||||||||||||
Class C at NAV | 11/01/1993 | 12/18/1981 | 23.43 | 14.66 | 13.23 | |||||||||||||||
Class C with 1% Maximum Sales Charge | — | — | 22.43 | 14.66 | 13.23 | |||||||||||||||
Class I at NAV | 06/20/2005 | 12/18/1981 | 24.68 | 15.83 | 14.20 | |||||||||||||||
| ||||||||||||||||||||
S&P 500® Index | — | — | 28.71 | % | 18.46 | % | 16.54 | % | ||||||||||||
NASDAQ US Broad Dividend AchieversTM Index | — | — | 23.84 | 14.50 | 13.26 | |||||||||||||||
| % Total Annual Operating Expense Ratios4 | Class A | Class C | Class I | |||||||||||||||||
| 1.01 | % | 1.76 | % | 0.76 | % | |||||||||||||||
Growth of $10,000
This graph shows the change in value of a hypothetical investment of $10,000 in Class A of the Fund for the period indicated. For comparison, the same investment is shown in the indicated index.
| Growth of Investment | Amount Invested | Period Beginning | At NAV | With Maximum Sales Charge | ||||||||||||
Class C | $10,000 | 12/31/2011 | $34,684 | N.A. | ||||||||||||
Class I | $250,000 | 12/31/2011 | $944,310 | N.A. | ||||||||||||
See Endnotes and Additional Disclosures in this report.
Past performance is no guarantee of future results. Returns are historical and are calculated by determining the percentage change in net asset value (NAV) or offering price (as applicable) with all distributions reinvested. Investment return and principal value will fluctuate so that shares, when redeemed, may be worth more or less than their original cost. Performance for periods less than or equal to one year is cumulative. Performance is for the stated time period only; due to market volatility, current Fund performance may be lower or higher than the quoted return. For performance as of the most recent month-end, please refer to eatonvance.com.
| 3 |
Eaton Vance
Dividend Builder Fund
December 31, 2021
Sector Allocation (% of net assets)5
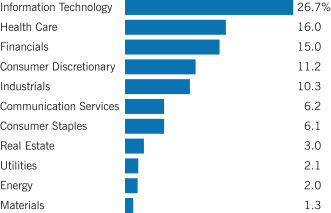
Top 10 Holdings (% of net assets)5
Apple, Inc. | 6.5 | % | ||
Microsoft Corp. | 6.1 | |||
AbbVie, Inc. | 3.1 | |||
JPMorgan Chase & Co. | 2.9 | |||
Broadcom, Inc. | 2.9 | |||
Verizon Communications, Inc. | 2.5 | |||
Danaher Corp. | 2.3 | |||
S&P Global, Inc. | 2.2 | |||
Alphabet, Inc., Class A | 2.2 | |||
Amazon.com, Inc. | 2.1 | |||
Total | 32.8 | % | ||
See Endnotes and Additional Disclosures in this report.
| 4 |
Eaton Vance
Dividend Builder Fund
December 31, 2021
Endnotes and Additional Disclosures
| 1 | The views expressed in this report are those of the portfolio manager(s) and are current only through the date stated at the top of this page. These views are subject to change at any time based upon market or other conditions, and Eaton Vance and the Fund(s) disclaim any responsibility to update such views. These views may not be relied upon as investment advice and, because investment decisions are based on many factors, may not be relied upon as an indication of trading intent on behalf of any Eaton Vance fund. This commentary may contain statements that are not historical facts, referred to as “forward-looking statements.” The Fund’s actual future results may differ significantly from those stated in any forward-looking statement, depending on factors such as changes in securities or financial markets or general economic conditions, the volume of sales and purchases of Fund shares, the continuation of investment advisory, administrative and service contracts, and other risks discussed from time to time in the Fund’s filings with the Securities and Exchange Commission. |
| 2 | S&P 500® Index is an unmanaged index of large-cap stocks commonly used as a measure of U.S. stock market performance. S&P Dow Jones Indices are a product of S&P Dow Jones Indices LLC (“S&P DJI”) and have been licensed for use. S&P® and S&P 500® are registered trademarks of S&P DJI; Dow Jones® is a registered trademark of Dow Jones Trademark Holdings LLC (“Dow Jones”); S&P DJI, Dow Jones and their respective affiliates do not sponsor, endorse, sell or promote the Fund, will not have any liability with respect thereto and do not have any liability for any errors, omissions, or interruptions of the S&P Dow Jones Indices. NASDAQ US Broad Dividend AchieversTM Index is an unmanaged index of US stocks with at least ten consecutive years of increasing annual regular dividends. Source: Nasdaq, Inc. The information is provided by Nasdaq (with its affiliates, are referred to as the “Corporations”) and Nasdaq’s third party licensors on an “as is” basis and the Corporations make no guarantees and bear no liability of any kind with respect to the information or the Fund. Unless otherwise stated, index returns do not reflect the effect of any applicable sales charges, commissions, expenses, taxes or leverage, as applicable. It is not possible to invest directly in an index. |
| 3 | Total Returns at NAV do not include applicable sales charges. If sales charges were deducted, the returns would be lower. Total Returns shown with maximum sales charge reflect the stated maximum sales charge. Unless otherwise stated, performance does not reflect the deduction of taxes on Fund distributions or redemptions of Fund shares. |
Effective November 5, 2020, Class C shares automatically convert to Class A shares eight years after purchase. The average annual total returns listed for Class C reflect conversion to Class A shares after eight years. Prior to November 5, 2020, Class C shares automatically converted to Class A shares ten years after purchase.
| 4 | Source: Fund prospectus. The expense ratios for the current reporting period can be found in the Financial Highlights section of this report. |
| 5 | Excludes cash and cash equivalents. |
Fund profile subject to change due to active management.
Additional Information
Dow Jones Industrial Average® is a price-weighted average of 30 blue-chip stocks that are generally the leaders in their industry. Nasdaq Composite Index is a market capitalization-weighted index of all domestic and international securities listed on Nasdaq. Source: Nasdaq, Inc. The information is provided by Nasdaq (with its affiliates, are referred to as the “Corporations”) and Nasdaq’s third party licensors on an “as is” basis and the Corporations make no guarantees and bear no liability of any kind with respect to the information or the Fund. Russell 1000® Index is an unmanaged index of 1,000 U.S. large-cap stocks. Russell 2000® Index is an unmanaged index of 2,000 U.S. small-cap stocks.
Important Notice to Shareholders
Effective December 31, 2021, the Fund’s secondary benchmark is the NASDAQ US Broad Dividend AchieversTM Index.
| 5 |
Eaton Vance
Dividend Builder Fund
December 31, 2021
Example: As a Fund shareholder, you incur two types of costs: (1) transaction costs, including sales charges (loads) on purchases and redemption fees (if applicable); and (2) ongoing costs, including management fees; distribution and/or service fees; and other Fund expenses. This Example is intended to help you understand your ongoing costs (in dollars) of Fund investing and to compare these costs with the ongoing costs of investing in other mutual funds. The Example is based on an investment of $1,000 invested at the beginning of the period and held for the entire period (July 1, 2021 – December 31, 2021).
Actual Expenses: The first section of the table below provides information about actual account values and actual expenses. You may use the information in this section, together with the amount you invested, to estimate the expenses that you paid over the period. Simply divide your account value by $1,000 (for example, an $8,600 account value divided by $1,000 = 8.6), then multiply the result by the number in the first section under the heading entitled “Expenses Paid During Period” to estimate the expenses you paid on your account during this period.
Hypothetical Example for Comparison Purposes: The second section of the table below provides information about hypothetical account values and hypothetical expenses based on the actual Fund expense ratio and an assumed rate of return of 5% per year (before expenses), which is not the actual Fund return. The hypothetical account values and expenses may not be used to estimate the actual ending account balance or expenses you paid for the period. You may use this information to compare the ongoing costs of investing in your Fund and other funds. To do so, compare this 5% hypothetical example with the 5% hypothetical examples that appear in the shareholder reports of the other funds.
Please note that the expenses shown in the table are meant to highlight your ongoing costs only and do not reflect any transactional costs, such as sales charges (loads) or redemption fees (if applicable). Therefore, the second section of the table is useful in comparing ongoing costs only, and will not help you determine the relative total costs of owning different funds. In addition, if these transactional costs were included, your costs would be higher.
| Beginning Account Value (7/1/21) | Ending Account Value (12/31/21) | Expenses Paid During Period* (7/1/21 – 12/31/21) | Annualized Expense Ratio | |||||||||||||
Actual | ||||||||||||||||
Class A | $ | 1,000.00 | $ | 1,103.50 | $ | 5.20 | 0.98 | % | ||||||||
Class C | $ | 1,000.00 | $ | 1,099.20 | $ | 9.15 | 1.73 | % | ||||||||
Class I | $ | 1,000.00 | $ | 1,105.00 | $ | 3.87 | 0.73 | % | ||||||||
Hypothetical | ||||||||||||||||
(5% return per year before expenses) | ||||||||||||||||
Class A | $ | 1,000.00 | $ | 1,020.27 | $ | 4.99 | 0.98 | % | ||||||||
Class C | $ | 1,000.00 | $ | 1,016.48 | $ | 8.79 | 1.73 | % | ||||||||
Class I | $ | 1,000.00 | $ | 1,021.53 | $ | 3.72 | 0.73 | % | ||||||||
| * | Expenses are equal to the Fund’s annualized expense ratio for the indicated Class, multiplied by the average account value over the period, multiplied by 184/365 (to reflect the one-half year period). The Example assumes that the $1,000 was invested at the net asset value per share determined at the close of business on June 30, 2021. |
| 6 |
Eaton Vance
Dividend Builder Fund
December 31, 2021
| Common Stocks — 99.9% |
| |||||||
| Security | Shares | Value | ||||||
| Banks — 6.8% | ||||||||
JPMorgan Chase & Co. | 198,300 | $ | 31,400,805 | |||||
PNC Financial Services Group, Inc. (The) | 114,400 | 22,939,488 | ||||||
Truist Financial Corp. | 334,800 | 19,602,540 | ||||||
| $ | 73,942,833 | |||||||
| Beverages — 4.1% | ||||||||
Coca-Cola Europacific Partners PLC | 400,600 | $ | 22,405,558 | |||||
PepsiCo, Inc. | 125,500 | 21,800,605 | ||||||
| $ | 44,206,163 | |||||||
| Biotechnology — 5.1% | ||||||||
AbbVie, Inc. | 246,300 | $ | 33,349,020 | |||||
Amgen, Inc. | 97,800 | 22,002,066 | ||||||
| $ | 55,351,086 | |||||||
| Capital Markets — 5.8% | ||||||||
BlackRock, Inc. | 18,800 | $ | 17,212,528 | |||||
CME Group, Inc. | 94,400 | 21,566,624 | ||||||
S&P Global, Inc. | 51,800 | 24,445,974 | ||||||
| $ | 63,225,126 | |||||||
| Chemicals — 1.3% | ||||||||
Air Products and Chemicals, Inc. | 25,600 | $ | 7,789,056 | |||||
FMC Corp. | 53,800 | 5,912,082 | ||||||
| $ | 13,701,138 | |||||||
| Commercial Services & Supplies — 1.0% | ||||||||
Waste Management, Inc. | 66,200 | $ | 11,048,780 | |||||
| $ | 11,048,780 | |||||||
| Communications Equipment — 2.1% | ||||||||
Cisco Systems, Inc. | 357,400 | $ | 22,648,438 | |||||
| $ | 22,648,438 | |||||||
| Diversified Telecommunication Services — 2.5% | ||||||||
Verizon Communications, Inc. | 530,300 | $ | 27,554,388 | |||||
| $ | 27,554,388 | |||||||
| Electric Utilities — 1.1% | ||||||||
Xcel Energy, Inc. | 184,700 | $ | 12,504,190 | |||||
| $ | 12,504,190 | |||||||
| Security | Shares | Value | ||||||
| Energy Equipment & Services — 2.0% | ||||||||
Baker Hughes Co. | 900,800 | $ | 21,673,248 | |||||
| $ | 21,673,248 | |||||||
| Equity Real Estate Investment Trusts (REITs) — 3.0% | ||||||||
Healthpeak Properties, Inc. | 311,900 | $ | 11,256,471 | |||||
Lamar Advertising Co., Class A | 175,400 | 21,276,020 | ||||||
| $ | 32,532,491 | |||||||
| Food & Staples Retailing — 2.1% | ||||||||
Sysco Corp. | 287,800 | $ | 22,606,690 | |||||
| $ | 22,606,690 | |||||||
| Health Care Equipment & Supplies — 3.6% | ||||||||
Abbott Laboratories | 158,300 | $ | 22,279,142 | |||||
Medtronic PLC | 165,300 | 17,100,285 | ||||||
| $ | 39,379,427 | |||||||
| Health Care Providers & Services — 2.0% | ||||||||
Anthem, Inc. | 47,700 | $ | 22,110,858 | |||||
| $ | 22,110,858 | |||||||
| Hotels, Restaurants & Leisure — 1.6% | ||||||||
Starbucks Corp. | 145,500 | $ | 17,019,135 | |||||
| $ | 17,019,135 | |||||||
| Independent Power and Renewable Electricity Producers — 1.0% | ||||||||
NextEra Energy Partners, L.P. | 123,500 | $ | 10,423,400 | |||||
| $ | 10,423,400 | |||||||
| Industrial Conglomerates — 1.3% | ||||||||
Honeywell International, Inc. | 70,000 | $ | 14,595,700 | |||||
| $ | 14,595,700 | |||||||
| Insurance — 2.4% | ||||||||
Allstate Corp. (The) | 66,000 | $ | 7,764,900 | |||||
American Financial Group, Inc. | 131,900 | 18,112,508 | ||||||
| $ | 25,877,408 | |||||||
| Interactive Media & Services — 2.2% | ||||||||
Alphabet, Inc., Class A(1) | 8,100 | $ | 23,466,024 | |||||
| $ | 23,466,024 | |||||||
| 7 | See Notes to Financial Statements. |
Eaton Vance
Dividend Builder Fund
December 31, 2021
Portfolio of Investments — continued
| Security | Shares | Value | ||||||
| Internet & Direct Marketing Retail — 2.1% | ||||||||
Amazon.com, Inc.(1) | 7,000 | $ | 23,340,380 | |||||
| $ | 23,340,380 | |||||||
| IT Services — 5.2% | ||||||||
Accenture PLC, Class A | 47,000 | $ | 19,483,850 | |||||
Automatic Data Processing, Inc. | 76,900 | 18,962,002 | ||||||
Broadridge Financial Solutions, Inc. | 102,200 | 18,684,204 | ||||||
| $ | 57,130,056 | |||||||
| Life Sciences Tools & Services — 2.3% | ||||||||
Danaher Corp. | 76,000 | $ | 25,004,760 | |||||
| $ | 25,004,760 | |||||||
| Machinery — 4.9% | ||||||||
Illinois Tool Works, Inc. | 54,600 | $ | 13,475,280 | |||||
Stanley Black & Decker, Inc. | 111,800 | 21,087,716 | ||||||
Westinghouse Air Brake Technologies Corp. | 208,100 | 19,168,091 | ||||||
| $ | 53,731,087 | |||||||
| Media — 1.5% | ||||||||
Comcast Corp., Class A | 333,300 | $ | 16,774,989 | |||||
| $ | 16,774,989 | |||||||
| Multiline Retail — 1.2% | ||||||||
Dollar General Corp. | 53,700 | $ | 12,664,071 | |||||
| $ | 12,664,071 | |||||||
| Pharmaceuticals — 3.0% | ||||||||
Bristol-Myers Squibb Co. | 354,300 | $ | 22,090,605 | |||||
Pfizer, Inc. | 176,700 | 10,434,135 | ||||||
| $ | 32,524,740 | |||||||
| Professional Services — 1.2% | ||||||||
Booz Allen Hamilton Holding Corp., Class A | 151,500 | $ | 12,845,685 | |||||
| $ | 12,845,685 | |||||||
| Road & Rail — 1.8% | ||||||||
Union Pacific Corp. | 79,400 | $ | 20,003,242 | |||||
| $ | 20,003,242 | |||||||
| Semiconductors & Semiconductor Equipment — 6.8% | ||||||||
Broadcom, Inc. | 47,100 | $ | 31,340,811 | |||||
Lam Research Corp. | 29,100 | 20,927,265 | ||||||
| Security | Shares | Value | ||||||
| Semiconductors & Semiconductor Equipment (continued) | ||||||||
Texas Instruments, Inc. | 115,300 | $ | 21,730,591 | |||||
| $ | 73,998,667 | |||||||
| Software — 6.1% | ||||||||
Microsoft Corp. | 197,567 | $ | 66,445,734 | |||||
| $ | 66,445,734 | |||||||
| Specialty Retail — 6.3% | ||||||||
Bath & Body Works, Inc. | 220,100 | $ | 15,360,779 | |||||
Best Buy Co., Inc. | 110,000 | 11,176,000 | ||||||
Home Depot, Inc. (The) | 54,300 | 22,535,043 | ||||||
TJX Cos., Inc. (The) | 260,700 | 19,792,344 | ||||||
| $ | 68,864,166 | |||||||
| Technology Hardware, Storage & Peripherals — 6.5% | ||||||||
Apple, Inc. | 395,648 | $ | 70,255,215 | |||||
| $ | 70,255,215 | |||||||
Total Common Stocks |
| $ | 1,087,449,315 | |||||
| Short-Term Investments — 0.1% | ||||||||
| Description | Units | Value | ||||||
Eaton Vance Cash Reserves Fund, LLC, 0.08%(2) | 1,120,143 | $ | 1,120,031 | |||||
Total Short-Term Investments |
| $ | 1,120,031 | |||||
Total Investments — 100.0% |
| $ | 1,088,569,346 | |||||
Other Assets, Less Liabilities — (0.0)%(3) |
| $ | (310,929 | ) | ||||
Net Assets — 100.0% |
| $ | 1,088,258,417 | |||||
The percentage shown for each investment category in the Portfolio of Investments is based on net assets.
| (1) | Non-income producing security. |
| (2) | Affiliated investment company, available to Eaton Vance portfolios and funds, which invests in high quality, U.S. dollar denominated money market instruments. The rate shown is the annualized seven-day yield as of December 31, 2021. |
| (3) | Amount is less than (0.05)%. |
| 8 | See Notes to Financial Statements. |
Eaton Vance
Dividend Builder Fund
December 31, 2021
Statement of Assets and Liabilities
| Assets | December 31, 2021 | |||
Unaffiliated investments, at value (identified cost, $743,670,110) | $ | 1,087,449,315 | ||
Affiliated investment, at value (identified cost, $1,120,031) | 1,120,031 | |||
Dividends receivable | 1,167,672 | |||
Dividends receivable from affiliated investment | 33 | |||
Receivable for Fund shares sold | 308,307 | |||
Tax reclaims receivable | 118,644 | |||
Total assets | $ | 1,090,164,002 | ||
| Liabilities | ||||
Payable for Fund shares redeemed | $ | 891,474 | ||
Payable to affiliates: | ||||
Investment adviser fee | 572,567 | |||
Distribution and service fees | 192,746 | |||
Trustees’ fees | 12,440 | |||
Accrued expenses | 236,358 | |||
Total liabilities | $ | 1,905,585 | ||
Net Assets | $ | 1,088,258,417 | ||
| Sources of Net Assets | ||||
Paid-in capital | $ | 642,588,418 | ||
Distributable earnings | 445,669,999 | |||
Total | $ | 1,088,258,417 | ||
| Class A Shares | ||||
Net Assets | $ | 821,560,114 | ||
Shares Outstanding | 41,397,368 | |||
Net Asset Value and Redemption Price Per Share | ||||
(net assets ÷ shares of beneficial interest outstanding) | $ | 19.85 | ||
Maximum Offering Price Per Share | ||||
(100 ÷ 94.25 of net asset value per share) | $ | 21.06 | ||
| Class C Shares | ||||
Net Assets | $ | 27,404,739 | ||
Shares Outstanding | 1,370,863 | |||
Net Asset Value and Offering Price Per Share* | ||||
(net assets ÷ shares of beneficial interest outstanding) | $ | 19.99 | ||
| Class I Shares | ||||
Net Assets | $ | 239,293,564 | ||
Shares Outstanding | 12,068,247 | |||
Net Asset Value, Offering Price and Redemption Price Per Share | ||||
(net assets ÷ shares of beneficial interest outstanding) | $ | 19.83 | ||
On sales of $50,000 or more, the offering price of Class A shares is reduced.
| * | Redemption price per share is equal to the net asset value less any applicable contingent deferred sales charge. |
| 9 | See Notes to Financial Statements. |
Eaton Vance
Dividend Builder Fund
December 31, 2021
Statement of Operations
| Investment Income | Year Ended December 31, 2021 | |||
Dividends (net of foreign taxes, $225,023) | $ | 29,199,555 | ||
Dividends from affiliated investment | 1,400 | |||
Securities lending income, net | 257,935 | |||
Total investment income | $ | 29,458,890 | ||
| Expenses | ||||
Investment adviser fee | $ | 6,511,268 | ||
Distribution and service fees | ||||
Class A | 1,940,279 | |||
Class C | 274,569 | |||
Trustees’ fees and expenses | 49,623 | |||
Custodian fee | 252,790 | |||
Transfer and dividend disbursing agent fees | 530,816 | |||
Legal and accounting services | 62,609 | |||
Printing and postage | 24,779 | |||
Registration fees | 50,979 | |||
Miscellaneous | 64,482 | |||
Total expenses | $ | 9,762,194 | ||
Net investment income | $ | 19,696,696 | ||
| Realized and Unrealized Gain (Loss) | ||||
Net realized gain (loss) — | ||||
Investment transactions | $ | 168,656,001 | ||
Investment transactions — affiliated investment | (395 | ) | ||
Foreign currency transactions | 88,877 | |||
Net realized gain | $ | 168,744,483 | ||
Change in unrealized appreciation (depreciation) — | ||||
Investments | $ | 34,842,517 | ||
Foreign currency | (18,610 | ) | ||
Net change in unrealized appreciation (depreciation) | $ | 34,823,907 | ||
Net realized and unrealized gain | $ | 203,568,390 | ||
Net increase in net assets from operations | $ | 223,265,086 | ||
| 10 | See Notes to Financial Statements. |
Eaton Vance
Dividend Builder Fund
December 31, 2021
Statements of Changes in Net Assets
| Year Ended December 31, | ||||||||
| Increase (Decrease) in Net Assets | 2021 | 2020 | ||||||
From operations — |
| |||||||
Net investment income | $ | 19,696,696 | $ | 16,156,312 | ||||
Net realized gain (loss) | 168,744,483 | (12,142,742 | ) | |||||
Net change in unrealized appreciation (depreciation) | 34,823,907 | 93,973,241 | ||||||
Net increase in net assets from operations | $ | 223,265,086 | $ | 97,986,811 | ||||
Distributions to shareholders — | ||||||||
Class A | $ | (51,288,730 | ) | $ | (19,322,901 | ) | ||
Class C | (1,524,848 | ) | (870,654 | ) | ||||
Class I | (15,397,929 | ) | (5,675,132 | ) | ||||
Total distributions to shareholders | $ | (68,211,507 | ) | $ | (25,868,687 | ) | ||
Transactions in shares of beneficial interest — | ||||||||
Proceeds from sale of shares | ||||||||
Class A | $ | 21,444,292 | $ | 25,145,166 | ||||
Class C | 3,118,845 | 3,300,682 | ||||||
Class I | 30,171,573 | 36,954,595 | ||||||
Net asset value of shares issued to shareholders in payment of distributions declared | ||||||||
Class A | 43,779,123 | 16,494,124 | ||||||
Class C | 1,476,883 | 820,302 | ||||||
Class I | 14,380,481 | 5,275,370 | ||||||
Cost of shares redeemed | ||||||||
Class A | (90,769,432 | ) | (96,679,594 | ) | ||||
Class C | (6,809,978 | ) | (14,358,129 | ) | ||||
Class I | (35,247,160 | ) | (44,088,791 | ) | ||||
Net asset value of shares converted | ||||||||
Class A | 3,823,023 | 18,644,674 | ||||||
Class C | (3,823,023 | ) | (18,644,674 | ) | ||||
Net decrease in net assets from Fund share transactions | $ | (18,455,373 | ) | $ | (67,136,275 | ) | ||
Net increase in net assets | $ | 136,598,206 | $ | 4,981,849 | ||||
| Net Assets |
| |||||||
At beginning of year | $ | 951,660,211 | $ | 946,678,362 | ||||
At end of year | $ | 1,088,258,417 | $ | 951,660,211 | ||||
| 11 | See Notes to Financial Statements. |
Eaton Vance
Dividend Builder Fund
December 31, 2021
Financial Highlights
| Class A | ||||||||||||||||||||
| Year Ended December 31, | ||||||||||||||||||||
| 2021 | 2020 | 2019 | 2018 | 2017 | ||||||||||||||||
Net asset value — Beginning of year | $ | 17.030 | $ | 15.610 | $ | 12.510 | $ | 14.550 | $ | 13.510 | ||||||||||
| Income (Loss) From Operations | ||||||||||||||||||||
Net investment income(1) | $ | 0.355 | $ | 0.276 | $ | 0.227 | $ | 0.242 | $ | 0.282 | ||||||||||
Net realized and unrealized gain (loss) | 3.744 | 1.590 | 3.607 | (0.942 | ) | 2.212 | ||||||||||||||
Total income (loss) from operations | $ | 4.099 | $ | 1.866 | $ | 3.834 | $ | (0.700 | ) | $ | 2.494 | |||||||||
| Less Distributions | ||||||||||||||||||||
From net investment income | $ | (0.344 | ) | $ | (0.264 | ) | $ | (0.264 | ) | $ | (0.264 | ) | $ | (0.264 | ) | |||||
From net realized gain | (0.935 | ) | (0.182 | ) | (0.470 | ) | (1.076 | ) | (1.190 | ) | ||||||||||
Total distributions | $ | (1.279 | ) | $ | (0.446 | ) | $ | (0.734 | ) | $ | (1.340 | ) | $ | (1.454 | ) | |||||
Net asset value — End of year | $ | 19.850 | $ | 17.030 | $ | 15.610 | $ | 12.510 | $ | 14.550 | ||||||||||
Total Return(2) | 24.42 | % | 12.32 | % | 31.09 | % | (5.40 | )% | 18.89 | % | ||||||||||
| Ratios/Supplemental Data | ||||||||||||||||||||
Net assets, end of year (000’s omitted) | $ | 821,560 | $ | 725,569 | $ | 706,043 | $ | 558,487 | $ | 674,421 | ||||||||||
Ratios (as a percentage of average daily net assets):(3) | ||||||||||||||||||||
Expenses | 0.99 | % | 1.01 | % | 1.01 | % | 1.02 | % | 1.03 | % | ||||||||||
Net investment income | 1.89 | % | 1.83 | % | 1.57 | % | 1.66 | % | 1.98 | % | ||||||||||
Portfolio Turnover of the Portfolio(4) | — | — | — | 37 | %(5) | 86 | % | |||||||||||||
Portfolio Turnover of the Fund. | 74 | % | 81 | % | 55 | % | 41 | %(5)(6) | — | |||||||||||
| (1) | Computed using average shares outstanding. |
| (2) | Returns are historical and are calculated by determining the percentage change in net asset value with all distributions reinvested and do not reflect the effect of sales charges. |
| (3) | Includes the Fund’s share of the Portfolio’s allocated expenses for the period while the Fund was investing in the Portfolio. |
| (4) | Portfolio turnover represents the rate of portfolio activity for the period while the Fund was investing in the Portfolio. |
| (5) | Not annualized. |
| (6) | For the period from June 11, 2018 through December 31, 2018 when the Fund was making investments directly in securities. |
References to Portfolio herein are to Dividend Builder Portfolio, a Massachusetts business trust having the same investment objective and policies as the Fund, in which the Fund invested all of its investable assets prior to June 11, 2018.
| 12 | See Notes to Financial Statements. |
Eaton Vance
Dividend Builder Fund
December 31, 2021
Financial Highlights — continued
| Class C | ||||||||||||||||||||
| Year Ended December 31, | ||||||||||||||||||||
| 2021 | 2020 | 2019 | 2018 | 2017 | ||||||||||||||||
Net asset value — Beginning of year | $ | 17.150 | $ | 15.710 | $ | 12.580 | $ | 14.620 | $ | 13.580 | ||||||||||
| Income (Loss) From Operations | ||||||||||||||||||||
Net investment income(1) | $ | 0.218 | $ | 0.166 | $ | 0.115 | $ | 0.133 | $ | 0.177 | ||||||||||
Net realized and unrealized gain (loss) | 3.758 | 1.602 | 3.636 | (0.945 | ) | 2.209 | ||||||||||||||
Total income (loss) from operations | $ | 3.976 | $ | 1.768 | $ | 3.751 | $ | (0.812 | ) | $ | 2.386 | |||||||||
| Less Distributions | ||||||||||||||||||||
From net investment income | $ | (0.201 | ) | $ | (0.146 | ) | $ | (0.151 | ) | $ | (0.152 | ) | $ | (0.156 | ) | |||||
From net realized gain | (0.935 | ) | (0.182 | ) | (0.470 | ) | (1.076 | ) | (1.190 | ) | ||||||||||
Total distributions | $ | (1.136 | ) | $ | (0.328 | ) | $ | (0.621 | ) | $ | (1.228 | ) | $ | (1.346 | ) | |||||
Net asset value — End of year | $ | 19.990 | $ | 17.150 | $ | 15.710 | $ | 12.580 | $ | 14.620 | ||||||||||
Total Return(2) | 23.43 | % | 11.51 | % | 30.13 | % | (6.09 | )% | 17.89 | % | ||||||||||
| Ratios/Supplemental Data | ||||||||||||||||||||
Net assets, end of year (000’s omitted) | $ | 27,405 | $ | 29,195 | $ | 56,585 | $ | 107,495 | $ | 149,298 | ||||||||||
Ratios (as a percentage of average daily net assets):(3) | ||||||||||||||||||||
Expenses | 1.74 | % | 1.76 | % | 1.77 | % | 1.77 | % | 1.78 | % | ||||||||||
Net investment income | 1.15 | % | 1.10 | % | 0.80 | % | 0.91 | % | 1.24 | % | ||||||||||
Portfolio Turnover of the Portfolio(4) | — | — | — | 37 | %(5) | 86 | % | |||||||||||||
Portfolio Turnover of the Fund• | 74 | % | 81 | % | 55 | % | 41 | %(5)(6) | — | |||||||||||
| (1) | Computed using average shares outstanding. |
| (2) | Returns are historical and are calculated by determining the percentage change in net asset value with all distributions reinvested and do not reflect the effect of sales charges. |
| (3) | Includes the Fund’s share of the Portfolio’s allocated expenses for the period while the Fund was investing in the Portfolio. |
| (4) | Portfolio turnover represents the rate of portfolio activity for the period while the Fund was investing in the Portfolio. |
| (5) | Not annualized. |
| (6) | For the period from June 11, 2018 through December 31, 2018 when the Fund was making investments directly in securities. |
References to Portfolio herein are to Dividend Builder Portfolio, a Massachusetts business trust having the same investment objective and policies as the Fund, in which the Fund invested all of its investable assets prior to June 11, 2018.
| 13 | See Notes to Financial Statements. |
Eaton Vance
Dividend Builder Fund
December 31, 2021
Financial Highlights — continued
| Class I | ||||||||||||||||||||
| Year Ended December 31, | ||||||||||||||||||||
| 2021 | 2020 | 2019 | 2018 | 2017 | ||||||||||||||||
Net asset value — Beginning of year | $ | 17.020 | $ | 15.600 | $ | 12.500 | $ | 14.530 | $ | 13.500 | ||||||||||
| Income (Loss) From Operations | ||||||||||||||||||||
Net investment income(1) | $ | 0.402 | $ | 0.313 | $ | 0.262 | $ | 0.279 | $ | 0.316 | ||||||||||
Net realized and unrealized gain (loss) | 3.733 | 1.591 | 3.608 | (0.932 | ) | 2.204 | ||||||||||||||
Total income (loss) from operations | $ | 4.135 | $ | 1.904 | $ | 3.870 | $ | (0.653 | ) | $ | 2.520 | |||||||||
| Less Distributions | ||||||||||||||||||||
From net investment income | $ | (0.390 | ) | $ | (0.302 | ) | $ | (0.300 | ) | $ | (0.301 | ) | $ | (0.300 | ) | |||||
From net realized gain | (0.935 | ) | (0.182 | ) | (0.470 | ) | (1.076 | ) | (1.190 | ) | ||||||||||
Total distributions | $ | (1.325 | ) | $ | (0.484 | ) | $ | (0.770 | ) | $ | (1.377 | ) | $ | (1.490 | ) | |||||
Net asset value — End of year | $ | 19.830 | $ | 17.020 | $ | 15.600 | $ | 12.500 | $ | 14.530 | ||||||||||
Total Return(2) | 24.68 | % | 12.61 | % | 31.44 | % | (5.10 | )% | 19.12 | % | ||||||||||
| Ratios/Supplemental Data | ||||||||||||||||||||
Net assets, end of year (000’s omitted) | $ | 239,294 | $ | 196,896 | $ | 184,050 | $ | 146,070 | $ | 164,604 | ||||||||||
Ratios (as a percentage of average daily net assets):(3) | ||||||||||||||||||||
Expenses | 0.74 | % | 0.76 | % | 0.76 | % | 0.77 | % | 0.78 | % | ||||||||||
Net investment income | 2.14 | % | 2.08 | % | 1.82 | % | 1.92 | % | 2.22 | % | ||||||||||
Portfolio Turnover of the Portfolio(4) | — | — | — | 37 | %(5) | 86 | % | |||||||||||||
Portfolio Turnover of the Fund. | 74 | % | 81 | % | 55 | % | 41 | %(5)(6) | — | |||||||||||
| (1) | Computed using average shares outstanding. |
| (2) | Returns are historical and are calculated by determining the percentage change in net asset value with all distributions reinvested. |
| (3) | Includes the Fund’s share of the Portfolio’s allocated expenses for the period while the Fund was investing in the Portfolio. |
| (4) | Portfolio turnover represents the rate of portfolio activity for the period while the Fund was investing in the Portfolio. |
| (5) | Not annualized. |
| (6) | For the period from June 11, 2018 through December 31, 2018 when the Fund was making investments directly in securities. |
References to Portfolio herein are to Dividend Builder Portfolio, a Massachusetts business trust having the same investment objective and policies as the Fund, in which the Fund invested all of its investable assets prior to June 11, 2018.
| 14 | See Notes to Financial Statements. |
Eaton Vance
Dividend Builder Fund
December 31, 2021
Notes to Financial Statements
1 Significant Accounting Policies
Eaton Vance Dividend Builder Fund (the Fund) is a diversified series of Eaton Vance Special Investment Trust (the Trust). The Trust is a Massachusetts business trust registered under the Investment Company Act of 1940, as amended (the 1940 Act), as an open-end management investment company. The Fund’s investment objective is to seek total return. The Fund offers three classes of shares. Class A shares are generally sold subject to a sales charge imposed at time of purchase. Class C shares are sold at net asset value and are generally subject to a contingent deferred sales charge (see Note 5). Effective January 25, 2019, Class C shares generally automatically convert to Class A shares ten years after their purchase and, effective November 5, 2020, automatically convert to Class A shares eight years after their purchase as described in the Fund’s prospectus. Class I shares are sold at net asset value and are not subject to a sales charge. Each class represents a pro-rata interest in the Fund, but votes separately on class-specific matters and (as noted below) is subject to different expenses. Realized and unrealized gains and losses and net investment income and losses, other than class-specific expenses, are allocated daily to each class of shares based on the relative net assets of each class to the total net assets of the Fund. Each class of shares differs in its distribution plan and certain other class-specific expenses.
The following is a summary of significant accounting policies of the Fund. The policies are in conformity with accounting principles generally accepted in the United States of America (U.S. GAAP). The Fund is an investment company and follows accounting and reporting guidance in the Financial Accounting Standards Board (FASB) Accounting Standards Codification Topic 946.
A Investment Valuation — The following methodologies are used to determine the market value or fair value of investments.
Equity Securities. Equity securities listed on a U.S. securities exchange generally are valued at the last sale or closing price on the day of valuation or, if no sales took place on such date, at the mean between the closing bid and ask prices on the exchange where such securities are principally traded. Equity securities listed on the NASDAQ National Market System are valued at the NASDAQ official closing price. Unlisted or listed securities for which closing sales prices or closing quotations are not available are valued at the mean between the latest available bid and ask prices.
Foreign Securities and Currencies. Foreign securities and currencies are valued in U.S. dollars, based on foreign currency exchange rate quotations supplied by a third party pricing service. The pricing service uses a proprietary model to determine the exchange rate. Inputs to the model include reported trades and implied bid/ask spreads. The daily valuation of exchange-traded foreign securities generally is determined as of the close of trading on the principal exchange on which such securities trade. Events occurring after the close of trading on foreign exchanges may result in adjustments to the valuation of foreign securities to more accurately reflect their fair value as of the close of regular trading on the New York Stock Exchange. When valuing foreign equity securities that meet certain criteria, the Fund’s Trustees have approved the use of a fair value service that values such securities to reflect market trading that occurs after the close of the applicable foreign markets of comparable securities or other instruments that have a strong correlation to the fair-valued securities.
Affiliated Fund. The Fund may invest in Eaton Vance Cash Reserves Fund, LLC (Cash Reserves Fund), an affiliated investment company managed by Eaton Vance Management (EVM). While Cash Reserves Fund is not a registered money market mutual fund, it conducts all of its investment activities in accordance with the requirements of Rule 2a-7 under the 1940 Act. Investments in Cash Reserves Fund are valued at the closing net asset value per unit on the valuation day. Cash Reserves Fund generally values its investment securities based on available market quotations provided by a third party pricing service.
Fair Valuation. Investments for which valuations or market quotations are not readily available or are deemed unreliable are valued at fair value using methods determined in good faith by or at the direction of the Trustees of the Fund in a manner that most fairly reflects the security’s “fair value”, which is the amount that the Fund might reasonably expect to receive for the security upon its current sale in the ordinary course. Each such determination is based on a consideration of relevant factors, which are likely to vary from one pricing context to another. These factors may include, but are not limited to, the type of security, the existence of any contractual restrictions on the security’s disposition, the price and extent of public trading in similar securities of the issuer or of comparable companies or entities, quotations or relevant information obtained from broker/dealers or other market participants, information obtained from the issuer, analysts, and/or the appropriate stock exchange (for exchange-traded securities), an analysis of the company’s or entity’s financial statements, and an evaluation of the forces that influence the issuer and the market(s) in which the security is purchased and sold.
B Investment Transactions — Investment transactions for financial statement purposes are accounted for on a trade date basis. Realized gains and losses on investments sold are determined on the basis of identified cost.
C Income — Dividend income is recorded on the ex-dividend date for dividends received in cash and/or securities. However, if the ex-dividend date has passed, certain dividends from foreign securities are recorded as the Fund is informed of the ex-dividend date. Withholding taxes on foreign dividends and capital gains have been provided for in accordance with the Fund’s understanding of the applicable countries’ tax rules and rates. In consideration of recent decisions rendered by European courts, the Fund has filed additional tax reclaims for previously withheld taxes on dividends earned in certain European Union countries. These filings are subject to various administrative and judicial proceedings within these countries. Due to the uncertainty as to the ultimate resolution of these proceedings, the likelihood of receipt of these reclaims, and the potential timing of payment, no amounts are reflected in the Fund’s financial statements for such outstanding reclaims.
D Federal Taxes — The Fund’s policy is to comply with the provisions of the Internal Revenue Code applicable to regulated investment companies and to distribute to shareholders each year substantially all of its net investment income, and all or substantially all of its net realized capital gains. Accordingly, no provision for federal income or excise tax is necessary.
| 15 |
Eaton Vance
Dividend Builder Fund
December 31, 2021
Notes to Financial Statements — continued
As of December 31, 2021, the Fund had no uncertain tax positions that would require financial statement recognition, de-recognition, or disclosure. The Fund files a U.S. federal income tax return annually after its fiscal year-end, which is subject to examination by the Internal Revenue Service for a period of three years from the date of filing.
E Expenses — The majority of expenses of the Trust are directly identifiable to an individual fund. Expenses which are not readily identifiable to a specific fund are allocated taking into consideration, among other things, the nature and type of expense and the relative size of the funds.
F Foreign Currency Translation — Investment valuations, other assets, and liabilities initially expressed in foreign currencies are translated each business day into U.S. dollars based upon current exchange rates. Purchases and sales of foreign investment securities and income and expenses denominated in foreign currencies are translated into U.S. dollars based upon currency exchange rates in effect on the respective dates of such transactions. Recognized gains or losses on investment transactions attributable to changes in foreign currency exchange rates are recorded for financial statement purposes as net realized gains and losses on investments. That portion of unrealized gains and losses on investments that results from fluctuations in foreign currency exchange rates is not separately disclosed.
G Use of Estimates — The preparation of the financial statements in conformity with U.S. GAAP requires management to make estimates and assumptions that affect the reported amounts of assets and liabilities at the date of the financial statements and the reported amounts of income and expense during the reporting period. Actual results could differ from those estimates.
H Indemnifications — Under the Trust’s organizational documents, its officers and Trustees may be indemnified against certain liabilities and expenses arising out of the performance of their duties to the Fund. Under Massachusetts law, if certain conditions prevail, shareholders of a Massachusetts business trust (such as the Trust) could be deemed to have personal liability for the obligations of the Trust. However, the Trust’s Declaration of Trust contains an express disclaimer of liability on the part of Fund shareholders and the By-laws provide that the Trust shall assume, upon request by the shareholder, the defense on behalf of any Trust shareholders. Moreover, the By-laws also provide for indemnification out of Fund property of any shareholder held personally liable solely by reason of being or having been a shareholder for all loss or expense arising from such liability. Additionally, in the normal course of business, the Fund enters into agreements with service providers that may contain indemnification clauses. The Fund’s maximum exposure under these arrangements is unknown as this would involve future claims that may be made against the Fund that have not yet occurred.
2 Distributions to Shareholders and Income Tax Information
It is the present policy of the Fund to make monthly distributions of all or substantially all of its net investment income and to distribute annually all or substantially all of its net realized capital gains. Distributions to shareholders are recorded on the ex-dividend date. Distributions are declared separately for each class of shares. Shareholders may reinvest income and capital gain distributions in additional shares of the same class of the Fund at the net asset value as of the ex-dividend date or, at the election of the shareholder, receive distributions in cash. Distributions to shareholders are determined in accordance with income tax regulations, which may differ from U.S. GAAP. As required by U.S. GAAP, only distributions in excess of tax basis earnings and profits are reported in the financial statements as a return of capital. Permanent differences between book and tax accounting relating to distributions are reclassified to paid-in capital. For tax purposes, distributions from short-term capital gains are considered to be from ordinary income.
The tax character of distributions declared for the years ended December 31, 2021 and December 31, 2020 was as follows:
| Year Ended December 31, | ||||||||
| 2021 | 2020 | |||||||
Ordinary income | $ | 18,907,386 | $ | 20,167,727 | ||||
Long-term capital gains | $ | 49,304,121 | $ | 5,700,960 | ||||
During the year ended December 31, 2021, distributable earnings was decreased by $5,634,646 and paid-in capital was increased by $5,634,646 due to the Fund’s use of equalization accounting. Tax equalization accounting allows the Fund to treat as a distribution that portion of redemption proceeds representing a redeeming shareholder’s portion of undistributed taxable income and net capital gains. These reclassifications had no effect on the net assets or net asset value per share of the Fund.
As of December 31, 2021, the components of distributable earnings (accumulated loss) on a tax basis were as follows:
Undistributed ordinary income | $ | 790,965 | ||
Undistributed long-term capital gains | 102,598,075 | |||
Net unrealized appreciation | 342,280,959 | |||
Distributable earnings | $ | 445,669,999 | ||
| 16 |
Eaton Vance
Dividend Builder Fund
December 31, 2021
Notes to Financial Statements — continued
The cost and unrealized appreciation (depreciation) of investments of the Fund at December 31, 2021, as determined on a federal income tax basis, were as follows:
Aggregate cost | $ | 746,336,716 | ||
Gross unrealized appreciation | $ | 344,961,864 | ||
Gross unrealized depreciation | (2,729,234 | ) | ||
Net unrealized appreciation | $ | 342,232,630 | ||
3 Investment Adviser Fee and Other Transactions with Affiliates
The investment adviser fee is earned by Boston Management and Research (BMR) as compensation for investment advisory services rendered to the Fund. On March 1, 2021, Morgan Stanley acquired Eaton Vance Corp. (the “Transaction”) and BMR became an indirect, wholly-owned subsidiary of Morgan Stanley. In connection with the Transaction, the Fund entered into a new investment advisory agreement (the “New Agreement”) with BMR, which took effect on March 1, 2021. Pursuant to the New Agreement (and the Fund’s investment advisory agreement with BMR in effect prior to March 1, 2021), the fee is computed at an annual rate as a percentage of average daily net assets as follows and is payable monthly:
| Average Daily Net Assets | Annual Fee Rate | |||
Up to $500 million | 0.6500 | % | ||
$500 million but less than $1 billion | 0.6250 | % | ||
$1 billion but less than $1.5 billion | 0.6000 | % | ||
$1.5 billion but less than $2 billion | 0.5500 | % | ||
$2 billion but less than $3 billion | 0.5000 | % | ||
$3 billion and over | 0.4375 | % | ||
For the year ended December 31, 2021, the investment adviser fee amounted to $6,511,268 or 0.64% of the Fund’s average daily net assets. The Fund may invest its cash in Cash Reserves Fund. EVM does not currently receive a fee for advisory services provided to Cash Reserves Fund.
EVM, an affiliate of BMR and, effective March 1, 2021, an indirect, wholly-owned subsidiary of Morgan Stanley, serves as the administrator of the Fund, but receives no compensation. EVM provides sub-transfer agency and related services to the Fund pursuant to a Sub-Transfer Agency Support Services Agreement. For the year ended December 31, 2021, EVM earned $101,211 from the Fund pursuant to such agreement, which is included in transfer and dividend disbursing agent fees on the Statement of Operations. The Fund was informed that Eaton Vance Distributors, Inc. (EVD), an affiliate of EVM and the Fund’s principal underwriter, received $26,246 as its portion of the sales charge on sales of Class A shares for the year ended December 31, 2021. The Fund was informed that Morgan Stanley affiliated broker-dealers, which may be deemed to be affiliates of EVM, BMR and EVD, also received a portion of the sales charge on sales of Class A shares from March 1, 2021 through December 31, 2021 in the amount of $4,475. EVD also received distribution and service fees from Class A and Class C shares (see Note 4) and contingent deferred sales charges (see Note 5).
Trustees and officers of the Fund who are members of EVM’s or BMR’s organizations receive remuneration for their services to the Fund out of the investment adviser fee. Trustees of the Fund who are not affiliated with the investment adviser may elect to defer receipt of all or a percentage of their annual fees in accordance with the terms of the Trustees Deferred Compensation Plan. For the year ended December 31, 2021, no significant amounts have been deferred. Certain officers and Trustees of the Fund are officers of the above organizations.
4 Distribution Plans
The Fund has in effect a distribution plan for Class A shares (Class A Plan) pursuant to Rule 12b-1 under the 1940 Act. Pursuant to the Class A Plan, the Fund pays EVD a distribution and service fee of 0.25% per annum of its average daily net assets attributable to Class A shares for distribution services and facilities provided to the Fund by EVD, as well as for personal services and/or the maintenance of shareholder accounts. Distribution and service fees paid or accrued to EVD for the year ended December 31, 2021 amounted to $1,940,279 for Class A shares.
The Fund also has in effect a distribution plan for Class C shares (Class C Plan) pursuant to Rule 12b-1 under the 1940 Act. Pursuant to the Class C Plan, the Fund pays EVD amounts equal to 0.75% per annum of its average daily net assets attributable to Class C shares for providing ongoing distribution services and facilities to the Fund. For the year ended December 31, 2021, the Fund paid or accrued to EVD $205,927 for Class C shares.
| 17 |
Eaton Vance
Dividend Builder Fund
December 31, 2021
Notes to Financial Statements — continued
Pursuant to the Class C Plan, the Fund also makes payments of service fees to EVD, financial intermediaries and other persons in amounts equal to 0.25% per annum of its average daily net assets attributable to that class. Service fees paid or accrued are for personal services and/or the maintenance of shareholder accounts. They are separate and distinct from the sales commissions and distribution fees payable to EVD. Service fees paid or accrued for the year ended December 31, 2021 amounted to $68,642 for Class C shares.
Distribution and service fees are subject to the limitations contained in the Financial Industry Regulatory Authority Rule 2341(d).
5 Contingent Deferred Sales Charges
A contingent deferred sales charge (CDSC) of 1% generally is imposed on redemptions of Class C shares made within 12 months of purchase. Class A shares may be subject to a 1% CDSC if redeemed within 18 months of purchase (depending on the circumstances of purchase). Generally, the CDSC is based upon the lower of the net asset value at date of redemption or date of purchase. No charge is levied on shares acquired by reinvestment of dividends or capital gain distributions. For the year ended December 31, 2021, the Fund was informed that EVD received less than $100 of CDSCs paid by Class A shareholders and approximately $3,000 of CDSCs paid by Class C shareholders.
6 Purchases and Sales of Investments
Purchases and sales of investments, other than short-term obligations, aggregated $750,613,270 and $814,501,690, respectively, for the year ended December 31, 2021.
7 Shares of Beneficial Interest
The Fund’s Declaration of Trust permits the Trustees to issue an unlimited number of full and fractional shares of beneficial interest (without par value). Such shares may be issued in a number of different series (such as the Fund) and classes. Transactions in Fund shares were as follows:
| Year Ended December 31, | ||||||||
| Class A | 2021 | 2020 | ||||||
Sales | 1,142,477 | 1,699,807 | ||||||
Issued to shareholders electing to receive payments of distributions in Fund shares | 2,282,140 | 1,078,741 | ||||||
Redemptions | (4,829,485 | ) | (6,635,685 | ) | ||||
Converted from Class C shares | 206,437 | 1,221,844 | ||||||
Net decrease | (1,198,431 | ) | (2,635,293 | ) | ||||
| Year Ended December 31, | ||||||||
| Class C | 2021 | 2020 | ||||||
Sales | 163,994 | 226,947 | ||||||
Issued to shareholders electing to receive payments of distributions in Fund shares | 76,214 | 53,368 | ||||||
Redemptions | (366,688 | ) | (966,206 | ) | ||||
Converted to Class A shares | (204,962 | ) | (1,213,264 | ) | ||||
Net decrease | (331,442 | ) | (1,899,155 | ) | ||||
| Year Ended December 31, | ||||||||
| Class I | 2021 | 2020 | ||||||
Sales | 1,628,587 | 2,473,700 | ||||||
Issued to shareholders electing to receive payments of distributions in Fund shares | 750,764 | 345,555 | ||||||
Redemptions | (1,880,014 | ) | (3,051,817 | ) | ||||
Net increase (decrease) | 499,337 | (232,562 | ) | |||||
| 18 |
Eaton Vance
Dividend Builder Fund
December 31, 2021
Notes to Financial Statements — continued
8 Line of Credit
The Fund participates with other portfolios and funds managed by EVM and its affiliates in an $800 million unsecured line of credit agreement with a group of banks, which is in effect through October 25, 2022. Borrowings are made by the Fund solely for temporary purposes related to redemptions and other short-term cash needs. Interest is charged to the Fund based on its borrowings at an amount above either the Secured Overnight Financing Rate (SOFR) or Federal Funds rate. In addition, a fee computed at an annual rate of 0.15% on the daily unused portion of the line of credit is allocated among the participating portfolios and funds at the end of each quarter. In connection with the renewal of the agreement in October 2021, an arrangement fee totaling $150,000 was incurred that was allocated to the participating portfolios and funds. Because the line of credit is not available exclusively to the Fund, it may be unable to borrow some or all of its requested amounts at any particular time. The Fund did not have any significant borrowings or allocated fees during the year ended December 31, 2021.
9 Securities Lending Agreement
The Fund has established a securities lending agreement with State Street Bank and Trust Company (SSBT) as securities lending agent in which the Fund lends portfolio securities to qualified borrowers in exchange for collateral consisting of either cash or securities issued or guaranteed by the U.S. Government or its agencies or instrumentalities in an amount at least equal to the market value of the securities on loan. The market value of securities loaned is determined daily and any additional required collateral is delivered to the Fund on the next business day. Cash collateral is invested in the State Street Navigator Securities Lending Government Money Market Portfolio, a money market fund registered under the 1940 Act. The Fund earns interest on the amount invested but it must pay (and at times receive from) the broker a loan rebate fee computed as a varying percentage of the collateral received. For security loans secured by non-cash collateral, the Fund earns a negotiated lending fee from the borrower. A portion of the income earned by the Fund from its investment of cash collateral, net of rebate fees, and lending fees received is allocated to SSBT for its services as lending agent and the portion allocated to the Fund is presented as securities lending income, net on the Statement of Operations. Non-cash collateral is held by the lending agent on behalf of the Fund and cannot be sold or re-pledged by the Fund; accordingly, such collateral is not reflected in the Statement of Assets and Liabilities.
The Fund is subject to possible delay in the recovery of loaned securities. Pursuant to the securities lending agreement, SSBT has provided indemnification to the Fund in the event of default by a borrower with respect to a loan. The Fund bears the risk of loss with respect to the investment of cash collateral. At December 31, 2021, the Fund had no securities on loan.
10 Investments in Affiliated Funds
At December 31, 2021, the value of the Fund’s investment in affiliated funds was $1,120,031, which represents 0.1% of the Fund’s net assets. Transactions in affiliated funds by the Fund for the year ended December 31, 2021 were as follows:
| Name | Value, beginning of period | Purchases | Sales proceeds | Net realized gain (loss) | Change in unrealized appreciation (depreciation) | Value, end of period | Dividend income | Units, end of period | ||||||||||||||||||||||||
Short-Term Investments | ||||||||||||||||||||||||||||||||
Eaton Vance Cash Reserves Fund, LLC | $ | 2,158,673 | $ | 105,131,979 | $ | (106,170,226 | ) | $ | (395 | ) | $ | — | $ | 1,120,031 | $ | 1,400 | 1,120,143 | |||||||||||||||
11 Fair Value Measurements
Under generally accepted accounting principles for fair value measurements, a three-tier hierarchy to prioritize the assumptions, referred to as inputs, is used in valuation techniques to measure fair value. The three-tier hierarchy of inputs is summarized in the three broad levels listed below.
| • | Level 1 – quoted prices in active markets for identical investments |
| • | Level 2 – other significant observable inputs (including quoted prices for similar investments, interest rates, prepayment speeds, credit risk, etc.) |
| • | Level 3 – significant unobservable inputs (including a fund’s own assumptions in determining the fair value of investments) |
In cases where the inputs used to measure fair value fall in different levels of the fair value hierarchy, the level disclosed is determined based on the lowest level input that is significant to the fair value measurement in its entirety. The inputs or methodology used for valuing securities are not necessarily an indication of the risk associated with investing in those securities.
| 19 |
Eaton Vance
Dividend Builder Fund
December 31, 2021
Notes to Financial Statements — continued
At December 31, 2021, the hierarchy of inputs used in valuing the Fund’s investments, which are carried at value, were as follows:
| Asset Description | Level 1 | Level 2 | Level 3 | Total | ||||||||||||
Common Stocks | $ | 1,087,449,315 | * | $ | — | $ | — | $ | 1,087,449,315 | |||||||
Short-Term Investments | — | 1,120,031 | — | 1,120,031 | ||||||||||||
Total Investments | $ | 1,087,449,315 | $ | 1,120,031 | $ | — | $ | 1,088,569,346 | ||||||||
| * | The level classification by major category of investments is the same as the category presentation in the Portfolio of Investments. |
12 Risks and Uncertainties
Pandemic Risk
An outbreak of respiratory disease caused by a novel coronavirus was first detected in China in late 2019 and subsequently spread internationally. This coronavirus has resulted in closing borders, enhanced health screenings, changes to healthcare service preparation and delivery, quarantines, cancellations, disruptions to supply chains and customer activity, as well as general concern and uncertainty. Health crises caused by outbreaks, such as the coronavirus outbreak, may exacerbate other pre-existing political, social and economic risks and disrupt normal market conditions and operations. The impact of this outbreak has negatively affected the worldwide economy, the economies of individual countries, individual companies, and the market in general, and may continue to do so in significant and unforeseen ways, as may other epidemics and pandemics that may arise in the future. Any such impact could adversely affect the Fund’s performance, or the performance of the securities in which the Fund invests.
| 20 |
Eaton Vance
Dividend Builder Fund
December 31, 2021
Report of Independent Registered Public Accounting Firm
To the Trustees of Eaton Vance Special Investment Trust and Shareholders of Eaton Vance Dividend Builder Fund:
Opinion on the Financial Statements and Financial Highlights
We have audited the accompanying statement of assets and liabilities of Eaton Vance Dividend Builder Fund (the “Fund”) (one of the funds constituting Eaton Vance Special Investment Trust), including the portfolio of investments, as of December 31, 2021, the related statement of operations for the year then ended, the statements of changes in net assets for each of the two years in the period then ended, the financial highlights for each of the five years in the period then ended, and the related notes. In our opinion, the financial statements and financial highlights present fairly, in all material respects, the financial position of the Fund as of December 31, 2021, and the results of its operations for the year then ended, the changes in its net assets for each of the two years in the period then ended, and the financial highlights for each of the five years in the period then ended, in conformity with accounting principles generally accepted in the United States of America.
Basis for Opinion
These financial statements and financial highlights are the responsibility of the Fund’s management. Our responsibility is to express an opinion on the Fund’s financial statements and financial highlights based on our audits. We are a public accounting firm registered with the Public Company Accounting Oversight Board (United States) (PCAOB) and are required to be independent with respect to the Fund in accordance with the U.S. federal securities laws and the applicable rules and regulations of the Securities and Exchange Commission and the PCAOB.
We conducted our audits in accordance with the standards of the PCAOB. Those standards require that we plan and perform the audit to obtain reasonable assurance about whether the financial statements and financial highlights are free of material misstatement, whether due to error or fraud. The Fund is not required to have, nor were we engaged to perform, an audit of its internal control over financial reporting. As part of our audits, we are required to obtain an understanding of internal control over financial reporting but not for the purpose of expressing an opinion on the effectiveness of the Fund’s internal control over financial reporting. Accordingly, we express no such opinion.
Our audits included performing procedures to assess the risks of material misstatement of the financial statements and financial highlights, whether due to error or fraud, and performing procedures that respond to those risks. Such procedures included examining, on a test basis, evidence regarding the amounts and disclosures in the financial statements and financial highlights. Our audits also included evaluating the accounting principles used and significant estimates made by management, as well as evaluating the overall presentation of the financial statements and financial highlights. Our procedures included confirmation of securities owned as of December 31, 2021, by correspondence with the custodian and brokers; when replies were not received from brokers, we performed other auditing procedures. We believe that our audits provide a reasonable basis for our opinion.
/s/ Deloitte & Touche LLP
Boston, Massachusetts
February 23, 2022
We have served as the auditor of one or more Eaton Vance investment companies since 1959.
| 21 |
Eaton Vance
Dividend Builder Fund
December 31, 2021
Federal Tax Information (Unaudited)
The Form 1099-DIV you received in February 2022 showed the tax status of all distributions paid to your account in calendar year 2021. Shareholders are advised to consult their own tax adviser with respect to the tax consequences of their investment in the Fund. As required by the Internal Revenue Code and/or regulations, shareholders must be notified regarding the status of qualified dividend income for individuals, the dividends received deduction for corporations and capital gains dividends.
Qualified Dividend Income. For the fiscal year ended December 31, 2021, the Fund designates approximately $24,838,107, or up to the maximum amount of such dividends allowable pursuant to the Internal Revenue Code, as qualified dividend income eligible for the reduced tax rate of 15%.
Dividends Received Deduction. Corporate shareholders are generally entitled to take the dividends received deduction on the portion of the Fund’s dividend distribution that qualifies under tax law. For the Fund’s fiscal 2021 ordinary income dividends, 100% qualifies for the corporate dividends received deduction.
Capital Gains Dividends. The Fund hereby designates as a capital gain dividend with respect to the taxable year ended December 31, 2021, $157,665,848 or, if subsequently determined to be different, the net capital gain of such year.
| 22 |
Eaton Vance
Dividend Builder Fund
December 31, 2021
Fund Management. The Trustees of Eaton Vance Special Investment Trust (the Trust) are responsible for the overall management and supervision of the Trust’s affairs. The Board members and officers of the Trust are listed below. Except as indicated, each individual has held the office shown or other offices in the same company for the last five years. Board members hold indefinite terms of office. Each Trustee holds office until his or her successor is elected and qualified, subject to a prior death, resignation, retirement, disqualification or removal. Under the terms of the Fund’s current Trustee retirement policy, an Independent Trustee must retire and resign as a Trustee on the earlier of: (i) the first day of July following his or her 74th birthday; or (ii), with limited exception, December 31st of the 20th year in which he or she has served as a Trustee. However, if such retirement and resignation would cause the Fund to be out of compliance with Section 16 of the 1940 Act or any other regulations or guidance of the SEC, then such retirement and resignation will not become effective until such time as action has been taken for the Fund to be in compliance therewith. The “noninterested Trustees” consist of those Trustees who are not “interested persons” of the Trust, as that term is defined under the 1940 Act. The business address of each Board member and officer is Two International Place, Boston, Massachusetts 02110. As used below, “BMR” refers to Boston Management and Research, “EVC” refers to Eaton Vance Corp., “EV” refers to EV LLC, “EVM” refers to Eaton Vance Management and “EVD” refers to Eaton Vance Distributors, Inc. EV is the trustee of each of EVM and BMR. Effective March 1, 2021, each of EVM, BMR, EVD and EV are indirect, wholly owned subsidiaries of Morgan Stanley. Each officer affiliated with EVM may hold a position with other EVM affiliates that is comparable to his or her position with EVM listed below. Each Trustee oversees 138 funds (with the exception of Messrs. Faust and Wennerholm and Ms. Frost who oversee 137 funds) in the Eaton Vance fund complex (including both funds and portfolios in a hub and spoke structure).
| Name and Year of Birth | Trust Position(s) | Length of Service | Principal Occupation(s) and Other Directorships During Past Five Years and Other Relevant Experience | |||
| Interested Trustee | ||||||
Thomas E. Faust Jr. 1958 | Trustee | Since 2007 | Chairman of Morgan Stanley Investment Management, Inc. (MSIM), member of the Board of Managers and President of EV, Chief Executive Officer of EVM and BMR, and Director of EVD. Formerly, Chairman, Chief Executive Officer and President of EVC. Mr. Faust is an interested person because of his positions with MSIM, BMR, EVM, EVD, and EV, which are affiliates of the Trust, and his former position with EVC, which was an affiliate of the Trust prior to March 1, 2021. Other Directorships. Formerly, Director of EVC (2007-2021) and Hexavest Inc. (investment management firm) (2012-2021). | |||
| Noninterested Trustees | ||||||
Mark R. Fetting 1954 | Trustee | Since 2016 | Private investor. Formerly held various positions at Legg Mason, Inc. (investment management firm) (2000-2012), including President, Chief Executive Officer, Director and Chairman (2008-2012), Senior Executive Vice President (2004-2008) and Executive Vice President (2001-2004). Formerly, President of Legg Mason family of funds (2001-2008). Formerly, Division President and Senior Officer of Prudential Financial Group, Inc. and related companies (investment management firm) (1991-2000). Other Directorships. None. | |||
Cynthia E. Frost 1961 | Trustee | Since 2014 | Private investor. Formerly, Chief Investment Officer of Brown University (university endowment) (2000-2012). Formerly, Portfolio Strategist for Duke Management Company (university endowment manager) (1995-2000). Formerly, Managing Director, Cambridge Associates (investment consulting company) (1989-1995). Formerly, Consultant, Bain and Company (management consulting firm) (1987-1989). Formerly, Senior Equity Analyst, BA Investment Management Company (1983-1985). Other Directorships. None. | |||
George J. Gorman 1952 | Chairperson of the Board and Trustee | Since 2021 (Chairperson) and 2014 (Trustee) | Principal at George J. Gorman LLC (consulting firm). Formerly, Senior Partner at Ernst & Young LLP (a registered public accounting firm) (1974-2009). Other Directorships. None. | |||
Valerie A. Mosley 1960 | Trustee | Since 2014 | Chairwoman and Chief Executive Officer of Valmo Ventures (a consulting and investment firm). Founder of Upward Wealth, Inc., dba BrightUP, a fintech platform. Formerly, Partner and Senior Vice President, Portfolio Manager and Investment Strategist at Wellington Management Company, LLP (investment management firm) (1992-2012). Formerly, Chief Investment Officer, PG Corbin Asset Management (1990-1992). Formerly worked in institutional corporate bond sales at Kidder Peabody (1986-1990). Other Directorships. Director of DraftKings, Inc. (digital sports entertainment and gaming company) (since September 2020). Director of Groupon, Inc. (e-commerce provider) (since April 2020). Director of Envestnet, Inc. (provider of intelligent systems for wealth management and financial wellness) (since 2018). Formerly, Director of Dynex Capital, Inc. (mortgage REIT) (2013-2020). | |||
| 23 |
Eaton Vance
Dividend Builder Fund
December 31, 2021
Management and Organization — continued
| Name and Year of Birth | Trust Position(s) | Length of Service | Principal Occupation(s) and Other Directorships During Past Five Years and Other Relevant Experience | |||
| Noninterested Trustees (continued) | ||||||
William H. Park 1947 | Trustee | Since 2003 | Private investor. Formerly, Consultant (management and transactional) (2012-2014). Formerly, Chief Financial Officer, Aveon Group L.P. (investment management firm) (2010-2011). Formerly, Vice Chairman, Commercial Industrial Finance Corp. (specialty finance company) (2006-2010). Formerly, President and Chief Executive Officer, Prizm Capital Management, LLC (investment management firm) (2002-2005). Formerly, Executive Vice President and Chief Financial Officer, United Asset Management Corporation (investment management firm) (1982-2001). Formerly, Senior Manager, Price Waterhouse (now PricewaterhouseCoopers) (a registered public accounting firm) (1972-1981). Other Directorships. None. | |||
Helen Frame Peters 1948 | Trustee | Since 2008 | Professor of Finance, Carroll School of Management, Boston College. Formerly, Dean, Carroll School of Management, Boston College (2000-2002). Formerly, Chief Investment Officer, Fixed Income, Scudder Kemper Investments (investment management firm) (1998-1999). Formerly, Chief Investment Officer, Equity and Fixed Income, Colonial Management Associates (investment management firm) (1991-1998). Other Directorships. None. | |||
Keith Quinton 1958 | Trustee | Since 2018 | Private investor, researcher and lecturer. Formerly, Independent Investment Committee Member at New Hampshire Retirement System (2017-2021). Formerly, Portfolio Manager and Senior Quantitative Analyst at Fidelity Investments (investment management firm) (2001-2014). Other Directorships. Formerly, Director (2016-2021) and Chairman (2019-2021) of New Hampshire Municipal Bond Bank. | |||
Marcus L. Smith 1966 | Trustee | Since 2018 | Private investor. Formerly, Portfolio Manager at MFS Investment Management (investment management firm) (1994-2017). Other Directorships. Director of First Industrial Realty Trust, Inc. (an industrial REIT) (since 2021). Director of MSCI Inc. (global provider of investment decision support tools) (since 2017). Formerly, Director of DCT Industrial Trust Inc. (logistics real estate company) (2017-2018). | |||
Susan J. Sutherland 1957 | Trustee | Since 2015 | Private investor. Director of Ascot Group Limited and certain of its subsidiaries (insurance and reinsurance) (since 2017). Formerly, Director of Hagerty Holding Corp. (insurance) (2015-2018) and Montpelier Re Holdings Ltd. (insurance and reinsurance) (2013-2015). Formerly, Associate, Counsel and Partner at Skadden, Arps, Slate, Meagher & Flom LLP (law firm) (1982-2013). Other Directorships. Director of Kairos Acquisition Corp. (insurance/InsurTech acquisition company) (since 2021). | |||
Scott E. Wennerholm 1959 | Trustee | Since 2016 | Private investor. Formerly, Trustee at Wheelock College (postsecondary institution) (2012-2018). Formerly, Consultant at GF Parish Group (executive recruiting firm) (2016-2017). Formerly, Chief Operating Officer and Executive Vice President at BNY Mellon Asset Management (investment management firm) (2005-2011). Formerly, Chief Operating Officer and Chief Financial Officer at Natixis Global Asset Management (investment management firm) (1997-2004). Formerly, Vice President at Fidelity Investments Institutional Services (investment management firm) (1994-1997). Other Directorships. None. | |||
| Name and Year of Birth | Trust Position(s) | Length of Service | Principal Occupation(s) During Past Five Years | |||
| Principal Officers who are not Trustees | ||||||
Eric A. Stein 1980 | President | Since 2020 | Vice President and Chief Investment Officer, Fixed Income of EVM and BMR. Prior to November 1, 2020, Mr. Stein was a co-Director of Eaton Vance’s Global Income Investments. Also Vice President of Calvert Research and Management (“CRM”). | |||
Deidre E. Walsh 1971 | Vice President and Chief Legal Officer | Since 2009 | Vice President of EVM and BMR. Also Vice President of CRM. | |||
| 24 |
Eaton Vance
Dividend Builder Fund
December 31, 2021
Management and Organization — continued
| Name and Year of Birth | Trust Position(s) | Length of Service | Principal Occupation(s) During Past Five Years | |||
| Principal Officers who are not Trustees (continued) | ||||||
James F. Kirchner 1967 | Treasurer | Since 2007 | Vice President of EVM and BMR. Also Vice President of CRM. | |||
Jill R. Damon 1984 | Secretary | Since 2022 | Vice President of EVM and BMR since 2017. Formerly, associate at Dechert LLP (2009-2017). | |||
Richard F. Froio 1968 | Chief Compliance Officer | Since 2017 | Vice President of EVM and BMR since 2017. Formerly, Deputy Chief Compliance Officer (Adviser/Funds) and Chief Compliance Officer (Distribution) at PIMCO (2012-2017) and Managing Director at BlackRock/Barclays Global Investors (2009-2012). | |||
The SAI for the Fund includes additional information about the Trustees and officers of the Trust and can be obtained without charge on Eaton Vance’s website at www.eatonvance.com or by calling 1-800-262-1122.
| 25 |
Eaton Vance Funds
| Privacy Notice | April 2021 |
| FACTS | WHAT DOES EATON VANCE DO WITH YOUR PERSONAL INFORMATION? | |
| Why? | Financial companies choose how they share your personal information. Federal law gives consumers the right to limit some but not all sharing. Federal law also requires us to tell you how we collect, share, and protect your personal information. Please read this notice carefully to understand what we do. | |
| What? | The types of personal information we collect and share depend on the product or service you have with us. This information can include:
∎ Social Security number and income ∎ investment experience and risk tolerance ∎ checking account number and wire transfer instructions | |
| How? | All financial companies need to share customers’ personal information to run their everyday business. In the section below, we list the reasons financial companies can share their customers’ personal information; the reasons Eaton Vance chooses to share; and whether you can limit this sharing. | |
| Reasons we can share your personal information | Does Eaton Vance share? | Can you limit this sharing? | ||
| For our everyday business purposes — such as to process your transactions, maintain your account(s), respond to court orders and legal investigations, or report to credit bureaus | Yes | No | ||
| For our marketing purposes — to offer our products and services to you | Yes | No | ||
| For joint marketing with other financial companies | No | We don’t share | ||
| For our investment management affiliates’ everyday business purposes — information about your transactions, experiences, and creditworthiness | Yes | Yes | ||
| For our affiliates’ everyday business purposes — information about your transactions and experiences | Yes | No | ||
| For our affiliates’ everyday business purposes — information about your creditworthiness | No | We don’t share | ||
| For our investment management affiliates to market to you | Yes | Yes | ||
| For our affiliates to market to you | No | We don’t share | ||
| For nonaffiliates to market to you | No | We don’t share |
| To limit our sharing | Call toll-free 1-800-262-1122 or email: EVPrivacy@eatonvance.com
Please note:
If you are a new customer, we can begin sharing your information 30 days from the date we sent this notice. When you are no longer our customer, we continue to share your information as described in this notice. However, you can contact us at any time to limit our sharing. | |
| Questions? | Call toll-free 1-800-262-1122 or email: EVPrivacy@eatonvance.com | |
| 26 |
Eaton Vance Funds
| Privacy Notice — continued | April 2021 |
| Page 2 |
| Who we are | ||
| Who is providing this notice? | Eaton Vance Management, Eaton Vance Distributors, Inc., Eaton Vance Trust Company, Eaton Vance Management (International) Limited, Eaton Vance Advisers International Ltd., Eaton Vance Global Advisors Limited, Eaton Vance Management’s Real Estate Investment Group, Boston Management and Research, Calvert Research and Management, Eaton Vance and Calvert Fund Families and our investment advisory affiliates (“Eaton Vance”) (see Investment Management Affiliates definition below) | |
| What we do | ||
| How does Eaton Vance protect my personal information? | To protect your personal information from unauthorized access and use, we use security measures that comply with federal law. These measures include computer safeguards and secured files and buildings. We have policies governing the proper handling of customer information by personnel and requiring third parties that provide support to adhere to appropriate security standards with respect to such information. | |
| How does Eaton Vance collect my personal information? | We collect your personal information, for example, when you
∎ open an account or make deposits or withdrawals from your account ∎ buy securities from us or make a wire transfer ∎ give us your contact information
We also collect your personal information from others, such as credit bureaus, affiliates, or other companies. | |
| Why can’t I limit all sharing? | Federal law gives you the right to limit only
∎ sharing for affiliates’ everyday business purposes — information about your creditworthiness ∎ affiliates from using your information to market to you ∎ sharing for nonaffiliates to market to you
State laws and individual companies may give you additional rights to limit sharing. See below for more on your rights under state law. | |
| Definitions | ||
| Investment Management Affiliates | Eaton Vance Investment Management Affiliates include registered investment advisers, registered broker-dealers, and registered and unregistered funds. Investment Management Affiliates does not include entities associated with Morgan Stanley Wealth Management, such as Morgan Stanley Smith Barney LLC and Morgan Stanley & Co. | |
| Affiliates | Companies related by common ownership or control. They can be financial and nonfinancial companies.
∎ Our affiliates include companies with a Morgan Stanley name and financial companies such as Morgan Stanley Smith Barney LLC and Morgan Stanley & Co. | |
| Nonaffiliates | Companies not related by common ownership or control. They can be financial and nonfinancial companies.
∎ Eaton Vance does not share with nonaffiliates so they can market to you. | |
| Joint marketing | A formal agreement between nonaffiliated financial companies that together market financial products or services to you.
∎ Eaton Vance doesn’t jointly market. | |
| Other important information | ||
Vermont: Except as permitted by law, we will not share personal information we collect about Vermont residents with Nonaffiliates unless you provide us with your written consent to share such information.
California: Except as permitted by law, we will not share personal information we collect about California residents with Nonaffiliates and we will limit sharing such personal information with our Affiliates to comply with California privacy laws that apply to us. | ||
| 27 |
Eaton Vance Funds
Delivery of Shareholder Documents. The Securities and Exchange Commission (SEC) permits funds to deliver only one copy of shareholder documents, including prospectuses, proxy statements and shareholder reports, to fund investors with multiple accounts at the same residential or post office box address. This practice is often called “householding” and it helps eliminate duplicate mailings to shareholders. Eaton Vance, or your financial intermediary, may household the mailing of your documents indefinitely unless you instruct Eaton Vance, or your financial intermediary, otherwise. If you would prefer that your Eaton Vance documents not be householded, please contact Eaton Vance at 1-800-262-1122, or contact your financial intermediary. Your instructions that householding not apply to delivery of your Eaton Vance documents will typically be effective within 30 days of receipt by Eaton Vance or your financial intermediary.
Portfolio Holdings. Each Eaton Vance Fund and its underlying Portfolio(s) (if applicable) files a schedule of portfolio holdings on Part F to Form N-PORT with the SEC. Certain information filed on Form N-PORT may be viewed on the Eaton Vance website at www.eatonvance.com, by calling Eaton Vance at 1-800-262-1122 or in the EDGAR database on the SEC’s website at www.sec.gov.
Proxy Voting. From time to time, funds are required to vote proxies related to the securities held by the funds. The Eaton Vance Funds or their underlying Portfolios (if applicable) vote proxies according to a set of policies and procedures approved by the Funds’ and Portfolios’ Boards. You may obtain a description of these policies and procedures and information on how the Funds or Portfolios voted proxies relating to portfolio securities during the most recent 12-month period ended June 30, without charge, upon request, by calling 1-800-262-1122 and by accessing the SEC’s website at www.sec.gov.
| 28 |
Investment Adviser
Boston Management and Research
Two International Place
Boston, MA 02110
Administrator
Eaton Vance Management
Two International Place
Boston, MA 02110
Principal Underwriter*
Eaton Vance Distributors, Inc.
Two International Place
Boston, MA 02110
(617) 482-8260
Custodian
State Street Bank and Trust Company
State Street Financial Center, One Lincoln Street
Boston, MA 02111
Transfer Agent
BNY Mellon Investment Servicing (US) Inc.
Attn: Eaton Vance Funds
P.O. Box 9653
Providence, RI 02940-9653
(800) 262-1122
Independent Registered Public Accounting Firm
Deloitte & Touche LLP
200 Berkeley Street
Boston, MA 02116-5022
Fund Offices
Two International Place
Boston, MA 02110
| * | FINRA BrokerCheck. Investors may check the background of their Investment Professional by contacting the Financial Industry Regulatory Authority (FINRA). FINRA BrokerCheck is a free tool to help investors check the professional background of current and former FINRA-registered securities firms and brokers. FINRA BrokerCheck is available by calling 1-800-289-9999 and at www.FINRA.org. The FINRA BrokerCheck brochure describing this program is available to investors at www.FINRA.org. |
159 12.31.21

Eaton Vance
Growth Fund
Annual Report
December 31, 2021

Commodity Futures Trading Commission Registration. The Commodity Futures Trading Commission (“CFTC”) has adopted regulations that subject registered investment companies and advisers to regulation by the CFTC if a fund invests more than a prescribed level of its assets in certain CFTC-regulated instruments (including futures, certain options and swap agreements) or markets itself as providing investment exposure to such instruments. The investment adviser has claimed an exclusion from the definition of “commodity pool operator” under the Commodity Exchange Act with respect to its management of the Fund. Accordingly, neither the Fund nor the adviser with respect to the operation of the Fund is subject to CFTC regulation. Because of its management of other strategies, the Fund’s adviser is registered with the CFTC as a commodity pool operator. The adviser is also registered as a commodity trading advisor.
Fund shares are not insured by the FDIC and are not deposits or other obligations of, or guaranteed by, any depository institution. Shares are subject to investment risks, including possible loss of principal invested.
This report must be preceded or accompanied by a current summary prospectus or prospectus. Before investing, investors should consider carefully the investment objective, risks, and charges and expenses of a mutual fund. This and other important information is contained in the summary prospectus and prospectus, which can be obtained from a financial intermediary. Prospective investors should read the prospectus carefully before investing. For further information, please call 1-800-262-1122.
Annual Report December 31, 2021
Eaton Vance
Growth Fund
| 2 | ||||
| 3 | ||||
| 4 | ||||
| 5 | ||||
| 6 | ||||
| 7 | ||||
| 23 | ||||
| 24 | ||||
| 25 | ||||
| 28 | ||||
| 30 |
Eaton Vance
Growth Fund
December 31, 2021
Management’s Discussion of Fund Performance1
Economic and Market Conditions
The 12-month period starting January 1, 2021, was notable for a U.S. equity rally that lasted for most of the period and resulted in U.S. stocks outperforming most other stock markets in developed economies. Except for temporary retreats in September and November, broad-market indexes generally posted strong returns during the period. Investors cheered the reopening of businesses that had been affected by the pandemic and the rollout of several highly effective COVID-19 vaccines.
COVID-19, however, continued to have a firm grip on the U.S. economy. Disease rates advanced and declined with second, third, and fourth waves of infections. Worker shortages led to global supply-chain disruptions. From computer chips to shipping containers, scarcities of key items led to temporary factory shutdowns and empty store shelves. Those shortages — combined with high demand from consumers eager to spend money saved earlier in the pandemic — led to higher year-over-year inflation than the U.S. had seen in decades.
Still, investor optimism about a recovering economy drove stock prices up during most of the period. A significant pullback, however, occurred in September 2021 when virtually every major U.S. stock index reported negative returns. Unexpectedly weak job creation in August and the U.S. Federal Reserve’s (the Fed’s) announcement that it might soon begin tapering its monthly bond purchases — which had stimulated the economy earlier — combined to drive stocks into negative territory. Rising COVID-19 infections also weighed on equity performance in September.
In the final quarter of 2021, however, stock prices came roaring back. Even the late-November news of a new and more transmissible COVID-19 variant — Omicron — caused only a temporary market retreat. The Fed’s actions to tamp down inflation were applauded by investors, with stocks gaining ground after the central bank announced that tapering would be accelerated and that three possible interest rate hikes were forecast for 2022. Just two trading days before year-end, the S&P 500® Index closed at its 70th new all-time high for the period, and the Dow Jones Industrial Average® (DJIA) closed at an all-time high as well.
For the period as a whole, the broad-market S&P 500® Index returned 28.71%; the blue-chip DJIA was up 20.95%; and the technology-laden Nasdaq Composite Index rose 22.18%. Large-cap U.S. stocks, as measured by the Russell 1000® Index, outperformed their small-cap counterparts, as measured by the Russell 2000® Index. In the large-cap space, growth stocks modestly outperformed value stocks, but in the small-cap space, value stocks strongly outperformed growth stocks during the period.
Fund Performance
For the 12-month period ended December 31, 2021, Eaton Vance Growth Fund (the Fund) returned 19.62% for Class A shares at net asset value (NAV), underperforming its benchmark, the Russell 1000® Growth Index (the Index), which returned 27.60%.
Stock selections in the information technology (IT) and consumer discretionary sectors, along with stock selections and an overweight position relative to the Index in the health care sector, detracted from Fund performance versus the Index during the period.
In the IT sector, the Fund’s underweight position in NVIDIA Corp. (NVIDIA), a maker of computer graphics processing units used in gaming, data center, and self-driving vehicle applications, hurt relative returns. Long-term tailwinds — growth in the gaming, artificial intelligence, and autonomous vehicle industries — combined with a sharp increase in gaming and data center demand during the pandemic helped NVIDIA’s stock price more than double during the period. By period-end, the stock was sold from the Fund.
In the consumer discretionary sector, underweighting electric car maker Tesla, Inc. (Tesla) — due to inconsistency of earnings and the company’s high valuation — hurt relative performance as vehicle deliveries and profits rose and Tesla’s stock performed strongly during the period. The stock received an additional boost in October 2021 when The Hertz Corp. announced it was purchasing 100,000 Tesla autos for its rental fleet. By period-end, Tesla was sold from the Fund.
The Fund’s overweight position in Haemonetics Corp. (Haemonetics), which develops products related to blood diseases, hurt relative returns versus the Index in the health care sector. Haemonetics’ share price dropped sharply in April 2021 after a key customer failed to renew its plasma collection contract. By period-end, Haemonetics was sold from the Fund.
In contrast, stock selections in the financials, communication services, and industrials sectors contributed to Fund performance versus the Index. In the financials sector, Fund performance relative to the Index was helped by an overweight position in Charles Schwab Corp. (Schwab), a diversified financial services firm that serves retail customers as well as independent Registered Investment Advisors (RIAs). Schwab’s stock price rose during the period as consumers continued to migrate toward independent advisors, and as growth in the firm’s retail brokerage business exceeded the industry average. Investor expectations for rising interest rates were an additional driver for Schwab’s stock price.
In the communication services sector, the Fund’s overweight position in Alphabet, Inc. (Alphabet), parent company of search engine Google, performed strongly as positive e-commerce trends drove increased demand for search engine advertising and engagement. In addition, growth in viewership and ad sales on video sharing platform YouTube, an Alphabet subsidiary, exceeded analyst expectations during the period and provided an additional tailwind for Alphabet’s stock price.
See Endnotes and Additional Disclosures in this report.
Past performance is no guarantee of future results. Returns are historical and are calculated by determining the percentage change in net asset value (NAV) or offering price (as applicable) with all distributions reinvested. Investment return and principal value will fluctuate so that shares, when redeemed, may be worth more or less than their original cost. Performance for periods less than or equal to one year is cumulative. Performance is for the stated time period only; due to market volatility, current Fund performance may be lower or higher than the quoted return. For performance as of the most recent month-end, please refer to eatonvance.com.
| 2 |
Eaton Vance
Growth Fund
December 31, 2021
Portfolio Manager(s) Lewis R. Piantedosi and Douglas R. Rogers, CFA, CMT
| % Average Annual Total Returns | Class Inception Date | Performance Inception Date | One Year | Five Years | Ten Years | |||||||||||||||
Class A at NAV | 09/09/2002 | 09/09/2002 | 19.62 | % | 21.87 | % | 17.75 | % | ||||||||||||
Class A with 5.75% Maximum Sales Charge | — | — | 12.75 | 20.44 | 17.06 | |||||||||||||||
Class C at NAV | 09/09/2002 | 09/09/2002 | 18.70 | 20.96 | 17.05 | |||||||||||||||
Class C with 1% Maximum Sales Charge | — | — | 17.70 | 20.96 | 17.05 | |||||||||||||||
Class I at NAV | 05/03/2007 | 09/09/2002 | 19.92 | 22.17 | 18.05 | |||||||||||||||
Class R at NAV | 08/03/2009 | 09/09/2002 | 19.29 | 21.56 | 17.45 | |||||||||||||||
| ||||||||||||||||||||
Russell 1000® Growth Index | — | — | 27.60 | % | 25.30 | % | 19.77 | % | ||||||||||||
| % Total Annual Operating Expense Ratios4 | Class A | Class C | Class I | Class R | ||||||||||||||||
Gross | 1.09 | % | 1.84 | % | 0.84 | % | 1.34 | % | ||||||||||||
Net | 1.05 | 1.80 | 0.80 | 1.30 | ||||||||||||||||
Growth of $10,000
This graph shows the change in value of a hypothetical investment of $10,000 in Class A of the Fund for the period indicated. For comparison, the same investment is shown in the indicated index.
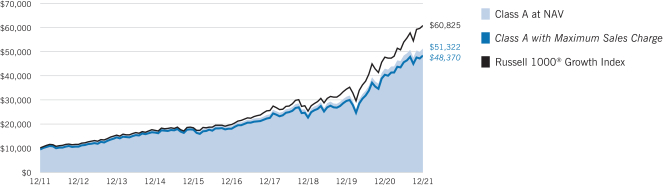
| Growth of Investment | Amount Invested | Period Beginning | At NAV | With Maximum Sales Charge | ||||||||||||
Class C | $10,000 | 12/31/2011 | $48,336 | N.A. | ||||||||||||
Class I | $250,000 | 12/31/2011 | $1,315,715 | N.A. | ||||||||||||
Class R | $10,000 | 12/31/2011 | $50,032 | N.A. | ||||||||||||
See Endnotes and Additional Disclosures in this report.
Past performance is no guarantee of future results. Returns are historical and are calculated by determining the percentage change in net asset value (NAV) or offering price (as applicable) with all distributions reinvested. Investment return and principal value will fluctuate so that shares, when redeemed, may be worth more or less than their original cost. Performance for periods less than or equal to one year is cumulative. Performance is for the stated time period only; due to market volatility, current Fund performance may be lower or higher than the quoted return. For performance as of the most recent month-end, please refer to eatonvance.com.
| 3 |
Eaton Vance
Growth Fund
December 31, 2021
Sector Allocation (% of net assets)5
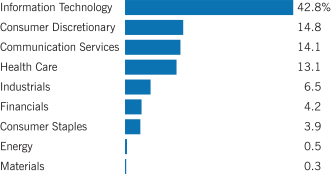
Top 10 Holdings (% of net assets)5
Amazon.com, Inc. | 7.8 | % | ||
Microsoft Corp. | 7.4 | |||
Apple, Inc. | 5.8 | |||
Alphabet, Inc., Class A | 5.4 | |||
Visa, Inc., Class A | 4.2 | |||
Meta Platforms, Inc., Class A | 3.9 | |||
Adobe, Inc. | 3.2 | |||
Intuit, Inc. | 3.1 | |||
QUALCOMM, Inc. | 2.9 | |||
PayPal Holdings, Inc. | 2.8 | |||
Total | 46.5 | % | ||
See Endnotes and Additional Disclosures in this report.
| 4 |
Eaton Vance
Growth Fund
December 31, 2021
Endnotes and Additional Disclosures
| 1 | The views expressed in this report are those of the portfolio manager(s) and are current only through the date stated at the top of this page. These views are subject to change at any time based upon market or other conditions, and Eaton Vance and the Fund(s) disclaim any responsibility to update such views. These views may not be relied upon as investment advice and, because investment decisions are based on many factors, may not be relied upon as an indication of trading intent on behalf of any Eaton Vance fund. This commentary may contain statements that are not historical facts, referred to as “forward-looking statements.” The Fund’s actual future results may differ significantly from those stated in any forward-looking statement, depending on factors such as changes in securities or financial markets or general economic conditions, the volume of sales and purchases of Fund shares, the continuation of investment advisory, administrative and service contracts, and other risks discussed from time to time in the Fund’s filings with the Securities and Exchange Commission. |
| 2 | Russell 1000® Growth Index is an unmanaged index of U.S. large-cap growth stocks. Unless otherwise stated, index returns do not reflect the effect of any applicable sales charges, commissions, expenses, taxes or leverage, as applicable. It is not possible to invest directly in an index. |
| 3 | Total Returns at NAV do not include applicable sales charges. If sales charges were deducted, the returns would be lower. Total Returns shown with maximum sales charge reflect the stated maximum sales charge. Unless otherwise stated, performance does not reflect the deduction of taxes on Fund distributions or redemptions of Fund shares. |
Effective November 5, 2020, Class C shares automatically convert to Class A shares eight years after purchase. The average annual total returns listed for Class C reflect conversion to Class A shares after eight years. Prior to November 5, 2020, Class C shares automatically converted to Class A shares ten years after purchase.
| 4 | Source: Fund prospectus. Net expense ratios reflect a contractual expense reimbursement that continues through 4/30/22. The expense ratios for the current reporting period can be found in the Financial Highlights section of this report. Performance reflects expenses waived and/or reimbursed, if applicable. Without such waivers and/or reimbursements, performance would have been lower. |
| 5 | Excludes cash and cash equivalents. |
Fund profile subject to change due to active management.
Additional Information
S&P 500® Index is an unmanaged index of large-cap stocks commonly used as a measure of U.S. stock market performance. Dow Jones Industrial Average® is a price-weighted average of 30 blue-chip stocks that are generally the leaders in their industry. S&P Dow Jones Indices are a product of S&P Dow Jones Indices LLC (“S&P DJI”) and have been licensed for use. S&P® and S&P 500® are registered trademarks of S&P DJI; Dow Jones® is a registered trademark of Dow Jones Trademark Holdings LLC (“Dow Jones”); S&P DJI, Dow Jones and their respective affiliates do not sponsor, endorse, sell or promote the Fund, will not have any liability with respect thereto and do not have any liability for any errors, omissions, or interruptions of the S&P Dow Jones Indices. Nasdaq Composite Index is a market capitalization-weighted index of all domestic and international securities listed on Nasdaq. Source: Nasdaq, Inc. The information is provided by Nasdaq (with its affiliates, are referred to as the “Corporations”) and Nasdaq’s third party licensors on an “as is” basis and the Corporations make no guarantees and bear no liability of any kind with respect to the information or the Fund. Russell 1000® Index is an unmanaged index of 1,000 U.S. large-cap stocks. Russell 2000® Index is an unmanaged index of 2,000 U.S. small-cap stocks.
Important Notice to Shareholders
Lewis R. Piantedosi will retire from the Eaton Vance organization effective June 30, 2022.
| 5 |
Eaton Vance
Growth Fund
December 31, 2021
Example: As a Fund shareholder, you incur two types of costs: (1) transaction costs, including sales charges (loads) on purchases and redemption fees (if applicable); and (2) ongoing costs, including management fees; distribution and/or service fees; and other Fund expenses. This Example is intended to help you understand your ongoing costs (in dollars) of Fund investing and to compare these costs with the ongoing costs of investing in other mutual funds. The Example is based on an investment of $1,000 invested at the beginning of the period and held for the entire period (July 1, 2021 – December 31, 2021).
Actual Expenses: The first section of the table below provides information about actual account values and actual expenses. You may use the information in this section, together with the amount you invested, to estimate the expenses that you paid over the period. Simply divide your account value by $1,000 (for example, an $8,600 account value divided by $1,000 = 8.6), then multiply the result by the number in the first section under the heading entitled “Expenses Paid During Period” to estimate the expenses you paid on your account during this period.
Hypothetical Example for Comparison Purposes: The second section of the table below provides information about hypothetical account values and hypothetical expenses based on the actual Fund expense ratio and an assumed rate of return of 5% per year (before expenses), which is not the actual Fund return. The hypothetical account values and expenses may not be used to estimate the actual ending account balance or expenses you paid for the period. You may use this information to compare the ongoing costs of investing in your Fund and other funds. To do so, compare this 5% hypothetical example with the 5% hypothetical examples that appear in the shareholder reports of the other funds.
Please note that the expenses shown in the table are meant to highlight your ongoing costs only and do not reflect any transactional costs, such as sales charges (loads) or redemption fees (if applicable). Therefore, the second section of the table is useful in comparing ongoing costs only, and will not help you determine the relative total costs of owning different funds. In addition, if these transactional costs were included, your costs would be higher.
Beginning Account Value | Ending Account Value | Expenses Paid During Period* | Annualized Expense | |||||||||||||
Actual | ||||||||||||||||
Class A | $ | 1,000.00 | $ | 1,062.30 | $ | 5.46 | ** | 1.05 | % | |||||||
Class C | $ | 1,000.00 | $ | 1,058.00 | $ | 9.34 | ** | 1.80 | % | |||||||
Class I | $ | 1,000.00 | $ | 1,063.60 | $ | 4.16 | ** | 0.80 | % | |||||||
Class R | $ | 1,000.00 | $ | 1,060.80 | $ | 6.75 | ** | 1.30 | % | |||||||
Hypothetical | ||||||||||||||||
(5% return per year before expenses) | ||||||||||||||||
Class A | $ | 1,000.00 | $ | 1,019.91 | $ | 5.35 | ** | 1.05 | % | |||||||
Class C | $ | 1,000.00 | $ | 1,016.13 | $ | 9.15 | ** | 1.80 | % | |||||||
Class I | $ | 1,000.00 | $ | 1,021.17 | $ | 4.08 | ** | 0.80 | % | |||||||
Class R | $ | 1,000.00 | $ | 1,018.65 | $ | 6.61 | ** | 1.30 | % | |||||||
| * | Expenses are equal to the Fund’s annualized expense ratio for the indicated Class, multiplied by the average account value over the period, multiplied by 184/365 (to reflect the one-half year period). The Example assumes that the $1,000 was invested at the net asset value per share determined at the close of business on June 30, 2021. |
| ** | Absent an allocation of certain expenses to an affiliate, expenses would be higher. |
| 6 |
Eaton Vance
Growth Fund
December 31, 2021
| Common Stocks — 100.2% |
| |||||||
| Security | Shares | Value | ||||||
| Aerospace & Defense — 1.2% | ||||||||
Hexcel Corp.(1) | 53,723 | $ | 2,782,851 | |||||
Raytheon Technologies Corp. | 31,675 | 2,725,951 | ||||||
| $ | 5,508,802 | |||||||
| Auto Components — 1.3% | ||||||||
Aptiv PLC(1) | 34,949 | $ | 5,764,838 | |||||
| $ | 5,764,838 | |||||||
| Banks — 1.0% | ||||||||
JPMorgan Chase & Co. | 27,897 | $ | 4,417,490 | |||||
| $ | 4,417,490 | |||||||
| Beverages — 1.7% | ||||||||
Coca-Cola Co. (The) | 131,149 | $ | 7,765,332 | |||||
| $ | 7,765,332 | |||||||
| Biotechnology — 1.4% | ||||||||
AbbVie, Inc. | 44,968 | $ | 6,088,667 | |||||
| $ | 6,088,667 | |||||||
| Building Products — 1.0% | ||||||||
Trane Technologies PLC | 21,131 | $ | 4,269,096 | |||||
| $ | 4,269,096 | |||||||
| Capital Markets — 3.3% | ||||||||
Charles Schwab Corp. (The) | 83,677 | $ | 7,037,235 | |||||
Goldman Sachs Group, Inc. (The) | 19,736 | 7,550,007 | ||||||
| $ | 14,587,242 | |||||||
| Chemicals — 0.3% | ||||||||
Ecolab, Inc. | 5,423 | $ | 1,272,182 | |||||
| $ | 1,272,182 | |||||||
| Commercial Services & Supplies — 1.3% | ||||||||
Copart, Inc.(1) | 16,029 | $ | 2,430,317 | |||||
Waste Connections, Inc. | 25,646 | 3,494,780 | ||||||
| $ | 5,925,097 | |||||||
| Electrical Equipment — 1.2% | ||||||||
AMETEK, Inc. | 37,368 | $ | 5,494,591 | |||||
| $ | 5,494,591 | |||||||
| Security | Shares | Value | ||||||
| Electronic Equipment, Instruments & Components — 0.8% | ||||||||
Zebra Technologies Corp., Class A(1) | 6,307 | $ | 3,753,926 | |||||
| $ | 3,753,926 | |||||||
| Entertainment — 2.3% | ||||||||
Netflix, Inc.(1) | 11,469 | $ | 6,909,385 | |||||
Walt Disney Co. (The)(1) | 21,088 | 3,266,320 | ||||||
| $ | 10,175,705 | |||||||
| Food & Staples Retailing — 1.0% | ||||||||
Sysco Corp. | 56,096 | $ | 4,406,341 | |||||
| $ | 4,406,341 | |||||||
| Food Products — 0.9% | ||||||||
Mondelez International, Inc., Class A | 57,415 | $ | 3,807,189 | |||||
| $ | 3,807,189 | |||||||
| Health Care Equipment & Supplies — 4.9% | ||||||||
Abbott Laboratories | 37,943 | $ | 5,340,098 | |||||
Inari Medical, Inc.(1) | 28,105 | 2,565,144 | ||||||
Intuitive Surgical, Inc.(1) | 23,471 | 8,433,130 | ||||||
Ortho Clinical Diagnostics Holdings PLC(1) | 124,498 | 2,663,012 | ||||||
Tandem Diabetes Care, Inc.(1) | 19,354 | 2,913,164 | ||||||
| $ | 21,914,548 | |||||||
| Health Care Providers & Services — 2.0% | ||||||||
UnitedHealth Group, Inc. | 17,578 | $ | 8,826,617 | |||||
| $ | 8,826,617 | |||||||
| Health Care Technology — 0.5% | ||||||||
Veeva Systems, Inc., Class A(1) | 8,460 | $ | 2,161,361 | |||||
| $ | 2,161,361 | |||||||
| Hotels, Restaurants & Leisure — 1.3% | ||||||||
Starbucks Corp. | 48,094 | $ | 5,625,555 | |||||
| $ | 5,625,555 | |||||||
| Household Products — 0.3% | ||||||||
Church & Dwight Co., Inc. | 14,395 | $ | 1,475,488 | |||||
| $ | 1,475,488 | |||||||
| Interactive Media & Services — 11.8% | ||||||||
Alphabet, Inc., Class A(1) | 8,284 | $ | 23,999,079 | |||||
Alphabet, Inc., Class C(1) | 2,799 | 8,099,159 | ||||||
| 7 | See Notes to Financial Statements. |
Eaton Vance
Growth Fund
December 31, 2021
Portfolio of Investments — continued
| Security | Shares | Value | ||||||
| Interactive Media & Services (continued) | ||||||||
Meta Platforms, Inc., Class A(1) | 52,478 | $ | 17,650,975 | |||||
Snap, Inc., Class A(1) | 38,243 | 1,798,568 | ||||||
Twitter, Inc.(1) | 28,161 | 1,217,119 | ||||||
| $ | 52,764,900 | |||||||
| Internet & Direct Marketing Retail — 7.8% | ||||||||
Amazon.com, Inc.(1) | 10,488 | $ | 34,970,558 | |||||
| $ | 34,970,558 | |||||||
| IT Services — 7.6% | ||||||||
Accenture PLC, Class A | 6,771 | $ | 2,806,918 | |||||
PayPal Holdings, Inc.(1) | 65,702 | 12,390,083 | ||||||
Visa, Inc., Class A | 87,662 | 18,997,232 | ||||||
| $ | 34,194,233 | |||||||
| Life Sciences Tools & Services — 3.1% | ||||||||
10X Genomics, Inc., Class A(1) | 23,657 | $ | 3,523,947 | |||||
Agilent Technologies, Inc. | 19,508 | 3,114,452 | ||||||
Illumina, Inc.(1) | 6,209 | 2,362,152 | ||||||
Thermo Fisher Scientific, Inc. | 7,598 | 5,069,689 | ||||||
| $ | 14,070,240 | |||||||
| Oil, Gas & Consumable Fuels — 0.5% | ||||||||
EOG Resources, Inc. | 26,895 | $ | 2,389,083 | |||||
| $ | 2,389,083 | |||||||
| Pharmaceuticals — 1.3% | ||||||||
Eli Lilly & Co. | 20,378 | $ | 5,628,811 | |||||
| $ | 5,628,811 | |||||||
| Road & Rail — 1.7% | ||||||||
CSX Corp. | 117,069 | $ | 4,401,794 | |||||
Uber Technologies, Inc.(1) | 80,436 | 3,372,682 | ||||||
| $ | 7,774,476 | |||||||
| Semiconductors & Semiconductor Equipment — 9.3% | ||||||||
Ambarella, Inc.(1) | 15,281 | $ | 3,100,362 | |||||
Intel Corp. | 91,929 | 4,734,344 | ||||||
Micron Technology, Inc. | 124,632 | 11,609,471 | ||||||
QUALCOMM, Inc. | 70,336 | 12,862,344 | ||||||
Texas Instruments, Inc. | 50,572 | 9,531,305 | ||||||
| $ | 41,837,826 | |||||||
| Security | Shares | Value | ||||||
| Software — 18.4% | ||||||||
Adobe, Inc.(1) | 25,224 | $ | 14,303,522 | |||||
Altair Engineering, Inc., Class A(1) | 30,179 | 2,333,440 | ||||||
Intuit, Inc. | 21,396 | 13,762,335 | ||||||
Microsoft Corp. | 99,130 | 33,339,402 | ||||||
Palantir Technologies, Inc., Class A(1) | 228,683 | 4,164,317 | ||||||
Paycom Software, Inc.(1) | 5,168 | 2,145,702 | ||||||
salesforce.com, inc.(1) | 26,346 | 6,695,309 | ||||||
Zscaler, Inc.(1) | 17,679 | 5,680,793 | ||||||
| $ | 82,424,820 | |||||||
| Specialty Retail — 3.3% | ||||||||
Home Depot, Inc. (The) | 12,522 | $ | 5,196,755 | |||||
TJX Cos., Inc. (The) | 128,012 | 9,718,671 | ||||||
| $ | 14,915,426 | |||||||
| Technology Hardware, Storage & Peripherals — 6.6% | ||||||||
Apple, Inc. | 145,932 | $ | 25,913,145 | |||||
Logitech International S.A.(2) | 46,188 | 3,809,586 | ||||||
| $ | 29,722,731 | |||||||
| Textiles, Apparel & Luxury Goods — 1.1% | ||||||||
NIKE, Inc., Class B | 29,417 | $ | 4,902,931 | |||||
| $ | 4,902,931 | |||||||
Total Common Stocks |
| $ | 448,836,102 | |||||
| Short-Term Investments — 0.2% |
| |||||||
| Affiliated Fund — 0.0%(3) |
| |||||||
| Description | Units | Value | ||||||
Eaton Vance Cash Reserves Fund, LLC, 0.08%(4) | 45,081 | $ | 45,076 | |||||
Total Affiliated Fund |
| $ | 45,076 | |||||
| 8 | See Notes to Financial Statements. |
Eaton Vance
Growth Fund
December 31, 2021
Portfolio of Investments — continued
| Securities Lending Collateral — 0.2% |
| |||||||
| Description | Shares | Value | ||||||
State Street Navigator Securities Lending Government Money Market Portfolio, 0.03%(5) | 911,858 | $ | 911,858 | |||||
Total Securities Lending Collateral |
| $ | 911,858 | |||||
Total Short-Term Investments |
| $ | 956,934 | |||||
Total Investments — 100.4% |
| $ | 449,793,036 | |||||
Other Assets, Less Liabilities — (0.4)% |
| $ | (1,711,611 | ) | ||||
Net Assets — 100.0% |
| $ | 448,081,425 | |||||
The percentage shown for each investment category in the Portfolio of Investments is based on net assets.
| (1) | Non-income producing security. |
| (2) | All or a portion of this security was on loan at December 31, 2021. The aggregate market value of securities on loan at December 31, 2021 was $874,535. |
| (3) | Amount is less than 0.05%. |
| (4) | Affiliated investment company, available to Eaton Vance portfolios and funds, which invests in high quality, U.S. dollar denominated money market instruments. The rate shown is the annualized seven-day yield as of December 31, 2021. |
| (5) | Represents investment of cash collateral received in connection with securities lending. |
| 9 | See Notes to Financial Statements. |
Eaton Vance
Growth Fund
December 31, 2021
Statement of Assets and Liabilities
| Assets | December 31, 2021 | |||
Unaffiliated investments, at value including $874,535 of securities on loan (identified cost, $177,518,715) | $ | 449,747,960 | ||
Affiliated investment, at value (identified cost, $45,076) | 45,076 | |||
Cash | 12,603 | |||
Dividends receivable | 37,300 | |||
Dividends receivable from affiliated investment | 35 | |||
Receivable for Fund shares sold | 238,642 | |||
Securities lending income receivable | 1,646 | |||
Tax reclaims receivable | 20,929 | |||
Receivable from affiliate | 8,598 | |||
Total assets | $ | 450,112,789 | ||
| Liabilities | ||||
Collateral for securities loaned | $ | 911,858 | ||
Payable for Fund shares redeemed | 648,193 | |||
Payable to affiliates: | ||||
Investment adviser fee | 244,409 | |||
Distribution and service fees | 82,808 | |||
Trustees’ fees | 5,388 | |||
Accrued expenses | 138,708 | |||
Total liabilities | $ | 2,031,364 | ||
Net Assets | $ | 448,081,425 | ||
| Sources of Net Assets | ||||
Paid-in capital | $ | 169,131,683 | ||
Distributable earnings | 278,949,742 | |||
Total | $ | 448,081,425 | ||
| Class A Shares | ||||
Net Assets | $ | 330,229,596 | ||
Shares Outstanding | 8,341,906 | |||
Net Asset Value and Redemption Price Per Share | ||||
(net assets ÷ shares of beneficial interest outstanding) | $ | 39.59 | ||
Maximum Offering Price Per Share | ||||
(100 ÷ 94.25 of net asset value per share) | $ | 42.01 | ||
| Class C Shares | ||||
Net Assets | $ | 14,408,760 | ||
Shares Outstanding | 475,663 | |||
Net Asset Value and Offering Price Per Share* | ||||
(net assets ÷ shares of beneficial interest outstanding) | $ | 30.29 | ||
| Class I Shares | ||||
Net Assets | $ | 100,422,933 | ||
Shares Outstanding | 2,415,315 | |||
Net Asset Value, Offering Price and Redemption Price Per Share | ||||
(net assets ÷ shares of beneficial interest outstanding) | $ | 41.58 | ||
| Class R Shares | ||||
Net Assets | $ | 3,020,136 | ||
Shares Outstanding | 79,681 | |||
Net Asset Value, Offering Price and Redemption Price Per Share | ||||
(net assets ÷ shares of beneficial interest outstanding) | $ | 37.90 | ||
On sales of $50,000 or more, the offering price of Class A shares is reduced.
| * | Redemption price per share is equal to the net asset value less any applicable contingent deferred sales charge. |
| 10 | See Notes to Financial Statements. |
Eaton Vance
Growth Fund
December 31, 2021
Statement of Operations
| Investment Income | Year Ended December 31, 2021 | |||
Dividends (net of foreign taxes, $9,753) | $ | 3,159,937 | ||
Dividends from affiliated investment | 747 | |||
Securities lending income, net | 46,308 | |||
Total investment income | $ | 3,206,992 | ||
| Expenses | ||||
Investment adviser fee | $ | 2,808,555 | ||
Distribution and service fees | ||||
Class A | 803,933 | |||
Class C | 151,280 | |||
Class R | 16,364 | |||
Trustees’ fees and expenses | 21,749 | |||
Custodian fee | 105,699 | |||
Transfer and dividend disbursing agent fees | 309,387 | |||
Legal and accounting services | 48,823 | |||
Printing and postage | 73,794 | |||
Registration fees | 60,685 | |||
Miscellaneous | 22,357 | |||
Total expenses | $ | 4,422,626 | ||
Deduct — | ||||
Allocation of expenses to affiliate | $ | 8,598 | ||
Total expense reductions | $ | 8,598 | ||
Net expenses | $ | 4,414,028 | ||
Net investment loss | $ | (1,207,036 | ) | |
| Realized and Unrealized Gain (Loss) | ||||
Net realized gain (loss) — | ||||
Investment transactions | $ | 43,002,249 | ||
Investment transactions — affiliated investments | (50 | ) | ||
Foreign currency transactions | (14,413 | ) | ||
Net realized gain | $ | 42,987,786 | ||
Change in unrealized appreciation (depreciation) — | ||||
Investments | $ | 35,102,108 | ||
Net change in unrealized appreciation (depreciation) | $ | 35,102,108 | ||
Net realized and unrealized gain | $ | 78,089,894 | ||
Net increase in net assets from operations | $ | 76,882,858 | ||
| 11 | See Notes to Financial Statements. |
Eaton Vance
Growth Fund
December 31, 2021
Statements of Changes in Net Assets
| Year Ended December 31, | ||||||||
| Increase (Decrease) in Net Assets | 2021 | 2020 | ||||||
From operations — | ||||||||
Net investment loss | $ | (1,207,036 | ) | $ | (1,032,425 | ) | ||
Net realized gain | 42,987,786 | 25,292,256 | ||||||
Net change in unrealized appreciation (depreciation) | 35,102,108 | 86,055,664 | ||||||
Net increase in net assets from operations | $ | 76,882,858 | $ | 110,315,495 | ||||
Distributions to shareholders — | ||||||||
Class A | $ | (26,394,413 | ) | $ | (20,016,051 | ) | ||
Class C | (1,466,142 | ) | (1,437,972 | ) | ||||
Class I | (7,573,390 | ) | (5,308,733 | ) | ||||
Class R | (248,220 | ) | (172,088 | ) | ||||
Total distributions to shareholders | $ | (35,682,165 | ) | $ | (26,934,844 | ) | ||
Transactions in shares of beneficial interest — | ||||||||
Proceeds from sale of shares | ||||||||
Class A | $ | 10,435,549 | $ | 15,526,023 | ||||
Class C | 1,557,588 | 3,669,214 | ||||||
Class I | 14,743,302 | 11,943,616 | ||||||
Class R | 1,143,299 | 940,391 | ||||||
Net asset value of shares issued to shareholders in payment of distributions declared | ||||||||
Class A | 24,347,899 | 18,401,997 | ||||||
Class C | 1,460,503 | 1,427,538 | ||||||
Class I | 7,353,696 | 5,160,388 | ||||||
Class R | 238,448 | 164,737 | ||||||
Cost of shares redeemed | ||||||||
Class A | (37,087,351 | ) | (37,068,012 | ) | ||||
Class C | (3,832,599 | ) | (5,324,364 | ) | ||||
Class I | (13,537,858 | ) | (17,470,213 | ) | ||||
Class R | (1,189,021 | ) | (1,372,344 | ) | ||||
Net asset value of shares converted | ||||||||
Class A | 1,945,594 | 4,954,410 | ||||||
Class C | (1,945,594 | ) | (4,954,410 | ) | ||||
Net increase (decrease) in net assets from Fund share transactions | $ | 5,633,455 | $ | (4,001,029 | ) | |||
Net increase in net assets | $ | 46,834,148 | $ | 79,379,622 | ||||
| Net Assets | ||||||||
At beginning of year | $ | 401,247,277 | $ | 321,867,655 | ||||
At end of year | $ | 448,081,425 | $ | 401,247,277 | ||||
| 12 | See Notes to Financial Statements. |
Eaton Vance
Growth Fund
December 31, 2021
Financial Highlights
| Class A | ||||||||||||||||||||
| Year Ended December 31, | ||||||||||||||||||||
| 2021 | 2020 | 2019 | 2018 | 2017 | ||||||||||||||||
Net asset value — Beginning of year | $ | 35.930 | $ | 28.130 | $ | 23.610 | $ | 26.650 | $ | 22.300 | ||||||||||
| Income (Loss) From Operations | ||||||||||||||||||||
Net investment loss(1) | $ | (0.120 | ) | $ | (0.098 | ) | $ | (0.037 | ) | $ | (0.034 | ) | $ | (0.021 | ) | |||||
Net realized and unrealized gain | 7.140 | 10.409 | 7.095 | 0.301 | 5.680 | |||||||||||||||
Total income from operations | $ | 7.020 | $ | 10.311 | $ | 7.058 | $ | 0.267 | $ | 5.659 | ||||||||||
| Less Distributions | ||||||||||||||||||||
From net investment income | $ | — | $ | — | $ | — | $ | — | $ | (0.029 | ) | |||||||||
From net realized gain | (3.360 | ) | (2.511 | ) | (2.538 | ) | (3.307 | ) | (1.280 | ) | ||||||||||
Total distributions | $ | (3.360 | ) | $ | (2.511 | ) | $ | (2.538 | ) | $ | (3.307 | ) | $ | (1.309 | ) | |||||
Net asset value — End of year | $ | 39.590 | $ | 35.930 | $ | 28.130 | $ | 23.610 | $ | 26.650 | ||||||||||
Total Return(2)(3) | 19.62 | % | 37.16 | % | 30.38 | % | 0.27 | % | 25.42 | % | ||||||||||
| Ratios/Supplemental Data | ||||||||||||||||||||
Net assets, end of year (000’s omitted) | $ | 330,230 | $ | 299,834 | $ | 236,457 | $ | 190,017 | $ | 209,606 | ||||||||||
Ratios (as a percentage of average daily net assets):(4) | ||||||||||||||||||||
Expenses(3) | 1.05 | % | 1.05 | % | 1.05 | % | 1.05 | % | 1.05 | % | ||||||||||
Net investment loss | (0.30 | )% | (0.32 | )% | (0.14 | )% | (0.12 | )% | (0.08 | )% | ||||||||||
Portfolio Turnover of the Portfolio(5) | — | — | — | 20 | %(6) | 50 | % | |||||||||||||
Portfolio Turnover of the Fund | 21 | % | 37 | % | 40 | % | 28 | %(6)(7) | — | |||||||||||
| (1) | Computed using average shares outstanding. |
| (2) | Returns are historical and are calculated by determining the percentage change in net asset value with all distributions reinvested and do not reflect the effect of sales charges. |
| (3) | The administrator reimbursed certain operating expenses (equal to less than 0.005%, 0.04%, 0.04%, 0.04% and 0.06% of average daily net assets for the years ended December 31, 2021, 2020, 2019, 2018 and 2017, respectively). Absent this reimbursement, total return would be lower. |
| (4) | Includes the Fund’s share of the Portfolio’s allocated expenses for the period while the Fund was investing in the Portfolio. |
| (5) | Portfolio turnover represents the rate of portfolio activity for the period while the Fund was investing in the Portfolio. |
| (6) | Not annualized. |
| (7) | For the period from May 14, 2018 through December 31, 2018 when the Fund was making investments directly in securities. |
References to Portfolio herein are to Growth Portfolio, a Massachusetts business trust in which the Fund invested all of its investable assets prior to the close of business on May 11, 2018 and which had the same investment objective and policies as the Fund during such period.
| 13 | See Notes to Financial Statements. |
Eaton Vance
Growth Fund
December 31, 2021
Financial Highlights — continued
| Class C | ||||||||||||||||||||
| Year Ended December 31, | ||||||||||||||||||||
| 2021 | 2020 | 2019 | 2018 | 2017 | ||||||||||||||||
Net asset value — Beginning of year | $ | 28.370 | $ | 22.790 | $ | 19.660 | $ | 22.870 | $ | 19.410 | ||||||||||
| Income (Loss) From Operations | ||||||||||||||||||||
Net investment loss(1) | $ | (0.326 | ) | $ | (0.261 | ) | $ | (0.206 | ) | $ | (0.214 | ) | $ | (0.183 | ) | |||||
Net realized and unrealized gain | 5.606 | 8.352 | 5.874 | 0.311 | 4.923 | |||||||||||||||
Total income from operations | $ | 5.280 | $ | 8.091 | $ | 5.668 | $ | 0.097 | $ | 4.740 | ||||||||||
| Less Distributions | ||||||||||||||||||||
From net realized gain | $ | (3.360 | ) | $ | (2.511 | ) | $ | (2.538 | ) | $ | (3.307 | ) | $ | (1.280 | ) | |||||
Total distributions | $ | (3.360 | ) | $ | (2.511 | ) | $ | (2.538 | ) | $ | (3.307 | ) | $ | (1.280 | ) | |||||
Net asset value — End of year | $ | 30.290 | $ | 28.370 | $ | 22.790 | $ | 19.660 | $ | 22.870 | ||||||||||
Total Return(2)(3) | 18.70 | % | 36.17 | % | 29.35 | % | (0.43 | )% | 24.45 | % | ||||||||||
| Ratios/Supplemental Data | ||||||||||||||||||||
Net assets, end of year (000’s omitted) | $ | 14,409 | $ | 16,026 | $ | 17,501 | $ | 35,061 | $ | 41,450 | ||||||||||
Ratios (as a percentage of average daily net assets):(4) | ||||||||||||||||||||
Expenses(3) | 1.80 | % | 1.80 | % | 1.80 | % | 1.80 | % | 1.80 | % | ||||||||||
Net investment loss | (1.05 | )% | (1.06 | )% | (0.91 | )% | (0.87 | )% | (0.83 | )% | ||||||||||
Portfolio Turnover of the Portfolio(5) | — | — | — | 20 | %(6) | 50 | % | |||||||||||||
Portfolio Turnover of the Fund | 21 | % | 37 | % | 40 | % | 28 | %(6)(7) | — | |||||||||||
| (1) | Computed using average shares outstanding. |
| (2) | Returns are historical and are calculated by determining the percentage change in net asset value with all distributions reinvested and do not reflect the effect of sales charges. |
| (3) | The administrator reimbursed certain operating expenses (equal to less than 0.005%, 0.04%, 0.04%, 0.04% and 0.06% of average daily net assets for the years ended December 31, 2021, 2020, 2019, 2018 and 2017, respectively). Absent this reimbursement, total return would be lower. |
| (4) | Includes the Fund’s share of the Portfolio’s allocated expenses for the period while the Fund was investing in the Portfolio. |
| (5) | Portfolio turnover represents the rate of portfolio activity for the period while the Fund was investing in the Portfolio. |
| (6) | Not annualized. |
| (7) | For the period from May 14, 2018 through December 31, 2018 when the Fund was making investments directly in securities. |
References to Portfolio herein are to Growth Portfolio, a Massachusetts business trust in which the Fund invested all of its investable assets prior to the close of business on May 11, 2018 and which had the same investment objective and policies as the Fund during such period.
| 14 | See Notes to Financial Statements. |
Eaton Vance
Growth Fund
December 31, 2021
Financial Highlights — continued
| Class I | ||||||||||||||||||||
| Year Ended December 31, | ||||||||||||||||||||
| 2021 | 2020 | 2019 | 2018 | 2017 | ||||||||||||||||
Net asset value — Beginning of year | $ | 37.500 | $ | 29.200 | $ | 24.380 | $ | 27.340 | $ | 22.850 | ||||||||||
| Income (Loss) From Operations | ||||||||||||||||||||
Net investment income (loss)(1) | $ | (0.023 | ) | $ | (0.022 | ) | $ | 0.029 | $ | 0.040 | $ | 0.043 | ||||||||
Net realized and unrealized gain | 7.463 | 10.833 | 7.329 | 0.307 | 5.820 | |||||||||||||||
Total income from operations | $ | 7.440 | $ | 10.811 | $ | 7.358 | $ | 0.347 | $ | 5.863 | ||||||||||
| Less Distributions | ||||||||||||||||||||
From net investment income | $ | — | $ | — | $ | — | $ | — | $ | (0.093 | ) | |||||||||
From net realized gain | (3.360 | ) | (2.511 | ) | (2.538 | ) | (3.307 | ) | (1.280 | ) | ||||||||||
Total distributions | $ | (3.360 | ) | $ | (2.511 | ) | $ | (2.538 | ) | $ | (3.307 | ) | $ | (1.373 | ) | |||||
Net asset value — End of year | $ | 41.580 | $ | 37.500 | $ | 29.200 | $ | 24.380 | $ | 27.340 | ||||||||||
Total Return(2)(3) | 19.92 | % | 37.51 | % | 30.65 | % | 0.56 | % | 25.72 | % | ||||||||||
| Ratios/Supplemental Data | ||||||||||||||||||||
Net assets, end of year (000’s omitted) | $ | 100,423 | $ | 82,887 | $ | 65,646 | $ | 78,812 | $ | 78,775 | ||||||||||
Ratios (as a percentage of average daily net assets):(4) | ||||||||||||||||||||
Expenses(3) | 0.80 | % | 0.80 | % | 0.80 | % | 0.80 | % | 0.80 | % | ||||||||||
Net investment income (loss) | (0.05 | )% | (0.07 | )% | 0.10 | % | 0.14 | % | 0.16 | % | ||||||||||
Portfolio Turnover of the Portfolio(5) | — | — | — | 20 | %(6) | 50 | % | |||||||||||||
Portfolio Turnover of the Fund | 21 | % | 37 | % | 40 | % | 28 | %(6)(7) | — | |||||||||||
| (1) | Computed using average shares outstanding. |
| (2) | Returns are historical and are calculated by determining the percentage change in net asset value with all distributions reinvested. |
| (3) | The administrator reimbursed certain operating expenses (equal to less than 0.005%, 0.04%, 0.04%, 0.04% and 0.06% of average daily net assets for the years ended December 31, 2021, 2020, 2019, 2018 and 2017, respectively). Absent this reimbursement, total return would be lower. |
| (4) | Includes the Fund’s share of the Portfolio’s allocated expenses for the period while the Fund was investing in the Portfolio. |
| (5) | Portfolio turnover represents the rate of portfolio activity for the period while the Fund was investing in the Portfolio. |
| (6) | Not annualized. |
| (7) | For the period from May 14, 2018 through December 31, 2018 when the Fund was making investments directly in securities. |
References to Portfolio herein are to Growth Portfolio, a Massachusetts business trust in which the Fund invested all of its investable assets prior to the close of business on May 11, 2018 and which had the same investment objective and policies as the Fund during such period.
| 15 | See Notes to Financial Statements. |
Eaton Vance
Growth Fund
December 31, 2021
Financial Highlights — continued
| Class R | ||||||||||||||||||||
| Year Ended December 31, | ||||||||||||||||||||
| 2021 | 2020 | 2019 | 2018 | 2017 | ||||||||||||||||
Net asset value — Beginning of year | $ | 34.610 | $ | 27.230 | $ | 22.980 | $ | 26.090 | $ | 21.880 | ||||||||||
| Income (Loss) From Operations | ||||||||||||||||||||
Net investment loss(1) | $ | (0.214 | ) | $ | (0.166 | ) | $ | (0.105 | ) | $ | (0.104 | ) | $ | (0.082 | ) | |||||
Net realized and unrealized gain | 6.864 | 10.057 | 6.893 | 0.301 | 5.572 | |||||||||||||||
Total income from operations | $ | 6.650 | $ | 9.891 | $ | 6.788 | $ | 0.197 | $ | 5.490 | ||||||||||
| Less Distributions | ||||||||||||||||||||
From net realized gain | $ | (3.360 | ) | $ | (2.511 | ) | $ | (2.538 | ) | $ | (3.307 | ) | $ | (1.280 | ) | |||||
Total distributions | $ | (3.360 | ) | $ | (2.511 | ) | $ | (2.538 | ) | $ | (3.307 | ) | $ | (1.280 | ) | |||||
Net asset value — End of year | $ | 37.900 | $ | 34.610 | $ | 27.230 | $ | 22.980 | $ | 26.090 | ||||||||||
Total Return(2)(3) | 19.29 | % | 36.84 | % | 30.03 | % | 0.01 | % | 25.12 | % | ||||||||||
| Ratios/Supplemental Data | ||||||||||||||||||||
Net assets, end of year (000’s omitted) | $ | 3,020 | $ | 2,501 | $ | 2,264 | $ | 3,030 | $ | 3,447 | ||||||||||
Ratios (as a percentage of average daily net assets):(4) | ||||||||||||||||||||
Expenses(3) | 1.30 | % | 1.30 | % | 1.30 | % | 1.30 | % | 1.30 | % | ||||||||||
Net investment loss | (0.56 | )% | (0.56 | )% | (0.39 | )% | (0.37 | )% | (0.33 | )% | ||||||||||
Portfolio Turnover of the Portfolio(5) | — | — | — | 20 | %(6) | 50 | % | |||||||||||||
Portfolio Turnover of the Fund | 21 | % | 37 | % | 40 | % | 28 | %(6)(7) | — | |||||||||||
| (1) | Computed using average shares outstanding. |
| (2) | Returns are historical and are calculated by determining the percentage change in net asset value with all distributions reinvested. |
| (3) | The administrator reimbursed certain operating expenses (equal to less than 0.005%, 0.04%, 0.04%, 0.04% and 0.06% of average daily net assets for the years ended December 31, 2021, 2020, 2019, 2018 and 2017, respectively). Absent this reimbursement, total return would be lower. |
| (4) | Includes the Fund’s share of the Portfolio’s allocated expenses for the period while the Fund was investing in the Portfolio. |
| (5) | Portfolio turnover represents the rate of portfolio activity for the period while the Fund was investing in the Portfolio. |
| (6) | Not annualized. |
| (7) | For the period from May 14, 2018 through December 31, 2018 when the Fund was making investments directly in securities. |
References to Portfolio herein are to Growth Portfolio, a Massachusetts business trust in which the Fund invested all of its investable assets prior to the close of business on May 11, 2018 and which had the same investment objective and policies as the Fund during such period.
| 16 | See Notes to Financial Statements. |
Eaton Vance
Growth Fund
December 31, 2021
Notes to Financial Statements
1 Significant Accounting Policies
Eaton Vance Growth Fund (the Fund) is a non-diversified series of Eaton Vance Special Investment Trust (the Trust). The Trust is a Massachusetts business trust registered under the Investment Company Act of 1940, as amended (the 1940 Act), as an open-end management investment company. The Fund’s investment objective is to seek total return. The Fund offers four classes of shares. Class A shares are generally sold subject to a sales charge imposed at time of purchase. Class C shares are sold at net asset value and are generally subject to a contingent deferred sales charge (see Note 5). Effective January 25, 2019, Class C shares generally automatically convert to Class A shares ten years after their purchase and, effective November 5, 2020, automatically convert to Class A shares eight years after their purchase as described in the Fund’s prospectus. Class I and Class R shares are sold at net asset value and are not subject to a sales charge. Each class represents a pro-rata interest in the Fund, but votes separately on class-specific matters and (as noted below) is subject to different expenses. Realized and unrealized gains and losses and net investment income and losses, other than class-specific expenses, are allocated daily to each class of shares based on the relative net assets of each class to the total net assets of the Fund. Each class of shares differs in its distribution plan and certain other class-specific expenses.
The following is a summary of significant accounting policies of the Fund. The policies are in conformity with accounting principles generally accepted in the United States of America (U.S. GAAP). The Fund is an investment company and follows accounting and reporting guidance in the Financial Accounting Standards Board (FASB) Accounting Standards Codification Topic 946.
A Investment Valuation — The following methodologies are used to determine the market value or fair value of investments.
Equity Securities. Equity securities listed on a U.S. securities exchange generally are valued at the last sale or closing price on the day of valuation or, if no sales took place on such date, at the mean between the closing bid and ask prices on the exchange where such securities are principally traded. Equity securities listed on the NASDAQ National Market System are valued at the NASDAQ official closing price. Unlisted or listed securities for which closing sales prices or closing quotations are not available are valued at the mean between the latest available bid and ask prices.
Foreign Securities and Currencies. Foreign securities and currencies are valued in U.S. dollars, based on foreign currency exchange rate quotations supplied by a third party pricing service. The pricing service uses a proprietary model to determine the exchange rate. Inputs to the model include reported trades and implied bid/ask spreads. The daily valuation of exchange-traded foreign securities generally is determined as of the close of trading on the principal exchange on which such securities trade. Events occurring after the close of trading on foreign exchanges may result in adjustments to the valuation of foreign securities to more accurately reflect their fair value as of the close of regular trading on the New York Stock Exchange. When valuing foreign equity securities that meet certain criteria, the Fund’s Trustees have approved the use of a fair value service that values such securities to reflect market trading that occurs after the close of the applicable foreign markets of comparable securities or other instruments that have a strong correlation to the fair-valued securities.
Affiliated Fund. The Fund may invest in Eaton Vance Cash Reserves Fund, LLC (Cash Reserves Fund), an affiliated investment company managed by Eaton Vance Management (EVM). While Cash Reserves Fund is not a registered money market mutual fund, it conducts all of its investment activities in accordance with the requirements of Rule 2a-7 under the 1940 Act. Investments in Cash Reserves Fund are valued at the closing net asset value per unit on the valuation day. Cash Reserves Fund generally values its investment securities based on available market quotations provided by a third party pricing service.
Other. Investments in registered investment companies (including money market funds) that do not trade on an exchange are valued at the net asset value per share on the valuation day.
Fair Valuation. Investments for which valuations or market quotations are not readily available or are deemed unreliable are valued at fair value using methods determined in good faith by or at the direction of the Trustees of the Fund in a manner that most fairly reflects the security’s “fair value”, which is the amount that the Fund might reasonably expect to receive for the security upon its current sale in the ordinary course. Each such determination is based on a consideration of relevant factors, which are likely to vary from one pricing context to another. These factors may include, but are not limited to, the type of security, the existence of any contractual restrictions on the security’s disposition, the price and extent of public trading in similar securities of the issuer or of comparable companies or entities, quotations or relevant information obtained from broker/dealers or other market participants, information obtained from the issuer, analysts, and/or the appropriate stock exchange (for exchange-traded securities), an analysis of the company’s or entity’s financial statements, and an evaluation of the forces that influence the issuer and the market(s) in which the security is purchased and sold.
B Investment Transactions — Investment transactions for financial statement purposes are accounted for on a trade date basis. Realized gains and losses on investments sold are determined on the basis of identified cost.
C Income — Dividend income is recorded on the ex-dividend date for dividends received in cash and/or securities. However, if the ex-dividend date has passed, certain dividends from foreign securities are recorded as the Fund is informed of the ex-dividend date. Withholding taxes on foreign dividends and capital gains have been provided for in accordance with the Fund’s understanding of the applicable countries’ tax rules and rates.
D Federal Taxes — The Fund’s policy is to comply with the provisions of the Internal Revenue Code applicable to regulated investment companies and to distribute to shareholders each year substantially all of its net investment income, and all or substantially all of its net realized capital gains. Accordingly, no provision for federal income or excise tax is necessary.
As of December 31, 2021, the Fund had no uncertain tax positions that would require financial statement recognition, de-recognition, or disclosure. The Fund files a U.S. federal income tax return annually after its fiscal year-end, which is subject to examination by the Internal Revenue Service for a period of three years from the date of filing.
| 17 |
Eaton Vance
Growth Fund
December 31, 2021
Notes to Financial Statements — continued
E Expenses — The majority of expenses of the Trust are directly identifiable to an individual fund. Expenses which are not readily identifiable to a specific fund are allocated taking into consideration, among other things, the nature and type of expense and the relative size of the funds.
F Foreign Currency Translation — Investment valuations, other assets, and liabilities initially expressed in foreign currencies are translated each business day into U.S. dollars based upon current exchange rates. Purchases and sales of foreign investment securities and income and expenses denominated in foreign currencies are translated into U.S. dollars based upon currency exchange rates in effect on the respective dates of such transactions. Recognized gains or losses on investment transactions attributable to changes in foreign currency exchange rates are recorded for financial statement purposes as net realized gains and losses on investments. That portion of unrealized gains and losses on investments that results from fluctuations in foreign currency exchange rates is not separately disclosed.
G Use of Estimates — The preparation of the financial statements in conformity with U.S. GAAP requires management to make estimates and assumptions that affect the reported amounts of assets and liabilities at the date of the financial statements and the reported amounts of income and expense during the reporting period. Actual results could differ from those estimates.
H Indemnifications — Under the Trust’s organizational documents, its officers and Trustees may be indemnified against certain liabilities and expenses arising out of the performance of their duties to the Fund. Under Massachusetts law, if certain conditions prevail, shareholders of a Massachusetts business trust (such as the Trust) could be deemed to have personal liability for the obligations of the Trust. However, the Trust’s Declaration of Trust contains an express disclaimer of liability on the part of Fund shareholders and the By-laws provide that the Trust shall assume, upon request by the shareholder, the defense on behalf of any Fund shareholders. Moreover, the By-laws also provide for indemnification out of Fund property of any shareholder held personally liable solely by reason of being or having been a shareholder for all loss or expense arising from such liability. Additionally, in the normal course of business, the Fund enters into agreements with service providers that may contain indemnification clauses. The Fund’s maximum exposure under these arrangements is unknown as this would involve future claims that may be made against the Fund that have not yet occurred.
2 Distributions to Shareholders and Income Tax Information
It is the present policy of the Fund to make at least one distribution annually (normally in December) of all or substantially all of its net investment income and to distribute annually all or substantially all of its net realized capital gains. Distributions to shareholders are recorded on the ex-dividend date. Distributions are declared separately for each class of shares. Shareholders may reinvest income and capital gain distributions in additional shares of the same class of the Fund at the net asset value as of the ex-dividend date or, at the election of the shareholder, receive distributions in cash. Distributions to shareholders are determined in accordance with income tax regulations, which may differ from U.S. GAAP. As required by U.S. GAAP, only distributions in excess of tax basis earnings and profits are reported in the financial statements as a return of capital. Permanent differences between book and tax accounting relating to distributions are reclassified to paid-in capital. For tax purposes, distributions from short-term capital gains are considered to be from ordinary income.
The tax character of distributions declared for the years ended December 31, 2021 and December 30, 2020 was as follows:
| Year Ended December 31, | ||||||||
| 2021 | 2020 | |||||||
Ordinary income | $ | 153,523 | $ | — | ||||
Long-term capital gains | $ | 35,528,642 | $ | 26,934,844 | ||||
During the year ended December 31, 2021, distributable earnings was decreased by $1,509,669 and paid-in capital was increased by $1,509,669 due to the Fund’s use of equalization accounting. Tax equalization accounting allows the Fund to treat as a distribution that portion of redemption proceeds representing a redeeming shareholder’s portion of undistributed taxable income and net capital gains. These reclassifications had no effect on the net assets or net asset value per share of the Fund.
As of December 31, 2021, the components of distributable earnings (accumulated loss) on a tax basis were as follows:
Undistributed long-term capital gains | $ | 7,187,054 | ||
Post October capital losses | (436,822 | ) | ||
Net unrealized appreciation | 272,199,510 | |||
Distributable earnings | $ | 278,949,742 | ||
At December 31, 2021, the Fund had a net capital loss of $436,822 attributable to security transactions incurred after October 31, 2021 that it has elected to defer. This net capital loss is treated as arising on the first day of the Fund’s taxable year ending December 31, 2022.
| 18 |
Eaton Vance
Growth Fund
December 31, 2021
Notes to Financial Statements — continued
The cost and unrealized appreciation (depreciation) of investments of the Fund at December 31, 2021, as determined on a federal income tax basis, were as follows:
Aggregate cost | $ | 177,593,512 | ||
Gross unrealized appreciation | $ | 274,702,479 | ||
Gross unrealized depreciation | (2,502,955 | ) | ||
Net unrealized appreciation | $ | 272,199,524 | ||
3 Investment Adviser Fee and Other Transactions with Affiliates
The investment adviser fee is earned by Boston Management and Research (BMR) as compensation for investment advisory services rendered to the Fund. On March 1, 2021, Morgan Stanley acquired Eaton Vance Corp. (the “Transaction”) and BMR became an indirect, wholly-owned subsidiary of Morgan Stanley. In connection with the Transaction, the Fund entered into a new investment advisory agreement (the “New Agreement”) with BMR, which took effect on March 1, 2021. Pursuant to the New Agreement (and the Fund’s investment advisory agreement with BMR in effect prior to March 1, 2021), the investment adviser fee is computed at an annual rate as a percentage of the Fund’s average daily net assets as follows and is payable monthly:
| Average Daily Net Assets | Annual Fee Rate | |||
Up to $500 million | 0.650 | % | ||
$500 million but less than $1 billion | 0.625 | % | ||
$1 billion but less than $2.5 billion | 0.600 | % | ||
$2.5 billion and over | 0.575 | % | ||
For the year ended December 31, 2021, the Fund’s investment adviser fee amounted to $2,808,555 or 0.65% of the Fund’s average daily net assets. The Fund may invest its cash in Cash Reserves Fund. EVM does not currently receive a fee for advisory services provided to Cash Reserves Fund.
EVM, an affiliate of BMR, serves as the administrator of the Fund, but currently receives no compensation. EVM has agreed to reimburse the Fund’s expenses to the extent that total annual operating expenses (relating to ordinary operating expenses only) exceed 1.05%, 1.80%, 0.80% and 1.30% of the Fund’s average daily net assets for Class A, Class C, Class I and Class R, respectively. This agreement may be changed or terminated after April 30, 2022. Pursuant to this agreement, EVM was allocated $8,598 of the Fund’s operating expenses for the year ended December 31, 2021.
EVM provides sub-transfer agency and related services to the Fund pursuant to a Sub-Transfer Agency Support Services Agreement. For the year ended December 31, 2021, EVM earned $85,445 from the Fund pursuant to such agreement, which is included in transfer and dividend disbursing agent fees on the Statement of Operations. The Fund was informed that Eaton Vance Distributors, Inc. (EVD), an affiliate of EVM and the Fund’s principal underwriter, received $12,046 as its portion of the sales charge on sales of Class A shares for the year ended December 31, 2021. The Fund was informed that Morgan Stanley affiliated broker-dealers, which may be deemed to be affiliates of EVM, BMR and EVD, also received a portion of the sales charge on sales of Class A shares from March 1, 2021 through December 31, 2021 in the amount of $680. EVD also received distribution and service fees from Class A, Class C and Class R shares (see Note 4) and contingent deferred sales charges (see Note 5).
Trustees and officers of the Fund who are members of EVM’s or BMR’s organizations receive remuneration for their services to the Fund out of the investment adviser fee. Trustees of the Fund who are not affiliated with the investment adviser may elect to defer receipt of all or a percentage of their annual fees in accordance with the terms of the Trustees Deferred Compensation Plan. For the year ended December 31, 2021, no significant amounts have been deferred. Certain officers and Trustees of the Fund are officers of the above organizations.
4 Distribution Plans
The Fund has in effect a distribution plan for Class A shares (Class A Plan) pursuant to Rule 12b-1 under the 1940 Act. Pursuant to the Class A Plan, the Fund pays EVD a distribution and service fee of 0.25% per annum of its average daily net assets attributable to Class A shares for distribution services and facilities provided to the Fund by EVD, as well as for personal services and/or the maintenance of shareholder accounts. Distribution and service fees paid or accrued to EVD for the year ended December 31, 2021 amounted to $803,933 for Class A shares. The Fund also has in effect distribution plans for Class C shares (Class C Plan) and Class R shares (Class R Plan) pursuant to Rule 12b-1 under the 1940 Act. Pursuant to the Class C Plan, the Fund pays EVD amounts equal to 0.75% per annum of its average daily net assets attributable to Class C shares for providing ongoing distribution services and facilities to the Fund. For the year ended December 31, 2021, the Fund paid or accrued to EVD $113,460 for Class C shares. The Class R Plan requires the Fund to pay EVD an amount up to 0.50% per annum of its average daily net assets attributable to Class R shares for providing ongoing distribution
| 19 |
Eaton Vance
Growth Fund
December 31, 2021
Notes to Financial Statements — continued
services and facilities to the Fund. The Trustees of the Trust have currently limited Class R distribution payments to 0.25% per annum of the average daily net assets attributable to Class R shares. For the year ended December 31, 2021, the Fund paid or accrued to EVD $8,182 for Class R shares.
Pursuant to the Class C and Class R Plans, the Fund also makes payments of service fees to EVD, financial intermediaries and other persons in amounts equal to 0.25% per annum of its average daily net assets attributable to that class. Service fees paid or accrued are for personal services and/or the maintenance of shareholder accounts. They are separate and distinct from the sales commissions and distribution fees payable to EVD. Service fees paid or accrued for the year ended December 31, 2021 amounted to $37,820 and $8,182 for Class C and Class R shares, respectively.
Distribution and service fees are subject to the limitations contained in the Financial Industry Regulatory Authority Rule 2341(d).
5 Contingent Deferred Sales Charges
A contingent deferred sales charge (CDSC) of 1% generally is imposed on redemptions of Class C shares made within 12 months of purchase. Class A shares may be subject to a 1% CDSC if redeemed within 18 months of purchase (depending on the circumstances of purchase). Generally, the CDSC is based upon the lower of the net asset value at date of redemption or date of purchase. No charge is levied on shares acquired by reinvestment of dividends or capital gain distributions. For the year ended December 31, 2021, the Fund was informed that EVD received less than $100 and approximately $1,000 of CDSCs paid by Class A and Class C shareholders, respectively.
6 Purchases and Sales of Investments
Purchases and sales of investments, other than short-term obligations, aggregated $89,593,784 and $120,338,071, respectively, for the year ended December 31, 2021.
7 Shares of Beneficial Interest
The Fund’s Declaration of Trust permits the Trustees to issue an unlimited number of full and fractional shares of beneficial interest (without par value). Such shares may be issued in a number of different series (such as the Fund) and classes. Transactions in Fund shares were as follows:
| Year Ended December 31, | ||||||||
| Class A | 2021 | 2020 | ||||||
Sales | 268,420 | 511,469 | ||||||
Issued to shareholders electing to receive payments of distributions in Fund shares | 620,171 | 534,226 | ||||||
Redemptions | (939,982 | ) | (1,262,698 | ) | ||||
Converted from Class C shares | 49,113 | 154,192 | ||||||
Net decrease | (2,278 | ) | (62,811 | ) | ||||
| Year Ended December 31, | ||||||||
| Class C | 2021 | 2020 | ||||||
Sales | 50,396 | 154,956 | ||||||
Issued to shareholders electing to receive payments of distributions in Fund shares | 48,586 | 52,354 | ||||||
Redemptions | (125,730 | ) | (218,580 | ) | ||||
Converted to Class A shares | (62,447 | ) | (191,968 | ) | ||||
Net decrease | (89,195 | ) | (203,238 | ) | ||||
| 20 |
Eaton Vance
Growth Fund
December 31, 2021
Notes to Financial Statements — continued
| Year Ended December 31, | ||||||||
| Class I | 2021 | 2020 | ||||||
Sales | 357,444 | 375,533 | ||||||
Issued to shareholders electing to receive payments of distributions in Fund shares | 178,358 | 143,692 | ||||||
Redemptions | (330,540 | ) | (557,146 | ) | ||||
Net increase (decrease) | 205,262 | (37,921 | ) | |||||
| Year Ended December 31, | ||||||||
| Class R | 2021 | 2020 | ||||||
Sales | 31,559 | 32,884 | ||||||
Issued to shareholders electing to receive payments of distributions in Fund shares | 6,342 | 4,960 | ||||||
Redemptions | (30,470 | ) | (48,717 | ) | ||||
Net increase (decrease) | 7,431 | (10,873 | ) | |||||
8 Line of Credit
The Fund participates with other portfolios and funds managed by EVM and its affiliates in an $800 million unsecured line of credit agreement with a group of banks, which is in effect through October 25, 2022. Borrowings are made by the Fund solely for temporary purposes related to redemptions and other short-term cash needs. Interest is charged to the Fund based on its borrowings at an amount above either the Secured Overnight Financing Rate (SOFR) or Federal Funds rate. In addition, a fee computed at an annual rate of 0.15% on the daily unused portion of the line of credit is allocated among the participating portfolios and funds at the end of each quarter. In connection with the renewal of the agreement in October 2021, an arrangement fee totaling $150,000 was incurred that was allocated to the participating portfolios and funds. Because the line of credit is not available exclusively to the Fund, it may be unable to borrow some or all of its requested amounts at any particular time. The Fund did not have any significant borrowings or allocated fees during the year ended December 31, 2021.
9 Securities Lending Agreement
The Fund has established a securities lending agreement with State Street Bank and Trust Company (SSBT) as securities lending agent in which the Fund lends portfolio securities to qualified borrowers in exchange for collateral consisting of either cash or securities issued or guaranteed by the U.S. government or its agencies or instrumentalities in an amount at least equal to the market value of the securities on loan. The market value of securities loaned is determined daily and any additional required collateral is delivered to the Fund on the next business day. Cash collateral is invested in the State Street Navigator Securities Lending Government Money Market Portfolio, a money market fund registered under the 1940 Act. The Fund earns interest on the amount invested but it must pay (and at times receive from) the broker a loan rebate fee computed as a varying percentage of the collateral received. For security loans secured by non-cash collateral, the Fund earns a negotiated lending fee from the borrower. A portion of the income earned by the Fund from its investment of cash collateral, net of rebate fees, and lending fees received is allocated to SSBT for its services as lending agent and the portion allocated to the Fund is presented as securities lending income, net on the Statement of Operations. Non-cash collateral is held by the lending agent on behalf of the Fund and cannot be sold or re-pledged by the Fund; accordingly, such collateral is not reflected in the Statement of Assets and Liabilities.
The Fund is subject to possible delay in the recovery of loaned securities. Pursuant to the securities lending agreement, SSBT has provided indemnification to the Fund in the event of default by a borrower with respect to a loan. The Fund bears the risk of loss with respect to the investment of cash collateral.
At December 31, 2021, the value of the securities loaned and the value of the collateral received, which exceeded the value of the securities loaned, amounted to $874,535 and $911,858, respectively. Collateral received was comprised of cash. The securities lending transactions have no contractual maturity date and each of the Fund and borrower has the option to terminate a loan at any time.
The following table provides a breakdown of securities lending transactions accounted for as secured borrowings, the obligations by class of collateral pledged, and the remaining contractual maturity of those transactions as of December 31, 2021.
| Remaining Contractual Maturity of the Transactions | ||||||||||||||||||||
| Overnight and Continuous | <30 days | 30 to 90 days | >90 days | Total | ||||||||||||||||
Common Stocks | $ | 911,858 | $ | — | $ | — | $ | — | $ | 911,858 | ||||||||||
| 21 |
Eaton Vance
Growth Fund
December 31, 2021
Notes to Financial Statements — continued
The carrying amount of the liability for collateral for securities loaned at December 31, 2021 approximated its fair value. If measured at fair value, such liability would have been considered as Level 2 in the fair value hierarchy (see Note 11) at December 31, 2021.
10 Investments in Affiliated Funds
At December 31, 2021, the value of the Fund’s investment in affiliated funds was $45,076, which represents less than 0.05% of the Fund’s net assets. Transactions in affiliated funds by the Fund for the year ended December 31, 2021 were as follows:
| Name | Value, beginning of period | Purchases | Sales proceeds | Net realized gain (loss) | Change in unrealized appreciation (depreciation) | Value, end of period | Dividend income | Units, end of period | ||||||||||||||||||||||||
Short-Term Investments |
| |||||||||||||||||||||||||||||||
Eaton Vance Cash Reserves Fund, LLC | $ | 514,520 | $ | 27,248,313 | $ | (27,717,707 | ) | $ | (50 | ) | $ | — | $ | 45,076 | $ | 747 | 45,081 | |||||||||||||||
11 Fair Value Measurements
Under generally accepted accounting principles for fair value measurements, a three-tier hierarchy to prioritize the assumptions, referred to as inputs, is used in valuation techniques to measure fair value. The three-tier hierarchy of inputs is summarized in the three broad levels listed below.
• Level 1 – quoted prices in active markets for identical investments
• Level 2 – other significant observable inputs (including quoted prices for similar investments, interest rates, prepayment speeds, credit risk, etc.)
• Level 3 – significant unobservable inputs (including a fund’s own assumptions in determining the fair value of investments)
In cases where the inputs used to measure fair value fall in different levels of the fair value hierarchy, the level disclosed is determined based on the lowest level input that is significant to the fair value measurement in its entirety. The inputs or methodology used for valuing securities are not necessarily an indication of the risk associated with investing in those securities.
At December 31, 2021, the hierarchy of inputs used in valuing the Fund’s investments, which are carried at value, were as follows:
| Asset Description | Level 1 | Level 2 | Level 3 | Total | ||||||||||||
Common Stocks | $ | 448,836,102 | * | $ | — | $ | — | $ | 448,836,102 | |||||||
Short-Term Investments — | ||||||||||||||||
Affiliated Fund | — | 45,076 | — | 45,076 | ||||||||||||
Securities Lending Collateral | 911,858 | — | — | 911,858 | ||||||||||||
Total Investments | $ | 449,747,960 | $ | 45,076 | $ | — | $ | 449,793,036 | ||||||||
| * | The level classification by major category of investments is the same as the category presentation in the Portfolio of Investments. |
12 Risks and Uncertainties
Pandemic Risk
An outbreak of respiratory disease caused by a novel coronavirus was first detected in China in late 2019 and subsequently spread internationally. This coronavirus has resulted in closing borders, enhanced health screenings, changes to healthcare service preparation and delivery, quarantines, cancellations, disruptions to supply chains and customer activity, as well as general concern and uncertainty. Health crises caused by outbreaks, such as the coronavirus outbreak, may exacerbate other pre-existing political, social and economic risks and disrupt normal market conditions and operations. The impact of this outbreak has negatively affected the worldwide economy, the economies of individual countries, individual companies, and the market in general, and may continue to do so in significant and unforeseen ways, as may other epidemics and pandemics that may arise in the future. Any such impact could adversely affect the Fund’s performance, or the performance of the securities in which the Fund invests.
| 22 |
Eaton Vance
Growth Fund
December 31, 2021
Report of Independent Registered Public Accounting Firm
To the Trustees of Eaton Vance Special Investment Trust and Shareholders of Eaton Vance Growth Fund:
Opinion on the Financial Statements and Financial Highlights
We have audited the accompanying statement of assets and liabilities of Eaton Vance Growth Fund (the “Fund”) (one of the funds constituting Eaton Vance Special Investment Trust), including the portfolio of investments, as of December 31, 2021, the related statement of operations for the year then ended, the statements of changes in net assets for each of the two years in the period then ended, the financial highlights for each of the five years in the period then ended, and the related notes. In our opinion, the financial statements and financial highlights present fairly, in all material respects, the financial position of the Fund as of December 31, 2021, and the results of its operations for the year then ended, the changes in its net assets for each of the two years in the period then ended, and the financial highlights for each of the five years in the period then ended, in conformity with accounting principles generally accepted in the United States of America.
Basis for Opinion
These financial statements and financial highlights are the responsibility of the Fund’s management. Our responsibility is to express an opinion on the Fund’s financial statements and financial highlights based on our audits. We are a public accounting firm registered with the Public Company Accounting Oversight Board (United States) (PCAOB) and are required to be independent with respect to the Fund in accordance with the U.S. federal securities laws and the applicable rules and regulations of the Securities and Exchange Commission and the PCAOB.
We conducted our audits in accordance with the standards of the PCAOB. Those standards require that we plan and perform the audit to obtain reasonable assurance about whether the financial statements and financial highlights are free of material misstatement, whether due to error or fraud. The Fund is not required to have, nor were we engaged to perform, an audit of its internal control over financial reporting. As part of our audits, we are required to obtain an understanding of internal control over financial reporting but not for the purpose of expressing an opinion on the effectiveness of the Fund’s internal control over financial reporting. Accordingly, we express no such opinion.
Our audits included performing procedures to assess the risks of material misstatement of the financial statements and financial highlights, whether due to error or fraud, and performing procedures that respond to those risks. Such procedures included examining, on a test basis, evidence regarding the amounts and disclosures in the financial statements and financial highlights. Our audits also included evaluating the accounting principles used and significant estimates made by management, as well as evaluating the overall presentation of the financial statements and financial highlights. Our procedures included confirmation of securities owned as of December 31, 2021, by correspondence with the custodian and brokers; when replies were not received from brokers, we performed other auditing procedures. We believe that our audits provide a reasonable basis for our opinion.
/s/ Deloitte & Touche LLP
Boston, Massachusetts
February 17, 2022
We have served as the auditor of one or more Eaton Vance investment companies since 1959.
| 23 |
Eaton Vance
Growth Fund
December 31, 2021
Federal Tax Information (Unaudited)
The Form 1099-DIV you received in February 2022 showed the tax status of all distributions paid to your account in calendar year 2021. Shareholders are advised to consult their own tax adviser with respect to the tax consequences of their investment in the Fund. As required by the Internal Revenue Code and/or regulations, shareholders must be notified regarding the status of qualified dividend income for individuals, the dividends received deduction for corporations and capital gains dividends.
Qualified Dividend Income. For the fiscal year ended December 31, 2021, the Fund designates approximately $3,125,722, or up to the maximum amount of such dividends allowable pursuant to the Internal Revenue Code, as qualified dividend income eligible for the reduced tax rate of 15%.
Dividends Received Deduction. Corporate shareholders are generally entitled to take the dividends received deduction on the portion of the Fund’s dividend distribution that qualifies under tax law. For the Fund’s fiscal 2021 ordinary income dividends, 100% qualifies for the corporate dividends received deduction.
Capital Gains Dividends. The Fund hereby designates as a capital gain dividend with respect to the taxable year ended December 31, 2021, $42,004,113 or, if subsequently determined to be different, the net capital gain of such year.
| 24 |
Eaton Vance
Growth Fund
December 31, 2021
Fund Management. The Trustees of Eaton Vance Special Investment Trust (the Trust) are responsible for the overall management and supervision of the Trust’s affairs. The Board members and officers of the Trust are listed below. Except as indicated, each individual has held the office shown or other offices in the same company for the last five years. Board members hold indefinite terms of office. Each Trustee holds office until his or her successor is elected and qualified, subject to a prior death, resignation, retirement, disqualification or removal. Under the terms of the Fund’s current Trustee retirement policy, an Independent Trustee must retire and resign as a Trustee on the earlier of: (i) the first day of July following his or her 74th birthday; or (ii), with limited exception, December 31st of the 20th year in which he or she has served as a Trustee. However, if such retirement and resignation would cause the Fund to be out of compliance with Section 16 of the 1940 Act or any other regulations or guidance of the SEC, then such retirement and resignation will not become effective until such time as action has been taken for the Fund to be in compliance therewith. The “noninterested Trustees” consist of those Trustees who are not “interested persons” of the Trust, as that term is defined under the 1940 Act. The business address of each Board member and officer is Two International Place, Boston, Massachusetts 02110. As used below, “BMR” refers to Boston Management and Research, “EVC” refers to Eaton Vance Corp., “EV” refers to EV LLC, “EVM” refers to Eaton Vance Management and “EVD” refers to Eaton Vance Distributors, Inc. EV is the trustee of each of EVM and BMR. Effective March 1, 2021, each of EVM, BMR, EVD and EV are indirect, wholly owned subsidiaries of Morgan Stanley. Each officer affiliated with EVM may hold a position with other EVM affiliates that is comparable to his or her position with EVM listed below. Each Trustee oversees 138 funds (with the exception of Messrs. Faust and Wennerholm and Ms. Frost who oversee 137 funds) in the Eaton Vance fund complex (including both funds and portfolios in a hub and spoke structure).
| Name and Year of Birth | Position(s) with the Trust | Length of Service | Principal Occupation(s) and Other Directorships During Past Five Years and Other Relevant Experience | |||
| Interested Trustee | ||||||
Thomas E. Faust Jr. 1958 | Trustee | Since 2007 | Chairman of Morgan Stanley Investment Management, Inc. (MSIM), member of the Board of Managers and President of EV, Chief Executive Officer of EVM and BMR, and Director of EVD. Formerly, Chairman, Chief Executive Officer and President of EVC. Mr. Faust is an interested person because of his positions with MSIM, BMR, EVM, EVD, and EV, which are affiliates of the Trust, and his former position with EVC, which was an affiliate of the Trust prior to March 1, 2021. Other Directorships. Formerly, Director of EVC (2007-2021) and Hexavest Inc. (investment management firm) (2012-2021). | |||
| Noninterested Trustees | ||||||
Mark R. Fetting 1954 | Trustee | Since 2016 | Private investor. Formerly held various positions at Legg Mason, Inc. (investment management firm) (2000-2012), including President, Chief Executive Officer, Director and Chairman (2008-2012), Senior Executive Vice President (2004-2008) and Executive Vice President (2001-2004). Formerly, President of Legg Mason family of funds (2001-2008). Formerly, Division President and Senior Officer of Prudential Financial Group, Inc. and related companies (investment management firm) (1991-2000). Other Directorships. None. | |||
Cynthia E. Frost 1961 | Trustee | Since 2014 | Private investor. Formerly, Chief Investment Officer of Brown University (university endowment) (2000-2012). Formerly, Portfolio Strategist for Duke Management Company (university endowment manager) (1995-2000). Formerly, Managing Director, Cambridge Associates (investment consulting company) (1989-1995). Formerly, Consultant, Bain and Company (management consulting firm) (1987-1989). Formerly, Senior Equity Analyst, BA Investment Management Company (1983-1985). Other Directorships. None. | |||
George J. Gorman 1952 | Chairperson of the Board and Trustee | Since 2021 (Chairperson) and 2014 (Trustee) | Principal at George J. Gorman LLC (consulting firm). Formerly, Senior Partner at Ernst & Young LLP (a registered public accounting firm) (1974-2009). Other Directorships. None. | |||
Valerie A. Mosley 1960 | Trustee | Since 2014 | Chairwoman and Chief Executive Officer of Valmo Ventures (a consulting and investment firm). Founder of Upward Wealth, Inc., dba BrightUP, a fintech platform. Formerly, Partner and Senior Vice President, Portfolio Manager and Investment Strategist at Wellington Management Company, LLP (investment management firm) (1992-2012). Formerly, Chief Investment Officer, PG Corbin Asset Management (1990-1992). Formerly worked in institutional corporate bond sales at Kidder Peabody (1986-1990). Other Directorships. Director of DraftKings, Inc. (digital sports entertainment and gaming company) (since September 2020). Director of Groupon, Inc. (e-commerce provider) (since April 2020). Director of Envestnet, Inc. (provider of intelligent systems for wealth management and financial wellness) (since 2018). Formerly, Director of Dynex Capital, Inc. (mortgage REIT) (2013-2020). | |||
| 25 |
Eaton Vance
Growth Fund
December 31, 2021
Management and Organization — continued
| Name and Year of Birth | Position(s) with the Trust | Length of Service | Principal Occupation(s) and Other Directorships During Past Five Years and Other Relevant Experience | |||
| Noninterested Trustees (continued) | ||||||
William H. Park 1947 | Trustee | Since 2003 | Private investor. Formerly, Consultant (management and transactional) (2012-2014). Formerly, Chief Financial Officer, Aveon Group L.P. (investment management firm) (2010-2011). Formerly, Vice Chairman, Commercial Industrial Finance Corp. (specialty finance company) (2006-2010). Formerly, President and Chief Executive Officer, Prizm Capital Management, LLC (investment management firm) (2002-2005). Formerly, Executive Vice President and Chief Financial Officer, United Asset Management Corporation (investment management firm) (1982-2001). Formerly, Senior Manager, Price Waterhouse (now PricewaterhouseCoopers) (a registered public accounting firm) (1972-1981). Other Directorships. None. | |||
Helen Frame Peters 1948 | Trustee | Since 2008 | Professor of Finance, Carroll School of Management, Boston College. Formerly, Dean, Carroll School of Management, Boston College (2000-2002). Formerly, Chief Investment Officer, Fixed Income, Scudder Kemper Investments (investment management firm) (1998-1999). Formerly, Chief Investment Officer, Equity and Fixed Income, Colonial Management Associates (investment management firm) (1991-1998). Other Directorships. None. | |||
Keith Quinton 1958 | Trustee | Since 2018 | Private investor, researcher and lecturer. Formerly, Independent Investment Committee Member at New Hampshire Retirement System (2017-2021). Formerly, Portfolio Manager and Senior Quantitative Analyst at Fidelity Investments (investment management firm) (2001-2014). Other Directorships. Formerly, Director (2016-2021) and Chairman (2019-2021) of New Hampshire Municipal Bond Bank. | |||
Marcus L. Smith 1966 | Trustee | Since 2018 | Private investor. Formerly, Portfolio Manager at MFS Investment Management (investment management firm) (1994-2017). Other Directorships. Director of First Industrial Realty Trust, Inc. (an industrial REIT) (since 2021). Director of MSCI Inc. (global provider of investment decision support tools) (since 2017). Formerly, Director of DCT Industrial Trust Inc. (logistics real estate company) (2017-2018). | |||
Susan J. Sutherland 1957 | Trustee | Since 2015 | Private investor. Director of Ascot Group Limited and certain of its subsidiaries (insurance and reinsurance) (since 2017). Formerly, Director of Hagerty Holding Corp. (insurance) (2015-2018) and Montpelier Re Holdings Ltd. (insurance and reinsurance) (2013-2015). Formerly, Associate, Counsel and Partner at Skadden, Arps, Slate, Meagher & Flom LLP (law firm) (1982-2013). Other Directorships. Director of Kairos Acquisition Corp. (insurance/InsurTech acquisition company) (since 2021). | |||
Scott E. Wennerholm 1959 | Trustee | Since 2016 | Private investor. Formerly, Trustee at Wheelock College (postsecondary institution) (2012-2018). Formerly, Consultant at GF Parish Group (executive recruiting firm) (2016-2017). Formerly, Chief Operating Officer and Executive Vice President at BNY Mellon Asset Management (investment management firm) (2005-2011). Formerly, Chief Operating Officer and Chief Financial Officer at Natixis Global Asset Management (investment management firm) (1997-2004). Formerly, Vice President at Fidelity Investments Institutional Services (investment management firm) (1994-1997). Other Directorships. None. | |||
| Name and Year of Birth | Position(s) with the Trust | Length of Service | Principal Occupation(s) During Past Five Years | |||
| Principal Officers who are not Trustees | ||||||
Eric A. Stein 1980 | President | Since 2020 | Vice President and Chief Investment Officer, Fixed Income of EVM and BMR. Prior to November 1, 2020, Mr. Stein was a co-Director of Eaton Vance’s Global Income Investments. Also Vice President of Calvert Research and Management (“CRM”). | |||
Deidre E. Walsh 1971 | Vice President and Chief Legal Officer | Since 2009 | Vice President of EVM and BMR. Also Vice President of CRM. | |||
| 26 |
Eaton Vance
Growth Fund
December 31, 2021
Management and Organization — continued
| Name and Year of Birth | Position(s) with the Trust | Length of Service | Principal Occupation(s) During Past Five Years | |||
| Principal Officers who are not Trustees (continued) | ||||||
James F. Kirchner 1967 | Treasurer | Since 2007 | Vice President of EVM and BMR. Also Vice President of CRM. | |||
Jill R. Damon 1984 | Secretary | Since 2022 | Vice President of EVM and BMR since 2017. Formerly, associate at Dechert LLP (2009-2017). | |||
Richard F. Froio 1968 | Chief Compliance Officer | Since 2017 | Vice President of EVM and BMR since 2017. Formerly, Deputy Chief Compliance Officer (Adviser/Funds) and Chief Compliance Officer (Distribution) at PIMCO (2012-2017) and Managing Director at BlackRock/Barclays Global Investors (2009-2012). | |||
The SAI for the Fund includes additional information about the Trustees and officers of the Trust and can be obtained without charge on Eaton Vance’s website at www.eatonvance.com or by calling 1-800-262-1122.
| 27 |
Eaton Vance Funds
| Privacy Notice | April 2021 |
| FACTS | WHAT DOES EATON VANCE DO WITH YOUR PERSONAL INFORMATION? | |
| Why? | Financial companies choose how they share your personal information. Federal law gives consumers the right to limit some but not all sharing. Federal law also requires us to tell you how we collect, share, and protect your personal information. Please read this notice carefully to understand what we do. | |
| What? | The types of personal information we collect and share depend on the product or service you have with us. This information can include:
∎ Social Security number and income ∎ investment experience and risk tolerance ∎ checking account number and wire transfer instructions | |
| How? | All financial companies need to share customers’ personal information to run their everyday business. In the section below, we list the reasons financial companies can share their customers’ personal information; the reasons Eaton Vance chooses to share; and whether you can limit this sharing. | |
| Reasons we can share your personal information | Does Eaton Vance share? | Can you limit this sharing? | ||
| For our everyday business purposes — such as to process your transactions, maintain your account(s), respond to court orders and legal investigations, or report to credit bureaus | Yes | No | ||
| For our marketing purposes — to offer our products and services to you | Yes | No | ||
| For joint marketing with other financial companies | No | We don’t share | ||
| For our investment management affiliates’ everyday business purposes — information about your transactions, experiences, and creditworthiness | Yes | Yes | ||
| For our affiliates’ everyday business purposes — information about your transactions and experiences | Yes | No | ||
| For our affiliates’ everyday business purposes — information about your creditworthiness | No | We don’t share | ||
| For our investment management affiliates to market to you | Yes | Yes | ||
| For our affiliates to market to you | No | We don’t share | ||
| For nonaffiliates to market to you | No | We don’t share |
| To limit our sharing | Call toll-free 1-800-262-1122 or email: EVPrivacy@eatonvance.com
Please note:
If you are a new customer, we can begin sharing your information 30 days from the date we sent this notice. When you are no longer our customer, we continue to share your information as described in this notice. However, you can contact us at any time to limit our sharing. | |
| Questions? | Call toll-free 1-800-262-1122 or email: EVPrivacy@eatonvance.com | |
| 28 |
Eaton Vance Funds
| Privacy Notice — continued | April 2021 |
| Page 2 |
| Who we are | ||
| Who is providing this notice? | Eaton Vance Management, Eaton Vance Distributors, Inc., Eaton Vance Trust Company, Eaton Vance Management (International) Limited, Eaton Vance Advisers International Ltd., Eaton Vance Global Advisors Limited, Eaton Vance Management’s Real Estate Investment Group, Boston Management and Research, Calvert Research and Management, Eaton Vance and Calvert Fund Families and our investment advisory affiliates (“Eaton Vance”) (see Investment Management Affiliates definition below) | |
| What we do | ||
| How does Eaton Vance protect my personal information? | To protect your personal information from unauthorized access and use, we use security measures that comply with federal law. These measures include computer safeguards and secured files and buildings. We have policies governing the proper handling of customer information by personnel and requiring third parties that provide support to adhere to appropriate security standards with respect to such information. | |
| How does Eaton Vance collect my personal information? | We collect your personal information, for example, when you
∎ open an account or make deposits or withdrawals from your account ∎ buy securities from us or make a wire transfer ∎ give us your contact information
We also collect your personal information from others, such as credit bureaus, affiliates, or other companies. | |
| Why can’t I limit all sharing? | Federal law gives you the right to limit only
∎ sharing for affiliates’ everyday business purposes — information about your creditworthiness ∎ affiliates from using your information to market to you ∎ sharing for nonaffiliates to market to you
State laws and individual companies may give you additional rights to limit sharing. See below for more on your rights under state law. | |
| Definitions | ||
| Investment Management Affiliates | Eaton Vance Investment Management Affiliates include registered investment advisers, registered broker-dealers, and registered and unregistered funds. Investment Management Affiliates does not include entities associated with Morgan Stanley Wealth Management, such as Morgan Stanley Smith Barney LLC and Morgan Stanley & Co. | |
| Affiliates | Companies related by common ownership or control. They can be financial and nonfinancial companies.
∎ Our affiliates include companies with a Morgan Stanley name and financial companies such as Morgan Stanley Smith Barney LLC and Morgan Stanley & Co. | |
| Nonaffiliates | Companies not related by common ownership or control. They can be financial and nonfinancial companies.
∎ Eaton Vance does not share with nonaffiliates so they can market to you. | |
| Joint marketing | A formal agreement between nonaffiliated financial companies that together market financial products or services to you.
∎ Eaton Vance doesn’t jointly market. | |
| Other important information | ||
Vermont: Except as permitted by law, we will not share personal information we collect about Vermont residents with Nonaffiliates unless you provide us with your written consent to share such information.
California: Except as permitted by law, we will not share personal information we collect about California residents with Nonaffiliates and we will limit sharing such personal information with our Affiliates to comply with California privacy laws that apply to us. | ||
| 29 |
Eaton Vance Funds
Delivery of Shareholder Documents. The Securities and Exchange Commission (SEC) permits funds to deliver only one copy of shareholder documents, including prospectuses, proxy statements and shareholder reports, to fund investors with multiple accounts at the same residential or post office box address. This practice is often called “householding” and it helps eliminate duplicate mailings to shareholders. Eaton Vance, or your financial intermediary, may household the mailing of your documents indefinitely unless you instruct Eaton Vance, or your financial intermediary, otherwise. If you would prefer that your Eaton Vance documents not be householded, please contact Eaton Vance at 1-800-262-1122, or contact your financial intermediary. Your instructions that householding not apply to delivery of your Eaton Vance documents will typically be effective within 30 days of receipt by Eaton Vance or your financial intermediary.
Portfolio Holdings. Each Eaton Vance Fund and its underlying Portfolio(s) (if applicable) files a schedule of portfolio holdings on Part F to Form N-PORT with the SEC. Certain information filed on Form N-PORT may be viewed on the Eaton Vance website at www.eatonvance.com, by calling Eaton Vance at 1-800-262-1122 or in the EDGAR database on the SEC’s website at www.sec.gov.
Proxy Voting. From time to time, funds are required to vote proxies related to the securities held by the funds. The Eaton Vance Funds or their underlying Portfolios (if applicable) vote proxies according to a set of policies and procedures approved by the Funds’ and Portfolios’ Boards. You may obtain a description of these policies and procedures and information on how the Funds or Portfolios voted proxies relating to portfolio securities during the most recent 12-month period ended June 30, without charge, upon request, by calling 1-800-262-1122 and by accessing the SEC’s website at www.sec.gov.
| 30 |
This Page Intentionally Left Blank
This Page Intentionally Left Blank
Investment Adviser
Boston Management and Research
Two International Place
Boston, MA 02110
Administrator
Eaton Vance Management
Two International Place
Boston, MA 02110
Principal Underwriter*
Eaton Vance Distributors, Inc.
Two International Place
Boston, MA 02110
(617) 482-8260
Custodian
State Street Bank and Trust Company
State Street Financial Center, One Lincoln Street
Boston, MA 02111
Transfer Agent
BNY Mellon Investment Servicing (US) Inc.
Attn: Eaton Vance Funds
P.O. Box 9653
Providence, RI 02940-9653
(800) 262-1122
Independent Registered Public Accounting Firm
Deloitte & Touche LLP
200 Berkeley Street
Boston, MA 02116-5022
Fund Offices
Two International Place
Boston, MA 02110
| * | FINRA BrokerCheck. Investors may check the background of their Investment Professional by contacting the Financial Industry Regulatory Authority (FINRA). FINRA BrokerCheck is a free tool to help investors check the professional background of current and former FINRA-registered securities firms and brokers. FINRA BrokerCheck is available by calling 1-800-289-9999 and at www.FINRA.org. The FINRA BrokerCheck brochure describing this program is available to investors at www.FINRA.org. |
1559 12.31.21

Eaton Vance
Large-Cap Value Fund
Annual Report
December 31, 2021

Commodity Futures Trading Commission Registration. The Commodity Futures Trading Commission (“CFTC”) has adopted regulations that subject registered investment companies and advisers to regulation by the CFTC if a fund invests more than a prescribed level of its assets in certain CFTC-regulated instruments (including futures, certain options and swap agreements) or markets itself as providing investment exposure to such instruments. The investment adviser has claimed an exclusion from the definition of “commodity pool operator” under the Commodity Exchange Act with respect to its management of the Fund. Accordingly, neither the Fund nor the adviser with respect to the operation of the Fund is subject to CFTC regulation. Because of its management of other strategies, the Fund’s adviser is registered with the CFTC as a commodity pool operator. The adviser is also registered as a commodity trading advisor.
Fund shares are not insured by the FDIC and are not deposits or other obligations of, or guaranteed by, any depository institution. Shares are subject to investment risks, including possible loss of principal invested.
This report must be preceded or accompanied by a current summary prospectus or prospectus. Before investing, investors should consider carefully the investment objective, risks, and charges and expenses of a mutual fund. This and other important information is contained in the summary prospectus and prospectus, which can be obtained from a financial intermediary. Prospective investors should read the prospectus carefully before investing. For further information, please call 1-800-262-1122.
Annual Report December 31, 2021
Eaton Vance
Large-Cap Value Fund
| 2 | ||||
| 4 | ||||
| 5 | ||||
| 6 | ||||
| 7 | ||||
| 8 | ||||
| 26 | ||||
| 27 | ||||
| 28 | ||||
| 31 | ||||
| 33 |
Eaton Vance
Large-Cap Value Fund
December 31, 2021
Management’s Discussion of Fund Performance1
Economic and Market Conditions
The 12-month period starting January 1, 2021, was notable for a U.S. equity rally that lasted for most of the period and resulted in U.S. stocks outperforming most other stock markets in developed economies. Except for temporary retreats in September and November, broad-market indexes generally posted strong returns during the period. Investors cheered the reopening of businesses that had been affected by the pandemic and the rollout of several highly effective COVID-19 vaccines.
COVID-19, however, continued to have a firm grip on the U.S. economy. Disease rates advanced and declined with second, third, and fourth waves of infections. Worker shortages led to global supply-chain disruptions. From computer chips to shipping containers, scarcities of key items led to temporary factory shutdowns and empty store shelves. Those shortages — combined with high demand from consumers eager to spend money saved earlier in the pandemic — led to higher year-over-year inflation than the U.S. had seen in decades.
Still, investor optimism about a recovering economy drove stock prices up during most of the period. A significant pullback, however, occurred in September 2021 when virtually every major U.S. stock index reported negative returns. Unexpectedly weak job creation in August and the U.S. Federal Reserve’s (the Fed’s) announcement that it might soon begin tapering its monthly bond purchases — which had stimulated the economy earlier — combined to drive stocks into negative territory. Rising COVID-19 infections also weighed on equity performance in September.
In the final quarter of 2021, however, stock prices came roaring back. Even the late-November news of a new and more transmissible COVID-19 variant — Omicron — caused only a temporary market retreat. The Fed’s actions to tamp down inflation were applauded by investors, with stocks gaining ground after the central bank announced that tapering would be accelerated and that three possible interest rate hikes were forecast for 2022. Just two trading days before year-end, the S&P 500® Index closed at its 70th new all-time high for the period, and the Dow Jones Industrial Average® (DJIA) closed at an all-time high as well.
For the period as a whole, the broad-market S&P 500® Index returned 28.71%; the blue-chip DJIA was up 20.95%; and the technology-laden Nasdaq Composite Index rose 22.18%. Large-cap U.S. stocks, as measured by the Russell 1000® Index, outperformed their small-cap counterparts, as measured by the Russell 2000® Index. In the large-cap space, growth stocks modestly outperformed value stocks, but in the small-cap space, value stocks strongly outperformed growth stocks during the period.
Fund Performance
For the 12-month period ended December 31, 2021, Eaton Vance Large-Cap Value Fund (the Fund) returned 24.29% for Class A shares at net asset value (NAV), underperforming its benchmark, the Russell 1000® Value Index (the Index), which returned 25.16%.
During the period, detractors from Fund performance versus the Index included stock selections in the information technology (IT) and health care sectors, as well as stock selections and an overweight position relative to the Index in the utilities sector.
In the IT sector, an overweight position in Fidelity National Information Services, Inc. (Fidelity National) — a provider of payment and credit card processing services to banks and businesses — hurt returns relative to the Index. Although Fidelity National delivered solid earnings during the period, its stock price declined on investor concerns about increasing competition in the payment processing industry, as well as pandemic headwinds for some of the firm’s key markets, including travel and entertainment.
Elsewhere in the IT sector, the Fund’s overweight position in Cognizant Technology Solutions Corp. (Cognizant), a provider of IT consulting and outsourcing, declined in price during the period. Although Cognizant delivered solid revenue and earnings growth during the first quarter of 2021, employee attrition related to COVID-19 in India, where the majority of the firm’s employees are located, weighed on Cognizant’s stock performance. By period-end, Cognizant was sold from the Fund.
In the health care sector, the Fund’s out-of-Index position in LHC Group, Inc. (LHC) declined in price. LHC, which provides hospice, home care, and facility-based care for post-acute-care patients, was negatively impacted by pandemic-related labor supply challenges and high labor costs. By period-end, LHC was sold from the Fund
In contrast, stock selections in the communication services and industrials sectors contributed to Fund performance versus the Index, as did stock selections and an underweight position in the financials sector. In the communication services sector, the Fund’s overweight position in Alphabet, Inc. (Alphabet), parent company of search engine Google, performed strongly as positive e-commerce trends drove increased demand for search engine advertising and engagement.
See Endnotes and Additional Disclosures in this report.
Past performance is no guarantee of future results. Returns are historical and are calculated by determining the percentage change in net asset value (NAV) or offering price (as applicable) with all distributions reinvested. Investment return and principal value will fluctuate so that shares, when redeemed, may be worth more or less than their original cost. Performance for periods less than or equal to one year is cumulative. Performance is for the stated time period only; due to market volatility, current Fund performance may be lower or higher than the quoted return. For performance as of the most recent month-end, please refer to eatonvance.com.
| 2 |
Eaton Vance
Large-Cap Value Fund
December 31, 2021
Management’s Discussion of Fund Performance1 — continued
In the industrials sector, the Fund’s overweight position in Johnson Controls International PLC (Johnson Controls) — a manufacturer of fire protection, HVAC, and security equipment for buildings — rose in price after the firm delivered strong first-quarter 2021 earnings. Pandemic-related sales opportunities in the indoor air quality market and the company’s focus on controlling costs and improving earnings quality were additional drivers of Johnson Controls’ stock price during the period.
Significant contributors to relative performance in other sectors included an overweight position in EOG Resources, Inc. (EOG), an oil and gas exploration and production company in the energy sector. EOG’s stock price rose as demand for crude oil recovered from a deep slump early in the pandemic, and as the firm generated significant free cash flow and increased its stock dividend during the period.
See Endnotes and Additional Disclosures in this report.
Past performance is no guarantee of future results. Returns are historical and are calculated by determining the percentage change in net asset value (NAV) or offering price (as applicable) with all distributions reinvested. Investment return and principal value will fluctuate so that shares, when redeemed, may be worth more or less than their original cost. Performance for periods less than or equal to one year is cumulative. Performance is for the stated time period only; due to market volatility, current Fund performance may be lower or higher than the quoted return. For performance as of the most recent month-end, please refer to eatonvance.com.
| 3 |
Eaton Vance
Large-Cap Value Fund
December 31, 2021
Portfolio Manager(s) Edward J. Perkin, CFA, Aaron S. Dunn, CFA and Bradley T. Galko, CFA
| % Average Annual Total Returns | Class Inception Date | Performance Inception Date | One Year | Five Years | Ten Years | |||||||||||||||
Class A at NAV | 09/23/1931 | 09/23/1931 | 24.29 | % | 12.03 | % | 12.25 | % | ||||||||||||
Class A with 5.75% Maximum Sales Charge | — | — | 17.15 | 10.71 | 11.58 | |||||||||||||||
Class C at NAV | 11/04/1994 | 09/23/1931 | 23.39 | 11.20 | 11.58 | |||||||||||||||
Class C with 1% Maximum Sales Charge | — | — | 22.39 | 11.20 | 11.58 | |||||||||||||||
Class I at NAV | 12/28/2004 | 09/23/1931 | 24.64 | 12.32 | 12.53 | |||||||||||||||
Class R at NAV | 02/18/2004 | 09/23/1931 | 24.01 | 11.76 | 11.97 | |||||||||||||||
Class R6 at NAV | 07/01/2014 | 09/23/1931 | 24.69 | 12.40 | 12.60 | |||||||||||||||
| ||||||||||||||||||||
Russell 1000® Value Index | — | — | 25.16 | % | 11.16 | % | 12.96 | % | ||||||||||||
| % Total Annual Operating Expense Ratios4 | Class A | Class C | Class I | Class R | Class R6 | |||||||||||||||
| 1.04 | % | 1.79 | % | 0.79 | % | 1.29 | % | 0.72 | % | |||||||||||
Growth of $10,000
This graph shows the change in value of a hypothetical investment of $10,000 in Class A of the Fund for the period indicated. For comparison, the same investment is shown in the indicated index.
| Growth of Investment3 | Amount Invested | Period Beginning | At NAV | With Maximum Sales Charge | ||||||||||||
Class C | $10,000 | 12/31/2011 | $29,945 | N.A. | ||||||||||||
Class I | $250,000 | 12/31/2011 | $814,873 | N.A. | ||||||||||||
Class R | $10,000 | 12/31/2011 | $31,011 | N.A. | ||||||||||||
Class R6 | $1,000,000 | 12/31/2011 | $3,278,887 | N.A. | ||||||||||||
See Endnotes and Additional Disclosures in this report.
Past performance is no guarantee of future results. Returns are historical and are calculated by determining the percentage change in net asset value (NAV) or offering price (as applicable) with all distributions reinvested. Investment return and principal value will fluctuate so that shares, when redeemed, may be worth more or less than their original cost. Performance for periods less than or equal to one year is cumulative. Performance is for the stated time period only; due to market volatility, current Fund performance may be lower or higher than the quoted return. For performance as of the most recent month-end, please refer to eatonvance.com.
| 4 |
Eaton Vance
Large-Cap Value Fund
December 31, 2021
Sector Allocation (% of net assets)5
Top 10 Holdings (% of net assets)5
UnitedHealth Group, Inc. | 3.4 | % | ||
Thermo Fisher Scientific, Inc. | 3.1 | |||
Procter & Gamble Co. (The) | 3.1 | |||
Wells Fargo & Co. | 3.0 | |||
Johnson & Johnson | 3.0 | |||
Alphabet, Inc., Class A | 2.9 | |||
Charles Schwab Corp. (The) | 2.9 | |||
American International Group, Inc. | 2.5 | |||
Walt Disney Co. (The) | 2.4 | |||
Verizon Communications, Inc. | 2.3 | |||
Total | 28.6 | % | ||
See Endnotes and Additional Disclosures in this report.
| 5 |
Eaton Vance
Large-Cap Value Fund
December 31, 2021
Endnotes and Additional Disclosures
| 1 | The views expressed in this report are those of the portfolio manager(s) and are current only through the date stated at the top of this page. These views are subject to change at any time based upon market or other conditions, and Eaton Vance and the Fund(s) disclaim any responsibility to update such views. These views may not be relied upon as investment advice and, because investment decisions are based on many factors, may not be relied upon as an indication of trading intent on behalf of any Eaton Vance fund. This commentary may contain statements that are not historical facts, referred to as “forward-looking statements.” The Fund’s actual future results may differ significantly from those stated in any forward-looking statement, depending on factors such as changes in securities or financial markets or general economic conditions, the volume of sales and purchases of Fund shares, the continuation of investment advisory, administrative and service contracts, and other risks discussed from time to time in the Fund’s filings with the Securities and Exchange Commission. |
| 2 | Russell 1000® Value Index is an unmanaged index of U.S. large-cap value stocks. Unless otherwise stated, index returns do not reflect the effect of any applicable sales charges, commissions, expenses, taxes or leverage, as applicable. It is not possible to invest directly in an index. |
| 3 | Total Returns at NAV do not include applicable sales charges. If sales charges were deducted, the returns would be lower. Total Returns shown with maximum sales charge reflect the stated maximum sales charge. Unless otherwise stated, performance does not reflect the deduction of taxes on Fund distributions or redemptions of Fund shares. |
Effective November 5, 2020, Class C shares automatically convert to Class A shares eight years after purchase. The average annual total returns listed for Class C reflect conversion to Class A shares after eight years. Prior to November 5, 2020, Class C shares automatically converted to Class A shares ten years after purchase.
Performance prior to the inception date of a class may be linked to the performance of an older class of the Fund. This linked performance is adjusted for any applicable sales charge, but is not adjusted for class expense differences. If adjusted for such differences, the performance would be different. The performance of Class R6 is linked to Class I. Performance presented in the Financial Highlights included in the financial statements is not linked.
| 4 | Source: Fund prospectus. The expense ratios for the current reporting period can be found in the Financial Highlights section of this report. |
| 5 | Excludes cash and cash equivalents. |
Fund profile subject to change due to active management.
Additional Information
S&P 500® Index is an unmanaged index of large-cap stocks commonly used as a measure of U.S. stock market performance. Dow Jones Industrial Average® is a price-weighted average of 30 blue-chip stocks that are generally the leaders in their industry. S&P Dow Jones Indices are a product of S&P Dow Jones Indices LLC (“S&P DJI”) and have been licensed for use. S&P® and S&P 500® are registered trademarks of S&P DJI; Dow Jones® is a registered trademark of Dow Jones Trademark Holdings LLC (“Dow Jones”); S&P DJI, Dow Jones and their respective affiliates do not sponsor, endorse, sell or promote the Fund, will not have any liability with respect thereto and do not have any liability for any errors, omissions, or interruptions of the S&P Dow Jones Indices. Nasdaq Composite Index is a market capitalization-weighted index of all domestic and international securities listed on Nasdaq. Source: Nasdaq, Inc. The information is provided by Nasdaq (with its affiliates, are referred to as the “Corporations”) and Nasdaq’s third party licensors on an “as is” basis and the Corporations make no guarantees and bear no liability of any kind with respect to the information or the Fund. Russell 1000® Index is an unmanaged index of 1,000 U.S. large-cap stocks. Russell 2000® Index is an unmanaged index of 2,000 U.S. small-cap stocks.
| 6 |
Eaton Vance
Large-Cap Value Fund
December 31, 2021
Example: As a Fund shareholder, you incur two types of costs: (1) transaction costs, including sales charges (loads) on purchases and redemption fees (if applicable); and (2) ongoing costs, including management fees; distribution and/or service fees; and other Fund expenses. This Example is intended to help you understand your ongoing costs (in dollars) of Fund investing and to compare these costs with the ongoing costs of investing in other mutual funds. The Example is based on an investment of $1,000 invested at the beginning of the period and held for the entire period (July 1, 2021 – December 31, 2021).
Actual Expenses: The first section of the table below provides information about actual account values and actual expenses. You may use the information in this section, together with the amount you invested, to estimate the expenses that you paid over the period. Simply divide your account value by $1,000 (for example, an $8,600 account value divided by $1,000 = 8.6), then multiply the result by the number in the first section under the heading entitled “Expenses Paid During Period” to estimate the expenses you paid on your account during this period.
Hypothetical Example for Comparison Purposes: The second section of the table below provides information about hypothetical account values and hypothetical expenses based on the actual Fund expense ratio and an assumed rate of return of 5% per year (before expenses), which is not the actual Fund return. The hypothetical account values and expenses may not be used to estimate the actual ending account balance or expenses you paid for the period. You may use this information to compare the ongoing costs of investing in your Fund and other funds. To do so, compare this 5% hypothetical example with the 5% hypothetical examples that appear in the shareholder reports of the other funds.
Please note that the expenses shown in the table are meant to highlight your ongoing costs only and do not reflect any transactional costs, such as sales charges (loads) or redemption fees (if applicable). Therefore, the second section of the table is useful in comparing ongoing costs only, and will not help you determine the relative total costs of owning different funds. In addition, if these transactional costs were included, your costs would be higher.
| Beginning Account Value (7/1/21) | Ending Account Value (12/31/21) | Expenses Paid During Period* (7/1/21 – 12/31/21) | Annualized Expense Ratio | |||||||||||||
Actual | ||||||||||||||||
Class A | $ | 1,000.00 | $ | 1,071.30 | $ | 5.27 | 1.01 | % | ||||||||
Class C | $ | 1,000.00 | $ | 1,067.70 | $ | 9.17 | 1.76 | % | ||||||||
Class I | $ | 1,000.00 | $ | 1,072.80 | $ | 3.97 | 0.76 | % | ||||||||
Class R | $ | 1,000.00 | $ | 1,070.60 | $ | 6.58 | 1.26 | % | ||||||||
Class R6 | $ | 1,000.00 | $ | 1,073.50 | $ | 3.66 | 0.70 | % | ||||||||
Hypothetical | ||||||||||||||||
(5% return per year before expenses) | ||||||||||||||||
Class A | $ | 1,000.00 | $ | 1,020.11 | $ | 5.14 | 1.01 | % | ||||||||
Class C | $ | 1,000.00 | $ | 1,016.33 | $ | 8.94 | 1.76 | % | ||||||||
Class I | $ | 1,000.00 | $ | 1,021.37 | $ | 3.87 | 0.76 | % | ||||||||
Class R | $ | 1,000.00 | $ | 1,018.85 | $ | 6.41 | 1.26 | % | ||||||||
Class R6 | $ | 1,000.00 | $ | 1,021.68 | $ | 3.57 | 0.70 | % | ||||||||
| * | Expenses are equal to the Fund’s annualized expense ratio for the indicated Class, multiplied by the average account value over the period, multiplied by 184/365 (to reflect the one-half year period). The Example assumes that the $1,000 was invested at the net asset value per share determined at the close of business on June 30, 2021. |
| 7 |
Eaton Vance
Large-Cap Value Fund
December 31, 2021
| Common Stocks — 99.6% |
| |||||||
| Security | Shares | Value | ||||||
| Aerospace & Defense — 2.4% | ||||||||
Hexcel Corp.(1) | 326,943 | $ | 16,935,647 | |||||
Huntington Ingalls Industries, Inc. | 132,505 | 24,743,984 | ||||||
| $ | 41,679,631 | |||||||
| Air Freight & Logistics — 1.9% | ||||||||
C.H. Robinson Worldwide, Inc. | 307,567 | $ | 33,103,436 | |||||
| $ | 33,103,436 | |||||||
| Automobiles — 1.2% | ||||||||
General Motors Co.(1) | 334,258 | $ | 19,597,547 | |||||
| $ | 19,597,547 | |||||||
| Banks — 6.7% | ||||||||
KeyCorp | 1,261,025 | $ | 29,167,508 | |||||
M&T Bank Corp. | 216,500 | 33,250,070 | ||||||
Truist Financial Corp. | 1,029 | 60,248 | ||||||
Wells Fargo & Co. | 1,082,560 | 51,941,229 | ||||||
| $ | 114,419,055 | |||||||
| Beverages — 2.3% | ||||||||
Constellation Brands, Inc., Class A | 50,157 | $ | 12,587,902 | |||||
PepsiCo, Inc. | 156,393 | 27,167,028 | ||||||
| $ | 39,754,930 | |||||||
| Biotechnology — 2.7% | ||||||||
AbbVie, Inc. | 188,184 | $ | 25,480,114 | |||||
Neurocrine Biosciences, Inc.(1) | 234,194 | 19,946,303 | ||||||
| $ | 45,426,417 | |||||||
| Building Products — 1.5% | ||||||||
Johnson Controls International PLC | 323,849 | $ | 26,332,162 | |||||
| $ | 26,332,162 | |||||||
| Capital Markets — 5.4% | ||||||||
Charles Schwab Corp. (The) | 588,172 | $ | 49,465,265 | |||||
Goldman Sachs Group, Inc. (The) | 82,817 | 31,681,644 | ||||||
State Street Corp. | 122,725 | 11,413,425 | ||||||
| $ | 92,560,334 | |||||||
| Chemicals — 1.5% | ||||||||
FMC Corp. | 231,367 | $ | 25,424,920 | |||||
| $ | 25,424,920 | |||||||
| Security | Shares | Value | ||||||
| Communications Equipment — 2.1% | ||||||||
Cisco Systems, Inc. | 567,901 | $ | 35,987,886 | |||||
| $ | 35,987,886 | |||||||
| Containers & Packaging — 1.4% | ||||||||
Packaging Corp. of America | 170,944 | $ | 23,274,026 | |||||
| $ | 23,274,026 | |||||||
| Diversified Telecommunication Services — 2.3% | ||||||||
Verizon Communications, Inc. | 763,164 | $ | 39,654,001 | |||||
| $ | 39,654,001 | |||||||
| Electric Utilities — 3.5% | ||||||||
Edison International | 462,514 | $ | 31,566,580 | |||||
NextEra Energy, Inc. | 296,724 | 27,702,153 | ||||||
| $ | 59,268,733 | |||||||
| Electrical Equipment — 1.6% | ||||||||
Eaton Corp. PLC | 162,572 | $ | 28,095,693 | |||||
| $ | 28,095,693 | |||||||
| Entertainment — 2.4% | ||||||||
Walt Disney Co. (The)(1) | 269,559 | $ | 41,751,994 | |||||
| $ | 41,751,994 | |||||||
| Equity Real Estate Investment Trusts (REITs) — 5.2% | ||||||||
EastGroup Properties, Inc. | 101,797 | $ | 23,194,446 | |||||
Healthpeak Properties, Inc. | 415,166 | 14,983,341 | ||||||
Invitation Homes, Inc. | 571,247 | 25,900,339 | ||||||
Mid-America Apartment Communities, Inc. | 106,067 | 24,336,013 | ||||||
| $ | 88,414,139 | |||||||
| Food Products — 1.4% | ||||||||
Mondelez International, Inc., Class A | 359,594 | $ | 23,844,678 | |||||
| $ | 23,844,678 | |||||||
| Health Care Providers & Services — 3.4% | ||||||||
UnitedHealth Group, Inc. | 114,590 | $ | 57,540,223 | |||||
| $ | 57,540,223 | |||||||
| Hotels, Restaurants & Leisure — 1.1% | ||||||||
Hilton Worldwide Holdings, Inc.(1) | 121,661 | $ | 18,977,899 | |||||
| $ | 18,977,899 | |||||||
| 8 | See Notes to Financial Statements. |
Eaton Vance
Large-Cap Value Fund
December 31, 2021
Portfolio of Investments — continued
| Security | Shares | Value | ||||||
| Household Products — 3.1% | ||||||||
Procter & Gamble Co. (The) | 322,268 | $ | 52,716,599 | |||||
| $ | 52,716,599 | |||||||
| Insurance — 6.8% | ||||||||
Allstate Corp. (The) | 253,412 | $ | 29,813,922 | |||||
American International Group, Inc. | 752,831 | 42,805,970 | ||||||
Arch Capital Group, Ltd.(1) | 729,393 | 32,421,519 | ||||||
Reinsurance Group of America, Inc. | 99,402 | 10,883,525 | ||||||
| $ | 115,924,936 | |||||||
| Interactive Media & Services — 2.9% | ||||||||
Alphabet, Inc., Class A(1) | 17,348 | $ | 50,257,850 | |||||
| $ | 50,257,850 | |||||||
| IT Services — 2.8% | ||||||||
Euronet Worldwide, Inc.(1) | 109,968 | $ | 13,104,886 | |||||
Fidelity National Information Services, Inc. | 315,979 | 34,489,108 | ||||||
| $ | 47,593,994 | |||||||
| Life Sciences Tools & Services — 5.2% | ||||||||
Charles River Laboratories International, Inc.(1) | 26,678 | $ | 10,051,737 | |||||
Thermo Fisher Scientific, Inc. | 79,227 | 52,863,423 | ||||||
Waters Corp.(1) | 68,896 | 25,670,650 | ||||||
| $ | 88,585,810 | |||||||
| Machinery — 4.4% | ||||||||
PACCAR, Inc. | 222,118 | $ | 19,604,135 | |||||
Stanley Black & Decker, Inc. | 130,335 | 24,583,788 | ||||||
Westinghouse Air Brake Technologies Corp. | 327,765 | 30,190,434 | ||||||
| $ | 74,378,357 | |||||||
| Media — 0.9% | ||||||||
Fox Corp., Class A | 417,534 | $ | 15,407,005 | |||||
| $ | 15,407,005 | |||||||
| Multi-Utilities — 2.5% | ||||||||
CMS Energy Corp. | 351,312 | $ | 22,852,846 | |||||
Sempra Energy | 145,380 | 19,230,866 | ||||||
| $ | 42,083,712 | |||||||
| Oil, Gas & Consumable Fuels — 6.3% | ||||||||
Chevron Corp. | 230,819 | $ | 27,086,610 | |||||
ConocoPhillips | 455,193 | 32,855,831 | ||||||
| Security | Shares | Value | ||||||
| Oil, Gas & Consumable Fuels (continued) | ||||||||
EOG Resources, Inc. | 349,068 | $ | 31,007,710 | |||||
Pioneer Natural Resources Co. | 87,707 | 15,952,149 | ||||||
| $ | 106,902,300 | |||||||
| Pharmaceuticals — 6.2% | ||||||||
Bristol-Myers Squibb Co. | 322,973 | $ | 20,137,366 | |||||
Johnson & Johnson | 299,121 | 51,170,629 | ||||||
Royalty Pharma PLC, Class A | 219,596 | 8,750,901 | ||||||
Sanofi | 263,645 | 26,455,182 | ||||||
| $ | 106,514,078 | |||||||
| Semiconductors & Semiconductor Equipment — 3.5% | ||||||||
Micron Technology, Inc. | 300,756 | $ | 28,015,421 | |||||
Texas Instruments, Inc. | 164,485 | 31,000,488 | ||||||
| $ | 59,015,909 | |||||||
| Software — 1.4% | ||||||||
VMware, Inc., Class A | 204,174 | $ | 23,659,683 | |||||
| $ | 23,659,683 | |||||||
| Specialty Retail — 1.0% | ||||||||
Best Buy Co., Inc. | 171,396 | $ | 17,413,834 | |||||
| $ | 17,413,834 | |||||||
| Textiles, Apparel & Luxury Goods — 1.3% | ||||||||
Capri Holdings, Ltd.(1) | 354,295 | $ | 22,997,288 | |||||
| $ | 22,997,288 | |||||||
| Tobacco — 1.3% | ||||||||
Philip Morris International, Inc. | 226,619 | $ | 21,528,805 | |||||
| $ | 21,528,805 | |||||||
Total Common Stocks |
| $ | 1,700,087,864 | |||||
| 9 | See Notes to Financial Statements. |
Eaton Vance
Large-Cap Value Fund
December 31, 2021
Portfolio of Investments — continued
| Short-Term Investments — 0.4% |
| |||||||
| Description | Units | Value | ||||||
Eaton Vance Cash Reserves Fund, LLC, 0.08%(2) | 6,682,351 | $ | 6,681,683 | |||||
Total Short-Term Investments |
| $ | 6,681,683 | |||||
Total Investments — 100.0% |
| $ | 1,706,769,547 | |||||
Other Assets, Less Liabilities — 0.0%(3) |
| $ | 23,671 | |||||
Net Assets — 100.0% |
| $ | 1,706,793,218 | |||||
The percentage shown for each investment category in the Portfolio of Investments is based on net assets.
| (1) | Non-income producing security. |
| (2) | Affiliated investment company, available to Eaton Vance portfolios and funds, which invests in high quality, U.S. dollar denominated money market instruments. The rate shown is the annualized seven-day yield as of December 31, 2021. |
| (3) | Amount is less than 0.05%. |
| 10 | See Notes to Financial Statements. |
Eaton Vance
Large-Cap Value Fund
December 31, 2021
Statement of Assets and Liabilities
| Assets | December 31, 2021 | |||
Unaffiliated investments, at value (identified cost, $1,309,345,857) | $ | 1,700,087,864 | ||
Affiliated investment, at value (identified cost, $6,681,683) | 6,681,683 | |||
Dividends receivable | 2,645,940 | |||
Dividends receivable from affiliated investment | 158 | |||
Receivable for Fund shares sold | 1,974,243 | |||
Tax reclaims receivable | 69,296 | |||
Total assets | $ | 1,711,459,184 | ||
| Liabilities |
| |||
Payable for Fund shares redeemed | $ | 3,145,104 | ||
Payable to affiliates: | ||||
Investment adviser fee | 881,537 | |||
Distribution and service fees | 182,333 | |||
Trustees’ fees | 20,018 | |||
Accrued expenses | 436,974 | |||
Total liabilities | $ | 4,665,966 | ||
Net Assets | $ | 1,706,793,218 | ||
| Sources of Net Assets |
| |||
Paid-in capital | $ | 1,312,680,463 | ||
Distributable earnings | 394,112,755 | |||
Net Assets | $ | 1,706,793,218 | ||
| Class A Shares | ||||
Net Assets | $ | 699,075,565 | ||
Shares Outstanding | 28,811,636 | |||
Net Asset Value and Redemption Price Per Share | ||||
(net assets ÷ shares of beneficial interest outstanding) | $ | 24.26 | ||
Maximum Offering Price Per Share | ||||
(100 ÷ 94.25 of net asset value per share) | $ | 25.74 | ||
| Class C Shares |
| |||
Net Assets | $ | 20,594,454 | ||
Shares Outstanding | 844,523 | |||
Net Asset Value and Offering Price Per Share* | ||||
(net assets ÷ shares of beneficial interest outstanding) | $ | 24.39 | ||
| Class I Shares |
| |||
Net Assets | $ | 841,349,941 | ||
Shares Outstanding | 34,508,176 | |||
Net Asset Value, Offering Price and Redemption Price Per Share | ||||
(net assets ÷ shares of beneficial interest outstanding) | $ | 24.38 | ||
| Class R Shares |
| |||
Net Assets | $ | 49,462,273 | ||
Shares Outstanding | 2,044,924 | |||
Net Asset Value, Offering Price and Redemption Price Per Share | ||||
(net assets ÷ shares of beneficial interest outstanding) | $ | 24.19 | ||
| Class R6 Shares |
| |||
Net Assets | $ | 96,310,985 | ||
Shares Outstanding | 3,947,337 | |||
Net Asset Value, Offering Price and Redemption Price Per Share | ||||
(net assets ÷ shares of beneficial interest outstanding) | $ | 24.40 | ||
On sales of $50,000 or more, the offering price of Class A shares is reduced. | ||||
| * | Redemption price per share is equal to the net asset value less any applicable contingent deferred sales charge. |
| 11 | See Notes to Financial Statements. |
Eaton Vance
Large-Cap Value Fund
December 31, 2021
Statement of Operations
| Investment Income | Year Ended December 31, 2021 | |||
Dividends (net of foreign taxes, $143,410) | $ | 34,575,013 | ||
Dividends from affiliated investment | 2,638 | |||
Securities lending income, net | 200,369 | |||
Total investment income | $ | 34,778,020 | ||
| Expenses | ||||
Investment adviser fee | $ | 10,453,752 | ||
Distribution and service fees | ||||
Class A | 1,701,976 | |||
Class C | 214,632 | |||
Class R | 249,374 | |||
Trustees’ fees and expenses | 80,788 | |||
Custodian fee | 370,539 | |||
Transfer and dividend disbursing agent fees | 1,182,565 | |||
Legal and accounting services | 79,901 | |||
Printing and postage | 67,408 | |||
Registration fees | 84,881 | |||
ReFlow liquidity program fees | 337,514 | |||
Miscellaneous | 65,715 | |||
Total expenses | $ | 14,889,045 | ||
Net investment income | $ | 19,888,975 | ||
| Realized and Unrealized Gain (Loss) | ||||
Net realized gain (loss) — | ||||
Investment transactions | $ | 254,219,193 | (1) | |
Investment transactions — affiliated investment | (679 | ) | ||
Foreign currency transactions | 13,605 | |||
Net realized gain | $ | 254,232,119 | ||
Change in unrealized appreciation (depreciation) — | ||||
Investments | $ | 86,539,907 | ||
Foreign currency | (1,166 | ) | ||
Net change in unrealized appreciation (depreciation) | $ | 86,538,741 | ||
Net realized and unrealized gain | $ | 340,770,860 | ||
Net increase in net assets from operations | $ | 360,659,835 | ||
| (1) | Includes $59,907,056 of net realized gains from redemptions in-kind. |
| 12 | See Notes to Financial Statements. |
Eaton Vance
Large-Cap Value Fund
December 31, 2021
Statements of Changes in Net Assets
| Year Ended December 31, | ||||||||
| Increase (Decrease) in Net Assets | 2021 | 2020 | ||||||
From operations — | ||||||||
Net investment income | $ | 19,888,975 | $ | 22,836,554 | ||||
Net realized gain (loss) | 254,232,119 | (1) | (27,232,126 | )(2) | ||||
Net change in unrealized appreciation (depreciation) | 86,538,741 | 11,259,208 | ||||||
Net increase in net assets from operations | $ | 360,659,835 | $ | 6,863,636 | ||||
Distributions to shareholders — | ||||||||
Class A | $ | (49,070,204 | ) | $ | (12,744,875 | ) | ||
Class C | (1,279,924 | ) | (368,227 | ) | ||||
Class I | (60,711,953 | ) | (17,011,147 | ) | ||||
Class R | (3,365,297 | ) | (871,691 | ) | ||||
Class R6 | (6,834,688 | ) | (1,647,551 | ) | ||||
Total distributions to shareholders | $ | (121,262,066 | ) | $ | (32,643,491 | ) | ||
Transactions in shares of beneficial interest — | ||||||||
Proceeds from sale of shares | ||||||||
Class A | $ | 49,290,623 | $ | 38,157,940 | ||||
Class C | 4,641,660 | 2,147,952 | ||||||
Class I | 289,525,969 | 329,748,203 | ||||||
Class R | 5,544,656 | 7,797,900 | ||||||
Class R6 | 29,415,674 | 14,400,945 | ||||||
Net asset value of shares issued to shareholders in payment of distributions declared | ||||||||
Class A | 44,038,615 | 11,432,250 | ||||||
Class C | 1,188,427 | 321,297 | ||||||
Class I | 50,158,104 | 13,841,018 | ||||||
Class R | 3,350,945 | 848,571 | ||||||
Class R6 | 6,771,948 | 1,641,221 | ||||||
Cost of shares redeemed | ||||||||
Class A | (124,586,539 | ) | (134,508,343 | ) | ||||
Class C | (6,728,463 | ) | (19,511,770 | ) | ||||
Class I | (387,832,708 | ) | (385,040,932 | ) | ||||
Class R | (14,571,996 | ) | (18,999,797 | ) | ||||
Class R6 | (19,470,197 | ) | (23,632,485 | ) | ||||
Net asset value of shares converted | ||||||||
Class A | 2,746,720 | 13,797,946 | ||||||
Class C | (2,746,720 | ) | (13,797,946 | ) | ||||
Net decrease in net assets from Fund share transactions | $ | (69,263,282 | ) | $ | (161,356,030 | ) | ||
Net increase (decrease) in net assets | $ | 170,134,487 | $ | (187,135,885 | ) | |||
| Net Assets |
| |||||||
At beginning of year | $ | 1,536,658,731 | $ | 1,723,794,616 | ||||
At end of year | $ | 1,706,793,218 | $ | 1,536,658,731 | ||||
| (1) | Includes $59,907,056 of net realized gains from redemptions in-kind. |
| (2) | Includes $47,502,556 of net realized gains from redemptions in-kind. |
| 13 | See Notes to Financial Statements. |
Eaton Vance
Large-Cap Value Fund
December 31, 2021
Financial Highlights
| Class A | ||||||||||||||||||||
| Year Ended December 31, | ||||||||||||||||||||
| 2021 | 2020 | 2019 | 2018 | 2017 | ||||||||||||||||
Net asset value — Beginning of year | $ | 21.000 | $ | 20.980 | $ | 16.500 | $ | 19.520 | $ | 18.030 | ||||||||||
| Income (Loss) From Operations | ||||||||||||||||||||
Net investment income(1) | $ | 0.254 | $ | 0.274 | $ | 0.256 | $ | 0.254 | $ | 0.246 | ||||||||||
Net realized and unrealized gain (loss) | 4.782 | 0.154 | (2) | 4.638 | (1.470 | ) | 2.393 | |||||||||||||
Total income (loss) from operations | $ | 5.036 | $ | 0.428 | $ | 4.894 | $ | (1.216 | ) | $ | 2.639 | |||||||||
| Less Distributions | ||||||||||||||||||||
From net investment income | $ | (0.244 | ) | $ | (0.259 | ) | $ | (0.248 | ) | $ | (0.240 | ) | $ | (0.240 | ) | |||||
From net realized gain | (1.532 | ) | (0.149 | ) | (0.166 | ) | (1.564 | ) | (0.909 | ) | ||||||||||
Total distributions | $ | (1.776 | ) | $ | (0.408 | ) | $ | (0.414 | ) | $ | (1.804 | ) | $ | (1.149 | ) | |||||
Net asset value — End of year | $ | 24.260 | $ | 21.000 | $ | 20.980 | $ | 16.500 | $ | 19.520 | ||||||||||
Total Return(3) | 24.29 | % | 2.28 | % | 29.79 | % | (6.83 | )% | 14.80 | % | ||||||||||
| Ratios/Supplemental Data | ||||||||||||||||||||
Net assets, end of year (000’s omitted) | $ | 699,076 | $ | 630,544 | $ | 711,972 | $ | 549,515 | $ | 741,193 | ||||||||||
Ratios (as a percentage of average daily net assets):(4) | ||||||||||||||||||||
Expenses | 1.01 | % | 1.04 | % | 1.04 | % | 1.06 | % | 1.06 | % | ||||||||||
Net investment income | 1.07 | % | 1.48 | % | 1.33 | % | 1.30 | % | 1.31 | % | ||||||||||
Portfolio Turnover of the Portfolio(5) | — | — | — | 34 | %(6) | 105 | % | |||||||||||||
Portfolio Turnover of the Fund | 56 | % | 65 | % | 62 | % | 48 | %(6)(7) | — | |||||||||||
| (1) | Computed using average shares outstanding. |
| (2) | The per share amount is not in accord with the net realized and unrealized gain (loss) for the period because of the timing of Fund share transactions and the amount of the per share realized and unrealized gains and losses at such time. |
| (3) | Returns are historical and are calculated by determining the percentage change in net asset value with all distributions reinvested and do not reflect the effect of sales charges. |
| (4) | Includes the Fund’s share of the Portfolio’s allocated expenses for the period while the Fund was investing in the Portfolio. |
| (5) | Portfolio turnover represents the rate of portfolio activity for the period while the Fund was investing in the Portfolio. |
| (6) | Not annualized. |
| (7) | For the period from June 18, 2018 through December 31, 2018 when the Fund was making investments directly in securities. |
References to Portfolio herein are to Large-Cap Value Portfolio, a Massachusetts business trust in which the Fund invested all of its investable assets prior to the close of business on June 15, 2018 and which had the same investment objective and policies as the Fund during such period.
| 14 | See Notes to Financial Statements. |
Eaton Vance
Large-Cap Value Fund
December 31, 2021
Financial Highlights — continued
| Class C | ||||||||||||||||||||
| Year Ended December 31, | ||||||||||||||||||||
| 2021 | 2020 | 2019 | 2018 | 2017 | ||||||||||||||||
Net asset value — Beginning of year | $ | 21.100 | $ | 21.050 | $ | 16.520 | $ | 19.540 | $ | 18.040 | ||||||||||
| Income (Loss) From Operations | ||||||||||||||||||||
Net investment income(1) | $ | 0.073 | $ | 0.139 | $ | 0.103 | $ | 0.107 | $ | 0.107 | ||||||||||
Net realized and unrealized gain (loss) | 4.810 | 0.150 | (2) | 4.655 | (1.473 | ) | 2.394 | |||||||||||||
Total income (loss) from operations | $ | 4.883 | $ | 0.289 | $ | 4.758 | $ | (1.366 | ) | $ | 2.501 | |||||||||
| Less Distributions | ||||||||||||||||||||
From net investment income | $ | (0.061 | ) | $ | (0.090 | ) | $ | (0.062 | ) | $ | (0.090 | ) | $ | (0.092 | ) | |||||
From net realized gain | (1.532 | ) | (0.149 | ) | (0.166 | ) | (1.564 | ) | (0.909 | ) | ||||||||||
Total distributions | $ | (1.593 | ) | $ | (0.239 | ) | $ | (0.228 | ) | $ | (1.654 | ) | $ | (1.001 | ) | |||||
Net asset value — End of year | $ | 24.390 | $ | 21.100 | $ | 21.050 | $ | 16.520 | $ | 19.540 | ||||||||||
Total Return(3) | 23.39 | % | 1.52 | % | 28.82 | % | (7.53 | )% | 13.96 | % | ||||||||||
| Ratios/Supplemental Data | ||||||||||||||||||||
Net assets, end of year (000’s omitted) | $ | 20,594 | $ | 21,069 | $ | 56,344 | $ | 168,783 | $ | 241,192 | ||||||||||
Ratios (as a percentage of average daily net assets):(4) | ||||||||||||||||||||
Expenses | 1.76 | % | 1.79 | % | 1.80 | % | 1.81 | % | 1.81 | % | ||||||||||
Net investment income | 0.30 | % | 0.75 | % | 0.54 | % | 0.55 | % | 0.57 | % | ||||||||||
Portfolio Turnover of the Portfolio(5) | — | — | — | 34 | %(6) | 105 | % | |||||||||||||
Portfolio Turnover of the Fund | 56 | % | 65 | % | 62 | % | 48 | %(6)(7) | — | |||||||||||
| (1) | Computed using average shares outstanding. |
| (2) | The per share amount is not in accord with the net realized and unrealized gain (loss) for the period because of the timing of Fund share transactions and the amount of the per share realized and unrealized gains and losses at such time. |
| (3) | Returns are historical and are calculated by determining the percentage change in net asset value with all distributions reinvested and do not reflect the effect of sales charges. |
| (4) | Includes the Fund’s share of the Portfolio’s allocated expenses for the period while the Fund was investing in the Portfolio. |
| (5) | Portfolio turnover represents the rate of portfolio activity for the period while the Fund was investing in the Portfolio. |
| (6) | Not annualized. |
| (7) | For the period from June 18, 2018 through December 31, 2018 when the Fund was making investments directly in securities. |
References to Portfolio herein are to Large-Cap Value Portfolio, a Massachusetts business trust in which the Fund invested all of its investable assets prior to the close of business on June 15, 2018 and which had the same investment objective and policies as the Fund during such period.
| 15 | See Notes to Financial Statements. |
Eaton Vance
Large-Cap Value Fund
December 31, 2021
Financial Highlights — continued
| Class I | ||||||||||||||||||||
| Year Ended December 31, | ||||||||||||||||||||
| 2021 | 2020 | 2019 | 2018 | 2017 | ||||||||||||||||
Net asset value — Beginning of year | $ | 21.090 | $ | 21.070 | $ | 16.570 | $ | 19.590 | $ | 18.090 | ||||||||||
| Income (Loss) From Operations | ||||||||||||||||||||
Net investment income(1) | $ | 0.314 | $ | 0.322 | $ | 0.305 | $ | 0.306 | $ | 0.296 | ||||||||||
Net realized and unrealized gain (loss) | 4.812 | 0.152 | (2) | 4.658 | (1.472 | ) | 2.401 | |||||||||||||
Total income (loss) from operations | $ | 5.126 | $ | 0.474 | $ | 4.963 | $ | (1.166 | ) | $ | 2.697 | |||||||||
| Less Distributions | ||||||||||||||||||||
From net investment income | $ | (0.304 | ) | $ | (0.305 | ) | $ | (0.297 | ) | $ | (0.290 | ) | $ | (0.288 | ) | |||||
From net realized gain | (1.532 | ) | (0.149 | ) | (0.166 | ) | (1.564 | ) | (0.909 | ) | ||||||||||
Total distributions | $ | (1.836 | ) | $ | (0.454 | ) | $ | (0.463 | ) | $ | (1.854 | ) | $ | (1.197 | ) | |||||
Net asset value — End of year | $ | 24.380 | $ | 21.090 | $ | 21.070 | $ | 16.570 | $ | 19.590 | ||||||||||
Total Return(3) | 24.64 | % | 2.52 | % | 30.11 | % | (6.57 | )% | 15.10 | % | ||||||||||
| Ratios/Supplemental Data | ||||||||||||||||||||
Net assets, end of year (000’s omitted) | $ | 841,350 | $ | 768,930 | $ | 819,292 | $ | 736,581 | $ | 1,032,300 | ||||||||||
Ratios (as a percentage of average daily net assets):(4) | ||||||||||||||||||||
Expenses | 0.76 | % | 0.79 | % | 0.79 | % | 0.81 | % | 0.81 | % | ||||||||||
Net investment income | 1.31 | % | 1.72 | % | 1.58 | % | 1.56 | % | 1.57 | % | ||||||||||
Portfolio Turnover of the Portfolio(5) | — | — | — | 34 | %(6) | 105 | % | |||||||||||||
Portfolio Turnover of the Fund | 56 | % | 65 | % | 62 | % | 48 | %(6)(7) | — | |||||||||||
| (1) | Computed using average shares outstanding. |
| (2) | The per share amount is not in accord with the net realized and unrealized gain (loss) for the period because of the timing of Fund share transactions and the amount of the per share realized and unrealized gains and losses at such time. |
| (3) | Returns are historical and are calculated by determining the percentage change in net asset value with all distributions reinvested. |
| (4) | Includes the Fund’s share of the Portfolio’s allocated expenses for the period while the Fund was investing in the Portfolio. |
| (5) | Portfolio turnover represents the rate of portfolio activity for the period while the Fund was investing in the Portfolio. |
| (6) | Not annualized. |
| (7) | For the period from June 18, 2018 through December 31, 2018 when the Fund was making investments directly in securities. |
References to Portfolio herein are to Large-Cap Value Portfolio, a Massachusetts business trust in which the Fund invested all of its investable assets prior to the close of business on June 15, 2018 and which had the same investment objective and policies as the Fund during such period.
| 16 | See Notes to Financial Statements. |
Eaton Vance
Large-Cap Value Fund
December 31, 2021
Financial Highlights — continued
| Class R | ||||||||||||||||||||
| Year Ended December 31, | ||||||||||||||||||||
| 2021 | 2020 | 2019 | 2018 | 2017 | ||||||||||||||||
Net asset value — Beginning of year | $ | 20.940 | $ | 20.920 | $ | 16.450 | $ | 19.460 | $ | 17.980 | ||||||||||
| Income (Loss) From Operations | ||||||||||||||||||||
Net investment income(1) | $ | 0.193 | $ | 0.228 | $ | 0.206 | $ | 0.204 | $ | 0.199 | ||||||||||
Net realized and unrealized gain (loss) | 4.773 | 0.152 | (2) | 4.626 | (1.460 | ) | 2.382 | |||||||||||||
Total income (loss) from operations | $ | 4.966 | $ | 0.380 | $ | 4.832 | $ | (1.256 | ) | $ | 2.581 | |||||||||
| Less Distributions | ||||||||||||||||||||
From net investment income | $ | (0.184 | ) | $ | (0.211 | ) | $ | (0.196 | ) | $ | (0.190 | ) | $ | (0.192 | ) | |||||
From net realized gain | (1.532 | ) | (0.149 | ) | (0.166 | ) | (1.564 | ) | (0.909 | ) | ||||||||||
Total distributions | $ | (1.716 | ) | $ | (0.360 | ) | $ | (0.362 | ) | $ | (1.754 | ) | $ | (1.101 | ) | |||||
Net asset value — End of year | $ | 24.190 | $ | 20.940 | $ | 20.920 | $ | 16.450 | $ | 19.460 | ||||||||||
Total Return(3) | 24.01 | % | 2.03 | % | 29.48 | % | (7.04 | )% | 14.50 | % | ||||||||||
| Ratios/Supplemental Data | ||||||||||||||||||||
Net assets, end of year (000’s omitted) | $ | 49,462 | $ | 47,772 | $ | 59,473 | $ | 60,984 | $ | 86,706 | ||||||||||
Ratios (as a percentage of average daily net assets):(4) | ||||||||||||||||||||
Expenses | 1.26 | % | 1.29 | % | 1.30 | % | 1.31 | % | 1.31 | % | ||||||||||
Net investment income | 0.81 | % | 1.23 | % | 1.08 | % | 1.05 | % | 1.06 | % | ||||||||||
Portfolio Turnover of the Portfolio(5) | — | — | — | 34 | %(6) | 105 | % | |||||||||||||
Portfolio Turnover of the Fund | 56 | % | 65 | % | 62 | % | 48 | %(6)(7) | — | |||||||||||
| (1) | Computed using average shares outstanding. |
| (2) | The per share amount is not in accord with the net realized and unrealized gain (loss) for the period because of the timing of Fund share transactions and the amount of the per share realized and unrealized gains and losses at such time. |
| (3) | Returns are historical and are calculated by determining the percentage change in net asset value with all distributions reinvested. |
| (4) | Includes the Fund’s share of the Portfolio’s allocated expenses for the period while the Fund was investing in the Portfolio. |
| (5) | Portfolio turnover represents the rate of portfolio activity for the period while the Fund was investing in the Portfolio. |
| (6) | Not annualized. |
| (7) | For the period from June 18, 2018 through December 31, 2018 when the Fund was making investments directly in securities. |
References to Portfolio herein are to Large-Cap Value Portfolio, a Massachusetts business trust in which the Fund invested all of its investable assets prior to the close of business on June 15, 2018 and which had the same investment objective and policies as the Fund during such period.
| 17 | See Notes to Financial Statements. |
Eaton Vance
Large-Cap Value Fund
December 31, 2021
Financial Highlights — continued
| Class R6 | ||||||||||||||||||||
| Year Ended December 31, | ||||||||||||||||||||
| 2021 | 2020 | 2019 | 2018 | 2017 | ||||||||||||||||
Net asset value — Beginning of year | $ | 21.110 | $ | 21.080 | $ | 16.580 | $ | 19.610 | $ | 18.100 | ||||||||||
| Income (Loss) From Operations | ||||||||||||||||||||
Net investment income(1) | $ | 0.334 | $ | 0.337 | $ | 0.320 | $ | 0.310 | $ | 0.311 | ||||||||||
Net realized and unrealized gain (loss) | 4.806 | 0.160 | (2) | 4.656 | (1.470 | ) | 2.413 | |||||||||||||
Total income (loss) from operations | $ | 5.140 | $ | 0.497 | $ | 4.976 | $ | (1.160 | ) | $ | 2.724 | |||||||||
| Less Distributions | ||||||||||||||||||||
From net investment income | $ | (0.318 | ) | $ | (0.318 | ) | $ | (0.310 | ) | $ | (0.306 | ) | $ | (0.305 | ) | |||||
From net realized gain | (1.532 | ) | (0.149 | ) | (0.166 | ) | (1.564 | ) | (0.909 | ) | ||||||||||
Total distributions | $ | (1.850 | ) | $ | (0.467 | ) | $ | (0.476 | ) | $ | (1.870 | ) | $ | (1.214 | ) | |||||
Net asset value — End of year | $ | 24.400 | $ | 21.110 | $ | 21.080 | $ | 16.580 | $ | 19.610 | ||||||||||
Total Return(3) | 24.69 | % | 2.64 | % | 30.17 | % | (6.54 | )% | 15.25 | % | ||||||||||
| Ratios/Supplemental Data | ||||||||||||||||||||
Net assets, end of year (000’s omitted) | $ | 96,311 | $ | 68,343 | $ | 76,714 | $ | 73,019 | $ | 86,742 | ||||||||||
Ratios (as a percentage of average daily net assets):(4) | ||||||||||||||||||||
Expenses | 0.70 | % | 0.72 | % | 0.72 | % | 0.72 | % | 0.73 | % | ||||||||||
Net investment income | 1.39 | % | 1.80 | % | 1.66 | % | 1.57 | % | 1.64 | % | ||||||||||
Portfolio Turnover of the Portfolio(5) | — | — | — | 34 | %(6) | 105 | % | |||||||||||||
Portfolio Turnover of the Fund | 56 | % | 65 | % | 62 | % | 48 | %(6)(7) | — | |||||||||||
| (1) | Computed using average shares outstanding. |
| (2) | The per share amount is not in accord with the net realized and unrealized gain (loss) for the period because of the timing of Fund share transactions and the amount of the per share realized and unrealized gains and losses at such time. |
| (3) | Returns are historical and are calculated by determining the percentage change in net asset value with all distributions reinvested. |
| (4) | Includes the Fund’s share of the Portfolio’s allocated expenses for the period while the Fund was investing in the Portfolio. |
| (5) | Portfolio turnover represents the rate of portfolio activity for the period while the Fund was investing in the Portfolio. |
| (6) | Not annualized. |
| (7) | For the period from June 18, 2018 through December 31, 2018 when the Fund was making investments directly in securities. |
References to Portfolio herein are to Large-Cap Value Portfolio, a Massachusetts business trust in which the Fund invested all of its investable assets prior to the close of business on June 15, 2018 and which had the same investment objective and policies as the Fund during such period.
| 18 | See Notes to Financial Statements. |
Eaton Vance
Large-Cap Value Fund
December 31, 2021
Notes to Financial Statements
1 Significant Accounting Policies
Eaton Vance Large-Cap Value Fund (the Fund) is a diversified series of Eaton Vance Special Investment Trust (the Trust). The Trust is a Massachusetts business trust registered under the Investment Company Act of 1940, as amended (the 1940 Act), as an open-end management investment company. The Fund’s investment objective is to seek total return. The Fund offers five classes of shares. Class A shares are generally sold subject to a sales charge imposed at time of purchase. Class C shares are sold at net asset value and are generally subject to a contingent deferred sales charge (see Note 5). Effective January 25, 2019, Class C shares generally automatically convert to Class A shares ten years after their purchase and, effective November 5, 2020, automatically convert to Class A shares eight years after their purchase as described in the Fund’s prospectus. Class I, Class R and Class R6 shares are sold at net asset value and are not subject to a sales charge.
Each class represents a pro-rata interest in the Fund, but votes separately on class-specific matters and (as noted below) is subject to different expenses. Realized and unrealized gains and losses and net investment income and losses, other than class-specific expenses, are allocated daily to each class of shares based on the relative net assets of each class to the total net assets of the Fund. Sub-accounting, recordkeeping and similar administrative fees payable to financial intermediaries, which are a component of transfer and dividend disbursing agent fees on the Statement of Operations, are not allocated to Class R6 shares. Each class of shares differs in its distribution plan and certain other class-specific expenses.
The following is a summary of significant accounting policies of the Fund. The policies are in conformity with accounting principles generally accepted in the United States of America (U.S. GAAP). The Fund is an investment company and follows accounting and reporting guidance in the Financial Accounting Standards Board (FASB) Accounting Standards Codification Topic 946.
A Investment Valuation — The following methodologies are used to determine the market value or fair value of investments.
Equity Securities. Equity securities listed on a U.S. securities exchange generally are valued at the last sale or closing price on the day of valuation or, if no sales took place on such date, at the mean between the closing bid and ask prices on the exchange where such securities are principally traded. Equity securities listed on the NASDAQ National Market System are valued at the NASDAQ official closing price. Unlisted or listed securities for which closing sales prices or closing quotations are not available are valued at the mean between the latest available bid and ask prices.
Foreign Securities and Currencies. Foreign securities and currencies are valued in U.S. dollars, based on foreign currency exchange rate quotations supplied by a third party pricing service. The pricing service uses a proprietary model to determine the exchange rate. Inputs to the model include reported trades and implied bid/ask spreads. The daily valuation of exchange-traded foreign securities generally is determined as of the close of trading on the principal exchange on which such securities trade. Events occurring after the close of trading on foreign exchanges may result in adjustments to the valuation of foreign securities to more accurately reflect their fair value as of the close of regular trading on the New York Stock Exchange. When valuing foreign equity securities that meet certain criteria, the Fund’s Trustees have approved the use of a fair value service that values such securities to reflect market trading that occurs after the close of the applicable foreign markets of comparable securities or other instruments that have a strong correlation to the fair-valued securities.
Affiliated Fund. The Fund may invest in Eaton Vance Cash Reserves Fund, LLC (Cash Reserves Fund), an affiliated investment company managed by Eaton Vance Management (EVM). While Cash Reserves Fund is not a registered money market mutual fund, it conducts all of its investment activities in accordance with the requirements of Rule 2a-7 under the 1940 Act. Investments in Cash Reserves Fund are valued at the closing net asset value per unit on the valuation day. Cash Reserves Fund generally values its investment securities based on available market quotations provided by a third party pricing service.
Other. Investments in registered investment companies (including money market funds) that do not trade on an exchange are valued at the net asset value per share on the valuation day.
Fair Valuation. Investments for which valuations or market quotations are not readily available or are deemed unreliable are valued at fair value using methods determined in good faith by or at the direction of the Trustees of the Fund in a manner that most fairly reflects the security’s “fair value”, which is the amount that the Fund might reasonably expect to receive for the security upon its current sale in the ordinary course. Each such determination is based on a consideration of relevant factors, which are likely to vary from one pricing context to another. These factors may include, but are not limited to, the type of security, the existence of any contractual restrictions on the security’s disposition, the price and extent of public trading in similar securities of the issuer or of comparable companies or entities, quotations or relevant information obtained from broker/dealers or other market participants, information obtained from the issuer, analysts, and/or the appropriate stock exchange (for exchange-traded securities), an analysis of the company’s or entity’s financial statements, and an evaluation of the forces that influence the issuer and the market(s) in which the security is purchased and sold.
B Investment Transactions — Investment transactions for financial statement purposes are accounted for on a trade date basis. Realized gains and losses on investments sold are determined on the basis of identified cost.
C Income — Dividend income is recorded on the ex-dividend date for dividends received in cash and/or securities. However, if the ex-dividend date has passed, certain dividends from foreign securities are recorded as the Fund is informed of the ex-dividend date. Withholding taxes on foreign dividends and capital gains have been provided for in accordance with the Fund’s understanding of the applicable countries’ tax rules and rates. In consideration of recent decisions rendered by European courts, the Fund has filed additional tax reclaims for previously withheld taxes on dividends earned in certain European Union countries. These filings are subject to various administrative and judicial proceedings within these countries. Due to the uncertainty as to the ultimate resolution of these proceedings, the likelihood of receipt of these reclaims, and the potential timing of payment, no amounts are reflected in the Fund’s financial statements for such outstanding reclaims.
| 19 |
Eaton Vance
Large-Cap Value Fund
December 31, 2021
Notes to Financial Statements — continued
D Federal Taxes — The Fund’s policy is to comply with the provisions of the Internal Revenue Code applicable to regulated investment companies and to distribute to shareholders each year substantially all of its net investment income, and all or substantially all of its net realized capital gains. Accordingly, no provision for federal income or excise tax is necessary.
As of December 31, 2021, the Fund had no uncertain tax positions that would require financial statement recognition, de-recognition, or disclosure. The Fund files a U.S. federal income tax return annually after its fiscal year-end, which is subject to examination by the Internal Revenue Service for a period of three years from the date of filing.
E Expenses — The majority of expenses of the Trust are directly identifiable to an individual fund. Expenses which are not readily identifiable to a specific fund are allocated taking into consideration, among other things, the nature and type of expense and the relative size of the funds.
F Foreign Currency Translation — Investment valuations, other assets, and liabilities initially expressed in foreign currencies are translated each business day into U.S. dollars based upon current exchange rates. Purchases and sales of foreign investment securities and income and expenses denominated in foreign currencies are translated into U.S. dollars based upon currency exchange rates in effect on the respective dates of such transactions. Recognized gains or losses on investment transactions attributable to changes in foreign currency exchange rates are recorded for financial statement purposes as net realized gains and losses on investments. That portion of unrealized gains and losses on investments that results from fluctuations in foreign currency exchange rates is not separately disclosed.
G Use of Estimates — The preparation of the financial statements in conformity with U.S. GAAP requires management to make estimates and assumptions that affect the reported amounts of assets and liabilities at the date of the financial statements and the reported amounts of income and expense during the reporting period. Actual results could differ from those estimates.
H Indemnifications — Under the Trust’s organizational documents, its officers and Trustees may be indemnified against certain liabilities and expenses arising out of the performance of their duties to the Fund. Under Massachusetts law, if certain conditions prevail, shareholders of a Massachusetts business trust (such as the Trust) could be deemed to have personal liability for the obligations of the Trust. However, the Trust’s Declaration of Trust contains an express disclaimer of liability on the part of Fund shareholders and the By-laws provide that the Trust shall assume, upon request by the shareholder, the defense on behalf of any Fund shareholders. Moreover, the By-laws also provide for indemnification out of Fund property of any shareholder held personally liable solely by reason of being or having been a shareholder for all loss or expense arising from such liability. Additionally, in the normal course of business, the Fund enters into agreements with service providers that may contain indemnification clauses. The Fund’s maximum exposure under these arrangements is unknown as this would involve future claims that may be made against the Fund that have not yet occurred.
2 Distributions to Shareholders and Income Tax Information
It is the present policy of the Fund to make quarterly distributions of all or substantially all of its net investment income and to distribute annually all or substantially all of its net realized capital gains. Distributions to shareholders are recorded on the ex-dividend date. Distributions are declared separately for each class of shares. Shareholders may reinvest income and capital gain distributions in additional shares of the same class of the Fund at the net asset value as of the ex-dividend date or, at the election of the shareholder, receive distributions in cash. Distributions to shareholders are determined in accordance with income tax regulations, which may differ from U.S. GAAP. As required by U.S. GAAP, only distributions in excess of tax basis earnings and profits are reported in the financial statements as a return of capital. Permanent differences between book and tax accounting relating to distributions are reclassified to paid-in capital. For tax purposes, distributions from short-term capital gains are considered to be from ordinary income.
The tax character of distributions declared for the years ended December 31, 2021 and December 31, 2020 was as follows:
| Year Ended December 31, | ||||||||
| 2021 | 2020 | |||||||
Ordinary income | $ | 18,959,123 | $ | 24,330,631 | ||||
Long-term capital gains | $ | 102,302,943 | $ | 8,312,860 | ||||
During the year ended December 31, 2021, distributable earnings was decreased by $69,077,971 and paid-in capital was increased by $69,077,971 due to the Fund’s use of equalization accounting and differences between book and tax accounting for redemptions in-kind. Tax equalization accounting allows the Fund to treat as a distribution that portion of redemption proceeds representing a redeeming shareholder’s portion of undistributed taxable income and net capital gains. These reclassifications had no effect on the net assets or net asset value per share of the Fund.
| 20 |
Eaton Vance
Large-Cap Value Fund
December 31, 2021
Notes to Financial Statements — continued
As of December 31, 2021, the components of distributable earnings (accumulated loss) on a tax basis were as follows:
Undistributed ordinary income | $ | 380,642 | ||
Undistributed long-term capital gains | 12,466,428 | |||
Net unrealized appreciation | 381,265,685 | |||
Distributable earnings | $ | 394,112,755 | ||
The cost and unrealized appreciation (depreciation) of investments of the Fund at December 31, 2021, as determined on a federal income tax basis, were as follows:
Aggregate cost | $ | 1,325,504,239 | ||
Gross unrealized appreciation | $ | 392,791,570 | ||
Gross unrealized depreciation | (11,526,262 | ) | ||
Net unrealized appreciation | $ | 381,265,308 | ||
3 Investment Adviser Fee and Other Transactions with Affiliates
The investment adviser fee is earned by Boston Management and Research (BMR) as compensation for investment advisory services rendered to the Fund. On March 1, 2021, Morgan Stanley acquired Eaton Vance Corp. (the “Transaction”) and BMR became an indirect, wholly-owned subsidiary of Morgan Stanley. In connection with the Transaction, the Fund entered into a new investment advisory agreement (the “New Agreement”) with BMR, which took effect on March 1, 2021. Pursuant to the New Agreement (and the Fund’s investment advisory agreement with BMR in effect prior to March 1, 2021), the fee is computed at an annual rate as a percentage of the Fund’s average daily net assets as follows and is payable monthly:
| Average Daily Net Assets | Annual Fee Rate | |||
Up to $2 billion | 0.625 | % | ||
$2 billion but less than $5 billion | 0.600 | % | ||
$5 billion but less than $10 billion | 0.575 | % | ||
$10 billion but less than $15 billion | 0.555 | % | ||
$15 billion but less than $20 billion | 0.540 | % | ||
$20 billion but less than $25 billion | 0.530 | % | ||
$25 billion and over | 0.520 | % | ||
For the year ended December 31, 2021, the investment adviser fee amounted to $10,453,752 or 0.625% of the Fund’s average daily net assets. The Fund may invest its cash in Cash Reserves Fund. EVM does not currently receive a fee for advisory services provided to Cash Reserves Fund. EVM, an affiliate of BMR and, effective March 1, 2021, an indirect, wholly-owned subsidiary of Morgan Stanley, serves as the administrator of the Fund, but receives no compensation.
EVM provides sub-transfer agency and related services to the Fund pursuant to a Sub-Transfer Agency Support Services Agreement. For the year ended December 31, 2021, EVM earned $107,916 from the Fund pursuant to such agreement, which is included in transfer and dividend disbursing agent fees on the Statement of Operations. The Fund was informed that Eaton Vance Distributors, Inc. (EVD), an affiliate of EVM and the Fund’s principal underwriter, received $19,877 as its portion of the sales charge on sales of Class A shares for the year ended December 31, 2021. The Fund was informed that Morgan Stanley affiliated broker-dealers, which may be deemed to be affiliates of BMR, EVM and EVD, also received a portion of the sales charge on sales of Class A shares from March 1, 2021 through December 31, 2021 in the amount of $983. EVD also received distribution and service fees from Class A, Class C and Class R shares (see Note 4) and contingent deferred sales charges (see Note 5).
Trustees and officers of the Fund who are members of EVM’s or BMR’s organizations receive remuneration for their services to the Fund out of the investment adviser fee. Trustees of the Fund who are not affiliated with the investment adviser may elect to defer receipt of all or a percentage of their annual fees in accordance with the terms of the Trustees Deferred Compensation Plan. For the year ended December 31, 2021, no significant amounts have been deferred. Certain officers and Trustees of the Fund are officers of the above organizations.
| 21 |
Eaton Vance
Large-Cap Value Fund
December 31, 2021
Notes to Financial Statements — continued
4 Distribution Plans
The Fund has in effect a distribution plan for Class A shares (Class A Plan) pursuant to Rule 12b-1 under the 1940 Act. Pursuant to the Class A Plan, the Fund pays EVD a distribution and service fee of 0.25% per annum of its average daily net assets attributable to Class A shares for distribution services and facilities provided to the Fund by EVD, as well as for personal services and/or the maintenance of shareholder accounts. Distribution and service fees paid or accrued to EVD for the year ended December 31, 2021 amounted to $1,701,976 for Class A shares.
The Fund also has in effect distribution plans for Class C shares (Class C Plan) and Class R shares (Class R Plan) pursuant to Rule 12b-1 under the 1940 Act. Pursuant to the Class C Plan, the Fund pays EVD amounts equal to 0.75% per annum of its average daily net assets attributable to Class C shares for providing ongoing distribution services and facilities to the Fund. For the year ended December 31, 2021, the Fund paid or accrued to EVD $160,974 for Class C shares.
The Class R Plan requires the Fund to pay EVD an amount up to 0.50% per annum of its average daily net assets attributable to Class R shares for providing ongoing distribution services and facilities to the Fund. The Trustees of the Trust have currently limited Class R distribution payments to 0.25% per annum of the average daily net assets attributable to Class R shares. For the year ended December 31, 2021, the Fund paid or accrued to EVD $124,687 for Class R shares.
Pursuant to the Class C and Class R Plans, the Fund also makes payments of service fees to EVD, financial intermediaries and other persons in amounts equal to 0.25% per annum of its average daily net assets attributable to that class. Service fees paid or accrued are for personal services and/or the maintenance of shareholder accounts. They are separate and distinct from the sales commissions and distribution fees payable to EVD. Service fees paid or accrued for the year ended December 31, 2021 amounted to $53,658 and $124,687 for Class C and Class R shares, respectively.
Distribution and service fees are subject to the limitations contained in the Financial Industry Regulatory Authority Rule 2341(d).
5 Contingent Deferred Sales Charges
A contingent deferred sales charge (CDSC) of 1% generally is imposed on redemptions of Class C shares made within 12 months of purchase. Class A shares may be subject to a 1% CDSC if redeemed within 18 months of purchase (depending on the circumstances of purchase). Generally, the CDSC is based upon the lower of the net asset value at date of redemption or date of purchase. No charge is levied on shares acquired by reinvestment of dividends or capital gain distributions. For the year ended December 31, 2021, the Fund was informed that EVD received approximately $300 and $2,000 of CDSCs paid by Class A and Class C shareholders, respectively.
6 Purchases and Sales of Investments
Purchases and sales of investments, other than short-term obligations and in-kind transactions, aggregated $929,554,372 and $952,898,159, respectively, for the year ended December 31, 2021. In-kind sales for the year ended December 31, 2021 aggregated $150,746,866.
7 Shares of Beneficial Interest
The Fund’s Declaration of Trust permits the Trustees to issue an unlimited number of full and fractional shares of beneficial interest (without par value). Such shares may be issued in a number of different series (such as the Fund) and classes. Sales and redemptions of Class I shares include shares purchased and redeemed in connection with the ReFlow liquidity program, a program designed to provide an alternative liquidity source for mutual funds experiencing net redemptions of their shares. Transactions in Fund shares were as follows:
| Year Ended December 31, | ||||||||
| Class A | 2021 | 2020 | ||||||
Sales | 2,067,434 | 2,092,191 | ||||||
Issued to shareholders electing to receive payments of distributions in Fund shares | 1,869,325 | 608,832 | ||||||
Redemptions | (5,267,155 | ) | (7,339,760 | ) | ||||
Converted from Class C shares | 115,452 | 729,592 | ||||||
Net decrease | (1,214,944 | ) | (3,909,145 | ) | ||||
| 22 |
Eaton Vance
Large-Cap Value Fund
December 31, 2021
Notes to Financial Statements — continued
| Year Ended December 31, | ||||||||
| Class C | 2021 | 2020 | ||||||
Sales | 194,103 | 114,572 | ||||||
Issued to shareholders electing to receive payments of distributions in Fund shares | 50,234 | 17,216 | ||||||
Redemptions | (283,521 | ) | (1,082,607 | ) | ||||
Converted to Class A shares | (114,963 | ) | (727,403 | ) | ||||
Net decrease | (154,147 | ) | (1,678,222 | ) | ||||
| Year Ended December 31, | ||||||||
| Class I | 2021 | 2020 | ||||||
Sales | 12,148,514 | 18,027,407 | ||||||
Issued to shareholders electing to receive payments of distributions in Fund shares | 2,118,517 | 733,665 | ||||||
Redemptions | (16,212,717 | ) | (21,190,948 | ) | ||||
Net decrease | (1,945,686 | ) | (2,429,876 | ) | ||||
| Year Ended December 31, | ||||||||
| Class R | 2021 | 2020 | ||||||
Sales | 235,191 | 425,056 | ||||||
Issued to shareholders electing to receive payments of distributions in Fund shares | 142,734 | 45,364 | ||||||
Redemptions | (614,541 | ) | (1,031,807 | ) | ||||
Net decrease | (236,616 | ) | (561,387 | ) | ||||
| Year Ended December 31, | ||||||||
| Class R6 | 2021 | 2020 | ||||||
Sales | 1,230,661 | 778,021 | ||||||
Issued to shareholders electing to receive payments of distributions in Fund shares | 285,796 | 87,018 | ||||||
Redemptions | (806,934 | ) | (1,265,701 | ) | ||||
Net increase (decrease) | 709,523 | (400,662 | ) | |||||
8 Line of Credit
The Fund participates with other portfolios and funds managed by EVM and its affiliates in an $800 million unsecured line of credit agreement with a group of banks, which is in effect through October 25, 2022. Borrowings are made by the Fund solely for temporary purposes related to redemptions and other short-term cash needs. Interest is charged to the Fund based on its borrowings at an amount above either the Secured Overnight Financing Rate (SOFR) or Federal Funds rate. In addition, a fee computed at an annual rate of 0.15% on the daily unused portion of the line of credit is allocated among the participating portfolios and funds at the end of each quarter. In connection with the renewal of the agreement in October 2021, an arrangement fee totaling $150,000 was incurred that was allocated to the participating portfolios and funds. Because the line of credit is not available exclusively to the Fund, it may be unable to borrow some or all of its requested amounts at any particular time. The Fund did not have any significant borrowings or allocated fees during the year ended December 31, 2021.
9 Securities Lending Agreement
The Fund has established a securities lending agreement with State Street Bank and Trust Company (SSBT) as securities lending agent in which the Fund lends portfolio securities to qualified borrowers in exchange for collateral consisting of either cash or securities issued or guaranteed by the U.S. government or its agencies or instrumentalities in an amount at least equal to the market value of the securities on loan. The market value of securities
| 23 |
Eaton Vance
Large-Cap Value Fund
December 31, 2021
Notes to Financial Statements — continued
loaned is determined daily and any additional required collateral is delivered to the Fund on the next business day. Cash collateral is invested in the State Street Navigator Securities Lending Government Money Market Portfolio, a money market fund registered under the 1940 Act. The Fund earns interest on the amount invested but it must pay (and at times receive from) the broker a loan rebate fee computed as a varying percentage of the collateral received. For security loans secured by non-cash collateral, the Fund earns a negotiated lending fee from the borrower. A portion of the income earned by the Fund from its investment of cash collateral, net of rebate fees, and lending fees received is allocated to SSBT for its services as lending agent and the portion allocated to the Fund is presented as securities lending income, net on the Statement of Operations. Non-cash collateral is held by the lending agent on behalf of the Fund and cannot be sold or re-pledged by the Fund; accordingly, such collateral is not reflected in the Statement of Assets and Liabilities.
The Fund is subject to possible delay in the recovery of loaned securities. Pursuant to the securities lending agreement, SSBT has provided indemnification to the Fund in the event of default by a borrower with respect to a loan. The Fund bears the risk of loss with respect to the investment of cash collateral. At December 31, 2021, the Fund had no securities on loan.
10 Investments in Affiliated Funds
At December 31, 2021, the value of the Fund’s investment in affiliated funds was $6,681,683, which represents 0.4% of the Fund’s net assets. Transactions in affiliated funds by the Fund for the year ended December 31, 2021 were as follows:
| Name | Value, beginning of period | Purchases | Sales proceeds | Net realized gain (loss) | Change in unrealized appreciation (depreciation) | Value, end of period | Dividend income | Units, end of period | ||||||||||||||||||||||||
Short-Term Investments |
| |||||||||||||||||||||||||||||||
Eaton Vance Cash Reserves Fund, LLC | $ | 2,269,487 | $ | 194,948,826 | $ | (190,535,951 | ) | $ | (679 | ) | $ | — | $ | 6,681,683 | $ | 2,638 | 6,682,351 | |||||||||||||||
11 Fair Value Measurements
Under generally accepted accounting principles for fair value measurements, a three-tier hierarchy to prioritize the assumptions, referred to as inputs, is used in valuation techniques to measure fair value. The three-tier hierarchy of inputs is summarized in the three broad levels listed below.
| • | Level 1 – quoted prices in active markets for identical investments |
| • | Level 2 – other significant observable inputs (including quoted prices for similar investments, interest rates, prepayment speeds, credit risk, etc.) |
| • | Level 3 – significant unobservable inputs (including a fund’s own assumptions in determining the fair value of investments) |
In cases where the inputs used to measure fair value fall in different levels of the fair value hierarchy, the level disclosed is determined based on the lowest level input that is significant to the fair value measurement in its entirety. The inputs or methodology used for valuing securities are not necessarily an indication of the risk associated with investing in those securities.
| 24 |
Eaton Vance
Large-Cap Value Fund
December 31, 2021
Notes to Financial Statements — continued
At December 31, 2021, the hierarchy of inputs used in valuing the Fund’s investments, which are carried at value, were as follows:
| Asset Description | Level 1 | Level 2 | Level 3 | Total | ||||||||||||
Common Stocks | ||||||||||||||||
Communication Services | $ | 147,070,850 | $ | — | $ | — | $ | 147,070,850 | ||||||||
Consumer Discretionary | 78,986,568 | — | — | 78,986,568 | ||||||||||||
Consumer Staples | 137,845,012 | — | — | 137,845,012 | ||||||||||||
Energy | 106,902,300 | — | — | 106,902,300 | ||||||||||||
Financials | 322,904,325 | — | — | 322,904,325 | ||||||||||||
Health Care | 271,611,346 | 26,455,182 | — | 298,066,528 | ||||||||||||
Industrials | 203,589,279 | — | — | 203,589,279 | ||||||||||||
Information Technology | 166,257,472 | — | — | 166,257,472 | ||||||||||||
Materials | 48,698,946 | — | — | 48,698,946 | ||||||||||||
Real Estate | 88,414,139 | — | — | 88,414,139 | ||||||||||||
Utilities | 101,352,445 | — | — | 101,352,445 | ||||||||||||
Total Common Stocks | $ | 1,673,632,682 | $ | 26,455,182 | * | $ | — | $ | 1,700,087,864 | |||||||
Short-Term Investments | $ | — | $ | 6,681,683 | $ | — | $ | 6,681,683 | ||||||||
Total Investments | $ | 1,673,632,682 | $ | 33,136,865 | $ | — | $ | 1,706,769,547 | ||||||||
| * | Includes foreign equity securities whose values were adjusted to reflect market trading of comparable securities or other correlated instruments that occurred after the close of trading in their applicable foreign markets. |
12 Risks and Uncertainties
Pandemic Risk
An outbreak of respiratory disease caused by a novel coronavirus was first detected in China in late 2019 and subsequently spread internationally. This coronavirus has resulted in closing borders, enhanced health screenings, changes to healthcare service preparation and delivery, quarantines, cancellations, disruptions to supply chains and customer activity, as well as general concern and uncertainty. Health crises caused by outbreaks, such as the coronavirus outbreak, may exacerbate other pre-existing political, social and economic risks and disrupt normal market conditions and operations. The impact of this outbreak has negatively affected the worldwide economy, the economies of individual countries, individual companies, and the market in general, and may continue to do so in significant and unforeseen ways, as may other epidemics and pandemics that may arise in the future. Any such impact could adversely affect the Fund’s performance, or the performance of the securities in which the Fund invests.
| 25 |
Eaton Vance
Large-Cap Value Fund
December 31, 2021
Report of Independent Registered Public Accounting Firm
To the Trustees of Eaton Vance Special Investment Trust and Shareholders of Eaton Vance Large-Cap Value Fund:
Opinion on the Financial Statements and Financial Highlights
We have audited the accompanying statement of assets and liabilities of Eaton Vance Large-Cap Value Fund (the “Fund”) (one of the funds constituting Eaton Vance Special Investment Trust), including the portfolio of investments, as of December 31, 2021, the related statement of operations for the year then ended, the statements of changes in net assets for each of the two years in the period then ended, the financial highlights for each of the five years in the period then ended, and the related notes. In our opinion, the financial statements and financial highlights present fairly, in all material respects, the financial position of the Fund as of December 31, 2021, and the results of its operations for the year then ended, the changes in its net assets for each of the two years in the period then ended, and the financial highlights for each of the five years in the period then ended, in conformity with accounting principles generally accepted in the United States of America.
Basis for Opinion
These financial statements and financial highlights are the responsibility of the Fund’s management. Our responsibility is to express an opinion on the Fund’s financial statements and financial highlights based on our audits. We are a public accounting firm registered with the Public Company Accounting Oversight Board (United States) (PCAOB) and are required to be independent with respect to the Fund in accordance with the U.S. federal securities laws and the applicable rules and regulations of the Securities and Exchange Commission and the PCAOB.
We conducted our audits in accordance with the standards of the PCAOB. Those standards require that we plan and perform the audit to obtain reasonable assurance about whether the financial statements and financial highlights are free of material misstatement, whether due to error or fraud. The Fund is not required to have, nor were we engaged to perform, an audit of its internal control over financial reporting. As part of our audits, we are required to obtain an understanding of internal control over financial reporting but not for the purpose of expressing an opinion on the effectiveness of the Fund’s internal control over financial reporting. Accordingly, we express no such opinion.
Our audits included performing procedures to assess the risks of material misstatement of the financial statements and financial highlights, whether due to error or fraud, and performing procedures that respond to those risks. Such procedures included examining, on a test basis, evidence regarding the amounts and disclosures in the financial statements and financial highlights. Our audits also included evaluating the accounting principles used and significant estimates made by management, as well as evaluating the overall presentation of the financial statements and financial highlights. Our procedures included confirmation of securities owned as of December 31, 2021, by correspondence with the custodian and brokers; when replies were not received from brokers, we performed other auditing procedures. We believe that our audits provide a reasonable basis for our opinion.
/s/ Deloitte & Touche LLP
Boston, Massachusetts
February 23, 2022
We have served as the auditor of one or more Eaton Vance investment companies since 1959.
| 26 |
Eaton Vance
Large-Cap Value Fund
December 31, 2021
Federal Tax Information (Unaudited)
The Form 1099-DIV you received in February 2022 showed the tax status of all distributions paid to your account in calendar year 2021. Shareholders are advised to consult their own tax adviser with respect to the tax consequences of their investment in the Fund. As required by the Internal Revenue Code and/or regulations, shareholders must be notified regarding the status of qualified dividend income for individuals, the dividends received deduction for corporations and capital gains dividends.
Qualified Dividend Income. For the fiscal year ended December 31, 2021, the Fund designates approximately $33,059,255, or up to the maximum amount of such dividends allowable pursuant to the Internal Revenue Code, as qualified dividend income eligible for the reduced tax rate of 15%.
Dividends Received Deduction. Corporate shareholders are generally entitled to take the dividends received deduction on the portion of the Fund’s dividend distribution that qualifies under tax law. For the Fund’s fiscal 2021 ordinary income dividends, 100% qualifies for the corporate dividends received deduction.
Capital Gains Dividends. The Fund hereby designates as a capital gain dividend with respect to the taxable year ended December 31, 2021, $125,505,870 or, if subsequently determined to be different, the net capital gain of such year.
| 27 |
Eaton Vance
Large-Cap Value Fund
December 31, 2021
Fund Management. The Trustees of Eaton Vance Special Investment Trust (the Trust) are responsible for the overall management and supervision of the Trust’s affairs. The Board members and officers of the Trust are listed below. Except as indicated, each individual has held the office shown or other offices in the same company for the last five years. Board members hold indefinite terms of office. Each Trustee holds office until his or her successor is elected and qualified, subject to a prior death, resignation, retirement, disqualification or removal. Under the terms of the Fund’s current Trustee retirement policy, an Independent Trustee must retire and resign as a Trustee on the earlier of: (i) the first day of July following his or her 74th birthday; or (ii), with limited exception, December 31st of the 20th year in which he or she has served as a Trustee. However, if such retirement and resignation would cause the Fund to be out of compliance with Section 16 of the 1940 Act or any other regulations or guidance of the SEC, then such retirement and resignation will not become effective until such time as action has been taken for the Fund to be in compliance therewith. The “noninterested Trustees” consist of those Trustees who are not “interested persons” of the Trust, as that term is defined under the 1940 Act. The business address of each Board member and officer is Two International Place, Boston, Massachusetts 02110. As used below, “BMR” refers to Boston Management and Research, “EVC” refers to Eaton Vance Corp., “EV” refers to EV LLC, “EVM” refers to Eaton Vance Management and “EVD” refers to Eaton Vance Distributors, Inc. EV is the trustee of each of EVM and BMR. Effective March 1, 2021, each of EVM, BMR, EVD and EV are indirect, wholly owned subsidiaries of Morgan Stanley. Each officer affiliated with EVM may hold a position with other EVM affiliates that is comparable to his or her position with EVM listed below. Each Trustee oversees 138 funds (with the exception of Messrs. Faust and Wennerholm and Ms. Frost who oversee 137 funds) in the Eaton Vance fund complex (including both funds and portfolios in a hub and spoke structure).
| Name and Year of Birth | Trust Position(s) | Length of Service | Principal Occupation(s) and Other Directorships During Past Five Years and Other Relevant Experience | |||
| Interested Trustee | ||||||
Thomas E. Faust Jr. 1958 | Trustee | Since 2007 | Chairman of Morgan Stanley Investment Management, Inc. (MSIM), member of the Board of Managers and President of EV, Chief Executive Officer of EVM and BMR, and Director of EVD. Formerly, Chairman, Chief Executive Officer and President of EVC. Mr. Faust is an interested person because of his positions with MSIM, BMR, EVM, EVD, and EV, which are affiliates of the Trust, and his former position with EVC, which was an affiliate of the Trust prior to March 1, 2021. Other Directorships. Formerly, Director of EVC (2007-2021) and Hexavest Inc. (investment management firm) (2012-2021). | |||
| Noninterested Trustees | ||||||
Mark R. Fetting 1954 | Trustee | Since 2016 | Private investor. Formerly held various positions at Legg Mason, Inc. (investment management firm) (2000-2012), including President, Chief Executive Officer, Director and Chairman (2008-2012), Senior Executive Vice President (2004-2008) and Executive Vice President (2001-2004). Formerly, President of Legg Mason family of funds (2001-2008). Formerly, Division President and Senior Officer of Prudential Financial Group, Inc. and related companies (investment management firm) (1991-2000). Other Directorships. None. | |||
Cynthia E. Frost 1961 | Trustee | Since 2014 | Private investor. Formerly, Chief Investment Officer of Brown University (university endowment) (2000-2012). Formerly, Portfolio Strategist for Duke Management Company (university endowment manager) (1995-2000). Formerly, Managing Director, Cambridge Associates (investment consulting company) (1989-1995). Formerly, Consultant, Bain and Company (management consulting firm) (1987-1989). Formerly, Senior Equity Analyst, BA Investment Management Company (1983-1985). Other Directorships. None. | |||
George J. Gorman 1952 | Chairperson of the Board and Trustee | Since 2021 (Chairperson) and 2014 (Trustee) | Principal at George J. Gorman LLC (consulting firm). Formerly, Senior Partner at Ernst & Young LLP (a registered public accounting firm) (1974-2009). Other Directorships. None. | |||
Valerie A. Mosley 1960 | Trustee | Since 2014 | Chairwoman and Chief Executive Officer of Valmo Ventures (a consulting and investment firm). Founder of Upward Wealth, Inc., dba BrightUP, a fintech platform. Formerly, Partner and Senior Vice President, Portfolio Manager and Investment Strategist at Wellington Management Company, LLP (investment management firm) (1992-2012). Formerly, Chief Investment Officer, PG Corbin Asset Management (1990-1992). Formerly worked in institutional corporate bond sales at Kidder Peabody (1986-1990). Other Directorships. Director of DraftKings, Inc. (digital sports entertainment and gaming company) (since September 2020). Director of Groupon, Inc. (e-commerce provider) (since April 2020). Director of Envestnet, Inc. (provider of intelligent systems for wealth management and financial wellness) (since 2018). Formerly, Director of Dynex Capital, Inc. (mortgage REIT) (2013-2020). | |||
| 28 |
Eaton Vance
Large-Cap Value Fund
December 31, 2021
Management and Organization — continued
| Name and Year of Birth | Trust Position(s) | Length of Service | Principal Occupation(s) and Other Directorships During Past Five Years and Other Relevant Experience | |||
| Noninterested Trustees (continued) | ||||||
William H. Park 1947 | Trustee | Since 2003 | Private investor. Formerly, Consultant (management and transactional) (2012-2014). Formerly, Chief Financial Officer, Aveon Group L.P. (investment management firm) (2010-2011). Formerly, Vice Chairman, Commercial Industrial Finance Corp. (specialty finance company) (2006-2010). Formerly, President and Chief Executive Officer, Prizm Capital Management, LLC (investment management firm) (2002-2005). Formerly, Executive Vice President and Chief Financial Officer, United Asset Management Corporation (investment management firm) (1982-2001). Formerly, Senior Manager, Price Waterhouse (now PricewaterhouseCoopers) (a registered public accounting firm) (1972-1981). Other Directorships. None. | |||
Helen Frame Peters 1948 | Trustee | Since 2008 | Professor of Finance, Carroll School of Management, Boston College. Formerly, Dean, Carroll School of Management, Boston College (2000-2002). Formerly, Chief Investment Officer, Fixed Income, Scudder Kemper Investments (investment management firm) (1998-1999). Formerly, Chief Investment Officer, Equity and Fixed Income, Colonial Management Associates (investment management firm) (1991-1998). Other Directorships. None. | |||
Keith Quinton 1958 | Trustee | Since 2018 | Private investor, researcher and lecturer. Formerly, Independent Investment Committee Member at New Hampshire Retirement System (2017-2021). Formerly, Portfolio Manager and Senior Quantitative Analyst at Fidelity Investments (investment management firm) (2001-2014). Other Directorships. Formerly, Director (2016-2021) and Chairman (2019-2021) of New Hampshire Municipal Bond Bank. | |||
Marcus L. Smith 1966 | Trustee | Since 2018 | Private investor. Formerly, Portfolio Manager at MFS Investment Management (investment management firm) (1994-2017). Other Directorships. Director of First Industrial Realty Trust, Inc. (an industrial REIT) (since 2021). Director of MSCI Inc. (global provider of investment decision support tools) (since 2017). Formerly, Director of DCT Industrial Trust Inc. (logistics real estate company) (2017-2018). | |||
Susan J. Sutherland 1957 | Trustee | Since 2015 | Private investor. Director of Ascot Group Limited and certain of its subsidiaries (insurance and reinsurance) (since 2017). Formerly, Director of Hagerty Holding Corp. (insurance) (2015-2018) and Montpelier Re Holdings Ltd. (insurance and reinsurance) (2013-2015). Formerly, Associate, Counsel and Partner at Skadden, Arps, Slate, Meagher & Flom LLP (law firm) (1982-2013). Other Directorships. Director of Kairos Acquisition Corp. (insurance/InsurTech acquisition company) (since 2021). | |||
Scott E. Wennerholm 1959 | Trustee | Since 2016 | Private investor. Formerly, Trustee at Wheelock College (postsecondary institution) (2012-2018). Formerly, Consultant at GF Parish Group (executive recruiting firm) (2016-2017). Formerly, Chief Operating Officer and Executive Vice President at BNY Mellon Asset Management (investment management firm) (2005-2011). Formerly, Chief Operating Officer and Chief Financial Officer at Natixis Global Asset Management (investment management firm) (1997-2004). Formerly, Vice President at Fidelity Investments Institutional Services (investment management firm) (1994-1997). Other Directorships. None. | |||
| Name and Year of Birth | Trust Position(s) | Length of Service | Principal Occupation(s) During Past Five Years | |||
| Principal Officers who are not Trustees | ||||||
Eric A. Stein 1980 | President | Since 2020 | Vice President and Chief Investment Officer, Fixed Income of EVM and BMR. Prior to November 1, 2020, Mr. Stein was a co-Director of Eaton Vance’s Global Income Investments. Also Vice President of Calvert Research and Management (“CRM”). | |||
Deidre E. Walsh 1971 | Vice President and Chief Legal Officer | Since 2009 | Vice President of EVM and BMR. Also Vice President of CRM. | |||
| 29 |
Eaton Vance
Large-Cap Value Fund
December 31, 2021
Management and Organization — continued
| Name and Year of Birth | Trust Position(s) | Length of Service | Principal Occupation(s) During Past Five Years | |||
| Principal Officers who are not Trustees (continued) | ||||||
James F. Kirchner 1967 | Treasurer | Since 2007 | Vice President of EVM and BMR. Also Vice President of CRM. | |||
Jill R. Damon 1984 | Secretary | Since 2022 | Vice President of EVM and BMR since 2017. Formerly, associate at Dechert LLP (2009-2017). | |||
Richard F. Froio 1968 | Chief Compliance Officer | Since 2017 | Vice President of EVM and BMR since 2017. Formerly, Deputy Chief Compliance Officer (Adviser/Funds) and Chief Compliance Officer (Distribution) at PIMCO (2012-2017) and Managing Director at BlackRock/Barclays Global Investors (2009-2012). | |||
The SAI for the Fund includes additional information about the Trustees and officers of the Trust and can be obtained without charge on Eaton Vance’s website at www.eatonvance.com or by calling 1-800-262-1122.
| 30 |
Eaton Vance Funds
| Privacy Notice | April 2021 |
| FACTS | WHAT DOES EATON VANCE DO WITH YOUR PERSONAL INFORMATION? | |
| Why? | Financial companies choose how they share your personal information. Federal law gives consumers the right to limit some but not all sharing. Federal law also requires us to tell you how we collect, share, and protect your personal information. Please read this notice carefully to understand what we do. | |
| What? | The types of personal information we collect and share depend on the product or service you have with us. This information can include:
∎ Social Security number and income ∎ investment experience and risk tolerance ∎ checking account number and wire transfer instructions | |
| How? | All financial companies need to share customers’ personal information to run their everyday business. In the section below, we list the reasons financial companies can share their customers’ personal information; the reasons Eaton Vance chooses to share; and whether you can limit this sharing. | |
| Reasons we can share your personal information | Does Eaton Vance share? | Can you limit this sharing? | ||
| For our everyday business purposes — such as to process your transactions, maintain your account(s), respond to court orders and legal investigations, or report to credit bureaus | Yes | No | ||
| For our marketing purposes — to offer our products and services to you | Yes | No | ||
| For joint marketing with other financial companies | No | We don’t share | ||
| For our investment management affiliates’ everyday business purposes — information about your transactions, experiences, and creditworthiness | Yes | Yes | ||
| For our affiliates’ everyday business purposes — information about your transactions and experiences | Yes | No | ||
| For our affiliates’ everyday business purposes — information about your creditworthiness | No | We don’t share | ||
| For our investment management affiliates to market to you | Yes | Yes | ||
| For our affiliates to market to you | No | We don’t share | ||
| For nonaffiliates to market to you | No | We don’t share |
| To limit our sharing | Call toll-free 1-800-262-1122 or email: EVPrivacy@eatonvance.com
Please note:
If you are a new customer, we can begin sharing your information 30 days from the date we sent this notice. When you are no longer our customer, we continue to share your information as described in this notice. However, you can contact us at any time to limit our sharing. | |
| Questions? | Call toll-free 1-800-262-1122 or email: EVPrivacy@eatonvance.com | |
| 31 |
Eaton Vance Funds
| Privacy Notice — continued | April 2021 |
| Page 2 |
| Who we are | ||
| Who is providing this notice? | Eaton Vance Management, Eaton Vance Distributors, Inc., Eaton Vance Trust Company, Eaton Vance Management (International) Limited, Eaton Vance Advisers International Ltd., Eaton Vance Global Advisors Limited, Eaton Vance Management’s Real Estate Investment Group, Boston Management and Research, Calvert Research and Management, Eaton Vance and Calvert Fund Families and our investment advisory affiliates (“Eaton Vance”) (see Investment Management Affiliates definition below) | |
| What we do | ||
| How does Eaton Vance protect my personal information? | To protect your personal information from unauthorized access and use, we use security measures that comply with federal law. These measures include computer safeguards and secured files and buildings. We have policies governing the proper handling of customer information by personnel and requiring third parties that provide support to adhere to appropriate security standards with respect to such information. | |
| How does Eaton Vance collect my personal information? | We collect your personal information, for example, when you
∎ open an account or make deposits or withdrawals from your account ∎ buy securities from us or make a wire transfer ∎ give us your contact information
We also collect your personal information from others, such as credit bureaus, affiliates, or other companies. | |
| Why can’t I limit all sharing? | Federal law gives you the right to limit only
∎ sharing for affiliates’ everyday business purposes — information about your creditworthiness ∎ affiliates from using your information to market to you ∎ sharing for nonaffiliates to market to you
State laws and individual companies may give you additional rights to limit sharing. See below for more on your rights under state law. | |
| Definitions | ||
| Investment Management Affiliates | Eaton Vance Investment Management Affiliates include registered investment advisers, registered broker-dealers, and registered and unregistered funds. Investment Management Affiliates does not include entities associated with Morgan Stanley Wealth Management, such as Morgan Stanley Smith Barney LLC and Morgan Stanley & Co. | |
| Affiliates | Companies related by common ownership or control. They can be financial and nonfinancial companies.
∎ Our affiliates include companies with a Morgan Stanley name and financial companies such as Morgan Stanley Smith Barney LLC and Morgan Stanley & Co. | |
| Nonaffiliates | Companies not related by common ownership or control. They can be financial and nonfinancial companies.
∎ Eaton Vance does not share with nonaffiliates so they can market to you. | |
| Joint marketing | A formal agreement between nonaffiliated financial companies that together market financial products or services to you.
∎ Eaton Vance doesn’t jointly market. | |
| Other important information | ||
Vermont: Except as permitted by law, we will not share personal information we collect about Vermont residents with Nonaffiliates unless you provide us with your written consent to share such information.
California: Except as permitted by law, we will not share personal information we collect about California residents with Nonaffiliates and we will limit sharing such personal information with our Affiliates to comply with California privacy laws that apply to us. | ||
| 32 |
Eaton Vance Funds
Delivery of Shareholder Documents. The Securities and Exchange Commission (SEC) permits funds to deliver only one copy of shareholder documents, including prospectuses, proxy statements and shareholder reports, to fund investors with multiple accounts at the same residential or post office box address. This practice is often called “householding” and it helps eliminate duplicate mailings to shareholders. Eaton Vance, or your financial intermediary, may household the mailing of your documents indefinitely unless you instruct Eaton Vance, or your financial intermediary, otherwise. If you would prefer that your Eaton Vance documents not be householded, please contact Eaton Vance at 1-800-262-1122, or contact your financial intermediary. Your instructions that householding not apply to delivery of your Eaton Vance documents will typically be effective within 30 days of receipt by Eaton Vance or your financial intermediary.
Portfolio Holdings. Each Eaton Vance Fund and its underlying Portfolio(s) (if applicable) files a schedule of portfolio holdings on Part F to Form N-PORT with the SEC. Certain information filed on Form N-PORT may be viewed on the Eaton Vance website at www.eatonvance.com, by calling Eaton Vance at 1-800-262-1122 or in the EDGAR database on the SEC’s website at www.sec.gov.
Proxy Voting. From time to time, funds are required to vote proxies related to the securities held by the funds. The Eaton Vance Funds or their underlying Portfolios (if applicable) vote proxies according to a set of policies and procedures approved by the Funds’ and Portfolios’ Boards. You may obtain a description of these policies and procedures and information on how the Funds or Portfolios voted proxies relating to portfolio securities during the most recent 12-month period ended June 30, without charge, upon request, by calling 1-800-262-1122 and by accessing the SEC’s website at www.sec.gov.
| 33 |
This Page Intentionally Left Blank
This Page Intentionally Left Blank
This Page Intentionally Left Blank
Investment Adviser
Boston Management and Research
Two International Place
Boston, MA 02110
Administrator
Eaton Vance Management
Two International Place
Boston, MA 02110
Principal Underwriter*
Eaton Vance Distributors, Inc.
Two International Place
Boston, MA 02110
(617) 482-8260
Custodian
State Street Bank and Trust Company
State Street Financial Center, One Lincoln Street
Boston, MA 02111
Transfer Agent
BNY Mellon Investment Servicing (US) Inc.
Attn: Eaton Vance Funds
P.O. Box 9653
Providence, RI 02940-9653
(800) 262-1122
Independent Registered Public Accounting Firm
Deloitte & Touche LLP
200 Berkeley Street
Boston, MA 02116-5022
Fund Offices
Two International Place
Boston, MA 02110
| * | FINRA BrokerCheck. Investors may check the background of their Investment Professional by contacting the Financial Industry Regulatory Authority (FINRA). FINRA BrokerCheck is a free tool to help investors check the professional background of current and former FINRA-registered securities firms and brokers. FINRA BrokerCheck is available by calling 1-800-289-9999 and at www.FINRA.org. The FINRA BrokerCheck brochure describing this program is available to investors at www.FINRA.org. |
173 12.31.21

Eaton Vance
Small-Cap Fund
Annual Report
December 31, 2021

Commodity Futures Trading Commission Registration. The Commodity Futures Trading Commission (“CFTC”) has adopted regulations that subject registered investment companies and advisers to regulation by the CFTC if a fund invests more than a prescribed level of its assets in certain CFTC-regulated instruments (including futures, certain options and swap agreements) or markets itself as providing investment exposure to such instruments. The investment adviser has claimed an exclusion from the definition of “commodity pool operator” under the Commodity Exchange Act with respect to its management of the Fund. Accordingly, neither the Fund nor the adviser with respect to the operation of the Fund is subject to CFTC regulation. Because of its management of other strategies, the Fund’s adviser is registered with the CFTC as a commodity pool operator. The adviser is also registered as a commodity trading advisor.
Fund shares are not insured by the FDIC and are not deposits or other obligations of, or guaranteed by, any depository institution. Shares are subject to investment risks, including possible loss of principal invested.
This report must be preceded or accompanied by a current summary prospectus or prospectus. Before investing, investors should consider carefully the investment objective, risks, and charges and expenses of a mutual fund. This and other important information is contained in the summary prospectus and prospectus, which can be obtained from a financial intermediary. Prospective investors should read the prospectus carefully before investing. For further information, please call 1-800-262-1122.
Annual Report December 31, 2021
Eaton Vance
Small-Cap Fund
| 2 | ||||
| 3 | ||||
| 4 | ||||
| 5 | ||||
| 6 | ||||
| 7 | ||||
| 23 | ||||
| 24 | ||||
| 25 | ||||
| 28 | ||||
| 30 |
Eaton Vance
Small-Cap Fund
December 31, 2021
Management’s Discussion of Fund Performance1
Economic and Market Conditions
The 12-month period starting January 1, 2021, was notable for a U.S. equity rally that lasted for most of the period and resulted in U.S. stocks outperforming most other stock markets in developed economies. Except for temporary retreats in September and November, broad-market indexes generally posted strong returns during the period. Investors cheered the reopening of businesses that had been affected by the pandemic and the rollout of several highly effective COVID-19 vaccines.
COVID-19, however, continued to have a firm grip on the U.S. economy. Disease rates advanced and declined with second, third, and fourth waves of infections. Worker shortages led to global supply-chain disruptions. From computer chips to shipping containers, scarcities of key items led to temporary factory shutdowns and empty store shelves. Those shortages — combined with high demand from consumers eager to spend money saved earlier in the pandemic — led to higher year-over-year inflation than the U.S. had seen in decades.
Still, investor optimism about a recovering economy drove stock prices up during most of the period. A significant pullback, however, occurred in September 2021 when virtually every major U.S. stock index reported negative returns. Unexpectedly weak job creation in August and the U.S. Federal Reserve’s (the Fed’s) announcement that it might soon begin tapering its monthly bond purchases — which had stimulated the economy earlier — combined to drive stocks into negative territory. Rising COVID-19 infections also weighed on equity performance in September.
In the final quarter of 2021, however, stock prices came roaring back. Even the late-November news of a new and more transmissible COVID-19 variant — Omicron — caused only a temporary market retreat. The Fed’s actions to tamp down inflation were applauded by investors, with stocks gaining ground after the central bank announced that tapering would be accelerated and that three possible interest rate hikes were forecast for 2022. Just two trading days before year-end, the S&P 500® Index closed at its 70th new all-time high for the period, and the Dow Jones Industrial Average® (DJIA) closed at an all-time high as well.
For the period as a whole, the broad-market S&P 500® Index returned 28.71%; the blue-chip DJIA was up 20.95%; and the technology-laden Nasdaq Composite Index rose 22.18%. Large-cap U.S. stocks, as measured by the Russell 1000® Index, outperformed their small-cap counterparts, as measured by the Russell 2000® Index. In the large-cap space, growth stocks modestly outperformed value stocks, but in the small-cap space, value stocks strongly outperformed growth stocks during the period.
Fund Performance
For the 12-month period ended December 31, 2021, Eaton Vance Small-Cap Fund (the Fund) returned 21.18% for Class A shares at net asset value (NAV), outperforming its benchmark, the Russell 2000® Index (the Index), which returned 14.82%.
Outperformance was largely driven by sector selections. An underweight exposure to health care — the weakest sector within the Index and the only one with negative performance during the period — contributed to relative returns. Selections within the real estate and materials sectors also benefited relative performance.
The Fund’s underweight exposure to energy — the strongest performing sector within the Index — was the leading detractor from relative returns. Security selections in the industrials, information technology (IT), and consumer staples sectors also weighed on relative performance during the period.
In the materials sector, Valvoline, Inc. (Valvoline), a provider of automotive lubricants, chemicals, and services, was the largest individual contributor to Fund returns during the period. Valvoline’s stock price rose as the U.S. economy revived from business shutdowns early in the pandemic and as its retail operation showed strong organic growth.
Ambarella, Inc., a designer of semiconductors for high-definition video, was also a leading contributor. Its stock price rose on successive quarters of better-than-expected sales and projections of strong growth. Its semiconductors are used for a variety of applications, including video security, driver assistance systems, autonomous driving, and robotics.
In the real estate sector, CubeSmart, a REIT that invests in self-storage facilities, was another strong contributor during the period. Its stock price rose as its revenues outpaced those of its competitors.
The Fund’s position in Haemonetics Corp. (Haemonetics), a provider of blood and plasma products and services in the health care sector, was the leading detractor from returns relative to the Index during the period. Its stock price fell after one of its largest customers, CSL, informed the company it would discontinue use of its plasma collection devices and was shifting to a partnership with a competitor. By period end, Haemonetics was sold from the Fund.
Also in health care, the Fund’s ownership of LHC Group, Inc. (LHC), a provider of home health care services, detracted from relative performance. LHC’s stock price weakened as the COVID-19 pandemic limited demand for home health services and costs rose because of increased wages for nurses.
In the industrials sector, Mercury Systems, Inc. (Mercury), a provider of electronics to the defense industry, also weighed on relative returns during the period. Mercury’s stock price fell as its organic growth slowed and on investor concerns that defense department spending might decline. By period-end, Mercury was sold from the Fund.
See Endnotes and Additional Disclosures in this report.
Past performance is no guarantee of future results. Returns are historical and are calculated by determining the percentage change in net asset value (NAV) or offering price (as applicable) with all distributions reinvested. Investment return and principal value will fluctuate so that shares, when redeemed, may be worth more or less than their original cost. Performance for periods less than or equal to one year is cumulative. Performance is for the stated time period only; due to market volatility, current Fund performance may be lower or higher than the quoted return. For performance as of the most recent month-end, please refer to eatonvance.com.
| 2 |
Eaton Vance
Small-Cap Fund
December 31, 2021
Portfolio Manager(s) Michael D. McLean, CFA and J. Griffith Noble, CFA
| % Average Annual Total Returns | Class Inception Date | Performance Inception Date | One Year | Five Years | Ten Years | |||||||||||||||
Class A at NAV | 01/02/1997 | 01/02/1997 | 21.18 | % | 13.52 | % | 13.12 | % | ||||||||||||
Class A with 5.75% Maximum Sales Charge | — | — | 14.19 | 12.18 | 12.45 | |||||||||||||||
Class C at NAV | 05/03/2002 | 01/02/1997 | 20.25 | 12.68 | 12.44 | |||||||||||||||
Class C with 1% Maximum Sales Charge | — | — | 19.25 | 12.68 | 12.44 | |||||||||||||||
Class I at NAV | 09/02/2008 | 01/02/1997 | 21.46 | 13.79 | 13.40 | |||||||||||||||
Class R at NAV | 08/03/2009 | 01/02/1997 | 20.82 | 13.23 | 12.84 | |||||||||||||||
| ||||||||||||||||||||
Russell 2000® Index | — | — | 14.82 | % | 12.01 | % | 13.22 | % | ||||||||||||
| % Total Annual Operating Expense Ratios4 | Class A | Class C | Class I | Class R | ||||||||||||||||
Gross | 1.46 | % | 2.21 | % | 1.21 | % | 1.71 | % | ||||||||||||
Net | 1.21 | 1.96 | 0.96 | 1.46 | ||||||||||||||||
Growth of $10,000
This graph shows the change in value of a hypothetical investment of $10,000 in Class A of the Fund for the period indicated. For comparison, the same investment is shown in the indicated index.
| Growth of Investment | Amount Invested | Period Beginning | At NAV | With Maximum Sales Charge | ||||||||||||
Class C | $10,000 | 12/31/2011 | $32,336 | N.A. | ||||||||||||
Class I | $250,000 | 12/31/2011 | $879,688 | N.A. | ||||||||||||
Class R | $10,000 | 12/31/2011 | $33,500 | N.A. | ||||||||||||
See Endnotes and Additional Disclosures in this report.
Past performance is no guarantee of future results. Returns are historical and are calculated by determining the percentage change in net asset value (NAV) or offering price (as applicable) with all distributions reinvested. Investment return and principal value will fluctuate so that shares, when redeemed, may be worth more or less than their original cost. Performance for periods less than or equal to one year is cumulative. Performance is for the stated time period only; due to market volatility, current Fund performance may be lower or higher than the quoted return. For performance as of the most recent month-end, please refer to eatonvance.com.
| 3 |
Eaton Vance
Small-Cap Fund
December 31, 2021
Sector Allocation (% of net assets)5
Top 10 Holdings (% of net assets)5
Performance Food Group Co. | 2.7 | % | ||
Valvoline, Inc. | 2.7 | |||
AZEK Co., Inc. (The) | 2.6 | |||
CBIZ, Inc. | 2.4 | |||
Terminix Global Holdings, Inc. | 2.1 | |||
SouthState Corp. | 2.1 | |||
Chemed Corp. | 2.1 | |||
Dorman Products, Inc. | 1.9 | |||
Envista Holdings Corp. | 1.9 | |||
National Vision Holdings, Inc. | 1.8 | |||
Total | 22.3 | % | ||
See Endnotes and Additional Disclosures in this report.
| 4 |
Eaton Vance
Small-Cap Fund
December 31, 2021
Endnotes and Additional Disclosures
| 1 | The views expressed in this report are those of the portfolio manager(s) and are current only through the date stated at the top of this page. These views are subject to change at any time based upon market or other conditions, and Eaton Vance and the Fund(s) disclaim any responsibility to update such views. These views may not be relied upon as investment advice and, because investment decisions are based on many factors, may not be relied upon as an indication of trading intent on behalf of any Eaton Vance fund. This commentary may contain statements that are not historical facts, referred to as “forward-looking statements.” The Fund’s actual future results may differ significantly from those stated in any forward-looking statement, depending on factors such as changes in securities or financial markets or general economic conditions, the volume of sales and purchases of Fund shares, the continuation of investment advisory, administrative and service contracts, and other risks discussed from time to time in the Fund’s filings with the Securities and Exchange Commission. |
| 2 | Russell 2000® Index is an unmanaged index of 2,000 U.S. small- cap stocks. Unless otherwise stated, index returns do not reflect the effect of any applicable sales charges, commissions, expenses, taxes or leverage, as applicable. It is not possible to invest directly in an index. |
| 3 | Total Returns at NAV do not include applicable sales charges. If sales charges were deducted, the returns would be lower. Total Returns shown with maximum sales charge reflect the stated maximum sales charge. Unless otherwise stated, performance does not reflect the deduction of taxes on Fund distributions or redemptions of Fund shares. |
Effective November 5, 2020, Class C shares automatically convert to Class A shares eight years after purchase. The average annual total returns listed for Class C reflect conversion to Class A shares after eight years. Prior to November 5, 2020, Class C shares automatically converted to Class A shares ten years after purchase.
| 4 | Source: Fund prospectus. Net expense ratios reflect a contractual expense reimbursement that continues through 4/30/22. The expense ratios for the current reporting period can be found in the Financial Highlights section of this report. Performance reflects expenses waived and/or reimbursed, if applicable. Without such waivers and/or reimbursements, performance would have been lower. |
| 5 | Excludes cash and cash equivalents. |
Fund profile subject to change due to active management.
Additional Information
S&P 500® Index is an unmanaged index of large-cap stocks commonly used as a measure of U.S. stock market performance. Dow Jones Industrial Average® is a price-weighted average of 30 blue-chip stocks that are generally the leaders in their industry. S&P Dow Jones Indices are a product of S&P Dow Jones Indices LLC (“S&P DJI”) and have been licensed for use. S&P® and S&P 500® are registered trademarks of S&P DJI; Dow Jones® is a registered trademark of Dow Jones Trademark Holdings LLC (“Dow Jones”); S&P DJI, Dow Jones and their respective affiliates do not sponsor, endorse, sell or promote the Fund, will not have any liability with respect thereto and do not have any liability for any errors, omissions, or interruptions of the S&P Dow Jones Indices. Nasdaq Composite Index is a market capitalization-weighted index of all domestic and international securities listed on Nasdaq. Source: Nasdaq, Inc. The information is provided by Nasdaq (with its affiliates, are referred to as the “Corporations”) and Nasdaq’s third party licensors on an “as is” basis and the Corporations make no guarantees and bear no liability of any kind with respect to the information or the Fund. Russell 1000® Index is an unmanaged index of 1,000 U.S. large-cap stocks.
| 5 |
Eaton Vance
Small-Cap Fund
December 31, 2021
Example: As a Fund shareholder, you incur two types of costs: (1) transaction costs, including sales charges (loads) on purchases and redemption fees (if applicable); and (2) ongoing costs, including management fees; distribution and/or service fees; and other Fund expenses. This Example is intended to help you understand your ongoing costs (in dollars) of Fund investing and to compare these costs with the ongoing costs of investing in other mutual funds. The Example is based on an investment of $1,000 invested at the beginning of the period and held for the entire period (July 1, 2021 – December 31, 2021).
Actual Expenses: The first section of the table below provides information about actual account values and actual expenses. You may use the information in this section, together with the amount you invested, to estimate the expenses that you paid over the period. Simply divide your account value by $1,000 (for example, an $8,600 account value divided by $1,000 = 8.6), then multiply the result by the number in the first section under the heading entitled “Expenses Paid During Period” to estimate the expenses you paid on your account during this period.
Hypothetical Example for Comparison Purposes: The second section of the table below provides information about hypothetical account values and hypothetical expenses based on the actual Fund expense ratio and an assumed rate of return of 5% per year (before expenses), which is not the actual Fund return. The hypothetical account values and expenses may not be used to estimate the actual ending account balance or expenses you paid for the period. You may use this information to compare the ongoing costs of investing in your Fund and other funds. To do so, compare this 5% hypothetical example with the 5% hypothetical examples that appear in the shareholder reports of the other funds.
Please note that the expenses shown in the table are meant to highlight your ongoing costs only and do not reflect any transactional costs, such as sales charges (loads) or redemption fees (if applicable). Therefore, the second section of the table is useful in comparing ongoing costs only, and will not help you determine the relative total costs of owning different funds. In addition, if these transactional costs were included, your costs would be higher.
| Beginning Account Value (7/1/21) | Ending Account Value (12/31/21) | Expenses Paid During Period* (7/1/21 – 12/31/21) | Annualized Expense Ratio | |||||||||||||
Actual | ||||||||||||||||
Class A | $ | 1,000.00 | $ | 1,066.00 | $ | 6.30 | ** | 1.21 | % | |||||||
Class C | $ | 1,000.00 | $ | 1,061.90 | $ | 10.19 | ** | 1.96 | % | |||||||
Class I | $ | 1,000.00 | $ | 1,067.10 | $ | 5.00 | ** | 0.96 | % | |||||||
Class R | $ | 1,000.00 | $ | 1,063.90 | $ | 7.60 | ** | 1.46 | % | |||||||
Hypothetical | ||||||||||||||||
(5% return per year before expenses) | ||||||||||||||||
Class A | $ | 1,000.00 | $ | 1,019.11 | $ | 6.16 | ** | 1.21 | % | |||||||
Class C | $ | 1,000.00 | $ | 1,015.33 | $ | 9.96 | ** | 1.96 | % | |||||||
Class I | $ | 1,000.00 | $ | 1,020.37 | $ | 4.89 | ** | 0.96 | % | |||||||
Class R | $ | 1,000.00 | $ | 1,017.85 | $ | 7.43 | ** | 1.46 | % | |||||||
| * | Expenses are equal to the Fund’s annualized expense ratio for the indicated Class, multiplied by the average account value over the period, multiplied by 184/365 (to reflect the one-half year period). The Example assumes that the $1,000 was invested at the net asset value per share determined at the close of business on June 30, 2021. |
| ** | Absent an allocation of certain expenses to an affiliate, expenses would be higher. |
| 6 |
Eaton Vance
Small-Cap Fund
December 31, 2021
| Common Stocks — 98.6% |
| |||||||
| Security | Shares | Value | ||||||
| Aerospace & Defense — 1.0% | ||||||||
Hexcel Corp.(1) | 26,728 | $ | 1,384,510 | |||||
| $ | 1,384,510 | |||||||
| Auto Components — 4.2% | ||||||||
Dana, Inc. | 81,218 | $ | 1,853,395 | |||||
Dorman Products, Inc.(1) | 24,259 | 2,741,509 | ||||||
Visteon Corp.(1) | 13,127 | 1,458,935 | ||||||
| $ | 6,053,839 | |||||||
| Automobiles — 1.2% | ||||||||
Harley-Davidson, Inc. | 46,091 | $ | 1,737,170 | |||||
| $ | 1,737,170 | |||||||
| Banks — 11.9% | ||||||||
Commerce Bancshares, Inc. | 38,503 | $ | 2,646,696 | |||||
Community Bank System, Inc. | 27,040 | 2,013,939 | ||||||
Glacier Bancorp, Inc. | 24,162 | 1,369,985 | ||||||
Independent Bank Corp. | 19,153 | 1,561,544 | ||||||
Independent Bank Group, Inc. | 19,390 | 1,398,989 | ||||||
Pinnacle Financial Partners, Inc. | 21,487 | 2,052,008 | ||||||
SouthState Corp. | 37,163 | 2,977,128 | ||||||
Stock Yards Bancorp, Inc. | 17,917 | 1,144,538 | ||||||
UMB Financial Corp. | 11,146 | 1,182,702 | ||||||
Wintrust Financial Corp. | 7,697 | 699,042 | ||||||
| $ | 17,046,571 | |||||||
| Biotechnology — 0.9% | ||||||||
Neurocrine Biosciences, Inc.(1) | 14,493 | $ | 1,234,369 | |||||
| $ | 1,234,369 | |||||||
| Building Products — 4.7% | ||||||||
AAON, Inc. | 15,276 | $ | 1,213,372 | |||||
AZEK Co., Inc. (The)(1) | 81,245 | 3,756,769 | ||||||
CSW Industrials, Inc. | 14,551 | 1,758,634 | ||||||
| $ | 6,728,775 | |||||||
| Capital Markets — 0.8% | ||||||||
Cohen & Steers, Inc. | 12,527 | $ | 1,158,873 | |||||
| $ | 1,158,873 | |||||||
| Chemicals — 4.5% | ||||||||
Balchem Corp. | 5,609 | $ | 945,677 | |||||
| Security | Shares | Value | ||||||
| Chemicals (continued) | ||||||||
Quaker Chemical Corp. | 7,100 | $ | 1,638,538 | |||||
Valvoline, Inc. | 104,499 | 3,896,768 | ||||||
| $ | 6,480,983 | |||||||
| Commercial Services & Supplies — 2.4% | ||||||||
Casella Waste Systems, Inc.(1) | 11,341 | $ | 968,748 | |||||
Kimball International, Inc., Class B | 36,058 | 368,874 | ||||||
MillerKnoll, Inc. | 54,547 | 2,137,697 | ||||||
| $ | 3,475,319 | |||||||
| Diversified Consumer Services — 2.1% | ||||||||
Terminix Global Holdings, Inc.(1) | 68,132 | $ | 3,081,610 | |||||
| $ | 3,081,610 | |||||||
| Electronic Equipment, Instruments & Components — 1.1% | ||||||||
National Instruments Corp. | 36,981 | $ | 1,614,960 | |||||
| $ | 1,614,960 | |||||||
| Equity Real Estate Investment Trusts (REITs) — 7.2% | ||||||||
CubeSmart | 39,675 | $ | 2,257,904 | |||||
EastGroup Properties, Inc. | 9,515 | 2,167,993 | ||||||
Essential Properties Realty Trust, Inc. | 82,920 | 2,390,584 | ||||||
Rexford Industrial Realty, Inc. | 19,320 | 1,567,045 | ||||||
STORE Capital Corp. | 56,218 | 1,933,899 | ||||||
| $ | 10,317,425 | |||||||
| Food & Staples Retailing — 3.2% | ||||||||
Chefs’ Warehouse, Inc. (The)(1) | 23,227 | $ | 773,459 | |||||
Performance Food Group Co.(1) | 85,011 | 3,901,155 | ||||||
| $ | 4,674,614 | |||||||
| Food Products — 1.6% | ||||||||
J&J Snack Foods Corp. | 4,352 | $ | 687,442 | |||||
Nomad Foods, Ltd.(1) | 62,384 | 1,583,930 | ||||||
| $ | 2,271,372 | |||||||
| Gas Utilities — 1.8% | ||||||||
ONE Gas, Inc. | 33,675 | $ | 2,612,843 | |||||
| $ | 2,612,843 | |||||||
| Health Care Equipment & Supplies — 5.1% | ||||||||
Envista Holdings Corp.(1) | 59,581 | $ | 2,684,720 | |||||
ICU Medical, Inc.(1) | 6,514 | 1,546,033 | ||||||
| 7 | See Notes to Financial Statements. |
Eaton Vance
Small-Cap Fund
December 31, 2021
Portfolio of Investments — continued
| Security | Shares | Value | ||||||
| Health Care Equipment & Supplies (continued) | ||||||||
Integra LifeSciences Holdings Corp.(1) | 33,466 | $ | 2,241,887 | |||||
Ortho Clinical Diagnostics Holdings PLC(1) | 36,855 | 788,328 | ||||||
| $ | 7,260,968 | |||||||
| Health Care Providers & Services — 9.3% | ||||||||
Addus HomeCare Corp.(1) | 22,837 | $ | 2,135,488 | |||||
Agiliti, Inc.(1) | 85,487 | 1,979,879 | ||||||
AMN Healthcare Services, Inc.(1) | 5,678 | 694,590 | ||||||
Apria, Inc.(1) | 15,722 | 512,537 | ||||||
Chemed Corp. | 5,580 | 2,952,043 | ||||||
LHC Group, Inc.(1) | 18,497 | 2,538,343 | ||||||
R1 RCM, Inc.(1) | 97,426 | 2,483,389 | ||||||
| $ | 13,296,269 | |||||||
| Hotels, Restaurants & Leisure — 2.5% | ||||||||
Choice Hotels International, Inc. | 11,496 | $ | 1,793,261 | |||||
Wyndham Hotels & Resorts, Inc. | 19,335 | 1,733,383 | ||||||
| $ | 3,526,644 | |||||||
| Household Durables — 0.5% | ||||||||
Tempur Sealy International, Inc. | 15,916 | $ | 748,530 | |||||
| $ | 748,530 | |||||||
| Insurance — 6.1% | ||||||||
AMERISAFE, Inc. | 13,435 | $ | 723,206 | |||||
James River Group Holdings, Ltd. | 19,892 | 573,088 | ||||||
Kinsale Capital Group, Inc. | 4,185 | 995,570 | ||||||
RLI Corp. | 17,200 | 1,928,120 | ||||||
Ryan Specialty Group Holdings, Inc., Class A(1) | 56,791 | 2,291,517 | ||||||
Selective Insurance Group, Inc. | 27,091 | 2,219,837 | ||||||
| $ | 8,731,338 | |||||||
| Interactive Media & Services — 1.7% | ||||||||
CarGurus, Inc.(1) | 73,266 | $ | 2,464,668 | |||||
| $ | 2,464,668 | |||||||
| IT Services — 1.2% | ||||||||
Euronet Worldwide, Inc.(1) | 14,885 | $ | 1,773,846 | |||||
| $ | 1,773,846 | |||||||
| Machinery — 4.7% | ||||||||
Allison Transmission Holdings, Inc. | 44,334 | $ | 1,611,541 | |||||
Middleby Corp.(1) | 11,272 | 2,217,879 | ||||||
| Security | Shares | Value | ||||||
| Machinery (continued) | ||||||||
Mueller Water Products, Inc., Class A | 115,351 | $ | 1,661,054 | |||||
Woodward, Inc. | 11,522 | 1,261,198 | ||||||
| $ | 6,751,672 | |||||||
| Professional Services — 2.4% | ||||||||
CBIZ, Inc.(1) | 86,686 | $ | 3,391,156 | |||||
| $ | 3,391,156 | |||||||
| Road & Rail — 1.5% | ||||||||
Landstar System, Inc. | 12,388 | $ | 2,217,700 | |||||
| $ | 2,217,700 | |||||||
| Semiconductors & Semiconductor Equipment — 2.3% | ||||||||
Ambarella, Inc.(1) | 11,174 | $ | 2,267,093 | |||||
Silicon Laboratories, Inc.(1) | 4,924 | 1,016,412 | ||||||
| $ | 3,283,505 | |||||||
| Software — 6.8% | ||||||||
ACI Worldwide, Inc.(1) | 61,604 | $ | 2,137,659 | |||||
Altair Engineering, Inc., Class A(1) | 23,590 | 1,823,979 | ||||||
Clearwater Analytics Holdings, Inc., Class A(1) | 54,252 | 1,246,711 | ||||||
Envestnet, Inc.(1) | 27,942 | 2,216,918 | ||||||
nCino, Inc.(1) | 22,333 | 1,225,189 | ||||||
Olo, Inc., Class A(1) | 51,183 | 1,065,118 | ||||||
| $ | 9,715,574 | |||||||
| Specialty Retail — 1.8% | ||||||||
National Vision Holdings, Inc.(1) | 55,172 | $ | 2,647,704 | |||||
| $ | 2,647,704 | |||||||
| Textiles, Apparel & Luxury Goods — 1.7% | ||||||||
Capri Holdings, Ltd.(1) | 21,023 | $ | 1,364,603 | |||||
Steven Madden, Ltd. | 22,585 | 1,049,525 | ||||||
| $ | 2,414,128 | |||||||
| Trading Companies & Distributors — 2.4% | ||||||||
Applied Industrial Technologies, Inc. | 9,793 | $ | 1,005,741 | |||||
Herc Holdings, Inc. | 15,687 | 2,455,800 | ||||||
| $ | 3,461,541 | |||||||
Total Common Stocks |
| $ | 141,558,476 | |||||
| 8 | See Notes to Financial Statements. |
Eaton Vance
Small-Cap Fund
December 31, 2021
Portfolio of Investments — continued
| Short-Term Investments — 1.3% |
| |||||||
| Description | Units | Value | ||||||
Eaton Vance Cash Reserves Fund, LLC, 0.08%(2) | 1,936,813 | $ | 1,936,619 | |||||
Total Short-Term Investments |
| $ | 1,936,619 | |||||
Total Investments — 99.9% |
| $ | 143,495,095 | |||||
Other Assets, Less Liabilities — 0.1% |
| $ | 148,166 | |||||
Net Assets — 100.0% |
| $ | 143,643,261 | |||||
The percentage shown for each investment category in the Portfolio of Investments is based on net assets.
| (1) | Non-income producing security. |
| (2) | Affiliated investment company, available to Eaton Vance portfolios and funds, which invests in high quality, U.S. dollar denominated money market instruments. The rate shown is the annualized seven-day yield as of December 31, 2021. |
| 9 | See Notes to Financial Statements. |
Eaton Vance
Small-Cap Fund
December 31, 2021
Statement of Assets and Liabilities
| Assets | December 31, 2021 | |||
Unaffiliated investments, at value (identified cost, $102,254,616) | $ | 141,558,476 | ||
Affiliated investment, at value (identified cost, $1,936,619) | 1,936,619 | |||
Dividends receivable | 128,192 | |||
Dividends receivable from affiliated investment | 125 | |||
Receivable for investments sold | 8,328,973 | |||
Receivable for Fund shares sold | 253,033 | |||
Receivable from affiliate | 17,641 | |||
Total assets | $ | 152,223,059 | ||
| Liabilities |
| |||
Payable for Fund shares redeemed | $ | 8,383,287 | ||
Payable to affiliates: | ||||
Investment adviser fee | 91,170 | |||
Administration fee | 18,234 | |||
Distribution and service fees | 8,802 | |||
Trustees’ fees | 1,670 | |||
Accrued expenses | 76,635 | |||
Total liabilities | $ | 8,579,798 | ||
Net Assets | $ | 143,643,261 | ||
| Sources of Net Assets |
| |||
Paid-in capital | $ | 103,732,011 | ||
Distributable earnings | 39,911,250 | |||
Net Assets | $ | 143,643,261 | ||
| Class A Shares | ||||
Net Assets | $ | 28,882,152 | ||
Shares Outstanding | 1,853,127 | |||
Net Asset Value and Redemption Price Per Share | ||||
(net assets ÷ shares of beneficial interest outstanding) | $ | 15.59 | ||
Maximum Offering Price Per Share | ||||
(100 ÷ 94.25 of net asset value per share) | $ | 16.54 | ||
| Class C Shares |
| |||
Net Assets | $ | 3,254,105 | ||
Shares Outstanding | 273,970 | |||
Net Asset Value and Offering Price Per Share* | ||||
(net assets ÷ shares of beneficial interest outstanding) | $ | 11.88 | ||
| Class I Shares |
| |||
Net Assets | $ | 111,052,022 | ||
Shares Outstanding | 6,215,200 | |||
Net Asset Value, Offering Price and Redemption Price Per Share | ||||
(net assets ÷ shares of beneficial interest outstanding) | $ | 17.87 | ||
| Class R Shares |
| |||
Net Assets | $ | 454,982 | ||
Shares Outstanding | 30,966 | |||
Net Asset Value, Offering Price and Redemption Price Per Share | ||||
(net assets ÷ shares of beneficial interest outstanding) | $ | 14.69 | ||
On sales of $50,000 or more, the offering price of Class A shares is reduced.
| * | Redemption price per share is equal to the net asset value less any applicable contingent deferred sales charge. |
| 10 | See Notes to Financial Statements. |
Eaton Vance
Small-Cap Fund
December 31, 2021
Statement of Operations
| Investment Income | Year Ended December 31, 2021 | |||
Dividends | $ | 1,283,815 | ||
Dividends from affiliated investment | 1,735 | |||
Total investment income | $ | 1,285,550 | ||
| Expenses | ||||
Investment adviser fee | $ | 993,755 | ||
Administration fee | 198,751 | |||
Distribution and service fees | ||||
Class A | 71,854 | |||
Class C | 34,504 | |||
Class R | 2,962 | |||
Trustees’ fees and expenses | 6,956 | |||
Custodian fee | 43,402 | |||
Transfer and dividend disbursing agent fees | 110,458 | |||
Legal and accounting services | 46,265 | |||
Printing and postage | 15,113 | |||
Registration fees | 60,725 | |||
Miscellaneous | 16,364 | |||
Total expenses | $ | 1,601,109 | ||
Deduct — | ||||
Allocation of expenses to affiliate | $ | 219,582 | ||
Total expense reductions | $ | 219,582 | ||
Net expenses | $ | 1,381,527 | ||
Net investment loss | $ | (95,977 | ) | |
| Realized and Unrealized Gain (Loss) | ||||
Net realized gain (loss) — | ||||
Investment transactions | $ | 18,348,654 | ||
Investment transactions — affiliated investment | (253 | ) | ||
Net realized gain | $ | 18,348,401 | ||
Change in unrealized appreciation (depreciation) — | ||||
Investments | $ | 6,733,999 | ||
Net change in unrealized appreciation (depreciation) | $ | 6,733,999 | ||
Net realized and unrealized gain | $ | 25,082,400 | ||
Net increase in net assets from operations | $ | 24,986,423 | ||
| 11 | See Notes to Financial Statements. |
Eaton Vance
Small-Cap Fund
December 31, 2021
Statements of Changes in Net Assets
| Year Ended December 31, | ||||||||
| Increase (Decrease) in Net Assets | 2021 | 2020 | ||||||
From operations — | ||||||||
Net investment income (loss) | $ | (95,977 | ) | $ | 136,594 | |||
Net realized gain | 18,348,401 | 840,972 | ||||||
Net change in unrealized appreciation (depreciation) | 6,733,999 | 13,406,758 | ||||||
Net increase in net assets from operations | $ | 24,986,423 | $ | 14,384,324 | ||||
Distributions to shareholders — | ||||||||
Class A | $ | (3,568,657 | ) | $ | (281,411 | ) | ||
Class C | (485,866 | ) | (52,234 | ) | ||||
Class I | (12,370,274 | ) | (744,845 | ) | ||||
Class R | (56,381 | ) | (6,409 | ) | ||||
Total distributions to shareholders | $ | (16,481,178 | ) | $ | (1,084,899 | ) | ||
Transactions in shares of beneficial interest — | ||||||||
Proceeds from sale of shares | ||||||||
Class A | $ | 2,045,106 | $ | 3,797,807 | ||||
Class C | 801,257 | 663,299 | ||||||
Class I | 37,317,290 | 40,823,265 | ||||||
Class R | 240,208 | 86,418 | ||||||
Net asset value of shares issued to shareholders in payment of distributions declared | ||||||||
Class A | 3,463,684 | 272,983 | ||||||
Class C | 485,842 | 51,943 | ||||||
Class I | 12,118,112 | 724,682 | ||||||
Class R | 56,381 | 6,409 | ||||||
Cost of shares redeemed | ||||||||
Class A | (5,468,835 | ) | (5,001,626 | ) | ||||
Class C | (1,370,508 | ) | (1,379,203 | ) | ||||
Class I | (27,577,610 | ) | (26,584,075 | ) | ||||
Class R | (457,733 | ) | (166,638 | ) | ||||
Net asset value of shares converted | ||||||||
Class A | 319,506 | 553,937 | ||||||
Class C | (319,506 | ) | (553,937 | ) | ||||
Net increase in net assets from Fund share transactions | $ | 21,653,194 | $ | 13,295,264 | ||||
Net increase in net assets | $ | 30,158,439 | $ | 26,594,689 | ||||
| Net Assets |
| |||||||
At beginning of year | $ | 113,484,822 | $ | 86,890,133 | ||||
At end of year | $ | 143,643,261 | $ | 113,484,822 | ||||
| 12 | See Notes to Financial Statements. |
Eaton Vance
Small-Cap Fund
December 31, 2021
Financial Highlights
| Class A | ||||||||||||||||||||
| Year Ended December 31, | ||||||||||||||||||||
| 2021 | 2020 | 2019 | 2018 | 2017 | ||||||||||||||||
Net asset value — Beginning of year | $ | 14.690 | $ | 13.190 | $ | 11.100 | $ | 13.150 | $ | 12.740 | ||||||||||
| Income (Loss) From Operations | ||||||||||||||||||||
Net investment income (loss)(1) | $ | (0.041 | ) | $ | 0.001 | $ | (0.008 | ) | $ | (0.026 | ) | $ | (0.057 | ) | ||||||
Net realized and unrealized gain (loss) | 3.103 | 1.654 | 3.046 | (0.660 | ) | 1.916 | ||||||||||||||
Total income (loss) from operations | $ | 3.062 | $ | 1.655 | $ | 3.038 | $ | (0.686 | ) | $ | 1.859 | |||||||||
| Less Distributions | ||||||||||||||||||||
From net realized gain | $ | (2.162 | ) | $ | (0.155 | ) | $ | (0.948 | ) | $ | (1.364 | ) | $ | (1.449 | ) | |||||
Total distributions | $ | (2.162 | ) | $ | (0.155 | ) | $ | (0.948 | ) | $ | (1.364 | ) | $ | (1.449 | ) | |||||
Net asset value — End of year | $ | 15.590 | $ | 14.690 | $ | 13.190 | $ | 11.100 | $ | 13.150 | ||||||||||
Total Return(2)(3) | 21.18 | % | 12.73 | % | 27.54 | % | (5.81 | )% | 14.91 | % | ||||||||||
| Ratios/Supplemental Data | ||||||||||||||||||||
Net assets, end of year (000’s omitted) | $ | 28,882 | $ | 26,683 | $ | 24,530 | $ | 19,329 | $ | 24,865 | ||||||||||
Ratios (as a percentage of average daily net assets): | ||||||||||||||||||||
Expenses(3) | 1.21 | % | 1.21 | % | 1.21 | % | 1.35 | % | 1.42 | % | ||||||||||
Net investment income (loss) | (0.25 | )% | 0.01 | % | (0.06 | )% | (0.19 | )% | (0.43 | )% | ||||||||||
Portfolio Turnover | 55 | % | 71 | % | 54 | % | 44 | % | 50 | % | ||||||||||
| (1) | Computed using average shares outstanding. |
| (2) | Returns are historical and are calculated by determining the percentage change in net asset value with all distributions reinvested and do not reflect the effect of sales charges. |
| (3) | The administrator reimbursed certain operating expenses (equal to 0.17%, 0.25%, 0.29%, 0.17% and 0.10% of average daily net assets for the years ended December 31, 2021, 2020, 2019, 2018 and 2017, respectively). Absent this reimbursement, total return would be lower. |
| 13 | See Notes to Financial Statements. |
Eaton Vance
Small-Cap Fund
December 31, 2021
Financial Highlights — continued
| Class C | ||||||||||||||||||||
| Year Ended December 31, | ||||||||||||||||||||
| 2021 | 2020 | 2019 | 2018 | 2017 | ||||||||||||||||
Net asset value — Beginning of year | $ | 11.630 | $ | 10.550 | $ | 9.100 | $ | 11.110 | $ | 11.040 | ||||||||||
| Income (Loss) From Operations | ||||||||||||||||||||
Net investment loss(1) | $ | (0.131 | ) | $ | (0.074 | ) | $ | (0.092 | ) | $ | (0.108 | ) | $ | (0.133 | ) | |||||
Net realized and unrealized gain (loss) | 2.440 | 1.309 | 2.490 | (0.538 | ) | 1.652 | ||||||||||||||
Total income (loss) from operations | $ | 2.309 | $ | 1.235 | $ | 2.398 | $ | (0.646 | ) | $ | 1.519 | |||||||||
| Less Distributions | ||||||||||||||||||||
From net realized gain | $ | (2.059 | ) | $ | (0.155 | ) | $ | (0.948 | ) | $ | (1.364 | ) | $ | (1.449 | ) | |||||
Total distributions | $ | (2.059 | ) | $ | (0.155 | ) | $ | (0.948 | ) | $ | (1.364 | ) | $ | (1.449 | ) | |||||
Net asset value — End of year | $ | 11.880 | $ | 11.630 | $ | 10.550 | $ | 9.100 | $ | 11.110 | ||||||||||
Total Return(2)(3) | 20.25 | % | 11.93 | % | 26.54 | % | (6.52 | )% | 14.11 | % | ||||||||||
| Ratios/Supplemental Data | ||||||||||||||||||||
Net assets, end of year (000’s omitted) | $ | 3,254 | $ | 3,517 | $ | 4,564 | $ | 7,356 | $ | 9,565 | ||||||||||
Ratios (as a percentage of average daily net assets): | ||||||||||||||||||||
Expenses(3) | 1.96 | % | 1.96 | % | 1.96 | % | 2.10 | % | 2.17 | % | ||||||||||
Net investment loss | (1.01 | )% | (0.76 | )% | (0.87 | )% | (0.94 | )% | (1.17 | )% | ||||||||||
Portfolio Turnover | 55 | % | 71 | % | 54 | % | 44 | % | 50 | % | ||||||||||
| (1) | Computed using average shares outstanding. |
| (2) | Returns are historical and are calculated by determining the percentage change in net asset value with all distributions reinvested and do not reflect the effect of sales charges. |
| (3) | The administrator reimbursed certain operating expenses (equal to 0.17%, 0.25%, 0.29%, 0.17% and 0.10% of average daily net assets for the years ended December 31, 2021, 2020, 2019, 2018 and 2017, respectively). Absent this reimbursement, total return would be lower. |
| 14 | See Notes to Financial Statements. |
Eaton Vance
Small-Cap Fund
December 31, 2021
Financial Highlights — continued
| Class I | ||||||||||||||||||||
| Year Ended December 31, | ||||||||||||||||||||
| 2021 | 2020 | 2019 | 2018 | 2017 | ||||||||||||||||
Net asset value — Beginning of year | $ | 16.570 | $ | 14.830 | $ | 12.360 | $ | 14.450 | $ | 13.840 | ||||||||||
| Income (Loss) From Operations | ||||||||||||||||||||
Net investment income (loss)(1) | $ | 0.003 | $ | 0.037 | $ | 0.029 | $ | 0.010 | $ | (0.022 | ) | |||||||||
Net realized and unrealized gain (loss) | 3.502 | 1.873 | 3.389 | (0.736 | ) | 2.081 | ||||||||||||||
Total income (loss) from operations | $ | 3.505 | $ | 1.910 | $ | 3.418 | $ | (0.726 | ) | $ | 2.059 | |||||||||
| Less Distributions | ||||||||||||||||||||
From net investment income | $ | (0.017 | ) | $ | (0.015 | ) | $ | — | $ | — | $ | — | ||||||||
From net realized gain | (2.188 | ) | (0.155 | ) | (0.948 | ) | (1.364 | ) | (1.449 | ) | ||||||||||
Total distributions | $ | (2.205 | ) | $ | (0.170 | ) | $ | (0.948 | ) | $ | (1.364 | ) | $ | (1.449 | ) | |||||
Net asset value — End of year | $ | 17.870 | $ | 16.570 | $ | 14.830 | $ | 12.360 | $ | 14.450 | ||||||||||
Total Return(2)(3) | 21.46 | % | 13.05 | % | 27.81 | % | (5.57 | )% | 15.17 | % | ||||||||||
| Ratios/Supplemental Data | ||||||||||||||||||||
Net assets, end of year (000’s omitted) | $ | 111,052 | $ | 82,716 | $ | 57,202 | $ | 35,097 | $ | 45,587 | ||||||||||
Ratios (as a percentage of average daily net assets): | ||||||||||||||||||||
Expenses(3) | 0.96 | % | 0.96 | % | 0.96 | % | 1.10 | % | 1.16 | % | ||||||||||
Net investment income (loss) | 0.01 | % | 0.27 | % | 0.20 | % | 0.07 | % | (0.15 | )% | ||||||||||
Portfolio Turnover | 55 | % | 71 | % | 54 | % | 44 | % | 50 | % | ||||||||||
| (1) | Computed using average shares outstanding. |
| (2) | Returns are historical and are calculated by determining the percentage change in net asset value with all distributions reinvested. |
| (3) | The administrator reimbursed certain operating expenses (equal to 0.17%, 0.25%, 0.29%, 0.17% and 0.10% of average daily net assets for the years ended December 31, 2021, 2020, 2019, 2018 and 2017, respectively). Absent this reimbursement, total return would be lower. |
| 15 | See Notes to Financial Statements. |
Eaton Vance
Small-Cap Fund
December 31, 2021
Financial Highlights — continued
| Class R | ||||||||||||||||||||
| Year Ended December 31, | ||||||||||||||||||||
| 2021 | 2020 | 2019 | 2018 | 2017 | ||||||||||||||||
Net asset value — Beginning of year | $ | 13.930 | $ | 12.540 | $ | 10.620 | $ | 12.670 | $ | 12.350 | ||||||||||
| Income (Loss) From Operations | ||||||||||||||||||||
Net investment loss(1) | $ | (0.082 | ) | $ | (0.029 | ) | $ | (0.042 | ) | $ | (0.053 | ) | $ | (0.084 | ) | |||||
Net realized and unrealized gain (loss) | 2.936 | 1.574 | 2.910 | (0.633 | ) | 1.853 | ||||||||||||||
Total income (loss) from operations | $ | 2.854 | $ | 1.545 | $ | 2.868 | $ | (0.686 | ) | $ | 1.769 | |||||||||
| Less Distributions | ||||||||||||||||||||
From net realized gain | $ | (2.094 | ) | $ | (0.155 | ) | $ | (0.948 | ) | $ | (1.364 | ) | $ | (1.449 | ) | |||||
Total distributions | $ | (2.094 | ) | $ | (0.155 | ) | $ | (0.948 | ) | $ | (1.364 | ) | $ | (1.449 | ) | |||||
Net asset value — End of year | $ | 14.690 | $ | 13.930 | $ | 12.540 | $ | 10.620 | $ | 12.670 | ||||||||||
Total Return(2)(3) | 20.82 | % | 12.51 | % | 27.18 | % | (6.04 | )% | 14.64 | % | ||||||||||
| Ratios/Supplemental Data | ||||||||||||||||||||
Net assets, end of year (000’s omitted) | $ | 455 | $ | 569 | $ | 595 | $ | 799 | $ | 722 | ||||||||||
Ratios (as a percentage of average daily net assets): | ||||||||||||||||||||
Expenses(3) | 1.46 | % | 1.46 | % | 1.46 | % | 1.60 | % | 1.66 | % | ||||||||||
Net investment loss | (0.53 | )% | (0.25 | )% | (0.34 | )% | (0.40 | )% | (0.66 | )% | ||||||||||
Portfolio Turnover | 55 | % | 71 | % | 54 | % | 44 | % | 50 | % | ||||||||||
| (1) | Computed using average shares outstanding. |
| (2) | Returns are historical and are calculated by determining the percentage change in net asset value with all distributions reinvested. |
| (3) | The administrator reimbursed certain operating expenses (equal to 0.17%, 0.25%, 0.29%, 0.17% and 0.10% of average daily net assets for the years ended December 31, 2021, 2020, 2019, 2018 and 2017, respectively). Absent this reimbursement, total return would be lower. |
| 16 | See Notes to Financial Statements. |
Eaton Vance
Small-Cap Fund
December 31, 2021
Notes to Financial Statements
1 Significant Accounting Policies
Eaton Vance Small-Cap Fund (the Fund) is a diversified series of Eaton Vance Special Investment Trust (the Trust). The Trust is a Massachusetts business trust registered under the Investment Company Act of 1940, as amended (the 1940 Act), as an open-end management investment company. The Fund’s investment objective is to seek long-term capital appreciation. The Fund offers four classes of shares. Class A shares are generally sold subject to a sales charge imposed at time of purchase. Class C shares are sold at net asset value and are generally subject to a contingent deferred sales charge (see Note 5). Effective January 25, 2019, Class C shares generally automatically convert to Class A shares ten years after their purchase and, effective November 5, 2020, automatically convert to Class A shares eight years after their purchase as described in the Fund’s prospectus. Class I and Class R shares are sold at net asset value and are not subject to a sales charge. Each class represents a pro-rata interest in the Fund, but votes separately on class-specific matters and (as noted below) is subject to different expenses. Realized and unrealized gains and losses and net investment income and losses, other than class-specific expenses, are allocated daily to each class of shares based on the relative net assets of each class to the total net assets of the Fund. Each class of shares differs in its distribution plan and certain other class-specific expenses.
The following is a summary of significant accounting policies of the Fund. The policies are in conformity with accounting principles generally accepted in the United States of America (U.S. GAAP). The Fund is an investment company and follows accounting and reporting guidance in the Financial Accounting Standards Board (FASB) Accounting Standards Codification Topic 946.
A Investment Valuation — The following methodologies are used to determine the market value or fair value of investments.
Equity Securities. Equity securities listed on a U.S. securities exchange generally are valued at the last sale or closing price on the day of valuation or, if no sales took place on such date, at the mean between the closing bid and ask prices on the exchange where such securities are principally traded. Equity securities listed on the NASDAQ National Market System are valued at the NASDAQ official closing price. Unlisted or listed securities for which closing sales prices or closing quotations are not available are valued at the mean between the latest available bid and ask prices.
Affiliated Fund. The Fund may invest in Eaton Vance Cash Reserves Fund, LLC (Cash Reserves Fund), an affiliated investment company managed by Eaton Vance Management (EVM). While Cash Reserves Fund is not a registered money market mutual fund, it conducts all of its investment activities in accordance with the requirements of Rule 2a-7 under the 1940 Act. Investments in Cash Reserves Fund are valued at the closing net asset value per unit on the valuation day. Cash Reserves Fund generally values its investment securities based on available market quotations provided by a third party pricing service.
Fair Valuation. Investments for which valuations or market quotations are not readily available or are deemed unreliable are valued at fair value using methods determined in good faith by or at the direction of the Trustees of the Fund in a manner that most fairly reflects the security’s “fair value”, which is the amount that the Fund might reasonably expect to receive for the security upon its current sale in the ordinary course. Each such determination is based on a consideration of relevant factors, which are likely to vary from one pricing context to another. These factors may include, but are not limited to, the type of security, the existence of any contractual restrictions on the security’s disposition, the price and extent of public trading in similar securities of the issuer or of comparable companies or entities, quotations or relevant information obtained from broker/dealers or other market participants, information obtained from the issuer, analysts, and/or the appropriate stock exchange (for exchange-traded securities), an analysis of the company’s or entity’s financial statements, and an evaluation of the forces that influence the issuer and the market(s) in which the security is purchased and sold.
B Investment Transactions — Investment transactions for financial statement purposes are accounted for on a trade date basis. Realized gains and losses on investments sold are determined on the basis of identified cost.
C Income — Dividend income is recorded on the ex-dividend date for dividends received in cash and/or securities.
D Federal Taxes — The Fund’s policy is to comply with the provisions of the Internal Revenue Code applicable to regulated investment companies and to distribute to shareholders each year substantially all of its net investment income, and all or substantially all of its net realized capital gains. Accordingly, no provision for federal income or excise tax is necessary.
As of December 31, 2021, the Fund had no uncertain tax positions that would require financial statement recognition, de-recognition, or disclosure. The Fund files a U.S. federal income tax return annually after its fiscal year-end, which is subject to examination by the Internal Revenue Service for a period of three years from the date of filing.
E Expenses — The majority of expenses of the Trust are directly identifiable to an individual fund. Expenses which are not readily identifiable to a specific fund are allocated taking into consideration, among other things, the nature and type of expense and the relative size of the funds.
F Use of Estimates — The preparation of the financial statements in conformity with U.S. GAAP requires management to make estimates and assumptions that affect the reported amounts of assets and liabilities at the date of the financial statements and the reported amounts of income and expense during the reporting period. Actual results could differ from those estimates.
G Indemnifications — Under the Trust’s organizational documents, its officers and Trustees may be indemnified against certain liabilities and expenses arising out of the performance of their duties to the Fund. Under Massachusetts law, if certain conditions prevail, shareholders of a Massachusetts business trust (such as the Trust) could be deemed to have personal liability for the obligations of the Trust. However, the Trust’s Declaration of Trust contains an express disclaimer of liability on the part of Fund shareholders and the By-laws provide that the Trust shall assume, upon request by the shareholder, the
| 17 |
Eaton Vance
Small-Cap Fund
December 31, 2021
Notes to Financial Statements — continued
defense on behalf of any Fund shareholders. Moreover, the By-laws also provide for indemnification out of Fund property of any shareholder held personally liable solely by reason of being or having been a shareholder for all loss or expense arising from such liability. Additionally, in the normal course of business, the Fund enters into agreements with service providers that may contain indemnification clauses. The Fund’s maximum exposure under these arrangements is unknown as this would involve future claims that may be made against the Fund that have not yet occurred.
2 Distributions to Shareholders and Income Tax Information
It is the present policy of the Fund to make at least one distribution annually (normally in December) of all or substantially all of its net investment income and to distribute annually all or substantially all of its net realized capital gains. Distributions to shareholders are recorded on the ex-dividend date. Distributions are declared separately for each class of shares. Shareholders may reinvest income and capital gain distributions in additional shares of the same class of the Fund at the net asset value as of the ex-dividend date or, at the election of the shareholder, receive distributions in cash. Distributions to shareholders are determined in accordance with income tax regulations, which may differ from U.S. GAAP. As required by U.S. GAAP, only distributions in excess of tax basis earnings and profits are reported in the financial statements as a return of capital. Permanent differences between book and tax accounting relating to distributions are reclassified to paid-in capital. For tax purposes, distributions from short-term capital gains are considered to be from ordinary income.
The tax character of distributions declared for the years ended December 31, 2021 and December 31, 2020 was as follows:
| Year Ended December 31, | ||||||||
| 2021 | 2020 | |||||||
Ordinary income | $ | 6,063,195 | $ | 194,250 | ||||
Long-term capital gains | $ | 10,417,983 | $ | 890,649 | ||||
During the year ended December 31, 2021, distributable earnings was decreased by $1,198,600 and paid-in capital was increased by $1,198,600 due to the Fund’s use of equalization accounting. Tax equalization accounting allows the Fund to treat as a distribution that portion of redemption proceeds representing a redeeming shareholder’s portion of undistributed taxable income and net capital gains. These reclassifications had no effect on the net assets or net asset value per share of the Fund.
As of December 31, 2021, the components of distributable earnings (accumulated loss) on a tax basis were as follows:
Undistributed ordinary income | $ | 591,596 | ||
Undistributed long-term capital gains | 2,038,989 | |||
Net unrealized appreciation | 37,280,665 | |||
Distributable earnings | $ | 39,911,250 | ||
The cost and unrealized appreciation (depreciation) of investments of the Fund at December 31, 2021, as determined on a federal income tax basis, were as follows:
Aggregate cost | $ | 106,214,430 | ||
Gross unrealized appreciation | $ | 38,894,515 | ||
Gross unrealized depreciation | (1,613,850 | ) | ||
Net unrealized appreciation | $ | 37,280,665 | ||
3 Investment Adviser Fee and Other Transactions with Affiliates
The investment adviser fee is earned by Boston Management and Research (BMR) as compensation for investment advisory services rendered to the Fund. On March 1, 2021, Morgan Stanley acquired Eaton Vance Corp. (the “Transaction”) and BMR became an indirect, wholly-owned subsidiary of Morgan Stanley. In connection with the Transaction, the Fund entered into a new investment advisory agreement (the “New Agreement”) with BMR, which took
| 18 |
Eaton Vance
Small-Cap Fund
December 31, 2021
Notes to Financial Statements — continued
effect on March 1, 2021. Pursuant to the New Agreement (and the Fund’s investment advisory agreement with BMR in effect prior to March 1, 2021), the fee is computed at an annual rate as a percentage of average daily net assets as follows and is payable monthly:
| Average Daily Net Assets | Annual Fee Rate | |||
Up to $500 million | 0.7500 | % | ||
$500 million but less than $1 billion | 0.6875 | % | ||
$1 billion but less than $1.5 billion | 0.6250 | % | ||
$1.5 billion but less than $2 billion | 0.5625 | % | ||
$2 billion but less than $3 billion | 0.5000 | % | ||
$3 billion and over | 0.4375 | % | ||
For the year ended December 31, 2021, the Fund’s investment adviser fee amounted to $993,755 or 0.75% of the Fund’s average daily net assets. The Fund may invest its cash in Cash Reserves Fund. EVM does not currently receive a fee for advisory services provided to Cash Reserves Fund. The administration fee is earned by EVM, an affiliate of BMR and effective March 1, 2021, an indirect, wholly-owned subsidiary of Morgan Stanley, as compensation for administrative services rendered to the Fund. The fee is computed at an annual rate of 0.15% of the Fund’s average daily net assets. For the year ended December 31, 2021, the administration fee amounted to $198,751.
EVM has agreed to reimburse the Fund’s expenses to the extent that total annual operating expenses (relating to ordinary operating expenses only) exceed 1.21%, 1.96%, 0.96% and 1.46% of the Fund’s average daily net assets for Class A, Class C, Class I and Class R, respectively. This agreement may be changed or terminated after April 30, 2022. Pursuant to this agreement, EVM was allocated $219,582 of the Fund’s operating expenses for the year ended December 31, 2021.
EVM provides sub-transfer agency and related services to the Fund pursuant to a Sub-Transfer Agency Support Services Agreement. For the year ended December 31, 2021, EVM earned $13,788 from the Fund pursuant to such agreement, which is included in transfer and dividend disbursing agent fees on the Statement of Operations. The Fund was informed that Eaton Vance Distributors, Inc. (EVD), an affiliate of EVM and the Fund’s principal underwriter, received $2,382 as its portion of the sales charge on sales of Class A shares for the year ended December 31, 2021. EVD also received distribution and service fees from Class A, Class C and Class R shares (see Note 4) and contingent deferred sales charges (see Note 5).
Trustees and officers of the Fund who are members of EVM’s or BMR’s organizations receive remuneration for their services to the Fund out of the investment adviser fee. Trustees of the Fund who are not affiliated with the investment adviser may elect to defer receipt of all or a percentage of their annual fees in accordance with the terms of the Trustees Deferred Compensation Plan. For the year ended December 31, 2021, no significant amounts have been deferred. Certain officers and Trustees of the Fund are officers of the above organizations.
4 Distribution Plans
The Fund has in effect a distribution plan for Class A shares (Class A Plan) pursuant to Rule 12b-1 under the 1940 Act. Pursuant to the Class A Plan, the Fund pays EVD a distribution and service fee of 0.25% per annum of its average daily net assets attributable to Class A shares for distribution services and facilities provided to the Fund by EVD, as well as for personal services and/or the maintenance of shareholder accounts. Distribution and service fees paid or accrued to EVD for the year ended December 31, 2021 amounted to $71,854 for Class A shares.
The Fund also has in effect distribution plans for Class C shares (Class C Plan) and Class R shares (Class R Plan) pursuant to Rule 12b-1 under the 1940 Act. Pursuant to the Class C Plan, the Fund pays EVD amounts equal to 0.75% per annum of its average daily net assets attributable to Class C shares for providing ongoing distribution services and facilities to the Fund. For the year ended December 31, 2021, the Fund paid or accrued to EVD $25,878 for Class C shares.
The Class R Plan requires the Fund to pay EVD an amount up to 0.50% per annum of its average daily net assets attributable to Class R shares for providing ongoing distribution services and facilities to the Fund. The Trustees of the Trust have currently limited Class R distribution payments to 0.25% per annum of the average daily net assets attributable to Class R shares. For the year ended December 31, 2021, the Fund paid or accrued to EVD $1,481 for Class R shares.
Pursuant to the Class C and Class R Plans, the Fund also makes payments of service fees to EVD, financial intermediaries and other persons in amounts equal to 0.25% per annum of its average daily net assets attributable to that class. Service fees paid or accrued are for personal services and/or the maintenance of shareholder accounts. They are separate and distinct from the sales commissions and distribution fees payable to EVD. Service fees paid or accrued for the year ended December 31, 2021 amounted to $8,626 and $1,481 for Class C and Class R shares, respectively.
Distribution and service fees are subject to the limitations contained in the Financial Industry Regulatory Authority Rule 2341(d).
| 19 |
Eaton Vance
Small-Cap Fund
December 31, 2021
Notes to Financial Statements — continued
5 Contingent Deferred Sales Charges
A contingent deferred sales charge (CDSC) of 1% generally is imposed on redemptions of Class C shares made within 12 months of purchase. Class A shares may be subject to a 1% CDSC if redeemed within 18 months of purchase (depending on the circumstances of purchase). Generally, the CDSC is based upon the lower of the net asset value at date of redemption or date of purchase. No charge is levied on shares acquired by reinvestment of dividends or capital gain distributions. For the year ended December 31, 2021, the Fund was informed that EVD received approximately $500 of CDSCs paid by Class C shareholders and no CDSCs paid by Class A shareholders.
6 Purchases and Sales of Investments
Purchases and sales of investments, other than short-term obligations, aggregated $75,085,367 and $70,682,580, respectively, for the year ended December 31, 2021.
7 Shares of Beneficial Interest
The Fund’s Declaration of Trust permits the Trustees to issue an unlimited number of full and fractional shares of beneficial interest (without par value). Such shares may be issued in a number of different series (such as the Fund) and classes. Transactions in Fund shares were as follows:
| Year Ended December 31, | ||||||||
| Class A | 2021 | 2020 | ||||||
Sales | 124,193 | 308,199 | ||||||
Issued to shareholders electing to receive payments of distributions in Fund shares | 227,276 | 21,350 | ||||||
Redemptions | (334,602 | ) | (418,016 | ) | ||||
Converted from Class C shares | 20,068 | 44,510 | ||||||
Net increase (decrease) | 36,935 | (43,957 | ) | |||||
| Year Ended December 31, | ||||||||
| Class C | 2021 | 2020 | ||||||
Sales | 61,246 | 65,068 | ||||||
Issued to shareholders electing to receive payments of distributions in Fund shares | 41,811 | 5,129 | ||||||
Redemptions | (106,034 | ) | (144,414 | ) | ||||
Converted to Class A shares | (25,459 | ) | (55,951 | ) | ||||
Net decrease | (28,436 | ) | (130,168 | ) | ||||
| Year Ended December 31, | ||||||||
| Class I | 2021 | 2020 | ||||||
Sales | 2,046,359 | 3,158,255 | ||||||
Issued to shareholders electing to receive payments of distributions in Fund shares | 693,653 | 49,613 | ||||||
Redemptions | (1,516,312 | ) | (2,073,389 | ) | ||||
Net increase | 1,223,700 | 1,134,479 | ||||||
| 20 |
Eaton Vance
Small-Cap Fund
December 31, 2021
Notes to Financial Statements — continued
| Year Ended December 31, | ||||||||
| Class R | 2021 | 2020 | ||||||
Sales | 15,360 | 7,347 | ||||||
Issued to shareholders electing to receive payments of distributions in Fund shares | 3,923 | 528 | ||||||
Redemptions | (29,146 | ) | (14,483 | ) | ||||
Net decrease | (9,863 | ) | (6,608 | ) | ||||
8 Line of Credit
The Fund participates with other portfolios and funds managed by EVM and its affiliates in an $800 million unsecured line of credit agreement with a group of banks, which is in effect through October 25, 2022. Borrowings are made by the Fund solely for temporary purposes related to redemptions and other short-term cash needs. Interest is charged to the Fund based on its borrowings at an amount above either the Secured Overnight Financing Rate (SOFR) or Federal Funds rate. In addition, a fee computed at an annual rate of 0.15% on the daily unused portion of the line of credit is allocated among the participating portfolios and funds at the end of each quarter. In connection with the renewal of the agreement in October 2021, an arrangement fee totaling $150,000 was incurred that was allocated to the participating portfolios and funds. Because the line of credit is not available exclusively to the Fund, it may be unable to borrow some or all of its requested amounts at any particular time. The Fund did not have any significant borrowings or allocated fees during the year ended December 31, 2021.
9 Investments in Affiliated Funds
At December 31, 2021, the value of the Fund’s investment in affiliated funds was $1,936,619, which represents 1.3% of the Fund’s net assets. Transactions in affiliated funds by the Fund for the year ended December 31, 2021 were as follows:
| Name | Value, beginning of period | Purchases | Sales proceeds | Net realized gain (loss) | Change in unrealized appreciation (depreciation) | Value, end of period | Dividend income | Units, end of period | ||||||||||||||||||||||||
Short-Term Investments |
| |||||||||||||||||||||||||||||||
Eaton Vance Cash Reserves Fund, LLC | $ | 2,082,397 | $ | 41,944,819 | $ | (42,090,344 | ) | $ | (253 | ) | $ | — | $ | 1,936,619 | $ | 1,735 | 1,936,813 | |||||||||||||||
10 Fair Value Measurements
Under generally accepted accounting principles for fair value measurements, a three-tier hierarchy to prioritize the assumptions, referred to as inputs, is used in valuation techniques to measure fair value. The three-tier hierarchy of inputs is summarized in the three broad levels listed below.
| • | Level 1 – quoted prices in active markets for identical investments |
| • | Level 2 – other significant observable inputs (including quoted prices for similar investments, interest rates, prepayment speeds, credit risk, etc.) |
| • | Level 3 – significant unobservable inputs (including a fund’s own assumptions in determining the fair value of investments) |
In cases where the inputs used to measure fair value fall in different levels of the fair value hierarchy, the level disclosed is determined based on the lowest level input that is significant to the fair value measurement in its entirety. The inputs or methodology used for valuing securities are not necessarily an indication of the risk associated with investing in those securities.
| 21 |
Eaton Vance
Small-Cap Fund
December 31, 2021
Notes to Financial Statements — continued
At December 31, 2021, the hierarchy of inputs used in valuing the Fund’s investments, which are carried at value, were as follows:
| Asset Description | Level 1 | Level 2 | Level 3 | Total | ||||||||||||
Common Stocks | $ | 141,558,476 | * | $ | — | $ | — | $ | 141,558,476 | |||||||
Short-Term Investments | — | 1,936,619 | — | 1,936,619 | ||||||||||||
Total Investments | $ | 141,558,476 | $ | 1,936,619 | $ | — | $ | 143,495,095 | ||||||||
| * | The level classification by major category of investments is the same as the category presentation in the Portfolio of Investments. |
11 Risks and Uncertainties
Pandemic Risk
An outbreak of respiratory disease caused by a novel coronavirus was first detected in China in late 2019 and subsequently spread internationally. This coronavirus has resulted in closing borders, enhanced health screenings, changes to healthcare service preparation and delivery, quarantines, cancellations, disruptions to supply chains and customer activity, as well as general concern and uncertainty. Health crises caused by outbreaks, such as the coronavirus outbreak, may exacerbate other pre-existing political, social and economic risks and disrupt normal market conditions and operations. The impact of this outbreak has negatively affected the worldwide economy, the economies of individual countries, individual companies, and the market in general, and may continue to do so in significant and unforeseen ways, as may other epidemics and pandemics that may arise in the future. Any such impact could adversely affect the Fund’s performance, or the performance of the securities in which the Fund invests.
| 22 |
Eaton Vance
Small-Cap Fund
December 31, 2021
Report of Independent Registered Public Accounting Firm
To the Trustees of Eaton Vance Special Investment Trust and Shareholders of Eaton Vance Small-Cap Fund:
Opinion on the Financial Statements and Financial Highlights
We have audited the accompanying statement of assets and liabilities of Eaton Vance Small-Cap Fund (the “Fund”) (one of the funds constituting Eaton Vance Special Investment Trust), including the portfolio of investments, as of December 31, 2021, the related statement of operations for the year then ended, the statements of changes in net assets for each of the two years in the period then ended, the financial highlights for each of the five years in the period then ended, and the related notes. In our opinion, the financial statements and financial highlights present fairly, in all material respects, the financial position of the Fund as of December 31, 2021, and the results of its operations for the year then ended, the changes in its net assets for each of the two years in the period then ended, and the financial highlights for each of the five years in the period then ended, in conformity with accounting principles generally accepted in the United States of America.
Basis for Opinion
These financial statements and financial highlights are the responsibility of the Fund’s management. Our responsibility is to express an opinion on the Fund’s financial statements and financial highlights based on our audits. We are a public accounting firm registered with the Public Company Accounting Oversight Board (United States) (PCAOB) and are required to be independent with respect to the Fund in accordance with the U.S. federal securities laws and the applicable rules and regulations of the Securities and Exchange Commission and the PCAOB.
We conducted our audits in accordance with the standards of the PCAOB. Those standards require that we plan and perform the audit to obtain reasonable assurance about whether the financial statements and financial highlights are free of material misstatement, whether due to error or fraud. The Fund is not required to have, nor were we engaged to perform, an audit of its internal control over financial reporting. As part of our audits, we are required to obtain an understanding of internal control over financial reporting but not for the purpose of expressing an opinion on the effectiveness of the Fund’s internal control over financial reporting. Accordingly, we express no such opinion.
Our audits included performing procedures to assess the risks of material misstatement of the financial statements and financial highlights, whether due to error or fraud, and performing procedures that respond to those risks. Such procedures included examining, on a test basis, evidence regarding the amounts and disclosures in the financial statements and financial highlights. Our audits also included evaluating the accounting principles used and significant estimates made by management, as well as evaluating the overall presentation of the financial statements and financial highlights. Our procedures included confirmation of securities owned as of December 31, 2021, by correspondence with the custodian and brokers; when replies were not received from brokers, we performed other auditing procedures. We believe that our audits provide a reasonable basis for our opinion.
/s/ Deloitte & Touche LLP
Boston, Massachusetts
February 23, 2022
We have served as the auditor of one or more Eaton Vance investment companies since 1959.
| 23 |
Eaton Vance
Small-Cap Fund
December 31, 2021
Federal Tax Information (Unaudited)
The Form 1099-DIV you received in February 2022 showed the tax status of all distributions paid to your account in calendar year 2021. Shareholders are advised to consult their own tax adviser with respect to the tax consequences of their investment in the Fund. As required by the Internal Revenue Code and/or regulations, shareholders must be notified regarding the status of qualified dividend income for individuals, the dividends received deduction for corporations and capital gains dividends.
Qualified Dividend Income. For the fiscal year ended December 31, 2021, the Fund designates approximately $977,360, or up to the maximum amount of such dividends allowable pursuant to the Internal Revenue Code, as qualified dividend income eligible for the reduced tax rate of 15%.
Dividends Received Deduction. Corporate shareholders are generally entitled to take the dividends received deduction on the portion of the Fund’s dividend distribution that qualifies under tax law. For the Fund’s fiscal 2021 ordinary income dividends, 14.54% qualifies for the corporate dividends received deduction.
Capital Gains Dividends. The Fund hereby designates as a capital gain dividend with respect to the taxable year ended December 31, 2021, $11,229,398 or, if subsequently determined to be different, the net capital gain of such year.
| 24 |
Eaton Vance
Small-Cap Fund
December 31, 2021
Fund Management. The Trustees of Eaton Vance Special Investment Trust (the Trust) are responsible for the overall management and supervision of the Trust’s affairs. The Board members and officers of the Trust are listed below. Except as indicated, each individual has held the office shown or other offices in the same company for the last five years. Board members hold indefinite terms of office. Each Trustee holds office until his or her successor is elected and qualified, subject to a prior death, resignation, retirement, disqualification or removal. Under the terms of the Fund’s current Trustee retirement policy, an Independent Trustee must retire and resign as a Trustee on the earlier of: (i) the first day of July following his or her 74th birthday; or (ii), with limited exception, December 31st of the 20th year in which he or she has served as a Trustee. However, if such retirement and resignation would cause the Fund to be out of compliance with Section 16 of the 1940 Act or any other regulations or guidance of the SEC, then such retirement and resignation will not become effective until such time as action has been taken for the Fund to be in compliance therewith. The “noninterested Trustees” consist of those Trustees who are not “interested persons” of the Trust, as that term is defined under the 1940 Act. The business address of each Board member and officer is Two International Place, Boston, Massachusetts 02110. As used below, “BMR” refers to Boston Management and Research, “EVC” refers to Eaton Vance Corp., “EV” refers to EV LLC, “EVM” refers to Eaton Vance Management and “EVD” refers to Eaton Vance Distributors, Inc. EV is the trustee of each of EVM and BMR. Effective March 1, 2021, each of EVM, BMR, EVD and EV are indirect, wholly owned subsidiaries of Morgan Stanley. Each officer affiliated with EVM may hold a position with other EVM affiliates that is comparable to his or her position with EVM listed below. Each Trustee oversees 138 funds (with the exception of Messrs. Faust and Wennerholm and Ms. Frost who oversee 137 funds) in the Eaton Vance fund complex (including both funds and portfolios in a hub and spoke structure).
| Name and Year of Birth | Trust Position(s) | Length of Service | Principal Occupation(s) and Other Directorships During Past Five Years and Other Relevant Experience | |||
| Interested Trustee | ||||||
Thomas E. Faust Jr. 1958 | Trustee | Since 2007 | Chairman of Morgan Stanley Investment Management, Inc. (MSIM), member of the Board of Managers and President of EV, Chief Executive Officer of EVM and BMR, and Director of EVD. Formerly, Chairman, Chief Executive Officer and President of EVC. Mr. Faust is an interested person because of his positions with MSIM, BMR, EVM, EVD, and EV, which are affiliates of the Trust, and his former position with EVC, which was an affiliate of the Trust prior to March 1, 2021. Other Directorships. Formerly, Director of EVC (2007-2021) and Hexavest Inc. (investment management firm) (2012-2021). | |||
| Noninterested Trustees | ||||||
Mark R. Fetting 1954 | Trustee | Since 2016 | Private investor. Formerly held various positions at Legg Mason, Inc. (investment management firm) (2000-2012), including President, Chief Executive Officer, Director and Chairman (2008-2012), Senior Executive Vice President (2004-2008) and Executive Vice President (2001-2004). Formerly, President of Legg Mason family of funds (2001-2008). Formerly, Division President and Senior Officer of Prudential Financial Group, Inc. and related companies (investment management firm) (1991-2000). Other Directorships. None. | |||
Cynthia E. Frost 1961 | Trustee | Since 2014 | Private investor. Formerly, Chief Investment Officer of Brown University (university endowment) (2000-2012). Formerly, Portfolio Strategist for Duke Management Company (university endowment manager) (1995-2000). Formerly, Managing Director, Cambridge Associates (investment consulting company) (1989-1995). Formerly, Consultant, Bain and Company (management consulting firm) (1987-1989). Formerly, Senior Equity Analyst, BA Investment Management Company (1983-1985). Other Directorships. None. | |||
George J. Gorman 1952 | Chairperson of the Board and Trustee | Since 2021 (Chairperson) and 2014 (Trustee) | Principal at George J. Gorman LLC (consulting firm). Formerly, Senior Partner at Ernst & Young LLP (a registered public accounting firm) (1974-2009). Other Directorships. None. | |||
| 25 |
Eaton Vance
Small-Cap Fund
December 31, 2021
Management and Organization — continued
| Name and Year of Birth | Trust Position(s) | Length of Service | Principal Occupation(s) and Other Directorships During Past Five Years and Other Relevant Experience | |||
| Noninterested Trustees (continued) | ||||||
Valerie A. Mosley 1960 | Trustee | Since 2014 | Chairwoman and Chief Executive Officer of Valmo Ventures (a consulting and investment firm). Founder of Upward Wealth, Inc., dba BrightUP, a fintech platform. Formerly, Partner and Senior Vice President, Portfolio Manager and Investment Strategist at Wellington Management Company, LLP (investment management firm) (1992-2012). Formerly, Chief Investment Officer, PG Corbin Asset Management (1990-1992). Formerly worked in institutional corporate bond sales at Kidder Peabody (1986-1990). Other Directorships. Director of DraftKings, Inc. (digital sports entertainment and gaming company) (since September 2020). Director of Groupon, Inc. (e-commerce provider) (since April 2020). Director of Envestnet, Inc. (provider of intelligent systems for wealth management and financial wellness) (since 2018). Formerly, Director of Dynex Capital, Inc. (mortgage REIT) (2013-2020). | |||
William H. Park 1947 | Trustee | Since 2003 | Private investor. Formerly, Consultant (management and transactional) (2012-2014). Formerly, Chief Financial Officer, Aveon Group L.P. (investment management firm) (2010-2011). Formerly, Vice Chairman, Commercial Industrial Finance Corp. (specialty finance company) (2006-2010). Formerly, President and Chief Executive Officer, Prizm Capital Management, LLC (investment management firm) (2002-2005). Formerly, Executive Vice President and Chief Financial Officer, United Asset Management Corporation (investment management firm) (1982-2001). Formerly, Senior Manager, Price Waterhouse (now PricewaterhouseCoopers) (a registered public accounting firm) (1972-1981). Other Directorships. None. | |||
Helen Frame Peters 1948 | Trustee | Since 2008 | Professor of Finance, Carroll School of Management, Boston College. Formerly, Dean, Carroll School of Management, Boston College (2000-2002). Formerly, Chief Investment Officer, Fixed Income, Scudder Kemper Investments (investment management firm) (1998-1999). Formerly, Chief Investment Officer, Equity and Fixed Income, Colonial Management Associates (investment management firm) (1991-1998). Other Directorships. None. | |||
Keith Quinton 1958 | Trustee | Since 2018 | Private investor, researcher and lecturer. Formerly, Independent Investment Committee Member at New Hampshire Retirement System (2017-2021). Formerly, Portfolio Manager and Senior Quantitative Analyst at Fidelity Investments (investment management firm) (2001-2014). Other Directorships. Formerly, Director (2016-2021) and Chairman (2019-2021) of New Hampshire Municipal Bond Bank. | |||
Marcus L. Smith 1966 | Trustee | Since 2018 | Private investor. Formerly, Portfolio Manager at MFS Investment Management (investment management firm) (1994-2017). Other Directorships. Director of First Industrial Realty Trust, Inc. (an industrial REIT) (since 2021). Director of MSCI Inc. (global provider of investment decision support tools) (since 2017). Formerly, Director of DCT Industrial Trust Inc. (logistics real estate company) (2017-2018). | |||
Susan J. Sutherland 1957 | Trustee | Since 2015 | Private investor. Director of Ascot Group Limited and certain of its subsidiaries (insurance and reinsurance) (since 2017). Formerly, Director of Hagerty Holding Corp. (insurance) (2015-2018) and Montpelier Re Holdings Ltd. (insurance and reinsurance) (2013-2015). Formerly, Associate, Counsel and Partner at Skadden, Arps, Slate, Meagher & Flom LLP (law firm) (1982-2013). Other Directorships. Director of Kairos Acquisition Corp. (insurance/InsurTech acquisition company) (since 2021). | |||
Scott E. Wennerholm 1959 | Trustee | Since 2016 | Private investor. Formerly, Trustee at Wheelock College (postsecondary institution) (2012-2018). Formerly, Consultant at GF Parish Group (executive recruiting firm) (2016-2017). Formerly, Chief Operating Officer and Executive Vice President at BNY Mellon Asset Management (investment management firm) (2005-2011). Formerly, Chief Operating Officer and Chief Financial Officer at Natixis Global Asset Management (investment management firm) (1997-2004). Formerly, Vice President at Fidelity Investments Institutional Services (investment management firm) (1994-1997). Other Directorships. None. | |||
| 26 |
Eaton Vance
Small-Cap Fund
December 31, 2021
Management and Organization — continued
| Name and Year of Birth | Trust Position(s) | Length of Service | Principal Occupation(s) During Past Five Years | |||
| Principal Officers who are not Trustees | ||||||
Eric A. Stein 1980 | President | Since 2020 | Vice President and Chief Investment Officer, Fixed Income of EVM and BMR. Prior to November 1, 2020, Mr. Stein was a co-Director of Eaton Vance’s Global Income Investments. Also Vice President of Calvert Research and Management (“CRM”). | |||
Deidre E. Walsh 1971 | Vice President and Chief Legal Officer | Since 2009 | Vice President of EVM and BMR. Also Vice President of CRM. | |||
James F. Kirchner 1967 | Treasurer | Since 2007 | Vice President of EVM and BMR. Also Vice President of CRM. | |||
Jill R. Damon 1984 | Secretary | Since 2022 | Vice President of EVM and BMR since 2017. Formerly, associate at Dechert LLP (2009-2017). | |||
Richard F. Froio 1968 | Chief Compliance Officer | Since 2017 | Vice President of EVM and BMR since 2017. Formerly, Deputy Chief Compliance Officer (Adviser/Funds) and Chief Compliance Officer (Distribution) at PIMCO (2012-2017) and Managing Director at BlackRock/Barclays Global Investors (2009-2012). | |||
The SAI for the Fund includes additional information about the Trustees and officers of the Trust and can be obtained without charge on Eaton Vance’s website at www.eatonvance.com or by calling 1-800-262-1122.
| 27 |
Eaton Vance Funds
| Privacy Notice | April 2021 |
| FACTS | WHAT DOES EATON VANCE DO WITH YOUR PERSONAL INFORMATION? | |
| Why? | Financial companies choose how they share your personal information. Federal law gives consumers the right to limit some but not all sharing. Federal law also requires us to tell you how we collect, share, and protect your personal information. Please read this notice carefully to understand what we do. | |
| What? | The types of personal information we collect and share depend on the product or service you have with us. This information can include:
∎ Social Security number and income ∎ investment experience and risk tolerance ∎ checking account number and wire transfer instructions | |
| How? | All financial companies need to share customers’ personal information to run their everyday business. In the section below, we list the reasons financial companies can share their customers’ personal information; the reasons Eaton Vance chooses to share; and whether you can limit this sharing. | |
| Reasons we can share your personal information | Does Eaton Vance share? | Can you limit this sharing? | ||
| For our everyday business purposes — such as to process your transactions, maintain your account(s), respond to court orders and legal investigations, or report to credit bureaus | Yes | No | ||
| For our marketing purposes — to offer our products and services to you | Yes | No | ||
| For joint marketing with other financial companies | No | We don’t share | ||
| For our investment management affiliates’ everyday business purposes — information about your transactions, experiences, and creditworthiness | Yes | Yes | ||
| For our affiliates’ everyday business purposes — information about your transactions and experiences | Yes | No | ||
| For our affiliates’ everyday business purposes — information about your creditworthiness | No | We don’t share | ||
| For our investment management affiliates to market to you | Yes | Yes | ||
| For our affiliates to market to you | No | We don’t share | ||
| For nonaffiliates to market to you | No | We don’t share |
| To limit our sharing | Call toll-free 1-800-262-1122 or email: EVPrivacy@eatonvance.com
Please note:
If you are a new customer, we can begin sharing your information 30 days from the date we sent this notice. When you are no longer our customer, we continue to share your information as described in this notice. However, you can contact us at any time to limit our sharing. | |
| Questions? | Call toll-free 1-800-262-1122 or email: EVPrivacy@eatonvance.com | |
| 28 |
Eaton Vance Funds
| Privacy Notice — continued | April 2021 |
| Page 2 |
| Who we are | ||
| Who is providing this notice? | Eaton Vance Management, Eaton Vance Distributors, Inc., Eaton Vance Trust Company, Eaton Vance Management (International) Limited, Eaton Vance Advisers International Ltd., Eaton Vance Global Advisors Limited, Eaton Vance Management’s Real Estate Investment Group, Boston Management and Research, Calvert Research and Management, Eaton Vance and Calvert Fund Families and our investment advisory affiliates (“Eaton Vance”) (see Investment Management Affiliates definition below) | |
| What we do | ||
| How does Eaton Vance protect my personal information? | To protect your personal information from unauthorized access and use, we use security measures that comply with federal law. These measures include computer safeguards and secured files and buildings. We have policies governing the proper handling of customer information by personnel and requiring third parties that provide support to adhere to appropriate security standards with respect to such information. | |
| How does Eaton Vance collect my personal information? | We collect your personal information, for example, when you
∎ open an account or make deposits or withdrawals from your account ∎ buy securities from us or make a wire transfer ∎ give us your contact information
We also collect your personal information from others, such as credit bureaus, affiliates, or other companies. | |
| Why can’t I limit all sharing? | Federal law gives you the right to limit only
∎ sharing for affiliates’ everyday business purposes — information about your creditworthiness ∎ affiliates from using your information to market to you ∎ sharing for nonaffiliates to market to you
State laws and individual companies may give you additional rights to limit sharing. See below for more on your rights under state law. | |
| Definitions | ||
| Investment Management Affiliates | Eaton Vance Investment Management Affiliates include registered investment advisers, registered broker-dealers, and registered and unregistered funds. Investment Management Affiliates does not include entities associated with Morgan Stanley Wealth Management, such as Morgan Stanley Smith Barney LLC and Morgan Stanley & Co. | |
| Affiliates | Companies related by common ownership or control. They can be financial and nonfinancial companies.
∎ Our affiliates include companies with a Morgan Stanley name and financial companies such as Morgan Stanley Smith Barney LLC and Morgan Stanley & Co. | |
| Nonaffiliates | Companies not related by common ownership or control. They can be financial and nonfinancial companies.
∎ Eaton Vance does not share with nonaffiliates so they can market to you. | |
| Joint marketing | A formal agreement between nonaffiliated financial companies that together market financial products or services to you.
∎ Eaton Vance doesn’t jointly market. | |
| Other important information | ||
Vermont: Except as permitted by law, we will not share personal information we collect about Vermont residents with Nonaffiliates unless you provide us with your written consent to share such information.
California: Except as permitted by law, we will not share personal information we collect about California residents with Nonaffiliates and we will limit sharing such personal information with our Affiliates to comply with California privacy laws that apply to us. | ||
| 29 |
Eaton Vance Funds
Delivery of Shareholder Documents. The Securities and Exchange Commission (SEC) permits funds to deliver only one copy of shareholder documents, including prospectuses, proxy statements and shareholder reports, to fund investors with multiple accounts at the same residential or post office box address. This practice is often called “householding” and it helps eliminate duplicate mailings to shareholders. Eaton Vance, or your financial intermediary, may household the mailing of your documents indefinitely unless you instruct Eaton Vance, or your financial intermediary, otherwise. If you would prefer that your Eaton Vance documents not be householded, please contact Eaton Vance at 1-800-262-1122, or contact your financial intermediary. Your instructions that householding not apply to delivery of your Eaton Vance documents will typically be effective within 30 days of receipt by Eaton Vance or your financial intermediary.
Portfolio Holdings. Each Eaton Vance Fund and its underlying Portfolio(s) (if applicable) files a schedule of portfolio holdings on Part F to Form N-PORT with the SEC. Certain information filed on Form N-PORT may be viewed on the Eaton Vance website at www.eatonvance.com, by calling Eaton Vance at 1-800-262-1122 or in the EDGAR database on the SEC’s website at www.sec.gov.
Proxy Voting. From time to time, funds are required to vote proxies related to the securities held by the funds. The Eaton Vance Funds or their underlying Portfolios (if applicable) vote proxies according to a set of policies and procedures approved by the Funds’ and Portfolios’ Boards. You may obtain a description of these policies and procedures and information on how the Funds or Portfolios voted proxies relating to portfolio securities during the most recent 12-month period ended June 30, without charge, upon request, by calling 1-800-262-1122 and by accessing the SEC’s website at www.sec.gov.
| 30 |
This Page Intentionally Left Blank
This Page Intentionally Left Blank
Investment Adviser
Boston Management and Research
Two International Place
Boston, MA 02110
Administrator
Eaton Vance Management
Two International Place
Boston, MA 02110
Principal Underwriter*
Eaton Vance Distributors, Inc.
Two International Place
Boston, MA 02110
(617) 482-8260
Custodian
State Street Bank and Trust Company
State Street Financial Center, One Lincoln Street
Boston, MA 02111
Transfer Agent
BNY Mellon Investment Servicing (US) Inc.
Attn: Eaton Vance Funds
P.O. Box 9653
Providence, RI 02940-9653
(800) 262-1122
Independent Registered Public Accounting Firm
Deloitte & Touche LLP
200 Berkeley Street
Boston, MA 02116-5022
Fund Offices
Two International Place
Boston, MA 02110
| * | FINRA BrokerCheck. Investors may check the background of their Investment Professional by contacting the Financial Industry Regulatory Authority (FINRA). FINRA BrokerCheck is a free tool to help investors check the professional background of current and former FINRA-registered securities firms and brokers. FINRA BrokerCheck is available by calling 1-800-289-9999 and at www.FINRA.org. The FINRA BrokerCheck brochure describing this program is available to investors at www.FINRA.org. |
164 12.31.21

Eaton Vance
Special Equities Fund
Annual Report
December 31, 2021

Commodity Futures Trading Commission Registration. The Commodity Futures Trading Commission (“CFTC”) has adopted regulations that subject registered investment companies and advisers to regulation by the CFTC if a fund invests more than a prescribed level of its assets in certain CFTC-regulated instruments (including futures, certain options and swap agreements) or markets itself as providing investment exposure to such instruments. The investment adviser has claimed an exclusion from the definition of “commodity pool operator” under the Commodity Exchange Act with respect to its management of the Fund. Accordingly, neither the Fund nor the adviser with respect to the operation of the Fund is subject to CFTC regulation. Because of its management of other strategies, the Fund’s adviser is registered with the CFTC as a commodity pool operator. The adviser is also registered as a commodity trading advisor.
Fund shares are not insured by the FDIC and are not deposits or other obligations of, or guaranteed by, any depository institution. Shares are subject to investment risks, including possible loss of principal invested.
This report must be preceded or accompanied by a current summary prospectus or prospectus. Before investing, investors should consider carefully the investment objective, risks, and charges and expenses of a mutual fund. This and other important information is contained in the summary prospectus and prospectus, which can be obtained from a financial intermediary. Prospective investors should read the prospectus carefully before investing. For further information, please call 1-800-262-1122.
Annual Report December 31, 2021
Eaton Vance
Special Equities Fund
| 2 | ||||
| 3 | ||||
| 4 | ||||
| 5 | ||||
| 6 | ||||
| 7 | ||||
| 21 | ||||
| 22 | ||||
| 23 | ||||
| 26 | ||||
| 28 |
Eaton Vance
Special Equities Fund
December 31, 2021
Management’s Discussion of Fund Performance1
Economic and Market Conditions
The 12-month period starting January 1, 2021, was notable for a U.S. equity rally that lasted for most of the period and resulted in U.S. stocks outperforming most other stock markets in developed economies. Except for temporary retreats in September and November, broad-market indexes generally posted strong returns during the period. Investors cheered the reopening of businesses that had been affected by the pandemic and the rollout of several highly effective COVID-19 vaccines.
COVID-19, however, continued to have a firm grip on the U.S. economy. Disease rates advanced and declined with second, third, and fourth waves of infections. Worker shortages led to global supply-chain disruptions. From computer chips to shipping containers, scarcities of key items led to temporary factory shutdowns and empty store shelves. Those shortages — combined with high demand from consumers eager to spend money saved earlier in the pandemic — led to higher year-over-year inflation than the U.S. had seen in decades.
Still, investor optimism about a recovering economy drove stock prices up during most of the period. A significant pullback, however, occurred in September 2021 when virtually every major U.S. stock index reported negative returns. Unexpectedly weak job creation in August and the U.S. Federal Reserve’s (the Fed’s) announcement that it might soon begin tapering its monthly bond purchases — which had stimulated the economy earlier — combined to drive stocks into negative territory. Rising COVID-19 infections also weighed on equity performance in September.
In the final quarter of 2021, however, stock prices came roaring back. Even the late-November news of a new and more transmissible COVID-19 variant — Omicron — caused only a temporary market retreat. The Fed’s actions to tamp down inflation were applauded by investors, with stocks gaining ground after the central bank announced that tapering would be accelerated and that three possible interest rate hikes were forecast for 2022. Just two trading days before year-end, the S&P 500® Index closed at its 70th new all-time high for the period, and the Dow Jones Industrial Average® (DJIA) closed at an all-time high as well.
For the period as a whole, the broad-market S&P 500® Index returned 28.71%; the blue-chip DJIA was up 20.95%; and the technology-laden Nasdaq Composite Index rose 22.18%. Large-cap U.S. stocks, as measured by the Russell 1000® Index, outperformed their small-cap counterparts, as measured by the Russell 2000® Index. In the large-cap space, growth stocks modestly outperformed value stocks, but in the small-cap space, value stocks strongly outperformed growth stocks during the period.
Fund Performance
For the 12-month period ended December 31, 2021, Eaton Vance Special Equities Fund (the Fund) returned 18.87% for Class A shares at net asset value (NAV), outperforming its benchmark, the Russell 2500TM Index (the Index), which returned 18.18%.
The Fund’s performance relative to the Index was primarily a result of stock selections in the consumer discretionary, real estate, and communication services sectors. The Fund’s sector allocations further contributed to relative returns during the period. Underweight exposures to the information technology (IT) and communication services sectors, and an overweight exposure to the industrials sector were particularly beneficial.
In the materials sector, Valvoline, Inc. (Valvoline), a provider of automotive lubricants, chemicals, and services, was a leading individual contributor to relative returns during the period. Valvoline’s stock price rose as economies worldwide rebounded from the business shutdowns early in the pandemic and the company’s retail operation showed strong organic growth.
Favorable selections in the consumer discretionary sector included Tempur Sealy International, Inc., a mattress manufacturer, and a leading contributor to Fund performance during the period. Its stock price rose after the company reported strong sales and gross margins growth in the second quarter. In the real estate sector, CubeSmart, a REIT that invests in self-storage facilities, was among the strongest contributors to Fund performance. Its stock price rose as its revenues outpaced those of its competitors during the period.
While sector allocations contributed overall, the Fund’s underweight exposure to the energy sector — the best-performing sector during the period — detracted from relative returns. The Fund’s overweight exposure to the utilities sector further detracted. Stock selections within the IT and consumer staples sectors also weighed on relative returns during the period.
Two of the Fund’s leading detractors were in health care, one of the weakest-performing sectors within the Index during the period. The stock price of Haemonetics Corp. (Haemonetics), a provider of blood and plasma products and services, fell after one of its largest customers, CSL, informed the company it would discontinue use of its plasma collection devices and was shifting its business to a competitor. By period-end, Haemonetics was sold from the Fund. Also in health care, the Fund’s ownership of LHC Group, Inc. (LHC), a provider of home health care services, detracted from relative performance. LHC’s stock price weakened as the COVID-19 pandemic limited demand for home health services and costs rose because of increased wages for nurses. In the industrials sector, Mercury Systems, Inc. (Mercury Systems), a provider of electronics to the defense industry, also weighed on relative returns. Mercury Systems’ stock price fell as the company’s organic growth slowed and on investor concerns that defense department spending might decline. By period-end, Mercury Systems was sold from the Fund.
See Endnotes and Additional Disclosures in this report.
Past performance is no guarantee of future results. Returns are historical and are calculated by determining the percentage change in net asset value (NAV) or offering price (as applicable) with all distributions reinvested. Investment return and principal value will fluctuate so that shares, when redeemed, may be worth more or less than their original cost. Performance for periods less than or equal to one year is cumulative. Performance is for the stated time period only; due to market volatility, current Fund performance may be lower or higher than the quoted return. For performance as of the most recent month-end, please refer to eatonvance.com.
| 2 |
Eaton Vance
Special Equities Fund
December 31, 2021
Portfolio Manager(s) Michael D. McLean, CFA and J. Griffith Noble, CFA
| % Average Annual Total Returns | Class Inception Date | Performance Inception Date | One Year | Five Years | Ten Years | |||||||||||||||
Class A at NAV | 04/22/1968 | 04/22/1968 | 18.87 | % | 13.50 | % | 12.06 | % | ||||||||||||
Class A with 5.75% Maximum Sales Charge | — | — | 12.06 | 12.16 | 11.40 | |||||||||||||||
Class C at NAV | 11/17/1994 | 04/22/1968 | 18.02 | 12.65 | 11.39 | |||||||||||||||
Class C with 1% Maximum Sales Charge | — | — | 17.02 | 12.65 | 11.39 | |||||||||||||||
Class I at NAV | 07/29/2011 | 04/22/1968 | 19.19 | 13.78 | 12.35 | |||||||||||||||
| ||||||||||||||||||||
Russell 2500™ Index | — | — | 18.18 | % | 13.75 | % | 14.13 | % | ||||||||||||
| % Total Annual Operating Expense Ratios4 | Class A | Class C | Class I | |||||||||||||||||
Gross | 1.33 | % | 2.08 | % | 1.08 | % | ||||||||||||||
Net | 1.20 | 1.95 | 0.95 | |||||||||||||||||
Growth of $10,000
This graph shows the change in value of a hypothetical investment of $10,000 in Class A of the Fund for the period indicated. For comparison, the same investment is shown in the indicated index.
| Growth of Investment | Amount Invested | Period Beginning | At NAV | With Maximum Sales Charge | ||||||||||||
Class C | $10,000 | 12/31/2011 | $29,429 | N.A. | ||||||||||||
Class I | $250,000 | 12/31/2011 | $801,700 | N.A. | ||||||||||||
See Endnotes and Additional Disclosures in this report.
Past performance is no guarantee of future results. Returns are historical and are calculated by determining the percentage change in net asset value (NAV) or offering price (as applicable) with all distributions reinvested. Investment return and principal value will fluctuate so that shares, when redeemed, may be worth more or less than their original cost. Performance for periods less than or equal to one year is cumulative. Performance is for the stated time period only; due to market volatility, current Fund performance may be lower or higher than the quoted return. For performance as of the most recent month-end, please refer to eatonvance.com.
| 3 |
Eaton Vance
Special Equities Fund
December 31, 2021
Sector Allocation (% of net assets)5
Top 10 Holdings (% of net assets)5
Valvoline, Inc. | 2.6 | % | ||
AZEK Co., Inc. (The) | 2.5 | |||
Performance Food Group Co. | 2.5 | |||
F5, Inc. | 2.2 | |||
CBIZ, Inc. | 2.2 | |||
Terminix Global Holdings, Inc. | 2.2 | |||
Middleby Corp. | 2.1 | |||
Dorman Products, Inc. | 2.0 | |||
EastGroup Properties, Inc. | 1.9 | |||
Envista Holdings Corp. | 1.8 | |||
Total | 22.0 | % | ||
See Endnotes and Additional Disclosures in this report.
| 4 |
Eaton Vance
Special Equities Fund
December 31, 2021
Endnotes and Additional Disclosures
| 1 | The views expressed in this report are those of the portfolio manager(s) and are current only through the date stated at the top of this page. These views are subject to change at any time based upon market or other conditions, and Eaton Vance and the Fund(s) disclaim any responsibility to update such views. These views may not be relied upon as investment advice and, because investment decisions are based on many factors, may not be relied upon as an indication of trading intent on behalf of any Eaton Vance fund. This commentary may contain statements that are not historical facts, referred to as “forward-looking statements.” The Fund’s actual future results may differ significantly from those stated in any forward-looking statement, depending on factors such as changes in securities or financial markets or general economic conditions, the volume of sales and purchases of Fund shares, the continuation of investment advisory, administrative and service contracts, and other risks discussed from time to time in the Fund’s filings with the Securities and Exchange Commission. |
| 2 | Russell 2500™ Index is an unmanaged index of approximately 2,500 small-and mid-cap U.S. stocks. Unless otherwise stated, index returns do not reflect the effect of any applicable sales charges, commissions, expenses, taxes or leverage, as applicable. It is not possible to invest directly in an index. |
| 3 | Total Returns at NAV do not include applicable sales charges. If sales charges were deducted, the returns would be lower. Total Returns shown with maximum sales charge reflect the stated maximum sales charge. Unless otherwise stated, performance does not reflect the deduction of taxes on Fund distributions or redemptions of Fund shares. |
Effective November 5, 2020, Class C shares automatically convert to Class A shares eight years after purchase. The average annual total returns listed for Class C reflect conversion to Class A shares after eight years. Prior to November 5, 2020, Class C shares automatically converted to Class A shares ten years after purchase. |
| 4 | Source: Fund prospectus. Net expense ratios reflect a contractual expense reimbursement that continues through 4/30/22. The expense ratios for the current reporting period can be found in the Financial Highlights section of this report. Performance reflects expenses waived and/or reimbursed, if applicable. Without such waivers and/or reimbursements, performance would have been lower. |
| 5 | Excludes cash and cash equivalents. |
Fund profile subject to change due to active management. |
Additional Information
S&P 500® Index is an unmanaged index of large-cap stocks commonly used as a measure of U.S. stock market performance. Dow Jones Industrial Average® is a price-weighted average of 30 blue-chip stocks that are generally the leaders in their industry. S&P Dow Jones Indices are a product of S&P Dow Jones Indices LLC (“S&P DJI”) and have been licensed for use. S&P® and S&P 500® are registered trademarks of S&P DJI; Dow Jones® is a registered trademark of Dow Jones Trademark Holdings LLC (“Dow Jones”); S&P DJI, Dow Jones and their respective affiliates do not sponsor, endorse, sell or promote the Fund, will not have any liability with respect thereto and do not have any liability for any errors, omissions, or interruptions of the S&P Dow Jones Indices. Nasdaq Composite Index is a market capitalization-weighted index of all domestic and international securities listed on Nasdaq. Source: Nasdaq, Inc. The information is provided by Nasdaq (with its affiliates, are referred to as the “Corporations”) and Nasdaq’s third party licensors on an “as is” basis and the Corporations make no guarantees and bear no liability of any kind with respect to the information or the Fund. Russell 1000® Index is an unmanaged index of 1,000 U.S. large-cap stocks. Russell 2000® Index is an unmanaged index of 2,000 U.S. small-cap stocks.
| 5 |
Eaton Vance
Special Equities Fund
December 31, 2021
Example: As a Fund shareholder, you incur two types of costs: (1) transaction costs, including sales charges (loads) on purchases and redemption fees (if applicable); and (2) ongoing costs, including management fees; distribution and/or service fees; and other Fund expenses. This Example is intended to help you understand your ongoing costs (in dollars) of Fund investing and to compare these costs with the ongoing costs of investing in other mutual funds. The Example is based on an investment of $1,000 invested at the beginning of the period and held for the entire period (July 1, 2021 – December 31, 2021).
Actual Expenses: The first section of the table below provides information about actual account values and actual expenses. You may use the information in this section, together with the amount you invested, to estimate the expenses that you paid over the period. Simply divide your account value by $1,000 (for example, an $8,600 account value divided by $1,000 = 8.6), then multiply the result by the number in the first section under the heading entitled “Expenses Paid During Period” to estimate the expenses you paid on your account during this period.
Hypothetical Example for Comparison Purposes: The second section of the table below provides information about hypothetical account values and hypothetical expenses based on the actual Fund expense ratio and an assumed rate of return of 5% per year (before expenses), which is not the actual Fund return. The hypothetical account values and expenses may not be used to estimate the actual ending account balance or expenses you paid for the period. You may use this information to compare the ongoing costs of investing in your Fund and other funds. To do so, compare this 5% hypothetical example with the 5% hypothetical examples that appear in the shareholder reports of the other funds.
Please note that the expenses shown in the table are meant to highlight your ongoing costs only and do not reflect any transactional costs, such as sales charges (loads) or redemption fees (if applicable). Therefore, the second section of the table is useful in comparing ongoing costs only, and will not help you determine the relative total costs of owning different funds. In addition, if these transactional costs were included, your costs would be higher.
| Beginning Account Value (7/1/21) | Ending Account Value (12/31/21) | Expenses Paid During Period* (7/1/21 – 12/31/21) | Annualized Expense Ratio | |||||||||||||
Actual |
| |||||||||||||||
Class A | $ | 1,000.00 | $ | 1,055.20 | $ | 6.06 | 1.17 | % | ||||||||
Class C | $ | 1,000.00 | $ | 1,051.70 | $ | 9.88 | 1.91 | % | ||||||||
Class I | $ | 1,000.00 | $ | 1,056.70 | $ | 4.82 | 0.93 | % | ||||||||
Hypothetical | ||||||||||||||||
(5% return per year before expenses) | ||||||||||||||||
Class A | $ | 1,000.00 | $ | 1,019.31 | $ | 5.96 | 1.17 | % | ||||||||
Class C | $ | 1,000.00 | $ | 1,015.58 | $ | 9.70 | 1.91 | % | ||||||||
Class I | $ | 1,000.00 | $ | 1,020.52 | $ | 4.74 | 0.93 | % | ||||||||
| * | Expenses are equal to the Fund’s annualized expense ratio for the indicated Class, multiplied by the average account value over the period, multiplied by 184/365 (to reflect the one-half year period). The Example assumes that the $1,000 was invested at the net asset value per share determined at the close of business on June 30, 2021. |
| 6 |
Eaton Vance
Special Equities Fund
December 31, 2021
| Common Stocks — 97.7% |
| |||||||
| Security | Shares | Value | ||||||
| Aerospace & Defense — 1.0% | ||||||||
Hexcel Corp.(1) | 12,671 | $ | 656,358 | |||||
| $ | 656,358 | |||||||
| Auto Components — 4.2% | ||||||||
Dana, Inc. | 38,280 | $ | 873,549 | |||||
Dorman Products, Inc.(1) | 11,985 | 1,354,425 | ||||||
Visteon Corp.(1) | 6,065 | 674,064 | ||||||
| $ | 2,902,038 | |||||||
| Automobiles — 1.2% | ||||||||
Harley-Davidson, Inc. | 21,860 | $ | 823,903 | |||||
| $ | 823,903 | |||||||
| Banks — 8.2% | ||||||||
Commerce Bancshares, Inc. | 16,814 | $ | 1,155,794 | |||||
Independent Bank Group, Inc. | 7,670 | 553,391 | ||||||
M&T Bank Corp. | 6,780 | 1,041,272 | ||||||
Pinnacle Financial Partners, Inc. | 9,430 | 900,565 | ||||||
SouthState Corp. | 15,705 | 1,258,128 | ||||||
UMB Financial Corp. | 6,680 | 708,815 | ||||||
| $ | 5,617,965 | |||||||
| Biotechnology — 0.8% | ||||||||
Neurocrine Biosciences, Inc.(1) | 6,730 | $ | 573,194 | |||||
| $ | 573,194 | |||||||
| Building Products — 3.3% | ||||||||
AAON, Inc. | 6,705 | $ | 532,578 | |||||
AZEK Co., Inc. (The)(1) | 37,779 | 1,746,901 | ||||||
| $ | 2,279,479 | |||||||
| Capital Markets — 1.6% | ||||||||
Cohen & Steers, Inc. | 5,224 | $ | 483,272 | |||||
Tradeweb Markets, Inc., Class A | 6,400 | 640,896 | ||||||
| $ | 1,124,168 | |||||||
| Chemicals — 3.9% | ||||||||
Quaker Chemical Corp. | 3,815 | $ | 880,426 | |||||
Valvoline, Inc. | 48,035 | 1,791,225 | ||||||
| $ | 2,671,651 | |||||||
| Security | Shares | Value | ||||||
| Commercial Services & Supplies — 1.5% | ||||||||
MillerKnoll, Inc. | 25,555 | $ | 1,001,500 | |||||
| $ | 1,001,500 | |||||||
| Communications Equipment — 2.2% | ||||||||
F5, Inc.(1) | 6,300 | $ | 1,541,673 | |||||
| $ | 1,541,673 | |||||||
| Containers & Packaging — 1.2% | ||||||||
AptarGroup, Inc. | 6,970 | $ | 853,686 | |||||
| $ | 853,686 | |||||||
| Diversified Consumer Services — 2.7% | ||||||||
Bright Horizons Family Solutions, Inc.(1) | 2,560 | $ | 322,253 | |||||
Terminix Global Holdings, Inc.(1) | 33,120 | 1,498,017 | ||||||
| $ | 1,820,270 | |||||||
| Electric Utilities — 1.0% | ||||||||
Alliant Energy Corp. | 11,084 | $ | 681,333 | |||||
| $ | 681,333 | |||||||
| Electrical Equipment — 0.5% | ||||||||
Generac Holdings, Inc.(1) | 930 | $ | 327,286 | |||||
| $ | 327,286 | |||||||
| Electronic Equipment, Instruments & Components — 1.1% | ||||||||
National Instruments Corp. | 17,945 | $ | 783,658 | |||||
| $ | 783,658 | |||||||
| Equity Real Estate Investment Trusts (REITs) — 7.3% | ||||||||
CubeSmart | 16,577 | $ | 943,397 | |||||
EastGroup Properties, Inc. | 5,570 | 1,269,125 | ||||||
Equity LifeStyle Properties, Inc. | 10,555 | 925,251 | ||||||
Rexford Industrial Realty, Inc. | 12,770 | 1,035,775 | ||||||
STORE Capital Corp. | 24,030 | 826,632 | ||||||
| $ | 5,000,180 | |||||||
| Food & Staples Retailing — 2.5% | ||||||||
Performance Food Group Co.(1) | 37,593 | $ | 1,725,143 | |||||
| $ | 1,725,143 | |||||||
| 7 | See Notes to Financial Statements. |
Eaton Vance
Special Equities Fund
December 31, 2021
Portfolio of Investments — continued
| Security | Shares | Value | ||||||
| Food Products — 1.7% | ||||||||
Lamb Weston Holdings, Inc. | 8,180 | $ | 518,448 | |||||
Nomad Foods, Ltd.(1) | 24,990 | 634,496 | ||||||
| $ | 1,152,944 | |||||||
| Health Care Equipment & Supplies — 4.6% | ||||||||
Cooper Cos., Inc. (The) | 991 | $ | 415,170 | |||||
Envista Holdings Corp.(1) | 28,050 | 1,263,933 | ||||||
ICU Medical, Inc.(1) | 2,113 | 501,499 | ||||||
Teleflex, Inc. | 2,959 | 971,972 | ||||||
| $ | 3,152,574 | |||||||
| Health Care Providers & Services — 7.1% | ||||||||
Addus HomeCare Corp.(1) | 4,765 | $ | 445,575 | |||||
Agiliti, Inc.(1) | 38,245 | 885,754 | ||||||
Amedisys, Inc.(1) | 1,880 | 304,335 | ||||||
Chemed Corp. | 2,170 | 1,148,017 | ||||||
LHC Group, Inc.(1) | 6,410 | 879,644 | ||||||
R1 RCM, Inc.(1) | 46,055 | 1,173,942 | ||||||
| $ | 4,837,267 | |||||||
| Hotels, Restaurants & Leisure — 2.4% | ||||||||
Choice Hotels International, Inc. | 5,375 | $ | 838,446 | |||||
Wyndham Hotels & Resorts, Inc. | 8,650 | 775,473 | ||||||
| $ | 1,613,919 | |||||||
| Household Durables — 0.5% | ||||||||
Tempur Sealy International, Inc. | 6,730 | $ | 316,512 | |||||
| $ | 316,512 | |||||||
| Insurance — 6.8% | ||||||||
James River Group Holdings, Ltd. | 9,290 | $ | 267,645 | |||||
Kinsale Capital Group, Inc. | 1,925 | 457,938 | ||||||
RLI Corp. | 7,977 | 894,222 | ||||||
Ryan Specialty Group Holdings, Inc., Class A(1) | 27,236 | 1,098,973 | ||||||
Selective Insurance Group, Inc. | 12,025 | 985,328 | ||||||
W.R. Berkley Corp. | 11,855 | 976,733 | ||||||
| $ | 4,680,839 | |||||||
| Interactive Media & Services — 1.7% | ||||||||
CarGurus, Inc.(1) | 34,920 | $ | 1,174,709 | |||||
| $ | 1,174,709 | |||||||
| Security | Shares | Value | ||||||
| IT Services — 1.4% | ||||||||
Euronet Worldwide, Inc.(1) | 8,071 | $ | 961,821 | |||||
| $ | 961,821 | |||||||
| Leisure Products — 0.6% | ||||||||
Brunswick Corp. | 3,915 | $ | 394,358 | |||||
| $ | 394,358 | |||||||
| Machinery — 5.8% | ||||||||
Allison Transmission Holdings, Inc. | 21,575 | $ | 784,251 | |||||
Graco, Inc. | 13,460 | 1,085,145 | ||||||
Middleby Corp.(1) | 7,275 | 1,431,429 | ||||||
Mueller Water Products, Inc., Class A | 12,025 | 173,160 | ||||||
Woodward, Inc. | 4,805 | 525,956 | ||||||
| $ | 3,999,941 | |||||||
| Multi-Utilities — 0.9% | ||||||||
CMS Energy Corp. | 9,925 | $ | 645,621 | |||||
| $ | 645,621 | |||||||
| Pharmaceuticals — 0.8% | ||||||||
Jazz Pharmaceuticals PLC(1) | 4,455 | $ | 567,567 | |||||
| $ | 567,567 | |||||||
| Professional Services — 2.2% | ||||||||
CBIZ, Inc.(1) | 38,480 | $ | 1,505,338 | |||||
| $ | 1,505,338 | |||||||
| Road & Rail — 1.0% | ||||||||
Landstar System, Inc. | 3,780 | $ | 676,696 | |||||
| $ | 676,696 | |||||||
| Semiconductors & Semiconductor Equipment — 0.7% | ||||||||
Silicon Laboratories, Inc.(1) | 2,450 | $ | 505,729 | |||||
| $ | 505,729 | |||||||
| Software — 9.1% | ||||||||
ACI Worldwide, Inc.(1) | 25,813 | $ | 895,711 | |||||
Altair Engineering, Inc., Class A(1) | 11,277 | 871,938 | ||||||
Black Knight, Inc.(1) | 8,797 | 729,183 | ||||||
Ceridian HCM Holding, Inc.(1) | 3,810 | 397,993 | ||||||
Clearwater Analytics Holdings, Inc., Class A(1) | 25,290 | 581,164 | ||||||
Envestnet, Inc.(1) | 11,215 | 889,798 | ||||||
Fair Isaac Corp.(1) | 1,830 | 793,616 | ||||||
| 8 | See Notes to Financial Statements. |
Eaton Vance
Special Equities Fund
December 31, 2021
Portfolio of Investments — continued
| Security | Shares | Value | ||||||
| Software (continued) | ||||||||
nCino, Inc.(1) | 10,704 | $ | 587,221 | |||||
Olo, Inc., Class A(1) | 24,032 | 500,106 | ||||||
| $ | 6,246,730 | |||||||
| Specialty Retail — 2.5% | ||||||||
Five Below, Inc.(1) | 2,280 | $ | 471,709 | |||||
National Vision Holdings, Inc.(1) | 25,396 | 1,218,754 | ||||||
| $ | 1,690,463 | |||||||
| Textiles, Apparel & Luxury Goods — 2.0% | ||||||||
Capri Holdings, Ltd.(1) | 8,760 | $ | 568,612 | |||||
Deckers Outdoor Corp.(1) | 865 | 316,858 | ||||||
Steven Madden, Ltd. | 10,155 | 471,903 | ||||||
| $ | 1,357,373 | |||||||
| Trading Companies & Distributors — 1.7% | ||||||||
Herc Holdings, Inc. | 7,285 | $ | 1,140,467 | |||||
| $ | 1,140,467 | |||||||
Total Common Stocks |
| $ | 67,004,353 | |||||
| Short-Term Investments — 2.1% |
| |||||||
| Description | Units | Value | ||||||
Eaton Vance Cash Reserves Fund, LLC, 0.08%(2) | 1,463,162 | $ | 1,463,016 | |||||
Total Short-Term Investments |
| $ | 1,463,016 | |||||
Total Investments — 99.8% |
| $ | 68,467,369 | |||||
Other Assets, Less Liabilities — 0.2% |
| $ | 106,422 | |||||
Net Assets — 100.0% |
| $ | 68,573,791 | |||||
The percentage shown for each investment category in the Portfolio of Investments is based on net assets.
| (1) | Non-income producing security. |
| (2) | Affiliated investment company, available to Eaton Vance portfolios and funds, which invests in high quality, U.S. dollar denominated money market instruments. The rate shown is the annualized seven-day yield as of December 31, 2021. |
| 9 | See Notes to Financial Statements. |
Eaton Vance
Special Equities Fund
December 31, 2021
Statement of Assets and Liabilities
| Assets | December 31, 2021 | |||
Unaffiliated investments, at value (identified cost, $50,114,152) | $ | 67,004,353 | ||
Affiliated investment, at value (identified cost, $1,463,016) | 1,463,016 | |||
Dividends receivable | 38,007 | |||
Dividends receivable from affiliated investment | 56 | |||
Receivable for investments sold | 3,122,382 | |||
Receivable for Fund shares sold | 219,005 | |||
Total assets | $ | 71,846,819 | ||
| Liabilities |
| |||
Payable for Fund shares redeemed | $ | 3,173,690 | ||
Payable to affiliates: | ||||
Investment adviser fee | 36,172 | |||
Distribution and service fees | 7,814 | |||
Trustees’ fees | 910 | |||
Accrued expenses | 54,442 | |||
Total liabilities | $ | 3,273,028 | ||
Net Assets | $ | 68,573,791 | ||
| Sources of Net Assets |
| |||
Paid-in capital | $ | 49,633,846 | ||
Distributable earnings | 18,939,945 | |||
Net Assets | $ | 68,573,791 | ||
| Class A Shares | ||||
Net Assets | $ | 35,482,744 | ||
Shares Outstanding | 1,273,398 | |||
Net Asset Value and Redemption Price Per Share | ||||
(net assets ÷ shares of beneficial interest outstanding) | $ | 27.86 | ||
Maximum Offering Price Per Share | ||||
(100 ÷ 94.25 of net asset value per share) | $ | 29.56 | ||
| Class C Shares |
| |||
Net Assets | $ | 593,565 | ||
Shares Outstanding | 25,853 | |||
Net Asset Value and Offering Price Per Share* | ||||
(net assets ÷ shares of beneficial interest outstanding) | $ | 22.96 | ||
| Class I Shares |
| |||
Net Assets | $ | 32,497,482 | ||
Shares Outstanding | 1,123,716 | |||
Net Asset Value, Offering Price and Redemption Price Per Share | ||||
(net assets ÷ shares of beneficial interest outstanding) | $ | 28.92 | ||
On sales of $50,000 or more, the offering price of Class A shares is reduced.
| * | Redemption price per share is equal to the net asset value less any applicable contingent deferred sales charge. |
| 10 | See Notes to Financial Statements. |
Eaton Vance
Special Equities Fund
December 31, 2021
Statement of Operations
| Investment Income | Year Ended December 31, 2021 | |||
Dividends | $ | 567,890 | ||
Dividends from affiliated investment | 545 | |||
Total investment income | $ | 568,435 | ||
| Expenses |
| |||
Investment adviser fee | $ | 392,090 | ||
Distribution and service fees |
| |||
Class A | 89,200 | |||
Class C | 6,233 | |||
Trustees’ fees and expenses | 3,592 | |||
Custodian fee | 27,855 | |||
Transfer and dividend disbursing agent fees | 59,828 | |||
Legal and accounting services | 38,860 | |||
Printing and postage | 8,050 | |||
Registration fees | 43,125 | |||
Miscellaneous | 13,785 | |||
Total expenses | $ | 682,618 | ||
Net investment loss | $ | (114,183 | ) | |
| Realized and Unrealized Gain (Loss) |
| |||
Net realized gain (loss) — |
| |||
Investment transactions | $ | 9,871,088 | ||
Investment transactions — affiliated investment | (44 | ) | ||
Net realized gain | $ | 9,871,044 | ||
Change in unrealized appreciation (depreciation) — | ||||
Investments | $ | 423,395 | ||
Net change in unrealized appreciation (depreciation) | $ | 423,395 | ||
Net realized and unrealized gain | $ | 10,294,439 | ||
Net increase in net assets from operations | $ | 10,180,256 | ||
| 11 | See Notes to Financial Statements. |
Eaton Vance
Special Equities Fund
December 31, 2021
Statements of Changes in Net Assets
| Year Ended December 31, | ||||||||
| Increase (Decrease) in Net Assets | 2021 | 2020 | ||||||
From operations — | ||||||||
Net investment loss | $ | (114,183 | ) | $ | (22,856 | ) | ||
Net realized gain | 9,871,044 | 2,179,226 | ||||||
Net change in unrealized appreciation (depreciation) | 423,395 | 3,484,594 | ||||||
Net increase in net assets from operations | $ | 10,180,256 | $ | 5,640,964 | ||||
Distributions to shareholders — | ||||||||
Class A | $ | (4,279,525 | ) | $ | (913,623 | ) | ||
Class C | (83,557 | ) | (22,272 | ) | ||||
Class I | (3,858,486 | ) | (459,729 | ) | ||||
Total distributions to shareholders | $ | (8,221,568 | ) | $ | (1,395,624 | ) | ||
Transactions in shares of beneficial interest — | ||||||||
Proceeds from sale of shares | ||||||||
Class A | $ | 906,185 | $ | 461,295 | ||||
Class C | 9,563 | 49,654 | ||||||
Class I | 18,272,454 | 4,177,908 | ||||||
Net asset value of shares issued to shareholders in payment of distributions declared | ||||||||
Class A | 3,625,656 | 781,858 | ||||||
Class C | 83,119 | 22,186 | ||||||
Class I | 3,849,997 | 457,529 | ||||||
Cost of shares redeemed | ||||||||
Class A | (4,176,755 | ) | (3,730,294 | ) | ||||
Class C | (118,510 | ) | (117,270 | ) | ||||
Class I | (6,795,935 | ) | (6,527,403 | ) | ||||
Net asset value of shares converted | ||||||||
Class A | 46,461 | 290,389 | ||||||
Class C | (46,461 | ) | (290,389 | ) | ||||
Net increase (decrease) in net assets from Fund share transactions | $ | 15,655,774 | $ | (4,424,537 | ) | |||
Net increase (decrease) in net assets | $ | 17,614,462 | $ | (179,197 | ) | |||
| Net Assets |
| |||||||
At beginning of year | $ | 50,959,329 | $ | 51,138,526 | ||||
At end of year | $ | 68,573,791 | $ | 50,959,329 | ||||
| 12 | See Notes to Financial Statements. |
Eaton Vance
Special Equities Fund
December 31, 2021
Financial Highlights
| Class A | ||||||||||||||||||||
| Year Ended December 31, | ||||||||||||||||||||
| 2021 | 2020 | 2019 | 2018 | 2017 | ||||||||||||||||
Net asset value — Beginning of year | $ | 26.630 | $ | 24.300 | $ | 19.820 | $ | 22.700 | $ | 21.100 | ||||||||||
| Income (Loss) From Operations | ||||||||||||||||||||
Net investment loss(1) | $ | (0.086 | ) | $ | (0.026 | ) | $ | (0.034 | ) | $ | (0.036 | ) | $ | (0.070 | ) | |||||
Net realized and unrealized gain (loss) | 5.017 | 3.086 | 5.586 | (0.982 | ) | 3.281 | ||||||||||||||
Total income (loss) from operations | $ | 4.931 | $ | 3.060 | $ | 5.552 | $ | (1.018 | ) | $ | 3.211 | |||||||||
| Less Distributions | ||||||||||||||||||||
From net realized gain | $ | (3.701 | ) | $ | (0.730 | ) | $ | (1.072 | ) | $ | (1.862 | ) | $ | (1.611 | ) | |||||
Total distributions | $ | (3.701 | ) | $ | (0.730 | ) | $ | (1.072 | ) | $ | (1.862 | ) | $ | (1.611 | ) | |||||
Net asset value — End of year | $ | 27.860 | $ | 26.630 | $ | 24.300 | $ | 19.820 | $ | 22.700 | ||||||||||
Total Return(2) | 18.87 | % | 12.81 | %(3) | 28.12 | %(3) | (4.95 | )%(3) | 15.38 | %(3) | ||||||||||
| Ratios/Supplemental Data | ||||||||||||||||||||
Net assets, end of year (000’s omitted) | $ | 35,483 | $ | 33,253 | $ | 32,825 | $ | 28,419 | $ | 32,397 | ||||||||||
Ratios (as a percentage of average daily net assets): | ||||||||||||||||||||
Expenses | 1.18 | % | 1.20 | %(3) | 1.29 | %(3) | 1.35 | %(3) | 1.36 | %(3) | ||||||||||
Net investment loss | (0.29 | )% | (0.12 | )% | (0.14 | )% | (0.15 | )% | (0.32 | )% | ||||||||||
Portfolio Turnover | 58 | % | 41 | % | 39 | % | 41 | % | 65 | % | ||||||||||
| (1) | Computed using average shares outstanding. |
| (2) | Returns are historical and are calculated by determining the percentage change in net asset value with all distributions reinvested and do not reflect the effect of sales charges. |
| (3) | The administrator reimbursed certain operating expenses (equal to 0.13%, 0.02%, 0.02% and 0.01% of average daily net assets for the years ended December 31, 2020, 2019, 2018 and 2017, respectively). Absent this reimbursement, total return would be lower. |
| 13 | See Notes to Financial Statements. |
Eaton Vance
Special Equities Fund
December 31, 2021
Financial Highlights — continued
| Class C | ||||||||||||||||||||
| Year Ended December 31, | ||||||||||||||||||||
| 2021 | 2020 | 2019 | 2018 | 2017 | ||||||||||||||||
Net asset value — Beginning of year | $ | 22.670 | $ | 20.940 | $ | 17.330 | $ | 20.230 | $ | 19.110 | ||||||||||
| Income (Loss) From Operations | ||||||||||||||||||||
Net investment loss(1) | $ | (0.259 | ) | $ | (0.169 | ) | $ | (0.191 | ) | $ | (0.195 | ) | $ | (0.215 | ) | |||||
Net realized and unrealized gain (loss) | 4.250 | 2.629 | 4.873 | (0.843 | ) | 2.946 | ||||||||||||||
Total income (loss) from operations | $ | 3.991 | $ | 2.460 | $ | 4.682 | $ | (1.038 | ) | $ | 2.731 | |||||||||
| Less Distributions | ||||||||||||||||||||
From net realized gain | $ | (3.701 | ) | $ | (0.730 | ) | $ | (1.072 | ) | $ | (1.862 | ) | $ | (1.611 | ) | |||||
Total distributions | $ | (3.701 | ) | $ | (0.730 | ) | $ | (1.072 | ) | $ | (1.862 | ) | $ | (1.611 | ) | |||||
Net asset value — End of year | $ | 22.960 | $ | 22.670 | $ | 20.940 | $ | 17.330 | $ | 20.230 | ||||||||||
Total Return(2) | 18.02 | % | 12.00 | %(3) | 27.14 | %(3) | (5.66 | )%(3) | 14.46 | %(3) | ||||||||||
| Ratios/Supplemental Data | ||||||||||||||||||||
Net assets, end of year (000’s omitted) | $ | 594 | $ | 643 | $ | 957 | $ | 1,461 | $ | 2,243 | ||||||||||
Ratios (as a percentage of average daily net assets): | ||||||||||||||||||||
Expenses | 1.93 | % | 1.95 | %(3) | 2.04 | %(3) | 2.10 | %(3) | 2.11 | %(3) | ||||||||||
Net investment loss | (1.05 | )% | (0.88 | )% | (0.94 | )% | (0.93 | )% | (1.07 | )% | ||||||||||
Portfolio Turnover | 58 | % | 41 | % | 39 | % | 41 | % | 65 | % | ||||||||||
| (1) | Computed using average shares outstanding. |
| (2) | Returns are historical and are calculated by determining the percentage change in net asset value with all distributions reinvested and do not reflect the effect of sales charges. |
| (3) | The administrator reimbursed certain operating expenses (equal to 0.13%, 0.02%, 0.02% and 0.01% of average daily net assets for the years ended December 31, 2020, 2019, 2018 and 2017, respectively). Absent this reimbursement, total return would be lower. |
| 14 | See Notes to Financial Statements. |
Eaton Vance
Special Equities Fund
December 31, 2021
Financial Highlights — continued
| Class I | ||||||||||||||||||||
| Year Ended December 31, | ||||||||||||||||||||
| 2021 | 2020 | 2019 | 2018 | 2017 | ||||||||||||||||
Net asset value — Beginning of year | $ | 27.450 | $ | 25.010 | $ | 20.330 | $ | 23.170 | $ | 21.460 | ||||||||||
| Income (Loss) From Operations | ||||||||||||||||||||
Net investment income (loss)(1) | $ | (0.004 | ) | $ | 0.029 | $ | 0.032 | $ | 0.028 | $ | (0.010 | ) | ||||||||
Net realized and unrealized gain (loss) | 5.175 | 3.193 | 5.720 | (1.006 | ) | 3.331 | ||||||||||||||
Total income (loss) from operations | $ | 5.171 | $ | 3.222 | $ | 5.752 | $ | (0.978 | ) | $ | 3.321 | |||||||||
| Less Distributions | ||||||||||||||||||||
From net investment income | $ | — | $ | (0.052 | ) | $ | — | $ | — | $ | — | |||||||||
From net realized gain | (3.701 | ) | (0.730 | ) | (1.072 | ) | (1.862 | ) | (1.611 | ) | ||||||||||
Total distributions | $ | (3.701 | ) | $ | (0.782 | ) | $ | (1.072 | ) | $ | (1.862 | ) | $ | (1.611 | ) | |||||
Net asset value — End of year | $ | 28.920 | $ | 27.450 | $ | 25.010 | $ | 20.330 | $ | 23.170 | ||||||||||
Total Return(2) | 19.19 | % | 13.10 | %(3) | 28.40 | %(3) | (4.67 | )%(3) | 15.63 | %(3) | ||||||||||
| Ratios/Supplemental Data | ||||||||||||||||||||
Net assets, end of year (000’s omitted) | $ | 32,497 | $ | 17,063 | $ | 17,357 | $ | 11,158 | $ | 11,216 | ||||||||||
Ratios (as a percentage of average daily net assets): | ||||||||||||||||||||
Expenses | 0.93 | % | 0.95 | %(3) | 1.03 | %(3) | 1.10 | %(3) | 1.11 | %(3) | ||||||||||
Net investment income (loss) | (0.01 | )% | 0.13 | % | 0.13 | % | 0.12 | % | (0.04 | )% | ||||||||||
Portfolio Turnover | 58 | % | 41 | % | 39 | % | 41 | % | 65 | % | ||||||||||
| (1) | Computed using average shares outstanding. |
| (2) | Returns are historical and are calculated by determining the percentage change in net asset value with all distributions reinvested. |
| (3) | The administrator reimbursed certain operating expenses (equal to 0.13%, 0.02%, 0.02% and 0.01% of average daily net assets for the years ended December 31, 2020, 2019, 2018 and 2017, respectively). Absent this reimbursement, total return would be lower. |
| 15 | See Notes to Financial Statements. |
Eaton Vance
Special Equities Fund
December 31, 2021
Notes to Financial Statements
1 Significant Accounting Policies
Eaton Vance Special Equities Fund (the Fund) is a diversified series of Eaton Vance Special Investment Trust (the Trust). The Trust is a Massachusetts business trust registered under the Investment Company Act of 1940, as amended (the 1940 Act), as an open-end management investment company. The Fund’s investment objective is to provide growth of capital. The Fund offers three classes of shares. Class A shares are generally sold subject to a sales charge imposed at time of purchase. Class C shares are sold at net asset value and are generally subject to a contingent deferred sales charge (see Note 5). Effective January 25, 2019, Class C shares generally automatically convert to Class A shares ten years after their purchase and, effective November 5, 2020, automatically convert to Class A shares eight years after their purchase as described in the Fund’s prospectus. Class I shares are sold at net asset value and are not subject to a sales charge. Each class represents a pro-rata interest in the Fund, but votes separately on class-specific matters and (as noted below) is subject to different expenses. Realized and unrealized gains and losses and net investment income and losses, other than class-specific expenses, are allocated daily to each class of shares based on the relative net assets of each class to the total net assets of the Fund. Each class of shares differs in its distribution plan and certain other class-specific expenses.
The following is a summary of significant accounting policies of the Fund. The policies are in conformity with accounting principles generally accepted in the United States of America (U.S. GAAP). The Fund is an investment company and follows accounting and reporting guidance in the Financial Accounting Standards Board (FASB) Accounting Standards Codification Topic 946.
A Investment Valuation — The following methodologies are used to determine the market value or fair value of investments.
Equity Securities. Equity securities listed on a U.S. securities exchange generally are valued at the last sale or closing price on the day of valuation or, if no sales took place on such date, at the mean between the closing bid and ask prices on the exchange where such securities are principally traded. Equity securities listed on the NASDAQ National Market System are valued at the NASDAQ official closing price. Unlisted or listed securities for which closing sales prices or closing quotations are not available are valued at the mean between the latest available bid and ask prices.
Affiliated Fund. The Fund may invest in Eaton Vance Cash Reserves Fund, LLC (Cash Reserves Fund), an affiliated investment company managed by Eaton Vance Management (EVM). While Cash Reserves Fund is not a registered money market mutual fund, it conducts all of its investment activities in accordance with the requirements of Rule 2a-7 under the 1940 Act. Investments in Cash Reserves Fund are valued at the closing net asset value per unit on the valuation day. Cash Reserves Fund generally values its investment securities based on available market quotations provided by a third party pricing service.
Fair Valuation. Investments for which valuations or market quotations are not readily available or are deemed unreliable are valued at fair value using methods determined in good faith by or at the direction of the Trustees of the Fund in a manner that most fairly reflects the security’s “fair value”, which is the amount that the Fund might reasonably expect to receive for the security upon its current sale in the ordinary course. Each such determination is based on a consideration of relevant factors, which are likely to vary from one pricing context to another. These factors may include, but are not limited to, the type of security, the existence of any contractual restrictions on the security’s disposition, the price and extent of public trading in similar securities of the issuer or of comparable companies or entities, quotations or relevant information obtained from broker/dealers or other market participants, information obtained from the issuer, analysts, and/or the appropriate stock exchange (for exchange-traded securities), an analysis of the company’s or entity’s financial statements, and an evaluation of the forces that influence the issuer and the market(s) in which the security is purchased and sold.
B Investment Transactions — Investment transactions for financial statement purposes are accounted for on a trade date basis. Realized gains and losses on investments sold are determined on the basis of identified cost.
C Income — Dividend income is recorded on the ex-dividend date for dividends received in cash and/or securities. However, if the ex-dividend date has passed, certain dividends from foreign securities are recorded as the Fund is informed of the ex-dividend date.
D Federal Taxes — The Fund’s policy is to comply with the provisions of the Internal Revenue Code applicable to regulated investment companies and to distribute to shareholders each year substantially all of its net investment income, and all or substantially all of its net realized capital gains. Accordingly, no provision for federal income or excise tax is necessary.
As of December 31, 2021, the Fund had no uncertain tax positions that would require financial statement recognition, de-recognition, or disclosure. The Fund files a U.S. federal income tax return annually after its fiscal year-end, which is subject to examination by the Internal Revenue Service for a period of three years from the date of filing.
E Expenses — The majority of expenses of the Trust are directly identifiable to an individual fund. Expenses which are not readily identifiable to a specific fund are allocated taking into consideration, among other things, the nature and type of expense and the relative size of the funds.
F Use of Estimates — The preparation of the financial statements in conformity with U.S. GAAP requires management to make estimates and assumptions that affect the reported amounts of assets and liabilities at the date of the financial statements and the reported amounts of income and expense during the reporting period. Actual results could differ from those estimates.
G Indemnifications — Under the Trust’s organizational documents, its officers and Trustees may be indemnified against certain liabilities and expenses arising out of the performance of their duties to the Fund. Under Massachusetts law, if certain conditions prevail, shareholders of a Massachusetts business trust (such as the Trust) could be deemed to have personal liability for the obligations of the Trust. However, the Trust’s Declaration of Trust contains an
| 16 |
Eaton Vance
Special Equities Fund
December 31, 2021
Notes to Financial Statements — continued
express disclaimer of liability on the part of Fund shareholders and the By-laws provide that the Trust shall assume, upon request by the shareholder, the defense on behalf of any Fund shareholders. Moreover, the By-laws also provide for indemnification out of Fund property of any shareholder held personally liable solely by reason of being or having been a shareholder for all loss or expense arising from such liability. Additionally, in the normal course of business, the Fund enters into agreements with service providers that may contain indemnification clauses. The Fund’s maximum exposure under these arrangements is unknown as this would involve future claims that may be made against the Fund that have not yet occurred.
2 Distributions to Shareholders and Income Tax Information
It is the present policy of the Fund to make at least one distribution annually (normally in December) of all or substantially all of its net investment income and to distribute annually all or substantially all of its net realized capital gains. Distributions to shareholders are recorded on the ex-dividend date. Distributions are declared separately for each class of shares. Shareholders may reinvest income and capital gain distributions in additional shares of the same class of the Fund at the net asset value as of the ex-dividend date or, at the election of the shareholder, receive distributions in cash. Distributions to shareholders are determined in accordance with income tax regulations, which may differ from U.S. GAAP. As required by U.S. GAAP, only distributions in excess of tax basis earnings and profits are reported in the financial statements as a return of capital. Permanent differences between book and tax accounting relating to distributions are reclassified to paid-in capital. For tax purposes, distributions from short-term capital gains are considered to be from ordinary income.
The tax character of distributions declared for the years ended December 31, 2021 and December 31, 2020 was as follows:
| Year Ended December 31, | ||||||||
| 2021 | 2020 | |||||||
Ordinary income | $ | 2,180,525 | $ | 70,672 | ||||
Long-term capital gains | $ | 6,041,043 | $ | 1,324,952 | ||||
During the year ended December 31, 2021, distributable earnings was decreased by $481,196 and paid-in capital was increased by $481,196 due primarily to the Fund’s use of equalization accounting. Tax equalization accounting allows the Fund to treat as a distribution that portion of redemption proceeds representing a redeeming shareholder’s portion of undistributed taxable income and net capital gains. These reclassifications had no effect on the net assets or net asset value per share of the Fund.
As of December 31, 2021, the components of distributable earnings (accumulated loss) on a tax basis were as follows:
Undistributed ordinary income | $ | 348,800 | ||
Undistributed long-term capital gains | 1,945,167 | |||
Net unrealized appreciation | 16,645,978 | |||
Distributable earnings | $ | 18,939,945 | ||
The cost and unrealized appreciation (depreciation) of investments of the Fund at December 31, 2021, as determined on a federal income tax basis, were as follows:
Aggregate cost | $ | 51,821,391 | ||
Gross unrealized appreciation | $ | 17,531,790 | ||
Gross unrealized depreciation | (885,812 | ) | ||
Net unrealized appreciation | $ | 16,645,978 | ||
3 Investment Adviser Fee and Other Transactions with Affiliates
The investment adviser fee is earned by Boston Management and Research (BMR) as compensation for investment advisory services rendered to the Fund. On March 1, 2021, Morgan Stanley acquired Eaton Vance Corp. (the “Transaction”) and BMR became an indirect, wholly-owned subsidiary of Morgan Stanley. In connection with the Transaction, the Fund entered into a new investment advisory agreement (the “New Agreement”) with BMR, which took effect on March 1, 2021. Pursuant to the New Agreement (and the Fund’s investment advisory agreement with BMR in effect prior to March 1, 2021), the investment adviser fee is computed at an annual rate of 0.625% of the Fund’s average daily net assets and is payable monthly. For the year ended
| 17 |
Eaton Vance
Special Equities Fund
December 31, 2021
Notes to Financial Statements — continued
December 31, 2021, the Fund’s investment adviser fee amounted to $392,090. The Fund may invest its cash in Cash Reserves Fund. EVM does not currently receive a fee for advisory services provided to Cash Reserves Fund. EVM, an affiliate of BMR and, effective March 1, 2021, an indirect, wholly-owned subsidiary of Morgan Stanley, serves as administrator of the Fund, but receives no compensation.
EVM has agreed to reimburse the Fund’s expenses to the extent that total annual operating expenses (relating to ordinary operating expenses only) exceed 1.20%, 1.95% and 0.95% of the Fund’s average daily net assets for Class A, Class C and Class I, respectively. This agreement may be changed or terminated after April 30, 2022. Pursuant to this agreement, no operating expenses were allocated to EVM for the year ended December 31, 2021.
EVM provides sub-transfer agency and related services to the Fund pursuant to a Sub-Transfer Agency Support Services Agreement. For the year ended December 31, 2021, EVM earned $23,521 from the Fund pursuant to such agreement, which is included in transfer and dividend disbursing agent fees on the Statement of Operations. The Fund was informed that Eaton Vance Distributors, Inc. (EVD), an affiliate of EVM and the Fund’s principal underwriter, received $2,579 as its portion of the sales charge on sales of Class A shares for the year ended December 31, 2021. EVD also received distribution and service fees from Class A and Class C shares (see Note 4).
Trustees and officers of the Fund who are members of EVM’s or BMR’s organizations receive remuneration for their services to the Fund out of the investment adviser fee. Trustees of the Fund who are not affiliated with the investment adviser may elect to defer receipt of all or a percentage of their annual fees in accordance with the terms of the Trustees Deferred Compensation Plan. For the year ended December 31, 2021, no significant amounts have been deferred. Certain officers and Trustees of the Fund are officers of the above organizations.
4 Distribution Plans
The Fund has in effect a distribution plan for Class A shares (Class A Plan) pursuant to Rule 12b-1 under the 1940 Act. Pursuant to the Class A Plan, the Fund pays EVD a distribution and service fee of 0.25% per annum of its average daily net assets attributable to Class A shares for distribution services and facilities provided to the Fund by EVD, as well as for personal services and/or the maintenance of shareholder accounts. Distribution and service fees paid or accrued to EVD for the year ended December 31, 2021 amounted to $89,200 for Class A shares.
The Fund also has in effect a distribution plan for Class C shares (Class C Plan) pursuant to Rule 12b-1 under the 1940 Act. Pursuant to the Class C Plan, the Fund pays EVD amounts equal to 0.75% per annum of its average daily net assets attributable to Class C shares for providing ongoing distribution services and facilities to the Fund. For the year ended December 31, 2021, the Fund paid or accrued to EVD $4,675 for Class C shares.
Pursuant to the Class C Plan, the Fund also makes payments of service fees to EVD, financial intermediaries and other persons in amounts equal to 0.25% per annum of its average daily net assets attributable to that class. Service fees paid or accrued are for personal services and/or the maintenance of shareholder accounts. They are separate and distinct from the sales commissions and distribution fees payable to EVD. Service fees paid or accrued for the year ended December 31, 2021 amounted to $1,558 for Class C shares.
Distribution and service fees are subject to the limitations contained in the Financial Industry Regulatory Authority Rule 2341(d).
5 Contingent Deferred Sales Charges
A contingent deferred sales charge (CDSC) of 1% generally is imposed on redemptions of Class C shares made within 12 months of purchase. Class A shares may be subject to a 1% CDSC if redeemed within 18 months of purchase (depending on the circumstances of purchase). Generally, the CDSC is based upon the lower of the net asset value at date of redemption or date of purchase. No charge is levied on shares acquired by reinvestment of dividends or capital gain distributions. For the year ended December 31, 2021, the Fund was informed that EVD received no CDSCs paid by Class A and Class C shareholders.
6 Purchases and Sales of Investments
Purchases and sales of investments, other than short-term obligations, aggregated $40,956,942 and $35,097,670, respectively, for the year ended December 31, 2021.
| 18 |
Eaton Vance
Special Equities Fund
December 31, 2021
Notes to Financial Statements — continued
7 Shares of Beneficial Interest
The Fund’s Declaration of Trust permits the Trustees to issue an unlimited number of full and fractional shares of beneficial interest (without par value). Such shares may be issued in a number of different series (such as the Fund) and classes. Transactions in Fund shares were as follows:
| Year Ended December 31, | ||||||||
| Class A | 2021 | 2020 | ||||||
Sales | 31,702 | 21,232 | ||||||
Issued to shareholders electing to receive payments of distributions in Fund shares | 133,492 | 31,325 | ||||||
Redemptions | (142,186 | ) | (167,711 | ) | ||||
Converted from Class C shares | 1,662 | 12,803 | ||||||
Net increase (decrease) | 24,670 | (102,351 | ) | |||||
| Year Ended December 31, | ||||||||
| Class C | 2021 | 2020 | ||||||
Sales | 393 | 2,861 | ||||||
Issued to shareholders electing to receive payments of distributions in Fund shares | 3,712 | 1,048 | ||||||
Redemptions | (4,646 | ) | (6,296 | ) | ||||
Converted to Class A shares | (1,964 | ) | (14,928 | ) | ||||
Net decrease | (2,505 | ) | (17,315 | ) | ||||
| Year Ended December 31, | ||||||||
| Class I | 2021 | 2020 | ||||||
Sales | 597,217 | 180,173 | ||||||
Issued to shareholders electing to receive payments of distributions in Fund shares | 136,573 | 17,730 | ||||||
Redemptions | (231,670 | ) | (270,339 | ) | ||||
Net increase (decrease) | 502,120 | (72,436 | ) | |||||
At December 31, 2021, donor advised and pooled income funds (established and maintained by a public charity) managed by EVM owned in the aggregate 39.4% of the value of the outstanding shares of the Fund.
8 Line of Credit
The Fund participates with other portfolios and funds managed by EVM and its affiliates in an $800 million unsecured line of credit agreement with a group of banks, which is in effect through October 25, 2022. Borrowings are made by the Fund solely for temporary purposes related to redemptions and other short-term cash needs. Interest is charged to the Fund based on its borrowings at an amount above either the Secured Overnight Financing Rate (SOFR) or Federal Funds rate. In addition, a fee computed at an annual rate of 0.15% on the daily unused portion of the line of credit is allocated among the participating portfolios and funds at the end of each quarter. In connection with the renewal of the agreement in October 2021, an arrangement fee totaling $150,000 was incurred that was allocated to the participating portfolios and funds. Because the line of credit is not available exclusively to the Fund, it may be unable to borrow some or all of its requested amounts at any particular time. The Fund did not have any significant borrowings or allocated fees during the year ended December 31, 2021.
| 19 |
Eaton Vance
Special Equities Fund
December 31, 2021
Notes to Financial Statements — continued
9 Investments in Affiliated Funds
At December 31, 2021, the value of the Fund’s investment in affiliated funds was $1,463,016, which represents 2.1% of the Fund’s net assets. Transactions in affiliated funds by the Fund for the year ended December 31, 2021 were as follows:
| Name | Value, beginning of period | Purchases | Sales proceeds | Net realized gain (loss) | Change in unrealized appreciation (depreciation) | Value, end of period | Dividend income | Units, end of period | ||||||||||||||||||||||||
Short-Term Investments | ||||||||||||||||||||||||||||||||
Eaton Vance Cash Reserves Fund, LLC | $ | 137,211 | $ | 25,970,723 | $ | (24,644,874 | ) | $ | (44 | ) | $ | — | $ | 1,463,016 | $ | 545 | 1,463,162 | |||||||||||||||
10 Fair Value Measurements
Under generally accepted accounting principles for fair value measurements, a three-tier hierarchy to prioritize the assumptions, referred to as inputs, is used in valuation techniques to measure fair value. The three-tier hierarchy of inputs is summarized in the three broad levels listed below.
| • | Level 1 – quoted prices in active markets for identical investments |
| • | Level 2 – other significant observable inputs (including quoted prices for similar investments, interest rates, prepayment speeds, credit risk, etc.) |
| • | Level 3 – significant unobservable inputs (including a fund’s own assumptions in determining the fair value of investments) |
In cases where the inputs used to measure fair value fall in different levels of the fair value hierarchy, the level disclosed is determined based on the lowest level input that is significant to the fair value measurement in its entirety. The inputs or methodology used for valuing securities are not necessarily an indication of the risk associated with investing in those securities.
At December 31, 2021, the hierarchy of inputs used in valuing the Fund’s investments, which are carried at value, were as follows:
| Asset Description | Level 1 | Level 2 | Level 3 | Total | ||||||||||||
Common Stocks | $ | 67,004,353 | * | $ | — | $ | — | $ | 67,004,353 | |||||||
Short-Term Investments | — | 1,463,016 | — | 1,463,016 | ||||||||||||
Total Investments | $ | 67,004,353 | $ | 1,463,016 | $ | — | $ | 68,467,369 | ||||||||
| * | The level classification by major category of investments is the same as the category presentation in the Portfolio of Investments. |
11 Risks and Uncertainties
Pandemic Risk
An outbreak of respiratory disease caused by a novel coronavirus was first detected in China in late 2019 and subsequently spread internationally. This coronavirus has resulted in closing borders, enhanced health screenings, changes to healthcare service preparation and delivery, quarantines, cancellations, disruptions to supply chains and customer activity, as well as general concern and uncertainty. Health crises caused by outbreaks, such as the coronavirus outbreak, may exacerbate other pre-existing political, social and economic risks and disrupt normal market conditions and operations. The impact of this outbreak has negatively affected the worldwide economy, the economies of individual countries, individual companies, and the market in general, and may continue to do so in significant and unforeseen ways, as may other epidemics and pandemics that may arise in the future. Any such impact could adversely affect the Fund’s performance, or the performance of the securities in which the Fund invests.
| 20 |
Eaton Vance
Special Equities Fund
December 31, 2021
Report of Independent Registered Public Accounting Firm
To the Trustees of Eaton Vance Special Investment Trust and Shareholders of Eaton Vance Special Equities Fund:
Opinion on the Financial Statements and Financial Highlights
We have audited the accompanying statement of assets and liabilities of Eaton Vance Special Equities Fund (the “Fund”) (one of the funds constituting Eaton Vance Special Investment Trust), including the portfolio of investments, as of December 31, 2021, the related statement of operations for the year then ended, the statements of changes in net assets for each of the two years in the period then ended, the financial highlights for each of the five years in the period then ended, and the related notes. In our opinion, the financial statements and financial highlights present fairly, in all material respects, the financial position of the Fund as of December 31, 2021, and the results of its operations for the year then ended, the changes in its net assets for each of the two years in the period then ended, and the financial highlights for each of the five years in the period then ended, in conformity with accounting principles generally accepted in the United States of America.
Basis for Opinion
These financial statements and financial highlights are the responsibility of the Fund’s management. Our responsibility is to express an opinion on the Fund’s financial statements and financial highlights based on our audits. We are a public accounting firm registered with the Public Company Accounting Oversight Board (United States) (PCAOB) and are required to be independent with respect to the Fund in accordance with the U.S. federal securities laws and the applicable rules and regulations of the Securities and Exchange Commission and the PCAOB.
We conducted our audits in accordance with the standards of the PCAOB. Those standards require that we plan and perform the audit to obtain reasonable assurance about whether the financial statements and financial highlights are free of material misstatement, whether due to error or fraud. The Fund is not required to have, nor were we engaged to perform, an audit of its internal control over financial reporting. As part of our audits, we are required to obtain an understanding of internal control over financial reporting but not for the purpose of expressing an opinion on the effectiveness of the Fund’s internal control over financial reporting. Accordingly, we express no such opinion.
Our audits included performing procedures to assess the risks of material misstatement of the financial statements and financial highlights, whether due to error or fraud, and performing procedures that respond to those risks. Such procedures included examining, on a test basis, evidence regarding the amounts and disclosures in the financial statements and financial highlights. Our audits also included evaluating the accounting principles used and significant estimates made by management, as well as evaluating the overall presentation of the financial statements and financial highlights. Our procedures included confirmation of securities owned as of December 31, 2021, by correspondence with the custodian and brokers; when replies were not received from brokers, we performed other auditing procedures. We believe that our audits provide a reasonable basis for our opinion.
/s/ Deloitte & Touche LLP
Boston, Massachusetts
February 23, 2022
We have served as the auditor of one or more Eaton Vance investment companies since 1959.
| 21 |
Eaton Vance
Special Equities Fund
December 31, 2021
Federal Tax Information (Unaudited)
The Form 1099-DIV you received in February 2022 showed the tax status of all distributions paid to your account in calendar year 2021. Shareholders are advised to consult their own tax adviser with respect to the tax consequences of their investment in the Fund. As required by the Internal Revenue Code and/or regulations, shareholders must be notified regarding the status of qualified dividend income for individuals, the dividends received deduction for corporations and capital gains dividends.
Qualified Dividend Income. For the fiscal year ended December 31, 2021, the Fund designates approximately $401,372, or up to the maximum amount of such dividends allowable pursuant to the Internal Revenue Code, as qualified dividend income eligible for the reduced tax rate of 15%.
Dividends Received Deduction. Corporate shareholders are generally entitled to take the dividends received deduction on the portion of the Fund’s dividend distribution that qualifies under tax law. For the Fund’s fiscal 2021 ordinary income dividends, 15.56% qualifies for the corporate dividends received deduction.
Capital Gains Dividends. The Fund hereby designates as a capital gain dividend with respect to the taxable year ended December 31, 2021, $7,307,216 or, if subsequently determined to be different, the net capital gain of such year.
| 22 |
Eaton Vance
Special Equities Fund
December 31, 2021
Fund Management. The Trustees of Eaton Vance Special Investment Trust (the Trust) are responsible for the overall management and supervision of the Trust’s affairs. The Board members and officers of the Trust are listed below. Except as indicated, each individual has held the office shown or other offices in the same company for the last five years. Board members hold indefinite terms of office. Each Trustee holds office until his or her successor is elected and qualified, subject to a prior death, resignation, retirement, disqualification or removal. Under the terms of the Fund’s current Trustee retirement policy, an Independent Trustee must retire and resign as a Trustee on the earlier of: (i) the first day of July following his or her 74th birthday; or (ii), with limited exception, December 31st of the 20th year in which he or she has served as a Trustee. However, if such retirement and resignation would cause the Fund to be out of compliance with Section 16 of the 1940 Act or any other regulations or guidance of the SEC, then such retirement and resignation will not become effective until such time as action has been taken for the Fund to be in compliance therewith. The “noninterested Trustees” consist of those Trustees who are not “interested persons” of the Trust, as that term is defined under the 1940 Act. The business address of each Board member and officer is Two International Place, Boston, Massachusetts 02110. As used below, “BMR” refers to Boston Management and Research, “EVC” refers to Eaton Vance Corp., “EV” refers to EV LLC, “EVM” refers to Eaton Vance Management and “EVD” refers to Eaton Vance Distributors, Inc. EV is the trustee of each of EVM and BMR. Effective March 1, 2021, each of EVM, BMR, EVD and EV are indirect, wholly owned subsidiaries of Morgan Stanley. Each officer affiliated with EVM may hold a position with other EVM affiliates that is comparable to his or her position with EVM listed below. Each Trustee oversees 138 funds (with the exception of Messrs. Faust and Wennerholm and Ms. Frost who oversee 137 funds) in the Eaton Vance fund complex (including both funds and portfolios in a hub and spoke structure).
| Name and Year of Birth | Trust Position(s) | Length of Service | Principal Occupation(s) and Other Directorships During Past Five Years and Other Relevant Experience | |||
| Interested Trustee | ||||||
Thomas E. Faust Jr. 1958 | Trustee | Since 2007 | Chairman of Morgan Stanley Investment Management, Inc. (MSIM), member of the Board of Managers and President of EV, Chief Executive Officer of EVM and BMR, and Director of EVD. Formerly, Chairman, Chief Executive Officer and President of EVC. Mr. Faust is an interested person because of his positions with MSIM, BMR, EVM, EVD, and EV, which are affiliates of the Trust, and his former position with EVC, which was an affiliate of the Trust prior to March 1, 2021. Other Directorships. Formerly, Director of EVC (2007-2021) and Hexavest Inc. (investment management firm) (2012-2021). | |||
| Noninterested Trustees | ||||||
Mark R. Fetting 1954 | Trustee | Since 2016 | Private investor. Formerly held various positions at Legg Mason, Inc. (investment management firm) (2000-2012), including President, Chief Executive Officer, Director and Chairman (2008-2012), Senior Executive Vice President (2004-2008) and Executive Vice President (2001-2004). Formerly, President of Legg Mason family of funds (2001-2008). Formerly, Division President and Senior Officer of Prudential Financial Group, Inc. and related companies (investment management firm) (1991-2000). Other Directorships. None. | |||
Cynthia E. Frost 1961 | Trustee | Since 2014 | Private investor. Formerly, Chief Investment Officer of Brown University (university endowment) (2000-2012). Formerly, Portfolio Strategist for Duke Management Company (university endowment manager) (1995-2000). Formerly, Managing Director, Cambridge Associates (investment consulting company) (1989-1995). Formerly, Consultant, Bain and Company (management consulting firm) (1987-1989). Formerly, Senior Equity Analyst, BA Investment Management Company (1983-1985). Other Directorships. None. | |||
George J. Gorman 1952 | Chairperson of the Board and Trustee | Since 2021 (Chairperson) and 2014 (Trustee) | Principal at George J. Gorman LLC (consulting firm). Formerly, Senior Partner at Ernst & Young LLP (a registered public accounting firm) (1974-2009). Other Directorships. None. | |||
Valerie A. Mosley 1960 | Trustee | Since 2014 | Chairwoman and Chief Executive Officer of Valmo Ventures (a consulting and investment firm). Founder of Upward Wealth, Inc., dba BrightUP, a fintech platform. Formerly, Partner and Senior Vice President, Portfolio Manager and Investment Strategist at Wellington Management Company, LLP (investment management firm) (1992-2012). Formerly, Chief Investment Officer, PG Corbin Asset Management (1990-1992). Formerly worked in institutional corporate bond sales at Kidder Peabody (1986-1990). Other Directorships. Director of DraftKings, Inc. (digital sports entertainment and gaming company) (since September 2020). Director of Groupon, Inc. (e-commerce provider) (since April 2020). Director of Envestnet, Inc. (provider of intelligent systems for wealth management and financial wellness) (since 2018). Formerly, Director of Dynex Capital, Inc. (mortgage REIT) (2013-2020). | |||
| 23 |
Eaton Vance
Special Equities Fund
December 31, 2021
Management and Organization — continued
| Name and Year of Birth | Trust Position(s) | Length of Service | Principal Occupation(s) and Other Directorships During Past Five Years and Other Relevant Experience | |||
| Noninterested Trustees (continued) | ||||||
William H. Park 1947 | Trustee | Since 2003 | Private investor. Formerly, Consultant (management and transactional) (2012-2014). Formerly, Chief Financial Officer, Aveon Group L.P. (investment management firm) (2010-2011). Formerly, Vice Chairman, Commercial Industrial Finance Corp. (specialty finance company) (2006-2010). Formerly, President and Chief Executive Officer, Prizm Capital Management, LLC (investment management firm) (2002-2005). Formerly, Executive Vice President and Chief Financial Officer, United Asset Management Corporation (investment management firm) (1982-2001). Formerly, Senior Manager, Price Waterhouse (now PricewaterhouseCoopers) (a registered public accounting firm) (1972-1981). Other Directorships. None. | |||
Helen Frame Peters 1948 | Trustee | Since 2008 | Professor of Finance, Carroll School of Management, Boston College. Formerly, Dean, Carroll School of Management, Boston College (2000-2002). Formerly, Chief Investment Officer, Fixed Income, Scudder Kemper Investments (investment management firm) (1998-1999). Formerly, Chief Investment Officer, Equity and Fixed Income, Colonial Management Associates (investment management firm) (1991-1998). Other Directorships. None. | |||
Keith Quinton 1958 | Trustee | Since 2018 | Private investor, researcher and lecturer. Formerly, Independent Investment Committee Member at New Hampshire Retirement System (2017-2021). Formerly, Portfolio Manager and Senior Quantitative Analyst at Fidelity Investments (investment management firm) (2001-2014). Other Directorships. Formerly, Director (2016-2021) and Chairman (2019-2021) of New Hampshire Municipal Bond Bank. | |||
Marcus L. Smith 1966 | Trustee | Since 2018 | Private investor. Formerly, Portfolio Manager at MFS Investment Management (investment management firm) (1994-2017). Other Directorships. Director of First Industrial Realty Trust, Inc. (an industrial REIT) (since 2021). Director of MSCI Inc. (global provider of investment decision support tools) (since 2017). Formerly, Director of DCT Industrial Trust Inc. (logistics real estate company) (2017-2018). | |||
Susan J. Sutherland 1957 | Trustee | Since 2015 | Private investor. Director of Ascot Group Limited and certain of its subsidiaries (insurance and reinsurance) (since 2017). Formerly, Director of Hagerty Holding Corp. (insurance) (2015-2018) and Montpelier Re Holdings Ltd. (insurance and reinsurance) (2013-2015). Formerly, Associate, Counsel and Partner at Skadden, Arps, Slate, Meagher & Flom LLP (law firm) (1982-2013). Other Directorships. Director of Kairos Acquisition Corp. (insurance/InsurTech acquisition company) (since 2021). | |||
Scott E. Wennerholm 1959 | Trustee | Since 2016 | Private investor. Formerly, Trustee at Wheelock College (postsecondary institution) (2012-2018). Formerly, Consultant at GF Parish Group (executive recruiting firm) (2016-2017). Formerly, Chief Operating Officer and Executive Vice President at BNY Mellon Asset Management (investment management firm) (2005-2011). Formerly, Chief Operating Officer and Chief Financial Officer at Natixis Global Asset Management (investment management firm) (1997-2004). Formerly, Vice President at Fidelity Investments Institutional Services (investment management firm) (1994-1997). Other Directorships. None. | |||
| Name and Year of Birth | Trust Position(s) | Length of Service | Principal Occupation(s) During Past Five Years | |||
| Principal Officers who are not Trustees | ||||||
Eric A. Stein 1980 | President | Since 2020 | Vice President and Chief Investment Officer, Fixed Income of EVM and BMR. Prior to November 1, 2020, Mr. Stein was a co-Director of Eaton Vance’s Global Income Investments. Also Vice President of Calvert Research and Management (“CRM”). | |||
Deidre E. Walsh 1971 | Vice President and Chief Legal Officer | Since 2009 | Vice President of EVM and BMR. Also Vice President of CRM. | |||
| 24 |
Eaton Vance
Special Equities Fund
December 31, 2021
Management and Organization — continued
| Name and Year of Birth | Trust Position(s) | Length of Service | Principal Occupation(s) During Past Five Years | |||
| Principal Officers who are not Trustees (continued) | ||||||
James F. Kirchner 1967 | Treasurer | Since 2007 | Vice President of EVM and BMR. Also Vice President of CRM. | |||
Jill R. Damon 1984 | Secretary | Since 2022 | Vice President of EVM and BMR since 2017. Formerly, associate at Dechert LLP (2009-2017). | |||
Richard F. Froio 1968 | Chief Compliance Officer | Since 2017 | Vice President of EVM and BMR since 2017. Formerly, Deputy Chief Compliance Officer (Adviser/Funds) and Chief Compliance Officer (Distribution) at PIMCO (2012-2017) and Managing Director at BlackRock/Barclays Global Investors (2009-2012). | |||
The SAI for the Fund includes additional information about the Trustees and officers of the Trust and can be obtained without charge on Eaton Vance’s website at www.eatonvance.com or by calling 1-800-262-1122.
| 25 |
Eaton Vance Funds
| Privacy Notice | April 2021 |
| FACTS | WHAT DOES EATON VANCE DO WITH YOUR PERSONAL INFORMATION? | |
| Why? | Financial companies choose how they share your personal information. Federal law gives consumers the right to limit some but not all sharing. Federal law also requires us to tell you how we collect, share, and protect your personal information. Please read this notice carefully to understand what we do. | |
| What? | The types of personal information we collect and share depend on the product or service you have with us. This information can include:
∎ Social Security number and income ∎ investment experience and risk tolerance ∎ checking account number and wire transfer instructions | |
| How? | All financial companies need to share customers’ personal information to run their everyday business. In the section below, we list the reasons financial companies can share their customers’ personal information; the reasons Eaton Vance chooses to share; and whether you can limit this sharing. | |
| Reasons we can share your personal information | Does Eaton Vance share? | Can you limit this sharing? | ||
| For our everyday business purposes — such as to process your transactions, maintain your account(s), respond to court orders and legal investigations, or report to credit bureaus | Yes | No | ||
| For our marketing purposes — to offer our products and services to you | Yes | No | ||
| For joint marketing with other financial companies | No | We don’t share | ||
| For our investment management affiliates’ everyday business purposes — information about your transactions, experiences, and creditworthiness | Yes | Yes | ||
| For our affiliates’ everyday business purposes — information about your transactions and experiences | Yes | No | ||
| For our affiliates’ everyday business purposes — information about your creditworthiness | No | We don’t share | ||
| For our investment management affiliates to market to you | Yes | Yes | ||
| For our affiliates to market to you | No | We don’t share | ||
| For nonaffiliates to market to you | No | We don’t share |
| To limit our sharing | Call toll-free 1-800-262-1122 or email: EVPrivacy@eatonvance.com
Please note:
If you are a new customer, we can begin sharing your information 30 days from the date we sent this notice. When you are no longer our customer, we continue to share your information as described in this notice. However, you can contact us at any time to limit our sharing. | |
| Questions? | Call toll-free 1-800-262-1122 or email: EVPrivacy@eatonvance.com | |
| 26 |
Eaton Vance Funds
| Privacy Notice — continued | April 2021 |
| Page 2 |
| Who we are | ||
| Who is providing this notice? | Eaton Vance Management, Eaton Vance Distributors, Inc., Eaton Vance Trust Company, Eaton Vance Management (International) Limited, Eaton Vance Advisers International Ltd., Eaton Vance Global Advisors Limited, Eaton Vance Management’s Real Estate Investment Group, Boston Management and Research, Calvert Research and Management, Eaton Vance and Calvert Fund Families and our investment advisory affiliates (“Eaton Vance”) (see Investment Management Affiliates definition below) | |
| What we do | ||
| How does Eaton Vance protect my personal information? | To protect your personal information from unauthorized access and use, we use security measures that comply with federal law. These measures include computer safeguards and secured files and buildings. We have policies governing the proper handling of customer information by personnel and requiring third parties that provide support to adhere to appropriate security standards with respect to such information. | |
| How does Eaton Vance collect my personal information? | We collect your personal information, for example, when you
∎ open an account or make deposits or withdrawals from your account ∎ buy securities from us or make a wire transfer ∎ give us your contact information
We also collect your personal information from others, such as credit bureaus, affiliates, or other companies. | |
| Why can’t I limit all sharing? | Federal law gives you the right to limit only
∎ sharing for affiliates’ everyday business purposes — information about your creditworthiness ∎ affiliates from using your information to market to you ∎ sharing for nonaffiliates to market to you
State laws and individual companies may give you additional rights to limit sharing. See below for more on your rights under state law. | |
| Definitions | ||
| Investment Management Affiliates | Eaton Vance Investment Management Affiliates include registered investment advisers, registered broker-dealers, and registered and unregistered funds. Investment Management Affiliates does not include entities associated with Morgan Stanley Wealth Management, such as Morgan Stanley Smith Barney LLC and Morgan Stanley & Co. | |
| Affiliates | Companies related by common ownership or control. They can be financial and nonfinancial companies.
∎ Our affiliates include companies with a Morgan Stanley name and financial companies such as Morgan Stanley Smith Barney LLC and Morgan Stanley & Co. | |
| Nonaffiliates | Companies not related by common ownership or control. They can be financial and nonfinancial companies.
∎ Eaton Vance does not share with nonaffiliates so they can market to you. | |
| Joint marketing | A formal agreement between nonaffiliated financial companies that together market financial products or services to you.
∎ Eaton Vance doesn’t jointly market. | |
| Other important information | ||
Vermont: Except as permitted by law, we will not share personal information we collect about Vermont residents with Nonaffiliates unless you provide us with your written consent to share such information.
California: Except as permitted by law, we will not share personal information we collect about California residents with Nonaffiliates and we will limit sharing such personal information with our Affiliates to comply with California privacy laws that apply to us. | ||
| 27 |
Eaton Vance Funds
Delivery of Shareholder Documents. The Securities and Exchange Commission (SEC) permits funds to deliver only one copy of shareholder documents, including prospectuses, proxy statements and shareholder reports, to fund investors with multiple accounts at the same residential or post office box address. This practice is often called “householding” and it helps eliminate duplicate mailings to shareholders. Eaton Vance, or your financial intermediary, may household the mailing of your documents indefinitely unless you instruct Eaton Vance, or your financial intermediary, otherwise. If you would prefer that your Eaton Vance documents not be householded, please contact Eaton Vance at 1-800-262-1122, or contact your financial intermediary. Your instructions that householding not apply to delivery of your Eaton Vance documents will be effective within 30 days of receipt by Eaton Vance or your financial intermediary.
Portfolio Holdings. Each Eaton Vance Fund and its underlying Portfolio(s) (if applicable) files a schedule of portfolio holdings on Part F to Form N-PORT with the SEC. Certain information filed on Form N-PORT may be viewed on the Eaton Vance website at www.eatonvance.com, by calling Eaton Vance at 1-800-262-1122 or in the EDGAR database on the SEC’s website at www.sec.gov.
Proxy Voting. From time to time, funds are required to vote proxies related to the securities held by the funds. The Eaton Vance Funds or their underlying Portfolios (if applicable) vote proxies according to a set of policies and procedures approved by the Funds’ and Portfolios’ Boards. You may obtain a description of these policies and procedures and information on how the Funds or Portfolios voted proxies relating to portfolio securities during the most recent 12-month period ended June 30, without charge, upon request, by calling 1-800-262-1122 and by accessing the SEC’s website at www.sec.gov.
| 28 |
Investment Adviser
Boston Management and Research
Two International Place
Boston, MA 02110
Administrator
Eaton Vance Management
Two International Place
Boston, MA 02110
Principal Underwriter*
Eaton Vance Distributors, Inc.
Two International Place
Boston, MA 02110
(617) 482-8260
Custodian
State Street Bank and Trust Company
State Street Financial Center, One Lincoln Street
Boston, MA 02111
Transfer Agent
BNY Mellon Investment Servicing (US) Inc.
Attn: Eaton Vance Funds
P.O. Box 9653
Providence, RI 02940-9653
(800) 262-1122
Independent Registered Public Accounting Firm
Deloitte & Touche LLP
200 Berkeley Street
Boston, MA 02116-5022
Fund Offices
Two International Place
Boston, MA 02110
| * | FINRA BrokerCheck. Investors may check the background of their Investment Professional by contacting the Financial Industry Regulatory Authority (FINRA). FINRA BrokerCheck is a free tool to help investors check the professional background of current and former FINRA-registered securities firms and brokers. FINRA BrokerCheck is available by calling 1-800-289-9999 and at www.FINRA.org. The FINRA BrokerCheck brochure describing this program is available to investors at www.FINRA.org. |
172 12.31.21
Item 2. Code of Ethics
The registrant (sometimes referred to as the “Fund”) has adopted a code of ethics applicable to its Principal Executive Officer, Principal Financial Officer and Principal Accounting Officer. The registrant undertakes to provide a copy of such code of ethics to any person upon request, without charge, by calling 1-800-262-1122. The registrant has not amended the code of ethics as described in Form N-CSR during the period covered by this report. The registrant has not granted any waiver, including an implicit waiver, from a provision of the code of ethics as described in Form N-CSR during the period covered by this report.
Item 3. Audit Committee Financial Expert
The registrant’s Board of Trustees (the “Board”) has designated George J. Gorman, William H. Park and Scott E. Wennerholm, each an independent trustee, as audit committee financial experts. Mr. Gorman is a certified public accountant who is the Principal at George J. Gorman LLC (a consulting firm). Previously, Mr. Gorman served in various capacities at Ernst & Young LLP (a registered public accounting firm), including as Senior Partner. Mr. Gorman also has experience serving as an independent trustee and audit committee financial
expert of other mutual fund complexes. Mr. Park is a certified public accountant who is a private investor. Previously, he served as a consultant, as the Chief Financial Officer of Aveon Group, L.P. (an investment management firm), as the Vice Chairman of Commercial Industrial Finance Corp. (specialty finance company), as President and Chief Executive Officer of Prizm Capital Management, LLC (investment management firm), as Executive Vice President and Chief Financial Officer of United Asset Management Corporation (an institutional investment management firm) and as a Senior Manager at Price Waterhouse (now PricewaterhouseCoopers) (a registered public accounting firm). Mr. Wennerholm is a private investor. Previously, Mr. Wennerholm served as a Trustee at Wheelock College (postsecondary institution), as a Consultant at GF Parish Group (executive recruiting firm), Chief Operating Officer and Executive Vice President at BNY Mellon Asset Management (investment management firm), Chief Operating Officer and Chief Financial Officer at Natixis Global Asset Management (investment management firm), and Vice President at Fidelity Investments Institutional Services (investment management firm).
Item 4. Principal Accountant Fees and Services
Eaton Vance Balanced Fund, Eaton Vance Core Bond Fund, Eaton Vance Dividend Builder Fund, Eaton Vance Growth Fund, Eaton Vance Large-Cap Value Fund, Eaton Vance Small-Cap Fund and Eaton Vance Special Equities Fund (the “Fund(s)”) are series of Eaton Vance Special Investment Trust (the “Trust”), a Massachusetts business trust, which, including the Funds, contains a total of 9 series (the “Series”). The Trust is registered under the Investment Company Act of 1940 as an open-end management investment company. This Form N-CSR relates to the Funds’ annual reports.
(a)-(d)
The following tables present the aggregate fees billed to each Fund for the Fund’s fiscal years ended December 31, 2020 and December 31, 2021 by the registrant’s principal accountant, Deloitte & Touche LLP (“D&T”), for professional services rendered for the audit of the Fund’s annual financial statements and fees billed for other services rendered by D&T during such periods.
Eaton Vance Balanced Fund Fiscal Years Ended | 12/31/20 | 12/31/21 | ||||||
Audit Fees | $ | 24,450 | $ | 24,450 | ||||
Audit-Related Fees(1) | $ | 0 | $ | 0 | ||||
Tax Fees(2) | $ | 16,258 | $ | 16,608 | ||||
All Other Fees(3) | $ | 0 | $ | 0 | ||||
|
|
|
| |||||
Total | $ | 40,708 | $ | 41,058 | ||||
|
|
|
| |||||
Eaton Vance Core Bond Fund Fiscal Years Ended | 12/31/20 | 12/31/21 | ||||||
Audit Fees | $ | 15,250 | $ | 15,250 | ||||
Audit-Related Fees(1) | $ | 0 | $ | 0 | ||||
Tax Fees(2) | $ | 12,198 | $ | 12,548 | ||||
All Other Fees(3) | $ | 0 | $ | 0 | ||||
|
|
|
| |||||
Total | $ | 27,448 | $ | 27,798 | ||||
|
|
|
| |||||
Eaton Vance Dividend Builder Fund
Fiscal Years Ended | 12/31/20 | 12/31/21 | ||||||
Audit Fees | $ | 47,650 | $ | 37,650 | ||||
Audit-Related Fees(1) | $ | 0 | $ | 0 | ||||
Tax Fees(2) | $ | 15,551 | $ | 13,576 | ||||
All Other Fees(3) | $ | 0 | $ | 0 | ||||
|
|
|
| |||||
Total | $ | 63,201 | $ | 51,226 | ||||
|
|
|
| |||||
Eaton Vance Growth Fund
Fiscal Years Ended | 12/31/20 | 12/31/21 | ||||||
Audit Fees | $ | 35,450 | $ | 27,050 | ||||
Audit-Related Fees(1) | $ | 0 | $ | 0 | ||||
Tax Fees(2) | $ | 13,840 | $ | 14,190 | ||||
All Other Fees(3) | $ | 0 | $ | 0 | ||||
|
|
|
| |||||
Total | $ | 49,290 | $ | 41,240 | ||||
|
|
|
| |||||
Eaton Vance Large-Cap Value Fund
Fiscal Years Ended | 12/31/20 | 12/31/21 | ||||||
Audit Fees | $ | 48,950 | $ | 38,950 | ||||
Audit-Related Fees(1) | $ | 0 | $ | 0 | ||||
Tax Fees(2) | $ | 16,389 | $ | 16,739 | ||||
All Other Fees(3) | $ | 0 | $ | 0 | ||||
|
|
|
| |||||
Total | $ | 65,339 | $ | 55,689 | ||||
|
|
|
| |||||
Eaton Vance Small-Cap Fund
Fiscal Years Ended | 12/31/20 | 12/31/21 | ||||||
Audit Fees | $ | 33,050 | $ | 28,050 | ||||
Audit-Related Fees(1) | $ | 0 | $ | 0 | ||||
Tax Fees(2) | $ | 10,512 | $ | 10,862 | ||||
All Other Fees(3) | $ | 0 | $ | 0 | ||||
|
|
|
| |||||
Total | $ | 43,562 | $ | 38,912 | ||||
|
|
|
| |||||
Eaton Vance Special Equities Fund
Fiscal Years Ended | 12/31/20 | 12/31/21 | ||||||
Audit Fees | $ | 29,450 | $ | 27,050 | ||||
Audit-Related Fees(1) | $ | 0 | $ | 0 | ||||
Tax Fees(2) | $ | 9,953 | $ | 10,303 | ||||
All Other Fees(3) | $ | 0 | $ | 0 | ||||
|
|
|
| |||||
Total | $ | 39,403 | $ | 37,353 | ||||
|
|
|
| |||||
| (1) | Audit-related fees consist of the aggregate fees billed for assurance and related services that are reasonably related to the performance of the audit of financial statements and are not reported under the category of audit fees. |
| (2) | Tax fees consist of the aggregate fees billed for professional services rendered by the principal accountant relating to tax compliance, tax advice, and tax planning and specifically include fees for tax return preparation and other related tax compliance/planning matters. |
| (3) | All other fees consist of the aggregate fees billed for products and services provided by the principal accountant other than audit, audit-related, and tax services. |
The various Series comprising the Trust have differing fiscal year ends (October 31 and December 31). The following table presents the aggregate audit, audit-related, tax, and other fees billed to all of the Series in the Trust by D&T for the last two fiscal years of each Series.
Fiscal Years Ended | 10/31/20 | 12/31/20 | 10/31/21 | 12/31/21 | ||||||||||||
Audit Fees | $ | 39,350 | $ | 283,450 | $ | 40,350 | $ | 214,800 | ||||||||
Audit-Related Fees(1) | $ | 0 | $ | 0 | $ | 0 | $ | 0 | ||||||||
Tax Fees(2) | $ | 8,572 | $ | 113,037 | $ | 8,922 | $ | 101,882 | ||||||||
All Other Fees(3) | $ | 0 | $ | 0 | $ | 0 | $ | 0 | ||||||||
|
|
|
|
|
|
|
| |||||||||
Total | $ | 47,922 | $ | 396,487 | $ | 49,272 | $ | 316,682 | ||||||||
|
|
|
|
|
|
|
| |||||||||
| (1) | Audit-related fees consist of the aggregate fees billed for assurance and related services that are reasonably related to the performance of the audit of financial statements and are not reported under the category of audit fees. |
| (2) | Tax fees consist of the aggregate fees billed for professional services rendered by the principal accountant relating to tax compliance, tax advice, and tax planning and specifically include fees for tax return preparation and other related tax compliance/planning matters. |
| (3) | All other fees consist of the aggregate fees billed for products and services provided by the principal accountant other than audit, audit-related, and tax services. |
(e)(1) The registrant’s audit committee has adopted policies and procedures relating to the pre-approval of services provided by the registrant’s principal accountant (the “Pre-Approval Policies”). The Pre-Approval Policies establish a framework intended to assist the audit committee in the proper discharge of its pre-approval responsibilities. As a general matter, the Pre-Approval Policies (i) specify certain types of audit, audit-related, tax, and other services determined to be pre-approved by the audit committee; and (ii) delineate specific procedures governing the mechanics of the pre-approval process, including the approval and monitoring of audit and non-audit service fees. Unless a service is specifically pre-approved under the Pre-Approval Policies, it must be separately pre-approved by the audit committee.
The Pre-Approval Policies and the types of audit and non-audit services pre-approved therein must be reviewed and ratified by the registrant’s audit committee at least annually. The registrant’s audit committee maintains full responsibility for the appointment, compensation, and oversight of the work of the registrant’s principal accountant.
(e)(2) No services described in paragraphs (b)-(d) above were approved by the registrant’s audit committee pursuant to the “de minimis exception” set forth in Rule 2-01 (c)(7)(i)(C) of Regulation S-X.
(f) Not applicable.
(g) The following table presents (i) the aggregate non-audit fees (i.e., fees for audit-related, tax, and other services) billed for services rendered to all of the Series in the Trust by D&T for the last two fiscal years of each Series; and (ii) the aggregate non-audit fees (i.e., fees for audit-related, tax, and other services) billed to the Eaton Vance organization by D&T for the last two fiscal years of each Series.
Fiscal Years Ended | 10/31/20 | 12/31/20 | 10/31/21 | 12/31/21 | ||||||||||||
Registrant(1) | $ | 8,572 | $ | 113,037 | $ | 8,922 | $ | 101,882 | ||||||||
Eaton Vance(2) | $ | 51,800 | $ | 150,300 | $ | 51,800 | $ | 51,800 | ||||||||
| (1) | Includes all of the Series of the Trust. During the fiscal years reported above, certain of the Funds were “feeder” funds in a “master-feeder” fund structure or funds of funds. |
| (2) | Various subsidiaries of Morgan Stanley act in either an investment advisory and/or service provider capacity with respect to the Series and/or their respective “master” funds (if applicable). |
(h) The registrant’s audit committee has considered whether the provision by the registrant’s principal accountant of non-audit services to the registrant’s investment adviser and any entity controlling, controlled by, or under common control with the adviser that provides ongoing services to the registrant that were not pre-approved pursuant to Rule 2-01(c)(7)(ii) of Regulation S-X is compatible with maintaining the principal accountant’s independence.
Item 5. Audit Committee of Listed Registrants
Not applicable.
Item 6. Schedule of Investments
Please see schedule of investments contained in the Report to Stockholders included under Item 1 of this Form N-CSR.
Item 7. Disclosure of Proxy Voting Policies and Procedures for Closed-End Management Investment Companies
Not applicable.
Item 8. Portfolio Managers of Closed-End Management Investment Companies
Not applicable.
Item 9. Purchases of Equity Securities by Closed-End Management Investment Company and Affiliated Purchasers
Not applicable.
Item 10. Submission of Matters to a Vote of Security Holders
No material changes.
Item 11. Controls and Procedures
(a) It is the conclusion of the registrant’s principal executive officer and principal financial officer that the effectiveness of the registrant’s current disclosure controls and procedures (such disclosure controls and procedures having been evaluated within 90 days of the date of this filing) provide reasonable assurance that the information required to be disclosed by the registrant has been recorded, processed, summarized and reported within the time period specified in the Commission’s rules and forms and that the information required to be disclosed by the registrant has been accumulated and communicated to the registrant’s principal executive officer and principal financial officer in order to allow timely decisions regarding required disclosure.
(b) There have been no changes in the registrant’s internal controls over financial reporting during the period covered by this report that has materially affected, or is reasonably likely to materially affect, the registrant’s internal control over financial reporting.
Item 12. Disclosure of Securities Lending Activities for Closed-End Management Investment Companies
Not applicable.
Item 13. Exhibits
(a)(1) | Registrant’s Code of Ethics – Not applicable (please see Item 2). | |
(a)(2)(i) | ||
(a)(2)(ii) | ||
(b) | ||
Signatures
Pursuant to the requirements of the Securities Exchange Act of 1934 and the Investment Company Act of 1940, the registrant has duly caused this report to be signed on its behalf by the undersigned, thereunto duly authorized.
| Eaton Vance Special Investment Trust | ||
| By: | /s/ Eric A. Stein | |
| Eric A. Stein | ||
| President | ||
Date: February 23, 2022
Pursuant to the requirements of the Securities Exchange Act of 1934 and the Investment Company Act of 1940, this report has been signed below by the following persons on behalf of the registrant and in the capacities and on the dates indicated.
| By: | /s/ James F. Kirchner | |
| James F. Kirchner | ||
| Treasurer | ||
Date: February 23, 2022
| By: | /s/ Eric A. Stein | |
| Eric A. Stein | ||
| President | ||
Date: February 23, 2022