UNITED STATES
SECURITIES AND EXCHANGE COMMISSION
Washington, D.C. 20549
Form N-CSR
CERTIFIED SHAREHOLDER REPORT OF REGISTERED
MANAGEMENT INVESTMENT COMPANIES
Investment Company Act File Number: 811-01545
Eaton Vance Special Investment Trust
(Exact Name of Registrant as Specified in Charter)
Two International Place, Boston, Massachusetts 02110
(Address of Principal Executive Offices)
Deidre E. Walsh
Two International Place, Boston, Massachusetts 02110
(Name and Address of Agent for Services)
(617) 482-8260
(Registrant’s Telephone Number)
December 31
Date of Fiscal Year End
December 31, 2022
Date of Reporting Period
| Item 1. | Reports to Stockholders |
Eaton Vance
Balanced Fund
Annual Report
December 31, 2022
Commodity Futures Trading Commission Registration. The Commodity Futures Trading Commission (“CFTC”) has adopted regulations that subject registered investment companies and advisers to regulation by the CFTC if a fund invests more than a prescribed level of its assets in certain CFTC-regulated instruments (including futures, certain options and swap agreements) or markets itself as providing investment exposure to such instruments. The investment adviser has claimed an exclusion from the definition of “commodity pool operator” under the Commodity Exchange Act with respect to its management of the Fund. Accordingly, neither the Fund nor the adviser with respect to the operation of the Fund is subject to CFTC regulation. Because of its management of other strategies, the Fund's adviser is registered with the CFTC as a commodity pool operator. The adviser is also registered as a commodity trading advisor.
Fund shares are not insured by the FDIC and are not deposits or other obligations of, or guaranteed by, any depository institution. Shares are subject to investment risks, including possible loss of principal invested.
This report must be preceded or accompanied by a current summary prospectus or prospectus. Before investing, investors should consider carefully the investment objective, risks, and charges and expenses of a mutual fund. This and other important information is contained in the summary prospectus and prospectus, which can be obtained from a financial intermediary. Prospective investors should read the prospectus carefully before investing. For further information, please call 1-800-262-1122.
Annual Report December 31, 2022
Eaton Vance
Balanced Fund
Eaton Vance
Balanced Fund
December 31, 2022
Management’s Discussion of Fund Performance†
Economic and Market Conditions
The 12-month period starting January 1, 2022 was one of the rare moments when equity and fixed-income assets moved largely in sync -- downward. Most major U.S. stock and bond indexes posted double-digit declines during the period as markets were dominated by the ongoing effects of one black swan event -- the COVID-19 pandemic -- and fallout from another -- Russia’s invasion of Ukraine.
As the new year began, investors became increasingly concerned about the twin threats of inflation and interest rate hikes. As a result, stock performance turned negative -- a sharp about-face from the all-time highs many U.S. equity indexes had posted in late 2021. In anticipation of U.S. Federal Reserve (the Fed) interest rate hikes, bond performance turned negative as well.
In February, Russia’s invasion of Ukraine sent shock waves through U.S. and global markets, exacerbating inflationary pressures on energy and food costs. The Fed -- along with other central banks around the world -- initiated its first interest rate hikes in years.
Investors began to expect the Fed would raise interest rates at every policy meeting in 2022 and, in turn, worried that aggressive rate hikes could tip the economy into recession. At its June, July, September, and November 2022 policy meetings, the Fed hiked the federal funds rate 0.75% each time -- its first moves of that magnitude since 1994. Higher interest rates, inflation, and recessionary worries drove stock and bond prices down, with rate-sensitive technology stocks -- star performers earlier in the pandemic -- suffering some of the worst declines.
In October and November 2022, however, U.S. stocks delivered positive performance for the first time in months. Fixed-income investors enjoyed a November rally as well. The stock and bond rallies were driven by a combination of better-than-expected company earnings, declining inflation, and hope that the Fed would temper the size of future rate hikes.
But while the Fed indeed delivered a smaller 0.50% rate hike in December, it raised its expectation of how high rates might go in 2023. As investors considered the prospect that rates could stay higher for longer than previously expected, equity and fixed-income prices declined in the final month of 2022.
For the period as a whole, the S& P 500® Index, a broad measure of U.S. stocks, returned -18.11%; the technology-laden Nasdaq Composite Index returned -32.54%; the Bloomberg U.S. Treasury Index returned -12.46%; and the Bloomberg U.S. Aggregate Bond Index, a broad measure of U.S. fixed-income markets, returned -13.01%.
Fund Performance
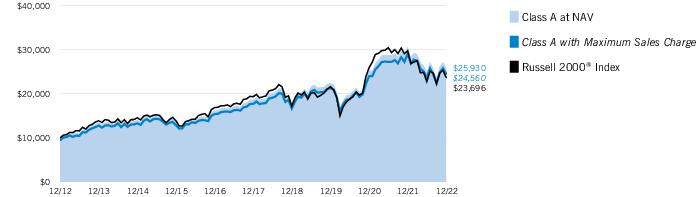
For the 12-month period ended December 31, 2022, Eaton Vance Balanced Fund (the Fund) returned -15.58% for Class A shares at net asset value (NAV), outperforming its primary benchmark, the S&P 500® Index (the Index), which returned -18.11%.
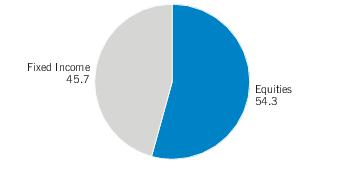
The Fund invests in a blend of Stock Portfolio -- the Fund’s equity allocation -- and Core Bond Portfolio -- the Fund’s fixed-income allocation. At period-end, 54% of the Fund was invested in equities, while 46% was invested in fixed-income securities.
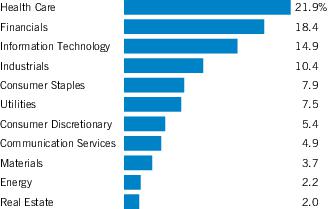
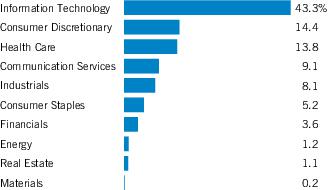
On the equity side, the Stock Portfolio outperformed the Index during the period. On an individual stock basis, the largest contributor to Fund performance versus the Index was an overweight position in energy exploration and production firm ConocoPhillips Co. (ConocoPhillips). The company benefited from a strong balance sheet, reliable operations, and rising oil prices that led to increased profits, which boosted the company’s stock price during the period.
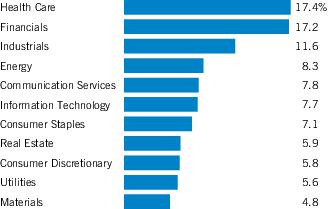
On a sector basis, stock selections in the information technology and communication services sectors; stock selections and an overweight position in the health care sector; and stock selections and an underweight position in the consumer discretionary sector contributed to Fund performance versus the Index during the period.
In contrast, the largest individual stock detractor from performance relative to the Index was not owning Index component and major oil and gas producer Exxon Mobil Corp. (Exxon Mobil). As with ConocoPhillips, higher oil and gas prices led to increased profits that boosted Exxon Mobil’s stock price during the period.
On a sector basis, stock selections and an underweight position in the energy sector -- the best-performing sector within the Index during the period -- and stock selections in the financials and industrials sectors detracted from Fund performance versus the Index during the period.
On the fixed-income side, the Core Bond Portfolio outperformed the Index, but underperformed the Fund’s secondary benchmark, the Bloomberg U.S. Aggregate Bond Index (the Secondary Index).
Security selection in the Core Bond Portfolio was the largest detractor from returns relative to the Secondary Index. Selections among investment-grade corporate bonds and asset-backed securities (ABS) weighed most on relative performance. Selections among U.S. Treasurys also detracted from relative returns during the period.
See Endnotes and Additional Disclosures in this report.
Past performance is no guarantee of future results. Returns are historical and are calculated by determining the percentage change in net asset value (NAV) or offering price (as applicable) with all distributions reinvested. Furthermore, returns do not reflect the deduction of taxes that shareholders may have to pay on Fund distributions or upon the redemption of Fund shares. Investment return and principal value will fluctuate so that shares, when redeemed, may be worth more or less than their original cost. Performance for periods less than or equal to one year is cumulative. Performance is for the stated time period only; due to market volatility, current Fund performance may be lower or higher than the quoted return. For performance as of the most recent month-end, please refer to eatonvance.com.
Eaton Vance
Balanced Fund
December 31, 2022
Management’s Discussion of Fund Performance† — continued
The Fund’s sector-allocation positioning further detracted from performance versus the Secondary Index. An underweight exposure to U.S. Treasurys, and overweight exposures to both non-agency commercial mortgage-backed securities (CMBS) and investment-grade corporate securities had negative impacts on returns relative to the Secondary Index.
The use of derivatives also had a modest negative impact on returns relative to the Secondary Index during the period.
In contrast, the Fund’s duration exposure, which on average was lower than that of the Secondary Index, was the largest contributor to relative returns during a period of rising interest rates. Security selections within non-agency CMBS and government-related securities contributed to performance versus the Secondary Index as well. An overweight exposure to ABS and an out-of-Index allocation to non-agency mortgage-backed securities further enhanced relative returns during the period.
See Endnotes and Additional Disclosures in this report.
Past performance is no guarantee of future results. Returns are historical and are calculated by determining the percentage change in net asset value (NAV) or offering price (as applicable) with all distributions reinvested. Furthermore, returns do not reflect the deduction of taxes that shareholders may have to pay on Fund distributions or upon the redemption of Fund shares. Investment return and principal value will fluctuate so that shares, when redeemed, may be worth more or less than their original cost. Performance for periods less than or equal to one year is cumulative. Performance is for the stated time period only; due to market volatility, current Fund performance may be lower or higher than the quoted return. For performance as of the most recent month-end, please refer to eatonvance.com.
Eaton Vance
Balanced Fund
December 31, 2022
Performance
Portfolio Manager(s) Charles B. Gaffney, Vishal Khanduja, CFA and Brian S. Ellis, CFA
| % Average Annual Total Returns1,2 | Class
Inception Date | Performance
Inception Date | One Year | Five Years | Ten Years |
| Class A at NAV | 04/01/1932 | 04/01/1932 | (15.58)% | 5.59% | 7.81% |
| Class A with 5.25% Maximum Sales Charge | — | — | (20.03) | 4.46 | 7.23 |
| Class C at NAV | 11/02/1993 | 04/01/1932 | (16.16) | 4.82 | 7.17 |
| Class C with 1% Maximum Deferred Sales Charge | — | — | (16.96) | 4.82 | 7.17 |
| Class I at NAV | 09/28/2012 | 04/01/1932 | (15.27) | 5.87 | 8.10 |
| Class R at NAV | 05/02/2016 | 04/01/1932 | (15.77) | 5.33 | 7.63 |
| Class R6 at NAV | 05/02/2016 | 04/01/1932 | (15.30) | 5.92 | 8.13 |
|
| S&P 500® Index | — | — | (18.11)% | 9.42% | 12.56% |
| Bloomberg U.S. Aggregate Bond Index | — | — | (13.01) | 0.02 | 1.06 |
| Blended Index | — | — | (15.79) | 5.95 | 8.08 |
| % Total Annual Operating Expense Ratios3 | Class A | Class C | Class I | Class R | Class R6 |
| | 0.95% | 1.70% | 0.70% | 1.20% | 0.66% |
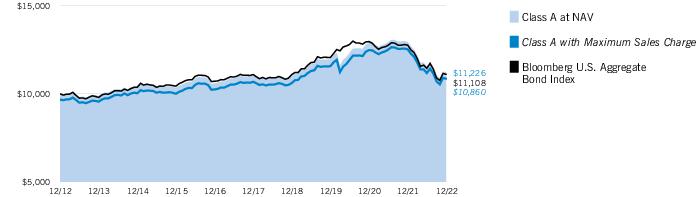
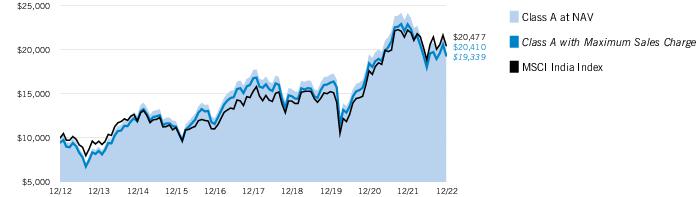
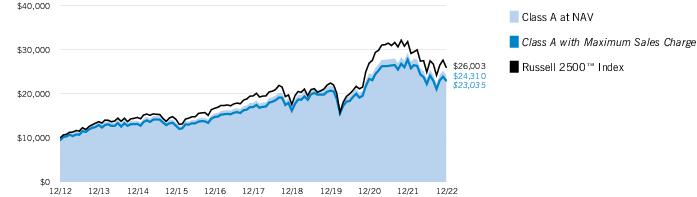
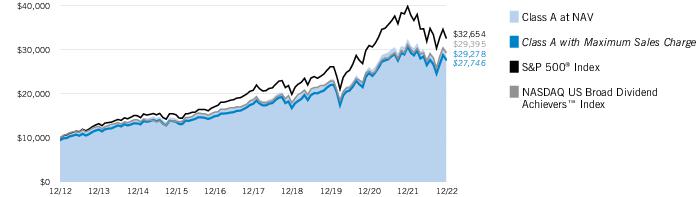
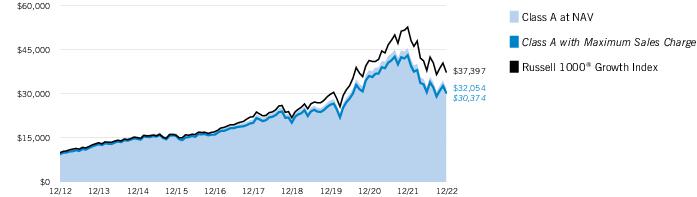
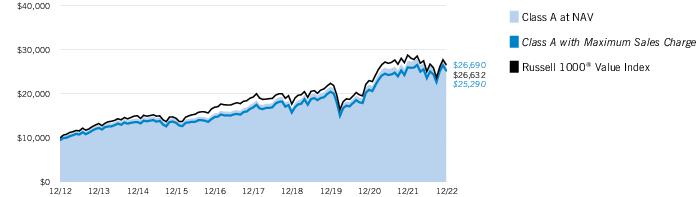
Growth of $10,000
This graph shows the change in value of a hypothetical investment of $10,000 in Class A of the Fund for the period indicated. For comparison, the same investment is shown in the indicated index.
| Growth of Investment2 | Amount Invested | Period Beginning | At NAV | With Maximum Sales Charge |
| Class C | $10,000 | 12/31/2012 | $19,986 | N.A. |
| Class I, at minimum investment | $1,000,000 | 12/31/2012 | $2,179,086 | N.A. |
| Class R | $10,000 | 12/31/2012 | $20,871 | N.A. |
| Class R6, at minimum investment | $5,000,000 | 12/31/2012 | $10,931,367 | N.A. |
See Endnotes and Additional Disclosures in this report.
Past performance is no guarantee of future results. Returns are historical and are calculated by determining the percentage change in net asset value (NAV) or offering price (as applicable) with all distributions reinvested. Furthermore, returns do not reflect the deduction of taxes that shareholders may have to pay on Fund distributions or upon the redemption of Fund shares. Investment return and principal value will fluctuate so that shares, when redeemed, may be worth more or less than their original cost. Performance for periods less than or equal to one year is cumulative. Performance is for the stated time period only; due to market volatility, current Fund performance may be lower or higher than the quoted return. For performance as of the most recent month-end, please refer to eatonvance.com.
Eaton Vance
Balanced Fund
December 31, 2022
| Asset Allocation (% of total investments)* |
| * | Fund invests in one or more affiliated investment companies (Portfolios). References to investments are to the aggregate holdings of the Fund, including its pro rata share of each Portfolio in which it invests. |
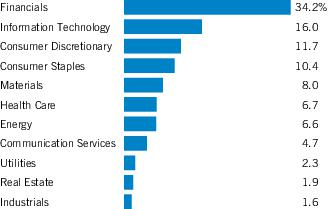
| Equity Investments Sector Allocation (% of total investments) |
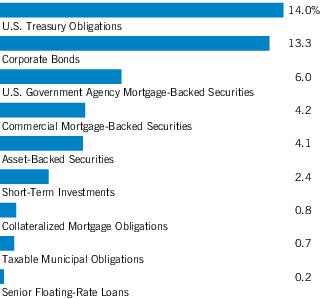
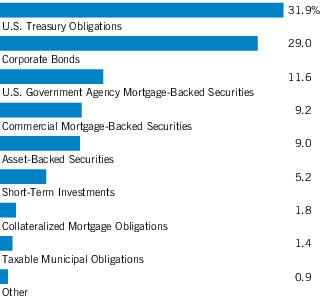
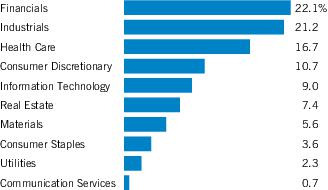
| Fixed-Income Allocation (% of total investments) |
Eaton Vance
Balanced Fund
December 31, 2022
Endnotes and Additional Disclosures
| † | The views expressed in this report are those of the portfolio manager(s) and are current only through the date stated at the top of this page. These views are subject to change at any time based upon market or other conditions, and Eaton Vance and the Fund(s) disclaim any responsibility to update such views. These views may not be relied upon as investment advice and, because investment decisions are based on many factors, may not be relied upon as an indication of trading intent on behalf of any Eaton Vance fund. This commentary may contain statements that are not historical facts, referred to as “forward-looking statements.” The Fund’s actual future results may differ significantly from those stated in any forward-looking statement, depending on factors such as changes in securities or financial markets or general economic conditions, the volume of sales and purchases of Fund shares, the continuation of investment advisory, administrative and service contracts, and other risks discussed from time to time in the Fund’s filings with the Securities and Exchange Commission. |
| | |
| 1 | S&P 500® Index is an unmanaged index of large-cap stocks commonly used as a measure of U.S. stock market performance. S&P Dow Jones Indices are a product of S&P Dow Jones Indices LLC (“S&P DJI”) and have been licensed for use. S&P® and S&P 500® are registered trademarks of S&P DJI; Dow Jones® is a registered trademark of Dow Jones Trademark Holdings LLC (“Dow Jones”); S&P DJI, Dow Jones and their respective affiliates do not sponsor, endorse, sell or promote the Fund, will not have any liability with respect thereto and do not have any liability for any errors, omissions, or interruptions of the S&P Dow Jones Indices. Bloomberg U.S. Aggregate Bond Index is an unmanaged index of domestic investment grade bonds, including corporate, government and mortgage-backed securities. The Blended Index consists of 60% S&P 500® Index and 40% Bloomberg U.S. Aggregate Bond Index, rebalanced monthly. Unless otherwise stated, index returns do not reflect the effect of any applicable sales charges, commissions, expenses, taxes or leverage, as applicable. It is not possible to invest directly in an index. |
| 2 | Total Returns at NAV do not include applicable sales charges. If sales charges were deducted, the returns would be lower. Total Returns shown with maximum sales charge reflect the stated maximum sales charge. Unless otherwise stated, performance does not reflect the deduction of taxes on Fund distributions or redemptions of Fund shares.Effective November 5, 2020, Class C shares automatically convert to Class A shares eight years after purchase. The average annual total returns listed for Class C reflect conversion to Class A shares after eight years. Prior to November 5, 2020, Class C shares automatically converted to Class A shares ten years after purchase.Performance prior to the inception date of a class may be linked to the performance of an older class of the Fund. This linked performance is adjusted for any applicable sales charge, but is not adjusted for class expense differences. If adjusted for such differences, the performance would be different. The performance of Class I and Class R is linked to Class A and the performance of Class R6 is linked to Class I. Performance presented in the Financial Highlights included in the financial statements is not linked. |
| 3 | Source: Fund prospectus. The expense ratios for the current reporting |
| | period can be found in the Financial Highlights section of this report. Performance reflects expenses waived and/or reimbursed, if applicable. Without such waivers and/or reimbursements, performance would have been lower. |
| | Fund profile subject to change due to active management. |
| | Additional Information |
| | Nasdaq Composite Index is a market capitalization-weighted index of all domestic and international securities listed on Nasdaq. Source: Nasdaq, Inc. The information is provided by Nasdaq (with its affiliates, are referred to as the “Corporations”) and Nasdaq’s third party licensors on an “as is” basis and the Corporations make no guarantees and bear no liability of any kind with respect to the information or the Fund. Bloomberg U.S. Treasury Index measures the performance of U.S. Treasuries with a maturity of one year or more. Bloomberg U.S. Corporate Bond Index measures the performance of investment-grade U.S. corporate securities with a maturity of one year or more. |
| | Duration is a measure of the expected change in price of a bond — in percentage terms — given a one percent change in interest rates, all else being constant. Securities with lower durations tend to be less sensitive to interest rate changes. |
Eaton Vance
Balanced Fund
December 31, 2022
Example
As a Fund shareholder, you incur two types of costs: (1) transaction costs, including sales charges (loads) on purchases; and (2) ongoing costs, including management fees; distribution and/or service fees; and other Fund expenses. This Example is intended to help you understand your ongoing costs (in dollars) of Fund investing and to compare these costs with the ongoing costs of investing in other mutual funds. The Example is based on an investment of $1,000 invested at the beginning of the period and held for the entire period (July 1, 2022 to December 31, 2022).
Actual Expenses
The first section of the table below provides information about actual account values and actual expenses. You may use the information in this section, together with the amount you invested, to estimate the expenses that you paid over the period. Simply divide your account value by $1,000 (for example, an $8,600 account value divided by $1,000 = 8.6), then multiply the result by the number in the first section under the heading entitled “Expenses Paid During Period” to estimate the expenses you paid on your account during this period.
Hypothetical Example for Comparison Purposes
The second section of the table below provides information about hypothetical account values and hypothetical expenses based on the actual Fund expense ratio and an assumed rate of return of 5% per year (before expenses), which is not the actual Fund return. The hypothetical account values and expenses may not be used to estimate the actual ending account balance or expenses you paid for the period. You may use this information to compare the ongoing costs of investing in your Fund and other funds. To do so, compare this 5% hypothetical example with the 5% hypothetical examples that appear in the shareholder reports of the other funds.
Please note that the expenses shown in the table are meant to highlight your ongoing costs only and do not reflect any transactional costs, such as sales charges (loads). Therefore, the second section of the table is useful in comparing ongoing costs only, and will not help you determine the relative total costs of owning different funds. In addition, if these transactional costs were included, your costs would be higher.
| | Beginning
Account Value
(7/1/22) | Ending
Account Value
(12/31/22) | Expenses Paid
During Period*
(7/1/22 – 12/31/22) | Annualized
Expense
Ratio |
| Actual | | | | |
| Class A | $1,000.00 | $1,001.60 | $4.94 | 0.98% |
| Class C | $1,000.00 | $ 997.80 | $8.71 | 1.73% |
| Class I | $1,000.00 | $1,002.90 | $3.69 | 0.73% |
| Class R | $1,000.00 | $1,000.40 | $6.20 | 1.23% |
| Class R6 | $1,000.00 | $1,003.10 | $3.43 | 0.68% |
| |
| Hypothetical | | | | |
| (5% return per year before expenses) | | | | |
| Class A | $1,000.00 | $1,020.27 | $4.99 | 0.98% |
| Class C | $1,000.00 | $1,016.48 | $8.79 | 1.73% |
| Class I | $1,000.00 | $1,021.53 | $3.72 | 0.73% |
| Class R | $1,000.00 | $1,019.01 | $6.26 | 1.23% |
| Class R6 | $1,000.00 | $1,021.78 | $3.47 | 0.68% |
| * | Expenses are equal to the Fund's annualized expense ratio for the indicated Class, multiplied by the average account value over the period, multiplied by 184/365 (to reflect the one-half year period). The Example assumes that the $1,000 was invested at the net asset value per share determined at the close of business on June 30, 2022. The Example reflects the expenses of both the Fund and the Portfolios. |
Eaton Vance
Balanced Fund
December 31, 2022
Statement of Assets and Liabilities
| | December 31, 2022 |
| Assets | |
Investment in Core Bond Portfolio, at value
(identified cost, $408,676,059) | $ 361,136,198 |
Investment in Stock Portfolio, at value
(identified cost, $360,231,841) | 475,571,229 |
| Receivable for Fund shares sold | 1,796,164 |
| Total assets | $838,503,591 |
| Liabilities | |
| Payable for Fund shares redeemed | $ 2,906,467 |
| Payable to affiliates: | |
| Administration fee | 29,094 |
| Distribution and service fees | 242,052 |
| Trustees' fees | 125 |
| Accrued expenses | 228,280 |
| Total liabilities | $ 3,406,018 |
| Net Assets | $835,097,573 |
| Sources of Net Assets | |
| Paid-in capital | $ 745,486,765 |
| Distributable earnings | 89,610,808 |
| Net Assets | $835,097,573 |
| Class A Shares | |
| Net Assets | $ 350,730,739 |
| Shares Outstanding | 38,160,635 |
Net Asset Value and Redemption Price Per Share
(net assets ÷ shares of beneficial interest outstanding) | $ 9.19 |
Maximum Offering Price Per Share
(100 ÷ 94.75 of net asset value per share) | $ 9.70 |
| Class C Shares | |
| Net Assets | $ 182,998,649 |
| Shares Outstanding | 19,807,962 |
Net Asset Value and Offering Price Per Share*
(net assets ÷ shares of beneficial interest outstanding) | $ 9.24 |
| Class I Shares | |
| Net Assets | $ 283,881,516 |
| Shares Outstanding | 30,870,798 |
Net Asset Value, Offering Price and Redemption Price Per Share
(net assets ÷ shares of beneficial interest outstanding) | $ 9.20 |
| Class R Shares | |
| Net Assets | $ 12,922,467 |
| Shares Outstanding | 1,412,210 |
Net Asset Value, Offering Price and Redemption Price Per Share
(net assets ÷ shares of beneficial interest outstanding) | $ 9.15 |
8
See Notes to Financial Statements.
Eaton Vance
Balanced Fund
December 31, 2022
Statement of Assets and Liabilities — continued
| | December 31, 2022 |
| Class R6 Shares | |
| Net Assets | $4,564,202 |
| Shares Outstanding | 496,225 |
Net Asset Value, Offering Price and Redemption Price Per Share
(net assets ÷ shares of beneficial interest outstanding) | $ 9.20 |
| On sales of $50,000 or more, the offering price of Class A shares is reduced. |
| * | Redemption price per share is equal to the net asset value less any applicable contingent deferred sales charge. |
9
See Notes to Financial Statements.
Eaton Vance
Balanced Fund
December 31, 2022
| | Year Ended |
| | December 31, 2022 |
| Investment Income | |
| Dividend income allocated from Portfolios (net of foreign taxes withheld of $16,728) | $ 8,475,866 |
| Interest income allocated from Portfolios (net of foreign taxes withheld of $16) | 11,416,490 |
| Expenses allocated from Portfolios | (5,453,831) |
| Total investment income from Portfolios | $ 14,438,525 |
| Expenses | |
| Administration fee | $ 387,119 |
| Distribution and service fees: | |
| Class A | 960,282 |
| Class C | 2,127,429 |
| Class R | 69,916 |
| Trustees’ fees and expenses | 500 |
| Custodian fee | 58,290 |
| Transfer and dividend disbursing agent fees | 643,817 |
| Legal and accounting services | 59,100 |
| Printing and postage | 70,640 |
| Registration fees | 86,868 |
| Miscellaneous | 19,937 |
| Total expenses | $ 4,483,898 |
| Deduct: | |
| Waiver and/or reimbursement of expenses by affiliate | $ 9,401 |
| Total expense reductions | $ 9,401 |
| Net expenses | $ 4,474,497 |
| Net investment income | $ 9,964,028 |
| Realized and Unrealized Gain (Loss) from Portfolios | |
| Net realized gain (loss): | |
| Investment transactions | $ 16,385,697 |
| Futures contracts | (4,219,950) |
| Foreign currency transactions | (1,030) |
| Net realized gain | $ 12,164,717 |
| Change in unrealized appreciation (depreciation): | |
| Investments | $ (194,633,820) |
| Futures contracts | 273,456 |
| Foreign currency | (5,540) |
| Net change in unrealized appreciation (depreciation) | $(194,365,904) |
| Net realized and unrealized loss | $(182,201,187) |
| Net decrease in net assets from operations | $(172,237,159) |
10
See Notes to Financial Statements.
Eaton Vance
Balanced Fund
December 31, 2022
Statements of Changes in Net Assets
| | Year Ended December 31, |
| | 2022 | 2021 |
| Increase (Decrease) in Net Assets | | |
| From operations: | | |
| Net investment income | $ 9,964,028 | $ 7,539,421 |
| Net realized gain | 12,164,717 | 113,049,941 (1) |
| Net change in unrealized appreciation (depreciation) | (194,365,904) | 27,978,321 |
| Net increase (decrease) in net assets from operations | $ (172,237,159) | $ 148,567,683 |
| Distributions to shareholders: | | |
| Class A | $ (19,606,480) | $ (34,488,656) |
| Class C | (8,804,256) | (18,132,108) |
| Class I | (16,932,328) | (32,432,173) |
| Class R | (691,511) | (1,117,168) |
| Class R6 | (262,178) | (5,018,451) |
| Total distributions to shareholders | $ (46,296,753) | $ (91,188,556) |
| Transactions in shares of beneficial interest: | | |
| Class A | $ (9,760,073) | $ 36,091,509 |
| Class C | (25,998,184) | (3,270,357) |
| Class I | (49,224,778) | (9,824,338) |
| Class R | 557,795 | 6,272,222 |
| Class R6 | 464,775 | (52,360,733) |
| Net decrease in net assets from Fund share transactions | $ (83,960,465) | $ (23,091,697) |
| Other capital: | | |
| Portfolio transaction fee contributed to Portfolio | $ (784,624) | $ (502,642) |
| Portfolio transaction fee allocated from Portfolio | 765,338 | 494,318 |
| Net decrease in net assets from other capital | $ (19,286) | $ (8,324) |
| Net increase (decrease) in net assets | $ (302,513,663) | $ 34,279,106 |
| Net Assets | | |
| At beginning of year | $1,137,611,236 | $ 1,103,332,130 |
| At end of year | $ 835,097,573 | $1,137,611,236 |
| (1) | Includes $2,669,216 of net realized gains from redemptions in-kind. |
11
See Notes to Financial Statements.
Eaton Vance
Balanced Fund
December 31, 2022
| | Class A |
| | Year Ended December 31, |
| | 2022 | 2021 | 2020 | 2019 | 2018 |
| Net asset value — Beginning of year | $ 11.500 | $ 10.930 | $ 9.850 | $ 8.280 | $ 9.110 |
| Income (Loss) From Operations | | | | | |
| Net investment income(1) | $ 0.116 | $ 0.085 | $ 0.110 | $ 0.125 | $ 0.132 |
| Net realized and unrealized gain (loss) | (1.896) | 1.430 | 1.266 | 1.819 | (0.424) |
| Total income (loss) from operations | $ (1.780) | $ 1.515 | $ 1.376 | $ 1.944 | $ (0.292) |
| Less Distributions | | | | | |
| From net investment income | $ (0.130) | $ (0.127) | $ (0.118) | $ (0.127) | $ (0.146) |
| From net realized gain | (0.400) | (0.818) | (0.178) | (0.247) | (0.392) |
| Total distributions | $ (0.530) | $ (0.945) | $ (0.296) | $ (0.374) | $ (0.538) |
| Portfolio transaction fee, net(1) | $ (0.000)(2) | $ (0.000)(2) | $ 0.000(2) | $ (0.000)(2) | $ (0.000)(2) |
| Net asset value — End of year | $ 9.190 | $ 11.500 | $ 10.930 | $ 9.850 | $ 8.280 |
| Total Return(3) | (15.58)% | 14.01% | 14.20% (4) | 23.63% | (3.43)% (4) |
| Ratios/Supplemental Data | | | | | |
| Net assets, end of year (000’s omitted) | $350,731 | $448,684 | $391,745 | $353,169 | $294,742 |
| Ratios (as a percentage of average daily net assets):(5) | | | | | |
| Expenses | 0.97% (6) | 0.95% | 0.96% (4) | 0.98% | 0.98% (4) |
| Net investment income | 1.15% | 0.73% | 1.10% | 1.34% | 1.45% |
| Portfolio Turnover of the Fund(7) | 7% | 7% | 11% | 12% | 7% |
| (1) | Computed using average shares outstanding. |
| (2) | Amount is less than $0.0005 or $(0.0005), as applicable. |
| (3) | Returns are historical and are calculated by determining the percentage change in net asset value with all distributions reinvested and do not reflect the effect of sales charges. |
| (4) | The administrator of the Fund reimbursed certain operating expenses (equal to less than 0.005% and 0.03% of average daily net assets for the years ended December 31, 2020 and 2018, respectively). Absent this reimbursement, total return would be lower. |
| (5) | Includes the Fund’s share of the Portfolios’ allocated expenses. |
| (6) | Includes a reduction by the investment adviser of a portion of the Portfolios' adviser fee due to the Portfolios' investment in the Liquidity Fund (equal to less than 0.005% of average daily net assets for the year ended December 31, 2022). |
| (7) | Percentage is based on the Fund’s contributions to and withdrawals from the Portfolios and excludes the investment activity of the Portfolios. |
12
See Notes to Financial Statements.
Eaton Vance
Balanced Fund
December 31, 2022
Financial Highlights — continued
| | Class C |
| | Year Ended December 31, |
| | 2022 | 2021 | 2020 | 2019 | 2018 |
| Net asset value — Beginning of year | $ 11.550 | $ 10.970 | $ 9.900 | $ 8.310 | $ 9.140 |
| Income (Loss) From Operations | | | | | |
| Net investment income (loss)(1) | $ 0.039 | $ (0.002) | $ 0.036 | $ 0.055 | $ 0.064 |
| Net realized and unrealized gain (loss) | (1.897) | 1.442 | 1.257 | 1.837 | (0.426) |
| Total income (loss) from operations | $ (1.858) | $ 1.440 | $ 1.293 | $ 1.892 | $ (0.362) |
| Less Distributions | | | | | |
| From net investment income | $ (0.052) | $ (0.042) | $ (0.045) | $ (0.055) | $ (0.076) |
| From net realized gain | (0.400) | (0.818) | (0.178) | (0.247) | (0.392) |
| Total distributions | $ (0.452) | $ (0.860) | $ (0.223) | $ (0.302) | $ (0.468) |
| Portfolio transaction fee, net(1) | $ (0.000)(2) | $ (0.000)(2) | $ 0.000(2) | $ (0.000)(2) | $ (0.000)(2) |
| Net asset value — End of year | $ 9.240 | $ 11.550 | $ 10.970 | $ 9.900 | $ 8.310 |
| Total Return(3) | (16.16)% | 13.21% | 13.21% (4) | 22.71% | (4.03)% (4) |
| Ratios/Supplemental Data | | | | | |
| Net assets, end of year (000’s omitted) | $182,999 | $258,309 | $248,249 | $236,215 | $221,669 |
| Ratios (as a percentage of average daily net assets):(5) | | | | | |
| Expenses | 1.72% (6) | 1.70% | 1.71% (4) | 1.73% | 1.73% (4) |
| Net investment income (loss) | 0.39% | (0.02)% | 0.36% | 0.59% | 0.70% |
| Portfolio Turnover of the Fund(7) | 7% | 7% | 11% | 12% | 7% |
| (1) | Computed using average shares outstanding. |
| (2) | Amount is less than $0.0005 or $(0.0005), as applicable. |
| (3) | Returns are historical and are calculated by determining the percentage change in net asset value with all distributions reinvested and do not reflect the effect of sales charges. |
| (4) | The administrator of the Fund reimbursed certain operating expenses (equal to less than 0.005% and 0.03% of average daily net assets for the years ended December 31, 2020 and 2018, respectively). Absent this reimbursement, total return would be lower. |
| (5) | Includes the Fund’s share of the Portfolios’ allocated expenses. |
| (6) | Includes a reduction by the investment adviser of a portion of the Portfolios' adviser fee due to the Portfolios' investment in the Liquidity Fund (equal to less than 0.005% of average daily net assets for the year ended December 31, 2022). |
| (7) | Percentage is based on the Fund’s contributions to and withdrawals from the Portfolios and excludes the investment activity of the Portfolios. |
13
See Notes to Financial Statements.
Eaton Vance
Balanced Fund
December 31, 2022
Financial Highlights — continued
| | Class I |
| | Year Ended December 31, |
| | 2022 | 2021 | 2020 | 2019 | 2018 |
| Net asset value — Beginning of year | $ 11.500 | $ 10.930 | $ 9.860 | $ 8.280 | $ 9.110 |
| Income (Loss) From Operations | | | | | |
| Net investment income(1) | $ 0.140 | $ 0.114 | $ 0.134 | $ 0.149 | $ 0.156 |
| Net realized and unrealized gain (loss) | (1.884) | 1.430 | 1.257 | 1.830 | (0.425) |
| Total income (loss) from operations | $ (1.744) | $ 1.544 | $ 1.391 | $ 1.979 | $ (0.269) |
| Less Distributions | | | | | |
| From net investment income | $ (0.156) | $ (0.156) | $ (0.143) | $ (0.152) | $ (0.169) |
| From net realized gain | (0.400) | (0.818) | (0.178) | (0.247) | (0.392) |
| Total distributions | $ (0.556) | $ (0.974) | $ (0.321) | $ (0.399) | $ (0.561) |
| Portfolio transaction fee, net(1) | $ (0.000)(2) | $ (0.000)(2) | $ 0.000(2) | $ (0.000)(2) | $ (0.000)(2) |
| Net asset value — End of year | $ 9.200 | $ 11.500 | $ 10.930 | $ 9.860 | $ 8.280 |
| Total Return(3) | (15.27)% | 14.28% | 14.36% (4) | 24.07% | (3.19)% (4) |
| Ratios/Supplemental Data | | | | | |
| Net assets, end of year (000’s omitted) | $283,882 | $409,900 | $399,991 | $322,436 | $208,740 |
| Ratios (as a percentage of average daily net assets):(5) | | | | | |
| Expenses | 0.72% (6) | 0.70% | 0.71% (4) | 0.73% | 0.73% (4) |
| Net investment income | 1.39% | 0.98% | 1.34% | 1.59% | 1.70% |
| Portfolio Turnover of the Fund(7) | 7% | 7% | 11% | 12% | 7% |
| (1) | Computed using average shares outstanding. |
| (2) | Amount is less than $0.0005 or $(0.0005), as applicable. |
| (3) | Returns are historical and are calculated by determining the percentage change in net asset value with all distributions reinvested. |
| (4) | The administrator of the Fund reimbursed certain operating expenses (equal to less than 0.005% and 0.03% of average daily net assets for the years ended December 31, 2020 and 2018, respectively). Absent this reimbursement, total return would be lower. |
| (5) | Includes the Fund’s share of the Portfolios’ allocated expenses. |
| (6) | Includes a reduction by the investment adviser of a portion of the Portfolios' adviser fee due to the Portfolios' investment in the Liquidity Fund (equal to less than 0.005% of average daily net assets for the year ended December 31, 2022). |
| (7) | Percentage is based on the Fund’s contributions to and withdrawals from the Portfolios and excludes the investment activity of the Portfolios. |
14
See Notes to Financial Statements.
Eaton Vance
Balanced Fund
December 31, 2022
Financial Highlights — continued
| | Class R |
| | Year Ended December 31, |
| | 2022 | 2021 | 2020 | 2019 | 2018 |
| Net asset value — Beginning of year | $11.450 | $ 10.890 | $ 9.820 | $ 8.260 | $ 9.090 |
| Income (Loss) From Operations | | | | | |
| Net investment income(1) | $ 0.091 | $ 0.055 | $ 0.083 | $ 0.102 | $ 0.115 |
| Net realized and unrealized gain (loss) | (1.885) | 1.425 | 1.261 | 1.812 | (0.423) |
| Total income (loss) from operations | $ (1.794) | $ 1.480 | $ 1.344 | $ 1.914 | $(0.308) |
| Less Distributions | | | | | |
| From net investment income | $ (0.106) | $ (0.102) | $ (0.096) | $ (0.107) | $ (0.130) |
| From net realized gain | (0.400) | (0.818) | (0.178) | (0.247) | (0.392) |
| Total distributions | $ (0.506) | $ (0.920) | $ (0.274) | $(0.354) | $(0.522) |
| Portfolio transaction fee, net(1) | $ (0.000)(2) | $ (0.000)(2) | $ 0.000(2) | $(0.000) (2) | $(0.000) (2) |
| Net asset value — End of year | $ 9.150 | $11.450 | $10.890 | $ 9.820 | $ 8.260 |
| Total Return(3) | (15.77)% | 13.71% | 13.89% (4) | 23.31% | (3.61)% (4) |
| Ratios/Supplemental Data | | | | | |
| Net assets, end of year (000’s omitted) | $12,922 | $ 15,587 | $ 8,958 | $ 5,905 | $ 2,514 |
| Ratios (as a percentage of average daily net assets):(5) | | | | | |
| Expenses | 1.22% (6) | 1.20% | 1.21% (4) | 1.23% | 1.23% (4) |
| Net investment income | 0.90% | 0.47% | 0.84% | 1.08% | 1.27% |
| Portfolio Turnover of the Fund(7) | 7% | 7% | 11% | 12% | 7% |
| (1) | Computed using average shares outstanding. |
| (2) | Amount is less than $0.0005 or $(0.0005), as applicable. |
| (3) | Returns are historical and are calculated by determining the percentage change in net asset value with all distributions reinvested. |
| (4) | The administrator of the Fund reimbursed certain operating expenses (equal to less than 0.005% and 0.03% of average daily net assets for the years ended December 31, 2020 and 2018, respectively). Absent this reimbursement, total return would be lower. |
| (5) | Includes the Fund’s share of the Portfolios’ allocated expenses. |
| (6) | Includes a reduction by the investment adviser of a portion of the Portfolios' adviser fee due to the Portfolios' investment in the Liquidity Fund (equal to less than 0.005% of average daily net assets for the year ended December 31, 2022). |
| (7) | Percentage is based on the Fund’s contributions to and withdrawals from the Portfolios and excludes the investment activity of the Portfolios. |
15
See Notes to Financial Statements.
Eaton Vance
Balanced Fund
December 31, 2022
Financial Highlights — continued
| | Class R6 |
| | Year Ended December 31, |
| | 2022 | 2021 | 2020 | 2019 | 2018 |
| Net asset value — Beginning of year | $11.510 | $ 10.930 | $ 9.860 | $ 8.280 | $ 9.110 |
| Income (Loss) From Operations | | | | | |
| Net investment income(1) | $ 0.146 | $ 0.119 | $ 0.139 | $ 0.153 | $ 0.160 |
| Net realized and unrealized gain (loss) | (1.895) | 1.440 | 1.256 | 1.829 | (0.423) |
| Total income (loss) from operations | $ (1.749) | $ 1.559 | $ 1.395 | $ 1.982 | $ (0.263) |
| Less Distributions | | | | | |
| From net investment income | $ (0.161) | $ (0.161) | $ (0.147) | $ (0.155) | $ (0.175) |
| From net realized gain | (0.400) | (0.818) | (0.178) | (0.247) | (0.392) |
| Total distributions | $ (0.561) | $ (0.979) | $ (0.325) | $ (0.402) | $ (0.567) |
| Portfolio transaction fee, net(1) | $ (0.000)(2) | $ (0.000)(2) | $ 0.000(2) | $ (0.000)(2) | $ (0.000)(2) |
| Net asset value — End of year | $ 9.200 | $11.510 | $10.930 | $ 9.860 | $ 8.280 |
| Total Return(3) | (15.30)% | 14.42% | 14.41% (4) | 24.11% | (3.13)% (4) |
| Ratios/Supplemental Data | | | | | |
| Net assets, end of year (000’s omitted) | $ 4,564 | $ 5,131 | $ 54,388 | $42,255 | $28,215 |
| Ratios (as a percentage of average daily net assets):(5) | | | | | |
| Expenses | 0.67% (6) | 0.66% | 0.67% (4) | 0.68% | 0.69% (4) |
| Net investment income | 1.45% | 1.02% | 1.39% | 1.63% | 1.74% |
| Portfolio Turnover of the Fund(7) | 7% | 7% | 11% | 12% | 7% |
| (1) | Computed using average shares outstanding. |
| (2) | Amount is less than $0.0005 or $(0.0005), as applicable. |
| (3) | Returns are historical and are calculated by determining the percentage change in net asset value with all distributions reinvested. |
| (4) | The administrator of the Fund reimbursed certain operating expenses (equal to less than 0.005% and 0.03% of average daily net assets for the years ended December 31, 2020 and 2018, respectively). Absent this reimbursement, total return would be lower. |
| (5) | Includes the Fund’s share of the Portfolios’ allocated expenses. |
| (6) | Includes a reduction by the investment adviser of a portion of the Portfolios' adviser fee due to the Portfolios' investment in the Liquidity Fund (equal to less than 0.005% of average daily net assets for the year ended December 31, 2022). |
| (7) | Percentage is based on the Fund’s contributions to and withdrawals from the Portfolios and excludes the investment activity of the Portfolios. |
16
See Notes to Financial Statements.
Eaton Vance
Balanced Fund
December 31, 2022
Notes to Financial Statements
1 Significant Accounting Policies
Eaton Vance Balanced Fund (the Fund) is a diversified series of Eaton Vance Special Investment Trust (the Trust). The Trust is a Massachusetts business trust registered under the Investment Company Act of 1940, as amended (the 1940 Act), as an open-end management investment company. The Fund offers five classes of shares. Class A shares are generally sold subject to a sales charge imposed at time of purchase. Class C shares are sold at net asset value and are generally subject to a contingent deferred sales charge (see Note 5). Effective November 5, 2020, Class C shares automatically convert to Class A shares eight years after their purchase as described in the Fund’s prospectus. Class I, Class R and Class R6 shares are sold at net asset value and are not subject to a sales charge. Each class represents a pro-rata interest in the Fund, but votes separately on class-specific matters and (as noted below) is subject to different expenses. Realized and unrealized gains and losses and net investment income and losses, other than class-specific expenses, are allocated daily to each class of shares based on the relative net assets of each class to the total net assets of the Fund. Sub-accounting, recordkeeping and similar administrative fees payable to financial intermediaries, which are a component of transfer and dividend disbursing agent fees on the Statement of Operations, are not allocated to Class R6 shares. Each class of shares differs in its distribution plan and certain other class-specific expenses. The Fund's investment objective is to provide current income and long-term growth of capital. The Fund currently pursues its objective by investing substantially all of its assets in interests in two portfolios managed by Eaton Vance Management (EVM) or its affiliates (the Portfolios), which are Massachusetts business trusts. The value of the Fund’s investments in the Portfolios reflects the Fund’s proportionate interest in their net assets. The Fund's proportionate interest in each of the Portfolio's net assets at December 31, 2022 were as follows: Core Bond Portfolio (63.2%) and Stock Portfolio (86.5%). The performance of the Fund is directly affected by the performance of the Portfolios. The financial statements of Stock Portfolio, including the portfolio of investments, are included elsewhere in this report and should be read in conjunction with the Fund’s financial statements. A copy of Core Bond Portfolio’s financial statements is available by calling Eaton Vance at 1-800-262-1122 or in the EDGAR database on the Securities and Exchange Commission’s website at www.sec.gov.
The following is a summary of significant accounting policies of the Fund. The policies are in conformity with accounting principles generally accepted in the United States of America (U.S. GAAP). The Fund is an investment company and follows accounting and reporting guidance in the Financial Accounting Standards Board (FASB) Accounting Standards Codification Topic 946.
A Investment Valuation— Valuation of securities by Stock Portfolio is discussed in Note 1A of the Portfolio's Notes to Financial Statements, which are included elsewhere in this report. Such policies are consistent with those of Core Bond Portfolio.
Additional valuation policies for Core Bond Portfolio (the Portfolio) are as follows:
Debt Obligations. Debt obligations are generally valued on the basis of valuations provided by third party pricing services, as derived from such services’ pricing models. Inputs to the models may include, but are not limited to, reported trades, executable bid and ask prices, broker/dealer quotations, prices or yields of securities with similar characteristics, interest rates, anticipated prepayments, benchmark curves or information pertaining to the issuer, as well as industry and economic events. The pricing services may use a matrix approach, which considers information regarding securities with similar characteristics to determine the valuation for a security. Short-term debt obligations purchased with a remaining maturity of sixty days or less for which a valuation from a third party pricing service is not readily available may be valued at amortized cost, which approximates fair value.
Preferred Securities. Preferred securities that are not listed or traded in the over-the-counter market are valued by a third party pricing service that uses various techniques that consider factors including, but not limited to, prices or yields of securities with similar characteristics, benchmark yields, broker/dealer quotes, quotes of underlying common stock, issuer spreads, as well as industry and economic events.
Senior Floating-Rate Loans. Interests in senior floating-rate loans (Senior Loans) for which reliable market quotations are readily available are valued generally at the average mean of bid and ask quotations obtained from a third party pricing service.
Derivatives. Futures contracts are valued at the closing settlement price established by the board of trade or exchange on which they are traded.
B Income—The Fund's net investment income or loss consists of the Fund's pro-rata share of the net investment income or loss of the Portfolios, less all actual and accrued expenses of the Fund.
C Federal Taxes—The Fund's policy is to comply with the provisions of the Internal Revenue Code applicable to regulated investment companies and to distribute to shareholders each year substantially all of its net investment income, and all or substantially all of its net realized capital gains. Accordingly, no provision for federal income or excise tax is necessary.
As of December 31, 2022, the Fund had no uncertain tax positions that would require financial statement recognition, de-recognition, or disclosure. The Fund files a U.S. federal income tax return annually after its fiscal year-end, which is subject to examination by the Internal Revenue Service for a period of three years from the date of filing.
D Expenses—The majority of expenses of the Trust are directly identifiable to an individual fund. Expenses which are not readily identifiable to a specific fund are allocated taking into consideration, among other things, the nature and type of expense and the relative size of the funds.
Eaton Vance
Balanced Fund
December 31, 2022
Notes to Financial Statements — continued
E Use of Estimates—The preparation of the financial statements in conformity with U.S. GAAP requires management to make estimates and assumptions that affect the reported amounts of assets and liabilities at the date of the financial statements and the reported amounts of income and expense during the reporting period. Actual results could differ from those estimates.
F Indemnifications—Under the Trust’s organizational documents, its officers and Trustees may be indemnified against certain liabilities and expenses arising out of the performance of their duties to the Fund. Under Massachusetts law, if certain conditions prevail, shareholders of a Massachusetts business trust (such as the Trust) could be deemed to have personal liability for the obligations of the Trust. However, the Trust’s Declaration of Trust contains an express disclaimer of liability on the part of Fund shareholders and the By-laws provide that the Trust shall assume, upon request by the shareholder, the defense on behalf of any Fund shareholders. Moreover, the By-laws also provide for indemnification out of Fund property of any shareholder held personally liable solely by reason of being or having been a shareholder for all loss or expense arising from such liability. Additionally, in the normal course of business, the Fund enters into agreements with service providers that may contain indemnification clauses. The Fund’s maximum exposure under these arrangements is unknown as this would involve future claims that may be made against the Fund that have not yet occurred.
G Other—Investment transactions are accounted for on a trade date basis.
2 Distributions to Shareholders and Income Tax Information
It is the present policy of the Fund to make quarterly distributions of all or substantially all of its net investment income and to distribute annually all or substantially all of its net realized capital gains. Distributions to shareholders are recorded on the ex-dividend date. Distributions are declared separately for each class of shares. Shareholders may reinvest income and capital gain distributions in additional shares of the same class of the Fund at the net asset value as of the ex-dividend date or, at the election of the shareholder, receive distributions in cash. Distributions to shareholders are determined in accordance with income tax regulations, which may differ from U.S. GAAP. As required by U.S. GAAP, only distributions in excess of tax basis earnings and profits are reported in the financial statements as a return of capital. Permanent differences between book and tax accounting relating to distributions are reclassified to paid-in capital. For tax purposes, distributions from short-term capital gains are considered to be from ordinary income.
The tax character of distributions declared for the years ended December 31, 2022 and December 31, 2021 was as follows:
| | Year Ended December 31, |
| | 2022 | 2021 |
| Ordinary income | $10,727,583 | $18,106,165 |
| Long-term capital gains | $35,569,170 | $73,082,391 |
During the year ended December 31, 2022, distributable earnings was decreased by $5,502,156 and paid-in capital was increased by $5,502,156 due to the Fund’s use of equalization accounting. Tax equalization accounting allows the Fund to treat as a distribution that portion of redemption proceeds representing a redeeming shareholder’s portion of undistributed taxable income and net capital gains. These reclassifications had no effect on the net assets or net asset value per share of the Fund.
As of December 31, 2022, the components of distributable earnings (accumulated loss) on a tax basis were as follows:
| Undistributed long-term capital gains | $ 4,484,003 |
| Net unrealized appreciation | 85,126,805 |
| Distributable earnings | $89,610,808 |
3 Investment Adviser Fee and Other Transactions with Affiliates
The investment adviser fee is earned by EVM, an indirect, wholly-owned subsidiary of Morgan Stanley, as compensation for investment advisory services rendered to the Fund. The fee is computed at an annual rate based on the Fund’s average daily net assets that are not invested in other investment companies for which EVM or its affiliates serve as investment adviser and receive an advisory fee as follows and is payable monthly:
Eaton Vance
Balanced Fund
December 31, 2022
Notes to Financial Statements — continued
For equity securities:
| Average Daily Net Assets | Annual Fee Rate |
| Up to $500 million | 0.600% |
| $500 million but less than $1 billion | 0.575% |
| $1 billion but less than $2.5 billion | 0.550% |
| $2.5 billion but less than $5 billion | 0.530% |
| $5 billion and over | 0.515% |
For income securities and cash:
| Average Daily Net Assets | Annual Fee Rate |
| Less than $1 billion | 0.450% |
| $1 billion up to $2 billion | 0.425% |
| $2 billion up to $5 billion | 0.415% |
| $5 billion and over | 0.405% |
For the year ended December 31, 2022, the Fund incurred no investment adviser fee on such assets. To the extent the Fund’s assets are invested in the Portfolios, the Fund is allocated its pro rata share of the Portfolios’ investment adviser fees. The Portfolios have engaged Boston Management and Research (BMR), an affiliate of EVM and an indirect, wholly-owned subsidiary of Morgan Stanley, to render investment advisory services. See Note 2 of the Portfolios’ Notes to Financial Statements. For the year ended December 31, 2022, the Fund’s allocated portion of investment adviser fees paid by the Portfolios amounted to $5,065,209 or 0.54% of the Fund’s average daily net assets. The administration fee is earned by EVM as compensation for administrative services rendered to the Fund. The fee is computed at an annual rate of 0.04% of the Fund’s average daily net assets. For the year ended December 31, 2022, the administration fee amounted to $387,119.
EVM provides sub-transfer agency and related services to the Fund pursuant to a Sub-Transfer Agency Support Services Agreement. For the year ended December 31, 2022, EVM earned $104,098 from the Fund pursuant to such agreement, which is included in transfer and dividend disbursing agent fees on the Statement of Operations. The Fund was informed that Eaton Vance Distributors, Inc. (EVD), an affiliate of EVM, received $37,180 as its portion of the sales charge on sales of Class A shares for the year ended December 31, 2022. The Fund was informed that Morgan Stanley affiliated broker-dealers, which may be deemed to be affiliates of EVM and EVD, also received a portion of the sales charge on sales of Class A shares for the year ended December 31, 2022 in the amount of $6,240. EVD also received distribution and service fees from Class A, Class C and Class R shares (see Note 4) and contingent deferred sales charges (see Note 5).
Trustees and officers of the Fund and the Portfolios who are members of EVM’s or BMR's organizations receive remuneration for their services to the Fund out of the investment adviser fee. Certain officers and Trustees of the Fund and the Portfolios are officers of the above organizations.
4 Distribution Plans
The Fund has in effect a distribution plan for Class A shares (Class A Plan) pursuant to Rule 12b-1 under the 1940 Act. Pursuant to the Class A Plan, the Fund pays EVD a distribution and service fee of 0.25% per annum of its average daily net assets attributable to Class A shares for distribution services and facilities provided to the Fund by EVD, as well as for personal services and/or the maintenance of shareholder accounts. Distribution and service fees paid or accrued to EVD for the year ended December 31, 2022 amounted to $960,282 for Class A shares.
The Fund also has in effect distribution plans for Class C shares (Class C Plan) and Class R shares (Class R Plan) pursuant to Rule 12b-1 under the 1940 Act. Pursuant to the Class C Plan, the Fund pays EVD amounts equal to 0.75% per annum of its average daily net assets attributable to Class C shares for providing ongoing distribution services and facilities to the Fund. For the year ended December 31, 2022, the Fund paid or accrued to EVD $1,595,572 for Class C shares.
The Class R Plan requires the Fund to pay EVD an amount up to 0.50% per annum of its average daily net assets attributable to Class R shares for providing ongoing distribution services and facilities to the Fund. The Trustees of the Trust have currently limited Class R distribution payments to 0.25% per annum of the average daily net assets attributable to Class R shares. For the year ended December 31, 2022, the Fund paid or accrued to EVD $34,958 for Class R shares.
Eaton Vance
Balanced Fund
December 31, 2022
Notes to Financial Statements — continued
Pursuant to the Class C and Class R Plans, the Fund also makes payments of service fees to EVD, financial intermediaries and other persons in amounts equal to 0.25% per annum of its average daily net assets attributable to that class. Service fees paid or accrued are for personal services and/or the maintenance of shareholder accounts. They are separate and distinct from the sales commissions and distribution fees payable to EVD. Service fees paid or accrued for the year ended December 31, 2022 amounted to $531,857 and $34,958 for Class C and Class R shares, respectively.
Distribution and service fees are subject to the limitations contained in the Financial Industry Regulatory Authority Rule 2341(d).
5 Contingent Deferred Sales Charges
A contingent deferred sales charge (CDSC) of 1% generally is imposed on redemptions of Class C shares made within 12 months of purchase. Class A shares may be subject to a 1% CDSC if redeemed within 12 months (18 months prior to April 29, 2022) of purchase (depending on the circumstances of purchase). Generally, the CDSC is based upon the lower of the net asset value at date of redemption or date of purchase. No charge is levied on shares acquired by reinvestment of dividends or capital gain distributions. For the year ended December 31, 2022, the Fund was informed that EVD received approximately $2,000 and $15,000 of CDSCs paid by Class A and Class C shareholders, respectively.
6 Investment Transactions
For the year ended December 31, 2022, increases and decreases in the Fund's investments in the Portfolios were as follows:
| Portfolio | Contributions | Withdrawals |
| Core Bond Portfolio | $60,593,412 | $ 78,452,402 |
| Stock Portfolio | 2,969,853 | 173,059,617 |
In addition, a Portfolio transaction fee was imposed by Stock Portfolio on the combined daily inflows or outflows of the Fund and Stock Portfolio’s other investors as more fully described at Note 1H of Stock Portfolio’s financial statements included herein. Such fee was allocated to the Fund based on its pro-rata interest in Stock Portfolio. The amount of the Portfolio transaction fee imposed on the Fund, if any, and the allocation of such fee are presented as Other capital on the Statements of Changes in Net Assets. Effective after the close of business on December 23, 2022, the Portfolio transaction fee was discontinued.
7 Shares of Beneficial Interest
The Fund’s Declaration of Trust permits the Trustees to issue an unlimited number of full and fractional shares of beneficial interest (without par value). Such shares may be issued in a number of different series (such as the Fund) and classes. Transactions in Fund shares, including direct exchanges pursuant to share class conversions for all periods presented, were as follows:
| | Year Ended
December 31, 2022 | | Year Ended
December 31, 2021 |
| | Shares | Amount | | Shares | Amount |
| Class A | | | | | |
| Sales | 3,533,106 | $ 35,319,040 | | 4,580,825 | $ 53,079,612 |
| Issued to shareholders electing to receive payments of distributions in Fund shares | 1,892,087 | 17,920,820 | | 2,770,703 | 31,529,862 |
| Redemptions | (6,286,466) | (62,999,933) | | (4,184,607) | (48,517,965) |
| Net increase (decrease) | (861,273) | $ (9,760,073) | | 3,166,921 | $ 36,091,509 |
| Class C | | | | | |
| Sales | 1,504,585 | $ 15,270,383 | | 2,781,836 | $ 32,200,851 |
| Issued to shareholders electing to receive payments of distributions in Fund shares | 915,758 | 8,650,430 | | 1,550,042 | 17,713,688 |
| Redemptions | (4,974,068) | (49,918,997) | | (4,591,201) | (53,184,896) |
| Net decrease | (2,553,725) | $ (25,998,184) | | (259,323) | $ (3,270,357) |
Eaton Vance
Balanced Fund
December 31, 2022
Notes to Financial Statements — continued
| | Year Ended
December 31, 2022 | | Year Ended
December 31, 2021 |
| | Shares | Amount | | Shares | Amount |
| Class I | | | | | |
| Sales | 4,591,878 | $ 46,467,208 | | 6,952,216 | $ 80,302,215 |
| Issued to shareholders electing to receive payments of distributions in Fund shares | 1,636,674 | 15,552,170 | | 2,617,006 | 29,817,055 |
| Redemptions | (10,986,770) | (111,244,156) | | (10,534,372) | (119,943,608) |
| Net decrease | (4,758,218) | $ (49,224,778) | | (965,150) | $ (9,824,338) |
| Class R | | | | | |
| Sales | 263,754 | $ 2,711,156 | | 682,829 | $ 7,932,531 |
| Issued to shareholders electing to receive payments of distributions in Fund shares | 73,478 | 691,512 | | 98,543 | 1,117,168 |
| Redemptions | (286,225) | (2,844,873) | | (243,016) | (2,777,477) |
| Net increase | 51,007 | $ 557,795 | | 538,356 | $ 6,272,222 |
| Class R6 | | | | | |
| Sales | 228,791 | $ 2,300,945 | | 1,253,295 | $ 14,450,535 |
| Issued to shareholders electing to receive payments of distributions in Fund shares | 27,540 | 261,580 | | 440,316 | 5,017,767 |
| Redemptions | (206,014) | (2,097,750) | | (6,222,460) | (71,829,035) |
| Net increase (decrease) | 50,317 | $ 464,775 | | (4,528,849) | $ (52,360,733) |
8 Fair Value Measurements
Under generally accepted accounting principles for fair value measurements, a three-tier hierarchy to prioritize the assumptions, referred to as inputs, is used in valuation techniques to measure fair value. The three-tier hierarchy of inputs is summarized in the three broad levels listed below.
| • | Level 1 – quoted prices in active markets for identical investments |
| • | Level 2 – other significant observable inputs (including quoted prices for similar investments, interest rates, prepayment speeds, credit risk, etc.) |
| • | Level 3 – significant unobservable inputs (including a fund's own assumptions in determining the fair value of investments) |
In cases where the inputs used to measure fair value fall in different levels of the fair value hierarchy, the level disclosed is determined based on the lowest level input that is significant to the fair value measurement in its entirety. The inputs or methodology used for valuing securities are not necessarily an indication of the risk associated with investing in those securities.
At December 31, 2022 and December 31, 2021, the Fund’s investment in Core Bond Portfolio, whose financial statements are not included but are available elsewhere as discussed in Note 1, and in Stock Portfolio were valued based on Level 1 inputs.
9 Risks and Uncertainties
Pandemic Risk
An outbreak of respiratory disease caused by a novel coronavirus was first detected in China in late 2019 and subsequently spread internationally. This coronavirus has resulted in closing borders, enhanced health screenings, changes to healthcare service preparation and delivery, quarantines, cancellations, disruptions to supply chains and customer activity, as well as general concern and uncertainty. Health crises caused by outbreaks of disease, such as the coronavirus outbreak, may exacerbate other pre-existing political, social and economic risks and disrupt normal market conditions and operations. The impact of this outbreak has negatively affected the worldwide economy, as well as the economies of individual countries and industries, and could continue to affect the market in significant and unforeseen ways. Other epidemics and pandemics that may arise in the future may have similar effects. Any such impact could adversely affect the Fund's performance, or the performance of the securities in which the Fund invests.
Eaton Vance
Balanced Fund
December 31, 2022
Report of Independent Registered Public Accounting Firm
To the Trustees of Eaton Vance Special Investment Trust and Shareholders of Eaton Vance Balanced Fund:
Opinion on the Financial Statements and Financial Highlights
We have audited the accompanying statement of assets and liabilities of Eaton Vance Balanced Fund (the “Fund”) (one of the funds constituting Eaton Vance Special Investment Trust), as of December 31, 2022, the related statement of operations for the year then ended, the statements of changes in net assets for each of the two years in the period then ended, the financial highlights for each of the five years in the period then ended, and the related notes. In our opinion, the financial statements and financial highlights present fairly, in all material respects, the financial position of the Fund as of December 31, 2022, and the results of its operations for the year then ended, the changes in its net assets for each of the two years in the period then ended, and the financial highlights for each of the five years in the period then ended in conformity with accounting principles generally accepted in the United States of America.
Basis for Opinion
These financial statements and financial highlights are the responsibility of the Fund's management. Our responsibility is to express an opinion on the Fund's financial statements and financial highlights based on our audits. We are a public accounting firm registered with the Public Company Accounting Oversight Board (United States) (PCAOB) and are required to be independent with respect to the Fund in accordance with the U.S. federal securities laws and the applicable rules and regulations of the Securities and Exchange Commission and the PCAOB.
We conducted our audits in accordance with the standards of the PCAOB. Those standards require that we plan and perform the audit to obtain reasonable assurance about whether the financial statements and financial highlights are free of material misstatement, whether due to error or fraud. The Fund is not required to have, nor were we engaged to perform, an audit of its internal control over financial reporting. As part of our audits, we are required to obtain an understanding of internal control over financial reporting but not for the purpose of expressing an opinion on the effectiveness of the Fund’s internal control over financial reporting. Accordingly, we express no such opinion.
Our audits included performing procedures to assess the risks of material misstatement of the financial statements and financial highlights, whether due to error or fraud, and performing procedures that respond to those risks. Such procedures included examining, on a test basis, evidence regarding the amounts and disclosures in the financial statements and financial highlights. Our audits also included evaluating the accounting principles used and significant estimates made by management, as well as evaluating the overall presentation of the financial statements and financial highlights. We believe that our audits provide a reasonable basis for our opinion.
/s/ Deloitte & Touche LLP
Boston, Massachusetts
February 24, 2023
We have served as the auditor of one or more Eaton Vance investment companies since 1959.
Eaton Vance
Balanced Fund
December 31, 2022
Federal Tax Information (Unaudited)
The Form 1099-DIV you received in February 2023 showed the tax status of all distributions paid to your account in calendar year 2022. Shareholders are advised to consult their own tax adviser with respect to the tax consequences of their investment in the Fund. As required by the Internal Revenue Code and/or regulations, shareholders must be notified regarding the status of qualified dividend income for individuals, the dividends received deduction for corporations and capital gains dividends.
Qualified Dividend Income. For the fiscal year ended December 31, 2022, the Fund designates approximately $6,209,304, or up to the maximum amount of such dividends allowable pursuant to the Internal Revenue Code, as qualified dividend income eligible for the reduced tax rate of 15%.
Dividends Received Deduction. Corporate shareholders are generally entitled to take the dividends received deduction on the portion of the Fund’s dividend distribution that qualifies under tax law. For the Fund’s fiscal 2022 ordinary income dividends, 54.40% qualifies for the corporate dividends received deduction.
Capital Gains Dividends. The Fund hereby designates as a capital gain dividend with respect to the taxable year ended December 31, 2022, $11,418,197 or, if subsequently determined to be different, the net capital gain of such year.
Stock Portfolio
December 31, 2022
| Security | Shares | Value |
| Auto Components — 0.8% |
| Aptiv PLC(1) | | 48,156 | $ 4,484,768 |
| | | | $ 4,484,768 |
| Banks — 2.8% |
| PNC Financial Services Group, Inc. (The) | | 43,770 | $ 6,913,034 |
| Wells Fargo & Co. | | 201,910 | 8,336,864 |
| | | | $ 15,249,898 |
| Beverages — 6.0% |
| Coca-Cola Co. (The) | | 257,046 | $ 16,350,696 |
| PepsiCo, Inc. | | 93,400 | 16,873,644 |
| | | | $ 33,224,340 |
| Biotechnology — 2.8% |
| AbbVie, Inc. | | 96,116 | $ 15,533,307 |
| | | | $ 15,533,307 |
| Capital Markets — 5.6% |
| Intercontinental Exchange, Inc. | | 109,304 | $ 11,213,497 |
| S&P Global, Inc. | | 22,736 | 7,615,196 |
| Stifel Financial Corp. | | 98,400 | 5,743,608 |
| Tradeweb Markets, Inc., Class A | | 95,929 | 6,228,670 |
| | | | $ 30,800,971 |
| Chemicals — 2.6% |
| FMC Corp. | | 57,700 | $ 7,200,960 |
| Linde PLC | | 21,000 | 6,849,780 |
| | | | $ 14,050,740 |
| Commercial Services & Supplies — 1.3% |
| Waste Management, Inc. | | 45,278 | $ 7,103,213 |
| | | | $ 7,103,213 |
| Electric Utilities — 3.0% |
| Constellation Energy Corp. | | 81,700 | $ 7,043,357 |
| NextEra Energy, Inc. | | 112,640 | 9,416,704 |
| | | | $ 16,460,061 |
| Electrical Equipment — 1.6% |
| AMETEK, Inc. | | 64,156 | $ 8,963,876 |
| | | | $ 8,963,876 |
| Security | Shares | Value |
| Electronic Equipment, Instruments & Components — 1.4% |
| TE Connectivity, Ltd. | | 67,000 | $ 7,691,600 |
| | | | $ 7,691,600 |
| Entertainment — 2.0% |
| Electronic Arts, Inc. | | 90,800 | $ 11,093,944 |
| | | | $ 11,093,944 |
| Equity Real Estate Investment Trusts (REITs) — 1.1% |
| Lamar Advertising Co., Class A | | 61,690 | $ 5,823,536 |
| | | | $ 5,823,536 |
| Food & Staples Retailing — 1.9% |
| Walmart, Inc. | | 74,000 | $ 10,492,460 |
| | | | $ 10,492,460 |
| Health Care Equipment & Supplies — 4.2% |
| Boston Scientific Corp.(1) | | 210,736 | $ 9,750,755 |
| Intuitive Surgical, Inc.(1) | | 27,100 | 7,190,985 |
| Stryker Corp. | | 25,000 | 6,112,250 |
| | | | $ 23,053,990 |
| Health Care Providers & Services — 1.8% |
| Elevance Health, Inc. | | 19,724 | $ 10,117,820 |
| | | | $ 10,117,820 |
| Hotels, Restaurants & Leisure — 1.6% |
| Domino's Pizza, Inc. | | 15,400 | $ 5,334,560 |
| Marriott International, Inc., Class A | | 22,628 | 3,369,083 |
| | | | $ 8,703,643 |
| Insurance — 3.3% |
| Allstate Corp. (The) | | 91,200 | $ 12,366,720 |
| W.R. Berkley Corp. | | 78,600 | 5,704,002 |
| | | | $ 18,070,722 |
| Interactive Media & Services — 3.5% |
| Alphabet, Inc., Class C(1) | | 214,380 | $ 19,021,938 |
| | | | $ 19,021,938 |
| Internet & Direct Marketing Retail — 2.7% |
| Amazon.com, Inc.(1) | | 179,820 | $ 15,104,880 |
| | | | $ 15,104,880 |
| IT Services — 4.7% |
| Automatic Data Processing, Inc. | | 43,996 | $ 10,508,884 |
24
See Notes to Financial Statements.
Stock Portfolio
December 31, 2022
Portfolio of Investments — continued
| Security | Shares | Value |
| IT Services (continued) |
| Visa, Inc., Class A | | 73,330 | $ 15,235,041 |
| | | | $ 25,743,925 |
| Life Sciences Tools & Services — 4.0% |
| Danaher Corp. | | 45,392 | $ 12,047,945 |
| Thermo Fisher Scientific, Inc. | | 18,034 | 9,931,143 |
| | | | $ 21,979,088 |
| Machinery — 1.3% |
| Westinghouse Air Brake Technologies Corp. | | 69,700 | $ 6,956,757 |
| | | | $ 6,956,757 |
| Media — 1.2% |
| Comcast Corp., Class A | | 185,300 | $ 6,479,941 |
| | | | $ 6,479,941 |
| Multi-Utilities — 1.3% |
| Sempra Energy | | 46,800 | $ 7,232,472 |
| | | | $ 7,232,472 |
| Oil, Gas & Consumable Fuels — 1.7% |
| ConocoPhillips | | 80,956 | $ 9,552,808 |
| | | | $ 9,552,808 |
| Pharmaceuticals — 3.2% |
| Bristol-Myers Squibb Co. | | 105,300 | $ 7,576,335 |
| Eli Lilly & Co. | | 27,400 | 10,024,016 |
| | | | $ 17,600,351 |
| Professional Services — 2.4% |
| Booz Allen Hamilton Holding Corp. | | 56,190 | $ 5,872,979 |
| TransUnion | | 128,200 | 7,275,350 |
| | | | $ 13,148,329 |
| Real Estate Management & Development — 1.5% |
| FirstService Corp. | | 66,000 | $ 8,088,300 |
| | | | $ 8,088,300 |
| Road & Rail — 1.7% |
| Union Pacific Corp. | | 46,324 | $ 9,592,311 |
| | | | $ 9,592,311 |
| Semiconductors & Semiconductor Equipment — 4.9% |
| Analog Devices, Inc. | | 66,786 | $ 10,954,908 |
| Security | Shares | Value |
| Semiconductors & Semiconductor Equipment (continued) |
| Lam Research Corp. | | 16,000 | $ 6,724,800 |
| Texas Instruments, Inc. | | 55,047 | 9,094,865 |
| | | | $ 26,774,573 |
| Software — 11.2% |
| Black Knight, Inc.(1) | | 89,100 | $ 5,501,925 |
| Fair Isaac Corp.(1) | | 8,100 | 4,848,498 |
| Intuit, Inc. | | 18,354 | 7,143,744 |
| Microsoft Corp. | | 159,398 | 38,226,828 |
| VMware, Inc., Class A(1) | | 46,500 | 5,708,340 |
| | | | $ 61,429,335 |
| Specialty Retail — 2.6% |
| Home Depot, Inc. (The) | | 17,700 | $ 5,590,722 |
| TJX Cos., Inc. (The) | | 109,234 | 8,695,026 |
| | | | $ 14,285,748 |
| Technology Hardware, Storage & Peripherals — 5.4% |
| Apple, Inc. | | 230,384 | $ 29,933,793 |
| | | | $ 29,933,793 |
| Textiles, Apparel & Luxury Goods — 1.1% |
| NIKE, Inc., Class B | | 51,400 | $ 6,014,314 |
| | | | $ 6,014,314 |
| Wireless Telecommunication Services — 1.5% |
| T-Mobile US, Inc.(1) | | 59,308 | $ 8,303,120 |
| | | | $ 8,303,120 |
Total Common Stocks
(identified cost $396,061,663) | | | $548,160,872 |
| Short-Term Investments — 0.0%(2) |
| Security | Shares | Value |
| Morgan Stanley Institutional Liquidity Funds - Government Portfolio, Institutional Class, 4.11%(3) | | 4,125 | $ 4,125 |
Total Short-Term Investments
(identified cost $4,125) | | | $ 4,125 |
Total Investments — 99.7%
(identified cost $396,065,788) | | | $548,164,997 |
| Other Assets, Less Liabilities — 0.3% | | | $ 1,871,448 |
| Net Assets — 100.0% | | | $550,036,445 |
25
See Notes to Financial Statements.
Stock Portfolio
December 31, 2022
Portfolio of Investments — continued
| The percentage shown for each investment category in the Portfolio of Investments is based on net assets. |
| (1) | Non-income producing security. |
| (2) | Amount is less than 0.05%. |
| (3) | May be deemed to be an affiliated investment company. The rate shown is the annualized seven-day yield as of December 31, 2022. |
26
See Notes to Financial Statements.
Stock Portfolio
December 31, 2022
Statement of Assets and Liabilities
| | December 31, 2022 |
| Assets | |
| Unaffiliated investments, at value (identified cost $396,061,663) | $ 548,160,872 |
| Affiliated investment, at value (identified cost $4,125) | 4,125 |
| Dividends receivable | 504,625 |
| Dividends receivable from affiliated investment | 4,559 |
| Receivable for investments sold | 1,808,632 |
| Tax reclaims receivable | 92,357 |
| Total assets | $550,575,170 |
| Liabilities | |
| Demand note payable | $ 100,000 |
| Payable to affiliates: | |
| Investment adviser fee | 288,123 |
| Trustees' fees | 11,385 |
| Accrued expenses | 139,217 |
| Total liabilities | $ 538,725 |
| Net Assets applicable to investors' interest in Portfolio | $550,036,445 |
27
See Notes to Financial Statements.
Stock Portfolio
December 31, 2022
| | Year Ended |
| | December 31, 2022 |
| Investment Income | |
| Dividend income (net of foreign taxes withheld of $10,985) | $ 9,389,595 |
| Dividend income from affiliated investments | 33,517 |
| Total investment income | $ 9,423,112 |
| Expenses | |
| Investment adviser fee | $ 3,854,942 |
| Trustees’ fees and expenses | 44,226 |
| Custodian fee | 159,800 |
| Legal and accounting services | 56,300 |
| Miscellaneous | 21,204 |
| Total expenses | $ 4,136,472 |
| Deduct: | |
| Waiver and/or reimbursement of expenses by affiliate | $ 2,688 |
| Total expense reductions | $ 2,688 |
| Net expenses | $ 4,133,784 |
| Net investment income | $ 5,289,328 |
| Realized and Unrealized Gain (Loss) | |
| Net realized gain (loss): | |
| Investment transactions | $ 32,247,368 |
| Investment transactions - affiliated investment | 2,363 |
| Foreign currency transactions | (1,188) |
| Net realized gain | $ 32,248,543 |
| Change in unrealized appreciation (depreciation): | |
| Investments | $ (166,969,130) |
| Foreign currency | (6,299) |
| Net change in unrealized appreciation (depreciation) | $(166,975,429) |
| Net realized and unrealized loss | $(134,726,886) |
| Net decrease in net assets from operations | $(129,437,558) |
28
See Notes to Financial Statements.
Stock Portfolio
December 31, 2022
Statement of Changes in Net Assets
| | Year Ended December 31, |
| | 2022 | 2021 |
| Increase (Decrease) in Net Assets | | |
| From operations: | | |
| Net investment income | $ 5,289,328 | $ 4,613,543 |
| Net realized gain | 32,248,543 | 123,837,212 (1) |
| Net change in unrealized appreciation (depreciation) | (166,975,429) | 46,443,015 |
| Net increase (decrease) in net assets from operations | $(129,437,558) | $ 174,893,770 |
| Capital transactions: | | |
| Contributions | $ 5,305,309 | $ 23,356,815 |
| Withdrawals | (198,020,738) | (131,961,931) |
| Portfolio transaction fee | 879,886 | 574,923 |
| Net decrease in net assets from capital transactions | $(191,835,543) | $(108,030,193) |
| Net increase (decrease) in net assets | $(321,273,101) | $ 66,863,577 |
| Net Assets | | |
| At beginning of year | $ 871,309,546 | $ 804,445,969 |
| At end of year | $ 550,036,445 | $ 871,309,546 |
| (1) | Includes $3,096,043 of net realized gains from redemptions in-kind. |
29
See Notes to Financial Statements.
Stock Portfolio
December 31, 2022
| | Year Ended December 31, |
| Ratios/Supplemental Data | 2022 | 2021 | 2020 | 2019 | 2018 |
| Ratios (as a percentage of average daily net assets): | | | | | |
| Expenses | 0.64% (1) | 0.63% | 0.64% | 0.63% | 0.64% |
| Net investment income | 0.82% | 0.55% | 0.84% | 0.99% | 1.14% |
| Portfolio Turnover | 52% | 44% | 70% | 55% | 90% |
| Total Return | (16.49)% | 23.21% | 18.61% | 35.47% | (5.57)% |
| Net assets, end of year (000’s omitted) | $550,036 | $871,310 | $804,446 | $683,548 | $516,615 |
| (1) | Includes a reduction by the investment adviser of a portion of its adviser fee due to the Portfolio's investment in the Liquidity Fund (equal to less than 0.005% of average daily net assets for the year ended December 31, 2022). |
Stock Portfolio
December 31, 2022
Notes to Financial Statements
1 Significant Accounting Policies
Stock Portfolio (the Portfolio) is a Massachusetts business trust registered under the Investment Company Act of 1940, as amended (the 1940 Act), as a diversified, open-end management investment company. The Portfolio's investment objective is to achieve long-term capital appreciation by investing in a diversified portfolio of equity securities. The Declaration of Trust permits the Trustees to issue interests in the Portfolio. At December 31, 2022, Eaton Vance Stock Fund and Eaton Vance Balanced Fund held an interest of 13.5% and 86.5%, respectively, in the Portfolio.
The following is a summary of significant accounting policies of the Portfolio. The policies are in conformity with accounting principles generally accepted in the United States of America (U.S. GAAP). The Portfolio is an investment company and follows accounting and reporting guidance in the Financial Accounting Standards Board (FASB) Accounting Standards Codification Topic 946.
A Investment Valuation—The following methodologies are used to determine the market value or fair value of investments.
Equity Securities. Equity securities listed on a U.S. securities exchange generally are valued at the last sale or closing price on the day of valuation or, if no sales took place on such date, at the mean between the closing bid and ask prices on the exchange where such securities are principally traded. Equity securities listed on the NASDAQ National Market System are valued at the NASDAQ official closing price. Unlisted or listed securities for which closing sales prices or closing quotations are not available are valued at the mean between the latest available bid and ask prices.
Foreign Securities and Currencies. Foreign securities and currencies are valued in U.S. dollars, based on foreign currency exchange rate quotations supplied by a third party pricing service. The pricing service uses a proprietary model to determine the exchange rate. Inputs to the model include reported trades and implied bid/ask spreads. The daily valuation of exchange-traded foreign securities generally is determined as of the close of trading on the principal exchange on which such securities trade. Events occurring after the close of trading on foreign exchanges may result in adjustments to the valuation of foreign securities to more accurately reflect their fair value as of the close of regular trading on the New York Stock Exchange. When valuing foreign equity securities that meet certain criteria, the Portfolio's Trustees have approved the use of a fair value service that values such securities to reflect market trading that occurs after the close of the applicable foreign markets of comparable securities or other instruments that have a strong correlation to the fair-valued securities.
Other. Investments in management investment companies (including money market funds) that do not trade on an exchange are valued at the net asset value as of the close of each business day.
Fair Valuation. In connection with Rule 2a-5 of the 1940 Act, which became effective September 8, 2022, the Trustees have designated the Portfolio’s investment adviser as its valuation designee. Investments for which valuations or market quotations are not readily available or are deemed unreliable are valued by the investment adviser, as valuation designee, at fair value using methods that most fairly reflect the security’s “fair value”, which is the amount that the Portfolio might reasonably expect to receive for the security upon its current sale in the ordinary course. Each such determination is based on a consideration of relevant factors, which are likely to vary from one pricing context to another. These factors may include, but are not limited to, the type of security, the existence of any contractual restrictions on the security’s disposition, the price and extent of public trading in similar securities of the issuer or of comparable companies or entities, quotations or relevant information obtained from broker/dealers or other market participants, information obtained from the issuer, analysts, and/or the appropriate stock exchange (for exchange-traded securities), an analysis of the company’s or entity’s financial statements, and an evaluation of the forces that influence the issuer and the market(s) in which the security is purchased and sold.
B Investment Transactions—Investment transactions for financial statement purposes are accounted for on a trade date basis. Realized gains and losses on investments sold are determined on the basis of identified cost.
C Income—Dividend income is recorded on the ex-dividend date for dividends received in cash and/or securities. However, if the ex-dividend date has passed, certain dividends from foreign securities are recorded as the Portfolio is informed of the ex-dividend date. Withholding taxes on foreign dividends and capital gains have been provided for in accordance with the Portfolio’s understanding of the applicable countries’ tax rules and rates.
D Federal Taxes—The Portfolio has elected to be treated as a partnership for federal tax purposes. No provision is made by the Portfolio for federal or state taxes on any taxable income of the Portfolio because each investor in the Portfolio is ultimately responsible for the payment of any taxes on its share of taxable income. Since at least one of the Portfolio's investors is a regulated investment company that invests all or substantially all of its assets in the Portfolio, the Portfolio normally must satisfy the applicable source of income and diversification requirements (under the Internal Revenue Code) in order for its investors to satisfy them. The Portfolio will allocate, at least annually among its investors, each investor's distributive share of the Portfolio's net investment income, net realized capital gains and losses and any other items of income, gain, loss, deduction or credit.
As of December 31, 2022, the Portfolio had no uncertain tax positions that would require financial statement recognition, de-recognition, or disclosure. The Portfolio files a U.S. federal income tax return annually after its fiscal year-end, which is subject to examination by the Internal Revenue Service for a period of three years from the date of filing.
E Foreign Currency Translation—Investment valuations, other assets, and liabilities initially expressed in foreign currencies are translated each business day into U.S. dollars based upon current exchange rates. Purchases and sales of foreign investment securities and income and expenses denominated in foreign currencies are translated into U.S. dollars based upon currency exchange rates in effect on the respective dates of such transactions. Recognized
Stock Portfolio
December 31, 2022
Notes to Financial Statements — continued
gains or losses on investment transactions attributable to changes in foreign currency exchange rates are recorded for financial statement purposes as net realized gains and losses on investments. That portion of unrealized gains and losses on investments that results from fluctuations in foreign currency exchange rates is not separately disclosed.
F Use of Estimates—The preparation of the financial statements in conformity with U.S. GAAP requires management to make estimates and assumptions that affect the reported amounts of assets and liabilities at the date of the financial statements and the reported amounts of income and expense during the reporting period. Actual results could differ from those estimates.
G Indemnifications—Under the Portfolio’s organizational documents, its officers and Trustees may be indemnified against certain liabilities and expenses arising out of the performance of their duties to the Portfolio. Under Massachusetts law, if certain conditions prevail, interestholders in the Portfolio could be deemed to have personal liability for the obligations of the Portfolio. However, the Portfolio’s Declaration of Trust contains an express disclaimer of liability on the part of Portfolio interestholders. Additionally, in the normal course of business, the Portfolio enters into agreements with service providers that may contain indemnification clauses. The Portfolio’s maximum exposure under these arrangements is unknown as this would involve future claims that may be made against the Portfolio that have not yet occurred.
H Capital Transactions—To seek to protect the Portfolio (and, indirectly, other investors in the Portfolio) against the costs of accommodating investor inflows and outflows, the Portfolio imposed a fee (“Portfolio transaction fee”) on inflows and outflows by Portfolio investors. The Portfolio transaction fee was sized to cover the estimated cost to the Portfolio of, in connection with issuing interests, converting the cash and/or other instruments it received to the desired composition and, in connection with redeeming its interests, converting Portfolio holdings to cash and/or other instruments to be distributed. Such fee, which may have varied over time, was limited to amounts that had been authorized by the Board of Trustees and determined by EVM to be appropriate. The maximum Portfolio transaction fee was 2% of the amount of net contributions or withdrawals. The Portfolio transaction fee is recorded as a component of capital transactions on the Statements of Changes in Net Assets. Effective after the close of business on December 23, 2022, the Portfolio transaction fee was discontinued.
2 Investment Adviser Fee and Other Transactions with Affiliates
The investment adviser fee is earned by Boston Management and Research (BMR), an indirect, wholly-owned subsidiary of Morgan Stanley, as compensation for investment advisory services rendered to the Portfolio The fee is computed at an annual rate as a percentage of the Portfolio’s average daily net assets as follows and is payable monthly:
| Average Daily Net Assets | Annual Fee Rate |
| Up to $500 million | 0.600% |
| $500 million but less than $1 billion | 0.575% |
| $1 billion but less than $2.5 billion | 0.550% |
| $2.5 billion but less than $5 billion | 0.530% |
| $5 billion and over | 0.515% |
For the year ended December 31, 2022, the Portfolio's investment adviser fee amounted to $3,854,942 or 0.60% of the Portfolio’s average daily net assets.
Effective April 26, 2022, the Portfolio may invest in a money market fund, the Institutional Class of the Morgan Stanley Institutional Liquidity Funds - Government Portfolio (the "Liquidity Fund"), an open-end management investment company managed by Morgan Stanley Investment Management Inc., a wholly-owned subsidiary of Morgan Stanley. The investment adviser fee paid by the Portfolio is reduced by an amount equal to its pro-rata share of the advisory and administration fees paid by the Portfolio due to its investment in the Liquidity Fund. For the year ended December 31, 2022, the investment adviser fee paid was reduced by $2,688 relating to the Portfolio's investment in the Liquidity Fund. Prior to April 26, 2022, the Portfolio may have invested its cash in Eaton Vance Cash Reserves Fund, LLC (Cash Reserves Fund), an affiliated investment company managed by Eaton Vance Management (EVM). EVM did not receive a fee for advisory services provided to Cash Reserves Fund.
Trustees and officers of the Portfolio who are members of EVM’s or BMR’s organizations receive remuneration for their services to the Portfolio out of the investment adviser fee. Trustees of the Portfolio who are not affiliated with the investment adviser may elect to defer receipt of all or a percentage of their annual fees in accordance with the terms of the Trustees Deferred Compensation Plan. For the year ended December 31, 2022, no significant amounts have been deferred. Certain officers and Trustees of the Portfolio are officers of the above organizations.
3 Purchases and Sales of Investments
Purchases and sales of investments, other than short-term obligations, aggregated $338,914,343 and $482,840,108, respectively, for the year ended December 31, 2022.
Stock Portfolio
December 31, 2022
Notes to Financial Statements — continued
4 Federal Income Tax Basis of Investments
The cost and unrealized appreciation (depreciation) of investments of the Portfolio at December 31, 2022, as determined on a federal income tax basis, were as follows:
| Aggregate cost | $396,668,747 |
| Gross unrealized appreciation | $ 160,459,265 |
| Gross unrealized depreciation | (8,963,015) |
| Net unrealized appreciation | $151,496,250 |
5 Line of Credit
The Portfolio participates with other portfolios and funds managed by EVM and its affiliates in a $725 million unsecured line of credit agreement with a group of banks, which is in effect through October 24, 2023. In connection with the renewal of the agreement on October 25, 2022, the borrowing limit was decreased from $800 million. Borrowings are made by the Portfolio solely for temporary purposes related to redemptions and other short-term cash needs. Interest is charged to the Portfolio based on its borrowings at an amount above either the Secured Overnight Financing Rate (SOFR) or Federal Funds rate. In addition, a fee computed at an annual rate of 0.15% on the daily unused portion of the line of credit is allocated among the participating portfolios and funds at the end of each quarter. Also in connection with the renewal of the agreement, an arrangement fee totaling $150,000 was incurred that was allocated to the participating portfolios and funds. Because the line of credit is not available exclusively to the Portfolio, it may be unable to borrow some or all of its requested amounts at any particular time. At December 31, 2022, the Portfolio had a balance outstanding pursuant to this line of credit of $100,000 at an annual interest rate of 5.33%. Based on the short-term nature of the borrowings under the line of credit and variable interest rate, the carrying value of the borrowings approximated its fair value at December 31, 2022. If measured at fair value, borrowings under the line of credit would have been considered as Level 2 in the fair value hierarchy (see Note 7) at December 31, 2022.
6 Investments in Affiliated Funds
At December 31, 2022, the value of the Portfolio's investment in affiliated funds, including funds that may be deemed to be affiliated, was $4,125, which represents less than 0.05% of the Portfolio's net assets. Transactions in such investments by the Portfolio for the year ended December 31, 2022 were as follows:
| Name | Value,
beginning
of period | Purchases | Sales
proceeds | Net
realized
gain (loss) | Change in
unrealized
appreciation
(depreciation) | Value, end
of period | Dividend
income | Units/Shares,
end of period |
| Short-Term Investments |
| Cash Reserves Fund | $2,248,476 | $51,152,522 | $(53,403,361) | $ 2,363 | $ — | $ — | $ 588 | — |
| Liquidity Fund | — | 80,703,519 | (80,699,394) | — | — | 4,125 | 32,929 | 4,125 |
| Total | | | | $2,363 | $ — | $4,125 | $33,517 | |
7 Fair Value Measurements
Under generally accepted accounting principles for fair value measurements, a three-tier hierarchy to prioritize the assumptions, referred to as inputs, is used in valuation techniques to measure fair value. The three-tier hierarchy of inputs is summarized in the three broad levels listed below.
| • | Level 1 – quoted prices in active markets for identical investments |
| • | Level 2 – other significant observable inputs (including quoted prices for similar investments, interest rates, prepayment speeds, credit risk, etc.) |
| • | Level 3 – significant unobservable inputs (including a fund's own assumptions in determining the fair value of investments) |
In cases where the inputs used to measure fair value fall in different levels of the fair value hierarchy, the level disclosed is determined based on the lowest level input that is significant to the fair value measurement in its entirety. The inputs or methodology used for valuing securities are not necessarily an indication of the risk associated with investing in those securities.
Stock Portfolio
December 31, 2022
Notes to Financial Statements — continued
At December 31, 2022, the hierarchy of inputs used in valuing the Portfolio's investments, which are carried at value, were as follows:
| Asset Description | Level 1 | Level 2 | Level 3 | Total |
| Common Stocks | $ 548,160,872* | $ — | $ — | $ 548,160,872 |
| Short-Term Investments | 4,125 | — | — | 4,125 |
| Total Investments | $548,164,997 | $ — | $ — | $548,164,997 |
| * | The level classification by major category of investments is the same as the category presentation in the Portfolio of Investments. |
8 Risks and Uncertainties
Pandemic Risk
An outbreak of respiratory disease caused by a novel coronavirus was first detected in China in late 2019 and subsequently spread internationally. This coronavirus has resulted in closing borders, enhanced health screenings, changes to healthcare service preparation and delivery, quarantines, cancellations, disruptions to supply chains and customer activity, as well as general concern and uncertainty. Health crises caused by outbreaks of disease, such as the coronavirus outbreak, may exacerbate other pre-existing political, social and economic risks and disrupt normal market conditions and operations. The impact of this outbreak has negatively affected the worldwide economy, as well as the economies of individual countries and industries, and could continue to affect the market in significant and unforeseen ways. Other epidemics and pandemics that may arise in the future may have similar effects. Any such impact could adversely affect the Portfolio’s performance, or the performance of the securities in which the Portfolio invests.
Stock Portfolio
December 31, 2022
Report of Independent Registered Public Accounting Firm
To the Trustees and Investors of Stock Portfolio:
Opinion on the Financial Statements and Financial Highlights
We have audited the accompanying statement of assets and liabilities of Stock Portfolio (the “Portfolio”), including the portfolio of investments, as of December 31, 2022, the related statement of operations for the year then ended, the statements of changes in net assets for each of the two years in the period then ended, the financial highlights for each of the five years in the period then ended, and the related notes. In our opinion, the financial statements and financial highlights present fairly, in all material respects, the financial position of the Portfolio as of December 31, 2022, and the results of its operations for the year then ended, the changes in its net assets for each of the two years in the period then ended, and the financial highlights for each of the five years in the period then ended, in conformity with accounting principles generally accepted in the United States of America.
Basis for Opinion
These financial statements and financial highlights are the responsibility of the Portfolio's management. Our responsibility is to express an opinion on the Portfolio's financial statements and financial highlights based on our audits. We are a public accounting firm registered with the Public Company Accounting Oversight Board (United States) (PCAOB) and are required to be independent with respect to the Portfolio in accordance with the U.S. federal securities laws and the applicable rules and regulations of the Securities and Exchange Commission and the PCAOB.
We conducted our audits in accordance with the standards of the PCAOB. Those standards require that we plan and perform the audit to obtain reasonable assurance about whether the financial statements and financial highlights are free of material misstatement, whether due to error or fraud. The Portfolio is not required to have, nor were we engaged to perform, an audit of its internal control over financial reporting. As part of our audits, we are required to obtain an understanding of internal control over financial reporting but not for the purpose of expressing an opinion on the effectiveness of the Portfolio’s internal control over financial reporting. Accordingly, we express no such opinion.
Our audits included performing procedures to assess the risks of material misstatement of the financial statements and financial highlights, whether due to error or fraud, and performing procedures that respond to those risks. Such procedures included examining, on a test basis, evidence regarding the amounts and disclosures in the financial statements and financial highlights. Our audits also included evaluating the accounting principles used and significant estimates made by management, as well as evaluating the overall presentation of the financial statements and financial highlights. Our procedures included confirmation of securities owned as of December 31, 2022, by correspondence with the custodian and brokers; when replies were not received from brokers, we performed other auditing procedures. We believe that our audits provide a reasonable basis for our opinion.
/s/ Deloitte & Touche LLP
Boston, Massachusetts
February 24, 2023
We have served as the auditor of one or more Eaton Vance investment companies since 1959.
Eaton Vance
Balanced Fund
December 31, 2022
Management and Organization
Fund Management. The Trustees of Eaton Vance Special Investment Trust (the Trust), Core Bond Portfolio (CBP) and Stock Portfolio (SP) (the Portfolios) are responsible for the overall management and supervision of the Trust and each Portfolio’s affairs. The Board members and officers of the Trust and each Portfolio are listed below. Except as indicated, each individual has held the office shown or other offices in the same company for the last five years. Board members hold indefinite terms of office. Each Trustee holds office until his or her successor is elected and qualified, subject to a prior death, resignation, retirement, disqualification or removal. Under the terms of the Fund's and the Portfolio's current Trustee retirement policy, an Independent Trustee must retire and resign as a Trustee on the earlier of: (i) the first day of July following his or her 74th birthday; or (ii), with limited exception, December 31st of the 20th year in which he or she has served as a Trustee. However, if such retirement and resignation would cause the Fund and the Portfolios to be out of compliance with Section 16 of the 1940 Act or any other regulations or guidance of the SEC, then such retirement and resignation will not become effective until such time as action has been taken for the Fund and the Portfolios to be in compliance therewith. The “noninterested Trustees” consist of those Trustees who are not “interested persons” of the Trust and each portfolio, as that term is defined under the 1940 Act. The business address of each Board member and officer is Two International Place, Boston, Massachusetts 02110. As used below, “BMR” refers to Boston Management and Research, “EVC” refers to Eaton Vance Corp., “EV” refers to EV LLC, “EVM” refers to Eaton Vance Management and “EVD” refers to Eaton Vance Distributors, Inc. EV is the trustee of each of EVM and BMR. Effective March 1, 2021, each of EVM, BMR, EVD and EV are indirect, wholly owned subsidiaries of Morgan Stanley. Each officer affiliated with EVM may hold a position with other EVM affiliates that is comparable to his or her position with EVM listed below. Each Trustee oversees 130 funds in the Eaton Vance fund complex (including both funds and portfolios in a hub and spoke structure).
| Name and Year of Birth | Trust/Portfolio
Position(s) | Length of Service | Principal Occupation(s) and Other Directorships
During Past Five Years and Other Relevant Experience |
| Interested Trustee |
Thomas E. Faust Jr.
1958 | Trustee | Since 2007 | Chairman of Morgan Stanley Investment Management, Inc. (MSIM), member of the Board of Managers and President of EV (since 2021), Chief Executive Officer of EVM and BMR. Formerly, Chairman, Chief Executive Officer (2007-2021) and President (2006-2021) of EVC and Director of EVD (2007-2022). Mr. Faust is an interested person because of his positions with MSIM, BMR, EVM and EV, which are affiliates of the Trust and each Portfolio.
Other Directorships. Formerly, Director of EVC (2007-2021) and Hexavest Inc. (investment management firm) (2012-2021). |
| Noninterested Trustees |
Alan C. Bowser(1)
1962 | Trustee | Since 2022 | Formerly, Chief Diversity Officer, Partner and a member of the Operating Committee, and formerly served as Senior Advisor on Diversity and Inclusion for the firm’s chief executive officer, Co-Head of the Americas Region, and Senior Client Advisor of Bridgewater Associates, an asset management firm (2011- 2023).
Other Directorships. None. |
Mark R. Fetting
1954 | Trustee | Since 2016 | Private investor. Formerly held various positions at Legg Mason, Inc. (investment management firm) (2000-2012), including President, Chief Executive Officer, Director and Chairman (2008-2012), Senior Executive Vice President (2004-2008) and Executive Vice President (2001-2004). Formerly, President of Legg Mason family of funds (2001-2008). Formerly, Division President and Senior Officer of Prudential Financial Group, Inc. and related companies (investment management firm) (1991-2000).
Other Directorships. None. |
Cynthia E. Frost
1961 | Trustee | Since 2014 | Private investor. Formerly, Chief Investment Officer of Brown University (university endowment) (2000-2012). Formerly, Portfolio Strategist for Duke Management Company (university endowment manager) (1995-2000). Formerly, Managing Director, Cambridge Associates (investment consulting company) (1989-1995). Formerly, Consultant, Bain and Company (management consulting firm) (1987-1989). Formerly, Senior Equity Analyst, BA Investment Management Company (1983-1985).
Other Directorships. None. |
George J. Gorman
1952 | Chairperson
of the Board
and Trustee | Since 2021
(Chairperson) and
2014 (Trustee) | Principal at George J. Gorman LLC (consulting firm). Formerly, Senior Partner at Ernst & Young LLP (a registered public accounting firm) (1974-2009).
Other Directorships. None. |
Eaton Vance
Balanced Fund
December 31, 2022
Management and Organization — continued
| Name and Year of Birth | Trust/Portfolio
Position(s) | Length of Service | Principal Occupation(s) and Other Directorships
During Past Five Years and Other Relevant Experience |
| Noninterested Trustees (continued) |
Valerie A. Mosley
1960 | Trustee | Since 2014 | Chairwoman and Chief Executive Officer of Valmo Ventures (a consulting and investment firm). Founder of Upward Wealth, Inc., dba BrightUp, a fintech platform. Formerly, Partner and Senior Vice President, Portfolio Manager and Investment Strategist at Wellington Management Company, LLP (investment management firm) (1992-2012). Formerly, Chief Investment Officer, PG Corbin Asset Management (1990-1992). Formerly worked in institutional corporate bond sales at Kidder Peabody (1986-1990).
Other Directorships. Director of DraftKings, Inc. (digital sports entertainment and gaming company) (since September 2020). Director of Envestnet, Inc. (provider of intelligent systems for wealth management and financial wellness) (since 2018). Formerly, Director of Dynex Capital, Inc. (mortgage REIT) (2013-2020) and Director of Groupon, Inc. (e-commerce provider) (2020-2022). |
Keith Quinton
1958 | Trustee | Since 2018 | Private investor, researcher and lecturer. Formerly, Independent Investment Committee Member at New Hampshire Retirement System (2017-2021). Formerly, Portfolio Manager and Senior Quantitative Analyst at Fidelity Investments (investment management firm) (2001-2014).
Other Directorships. Formerly, Director (2016-2021) and Chairman (2019-2021) of New Hampshire Municipal Bond Bank. |
Marcus L. Smith
1966 | Trustee | Since 2018 | Private investor and independent corporate director. Formerly, Chief Investment Officer, Canada (2012-2017), Chief Investment Officer, Asia (2010-2012), Director of Asian Research (2004-2010) and portfolio manager (2001-2017) at MFS Investment Management (investment management firm).
Other Directorships. Director of First Industrial Realty Trust, Inc. (an industrial REIT) (since 2021). Director of MSCI Inc. (global provider of investment decision support tools) (since 2017). Formerly, Director of DCT Industrial Trust Inc. (logistics real estate company) (2017-2018). |
Susan J. Sutherland
1957 | Trustee | Since 2015 | Private investor. Director of Ascot Group Limited and certain of its subsidiaries (insurance and reinsurance) (since 2017). Formerly, Director of Hagerty Holding Corp. (insurance) (2015-2018) and Montpelier Re Holdings Ltd. (insurance and reinsurance) (2013-2015). Formerly, Associate, Counsel and Partner at Skadden, Arps, Slate, Meagher & Flom LLP (law firm) (1982-2013).
Other Directorships. Formerly, Director of Kairos Acquisition Corp. (insurance/InsurTech acquisition company) (2021-2023). |
Scott E. Wennerholm
1959 | Trustee | Since 2016 | Private investor. Formerly, Trustee at Wheelock College (postsecondary institution) (2012-2018). Formerly, Consultant at GF Parish Group (executive recruiting firm) (2016-2017). Formerly, Chief Operating Officer and Executive Vice President at BNY Mellon Asset Management (investment management firm) (2005-2011). Formerly, Chief Operating Officer and Chief Financial Officer at Natixis Global Asset Management (investment management firm) (1997-2004). Formerly, Vice President at Fidelity Investments Institutional Services (investment management firm) (1994-1997).
Other Directorships. None. |
Nancy A. Wiser(1)
1967 | Trustee | Since 2022 | Formerly, Executive Vice President and the Global Head of Operations at Wells Fargo Asset Management (2011-2021).
Other Directorships. None. |
| Name and Year of Birth | Trust/Portfolio
Position(s) | Length of Service | Principal Occupation(s)
During Past Five Years |
| Principal Officers who are not Trustees |
Eric A. Stein
1980 | President of the Trust | Since 2020 | Vice President and Chief Investment Officer, Fixed Income of EVM and BMR. Prior to November 1, 2020, Mr. Stein was a co-Director of Eaton Vance’s Global Income Investments. Also Vice President of Calvert Research and Management (“CRM”). |
R. Kelly Williams, Jr.
1971 | President of Stock Portfolio | Since 2022 | President and Chief Operating Officer of Atlanta Capital Management Company, LLC. Officer of 21 registered investment companies managed by Eaton Vance or BMR. |
Deidre E. Walsh
1971 | Vice President and
Chief Legal Officer | Since 2009 | Vice President of EVM and BMR. Also Vice President of CRM. |
Eaton Vance
Balanced Fund
December 31, 2022
Management and Organization — continued
| Name and Year of Birth | Trust/Portfolio
Position(s) | Length of Service | Principal Occupation(s)
During Past Five Years |
| Principal Officers who are not Trustees (continued) |
James F. Kirchner
1967 | Treasurer | Since 2007 | Vice President of EVM and BMR. Also Vice President of CRM. |
Nicholas Di Lorenzo
1987 | Secretary | Since 2022 | Formerly, associate (2012-2021) and counsel (2022) at Dechert LLP. |
Richard F. Froio
1968 | Chief Compliance
Officer | Since 2017 | Vice President of EVM and BMR since 2017. Formerly, Deputy Chief Compliance Officer (Adviser/Funds) and Chief Compliance Officer (Distribution) at PIMCO (2012-2017) and Managing Director at BlackRock/Barclays Global Investors (2009-2012). |
(1) Mr. Bowser and Ms. Wiser began serving as Trustees effective April 4, 2022.
The SAI for the Fund includes additional information about the Trustees and officers of the Fund and each Portfolio and can be obtained without charge on Eaton Vance’s website at www.eatonvance.com or by calling 1-800-262-1122.
| FACTS | WHAT DOES EATON VANCE DO WITH YOUR
PERSONAL INFORMATION? |
| Why? | Financial companies choose how they share your personal information. Federal law gives consumers the right to limit some but not all sharing. Federal law also requires us to tell you how we collect, share, and protect your personal information. Please read this notice carefully to understand what we do. |
| |
| What? | The types of personal information we collect and share depend on the product or service you have with us. This information can include:■ Social Security number and income
■ investment experience and risk tolerance
■ checking account number and wire transfer instructions |
| |
| How? | All financial companies need to share customers’ personal information to run their everyday business. In the section below, we list the reasons financial companies can share their customers’ personal information; the reasons Eaton Vance chooses to share; and whether you can limit this sharing. |
Reasons we can share your
personal information | Does Eaton Vance
share? | Can you limit
this sharing? |
| For our everyday business purposes — such as to process your transactions, maintain your account(s), respond to court orders and legal investigations, or report to credit bureaus | Yes | No |
| For our marketing purposes — to offer our products and services to you | Yes | No |
| For joint marketing with other financial companies | No | We don’t share |
| For our investment management affiliates’ everyday business purposes — information about your transactions, experiences, and creditworthiness | Yes | Yes |
| For our affiliates’ everyday business purposes — information about your transactions and experiences | Yes | No |
| For our affiliates’ everyday business purposes — information about your creditworthiness | No | We don’t share |
| For our investment management affiliates to market to you | Yes | Yes |
| For our affiliates to market to you | No | We don’t share |
| For nonaffiliates to market to you | No | We don’t share |
To limit our
sharing | Call toll-free 1-800-262-1122 or email: EVPrivacy@eatonvance.comPlease note:If you are a new customer, we can begin sharing your information 30 days from the date we sent this notice. When you are no longer our customer, we continue to share your information as described in this notice. However, you can contact us at any time to limit our sharing. |
| Questions? | Call toll-free 1-800-262-1122 or email: EVPrivacy@eatonvance.com |
| Privacy Notice — continued | April 2021 |
| Who we are |
| Who is providing this notice? | Eaton Vance Management, Eaton Vance Distributors, Inc., Eaton Vance Trust Company, Eaton Vance Management (International) Limited, Eaton Vance Advisers International Ltd., Eaton Vance Global Advisors Limited, Eaton Vance Management’s Real Estate Investment Group, Boston Management and Research, Calvert Research and Management, Eaton Vance and Calvert Fund Families and our investment advisory affiliates (“Eaton Vance”) (see Investment Management Affiliates definition below) |
| What we do |
How does Eaton Vance
protect my personal
information? | To protect your personal information from unauthorized access and use, we use security measures that comply with federal law. These measures include computer safeguards and secured files and buildings. We have policies governing the proper handling of customer information by personnel and requiring third parties that provide support to adhere to appropriate security standards with respect to such information. |
How does Eaton Vance
collect my personal
information? | We collect your personal information, for example, when you■ open an account or make deposits or withdrawals from your account
■ buy securities from us or make a wire transfer
■ give us your contact informationWe also collect your personal information from others, such as credit bureaus, affiliates, or other companies. |
| Why can’t I limit all sharing? | Federal law gives you the right to limit only■ sharing for affiliates’ everyday business purposes — information about your creditworthiness
■ affiliates from using your information to market to you
■ sharing for nonaffiliates to market to youState laws and individual companies may give you additional rights to limit sharing. See below for more on your rights under state law. |
| Definitions |
Investment Management
Affiliates | Eaton Vance Investment Management Affiliates include registered investment advisers, registered broker- dealers, and registered and unregistered funds. Investment Management Affiliates does not include entities associated with Morgan Stanley Wealth Management, such as Morgan Stanley Smith Barney LLC and Morgan Stanley & Co. |
| Affiliates | Companies related by common ownership or control. They can be financial and nonfinancial companies.■ Our affiliates include companies with a Morgan Stanley name and financial companies such as Morgan Stanley Smith Barney LLC and Morgan Stanley & Co. |
| Nonaffiliates | Companies not related by common ownership or control. They can be financial and nonfinancial companies.■ Eaton Vance does not share with nonaffiliates so they can market to you. |
| Joint marketing | A formal agreement between nonaffiliated financial companies that together market financial products or services to you.■ Eaton Vance doesn’t jointly market. |
| Other important information |
| Vermont: Except as permitted by law, we will not share personal information we collect about Vermont residents with Nonaffiliates unless you provide us with your written consent to share such information.California: Except as permitted by law, we will not share personal information we collect about California residents with Nonaffiliates and we will limit sharing such personal information with our Affiliates to comply with California privacy laws that apply to us. |
Delivery of Shareholder Documents. The Securities and Exchange Commission (SEC) permits funds to deliver only one copy of shareholder documents, including prospectuses, proxy statements and shareholder reports, to fund investors with multiple accounts at the same residential or post office box address. This practice is often called “householding” and it helps eliminate duplicate mailings to shareholders. Eaton Vance, or your financial intermediary, may household the mailing of your documents indefinitely unless you instruct Eaton Vance, or your financial intermediary, otherwise. If you would prefer that your Eaton Vance documents not be householded, please contact Eaton Vance at 1-800-262-1122, or contact your financial intermediary. Your instructions that householding not apply to delivery of your Eaton Vance documents will typically be effective within 30 days of receipt by Eaton Vance or your financial intermediary.
Portfolio Holdings. Each Eaton Vance Fund and its underlying Portfolio(s) (if applicable) files a schedule of portfolio holdings on Part F to Form N-PORT with the SEC. Certain information filed on Form N-PORT may be viewed on the Eaton Vance website at www.eatonvance.com, by calling Eaton Vance at 1-800-262-1122 or in the EDGAR database on the SEC’s website at www.sec.gov.
Proxy Voting. From time to time, funds are required to vote proxies related to the securities held by the funds. The Eaton Vance Funds or their underlying Portfolios (if applicable) vote proxies according to a set of policies and procedures approved by the Funds’ and Portfolios’ Boards. You may obtain a description of these policies and procedures and information on how the Funds or Portfolios voted proxies relating to portfolio securities during the most recent 12-month period ended June 30, without charge, upon request, by calling 1-800-262-1122 and by accessing the SEC’s website at www.sec.gov.
This Page Intentionally Left Blank
This Page Intentionally Left Blank
This Page Intentionally Left Blank
Investment Adviser of Core Bond Portfolio and Stock Portfolio
Boston Management and Research
Two International Place
Boston, MA 02110
Investment Adviser and Administrator of Eaton Vance Balanced Fund
Eaton Vance Management
Two International Place
Boston, MA 02110
Principal Underwriter*
Eaton Vance Distributors, Inc.
Two International Place
Boston, MA 02110
(617) 482-8260
Custodian
State Street Bank and Trust Company
State Street Financial Center, One Lincoln Street
Boston, MA 02111
Transfer Agent
BNY Mellon Investment Servicing (US) Inc.
Attn: Eaton Vance Funds
P.O. Box 534439
Pittsburgh, PA 15253-4439
(800) 262-1122
Independent Registered Public Accounting Firm
Deloitte & Touche LLP
200 Berkeley Street
Boston, MA 02116-5022
Fund Offices
Two International Place
Boston, MA 02110
* FINRA BrokerCheck. Investors may check the background of their Investment Professional by contacting the Financial Industry Regulatory Authority (FINRA). FINRA BrokerCheck is a free tool to help investors check the professional background of current and former FINRA-registered securities firms and brokers. FINRA BrokerCheck is available by calling 1-800-289-9999 and at www.FINRA.org. The FINRA BrokerCheck brochure describing this program is available to investors at www.FINRA.org.
Eaton Vance
Core Bond Fund
Annual Report
December 31, 2022
Commodity Futures Trading Commission Registration. The Commodity Futures Trading Commission (“CFTC”) has adopted regulations that subject registered investment companies and advisers to regulation by the CFTC if a fund invests more than a prescribed level of its assets in certain CFTC-regulated instruments (including futures, certain options and swap agreements) or markets itself as providing investment exposure to such instruments. The investment adviser has claimed an exclusion from the definition of “commodity pool operator” under the Commodity Exchange Act with respect to its management of the Fund. Accordingly, neither the Fund nor the adviser with respect to the operation of the Fund is subject to CFTC regulation. Because of its management of other strategies, the Fund's adviser is registered with the CFTC as a commodity pool operator. The adviser is also registered as a commodity trading advisor.
Fund shares are not insured by the FDIC and are not deposits or other obligations of, or guaranteed by, any depository institution. Shares are subject to investment risks, including possible loss of principal invested.
This report must be preceded or accompanied by a current summary prospectus or prospectus. Before investing, investors should consider carefully the investment objective, risks, and charges and expenses of a mutual fund. This and other important information is contained in the summary prospectus and prospectus, which can be obtained from a financial intermediary. Prospective investors should read the prospectus carefully before investing. For further information, please call 1-800-262-1122.
Annual Report December 31, 2022
Eaton Vance
Core Bond Fund
Eaton Vance
Core Bond Fund
December 31, 2022
Management’s Discussion of Fund Performance†
Economic and Market Conditions
For most of the 12-month period ended December 31, 2022, the dominant economic themes for fixed-income investors included persistently high inflation in the U.S. and around the globe, as well as attempts by multiple central banks to tame runaway prices by raising interest rates to lower consumer demand. In the final three months of the period, however, inflation slowed and central banks began to back away from their tightening monetary policies. The overall result was a prolonged sell-off in fixed-income assets, which left most major U.S. fixed-income indexes reporting declines for the full period.
At the beginning of the period, investors generally expected three relatively modest interest rate hikes by the U.S. Federal Reserve (the Fed) during 2022. But in February, Russia’s invasion of Ukraine sent shock waves through markets worldwide, exacerbating inflationary pressures on energy and food prices. At its March 2022 meeting, the Fed ended a two-year period of near-zero interest rates with a 0.25% increase in the federal funds rate, its first hike since 2018.
As markets recognized the potential for the Fed to raise rates at every policy meeting in 2022 to combat inflation, interest rates continued an upward trajectory through most of the spring and summer. In November, the Fed announced its fourth straight 0.75% rate hike -- its sixth hike of 2022 -- and reaffirmed that fighting inflation remained the central bank’s top priority. In December, however, amid signs its policies were having the intended effect, the Fed signaled -- and then followed through on -- a slower rate of monetary tightening. The fixed-income market declined 12.46% during the period, according to the Bloomberg U.S. Treasury Index.
As credit spreads widened during most of the period, investment-grade corporate bonds underperformed U.S. Treasurys, with the Bloomberg U.S. Corporate Bond Index (the Corporate Index) declining 15.76%. During the period, lower rated bonds and bonds with longer durations generally underperformed higher rated bonds and bonds with shorter durations. The Corporate Index was concentrated in longer duration bonds rated BBB -- the lowest investment-grade credit rating -- that were most affected by the widespread fixed-income sell-off during the period.
Despite a lower overall credit rating, the high yield corporate asset class outperformed both investment-grade assets and U.S. Treasurys, as the Bloomberg U.S. Corporate High Yield Index returned -11.19% during the period.
Asset-backed securities (ABS) were one of the best-performing fixed-income asset classes, with the Bloomberg Asset-Backed Securities Index returning -4.30% during the period. The relative outperformance of ABS was due mainly to a shorter duration than U.S. Treasurys, as represented by the Bloomberg U.S. Treasury Index, during a period of rising interest rates.
Fund Performance
For the 12-month period ended December 31, 2022, Eaton Vance Core Bond Fund (the Fund) returned -13.33% for Class A shares at net asset value (NAV), underperforming its benchmark, the Bloomberg U.S. Aggregate Bond Index (the Index), which returned -13.01%.
The Fund’s security selections detracted most from returns relative to the Index during the period. Selections among investment-grade corporate bonds and asset-backed securities (ABS) weighed most on relative performance. Selections among U.S. Treasurys also detracted from relative returns during the period.
The Fund’s sector allocation positioning further detracted from relative performance during the period. An underweight exposure to U.S. Treasurys, and overweight exposures to both non-agency commercial mortgage-backed securities (CMBS), and investment-grade corporate securities had negative impacts on returns relative to the Index.
In contrast, the Fund’s shorter-than-Index duration was the largest contributor to relative returns during the period. Security selections within non-agency CMBS and government-related securities further contributed. An overweight exposure to ABS and an out-of-Index allocation to non-agency mortgage-backed securities further enhanced relative returns during the period.
The use of derivatives had a slightly negative impact on returns relative to the Index during the period.
See Endnotes and Additional Disclosures in this report.
Past performance is no guarantee of future results. Returns are historical and are calculated by determining the percentage change in net asset value (NAV) or offering price (as applicable) with all distributions reinvested. Furthermore, returns do not reflect the deduction of taxes that shareholders may have to pay on Fund distributions or upon the redemption of Fund shares. Investment return and principal value will fluctuate so that shares, when redeemed, may be worth more or less than their original cost. Performance for periods less than or equal to one year is cumulative. Performance is for the stated time period only; due to market volatility, current Fund performance may be lower or higher than the quoted return. For performance as of the most recent month-end, please refer to eatonvance.com.
Eaton Vance
Core Bond Fund
December 31, 2022
Performance
Portfolio Manager(s) Vishal Khanduja, CFA and Brian S. Ellis, CFA
| % Average Annual Total Returns1,2 | Class
Inception Date | Performance
Inception Date | One Year | Five Years | Ten Years |
| Class A at NAV | 01/05/2009 | 03/07/2000 | (13.33)% | 0.32% | 1.16% |
| Class A with 3.25% Maximum Sales Charge | — | — | (16.11) | (0.33) | 0.83 |
| Class I at NAV | 03/21/2007 | 03/07/2000 | (13.13) | 0.57 | 1.41 |
|
| Bloomberg U.S. Aggregate Bond Index | — | — | (13.01)% | 0.02% | 1.06% |
| % Total Annual Operating Expense Ratios3 | Class A | Class I |
| Gross | 0.86% | 0.61% |
| Net | 0.74 | 0.49 |
Growth of $10,000
This graph shows the change in value of a hypothetical investment of $10,000 in Class A of the Fund for the period indicated. For comparison, the same investment is shown in the indicated index.
| Growth of Investment | Amount Invested | Period Beginning | At NAV | With Maximum Sales Charge |
| Class I, at minimum investment | $1,000,000 | 12/31/2012 | $1,150,906 | N.A. |
See Endnotes and Additional Disclosures in this report.
Past performance is no guarantee of future results. Returns are historical and are calculated by determining the percentage change in net asset value (NAV) or offering price (as applicable) with all distributions reinvested. Furthermore, returns do not reflect the deduction of taxes that shareholders may have to pay on Fund distributions or upon the redemption of Fund shares. Investment return and principal value will fluctuate so that shares, when redeemed, may be worth more or less than their original cost. Performance for periods less than or equal to one year is cumulative. Performance is for the stated time period only; due to market volatility, current Fund performance may be lower or higher than the quoted return. For performance as of the most recent month-end, please refer to eatonvance.com.
Eaton Vance
Core Bond Fund
December 31, 2022
| Asset Allocation (% of total investments) |
Footnotes:
Fund invests in an affiliated investment company (Portfolio) with the same objective(s) and policies as the Fund. References to investments are to the Portfolio’s holdings.
Eaton Vance
Core Bond Fund
December 31, 2022
Endnotes and Additional Disclosures
| † | The views expressed in this report are those of the portfolio manager(s) and are current only through the date stated at the top of this page. These views are subject to change at any time based upon market or other conditions, and Eaton Vance and the Fund(s) disclaim any responsibility to update such views. These views may not be relied upon as investment advice and, because investment decisions are based on many factors, may not be relied upon as an indication of trading intent on behalf of any Eaton Vance fund. This commentary may contain statements that are not historical facts, referred to as “forward-looking statements.” The Fund’s actual future results may differ significantly from those stated in any forward-looking statement, depending on factors such as changes in securities or financial markets or general economic conditions, the volume of sales and purchases of Fund shares, the continuation of investment advisory, administrative and service contracts, and other risks discussed from time to time in the Fund’s filings with the Securities and Exchange Commission. |
| | |
| 1 | Bloomberg U.S. Aggregate Bond Index is an unmanaged index of domestic investment-grade bonds, including corporate, government and mortgage-backed securities. Unless otherwise stated, index returns do not reflect the effect of any applicable sales charges, commissions, expenses, taxes or leverage, as applicable. It is not possible to invest directly in an index. |
| 2 | Total Returns at NAV do not include applicable sales charges. If sales charges were deducted, the returns would be lower. Total Returns shown with maximum sales charge reflect the stated maximum sales charge. Unless otherwise stated, performance does not reflect the deduction of taxes on Fund distributions or redemptions of Fund shares. |
| 3 | Source: Fund prospectus. Net expense ratios reflect a contractual expense reimbursement that continues through 4/30/23. The expense ratios for the current reporting period can be found in the Financial Highlights section of this report. Performance reflects expenses waived and/or reimbursed, if applicable. Without such waivers and/or reimbursements, performance would have been lower. |
| | Fund profile subject to change due to active management. |
| | Additional Information |
| | Bloomberg U.S. Treasury Index measures the performance of U.S. Treasuries with a maturity of one year or more. Bloomberg U.S. Corporate Bond Index measures the performance of investment-grade U.S. corporate securities with a maturity of one year or more. Bloomberg U.S. Corporate High Yield Index measures USD-denominated, non-investment grade corporate securities. Bloomberg Asset-Backed Securities Index tracks the performance of U.S. dollar denominated investment grade, fixed rate asset-backed securities publicly issued in the U.S. domestic market. |
| | Duration is a measure of the expected change in price of a bond — in percentage terms — given a one percent change in interest rates, all else being constant. Securities with lower durations tend to be less sensitive to interest rate changes. |
| | Credit spread is the difference in yield between a U.S. Treasury bond and another debt security of the same maturity but different credit quality. |
Eaton Vance
Core Bond Fund
December 31, 2022
Example
As a Fund shareholder, you incur two types of costs: (1) transaction costs, including sales charges (loads) on purchases; and (2) ongoing costs, including management fees; distribution and/or service fees; and other Fund expenses. This Example is intended to help you understand your ongoing costs (in dollars) of Fund investing and to compare these costs with the ongoing costs of investing in other mutual funds. The Example is based on an investment of $1,000 invested at the beginning of the period and held for the entire period (July 1, 2022 to December 31, 2022).
Actual Expenses
The first section of the table below provides information about actual account values and actual expenses. You may use the information in this section, together with the amount you invested, to estimate the expenses that you paid over the period. Simply divide your account value by $1,000 (for example, an $8,600 account value divided by $1,000 = 8.6), then multiply the result by the number in the first section under the heading entitled “Expenses Paid During Period” to estimate the expenses you paid on your account during this period.
Hypothetical Example for Comparison Purposes
The second section of the table below provides information about hypothetical account values and hypothetical expenses based on the actual Fund expense ratio and an assumed rate of return of 5% per year (before expenses), which is not the actual Fund return. The hypothetical account values and expenses may not be used to estimate the actual ending account balance or expenses you paid for the period. You may use this information to compare the ongoing costs of investing in your Fund and other funds. To do so, compare this 5% hypothetical example with the 5% hypothetical examples that appear in the shareholder reports of the other funds.
Please note that the expenses shown in the table are meant to highlight your ongoing costs only and do not reflect any transactional costs, such as sales charges (loads). Therefore, the second section of the table is useful in comparing ongoing costs only, and will not help you determine the relative total costs of owning different funds. In addition, if these transactional costs were included, your costs would be higher.
| | Beginning
Account Value
(7/1/22) | Ending
Account Value
(12/31/22) | Expenses Paid
During Period*
(7/1/22 – 12/31/22) | Annualized
Expense
Ratio |
| Actual | | | | |
| Class A | $1,000.00 | $ 971.10 | $3.68** | 0.74% |
| Class I | $1,000.00 | $ 972.30 | $2.44** | 0.49% |
| |
| Hypothetical | | | | |
| (5% return per year before expenses) | | | | |
| Class A | $1,000.00 | $1,021.48 | $3.77** | 0.74% |
| Class I | $1,000.00 | $1,022.74 | $2.50** | 0.49% |
| * | Expenses are equal to the Fund's annualized expense ratio for the indicated Class, multiplied by the average account value over the period, multiplied by 184/365 (to reflect the one-half year period). The Example assumes that the $1,000 was invested at the net asset value per share determined at the close of business on June 30, 2022. The Example reflects the expenses of both the Fund and the Portfolio. |
| ** | Absent an allocation of certain expenses to affiliates, expenses would be higher. |
Eaton Vance
Core Bond Fund
December 31, 2022
Statement of Assets and Liabilities
| | December 31, 2022 |
| Assets | |
| Investment in Core Bond Portfolio, at value (identified cost $228,524,948) | $ 210,363,357 |
| Receivable for Fund shares sold | 1,208,284 |
| Receivable from affiliate | 19,318 |
| Total assets | $211,590,959 |
| Liabilities | |
| Payable for Fund shares redeemed | $ 299,875 |
| Distributions payable | 2,010 |
| Payable to affiliates: | |
| Distribution and service fees | 2,738 |
| Trustees' fees | 125 |
| Accrued expenses | 59,936 |
| Total liabilities | $ 364,684 |
| Net Assets | $211,226,275 |
| Sources of Net Assets | |
| Paid-in capital | $ 238,595,713 |
| Accumulated loss | (27,369,438) |
| Net Assets | $211,226,275 |
| Class A Shares | |
| Net Assets | $ 13,225,614 |
| Shares Outstanding | 1,572,122 |
Net Asset Value and Redemption Price Per Share
(net assets ÷ shares of beneficial interest outstanding) | $ 8.41 |
Maximum Offering Price Per Share
(100 ÷ 96.75 of net asset value per share) | $ 8.69 |
| Class I Shares | |
| Net Assets | $ 198,000,661 |
| Shares Outstanding | 23,573,306 |
Net Asset Value, Offering Price and Redemption Price Per Share
(net assets ÷ shares of beneficial interest outstanding) | $ 8.40 |
| On sales of $100,000 or more, the offering price of Class A shares is reduced. |
7
See Notes to Financial Statements.
Eaton Vance
Core Bond Fund
December 31, 2022
| | Year Ended |
| | December 31, 2022 |
| Investment Income | |
| Dividend income allocated from Portfolio (net of foreign taxes withheld of $3,396) | $ 122,091 |
| Interest income allocated from Portfolio | 4,777,125 |
| Expenses allocated from Portfolio | (784,575) |
| Total investment income from Portfolio | $ 4,114,641 |
| Expenses | |
| Distribution and service fees: | |
| Class A | $ 35,059 |
| Trustees’ fees and expenses | 500 |
| Custodian fee | 19,999 |
| Transfer and dividend disbursing agent fees | 47,077 |
| Legal and accounting services | 37,957 |
| Printing and postage | 11,471 |
| Registration fees | 39,180 |
| Miscellaneous | 9,633 |
| Total expenses | $ 200,876 |
| Deduct: | |
| Allocation of expenses to affiliate | $ 165,793 |
| Total expense reductions | $ 165,793 |
| Net expenses | $ 35,083 |
| Net investment income | $ 4,079,558 |
| Realized and Unrealized Gain (Loss) from Portfolio | |
| Net realized gain (loss): | |
| Investment transactions | $ (5,251,665) |
| Futures contracts | (1,757,258) |
| Net realized loss | $ (7,008,923) |
| Change in unrealized appreciation (depreciation): | |
| Investments | $ (19,568,038) |
| Futures contracts | 107,630 |
| Net change in unrealized appreciation (depreciation) | $(19,460,408) |
| Net realized and unrealized loss | $(26,469,331) |
| Net decrease in net assets from operations | $(22,389,773) |
8
See Notes to Financial Statements.
Eaton Vance
Core Bond Fund
December 31, 2022
Statements of Changes in Net Assets
| | Year Ended December 31, |
| | 2022 | 2021 |
| Increase (Decrease) in Net Assets | | |
| From operations: | | |
| Net investment income | $ 4,079,558 | $ 2,987,064 |
| Net realized gain (loss) | (7,008,923) | 2,223,449 |
| Net change in unrealized appreciation (depreciation) | (19,460,408) | (4,167,035) |
| Net increase (decrease) in net assets from operations | $ (22,389,773) | $ 1,043,478 |
| Distributions to shareholders: | | |
| Class A | $ (371,328) | $ (604,619) |
| Class I | (4,410,863) | (4,330,652) |
| Total distributions to shareholders | $ (4,782,191) | $ (4,935,271) |
| Transactions in shares of beneficial interest: | | |
| Class A | $ (1,658,885) | $ (3,832,515) |
| Class I | 115,964,665 | (29,778,888) |
| Net increase (decrease) in net assets from Fund share transactions | $114,305,780 | $ (33,611,403) |
| Net increase (decrease) in net assets | $ 87,133,816 | $ (37,503,196) |
| Net Assets | | |
| At beginning of year | $ 124,092,459 | $ 161,595,655 |
| At end of year | $211,226,275 | $124,092,459 |
9
See Notes to Financial Statements.
Eaton Vance
Core Bond Fund
December 31, 2022
| | Class A |
| | Year Ended December 31, |
| | 2022 | 2021 | 2020 | 2019 | 2018 |
| Net asset value — Beginning of year | $ 9.970 | $10.260 | $ 10.010 | $ 9.490 | $ 9.840 |
| Income (Loss) From Operations | | | | | |
| Net investment income(1) | $ 0.201 | $ 0.184 | $ 0.226 | $ 0.260 | $ 0.273 |
| Net realized and unrealized gain (loss) | (1.522) | (0.148) | 0.550 | 0.587 | (0.338) |
| Total income (loss) from operations | $ (1.321) | $ 0.036 | $ 0.776 | $ 0.847 | $ (0.065) |
| Less Distributions | | | | | |
| From net investment income | $ (0.226) | $ (0.205) | $ (0.249) | $ (0.278) | $ (0.285) |
| From net realized gain | (0.013) | (0.121) | (0.277) | (0.049) | — |
| Total distributions | $ (0.239) | $ (0.326) | $ (0.526) | $ (0.327) | $ (0.285) |
| Net asset value — End of year | $ 8.410 | $ 9.970 | $10.260 | $10.010 | $ 9.490 |
| Total Return(2)(3) | (13.33)% | 0.36% | 7.88% | 9.00% | (0.64)% |
| Ratios/Supplemental Data | | | | | |
| Net assets, end of year (000’s omitted) | $13,226 | $17,409 | $ 21,770 | $ 28,309 | $25,158 |
| Ratios (as a percentage of average daily net assets):(4) | | | | | |
| Expenses (3) | 0.74% (5) | 0.74% | 0.74% | 0.74% | 0.74% |
| Net investment income | 2.25% | 1.81% | 2.23% | 2.63% | 2.85% |
| Portfolio Turnover of the Portfolio | 102% | 122% | 93% | 89% | 65% |
| (1) | Computed using average shares outstanding. |
| (2) | Returns are historical and are calculated by determining the percentage change in net asset value with all distributions reinvested and do not reflect the effect of sales charges. |
| (3) | The investment adviser of the Portfolio and/or the administrator reimbursed certain operating expenses (equal to 0.12%, 0.12%, 0.12%, 0.11% and 0.11% of average daily net assets for the years ended December 31, 2022, 2021, 2020, 2019 and 2018, respectively). Absent this reimbursement, total return would be lower. |
| (4) | Includes the Fund’s share of the Portfolio’s allocated expenses. |
| (5) | Includes a reduction by the investment adviser of a portion of the Portfolio’s adviser fee due to the Portfolio’s investment in the Liquidity Fund (equal to less than 0.005% of average daily net assets for the year ended December 31, 2022). |
10
See Notes to Financial Statements.
Eaton Vance
Core Bond Fund
December 31, 2022
Financial Highlights — continued
| | Class I |
| | Year Ended December 31, |
| | 2022 | 2021 | 2020 | 2019 | 2018 |
| Net asset value — Beginning of year | $ 9.960 | $ 10.240 | $ 9.990 | $ 9.470 | $ 9.830 |
| Income (Loss) From Operations | | | | | |
| Net investment income(1) | $ 0.227 | $ 0.209 | $ 0.251 | $ 0.283 | $ 0.282 |
| Net realized and unrealized gain (loss) | (1.526) | (0.138) | 0.550 | 0.588 | (0.333) |
| Total income (loss) from operations | $ (1.299) | $ 0.071 | $ 0.801 | $ 0.871 | $ (0.051) |
| Less Distributions | | | | | |
| From net investment income | $ (0.248) | $ (0.230) | $ (0.274) | $ (0.302) | $ (0.309) |
| From net realized gain | (0.013) | (0.121) | (0.277) | (0.049) | — |
| Total distributions | $ (0.261) | $ (0.351) | $ (0.551) | $ (0.351) | $ (0.309) |
| Net asset value — End of year | $ 8.400 | $ 9.960 | $ 10.240 | $ 9.990 | $ 9.470 |
| Total Return(2)(3) | (13.13)% | 0.71% | 8.16% | 9.29% | (0.50)% |
| Ratios/Supplemental Data | | | | | |
| Net assets, end of year (000’s omitted) | $198,001 | $106,684 | $139,826 | $177,519 | $149,220 |
| Ratios (as a percentage of average daily net assets):(4) | | | | | |
| Expenses (3) | 0.49% (5) | 0.49% | 0.49% | 0.49% | 0.49% |
| Net investment income | 2.57% | 2.06% | 2.47% | 2.87% | 2.95% |
| Portfolio Turnover of the Portfolio | 102% | 122% | 93% | 89% | 65% |
| (1) | Computed using average shares outstanding. |
| (2) | Returns are historical and are calculated by determining the percentage change in net asset value with all distributions reinvested. |
| (3) | The investment adviser of the Portfolio and/or the administrator reimbursed certain operating expenses (equal to 0.12%, 0.12%, 0.12%, 0.11% and 0.11% of average daily net assets for the years ended December 31, 2022, 2021, 2020, 2019 and 2018, respectively). Absent this reimbursement, total return would be lower. |
| (4) | Includes the Fund’s share of the Portfolio’s allocated expenses. |
| (5) | Includes a reduction by the investment adviser of a portion of the Portfolio’s adviser fee due to the Portfolio’s investment in the Liquidity Fund (equal to less than 0.005% of average daily net assets for the year ended December 31, 2022). |
11
See Notes to Financial Statements.
Eaton Vance
Core Bond Fund
December 31, 2022
Notes to Financial Statements
1 Significant Accounting Policies
Eaton Vance Core Bond Fund (the Fund) is a diversified series of Eaton Vance Special Investment Trust (the Trust). The Trust is a Massachusetts business trust registered under the Investment Company Act of 1940, as amended (the 1940 Act), as an open-end management investment company. The Fund offers two classes of shares. Class A shares are generally sold subject to a sales charge imposed at time of purchase. Class I shares are sold at net asset value and are not subject to a sales charge. Each class represents a pro-rata interest in the Fund, but votes separately on class-specific matters and (as noted below) is subject to different expenses. Realized and unrealized gains and losses are allocated daily to each class of shares based on the relative net assets of each class to the total net assets of the Fund. Net investment income, other than class-specific expenses, is allocated daily to each class of shares based upon the ratio of the value of each class’s paid shares to the total value of all paid shares. Each class of shares differs in its distribution plan and certain other class-specific expenses. The Fund invests all of its investable assets in interests in Core Bond Portfolio (the Portfolio), a Massachusetts business trust, having the same investment objectives and policies as the Fund. The value of the Fund’s investment in the Portfolio reflects the Fund’s proportionate interest in the net assets of the Portfolio (36.8% at December 31, 2022). The performance of the Fund is directly affected by the performance of the Portfolio. The financial statements of the Portfolio, including the portfolio of investments, are included elsewhere in this report and should be read in conjunction with the Fund’s financial statements.
The following is a summary of significant accounting policies of the Fund. The policies are in conformity with accounting principles generally accepted in the United States of America (U.S. GAAP). The Fund is an investment company and follows accounting and reporting guidance in the Financial Accounting Standards Board (FASB) Accounting Standards Codification Topic 946.
A Investment Valuation—Valuation of securities by the Portfolio is discussed in Note 1A of the Portfolio's Notes to Financial Statements, which are included elsewhere in this report.
B Income—The Fund's net investment income or loss consists of the Fund's pro-rata share of the net investment income or loss of the Portfolio, less all actual and accrued expenses of the Fund.
C Federal Taxes—The Fund's policy is to comply with the provisions of the Internal Revenue Code applicable to regulated investment companies and to distribute to shareholders each year substantially all of its net investment income, and all or substantially all of its net realized capital gains. Accordingly, no provision for federal income or excise tax is necessary.
As of December 31, 2022, the Fund had no uncertain tax positions that would require financial statement recognition, de-recognition, or disclosure. The Fund files a U.S. federal income tax return annually after its fiscal year-end, which is subject to examination by the Internal Revenue Service for a period of three years from the date of filing.
D Expenses—The majority of expenses of the Trust are directly identifiable to an individual fund. Expenses which are not readily identifiable to a specific fund are allocated taking into consideration, among other things, the nature and type of expense and the relative size of the funds.
E Use of Estimates—The preparation of the financial statements in conformity with U.S. GAAP requires management to make estimates and assumptions that affect the reported amounts of assets and liabilities at the date of the financial statements and the reported amounts of income and expense during the reporting period. Actual results could differ from those estimates.
F Indemnifications—Under the Trust’s organizational documents, its officers and Trustees may be indemnified against certain liabilities and expenses arising out of the performance of their duties to the Fund. Under Massachusetts law, if certain conditions prevail, shareholders of a Massachusetts business trust (such as the Trust) could be deemed to have personal liability for the obligations of the Trust. However, the Trust’s Declaration of Trust contains an express disclaimer of liability on the part of Fund shareholders and the By-laws provide that the Trust shall assume, upon request by the shareholder, the defense on behalf of any Fund shareholders. Moreover, the By-laws also provide for indemnification out of Fund property of any shareholder held personally liable solely by reason of being or having been a shareholder for all loss or expense arising from such liability. Additionally, in the normal course of business, the Fund enters into agreements with service providers that may contain indemnification clauses. The Fund’s maximum exposure under these arrangements is unknown as this would involve future claims that may be made against the Fund that have not yet occurred.
G Other—Investment transactions are accounted for on a trade date basis.
2 Distributions to Shareholders and Income Tax Information
The Fund declares dividends daily to shareholders of record at the time of declaration. Distributions are generally paid monthly. Distributions of realized capital gains are made at least annually. Distributions are declared separately for each class of shares. Shareholders may reinvest income and capital gain distributions in additional shares of the same class of the Fund at the net asset value as of the reinvestment date or, at the election of the shareholder, receive distributions in cash. Distributions to shareholders are determined in accordance with income tax regulations, which may differ from U.S. GAAP. As required by U.S. GAAP, only distributions in excess of tax basis earnings and profits are reported in the financial statements as a return of capital. Permanent differences between book and tax accounting relating to distributions are reclassified to paid-in capital. For tax purposes, distributions from short-term capital gains are considered to be from ordinary income.
Eaton Vance
Core Bond Fund
December 31, 2022
Notes to Financial Statements — continued
The tax character of distributions declared for the years ended December 31, 2022 and December 31, 2021 was as follows:
| | Year Ended December 31, |
| | 2022 | 2021 |
| Ordinary income | $4,509,374 | $3,431,588 |
| Long-term capital gains | $ 272,817 | $1,503,683 |
During the year ended December 31, 2022, accumulated loss was decreased by $3,170 and paid-in capital was decreased by $3,170 due to differences between book and tax accounting. These reclassifications had no effect on the net assets or net asset value per share of the Fund.
As of December 31, 2022, the components of distributable earnings (accumulated loss) on a tax basis were as follows:
| Deferred capital losses | $ (7,269,091) |
| Net unrealized depreciation | (20,098,337) |
| Distributions payable | (2,010) |
| Accumulated loss | $(27,369,438) |
At December 31, 2022, the Fund, for federal income tax purposes, had deferred capital losses of $7,269,091 which would reduce its taxable income arising from future net realized gains on investment transactions, if any, to the extent permitted by the Internal Revenue Code, and thus would reduce the amount of distributions to shareholders, which would otherwise be necessary to relieve the Fund of any liability for federal income or excise tax. The deferred capital losses are treated as arising on the first day of the Fund’s next taxable year and retain the same short-term or long-term character as when originally deferred. Of the deferred capital losses at December 31, 2022, $3,159,857 are short-term and $4,109,234 are long-term.
3 Investment Adviser Fee and Other Transactions with Affiliates
The investment adviser fee is earned by Eaton Vance Management (EVM), an indirect, wholly-owned subsidiary of Morgan Stanley, as compensation for investment advisory services rendered to the Fund. The investment adviser fee is computed as a percentage of the Fund's average daily net assets that are not invested in other investment companies for which EVM or its affiliates serve as investment adviser and receive an advisory fee, at a per annum rate as follows and is payable monthly:
| Average Daily Net Assets | Annual Fee Rate |
| Up to $1 billion | 0.450% |
| $1 billion up to $2 billion | 0.425% |
| $2 billion up to $5 billion | 0.415% |
| $5 billion and over | 0.405% |
For the year ended December 31, 2022, the Fund incurred no investment adviser fee on such assets. To the extent the Fund’s assets are invested in the Portfolio, the Fund is allocated its share of the Portfolio’s investment adviser fee. The Portfolio has engaged Boston Management and Research (BMR) to render investment advisory services. See Note 2 of the Portfolio’s Notes to Financial Statements which are included elsewhere in this report. EVM also serves as the administrator of the Fund, but receives no compensation.
EVM has agreed to reimburse the Fund’s expenses to the extent that total annual operating expenses (relating to ordinary operating expenses only and excluding such expenses as borrowing costs, taxes or litigation expenses) exceed 0.74% and 0.49% of the Fund’s average daily net assets for Class A and Class I, respectively. This agreement may be changed or terminated after April 30, 2023. Pursuant to this agreement, EVM was allocated $165,793 of the Fund’s operating expenses for the year ended December 31, 2022.
EVM provides sub-transfer agency and related services to the Fund pursuant to a Sub-Transfer Agency Support Services Agreement. For the year ended December 31, 2022, EVM earned $6,864 from the Fund pursuant to such agreement, which is included in transfer and dividend disbursing agent fees on the Statement of Operations. The Fund was informed that Eaton Vance Distributors, Inc. (EVD), an affiliate of EVM and the Fund's principal underwriter, received $930 as its portion of the sales charge on sales of Class A shares for the year ended December 31, 2022. EVD also received distribution and service fees from Class A shares (see Note 4).
Eaton Vance
Core Bond Fund
December 31, 2022
Notes to Financial Statements — continued
Trustees and officers of the Fund who are members of EVM’s or BMR's organizations receive remuneration for their services to the Fund out of the investment adviser fee. Certain officers and Trustees of the Fund and the Portfolio are officers of the above organizations.
4 Distribution Plan
The Fund has in effect a distribution plan for Class A shares (Class A Plan) pursuant to Rule 12b-1 under the 1940 Act. Pursuant to the Class A Plan, the Fund pays EVD a distribution and service fee of 0.25% per annum of its average daily net assets attributable to Class A shares for distribution services and facilities provided to the Fund by EVD, as well as for personal services and/or the maintenance of shareholder accounts. Distribution and service fees paid or accrued to EVD for the year ended December 31, 2022 amounted to $35,059 for Class A shares.
Distribution and service fees are subject to the limitations contained in the Financial Industry Regulatory Authority Rule 2341(d).
5 Contingent Deferred Sales Charges
Class A shares may be subject to a 0.75% (1% prior to April 29, 2022) contingent deferred sales charge (CDSC) if redeemed within 12 months (18 months prior to April 29, 2022) of purchase (depending on the circumstances of purchase). Generally, the CDSC is based upon the lower of the net asset value at date of redemption or date of purchase. No charge is levied on shares acquired by reinvestment of dividends or capital gain distributions. For the year ended December 31, 2022, the Fund was informed that EVD received no CDSCs paid by Class A shareholders.
6 Investment Transactions
For the year ended December 31, 2022, increases and decreases in the Fund's investment in the Portfolio aggregated $140,377,795 and $44,584,727, respectively.
7 Shares of Beneficial Interest
The Fund’s Declaration of Trust permits the Trustees to issue an unlimited number of full and fractional shares of beneficial interest (without par value). Such shares may be issued in a number of different series (such as the Fund) and classes. Transactions in Fund shares were as follows:
| | Year Ended
December 31, 2022 | | Year Ended
December 31, 2021 |
| | Shares | Amount | | Shares | Amount |
| Class A | | | | | |
| Sales | 315,964 | $ 2,716,860 | | 170,928 | $ 1,738,879 |
| Issued to shareholders electing to receive payments of distributions in Fund shares | 39,843 | 351,798 | | 56,919 | 573,920 |
| Redemptions | (529,023) | (4,727,543) | | (605,106) | (6,145,314) |
| Net decrease | (173,216) | $ (1,658,885) | | (377,259) | $ (3,832,515) |
| Class I | | | | | |
| Sales | 17,326,308 | $ 156,279,721 | | 2,900,652 | $ 29,318,252 |
| Issued to shareholders electing to receive payments of distributions in Fund shares | 504,807 | 4,405,405 | | 428,735 | 4,318,831 |
| Redemptions | (4,971,011) | (44,720,461) | | (6,271,622) | (63,415,971) |
| Net increase (decrease) | 12,860,104 | $115,964,665 | | (2,942,235) | $(29,778,888) |
At December 31, 2022, donor advised and pooled income funds (established and maintained by a public charity) managed by EVM owned in the aggregate 64.7% of the value of the outstanding shares of the Fund.
Eaton Vance
Core Bond Fund
December 31, 2022
Report of Independent Registered Public Accounting Firm
To the Trustees of Eaton Vance Special Investment Trust and Shareholders of Eaton Vance Core Bond Fund:
Opinion on the Financial Statements and Financial Highlights
We have audited the accompanying statement of assets and liabilities of Eaton Vance Core Bond Fund (the "Fund") (one of the funds constituting Eaton Vance Special Investment Trust), as of December 31, 2022, the related statement of operations for the year then ended, the statements of changes in net assets for each of the two years in the period then ended, the financial highlights for each of the five years in the period then ended, and the related notes. In our opinion, the financial statements and financial highlights present fairly, in all material respects, the financial position of the Fund as of December 31, 2022, and the results of its operations for the year then ended, the changes in its net assets for each of the two years in the period then ended, and the financial highlights for each of the five years in the period then ended, in conformity with accounting principles generally accepted in the United States of America.
Basis for Opinion
These financial statements and financial highlights are the responsibility of the Fund's management. Our responsibility is to express an opinion on the Fund's financial statements and financial highlights based on our audits. We are a public accounting firm registered with the Public Company Accounting Oversight Board (United States) (PCAOB) and are required to be independent with respect to the Fund in accordance with the U.S. federal securities laws and the applicable rules and regulations of the Securities and Exchange Commission and the PCAOB.
We conducted our audits in accordance with the standards of the PCAOB. Those standards require that we plan and perform the audit to obtain reasonable assurance about whether the financial statements and financial highlights are free of material misstatement, whether due to error or fraud. The Fund is not required to have, nor were we engaged to perform, an audit of its internal control over financial reporting. As part of our audits, we are required to obtain an understanding of internal control over financial reporting but not for the purpose of expressing an opinion on the effectiveness of the Fund’s internal control over financial reporting. Accordingly, we express no such opinion.
Our audits included performing procedures to assess the risks of material misstatement of the financial statements and financial highlights, whether due to error or fraud, and performing procedures that respond to those risks. Such procedures included examining, on a test basis, evidence regarding the amounts and disclosures in the financial statements and financial highlights. Our audits also included evaluating the accounting principles used and significant estimates made by management, as well as evaluating the overall presentation of the financial statements and financial highlights. We believe that our audits provide a reasonable basis for our opinion.
/s/ Deloitte & Touche LLP
Boston, Massachusetts
February 24, 2023
We have served as the auditor of one or more Eaton Vance investment companies since 1959.
Eaton Vance
Core Bond Fund
December 31, 2022
Federal Tax Information (Unaudited)
The Form 1099-DIV you received in February 2023 showed the tax status of all distributions paid to your account in calendar year 2022. Shareholders are advised to consult their own tax adviser with respect to the tax consequences of their investment in the Fund. As required by the Internal Revenue Code and/or regulations, shareholders must be notified regarding the status of qualified dividend income for individuals and 163(j) interest dividends.
Qualified Dividend Income. For the fiscal year ended December 31, 2022, the Fund designates approximately $34,443, or up to the maximum amount of such dividends allowable pursuant to the Internal Revenue Code, as qualified dividend income eligible for the reduced tax rate of 15%.
163(j) Interest Dividends. For the fiscal year ended December 31, 2022, the Fund designates 98.14% of distributions from net investment income as a 163(j) interest dividend.
Core Bond Portfolio
December 31, 2022
| Asset-Backed Securities — 10.0% |
| Security | Principal
Amount
(000's omitted) | Value |
| Adams Outdoor Advertising, L.P., Series 2018-1, Class A, 4.81%, 11/15/48(1) | $ | 651 | $ 618,243 |
| CNH Equipment Trust, Series 2022-B, Class A2, 3.94%, 12/15/25 | | 410 | 405,024 |
| Coinstar Funding, LLC, Series 2017-1A, Class A2, 5.216%, 4/25/47(1) | | 1,213 | 932,664 |
| Conn's Receivables Funding, LLC: | | | |
| Series 2021-A, Class A, 1.05%, 5/15/26(1) | | 2 | 1,941 |
| Series 2021-A, Class B, 2.87%, 5/15/26(1) | | 1,260 | 1,237,909 |
| Series 2022-A, Class C, 0.00%, 12/15/26(1) | | 2,100 | 1,519,398 |
| DataBank Issuer, Series 2021-2A, Class A2, 2.40%, 10/25/51(1) | | 1,186 | 1,028,825 |
| DB Master Finance, LLC, Series 2017-1A, Class A2II, 4.03%, 11/20/47(1) | | 324 | 295,489 |
| Diamond Infrastructure Funding, LLC: | | | |
| Series 2021-1A, Class A, 1.76%, 4/15/49(1) | | 3,760 | 3,088,045 |
| Series 2021-1A, Class C, 3.475%, 4/15/49(1) | | 313 | 243,672 |
| Driven Brands Funding, LLC, Series 2018-1A, Class A2, 4.739%, 4/20/48(1) | | 1,108 | 1,033,414 |
| FMC GMSR Issuer Trust, Series 2021-GT2, Class A, 3.85%, 10/25/26(1)(2) | | 1,225 | 985,860 |
| FOCUS Brands Funding, LLC, Series 2017-1A, Class A2II, 5.093%, 4/30/47(1) | | 945 | 833,652 |
| Horizon Aircraft Finance III, Ltd., Series 2019-2, Class A, 3.425%, 11/15/39(1) | | 1,433 | 1,111,686 |
| Jersey Mike's Funding, Series 2019-1A, Class A2, 4.433%, 2/15/50(1) | | 1,031 | 929,901 |
| JPMorgan Chase Bank, NA: | | | |
| Series 2021-2, Class B, 0.889%, 12/26/28(1) | | 838 | 801,438 |
| Series 2021-3, Class B, 0.76%, 2/26/29(1) | | 762 | 718,838 |
| Lendingpoint Asset Securitization Trust: | | | |
| Series 2022-A, Class A, 1.68%, 6/15/29(1) | | 465 | 459,925 |
| Series 2022-C, Class A, 6.56%, 2/15/30(1) | | 2,478 | 2,467,697 |
| Lunar Aircraft, Ltd., Series 2020-1A, Class B, 4.335%, 2/15/45(1) | | 300 | 192,894 |
| Neighborly Issuer, LLC, Series 2021-1A, Class A2, 3.584%, 4/30/51(1) | | 1,349 | 1,085,376 |
| NRZ Excess Spread-Collateralized Notes, Series 2021-GNT1, Class A, 3.474%, 11/25/26(1) | | 1,845 | 1,632,235 |
| Oportun Funding XIV, LLC, Series 2021-A, Class B, 1.76%, 3/8/28(1) | | 419 | 388,283 |
| Oportun Issuance Trust: | | | |
| Series 2021-B, Class A, 1.47%, 5/8/31(1) | | 1,547 | 1,352,588 |
| Series 2021-C, Class A, 2.18%, 10/8/31(1) | | 4,685 | 4,103,363 |
| Pagaya AI Debt Selection Trust: | | | |
| Series 2021-2, 3.00%, 1/25/29(1) | | 887 | 826,660 |
| Series 2021-3, Class A, 1.15%, 5/15/29(1) | | 1,246 | 1,214,043 |
| Security | Principal
Amount
(000's omitted) | Value |
| Pagaya AI Debt Selection Trust: (continued) | | | |
| Series 2021-HG1, Class A, 1.22%, 1/16/29(1) | $ | 563 | $ 531,529 |
| Planet Fitness Master Issuer, LLC, Series 2019-1A, Class A2, 3.858%, 12/5/49(1) | | 1,009 | 831,637 |
| Santander Drive Auto Receivables Trust, Series 2022-5, Class A2, 3.98%, 1/15/25 | | 850 | 845,799 |
| ServiceMaster Funding, LLC: | | | |
| Series 2020-1, Class A2I, 2.841%, 1/30/51(1) | | 550 | 442,983 |
| Series 2020-1, Class A2II, 3.337%, 1/30/51(1) | | 642 | 483,145 |
| SERVPRO Master Issuer, LLC, Series 2019-1A, Class A2, 3.882%, 10/25/49(1) | | 3,636 | 3,235,526 |
| Sonic Capital, LLC, Series 2020-1A, Class A2I, 3.845%, 1/20/50(1) | | 1,787 | 1,593,031 |
| SpringCastle America Funding, LLC, Series 2020-AA, Class A, 1.97%, 9/25/37(1) | | 1,054 | 951,679 |
| Stack Infrastructure Issuer, LLC: | | | |
| Series 2019-1A, Class A2, 4.54%, 2/25/44(1) | | 8,573 | 8,370,151 |
| Series 2019-2A, Class A2, 3.08%, 10/25/44(1) | | 750 | 702,647 |
| Sunnova Helios V Issuer, LLC, Series 2021-A, Class A, 1.80%, 2/20/48(1) | | 242 | 197,370 |
| Sunnova Helios X Issuer, LLC, Series 2022-C, Class B, 5.60%, 11/22/49(1) | | 1,374 | 1,273,558 |
| Sunnova Sol II Issuer, LLC, Series 2020-2A, Class A, 2.73%, 11/1/55(1) | | 2,401 | 1,890,758 |
| Theorem Funding Trust, Series 2022-3A, Class A, 7.60%, 4/15/29(1) | | 762 | 759,479 |
| Towd Point Asset Trust, Series 2018-SL1, Class A, 4.989%, (1 mo. USD LIBOR + 0.60%), 1/25/46(1)(3) | | 1,235 | 1,227,718 |
| Vantage Data Centers Issuer, LLC: | | | |
| Series 2019-1A, Class A2, 3.188%, 7/15/44(1) | | 1,128 | 1,073,032 |
| Series 2020-2A, Class A2, 1.992%, 9/15/45(1) | | 2,220 | 1,828,560 |
| Series 2021-1A, Class A2, 2.165%, 10/15/46(1) | | 869 | 748,551 |
| Willis Engine Structured Trust V: | | | |
| Series 2020-A, Class B, 4.212%, 3/15/45(1) | | 891 | 616,839 |
| Series 2020-A, Class C, 6.657%, 3/15/45(1) | | 230 | 155,344 |
Total Asset-Backed Securities
(identified cost $63,917,467) | | | $ 57,268,399 |
| Collateralized Mortgage Obligations — 2.0% |
| Security | Principal
Amount
(000's omitted) | Value |
| Bellemeade Re, Ltd.: | | | |
| Series 2021-1A, Class M1A, 5.678%, (30-day average SOFR + 1.75%), 3/25/31(1)(3) | $ | 257 | $ 256,583 |
| Series 2021-1A, Class M1B, 6.128%, (30-day average SOFR + 2.20%), 3/25/31(1)(3) | | 390 | 385,567 |
17
See Notes to Financial Statements.
Core Bond Portfolio
December 31, 2022
Portfolio of Investments — continued
| Security | Principal
Amount
(000's omitted) | Value |
| Bellemeade Re, Ltd.: (continued) | | | |
| Series 2021-2A, Class M1A, 5.128%, (30-day average SOFR + 1.20%), 6/25/31(1)(3) | $ | 1,468 | $ 1,456,523 |
| Series 2021-3A, Class A2, 4.928%, (30-day average SOFR + 1.00%), 9/25/31(1)(3) | | 830 | 773,007 |
| Cascade MH Asset Trust, Series 2022-MH1, Class A, 4.25% to 4/25/40, 8/25/54(1)(4) | | 1,641 | 1,441,433 |
| Federal Home Loan Mortgage Corp. Structured Agency Credit Risk Debt Notes: | | | |
| Series 2018-DNA1, Class M2AT, 5.439%, (1 mo. USD LIBOR + 1.05%), 7/25/30(3) | | 140 | 139,691 |
| Series 2019-DNA4, Class M2, 6.339%, (1 mo. USD LIBOR + 1.95%), 10/25/49(1)(3) | | 94 | 94,409 |
| Series 2021-DNA3, Class M1, 4.678%, (30-day average SOFR + 0.75%), 10/25/33(1)(3) | | 438 | 435,690 |
| Series 2022-DNA2, Class M1A, 5.228%, (30-day average SOFR + 1.30%), 2/25/42(1)(3) | | 1,094 | 1,083,838 |
| Federal National Mortgage Association: | | | |
| Series 2005-58, Class MA, 5.50%, 7/25/35 | | 71 | 72,324 |
| Series 2011-135, Class PK, 4.50%, 5/25/40 | | 37 | 37,110 |
| Series 2013-6, Class HD, 1.50%, 12/25/42 | | 54 | 49,953 |
| Series 2014-70, Class KP, 3.50%, 3/25/44 | | 333 | 318,369 |
| Federal National Mortgage Association Connecticut Avenue Securities: | | | |
| Series 2013-C01, Class M2, 9.639%, (1 mo. USD LIBOR + 5.25%), 10/25/23(3) | | 465 | 478,531 |
| Series 2014-C02, Class 2M2, 6.989%, (1 mo. USD LIBOR + 2.60%), 5/25/24(3) | | 182 | 182,597 |
| Series 2014-C03, Class 2M2, 7.289%, (1 mo. USD LIBOR + 2.90%), 7/25/24(3) | | 289 | 291,644 |
| Series 2018-R07, Class 1M2, 6.789%, (1 mo. USD LIBOR + 2.40%), 4/25/31(1)(3) | | 75 | 74,848 |
| Series 2019-R06, Class 2B1, 8.139%, (1 mo. USD LIBOR + 3.75%), 9/25/39(1)(3) | | 2,988 | 2,945,447 |
| Home Re, Ltd., Series 2021-1, Class M1B, 5.939%, (1 mo. USD LIBOR + 1.55%), 7/25/33(1)(3) | | 745 | 741,144 |
Total Collateralized Mortgage Obligations
(identified cost $11,475,202) | | | $ 11,258,708 |
| Commercial Mortgage-Backed Securities — 10.3% |
| Security | Principal
Amount
(000's omitted) | Value |
| BAMLL Commercial Mortgage Securities Trust: | | | |
| Series 2019-BPR, Class DNM, 3.719%, 11/5/32(1)(2) | $ | 3,325 | $ 2,621,349 |
| Series 2019-BPR, Class FNM, 3.719%, 11/5/32(1)(2) | | 1,635 | 1,126,425 |
| BX Commercial Mortgage Trust: | | | |
| Series 2019-XL, Class A, 5.37%, (1 mo. USD LIBOR + 0.92%), 10/15/36(1)(3) | | 2,499 | 2,469,720 |
| Series 2019-XL, Class B, 5.53%, (1 mo. USD LIBOR + 1.08%), 10/15/36(1)(3) | | 1,122 | 1,103,194 |
| Security | Principal
Amount
(000's omitted) | Value |
| BX Commercial Mortgage Trust: (continued) | | | |
| Series 2021-VOLT, Class B, 5.268%, (1 mo. USD LIBOR + 0.95%), 9/15/36(1)(3) | $ | 3,103 | $ 2,932,001 |
| Series 2021-VOLT, Class C, 5.418%, (1 mo. USD LIBOR + 1.10%), 9/15/36(1)(3) | | 1,461 | 1,375,525 |
| Series 2021-VOLT, Class D, 5.968%, (1 mo. USD LIBOR + 1.65%), 9/15/36(1)(3) | | 1,074 | 1,007,496 |
| CFCRE Commercial Mortgage Trust: | | | |
| Series 2016-C7, Class C, 4.386%, 12/10/54(2) | | 1,250 | 1,045,197 |
| Series 2016-C7, Class D, 4.386%, 12/10/54(1)(2) | | 2,000 | 1,491,941 |
| Citigroup Commercial Mortgage Trust, Series 2013-GC11, Class C, 4.134%, 4/10/46(2) | | 97 | 96,146 |
| COMM Mortgage Trust: | | | |
| Series 2013-CR11, Class B, 5.111%, 8/10/50(2) | | 2,855 | 2,736,999 |
| Series 2014-CR21, Class C, 4.418%, 12/10/47(2) | | 2,500 | 2,247,519 |
| CSMC Trust, Series 2016-NXSR, Class C, 4.448%, 12/15/49(2) | | 1,775 | 1,379,912 |
| Extended Stay America Trust: | | | |
| Series 2021-ESH, Class A, 5.398%, (1 mo. USD LIBOR + 1.08%), 7/15/38(1)(3) | | 486 | 472,860 |
| Series 2021-ESH, Class C, 6.018%, (1 mo. USD LIBOR + 1.70%), 7/15/38(1)(3) | | 2,673 | 2,571,368 |
| Federal National Mortgage Association: | | | |
| Series 2018-M4, Class A2, 3.056%, 3/25/28(2) | | 576 | 536,794 |
| Series 2019-M1, Class A2, 3.547%, 9/25/28(2) | | 2,491 | 2,393,461 |
| Series 2020-M1, Class A2, 2.444%, 10/25/29 | | 4,434 | 3,887,962 |
| Federal National Mortgage Association Multifamily Connecticut Avenue Securities Trust, Series 2020-01, Class M10, 8.139%, (1 mo. USD LIBOR + 3.75%), 3/25/50(1)(3) | | 1,260 | 1,168,517 |
| Hawaii Hotel Trust, Series 2019-MAUI, Class A, 5.468%, (1 mo. USD LIBOR + 1.15%), 5/15/38(1)(3) | | 4,033 | 3,923,126 |
| JPMBB Commercial Mortgage Securities Trust: | | | |
| Series 2014-C22, Class D, 4.547%, 9/15/47(1)(2) | | 990 | 736,840 |
| Series 2014-C23, Class D, 3.984%, 9/15/47(1)(2) | | 2,000 | 1,706,628 |
| Series 2014-C25, Class D, 3.936%, 11/15/47(1)(2) | | 1,960 | 1,349,149 |
| JPMorgan Chase Commercial Mortgage Securities Trust: | | | |
| Series 2013-C13, Class D, 4.122%, 1/15/46(1)(2) | | 2,000 | 1,920,619 |
| Series 2021-MHC, Class C, 5.618%, (1 mo. USD LIBOR + 1.30%), 4/15/38(1)(3) | | 2,425 | 2,329,312 |
| Morgan Stanley Bank of America Merrill Lynch Trust, Series 2016-C29, Class C, 4.722%, 5/15/49(2)(5) | | 993 | 875,452 |
| Morgan Stanley Capital I Trust: | | | |
| Series 2016-UBS12, Class D, 3.312%, 12/15/49(1)(5) | | 1,745 | 927,474 |
| Series 2019-BPR, Class A, 5.968%, (1 mo. USD LIBOR + 1.65%), 5/15/36(1)(3)(5) | | 2,210 | 2,115,737 |
18
See Notes to Financial Statements.
Core Bond Portfolio
December 31, 2022
Portfolio of Investments — continued
| Security | Principal
Amount
(000's omitted) | Value |
| Natixis Commercial Mortgage Securities Trust, Series 2018-FL1, Class C, 6.518%, (1 mo. USD LIBOR + 2.20%), 6/15/35(1)(3) | $ | 5,000 | $ 4,470,146 |
| SLG Office Trust, Series 2021-OVA, Class A, 2.585%, 7/15/41(1) | | 2,427 | 1,942,145 |
| VMC Finance, LLC: | | | |
| Series 2021-HT1, Class A, 5.989%, (1 mo. USD LIBOR + 1.65%), 1/18/37(1)(3) | | 1,484 | 1,436,612 |
| Series 2021-HT1, Class B, 8.839%, (1 mo. USD LIBOR + 4.50%), 1/18/37(1)(3) | | 2,000 | 1,875,986 |
| Wells Fargo Commercial Mortgage Trust, Series 2016-C35, Class D, 3.142%, 7/15/48(1) | | 500 | 362,406 |
Total Commercial Mortgage-Backed Securities
(identified cost $64,859,074) | | | $ 58,636,018 |
| Security | Principal
Amount
(000's omitted) | Value |
| Aerospace & Defense — 0.2% |
| Delta Air Lines, Inc./SkyMiles IP, Ltd., 4.75%, 10/20/28(1) | $ | 1,436 | $ 1,352,008 |
| | | | $ 1,352,008 |
| Auto Manufacturers — 0.5% |
| General Motors Co., 5.60%, 10/15/32 | $ | 1,503 | $ 1,400,562 |
| General Motors Financial Co., Inc., 4.30%, 4/6/29 | | 1,702 | 1,527,891 |
| | | | $ 2,928,453 |
| Automotive & Auto Parts — 0.1% |
| Aptiv PLC/Aptiv Corp., 3.25%, 3/1/32 | $ | 526 | $ 431,618 |
| | | | $ 431,618 |
| Banks — 14.2% |
| Australia & New Zealand Banking Group, Ltd., 2.95% to 7/22/25, 7/22/30(1)(6) | $ | 903 | $ 817,161 |
| Banco Safra S.A., 4.125%, 2/8/23(1) | | 1,210 | 1,208,633 |
| Banco Santander S.A.: | | | |
| 1.722% to 9/14/26, 9/14/27(6) | | 1,200 | 1,026,489 |
| 5.294%, 8/18/27 | | 1,400 | 1,369,205 |
| Bank of America Corp.: | | | |
| 1.734% to 7/22/26, 7/22/27(6) | | 5,076 | 4,453,408 |
| 1.898% to 7/23/30, 7/23/31(6) | | 1,020 | 785,079 |
| 1.922% to 10/24/30, 10/24/31(6) | | 831 | 636,646 |
| 2.087% to 6/14/28, 6/14/29(6) | | 1,881 | 1,586,165 |
| Security | Principal
Amount
(000's omitted) | Value |
| Banks (continued) |
| Bank of America Corp.: (continued) | | | |
| 2.299% to 7/21/31, 7/21/32(6) | $ | 2,050 | $ 1,583,648 |
| 2.456% to 10/22/24, 10/22/25(6) | | 482 | 455,749 |
| 2.551% to 2/4/27, 2/4/28(6) | | 1,250 | 1,111,991 |
| 3.824% to 1/20/27, 1/20/28(6) | | 1,639 | 1,531,723 |
| 3.846% to 3/8/32, 3/8/37(6) | | 3,289 | 2,731,943 |
| 6.204% to 11/10/27, 11/10/28(6) | | 1,272 | 1,315,590 |
| BankUnited, Inc., 5.125%, 6/11/30 | | 466 | 432,766 |
| Barclays PLC: | | | |
| 2.852% to 5/7/25, 5/7/26(6) | | 1,281 | 1,191,437 |
| 4.836%, 5/9/28 | | 2,125 | 1,963,007 |
| BBVA Bancomer S.A./Texas: | | | |
| 1.875%, 9/18/25(1) | | 1,165 | 1,057,785 |
| 5.125% to 1/18/28, 1/18/33(1)(6) | | 1,000 | 899,231 |
| BNP Paribas S.A.: | | | |
| 7.75% to 8/16/29(1)(6)(7) | | 787 | 779,130 |
| 9.25% to 11/17/27(1)(6)(7) | | 634 | 662,560 |
| BPCE S.A., 3.648% to 1/14/32, 1/14/37(1)(6) | | 1,452 | 1,088,643 |
| Capital One Financial Corp., 3.273% to 3/1/29, 3/1/30(6) | | 909 | 778,925 |
| Citigroup, Inc.: | | | |
| 2.572%, (SOFR + 2.107%), 6/3/31(3) | | 2,328 | 1,888,000 |
| 3.106% to 4/8/25, 4/8/26(6) | | 1,447 | 1,370,931 |
| 3.70%, 1/12/26 | | 1,524 | 1,467,691 |
| 3.785% to 3/17/32, 3/17/33(6) | | 1,685 | 1,445,691 |
| 4.00% to 12/10/25(6)(7) | | 1,090 | 952,246 |
| 6.27% to 11/17/32, 11/17/33(6) | | 2,376 | 2,458,703 |
| Discover Bank, 4.682% to 8/9/23, 8/9/28(6) | | 1,117 | 1,072,328 |
| Federation des Caisses Desjardins du Quebec, 4.40%, 8/23/25(1) | | 2,222 | 2,169,993 |
| Goldman Sachs Group, Inc. (The): | | | |
| 1.948% to 10/21/26, 10/21/27(6) | | 2,188 | 1,916,009 |
| 3.75%, 2/25/26 | | 970 | 934,832 |
| HSBC Holdings PLC: | | | |
| 2.251% to 11/22/26, 11/22/27(6) | | 1,552 | 1,346,133 |
| 2.357% to 8/18/30, 8/18/31(6) | | 982 | 752,440 |
| 7.39% to 11/3/27, 11/3/28(6) | | 2,670 | 2,810,783 |
| International Bank for Reconstruction & Development, 3.829%, (SOFR + 0.13%), 1/13/23(3) | | 2,756 | 2,756,015 |
| Intesa Sanpaolo SpA: | | | |
| 7.00%, 11/21/25(1) | | 469 | 478,836 |
| 8.248% to 11/21/32, 11/21/33(1)(6) | | 1,155 | 1,175,022 |
| JPMorgan Chase & Co.: | | | |
| 1.47% to 9/22/26, 9/22/27(6) | | 1,591 | 1,379,460 |
| 2.739% to 10/15/29, 10/15/30(6) | | 3,095 | 2,602,031 |
| 4.586% to 4/26/32, 4/26/33(6) | | 1,198 | 1,112,497 |
19
See Notes to Financial Statements.
Core Bond Portfolio
December 31, 2022
Portfolio of Investments — continued
| Security | Principal
Amount
(000's omitted) | Value |
| Banks (continued) |
| JPMorgan Chase & Co.: (continued) | | | |
| 4.851% to 7/25/27, 7/25/28(6) | $ | 2,301 | $ 2,246,754 |
| Macquarie Bank, Ltd., 3.624%, 6/3/30(1) | | 762 | 617,742 |
| National Bank of Canada, 0.55% to 11/15/23, 11/15/24(6) | | 1,294 | 1,238,929 |
| NatWest Group PLC, 7.472% to 11/10/25, 11/10/26(6) | | 1,147 | 1,194,841 |
| PPTT, 2006-A GS, Class A, 2.764%(1)(7)(8) | | 259 | 191,038 |
| Santander Holdings USA, Inc.: | | | |
| 3.45%, 6/2/25 | | 1,788 | 1,705,383 |
| 4.50%, 7/17/25 | | 712 | 696,746 |
| Santander UK Group Holdings PLC, 6.833% to 11/21/25, 11/21/26(6) | | 1,193 | 1,209,720 |
| Societe Generale S.A.: | | | |
| 6.221% to 6/15/32, 6/15/33(1)(6) | | 975 | 914,553 |
| 9.375% to 11/22/27(1)(6)(7) | | 756 | 777,707 |
| Standard Chartered PLC: | | | |
| 1.456% to 1/14/26, 1/14/27(1)(6) | | 808 | 701,586 |
| 1.822% to 11/23/24, 11/23/25(1)(6) | | 929 | 849,135 |
| Synchrony Bank, 5.625%, 8/23/27 | | 1,486 | 1,450,435 |
| Synovus Bank/Columbus, GA, 4.00% to 10/29/25, 10/29/30(6) | | 940 | 872,981 |
| Texas Capital Bancshares, Inc., 4.00% to 5/6/26, 5/6/31(6) | | 655 | 582,133 |
| Toronto-Dominion Bank (The), 8.125% to 10/31/27, 10/31/82(6) | | 1,975 | 2,058,938 |
| Truist Financial Corp., 5.10% to 3/1/30(6)(7) | | 1,427 | 1,327,110 |
| UBS AG, 1.25%, 6/1/26(1) | | 1,442 | 1,261,902 |
| UBS Group AG, 2.095% to 2/11/31, 2/11/32(1)(6) | | 1,652 | 1,247,505 |
| Westpac Banking Corp., 3.02% to 11/18/31, 11/18/36(6) | | 867 | 646,578 |
| | | | $ 81,348,271 |
| Beverages — 0.1% |
| Coca-Cola Europacific Partners PLC, 1.50%, 1/15/27(1) | $ | 541 | $ 468,645 |
| | | | $ 468,645 |
| Building Materials — 0.2% |
| Owens Corning, 3.95%, 8/15/29 | $ | 1,441 | $ 1,312,773 |
| | | | $ 1,312,773 |
| Chemicals — 0.7% |
| Alpek SAB de CV: | | | |
| 3.25%, 2/25/31(1) | $ | 1,200 | $ 1,001,636 |
| 4.25%, 9/18/29(1) | | 920 | 836,533 |
| Celanese US Holdings, LLC: | | | |
| 6.165%, 7/15/27 | | 894 | 883,210 |
| Security | Principal
Amount
(000's omitted) | Value |
| Chemicals (continued) |
| Celanese US Holdings, LLC: (continued) | | | |
| 6.33%, 7/15/29 | $ | 1,090 | $ 1,061,414 |
| | | | $ 3,782,793 |
| Commercial Services — 0.8% |
| Ashtead Capital, Inc., 4.25%, 11/1/29(1) | $ | 1,752 | $ 1,574,162 |
| Block Financial, LLC, 3.875%, 8/15/30 | | 1,362 | 1,194,802 |
| Ford Foundation (The), 2.415%, 6/1/50 | | 650 | 411,912 |
| Western Union Co. (The), 6.20%, 11/17/36 | | 1,275 | 1,272,944 |
| | | | $ 4,453,820 |
| Computers — 0.7% |
| DXC Technology Co., 2.375%, 9/15/28 | $ | 639 | $ 539,060 |
| Kyndryl Holdings, Inc., 2.05%, 10/15/26 | | 1,472 | 1,202,753 |
| Seagate HDD Cayman: | | | |
| 4.091%, 6/1/29 | | 332 | 275,722 |
| 5.75%, 12/1/34 | | 1,473 | 1,251,542 |
| 9.625%, 12/1/32(1) | | 666 | 730,870 |
| | | | $ 3,999,947 |
| Consumer Products — 0.3% |
| Natura & Co. Luxembourg Holdings S.a.r.l., 6.00%, 4/19/29(1) | $ | 1,029 | $ 901,845 |
| Natura Cosmeticos S.A., 4.125%, 5/3/28(1) | | 678 | 554,072 |
| | | | $ 1,455,917 |
| Diversified Financial Services — 2.4% |
| AerCap Ireland Capital DAC/AerCap Global Aviation Trust: | | | |
| 1.65%, 10/29/24 | $ | 221 | $ 203,999 |
| 4.50%, 9/15/23 | | 1,246 | 1,238,166 |
| 6.50%, 7/15/25 | | 742 | 752,555 |
| Affiliated Managers Group, Inc., 3.30%, 6/15/30 | | 1,136 | 941,911 |
| Air Lease Corp., 2.875%, 1/15/26 | | 700 | 648,447 |
| Ally Financial, Inc., 8.00%, 11/1/31 | | 1,285 | 1,330,062 |
| Bread Financial Holdings, Inc., 4.75%, 12/15/24(1) | | 1,140 | 1,012,683 |
| CI Financial Corp.: | | | |
| 3.20%, 12/17/30 | | 1,403 | 1,067,195 |
| 4.10%, 6/15/51 | | 1,468 | 869,902 |
| Ford Motor Credit Co., LLC, 7.35%, 11/4/27 | | 1,451 | 1,490,467 |
| KKR Group Finance Co. VII, LLC, 3.625%, 2/25/50(1) | | 1,350 | 931,386 |
| KKR Group Finance Co. X, LLC, 3.25%, 12/15/51(1) | | 420 | 267,591 |
| Rocket Mortgage, LLC/Rocket Mortgage Co.-Issuer, Inc.: | | | |
| 2.875%, 10/15/26(1) | | 226 | 194,103 |
| 3.875%, 3/1/31(1) | | 1,507 | 1,153,835 |
20
See Notes to Financial Statements.
Core Bond Portfolio
December 31, 2022
Portfolio of Investments — continued
| Security | Principal
Amount
(000's omitted) | Value |
| Diversified Financial Services (continued) |
| Stifel Financial Corp., 4.00%, 5/15/30 | $ | 1,408 | $ 1,224,315 |
| UniCredit SpA, 5.459% to 6/30/30, 6/30/35(1)(6) | | 611 | 497,604 |
| | | | $ 13,824,221 |
| Electric Utilities — 0.8% |
| AES Corp. (The), 2.45%, 1/15/31 | $ | 2,342 | $ 1,868,591 |
| Enel Finance International N.V., 1.375%, 7/12/26(1) | | 873 | 753,370 |
| ITC Holdings Corp., 4.05%, 7/1/23 | | 680 | 674,517 |
| NextEra Energy Capital Holdings, Inc., 1.90%, 6/15/28 | | 1,240 | 1,060,891 |
| NextEra Energy Operating Partners, L.P., 4.25%, 9/15/24(1) | | 38 | 35,526 |
| | | | $ 4,392,895 |
| Electrical and Electronic Equipment — 0.6% |
| Jabil, Inc.: | | | |
| 3.00%, 1/15/31 | $ | 1,956 | $ 1,623,766 |
| 3.60%, 1/15/30 | | 2,207 | 1,942,767 |
| | | | $ 3,566,533 |
| Entertainment — 0.5% |
| Magallanes, Inc., 5.141%, 3/15/52(1) | $ | 2,485 | $ 1,816,106 |
| Warnermedia Holdings, Inc., 5.05%, 3/15/42(1) | | 1,000 | 768,625 |
| | | | $ 2,584,731 |
| Foods — 0.4% |
| JBS USA LUX S.A./JBS USA Food Co./JBS USA Finance, Inc., 3.75%, 12/1/31(1) | $ | 1,587 | $ 1,303,666 |
| Smithfield Foods, Inc.: | | | |
| 2.625%, 9/13/31(1) | | 1,120 | 803,805 |
| 3.00%, 10/15/30(1) | | 210 | 160,335 |
| | | | $ 2,267,806 |
| Health Care — 0.2% |
| Centene Corp.: | | | |
| 3.375%, 2/15/30 | $ | 784 | $ 664,538 |
| 4.25%, 12/15/27 | | 798 | 750,174 |
| | | | $ 1,414,712 |
| Insurance — 1.1% |
| GA Global Funding Trust, 2.25%, 1/6/27(1) | $ | 2,595 | $ 2,287,754 |
| Global Atlantic Fin Co., 3.125%, 6/15/31(1) | | 2,188 | 1,610,060 |
| Security | Principal
Amount
(000's omitted) | Value |
| Insurance (continued) |
| Liberty Mutual Group, Inc., 4.125% to 9/15/26, 12/15/51(1)(6) | $ | 1,466 | $ 1,196,197 |
| Stewart Information Services Corp., 3.60%, 11/15/31 | | 1,286 | 988,463 |
| | | | $ 6,082,474 |
| Lodging and Gaming — 0.1% |
| Hyatt Hotels Corp.: | | | |
| 1.30%, 10/1/23 | $ | 577 | $ 561,045 |
| 1.80%, 10/1/24 | | 237 | 222,227 |
| | | | $ 783,272 |
| Media — 1.3% |
| Charter Communications Operating, LLC/Charter Communications Operating Capital: | | | |
| 2.80%, 4/1/31 | $ | 2,110 | $ 1,647,499 |
| 4.80%, 3/1/50 | | 3,805 | 2,777,223 |
| Comcast Corp.: | | | |
| 2.887%, 11/1/51 | | 2,930 | 1,895,002 |
| 2.937%, 11/1/56 | | 832 | 518,327 |
| 4.25%, 1/15/33 | | 800 | 756,572 |
| | | | $ 7,594,623 |
| Oil and Gas — 0.4% |
| Patterson-UTI Energy, Inc., 5.15%, 11/15/29 | $ | 1,765 | $ 1,585,621 |
| South32 Treasury, Ltd., 4.35%, 4/14/32(1) | | 1,003 | 860,860 |
| | | | $ 2,446,481 |
| Other Revenue — 0.6% |
| BlueHub Loan Fund, Inc., 3.099%, 1/1/30 | $ | 3,160 | $ 2,742,130 |
| OneMain Finance Corp., 3.50%, 1/15/27 | | 1,146 | 950,286 |
| | | | $ 3,692,416 |
| Pharmaceuticals — 0.2% |
| Perrigo Finance Unlimited Co., 4.40%, 6/15/30 | $ | 1,214 | $ 1,036,000 |
| | | | $ 1,036,000 |
| Real Estate Investment Trusts (REITs) — 3.0% |
| American Assets Trust, L.P., 3.375%, 2/1/31 | $ | 1,170 | $ 930,678 |
| Corporate Office Properties, L.P., 2.90%, 12/1/33 | | 872 | 620,983 |
| Digital Realty Trust, L.P., 3.70%, 8/15/27 | | 1,272 | 1,182,404 |
| EPR Properties: | | | |
| 3.75%, 8/15/29 | | 1,474 | 1,156,764 |
| 4.50%, 6/1/27 | | 1,381 | 1,210,727 |
| 4.95%, 4/15/28 | | 332 | 283,783 |
| Extra Space Storage, L.P., 2.55%, 6/1/31 | | 1,011 | 793,389 |
21
See Notes to Financial Statements.
Core Bond Portfolio
December 31, 2022
Portfolio of Investments — continued
| Security | Principal
Amount
(000's omitted) | Value |
| Real Estate Investment Trusts (REITs) (continued) |
| HAT Holdings I, LLC/HAT Holdings II, LLC: | | | |
| 3.375%, 6/15/26(1) | $ | 1,436 | $ 1,249,593 |
| 3.75%, 9/15/30(1) | | 597 | 439,760 |
| Iron Mountain, Inc.: | | | |
| 4.50%, 2/15/31(1) | | 977 | 805,239 |
| 5.00%, 7/15/28(1) | | 339 | 305,083 |
| Life Storage, L.P., 2.40%, 10/15/31 | | 1,473 | 1,136,782 |
| Newmark Group, Inc., 6.125%, 11/15/23 | | 3,504 | 3,476,466 |
| Sabra Health Care, L.P., 3.20%, 12/1/31 | | 1,435 | 1,071,015 |
| SITE Centers Corp., 3.625%, 2/1/25 | | 874 | 825,596 |
| Sun Communities Operating, L.P.: | | | |
| 2.70%, 7/15/31 | | 455 | 360,241 |
| 4.20%, 4/15/32 | | 1,674 | 1,478,935 |
| | | | $ 17,327,438 |
| Retail — 0.5% |
| Bath & Body Works, Inc.: | | | |
| 6.625%, 10/1/30(1) | $ | 700 | $ 658,079 |
| 7.60%, 7/15/37 | | 524 | 443,637 |
| Dick's Sporting Goods, Inc., 4.10%, 1/15/52 | | 2,609 | 1,691,665 |
| | | | $ 2,793,381 |
| Technology — 0.1% |
| CDW, LLC/CDW Finance Corp., 3.276%, 12/1/28 | $ | 731 | $ 627,224 |
| | | | $ 627,224 |
| Telecommunications — 1.6% |
| AT&T, Inc.: | | | |
| 3.55%, 9/15/55 | $ | 5,662 | $ 3,803,394 |
| 3.65%, 6/1/51 | | 2,039 | 1,445,307 |
| Nokia Oyj: | | | |
| 4.375%, 6/12/27 | | 981 | 927,819 |
| 6.625%, 5/15/39 | | 1,492 | 1,418,797 |
| SES Global Americas Holdings GP, 5.30%, 3/25/44(1) | | 661 | 508,593 |
| SES S.A., 5.30%, 4/4/43(1) | | 393 | 301,156 |
| T-Mobile USA, Inc.: | | | |
| 2.25%, 11/15/31 | | 278 | 219,384 |
| 2.55%, 2/15/31 | | 646 | 529,296 |
| | | | $ 9,153,746 |
| Transportation — 0.2% |
| SMBC Aviation Capital Finance DAC, 3.55%, 4/15/24(1) | $ | 1,200 | $ 1,160,622 |
| | | | $ 1,160,622 |
| Security | Principal
Amount
(000's omitted) | Value |
| Utilities — 0.5% |
| Southern Co. (The), Series B, 4.00% to 10/15/25, 1/15/51(6) | $ | 1,704 | $ 1,554,900 |
| Southern Co. Gas Capital Corp., 2.45%, 10/1/23 | | 1,060 | 1,037,250 |
| | | | $ 2,592,150 |
Total Corporate Bonds
(identified cost $209,590,566) | | | $184,874,970 |
| Security | Shares | Value |
| Oil, Gas & Consumable Fuels — 0.1% |
| NuStar Energy, L.P., Series B, 10.41%, (3 mo. USD LIBOR + 5.643%)(3) | | 24,632 | $ 502,000 |
| | | | $ 502,000 |
| Real Estate Management & Development — 0.2% |
| Brookfield Property Partners, L.P., Series A, 5.75% | | 83,921 | $ 1,135,451 |
| | | | $ 1,135,451 |
| Telecommunications — 0.2% |
| United States Cellular Corp., 5.50% | | 83,925 | $ 1,218,591 |
| | | | $ 1,218,591 |
Total Preferred Stocks
(identified cost $4,713,246) | | | $ 2,856,042 |
| Senior Floating-Rate Loans — 0.5%(9) |
| Borrower/Description | Principal
Amount
(000's omitted) | Value |
| Diversified Telecommunication Services — 0.1% |
| CenturyLink, Inc., Term Loan, 6.634%, (1 mo. USD LIBOR + 2.25%), 3/15/27 | $ | 485 | $ 460,780 |
| | | | $ 460,780 |
| IT Services — 0.0%(10) |
| Asurion, LLC, Term Loan, 7.634%, (1 mo. USD LIBOR + 3.25%), 12/23/26 | $ | 245 | $ 218,706 |
| | | | $ 218,706 |
22
See Notes to Financial Statements.
Core Bond Portfolio
December 31, 2022
Portfolio of Investments — continued
| Borrower/Description | Principal
Amount
(000's omitted) | Value |
| Software — 0.2% |
| Hyland Software, Inc., Term Loan, 7.884%, (1 mo. USD LIBOR + 3.50%), 7/1/24 | $ | 593 | $ 586,170 |
| Seattle Spinco, Inc., Term Loan, 7.134%, (1 mo. USD LIBOR + 2.75%), 6/21/24 | | 291 | 290,429 |
| | | | $ 876,599 |
| Specialty Retail — 0.2% |
| PetSmart, Inc., Term Loan, 8.13%, (1 mo. USD LIBOR + 3.75%), 2/11/28 | $ | 1,290 | $ 1,268,429 |
| | | | $ 1,268,429 |
Total Senior Floating-Rate Loans
(identified cost $2,903,467) | | | $ 2,824,514 |
| Taxable Municipal Obligations — 1.5% |
| Security | Principal
Amount
(000's omitted) | Value |
| Special Tax Revenue — 0.2% |
| California Health Facilities Financing Authority, (No Place Like Home Program), 3.034%, 6/1/34 | $ | 1,430 | $ 1,167,023 |
| | | | $ 1,167,023 |
| Water and Sewer — 1.3% |
| Narragansett Bay Commission, RI, Wastewater System Revenue: | | | |
| Green Bonds, 2.094%, 9/1/30 | $ | 820 | $ 665,873 |
| Green Bonds, 2.184%, 9/1/31 | | 650 | 516,958 |
| Green Bonds, 2.264%, 9/1/32 | | 585 | 456,042 |
| Green Bonds, 2.344%, 9/1/33 | | 635 | 486,404 |
| San Francisco City and County Public Utilities Commission, CA, Water Revenue, Green Bonds, 3.303%, 11/1/39 | | 6,750 | 5,528,250 |
| | | | $ 7,653,527 |
Total Taxable Municipal Obligations
(identified cost $10,870,000) | | | $ 8,820,550 |
| U.S. Government Agency Mortgage-Backed Securities — 13.0% |
| Security | Principal
Amount
(000's omitted) | Value |
| Federal Home Loan Mortgage Corp.: | | | |
| Pool #A93547, 4.50%, 8/1/40 | $ | 326 | $ 323,376 |
| Pool #C03490, 4.50%, 8/1/40 | | 175 | 173,426 |
| Security | Principal
Amount
(000's omitted) | Value |
| Federal Home Loan Mortgage Corp.: (continued) | | | |
| Pool #C09031, 2.50%, 2/1/43 | $ | 671 | $ 584,729 |
| Pool #G07589, 5.50%, 6/1/41 | | 1,079 | 1,117,654 |
| Pool #G08596, 4.50%, 7/1/44 | | 262 | 259,545 |
| Pool #G08670, 3.00%, 10/1/45 | | 394 | 356,191 |
| Pool #G08701, 3.00%, 4/1/46 | | 524 | 472,283 |
| Pool #G60608, 4.00%, 5/1/46 | | 1,136 | 1,095,536 |
| Pool #G60761, 3.00%, 10/1/43 | | 708 | 643,383 |
| Pool #Q17453, 3.50%, 4/1/43 | | 688 | 645,138 |
| Pool #Q34310, 3.50%, 6/1/45 | | 416 | 389,627 |
| Pool #Q40264, 3.50%, 5/1/46 | | 380 | 355,182 |
| Pool #Q45051, 3.00%, 12/1/46 | | 1,414 | 1,274,316 |
| Pool #Q46889, 3.50%, 3/1/47 | | 922 | 864,774 |
| Pool #Q47999, 4.00%, 5/1/47 | | 1,145 | 1,104,805 |
| Pool #ZT0383, 3.50%, 3/1/48 | | 408 | 378,483 |
| Federal National Mortgage Association: | | | |
| 4.00%, 30-Year, TBA(11) | | 28,527 | 26,784,164 |
| 4.50%, 30-Year, TBA(11) | | 14,075 | 13,569,179 |
| 5.00%, 30-Year, TBA(11) | | 10,475 | 10,330,973 |
| 5.50%, 30-Year, TBA(11) | | 2,150 | 2,156,720 |
| Pool #AB3678, 3.50%, 10/1/41 | | 1,795 | 1,681,471 |
| Pool #AL7524, 5.00%, 7/1/41 | | 239 | 242,096 |
| Pool #AS3892, 4.00%, 11/1/44 | | 389 | 374,924 |
| Pool #AS5332, 4.00%, 7/1/45 | | 361 | 348,259 |
| Pool #AS6014, 4.00%, 10/1/45 | | 230 | 221,735 |
| Pool #BA0891, 3.50%, 1/1/46 | | 908 | 847,266 |
| Pool #BA3938, 3.50%, 1/1/46 | | 556 | 519,347 |
| Pool #BD1183, 3.50%, 12/1/46 | | 318 | 295,755 |
| Pool #BE2316, 3.50%, 1/1/47 | | 898 | 835,055 |
| Pool #BM1144, 2.50%, 3/1/47 | | 806 | 699,204 |
| Pool #FM7023, 3.00%, 7/1/49 | | 809 | 721,186 |
| Pool #MA1789, 4.50%, 2/1/44 | | 261 | 257,826 |
| Pool #MA2653, 4.00%, 6/1/46 | | 533 | 512,640 |
| Government National Mortgage Association: | | | |
| Pool #AQ1784, 3.50%, 12/20/45 | | 923 | 858,759 |
| Pool #CB2653, 2.50%, 3/20/51 | | 1,303 | 1,119,557 |
| Pool #CB8629, 2.50%, 4/20/51 | | 2,000 | 1,715,511 |
Total U.S. Government Agency Mortgage-Backed Securities
(identified cost $77,731,706) | | $ 74,130,075 |
| U.S. Treasury Obligations — 35.6% |
| Security | Principal
Amount
(000's omitted) | Value |
| U.S. Treasury Bonds: | | | |
| 1.375%, 8/15/50 | $ | 2,806 | $ 1,560,235 |
23
See Notes to Financial Statements.
Core Bond Portfolio
December 31, 2022
Portfolio of Investments — continued
| Security | Principal
Amount
(000's omitted) | Value |
| U.S. Treasury Bonds: (continued) | | | |
| 1.625%, 11/15/50 | $ | 8,674 | $ 5,164,130 |
| 1.875%, 11/15/51 | | 1,318 | 835,231 |
| 2.00%, 11/15/41 | | 8,644 | 6,176,239 |
| 2.00%, 8/15/51 | | 347 | 227,326 |
| 2.25%, 2/15/52 | | 3,332 | 2,318,343 |
| 2.375%, 2/15/42 | | 19,594 | 14,969,893 |
| 2.875%, 5/15/52 | | 1,099 | 880,917 |
| 4.00%, 11/15/42 | | 4,300 | 4,211,313 |
| 4.00%, 11/15/52 | | 4,866 | 4,874,363 |
| U.S. Treasury Notes: | | | |
| 0.125%, 6/30/23 | | 8,000 | 7,822,688 |
| 0.25%, 5/31/25 | | 3,310 | 3,005,377 |
| 0.375%, 11/30/25 | | 1,414 | 1,264,978 |
| 0.375%, 12/31/25 | | 10,941 | 9,779,373 |
| 0.375%, 1/31/26 | | 8,006 | 7,124,402 |
| 0.50%, 2/28/26 | | 3,144 | 2,801,967 |
| 0.75%, 11/15/24 | | 3,700 | 3,454,008 |
| 0.75%, 4/30/26 | | 4,821 | 4,310,840 |
| 1.00%, 7/31/28 | | 2,455 | 2,087,134 |
| 1.125%, 2/29/28 | | 10,680 | 9,249,464 |
| 1.125%, 8/31/28 | | 1,045 | 892,373 |
| 1.25%, 3/31/28 | | 2,415 | 2,099,541 |
| 1.25%, 4/30/28 | | 8,955 | 7,771,261 |
| 1.25%, 6/30/28 | | 1,455 | 1,258,405 |
| 1.375%, 10/31/28 | | 2,510 | 2,166,836 |
| 1.50%, 2/29/24 | | 13,624 | 13,138,379 |
| 1.875%, 2/28/27 | | 22,061 | 20,208,312 |
| 2.125%, 3/31/24 | | 14,939 | 14,475,949 |
| 2.625%, 4/15/25 | | 992 | 954,955 |
| 2.75%, 4/30/27 | | 18,000 | 17,061,328 |
| 2.75%, 8/15/32 | | 8,872 | 8,080,633 |
| 2.875%, 4/30/29 | | 3,760 | 3,522,176 |
| 3.00%, 8/15/52 | | 3,759 | 3,098,238 |
| 3.125%, 8/31/27 | | 3,713 | 3,571,587 |
| 3.125%, 8/31/29 | | 1,659 | 1,575,175 |
| 3.25%, 8/31/24 | | 7,720 | 7,559,870 |
| 3.875%, 9/30/29 | | 2,306 | 2,289,966 |
| 4.125%, 9/30/27 | | 1,600 | 1,606,125 |
Total U.S. Treasury Obligations
(identified cost $222,826,145) | | | $203,449,330 |
| Short-Term Investments — 5.8% |
| Security | Shares | Value |
| Morgan Stanley Institutional Liquidity Funds - Government Portfolio, Institutional Class, 4.11%(12) | | 33,127,696 | $ 33,127,696 |
Total Short-Term Investments
(identified cost $33,127,696) | | | $ 33,127,696 |
Total Investments — 111.5%
(identified cost $702,014,569) | | | $637,246,302 |
| Other Assets, Less Liabilities — (11.5)% | | | $ (65,746,559) |
| Net Assets — 100.0% | | | $571,499,743 |
| The percentage shown for each investment category in the Portfolio of Investments is based on net assets. |
| (1) | Security exempt from registration under Rule 144A of the Securities Act of 1933, as amended. These securities may be sold in certain transactions in reliance on an exemption from registration (normally to qualified institutional buyers). At December 31, 2022, the aggregate value of these securities is $154,542,205 or 27.0% of the Portfolio's net assets. |
| (2) | Weighted average fixed-rate coupon that changes/updates monthly. Rate shown is the rate at December 31, 2022. |
| (3) | Variable rate security. The stated interest rate represents the rate in effect at December 31, 2022. |
| (4) | Step coupon security. Interest rate represents the rate in effect at December 31, 2022. |
| (5) | Represents an investment in an issuer that may be deemed to be an affiliate (see Note 7). |
| (6) | Security converts to variable rate after the indicated fixed-rate coupon period. |
| (7) | Perpetual security with no stated maturity date but may be subject to calls by the issuer. |
| (8) | Variable rate security. The stated interest rate, which resets quarterly, is determined at auction and represents the rate in effect at December 31, 2022. |
| (9) | Senior floating-rate loans (Senior Loans) often require prepayments from excess cash flows or permit the borrowers to repay at their election. The degree to which borrowers repay, whether as a contractual requirement or at their election, cannot be predicted with accuracy. As a result, the actual remaining maturity may be substantially less than the stated maturities shown. However, Senior Loans will typically have an expected average life of approximately two to four years. Senior Loans typically have rates of interest which are redetermined periodically by reference to a base lending rate, plus a spread. These base lending rates are primarily the London Interbank Offered Rate (“LIBOR”) or the Secured Overnight Financing Rate (“SOFR”) and secondarily, the prime rate offered by one or more major United States banks (the “Prime Rate”). Base lending rates may be subject to a floor, or minimum rate. Rates for SOFR are generally 1 or 3-month tenors and may also be subject to a credit spread adjustment. Senior Loans are generally subject to contractual restrictions that must be satisfied before they can be bought or sold. |
24
See Notes to Financial Statements.
Core Bond Portfolio
December 31, 2022
Portfolio of Investments — continued
| (10) | Amount is less than 0.05%. |
| (11) | TBA (To Be Announced) securities are purchased on a forward commitment basis with an approximate principal amount and maturity date. The actual principal amount and maturity date are determined upon settlement. |
| (12) | May be deemed to be an affiliated investment company. The rate shown is the annualized seven-day yield as of December 31, 2022. |
| Futures Contracts |
| Description | Number of
Contracts | Position | Expiration
Date | Notional
Amount | Value/Unrealized
Appreciation
(Depreciation) |
| Interest Rate Futures | | | | | |
| U.S. 2-Year Treasury Note | 81 | Long | 3/31/23 | $ 16,611,328 | $ 21,735 |
| U.S. 10-Year Treasury Note | 17 | Long | 3/22/23 | 1,909,047 | (4,517) |
| U.S. Long Treasury Bond | 59 | Long | 3/22/23 | 7,395,281 | (1,646) |
| U.S. Ultra-Long Treasury Bond | 133 | Long | 3/22/23 | 17,863,563 | 103,738 |
| U.S. 5-Year Treasury Note | (159) | Short | 3/31/23 | (17,160,821) | (1,985) |
| U.S. Ultra 10-Year Treasury Note | (173) | Short | 3/22/23 | (20,462,657) | 34,280 |
| | | | | | $151,605 |
| Abbreviations: |
| LIBOR | – London Interbank Offered Rate |
| PPTT | – Preferred Pass-Through Trust |
| SOFR | – Secured Overnight Financing Rate |
| TBA | – To Be Announced |
| Currency Abbreviations: |
| USD | – United States Dollar |
25
See Notes to Financial Statements.
Core Bond Portfolio
December 31, 2022
Statement of Assets and Liabilities
| | December 31, 2022 |
| Assets | |
| Unaffiliated investments, at value (identified cost $664,274,850) | $ 600,199,943 |
| Affiliated investments, at value (identified cost $37,739,719) | 37,046,359 |
| Cash | 359,426 |
| Deposits for derivatives collateral — futures contracts | 870,985 |
| Deposits for forward commitment securities | 470,000 |
| Interest receivable | 3,798,070 |
| Interest and dividends receivable from affiliated investments | 40,740 |
| Receivable from affiliate | 6,108 |
| Total assets | $642,791,631 |
| Liabilities | |
| Payable for investments purchased | $ 17,062,608 |
| Payable for forward commitment securities | 53,746,539 |
| Payable for variation margin on open futures contracts | 96,239 |
| Payable to affiliates: | |
| Investment adviser fee | 211,750 |
| Trustees' fees | 9,860 |
| Accrued expenses | 164,892 |
| Total liabilities | $ 71,291,888 |
| Net Assets applicable to investors' interest in Portfolio | $571,499,743 |
26
See Notes to Financial Statements.
Core Bond Portfolio
December 31, 2022
| | Year Ended |
| | December 31, 2022 |
| Investment Income | |
| Dividend income (net of foreign taxes withheld of $10,537) | $ 275,776 |
| Dividend income from affiliated investments | 142,206 |
| Interest and other income | 16,001,116 |
| Interest income from affiliated investments | 192,509 |
| Total investment income | $ 16,611,607 |
| Expenses | |
| Investment adviser fee | $ 2,439,866 |
| Trustees’ fees and expenses | 36,107 |
| Custodian fee | 153,338 |
| Legal and accounting services | 78,480 |
| Miscellaneous | 16,521 |
| Total expenses | $ 2,724,312 |
| Deduct: | |
| Waiver and/or reimbursement of expenses by affiliate | $ 76,416 |
| Total expense reductions | $ 76,416 |
| Net expenses | $ 2,647,896 |
| Net investment income | $ 13,963,711 |
| Realized and Unrealized Gain (Loss) | |
| Net realized gain (loss): | |
| Investment transactions | $ (16,902,316) |
| Investment transactions - affiliated investments | 1,321 |
| Futures contracts | (5,977,210) |
| Net realized loss | $(22,878,205) |
| Change in unrealized appreciation (depreciation): | |
| Investments | $ (68,462,460) |
| Investments - affiliated investments | (310,780) |
| Futures contracts | 381,085 |
| Net change in unrealized appreciation (depreciation) | $(68,392,155) |
| Net realized and unrealized loss | $(91,270,360) |
| Net decrease in net assets from operations | $(77,306,649) |
27
See Notes to Financial Statements.
Core Bond Portfolio
December 31, 2022
Statements of Changes in Net Assets
| | Year Ended December 31, |
| | 2022 | 2021 |
| Increase (Decrease) in Net Assets | | |
| From operations: | | |
| Net investment income | $ 13,963,711 | $ 11,649,278 |
| Net realized gain (loss) | (22,878,205) | 8,512,986 |
| Net change in unrealized appreciation (depreciation) | (68,392,155) | (16,032,763) |
| Net increase (decrease) in net assets from operations | $ (77,306,649) | $ 4,129,501 |
| Capital transactions: | | |
| Contributions | $ 200,971,207 | $ 73,755,473 |
| Withdrawals | (123,037,128) | (82,966,119) |
| Net increase (decrease) in net assets from capital transactions | $ 77,934,079 | $ (9,210,646) |
| Net increase (decrease) in net assets | $ 627,430 | $ (5,081,145) |
| Net Assets | | |
| At beginning of year | $ 570,872,313 | $ 575,953,458 |
| At end of year | $ 571,499,743 | $570,872,313 |
28
See Notes to Financial Statements.
Core Bond Portfolio
December 31, 2022
| | Year Ended December 31, |
| | 2022 | 2021 | 2020 | 2019 | 2018 |
| Ratios/Supplemental Data | | | | | |
| Ratios (as a percentage of average daily net assets): | | | | | |
| Expenses (1) | 0.49% (2) | 0.49% | 0.49% | 0.49% | 0.49% |
| Net investment income | 2.58% | 2.06% | 2.46% | 2.86% | 2.98% |
| Portfolio Turnover | 102% (3) | 122% (3) | 93% (3) | 89% | 65% |
| Total Return(1) | (13.13)% | 0.70% | 8.16% | 9.28% | (0.50)% |
| Net assets, end of year (000’s omitted) | $571,500 | $570,872 | $575,953 | $590,390 | $506,016 |
| (1) | The investment adviser reimbursed certain operating expenses (equal to 0.01%, 0.01%, 0.01%, 0.01% and 0.02% of average daily net assets for the years ended December 31, 2022, 2021, 2020, 2019 and 2018, respectively). Absent this reimbursement, total return would be lower. |
| (2) | Includes a reduction by the investment adviser of a portion of its adviser fee due to the Portfolio's investment in the Liquidity Fund (equal to less than 0.005% of average daily net assets for the year ended December 31, 2022). |
| (3) | Includes the effect of To Be Announced (TBA) transactions. |
Core Bond Portfolio
December 31, 2022
Notes to Financial Statements
1 Significant Accounting Policies
Core Bond Portfolio (the Portfolio) is a Massachusetts business trust registered under the Investment Company Act of 1940, as amended (the 1940 Act), as a diversified, open-end management investment company. The Portfolio’s investment objectives are to seek current income and total return. The Declaration of Trust permits the Trustees to issue interests in the Portfolio. At December 31, 2022, Eaton Vance Balanced Fund and Eaton Vance Core Bond Fund held an interest of 63.2% and 36.8%, respectively, in the Portfolio.
The following is a summary of significant accounting policies of the Portfolio. The policies are in conformity with accounting principles generally accepted in the United States of America (U.S. GAAP). The Portfolio is an investment company and follows accounting and reporting guidance in the Financial Accounting Standards Board (FASB) Accounting Standards Codification Topic 946.
A Investment Valuation—The following methodologies are used to determine the market value or fair value of investments.
Debt Obligations. Debt obligations are generally valued on the basis of valuations provided by third party pricing services, as derived from such services’ pricing models. Inputs to the models may include, but are not limited to, reported trades, executable bid and ask prices, broker/dealer quotations, prices or yields of securities with similar characteristics, interest rates, anticipated prepayments, benchmark curves or information pertaining to the issuer, as well as industry and economic events. The pricing services may use a matrix approach, which considers information regarding securities with similar characteristics to determine the valuation for a security. Short-term debt obligations purchased with a remaining maturity of sixty days or less for which a valuation from a third party pricing service is not readily available may be valued at amortized cost, which approximates fair value.
Preferred Securities. Preferred securities listed on a U.S. securities exchange generally are valued at the last sale or closing price on the day of valuation or, if no sales took place on such date, at the mean between the closing bid and ask prices on the exchange where such securities are principally traded. Preferred securities listed on the NASDAQ National Market System are valued at the NASDAQ official closing price. Preferred securities that are not listed or traded in the over-the-counter market are valued by a third party pricing service that uses various techniques that consider factors including, but not limited to, prices or yields of securities with similar characteristics, benchmark yields, broker/dealer quotes, quotes of underlying common stock, issuer spreads, as well as industry and economic events.
Senior Floating-Rate Loans. Interests in senior floating-rate loans (Senior Loans) for which reliable market quotations are readily available are valued generally at the average mean of bid and ask quotations obtained from a third party pricing service.
Derivatives. Futures contracts are valued at the closing settlement price established by the board of trade or exchange on which they are traded.
Other. Investments in management investment companies (including money market funds) that do not trade on an exchange are valued at the net asset value as of the close of each business day.
Fair Valuation. In connection with Rule 2a-5 of the 1940 Act, which became effective September 8, 2022, the Trustees have designated the Portfolio’s investment adviser as its valuation designee. Investments for which valuations or market quotations are not readily available or are deemed unreliable are valued by the investment adviser, as valuation designee, at fair value using methods that most fairly reflect the security’s “fair value”, which is the amount that the Portfolio might reasonably expect to receive for the security upon its current sale in the ordinary course. Each such determination is based on a consideration of relevant factors, which are likely to vary from one pricing context to another. These factors may include, but are not limited to, the type of security, the existence of any contractual restrictions on the security’s disposition, the price and extent of public trading in similar securities of the issuer or of comparable companies or entities, quotations or relevant information obtained from broker/dealers or other market participants, information obtained from the issuer, analysts, and/or the appropriate stock exchange (for exchange-traded securities), an analysis of the company’s or entity’s financial statements, and an evaluation of the forces that influence the issuer and the market(s) in which the security is purchased and sold.
B Investment Transactions—Investment transactions for financial statement purposes are accounted for on a trade date basis. Realized gains and losses on investments sold are determined on the basis of identified cost.
C Income—Interest income is recorded on the basis of interest accrued, adjusted for amortization of premium or accretion of discount. Dividend income is recorded on the ex-dividend date for dividends received in cash and/or securities. Withholding taxes on dividends have been provided for in accordance with the Portfolio’s understanding of the applicable countries’ tax rules and rates.
D Federal Taxes—The Portfolio has elected to be treated as a partnership for federal tax purposes. No provision is made by the Portfolio for federal or state taxes on any taxable income of the Portfolio because each investor in the Portfolio is ultimately responsible for the payment of any taxes on its share of taxable income. Since at least one of the Portfolio's investors is a regulated investment company that invests all or substantially all of its assets in the Portfolio, the Portfolio normally must satisfy the applicable source of income and diversification requirements (under the Internal Revenue Code) in order for its investors to satisfy them. The Portfolio will allocate, at least annually among its investors, each investor's distributive share of the Portfolio's net investment income, net realized capital gains and losses and any other items of income, gain, loss, deduction or credit.
As of December 31, 2022, the Portfolio had no uncertain tax positions that would require financial statement recognition, de-recognition, or disclosure. The Portfolio files a U.S. federal income tax return annually after its fiscal year-end, which is subject to examination by the Internal Revenue Service for a period of three years from the date of filing.
Core Bond Portfolio
December 31, 2022
Notes to Financial Statements — continued
E Unfunded Loan Commitments—The Portfolio may enter into certain loan agreements all or a portion of which may be unfunded. The Portfolio is obligated to fund these commitments at the borrower's discretion. These commitments, if any, are disclosed in the accompanying Portfolio of Investments.
F Use of Estimates—The preparation of the financial statements in conformity with U.S. GAAP requires management to make estimates and assumptions that affect the reported amounts of assets and liabilities at the date of the financial statements and the reported amounts of income and expense during the reporting period. Actual results could differ from those estimates.
G Indemnifications—Under the Portfolio’s organizational documents, its officers and Trustees may be indemnified against certain liabilities and expenses arising out of the performance of their duties to the Portfolio. Under Massachusetts law, if certain conditions prevail, interestholders in the Portfolio could be deemed to have personal liability for the obligations of the Portfolio. However, the Portfolio’s Declaration of Trust contains an express disclaimer of liability on the part of Portfolio interestholders. Additionally, in the normal course of business, the Portfolio enters into agreements with service providers that may contain indemnification clauses. The Portfolio’s maximum exposure under these arrangements is unknown as this would involve future claims that may be made against the Portfolio that have not yet occurred.
H Futures Contracts—Upon entering into a futures contract, the Portfolio is required to deposit with the broker, either in cash or securities, an amount equal to a certain percentage of the contract amount (initial margin). Subsequent payments, known as variation margin, are made or received by the Portfolio each business day, depending on the daily fluctuations in the value of the underlying security and are recorded as unrealized gains or losses by the Portfolio. Gains (losses) are realized upon the expiration or closing of the futures contracts. Should market conditions change unexpectedly, the Portfolio may not achieve the anticipated benefits of the futures contracts and may realize a loss. Futures contracts have minimal counterparty risk as they are exchange traded and the clearinghouse for the exchange is substituted as the counterparty, guaranteeing counterparty performance.
I When-Issued Securities and Delayed Delivery Transactions—The Portfolio may purchase securities on a delayed delivery, when-issued or forward commitment basis, including TBA (To Be Announced) securities. Payment and delivery may take place after the customary settlement period for that security. At the time the transaction is negotiated, the price of the security that will be delivered is fixed. The Portfolio maintains cash and/or security positions for these commitments such that sufficient liquid assets will be available to make payments upon settlement. Securities purchased on a delayed delivery, when-issued or forward commitment basis are marked-to-market daily and begin earning interest on settlement date. Such security purchases are subject to the risk that when delivered they will be worth less than the agreed upon payment price. Losses may also arise if the counterparty does not perform under the contract. A forward purchase commitment may also be closed by entering into an offsetting commitment. If an offsetting commitment is entered into, the Portfolio will realize a gain or loss on investments based on the price established when the Portfolio entered into the commitment.
2 Investment Adviser Fee and Other Transactions with Affiliates
The investment adviser fee is earned by Boston Management and Research (BMR), an indirect, wholly-owned subsidiary of Morgan Stanley, as compensation for investment advisory services rendered to the Portfolio. The investment adviser fee is computed at an annual rate as a percentage of the Portfolio’s average daily net assets as follows and is payable monthly:
| Average Daily Net Assets | Annual Fee Rate |
| Up to $1 billion | 0.450% |
| $1 billion up to $2 billion | 0.425% |
| $2 billion up to $5 billion | 0.415% |
| $5 billion and over | 0.405% |
For the year ended December 31, 2022, the Portfolio's investment adviser fee amounted to $2,439,866 or 0.45% of the Portfolio’s average daily net assets. Pursuant to a voluntary expense reimbursement, BMR was allocated $66,158 of the Portfolio’s operating expenses for the year ended December 31, 2022.
Effective April 26, 2022, the Portfolio may invest in a money market fund, the Institutional Class of the Morgan Stanley Institutional Liquidity Funds - Government Portfolio (the "Liquidity Fund"), an open-end management investment company managed by Morgan Stanley Investment Management Inc., a wholly-owned subsidiary of Morgan Stanley. The investment adviser fee paid by the Portfolio is reduced by an amount equal to its pro-rata share of the advisory and administration fees paid by the Portfolio due to its investment in the Liquidity Fund. For the year ended December 31, 2022, the investment adviser fee paid was reduced by $10,258 relating to the Portfolio's investment in the Liquidity Fund. Prior to April 26, 2022, the Portfolio may have invested its cash in Eaton Vance Cash Reserves Fund, LLC (Cash Reserves Fund), an affiliated investment company managed by Eaton Vance Management (EVM). EVM did not receive a fee for advisory services provided to Cash Reserves Fund.
Core Bond Portfolio
December 31, 2022
Notes to Financial Statements — continued
Trustees and officers of the Portfolio who are members of EVM’s or BMR’s organizations receive remuneration for their services to the Portfolio out of the investment adviser fee. Trustees of the Portfolio who are not affiliated with the investment adviser may elect to defer receipt of all or a percentage of their annual fees in accordance with the terms of the Trustees Deferred Compensation Plan. For the year ended December 31, 2022, no significant amounts have been deferred. Certain officers and Trustees of the Portfolio are officers of the above organizations.
3 Purchases and Sales of Investments
Purchases and sales of investments, other than short-term obligations and including maturities, paydowns, principal repayments on Senior Loans and TBA transactions, for the year ended December 31, 2022 were as follows:
| | Purchases | Sales |
| Investments (non-U.S. Government) | $ 151,006,770 | $ 168,567,991 |
| U.S. Government and Agency Securities | 552,991,990 | 407,098,391 |
| | $703,998,760 | $575,666,382 |
4 Federal Income Tax Basis of Investments
The cost and unrealized appreciation (depreciation) of investments, including open derivative contracts, of the Portfolio at December 31, 2022, as determined on a federal income tax basis, were as follows:
| Aggregate cost | $ 702,878,039 |
| Gross unrealized appreciation | $ 640,783 |
| Gross unrealized depreciation | (66,272,520) |
| Net unrealized depreciation | $ (65,631,737) |
5 Financial Instruments
The Portfolio may trade in financial instruments with off-balance sheet risk in the normal course of its investing activities. These financial instruments may include futures contracts and may involve, to a varying degree, elements of risk in excess of the amounts recognized for financial statement purposes. The notional or contractual amounts of these instruments represent the investment the Portfolio has in particular classes of financial instruments and do not necessarily represent the amounts potentially subject to risk. The measurement of the risks associated with these instruments is meaningful only when all related and offsetting transactions are considered. A summary of obligations under these financial instruments at December 31, 2022 is included in the Portfolio of Investments. At December 31, 2022, the Portfolio had sufficient cash and/or securities to cover commitments under these contracts.
The Portfolio is subject to interest rate risk in the normal course of pursuing its investment objectives. Because the Portfolio holds fixed-rate bonds, the value of these bonds may decrease if interest rates rise. The Portfolio enters into U.S. Treasury futures contracts to hedge against fluctuations in interest rates.
The fair value of open derivative instruments (not considered to be hedging instruments for accounting disclosure purposes) and whose primary underlying risk exposure is interest rate risk at December 31, 2022 was as follows:
| | Fair Value |
| Derivative | Asset Derivative(1) | Liability Derivative(1) |
| Futures contracts | $159,753 | $(8,148) |
| (1) | Only the current day’s variation margin on open futures contracts is reported within the Statement of Assets and Liabilities as Receivable or Payable for variation margin on open futures contracts, as applicable. |
Core Bond Portfolio
December 31, 2022
Notes to Financial Statements — continued
The effect of derivative instruments (not considered to be hedging instruments for accounting disclosure purposes) on the Statement of Operations and whose primary underlying risk exposure is interest rate risk for the year ended December 31, 2022 was as follows:
| Derivative | Realized Gain (Loss)
on Derivatives Recognized
in Income(1) | Change in Unrealized
Appreciation (Depreciation) on
Derivatives Recognized in Income(2) |
| Futures contracts | $(5,977,210) | $381,085 |
| (1) | Statement of Operations location: Net realized gain (loss) - Futures contracts. |
| (2) | Statement of Operations location: Change in unrealized appreciation (depreciation) - Futures contracts. |
The average notional cost of futures contracts outstanding during the year ended December 31, 2022, which is indicative of the volume of this derivative type, was approximately as follows:
Futures
Contracts — Long | Futures
Contracts — Short |
| $68,308,000 | $31,676,000 |
6 Line of Credit
The Portfolio participates with other portfolios and funds managed by EVM and its affiliates in a $725 million unsecured line of credit agreement with a group of banks, which is in effect through October 24, 2023. In connection with the renewal of the agreement on October 25, 2022, the borrowing limit was decreased from $800 million. Borrowings are made by the Portfolio solely for temporary purposes related to redemptions and other short-term cash needs. Interest is charged to the Portfolio based on its borrowings at an amount above either the Secured Overnight Financing Rate (SOFR) or Federal Funds rate. In addition, a fee computed at an annual rate of 0.15% on the daily unused portion of the line of credit is allocated among the participating portfolios and funds at the end of each quarter. Also in connection with the renewal of the agreement, an arrangement fee totaling $150,000 was incurred that was allocated to the participating portfolios and funds. Because the line of credit is not available exclusively to the Portfolio, it may be unable to borrow some or all of its requested amounts at any particular time. The Portfolio did not have any significant borrowings or allocated fees during the year ended December 31, 2022.
7 Investments in Affiliated Issuers and Funds
At December 31, 2022, the value of the Portfolio's investment in affiliated issuers and funds, including issuers and funds that may be deemed to be affiliated, was $37,046,359, which represents 6.5% of the Portfolio's net assets. Transactions in such investments and funds by the Portfolio for the year ended December 31, 2022 were as follows:
| Name | Value,
beginning
of period | Purchases | Sales
proceeds | Net
realized
gain (loss) | Change in
unrealized
appreciation
(depreciation) | Value, end
of period | Interest/
Dividend
income | Principal amount/
Units/Shares, end
of period |
| Commercial Mortgage-Backed Securities | | | | | | | | |
| Morgan Stanley Bank of America Merrill Lynch Trust, Series 2016-C29, Class C, 4.722%, 5/15/49 | $ 1,014,911 | $ — | $ — | $ — | $ (139,460) | $ 875,452 | $ 47,609 | $ 993,200 |
| Morgan Stanley Capital I Trust: | | | | | | | | |
| Series 2016-UBS12, Class D, 3.312%, 12/15/49 | 1,017,226 | — | — | — | (104,302) | 927,474 | 72,344 | 1,745,000 |
| Series 2019-BPR, Class A, 5.968%, (1 mo. USD LIBOR + 1.65%), 5/15/36 | 2,493,382 | — | (310,626) | (5) | (67,018) | 2,115,737 | 72,556 | 2,210,379 |
Core Bond Portfolio
December 31, 2022
Notes to Financial Statements — continued
| Name | Value,
beginning
of period | Purchases | Sales
proceeds | Net
realized
gain (loss) | Change in
unrealized
appreciation
(depreciation) | Value, end
of period | Interest/
Dividend
income | Principal amount/
Units/Shares, end
of period |
| Short-Term Investments |
| Cash Reserves Fund | $38,096,434 | $122,078,814 | $(160,176,574) | $ 1,326 | $ — | $ — | $ 2,657 | — |
| Liquidity Fund | — | 168,106,023 | (134,978,327) | — | — | 33,127,696 | 139,549 | 33,127,696 |
| Total | | | | $1,321 | $(310,780) | $37,046,359 | $334,715 | |
8 Fair Value Measurements
Under generally accepted accounting principles for fair value measurements, a three-tier hierarchy to prioritize the assumptions, referred to as inputs, is used in valuation techniques to measure fair value. The three-tier hierarchy of inputs is summarized in the three broad levels listed below.
| • | Level 1 – quoted prices in active markets for identical investments |
| • | Level 2 – other significant observable inputs (including quoted prices for similar investments, interest rates, prepayment speeds, credit risk, etc.) |
| • | Level 3 – significant unobservable inputs (including a fund's own assumptions in determining the fair value of investments) |
In cases where the inputs used to measure fair value fall in different levels of the fair value hierarchy, the level disclosed is determined based on the lowest level input that is significant to the fair value measurement in its entirety. The inputs or methodology used for valuing securities are not necessarily an indication of the risk associated with investing in those securities.
At December 31, 2022, the hierarchy of inputs used in valuing the Portfolio’s investments and open derivative instruments, which are carried at value, were as follows:
| Asset Description | Level 1 | Level 2 | Level 3 | Total |
| Asset-Backed Securities | $ — | $ 57,268,399 | $ — | $ 57,268,399 |
| Collateralized Mortgage Obligations | — | 11,258,708 | — | 11,258,708 |
| Commercial Mortgage-Backed Securities | — | 58,636,018 | — | 58,636,018 |
| Corporate Bonds | — | 184,874,970 | — | 184,874,970 |
| Preferred Stocks | 2,856,042 | — | — | 2,856,042 |
| Senior Floating-Rate Loans | — | 2,824,514 | — | 2,824,514 |
| Taxable Municipal Obligations | — | 8,820,550 | — | 8,820,550 |
| U.S. Government Agency Mortgage-Backed Securities | — | 74,130,075 | — | 74,130,075 |
| U.S. Treasury Obligations | — | 203,449,330 | — | 203,449,330 |
| Short-Term Investments | 33,127,696 | — | — | 33,127,696 |
| Total Investments | $ 35,983,738 | $601,262,564 | $ — | $ 637,246,302 |
| Futures Contracts | $ 159,753 | $ — | $ — | $ 159,753 |
| Total | $ 36,143,491 | $601,262,564 | $ — | $ 637,406,055 |
| Liability Description | | | | |
| Futures Contracts | $ (8,148) | $ — | $ — | $ (8,148) |
| Total | $ (8,148) | $ — | $ — | $ (8,148) |
Core Bond Portfolio
December 31, 2022
Notes to Financial Statements — continued
9 Risks and Uncertainties
Pandemic Risk
An outbreak of respiratory disease caused by a novel coronavirus was first detected in China in late 2019 and subsequently spread internationally. This coronavirus has resulted in closing borders, enhanced health screenings, changes to healthcare service preparation and delivery, quarantines, cancellations, disruptions to supply chains and customer activity, as well as general concern and uncertainty. Health crises caused by outbreaks of disease, such as the coronavirus outbreak, may exacerbate other pre-existing political, social and economic risks and disrupt normal market conditions and operations. The impact of this outbreak has negatively affected the worldwide economy, as well as the economies of individual countries and industries, and could continue to affect the market in significant and unforeseen ways. Other epidemics and pandemics that may arise in the future may have similar effects. Any such impact could adversely affect the Portfolio's performance, or the performance of the securities in which the Portfolio invests.
Core Bond Portfolio
December 31, 2022
Report of Independent Registered Public Accounting Firm
To the Trustees and Investors of Core Bond Portfolio:
Opinion on the Financial Statements and Financial Highlights
We have audited the accompanying statement of assets and liabilities of Core Bond Portfolio (the “Portfolio”), including the portfolio of investments, as of December 31, 2022, the related statement of operations for the year then ended, the statements of changes in net assets for each of the two years in the period then ended, the financial highlights for each of the five years in the period then ended, and the related notes. In our opinion, the financial statements and financial highlights present fairly, in all material respects, the financial position of the Portfolio as of December 31, 2022, and the results of its operations for the year then ended, the changes in its net assets for each of the two years in the period then ended, and the financial highlights for each of the five years in the period then ended, in conformity with accounting principles generally accepted in the United States of America.
Basis for Opinion
These financial statements and financial highlights are the responsibility of the Portfolio’s management. Our responsibility is to express an opinion on the Portfolio’s financial statements and financial highlights based on our audits. We are a public accounting firm registered with the Public Company Accounting Oversight Board (United States) (PCAOB) and are required to be independent with respect to the Portfolio in accordance with the U.S. federal securities laws and the applicable rules and regulations of the Securities and Exchange Commission and the PCAOB.
We conducted our audits in accordance with the standards of the PCAOB. Those standards require that we plan and perform the audit to obtain reasonable assurance about whether the financial statements and financial highlights are free of material misstatement, whether due to error or fraud. The Portfolio is not required to have, nor were we engaged to perform, an audit of its internal control over financial reporting. As part of our audits, we are required to obtain an understanding of internal control over financial reporting but not for the purpose of expressing an opinion on the effectiveness of the Portfolio’s internal control over financial reporting. Accordingly, we express no such opinion.
Our audits included performing procedures to assess the risks of material misstatement of the financial statements and financial highlights, whether due to error or fraud, and performing procedures that respond to those risks. Such procedures included examining, on a test basis, evidence regarding the amounts and disclosures in the financial statements and financial highlights. Our audits also included evaluating the accounting principles used and significant estimates made by management, as well as evaluating the overall presentation of the financial statements and financial highlights. Our procedures included confirmation of securities and senior loans owned as of December 31, 2022, by correspondence with the custodian, brokers and selling or agent banks; when replies were not received from brokers and selling or agent banks, we performed other auditing procedures. We believe that our audits provide a reasonable basis for our opinion.
/s/ Deloitte & Touche LLP
Boston, Massachusetts
February 24, 2023
We have served as the auditor of one or more Eaton Vance investment companies since 1959.
Eaton Vance
Core Bond Fund
December 31, 2022
Management and Organization
Fund Management. The Trustees of Eaton Vance Special Investment Trust (the Trust) and Core Bond Portfolio (the Portfolio) are responsible for the overall management and supervision of the Trust's and the Portfolio's affairs. The Board members and officers of the Trust and the Portfolio are listed below. Except as indicated, each individual has held the office shown or other offices in the same company for the last five years. Board members hold indefinite terms of office. Each Trustee holds office until his or her successor is elected and qualified, subject to a prior death, resignation, retirement, disqualification or removal. Under the terms of the Fund's and the Portfolio's current Trustee retirement policy, an Independent Trustee must retire and resign as a Trustee on the earlier of: (i) the first day of July following his or her 74th birthday; or (ii), with limited exception, December 31st of the 20th year in which he or she has served as a Trustee. However, if such retirement and resignation would cause the Fund and the Portfolio to be out of compliance with Section 16 of the 1940 Act or any other regulations or guidance of the SEC, then such retirement and resignation will not become effective until such time as action has been taken for the Fund and the Portfolio to be in compliance therewith. The “noninterested Trustees” consist of those Trustees who are not “interested persons” of the Trust and the Portfolio, as that term is defined under the 1940 Act. The business address of each Board member and officer is Two International Place, Boston, Massachusetts 02110. As used below, “BMR” refers to Boston Management and Research, “EVC” refers to Eaton Vance Corp., “EV” refers to EV LLC, “EVM” refers to Eaton Vance Management and “EVD” refers to Eaton Vance Distributors, Inc. EV is the trustee of each of EVM and BMR. Effective March 1, 2021, each of EVM, BMR, EVD and EV are indirect, wholly owned subsidiaries of Morgan Stanley. Each officer affiliated with EVM may hold a position with other EVM affiliates that is comparable to his or her position with EVM listed below. Each Trustee oversees 135 funds (with the exception of Mr. Bowser who oversees 110 funds) in the Eaton Vance fund complex (including both funds and portfolios in a hub and spoke structure).
| Name and Year of Birth | Trust/Portfolio
Position(s) | Length of Service | Principal Occupation(s) and Other Directorships
During Past Five Years and Other Relevant Experience |
| Interested Trustee |
Thomas E. Faust Jr.
1958 | Trustee | Since 2007 | Chairman of Morgan Stanley Investment Management, Inc. (MSIM), member of the Board of Managers and President of EV (since 2021), Chief Executive Officer of EVM and BMR. Formerly, Chairman, Chief Executive Officer (2007-2021) and President (2006-2021) of EVC and Director of EVD (2007-2022). Mr. Faust is an interested person because of his positions with EVM, BMR, EVC and EV, which are affiliates of the Trust and the Portfolio.
Other Directorships. Formerly, Director of EVC (2007-2021) and Hexavest Inc. (investment management firm) (2012-2021). |
| Noninterested Trustees |
Alan C. Bowser(1)
1962 | Trustee | Since 2022 | Formerly, Chief Diversity Officer, Partner and a member of the Operating Committee, and formerly served as Senior Advisor on Diversity and Inclusion for the firm’s chief executive officer, Co-Head of the Americas Region, and Senior Client Advisor of Bridgewater Associates, an asset management firm (2011- 2023).
Other Directorships. None. |
Mark R. Fetting
1954 | Trustee | Since 2016 | Private investor. Formerly held various positions at Legg Mason, Inc. (investment management firm) (2000-2012), including President, Chief Executive Officer, Director and Chairman (2008-2012), Senior Executive Vice President (2004-2008) and Executive Vice President (2001-2004). Formerly, President of Legg Mason family of funds (2001-2008). Formerly, Division President and Senior Officer of Prudential Financial Group, Inc. and related companies (investment management firm) (1991-2000).
Other Directorships. None. |
Cynthia E. Frost
1961 | Trustee | Since 2014 | Private investor. Formerly, Chief Investment Officer of Brown University (university endowment) (2000-2012). Formerly, Portfolio Strategist for Duke Management Company (university endowment manager) (1995-2000). Formerly, Managing Director, Cambridge Associates (investment consulting company) (1989-1995). Formerly, Consultant, Bain and Company (management consulting firm) (1987- 1989). Formerly, Senior Equity Analyst, BA Investment Management Company (1983-1985).
Other Directorships. None. |
George J. Gorman
1952 | Chairperson of the
Board and Trustee | Since 2021
(Chairperson) and 2014 (Trustee) | Principal at George J. Gorman LLC (consulting firm). Formerly, Senior Partner at Ernst & Young LLP (a registered public accounting firm) (1974-2009).
Other Directorships. None. |
Eaton Vance
Core Bond Fund
December 31, 2022
Management and Organization — continued
| Name and Year of Birth | Trust/Portfolio
Position(s) | Length of Service | Principal Occupation(s) and Other Directorships
During Past Five Years and Other Relevant Experience |
| Noninterested Trustees (continued) |
Valerie A. Mosley
1960 | Trustee | Since 2014 | Chairwoman and Chief Executive Officer of Valmo Ventures (a consulting and investment firm). Founder of Upward Wealth, Inc., dba BrightUp, a fintech platform. Formerly, Partner and Senior Vice President, Portfolio Manager and Investment Strategist at Wellington Management Company, LLP (investment management firm) (1992-2012). Formerly, Chief Investment Officer, PG Corbin Asset Management (1990-1992). Formerly worked in institutional corporate bond sales at Kidder Peabody (1986-1990).
Other Directorships. Director of DraftKings, Inc. (digital sports entertainment and gaming company) (since September 2020). Director of Envestnet, Inc. (provider of intelligent systems for wealth management and financial wellness) (since 2018). Formerly, Director of Dynex Capital, Inc. (mortgage REIT) (2013-2020) and Director of Groupon, Inc. (e-commerce provider) (2020-2022). |
Keith Quinton
1958 | Trustee | Since 2018 | Private investor, researcher and lecturer. Formerly, Independent Investment Committee Member at New Hampshire Retirement System (2017-2021). Formerly, Portfolio Manager and Senior Quantitative Analyst at Fidelity Investments (investment management firm) (2001-2014).
Other Directorships. Formerly, Director (2016-2021) and Chairman (2019-2021) of New Hampshire Municipal Bond Bank. |
Marcus L. Smith
1966 | Trustee | Since 2018 | Private investor and independent corporate director. Formerly, Chief Investment Officer, Canada (2012-2017), Chief Investment Officer, Asia (2010-2012), Director of Asian Research (2004-2010) and portfolio manager (2001-2017) at MFS Investment Management (investment management firm).
Other Directorships. Director of First Industrial Realty Trust, Inc. (an industrial REIT) (since 2021). Director of MSCI Inc. (global provider of investment decision support tools) (since 2017). Formerly, Director of DCT Industrial Trust Inc. (logistics real estate company) (2017-2018). |
Susan J. Sutherland
1957 | Trustee | Since 2015 | Private investor. Director of Ascot Group Limited and certain of its subsidiaries (insurance and reinsurance) (since 2017). Formerly, Director of Hagerty Holding Corp. (insurance) (2015-2018) and Montpelier Re Holdings Ltd. (insurance and reinsurance) (2013-2015). Formerly, Associate, Counsel and Partner at Skadden, Arps, Slate, Meagher & Flom LLP (law firm) (1982-2013).
Other Directorships. Formerly, Director of Kairos Acquisition Corp. (insurance/InsurTech acquisition company) (2021-2023). |
Scott E. Wennerholm
1959 | Trustee | Since 2016 | Private investor. Formerly, Trustee at Wheelock College (postsecondary institution) (2012-2018). Formerly, Consultant at GF Parish Group (executive recruiting firm) (2016-2017). Formerly, Chief Operating Officer and Executive Vice President at BNY Mellon Asset Management (investment management firm) (2005-2011). Formerly, Chief Operating Officer and Chief Financial Officer at Natixis Global Asset Management (investment management firm) (1997-2004). Formerly, Vice President at Fidelity Investments Institutional Services (investment management firm) (1994-1997).
Other Directorships. None. |
Nancy A. Wiser(1)
1967 | Trustee | Since 2022 | Formerly, Executive Vice President and the Global Head of Operations at Wells Fargo Asset Management (2011-2021).
Other Directorships. None. |
| Name and Year of Birth | Trust/Portfolio
Position(s) | Length of Service | Principal Occupation(s)
During Past Five Years |
| Principal Officers who are not Trustees |
Eric A. Stein
1980 | President | Since 2020 | Vice President and Chief Investment Officer, Fixed Income of EVM and BMR. Prior to November 1, 2020, Mr. Stein was a co-Director of Eaton Vance’s Global Income Investments. Also Vice President of Calvert Research and Management (“CRM”). |
Deidre E. Walsh
1971 | Vice President and Chief Legal Officer | Since 2009 | Vice President of EVM and BMR. Also Vice President of CRM. |
James F. Kirchner
1967 | Treasurer | Since 2007 | Vice President of EVM and BMR. Also Vice President of CRM. |
Eaton Vance
Core Bond Fund
December 31, 2022
Management and Organization — continued
| Name and Year of Birth | Trust/Portfolio
Position(s) | Length of Service | Principal Occupation(s)
During Past Five Years |
| Principal Officers who are not Trustees (continued) |
Nicholas Di Lorenzo
1987 | Secretary | Since 2022 | Formerly, associate (2012-2021) and counsel (2022) at Dechert LLP. |
Richard F. Froio
1968 | Chief Compliance
Officer | Since 2017 | Vice President of EVM and BMR since 2017. Formerly, Deputy Chief Compliance Officer (Adviser/Funds) and Chief Compliance Officer (Distribution) at PIMCO (2012-2017) and Managing Director at BlackRock/Barclays Global Investors (2009-2012). |
(1) Mr. Bowser and Ms. Wiser began serving as Trustees effective April 4, 2022.
The SAI for the Fund includes additional information about the Trustees and officers of the Trust and the Portfolio and can be obtained without charge on Eaton Vance’s website at www.eatonvance.com or by calling 1-800-262-1122.
| FACTS | WHAT DOES EATON VANCE DO WITH YOUR
PERSONAL INFORMATION? |
| Why? | Financial companies choose how they share your personal information. Federal law gives consumers the right to limit some but not all sharing. Federal law also requires us to tell you how we collect, share, and protect your personal information. Please read this notice carefully to understand what we do. |
| |
| What? | The types of personal information we collect and share depend on the product or service you have with us. This information can include:■ Social Security number and income
■ investment experience and risk tolerance
■ checking account number and wire transfer instructions |
| |
| How? | All financial companies need to share customers’ personal information to run their everyday business. In the section below, we list the reasons financial companies can share their customers’ personal information; the reasons Eaton Vance chooses to share; and whether you can limit this sharing. |
Reasons we can share your
personal information | Does Eaton Vance
share? | Can you limit
this sharing? |
| For our everyday business purposes — such as to process your transactions, maintain your account(s), respond to court orders and legal investigations, or report to credit bureaus | Yes | No |
| For our marketing purposes — to offer our products and services to you | Yes | No |
| For joint marketing with other financial companies | No | We don’t share |
| For our investment management affiliates’ everyday business purposes — information about your transactions, experiences, and creditworthiness | Yes | Yes |
| For our affiliates’ everyday business purposes — information about your transactions and experiences | Yes | No |
| For our affiliates’ everyday business purposes — information about your creditworthiness | No | We don’t share |
| For our investment management affiliates to market to you | Yes | Yes |
| For our affiliates to market to you | No | We don’t share |
| For nonaffiliates to market to you | No | We don’t share |
To limit our
sharing | Call toll-free 1-800-262-1122 or email: EVPrivacy@eatonvance.comPlease note:If you are a new customer, we can begin sharing your information 30 days from the date we sent this notice. When you are no longer our customer, we continue to share your information as described in this notice. However, you can contact us at any time to limit our sharing. |
| Questions? | Call toll-free 1-800-262-1122 or email: EVPrivacy@eatonvance.com |
| Privacy Notice — continued | April 2021 |
| Who we are |
| Who is providing this notice? | Eaton Vance Management, Eaton Vance Distributors, Inc., Eaton Vance Trust Company, Eaton Vance Management (International) Limited, Eaton Vance Advisers International Ltd., Eaton Vance Global Advisors Limited, Eaton Vance Management’s Real Estate Investment Group, Boston Management and Research, Calvert Research and Management, Eaton Vance and Calvert Fund Families and our investment advisory affiliates (“Eaton Vance”) (see Investment Management Affiliates definition below) |
| What we do |
How does Eaton Vance
protect my personal
information? | To protect your personal information from unauthorized access and use, we use security measures that comply with federal law. These measures include computer safeguards and secured files and buildings. We have policies governing the proper handling of customer information by personnel and requiring third parties that provide support to adhere to appropriate security standards with respect to such information. |
How does Eaton Vance
collect my personal
information? | We collect your personal information, for example, when you■ open an account or make deposits or withdrawals from your account
■ buy securities from us or make a wire transfer
■ give us your contact informationWe also collect your personal information from others, such as credit bureaus, affiliates, or other companies. |
| Why can’t I limit all sharing? | Federal law gives you the right to limit only■ sharing for affiliates’ everyday business purposes — information about your creditworthiness
■ affiliates from using your information to market to you
■ sharing for nonaffiliates to market to youState laws and individual companies may give you additional rights to limit sharing. See below for more on your rights under state law. |
| Definitions |
Investment Management
Affiliates | Eaton Vance Investment Management Affiliates include registered investment advisers, registered broker- dealers, and registered and unregistered funds. Investment Management Affiliates does not include entities associated with Morgan Stanley Wealth Management, such as Morgan Stanley Smith Barney LLC and Morgan Stanley & Co. |
| Affiliates | Companies related by common ownership or control. They can be financial and nonfinancial companies.■ Our affiliates include companies with a Morgan Stanley name and financial companies such as Morgan Stanley Smith Barney LLC and Morgan Stanley & Co. |
| Nonaffiliates | Companies not related by common ownership or control. They can be financial and nonfinancial companies.■ Eaton Vance does not share with nonaffiliates so they can market to you. |
| Joint marketing | A formal agreement between nonaffiliated financial companies that together market financial products or services to you.■ Eaton Vance doesn’t jointly market. |
| Other important information |
| Vermont: Except as permitted by law, we will not share personal information we collect about Vermont residents with Nonaffiliates unless you provide us with your written consent to share such information.California: Except as permitted by law, we will not share personal information we collect about California residents with Nonaffiliates and we will limit sharing such personal information with our Affiliates to comply with California privacy laws that apply to us. |
Delivery of Shareholder Documents. The Securities and Exchange Commission (SEC) permits funds to deliver only one copy of shareholder documents, including prospectuses, proxy statements and shareholder reports, to fund investors with multiple accounts at the same residential or post office box address. This practice is often called “householding” and it helps eliminate duplicate mailings to shareholders. Eaton Vance, or your financial intermediary, may household the mailing of your documents indefinitely unless you instruct Eaton Vance, or your financial intermediary, otherwise. If you would prefer that your Eaton Vance documents not be householded, please contact Eaton Vance at 1-800-262-1122, or contact your financial intermediary. Your instructions that householding not apply to delivery of your Eaton Vance documents will typically be effective within 30 days of receipt by Eaton Vance or your financial intermediary.
Portfolio Holdings. Each Eaton Vance Fund and its underlying Portfolio(s) (if applicable) files a schedule of portfolio holdings on Part F to Form N-PORT with the SEC. Certain information filed on Form N-PORT may be viewed on the Eaton Vance website at www.eatonvance.com, by calling Eaton Vance at 1-800-262-1122 or in the EDGAR database on the SEC’s website at www.sec.gov.
Proxy Voting. From time to time, funds are required to vote proxies related to the securities held by the funds. The Eaton Vance Funds or their underlying Portfolios (if applicable) vote proxies according to a set of policies and procedures approved by the Funds’ and Portfolios’ Boards. You may obtain a description of these policies and procedures and information on how the Funds or Portfolios voted proxies relating to portfolio securities during the most recent 12-month period ended June 30, without charge, upon request, by calling 1-800-262-1122 and by accessing the SEC’s website at www.sec.gov.
This Page Intentionally Left Blank
This Page Intentionally Left Blank
Investment Adviser of Core Bond Portfolio
Boston Management and Research
Two International Place
Boston, MA 02110
Investment Adviser and Administrator of Eaton Vance Core Bond Fund
Eaton Vance Management
Two International Place
Boston, MA 02110
Principal Underwriter*
Eaton Vance Distributors, Inc.
Two International Place
Boston, MA 02110
(617) 482-8260
Custodian
State Street Bank and Trust Company
State Street Financial Center, One Lincoln Street
Boston, MA 02111
Transfer Agent
BNY Mellon Investment Servicing (US) Inc.
Attn: Eaton Vance Funds
P.O. Box 534439
Pittsburgh, PA 15253-4439
(800) 262-1122
Independent Registered Public Accounting Firm
Deloitte & Touche LLP
200 Berkeley Street
Boston, MA 02116-5022
Fund Offices
Two International Place
Boston, MA 02110
* FINRA BrokerCheck. Investors may check the background of their Investment Professional by contacting the Financial Industry Regulatory Authority (FINRA). FINRA BrokerCheck is a free tool to help investors check the professional background of current and former FINRA-registered securities firms and brokers. FINRA BrokerCheck is available by calling 1-800-289-9999 and at www.FINRA.org. The FINRA BrokerCheck brochure describing this program is available to investors at www.FINRA.org.
Eaton Vance
Greater India Fund
Annual Report
December 31, 2022
Commodity Futures Trading Commission Registration. The Commodity Futures Trading Commission (“CFTC”) has adopted regulations that subject registered investment companies and advisers to regulation by the CFTC if a fund invests more than a prescribed level of its assets in certain CFTC-regulated instruments (including futures, certain options and swap agreements) or markets itself as providing investment exposure to such instruments. The investment adviser has claimed an exclusion from the definition of “commodity pool operator” under the Commodity Exchange Act with respect to its management of the Fund. Accordingly, neither the Fund nor the adviser with respect to the operation of the Fund is subject to CFTC regulation. Because of its management of other strategies, the Fund's adviser and Goldman Sachs Asset Management, L.P. (GSAM), sub-adviser to the Fund, are registered with the CFTC as commodity pool operators. The adviser and GSAM are also registered as commodity trading advisors.
Fund shares are not insured by the FDIC and are not deposits or other obligations of, or guaranteed by, any depository institution. Shares are subject to investment risks, including possible loss of principal invested.
This report must be preceded or accompanied by a current summary prospectus or prospectus. Before investing, investors should consider carefully the investment objective, risks, and charges and expenses of a mutual fund. This and other important information is contained in the summary prospectus and prospectus, which can be obtained from a financial intermediary. Prospective investors should read the prospectus carefully before investing. For further information, please call 1-800-262-1122.
Annual Report December 31, 2022
Eaton Vance
Greater India Fund
Eaton Vance
Greater India Fund
December 31, 2022
Management’s Discussion of Fund Performance†
Economic and Market Conditions
For the 12-month period starting January 1, 2022, major global factors influenced economies and investment markets in both India and around the world. The period was dominated by high inflation and assertive attempts by central banks worldwide to tame runaway prices by raising interest rates to intentionally slow consumer demand. Russia’s invasion of Ukraine in February exacerbated the inflationary pressures on businesses struggling to rebound from the COVID-19 pandemic.
In India, supply-side disruptions due to geopolitical tensions caused an uptick in energy and commodity prices during the period. Core inflation -- excluding food, fuel, and tobacco -- hovered above the Reserve Bank of India’s (RBI’s) 2%-6% target range, which weighed on investor demand during the period and posed delicate challenges for policymakers.
In line with other central banks around the world, the RBI hiked interest rates to seek to absorb some of the inflationary fallout from these global events, kicking off an aggressive monetary-tightening cycle. In November 2022, inflation showed signs of easing as the Consumer Price Index (CPI) declined sharply to an annualized rate of 5.9% -- within the upper-range of the RBI’s target.
Against this challenging macroeconomic backdrop, Indian equities returned -7.95% during the period, according to the MSCI India Index (the Index). While absolute performance was muted, India outperformed other larger emerging markets for the second consecutive year, driven by strong domestic fundamentals during the period.
On a currency level, the Indian rupee suffered its worst relative performance since 2013, depreciating 10% against the U.S. dollar, and 5% against the euro. Still, the rupee was the best-performing currency within the Asia-Pacific region during the period.
India’s current account deficit widened to a record high $36.4 billion during the period, accounting for 4.4% of its gross domestic product, or GDP. India’s merchandise trade deficit contracted in November, driven by lower imports. Meanwhile, service exports grew about 30% due to an increase in the sales of software, business, and travel services overseas.
During the period, the best-performing sectors were utilities and industrials, while the worst-performing sectors were information technology and real estate.
For the period as a whole, the MSCI World Index, a broad measure of global equities, returned -18.14%; while the S&P 500® Index returned -18.11%; and the Nasdaq Composite Index returned -32.54%. The MSCI EAFE Index of developed-market international equities returned -14.45%, while the MSCI Emerging Markets Index returned -20.09%, and the MSCI Frontier Markets Index returned -26.34%.
Fund Performance
For the 12-month period ended December 31, 2022, Eaton Vance Greater India Fund (the Fund) returned -15.54% for Class A shares at net asset value (NAV), underperforming its benchmark, the Index, which returned -7.95%.
At the sector level, the Fund’s positions in consumer discretionary and industrials were the largest detractors from performance relative to the Index, while the financials and health care sectors were the largest contributors to relative returns during the period.
In the information technology (IT) sector, the Fund’s overweight position in Infosys, Ltd. (Infosys) was the top detractor from relative returns during the period. Infosys derives a major part of its revenues by providing IT consulting and business outsourcing services to developed markets, especially the U.S. and Europe. The IT sector underperformed the Index during the period amid multiple economic concerns -- higher interest rates, steep valuations, and fears that companies might reduce their IT budgets as global growth slowed.
In the consumer discretionary sector, the Fund’s overweight position in Zomato, Ltd. (Zomato), a multinational food-delivery company, also detracted from returns relative to the Index during the period. Zomato’s digital business model was hurt as consumer demand for online orders and deliveries slowed as economies worldwide began to emerge from the depths of COVID-19. In addition, news that Zomato planned to acquire Blinkit, a provider of online food services, generally was not well received by investors.
On the upside, an overweight position in Axis Bank, Ltd. (Axis Bank) was the largest contributor to returns relative to the Index during the period. Axis Bank’s stock price surged to an all-time high as the private bank reaped the benefits of structural sector-tailwinds and its initiatives on the digital front to increase growth and profitability.
Also in the financials sector, an overweight position in ICICI Bank, Ltd. contributed to relative returns during a period when the private Indian bank reported strong operational performance.
See Endnotes and Additional Disclosures in this report.
Past performance is no guarantee of future results. Returns are historical and are calculated by determining the percentage change in net asset value (NAV) or offering price (as applicable) with all distributions reinvested. Furthermore, returns do not reflect the deduction of taxes that shareholders may have to pay on Fund distributions or upon the redemption of Fund shares. Investment return and principal value will fluctuate so that shares, when redeemed, may be worth more or less than their original cost. Performance for periods less than or equal to one year is cumulative. Performance is for the stated time period only; due to market volatility, current Fund performance may be lower or higher than the quoted return. For performance as of the most recent month-end, please refer to eatonvance.com.
Eaton Vance
Greater India Fund
December 31, 2022
Performance
Portfolio Manager(s) Hiren Dasani, CFA, of Goldman Sachs Asset Management, L.P. (GSAM)
| % Average Annual Total Returns1,2 | Class
Inception Date | Performance
Inception Date | One Year | Five Years | Ten Years |
| Class A at NAV | 05/02/1994 | 05/02/1994 | (15.54)% | 2.89% | 7.39% |
| Class A with 5.25% Maximum Sales Charge | — | — | (19.97) | 1.79 | 6.81 |
| Class C at NAV | 07/07/2006 | 05/02/1994 | (16.10) | 2.18 | 6.79 |
| Class C with 1% Maximum Deferred Sales Charge | — | — | (16.76) | 2.18 | 6.79 |
| Class I at NAV | 10/01/2009 | 05/02/1994 | (14.66) | 3.34 | 7.78 |
|
| MSCI India Index | — | — | (7.95)% | 6.01% | 7.43% |
| % Total Annual Operating Expense Ratios3 | Class A | Class C | Class I |
| | 1.49% | 2.24% | 1.24% |
Growth of $10,000
This graph shows the change in value of a hypothetical investment of $10,000 in Class A of the Fund for the period indicated. For comparison, the same investment is shown in the indicated index.
| Growth of Investment | Amount Invested | Period Beginning | At NAV | With Maximum Sales Charge |
| Class C | $10,000 | 12/31/2012 | $19,293 | N.A. |
| Class I, at minimum investment | $1,000,000 | 12/31/2012 | $2,116,198 | N.A. |
See Endnotes and Additional Disclosures in this report.
Past performance is no guarantee of future results. Returns are historical and are calculated by determining the percentage change in net asset value (NAV) or offering price (as applicable) with all distributions reinvested. Furthermore, returns do not reflect the deduction of taxes that shareholders may have to pay on Fund distributions or upon the redemption of Fund shares. Investment return and principal value will fluctuate so that shares, when redeemed, may be worth more or less than their original cost. Performance for periods less than or equal to one year is cumulative. Performance is for the stated time period only; due to market volatility, current Fund performance may be lower or higher than the quoted return. For performance as of the most recent month-end, please refer to eatonvance.com.
Eaton Vance
Greater India Fund
December 31, 2022
| Sector Allocation (% of net assets)1 |
| Top 10 Holdings (% of net assets)1 |
| ICICI Bank, Ltd. | 10.4% |
| Infosys, Ltd. | 10.0 |
| Axis Bank, Ltd. | 7.0 |
| Reliance Industries, Ltd. | 6.6 |
| Bharti Airtel, Ltd. | 3.7 |
| HDFC Bank, Ltd. | 3.4 |
| State Bank of India | 3.3 |
| Sun Pharmaceutical Industries, Ltd. | 3.1 |
| Mahindra & Mahindra, Ltd. | 2.7 |
| HCL Technologies, Ltd. | 2.7 |
| Total | 52.9% |
Footnotes:
Fund invests in an affiliated investment company (Portfolio) with the same objective(s) and policies as the Fund. References to investments are to the Portfolio’s holdings.
| 1 | Excludes cash and cash equivalents. |
Eaton Vance
Greater India Fund
December 31, 2022
Endnotes and Additional Disclosures
| † | The views expressed in this report are those of the portfolio manager(s) and are current only through the date stated at the top of this page. These views are subject to change at any time based upon market or other conditions, and Eaton Vance and the Fund(s) disclaim any responsibility to update such views. These views may not be relied upon as investment advice and, because investment decisions are based on many factors, may not be relied upon as an indication of trading intent on behalf of any Eaton Vance fund. This commentary may contain statements that are not historical facts, referred to as “forward-looking statements.” The Fund’s actual future results may differ significantly from those stated in any forward-looking statement, depending on factors such as changes in securities or financial markets or general economic conditions, the volume of sales and purchases of Fund shares, the continuation of investment advisory, administrative and service contracts, and other risks discussed from time to time in the Fund’s filings with the Securities and Exchange Commission. |
| | |
| 1 | MSCI India Index is an unmanaged index of common stocks traded in the India market. MSCI indexes are net of foreign withholding taxes. Source: MSCI. MSCI data may not be reproduced or used for any other purpose. MSCI provides no warranties, has not prepared or approved this report, and has no liability hereunder. Unless otherwise stated, index returns do not reflect the effect of any applicable sales charges, commissions, expenses, taxes or leverage, as applicable. It is not possible to invest directly in an index. |
| 2 | Total Returns at NAV do not include applicable sales charges. If sales charges were deducted, the returns would be lower. Total Returns shown with maximum sales charge reflect the stated maximum sales charge. Unless otherwise stated, performance does not reflect the deduction of taxes on Fund distributions or redemptions of Fund shares.Effective November 5, 2020, Class C shares automatically convert to Class A shares eight years after purchase. The average annual total returns listed for Class C reflect conversion to Class A shares after eight years. Prior to November 5, 2020, Class C shares automatically converted to Class A shares ten years after purchase.Effective September 15, 2016, Goldman Sachs Asset Management International (GSAM beginning October 19, 2017) began sub-advising the Fund. Performance prior to September 15, 2016, reflects the Fund’s performance under a former sub-adviser. |
| 3 | Source: Fund prospectus. The expense ratios for the current reporting period can be found in the Financial Highlights section of this report. Performance reflects expenses waived and/or reimbursed, if applicable. Without such waivers and/or reimbursements, performance would have been lower. |
| | Fund profile subject to change due to active management. |
| | Additional Information |
| | MSCI World Index is an unmanaged index of equity securities in the developed markets. MSCI EAFE Index is an unmanaged index of equities in the developed markets, excluding the U.S. and Canada. MSCI Emerging Markets Index is an unmanaged index of emerging markets common stocks. MSCI Frontier Markets Index is an unmanaged index that measures the performance of stock markets with less-developed economies and financial markets than emerging markets, and that typically have more restrictions on foreign stock ownership. S&P 500® Index is an unmanaged index of large-cap stocks commonly used as a measure of U.S. stock market performance. S&P Dow Jones Indices are a product of S&P Dow Jones Indices LLC (“S&P DJI”) and have been licensed for use. S&P® and S&P 500® are registered trademarks of S&P DJI; Dow Jones® is a registered trademark of Dow Jones Trademark Holdings LLC (“Dow Jones”); S&P DJI, Dow Jones and their respective affiliates do not sponsor, endorse, sell or promote the Fund, will not have any liability with respect thereto and do not have any liability for any errors, omissions, or interruptions of the S&P Dow Jones Indices. Nasdaq Composite Index is a market capitalization-weighted index of all domestic and international securities listed on Nasdaq. Source:
Nasdaq, Inc. The information is provided by Nasdaq (with its affiliates, are referred to as the “Corporations”) and Nasdaq's third party licensors on an “as is” basis and the Corporations make no guarantees and bear no liability of any kind with respect to the information or the Fund. |
Eaton Vance
Greater India Fund
December 31, 2022
Example
As a Fund shareholder, you incur two types of costs: (1) transaction costs, including sales charges (loads) on purchases; and (2) ongoing costs, including management fees; distribution and/or service fees; and other Fund expenses. This Example is intended to help you understand your ongoing costs (in dollars) of Fund investing and to compare these costs with the ongoing costs of investing in other mutual funds. The Example is based on an investment of $1,000 invested at the beginning of the period and held for the entire period (July 1, 2022 to December 31, 2022).
Actual Expenses
The first section of the table below provides information about actual account values and actual expenses. You may use the information in this section, together with the amount you invested, to estimate the expenses that you paid over the period. Simply divide your account value by $1,000 (for example, an $8,600 account value divided by $1,000 = 8.6), then multiply the result by the number in the first section under the heading entitled “Expenses Paid During Period” to estimate the expenses you paid on your account during this period.
Hypothetical Example for Comparison Purposes
The second section of the table below provides information about hypothetical account values and hypothetical expenses based on the actual Fund expense ratio and an assumed rate of return of 5% per year (before expenses), which is not the actual Fund return. The hypothetical account values and expenses may not be used to estimate the actual ending account balance or expenses you paid for the period. You may use this information to compare the ongoing costs of investing in your Fund and other funds. To do so, compare this 5% hypothetical example with the 5% hypothetical examples that appear in the shareholder reports of the other funds.
Please note that the expenses shown in the table are meant to highlight your ongoing costs only and do not reflect any transactional costs, such as sales charges (loads). Therefore, the second section of the table is useful in comparing ongoing costs only, and will not help you determine the relative total costs of owning different funds. In addition, if these transactional costs were included, your costs would be higher.
| | Beginning
Account Value
(7/1/22) | Ending
Account Value
(12/31/22) | Expenses Paid
During Period*
(7/1/22 – 12/31/22) | Annualized
Expense
Ratio |
| Actual | | | | |
| Class A | $1,000.00 | $1,073.80 | $ 8.31 | 1.59% |
| Class C | $1,000.00 | $1,068.30 | $12.20 | 2.34% |
| Class I | $1,000.00 | $1,078.30 | $ 7.02 | 1.34% |
| |
| Hypothetical | | | | |
| (5% return per year before expenses) | | | | |
| Class A | $1,000.00 | $1,017.19 | $ 8.08 | 1.59% |
| Class C | $1,000.00 | $1,013.41 | $11.88 | 2.34% |
| Class I | $1,000.00 | $1,018.45 | $ 6.82 | 1.34% |
| * | Expenses are equal to the Fund's annualized expense ratio for the indicated Class, multiplied by the average account value over the period, multiplied by 184/365 (to reflect the one-half year period). The Example assumes that the $1,000 was invested at the net asset value per share determined at the close of business on June 30, 2022. The Example reflects the expenses of both the Fund and the Portfolio. |
Eaton Vance
Greater India Fund
December 31, 2022
Statement of Assets and Liabilities
| | December 31, 2022 |
| Assets | |
| Investment in Greater India Portfolio, at value (identified cost $146,217,868) | $ 187,201,783 |
| Receivable for Fund shares sold | 832,696 |
| Total assets | $188,034,479 |
| Liabilities | |
| Payable for Fund shares redeemed | $ 1,278,080 |
| Payable to affiliates: | |
| Administration fee | 24,553 |
| Distribution and service fees | 33,386 |
| Trustees' fees | 125 |
| Accrued expenses | 108,440 |
| Total liabilities | $ 1,444,584 |
| Net Assets | $186,589,895 |
| Sources of Net Assets | |
| Paid-in capital | $ 142,827,120 |
| Distributable earnings | 43,762,775 |
| Net Assets | $186,589,895 |
| Class A Shares | |
| Net Assets | $ 129,752,025 |
| Shares Outstanding | 4,207,222 |
Net Asset Value and Redemption Price Per Share
(net assets ÷ shares of beneficial interest outstanding) | $ 30.84 |
Maximum Offering Price Per Share
(100 ÷ 94.75 of net asset value per share) | $ 32.55 |
| Class C Shares | |
| Net Assets | $ 5,465,466 |
| Shares Outstanding | 224,919 |
Net Asset Value and Offering Price Per Share*
(net assets ÷ shares of beneficial interest outstanding) | $ 24.30 |
| Class I Shares | |
| Net Assets | $ 51,372,404 |
| Shares Outstanding | 1,586,489 |
Net Asset Value, Offering Price and Redemption Price Per Share
(net assets ÷ shares of beneficial interest outstanding) | $ 32.38 |
| On sales of $50,000 or more, the offering price of Class A shares is reduced. |
| * | Redemption price per share is equal to the net asset value less any applicable contingent deferred sales charge. |
7
See Notes to Financial Statements.
Eaton Vance
Greater India Fund
December 31, 2022
| | Year Ended |
| | December 31, 2022 |
| Investment Income | |
| Dividend income allocated from Portfolio (net of foreign taxes withheld of $405,653) | $ 1,438,065 |
| Expenses allocated from Portfolio | (2,150,639) |
| Total investment loss from Portfolio | $ (712,574) |
| Expenses | |
| Administration fee | $ 334,440 |
| Distribution and service fees: | |
| Class A | 412,890 |
| Class C | 72,916 |
| Trustees’ fees and expenses | 500 |
| Custodian fee | 23,156 |
| Transfer and dividend disbursing agent fees | 220,957 |
| Legal and accounting services | 50,383 |
| Printing and postage | 36,725 |
| Registration fees | 51,260 |
| Miscellaneous | 11,952 |
| Total expenses | $ 1,215,179 |
| Net investment loss | $ (1,927,753) |
| Realized and Unrealized Gain (Loss) from Portfolio | |
| Net realized gain (loss): | |
| Investment transactions (net of foreign capital gains taxes of $3,363,845) | $ 21,028,311 |
| Futures contracts | (320,879) |
| Foreign currency transactions | (109,219) |
| Net realized gain | $ 20,598,213 |
| Change in unrealized appreciation (depreciation): | |
| Investments (including net decrease in accrued foreign capital gains taxes of $6,533,083) | $ (60,207,398) |
| Futures contracts | (8,409) |
| Foreign currency | (4,011) |
| Net change in unrealized appreciation (depreciation) | $(60,219,818) |
| Net realized and unrealized loss | $(39,621,605) |
| Net decrease in net assets from operations | $(41,549,358) |
8
See Notes to Financial Statements.
Eaton Vance
Greater India Fund
December 31, 2022
Statements of Changes in Net Assets
| | Year Ended December 31, |
| | 2022 | 2021 |
| Increase (Decrease) in Net Assets | | |
| From operations: | | |
| Net investment loss | $ (1,927,753) | $ (2,439,847) |
| Net realized gain | 20,598,213 | 40,770,335 |
| Net change in unrealized appreciation (depreciation) | (60,219,818) | 20,398,858 |
| Net increase (decrease) in net assets from operations | $ (41,549,358) | $ 58,729,346 |
| Distributions to shareholders: | | |
| Class A | $ (24,253,948) | $ (15,279,756) |
| Class C | (1,281,257) | (903,171) |
| Class I | (9,404,928) | (7,991,474) |
| Total distributions to shareholders | $ (34,940,133) | $ (24,174,401) |
| Transactions in shares of beneficial interest: | | |
| Class A | $ (120,185) | $ 4,517,234 |
| Class C | (968,614) | 743,038 |
| Class I | (23,569,893) | 14,897,289 |
| Contributed capital from affiliate for shares redeemed: | | |
| Class A | 176,145 | 881,304 |
| Class C | 23,690 | 86,067 |
| Class I | 769,087 | 1,786,810 |
| Net increase (decrease) in net assets from Fund share transactions | $ (23,689,770) | $ 22,911,742 |
| Net increase (decrease) in net assets | $(100,179,261) | $ 57,466,687 |
| Net Assets | | |
| At beginning of year | $ 286,769,156 | $ 229,302,469 |
| At end of year | $ 186,589,895 | $286,769,156 |
9
See Notes to Financial Statements.
Eaton Vance
Greater India Fund
December 31, 2022
| | Class A |
| | Year Ended December 31, |
| | 2022 | 2021 | 2020 | 2019 | 2018 |
| Net asset value — Beginning of year | $ 44.090 | $ 38.790 | $ 34.300 | $ 32.020 | $ 36.830 |
| Income (Loss) From Operations | | | | | |
| Net investment loss(1) | $ (0.356) | $ (0.425) | $ (0.237) | $ (0.188) | $ (0.150) |
| Net realized and unrealized gain (loss) | (6.225) | 9.728 | 4.823 | 3.424 | (4.284) |
| Total income (loss) from operations | $ (6.581) | $ 9.303 | $ 4.586 | $ 3.236 | $ (4.434) |
| Less Distributions | | | | | |
| From net investment income | $ (0.756) | $ — | $ — | $ — | $ (0.376) |
| From net realized gain | (5.913) | (4.003) | (0.096) | (0.956) | — |
| Total distributions | $ (6.669) | $ (4.003) | $ (0.096) | $ (0.956) | $ (0.376) |
| Net asset value — End of year | $ 30.840 | $ 44.090 | $ 38.790 | $ 34.300 | $ 32.020 |
| Total Return(2) | (15.54)% | 24.04% | 13.42% | 10.46% | (12.13)% |
| Ratios/Supplemental Data | | | | | |
| Net assets, end of year (000’s omitted) | $129,752 | $181,368 | $155,011 | $163,335 | $152,967 |
| Ratios (as a percentage of average daily net assets):(3) | | | | | |
| Expenses | 1.57% (4) | 1.54% | 1.56% | 1.63% | 1.62% |
| Net investment loss | (0.93)% | (0.98)% | (0.75)% | (0.58)% | (0.44)% |
| Portfolio Turnover of the Portfolio | 17% | 33% | 26% | 21% | 29% |
| (1) | Computed using average shares outstanding. |
| (2) | Returns are historical and are calculated by determining the percentage change in net asset value with all distributions reinvested and do not reflect the effect of sales charges. |
| (3) | Includes the Fund's share of the Portfolio's allocated expenses. |
| (4) | Includes a reduction by the investment adviser of a portion of the Portfolio's adviser fee due to the Portfolio's investment in the Liquidity Fund (equal to less than 0.005% of average daily net assets for the year ended December 31, 2022). |
10
See Notes to Financial Statements.
Eaton Vance
Greater India Fund
December 31, 2022
Financial Highlights — continued
| | Class C |
| | Year Ended December 31, |
| | 2022 | 2021 | 2020 | 2019 | 2018 |
| Net asset value — Beginning of year | $ 36.390 | $ 32.810 | $ 29.230 | $ 27.620 | $ 32.050 |
| Income (Loss) From Operations | | | | | |
| Net investment loss(1) | $ (0.520) | $ (0.616) | $ (0.385) | $ (0.363) | $ (0.334) |
| Net realized and unrealized gain (loss) | (5.065) | 8.199 | 4.061 | 2.929 | (3.720) |
| Total income (loss) from operations | $ (5.585) | $ 7.583 | $ 3.676 | $ 2.566 | $ (4.054) |
| Less Distributions | | | | | |
| From net investment income | $ (0.592) | $ — | $ — | $ — | $ (0.376) |
| From net realized gain | (5.913) | (4.003) | (0.096) | (0.956) | — |
| Total distributions | $ (6.505) | $ (4.003) | $ (0.096) | $ (0.956) | $ (0.376) |
| Net asset value — End of year | $24.300 | $36.390 | $32.810 | $29.230 | $27.620 |
| Total Return(2) | (16.10)% | 23.17% | 12.64% | 9.69% | (12.76)% |
| Ratios/Supplemental Data | | | | | |
| Net assets, end of year (000’s omitted) | $ 5,465 | $ 9,181 | $ 7,548 | $ 11,898 | $ 21,891 |
| Ratios (as a percentage of average daily net assets):(3) | | | | | |
| Expenses | 2.29% (4) | 2.24% | 2.26% | 2.33% | 2.32% |
| Net investment loss | (1.64)% | (1.69)% | (1.44)% | (1.30)% | (1.14)% |
| Portfolio Turnover of the Portfolio | 17% | 33% | 26% | 21% | 29% |
| (1) | Computed using average shares outstanding. |
| (2) | Returns are historical and are calculated by determining the percentage change in net asset value with all distributions reinvested and do not reflect the effect of sales charges. |
| (3) | Includes the Fund's share of the Portfolio's allocated expenses. |
| (4) | Includes a reduction by the investment adviser of a portion of the Portfolio's adviser fee due to the Portfolio's investment in the Liquidity Fund (equal to less than 0.005% of average daily net assets for the year ended December 31, 2022). |
11
See Notes to Financial Statements.
Eaton Vance
Greater India Fund
December 31, 2022
Financial Highlights — continued
| | Class I |
| | Year Ended December 31, |
| | 2022 | 2021 | 2020 | 2019 | 2018 |
| Net asset value — Beginning of year | $ 45.600 | $ 39.920 | $ 35.190 | $ 32.730 | $ 37.520 |
| Income (Loss) From Operations | | | | | |
| Net investment loss(1) | $ (0.257) | $ (0.298) | $ (0.148) | $ (0.092) | $ (0.047) |
| Net realized and unrealized gain (loss) | (6.170) | 9.981 | 4.974 | 3.508 | (4.367) |
| Total income (loss) from operations | $ (6.427) | $ 9.683 | $ 4.826 | $ 3.416 | $ (4.414) |
| Less Distributions | | | | | |
| From net investment income | $ (0.880) | $ — | $ — | $ — | $ (0.376) |
| From net realized gain | (5.913) | (4.003) | (0.096) | (0.956) | — |
| Total distributions | $ (6.793) | $ (4.003) | $ (0.096) | $ (0.956) | $ (0.376) |
| Net asset value — End of year | $32.380 | $45.600 | $39.920 | $35.190 | $32.730 |
| Total Return(2) | (14.66)% | 24.31% | 13.77% | 10.79% | (11.85)% |
| Ratios/Supplemental Data | | | | | |
| Net assets, end of year (000’s omitted) | $ 51,372 | $ 96,220 | $ 66,744 | $ 40,761 | $ 37,330 |
| Ratios (as a percentage of average daily net assets):(3) | | | | | |
| Expenses | 1.28% (4) | 1.24% | 1.26% | 1.33% | 1.32% |
| Net investment loss | (0.64)% | (0.66)% | (0.45)% | (0.27)% | (0.14)% |
| Portfolio Turnover of the Portfolio | 17% | 33% | 26% | 21% | 29% |
| (1) | Computed using average shares outstanding. |
| (2) | Returns are historical and are calculated by determining the percentage change in net asset value with all distributions reinvested. |
| (3) | Includes the Fund's share of the Portfolio's allocated expenses. |
| (4) | Includes a reduction by the investment adviser of a portion of the Portfolio's adviser fee due to the Portfolio's investment in the Liquidity Fund (equal to less than 0.005% of average daily net assets for the year ended December 31, 2022). |
12
See Notes to Financial Statements.
Eaton Vance
Greater India Fund
December 31, 2022
Notes to Financial Statements
1 Significant Accounting Policies
Eaton Vance Greater India Fund (the Fund) is a non-diversified series of Eaton Vance Special Investment Trust (the Trust). The Trust is a Massachusetts business trust registered under the Investment Company Act of 1940, as amended (the 1940 Act), as an open-end management investment company. The Fund offers three classes of shares. Class A shares are generally sold subject to a sales charge imposed at time of purchase. Class C shares are sold at net asset value and are generally subject to a contingent deferred sales charge (see Note 5). Effective November 5, 2020, Class C shares automatically convert to Class A shares eight years after their purchase as described in the Fund’s prospectus. Class I shares are sold at net asset value and are not subject to a sales charge. Each class represents a pro-rata interest in the Fund, but votes separately on class-specific matters and (as noted below) is subject to different expenses. Realized and unrealized gains and losses and net investment income and losses, other than class-specific expenses, are allocated daily to each class of shares based on the relative net assets of each class to the total net assets of the Fund. Each class of shares differs in its distribution plan and certain other class-specific expenses. The Fund invests all of its investable assets in interests in Greater India Portfolio (the Portfolio), a Massachusetts business trust, having the same investment objective and policies as the Fund. The value of the Fund’s investment in the Portfolio reflects the Fund’s proportionate interest in the net assets of the Portfolio (99.9% at December 31, 2022). The performance of the Fund is directly affected by the performance of the Portfolio. The financial statements of the Portfolio, including the portfolio of investments, are included elsewhere in this report and should be read in conjunction with the Fund’s financial statements.
The following is a summary of significant accounting policies of the Fund. The policies are in conformity with accounting principles generally accepted in the United States of America (U.S. GAAP). The Fund is an investment company and follows accounting and reporting guidance in the Financial Accounting Standards Board (FASB) Accounting Standards Codification Topic 946.
A Investment Valuation—Valuation of securities by the Portfolio is discussed in Note 1A of the Portfolio's Notes to Financial Statements, which are included elsewhere in this report.
B Income—The Fund's net investment income or loss consists of the Fund's pro-rata share of the net investment income or loss of the Portfolio, less all actual and accrued expenses of the Fund.
C Federal and Other Taxes—The Fund’s policy is to comply with the provisions of the Internal Revenue Code applicable to regulated investment companies and to distribute to shareholders each year substantially all of its net investment income, and all or substantially all of its net realized capital gains. Accordingly, no provision for federal income or excise tax is necessary.
In addition to the requirements of the Internal Revenue Code, the Fund may also be required to recognize its pro-rata share of the capital gains taxes incurred by the Portfolio. In doing so, the daily net asset value would reflect the Fund’s pro-rata share of the estimated reserve for such taxes incurred by the Portfolio.
As of December 31, 2022, the Fund had no uncertain tax positions that would require financial statement recognition, de-recognition, or disclosure. The Fund files a U.S. federal income tax return annually after its fiscal year-end, which is subject to examination by the Internal Revenue Service for a period of three years from the date of filing.
D Expenses—The majority of expenses of the Trust are directly identifiable to an individual fund. Expenses which are not readily identifiable to a specific fund are allocated taking into consideration, among other things, the nature and type of expense and the relative size of the funds.
E Use of Estimates—The preparation of the financial statements in conformity with U.S. GAAP requires management to make estimates and assumptions that affect the reported amounts of assets and liabilities at the date of the financial statements and the reported amounts of income and expense during the reporting period. Actual results could differ from those estimates.
F Indemnifications—Under the Trust’s organizational documents, its officers and Trustees may be indemnified against certain liabilities and expenses arising out of the performance of their duties to the Fund. Under Massachusetts law, if certain conditions prevail, shareholders of a Massachusetts business trust (such as the Trust) could be deemed to have personal liability for the obligations of the Trust. However, the Trust’s Declaration of Trust contains an express disclaimer of liability on the part of Fund shareholders and the By-laws provide that the Trust shall assume, upon request by the shareholder, the defense on behalf of any Fund shareholders. Moreover, the By-laws also provide for indemnification out of Fund property of any shareholder held personally liable solely by reason of being or having been a shareholder for all loss or expense arising from such liability. Additionally, in the normal course of business, the Fund enters into agreements with service providers that may contain indemnification clauses. The Fund's maximum exposure under these arrangements is unknown as this would involve future claims that may be made against the Fund that have not yet occurred.
G Other—Investment transactions are accounted for on a trade date basis.
Eaton Vance
Greater India Fund
December 31, 2022
Notes to Financial Statements — continued
2 Distributions to Shareholders and Income Tax Information
It is the present policy of the Fund to make at least one distribution annually (normally in December) of all or substantially all of its net investment income and to distribute annually all or substantially all of its net realized capital gains. Distributions to shareholders are recorded on the ex-dividend date. Distributions are declared separately for each class of shares. Shareholders may reinvest income and capital gain distributions in additional shares of the same class of the Fund at the net asset value as of the ex-dividend date or, at the election of the shareholder, receive distributions in cash. Distributions to shareholders are determined in accordance with income tax regulations, which may differ from U.S. GAAP. As required by U.S. GAAP, only distributions in excess of tax basis earnings and profits are reported in the financial statements as a return of capital. Permanent differences between book and tax accounting relating to distributions are reclassified to paid-in capital. For tax purposes, distributions from short-term capital gains are considered to be from ordinary income.
The tax character of distributions declared for the years ended December 31, 2022 and December 31, 2021 was as follows:
| | Year Ended December 31, |
| | 2022 | 2021 |
| Ordinary income | $ 6,024,316 | $ 3,002,551 |
| Long-term capital gains | $28,915,817 | $21,171,850 |
During the year ended December 31, 2022, distributable earnings was increased by $2,649,229 and paid-in capital was decreased by $2,649,229 due to the Fund's use of equalization accounting and differences between book and tax accounting for foreign tax credits and contributed capital. Tax equalization accounting allows the Fund to treat as a distribution that portion of redemption proceeds representing a redeeming shareholder’s portion of undistributed taxable income and net capital gains. These reclassifications had no effect on the net assets or net asset value per share of the Fund.
As of December 31, 2022, the components of distributable earnings (accumulated loss) on a tax basis were as follows:
| Undistributed long-term capital gains | $ 3,849,757 |
| Late year ordinary losses | (1,439,531) |
| Net unrealized appreciation | 41,352,549 |
| Distributable earnings | $43,762,775 |
At December 31, 2022, the Fund had a late year ordinary loss of $1,439,531, related to certain specified losses realized after October 31, 2022, which it has elected to defer to the following taxable year pursuant to income tax regulations.
3 Investment Adviser Fee and Other Transactions with Affiliates
The investment adviser fee is earned by Boston Management and Research (BMR), an indirect, wholly-owned subsidiary of Morgan Stanley, as compensation for investment advisory services rendered to the Fund. The fee is computed at an annual rate as a percentage of the Fund’s average daily net assets that are not invested in other investment companies for which BMR or its affiliates serve as investment adviser and receive an advisory fee as follows and is payable monthly:
| Average Daily Net Assets | Annual Fee Rate |
| Up to $500 million | 0.850% |
| $500 million but less than $1 billion | 0.800% |
| $1 billion but less than $2.5 billion | 0.775% |
| $2.5 billion but less than $5 billion | 0.750% |
| $5 billion and over | 0.730% |
For the year ended December 31, 2022, the Fund incurred no investment adviser fee on such assets. Pursuant to an investment sub-advisory agreement, BMR has delegated the investment management of the Fund to Goldman Sachs Asset Management, L.P. (GSAM). BMR pays GSAM a portion of its investment adviser fee for sub-advisory services provided to the Fund. To the extent the Fund’s assets are invested in the Portfolio, the Fund is allocated its pro-rata share of the Portfolio’s investment adviser fee. The Portfolio has engaged BMR to render investment advisory services. See Note 2 of the Portfolio’s
Eaton Vance
Greater India Fund
December 31, 2022
Notes to Financial Statements — continued
Notes to Financial Statements which are included elsewhere in this report. The administration fee is earned by Eaton Vance Management (EVM), an affiliate of BMR and an indirect, wholly-owned subsidiary of Morgan Stanley, for administering the business affairs of the Fund and is computed at an annual rate of 0.15% of the Fund’s average daily net assets. For the year ended December 31, 2022, the administration fee amounted to $334,440.
EVM provides sub-transfer agency and related services to the Fund pursuant to a Sub-Transfer Agency Support Services Agreement. For the year ended December 31, 2022, EVM earned $37,656 from the Fund pursuant to such agreement, which is included in transfer and dividend disbursing agent fees on the Statement of Operations. The Fund was informed that Eaton Vance Distributors, Inc. (EVD), an affiliate of EVM and the Fund’s principal underwriter, received $5,114 as its portion of the sales charge on sales of Class A shares for the year ended December 31, 2022. The Fund was informed that Morgan Stanley affiliated broker-dealers, which may be deemed to be affiliates of BMR, EVM and EVD, also received a portion of the sales charge on sales of Class A shares for the year ended December 31, 2022 in the the amount of $375. EVD also received distribution and service fees from Class A and Class C shares (see Note 4) and contingent deferred sales charges (see Note 5).
Trustees and officers of the Fund who are members of EVM’s or BMR’s organizations receive remuneration for their services to the Fund out of the investment adviser fee and administration fee. Certain officers and Trustees of the Fund and the Portfolio are officers of the above organizations.
4 Distribution Plans
The Fund has in effect a distribution plan for Class A shares (Class A Plan) pursuant to Rule 12b-1 under the 1940 Act. Pursuant to the Class A Plan, the Fund pays EVD a distribution and service fee of 0.25% per annum (0.30% per annum prior to July 1, 2022 when the distribution and service fee rate was reduced) of its average daily net assets attributable to Class A shares for distribution services and facilities provided to the Fund by EVD, as well as for personal services and/or the maintenance of shareholder accounts. Distribution and service fees paid or accrued to EVD for the year ended December 31, 2022 amounted to $412,890, representing 0.28% of the average daily net assets attributable to Class A shares.
The Fund also has in effect a distribution plan for Class C shares (Class C Plan) pursuant to Rule 12b-1 under the 1940 Act. Pursuant to the Class C Plan, the Fund pays EVD amounts equal to 0.75% per annum of its average daily net assets attributable to Class C shares for providing ongoing distribution services and facilities to the Fund. For the year ended December 31, 2022, the Fund paid or accrued to EVD $54,687 for Class C shares.
Pursuant to the Class C Plan, the Fund also makes payments of service fees to EVD, financial intermediaries and other persons in amounts equal to 0.25% per annum of its average daily net assets attributable to that class. Service fees paid or accrued are for personal services and/or the maintenance of shareholder accounts. They are separate and distinct from the sales commissions and distribution fees payable to EVD. Service fees paid or accrued for the year ended December 31, 2022 amounted to $18,229 for Class C shares.
Distribution and service fees are subject to the limitations contained in the Financial Industry Regulatory Authority Rule 2341(d).
5 Contingent Deferred Sales Charges
A contingent deferred sales charge (CDSC) of 1% generally is imposed on redemptions of Class C shares made within 12 months of purchase. Class A shares may be subject to a 1% CDSC if redeemed within 12 months (18 months prior to April 29, 2022) of purchase (depending on the circumstances of purchase). Generally, the CDSC is based upon the lower of the net asset value at date of redemption or date of purchase. No charge is levied on shares acquired by reinvestment of dividends or capital gain distributions. For the year ended December 31, 2022, the Fund was informed that EVD received approximately $1,000 of CDSCs paid by Class C shareholders and no CDSCs paid by Class A shareholders.
6 Investment Transactions
For the year ended December 31, 2022, increases and decreases in the Fund's investment in the Portfolio aggregated $16,606,183 and $73,220,373, respectively.
Eaton Vance
Greater India Fund
December 31, 2022
Notes to Financial Statements — continued
7 Shares of Beneficial Interest
The Fund’s Declaration of Trust permits the Trustees to issue an unlimited number of full and fractional shares of beneficial interest (without par value). Such shares may be issued in a number of different series (such as the Fund) and classes. Transactions in Fund shares, including direct exchanges pursuant to share class conversions for all periods presented, were as follows:
| | Year Ended
December 31, 2022 | | Year Ended
December 31, 2021 |
| | Shares | Amount | | Shares | Amount |
| Class A | | | | | |
| Sales | 199,682 | $ 8,180,108 | | 238,205 | $ 10,538,620 |
| Issued to shareholders electing to receive payments of distributions in Fund shares | 686,800 | 21,689,583 | | 318,323 | 13,799,306 |
| Redemptions | (793,176) | (29,989,876) | | (438,592) | (19,820,692) |
| Net increase (decrease) | 93,306 | $ (120,185) | | 117,936 | $ 4,517,234 |
| Class C | | | | | |
| Sales | 25,885 | $ 848,002 | | 47,927 | $ 1,751,246 |
| Issued to shareholders electing to receive payments of distributions in Fund shares | 49,502 | 1,281,257 | | 25,165 | 900,899 |
| Redemptions | (102,785) | (3,097,873) | | (50,822) | (1,909,107) |
| Net increase (decrease) | (27,398) | $ (968,614) | | 22,270 | $ 743,038 |
| Class I | | | | | |
| Sales | 703,566 | $ 29,872,335 | | 996,118 | $ 43,052,707 |
| Issued to shareholders electing to receive payments of distributions in Fund shares | 256,262 | 8,534,840 | | 161,306 | 7,234,565 |
| Redemptions | (1,483,298) | (61,977,068) | | (719,500) | (35,389,983) |
| Net increase (decrease) | (523,470) | $(23,569,893) | | 437,924 | $ 14,897,289 |
As disclosed in the Fund's December 31, 2021 financial statements, it was determined that the Fund's investment in the Portfolio was overstated, thereby resulting in an overstatement of the Fund's net assets and net asset value (NAV) per share for each class, because the Portfolio's accrual for foreign capital gains taxes had been understated since June 2, 2020. Since the amount of the misstatement was concluded to be material, the Fund's daily net assets and NAV per share for each class were revised from June 2, 2020 through December 31, 2021 and through the date of correction on March 7, 2022 (the error period), to reflect the correct accrual for foreign capital gains taxes.
In accordance with the Fund's NAV correction policy, the Fund reprocessed shareholder transactions during the year ended December 31, 2022 where shareholders were negatively impacted during the error period. In addition, EVM contributed capital to the Fund of $968,922 and $2,754,181 for the years ended December 31, 2022 and December 31, 2021, respectively, for overpayments to redeeming shareholders resulting from the overstatement of the Fund's net assets and NAV per share for each class during such periods. The amounts are reflected as Contributed capital from affiliate for shares redeemed on the Statements of Changes in Net Assets and were paid to the Fund in March 2022.
Eaton Vance
Greater India Fund
December 31, 2022
Report of Independent Registered Public Accounting Firm
To the Trustees of Eaton Vance Special Investment Trust and Shareholders of Eaton Vance Greater India Fund:
Opinion on the Financial Statements and Financial Highlights
We have audited the accompanying statement of assets and liabilities of Eaton Vance Greater India Fund (the “Fund”) (one of the funds constituting Eaton Vance Special Investment Trust), as of December 31, 2022, the related statement of operations for the year then ended, the statements of changes in net assets for each of the two years in the period then ended, the financial highlights for each of the five years in the period then ended, and the related notes. In our opinion, the financial statements and financial highlights present fairly, in all material respects, the financial position of the Fund as of December 31, 2022, and the results of its operations for the year then ended, the changes in its net assets for each of the two years in the period then ended, and the financial highlights for each of the five years in the period then ended, in conformity with accounting principles generally accepted in the United States of America.
Basis for Opinion
These financial statements and financial highlights are the responsibility of the Fund's management. Our responsibility is to express an opinion on the Fund's financial statements and financial highlights based on our audits. We are a public accounting firm registered with the Public Company Accounting Oversight Board (United States) (PCAOB) and are required to be independent with respect to the Fund in accordance with the U.S. federal securities laws and the applicable rules and regulations of the Securities and Exchange Commission and the PCAOB.
We conducted our audits in accordance with the standards of the PCAOB. Those standards require that we plan and perform the audit to obtain reasonable assurance about whether the financial statements and financial highlights are free of material misstatement, whether due to error or fraud. The Fund is not required to have, nor were we engaged to perform, an audit of its internal control over financial reporting. As part of our audits, we are required to obtain an understanding of internal control over financial reporting but not for the purpose of expressing an opinion on the effectiveness of the Fund’s internal control over financial reporting. Accordingly, we express no such opinion.
Our audits included performing procedures to assess the risks of material misstatement of the financial statements and financial highlights, whether due to error or fraud, and performing procedures that respond to those risks. Such procedures included examining, on a test basis, evidence regarding the amounts and disclosures in the financial statements and financial highlights. Our audits also included evaluating the accounting principles used and significant estimates made by management, as well as evaluating the overall presentation of the financial statements and financial highlights. We believe that our audits provide a reasonable basis for our opinion.
/s/ Deloitte & Touche LLP
Boston, Massachusetts
February 24, 2023
We have served as the auditor of one or more Eaton Vance investment companies since 1959.
Eaton Vance
Greater India Fund
December 31, 2022
Federal Tax Information (Unaudited)
The Form 1099-DIV you received in February 2023 showed the tax status of all distributions paid to your account in calendar year 2022. Shareholders are advised to consult their own tax adviser with respect to the tax consequences of their investment in the Fund. As required by the Internal Revenue Code and/or regulations, shareholders must be notified regarding the status of qualified dividend income for individuals, the foreign tax credit and capital gains dividends.
Qualified Dividend Income. For the fiscal year ended December 31, 2022, the Fund designates approximately $1,798,640, or up to the maximum amount of such dividends allowable pursuant to the Internal Revenue Code, as qualified dividend income eligible for the reduced tax rate of 15%.
Foreign Tax Credit. For the fiscal year ended December 31, 2022, the Fund paid foreign taxes of $3,724,167 and recognized foreign source income of $21,994,461.
Capital Gains Dividends. The Fund hereby designates as a capital gain dividend with respect to the taxable year ended December 31, 2022, $24,908,127 or, if subsequently determined to be different, the net capital gain of such year.
Greater India Portfolio
December 31, 2022
| Security | Shares | Value |
| India — 104.1% |
| Auto Components — 2.1% |
| Sona BLW Precision Forgings, Ltd.(1) | | 260,883 | $ 1,319,969 |
| Sundram Fasteners, Ltd. | | 131,433 | 1,546,817 |
| Tube Investments of India, Ltd. | | 32,844 | 1,093,413 |
| | | | $ 3,960,199 |
| Automobiles — 5.1% |
| Mahindra & Mahindra, Ltd. | | 337,035 | $ 5,081,281 |
| Maruti Suzuki India, Ltd. | | 17,861 | 1,810,876 |
| Tata Motors, Ltd.(2) | | 571,605 | 2,677,019 |
| | | | $ 9,569,176 |
| Banks — 26.8% |
| AU Small Finance Bank, Ltd.(1) | | 191,406 | $ 1,513,055 |
| Axis Bank, Ltd. | | 1,158,520 | 13,053,618 |
| Bank of Baroda | | 387,935 | 868,542 |
| Federal Bank, Ltd. | | 1,516,908 | 2,551,382 |
| HDFC Bank, Ltd. | | 328,008 | 6,440,711 |
| ICICI Bank, Ltd. | | 1,813,020 | 19,546,390 |
| State Bank of India | | 830,529 | 6,147,247 |
| | | | $ 50,120,945 |
| Beverages — 1.8% |
| United Spirits, Ltd.(2) | | 309,083 | $ 3,268,583 |
| | | | $ 3,268,583 |
| Building Products — 0.6% |
| Kajaria Ceramics, Ltd. | | 85,334 | $ 1,178,765 |
| | | | $ 1,178,765 |
| Chemicals — 1.5% |
| Atul, Ltd. | | 11,387 | $ 1,138,531 |
| Navin Fluorine International, Ltd. | | 35,632 | 1,752,957 |
| | | | $ 2,891,488 |
| Construction Materials — 2.5% |
| ACC, Ltd. | | 64,794 | $ 1,911,256 |
| Ambuja Cements, Ltd. | | 430,793 | 2,724,109 |
| | | | $ 4,635,365 |
| Security | Shares | Value |
| Consumer Finance — 0.7% |
| SBI Cards & Payment Services, Ltd. | | 127,478 | $ 1,223,413 |
| | | | $ 1,223,413 |
| Diversified Financial Services — 2.8% |
| Bajaj Finserv, Ltd. | | 211,599 | $ 3,947,290 |
| Housing Development Finance Corp., Ltd. | | 40,077 | 1,276,211 |
| | | | $ 5,223,501 |
| Electronic Equipment, Instruments & Components — 0.8% |
| Honeywell Automation India, Ltd. | | 3,034 | $ 1,529,308 |
| | | | $ 1,529,308 |
| Food & Staples Retailing — 2.2% |
| Avenue Supermarts, Ltd.(1)(2) | | 67,427 | $ 3,297,137 |
| Medplus Health Services, Ltd.(2) | | 109,235 | 804,428 |
| | | | $ 4,101,565 |
| Food Products — 3.5% |
| Britannia Industries, Ltd. | | 47,475 | $ 2,474,196 |
| Tata Consumer Products, Ltd. | | 444,174 | 4,137,877 |
| | | | $ 6,612,073 |
| Gas Utilities — 0.5% |
| Gujarat Gas, Ltd. | | 144,858 | $ 851,383 |
| | | | $ 851,383 |
| Health Care Providers & Services — 1.7% |
| Apollo Hospitals Enterprise, Ltd. | | 60,361 | $ 3,260,630 |
| | | | $ 3,260,630 |
| Hotels, Restaurants & Leisure — 0.6% |
| Devyani International, Ltd.(2) | | 537,233 | $ 1,168,693 |
| | | | $ 1,168,693 |
| Household Durables — 1.4% |
| Crompton Greaves Consumer Electricals, Ltd. | | 337,079 | $ 1,371,817 |
| Dixon Technologies India, Ltd. | | 26,438 | 1,245,683 |
| | | | $ 2,617,500 |
| Independent Power and Renewable Electricity Producers — 1.8% |
| NHPC, Ltd. | | 1,155,783 | $ 558,323 |
| NTPC, Ltd. | | 1,409,843 | 2,841,271 |
| | | | $ 3,399,594 |
19
See Notes to Financial Statements.
Greater India Portfolio
December 31, 2022
Portfolio of Investments — continued
| Security | Shares | Value |
| Insurance — 4.0% |
| ICICI Lombard General Insurance Co., Ltd.(1) | | 124,565 | $ 1,863,159 |
| PB Fintech, Ltd.(2) | | 114,698 | 619,786 |
| SBI Life Insurance Co., Ltd.(1) | | 336,936 | 5,009,757 |
| | | | $ 7,492,702 |
| Interactive Media & Services — 1.0% |
| Info Edge India, Ltd. | | 38,248 | $ 1,807,235 |
| | | | $ 1,807,235 |
| Internet & Direct Marketing Retail — 1.5% |
| FSN E-Commerce Ventures, Ltd.(2) | | 541,906 | $ 1,013,238 |
| Zomato, Ltd.(2) | | 2,495,185 | 1,791,762 |
| | | | $ 2,805,000 |
| IT Services — 15.2% |
| Coforge, Ltd. | | 45,728 | $ 2,142,839 |
| HCL Technologies, Ltd. | | 403,700 | 5,051,550 |
| Infosys, Ltd. | | 1,028,706 | 18,759,622 |
| Persistent Systems, Ltd. | | 31,894 | 1,487,627 |
| Zensar Technologies, Ltd. | | 395,433 | 1,018,315 |
| | | | $ 28,459,953 |
| Machinery — 1.0% |
| Grindwell Norton, Ltd. | | 86,000 | $ 1,848,011 |
| | | | $ 1,848,011 |
| Metals & Mining — 3.9% |
| APL Apollo Tubes, Ltd. | | 156,608 | $ 2,057,283 |
| Hindalco Industries, Ltd. | | 647,833 | 3,706,740 |
| Jindal Steel & Power, Ltd. | | 227,782 | 1,605,477 |
| | | | $ 7,369,500 |
| Oil, Gas & Consumable Fuels — 6.6% |
| Reliance Industries, Ltd. | | 401,951 | $ 12,339,172 |
| | | | $ 12,339,172 |
| Personal Products — 2.9% |
| Emami, Ltd. | | 308,764 | $ 1,590,992 |
| Godrej Consumer Products, Ltd.(2) | | 361,475 | 3,813,604 |
| | | | $ 5,404,596 |
| Pharmaceuticals — 5.0% |
| Ipca Laboratories, Ltd. | | 95,704 | $ 973,667 |
| Pfizer, Ltd. | | 3,322 | 177,452 |
| Security | Shares | Value |
| Pharmaceuticals (continued) |
| Sun Pharmaceutical Industries, Ltd. | | 471,379 | $ 5,692,416 |
| Torrent Pharmaceuticals, Ltd. | | 133,960 | 2,503,392 |
| | | | $ 9,346,927 |
| Real Estate Management & Development — 1.9% |
| Godrej Properties, Ltd.(2) | | 117,693 | $ ��� 1,735,761 |
| Oberoi Realty, Ltd. | | 172,998 | 1,803,602 |
| | | | $ 3,539,363 |
| Specialty Retail — 1.0% |
| Trent, Ltd. | | 113,576 | $ 1,851,168 |
| | | | $ 1,851,168 |
| Wireless Telecommunication Services — 3.7% |
| Bharti Airtel, Ltd. | | 714,454 | $ 6,967,972 |
| | | | $ 6,967,972 |
Total India
(identified cost $145,910,833) | | | $194,843,780 |
Total Common Stocks
(identified cost $145,910,833) | | | $194,843,780 |
| Short-Term Investments — 0.2% |
| Security | Shares | Value |
| Morgan Stanley Institutional Liquidity Funds - Government Portfolio, Institutional Class, 4.11%(3) | | 391,183 | $ 391,183 |
Total Short-Term Investments
(identified cost $391,183) | | | $ 391,183 |
Total Investments — 104.3%
(identified cost $146,302,016) | | | $195,234,963 |
| Other Assets, Less Liabilities — (4.3)% | | | $ (8,030,808) |
| Net Assets — 100.0% | | | $187,204,155 |
| The percentage shown for each investment category in the Portfolio of Investments is based on net assets. |
| (1) | Security exempt from registration under Rule 144A of the Securities Act of 1933, as amended. These securities may be sold in certain transactions in reliance on an exemption from registration (normally to qualified institutional buyers). At December 31, 2022, the aggregate value of these securities is $13,003,077 or 6.9% of the Portfolio's net assets. |
| (2) | Non-income producing security. |
20
See Notes to Financial Statements.
Greater India Portfolio
December 31, 2022
Portfolio of Investments — continued
| (3) | May be deemed to be an affiliated investment company. The rate shown is the annualized seven-day yield as of December 31, 2022. |
| Futures Contracts |
| Description | Number of
Contracts | Position | Expiration
Date | Notional
Amount | Value/Unrealized
Appreciation
(Depreciation) |
| Equity Futures | | | | | |
| SGX CNX Nifty Index | 119 | Long | 1/25/23 | $4,329,269 | $ 5,231 |
| | | | | | $5,231 |
21
See Notes to Financial Statements.
Greater India Portfolio
December 31, 2022
Statement of Assets and Liabilities
| | December 31, 2022 |
| Assets | |
| Unaffiliated investments, at value (identified cost $145,910,833) | $ 194,843,780 |
| Affiliated investment, at value (identified cost $391,183) | 391,183 |
| Deposits for derivatives collateral — futures contracts | 235,620 |
| Foreign currency, at value (identified cost $35,920) | 35,954 |
| Dividends receivable | 119 |
| Dividends receivable from affiliated investment | 4,971 |
| Receivable for foreign taxes | 35,590 |
| Total assets | $195,547,217 |
| Liabilities | |
| Payable for investments purchased | $ 9,564 |
| Payable for variation margin on open futures contracts | 21,371 |
| Payable to affiliates: | |
| Investment adviser fee | 141,468 |
| Trustees' fees | 3,870 |
| Accrued foreign capital gains taxes | 8,012,161 |
| Accrued expenses | 154,628 |
| Total liabilities | $ 8,343,062 |
| Net Assets applicable to investors' interest in Portfolio | $187,204,155 |
22
See Notes to Financial Statements.
Greater India Portfolio
December 31, 2022
| | Year Ended |
| | December 31, 2022 |
| Investment Income | |
| Dividend income (net of foreign taxes withheld of $405,658) | $ 1,396,207 |
| Dividend income from affiliated investment | 41,874 |
| Total investment income | $ 1,438,081 |
| Expenses | |
| Investment adviser fee | $ 1,897,175 |
| Trustees’ fees and expenses | 15,871 |
| Custodian fee | 139,107 |
| Legal and accounting services | 81,375 |
| Miscellaneous | 20,163 |
| Total expenses | $ 2,153,691 |
| Deduct: | |
| Waiver and/or reimbursement of expenses by affiliate | $ 3,031 |
| Total expense reductions | $ 3,031 |
| Net expenses | $ 2,150,660 |
| Net investment loss | $ (712,579) |
| Realized and Unrealized Gain (Loss) | |
| Net realized gain (loss): | |
| Investment transactions (net of foreign capital gains taxes of $3,363,883) | $ 21,028,542 |
| Futures contracts | (320,882) |
| Foreign currency transactions | (109,219) |
| Net realized gain | $ 20,598,441 |
| Change in unrealized appreciation (depreciation): | |
| Investments (including net decrease in accrued foreign capital gains taxes of $6,533,002) | $ (60,208,185) |
| Futures contracts | (8,409) |
| Foreign currency | (4,012) |
| Net change in unrealized appreciation (depreciation) | $(60,220,606) |
| Net realized and unrealized loss | $(39,622,165) |
| Net decrease in net assets from operations | $(40,334,744) |
23
See Notes to Financial Statements.
Greater India Portfolio
December 31, 2022
Statements of Changes in Net Assets
| | Year Ended December 31, |
| | 2022 | 2021 |
| Increase (Decrease) in Net Assets | | |
| From operations: | | |
| Net investment loss | $ (712,579) | $ (1,063,318) |
| Net realized gain | 20,598,441 | 40,770,718 |
| Net change in unrealized appreciation (depreciation) | (60,220,606) | 20,399,100 |
| Net increase (decrease) in net assets from operations | $ (40,334,744) | $ 60,106,500 |
| Capital transactions: | | |
| Contributions | $ 16,606,183 | $ 31,649,737 |
| Withdrawals | (73,220,373) | (36,627,830) |
| Net decrease in net assets from capital transactions | $ (56,614,190) | $ (4,978,093) |
| Net increase (decrease) in net assets | $ (96,948,934) | $ 55,128,407 |
| Net Assets | | |
| At beginning of year | $ 284,153,089 | $ 229,024,682 |
| At end of year | $187,204,155 | $284,153,089 |
24
See Notes to Financial Statements.
Greater India Portfolio
December 31, 2022
| | Year Ended December 31, |
| Ratios/Supplemental Data | 2022 | 2021 | 2020 | 2019 | 2018 |
| Ratios (as a percentage of average daily net assets): | | | | | |
| Expenses | 0.97% (1) | 0.95% | 0.93% | 0.98% | 0.98% |
| Net investment income (loss) | (0.32)% | (0.39)% | (0.12)% | 0.07% | 0.19% |
| Portfolio Turnover | 17% | 33% | 26% | 21% | 29% |
| Total Return | (14.39)% | 24.76% | 14.14% | 11.17% | (11.57)% |
| Net assets, end of year (000’s omitted) | $187,204 | $284,153 | $229,025 | $216,812 | $213,186 |
| (1) | Includes a reduction by the investment adviser of a portion of its adviser fee due to the Portfolio’s investment in the Liquidity Fund (equal to less than 0.005% of average daily net assets for the year ended December 31, 2022). |
25
See Notes to Financial Statements.
Greater India Portfolio
December 31, 2022
Notes to Financial Statements
1 Significant Accounting Policies
Greater India Portfolio (the Portfolio) is a Massachusetts business trust registered under the Investment Company Act of 1940, as amended (the 1940 Act), as a non-diversified, open-end management investment company. The Portfolio’s investment objective is to seek long-term capital appreciation. The Declaration of Trust permits the Trustees to issue interests in the Portfolio. At December 31, 2022, Eaton Vance Greater India Fund held a 99.9% interest in the Portfolio.
The following is a summary of significant accounting policies of the Portfolio. The policies are in conformity with accounting principles generally accepted in the United States of America (U.S. GAAP). The Portfolio is an investment company and follows accounting and reporting guidance in the Financial Accounting Standards Board (FASB) Accounting Standards Codification Topic 946.
A Investment Valuation—The following methodologies are used to determine the market value or fair value of investments.
Equity Securities. Equity securities listed on a U.S. securities exchange generally are valued at the last sale or closing price on the day of valuation or, if no sales took place on such date, at the mean between the closing bid and ask prices on the exchange where such securities are principally traded. Equity securities listed on the NASDAQ National Market System are valued at the NASDAQ official closing price. Unlisted or listed securities for which closing sales prices or closing quotations are not available are valued at the mean between the latest available bid and ask prices.
Derivatives. Futures contracts are valued at the closing settlement price established by the board of trade or exchange on which they are traded, with adjustments for fair valuation for certain foreign futures contracts as described below.
Foreign Securities, Futures Contracts and Currencies. Foreign securities, futures contracts and currencies are valued in U.S. dollars, based on foreign currency exchange rate quotations supplied by a third party pricing service. The pricing service uses a proprietary model to determine the exchange rate. Inputs to the model include reported trades and implied bid/ask spreads. The daily valuation of exchange-traded foreign securities and certain exchange-traded foreign futures contracts generally is determined as of the close of trading on the principal exchange on which such securities and contracts trade. Foreign ownership of shares of certain Indian companies may be subject to limitations. When foreign ownership of such an Indian company’s shares approaches the limitation, foreign investors may be willing to pay a premium to the local share price to acquire shares from other foreign investors. Such shares are valued at the closing price for foreign investors as provided by the exchange on which they trade. Events occurring after the close of trading on foreign exchanges may result in adjustments to the valuation of foreign securities and certain foreign futures contracts to more accurately reflect their fair value as of the close of regular trading on the New York Stock Exchange. When valuing foreign equity securities and foreign futures contracts that meet certain criteria, the Portfolio’s Trustees have approved the use of a fair value service that values such securities and foreign futures contracts to reflect market trading that occurs after the close of the applicable foreign markets of comparable securities or other instruments that have a strong correlation to the fair-valued securities and foreign futures contracts.
Other. Investments in management investment companies (including money market funds) that do not trade on an exchange are valued at the net asset value as of the close of each business day.
Fair Valuation. In connection with Rule 2a-5 of the 1940 Act, which became effective September 8, 2022, the Trustees have designated the Portfolio’s investment adviser as its valuation designee. Investments for which valuations or market quotations are not readily available or are deemed unreliable are valued by the investment adviser, as valuation designee, at fair value using methods that most fairly reflect the security’s “fair value”, which is the amount that the Portfolio might reasonably expect to receive for the security upon its current sale in the ordinary course. Each such determination is based on a consideration of relevant factors, which are likely to vary from one pricing context to another. These factors may include, but are not limited to, the type of security, the existence of any contractual restrictions on the security’s disposition, the price and extent of public trading in similar securities of the issuer or of comparable companies or entities, quotations or relevant information obtained from broker/dealers or other market participants, information obtained from the issuer, analysts, and/or the appropriate stock exchange (for exchange-traded securities), an analysis of the company’s or entity’s financial statements, and an evaluation of the forces that influence the issuer and the market(s) in which the security is purchased and sold.
B Investment Transactions—Investment transactions for financial statement purposes are accounted for on a trade date basis. Realized gains and losses on investments sold are determined on the basis of identified cost.
C Income—Dividend income is recorded on the ex-dividend date for dividends received in cash and/or securities. However, if the ex-dividend date has passed, certain dividends from foreign securities are recorded as the Portfolio is informed of the ex-dividend date. Withholding taxes on foreign dividends and capital gains have been provided for in accordance with the Portfolio's understanding of the applicable countries’ tax rules and rates.
D Federal and Other Taxes—The Portfolio has elected to be treated as a partnership for federal tax purposes. No provision is made by the Portfolio for federal or state taxes on any taxable income of the Portfolio because each investor in the Portfolio is ultimately responsible for the payment of any taxes on its share of taxable income. Since at least one of the Portfolio’s investors is a regulated investment company that invests all or substantially all of its assets in the Portfolio, the Portfolio normally must satisfy the applicable source of income and diversification requirements (under the Internal Revenue Code) in order for its investors to satisfy them. The Portfolio will allocate, at least annually among its investors, each investor’s distributive share of the Portfolio’s net investment income, net realized capital gains and losses and any other items of income, gain, loss, deduction or credit.
Greater India Portfolio
December 31, 2022
Notes to Financial Statements — continued
In addition to the requirements of the Internal Revenue Code, the Portfolio may also be subject to local taxes on the recognition of capital gains in India. In determining the daily net asset value, the Portfolio estimates the accrual for such taxes, if any, based on the unrealized appreciation on certain portfolio securities, historical effective tax rates on securities sold, and the availability of any realized losses in excess of gains that may be carried forward to offset future gains. Taxes attributable to unrealized appreciation are included in the change in unrealized appreciation (depreciation) on investments. Capital gains taxes on certain Indian securities sold at a gain are included in net realized gain (loss) on investments. As of December 31, 2022, the Portfolio for tax reporting in India had no accumulated losses available to be carried forward to offset future realized gains from the sale of Indian securities.
As of December 31, 2022, the Portfolio had no uncertain tax positions that would require financial statement recognition, de-recognition, or disclosure. The Portfolio files a U.S. federal income tax return annually after its fiscal year-end, which is subject to examination by the Internal Revenue Service for a period of three years from the date of filing. The Portfolio also files a tax return in India annually as of March 31st. Such tax returns are subject to examination by the Indian tax authorities for open years as determined by the statute of limitations, which is generally a period of up to 7 years after a tax return is filed.
E Foreign Currency Translation—Investment valuations, other assets, and liabilities initially expressed in foreign currencies are translated each business day into U.S. dollars based upon current exchange rates. Purchases and sales of foreign investment securities and income and expenses denominated in foreign currencies are translated into U.S. dollars based upon currency exchange rates in effect on the respective dates of such transactions. Recognized gains or losses on investment transactions attributable to changes in foreign currency exchange rates are recorded for financial statement purposes as net realized gains and losses on investments. That portion of unrealized gains and losses on investments that results from fluctuations in foreign currency exchange rates is not separately disclosed.
F Use of Estimates—The preparation of the financial statements in conformity with U.S. GAAP requires management to make estimates and assumptions that affect the reported amounts of assets and liabilities at the date of the financial statements and the reported amounts of income and expense during the reporting period. Actual results could differ from those estimates.
G Indemnifications—Under the Portfolio’s organizational documents, its officers and Trustees may be indemnified against certain liabilities and expenses arising out of the performance of their duties to the Portfolio. Under Massachusetts law, if certain conditions prevail, interestholders in the Portfolio could be deemed to have personal liability for the obligations of the Portfolio. However, the Portfolio’s Declaration of Trust contains an express disclaimer of liability on the part of Portfolio interestholders. Additionally, in the normal course of business, the Portfolio enters into agreements with service providers that may contain indemnification clauses. The Portfolio’s maximum exposure under these arrangements is unknown as this would involve future claims that may be made against the Portfolio that have not yet occurred.
H Futures Contracts—Upon entering into a futures contract, the Portfolio is required to deposit with the broker, either in cash or securities, an amount equal to a certain percentage of the contract amount (initial margin). Subsequent payments, known as variation margin, are made or received by the Portfolio each business day, depending on the daily fluctuations in the value of the underlying security or index, and are recorded as unrealized gains or losses by the Portfolio. Gains (losses) are realized upon the expiration or closing of the futures contracts. Should market conditions change unexpectedly, the Portfolio may not achieve the anticipated benefits of the futures contracts and may realize a loss. Futures contracts have minimal counterparty risk as they are exchange traded and the clearinghouse for the exchange is substituted as the counterparty, guaranteeing counterparty performance.
2 Investment Adviser Fee and Other Transactions with Affiliates
The investment adviser fee is earned by Boston Management and Research (BMR), an indirect, wholly-owned subsidiary of Morgan Stanley, as compensation for investment advisory services rendered to the Portfolio. The fee is computed at an annual rate as a percentage of average daily net assets as follows and is payable monthly:
| Average Daily Net Assets | Annual Fee Rate |
| Up to $500 million | 0.850% |
| $500 million but less than $1 billion | 0.800% |
| $1 billion but less than $2.5 billion | 0.775% |
| $2.5 billion but less than $5 billion | 0.750% |
| $5 billion and over | 0.730% |
For the year ended December 31, 2022, the investment adviser fee amounted to $1,897,175 or 0.85% of the Portfolio's average daily net assets. Pursuant to an investment sub-advisory agreement, BMR has delegated the investment management of the Portfolio to Goldman Sachs Asset Management, L.P. (GSAM). BMR pays GSAM a portion of its investment adviser fee for sub-advisory services provided to the Portfolio. Effective April 26, 2022, the Portfolio may invest in a money market fund, the Institutional Class of the Morgan Stanley Institutional Liquidity Funds - Government Portfolio (the “Liquidity Fund”), an open-end management investment company managed by Morgan Stanley Investment Management Inc., a wholly-owned subsidiary of
Greater India Portfolio
December 31, 2022
Notes to Financial Statements — continued
Morgan Stanley. The investment adviser fee paid by the Portfolio is reduced by an amount equal to its pro-rata share of the advisory and administration fees paid by the Portfolio due to its investment in the Liquidity Fund. For the year ended December 31, 2022, the investment adviser fee paid was reduced by $3,031 relating to the Portfolio's investment in the Liquidity Fund.
Trustees and officers of the Portfolio who are members of EVM’s or BMR’s organizations receive remuneration for their services to the Portfolio out of the investment adviser fee. Trustees of the Portfolio who are not affiliated with the investment adviser may elect to defer receipt of all or a percentage of their annual fees in accordance with the terms of the Trustees Deferred Compensation Plan. For the year ended December 31, 2022, no significant amounts have been deferred. Certain officers and Trustees of the Portfolio are officers of the above organizations.
3 Purchases and Sales of Investments
Purchases and sales of investments, other than short-term obligations, aggregated $39,629,443 and $98,463,212, respectively, for the year ended December 31, 2022.
4 Federal Income Tax Basis of Investments
The cost and unrealized appreciation (depreciation) of investments, including open derivative contracts, of the Portfolio at December 31, 2022, as determined on a federal income tax basis, were as follows:
| Aggregate cost | $148,822,078 |
| Gross unrealized appreciation | $ 55,695,673 |
| Gross unrealized depreciation | (9,277,557) |
| Net unrealized appreciation | $ 46,418,116 |
5 Financial Instruments
The Portfolio may trade in financial instruments with off-balance sheet risk in the normal course of its investing activities. These financial instruments may include futures contracts and may involve, to a varying degree, elements of risk in excess of the amounts recognized for financial statement purposes. The notional or contractual amounts of these instruments represent the investment the Portfolio has in particular classes of financial instruments and do not necessarily represent the amounts potentially subject to risk. The measurement of the risks associated with these instruments is meaningful only when all related and offsetting transactions are considered. A summary of obligations under these financial instruments at December 31, 2022 is included in the Portfolio of Investments. At December 31, 2022, the Portfolio had sufficient cash and/or securities to cover commitments under these contracts.
The Portfolio is subject to equity price risk in the normal course of pursuing its investment objective. The Portfolio enters into equity index futures contracts to manage cash flows.
The fair value of open derivative instruments (not considered to be hedging instruments for accounting disclosure purposes) and whose primary underlying risk exposure is equity price risk at December 31, 2022 was as follows:
| | Fair Value |
| Derivative | Asset Derivative(1) | Liability Derivative |
| Futures contracts | $5,231 | $ — |
| (1) | Only the current day's variation margin on open futures contracts is reported within the Statement of Assets and Liabilities as Receivable or Payable for variation margin on open futures contracts, as applicable. |
Greater India Portfolio
December 31, 2022
Notes to Financial Statements — continued
The effect of derivative instruments (not considered to be hedging instruments for accounting disclosure purposes) on the Statement of Operations and whose primary underlying risk exposure is equity price risk for the year ended December 31, 2022 was as follows:
| Derivative | Realized Gain (Loss)
on Derivatives Recognized
in Income(1) | Change in Unrealized
Appreciation (Depreciation) on
Derivatives Recognized in Income(2) |
| Futures contracts | $(320,882) | $(8,409) |
| (1) | Statement of Operations location: Net realized gain (loss): Futures contracts. |
| (2) | Statement of Operations location: Change in unrealized appreciation (depreciation): Futures contracts. |
The average notional cost of futures contracts (long) outstanding during the year ended December 31, 2022, which is indicative of the volume of this derivative type, was approximately $2,974,000.
6 Line of Credit
The Portfolio participates with other portfolios and funds managed by EVM and its affiliates in a $725 million unsecured line of credit agreement with a group of banks, which is in effect through October 24, 2023. In connection with the renewal of the agreement on October 25, 2022, the borrowing limit was decreased from $800 million. Borrowings are made by the Portfolio solely for temporary purposes related to redemptions and other short-term cash needs. Interest is charged to the Portfolio based on its borrowings at an amount above either the Secured Overnight Financing Rate (SOFR) or Federal Funds rate. In addition, a fee computed at an annual rate of 0.15% on the daily unused portion of the line of credit is allocated among the participating portfolios and funds at the end of each quarter. Also in connection with the renewal of the agreement, an arrangement fee totaling $150,000 was incurred that was allocated to the participating portfolios and funds. Because the line of credit is not available exclusively to the Portfolio, it may be unable to borrow some or all of its requested amounts at any particular time. The Portfolio did not have any significant borrowings or allocated fees during the year ended December 31, 2022.
7 Investments in Affiliated Funds
At December 31, 2022, the value of the Portfolio's investment in funds that may be deemed to be affiliated was $391,183, which represents 0.2% of the Portfolio's net assets. Transactions in such funds by the Portfolio for the year ended December 31, 2022 were as follows:
| Name | Value,
beginning
of period | Purchases | Sales
proceeds | Net
realized
gain (loss) | Change in
unrealized
appreciation
(depreciation) | Value, end
of period | Dividend
income | Shares,
end of period |
| Short-Term Investments |
| Liquidity Fund | $ — | $44,332,006 | $(43,940,823) | $ — | $ — | $391,183 | $41,874 | 391,183 |
8 Fair Value Measurements
Under generally accepted accounting principles for fair value measurements, a three-tier hierarchy to prioritize the assumptions, referred to as inputs, is used in valuation techniques to measure fair value. The three-tier hierarchy of inputs is summarized in the three broad levels listed below.
| • | Level 1 – quoted prices in active markets for identical investments |
| • | Level 2 – other significant observable inputs (including quoted prices for similar investments, interest rates, prepayment speeds, credit risk, etc.) |
| • | Level 3 – significant unobservable inputs (including a fund's own assumptions in determining the fair value of investments) |
In cases where the inputs used to measure fair value fall in different levels of the fair value hierarchy, the level disclosed is determined based on the lowest level input that is significant to the fair value measurement in its entirety. The inputs or methodology used for valuing securities are not necessarily an indication of the risk associated with investing in those securities.
Greater India Portfolio
December 31, 2022
Notes to Financial Statements — continued
At December 31, 2022, the hierarchy of inputs used in valuing the Portfolio's investments and open derivative instruments, which are carried at value, were as follows:
| Asset Description | Level 1 | Level 2 | Level 3 | Total |
| Common Stocks | $ — | $ 194,843,780* | $ — | $ 194,843,780 |
| Short-Term Investments | 391,183 | — | — | 391,183 |
| Total Investments | $391,183 | $194,843,780 | $ — | $195,234,963 |
| Futures Contracts | $ — | $ 5,231 | $ — | $ 5,231 |
| Total | $391,183 | $194,849,011 | $ — | $195,240,194 |
| * | Includes foreign equity securities whose values were adjusted to reflect market trading of comparable securities or other correlated instruments that occurred after the close of trading in their applicable foreign markets. |
9 Risks and Uncertainties
Risks Associated with Foreign Investments
Foreign investments can be adversely affected by political, economic and market developments abroad, including the imposition of economic and other sanctions by the United States or another country. There may be less publicly available information about foreign issuers because they may not be subject to reporting practices, requirements or regulations comparable to those to which United States companies are subject. Foreign markets may be smaller, less liquid and more volatile than the major markets in the United States. Trading in foreign markets typically involves higher expense than trading in the United States. The Portfolio may have difficulties enforcing its legal or contractual rights in a foreign country. Securities that trade or are denominated in currencies other than the U.S. dollar may be adversely affected by fluctuations in currency exchange rates.
Countries within the Indian sub-continent region are considered emerging market countries. The securities markets within the Indian sub-continent are undergoing a period of growth and change, which may result in trading or price volatility and difficulties in the settlement and recording of transactions, and in interpreting and applying relevant laws and regulations. The securities markets in these countries are comparatively underdeveloped and may be concentrated in certain sectors. In addition, governmental actions can have a significant effect on the economic conditions in the India region, which could adversely affect the value and liquidity of investments.
Pandemic Risk
An outbreak of respiratory disease caused by a novel coronavirus was first detected in China in late 2019 and subsequently spread internationally. This coronavirus has resulted in closing borders, enhanced health screenings, changes to healthcare service preparation and delivery, quarantines, cancellations, disruptions to supply chains and customer activity, as well as general concern and uncertainty. Health crises caused by outbreaks of disease, such as the coronavirus outbreak, may exacerbate other pre-existing political, social and economic risks and disrupt normal market conditions and operations. The impact of this outbreak has negatively affected the worldwide economy, as well as the economies of individual countries and industries, and could continue to affect the market in significant and unforeseen ways. Other epidemics and pandemics that may arise in the future may have similar effects. Any such impact could adversely affect the Portfolio's performance, or the performance of the securities in which the Portfolio invests.
Greater India Portfolio
December 31, 2022
Report of Independent Registered Public Accounting Firm
To the Trustees and Investors of Greater India Portfolio:
Opinion on the Financial Statements and Financial Highlights
We have audited the accompanying statement of assets and liabilities of Greater India Portfolio (the “Portfolio”), including the portfolio of investments, as of December 31, 2022, the related statement of operations for the year then ended, the statements of changes in net assets for each of the two years in the period then ended, the financial highlights for each of the five years in the period then ended, and the related notes. In our opinion, the financial statements and financial highlights present fairly, in all material respects, the financial position of the Portfolio as of December 31, 2022, and the results of its operations for the year then ended, the changes in its net assets for each of the two years in the period then ended, and the financial highlights for each of the five years in the period then ended, in conformity with accounting principles generally accepted in the United States of America.
Basis for Opinion
These financial statements and financial highlights are the responsibility of the Portfolio's management. Our responsibility is to express an opinion on the Portfolio's financial statements and financial highlights based on our audits. We are a public accounting firm registered with the Public Company Accounting Oversight Board (United States) (PCAOB) and are required to be independent with respect to the Portfolio in accordance with the U.S. federal securities laws and the applicable rules and regulations of the Securities and Exchange Commission and the PCAOB.
We conducted our audits in accordance with the standards of the PCAOB. Those standards require that we plan and perform the audit to obtain reasonable assurance about whether the financial statements and financial highlights are free of material misstatement, whether due to error or fraud. The Portfolio is not required to have, nor were we engaged to perform, an audit of its internal control over financial reporting. As part of our audits, we are required to obtain an understanding of internal control over financial reporting but not for the purpose of expressing an opinion on the effectiveness of the Portfolio’s internal control over financial reporting. Accordingly, we express no such opinion.
Our audits included performing procedures to assess the risks of material misstatement of the financial statements and financial highlights, whether due to error or fraud, and performing procedures that respond to those risks. Such procedures included examining, on a test basis, evidence regarding the amounts and disclosures in the financial statements and financial highlights. Our audits also included evaluating the accounting principles used and significant estimates made by management, as well as evaluating the overall presentation of the financial statements and financial highlights. Our procedures included confirmation of securities owned as of December 31, 2022, by correspondence with the custodian and brokers; when replies were not received from brokers, we performed other auditing procedures. We believe that our audits provide a reasonable basis for our opinion.
/s/ Deloitte & Touche LLP
Boston, Massachusetts
February 24, 2023
We have served as the auditor of one or more Eaton Vance investment companies since 1959.
Eaton Vance
Greater India Fund
December 31, 2022
Management and Organization
Fund Management. The Trustees of Eaton Vance Special Investment Trust (the Trust) and Greater India Portfolio (the Portfolio) are responsible for the overall management and supervision of the Trust's and the Portfolio's affairs. The Board members and officers of the Trust and the Portfolio are listed below. Except as indicated, each individual has held the office shown or other offices in the same company for the last five years. Board members hold indefinite terms of office. Each Trustee holds office until his or her successor is elected and qualified, subject to a prior death, resignation, retirement, disqualification or removal. Under the terms of the Fund’s and the Portfolio's current Trustee retirement policy, an Independent Trustee must retire and resign as a Trustee on the earlier of: (i) the first day of July following his or her 74th birthday; or (ii), with limited exception, December 31st of the 20th year in which he or she has served as a Trustee. However, if such retirement and resignation would cause the Fund and the Portfolio to be out of compliance with Section 16 of the 1940 Act or any other regulations or guidance of the SEC, then such retirement and resignation will not become effective until such time as action has been taken for the Fund and the Portfolio to be in compliance therewith. The “noninterested Trustees” consist of those Trustees who are not “interested persons” of the the Trust and the Portfolio, as that term is defined under the 1940 Act. The business address of each Board member and officer is Two International Place, Boston, Massachusetts 02110. As used below, “BMR” refers to Boston Management and Research, “EVC” refers to Eaton Vance Corp., “EV” refers to EV LLC, “EVM” refers to Eaton Vance Management and “EVD” refers to Eaton Vance Distributors, Inc. EV is the trustee of each of EVM and BMR. Effective March 1, 2021, each of EVM, BMR, EVD and EV are indirect, wholly owned subsidiaries of Morgan Stanley. Each officer affiliated with EVM may hold a position with other EVM affiliates that is comparable to his or her position with EVM listed below. Each Trustee oversees 130 funds in the Eaton Vance fund complex (including both funds and portfolios in a hub and spoke structure).
| Name and Year of Birth | Trust/Portfolio
Position(s) | Length of Service | Principal Occupation(s) and Other Directorships
During Past Five Years and Other Relevant Experience |
| Interested Trustee |
Thomas E. Faust Jr.
1958 | Trustee | Since 2007 | Chairman of Morgan Stanley Investment Management, Inc. (MSIM), member of the Board of Managers and President of EV (since 2021), Chief Executive Officer of EVM and BMR. Formerly, Chairman, Chief Executive Officer (2007-2021) and President (2006-2021) of EVC and Director of EVD (2007-2022). Mr. Faust is an interested person because of his positions with MSIM, BMR, EVM and EV, which are affiliates of the Trust and the Portfolio.
Other Directorships. Formerly, Director of EVC (2007-2021) and Hexavest Inc. (investment management firm) (2012-2021). |
| Noninterested Trustees |
Alan C. Bowser(1)
1962 | Trustee | Since 2022 | Formerly, Chief Diversity Officer, Partner and a member of the Operating Committee, and formerly served as Senior Advisor on Diversity and Inclusion for the firm’s chief executive officer, Co-Head of the Americas Region, and Senior Client Advisor of Bridgewater Associates, an asset management firm (2011- 2023).
Other Directorships. None. |
Mark R. Fetting
1954 | Trustee | Since 2016 | Private investor. Formerly held various positions at Legg Mason, Inc. (investment management firm) (2000-2012), including President, Chief Executive Officer, Director and Chairman (2008-2012), Senior Executive Vice President (2004-2008) and Executive Vice President (2001-2004). Formerly, President of Legg Mason family of funds (2001-2008). Formerly, Division President and Senior Officer of Prudential Financial Group, Inc. and related companies (investment management firm) (1991-2000).
Other Directorships. None. |
Cynthia E. Frost
1961 | Trustee | Since 2014 | Private investor. Formerly, Chief Investment Officer of Brown University (university endowment) (2000-2012). Formerly, Portfolio Strategist for Duke Management Company (university endowment manager) (1995-2000). Formerly, Managing Director, Cambridge Associates (investment consulting company) (1989-1995). Formerly, Consultant, Bain and Company (management consulting firm) (1987-1989). Formerly, Senior Equity Analyst, BA Investment Management Company (1983-1985).
Other Directorships. None. |
George J. Gorman
1952 | Chairperson
of the Board
and Trustee | Since 2021
(Chairperson) and
2014 (Trustee) | Principal at George J. Gorman LLC (consulting firm). Formerly, Senior Partner at Ernst & Young LLP (a registered public accounting firm) (1974-2009).
Other Directorships. None. |
Eaton Vance
Greater India Fund
December 31, 2022
Management and Organization — continued
| Name and Year of Birth | Trust/Portfolio
Position(s) | Length of Service | Principal Occupation(s) and Other Directorships
During Past Five Years and Other Relevant Experience |
| Noninterested Trustees (continued) |
Valerie A. Mosley
1960 | Trustee | Since 2014 | Chairwoman and Chief Executive Officer of Valmo Ventures (a consulting and investment firm). Founder of Upward Wealth, Inc., dba BrightUp, a fintech platform. Formerly, Partner and Senior Vice President, Portfolio Manager and Investment Strategist at Wellington Management Company, LLP (investment management firm) (1992-2012). Formerly, Chief Investment Officer, PG Corbin Asset Management (1990-1992). Formerly worked in institutional corporate bond sales at Kidder Peabody (1986-1990).
Other Directorships. Director of DraftKings, Inc. (digital sports entertainment and gaming company) (since September 2020). Director of Envestnet, Inc. (provider of intelligent systems for wealth management and financial wellness) (since 2018). Formerly, Director of Dynex Capital, Inc. (mortgage REIT) (2013-2020) and Director of Groupon, Inc. (e-commerce provider) (2020-2022). |
Keith Quinton
1958 | Trustee | Since 2018 | Private investor, researcher and lecturer. Formerly, Independent Investment Committee Member at New Hampshire Retirement System (2017-2021). Formerly, Portfolio Manager and Senior Quantitative Analyst at Fidelity Investments (investment management firm) (2001-2014).
Other Directorships. Formerly, Director (2016-2021) and Chairman (2019-2021) of New Hampshire Municipal Bond Bank. |
Marcus L. Smith
1966 | Trustee | Since 2018 | Private investor and independent corporate director. Formerly, Chief Investment Officer, Canada (2012-2017), Chief Investment Officer, Asia (2010-2012), Director of Asian Research (2004-2010) and portfolio manager (2001-2017) at MFS Investment Management (investment management firm).
Other Directorships. Director of First Industrial Realty Trust, Inc. (an industrial REIT) (since 2021). Director of MSCI Inc. (global provider of investment decision support tools) (since 2017). Formerly, Director of DCT Industrial Trust Inc. (logistics real estate company) (2017-2018). |
Susan J. Sutherland
1957 | Trustee | Since 2015 | Private investor. Director of Ascot Group Limited and certain of its subsidiaries (insurance and reinsurance) (since 2017). Formerly, Director of Hagerty Holding Corp. (insurance) (2015-2018) and Montpelier Re Holdings Ltd. (insurance and reinsurance) (2013-2015). Formerly, Associate, Counsel and Partner at Skadden, Arps, Slate, Meagher & Flom LLP (law firm) (1982-2013).
Other Directorships. Formerly, Director of Kairos Acquisition Corp. (insurance/InsurTech acquisition company) (2021-2023). |
Scott E. Wennerholm
1959 | Trustee | Since 2016 | Private investor. Formerly, Trustee at Wheelock College (postsecondary institution) (2012-2018). Formerly, Consultant at GF Parish Group (executive recruiting firm) (2016-2017). Formerly, Chief Operating Officer and Executive Vice President at BNY Mellon Asset Management (investment management firm) (2005-2011). Formerly, Chief Operating Officer and Chief Financial Officer at Natixis Global Asset Management (investment management firm) (1997-2004). Formerly, Vice President at Fidelity Investments Institutional Services (investment management firm) (1994-1997).
Other Directorships. None. |
Nancy A. Wiser(1)
1967 | Trustee | Since 2022 | Formerly, Executive Vice President and the Global Head of Operations at Wells Fargo Asset Management (2011-2021).
Other Directorships. None. |
| Name and Year of Birth | Trust/Portfolio
Position(s) | Length of Service | Principal Occupation(s)
During Past Five Years |
| Principal Officers who are not Trustees |
Eric A. Stein
1980 | President of the Trust | Since 2020 | Vice President and Chief Investment Officer, Fixed Income of EVM and BMR. Prior to November 1, 2020, Mr. Stein was a co-Director of Eaton Vance’s Global Income Investments. Also Vice President of Calvert Research and Management (“CRM”). |
R. Kelly Williams, Jr.
1971 | President of the Portfolio | Since 2022 | President and Chief Operating Officer of Atlanta Capital Management Company, LLC. Officer of 21 registered investment companies managed by Eaton Vance or BMR. |
Deidre E. Walsh
1971 | Vice President and
Chief Legal Officer | Since 2009 | Vice President of EVM and BMR. Also Vice President of CRM. |
Eaton Vance
Greater India Fund
December 31, 2022
Management and Organization — continued
| Name and Year of Birth | Trust/Portfolio
Position(s) | Length of Service | Principal Occupation(s)
During Past Five Years |
| Principal Officers who are not Trustees (continued) |
James F. Kirchner
1967 | Treasurer | Since 2007 | Vice President of EVM and BMR. Also Vice President of CRM. |
Nicholas Di Lorenzo
1987 | Secretary | Since 2022 | Formerly, associate (2012-2021) and counsel (2022) at Dechert LLP. |
Richard F. Froio
1968 | Chief Compliance
Officer | Since 2017 | Vice President of EVM and BMR since 2017. Formerly, Deputy Chief Compliance Officer (Adviser/Funds) and Chief Compliance Officer (Distribution) at PIMCO (2012-2017) and Managing Director at BlackRock/Barclays Global Investors (2009-2012). |
(1) Mr. Bowser and Ms. Wiser began serving as Trustees effective April 4, 2022.
The SAI for the Fund includes additional information about the Trustees and officers of the Fund and the Portfolio and can be obtained without charge on Eaton Vance’s website at www.eatonvance.com or by calling 1-800-262-1122.
| FACTS | WHAT DOES EATON VANCE DO WITH YOUR
PERSONAL INFORMATION? |
| Why? | Financial companies choose how they share your personal information. Federal law gives consumers the right to limit some but not all sharing. Federal law also requires us to tell you how we collect, share, and protect your personal information. Please read this notice carefully to understand what we do. |
| |
| What? | The types of personal information we collect and share depend on the product or service you have with us. This information can include:■ Social Security number and income
■ investment experience and risk tolerance
■ checking account number and wire transfer instructions |
| |
| How? | All financial companies need to share customers’ personal information to run their everyday business. In the section below, we list the reasons financial companies can share their customers’ personal information; the reasons Eaton Vance chooses to share; and whether you can limit this sharing. |
Reasons we can share your
personal information | Does Eaton Vance
share? | Can you limit
this sharing? |
| For our everyday business purposes — such as to process your transactions, maintain your account(s), respond to court orders and legal investigations, or report to credit bureaus | Yes | No |
| For our marketing purposes — to offer our products and services to you | Yes | No |
| For joint marketing with other financial companies | No | We don’t share |
| For our investment management affiliates’ everyday business purposes — information about your transactions, experiences, and creditworthiness | Yes | Yes |
| For our affiliates’ everyday business purposes — information about your transactions and experiences | Yes | No |
| For our affiliates’ everyday business purposes — information about your creditworthiness | No | We don’t share |
| For our investment management affiliates to market to you | Yes | Yes |
| For our affiliates to market to you | No | We don’t share |
| For nonaffiliates to market to you | No | We don’t share |
To limit our
sharing | Call toll-free 1-800-262-1122 or email: EVPrivacy@eatonvance.comPlease note:If you are a new customer, we can begin sharing your information 30 days from the date we sent this notice. When you are no longer our customer, we continue to share your information as described in this notice. However, you can contact us at any time to limit our sharing. |
| Questions? | Call toll-free 1-800-262-1122 or email: EVPrivacy@eatonvance.com |
| Privacy Notice — continued | April 2021 |
| Who we are |
| Who is providing this notice? | Eaton Vance Management, Eaton Vance Distributors, Inc., Eaton Vance Trust Company, Eaton Vance Management (International) Limited, Eaton Vance Advisers International Ltd., Eaton Vance Global Advisors Limited, Eaton Vance Management’s Real Estate Investment Group, Boston Management and Research, Calvert Research and Management, Eaton Vance and Calvert Fund Families and our investment advisory affiliates (“Eaton Vance”) (see Investment Management Affiliates definition below) |
| What we do |
How does Eaton Vance
protect my personal
information? | To protect your personal information from unauthorized access and use, we use security measures that comply with federal law. These measures include computer safeguards and secured files and buildings. We have policies governing the proper handling of customer information by personnel and requiring third parties that provide support to adhere to appropriate security standards with respect to such information. |
How does Eaton Vance
collect my personal
information? | We collect your personal information, for example, when you■ open an account or make deposits or withdrawals from your account
■ buy securities from us or make a wire transfer
■ give us your contact informationWe also collect your personal information from others, such as credit bureaus, affiliates, or other companies. |
| Why can’t I limit all sharing? | Federal law gives you the right to limit only■ sharing for affiliates’ everyday business purposes — information about your creditworthiness
■ affiliates from using your information to market to you
■ sharing for nonaffiliates to market to youState laws and individual companies may give you additional rights to limit sharing. See below for more on your rights under state law. |
| Definitions |
Investment Management
Affiliates | Eaton Vance Investment Management Affiliates include registered investment advisers, registered broker- dealers, and registered and unregistered funds. Investment Management Affiliates does not include entities associated with Morgan Stanley Wealth Management, such as Morgan Stanley Smith Barney LLC and Morgan Stanley & Co. |
| Affiliates | Companies related by common ownership or control. They can be financial and nonfinancial companies.■ Our affiliates include companies with a Morgan Stanley name and financial companies such as Morgan Stanley Smith Barney LLC and Morgan Stanley & Co. |
| Nonaffiliates | Companies not related by common ownership or control. They can be financial and nonfinancial companies.■ Eaton Vance does not share with nonaffiliates so they can market to you. |
| Joint marketing | A formal agreement between nonaffiliated financial companies that together market financial products or services to you.■ Eaton Vance doesn’t jointly market. |
| Other important information |
| Vermont: Except as permitted by law, we will not share personal information we collect about Vermont residents with Nonaffiliates unless you provide us with your written consent to share such information.California: Except as permitted by law, we will not share personal information we collect about California residents with Nonaffiliates and we will limit sharing such personal information with our Affiliates to comply with California privacy laws that apply to us. |
Delivery of Shareholder Documents. The Securities and Exchange Commission (SEC) permits funds to deliver only one copy of shareholder documents, including prospectuses, proxy statements and shareholder reports, to fund investors with multiple accounts at the same residential or post office box address. This practice is often called “householding” and it helps eliminate duplicate mailings to shareholders. Eaton Vance, or your financial intermediary, may household the mailing of your documents indefinitely unless you instruct Eaton Vance, or your financial intermediary, otherwise. If you would prefer that your Eaton Vance documents not be householded, please contact Eaton Vance at 1-800-262-1122, or contact your financial intermediary. Your instructions that householding not apply to delivery of your Eaton Vance documents will typically be effective within 30 days of receipt by Eaton Vance or your financial intermediary.
Portfolio Holdings. Each Eaton Vance Fund and its underlying Portfolio(s) (if applicable) files a schedule of portfolio holdings on Part F to Form N-PORT with the SEC. Certain information filed on Form N-PORT may be viewed on the Eaton Vance website at www.eatonvance.com, by calling Eaton Vance at 1-800-262-1122 or in the EDGAR database on the SEC’s website at www.sec.gov.
Proxy Voting. From time to time, funds are required to vote proxies related to the securities held by the funds. The Eaton Vance Funds or their underlying Portfolios (if applicable) vote proxies according to a set of policies and procedures approved by the Funds’ and Portfolios’ Boards. You may obtain a description of these policies and procedures and information on how the Funds or Portfolios voted proxies relating to portfolio securities during the most recent 12-month period ended June 30, without charge, upon request, by calling 1-800-262-1122 and by accessing the SEC’s website at www.sec.gov.
This Page Intentionally Left Blank
This Page Intentionally Left Blank
This Page Intentionally Left Blank
Investment Adviser of Eaton Vance Greater India Fund
and Greater India Portfolio
Boston Management and Research
Two International Place
Boston, MA 02110
Investment Sub-Adviser of Eaton Vance Greater India Fund
and Greater India Portfolio
Goldman Sachs Asset Management, L.P.
200 West Street
New York, NY 10282
Administrator of Eaton Vance Greater India Fund
Eaton Vance Management
Two International Place
Boston, MA 02110
Principal Underwriter*
Eaton Vance Distributors, Inc.
Two International Place
Boston, MA 02110
(617) 482-8260
Custodian
State Street Bank and Trust Company
State Street Financial Center, One Lincoln Street
Boston, MA 02111
Transfer Agent
BNY Mellon Investment Servicing (US) Inc.
Attn: Eaton Vance Funds
P.O. Box 534439
Pittsburgh, PA 15253-4439
(800) 262-1122
Independent Registered Public Accounting Firm
Deloitte & Touche LLP
200 Berkeley Street
Boston, MA 02116-5022
Fund Offices
Two International Place
Boston, MA 02110
* FINRA BrokerCheck. Investors may check the background of their Investment Professional by contacting the Financial Industry Regulatory Authority (FINRA). FINRA BrokerCheck is a free tool to help investors check the professional background of current and former FINRA-registered securities firms and brokers. FINRA BrokerCheck is available by calling 1-800-289-9999 and at www.FINRA.org. The FINRA BrokerCheck brochure describing this program is available to investors at www.FINRA.org.
Eaton Vance
Special Equities Fund
Annual Report
December 31, 2022
Commodity Futures Trading Commission Registration. The Commodity Futures Trading Commission (“CFTC”) has adopted regulations that subject registered investment companies and advisers to regulation by the CFTC if a fund invests more than a prescribed level of its assets in certain CFTC-regulated instruments (including futures, certain options and swap agreements) or markets itself as providing investment exposure to such instruments. The investment adviser has claimed an exclusion from the definition of “commodity pool operator” under the Commodity Exchange Act with respect to its management of the Fund. Accordingly, neither the Fund nor the adviser with respect to the operation of the Fund is subject to CFTC regulation. Because of its management of other strategies, the Fund's adviser is registered with the CFTC as a commodity pool operator. The adviser is also registered as a commodity trading advisor.
Fund shares are not insured by the FDIC and are not deposits or other obligations of, or guaranteed by, any depository institution. Shares are subject to investment risks, including possible loss of principal invested.
This report must be preceded or accompanied by a current summary prospectus or prospectus. Before investing, investors should consider carefully the investment objective, risks, and charges and expenses of a mutual fund. This and other important information is contained in the summary prospectus and prospectus, which can be obtained from a financial intermediary. Prospective investors should read the prospectus carefully before investing. For further information, please call 1-800-262-1122.
Annual Report December 31, 2022
Eaton Vance
Special Equities Fund
Eaton Vance
Special Equities Fund
December 31, 2022
Management’s Discussion of Fund Performance†
Economic and Market Conditions
During the 12-month period starting January 1, 2022, the U.S. equity market was dominated by the ongoing effects of one black swan event -- the COVID-19 pandemic -- and fallout from another -- Russia’s invasion of Ukraine.
As the new year began, investors became increasingly concerned about the twin threats of inflation and interest rate hikes. As a result, stock performance turned negative -- a sharp about-face from the all-time highs many U.S. equity indexes had posted in late 2021.
In February, Russia’s invasion of Ukraine sent shock waves through U.S. and global markets, exacerbating inflationary pressures on energy and food costs. The U.S. Federal Reserve (the Fed) -- along with other central banks around the world -- initiated its first interest rate hikes in years.
Investors began to expect the Fed would raise interest rates at every policy meeting in 2022 and, in turn, worried that aggressive rate hikes could tip the economy into recession. At its June, July, September, and November 2022 policy meetings, the Fed hiked the federal funds rate 0.75% each time -- its first moves of that magnitude since 1994. Higher interest rates, inflation, and recessionary worries drove stock prices down, with rate-sensitive technology stocks -- star performers earlier in the pandemic -- suffering some of the worst declines.
In October and November 2022, however, U.S. stocks delivered positive performance for the first time in months. The rally was driven by a combination of better-than-expected company earnings, declining inflation, and hope that the Fed would temper the size of future rate hikes.
But while the Fed indeed delivered a smaller 0.50% rate hike in December, it raised its expectation of how high rates might go in 2023. As investors digested the news that rates could stay higher for longer than previously expected, equity prices declined in the final month of 2022.
For the period as a whole, the blue-chip Dow Jones Industrial Average® returned -6.86%; the S&P 500® Index, a broad measure of U.S. stocks, returned -18.11%; and the technology-laden Nasdaq Composite Index returned -32.54%.
Fund Performance
For the 12-month period ended December 31, 2022, Eaton Vance Special Equities Fund returned -17.09% for Class A shares at net asset value (NAV), outperforming its benchmark, the Russell 2500™ Index (the Index), which returned -18.37%.
The Fund’s outperformance relative to the Index was primarily a result of stock selections. Selections in the financials, health care, consumer discretionary, and consumer staples sectors were particularly beneficial during the period.
In the consumer staples sector, Performance Food Group Co. (Performance) was a leading contributor to returns relative to the Index during the period. Performance’s share price rose on strong growth in sales and profits attributed in part to the food distributor’s 2021 acquisition of Core-Mark Holding Co., Inc., a distributor to convenience stores.
CBIZ, Inc. (CBIZ), a management consulting company, contributed to Fund returns relative to the Index during the period. CBIZ’s share price rose after the company reported strong earnings and revenue growth during the first three quarters of 2022, and issued robust projections for the remainder of its fiscal year.
Favorable selections in the information technology sector included Fair Isaac Corp. (Fair Isaac), a large credit-rating company and provider of software that seeks to predict consumer behavior in the U.S. Fair Isaac’s share price rose as the company was able to increase the price of its products, leading to increased revenues and higher profit margins during the period.
In contrast, the Fund’s sector allocations detracted overall from relative returns. The Fund’s underweight exposure to the energy sector -- the only sector in positive territory with returns of 50% during the period -- particularly weighed on relative returns. Stock selections in the industrials and communication services sectors also detracted from relative returns during the period.
AZEK Co., Inc. (AZEK), an outdoor furniture manufacturer, was among the largest detractors from Fund returns relative to the Index during the period. AZEK’s stock price fell on concerns that rate-hike projections by the U.S. Federal Reserve might weigh on home purchases and improvements, decreasing demand for its products.
The share price of R1 RCM, Inc. fell sharply after the company announced an earnings loss for the third quarter of 2022 and a change in its chief executive officer. The company provides financial management services to the health care industry.
CarGurus, Inc., an automotive research and shopping website, was among the largest detractors from relative returns during the period. Its share price fell after the company announced lower-than-expected projected earnings for the second quarter of 2022, and declining traffic on its website.
See Endnotes and Additional Disclosures in this report.
Past performance is no guarantee of future results. Returns are historical and are calculated by determining the percentage change in net asset value (NAV) or offering price (as applicable) with all distributions reinvested. Furthermore, returns do not reflect the deduction of taxes that shareholders may have to pay on Fund distributions or upon the redemption of Fund shares. Investment return and principal value will fluctuate so that shares, when redeemed, may be worth more or less than their original cost. Performance for periods less than or equal to one year is cumulative. Performance is for the stated time period only; due to market volatility, current Fund performance may be lower or higher than the quoted return. For performance as of the most recent month-end, please refer to eatonvance.com.
Eaton Vance
Special Equities Fund
December 31, 2022
Performance
Portfolio Manager(s) Michael D. McLean, CFA and J. Griffith Noble, CFA
| % Average Annual Total Returns1,2 | Class
Inception Date | Performance
Inception Date | One Year | Five Years | Ten Years |
| Class A at NAV | 04/22/1968 | 04/22/1968 | (17.09)% | 6.25% | 9.28% |
| Class A with 5.25% Maximum Sales Charge | — | — | (21.43) | 5.11 | 8.70 |
| Class C at NAV | 11/17/1994 | 04/22/1968 | (17.73) | 5.45 | 8.63 |
| Class C with 1% Maximum Deferred Sales Charge | — | — | (18.51) | 5.45 | 8.63 |
| Class I at NAV | 07/29/2011 | 04/22/1968 | (16.91) | 6.51 | 9.56 |
|
| Russell 2500™ Index | — | — | (18.37)% | 5.88% | 10.02% |
| % Total Annual Operating Expense Ratios3 | Class A | Class C | Class I |
| | 1.18% | 1.93% | 0.93% |
Growth of $10,000
This graph shows the change in value of a hypothetical investment of $10,000 in Class A of the Fund for the period indicated. For comparison, the same investment is shown in the indicated index.
| Growth of Investment | Amount Invested | Period Beginning | At NAV | With Maximum Sales Charge |
| Class C | $10,000 | 12/31/2012 | $22,903 | N.A. |
| Class I, at minimum investment | $1,000,000 | 12/31/2012 | $2,493,149 | N.A. |
See Endnotes and Additional Disclosures in this report.
Past performance is no guarantee of future results. Returns are historical and are calculated by determining the percentage change in net asset value (NAV) or offering price (as applicable) with all distributions reinvested. Furthermore, returns do not reflect the deduction of taxes that shareholders may have to pay on Fund distributions or upon the redemption of Fund shares. Investment return and principal value will fluctuate so that shares, when redeemed, may be worth more or less than their original cost. Performance for periods less than or equal to one year is cumulative. Performance is for the stated time period only; due to market volatility, current Fund performance may be lower or higher than the quoted return. For performance as of the most recent month-end, please refer to eatonvance.com.
Eaton Vance
Special Equities Fund
December 31, 2022
| Sector Allocation (% of net assets)1 |
| Top 10 Holdings (% of net assets)1 |
| CBIZ, Inc. | 3.0% |
| Chemed Corp. | 2.7 |
| Valvoline, Inc. | 2.6 |
| Fair Isaac Corp. | 2.5 |
| RLI Corp. | 2.3 |
| AAON, Inc. | 2.2 |
| Ryan Specialty Holdings, Inc., Class A | 2.2 |
| W.R. Berkley Corp. | 2.2 |
| Performance Food Group Co. | 2.1 |
| Dorman Products, Inc. | 2.1 |
| Total | 23.9% |
Footnotes:
| 1 | Excludes cash and cash equivalents. |
Eaton Vance
Special Equities Fund
December 31, 2022
Endnotes and Additional Disclosures
| † | The views expressed in this report are those of the portfolio manager(s) and are current only through the date stated at the top of this page. These views are subject to change at any time based upon market or other conditions, and Eaton Vance and the Fund(s) disclaim any responsibility to update such views. These views may not be relied upon as investment advice and, because investment decisions are based on many factors, may not be relied upon as an indication of trading intent on behalf of any Eaton Vance fund. This commentary may contain statements that are not historical facts, referred to as “forward-looking statements.” The Fund’s actual future results may differ significantly from those stated in any forward-looking statement, depending on factors such as changes in securities or financial markets or general economic conditions, the volume of sales and purchases of Fund shares, the continuation of investment advisory, administrative and service contracts, and other risks discussed from time to time in the Fund’s filings with the Securities and Exchange Commission. |
| | |
| 1 | Russell 2500™ Index is an unmanaged index of approximately 2,500 small-and mid-cap U.S. stocks. Unless otherwise stated, index returns do not reflect the effect of any applicable sales charges, commissions, expenses, taxes or leverage, as applicable. It is not possible to invest directly in an index. |
| 2 | Total Returns at NAV do not include applicable sales charges. If sales charges were deducted, the returns would be lower. Total Returns shown with maximum sales charge reflect the stated maximum sales charge. Unless otherwise stated, performance does not reflect the deduction of taxes on Fund distributions or redemptions of Fund shares.Effective November 5, 2020, Class C shares automatically convert to Class A shares eight years after purchase. The average annual total returns listed for Class C reflect conversion to Class A shares after eight years. Prior to November 5, 2020, Class C shares automatically converted to Class A shares ten years after purchase. |
| 3 | Source: Fund prospectus. The expense ratios for the current reporting period can be found in the Financial Highlights section of this report. Performance reflects expenses waived and/or reimbursed, if applicable. Without such waivers and/or reimbursements, performance would have been lower. |
| | Fund profile subject to change due to active management. |
| | Important Notice to Shareholders |
| | In December 2022, the Trustees of the Trust, on behalf of the Fund, approved an Agreement and Plan of Reorganization pursuant to which the Fund is expected to be reorganized with and into a newly formed series of Calvert Management Series. The proposed reorganization is subject to approval by the shareholders of the Fund and the satisfaction of certain other conditions. |
| | Additional Information |
| | S&P 500® Index is an unmanaged index of large-cap stocks commonly used as a measure of U.S. stock market performance. Dow Jones Industrial Average® is a price-weighted average of 30 blue-chip stocks that are generally the leaders in their industry. S&P Dow Jones Indices are a product of S&P Dow Jones Indices LLC (“S&P DJI”) and have been licensed for use. S&P® and S&P 500® are registered trademarks of S&P DJI; Dow Jones® is a registered trademark of Dow Jones Trademark Holdings LLC (“Dow Jones”); S&P DJI, Dow Jones and their respective affiliates do not sponsor, endorse, sell or promote the Fund, will not have any liability with respect thereto and do not have any liability for any errors, omissions, or interruptions of the S&P Dow Jones Indices. Nasdaq Composite Index is a market capitalization-weighted index of all domestic and international securities listed on Nasdaq. Source: Nasdaq, Inc. The information is provided by Nasdaq (with its affiliates, are referred to as the “Corporations”) and Nasdaq’s third party licensors on an “as is” basis and the Corporations make no guarantees and bear no liability of any kind with respect to the information or the Fund. |
Eaton Vance
Special Equities Fund
December 31, 2022
Example
As a Fund shareholder, you incur two types of costs: (1) transaction costs, including sales charges (loads) on purchases; and (2) ongoing costs, including management fees; distribution and/or service fees; and other Fund expenses. This Example is intended to help you understand your ongoing costs (in dollars) of Fund investing and to compare these costs with the ongoing costs of investing in other mutual funds. The Example is based on an investment of $1,000 invested at the beginning of the period and held for the entire period (July 1, 2022 to December 31, 2022).
Actual Expenses
The first section of the table below provides information about actual account values and actual expenses. You may use the information in this section, together with the amount you invested, to estimate the expenses that you paid over the period. Simply divide your account value by $1,000 (for example, an $8,600 account value divided by $1,000 = 8.6), then multiply the result by the number in the first section under the heading entitled “Expenses Paid During Period” to estimate the expenses you paid on your account during this period.
Hypothetical Example for Comparison Purposes
The second section of the table below provides information about hypothetical account values and hypothetical expenses based on the actual Fund expense ratio and an assumed rate of return of 5% per year (before expenses), which is not the actual Fund return. The hypothetical account values and expenses may not be used to estimate the actual ending account balance or expenses you paid for the period. You may use this information to compare the ongoing costs of investing in your Fund and other funds. To do so, compare this 5% hypothetical example with the 5% hypothetical examples that appear in the shareholder reports of the other funds.
Please note that the expenses shown in the table are meant to highlight your ongoing costs only and do not reflect any transactional costs, such as sales charges (loads). Therefore, the second section of the table is useful in comparing ongoing costs only, and will not help you determine the relative total costs of owning different funds. In addition, if these transactional costs were included, your costs would be higher.
| | Beginning
Account Value
(7/1/22) | Ending
Account Value
(12/31/22) | Expenses Paid
During Period*
(7/1/22 – 12/31/22) | Annualized
Expense
Ratio |
| Actual | | | | |
| Class A | $1,000.00 | $1,034.90 | $6.15** | 1.20% |
| Class C | $1,000.00 | $1,031.10 | $9.98** | 1.95% |
| Class I | $1,000.00 | $1,036.20 | $4.88** | 0.95% |
| |
| Hypothetical | | | | |
| (5% return per year before expenses) | | | | |
| Class A | $1,000.00 | $1,019.16 | $6.11** | 1.20% |
| Class C | $1,000.00 | $1,015.38 | $9.91** | 1.95% |
| Class I | $1,000.00 | $1,020.42 | $4.84** | 0.95% |
| * | Expenses are equal to the Fund's annualized expense ratio for the indicated Class, multiplied by the average account value over the period, multiplied by 184/365 (to reflect the one-half year period). The Example assumes that the $1,000 was invested at the net asset value per share determined at the close of business on June 30, 2022. |
| ** | Absent an allocation of certain expenses to an affiliate, expenses would be higher. |
Eaton Vance
Special Equities Fund
December 31, 2022
| Security | Shares | Value |
| Aerospace & Defense — 2.9% |
| Hexcel Corp. | | 15,786 | $ 929,006 |
| Woodward, Inc. | | 5,830 | 563,236 |
| | | | $ 1,492,242 |
| Auto Components — 4.2% |
| Dana, Inc. | | 31,725 | $ 479,999 |
| Dorman Products, Inc.(1) | | 13,400 | 1,083,658 |
| Visteon Corp.(1) | | 4,700 | 614,901 |
| | | | $ 2,178,558 |
| Automobiles — 0.7% |
| Harley-Davidson, Inc. | | 9,090 | $ 378,144 |
| | | | $ 378,144 |
| Banks — 7.6% |
| Commerce Bancshares, Inc. | | 15,799 | $ 1,075,438 |
| CVB Financial Corp. | | 20,530 | 528,647 |
| M&T Bank Corp. | | 5,680 | 823,941 |
| SouthState Corp. | | 13,780 | 1,052,241 |
| Wintrust Financial Corp. | | 5,840 | 493,597 |
| | | | $ 3,973,864 |
| Biotechnology — 1.6% |
| Neurocrine Biosciences, Inc.(1) | | 6,845 | $ 817,567 |
| | | | $ 817,567 |
| Building Products — 4.2% |
| AAON, Inc. | | 15,320 | $ 1,153,902 |
| AZEK Co., Inc. (The)(1) | | 50,764 | 1,031,525 |
| | | | $ 2,185,427 |
| Capital Markets — 3.8% |
| LPL Financial Holdings, Inc. | | 1,710 | $ 369,651 |
| MarketAxess Holdings, Inc. | | 2,185 | 609,374 |
| Stifel Financial Corp. | | 5,375 | 313,739 |
| Tradeweb Markets, Inc., Class A | | 10,840 | 703,841 |
| | | | $ 1,996,605 |
| Chemicals — 3.9% |
| Quaker Houghton | | 4,000 | $ 667,600 |
| Security | Shares | Value |
| Chemicals (continued) |
| Valvoline, Inc. | | 41,420 | $ 1,352,363 |
| | | | $ 2,019,963 |
| Commercial Services & Supplies — 2.1% |
| Rentokil Initial PLC ADR | | 34,800 | $ 1,072,188 |
| | | | $ 1,072,188 |
| Communications Equipment — 1.8% |
| F5, Inc.(1) | | 6,415 | $ 920,617 |
| | | | $ 920,617 |
| Containers & Packaging — 1.5% |
| AptarGroup, Inc. | | 7,290 | $ 801,754 |
| | | | $ 801,754 |
| Electric Utilities — 1.2% |
| Alliant Energy Corp. | | 11,474 | $ 633,479 |
| | | | $ 633,479 |
| Electrical Equipment — 0.4% |
| Generac Holdings, Inc.(1) | | 2,260 | $ 227,492 |
| | | | $ 227,492 |
| Electronic Equipment, Instruments & Components — 1.3% |
| National Instruments Corp. | | 18,305 | $ 675,454 |
| | | | $ 675,454 |
| Equity Real Estate Investment Trusts (REITs) — 6.5% |
| CubeSmart | | 20,467 | $ 823,797 |
| EastGroup Properties, Inc. | | 5,730 | 848,384 |
| Equity LifeStyle Properties, Inc. | | 13,420 | 866,932 |
| Rexford Industrial Realty, Inc. | | 15,360 | 839,270 |
| | | | $ 3,378,383 |
| Food & Staples Retailing — 2.1% |
| Performance Food Group Co.(1) | | 18,728 | $ 1,093,528 |
| | | | $ 1,093,528 |
| Health Care Equipment & Supplies — 5.5% |
| Cooper Cos., Inc. (The) | | 3,081 | $ 1,018,794 |
| Envista Holdings Corp.(1) | | 26,575 | 894,780 |
| Teleflex, Inc. | | 3,904 | 974,556 |
| | | | $ 2,888,130 |
7
See Notes to Financial Statements.
Eaton Vance
Special Equities Fund
December 31, 2022
Portfolio of Investments — continued
| Security | Shares | Value |
| Health Care Providers & Services — 6.5% |
| Addus HomeCare Corp.(1) | | 4,820 | $ 479,542 |
| Agiliti, Inc.(1) | | 47,305 | 771,545 |
| Amedisys, Inc.(1) | | 1,975 | 164,991 |
| Chemed Corp. | | 2,760 | 1,408,787 |
| R1 RCM, Inc.(1) | | 52,015 | 569,564 |
| | | | $ 3,394,429 |
| Hotels, Restaurants & Leisure — 4.0% |
| Domino's Pizza, Inc. | | 1,735 | $ 601,004 |
| Papa John's International, Inc. | | 2,425 | 199,602 |
| Planet Fitness, Inc., Class A(1) | | 2,685 | 211,578 |
| Texas Roadhouse, Inc. | | 2,640 | 240,108 |
| Wyndham Hotels & Resorts, Inc. | | 11,945 | 851,798 |
| | | | $ 2,104,090 |
| Insurance — 9.6% |
| RLI Corp. | | 9,042 | $ 1,186,943 |
| Ryan Specialty Holdings, Inc., Class A(1) | | 27,756 | 1,152,152 |
| Selective Insurance Group, Inc. | | 10,960 | 971,166 |
| W.R. Berkley Corp. | | 15,790 | 1,145,880 |
| White Mountains Insurance Group, Ltd. | | 385 | 544,517 |
| | | | $ 5,000,658 |
| Interactive Media & Services — 0.7% |
| CarGurus, Inc.(1) | | 24,725 | $ 346,397 |
| | | | $ 346,397 |
| Leisure Products — 0.8% |
| Brunswick Corp. | | 5,535 | $ 398,963 |
| | | | $ 398,963 |
| Machinery — 5.7% |
| Chart Industries, Inc.(1) | | 2,740 | $ 315,730 |
| Graco, Inc. | | 14,815 | 996,457 |
| Middleby Corp.(1) | | 7,380 | 988,182 |
| Nordson Corp. | | 2,905 | 690,577 |
| | | | $ 2,990,946 |
| Multi-Utilities — 1.2% |
| CMS Energy Corp. | | 9,945 | $ 629,817 |
| | | | $ 629,817 |
| Pharmaceuticals — 1.4% |
| Jazz Pharmaceuticals PLC(1) | | 4,560 | $ 726,454 |
| | | | $ 726,454 |
| Security | Shares | Value |
| Professional Services — 3.0% |
| CBIZ, Inc.(1) | | 33,460 | $ 1,567,601 |
| | | | $ 1,567,601 |
| Road & Rail — 1.3% |
| Landstar System, Inc. | | 4,000 | $ 651,600 |
| | | | $ 651,600 |
| Software — 8.5% |
| Altair Engineering, Inc., Class A(1) | | 19,437 | $ 883,800 |
| Ceridian HCM Holding, Inc.(1) | | 5,980 | 383,617 |
| Clearwater Analytics Holdings, Inc., Class A(1) | | 25,915 | 485,906 |
| Envestnet, Inc.(1) | | 15,455 | 953,573 |
| Fair Isaac Corp.(1) | | 2,170 | 1,298,919 |
| SPS Commerce, Inc.(1) | | 3,095 | 397,491 |
| | | | $ 4,403,306 |
| Specialty Retail — 1.8% |
| Five Below, Inc.(1) | | 2,945 | $ 520,882 |
| Floor & Decor Holdings, Inc., Class A(1) | | 2,890 | 201,231 |
| RH (1) | | 885 | 236,463 |
| | | | $ 958,576 |
| Trading Companies & Distributors — 2.3% |
| Core & Main, Inc., Class A(1) | | 38,085 | $ 735,421 |
| Herc Holdings, Inc. | | 3,430 | 451,285 |
| | | | $ 1,186,706 |
Total Common Stocks
(identified cost $45,337,822) | | | $51,092,938 |
| Short-Term Investments — 1.9% |
| Security | Shares | Value |
| Morgan Stanley Institutional Liquidity Funds - Government Portfolio, Institutional Class, 4.11%(2) | | 997,723 | $ 997,723 |
Total Short-Term Investments
(identified cost $997,723) | | | $ 997,723 |
Total Investments — 100.0%
(identified cost $46,335,545) | | | $52,090,661 |
| Other Assets, Less Liabilities — (0.0)%(3) | | | $ (4,156) |
| Net Assets — 100.0% | | | $52,086,505 |
8
See Notes to Financial Statements.
Eaton Vance
Special Equities Fund
December 31, 2022
Portfolio of Investments — continued
| The percentage shown for each investment category in the Portfolio of Investments is based on net assets. |
| (1) | Non-income producing security. |
| (2) | May be deemed to be an affiliated investment company. The rate shown is the annualized seven-day yield as of December 31, 2022. |
| (3) | Amount is less than (0.05)%. |
| Abbreviations: |
| ADR | – American Depositary Receipt |
9
See Notes to Financial Statements.
Eaton Vance
Special Equities Fund
December 31, 2022
Statement of Assets and Liabilities
| | December 31, 2022 |
| Assets | |
| Unaffiliated investments, at value (identified cost $45,337,822) | $ 51,092,938 |
| Affiliated investment, at value (identified cost $997,723) | 997,723 |
| Dividends receivable | 33,526 |
| Dividends receivable from affiliated investment | 2,138 |
| Receivable for Fund shares sold | 106,765 |
| Receivable from affiliate | 5,601 |
| Total assets | $52,238,691 |
| Liabilities | |
| Payable for investments purchased | $ 36,465 |
| Payable for Fund shares redeemed | 298 |
| Payable to affiliates: | |
| Investment adviser fee | 27,692 |
| Distribution and service fees | 5,869 |
| Trustees' fees | 1,095 |
| Accrued expenses | 80,767 |
| Total liabilities | $ 152,186 |
| Net Assets | $52,086,505 |
| Sources of Net Assets | |
| Paid-in capital | $ 46,879,232 |
| Distributable earnings | 5,207,273 |
| Net Assets | $52,086,505 |
| Class A Shares | |
| Net Assets | $ 26,123,276 |
| Shares Outstanding | 1,185,397 |
Net Asset Value and Redemption Price Per Share
(net assets ÷ shares of beneficial interest outstanding) | $ 22.04 |
Maximum Offering Price Per Share
(100 ÷ 94.75 of net asset value per share) | $ 23.26 |
| Class C Shares | |
| Net Assets | $ 206,365 |
| Shares Outstanding | 11,576 |
Net Asset Value and Offering Price Per Share*
(net assets ÷ shares of beneficial interest outstanding) | $ 17.83 |
| Class I Shares | |
| Net Assets | $ 25,756,864 |
| Shares Outstanding | 1,121,196 |
Net Asset Value, Offering Price and Redemption Price Per Share
(net assets ÷ shares of beneficial interest outstanding) | $ 22.97 |
| On sales of $50,000 or more, the offering price of Class A shares is reduced. |
| * | Redemption price per share is equal to the net asset value less any applicable contingent deferred sales charge. |
10
See Notes to Financial Statements.
Eaton Vance
Special Equities Fund
December 31, 2022
| | Year Ended |
| | December 31, 2022 |
| Investment Income | |
| Dividend income | $ 581,768 |
| Dividend income from affiliated investments | 15,394 |
| Total investment income | $ 597,162 |
| Expenses | |
| Investment adviser fee | $ 352,597 |
| Distribution and service fees: | |
| Class A | 73,381 |
| Class C | 3,936 |
| Trustees’ fees and expenses | 4,297 |
| Custodian fee | 27,256 |
| Transfer and dividend disbursing agent fees | 64,663 |
| Legal and accounting services | 47,122 |
| Printing and postage | 9,864 |
| Registration fees | 43,789 |
| Miscellaneous | 13,157 |
| Total expenses | $ 640,062 |
| Deduct: | |
| Waiver and/or reimbursement of expenses by affiliates | $ 28,274 |
| Total expense reductions | $ 28,274 |
| Net expenses | $ 611,788 |
| Net investment loss | $ (14,626) |
| Realized and Unrealized Gain (Loss) | |
| Net realized gain (loss): | |
| Investment transactions | $ (212,374) |
| Investment transactions - affiliated investment | 66 |
| Net realized loss | $ (212,308) |
| Change in unrealized appreciation (depreciation): | |
| Investments | $ (11,135,085) |
| Net change in unrealized appreciation (depreciation) | $(11,135,085) |
| Net realized and unrealized loss | $(11,347,393) |
| Net decrease in net assets from operations | $(11,362,019) |
11
See Notes to Financial Statements.
Eaton Vance
Special Equities Fund
December 31, 2022
Statements of Changes in Net Assets
| | Year Ended December 31, |
| | 2022 | 2021 |
| Increase (Decrease) in Net Assets | | |
| From operations: | | |
| Net investment loss | $ (14,626) | $ (114,183) |
| Net realized gain (loss) | (212,308) | 9,871,044 |
| Net change in unrealized appreciation (depreciation) | (11,135,085) | 423,395 |
| Net increase (decrease) in net assets from operations | $(11,362,019) | $10,180,256 |
| Distributions to shareholders: | | |
| Class A | $ (1,257,539) | $ (4,279,525) |
| Class C | (13,635) | (83,557) |
| Class I | (1,129,625) | (3,858,486) |
| Total distributions to shareholders | $ (2,400,799) | $ (8,221,568) |
| Transactions in shares of beneficial interest: | | |
| Class A | $ (2,128,884) | $ 401,547 |
| Class C | (273,594) | (72,289) |
| Class I | (321,990) | 15,326,516 |
| Net increase (decrease) in net assets from Fund share transactions | $ (2,724,468) | $15,655,774 |
| Net increase (decrease) in net assets | $(16,487,286) | $17,614,462 |
| Net Assets | | |
| At beginning of year | $ 68,573,791 | $ 50,959,329 |
| At end of year | $ 52,086,505 | $68,573,791 |
12
See Notes to Financial Statements.
Eaton Vance
Special Equities Fund
December 31, 2022
| | Class A |
| | Year Ended December 31, |
| | 2022 | 2021 | 2020 | 2019 | 2018 |
| Net asset value — Beginning of year | $ 27.860 | $ 26.630 | $ 24.300 | $ 19.820 | $ 22.700 |
| Income (Loss) From Operations | | | | | |
| Net investment loss(1) | $ (0.034) | $ (0.086) | $ (0.026) | $ (0.034) | $ (0.036) |
| Net realized and unrealized gain (loss) | (4.697) | 5.017 | 3.086 | 5.586 | (0.982) |
| Total income (loss) from operations | $ (4.731) | $ 4.931 | $ 3.060 | $ 5.552 | $ (1.018) |
| Less Distributions | | | | | |
| From net realized gain | $ (1.089) | $ (3.701) | $ (0.730) | $ (1.072) | $ (1.862) |
| Total distributions | $ (1.089) | $ (3.701) | $ (0.730) | $ (1.072) | $ (1.862) |
| Net asset value — End of year | $22.040 | $27.860 | $26.630 | $24.300 | $19.820 |
| Total Return(2) | (17.09)% (3) | 18.87% | 12.81% (3) | 28.12% (3) | (4.95)% (3) |
| Ratios/Supplemental Data | | | | | |
| Net assets, end of year (000’s omitted) | $ 26,123 | $ 35,483 | $ 33,253 | $ 32,825 | $ 28,419 |
| Ratios (as a percentage of average daily net assets): | | | | | |
| Expenses | 1.20% (3)(4) | 1.18% | 1.20% (3) | 1.29% (3) | 1.35% (3) |
| Net investment loss | (0.14)% | (0.29)% | (0.12)% | (0.14)% | (0.15)% |
| Portfolio Turnover | 40% | 58% | 41% | 39% | 41% |
| (1) | Computed using average shares outstanding. |
| (2) | Returns are historical and are calculated by determining the percentage change in net asset value with all distributions reinvested and do not reflect the effect of sales charges. |
| (3) | The administrator reimbursed certain operating expenses (equal to 0.05%, 0.13%, 0.02% and 0.02% of average daily net assets for the years ended December 31, 2022, 2020, 2019 and 2018, respectively). Absent this reimbursement, total return would be lower. |
| (4) | Includes a reduction by the investment adviser of a portion of its adviser fee due to the Fund’s investment in the Liquidity Fund (equal to less than 0.005% of average daily net assets for the year ended December 31, 2022). |
13
See Notes to Financial Statements.
Eaton Vance
Special Equities Fund
December 31, 2022
Financial Highlights — continued
| | Class C |
| | Year Ended December 31, |
| | 2022 | 2021 | 2020 | 2019 | 2018 |
| Net asset value — Beginning of year | $ 22.960 | $ 22.670 | $ 20.940 | $ 17.330 | $ 20.230 |
| Income (Loss) From Operations | | | | | |
| Net investment loss(1) | $ (0.190) | $ (0.259) | $ (0.169) | $ (0.191) | $ (0.195) |
| Net realized and unrealized gain (loss) | (3.851) | 4.250 | 2.629 | 4.873 | (0.843) |
| Total income (loss) from operations | $ (4.041) | $ 3.991 | $ 2.460 | $ 4.682 | $ (1.038) |
| Less Distributions | | | | | |
| From net realized gain | $ (1.089) | $ (3.701) | $ (0.730) | $ (1.072) | $ (1.862) |
| Total distributions | $ (1.089) | $ (3.701) | $ (0.730) | $ (1.072) | $ (1.862) |
| Net asset value — End of year | $17.830 | $22.960 | $22.670 | $20.940 | $17.330 |
| Total Return(2) | (17.73)% (3) | 18.02% | 12.00% (3) | 27.14% (3) | (5.66)% (3) |
| Ratios/Supplemental Data | | | | | |
| Net assets, end of year (000’s omitted) | $ 206 | $ 594 | $ 643 | $ 957 | $ 1,461 |
| Ratios (as a percentage of average daily net assets): | | | | | |
| Expenses | 1.95% (3)(4) | 1.93% | 1.95% (3) | 2.04% (3) | 2.10% (3) |
| Net investment loss | (0.95)% | (1.05)% | (0.88)% | (0.94)% | (0.93)% |
| Portfolio Turnover | 40% | 58% | 41% | 39% | 41% |
| (1) | Computed using average shares outstanding. |
| (2) | Returns are historical and are calculated by determining the percentage change in net asset value with all distributions reinvested and do not reflect the effect of sales charges. |
| (3) | The administrator reimbursed certain operating expenses (equal to 0.05%, 0.13%, 0.02% and 0.02% of average daily net assets for the years ended December 31, 2022, 2020, 2019 and 2018, respectively). Absent this reimbursement, total return would be lower. |
| (4) | Includes a reduction by the investment adviser of a portion of its adviser fee due to the Fund’s investment in the Liquidity Fund (equal to less than 0.005% of average daily net assets for the year ended December 31, 2022). |
14
See Notes to Financial Statements.
Eaton Vance
Special Equities Fund
December 31, 2022
Financial Highlights — continued
| | Class I |
| | Year Ended December 31, |
| | 2022 | 2021 | 2020 | 2019 | 2018 |
| Net asset value — Beginning of year | $ 28.920 | $ 27.450 | $ 25.010 | $ 20.330 | $ 23.170 |
| Income (Loss) From Operations | | | | | |
| Net investment income (loss)(1) | $ 0.029 | $ (0.004) | $ 0.029 | $ 0.032 | $ 0.028 |
| Net realized and unrealized gain (loss) | (4.890) | 5.175 | 3.193 | 5.720 | (1.006) |
| Total income (loss) from operations | $ (4.861) | $ 5.171 | $ 3.222 | $ 5.752 | $ (0.978) |
| Less Distributions | | | | | |
| From net investment income | $ — | $ — | $ (0.052) | $ — | $ — |
| From net realized gain | (1.089) | (3.701) | (0.730) | (1.072) | (1.862) |
| Total distributions | $ (1.089) | $ (3.701) | $ (0.782) | $ (1.072) | $ (1.862) |
| Net asset value — End of year | $22.970 | $28.920 | $27.450 | $25.010 | $20.330 |
| Total Return(2) | (16.91)% (3) | 19.19% | 13.10% (3) | 28.40% (3) | (4.67)% (3) |
| Ratios/Supplemental Data | | | | | |
| Net assets, end of year (000’s omitted) | $ 25,757 | $ 32,497 | $ 17,063 | $ 17,357 | $ 11,158 |
| Ratios (as a percentage of average daily net assets): | | | | | |
| Expenses | 0.95% (3)(4) | 0.93% | 0.95% (3) | 1.03% (3) | 1.10% (3) |
| Net investment income (loss) | 0.11% | (0.01)% | 0.13% | 0.13% | 0.12% |
| Portfolio Turnover | 40% | 58% | 41% | 39% | 41% |
| (1) | Computed using average shares outstanding. |
| (2) | Returns are historical and are calculated by determining the percentage change in net asset value with all distributions reinvested. |
| (3) | The administrator reimbursed certain operating expenses (equal to 0.05%, 0.13%, 0.02% and 0.02% of average daily net assets for the years ended December 31, 2022, 2020, 2019 and 2018, respectively). Absent this reimbursement, total return would be lower. |
| (4) | Includes a reduction by the investment adviser of a portion of its adviser fee due to the Fund’s investment in the Liquidity Fund (equal to less than 0.005% of average daily net assets for the year ended December 31, 2022). |
15
See Notes to Financial Statements.
Eaton Vance
Special Equities Fund
December 31, 2022
Notes to Financial Statements
1 Significant Accounting Policies
Eaton Vance Special Equities Fund (the Fund) is a diversified series of Eaton Vance Special Investment Trust (the Trust). The Trust is a Massachusetts business trust registered under the Investment Company Act of 1940, as amended (the 1940 Act), as an open-end management investment company. The Fund’s investment objective is to provide growth of capital. The Fund offers three classes of shares. Class A shares are generally sold subject to a sales charge imposed at time of purchase. Class C shares are sold at net asset value and are generally subject to a contingent deferred sales charge (see Note 5). Effective November 5, 2020, Class C shares automatically convert to Class A shares eight years after their purchase as described in the Fund’s prospectus. Class I shares are sold at net asset value and are not subject to a sales charge. Each class represents a pro-rata interest in the Fund, but votes separately on class-specific matters and (as noted below) is subject to different expenses. Realized and unrealized gains and losses and net investment income and losses, other than class-specific expenses, are allocated daily to each class of shares based on the relative net assets of each class to the total net assets of the Fund. Each class of shares differs in its distribution plan and certain other class-specific expenses.
The following is a summary of significant accounting policies of the Fund. The policies are in conformity with accounting principles generally accepted in the United States of America (U.S. GAAP). The Fund is an investment company and follows accounting and reporting guidance in the Financial Accounting Standards Board (FASB) Accounting Standards Codification Topic 946.
A Investment Valuation—The following methodologies are used to determine the market value or fair value of investments.
Equity Securities. Equity securities listed on a U.S. securities exchange generally are valued at the last sale or closing price on the day of valuation or, if no sales took place on such date, at the mean between the closing bid and ask prices on the exchange where such securities are principally traded. Equity securities listed on the NASDAQ National Market System are valued at the NASDAQ official closing price. Unlisted or listed securities for which closing sales prices or closing quotations are not available are valued at the mean between the latest available bid and ask prices.
Other. Investments in management investment companies (including money market funds) that do not trade on an exchange are valued at the net asset value as of the close of each business day.
Fair Valuation. In connection with Rule 2a-5 of the 1940 Act, which became effective September 8, 2022, the Trustees have designated the Fund’s investment adviser as its valuation designee. Investments for which valuations or market quotations are not readily available or are deemed unreliable are valued by the investment adviser, as valuation designee, at fair value using methods that most fairly reflect the security’s “fair value”, which is the amount that the Fund might reasonably expect to receive for the security upon its current sale in the ordinary course. Each such determination is based on a consideration of relevant factors, which are likely to vary from one pricing context to another. These factors may include, but are not limited to, the type of security, the existence of any contractual restrictions on the security’s disposition, the price and extent of public trading in similar securities of the issuer or of comparable companies or entities, quotations or relevant information obtained from broker/dealers or other market participants, information obtained from the issuer, analysts, and/or the appropriate stock exchange (for exchange-traded securities), an analysis of the company’s or entity’s financial statements, and an evaluation of the forces that influence the issuer and the market(s) in which the security is purchased and sold.
B Investment Transactions—Investment transactions for financial statement purposes are accounted for on a trade date basis. Realized gains and losses on investments sold are determined on the basis of identified cost.
C Income—Dividend income is recorded on the ex-dividend date for dividends received in cash and/or securities. However, if the ex-dividend date has passed, certain dividends from foreign securities are recorded as the Fund is informed of the ex-dividend date.
D Federal Taxes—The Fund's policy is to comply with the provisions of the Internal Revenue Code applicable to regulated investment companies and to distribute to shareholders each year substantially all of its net investment income, and all or substantially all of its net realized capital gains. Accordingly, no provision for federal income or excise tax is necessary.
As of December 31, 2022, the Fund had no uncertain tax positions that would require financial statement recognition, de-recognition, or disclosure. The Fund files a U.S. federal income tax return annually after its fiscal year-end, which is subject to examination by the Internal Revenue Service for a period of three years from the date of filing.
E Expenses—The majority of expenses of the Trust are directly identifiable to an individual fund. Expenses which are not readily identifiable to a specific fund are allocated taking into consideration, among other things, the nature and type of expense and the relative size of the funds.
F Use of Estimates—The preparation of the financial statements in conformity with U.S. GAAP requires management to make estimates and assumptions that affect the reported amounts of assets and liabilities at the date of the financial statements and the reported amounts of income and expense during the reporting period. Actual results could differ from those estimates.
G Indemnifications—Under the Trust’s organizational documents, its officers and Trustees may be indemnified against certain liabilities and expenses arising out of the performance of their duties to the Fund. Under Massachusetts law, if certain conditions prevail, shareholders of a Massachusetts business trust (such as the Trust) could be deemed to have personal liability for the obligations of the Trust. However, the Trust’s Declaration of Trust contains an express disclaimer of liability on the part of Fund shareholders and the By-laws provide that the Trust shall assume, upon request by the shareholder, the defense on behalf of any Fund shareholders. Moreover, the By-laws also provide for indemnification out of Fund property of any shareholder held personally
Eaton Vance
Special Equities Fund
December 31, 2022
Notes to Financial Statements — continued
liable solely by reason of being or having been a shareholder for all loss or expense arising from such liability. Additionally, in the normal course of business, the Fund enters into agreements with service providers that may contain indemnification clauses. The Fund’s maximum exposure under these arrangements is unknown as this would involve future claims that may be made against the Fund that have not yet occurred.
2 Distributions to Shareholders and Income Tax Information
It is the present policy of the Fund to make at least one distribution annually (normally in December) of all or substantially all of its net investment income and to distribute annually all or substantially all of its net realized capital gains. Distributions to shareholders are recorded on the ex-dividend date. Distributions are declared separately for each class of shares. Shareholders may reinvest income and capital gain distributions in additional shares of the same class of the Fund at the net asset value as of the ex-dividend date or, at the election of the shareholder, receive distributions in cash. Distributions to shareholders are determined in accordance with income tax regulations, which may differ from U.S. GAAP. As required by U.S. GAAP, only distributions in excess of tax basis earnings and profits are reported in the financial statements as a return of capital. Permanent differences between book and tax accounting relating to distributions are reclassified to paid-in capital. For tax purposes, distributions from short-term capital gains are considered to be from ordinary income.
The tax character of distributions declared for the years ended December 31, 2022 and December 31, 2021 was as follows:
| | Year Ended December 31, |
| | 2022 | 2021 |
| Ordinary income | $ 348,801 | $2,180,525 |
| Long-term capital gains | $2,051,998 | $6,041,043 |
During the year ended December 31, 2022, distributable earnings was increased by $30,146 and paid-in capital was decreased by $30,146 due to differences between book and tax accounting for net operating losses. These reclassifications had no effect on the net assets or net asset value per share of the Fund.
As of December 31, 2022, the components of distributable earnings (accumulated loss) on a tax basis were as follows:
| Post October capital losses | $ (235,109) |
| Net unrealized appreciation | 5,442,382 |
| Distributable earnings | $5,207,273 |
At December 31, 2022, the Fund had a net capital loss of $235,109 attributable to security transactions incurred after October 31, 2022 that it has elected to defer. This net capital loss is treated as arising on the first day of the Fund's taxable year ending December 31, 2023.
The cost and unrealized appreciation (depreciation) of investments of the Fund at December 31, 2022, as determined on a federal income tax basis, were as follows:
| Aggregate cost | $ 46,648,279 |
| Gross unrealized appreciation | $ 8,570,486 |
| Gross unrealized depreciation | (3,128,104) |
| Net unrealized appreciation | $ 5,442,382 |
3 Investment Adviser Fee and Other Transactions with Affiliates
The investment adviser fee is earned by Boston Management and Research (BMR), an indirect, wholly-owned subsidiary of Morgan Stanley, as compensation for investment advisory services rendered to the Fund. The fee is computed at an annual rate of 0.625% of the Fund’s average daily net assets and is payable monthly. For the year ended December 31, 2022, the Fund’s investment adviser fee amounted to $352,597. Eaton Vance Management (EVM), an affiliate of BMR, and an indirect, wholly-owned subsidiary of Morgan Stanley, serves as the administrator of the Fund, but receives no compensation.
Eaton Vance
Special Equities Fund
December 31, 2022
Notes to Financial Statements — continued
Effective April 26, 2022, the Fund may invest in a money market fund, the Institutional Class of the Morgan Stanley Institutional Liquidity Funds - Government Portfolio (the “Liquidity Fund”), an open-end management investment company managed by Morgan Stanley Investment Management Inc., a wholly-owned subsidiary of Morgan Stanley. The investment adviser fee paid by the Fund is reduced by an amount equal to its pro-rata share of the advisory and administration fees paid by the Fund due to its investment in the Liquidity Fund. For the year ended December 31, 2022, the investment adviser fee paid was reduced by $928 relating to the Fund’s investment in the Liquidity Fund. Prior to April 26, 2022, the Fund may have invested its cash in Eaton Vance Cash Reserves Fund, LLC (Cash Reserves Fund), an affiliated investment company managed by EVM. EVM did not receive a fee for advisory services provided to Cash Reserves Fund.
EVM has agreed to reimburse the Fund’s expenses to the extent that total annual operating expenses (relating to ordinary operating expenses only) exceed 1.20%, 1.95% and 0.95% of the Fund’s average daily net assets for Class A, Class C and Class I, respectively. This agreement may be changed or terminated after April 30, 2023. Pursuant to this agreement, EVM was allocated $27,346 of the Fund’s operating expenses for the year ended December 31, 2022.
EVM provides sub-transfer agency and related services to the Fund pursuant to a Sub-Transfer Agency Support Services Agreement. For the year ended December 31, 2022, EVM earned $28,396 from the Fund pursuant to such agreement, which is included in transfer and dividend disbursing agent fees on the Statement of Operations. The Fund was informed that Eaton Vance Distributors, Inc. (EVD), an affiliate of EVM and the Fund’s principal underwriter, received $882 as its portion of the sales charge on sales of Class A shares for the year ended December 31, 2022. EVD also received distribution and service fees from Class A and Class C shares (see Note 4).
Trustees and officers of the Fund who are members of EVM’s or BMR’s organizations receive remuneration for their services to the Fund out of the investment adviser fee. Trustees of the Fund who are not affiliated with the investment adviser may elect to defer receipt of all or a percentage of their annual fees in accordance with the terms of the Trustees Deferred Compensation Plan. For the year ended December 31, 2022, no significant amounts have been deferred. Certain officers and Trustees of the Fund are officers of the above organizations.
4 Distribution Plans
The Fund has in effect a distribution plan for Class A shares (Class A Plan) pursuant to Rule 12b-1 under the 1940 Act. Pursuant to the Class A Plan, the Fund pays EVD a distribution and service fee of 0.25% per annum of its average daily net assets attributable to Class A shares for distribution services and facilities provided to the Fund by EVD, as well as for personal services and/or the maintenance of shareholder accounts. Distribution and service fees paid or accrued to EVD for the year ended December 31, 2022 amounted to $73,381 for Class A shares.
The Fund also has in effect a distribution plan for Class C shares (Class C Plan) pursuant to Rule 12b-1 under the 1940 Act. Pursuant to the Class C Plan, the Fund pays EVD amounts equal to 0.75% per annum of its average daily net assets attributable to Class C shares for providing ongoing distribution services and facilities to the Fund. For the year ended December 31, 2022, the Fund paid or accrued to EVD $2,952 for Class C shares.
Pursuant to the Class C Plan, the Fund also makes payments of service fees to EVD, financial intermediaries and other persons in amounts equal to 0.25% per annum of its average daily net assets attributable to that class. Service fees paid or accrued are for personal services and/or the maintenance of shareholder accounts. They are separate and distinct from the sales commissions and distribution fees payable to EVD. Service fees paid or accrued for the year ended December 31, 2022 amounted to $984 for Class C shares.
Distribution and service fees are subject to the limitations contained in the Financial Industry Regulatory Authority Rule 2341(d).
5 Contingent Deferred Sales Charges
A contingent deferred sales charge (CDSC) of 1% generally is imposed on redemptions of Class C shares made within 12 months of purchase. Class A shares may be subject to a 1% CDSC if redeemed within 12 months (18 months prior to April 29, 2022) of purchase (depending on the circumstances of purchase). Generally, the CDSC is based upon the lower of the net asset value at date of redemption or date of purchase. No charge is levied on shares acquired by reinvestment of dividends or capital gain distributions. For the year ended December 31, 2022, the Fund was informed that EVD received no CDSCs paid by Class A and Class C shareholders.
6 Purchases and Sales of Investments
Purchases and sales of investments, other than short-term obligations, aggregated $22,396,274 and $26,948,577, respectively, for the year ended December 31, 2022.
Eaton Vance
Special Equities Fund
December 31, 2022
Notes to Financial Statements — continued
7 Shares of Beneficial Interest
The Fund’s Declaration of Trust permits the Trustees to issue an unlimited number of full and fractional shares of beneficial interest (without par value). Such shares may be issued in a number of different series (such as the Fund) and classes. Transactions in Fund shares, including direct exchanges pursuant to share class conversions for all periods presented, were as follows:
| | Year Ended
December 31, 2022 | | Year Ended
December 31, 2021 |
| | Shares | Amount | | Shares | Amount |
| Class A | | | | | |
| Sales | 16,616 | $ 393,364 | | 33,364 | $ 952,646 |
| Issued to shareholders electing to receive payments of distributions in Fund shares | 47,151 | 1,067,968 | | 133,492 | 3,625,656 |
| Redemptions | (151,768) | (3,590,216) | | (142,186) | (4,176,755) |
| Net increase (decrease) | (88,001) | $(2,128,884) | | 24,670 | $ 401,547 |
| Class C | | | | | |
| Sales | — | $ — | | 393 | $ 9,563 |
| Issued to shareholders electing to receive payments of distributions in Fund shares | 737 | 13,505 | | 3,712 | 83,119 |
| Redemptions | (15,014) | (287,099) | | (6,610) | (164,971) |
| Net decrease | (14,277) | $ (273,594) | | (2,505) | $ (72,289) |
| Class I | | | | | |
| Sales | 271,453 | $ 6,896,016 | | 597,217 | $ 18,272,454 |
| Issued to shareholders electing to receive payments of distributions in Fund shares | 47,760 | 1,127,127 | | 136,573 | 3,849,997 |
| Redemptions | (321,733) | (8,345,133) | | (231,670) | (6,795,935) |
| Net increase (decrease) | (2,520) | $ (321,990) | | 502,120 | $15,326,516 |
At December 31, 2022, donor advised and pooled income funds (established and maintained by a public charity) managed by EVM owned in the aggregate 41.7% of the value of the outstanding shares of the Fund.
8 Line of Credit
The Fund participates with other portfolios and funds managed by EVM and its affiliates in a $725 million unsecured line of credit agreement with a group of banks, which is in effect through October 24, 2023. In connection with the renewal of the agreement on October 25, 2022, the borrowing limit was decreased from $800 million. Borrowings are made by the Fund solely for temporary purposes related to redemptions and other short-term cash needs. Interest is charged to the Fund based on its borrowings at an amount above either the Secured Overnight Financing Rate (SOFR) or Federal Funds rate. In addition, a fee computed at an annual rate of 0.15% on the daily unused portion of the line of credit is allocated among the participating portfolios and funds at the end of each quarter. Also in connection with the renewal of the agreement, an arrangement fee totaling $150,000 was incurred that was allocated to the participating portfolios and funds. Because the line of credit is not available exclusively to the Fund, it may be unable to borrow some or all of its requested amounts at any particular time. The Fund did not have any significant borrowings or allocated fees during the year ended December 31, 2022.
Eaton Vance
Special Equities Fund
December 31, 2022
Notes to Financial Statements — continued
9 Investments in Affiliated Funds
At December 31, 2022, the value of the Fund's investment in affiliated funds, including funds that may be deemed to be affiliated, was $997,723, which represents 1.9% of the Fund's net assets. Transactions in such investments by the Fund for the year ended December 31, 2022 were as follows:
| Name | Value,
beginning
of period | Purchases | Sales
proceeds | Net
realized
gain (loss) | Change in
unrealized
appreciation
(depreciation) | Value, end
of period | Dividend
income | Units/Shares,
end of period |
| Short-Term Investments |
| Cash Reserves Fund | $1,463,016 | $ 7,535,347 | $ (8,998,429) | $ 66 | $ — | $ — | $ 239 | — |
| Liquidity Fund | — | 11,418,361 | (10,420,638) | — | — | 997,723 | 15,155 | 997,723 |
| Total | | | | $ 66 | $ — | $997,723 | $15,394 | |
10 Fair Value Measurements
Under generally accepted accounting principles for fair value measurements, a three-tier hierarchy to prioritize the assumptions, referred to as inputs, is used in valuation techniques to measure fair value. The three-tier hierarchy of inputs is summarized in the three broad levels listed below.
| • | Level 1 – quoted prices in active markets for identical investments |
| • | Level 2 – other significant observable inputs (including quoted prices for similar investments, interest rates, prepayment speeds, credit risk, etc.) |
| • | Level 3 – significant unobservable inputs (including a fund's own assumptions in determining the fair value of investments) |
In cases where the inputs used to measure fair value fall in different levels of the fair value hierarchy, the level disclosed is determined based on the lowest level input that is significant to the fair value measurement in its entirety. The inputs or methodology used for valuing securities are not necessarily an indication of the risk associated with investing in those securities.
At December 31, 2022, the hierarchy of inputs used in valuing the Fund's investments, which are carried at value, were as follows:
| Asset Description | Level 1 | Level 2 | Level 3 | Total |
| Common Stocks | $ 51,092,938* | $ — | $ — | $ 51,092,938 |
| Short-Term Investments | 997,723 | — | — | 997,723 |
| Total Investments | $52,090,661 | $ — | $ — | $52,090,661 |
| * | The level classification by major category of investments is the same as the category presentation in the Portfolio of Investments. |
11 Risks and Uncertainties
Pandemic Risk
An outbreak of respiratory disease caused by a novel coronavirus was first detected in China in late 2019 and subsequently spread internationally. This coronavirus has resulted in closing borders, enhanced health screenings, changes to healthcare service preparation and delivery, quarantines, cancellations, disruptions to supply chains and customer activity, as well as general concern and uncertainty. Health crises caused by outbreaks of disease, such as the coronavirus outbreak, may exacerbate other pre-existing political, social and economic risks and disrupt normal market conditions and operations. The impact of this outbreak has negatively affected the worldwide economy, as well as the economies of individual countries and industries, and could continue to affect the market in significant and unforeseen ways. Other epidemics and pandemics that may arise in the future may have similar effects. Any such impact could adversely affect the Fund's performance, or the performance of the securities in which the Fund invests.
12 Proposed Plan of Reorganization
In December 2022, the Trustees of the Trust, on behalf of the Fund, approved an Agreement and Plan of Reorganization pursuant to which the Fund is expected to be reorganized with and into a newly formed series of Calvert Management Series. The proposed reorganization is subject to approval by the shareholders of the Fund and the satisfaction of certain other conditions.
Eaton Vance
Special Equities Fund
December 31, 2022
Report of Independent Registered Public Accounting Firm
To the Trustees of Eaton Vance Special Investment Trust and Shareholders of Eaton Vance Special Equities Fund:
Opinion on the Financial Statements and Financial Highlights
We have audited the accompanying statement of assets and liabilities of Eaton Vance Special Equities Fund (the "Fund") (one of the funds constituting Eaton Vance Special Investment Trust), including the portfolio of investments, as of December 31, 2022, the related statement of operations for the year then ended, the statements of changes in net assets for each of the two years in the period then ended, the financial highlights for each of the five years in the period then ended, and the related notes. In our opinion, the financial statements and financial highlights present fairly, in all material respects, the financial position of the Fund as of December 31, 2022, and the results of its operations for the year then ended, the changes in its net assets for each of the two years in the period then ended, and the financial highlights for each of the five years in the period then ended, in conformity with accounting principles generally accepted in the United States of America.
Basis for Opinion
These financial statements and financial highlights are the responsibility of the Fund's management. Our responsibility is to express an opinion on the Fund's financial statements and financial highlights based on our audits. We are a public accounting firm registered with the Public Company Accounting Oversight Board (United States) (PCAOB) and are required to be independent with respect to the Fund in accordance with the U.S. federal securities laws and the applicable rules and regulations of the Securities and Exchange Commission and the PCAOB.
We conducted our audits in accordance with the standards of the PCAOB. Those standards require that we plan and perform the audit to obtain reasonable assurance about whether the financial statements and financial highlights are free of material misstatement, whether due to error or fraud. The Fund is not required to have, nor were we engaged to perform, an audit of its internal control over financial reporting. As part of our audits, we are required to obtain an understanding of internal control over financial reporting but not for the purpose of expressing an opinion on the effectiveness of the Fund’s internal control over financial reporting. Accordingly, we express no such opinion.
Our audits included performing procedures to assess the risks of material misstatement of the financial statements and financial highlights, whether due to error or fraud, and performing procedures that respond to those risks. Such procedures included examining, on a test basis, evidence regarding the amounts and disclosures in the financial statements and financial highlights. Our audits also included evaluating the accounting principles used and significant estimates made by management, as well as evaluating the overall presentation of the financial statements and financial highlights. Our procedures included confirmation of securities owned as of December 31, 2022, by correspondence with the custodian and brokers; when replies were not received from brokers, we performed other auditing procedures. We believe that our audits provide a reasonable basis for our opinion.
/s/ Deloitte & Touche LLP
Boston, Massachusetts
February 24, 2023
We have served as the auditor of one or more Eaton Vance investment companies since 1959.
Eaton Vance
Special Equities Fund
December 31, 2022
Federal Tax Information (Unaudited)
The Form 1099-DIV you received in February 2023 showed the tax status of all distributions paid to your account in calendar year 2022. Shareholders are advised to consult their own tax adviser with respect to the tax consequences of their investment in the Fund. As required by the Internal Revenue Code and/or regulations, shareholders must be notified regarding the status of qualified dividend income for individuals, the dividends received deduction for corporations and capital gains dividends.
Qualified Dividend Income. For the fiscal year ended December 31, 2022, the Fund designates approximately $465,998, or up to the maximum amount of such dividends allowable pursuant to the Internal Revenue Code, as qualified dividend income eligible for the reduced tax rate of 15%.
Dividends Received Deduction. Corporate shareholders are generally entitled to take the dividends received deduction on the portion of the Fund’s dividend distribution that qualifies under tax law. For the Fund’s fiscal 2022 ordinary income dividends, 15.56% qualifies for the corporate dividends received deduction.
Capital Gains Dividends. The Fund hereby designates as a capital gain dividend with respect to the taxable year ended December 31, 2022, $106,831 or, if subsequently determined to be different, the net capital gain of such year.
Eaton Vance
Special Equities Fund
December 31, 2022
Management and Organization
Fund Management. The Trustees of Eaton Vance Special Investment Trust (the Trust) are responsible for the overall management and supervision of the Trust’s affairs. The Board members and officers of the Trust are listed below. Except as indicated, each individual has held the office shown or other offices in the same company for the last five years. Board members hold indefinite terms of office. Each Trustee holds office until his or her successor is elected and qualified, subject to a prior death, resignation, retirement, disqualification or removal. Under the terms of the Fund’s current Trustee retirement policy, an Independent Trustee must retire and resign as a Trustee on the earlier of: (i) the first day of July following his or her 74th birthday; or (ii), with limited exception, December 31st of the 20th year in which he or she has served as a Trustee. However, if such retirement and resignation would cause the Fund to be out of compliance with Section 16 of the 1940 Act or any other regulations or guidance of the SEC, then such retirement and resignation will not become effective until such time as action has been taken for the Fund to be in compliance therewith. The “noninterested Trustees” consist of those Trustees who are not “interested persons” of the Trust, as that term is defined under the 1940 Act. The business address of each Board member and officer is Two International Place, Boston, Massachusetts 02110. As used below, “BMR” refers to Boston Management and Research, “EVC” refers to Eaton Vance Corp., “EV” refers to EV LLC, “EVM” refers to Eaton Vance Management and “EVD” refers to Eaton Vance Distributors, Inc. EV is the trustee of each of EVM and BMR. Effective March 1, 2021, each of EVM, BMR, EVD and EV are indirect, wholly owned subsidiaries of Morgan Stanley. Each officer affiliated with EVM may hold a position with other EVM affiliates that is comparable to his or her position with EVM listed below. Each Trustee oversees 130 funds in the Eaton Vance fund complex (including both funds and portfolios in a hub and spoke structure).
| Name and Year of Birth | Trust
Position(s) | Length of Service | Principal Occupation(s) and Other Directorships
During Past Five Years and Other Relevant Experience |
| Interested Trustee |
Thomas E. Faust Jr.
1958 | Trustee | Since 2007 | Chairman of Morgan Stanley Investment Management, Inc. (MSIM), member of the Board of Managers and President of EV (since 2021), Chief Executive Officer of EVM and BMR. Formerly, Chairman, Chief Executive Officer (2007-2021) and President (2006-2021) of EVC and Director of EVD (2007-2022). Mr. Faust is an interested person because of his positions with MSIM, BMR, EVM and EV, which are affiliates of the Trust.
Other Directorships. Formerly, Director of EVC (2007-2021) and Hexavest Inc. (investment management firm) (2012-2021). |
| Noninterested Trustees |
Alan C. Bowser(1)
1962 | Trustee | Since 2022 | Formerly, Chief Diversity Officer, Partner and a member of the Operating Committee, and formerly served as Senior Advisor on Diversity and Inclusion for the firm’s chief executive officer, Co-Head of the Americas Region, and Senior Client Advisor of Bridgewater Associates, an asset management firm (2011- 2023).
Other Directorships. None. |
Mark R. Fetting
1954 | Trustee | Since 2016 | Private investor. Formerly held various positions at Legg Mason, Inc. (investment management firm) (2000-2012), including President, Chief Executive Officer, Director and Chairman (2008-2012), Senior Executive Vice President (2004-2008) and Executive Vice President (2001-2004). Formerly, President of Legg Mason family of funds (2001-2008). Formerly, Division President and Senior Officer of Prudential Financial Group, Inc. and related companies (investment management firm) (1991-2000).
Other Directorships. None. |
Cynthia E. Frost
1961 | Trustee | Since 2014 | Private investor. Formerly, Chief Investment Officer of Brown University (university endowment) (2000-2012). Formerly, Portfolio Strategist for Duke Management Company (university endowment manager) (1995-2000). Formerly, Managing Director, Cambridge Associates (investment consulting company) (1989-1995). Formerly, Consultant, Bain and Company (management consulting firm) (1987-1989). Formerly, Senior Equity Analyst, BA Investment Management Company (1983-1985).
Other Directorships. None. |
George J. Gorman
1952 | Chairperson
of the Board
and Trustee | Since 2021
(Chairperson) and
2014 (Trustee) | Principal at George J. Gorman LLC (consulting firm). Formerly, Senior Partner at Ernst & Young LLP (a registered public accounting firm) (1974-2009).
Other Directorships. None. |
Eaton Vance
Special Equities Fund
December 31, 2022
Management and Organization — continued
| Name and Year of Birth | Trust
Position(s) | Length of Service | Principal Occupation(s) and Other Directorships
During Past Five Years and Other Relevant Experience |
| Noninterested Trustees (continued) |
Valerie A. Mosley
1960 | Trustee | Since 2014 | Chairwoman and Chief Executive Officer of Valmo Ventures (a consulting and investment firm). Founder of Upward Wealth, Inc., dba BrightUp, a fintech platform. Formerly, Partner and Senior Vice President, Portfolio Manager and Investment Strategist at Wellington Management Company, LLP (investment management firm) (1992-2012). Formerly, Chief Investment Officer, PG Corbin Asset Management (1990-1992). Formerly worked in institutional corporate bond sales at Kidder Peabody (1986-1990).
Other Directorships. Director of DraftKings, Inc. (digital sports entertainment and gaming company) (since September 2020). Director of Envestnet, Inc. (provider of intelligent systems for wealth management and financial wellness) (since 2018). Formerly, Director of Dynex Capital, Inc. (mortgage REIT) (2013-2020) and Director of Groupon, Inc. (e-commerce provider) (2020-2022). |
Keith Quinton
1958 | Trustee | Since 2018 | Private investor, researcher and lecturer. Formerly, Independent Investment Committee Member at New Hampshire Retirement System (2017-2021). Formerly, Portfolio Manager and Senior Quantitative Analyst at Fidelity Investments (investment management firm) (2001-2014).
Other Directorships. Formerly, Director (2016-2021) and Chairman (2019-2021) of New Hampshire Municipal Bond Bank. |
Marcus L. Smith
1966 | Trustee | Since 2018 | Private investor and independent corporate director. Formerly, Chief Investment Officer, Canada (2012-2017), Chief Investment Officer, Asia (2010-2012), Director of Asian Research (2004-2010) and portfolio manager (2001-2017) at MFS Investment Management (investment management firm).
Other Directorships. Director of First Industrial Realty Trust, Inc. (an industrial REIT) (since 2021). Director of MSCI Inc. (global provider of investment decision support tools) (since 2017). Formerly, Director of DCT Industrial Trust Inc. (logistics real estate company) (2017-2018). |
Susan J. Sutherland
1957 | Trustee | Since 2015 | Private investor. Director of Ascot Group Limited and certain of its subsidiaries (insurance and reinsurance) (since 2017). Formerly, Director of Hagerty Holding Corp. (insurance) (2015-2018) and Montpelier Re Holdings Ltd. (insurance and reinsurance) (2013-2015). Formerly, Associate, Counsel and Partner at Skadden, Arps, Slate, Meagher & Flom LLP (law firm) (1982-2013).
Other Directorships. Formerly, Director of Kairos Acquisition Corp. (insurance/InsurTech acquisition company) (2021-2023). |
Scott E. Wennerholm
1959 | Trustee | Since 2016 | Private investor. Formerly, Trustee at Wheelock College (postsecondary institution) (2012-2018). Formerly, Consultant at GF Parish Group (executive recruiting firm) (2016-2017). Formerly, Chief Operating Officer and Executive Vice President at BNY Mellon Asset Management (investment management firm) (2005-2011). Formerly, Chief Operating Officer and Chief Financial Officer at Natixis Global Asset Management (investment management firm) (1997-2004). Formerly, Vice President at Fidelity Investments Institutional Services (investment management firm) (1994-1997).
Other Directorships. None. |
Nancy A. Wiser(1)
1967 | Trustee | Since 2022 | Formerly, Executive Vice President and the Global Head of Operations at Wells Fargo Asset Management (2011-2021).
Other Directorships. None. |
| Name and Year of Birth | Trust
Position(s) | Length of Service | Principal Occupation(s)
During Past Five Years |
| Principal Officers who are not Trustees |
Eric A. Stein
1980 | President | Since 2020 | Vice President and Chief Investment Officer, Fixed Income of EVM and BMR. Prior to November 1, 2020, Mr. Stein was a co-Director of Eaton Vance’s Global Income Investments. Also Vice President of Calvert Research and Management (“CRM”). |
Deidre E. Walsh
1971 | Vice President and
Chief Legal Officer | Since 2009 | Vice President of EVM and BMR. Also Vice President of CRM. |
James F. Kirchner
1967 | Treasurer | Since 2007 | Vice President of EVM and BMR. Also Vice President of CRM. |
Eaton Vance
Special Equities Fund
December 31, 2022
Management and Organization — continued
| Name and Year of Birth | Trust
Position(s) | Length of Service | Principal Occupation(s)
During Past Five Years |
| Principal Officers who are not Trustees (continued) |
Nicholas Di Lorenzo
1987 | Secretary | Since 2022 | Formerly, associate (2012-2021) and counsel (2022) at Dechert LLP. |
Richard F. Froio
1968 | Chief Compliance
Officer | Since 2017 | Vice President of EVM and BMR since 2017. Formerly, Deputy Chief Compliance Officer (Adviser/Funds) and Chief Compliance Officer (Distribution) at PIMCO (2012-2017) and Managing Director at BlackRock/Barclays Global Investors (2009-2012). |
(1) Mr. Bowser and Ms. Wiser began serving as Trustees effective April 4, 2022.
The SAI for the Fund includes additional information about the Trustees and officers of the Fund and can be obtained without charge on Eaton Vance’s website at www.eatonvance.com or by calling 1-800-262-1122.
| FACTS | WHAT DOES EATON VANCE DO WITH YOUR
PERSONAL INFORMATION? |
| Why? | Financial companies choose how they share your personal information. Federal law gives consumers the right to limit some but not all sharing. Federal law also requires us to tell you how we collect, share, and protect your personal information. Please read this notice carefully to understand what we do. |
| |
| What? | The types of personal information we collect and share depend on the product or service you have with us. This information can include:■ Social Security number and income
■ investment experience and risk tolerance
■ checking account number and wire transfer instructions |
| |
| How? | All financial companies need to share customers’ personal information to run their everyday business. In the section below, we list the reasons financial companies can share their customers’ personal information; the reasons Eaton Vance chooses to share; and whether you can limit this sharing. |
Reasons we can share your
personal information | Does Eaton Vance
share? | Can you limit
this sharing? |
| For our everyday business purposes — such as to process your transactions, maintain your account(s), respond to court orders and legal investigations, or report to credit bureaus | Yes | No |
| For our marketing purposes — to offer our products and services to you | Yes | No |
| For joint marketing with other financial companies | No | We don’t share |
| For our investment management affiliates’ everyday business purposes — information about your transactions, experiences, and creditworthiness | Yes | Yes |
| For our affiliates’ everyday business purposes — information about your transactions and experiences | Yes | No |
| For our affiliates’ everyday business purposes — information about your creditworthiness | No | We don’t share |
| For our investment management affiliates to market to you | Yes | Yes |
| For our affiliates to market to you | No | We don’t share |
| For nonaffiliates to market to you | No | We don’t share |
To limit our
sharing | Call toll-free 1-800-262-1122 or email: EVPrivacy@eatonvance.comPlease note:If you are a new customer, we can begin sharing your information 30 days from the date we sent this notice. When you are no longer our customer, we continue to share your information as described in this notice. However, you can contact us at any time to limit our sharing. |
| Questions? | Call toll-free 1-800-262-1122 or email: EVPrivacy@eatonvance.com |
| Privacy Notice — continued | April 2021 |
| Who we are |
| Who is providing this notice? | Eaton Vance Management, Eaton Vance Distributors, Inc., Eaton Vance Trust Company, Eaton Vance Management (International) Limited, Eaton Vance Advisers International Ltd., Eaton Vance Global Advisors Limited, Eaton Vance Management’s Real Estate Investment Group, Boston Management and Research, Calvert Research and Management, Eaton Vance and Calvert Fund Families and our investment advisory affiliates (“Eaton Vance”) (see Investment Management Affiliates definition below) |
| What we do |
How does Eaton Vance
protect my personal
information? | To protect your personal information from unauthorized access and use, we use security measures that comply with federal law. These measures include computer safeguards and secured files and buildings. We have policies governing the proper handling of customer information by personnel and requiring third parties that provide support to adhere to appropriate security standards with respect to such information. |
How does Eaton Vance
collect my personal
information? | We collect your personal information, for example, when you■ open an account or make deposits or withdrawals from your account
■ buy securities from us or make a wire transfer
■ give us your contact informationWe also collect your personal information from others, such as credit bureaus, affiliates, or other companies. |
| Why can’t I limit all sharing? | Federal law gives you the right to limit only■ sharing for affiliates’ everyday business purposes — information about your creditworthiness
■ affiliates from using your information to market to you
■ sharing for nonaffiliates to market to youState laws and individual companies may give you additional rights to limit sharing. See below for more on your rights under state law. |
| Definitions |
Investment Management
Affiliates | Eaton Vance Investment Management Affiliates include registered investment advisers, registered broker- dealers, and registered and unregistered funds. Investment Management Affiliates does not include entities associated with Morgan Stanley Wealth Management, such as Morgan Stanley Smith Barney LLC and Morgan Stanley & Co. |
| Affiliates | Companies related by common ownership or control. They can be financial and nonfinancial companies.■ Our affiliates include companies with a Morgan Stanley name and financial companies such as Morgan Stanley Smith Barney LLC and Morgan Stanley & Co. |
| Nonaffiliates | Companies not related by common ownership or control. They can be financial and nonfinancial companies.■ Eaton Vance does not share with nonaffiliates so they can market to you. |
| Joint marketing | A formal agreement between nonaffiliated financial companies that together market financial products or services to you.■ Eaton Vance doesn’t jointly market. |
| Other important information |
| Vermont: Except as permitted by law, we will not share personal information we collect about Vermont residents with Nonaffiliates unless you provide us with your written consent to share such information.California: Except as permitted by law, we will not share personal information we collect about California residents with Nonaffiliates and we will limit sharing such personal information with our Affiliates to comply with California privacy laws that apply to us. |
Delivery of Shareholder Documents. The Securities and Exchange Commission (SEC) permits funds to deliver only one copy of shareholder documents, including prospectuses, proxy statements and shareholder reports, to fund investors with multiple accounts at the same residential or post office box address. This practice is often called “householding” and it helps eliminate duplicate mailings to shareholders. Eaton Vance, or your financial intermediary, may household the mailing of your documents indefinitely unless you instruct Eaton Vance, or your financial intermediary, otherwise. If you would prefer that your Eaton Vance documents not be householded, please contact Eaton Vance at 1-800-262-1122, or contact your financial intermediary. Your instructions that householding not apply to delivery of your Eaton Vance documents will typically be effective within 30 days of receipt by Eaton Vance or your financial intermediary.
Portfolio Holdings. Each Eaton Vance Fund and its underlying Portfolio(s) (if applicable) files a schedule of portfolio holdings on Part F to Form N-PORT with the SEC. Certain information filed on Form N-PORT may be viewed on the Eaton Vance website at www.eatonvance.com, by calling Eaton Vance at 1-800-262-1122 or in the EDGAR database on the SEC’s website at www.sec.gov.
Proxy Voting. From time to time, funds are required to vote proxies related to the securities held by the funds. The Eaton Vance Funds or their underlying Portfolios (if applicable) vote proxies according to a set of policies and procedures approved by the Funds’ and Portfolios’ Boards. You may obtain a description of these policies and procedures and information on how the Funds or Portfolios voted proxies relating to portfolio securities during the most recent 12-month period ended June 30, without charge, upon request, by calling 1-800-262-1122 and by accessing the SEC’s website at www.sec.gov.
Investment Adviser
Boston Management and Research
Two International Place
Boston, MA 02110
Administrator
Eaton Vance Management
Two International Place
Boston, MA 02110
Principal Underwriter*
Eaton Vance Distributors, Inc.
Two International Place
Boston, MA 02110
(617) 482-8260
Custodian
State Street Bank and Trust Company
State Street Financial Center, One Lincoln Street
Boston, MA 02111
Transfer Agent
BNY Mellon Investment Servicing (US) Inc.
Attn: Eaton Vance Funds
P.O. Box 534439
Pittsburgh, PA 15253-4439
(800) 262-1122
Independent Registered Public Accounting Firm
Deloitte & Touche LLP
200 Berkeley Street
Boston, MA 02116-5022
Fund Offices
Two International Place
Boston, MA 02110
* FINRA BrokerCheck. Investors may check the background of their Investment Professional by contacting the Financial Industry Regulatory Authority (FINRA). FINRA BrokerCheck is a free tool to help investors check the professional background of current and former FINRA-registered securities firms and brokers. FINRA BrokerCheck is available by calling 1-800-289-9999 and at www.FINRA.org. The FINRA BrokerCheck brochure describing this program is available to investors at www.FINRA.org.
Eaton Vance
Dividend Builder Fund
Annual Report
December 31, 2022
Commodity Futures Trading Commission Registration. The Commodity Futures Trading Commission (“CFTC”) has adopted regulations that subject registered investment companies and advisers to regulation by the CFTC if a fund invests more than a prescribed level of its assets in certain CFTC-regulated instruments (including futures, certain options and swap agreements) or markets itself as providing investment exposure to such instruments. The investment adviser has claimed an exclusion from the definition of “commodity pool operator” under the Commodity Exchange Act with respect to its management of the Fund. Accordingly, neither the Fund nor the adviser with respect to the operation of the Fund is subject to CFTC regulation. Because of its management of other strategies, the Fund's adviser is registered with the CFTC as a commodity pool operator. The adviser is also registered as a commodity trading advisor.
Fund shares are not insured by the FDIC and are not deposits or other obligations of, or guaranteed by, any depository institution. Shares are subject to investment risks, including possible loss of principal invested.
This report must be preceded or accompanied by a current summary prospectus or prospectus. Before investing, investors should consider carefully the investment objective, risks, and charges and expenses of a mutual fund. This and other important information is contained in the summary prospectus and prospectus, which can be obtained from a financial intermediary. Prospective investors should read the prospectus carefully before investing. For further information, please call 1-800-262-1122.
Annual Report December 31, 2022
Eaton Vance
Dividend Builder Fund
Eaton Vance
Dividend Builder Fund
December 31, 2022
Management’s Discussion of Fund Performance†
Economic and Market Conditions
During the 12-month period starting January 1, 2022, the U.S. equity market was dominated by the ongoing effects of one black swan event -- the COVID-19 pandemic -- and fallout from another -- Russia’s invasion of Ukraine.
As the new year began, investors became increasingly concerned about the twin threats of inflation and interest rate hikes. As a result, stock performance turned negative -- a sharp about-face from the all-time highs many U.S. equity indexes had posted in late 2021.
In February, Russia’s invasion of Ukraine sent shock waves through U.S. and global markets, exacerbating inflationary pressures on energy and food costs. The U.S. Federal Reserve (the Fed) -- along with other central banks around the world -- initiated its first interest rate hikes in years.
Investors began to expect the Fed would raise interest rates at every policy meeting in 2022 and, in turn, worried that aggressive rate hikes could tip the economy into recession. At its June, July, September, and November 2022 policy meetings, the Fed hiked the federal funds rate 0.75% each time -- its first moves of that magnitude since 1994. Higher interest rates, inflation, and recessionary worries drove stock prices down, with rate-sensitive technology stocks -- star performers earlier in the pandemic -- suffering some of the worst declines.
In October and November 2022, however, U.S. stocks delivered positive performance for the first time in months. The rally was driven by a combination of better-than-expected company earnings, declining inflation, and hope that the Fed would temper the size of future rate hikes.
But while the Fed indeed delivered a smaller 0.50% rate hike in December, it raised its expectation of how high rates might go in 2023. As investors digested the news that rates could stay higher for longer than previously expected, equity prices declined in the final month of 2022.
For the period as a whole, the blue-chip Dow Jones Industrial Average® returned -6.86%; the S&P 500® Index, a broad measure of U.S. stocks, returned -18.11%; and the technology-laden Nasdaq Composite Index returned -32.54%.
Fund Performance
For the 12-month period ended December 31, 2022, Eaton Vance Dividend Builder Fund (the Fund) returned -9.75% for Class A shares at net asset value (NAV), outperforming its benchmark, the S&P 500® Index (the Index), which returned -18.11%.
On a sector basis, stock selections and underweight positions in the information technology, consumer discretionary, and communication services sectors -- the worst-performing sectors within the Index during the period -- contributed to Fund performance versus the Index. Stock selections and overweight positions in the health care, utilities, industrials, and consumer staples sectors -- each of which outperformed the Index during the period -- contributed to Fund performance relative to the Index as well.
On an individual stock basis, the largest contributors to Fund performance versus the Index during the period were an underweight position in Amazon.com, Inc. (Amazon), not owning Index components Tesla, Inc. (Tesla) and Meta Platforms, Inc. (Meta), and overweight positions in AbbVie, Inc. (AbbVie) and Allstate Corp. (Allstate).
Internet retailer and cloud-computing provider Amazon suffered a significant stock price decline as profit margins in its e-commerce business remained below prepandemic levels. By period-end, Amazon was sold from the Fund.
Not owning Tesla helped relative returns as the electric car maker’s stock price sank during the period, weighed down by lower consumer demand for automobiles, price cuts in response to increased competition, and the exceedingly high valuation the stock had reached previously. Not owning Facebook parent company Meta contributed to relative performance as Meta’s stock price also fell during the period, hurt by softening user engagement with Facebook and the 2021 announcement of a shift in Meta’s direction toward a virtual reality “metaverse,” which will require significant capital investment.
AbbVie’s share price increased as investors looked favorably upon the biopharmaceutical firm’s acquisition of Allergan in 2020, and an increase in AbbVie’s stock dividend during the period. Property and casualty insurer Allstate’s stock delivered strong performance during the second half of the period as investors rewarded the company for its data and analytics capabilities, its history of innovation, and ability to increase prices.
In contrast, stock selections and an underweight position in the energy sector detracted from Fund performance versus the Index during the period.
On an individual stock basis, the largest detractors from Fund performance relative to the Index were not owning Index component Exxon Mobil Corp. (Exxon Mobil) and an overweight position in Lam Research Corp. (Lam Research).
Major oil and gas producer Exxon Mobil’s stock price rose sharply as energy prices increased during the period. Lam Research is a semiconductor fabrication equipment manufacturer. Its stock price declined as investor expectations for sales growth waned in the face of concerns about a global recession and U.S. restrictions on the sales of semiconductor manufacturing equipment to China, one of the firm’s largest markets. By period-end, Lam Research was sold from the Fund.
See Endnotes and Additional Disclosures in this report.
Past performance is no guarantee of future results. Returns are historical and are calculated by determining the percentage change in net asset value (NAV) or offering price (as applicable) with all distributions reinvested. Furthermore, returns do not reflect the deduction of taxes that shareholders may have to pay on Fund distributions or upon the redemption of Fund shares. Investment return and principal value will fluctuate so that shares, when redeemed, may be worth more or less than their original cost. Performance for periods less than or equal to one year is cumulative. Performance is for the stated time period only; due to market volatility, current Fund performance may be lower or higher than the quoted return. For performance as of the most recent month-end, please refer to eatonvance.com.
Eaton Vance
Dividend Builder Fund
December 31, 2022
Performance
Portfolio Manager(s) Charles B. Gaffney
| % Average Annual Total Returns1,2 | Class
Inception Date | Performance
Inception Date | One Year | Five Years | Ten Years |
| Class A at NAV | 12/18/1981 | 12/18/1981 | (9.75)% | 9.35% | 11.33% |
| Class A with 5.25% Maximum Sales Charge | — | — | (14.49) | 8.17 | 10.74 |
| Class C at NAV | 11/01/1993 | 12/18/1981 | (10.37) | 8.55 | 10.67 |
| Class C with 1% Maximum Deferred Sales Charge | — | — | (11.06) | 8.55 | 10.67 |
| Class I at NAV | 06/20/2005 | 12/18/1981 | (9.54) | 9.63 | 11.61 |
|
| S&P 500® Index | — | — | (18.11)% | 9.42% | 12.56% |
| NASDAQ US Broad Dividend Achievers™ Index | — | — | (5.78) | 9.46 | 11.38 |
| % Total Annual Operating Expense Ratios3 | Class A | Class C | Class I |
| | 0.99% | 1.74% | 0.74% |
Growth of $10,000
This graph shows the change in value of a hypothetical investment of $10,000 in Class A of the Fund for the period indicated. For comparison, the same investment is shown in the indicated index.
| Growth of Investment | Amount Invested | Period Beginning | At NAV | With Maximum Sales Charge |
| Class C | $10,000 | 12/31/2012 | $27,573 | N.A. |
| Class I, at minimum investment | $1,000,000 | 12/31/2012 | $2,999,932 | N.A. |
See Endnotes and Additional Disclosures in this report.
Past performance is no guarantee of future results. Returns are historical and are calculated by determining the percentage change in net asset value (NAV) or offering price (as applicable) with all distributions reinvested. Furthermore, returns do not reflect the deduction of taxes that shareholders may have to pay on Fund distributions or upon the redemption of Fund shares. Investment return and principal value will fluctuate so that shares, when redeemed, may be worth more or less than their original cost. Performance for periods less than or equal to one year is cumulative. Performance is for the stated time period only; due to market volatility, current Fund performance may be lower or higher than the quoted return. For performance as of the most recent month-end, please refer to eatonvance.com.
Eaton Vance
Dividend Builder Fund
December 31, 2022
| Sector Allocation (% of net assets)1 |
| Top 10 Holdings (% of net assets)1 |
| AbbVie, Inc. | 3.4% |
| PepsiCo, Inc. | 3.4 |
| Allstate Corp. (The) | 2.9 |
| Broadcom, Inc. | 2.9 |
| JPMorgan Chase & Co. | 2.9 |
| Bristol-Myers Squibb Co. | 2.9 |
| Merck & Co., Inc. | 2.8 |
| Comcast Corp., Class A | 2.8 |
| Procter & Gamble Co. (The) | 2.7 |
| American Financial Group, Inc. | 2.7 |
| Total | 29.4% |
Footnotes:
| 1 | Excludes cash and cash equivalents. |
Eaton Vance
Dividend Builder Fund
December 31, 2022
Endnotes and Additional Disclosures
| † | The views expressed in this report are those of the portfolio manager(s) and are current only through the date stated at the top of this page. These views are subject to change at any time based upon market or other conditions, and Eaton Vance and the Fund(s) disclaim any responsibility to update such views. These views may not be relied upon as investment advice and, because investment decisions are based on many factors, may not be relied upon as an indication of trading intent on behalf of any Eaton Vance fund. This commentary may contain statements that are not historical facts, referred to as “forward-looking statements.” The Fund’s actual future results may differ significantly from those stated in any forward-looking statement, depending on factors such as changes in securities or financial markets or general economic conditions, the volume of sales and purchases of Fund shares, the continuation of investment advisory, administrative and service contracts, and other risks discussed from time to time in the Fund’s filings with the Securities and Exchange Commission. |
| | |
| 1 | S&P 500® Index is an unmanaged index of large-cap stocks commonly used as a measure of U.S. stock market performance. S&P Dow Jones Indices are a product of S&P Dow Jones Indices LLC (“S&P DJI”) and have been licensed for use. S&P® and S&P 500® are registered trademarks of S&P DJI; Dow Jones® is a registered trademark of Dow Jones Trademark Holdings LLC (“Dow Jones”); S&P DJI, Dow Jones and their respective affiliates do not sponsor, endorse, sell or promote the Fund, will not have any liability with respect thereto and do not have any liability for any errors, omissions, or interruptions of the S&P Dow Jones Indices. NASDAQ US Broad Dividend Achievers™ Index is an unmanaged index of US stocks with at least ten consecutive years of increasing annual regular dividends. Source: Nasdaq, Inc. The information is provided by Nasdaq (with its affiliates, are referred to as the “Corporations”) and Nasdaq’s third party licensors on an “as is” basis and the Corporations make no guarantees and bear no liability of any kind with respect to the information or the Fund. Unless otherwise stated, index returns do not reflect the effect of any applicable sales charges, commissions, expenses, taxes or leverage, as applicable. It is not possible to invest directly in an index. |
| 2 | Total Returns at NAV do not include applicable sales charges. If sales charges were deducted, the returns would be lower. Total Returns shown with maximum sales charge reflect the stated maximum sales charge. Unless otherwise stated, performance does not reflect the deduction of taxes on Fund distributions or redemptions of Fund shares.Effective November 5, 2020, Class C shares automatically convert to Class A shares eight years after purchase. The average annual total returns listed for Class C reflect conversion to Class A shares after eight years. Prior to November 5, 2020, Class C shares automatically converted to Class A shares ten years after purchase. |
| 3 | Source: Fund prospectus. The expense ratios for the current reporting period can be found in the Financial Highlights section of this report. Performance reflects expenses waived and/or reimbursed, if applicable. Without such waivers and/or reimbursements, performance would have been lower. |
| | Fund profile subject to change due to active management. |
| | Additional Information |
| | Dow Jones Industrial Average® is a price-weighted average of 30 blue-chip stocks that are generally the leaders in their industry. Nasdaq Composite Index is a market capitalization-weighted index of all domestic and international securities listed on Nasdaq. |
Eaton Vance
Dividend Builder Fund
December 31, 2022
Example
As a Fund shareholder, you incur two types of costs: (1) transaction costs, including sales charges (loads) on purchases; and (2) ongoing costs, including management fees; distribution and/or service fees; and other Fund expenses. This Example is intended to help you understand your ongoing costs (in dollars) of Fund investing and to compare these costs with the ongoing costs of investing in other mutual funds. The Example is based on an investment of $1,000 invested at the beginning of the period and held for the entire period (July 1, 2022 to December 31, 2022).
Actual Expenses
The first section of the table below provides information about actual account values and actual expenses. You may use the information in this section, together with the amount you invested, to estimate the expenses that you paid over the period. Simply divide your account value by $1,000 (for example, an $8,600 account value divided by $1,000 = 8.6), then multiply the result by the number in the first section under the heading entitled “Expenses Paid During Period” to estimate the expenses you paid on your account during this period.
Hypothetical Example for Comparison Purposes
The second section of the table below provides information about hypothetical account values and hypothetical expenses based on the actual Fund expense ratio and an assumed rate of return of 5% per year (before expenses), which is not the actual Fund return. The hypothetical account values and expenses may not be used to estimate the actual ending account balance or expenses you paid for the period. You may use this information to compare the ongoing costs of investing in your Fund and other funds. To do so, compare this 5% hypothetical example with the 5% hypothetical examples that appear in the shareholder reports of the other funds.
Please note that the expenses shown in the table are meant to highlight your ongoing costs only and do not reflect any transactional costs, such as sales charges (loads). Therefore, the second section of the table is useful in comparing ongoing costs only, and will not help you determine the relative total costs of owning different funds. In addition, if these transactional costs were included, your costs would be higher.
| | Beginning
Account Value
(7/1/22) | Ending
Account Value
(12/31/22) | Expenses Paid
During Period*
(7/1/22 – 12/31/22) | Annualized
Expense
Ratio |
| Actual | | | | |
| Class A | $1,000.00 | $1,045.70 | $5.21 | 1.01% |
| Class C | $1,000.00 | $1,042.00 | $9.06 | 1.76% |
| Class I | $1,000.00 | $1,047.10 | $3.92 | 0.76% |
| |
| Hypothetical | | | | |
| (5% return per year before expenses) | | | | |
| Class A | $1,000.00 | $1,020.11 | $5.14 | 1.01% |
| Class C | $1,000.00 | $1,016.33 | $8.94 | 1.76% |
| Class I | $1,000.00 | $1,021.37 | $3.87 | 0.76% |
| * | Expenses are equal to the Fund's annualized expense ratio for the indicated Class, multiplied by the average account value over the period, multiplied by 184/365 (to reflect the one-half year period). The Example assumes that the $1,000 was invested at the net asset value per share determined at the close of business on June 30, 2022. |
Eaton Vance
Dividend Builder Fund
December 31, 2022
| Security | Shares | Value |
| Banks — 7.2% |
| JPMorgan Chase & Co. | | 191,300 | $ 25,653,330 |
| PNC Financial Services Group, Inc. (The) | | 123,700 | 19,537,178 |
| Truist Financial Corp. | | 433,800 | 18,666,414 |
| | | | $ 63,856,922 |
| Beverages — 5.2% |
| Coca-Cola Co. (The) | | 248,400 | $ 15,800,724 |
| PepsiCo, Inc. | | 165,900 | 29,971,494 |
| | | | $ 45,772,218 |
| Biotechnology — 7.5% |
| AbbVie, Inc. | | 187,800 | $ 30,350,358 |
| Amgen, Inc. | | 72,300 | 18,988,872 |
| Gilead Sciences, Inc. | | 200,300 | 17,195,755 |
| | | | $ 66,534,985 |
| Capital Markets — 5.5% |
| BlackRock, Inc. | | 23,400 | $ 16,581,942 |
| CME Group, Inc. | | 70,900 | 11,922,544 |
| Intercontinental Exchange, Inc. | | 88,900 | 9,120,251 |
| S&P Global, Inc. | | 34,000 | 11,387,960 |
| | | | $ 49,012,697 |
| Chemicals — 2.0% |
| FMC Corp. | | 145,400 | $ 18,145,920 |
| | | | $ 18,145,920 |
| Commercial Services & Supplies — 2.0% |
| Waste Management, Inc. | | 114,300 | $ 17,931,384 |
| | | | $ 17,931,384 |
| Communications Equipment — 1.8% |
| Cisco Systems, Inc. | | 339,500 | $ 16,173,780 |
| | | | $ 16,173,780 |
| Containers & Packaging — 1.7% |
| Packaging Corp. of America | | 114,400 | $ 14,632,904 |
| | | | $ 14,632,904 |
| Electric Utilities — 3.5% |
| Constellation Energy Corp. | | 153,100 | $ 13,198,751 |
| Security | Shares | Value |
| Electric Utilities (continued) |
| Xcel Energy, Inc. | | 252,800 | $ 17,723,808 |
| | | | $ 30,922,559 |
| Electrical Equipment — 2.0% |
| Emerson Electric Co. | | 183,400 | $ 17,617,404 |
| | | | $ 17,617,404 |
| Energy Equipment & Services — 2.2% |
| Baker Hughes Co. | | 648,100 | $ 19,138,393 |
| | | | $ 19,138,393 |
| Equity Real Estate Investment Trusts (REITs) — 2.0% |
| Lamar Advertising Co., Class A | | 183,000 | $ 17,275,200 |
| | | | $ 17,275,200 |
| Health Care Equipment & Supplies — 3.5% |
| Abbott Laboratories | | 177,400 | $ 19,476,746 |
| Medtronic PLC | | 148,300 | 11,525,876 |
| | | | $ 31,002,622 |
| Health Care Providers & Services — 2.6% |
| Elevance Health, Inc. | | 44,000 | $ 22,570,680 |
| | | | $ 22,570,680 |
| Hotels, Restaurants & Leisure — 2.1% |
| Domino's Pizza, Inc. | | 25,600 | $ 8,867,840 |
| Starbucks Corp. | | ���95,800 | 9,503,360 |
| | | | $ 18,371,200 |
| Household Products — 2.7% |
| Procter & Gamble Co. (The) | | 158,900 | $ 24,082,884 |
| | | | $ 24,082,884 |
| Independent Power and Renewable Electricity Producers — 2.0% |
| NextEra Energy Partners, L.P.(1) | | 252,800 | $ 17,718,752 |
| | | | $ 17,718,752 |
| Insurance — 5.6% |
| Allstate Corp. (The) | | 191,400 | $ 25,953,840 |
| American Financial Group, Inc. | | 175,100 | 24,037,728 |
| | | | $ 49,991,568 |
| IT Services — 4.2% |
| Automatic Data Processing, Inc. | | 81,800 | $ 19,538,748 |
Eaton Vance
Dividend Builder Fund
December 31, 2022
Portfolio of Investments — continued
| Security | Shares | Value |
| IT Services (continued) |
| Broadridge Financial Solutions, Inc. | | 133,600 | $ 17,919,768 |
| | | | $ 37,458,516 |
| Life Sciences Tools & Services — 2.6% |
| Danaher Corp. | | 86,900 | $ 23,064,998 |
| | | | $ 23,064,998 |
| Machinery — 2.7% |
| Illinois Tool Works, Inc. | | 65,000 | $ 14,319,500 |
| Westinghouse Air Brake Technologies Corp. | | 94,300 | 9,412,083 |
| | | | $ 23,731,583 |
| Media — 3.9% |
| Comcast Corp., Class A | | 697,999 | $ 24,409,060 |
| Interpublic Group of Cos., Inc. (The) | | 294,400 | 9,806,464 |
| | | | $ 34,215,524 |
| Multi-Utilities — 2.0% |
| Sempra Energy | | 113,500 | $ 17,540,290 |
| | | | $ 17,540,290 |
| Pharmaceuticals — 5.7% |
| Bristol-Myers Squibb Co. | | 354,700 | $ 25,520,665 |
| Merck & Co., Inc. | | 228,400 | 25,340,980 |
| | | | $ 50,861,645 |
| Professional Services — 1.7% |
| Booz Allen Hamilton Holding Corp. | | 146,000 | $ 15,259,920 |
| | | | $ 15,259,920 |
| Road & Rail — 2.0% |
| Union Pacific Corp. | | 83,500 | $ 17,290,345 |
| | | | $ 17,290,345 |
| Semiconductors & Semiconductor Equipment — 6.5% |
| Broadcom, Inc. | | 46,200 | $ 25,831,806 |
| KLA Corp. | | 36,600 | 13,799,298 |
| Texas Instruments, Inc. | | 106,700 | 17,628,974 |
| | | | $ 57,260,078 |
| Software — 2.4% |
| Microsoft Corp. | | 87,667 | $ 21,024,299 |
| | | | $ 21,024,299 |
| Security | Shares | Value |
| Specialty Retail — 2.1% |
| Home Depot, Inc. (The) | | 58,900 | $ 18,604,154 |
| | | | $ 18,604,154 |
| Textiles, Apparel & Luxury Goods — 1.3% |
| NIKE, Inc., Class B | | 95,000 | $ 11,115,950 |
| | | | $ 11,115,950 |
| Wireless Telecommunication Services — 1.0% |
| T-Mobile US, Inc.(2) | | 63,800 | $ 8,932,000 |
| | | | $ 8,932,000 |
Total Common Stocks
(identified cost $769,464,439) | | | $877,111,374 |
| Short-Term Investments — 1.5% |
| Security | Shares | Value |
| Morgan Stanley Institutional Liquidity Funds - Government Portfolio, Institutional Class, 4.11%(3) | | 7,959,717 | $ 7,959,717 |
Total Affiliated Fund
(identified cost $7,959,717) | | | $ 7,959,717 |
| Securities Lending Collateral — 0.6% |
| Security | Shares | Value |
| State Street Navigator Securities Lending Government Money Market Portfolio, 4.34%(4) | | 5,683,113 | $ 5,683,113 |
Total Securities Lending Collateral
(identified cost $5,683,113) | | | $ 5,683,113 |
Total Short-Term Investments
(identified cost $13,642,830) | | | $ 13,642,830 |
Total Investments — 100.7%
(identified cost $783,107,269) | | | $890,754,204 |
| Other Assets, Less Liabilities — (0.7)% | | | $ (6,158,627) |
| Net Assets — 100.0% | | | $884,595,577 |
| The percentage shown for each investment category in the Portfolio of Investments is based on net assets. |
| (1) | All or a portion of this security was on loan at December 31, 2022. The aggregate market value of securities on loan at December 31, 2022 was $7,202,378. |
| (2) | Non-income producing security. |
Eaton Vance
Dividend Builder Fund
December 31, 2022
Portfolio of Investments — continued
| (3) | May be deemed to be an affiliated investment company. The rate shown is the annualized seven-day yield as of December 31, 2022. |
| (4) | Represents investment of cash collateral received in connection with securities lending. |
Eaton Vance
Dividend Builder Fund
December 31, 2022
Statement of Assets and Liabilities
| | December 31, 2022 |
| Assets | |
| Unaffiliated investments, at value (identified cost $775,147,552) — including $7,202,378 of securities on loan | $ 882,794,487 |
| Affiliated investment, at value (identified cost $7,959,717) | 7,959,717 |
| Dividends receivable | 1,733,611 |
| Dividends receivable from affiliated investment | 36,564 |
| Receivable for Fund shares sold | 1,330,140 |
| Securities lending income receivable | 1,588 |
| Tax reclaims receivable | 13,200 |
| Total assets | $893,869,307 |
| Liabilities | |
| Collateral for securities loaned | $ 5,683,113 |
| Payable for Fund shares redeemed | 2,563,672 |
| Payable to affiliates: | |
| Investment adviser fee | 492,317 |
| Distribution and service fees | 161,217 |
| Trustees' fees | 17,250 |
| Accrued expenses | 356,161 |
| Total liabilities | $ 9,273,730 |
| Net Assets | $884,595,577 |
| Sources of Net Assets | |
| Paid-in capital | $ 776,676,959 |
| Distributable earnings | 107,918,618 |
| Net Assets | $884,595,577 |
| Class A Shares | |
| Net Assets | $ 655,475,718 |
| Shares Outstanding | 47,357,788 |
Net Asset Value and Redemption Price Per Share
(net assets ÷ shares of beneficial interest outstanding) | $ 13.84 |
Maximum Offering Price Per Share
(100 ÷ 94.75 of net asset value per share) | $ 14.61 |
| Class C Shares | |
| Net Assets | $ 20,214,274 |
| Shares Outstanding | 1,446,439 |
Net Asset Value and Offering Price Per Share*
(net assets ÷ shares of beneficial interest outstanding) | $ 13.98 |
| Class I Shares | |
| Net Assets | $ 208,905,585 |
| Shares Outstanding | 15,111,091 |
Net Asset Value, Offering Price and Redemption Price Per Share
(net assets ÷ shares of beneficial interest outstanding) | $ 13.82 |
| On sales of $50,000 or more, the offering price of Class A shares is reduced. |
| * | Redemption price per share is equal to the net asset value less any applicable contingent deferred sales charge. |
10
See Notes to Financial Statements.
Eaton Vance
Dividend Builder Fund
December 31, 2022
| | Year Ended |
| | December 31, 2022 |
| Investment Income | |
| Dividend income (net of foreign taxes withheld of $1,617) | $ 27,136,371 |
| Dividend income from affiliated investments | 182,805 |
| Securities lending income, net | 5,090 |
| Total investment income | $ 27,324,266 |
| Expenses | |
| Investment adviser fee | $ 6,112,884 |
| Distribution and service fees: | |
| Class A | 1,800,289 |
| Class C | 235,973 |
| Trustees’ fees and expenses | 66,236 |
| Custodian fee | 221,274 |
| Transfer and dividend disbursing agent fees | 540,644 |
| Legal and accounting services | 81,041 |
| Printing and postage | 48,027 |
| Registration fees | 52,570 |
| Miscellaneous | 71,129 |
| Total expenses | $ 9,230,067 |
| Deduct: | |
| Waiver and/or reimbursement of expenses by affiliate | $ 12,382 |
| Total expense reductions | $ 12,382 |
| Net expenses | $ 9,217,685 |
| Net investment income | $ 18,106,581 |
| Realized and Unrealized Gain (Loss) | |
| Net realized gain (loss): | |
| Investment transactions | $ 112,558,239 |
| Investment transactions - affiliated investment | (168) |
| Foreign currency transactions | 1,214 |
| Net realized gain | $ 112,559,285 |
| Change in unrealized appreciation (depreciation): | |
| Investments | $ (236,132,270) |
| Foreign currency | (6,870) |
| Net change in unrealized appreciation (depreciation) | $(236,139,140) |
| Net realized and unrealized loss | $(123,579,855) |
| Net decrease in net assets from operations | $(105,473,274) |
11
See Notes to Financial Statements.
Eaton Vance
Dividend Builder Fund
December 31, 2022
Statements of Changes in Net Assets
| | Year Ended December 31, |
| | 2022 | 2021 |
| Increase (Decrease) in Net Assets | | |
| From operations: | | |
| Net investment income | $ 18,106,581 | $ 19,696,696 |
| Net realized gain | 112,559,285 | 168,744,483 |
| Net change in unrealized appreciation (depreciation) | (236,139,140) | 34,823,907 |
| Net increase (decrease) in net assets from operations | $ (105,473,274) | $ 223,265,086 |
| Distributions to shareholders: | | |
| Class A | $ (161,625,433) | $ (51,288,730) |
| Class C | (4,754,696) | (1,524,848) |
| Class I | (53,531,303) | (15,397,929) |
| Total distributions to shareholders | $ (219,911,432) | $ (68,211,507) |
| Transactions in shares of beneficial interest: | | |
| Class A | $ 75,078,618 | $ (21,722,994) |
| Class C | 518,131 | (6,037,273) |
| Class I | 46,125,117 | 9,304,894 |
| Net increase (decrease) in net assets from Fund share transactions | $ 121,721,866 | $ (18,455,373) |
| Net increase (decrease) in net assets | $ (203,662,840) | $ 136,598,206 |
| Net Assets | | |
| At beginning of year | $1,088,258,417 | $ 951,660,211 |
| At end of year | $ 884,595,577 | $1,088,258,417 |
12
See Notes to Financial Statements.
Eaton Vance
Dividend Builder Fund
December 31, 2022
| | Class A |
| | Year Ended December 31, |
| | 2022 | 2021 | 2020 | 2019 | 2018 |
| Net asset value — Beginning of year | $ 19.850 | $ 17.030 | $ 15.610 | $ 12.510 | $ 14.550 |
| Income (Loss) From Operations | | | | | |
| Net investment income(1) | $ 0.326 | $ 0.355 | $ 0.276 | $ 0.227 | $ 0.242 |
| Net realized and unrealized gain (loss) | (2.219) | 3.744 | 1.590 | 3.607 | (0.942) |
| Total income (loss) from operations | $ (1.893) | $ 4.099 | $ 1.866 | $ 3.834 | $ (0.700) |
| Less Distributions | | | | | |
| From net investment income | $ (0.335) | $ (0.344) | $ (0.264) | $ (0.264) | $ (0.264) |
| From net realized gain | (3.782) | (0.935) | (0.182) | (0.470) | (1.076) |
| Total distributions | $ (4.117) | $ (1.279) | $ (0.446) | $ (0.734) | $ (1.340) |
| Net asset value — End of year | $ 13.840 | $ 19.850 | $ 17.030 | $ 15.610 | $ 12.510 |
| Total Return(2) | (9.75)% | 24.42% | 12.32% | 31.09% | (5.40)% |
| Ratios/Supplemental Data | | | | | |
| Net assets, end of year (000’s omitted) | $655,476 | $821,560 | $725,569 | $706,043 | $558,487 |
| Ratios (as a percentage of average daily net assets):(3) | | | | | |
| Expenses | 1.00% (4) | 0.99% | 1.01% | 1.01% | 1.02% |
| Net investment income | 1.85% | 1.89% | 1.83% | 1.57% | 1.66% |
| Portfolio Turnover of the Portfolio(5) | — | — | — | — | 37% (6) |
| Portfolio Turnover of the Fund | 57% | 74% | 81% | 55% | 41% (6)(7) |
| (1) | Computed using average shares outstanding. |
| (2) | Returns are historical and are calculated by determining the percentage change in net asset value with all distributions reinvested and do not reflect the effect of sales charges. |
| (3) | Includes the Fund’s share of the Portfolio’s allocated expenses for the period while the Fund was investing in the Portfolio. |
| (4) | Includes a reduction by the investment adviser of a portion of its adviser fee due to the Fund's investment in the Liquidity Fund (equal to less than 0.005% of average daily net assets for the year ended December 31, 2022). |
| (5) | Portfolio turnover represents the rate of portfolio activity for the period while the Fund was investing in the Portfolio. |
| (6) | Not annualized. |
| (7) | For the period from June 11, 2018 through December 31, 2018 when the Fund was making investments directly in securities. |
| References to Portfolio herein are to Dividend Builder Portfolio, a Massachusetts business trust having the same investment objective and policies as the Fund, in which the Fund invested all of its investable assets prior to June 11, 2018. |
13
See Notes to Financial Statements.
Eaton Vance
Dividend Builder Fund
December 31, 2022
Financial Highlights — continued
| | Class C |
| | Year Ended December 31, |
| | 2022 | 2021 | 2020 | 2019 | 2018 |
| Net asset value — Beginning of year | $ 19.990 | $ 17.150 | $ 15.710 | $ 12.580 | $ 14.620 |
| Income (Loss) From Operations | | | | | |
| Net investment income(1) | $ 0.196 | $ 0.218 | $ 0.166 | $ 0.115 | $ 0.133 |
| Net realized and unrealized gain (loss) | (2.226) | 3.758 | 1.602 | 3.636 | (0.945) |
| Total income (loss) from operations | $ (2.030) | $ 3.976 | $ 1.768 | $ 3.751 | $ (0.812) |
| Less Distributions | | | | | |
| From net investment income | $ (0.198) | $ (0.201) | $ (0.146) | $ (0.151) | $ (0.152) |
| From net realized gain | (3.782) | (0.935) | (0.182) | (0.470) | (1.076) |
| Total distributions | $ (3.980) | $ (1.136) | $ (0.328) | $ (0.621) | $ (1.228) |
| Net asset value — End of year | $13.980 | $19.990 | $17.150 | $15.710 | $ 12.580 |
| Total Return(2) | (10.37)% | 23.43% | 11.51% | 30.13% | (6.09)% |
| Ratios/Supplemental Data | | | | | |
| Net assets, end of year (000’s omitted) | $ 20,214 | $ 27,405 | $ 29,195 | $ 56,585 | $107,495 |
| Ratios (as a percentage of average daily net assets):(3) | | | | | |
| Expenses | 1.75% (4) | 1.74% | 1.76% | 1.77% | 1.77% |
| Net investment income | 1.10% | 1.15% | 1.10% | 0.80% | 0.91% |
| Portfolio Turnover of the Portfolio(5) | — | — | — | — | 37% (6) |
| Portfolio Turnover of the Fund | 57% | 74% | 81% | 55% | 41% (6)(7) |
| (1) | Computed using average shares outstanding. |
| (2) | Returns are historical and are calculated by determining the percentage change in net asset value with all distributions reinvested and do not reflect the effect of sales charges. |
| (3) | Includes the Fund’s share of the Portfolio’s allocated expenses for the period while the Fund was investing in the Portfolio. |
| (4) | Includes a reduction by the investment adviser of a portion of its adviser fee due to the Fund's investment in the Liquidity Fund (equal to less than 0.005% of average daily net assets for the year ended December 31, 2022). |
| (5) | Portfolio turnover represents the rate of portfolio activity for the period while the Fund was investing in the Portfolio. |
| (6) | Not annualized. |
| (7) | For the period from June 11, 2018 through December 31, 2018 when the Fund was making investments directly in securities. |
| References to Portfolio herein are to Dividend Builder Portfolio, a Massachusetts business trust having the same investment objective and policies as the Fund, in which the Fund invested all of its investable assets prior to June 11, 2018. |
14
See Notes to Financial Statements.
Eaton Vance
Dividend Builder Fund
December 31, 2022
Financial Highlights — continued
| | Class I |
| | Year Ended December 31, |
| | 2022 | 2021 | 2020 | 2019 | 2018 |
| Net asset value — Beginning of year | $ 19.830 | $ 17.020 | $ 15.600 | $ 12.500 | $ 14.530 |
| Income (Loss) From Operations | | | | | |
| Net investment income(1) | $ 0.371 | $ 0.402 | $ 0.313 | $ 0.262 | $ 0.279 |
| Net realized and unrealized gain (loss) | (2.219) | 3.733 | 1.591 | 3.608 | (0.932) |
| Total income (loss) from operations | $ (1.848) | $ 4.135 | $ 1.904 | $ 3.870 | $ (0.653) |
| Less Distributions | | | | | |
| From net investment income | $ (0.380) | $ (0.390) | $ (0.302) | $ (0.300) | $ (0.301) |
| From net realized gain | (3.782) | (0.935) | (0.182) | (0.470) | (1.076) |
| Total distributions | $ (4.162) | $ (1.325) | $ (0.484) | $ (0.770) | $ (1.377) |
| Net asset value — End of year | $ 13.820 | $ 19.830 | $ 17.020 | $ 15.600 | $ 12.500 |
| Total Return(2) | (9.54)% | 24.68% | 12.61% | 31.44% | (5.10)% |
| Ratios/Supplemental Data | | | | | |
| Net assets, end of year (000’s omitted) | $208,906 | $239,294 | $196,896 | $184,050 | $146,070 |
| Ratios (as a percentage of average daily net assets):(3) | | | | | |
| Expenses | 0.75% (4) | 0.74% | 0.76% | 0.76% | 0.77% |
| Net investment income | 2.11% | 2.14% | 2.08% | 1.82% | 1.92% |
| Portfolio Turnover of the Portfolio(5) | — | — | — | — | 37% (6) |
| Portfolio Turnover of the Fund | 57% | 74% | 81% | 55% | 41% (6)(7) |
| (1) | Computed using average shares outstanding. |
| (2) | Returns are historical and are calculated by determining the percentage change in net asset value with all distributions reinvested. |
| (3) | Includes the Fund’s share of the Portfolio’s allocated expenses for the period while the Fund was investing in the Portfolio. |
| (4) | Includes a reduction by the investment adviser of a portion of its adviser fee due to the Fund's investment in the Liquidity Fund (equal to less than 0.005% of average daily net assets for the year ended December 31, 2022). |
| (5) | Portfolio turnover represents the rate of portfolio activity for the period while the Fund was investing in the Portfolio. |
| (6) | Not annualized. |
| (7) | For the period from June 11, 2018 through December 31, 2018 when the Fund was making investments directly in securities. |
| References to Portfolio herein are to Dividend Builder Portfolio, a Massachusetts business trust having the same investment objective and policies as the Fund, in which the Fund invested all of its investable assets prior to June 11, 2018. |
15
See Notes to Financial Statements.
Eaton Vance
Dividend Builder Fund
December 31, 2022
Notes to Financial Statements
1 Significant Accounting Policies
Eaton Vance Dividend Builder Fund (the Fund) is a diversified series of Eaton Vance Special Investment Trust (the Trust). The Trust is a Massachusetts business trust registered under the Investment Company Act of 1940, as amended (the 1940 Act), as an open-end management investment company. The Fund’s investment objective is to seek total return. The Fund offers three classes of shares. Class A shares are generally sold subject to a sales charge imposed at time of purchase. Class C shares are sold at net asset value and are generally subject to a contingent deferred sales charge (see Note 5). Effective November 5, 2020, Class C shares automatically convert to Class A shares eight years after their purchase as described in the Fund’s prospectus. Class I shares are sold at net asset value and are not subject to a sales charge. Each class represents a pro-rata interest in the Fund, but votes separately on class-specific matters and (as noted below) is subject to different expenses. Realized and unrealized gains and losses and net investment income and losses, other than class-specific expenses, are allocated daily to each class of shares based on the relative net assets of each class to the total net assets of the Fund. Each class of shares differs in its distribution plan and certain other class-specific expenses.
The following is a summary of significant accounting policies of the Fund. The policies are in conformity with accounting principles generally accepted in the United States of America (U.S. GAAP). The Fund is an investment company and follows accounting and reporting guidance in the Financial Accounting Standards Board (FASB) Accounting Standards Codification Topic 946.
A Investment Valuation—The following methodologies are used to determine the market value or fair value of investments.
Equity Securities. Equity securities listed on a U.S. securities exchange generally are valued at the last sale or closing price on the day of valuation or, if no sales took place on such date, at the mean between the closing bid and ask prices on the exchange where such securities are principally traded. Equity securities listed on the NASDAQ National Market System are valued at the NASDAQ official closing price. Unlisted or listed securities for which closing sales prices or closing quotations are not available are valued at the mean between the latest available bid and ask prices.
Foreign Securities and Currencies. Foreign securities and currencies are valued in U.S. dollars, based on foreign currency exchange rate quotations supplied by a third party pricing service. The pricing service uses a proprietary model to determine the exchange rate. Inputs to the model include reported trades and implied bid/ask spreads. The daily valuation of exchange-traded foreign securities generally is determined as of the close of trading on the principal exchange on which such securities trade. Events occurring after the close of trading on foreign exchanges may result in adjustments to the valuation of foreign securities to more accurately reflect their fair value as of the close of regular trading on the New York Stock Exchange. When valuing foreign equity securities that meet certain criteria, the Fund's Trustees have approved the use of a fair value service that values such securities to reflect market trading that occurs after the close of the applicable foreign markets of comparable securities or other instruments that have a strong correlation to the fair-valued securities.
Other. Investments in management investment companies (including money market funds) that do not trade on an exchange are valued at the net asset value as of the close of each business day.
Fair Valuation. In connection with Rule 2a-5 of the 1940 Act, which became effective September 8, 2022, the Trustees have designated the Fund’s investment adviser as its valuation designee. Investments for which valuations or market quotations are not readily available or are deemed unreliable are valued by the investment adviser, as valuation designee, at fair value using methods that most fairly reflect the security’s “fair value”, which is the amount that the Fund might reasonably expect to receive for the security upon its current sale in the ordinary course. Each such determination is based on a consideration of relevant factors, which are likely to vary from one pricing context to another. These factors may include, but are not limited to, the type of security, the existence of any contractual restrictions on the security’s disposition, the price and extent of public trading in similar securities of the issuer or of comparable companies or entities, quotations or relevant information obtained from broker/dealers or other market participants, information obtained from the issuer, analysts, and/or the appropriate stock exchange (for exchange-traded securities), an analysis of the company’s or entity’s financial statements, and an evaluation of the forces that influence the issuer and the market(s) in which the security is purchased and sold.
B Investment Transactions—Investment transactions for financial statement purposes are accounted for on a trade date basis. Realized gains and losses on investments sold are determined on the basis of identified cost.
C Income—Dividend income is recorded on the ex-dividend date for dividends received in cash and/or securities. However, if the ex-dividend date has passed, certain dividends from foreign securities are recorded as the Fund is informed of the ex-dividend date. Withholding taxes on foreign dividends and capital gains have been provided for in accordance with the Fund’s understanding of the applicable countries’ tax rules and rates. In consideration of recent decisions rendered by European courts, the Fund has filed additional tax reclaims for previously withheld taxes on dividends earned in certain European Union countries. These filings are subject to various administrative and judicial proceedings within these countries. Due to the uncertainty as to the ultimate resolution of these proceedings, the likelihood of receipt of these reclaims, and the potential timing of payment, no amounts are reflected in the Fund’s financial statements for such outstanding reclaims.
D Federal Taxes—The Fund's policy is to comply with the provisions of the Internal Revenue Code applicable to regulated investment companies and to distribute to shareholders each year substantially all of its net investment income, and all or substantially all of its net realized capital gains. Accordingly, no provision for federal income or excise tax is necessary.
Eaton Vance
Dividend Builder Fund
December 31, 2022
Notes to Financial Statements — continued
As of December 31, 2022, the Fund had no uncertain tax positions that would require financial statement recognition, de-recognition, or disclosure. The Fund files a U.S. federal income tax return annually after its fiscal year-end, which is subject to examination by the Internal Revenue Service for a period of three years from the date of filing.
E Expenses—The majority of expenses of the Trust are directly identifiable to an individual fund. Expenses which are not readily identifiable to a specific fund are allocated taking into consideration, among other things, the nature and type of expense and the relative size of the funds.
F Foreign Currency Translation—Investment valuations, other assets, and liabilities initially expressed in foreign currencies are translated each business day into U.S. dollars based upon current exchange rates. Purchases and sales of foreign investment securities and income and expenses denominated in foreign currencies are translated into U.S. dollars based upon currency exchange rates in effect on the respective dates of such transactions. Recognized gains or losses on investment transactions attributable to changes in foreign currency exchange rates are recorded for financial statement purposes as net realized gains and losses on investments. That portion of unrealized gains and losses on investments that results from fluctuations in foreign currency exchange rates is not separately disclosed.
G Use of Estimates—The preparation of the financial statements in conformity with U.S. GAAP requires management to make estimates and assumptions that affect the reported amounts of assets and liabilities at the date of the financial statements and the reported amounts of income and expense during the reporting period. Actual results could differ from those estimates.
H Indemnifications—Under the Trust’s organizational documents, its officers and Trustees may be indemnified against certain liabilities and expenses arising out of the performance of their duties to the Fund. Under Massachusetts law, if certain conditions prevail, shareholders of a Massachusetts business trust (such as the Trust) could be deemed to have personal liability for the obligations of the Trust. However, the Trust’s Declaration of Trust contains an express disclaimer of liability on the part of Fund shareholders and the By-laws provide that the Trust shall assume, upon request by the shareholder, the defense on behalf of any Trust shareholders. Moreover, the By-laws also provide for indemnification out of Fund property of any shareholder held personally liable solely by reason of being or having been a shareholder for all loss or expense arising from such liability. Additionally, in the normal course of business, the Fund enters into agreements with service providers that may contain indemnification clauses. The Fund’s maximum exposure under these arrangements is unknown as this would involve future claims that may be made against the Fund that have not yet occurred.
2 Distributions to Shareholders and Income Tax Information
It is the present policy of the Fund to make monthly distributions of all or substantially all of its net investment income and to distribute annually all or substantially all of its net realized capital gains. Distributions to shareholders are recorded on the ex-dividend date. Distributions are declared separately for each class of shares. Shareholders may reinvest income and capital gain distributions in additional shares of the same class of the Fund at the net asset value as of the ex-dividend date or, at the election of the shareholder, receive distributions in cash. Distributions to shareholders are determined in accordance with income tax regulations, which may differ from U.S. GAAP. As required by U.S. GAAP, only distributions in excess of tax basis earnings and profits are reported in the financial statements as a return of capital. Permanent differences between book and tax accounting relating to distributions are reclassified to paid-in capital. For tax purposes, distributions from short-term capital gains are considered to be from ordinary income.
The tax character of distributions declared for the years ended December 31, 2022 and December 31, 2021 was as follows:
| | Year Ended December 31, |
| | 2022 | 2021 |
| Ordinary income | $ 18,339,050 | $18,907,386 |
| Long-term capital gains | $201,572,382 | $49,304,121 |
During the year ended December 31, 2022, distributable earnings was decreased by $12,366,675 and paid-in capital was increased by $12,366,675
due to the Fund’s use of equalization accounting. Tax equalization accounting allows the Fund to treat as a distribution that portion of redemption proceeds representing a redeeming shareholder’s portion of undistributed taxable income and net capital gains. These reclassifications had no effect on the net assets or net asset value per share of the Fund.
Eaton Vance
Dividend Builder Fund
December 31, 2022
Notes to Financial Statements — continued
As of December 31, 2022, the components of distributable earnings (accumulated loss) on a tax basis were as follows:
| Undistributed ordinary income | $ 53,041 |
| Undistributed long-term capital gains | 1,493,661 |
| Net unrealized appreciation | 106,371,916 |
| Distributable earnings | $107,918,618 |
The cost and unrealized appreciation (depreciation) of investments of the Fund at December 31, 2022, as determined on a federal income tax basis, were as follows:
| Aggregate cost | $ 784,423,746 |
| Gross unrealized appreciation | $ 138,903,864 |
| Gross unrealized depreciation | (32,573,406) |
| Net unrealized appreciation | $ 106,330,458 |
3 Investment Adviser Fee and Other Transactions with Affiliates
The investment adviser fee is earned by Boston Management and Research (BMR), an indirect, wholly-owned subsidiary of Morgan Stanley, as compensation for investment advisory services rendered to the Fund. The fee is computed at an annual rate as a percentage of the Fund’s average daily net assets as follows and is payable monthly.
| Average Daily Net Assets | Annual Fee Rate |
| Up to $500 million | 0.6500% |
| $500 million but less than $1 billion | 0.6250% |
| $1 billion but less than $1.5 billion | 0.6000% |
| $1.5 billion but less than $2 billion | 0.5500% |
| $2 billion but less than $3 billion | 0.5000% |
| $3 billion and over | 0.4375% |
For the year ended December 31, 2022, the investment adviser fee amounted to $6,112,884 or 0.64% of the Fund’s average daily net assets. Effective April 26, 2022, the Fund may invest in a money market fund, the Institutional Class of the Morgan Stanley Institutional Liquidity Funds - Government Portfolio (the “Liquidity Fund”), an open-end management investment company managed by Morgan Stanley Investment Management Inc., a wholly-owned subsidiary of Morgan Stanley. The investment adviser fee paid by the Fund is reduced by an amount equal to its pro-rata share of the advisory and administration fees paid by the Fund due to its investment in the Liquidity Fund. For the year ended December 31, 2022, the investment adviser fee paid was reduced by $12,382 relating to the Fund’s investment in the Liquidity Fund. Prior to April 26, 2022, the Fund may have invested its cash in Eaton Vance Cash Reserves Fund, LLC (Cash Reserves Fund), an affiliated investment company managed by Eaton Vance Management (EVM). EVM did not receive a fee for advisory services provided to Cash Reserves Fund.
EVM, an affiliate of BMR and an indirect, wholly-owned subsidiary of Morgan Stanley, serves as the administrator of the Fund, but receives no compensation. EVM provides sub-transfer agency and related services to the Fund pursuant to a Sub-Transfer Agency Support Services Agreement. For the year ended December 31, 2022, EVM earned $117,213 from the Fund pursuant to such agreement, which is included in transfer and dividend disbursing agent fees on the Statement of Operations. The Fund was informed that Eaton Vance Distributors, Inc. (EVD), an affiliate of EVM and the Fund’s principal underwriter, received $17,700 as its portion of the sales charge on sales of Class A shares for the year ended December 31, 2022. The Fund was informed that Morgan Stanley affiliated broker-dealers, which may be deemed to be affiliates of EVM, BMR and EVD, also received a portion of the sales charge on sales of Class A shares of $17,700. EVD also received distribution and service fees from Class A and Class C shares (see Note 4) and contingent deferred sales charges (see Note 5).
Eaton Vance
Dividend Builder Fund
December 31, 2022
Notes to Financial Statements — continued
Trustees and officers of the Fund who are members of EVM’s or BMR’s organizations receive remuneration for their services to the Fund out of the investment adviser fee. Trustees of the Fund who are not affiliated with the investment adviser may elect to defer receipt of all or a percentage of their annual fees in accordance with the terms of the Trustees Deferred Compensation Plan. For the year ended December 31, 2022, no significant amounts have been deferred. Certain officers and Trustees of the Fund are officers of the above organizations.
4 Distribution Plans
The Fund has in effect a distribution plan for Class A shares (Class A Plan) pursuant to Rule 12b-1 under the 1940 Act. Pursuant to the Class A Plan, the Fund pays EVD a distribution and service fee of 0.25% per annum of its average daily net assets attributable to Class A shares for distribution services and facilities provided to the Fund by EVD, as well as for personal services and/or the maintenance of shareholder accounts. Distribution and service fees paid or accrued to EVD for the year ended December 31, 2022 amounted to $1,800,289 for Class A shares.
The Fund also has in effect a distribution plan for Class C shares (Class C Plan) pursuant to Rule 12b-1 under the 1940 Act. Pursuant to the Class C Plan, the Fund pays EVD amounts equal to 0.75% per annum of its average daily net assets attributable to Class C shares for providing ongoing distribution services and facilities to the Fund. For the year ended December 31, 2022, the Fund paid or accrued to EVD $176,980 for Class C shares.
Pursuant to the Class C Plan, the Fund also makes payments of service fees to EVD, financial intermediaries and other persons in amounts equal to 0.25% per annum of its average daily net assets attributable to that class. Service fees paid or accrued are for personal services and/or the maintenance of shareholder accounts. They are separate and distinct from the sales commissions and distribution fees payable to EVD. Service fees paid or accrued for the year ended December 31, 2022 amounted to $58,993 for Class C shares.
Distribution and service fees are subject to the limitations contained in the Financial Industry Regulatory Authority Rule 2341(d).
5 Contingent Deferred Sales Charges
A contingent deferred sales charge (CDSC) of 1% generally is imposed on redemptions of Class C shares made within 12 months of purchase. Class A shares may be subject to a 1% CDSC if redeemed within 12 months (18 months prior to April 29, 2022) of purchase (depending on the circumstances of purchase). Generally, the CDSC is based upon the lower of the net asset value at date of redemption or date of purchase. No charge is levied on shares acquired by reinvestment of dividends or capital gain distributions. For the year ended December 31, 2022, the Fund was informed that EVD received approximately $200 and $4,000 of CDSCs paid by Class A and Class C shareholders, respectively.
6 Purchases and Sales of Investments
Purchases and sales of investments, other than short-term obligations, aggregated $545,177,780 and $631,913,539, respectively, for the year ended December 31, 2022.
7 Shares of Beneficial Interest
The Fund’s Declaration of Trust permits the Trustees to issue an unlimited number of full and fractional shares of beneficial interest (without par value). Such shares may be issued in a number of different series (such as the Fund) and classes. Transactions in Fund shares, including direct exchanges pursuant to share class conversions for all periods presented, were as follows:
| | Year Ended
December 31, 2022 | | Year Ended
December 31, 2021 |
| | Shares | Amount | | Shares | Amount |
| Class A | | | | | |
| Sales | 2,115,760 | $ 33,764,541 | | 1,348,914 | $ 25,267,315 |
| Issued to shareholders electing to receive payments of distributions in Fund shares | 9,718,130 | 137,755,540 | | 2,282,140 | 43,779,123 |
| Redemptions | (5,873,470) | (96,441,463) | | (4,829,485) | (90,769,432) |
| Net increase (decrease) | 5,960,420 | $ 75,078,618 | | (1,198,431) | $(21,722,994) |
Eaton Vance
Dividend Builder Fund
December 31, 2022
Notes to Financial Statements — continued
| | Year Ended
December 31, 2022 | | Year Ended
December 31, 2021 |
| | Shares | Amount | | Shares | Amount |
| Class C | | | | | |
| Sales | 213,067 | $ 3,783,386 | | 163,994 | $ 3,118,845 |
| Issued to shareholders electing to receive payments of distributions in Fund shares | 322,190 | 4,584,231 | | 76,214 | 1,476,883 |
| Redemptions | (459,681) | (7,849,486) | | (571,650) | (10,633,001) |
| Net increase (decrease) | 75,576 | $ 518,131 | | (331,442) | $ (6,037,273) |
| Class I | | | | | |
| Sales | 3,272,366 | $ 57,567,777 | | 1,628,587 | $ 30,171,573 |
| Issued to shareholders electing to receive payments of distributions in Fund shares | 3,554,690 | 50,349,667 | | 750,764 | 14,380,481 |
| Redemptions | (3,784,212) | (61,792,327) | | (1,880,014) | (35,247,160) |
| Net increase | 3,042,844 | $ 46,125,117 | | 499,337 | $ 9,304,894 |
8 Line of Credit
The Fund participates with other portfolios and funds managed by EVM and its affiliates in a $725 million unsecured line of credit agreement with a group of banks, which is in effect through October 24, 2023. In connection with the renewal of the agreement on October 25, 2022, the borrowing limit was decreased from $800 million. Borrowings are made by the Fund solely for temporary purposes related to redemptions and other short-term cash needs. Interest is charged to the Fund based on its borrowings at an amount above either the Secured Overnight Financing Rate (SOFR) or Federal Funds rate. In addition, a fee computed at an annual rate of 0.15% on the daily unused portion of the line of credit is allocated among the participating portfolios and funds at the end of each quarter. Also in connection with the renewal of the agreement, an arrangement fee totaling $150,000 was incurred that was allocated to the participating portfolios and funds. Because the line of credit is not available exclusively to the Fund, it may be unable to borrow some or all of its requested amounts at any particular time. The Fund did not have any significant borrowings or allocated fees during the year ended December 31, 2022.
9 Securities Lending Agreement
The Fund has established a securities lending agreement with State Street Bank and Trust Company (SSBT) as securities lending agent in which the Fund lends portfolio securities to qualified borrowers in exchange for collateral consisting of either cash or securities issued or guaranteed by the U.S. government or its agencies or instrumentalities in an amount at least equal to the market value of the securities on loan. The market value of securities loaned is determined daily and any additional required collateral is delivered to the Fund on the next business day. Cash collateral is invested in the State Street Navigator Securities Lending Government Money Market Portfolio, a money market fund registered under the 1940 Act. The Fund earns interest on the amount invested but it must pay (and at times receive from) the broker a loan rebate fee computed as a varying percentage of the collateral received. For security loans secured by non-cash collateral, the Fund earns a negotiated lending fee from the borrower. A portion of the income earned by the Fund from its investment of cash collateral, net of rebate fees, and lending fees received is allocated to SSBT for its services as lending agent and the portion allocated to the Fund is presented as securities lending income, net on the Statement of Operations. Non-cash collateral is held by the lending agent on behalf of the Fund and cannot be sold or re-pledged by the Fund; accordingly, such collateral is not reflected in the Statement of Assets and Liabilities.
The Fund is subject to possible delay in the recovery of loaned securities. Pursuant to the securities lending agreement, SSBT has provided indemnification to the Fund in the event of default by a borrower with respect to a loan. The Fund bears the risk of loss with respect to the investment of cash collateral.
At December 31, 2022, the value of the securities loaned and the value of the collateral received, which exceeded the value of the securities loaned, amounted to $7,202,378 and $7,435,489, respectively. Collateral received was comprised of cash of $5,683,113 and U.S. government and/or agencies securities of $1,752,376. The securities lending transactions have no contractual maturity date and each of the Fund and borrower has the option to terminate a loan at any time.
Eaton Vance
Dividend Builder Fund
December 31, 2022
Notes to Financial Statements — continued
The following table provides a breakdown of securities lending transactions accounted for as secured borrowings, the obligations by class of collateral pledged, and the remaining contractual maturity of those transactions as of December 31, 2022.
| | Remaining Contractual Maturity of the Transactions |
| | Overnight and
Continuous | <30 days | 30 to 90 days | >90 days | Total |
| Common Stocks | $5,683,113 | $ — | $ — | $ — | $5,683,113 |
The carrying amount of the liability for collateral for securities loaned at December 31, 2022 approximated its fair value. If measured at fair value, such liability would have been considered as Level 2 in the fair value hierarchy (see Note 11) at December 31, 2022.
10 Investments in Affiliated Funds
At December 31, 2022, the value of the Fund's investment in affiliated funds, including funds that may be deemed to be affiliated, was $7,959,717, which represents 0.9% of the Fund's net assets. Transactions in such investments by the Fund for the year ended December 31, 2022 were as follows:
| Name | Value,
beginning
of period | Purchases | Sales
proceeds | Net
realized
gain (loss) | Change in
unrealized
appreciation
(depreciation) | Value, end
of period | Dividend
income | Units/Shares,
end of period |
| Short-Term Investments |
| Cash Reserves Fund | $1,120,031 | $ 21,224,470 | $ (22,344,333) | $ (168) | $ — | $ — | $ 1,033 | — |
| Liquidity Fund | — | 112,327,644 | (104,367,927) | — | — | 7,959,717 | 181,772 | 7,959,717 |
| Total | | | | $(168) | $ — | $7,959,717 | $182,805 | |
11 Fair Value Measurements
Under generally accepted accounting principles for fair value measurements, a three-tier hierarchy to prioritize the assumptions, referred to as inputs, is used in valuation techniques to measure fair value. The three-tier hierarchy of inputs is summarized in the three broad levels listed below.
| • | Level 1 – quoted prices in active markets for identical investments |
| • | Level 2 – other significant observable inputs (including quoted prices for similar investments, interest rates, prepayment speeds, credit risk, etc.) |
| • | Level 3 – significant unobservable inputs (including a fund's own assumptions in determining the fair value of investments) |
In cases where the inputs used to measure fair value fall in different levels of the fair value hierarchy, the level disclosed is determined based on the lowest level input that is significant to the fair value measurement in its entirety. The inputs or methodology used for valuing securities are not necessarily an indication of the risk associated with investing in those securities.
At December 31, 2022, the hierarchy of inputs used in valuing the Fund's investments, which are carried at value, were as follows:
| Asset Description | Level 1 | Level 2 | Level 3 | Total |
| Common Stocks | $ 877,111,374* | $ — | $ — | $ 877,111,374 |
| Short-Term Investments: | | | | |
| Affiliated Fund | 7,959,717 | — | — | 7,959,717 |
| Securities Lending Collateral | 5,683,113 | — | — | 5,683,113 |
| Total Investments | $890,754,204 | $ — | $ — | $890,754,204 |
| * | The level classification by major category of investments is the same as the category presentation in the Portfolio of Investments. |
Eaton Vance
Dividend Builder Fund
December 31, 2022
Notes to Financial Statements — continued
12 Risks and Uncertainties
Pandemic Risk
An outbreak of respiratory disease caused by a novel coronavirus was first detected in China in late 2019 and subsequently spread internationally. This coronavirus has resulted in closing borders, enhanced health screenings, changes to healthcare service preparation and delivery, quarantines, cancellations, disruptions to supply chains and customer activity, as well as general concern and uncertainty. Health crises caused by outbreaks of disease, such as the coronavirus outbreak, may exacerbate other pre-existing political, social and economic risks and disrupt normal market conditions and operations. The impact of this outbreak has negatively affected the worldwide economy, as well as the economies of individual countries and industries, and could continue to affect the market in significant and unforeseen ways. Other epidemics and pandemics that may arise in the future may have similar effects. Any such impact could adversely affect the Fund's performance, or the performance of the securities in which the Fund invests.
Eaton Vance
Dividend Builder Fund
December 31, 2022
Report of Independent Registered Public Accounting Firm
To the Trustees of Eaton Vance Special Investment Trust and Shareholders of Eaton Vance Dividend Builder Fund:
Opinion on the Financial Statements and Financial Highlights
We have audited the accompanying statement of assets and liabilities of Eaton Vance Dividend Builder Fund (the "Fund") (one of the funds constituting Eaton Vance Special Investment Trust), including the portfolio of investments, as of December 31, 2022, the related statement of operations for the year then ended, the statements of changes in net assets for each of the two years in the period then ended, the financial highlights for each of the five years in the period then ended, and the related notes. In our opinion, the financial statements and financial highlights present fairly, in all material respects, the financial position of the Fund as of December 31, 2022, and the results of its operations for the year then ended, the changes in its net assets for each of the two years in the period then ended, and the financial highlights for each of the five years in the period then ended, in conformity with accounting principles generally accepted in the United States of America.
Basis for Opinion
These financial statements and financial highlights are the responsibility of the Fund's management. Our responsibility is to express an opinion on the Fund's financial statements and financial highlights based on our audits. We are a public accounting firm registered with the Public Company Accounting Oversight Board (United States) (PCAOB) and are required to be independent with respect to the Fund in accordance with the U.S. federal securities laws and the applicable rules and regulations of the Securities and Exchange Commission and the PCAOB.
We conducted our audits in accordance with the standards of the PCAOB. Those standards require that we plan and perform the audit to obtain reasonable assurance about whether the financial statements and financial highlights are free of material misstatement, whether due to error or fraud. The Fund is not required to have, nor were we engaged to perform, an audit of its internal control over financial reporting. As part of our audits, we are required to obtain an understanding of internal control over financial reporting but not for the purpose of expressing an opinion on the effectiveness of the Fund’s internal control over financial reporting. Accordingly, we express no such opinion.
Our audits included performing procedures to assess the risks of material misstatement of the financial statements and financial highlights, whether due to error or fraud, and performing procedures that respond to those risks. Such procedures included examining, on a test basis, evidence regarding the amounts and disclosures in the financial statements and financial highlights. Our audits also included evaluating the accounting principles used and significant estimates made by management, as well as evaluating the overall presentation of the financial statements and financial highlights. Our procedures included confirmation of securities owned as of December 31, 2022, by correspondence with the custodian and brokers; when replies were not received from brokers, we performed other auditing procedures. We believe that our audits provide a reasonable basis for our opinion.
/s/ Deloitte & Touche LLP
Boston, Massachusetts
February 24, 2023
We have served as the auditor of one or more Eaton Vance investment companies since 1959.
Eaton Vance
Dividend Builder Fund
December 31, 2022
Federal Tax Information (Unaudited)
The Form 1099-DIV you received in February 2023 showed the tax status of all distributions paid to your account in calendar year 2022. Shareholders are advised to consult their own tax adviser with respect to the tax consequences of their investment in the Fund. As required by the Internal Revenue Code and/or regulations, shareholders must be notified regarding the status of qualified dividend income for individuals, the dividends received deduction for corporations and capital gains dividends.
Qualified Dividend Income. For the fiscal year ended December 31, 2022, the Fund designates approximately $25,448,043, or up to the maximum amount of such dividends allowable pursuant to the Internal Revenue Code, as qualified dividend income eligible for the reduced tax rate of 15%.
Dividends Received Deduction. Corporate shareholders are generally entitled to take the dividends received deduction on the portion of the Fund’s dividend distribution that qualifies under tax law. For the Fund’s fiscal 2022 ordinary income dividends, 95.69% qualifies for the corporate dividends received deduction.
Capital Gains Dividends. The Fund hereby designates as a capital gain dividend with respect to the taxable year ended December 31, 2022, $112,410,554 or, if subsequently determined to be different, the net capital gain of such year.
Eaton Vance
Dividend Builder Fund
December 31, 2022
Management and Organization
Fund Management. The Trustees of Eaton Vance Special Investment Trust (the Trust) are responsible for the overall management and supervision of the Trust's affairs. The Board members and officers of the Trust are listed below. Except as indicated, each individual has held the office shown or other offices in the same company for the last five years. Board members hold indefinite terms of office. Each Trustee holds office until his or her successor is elected and qualified, subject to a prior death, resignation, retirement, disqualification or removal. Under the terms of the Fund’s current Trustee retirement policy, an Independent Trustee must retire and resign as a Trustee on the earlier of: (i) the first day of July following his or her 74th birthday; or (ii), with limited exception, December 31st of the 20th year in which he or she has served as a Trustee. However, if such retirement and resignation would cause the Fund to be out of compliance with Section 16 of the 1940 Act or any other regulations or guidance of the SEC, then such retirement and resignation will not become effective until such time as action has been taken for the Fund to be in compliance therewith. The “noninterested Trustees” consist of those Trustees who are not “interested persons” of the Trust, as that term is defined under the 1940 Act. The business address of each Board member and officer is Two International Place, Boston, Massachusetts 02110. As used below, “BMR” refers to Boston Management and Research, “EVC” refers to Eaton Vance Corp., “EV” refers to EV LLC, “EVM” refers to Eaton Vance Management and “EVD” refers to Eaton Vance Distributors, Inc. EV is the trustee of each of EVM and BMR. Effective March 1, 2021, each of EVM, BMR, EVD and EV are indirect, wholly owned subsidiaries of Morgan Stanley. Each officer affiliated with EVM may hold a position with other EVM affiliates that is comparable to his or her position with EVM listed below. Each Trustee oversees 130 funds in the Eaton Vance fund complex (including both funds and portfolios in a hub and spoke structure).
| Name and Year of Birth | Trust
Position(s) | Length of Service | Principal Occupation(s) and Other Directorships
During Past Five Years and Other Relevant Experience |
| Interested Trustee |
Thomas E. Faust Jr.
1958 | Trustee | Since 2007 | Chairman of Morgan Stanley Investment Management, Inc. (MSIM), member of the Board of Managers and President of EV (since 2021), Chief Executive Officer of EVM and BMR. Formerly, Chairman, Chief Executive Officer (2007-2021) and President (2006-2021) of EVC and Director of EVD (2007-2022). Mr. Faust is an interested person because of his positions with MSIM, BMR, EVM and EV, which are affiliates of the Trust.
Other Directorships. Formerly, Director of EVC (2007-2021) and Hexavest Inc. (investment management firm) (2012-2021). |
| Noninterested Trustees |
Alan C. Bowser(1)
1962 | Trustee | Since 2022 | Formerly, Chief Diversity Officer, Partner and a member of the Operating Committee, and formerly served as Senior Advisor on Diversity and Inclusion for the firm’s chief executive officer, Co-Head of the Americas Region, and Senior Client Advisor of Bridgewater Associates, an asset management firm (2011- 2023).
Other Directorships. None. |
Mark R. Fetting
1954 | Trustee | Since 2016 | Private investor. Formerly held various positions at Legg Mason, Inc. (investment management firm) (2000-2012), including President, Chief Executive Officer, Director and Chairman (2008-2012), Senior Executive Vice President (2004-2008) and Executive Vice President (2001-2004). Formerly, President of Legg Mason family of funds (2001-2008). Formerly, Division President and Senior Officer of Prudential Financial Group, Inc. and related companies (investment management firm) (1991-2000).
Other Directorships. None. |
Cynthia E. Frost
1961 | Trustee | Since 2014 | Private investor. Formerly, Chief Investment Officer of Brown University (university endowment) (2000-2012). Formerly, Portfolio Strategist for Duke Management Company (university endowment manager) (1995-2000). Formerly, Managing Director, Cambridge Associates (investment consulting company) (1989-1995). Formerly, Consultant, Bain and Company (management consulting firm) (1987-1989). Formerly, Senior Equity Analyst, BA Investment Management Company (1983-1985).
Other Directorships. None. |
George J. Gorman
1952 | Chairperson
of the Board
and Trustee | Since 2021
(Chairperson) and
2014 (Trustee) | Principal at George J. Gorman LLC (consulting firm). Formerly, Senior Partner at Ernst & Young LLP (a registered public accounting firm) (1974-2009).
Other Directorships. None. |
Eaton Vance
Dividend Builder Fund
December 31, 2022
Management and Organization — continued
| Name and Year of Birth | Trust
Position(s) | Length of Service | Principal Occupation(s) and Other Directorships
During Past Five Years and Other Relevant Experience |
| Noninterested Trustees (continued) |
Valerie A. Mosley
1960 | Trustee | Since 2014 | Chairwoman and Chief Executive Officer of Valmo Ventures (a consulting and investment firm). Founder of Upward Wealth, Inc., dba BrightUp, a fintech platform. Formerly, Partner and Senior Vice President, Portfolio Manager and Investment Strategist at Wellington Management Company, LLP (investment management firm) (1992-2012). Formerly, Chief Investment Officer, PG Corbin Asset Management (1990-1992). Formerly worked in institutional corporate bond sales at Kidder Peabody (1986-1990).
Other Directorships. Director of DraftKings, Inc. (digital sports entertainment and gaming company) (since September 2020). Director of Envestnet, Inc. (provider of intelligent systems for wealth management and financial wellness) (since 2018). Formerly, Director of Dynex Capital, Inc. (mortgage REIT) (2013-2020) and Director of Groupon, Inc. (e-commerce provider) (2020-2022). |
Keith Quinton
1958 | Trustee | Since 2018 | Private investor, researcher and lecturer. Formerly, Independent Investment Committee Member at New Hampshire Retirement System (2017-2021). Formerly, Portfolio Manager and Senior Quantitative Analyst at Fidelity Investments (investment management firm) (2001-2014).
Other Directorships. Formerly, Director (2016-2021) and Chairman (2019-2021) of New Hampshire Municipal Bond Bank. |
Marcus L. Smith
1966 | Trustee | Since 2018 | Private investor and independent corporate director. Formerly, Chief Investment Officer, Canada (2012-2017), Chief Investment Officer, Asia (2010-2012), Director of Asian Research (2004-2010) and portfolio manager (2001-2017) at MFS Investment Management (investment management firm).
Other Directorships. Director of First Industrial Realty Trust, Inc. (an industrial REIT) (since 2021). Director of MSCI Inc. (global provider of investment decision support tools) (since 2017). Formerly, Director of DCT Industrial Trust Inc. (logistics real estate company) (2017-2018). |
Susan J. Sutherland
1957 | Trustee | Since 2015 | Private investor. Director of Ascot Group Limited and certain of its subsidiaries (insurance and reinsurance) (since 2017). Formerly, Director of Hagerty Holding Corp. (insurance) (2015-2018) and Montpelier Re Holdings Ltd. (insurance and reinsurance) (2013-2015). Formerly, Associate, Counsel and Partner at Skadden, Arps, Slate, Meagher & Flom LLP (law firm) (1982-2013).
Other Directorships. Formerly, Director of Kairos Acquisition Corp. (insurance/InsurTech acquisition company) (2021-2023). |
Scott E. Wennerholm
1959 | Trustee | Since 2016 | Private investor. Formerly, Trustee at Wheelock College (postsecondary institution) (2012-2018). Formerly, Consultant at GF Parish Group (executive recruiting firm) (2016-2017). Formerly, Chief Operating Officer and Executive Vice President at BNY Mellon Asset Management (investment management firm) (2005-2011). Formerly, Chief Operating Officer and Chief Financial Officer at Natixis Global Asset Management (investment management firm) (1997-2004). Formerly, Vice President at Fidelity Investments Institutional Services (investment management firm) (1994-1997).
Other Directorships. None. |
Nancy A. Wiser(1)
1967 | Trustee | Since 2022 | Formerly, Executive Vice President and the Global Head of Operations at Wells Fargo Asset Management (2011-2021).
Other Directorships. None. |
| Name and Year of Birth | Trust
Position(s) | Length of Service | Principal Occupation(s)
During Past Five Years |
| Principal Officers who are not Trustees |
Eric A. Stein
1980 | President | Since 2020 | Vice President and Chief Investment Officer, Fixed Income of EVM and BMR. Prior to November 1, 2020, Mr. Stein was a co-Director of Eaton Vance’s Global Income Investments. Also Vice President of Calvert Research and Management (“CRM”). |
Deidre E. Walsh
1971 | Vice President and
Chief Legal Officer | Since 2009 | Vice President of EVM and BMR. Also Vice President of CRM. |
James F. Kirchner
1967 | Treasurer | Since 2007 | Vice President of EVM and BMR. Also Vice President of CRM. |
Eaton Vance
Dividend Builder Fund
December 31, 2022
Management and Organization — continued
| Name and Year of Birth | Trust
Position(s) | Length of Service | Principal Occupation(s)
During Past Five Years |
| Principal Officers who are not Trustees (continued) |
Nicholas Di Lorenzo
1987 | Secretary | Since 2022 | Formerly, associate (2012-2021) and counsel (2022) at Dechert LLP. |
Richard F. Froio
1968 | Chief Compliance
Officer | Since 2017 | Vice President of EVM and BMR since 2017. Formerly, Deputy Chief Compliance Officer (Adviser/Funds) and Chief Compliance Officer (Distribution) at PIMCO (2012-2017) and Managing Director at BlackRock/Barclays Global Investors (2009-2012). |
(1) Mr. Bowser and Ms. Wiser began serving as Trustees effective April 4, 2022.
The SAI for the Fund includes additional information about the Trustees and officers of the Fund and can be obtained without charge on Eaton Vance’s website at www.eatonvance.com or by calling 1-800-262-1122.
| FACTS | WHAT DOES EATON VANCE DO WITH YOUR
PERSONAL INFORMATION? |
| Why? | Financial companies choose how they share your personal information. Federal law gives consumers the right to limit some but not all sharing. Federal law also requires us to tell you how we collect, share, and protect your personal information. Please read this notice carefully to understand what we do. |
| |
| What? | The types of personal information we collect and share depend on the product or service you have with us. This information can include:■ Social Security number and income
■ investment experience and risk tolerance
■ checking account number and wire transfer instructions |
| |
| How? | All financial companies need to share customers’ personal information to run their everyday business. In the section below, we list the reasons financial companies can share their customers’ personal information; the reasons Eaton Vance chooses to share; and whether you can limit this sharing. |
Reasons we can share your
personal information | Does Eaton Vance
share? | Can you limit
this sharing? |
| For our everyday business purposes — such as to process your transactions, maintain your account(s), respond to court orders and legal investigations, or report to credit bureaus | Yes | No |
| For our marketing purposes — to offer our products and services to you | Yes | No |
| For joint marketing with other financial companies | No | We don’t share |
| For our investment management affiliates’ everyday business purposes — information about your transactions, experiences, and creditworthiness | Yes | Yes |
| For our affiliates’ everyday business purposes — information about your transactions and experiences | Yes | No |
| For our affiliates’ everyday business purposes — information about your creditworthiness | No | We don’t share |
| For our investment management affiliates to market to you | Yes | Yes |
| For our affiliates to market to you | No | We don’t share |
| For nonaffiliates to market to you | No | We don’t share |
To limit our
sharing | Call toll-free 1-800-262-1122 or email: EVPrivacy@eatonvance.comPlease note:If you are a new customer, we can begin sharing your information 30 days from the date we sent this notice. When you are no longer our customer, we continue to share your information as described in this notice. However, you can contact us at any time to limit our sharing. |
| Questions? | Call toll-free 1-800-262-1122 or email: EVPrivacy@eatonvance.com |
| Privacy Notice — continued | April 2021 |
| Who we are |
| Who is providing this notice? | Eaton Vance Management, Eaton Vance Distributors, Inc., Eaton Vance Trust Company, Eaton Vance Management (International) Limited, Eaton Vance Advisers International Ltd., Eaton Vance Global Advisors Limited, Eaton Vance Management’s Real Estate Investment Group, Boston Management and Research, Calvert Research and Management, Eaton Vance and Calvert Fund Families and our investment advisory affiliates (“Eaton Vance”) (see Investment Management Affiliates definition below) |
| What we do |
How does Eaton Vance
protect my personal
information? | To protect your personal information from unauthorized access and use, we use security measures that comply with federal law. These measures include computer safeguards and secured files and buildings. We have policies governing the proper handling of customer information by personnel and requiring third parties that provide support to adhere to appropriate security standards with respect to such information. |
How does Eaton Vance
collect my personal
information? | We collect your personal information, for example, when you■ open an account or make deposits or withdrawals from your account
■ buy securities from us or make a wire transfer
■ give us your contact informationWe also collect your personal information from others, such as credit bureaus, affiliates, or other companies. |
| Why can’t I limit all sharing? | Federal law gives you the right to limit only■ sharing for affiliates’ everyday business purposes — information about your creditworthiness
■ affiliates from using your information to market to you
■ sharing for nonaffiliates to market to youState laws and individual companies may give you additional rights to limit sharing. See below for more on your rights under state law. |
| Definitions |
Investment Management
Affiliates | Eaton Vance Investment Management Affiliates include registered investment advisers, registered broker- dealers, and registered and unregistered funds. Investment Management Affiliates does not include entities associated with Morgan Stanley Wealth Management, such as Morgan Stanley Smith Barney LLC and Morgan Stanley & Co. |
| Affiliates | Companies related by common ownership or control. They can be financial and nonfinancial companies.■ Our affiliates include companies with a Morgan Stanley name and financial companies such as Morgan Stanley Smith Barney LLC and Morgan Stanley & Co. |
| Nonaffiliates | Companies not related by common ownership or control. They can be financial and nonfinancial companies.■ Eaton Vance does not share with nonaffiliates so they can market to you. |
| Joint marketing | A formal agreement between nonaffiliated financial companies that together market financial products or services to you.■ Eaton Vance doesn’t jointly market. |
| Other important information |
| Vermont: Except as permitted by law, we will not share personal information we collect about Vermont residents with Nonaffiliates unless you provide us with your written consent to share such information.California: Except as permitted by law, we will not share personal information we collect about California residents with Nonaffiliates and we will limit sharing such personal information with our Affiliates to comply with California privacy laws that apply to us. |
Delivery of Shareholder Documents. The Securities and Exchange Commission (SEC) permits funds to deliver only one copy of shareholder documents, including prospectuses, proxy statements and shareholder reports, to fund investors with multiple accounts at the same residential or post office box address. This practice is often called “householding” and it helps eliminate duplicate mailings to shareholders. Eaton Vance, or your financial intermediary, may household the mailing of your documents indefinitely unless you instruct Eaton Vance, or your financial intermediary, otherwise. If you would prefer that your Eaton Vance documents not be householded, please contact Eaton Vance at 1-800-262-1122, or contact your financial intermediary. Your instructions that householding not apply to delivery of your Eaton Vance documents will typically be effective within 30 days of receipt by Eaton Vance or your financial intermediary.
Portfolio Holdings. Each Eaton Vance Fund and its underlying Portfolio(s) (if applicable) files a schedule of portfolio holdings on Part F to Form N-PORT with the SEC. Certain information filed on Form N-PORT may be viewed on the Eaton Vance website at www.eatonvance.com, by calling Eaton Vance at 1-800-262-1122 or in the EDGAR database on the SEC’s website at www.sec.gov.
Proxy Voting. From time to time, funds are required to vote proxies related to the securities held by the funds. The Eaton Vance Funds or their underlying Portfolios (if applicable) vote proxies according to a set of policies and procedures approved by the Funds’ and Portfolios’ Boards. You may obtain a description of these policies and procedures and information on how the Funds or Portfolios voted proxies relating to portfolio securities during the most recent 12-month period ended June 30, without charge, upon request, by calling 1-800-262-1122 and by accessing the SEC’s website at www.sec.gov.
This Page Intentionally Left Blank
This Page Intentionally Left Blank
Investment Adviser
Boston Management and Research
Two International Place
Boston, MA 02110
Administrator
Eaton Vance Management
Two International Place
Boston, MA 02110
Principal Underwriter*
Eaton Vance Distributors, Inc.
Two International Place
Boston, MA 02110
(617) 482-8260
Custodian
State Street Bank and Trust Company
State Street Financial Center, One Lincoln Street
Boston, MA 02111
Transfer Agent
BNY Mellon Investment Servicing (US) Inc.
Attn: Eaton Vance Funds
P.O. Box 534439
Pittsburgh, PA 15253-4439
(800) 262-1122
Independent Registered Public Accounting Firm
Deloitte & Touche LLP
200 Berkeley Street
Boston, MA 02116-5022
Fund Offices
Two International Place
Boston, MA 02110
* FINRA BrokerCheck. Investors may check the background of their Investment Professional by contacting the Financial Industry Regulatory Authority (FINRA). FINRA BrokerCheck is a free tool to help investors check the professional background of current and former FINRA-registered securities firms and brokers. FINRA BrokerCheck is available by calling 1-800-289-9999 and at www.FINRA.org. The FINRA BrokerCheck brochure describing this program is available to investors at www.FINRA.org.
Eaton Vance
Growth Fund
Annual Report
December 31, 2022
Commodity Futures Trading Commission Registration. The Commodity Futures Trading Commission (“CFTC”) has adopted regulations that subject registered investment companies and advisers to regulation by the CFTC if a fund invests more than a prescribed level of its assets in certain CFTC-regulated instruments (including futures, certain options and swap agreements) or markets itself as providing investment exposure to such instruments. The investment adviser has claimed an exclusion from the definition of “commodity pool operator” under the Commodity Exchange Act with respect to its management of the Fund. Accordingly, neither the Fund nor the adviser with respect to the operation of the Fund is subject to CFTC regulation. Because of its management of other strategies, the Fund's adviser is registered with the CFTC as a commodity pool operator. The adviser is also registered as a commodity trading advisor.
Fund shares are not insured by the FDIC and are not deposits or other obligations of, or guaranteed by, any depository institution. Shares are subject to investment risks, including possible loss of principal invested.
This report must be preceded or accompanied by a current summary prospectus or prospectus. Before investing, investors should consider carefully the investment objective, risks, and charges and expenses of a mutual fund. This and other important information is contained in the summary prospectus and prospectus, which can be obtained from a financial intermediary. Prospective investors should read the prospectus carefully before investing. For further information, please call 1-800-262-1122.
Annual Report December 31, 2022
Eaton Vance
Growth Fund
Eaton Vance
Growth Fund
December 31, 2022
Management’s Discussion of Fund Performance†
Economic and Market Conditions
During the 12-month period starting January 1, 2022, the U.S. equity market was dominated by the ongoing effects of one black swan event -- the COVID-19 pandemic -- and fallout from another -- Russia’s invasion of Ukraine.
As the new year began, investors became increasingly concerned about the twin threats of inflation and interest rate hikes. As a result, stock performance turned negative -- a sharp about-face from the all-time highs many U.S. equity indexes had posted in late 2021.
In February, Russia’s invasion of Ukraine sent shock waves through U.S. and global markets, exacerbating inflationary pressures on energy and food costs. The U.S. Federal Reserve (the Fed) -- along with other central banks around the world -- initiated its first interest rate hikes in years.
Investors began to expect the Fed would raise interest rates at every policy meeting in 2022 and, in turn, worried that aggressive rate hikes could tip the economy into recession. At its June, July, September, and November 2022 policy meetings, the Fed hiked the federal funds rate 0.75% each time -- its first moves of that magnitude since 1994. Higher interest rates, inflation, and recessionary worries drove stock prices down, with rate-sensitive technology stocks -- star performers earlier in the pandemic -- suffering some of the worst declines.
In October and November 2022, however, U.S. stocks delivered positive performance for the first time in months. The rally was driven by a combination of better-than-expected company earnings, declining inflation, and hope that the Fed would temper the size of future rate hikes.
But while the Fed indeed delivered a smaller 0.50% rate hike in December, it raised its expectation of how high rates might go in 2023. As investors digested the news that rates could stay higher for longer than previously expected, equity prices declined in the final month of 2022.
For the period as a whole, the blue-chip Dow Jones Industrial Average® returned -6.86%; the S&P 500® Index, a broad measure of U.S. stocks, returned -18.11%; and the technology-laden Nasdaq Composite Index returned -32.54%.
Fund Performance
For the 12-month period ended December 31, 2022, Eaton Vance Growth Fund (the Fund) returned -29.63% for Class A shares at net asset value (NAV), underperforming its benchmark, the Russell 1000® Growth Index (the Index), which returned -29.14%.
On an individual stock basis, the largest detractors from Fund performance versus the Index during the period were overweight positions in Micron Technology, Inc. (Micron) and PayPal Holdings, Inc. (PayPal).
Semiconductor producer Micron’s stock price retreated as demand declined for consumer electronics and personal computers that use Micron chips. As the global economy reopened after pandemic lockdowns and consumer spending shifted from products to services, the swift change in consumption patterns caused a decline in memory chip prices that hurt Micron’s earnings during the period.
PayPal’s share price declined as the online payments provider faced increased competition during the period and altered its business model to focus on fewer, but higher profit-margin users. Like Micron, PayPal was also hurt by shifting consumption patterns as the economy reopened: business increased at brick-and-mortar stores and restaurants and declined for online shopping and food delivery, where PayPal usage was more common.
On a sector basis, stock selections in the information technology sector; an overweight position in the communication services sector; and stock selections and an underweight position in the materials sector detracted from Fund performance versus the Index during the period.
In contrast, the largest individual stock contributors to Fund performance relative to the Index included an underweight position in Tesla, Inc. (Tesla) and an overweight position in Visa, Inc. (Visa).
Underweighting Tesla helped relative returns as the electric car maker’s stock price sank during the period. Lower consumer demand for automobiles, price cuts in response to increased competition, and the exceedingly high valuation the stock had reached earlier all weighed on Tesla’s share price. Investors were also concerned that Tesla CEO Elon Musk’s attention was being diverted by his purchase of social media firm Twitter.
While the share price of credit card giant Visa declined during the period, the stock nonetheless outperformed the Index and helped relative returns. Despite competition from new age financial technology -- fintech -- companies, Visa’s digital payments business grew during the period, benefiting particularly from a rebound in travel spending, which tends to produce higher fees and profit margins than domestic credit card spending.
On a sector basis, contributors to performance versus the Index during the period included stock selections and an underweight position in the consumer discretionary sector; stock selections and an overweight position in the financials sector; and stock selections in the consumer staples sector.
See Endnotes and Additional Disclosures in this report.
Past performance is no guarantee of future results. Returns are historical and are calculated by determining the percentage change in net asset value (NAV) or offering price (as applicable) with all distributions reinvested. Furthermore, returns do not reflect the deduction of taxes that shareholders may have to pay on Fund distributions or upon the redemption of Fund shares. Investment return and principal value will fluctuate so that shares, when redeemed, may be worth more or less than their original cost. Performance for periods less than or equal to one year is cumulative. Performance is for the stated time period only; due to market volatility, current Fund performance may be lower or higher than the quoted return. For performance as of the most recent month-end, please refer to eatonvance.com.
Eaton Vance
Growth Fund
December 31, 2022
Performance
Portfolio Manager(s) Douglas R. Rogers, CFA, CMT
| % Average Annual Total Returns1,2 | Class
Inception Date | Performance
Inception Date | One Year | Five Years | Ten Years |
| Class A at NAV | 09/09/2002 | 09/09/2002 | (29.63)% | 8.58% | 12.35% |
| Class A with 5.25% Maximum Sales Charge | — | — | (33.32) | 7.41 | 11.74 |
| Class C at NAV | 09/09/2002 | 09/09/2002 | (30.15) | 7.77 | 11.67 |
| Class C with 1% Maximum Deferred Sales Charge | — | — | (30.80) | 7.77 | 11.67 |
| Class I at NAV | 05/03/2007 | 09/09/2002 | (29.47) | 8.85 | 12.62 |
| Class R at NAV | 08/03/2009 | 09/09/2002 | (29.82) | 8.29 | 12.06 |
|
| Russell 1000® Growth Index | — | — | (29.14)% | 10.95% | 14.09% |
| % Total Annual Operating Expense Ratios3 | Class A | Class C | Class I | Class R |
| | 1.05% | 1.80% | 0.80% | 1.30% |
Growth of $10,000
This graph shows the change in value of a hypothetical investment of $10,000 in Class A of the Fund for the period indicated. For comparison, the same investment is shown in the indicated index.
| Growth of Investment | Amount Invested | Period Beginning | At NAV | With Maximum Sales Charge |
| Class C | $10,000 | 12/31/2012 | $30,175 | N.A. |
| Class I, at minimum investment | $1,000,000 | 12/31/2012 | $3,284,585 | N.A. |
| Class R | $10,000 | 12/31/2012 | $31,233 | N.A. |
See Endnotes and Additional Disclosures in this report.
Past performance is no guarantee of future results. Returns are historical and are calculated by determining the percentage change in net asset value (NAV) or offering price (as applicable) with all distributions reinvested. Furthermore, returns do not reflect the deduction of taxes that shareholders may have to pay on Fund distributions or upon the redemption of Fund shares. Investment return and principal value will fluctuate so that shares, when redeemed, may be worth more or less than their original cost. Performance for periods less than or equal to one year is cumulative. Performance is for the stated time period only; due to market volatility, current Fund performance may be lower or higher than the quoted return. For performance as of the most recent month-end, please refer to eatonvance.com.
Eaton Vance
Growth Fund
December 31, 2022
| Sector Allocation (% of net assets)1 |
| Top 10 Holdings (% of net assets)1 |
| Microsoft Corp. | 8.2% |
| Apple, Inc. | 7.1 |
| Visa, Inc., Class A | 6.4 |
| Amazon.com, Inc. | 5.7 |
| Alphabet, Inc., Class A | 5.2 |
| TJX Cos., Inc. (The) | 3.2 |
| Adobe, Inc. | 3.0 |
| Intuit, Inc. | 2.8 |
| Coca-Cola Co. (The) | 2.6 |
| Texas Instruments, Inc. | 2.6 |
| Total | 46.8% |
Footnotes:
| 1 | Excludes cash and cash equivalents. |
Eaton Vance
Growth Fund
December 31, 2022
Endnotes and Additional Disclosures
| † | The views expressed in this report are those of the portfolio manager(s) and are current only through the date stated at the top of this page. These views are subject to change at any time based upon market or other conditions, and Eaton Vance and the Fund(s) disclaim any responsibility to update such views. These views may not be relied upon as investment advice and, because investment decisions are based on many factors, may not be relied upon as an indication of trading intent on behalf of any Eaton Vance fund. This commentary may contain statements that are not historical facts, referred to as “forward-looking statements.” The Fund’s actual future results may differ significantly from those stated in any forward-looking statement, depending on factors such as changes in securities or financial markets or general economic conditions, the volume of sales and purchases of Fund shares, the continuation of investment advisory, administrative and service contracts, and other risks discussed from time to time in the Fund’s filings with the Securities and Exchange Commission. |
| | |
| 1 | Russell 1000® Growth Index is an unmanaged index of U.S. large-cap growth stocks. Unless otherwise stated, index returns do not reflect the effect of any applicable sales charges, commissions, expenses, taxes or leverage, as applicable. It is not possible to invest directly in an index. |
| 2 | Total Returns at NAV do not include applicable sales charges. If sales charges were deducted, the returns would be lower. Total Returns shown with maximum sales charge reflect the stated maximum sales charge. Unless otherwise stated, performance does not reflect the deduction of taxes on Fund distributions or redemptions of Fund shares.Effective November 5, 2020, Class C shares automatically convert to Class A shares eight years after purchase. The average annual total returns listed for Class C reflect conversion to Class A shares after eight years. Prior to November 5, 2020, Class C shares automatically converted to Class A shares ten years after purchase. |
| 3 | Source: Fund prospectus. Net expense ratios reflect a contractual expense reimbursement that continues through 4/30/23. The expense ratios for the current reporting period can be found in the Financial Highlights section of this report. Performance reflects expenses waived and/or reimbursed, if applicable. Without such waivers and/or reimbursements, performance would have been lower. |
| | Fund profile subject to change due to active management. |
| | Additional Information |
| | S&P 500® Index is an unmanaged index of large-cap stocks commonly used as a measure of U.S. stock market performance. Dow Jones Industrial Average® is a price-weighted average of 30 blue-chip stocks that are generally the leaders in their industry. S&P Dow Jones Indices are a product of S&P Dow Jones Indices LLC (“S&P DJI”) and have been licensed for use. S&P® and S&P 500® are registered trademarks of S&P DJI; Dow Jones® is a registered trademark of Dow Jones Trademark Holdings LLC (“Dow Jones”); S&P DJI, Dow Jones and their respective affiliates do not sponsor, endorse, sell or promote the Fund, will not have any liability with respect thereto and do not have any liability for any errors, omissions, or interruptions of the S&P Dow Jones Indices. Nasdaq Composite Index is a market capitalization-weighted index of all domestic and international securities listed on Nasdaq. Source: Nasdaq, Inc. The information is provided by Nasdaq (with its affiliates, are referred to as the “Corporations”) and Nasdaq’s third party licensors on an “as is” basis and the Corporations make no guarantees and bear no liability of any kind with respect to the information or the Fund. |
Eaton Vance
Growth Fund
December 31, 2022
Example
As a Fund shareholder, you incur two types of costs: (1) transaction costs, including sales charges (loads) on purchases; and (2) ongoing costs, including management fees; distribution and/or service fees; and other Fund expenses. This Example is intended to help you understand your ongoing costs (in dollars) of Fund investing and to compare these costs with the ongoing costs of investing in other mutual funds. The Example is based on an investment of $1,000 invested at the beginning of the period and held for the entire period (July 1, 2022 to December 31, 2022).
Actual Expenses
The first section of the table below provides information about actual account values and actual expenses. You may use the information in this section, together with the amount you invested, to estimate the expenses that you paid over the period. Simply divide your account value by $1,000 (for example, an $8,600 account value divided by $1,000 = 8.6), then multiply the result by the number in the first section under the heading entitled “Expenses Paid During Period” to estimate the expenses you paid on your account during this period.
Hypothetical Example for Comparison Purposes
The second section of the table below provides information about hypothetical account values and hypothetical expenses based on the actual Fund expense ratio and an assumed rate of return of 5% per year (before expenses), which is not the actual Fund return. The hypothetical account values and expenses may not be used to estimate the actual ending account balance or expenses you paid for the period. You may use this information to compare the ongoing costs of investing in your Fund and other funds. To do so, compare this 5% hypothetical example with the 5% hypothetical examples that appear in the shareholder reports of the other funds.
Please note that the expenses shown in the table are meant to highlight your ongoing costs only and do not reflect any transactional costs, such as sales charges (loads). Therefore, the second section of the table is useful in comparing ongoing costs only, and will not help you determine the relative total costs of owning different funds. In addition, if these transactional costs were included, your costs would be higher.
| | Beginning
Account Value
(7/1/22) | Ending
Account Value
(12/31/22) | Expenses Paid
During Period*
(7/1/22 – 12/31/22) | Annualized
Expense
Ratio |
| Actual | | | | |
| Class A | $1,000.00 | $ 993.90 | $5.28** | 1.05% |
| Class C | $1,000.00 | $ 990.00 | $9.03** | 1.80% |
| Class I | $1,000.00 | $ 994.80 | $4.02** | 0.80% |
| Class R | $1,000.00 | $ 992.10 | $6.53** | 1.30% |
| |
| Hypothetical | | | | |
| (5% return per year before expenses) | | | | |
| Class A | $1,000.00 | $1,019.91 | $5.35** | 1.05% |
| Class C | $1,000.00 | $1,016.13 | $9.15** | 1.80% |
| Class I | $1,000.00 | $1,021.17 | $4.08** | 0.80% |
| Class R | $1,000.00 | $1,018.65 | $6.61** | 1.30% |
| * | Expenses are equal to the Fund's annualized expense ratio for the indicated Class, multiplied by the average account value over the period, multiplied by 184/365 (to reflect the one-half year period). The Example assumes that the $1,000 was invested at the net asset value per share determined at the close of business on June 30, 2022. |
| ** | Absent an allocation of certain expenses to an affiliate, expenses would be higher. |
Eaton Vance
Growth Fund
December 31, 2022
| Security | Shares | Value |
| Aerospace & Defense — 1.2% |
| Raytheon Technologies Corp. | | 33,313 | $ 3,361,948 |
| | | | $ 3,361,948 |
| Auto Components — 1.1% |
| Aptiv PLC(1) | | 31,603 | $ 2,943,187 |
| | | | $ 2,943,187 |
| Automobiles — 0.6% |
| Tesla, Inc.(1) | | 13,781 | $ 1,697,544 |
| | | | $ 1,697,544 |
| Beverages — 2.6% |
| Coca-Cola Co. (The) | | 116,531 | $ 7,412,537 |
| | | | $ 7,412,537 |
| Biotechnology — 2.3% |
| AbbVie, Inc. | | 40,381 | $ 6,525,973 |
| | | | $ 6,525,973 |
| Building Products — 0.9% |
| Trane Technologies PLC | | 15,069 | $ 2,532,948 |
| | | | $ 2,532,948 |
| Capital Markets — 3.6% |
| Charles Schwab Corp. (The) | | 59,703 | $ 4,970,872 |
| Goldman Sachs Group, Inc. (The) | | 9,136 | 3,137,120 |
| Intercontinental Exchange, Inc. | | 19,801 | 2,031,384 |
| | | | $ 10,139,376 |
| Chemicals — 0.3% |
| Ecolab, Inc. | | 4,701 | $ 684,278 |
| | | | $ 684,278 |
| Commercial Services & Supplies — 2.4% |
| Copart, Inc.(1) | | 51,105 | $ 3,111,783 |
| Waste Connections, Inc. | | 27,980 | 3,709,029 |
| | | | $ 6,820,812 |
| Electrical Equipment — 1.9% |
| AMETEK, Inc. | | 37,835 | $ 5,286,306 |
| | | | $ 5,286,306 |
| Security | Shares | Value |
| Electronic Equipment, Instruments & Components — 0.4% |
| Zebra Technologies Corp., Class A(1) | | 4,494 | $ 1,152,307 |
| | | | $ 1,152,307 |
| Entertainment — 1.7% |
| Netflix, Inc.(1) | | 10,016 | $ 2,953,518 |
| Walt Disney Co. (The)(1) | | 20,668 | 1,795,636 |
| | | | $ 4,749,154 |
| Food & Staples Retailing — 1.3% |
| Sysco Corp. | | 49,309 | $ 3,769,673 |
| | | | $ 3,769,673 |
| Food Products — 1.3% |
| Mondelez International, Inc., Class A | | 52,634 | $ 3,508,056 |
| | | | $ 3,508,056 |
| Health Care Equipment & Supplies — 3.3% |
| Abbott Laboratories | | 34,270 | $ 3,762,503 |
| Intuitive Surgical, Inc.(1) | | 21,119 | 5,603,927 |
| | | | $ 9,366,430 |
| Health Care Providers & Services — 2.4% |
| UnitedHealth Group, Inc. | | 12,582 | $ 6,670,725 |
| | | | $ 6,670,725 |
| Hotels, Restaurants & Leisure — 1.5% |
| Starbucks Corp. | | 43,318 | $ 4,297,146 |
| | | | $ 4,297,146 |
| Interactive Media & Services — 7.4% |
| Alphabet, Inc., Class A(1) | | 164,955 | $ 14,553,980 |
| Alphabet, Inc., Class C(1) | | 69,048 | 6,126,629 |
| | | | $ 20,680,609 |
| Internet & Direct Marketing Retail — 5.7% |
| Amazon.com, Inc.(1) | | 189,444 | $ 15,913,296 |
| | | | $ 15,913,296 |
| IT Services — 8.3% |
| Accenture PLC, Class A | | 11,892 | $ 3,173,261 |
| PayPal Holdings, Inc.(1) | | 30,166 | 2,148,423 |
| Visa, Inc., Class A | | 87,042 | 18,083,846 |
| | | | $ 23,405,530 |
7
See Notes to Financial Statements.
Eaton Vance
Growth Fund
December 31, 2022
Portfolio of Investments — continued
| Security | Shares | Value |
| Life Sciences Tools & Services — 3.3% |
| Agilent Technologies, Inc. | | 17,823 | $ 2,667,212 |
| Danaher Corp. | | 6,770 | 1,796,893 |
| Illumina, Inc.(1) | | 5,181 | 1,047,598 |
| Thermo Fisher Scientific, Inc. | | 6,921 | 3,811,326 |
| | | | $ 9,323,029 |
| Oil, Gas & Consumable Fuels — 1.2% |
| EOG Resources, Inc. | | 26,212 | $ 3,394,978 |
| | | | $ 3,394,978 |
| Pharmaceuticals — 2.4% |
| Eli Lilly & Co. | | 18,543 | $ 6,783,771 |
| | | | $ 6,783,771 |
| Real Estate Management & Development — 1.1% |
| FirstService Corp. | | 24,325 | $ 2,981,029 |
| | | | $ 2,981,029 |
| Road & Rail — 1.7% |
| CSX Corp. | | 100,471 | $ 3,112,591 |
| Uber Technologies, Inc.(1) | | 70,127 | 1,734,241 |
| | | | $ 4,846,832 |
| Semiconductors & Semiconductor Equipment — 8.3% |
| Lam Research Corp. | | 10,245 | $ 4,305,974 |
| Micron Technology, Inc. | | 80,793 | 4,038,034 |
| NVIDIA Corp. | | 19,473 | 2,845,784 |
| QUALCOMM, Inc. | | 44,546 | 4,897,387 |
| Texas Instruments, Inc. | | 43,947 | 7,260,923 |
| | | | $ 23,348,102 |
| Software — 18.1% |
| Adobe, Inc.(1) | | 24,684 | $ 8,306,906 |
| Bill.com Holdings, Inc.(1) | | 8,110 | 883,666 |
| Intuit, Inc. | | 20,132 | 7,835,777 |
| Microsoft Corp. | | 96,491 | 23,140,472 |
| NICE, Ltd. ADR(1)(2) | | 11,025 | 2,120,107 |
| Paycom Software, Inc.(1) | | 11,205 | 3,477,024 |
| Salesforce, Inc.(1) | | 25,764 | 3,416,049 |
| Zscaler, Inc.(1) | | 15,379 | 1,720,910 |
| | | | $ 50,900,911 |
| Specialty Retail — 4.5% |
| Home Depot, Inc. (The) | | 11,323 | $ 3,576,483 |
| Security | Shares | Value |
| Specialty Retail (continued) |
| TJX Cos., Inc. (The) | | 114,404 | $ 9,106,558 |
| | | | $ 12,683,041 |
| Technology Hardware, Storage & Peripherals — 8.1% |
| Apple, Inc. | | 153,618 | $ 19,959,586 |
| Logitech International S.A.(2) | | 45,503 | 2,832,562 |
| | | | $ 22,792,148 |
| Textiles, Apparel & Luxury Goods — 1.1% |
| NIKE, Inc., Class B | | 25,853 | $ 3,025,060 |
| | | | $ 3,025,060 |
Total Common Stocks
(identified cost $148,217,528) | | | $280,996,736 |
| Short-Term Investments — 1.2% |
| Security | Shares | Value |
| Morgan Stanley Institutional Liquidity Funds - Government Portfolio, Institutional Class, 4.11%(3) | | 344,907 | $ 344,907 |
Total Affiliated Fund
(identified cost $344,907) | | | $ 344,907 |
| Securities Lending Collateral — 1.1% |
| Security | Shares | Value |
| State Street Navigator Securities Lending Government Money Market Portfolio, 4.34%(4) | | 2,981,883 | $ 2,981,883 |
Total Securities Lending Collateral
(identified cost $2,981,883) | | | $ 2,981,883 |
Total Short-Term Investments
(identified cost $3,326,790) | | | $ 3,326,790 |
Total Investments — 101.2%
(identified cost $151,544,318) | | | $284,323,526 |
| Other Assets, Less Liabilities — (1.2)% | | | $ (3,487,980) |
| Net Assets — 100.0% | | | $280,835,546 |
8
See Notes to Financial Statements.
Eaton Vance
Growth Fund
December 31, 2022
Portfolio of Investments — continued
| The percentage shown for each investment category in the Portfolio of Investments is based on net assets. |
| (1) | Non-income producing security. |
| (2) | All or a portion of this security was on loan at December 31, 2022. The aggregate market value of securities on loan at December 31, 2022 was $4,380,267. |
| (3) | May be deemed to be an affiliated investment company. The rate shown is the annualized seven-day yield as of December 31, 2022. |
| (4) | Represents investment of cash collateral received in connection with securities lending. |
| Abbreviations: |
| ADR | – American Depositary Receipt |
9
See Notes to Financial Statements.
Eaton Vance
Growth Fund
December 31, 2022
Statement of Assets and Liabilities
| | December 31, 2022 |
| Assets | |
| Unaffiliated investments, at value (identified cost $151,199,411) — including $4,380,267 of securities on loan | $ 283,978,619 |
| Affiliated investment, at value (identified cost $344,907) | 344,907 |
| Cash | 10,202 |
| Dividends receivable | 61,783 |
| Dividends receivable from affiliated investment | 1,923 |
| Receivable for Fund shares sold | 170,392 |
| Securities lending income receivable | 861 |
| Tax reclaims receivable | 31,006 |
| Receivable from affiliate | 20,500 |
| Total assets | $284,620,193 |
| Liabilities | |
| Collateral for securities loaned | $ 2,981,883 |
| Payable for Fund shares redeemed | 404,500 |
| Payable to affiliates: | |
| Investment adviser fee | 159,689 |
| Distribution and service fees | 54,162 |
| Trustees' fees | 5,985 |
| Accrued expenses | 178,428 |
| Total liabilities | $ 3,784,647 |
| Net Assets | $280,835,546 |
| Sources of Net Assets | |
| Paid-in capital | $ 148,055,321 |
| Distributable earnings | 132,780,225 |
| Net Assets | $280,835,546 |
| Class A Shares | |
| Net Assets | $ 213,877,975 |
| Shares Outstanding | 8,102,736 |
Net Asset Value and Redemption Price Per Share
(net assets ÷ shares of beneficial interest outstanding) | $ 26.40 |
Maximum Offering Price Per Share
(100 ÷ 94.75 of net asset value per share) | $ 27.86 |
| Class C Shares | |
| Net Assets | $ 7,353,814 |
| Shares Outstanding | 373,352 |
Net Asset Value and Offering Price Per Share*
(net assets ÷ shares of beneficial interest outstanding) | $ 19.70 |
| Class I Shares | |
| Net Assets | $ 57,480,597 |
| Shares Outstanding | 2,062,427 |
Net Asset Value, Offering Price and Redemption Price Per Share
(net assets ÷ shares of beneficial interest outstanding) | $ 27.87 |
10
See Notes to Financial Statements.
Eaton Vance
Growth Fund
December 31, 2022
Statement of Assets and Liabilities — continued
| | December 31, 2022 |
| Class R Shares | |
| Net Assets | $2,123,160 |
| Shares Outstanding | 84,439 |
Net Asset Value, Offering Price and Redemption Price Per Share
(net assets ÷ shares of beneficial interest outstanding) | $ 25.14 |
| On sales of $50,000 or more, the offering price of Class A shares is reduced. |
| * | Redemption price per share is equal to the net asset value less any applicable contingent deferred sales charge. |
11
See Notes to Financial Statements.
Eaton Vance
Growth Fund
December 31, 2022
| | Year Ended |
| | December 31, 2022 |
| Investment Income | |
| Dividend income (net of foreign taxes withheld of $12,804) | $ 3,229,822 |
| Dividend income from affiliated investments | 12,230 |
| Securities lending income, net | 10,462 |
| Total investment income | $ 3,252,514 |
| Expenses | |
| Investment adviser fee | $ 2,184,636 |
| Distribution and service fees: | |
| Class A | 627,090 |
| Class C | 98,888 |
| Class R | 11,506 |
| Trustees’ fees and expenses | 23,571 |
| Custodian fee | 83,051 |
| Transfer and dividend disbursing agent fees | 307,209 |
| Legal and accounting services | 52,426 |
| Printing and postage | 32,806 |
| Registration fees | 63,553 |
| Miscellaneous | 23,026 |
| Total expenses | $ 3,507,762 |
| Deduct: | |
| Waiver and/or reimbursement of expenses by affiliates | $ 93,563 |
| Total expense reductions | $ 93,563 |
| Net expenses | $ 3,414,199 |
| Net investment loss | $ (161,685) |
| Realized and Unrealized Gain (Loss) | |
| Net realized gain (loss): | |
| Investment transactions | $ 9,888,032 |
| Investment transactions - affiliated investments | (142) |
| Net realized gain | $ 9,887,890 |
| Change in unrealized appreciation (depreciation): | |
| Investments | $ (139,450,037) |
| Net change in unrealized appreciation (depreciation) | $(139,450,037) |
| Net realized and unrealized loss | $(129,562,147) |
| Net decrease in net assets from operations | $(129,723,832) |
12
See Notes to Financial Statements.
Eaton Vance
Growth Fund
December 31, 2022
Statements of Changes in Net Assets
| | Year Ended December 31, |
| | 2022 | 2021 |
| Increase (Decrease) in Net Assets | | |
| From operations: | | |
| Net investment loss | $ (161,685) | $ (1,207,036) |
| Net realized gain | 9,887,890 | 42,987,786 |
| Net change in unrealized appreciation (depreciation) | (139,450,037) | 35,102,108 |
| Net increase (decrease) in net assets from operations | $(129,723,832) | $ 76,882,858 |
| Distributions to shareholders: | | |
| Class A | $ (11,782,056) | $ (26,394,413) |
| Class C | (552,977) | (1,466,142) |
| Class I | (3,054,347) | (7,573,390) |
| Class R | (120,830) | (248,220) |
| Total distributions to shareholders | $ (15,510,210) | $ (35,682,165) |
| Transactions in shares of beneficial interest: | | |
| Class A | $ (8,297,402) | $ (358,309) |
| Class C | (2,399,535) | (2,760,102) |
| Class I | (11,413,848) | 8,559,140 |
| Class R | 98,948 | 192,726 |
| Net increase (decrease) in net assets from Fund share transactions | $ (22,011,837) | $ 5,633,455 |
| Net increase (decrease) in net assets | $(167,245,879) | $ 46,834,148 |
| Net Assets | | |
| At beginning of year | $ 448,081,425 | $ 401,247,277 |
| At end of year | $ 280,835,546 | $448,081,425 |
13
See Notes to Financial Statements.
Eaton Vance
Growth Fund
December 31, 2022
| | Class A |
| | Year Ended December 31, |
| | 2022 | 2021 | 2020 | 2019 | 2018 |
| Net asset value — Beginning of year | $ 39.590 | $ 35.930 | $ 28.130 | $ 23.610 | $ 26.650 |
| Income (Loss) From Operations | | | | | |
| Net investment loss(1) | $ (0.024) | $ (0.120) | $ (0.098) | $ (0.037) | $ (0.034) |
| Net realized and unrealized gain (loss) | (11.650) | 7.140 | 10.409 | 7.095 | 0.301 |
| Total income (loss) from operations | $ (11.674) | $ 7.020 | $ 10.311 | $ 7.058 | $ 0.267 |
| Less Distributions | | | | | |
| From net realized gain | $ (1.516) | $ (3.360) | $ (2.511) | $ (2.538) | $ (3.307) |
| Total distributions | $ (1.516) | $ (3.360) | $ (2.511) | $ (2.538) | $ (3.307) |
| Net asset value — End of year | $ 26.400 | $ 39.590 | $ 35.930 | $ 28.130 | $ 23.610 |
| Total Return(2)(3) | (29.63)% | 19.62% | 37.16% | 30.38% | 0.27% |
| Ratios/Supplemental Data | | | | | |
| Net assets, end of year (000’s omitted) | $213,878 | $330,230 | $299,834 | $236,457 | $190,017 |
| Ratios (as a percentage of average daily net assets):(4) | | | | | |
| Expenses (3) | 1.05% (5) | 1.05% | 1.05% | 1.05% | 1.05% |
| Net investment loss | (0.08)% | (0.30)% | (0.32)% | (0.14)% | (0.12)% |
| Portfolio Turnover of the Portfolio(6) | — | — | — | — | 20% (7) |
| Portfolio Turnover of the Fund | 12% | 21% | 37% | 40% | 28% (7)(8) |
| (1) | Computed using average shares outstanding. |
| (2) | Returns are historical and are calculated by determining the percentage change in net asset value with all distributions reinvested and do not reflect the effect of sales charges. |
| (3) | The administrator reimbursed certain operating expenses (equal to 0.03%, less than 0.005%, 0.04%, 0.04% and 0.04% of average daily net assets for the years ended December 31, 2022, 2021, 2020, 2019 and 2018, respectively). Absent this reimbursement, total return would be lower. |
| (4) | Includes the Fund’s share of the Portfolio’s allocated expenses for the period while the Fund was investing in the Portfolio. |
| (5) | Includes a reduction by the investment adviser of a portion of its adviser fee due to the Fund’s investment in the Liquidity Fund (equal to less than 0.005% of average daily net assets for the year ended December 31, 2022). |
| (6) | Portfolio turnover represents the rate of portfolio activity for the period while the Fund was investing in the Portfolio. |
| (7) | Not annualized. |
| (8) | For the period from May 14, 2018 through December 31, 2018 when the Fund was making investments directly in securities. |
References to Portfolio herein are to Growth Portfolio, a Massachusetts business trust in which the Fund invested all of its investable assets prior to the close of business on May 11, 2018 and which had the same investment objective and policies as the Fund during such period.
14
See Notes to Financial Statements.
Eaton Vance
Growth Fund
December 31, 2022
Financial Highlights — continued
| | Class C |
| | Year Ended December 31, |
| | 2022 | 2021 | 2020 | 2019 | 2018 |
| Net asset value — Beginning of year | $ 30.290 | $ 28.370 | $ 22.790 | $ 19.660 | $ 22.870 |
| Income (Loss) From Operations | | | | | |
| Net investment loss(1) | $ (0.197) | $ (0.326) | $ (0.261) | $ (0.206) | $ (0.214) |
| Net realized and unrealized gain (loss) | (8.877) | 5.606 | 8.352 | 5.874 | 0.311 |
| Total income (loss) from operations | $ (9.074) | $ 5.280 | $ 8.091 | $ 5.668 | $ 0.097 |
| Less Distributions | | | | | |
| From net realized gain | $ (1.516) | $ (3.360) | $ (2.511) | $ (2.538) | $ (3.307) |
| Total distributions | $ (1.516) | $ (3.360) | $ (2.511) | $ (2.538) | $ (3.307) |
| Net asset value — End of year | $19.700 | $30.290 | $28.370 | $22.790 | $19.660 |
| Total Return(2)(3) | (30.15)% | 18.70% | 36.17% | 29.35% | (0.43)% |
| Ratios/Supplemental Data | | | | | |
| Net assets, end of year (000’s omitted) | $ 7,354 | $ 14,409 | $ 16,026 | $ 17,501 | $ 35,061 |
| Ratios (as a percentage of average daily net assets):(4) | | | | | |
| Expenses (3) | 1.80% (5) | 1.80% | 1.80% | 1.80% | 1.80% |
| Net investment loss | (0.83)% | (1.05)% | (1.06)% | (0.91)% | (0.87)% |
| Portfolio Turnover of the Portfolio(6) | — | — | — | — | 20% (7) |
| Portfolio Turnover of the Fund | 12% | 21% | 37% | 40% | 28% (7)(8) |
| (1) | Computed using average shares outstanding. |
| (2) | Returns are historical and are calculated by determining the percentage change in net asset value with all distributions reinvested and do not reflect the effect of sales charges. |
| (3) | The administrator reimbursed certain operating expenses (equal to 0.03%, less than 0.005%, 0.04%, 0.04% and 0.04% of average daily net assets for the years ended December 31, 2022, 2021, 2020, 2019 and 2018, respectively). Absent this reimbursement, total return would be lower. |
| (4) | Includes the Fund’s share of the Portfolio’s allocated expenses for the period while the Fund was investing in the Portfolio. |
| (5) | Includes a reduction by the investment adviser of a portion of its adviser fee due to the Fund’s investment in the Liquidity Fund (equal to less than 0.005% of average daily net assets for the year ended December 31, 2022). |
| (6) | Portfolio turnover represents the rate of portfolio activity for the period while the Fund was investing in the Portfolio. |
| (7) | Not annualized. |
| (8) | For the period from May 14, 2018 through December 31, 2018 when the Fund was making investments directly in securities. |
References to Portfolio herein are to Growth Portfolio, a Massachusetts business trust in which the Fund invested all of its investable assets prior to the close of business on May 11, 2018 and which had the same investment objective and policies as the Fund during such period.
15
See Notes to Financial Statements.
Eaton Vance
Growth Fund
December 31, 2022
Financial Highlights — continued
| | Class I |
| | Year Ended December 31, |
| | 2022 | 2021 | 2020 | 2019 | 2018 |
| Net asset value — Beginning of year | $ 41.580 | $ 37.500 | $ 29.200 | $ 24.380 | $ 27.340 |
| Income (Loss) From Operations | | | | | |
| Net investment income (loss)(1) | $ 0.055 | $ (0.023) | $ (0.022) | $ 0.029 | $ 0.040 |
| Net realized and unrealized gain (loss) | (12.249) | 7.463 | 10.833 | 7.329 | 0.307 |
| Total income (loss) from operations | $(12.194) | $ 7.440 | $10.811 | $ 7.358 | $ 0.347 |
| Less Distributions | | | | | |
| From net realized gain | $ (1.516) | $ (3.360) | $ (2.511) | $ (2.538) | $ (3.307) |
| Total distributions | $ (1.516) | $ (3.360) | $ (2.511) | $ (2.538) | $ (3.307) |
| Net asset value — End of year | $ 27.870 | $ 41.580 | $37.500 | $29.200 | $24.380 |
| Total Return(2)(3) | (29.47)% | 19.92% | 37.51% | 30.65% | 0.56% |
| Ratios/Supplemental Data | | | | | |
| Net assets, end of year (000’s omitted) | $ 57,481 | $100,423 | $ 82,887 | $ 65,646 | $ 78,812 |
| Ratios (as a percentage of average daily net assets):(4) | | | | | |
| Expenses (3) | 0.80% (5) | 0.80% | 0.80% | 0.80% | 0.80% |
| Net investment income (loss) | 0.17% | (0.05)% | (0.07)% | 0.10% | 0.14% |
| Portfolio Turnover of the Portfolio(6) | — | — | — | — | 20% (7) |
| Portfolio Turnover of the Fund | 12% | 21% | 37% | 40% | 28% (7)(8) |
| (1) | Computed using average shares outstanding. |
| (2) | Returns are historical and are calculated by determining the percentage change in net asset value with all distributions reinvested. |
| (3) | The administrator reimbursed certain operating expenses (equal to 0.03%, less than 0.005%, 0.04%, 0.04% and 0.04% of average daily net assets for the years ended December 31, 2022, 2021, 2020, 2019 and 2018, respectively). Absent this reimbursement, total return would be lower. |
| (4) | Includes the Fund’s share of the Portfolio’s allocated expenses for the period while the Fund was investing in the Portfolio. |
| (5) | Includes a reduction by the investment adviser of a portion of its adviser fee due to the Fund’s investment in the Liquidity Fund (equal to less than 0.005% of average daily net assets for the year ended December 31, 2022). |
| (6) | Portfolio turnover represents the rate of portfolio activity for the period while the Fund was investing in the Portfolio. |
| (7) | Not annualized. |
| (8) | For the period from May 14, 2018 through December 31, 2018 when the Fund was making investments directly in securities. |
References to Portfolio herein are to Growth Portfolio, a Massachusetts business trust in which the Fund invested all of its investable assets prior to the close of business on May 11, 2018 and which had the same investment objective and policies as the Fund during such period.
16
See Notes to Financial Statements.
Eaton Vance
Growth Fund
December 31, 2022
Financial Highlights — continued
| | Class R |
| | Year Ended December 31, |
| | 2022 | 2021 | 2020 | 2019 | 2018 |
| Net asset value — Beginning of year | $ 37.900 | $ 34.610 | $ 27.230 | $ 22.980 | $ 26.090 |
| Income (Loss) From Operations | | | | | |
| Net investment loss(1) | $ (0.096) | $ (0.214) | $ (0.166) | $ (0.105) | $ (0.104) |
| Net realized and unrealized gain (loss) | (11.148) | 6.864 | 10.057 | 6.893 | 0.301 |
| Total income (loss) from operations | $(11.244) | $ 6.650 | $ 9.891 | $ 6.788 | $ 0.197 |
| Less Distributions | | | | | |
| From net realized gain | $ (1.516) | $ (3.360) | $ (2.511) | $ (2.538) | $ (3.307) |
| Total distributions | $ (1.516) | $ (3.360) | $ (2.511) | $ (2.538) | $ (3.307) |
| Net asset value — End of year | $ 25.140 | $37.900 | $34.610 | $27.230 | $22.980 |
| Total Return(2)(3) | (29.82)% | 19.29% | 36.84% | 30.03% | 0.01% |
| Ratios/Supplemental Data | | | | | |
| Net assets, end of year (000’s omitted) | $ 2,123 | $ 3,020 | $ 2,501 | $ 2,264 | $ 3,030 |
| Ratios (as a percentage of average daily net assets):(4) | | | | | |
| Expenses (3) | 1.30% (5) | 1.30% | 1.30% | 1.30% | 1.30% |
| Net investment loss | (0.33)% | (0.56)% | (0.56)% | (0.39)% | (0.37)% |
| Portfolio Turnover of the Portfolio(6) | — | — | — | — | 20% (7) |
| Portfolio Turnover of the Fund | 12% | 21% | 37% | 40% | 28% (7)(8) |
| (1) | Computed using average shares outstanding. |
| (2) | Returns are historical and are calculated by determining the percentage change in net asset value with all distributions reinvested. |
| (3) | The administrator reimbursed certain operating expenses (equal to 0.03%, less than 0.005%, 0.04%, 0.04% and 0.04% of average daily net assets for the years ended December 31, 2022, 2021, 2020, 2019 and 2018, respectively). Absent this reimbursement, total return would be lower. |
| (4) | Includes the Fund’s share of the Portfolio’s allocated expenses for the period while the Fund was investing in the Portfolio. |
| (5) | Includes a reduction by the investment adviser of a portion of its adviser fee due to the Fund’s investment in the Liquidity Fund (equal to less than 0.005% of average daily net assets for the year ended December 31, 2022). |
| (6) | Portfolio turnover represents the rate of portfolio activity for the period while the Fund was investing in the Portfolio. |
| (7) | Not annualized. |
| (8) | For the period from May 14, 2018 through December 31, 2018 when the Fund was making investments directly in securities. |
References to Portfolio herein are to Growth Portfolio, a Massachusetts business trust in which the Fund invested all of its investable assets prior to the close of business on May 11, 2018 and which had the same investment objective and policies as the Fund during such period.
17
See Notes to Financial Statements.
Eaton Vance
Growth Fund
December 31, 2022
Notes to Financial Statements
1 Significant Accounting Policies
Eaton Vance Growth Fund (the Fund) is a non-diversified series of Eaton Vance Special Investment Trust (the Trust). The Trust is a Massachusetts business trust registered under the Investment Company Act of 1940, as amended (the 1940 Act), as an open-end management investment company. The Fund’s investment objective is to seek total return. The Fund offers four classes of shares. Class A shares are generally sold subject to a sales charge imposed at time of purchase. Class C shares are sold at net asset value and are generally subject to a contingent deferred sales charge (see Note 5). Effective November 5, 2020, Class C shares automatically convert to Class A shares eight years after their purchase as described in the Fund’s prospectus. Class I and Class R shares are sold at net asset value and are not subject to a sales charge. Each class represents a pro-rata interest in the Fund, but votes separately on class-specific matters and (as noted below) is subject to different expenses. Realized and unrealized gains and losses and net investment income and losses, other than class-specific expenses, are allocated daily to each class of shares based on the relative net assets of each class to the total net assets of the Fund. Each class of shares differs in its distribution plan and certain other class-specific expenses.
The following is a summary of significant accounting policies of the Fund. The policies are in conformity with accounting principles generally accepted in the United States of America (U.S. GAAP). The Fund is an investment company and follows accounting and reporting guidance in the Financial Accounting Standards Board (FASB) Accounting Standards Codification Topic 946.
A Investment Valuation—The following methodologies are used to determine the market value or fair value of investments.
Equity Securities. Equity securities listed on a U.S. securities exchange generally are valued at the last sale or closing price on the day of valuation or, if no sales took place on such date, at the mean between the closing bid and ask prices on the exchange where such securities are principally traded. Equity securities listed on the NASDAQ National Market System are valued at the NASDAQ official closing price. Unlisted or listed securities for which closing sales prices or closing quotations are not available are valued at the mean between the latest available bid and ask prices.
Foreign Securities and Currencies. Foreign securities and currencies are valued in U.S. dollars, based on foreign currency exchange rate quotations supplied by a third party pricing service. The pricing service uses a proprietary model to determine the exchange rate. Inputs to the model include reported trades and implied bid/ask spreads. The daily valuation of exchange-traded foreign securities generally is determined as of the close of trading on the principal exchange on which such securities trade. Events occurring after the close of trading on foreign exchanges may result in adjustments to the valuation of foreign securities to more accurately reflect their fair value as of the close of regular trading on the New York Stock Exchange. When valuing foreign equity securities that meet certain criteria, the Fund's Trustees have approved the use of a fair value service that values such securities to reflect market trading that occurs after the close of the applicable foreign markets of comparable securities or other instruments that have a strong correlation to the fair-valued securities.
Other. Investments in management investment companies (including money market funds) that do not trade on an exchange are valued at the net asset value as of the close of each business day.
Fair Valuation. In connection with Rule 2a-5 of the 1940 Act, which became effective September 8, 2022, the Trustees have designated the Fund’s investment adviser as its valuation designee. Investments for which valuations or market quotations are not readily available or are deemed unreliable are valued by the investment adviser, as valuation designee, at fair value using methods that most fairly reflect the security’s “fair value”, which is the amount that the Fund might reasonably expect to receive for the security upon its current sale in the ordinary course. Each such determination is based on a consideration of relevant factors, which are likely to vary from one pricing context to another. These factors may include, but are not limited to, the type of security, the existence of any contractual restrictions on the security’s disposition, the price and extent of public trading in similar securities of the issuer or of comparable companies or entities, quotations or relevant information obtained from broker/dealers or other market participants, information obtained from the issuer, analysts, and/or the appropriate stock exchange (for exchange-traded securities), an analysis of the company’s or entity’s financial statements, and an evaluation of the forces that influence the issuer and the market(s) in which the security is purchased and sold.
B Investment Transactions—Investment transactions for financial statement purposes are accounted for on a trade date basis. Realized gains and losses on investments sold are determined on the basis of identified cost.
C Income—Dividend income is recorded on the ex-dividend date for dividends received in cash and/or securities. However, if the ex-dividend date has passed, certain dividends from foreign securities are recorded as the Fund is informed of the ex-dividend date. Withholding taxes on foreign dividends and capital gains have been provided for in accordance with the Fund's understanding of the applicable countries’ tax rules and rates.
D Federal Taxes—The Fund's policy is to comply with the provisions of the Internal Revenue Code applicable to regulated investment companies and to distribute to shareholders each year substantially all of its net investment income, and all or substantially all of its net realized capital gains. Accordingly, no provision for federal income or excise tax is necessary.
As of December 31, 2022, the Fund had no uncertain tax positions that would require financial statement recognition, de-recognition, or disclosure. The Fund files a U.S. federal income tax return annually after its fiscal year-end, which is subject to examination by the Internal Revenue Service for a period of three years from the date of filing.
E Expenses—The majority of expenses of the Trust are directly identifiable to an individual fund. Expenses which are not readily identifiable to a specific fund are allocated taking into consideration, among other things, the nature and type of expense and the relative size of the funds.
Eaton Vance
Growth Fund
December 31, 2022
Notes to Financial Statements — continued
F Foreign Currency Translation—Investment valuations, other assets, and liabilities initially expressed in foreign currencies are translated each business day into U.S. dollars based upon current exchange rates. Purchases and sales of foreign investment securities and income and expenses denominated in foreign currencies are translated into U.S. dollars based upon currency exchange rates in effect on the respective dates of such transactions. Recognized gains or losses on investment transactions attributable to changes in foreign currency exchange rates are recorded for financial statement purposes as net realized gains and losses on investments. That portion of unrealized gains and losses on investments that results from fluctuations in foreign currency exchange rates is not separately disclosed.
G Use of Estimates—The preparation of the financial statements in conformity with U.S. GAAP requires management to make estimates and assumptions that affect the reported amounts of assets and liabilities at the date of the financial statements and the reported amounts of income and expense during the reporting period. Actual results could differ from those estimates.
H Indemnifications—Under the Trust’s organizational documents, its officers and Trustees may be indemnified against certain liabilities and expenses arising out of the performance of their duties to the Fund. Under Massachusetts law, if certain conditions prevail, shareholders of a Massachusetts business trust (such as the Trust) could be deemed to have personal liability for the obligations of the Trust. However, the Trust’s Declaration of Trust contains an express disclaimer of liability on the part of Fund shareholders and the By-laws provide that the Trust shall assume, upon request by the shareholder, the defense on behalf of any Fund shareholders. Moreover, the By-laws also provide for indemnification out of Fund property of any shareholder held personally liable solely by reason of being or having been a shareholder for all loss or expense arising from such liability. Additionally, in the normal course of business, the Fund enters into agreements with service providers that may contain indemnification clauses. The Fund’s maximum exposure under these arrangements is unknown as this would involve future claims that may be made against the Fund that have not yet occurred.
2 Distributions to Shareholders and Income Tax Information
It is the present policy of the Fund to make at least one distribution annually (normally in December) of all or substantially all of its net investment income and to distribute annually all or substantially all of its net realized capital gains. Distributions to shareholders are recorded on the ex-dividend date. Distributions are declared separately for each class of shares. Shareholders may reinvest income and capital gain distributions in additional shares of the same class of the Fund at the net asset value as of the ex-dividend date or, at the election of the shareholder, receive distributions in cash. Distributions to shareholders are determined in accordance with income tax regulations, which may differ from U.S. GAAP. As required by U.S. GAAP, only distributions in excess of tax basis earnings and profits are reported in the financial statements as a return of capital. Permanent differences between book and tax accounting relating to distributions are reclassified to paid-in capital. For tax purposes, distributions from short-term capital gains are considered to be from ordinary income.
The tax character of distributions declared for the years ended December 31, 2022 and December 31, 2021 was as follows:
| | Year Ended December 31, |
| | 2022 | 2021 |
| Ordinary income | $ — | $ 153,523 |
| Long-term capital gains | $15,510,210 | $35,528,642 |
During the year ended December 31, 2022, distributable earnings was decreased by $935,475 and paid-in capital was increased by $935,475 due to the Fund’s use of equalization accounting and differences between book and tax accounting for net operating losses. Tax equalization accounting allows the Fund to treat as a distribution that portion of redemption proceeds representing a redeeming shareholder’s portion of undistributed taxable income and net capital gains. These reclassifications had no effect on the net assets or net asset value per share of the Fund.
As of December 31, 2022, the components of distributable earnings (accumulated loss) on a tax basis were as follows:
| Undistributed long-term capital gains | $ 21,487 |
| Net unrealized appreciation | 132,758,738 |
| Distributable earnings | $132,780,225 |
Eaton Vance
Growth Fund
December 31, 2022
Notes to Financial Statements — continued
The cost and unrealized appreciation (depreciation) of investments of the Fund at December 31, 2022, as determined on a federal income tax basis, were as follows:
| Aggregate cost | $151,564,773 |
| Gross unrealized appreciation | $ 142,549,322 |
| Gross unrealized depreciation | (9,790,569) |
| Net unrealized appreciation | $132,758,753 |
3 Investment Adviser Fee and Other Transactions with Affiliates
The investment adviser fee is earned by Boston Management and Research (BMR), an indirect, wholly-owned subsidiary of Morgan Stanley, as compensation for investment advisory services rendered to the Fund. The fee is computed at an annual rate as a percentage of the Fund’s average daily net assets as follows and is payable monthly:
| Average Daily Net Assets | Annual Fee Rate |
| Up to $500 million | 0.650% |
| $500 million but less than $1 billion | 0.625% |
| $1 billion but less than $2.5 billion | 0.600% |
| $2.5 billion and over | 0.575% |
For the year ended December 31, 2022, the Fund’s investment adviser fee amounted to $2,184,636 or 0.65% of the Fund’s average daily net assets. Effective April 26, 2022, the Fund may invest in a money market fund, the Institutional Class of the Morgan Stanley Institutional Liquidity Funds - Government Portfolio (the “Liquidity Fund”), an open-end management investment company managed by Morgan Stanley Investment Management Inc., a wholly-owned subsidiary of Morgan Stanley. The investment adviser fee paid by the Fund is reduced by an amount equal to its pro-rata share of the advisory and administration fees paid by the Fund due to its investment in the Liquidity Fund. For the year ended December 31, 2022, the investment adviser fee paid was reduced by $803 relating to the Fund’s investment in the Liquidity Fund. Prior to April 26, 2022, the Fund may have invested its cash in Eaton Vance Cash Reserves Fund, LLC (Cash Reserves Fund), an affiliated investment company managed by Eaton Vance Management (EVM). EVM did not receive a fee for advisory services provided to Cash Reserves Fund.
EVM, an affiliate of BMR, serves as the administrator of the Fund, but receives no compensation. EVM has agreed to reimburse the Fund’s expenses to the extent that total annual operating expenses (relating to ordinary operating expenses only) exceed 1.05%, 1.80%, 0.80% and 1.30% of the Fund’s average daily net assets for Class A, Class C, Class I and Class R, respectively. This agreement may be changed or terminated after April 30, 2023. Pursuant to this agreement, EVM was allocated $92,760 of the Fund’s operating expenses for the year ended December 31, 2022.
EVM provides sub-transfer agency and related services to the Fund pursuant to a Sub-Transfer Agency Support Services Agreement. For the year ended December 31, 2022, EVM earned $97,029 from the Fund pursuant to such agreement, which is included in transfer and dividend disbursing agent fees on the Statement of Operations. The Fund was informed that Eaton Vance Distributors, Inc. (EVD), an affiliate of EVM and the Fund’s principal underwriter, received $6,463 as its portion of the sales charge on sales of Class A shares for the year ended December 31, 2022. EVD also received distribution and service fees from Class A, Class C and Class R shares (see Note 4) and contingent deferred sales charges (see Note 5).
Trustees and officers of the Fund who are members of EVM’s or BMR’s organizations receive remuneration for their services to the Fund out of the investment adviser fee. Trustees of the Fund who are not affiliated with the investment adviser may elect to defer receipt of all or a percentage of their annual fees in accordance with the terms of the Trustees Deferred Compensation Plan. For the year ended December 31, 2022, no significant amounts have been deferred. Certain officers and Trustees of the Fund are officers of the above organizations.
Eaton Vance
Growth Fund
December 31, 2022
Notes to Financial Statements — continued
4 Distribution Plans
The Fund has in effect a distribution plan for Class A shares (Class A Plan) pursuant to Rule 12b-1 under the 1940 Act. Pursuant to the Class A Plan, the Fund pays EVD a distribution and service fee of 0.25% per annum of its average daily net assets attributable to Class A shares for distribution services and facilities provided to the Fund by EVD, as well as for personal services and/or the maintenance of shareholder accounts. Distribution and service fees paid or accrued to EVD for the year ended December 31, 2022 amounted to $627,090 for Class A shares. The Fund also has in effect distribution plans for Class C shares (Class C Plan) and Class R shares (Class R Plan) pursuant to Rule 12b-1 under the 1940 Act. Pursuant to the Class C Plan, the Fund pays EVD amounts equal to 0.75% per annum of its average daily net assets attributable to Class C shares for providing ongoing distribution services and facilities to the Fund. For the year ended December 31, 2022, the Fund paid or accrued to EVD $74,166 for Class C shares. The Class R Plan requires the Fund to pay EVD an amount up to 0.50% per annum of its average daily net assets attributable to Class R shares for providing ongoing distribution services and facilities to the Fund. The Trustees of the Trust have currently limited Class R distribution payments to 0.25% per annum of the average daily net assets attributable to Class R shares. For the year ended December 31, 2022, the Fund paid or accrued to EVD $5,753 for Class R shares.
Pursuant to the Class C and Class R Plans, the Fund also makes payments of service fees to EVD, financial intermediaries and other persons in amounts equal to 0.25% per annum of its average daily net assets attributable to that class. Service fees paid or accrued are for personal services and/or the maintenance of shareholder accounts. They are separate and distinct from the sales commissions and distribution fees payable to EVD. Service fees paid or accrued for the year ended December 31, 2022 amounted to $24,722 and $5,753 for Class C and Class R shares, respectively.
Distribution and service fees are subject to the limitations contained in the Financial Industry Regulatory Authority Rule 2341(d).
5 Contingent Deferred Sales Charges
A contingent deferred sales charge (CDSC) of 1% generally is imposed on redemptions of Class C shares made within 12 months of purchase. Class A shares may be subject to a 1% CDSC if redeemed within 12 months (18 months prior to April 29, 2022) of purchase (depending on the circumstances of purchase). Generally, the CDSC is based upon the lower of the net asset value at date of redemption or date of purchase. No charge is levied on shares acquired by reinvestment of dividends or capital gain distributions. For the year ended December 31, 2022, the Fund was informed that EVD received approximately $300 of CDSCs paid by Class C shareholders and no CDSCs paid by Class A shareholders.
6 Purchases and Sales of Investments
Purchases and sales of investments, other than short-term obligations, aggregated $39,080,078 and $77,276,283, respectively, for the year ended December 31, 2022.
7 Shares of Beneficial Interest
The Fund’s Declaration of Trust permits the Trustees to issue an unlimited number of full and fractional shares of beneficial interest (without par value). Such shares may be issued in a number of different series (such as the Fund) and classes. Transactions in Fund shares, including direct exchanges pursuant to share class conversions for all periods presented, were as follows:
| | Year Ended
December 31, 2022 | | Year Ended
December 31, 2021 |
| | Shares | Amount | | Shares | Amount |
| Class A | | | | | |
| Sales | 251,076 | $ 7,858,018 | | 317,533 | $ 12,381,143 |
| Issued to shareholders electing to receive payments of distributions in Fund shares | 395,080 | 10,848,898 | | 620,171 | 24,347,899 |
| Redemptions | (885,326) | (27,004,318) | | (939,982) | (37,087,351) |
| Net decrease | (239,170) | $ (8,297,402) | | (2,278) | $ (358,309) |
Eaton Vance
Growth Fund
December 31, 2022
Notes to Financial Statements — continued
| | Year Ended
December 31, 2022 | | Year Ended
December 31, 2021 |
| | Shares | Amount | | Shares | Amount |
| Class C | | | | | |
| Sales | 40,187 | $ 976,989 | | 50,396 | $ 1,557,588 |
| Issued to shareholders electing to receive payments of distributions in Fund shares | 26,932 | 552,097 | | 48,586 | 1,460,503 |
| Redemptions | (169,430) | (3,928,621) | | (188,177) | (5,778,193) |
| Net decrease | (102,311) | $ (2,399,535) | | (89,195) | $ (2,760,102) |
| Class I | | | | | |
| Sales | 191,924 | $ 6,280,812 | | 357,444 | $ 14,743,302 |
| Issued to shareholders electing to receive payments of distributions in Fund shares | 102,482 | 2,970,956 | | 178,358 | 7,353,696 |
| Redemptions | (647,294) | (20,665,616) | | (330,540) | (13,537,858) |
| Net increase (decrease) | (352,888) | $(11,413,848) | | 205,262 | $ 8,559,140 |
| Class R | | | | | |
| Sales | 7,556 | $ 220,345 | | 31,559 | $ 1,143,299 |
| Issued to shareholders electing to receive payments of distributions in Fund shares | 4,443 | 116,241 | | 6,342 | 238,448 |
| Redemptions | (7,241) | (237,638) | | (30,470) | (1,189,021) |
| Net increase | 4,758 | $ 98,948 | | 7,431 | $ 192,726 |
8 Line of Credit
The Fund participates with other portfolios and funds managed by EVM and its affiliates in a $725 million unsecured line of credit agreement with a group of banks, which is in effect through October 24, 2023. In connection with the renewal of the agreement on October 25, 2022, the borrowing limit was decreased from $800 million. Borrowings are made by the Fund solely for temporary purposes related to redemptions and other short-term cash needs. Interest is charged to the Fund based on its borrowings at an amount above either the Secured Overnight Financing Rate (SOFR) or Federal Funds rate. In addition, a fee computed at an annual rate of 0.15% on the daily unused portion of the line of credit is allocated among the participating portfolios and funds at the end of each quarter. Also in connection with the renewal of the agreement, an arrangement fee totaling $150,000 was incurred that was allocated to the participating portfolios and funds. Because the line of credit is not available exclusively to the Fund, it may be unable to borrow some or all of its requested amounts at any particular time. The Fund did not have any significant borrowings or allocated fees during the year ended December 31, 2022.
9 Securities Lending Agreement
The Fund has established a securities lending agreement with State Street Bank and Trust Company (SSBT) as securities lending agent in which the Fund lends portfolio securities to qualified borrowers in exchange for collateral consisting of either cash or securities issued or guaranteed by the U.S. government or its agencies or instrumentalities in an amount at least equal to the market value of the securities on loan. The market value of securities loaned is determined daily and any additional required collateral is delivered to the Fund on the next business day. Cash collateral is invested in the State Street Navigator Securities Lending Government Money Market Portfolio, a money market fund registered under the 1940 Act. The Fund earns interest on the amount invested but it must pay (and at times receive from) the broker a loan rebate fee computed as a varying percentage of the collateral received. For security loans secured by non-cash collateral, the Fund earns a negotiated lending fee from the borrower. A portion of the income earned by the Fund from its investment of cash collateral, net of rebate fees, and lending fees received is allocated to SSBT for its services as lending agent and the portion allocated to the Fund is presented as securities lending income, net on the Statement of Operations. Non-cash collateral is held by the lending agent on behalf of the Fund and cannot be sold or re-pledged by the Fund; accordingly, such collateral is not reflected in the Statement of Assets and Liabilities.
The Fund is subject to possible delay in the recovery of loaned securities. Pursuant to the securities lending agreement, SSBT has provided indemnification to the Fund in the event of default by a borrower with respect to a loan. The Fund bears the risk of loss with respect to the investment of cash collateral.
Eaton Vance
Growth Fund
December 31, 2022
Notes to Financial Statements — continued
At December 31, 2022, the value of the securities loaned and the value of the collateral received, which exceeded the value of the securities loaned, amounted to $4,380,267 and $4,509,191, respectively. Collateral received was comprised of cash of $2,981,883 and U.S. government and/or agencies securities of $1,527,308. The securities lending transactions have no contractual maturity date and each of the Fund and borrower has the option to terminate a loan at any time.
The following table provides a breakdown of securities lending transactions accounted for as secured borrowings, the obligations by class of collateral pledged, and the remaining contractual maturity of those transactions as of December 31, 2022.
| | Remaining Contractual Maturity of the Transactions |
| | Overnight and
Continuous | <30 days | 30 to 90 days | >90 days | Total |
| Common Stocks | $2,981,883 | $ — | $ — | $ — | $2,981,883 |
The carrying amount of the liability for collateral for securities loaned at December 31, 2022 approximated its fair value. If measured at fair value, such liability would have been considered as Level 2 in the fair value hierarchy (see Note 11) at December 31, 2022.
10 Investments in Affiliated Funds
At December 31, 2022, the value of the Fund’s investment in affiliated funds, including funds that may be deemed to be affiliated, was $344,907, which represents 0.1% of the Fund's net assets. Transactions in such investments by the Fund for the year ended December 31, 2022 were as follows:
| Name | Value,
beginning
of period | Purchases | Sales
proceeds | Net
realized
gain (loss) | Change in
unrealized
appreciation
(depreciation) | Value, end
of period | Dividend
income | Units/Shares,
end of period |
| Short-Term Investments |
| Cash Reserves Fund | $45,076 | $ 8,001,032 | $ (8,045,966) | $ (142) | $ — | $ — | $ 327 | — |
| Liquidity Fund | — | 21,514,922 | (21,170,015) | — | — | 344,907 | 11,903 | 344,907 |
| Total | | | | $(142) | $ — | $344,907 | $12,230 | |
11 Fair Value Measurements
Under generally accepted accounting principles for fair value measurements, a three-tier hierarchy to prioritize the assumptions, referred to as inputs, is used in valuation techniques to measure fair value. The three-tier hierarchy of inputs is summarized in the three broad levels listed below.
| • | Level 1 – quoted prices in active markets for identical investments |
| • | Level 2 – other significant observable inputs (including quoted prices for similar investments, interest rates, prepayment speeds, credit risk, etc.) |
| • | Level 3 – significant unobservable inputs (including a fund's own assumptions in determining the fair value of investments) |
In cases where the inputs used to measure fair value fall in different levels of the fair value hierarchy, the level disclosed is determined based on the lowest level input that is significant to the fair value measurement in its entirety. The inputs or methodology used for valuing securities are not necessarily an indication of the risk associated with investing in those securities.
Eaton Vance
Growth Fund
December 31, 2022
Notes to Financial Statements — continued
At December 31, 2022, the hierarchy of inputs used in valuing the Fund's investments, which are carried at value, were as follows:
| Asset Description | Level 1 | Level 2 | Level 3 | Total |
| Common Stocks | $ 280,996,736* | $ — | $ — | $ 280,996,736 |
| Short-Term Investments: | | | | |
| Affiliated Fund | 344,907 | — | — | 344,907 |
| Securities Lending Collateral | 2,981,883 | — | — | 2,981,883 |
| Total Investments | $284,323,526 | $ — | $ — | $284,323,526 |
| * | The level classification by major category of investments is the same as the category presentation in the Portfolio of Investments. |
12 Risks and Uncertainties
Pandemic Risk
An outbreak of respiratory disease caused by a novel coronavirus was first detected in China in late 2019 and subsequently spread internationally. This coronavirus has resulted in closing borders, enhanced health screenings, changes to healthcare service preparation and delivery, quarantines, cancellations, disruptions to supply chains and customer activity, as well as general concern and uncertainty. Health crises caused by outbreaks of disease, such as the coronavirus outbreak, may exacerbate other pre-existing political, social and economic risks and disrupt normal market conditions and operations. The impact of this outbreak has negatively affected the worldwide economy, as well as the economies of individual countries and industries, and could continue to affect the market in significant and unforeseen ways. Other epidemics and pandemics that may arise in the future may have similar effects. Any such impact could adversely affect the Fund's performance, or the performance of the securities in which the Fund invests.
Eaton Vance
Growth Fund
December 31, 2022
Report of Independent Registered Public Accounting Firm
To the Trustees of Eaton Vance Special Investment Trust and Shareholders of Eaton Vance Growth Fund:
Opinion on the Financial Statements and Financial Highlights
We have audited the accompanying statement of assets and liabilities of Eaton Vance Growth Fund (the "Fund") (one of the funds constituting Eaton Vance Special Investment Trust), including the portfolio of investments, as of December 31, 2022, the related statement of operations for the year then ended, the statements of changes in net assets for each of the two years in the period then ended, the financial highlights for each of the five years in the period then ended, and the related notes. In our opinion, the financial statements and financial highlights present fairly, in all material respects, the financial position of the Fund as of December 31, 2022, and the results of its operations for the year then ended, the changes in its net assets for each of the two years in the period then ended, and the financial highlights for each of the five years in the period then ended, in conformity with accounting principles generally accepted in the United States of America.
Basis for Opinion
These financial statements and financial highlights are the responsibility of the Fund's management. Our responsibility is to express an opinion on the Fund's financial statements and financial highlights based on our audits. We are a public accounting firm registered with the Public Company Accounting Oversight Board (United States) (PCAOB) and are required to be independent with respect to the Fund in accordance with the U.S. federal securities laws and the applicable rules and regulations of the Securities and Exchange Commission and the PCAOB.
We conducted our audits in accordance with the standards of the PCAOB. Those standards require that we plan and perform the audit to obtain reasonable assurance about whether the financial statements and financial highlights are free of material misstatement, whether due to error or fraud. The Fund is not required to have, nor were we engaged to perform, an audit of its internal control over financial reporting. As part of our audits, we are required to obtain an understanding of internal control over financial reporting but not for the purpose of expressing an opinion on the effectiveness of the Fund’s internal control over financial reporting. Accordingly, we express no such opinion.
Our audits included performing procedures to assess the risks of material misstatement of the financial statements and financial highlights, whether due to error or fraud, and performing procedures that respond to those risks. Such procedures included examining, on a test basis, evidence regarding the amounts and disclosures in the financial statements and financial highlights. Our audits also included evaluating the accounting principles used and significant estimates made by management, as well as evaluating the overall presentation of the financial statements and financial highlights. Our procedures included confirmation of securities owned as of December 31, 2022, by correspondence with the custodian and brokers; when replies were not received from brokers, we performed other auditing procedures. We believe that our audits provide a reasonable basis for our opinion.
/s/ Deloitte & Touche LLP
Boston, Massachusetts
February 21, 2023
We have served as the auditor of one or more Eaton Vance investment companies since 1959.
Eaton Vance
Growth Fund
December 31, 2022
Federal Tax Information (Unaudited)
The Form 1099-DIV you received in February 2023 showed the tax status of all distributions paid to your account in calendar year 2022. Shareholders are advised to consult their own tax adviser with respect to the tax consequences of their investment in the Fund. As required by the Internal Revenue Code and/or regulations, shareholders must be notified regarding the status of capital gains dividends.
Capital Gains Dividends. The Fund hereby designates as a capital gain dividend with respect to the taxable year ended December 31, 2022, $9,441,838 or, if subsequently determined to be different, the net capital gain of such year.
Eaton Vance
Growth Fund
December 31, 2022
Management and Organization
Fund Management. The Trustees of Eaton Vance Special Investment Trust (the Trust) are responsible for the overall management and supervision of the Trust's affairs. The Board members and officers of the Trust are listed below. Except as indicated, each individual has held the office shown or other offices in the same company for the last five years. Board members hold indefinite terms of office. Each Trustee holds office until his or her successor is elected and qualified, subject to a prior death, resignation, retirement, disqualification or removal. Under the terms of the Fund’s current Trustee retirement policy, an Independent Trustee must retire and resign as a Trustee on the earlier of: (i) the first day of July following his or her 74th birthday; or (ii), with limited exception, December 31st of the 20th year in which he or she has served as a Trustee. However, if such retirement and resignation would cause the Fund to be out of compliance with Section 16 of the 1940 Act or any other regulations or guidance of the SEC, then such retirement and resignation will not become effective until such time as action has been taken for the Fund to be in compliance therewith. The “noninterested Trustees” consist of those Trustees who are not “interested persons” of the Trust, as that term is defined under the 1940 Act. The business address of each Board member and officer is Two International Place, Boston, Massachusetts 02110. As used below, “BMR” refers to Boston Management and Research, “EVC” refers to Eaton Vance Corp., “EV” refers to EV LLC, “EVM” refers to Eaton Vance Management and “EVD” refers to Eaton Vance Distributors, Inc. EV is the trustee of each of EVM and BMR. Effective March 1, 2021, each of EVM, BMR, EVD and EV are indirect, wholly owned subsidiaries of Morgan Stanley. Each officer affiliated with EVM may hold a position with other EVM affiliates that is comparable to his or her position with EVM listed below. Each Trustee oversees 130 funds in the Eaton Vance fund complex (including both funds and portfolios in a hub and spoke structure).
| Name and Year of Birth | Trust
Position(s) | Length of Service | Principal Occupation(s) and Other Directorships
During Past Five Years and Other Relevant Experience |
| Interested Trustee |
Thomas E. Faust Jr.
1958 | Trustee | Since 2007 | Chairman of Morgan Stanley Investment Management, Inc. (MSIM), member of the Board of Managers and President of EV (since 2021), Chief Executive Officer of EVM and BMR. Formerly, Chairman, Chief Executive Officer (2007-2021) and President (2006-2021) of EVC and Director of EVD (2007-2022). Mr. Faust is an interested person because of his positions with MSIM, BMR, EVM and EV, which are affiliates of the Trust.
Other Directorships. Formerly, Director of EVC (2007-2021) and Hexavest Inc. (investment management firm) (2012-2021). |
| Noninterested Trustees |
Alan C. Bowser(1)
1962 | Trustee | Since 2022 | Formerly, Chief Diversity Officer, Partner and a member of the Operating Committee, and formerly served as Senior Advisor on Diversity and Inclusion for the firm’s chief executive officer, Co-Head of the Americas Region, and Senior Client Advisor of Bridgewater Associates, an asset management firm (2011- 2023).
Other Directorships. None. |
Mark R. Fetting
1954 | Trustee | Since 2016 | Private investor. Formerly held various positions at Legg Mason, Inc. (investment management firm) (2000-2012), including President, Chief Executive Officer, Director and Chairman (2008-2012), Senior Executive Vice President (2004-2008) and Executive Vice President (2001-2004). Formerly, President of Legg Mason family of funds (2001-2008). Formerly, Division President and Senior Officer of Prudential Financial Group, Inc. and related companies (investment management firm) (1991-2000).
Other Directorships. None. |
Cynthia E. Frost
1961 | Trustee | Since 2014 | Private investor. Formerly, Chief Investment Officer of Brown University (university endowment) (2000-2012). Formerly, Portfolio Strategist for Duke Management Company (university endowment manager) (1995-2000). Formerly, Managing Director, Cambridge Associates (investment consulting company) (1989-1995). Formerly, Consultant, Bain and Company (management consulting firm) (1987-1989). Formerly, Senior Equity Analyst, BA Investment Management Company (1983-1985).
Other Directorships. None. |
George J. Gorman
1952 | Chairperson
of the Board
and Trustee | Since 2021
(Chairperson) and
2014 (Trustee) | Principal at George J. Gorman LLC (consulting firm). Formerly, Senior Partner at Ernst & Young LLP (a registered public accounting firm) (1974-2009).
Other Directorships. None. |
Eaton Vance
Growth Fund
December 31, 2022
Management and Organization — continued
| Name and Year of Birth | Trust
Position(s) | Length of Service | Principal Occupation(s) and Other Directorships
During Past Five Years and Other Relevant Experience |
| Noninterested Trustees (continued) |
Valerie A. Mosley
1960 | Trustee | Since 2014 | Chairwoman and Chief Executive Officer of Valmo Ventures (a consulting and investment firm). Founder of Upward Wealth, Inc., dba BrightUp, a fintech platform. Formerly, Partner and Senior Vice President, Portfolio Manager and Investment Strategist at Wellington Management Company, LLP (investment management firm) (1992-2012). Formerly, Chief Investment Officer, PG Corbin Asset Management (1990-1992). Formerly worked in institutional corporate bond sales at Kidder Peabody (1986-1990).
Other Directorships. Director of DraftKings, Inc. (digital sports entertainment and gaming company) (since September 2020). Director of Envestnet, Inc. (provider of intelligent systems for wealth management and financial wellness) (since 2018). Formerly, Director of Dynex Capital, Inc. (mortgage REIT) (2013-2020) and Director of Groupon, Inc. (e-commerce provider) (2020-2022). |
Keith Quinton
1958 | Trustee | Since 2018 | Private investor, researcher and lecturer. Formerly, Independent Investment Committee Member at New Hampshire Retirement System (2017-2021). Formerly, Portfolio Manager and Senior Quantitative Analyst at Fidelity Investments (investment management firm) (2001-2014).
Other Directorships. Formerly, Director (2016-2021) and Chairman (2019-2021) of New Hampshire Municipal Bond Bank. |
Marcus L. Smith
1966 | Trustee | Since 2018 | Private investor and independent corporate director. Formerly, Chief Investment Officer, Canada (2012-2017), Chief Investment Officer, Asia (2010-2012), Director of Asian Research (2004-2010) and portfolio manager (2001-2017) at MFS Investment Management (investment management firm).
Other Directorships. Director of First Industrial Realty Trust, Inc. (an industrial REIT) (since 2021). Director of MSCI Inc. (global provider of investment decision support tools) (since 2017). Formerly, Director of DCT Industrial Trust Inc. (logistics real estate company) (2017-2018). |
Susan J. Sutherland
1957 | Trustee | Since 2015 | Private investor. Director of Ascot Group Limited and certain of its subsidiaries (insurance and reinsurance) (since 2017). Formerly, Director of Hagerty Holding Corp. (insurance) (2015-2018) and Montpelier Re Holdings Ltd. (insurance and reinsurance) (2013-2015). Formerly, Associate, Counsel and Partner at Skadden, Arps, Slate, Meagher & Flom LLP (law firm) (1982-2013).
Other Directorships. Formerly, Director of Kairos Acquisition Corp. (insurance/InsurTech acquisition company) (2021-2023). |
Scott E. Wennerholm
1959 | Trustee | Since 2016 | Private investor. Formerly, Trustee at Wheelock College (postsecondary institution) (2012-2018). Formerly, Consultant at GF Parish Group (executive recruiting firm) (2016-2017). Formerly, Chief Operating Officer and Executive Vice President at BNY Mellon Asset Management (investment management firm) (2005-2011). Formerly, Chief Operating Officer and Chief Financial Officer at Natixis Global Asset Management (investment management firm) (1997-2004). Formerly, Vice President at Fidelity Investments Institutional Services (investment management firm) (1994-1997).
Other Directorships. None. |
Nancy A. Wiser(1)
1967 | Trustee | Since 2022 | Formerly, Executive Vice President and the Global Head of Operations at Wells Fargo Asset Management (2011-2021).
Other Directorships. None. |
| Name and Year of Birth | Trust
Position(s) | Length of Service | Principal Occupation(s)
During Past Five Years |
| Principal Officers who are not Trustees |
Eric A. Stein
1980 | President | Since 2020 | Vice President and Chief Investment Officer, Fixed Income of EVM and BMR. Prior to November 1, 2020, Mr. Stein was a co-Director of Eaton Vance’s Global Income Investments. Also Vice President of Calvert Research and Management (“CRM”). |
Deidre E. Walsh
1971 | Vice President and
Chief Legal Officer | Since 2009 | Vice President of EVM and BMR. Also Vice President of CRM. |
James F. Kirchner
1967 | Treasurer | Since 2007 | Vice President of EVM and BMR. Also Vice President of CRM. |
Eaton Vance
Growth Fund
December 31, 2022
Management and Organization — continued
| Name and Year of Birth | Trust
Position(s) | Length of Service | Principal Occupation(s)
During Past Five Years |
| Principal Officers who are not Trustees (continued) |
Nicholas Di Lorenzo
1987 | Secretary | Since 2022 | Formerly, associate (2012-2021) and counsel (2022) at Dechert LLP. |
Richard F. Froio
1968 | Chief Compliance
Officer | Since 2017 | Vice President of EVM and BMR since 2017. Formerly, Deputy Chief Compliance Officer (Adviser/Funds) and Chief Compliance Officer (Distribution) at PIMCO (2012-2017) and Managing Director at BlackRock/Barclays Global Investors (2009-2012). |
(1) Mr. Bowser and Ms. Wiser began serving as Trustees effective April 4, 2022.
The SAI for the Fund includes additional information about the Trustees and officers of the Fund and can be obtained without charge on Eaton Vance’s website at www.eatonvance.com or by calling 1-800-262-1122.
| FACTS | WHAT DOES EATON VANCE DO WITH YOUR
PERSONAL INFORMATION? |
| Why? | Financial companies choose how they share your personal information. Federal law gives consumers the right to limit some but not all sharing. Federal law also requires us to tell you how we collect, share, and protect your personal information. Please read this notice carefully to understand what we do. |
| |
| What? | The types of personal information we collect and share depend on the product or service you have with us. This information can include:■ Social Security number and income
■ investment experience and risk tolerance
■ checking account number and wire transfer instructions |
| |
| How? | All financial companies need to share customers’ personal information to run their everyday business. In the section below, we list the reasons financial companies can share their customers’ personal information; the reasons Eaton Vance chooses to share; and whether you can limit this sharing. |
Reasons we can share your
personal information | Does Eaton Vance
share? | Can you limit
this sharing? |
| For our everyday business purposes — such as to process your transactions, maintain your account(s), respond to court orders and legal investigations, or report to credit bureaus | Yes | No |
| For our marketing purposes — to offer our products and services to you | Yes | No |
| For joint marketing with other financial companies | No | We don’t share |
| For our investment management affiliates’ everyday business purposes — information about your transactions, experiences, and creditworthiness | Yes | Yes |
| For our affiliates’ everyday business purposes — information about your transactions and experiences | Yes | No |
| For our affiliates’ everyday business purposes — information about your creditworthiness | No | We don’t share |
| For our investment management affiliates to market to you | Yes | Yes |
| For our affiliates to market to you | No | We don’t share |
| For nonaffiliates to market to you | No | We don’t share |
To limit our
sharing | Call toll-free 1-800-262-1122 or email: EVPrivacy@eatonvance.comPlease note:If you are a new customer, we can begin sharing your information 30 days from the date we sent this notice. When you are no longer our customer, we continue to share your information as described in this notice. However, you can contact us at any time to limit our sharing. |
| Questions? | Call toll-free 1-800-262-1122 or email: EVPrivacy@eatonvance.com |
| Privacy Notice — continued | April 2021 |
| Who we are |
| Who is providing this notice? | Eaton Vance Management, Eaton Vance Distributors, Inc., Eaton Vance Trust Company, Eaton Vance Management (International) Limited, Eaton Vance Advisers International Ltd., Eaton Vance Global Advisors Limited, Eaton Vance Management’s Real Estate Investment Group, Boston Management and Research, Calvert Research and Management, Eaton Vance and Calvert Fund Families and our investment advisory affiliates (“Eaton Vance”) (see Investment Management Affiliates definition below) |
| What we do |
How does Eaton Vance
protect my personal
information? | To protect your personal information from unauthorized access and use, we use security measures that comply with federal law. These measures include computer safeguards and secured files and buildings. We have policies governing the proper handling of customer information by personnel and requiring third parties that provide support to adhere to appropriate security standards with respect to such information. |
How does Eaton Vance
collect my personal
information? | We collect your personal information, for example, when you■ open an account or make deposits or withdrawals from your account
■ buy securities from us or make a wire transfer
■ give us your contact informationWe also collect your personal information from others, such as credit bureaus, affiliates, or other companies. |
| Why can’t I limit all sharing? | Federal law gives you the right to limit only■ sharing for affiliates’ everyday business purposes — information about your creditworthiness
■ affiliates from using your information to market to you
■ sharing for nonaffiliates to market to youState laws and individual companies may give you additional rights to limit sharing. See below for more on your rights under state law. |
| Definitions |
Investment Management
Affiliates | Eaton Vance Investment Management Affiliates include registered investment advisers, registered broker- dealers, and registered and unregistered funds. Investment Management Affiliates does not include entities associated with Morgan Stanley Wealth Management, such as Morgan Stanley Smith Barney LLC and Morgan Stanley & Co. |
| Affiliates | Companies related by common ownership or control. They can be financial and nonfinancial companies.■ Our affiliates include companies with a Morgan Stanley name and financial companies such as Morgan Stanley Smith Barney LLC and Morgan Stanley & Co. |
| Nonaffiliates | Companies not related by common ownership or control. They can be financial and nonfinancial companies.■ Eaton Vance does not share with nonaffiliates so they can market to you. |
| Joint marketing | A formal agreement between nonaffiliated financial companies that together market financial products or services to you.■ Eaton Vance doesn’t jointly market. |
| Other important information |
| Vermont: Except as permitted by law, we will not share personal information we collect about Vermont residents with Nonaffiliates unless you provide us with your written consent to share such information.California: Except as permitted by law, we will not share personal information we collect about California residents with Nonaffiliates and we will limit sharing such personal information with our Affiliates to comply with California privacy laws that apply to us. |
Delivery of Shareholder Documents. The Securities and Exchange Commission (SEC) permits funds to deliver only one copy of shareholder documents, including prospectuses, proxy statements and shareholder reports, to fund investors with multiple accounts at the same residential or post office box address. This practice is often called “householding” and it helps eliminate duplicate mailings to shareholders. Eaton Vance, or your financial intermediary, may household the mailing of your documents indefinitely unless you instruct Eaton Vance, or your financial intermediary, otherwise. If you would prefer that your Eaton Vance documents not be householded, please contact Eaton Vance at 1-800-262-1122, or contact your financial intermediary. Your instructions that householding not apply to delivery of your Eaton Vance documents will typically be effective within 30 days of receipt by Eaton Vance or your financial intermediary.
Portfolio Holdings. Each Eaton Vance Fund and its underlying Portfolio(s) (if applicable) files a schedule of portfolio holdings on Part F to Form N-PORT with the SEC. Certain information filed on Form N-PORT may be viewed on the Eaton Vance website at www.eatonvance.com, by calling Eaton Vance at 1-800-262-1122 or in the EDGAR database on the SEC’s website at www.sec.gov.
Proxy Voting. From time to time, funds are required to vote proxies related to the securities held by the funds. The Eaton Vance Funds or their underlying Portfolios (if applicable) vote proxies according to a set of policies and procedures approved by the Funds’ and Portfolios’ Boards. You may obtain a description of these policies and procedures and information on how the Funds or Portfolios voted proxies relating to portfolio securities during the most recent 12-month period ended June 30, without charge, upon request, by calling 1-800-262-1122 and by accessing the SEC’s website at www.sec.gov.
Investment Adviser
Boston Management and Research
Two International Place
Boston, MA 02110
Administrator
Eaton Vance Management
Two International Place
Boston, MA 02110
Principal Underwriter*
Eaton Vance Distributors, Inc.
Two International Place
Boston, MA 02110
(617) 482-8260
Custodian
State Street Bank and Trust Company
State Street Financial Center, One Lincoln Street
Boston, MA 02111
Transfer Agent
BNY Mellon Investment Servicing (US) Inc.
Attn: Eaton Vance Funds
P.O. Box 534439
Pittsburgh, PA 15253-4439
(800) 262-1122
Independent Registered Public Accounting Firm
Deloitte & Touche LLP
200 Berkeley Street
Boston, MA 02116-5022
Fund Offices
Two International Place
Boston, MA 02110
*FINRA BrokerCheck. Investors may check the background of their Investment Professional by contacting the Financial Industry Regulatory Authority (FINRA). FINRA BrokerCheck is a free tool to help investors check the professional background of current and former FINRA-registered securities firms and brokers. FINRA BrokerCheck is available by calling 1-800-289-9999 and at www.FINRA.org. The FINRA BrokerCheck brochure describing this program is available to investors at www.FINRA.org.
Eaton Vance
Large-Cap Value Fund
Annual Report
December 31, 2022
Commodity Futures Trading Commission Registration. The Commodity Futures Trading Commission (“CFTC”) has adopted regulations that subject registered investment companies and advisers to regulation by the CFTC if a fund invests more than a prescribed level of its assets in certain CFTC-regulated instruments (including futures, certain options and swap agreements) or markets itself as providing investment exposure to such instruments. The investment adviser has claimed an exclusion from the definition of “commodity pool operator” under the Commodity Exchange Act with respect to its management of the Fund. Accordingly, neither the Fund nor the adviser with respect to the operation of the Fund is subject to CFTC regulation. Because of its management of other strategies, the Fund's adviser is registered with the CFTC as a commodity pool operator. The adviser is also registered as a commodity trading advisor.
Fund shares are not insured by the FDIC and are not deposits or other obligations of, or guaranteed by, any depository institution. Shares are subject to investment risks, including possible loss of principal invested.
This report must be preceded or accompanied by a current summary prospectus or prospectus. Before investing, investors should consider carefully the investment objective, risks, and charges and expenses of a mutual fund. This and other important information is contained in the summary prospectus and prospectus, which can be obtained from a financial intermediary. Prospective investors should read the prospectus carefully before investing. For further information, please call 1-800-262-1122.
Annual Report December 31, 2022
Eaton Vance
Large-Cap Value Fund
Eaton Vance
Large-Cap Value Fund
December 31, 2022
Management’s Discussion of Fund Performance†
Economic and Market Conditions
During the 12-month period starting January 1, 2022, the U.S. equity market was dominated by the ongoing effects of one black swan event -- the COVID-19 pandemic -- and fallout from another -- Russia’s invasion of Ukraine.
As the new year began, investors became increasingly concerned about the twin threats of inflation and interest rate hikes. As a result, stock performance turned negative -- a sharp about-face from the all-time highs many U.S. equity indexes had posted in late 2021.
In February, Russia’s invasion of Ukraine sent shock waves through U.S. and global markets, exacerbating inflationary pressures on energy and food costs. The U.S. Federal Reserve (the Fed) -- along with other central banks around the world -- initiated its first interest rate hikes in years.
Investors began to expect the Fed would raise interest rates at every policy meeting in 2022 and, in turn, worried that aggressive rate hikes could tip the economy into recession. At its June, July, September, and November 2022 policy meetings, the Fed hiked the federal funds rate 0.75% each time -- its first moves of that magnitude since 1994. Higher interest rates, inflation, and recessionary worries drove stock prices down, with rate-sensitive technology stocks -- star performers earlier in the pandemic -- suffering some of the worst declines.
In October and November 2022, however, U.S. stocks delivered positive performance for the first time in months. The rally was driven by a combination of better-than-expected company earnings, declining inflation, and hope that the Fed would temper the size of future rate hikes.
But while the Fed indeed delivered a smaller 0.50% rate hike in December, it raised its expectation of how high rates might go in 2023. As investors digested the news that rates could stay higher for longer than previously expected, equity prices declined in the final month of 2022.
For the period as a whole, the blue-chip Dow Jones Industrial Average® returned -6.86%; the S&P 500® Index, a broad measure of U.S. stocks, returned -18.11%; and the technology-laden Nasdaq Composite Index returned -32.54%.
Fund Performance
For the 12-month period ended December 31, 2022, Eaton Vance Large-Cap Value Fund (the Fund) returned -2.78% for Class A shares at net asset value (NAV), outperforming its benchmark, the Russell 1000® Value Index (the Index), which returned -7.54%.
On an individual stock basis, the largest contributors to Fund performance versus the Index during the period were overweight positions in ConocoPhillips; EOG Resources, Inc. (EOG Resources); and Huntington Ingalls Industries, Inc. (Huntington Ingalls); as well as an out-of-Index position in Neurocrine Biosciences, Inc. (Neurocrine).
Energy exploration and production firm ConocoPhillips benefited from a strong balance sheet, reliable operations, and rising oil prices that led to increased profits and helped boost the company’s stock price during the period. Similarly, rising energy commodity prices also produced higher profits and a rising stock price for oil and gas exploration and production firm EOG Resources.
As America’s largest military shipbuilder, Huntington Ingalls saw its stock price benefit from an increased focus on conventional warfare by the U.S. Congress and U.S. Department of Defense. Neurocrine’s stock price appreciated as sales of its primary product -- a proprietary treatment for the side effects of certain mental health medications -- continued to grow during the period.
On a sector basis, stock selections in the financials and industrials sectors; stock selections and an overweight position in the energy sector -- the best-performing sector within the Index during the period; and stock selections and an underweight position in the information technology sector all contributed to Fund performance versus the Index during the period.
In contrast, the largest detractors from Fund performance relative to the Index included not owning Index component Exxon Mobil Corp. (Exxon Mobil) and overweight positions in The Walt Disney Co. (Disney) and Alphabet, Inc. (Alphabet).
A lack of exposure to major oil and gas exploration and production firm Exxon Mobil detracted from relative returns as rising energy prices drove the company’s stock price higher during the period. The Fund’s Disney position declined in value as the company’s Disney+ streaming service reported weak profitability and disappointing subscriber growth.
The share price of Google parent company Alphabet declined during the period. While Alphabet’s cloud-storage business reported strong results, decelerating growth in digital advertising revenue led to disappointing earnings that weighed on the company’s stock performance.
On a sector basis, stock selections in the communication services, consumer discretionary, and real estate sectors detracted from Fund performance versus the Index during the period.
See Endnotes and Additional Disclosures in this report.
Past performance is no guarantee of future results. Returns are historical and are calculated by determining the percentage change in net asset value (NAV) or offering price (as applicable) with all distributions reinvested. Furthermore, returns do not reflect the deduction of taxes that shareholders may have to pay on Fund distributions or upon the redemption of Fund shares. Investment return and principal value will fluctuate so that shares, when redeemed, may be worth more or less than their original cost. Performance for periods less than or equal to one year is cumulative. Performance is for the stated time period only; due to market volatility, current Fund performance may be lower or higher than the quoted return. For performance as of the most recent month-end, please refer to eatonvance.com.
Eaton Vance
Large-Cap Value Fund
December 31, 2022
Performance
Portfolio Manager(s) Aaron S. Dunn, CFA and Bradley T. Galko, CFA
| % Average Annual Total Returns1,2 | Class
Inception Date | Performance
Inception Date | One Year | Five Years | Ten Years |
| Class A at NAV | 09/23/1931 | 09/23/1931 | (2.78)% | 8.36% | 10.31% |
| Class A with 5.25% Maximum Sales Charge | — | — | (7.87) | 7.20 | 9.72 |
| Class C at NAV | 11/04/1994 | 09/23/1931 | (3.53) | 7.55 | 9.65 |
| Class C with 1% Maximum Deferred Sales Charge | — | — | (4.46) | 7.55 | 9.65 |
| Class I at NAV | 12/28/2004 | 09/23/1931 | (2.56) | 8.64 | 10.58 |
| Class R at NAV | 02/18/2004 | 09/23/1931 | (3.04) | 8.10 | 10.03 |
| Class R6 at NAV | 07/01/2014 | 09/23/1931 | (2.50) | 8.70 | 10.65 |
|
| Russell 1000® Value Index | — | — | (7.54)% | 6.66% | 10.29% |
| % Total Annual Operating Expense Ratios3 | Class A | Class C | Class I | Class R | Class R6 |
| | 1.01% | 1.76% | 0.76% | 1.26% | 0.70% |
Growth of $10,000
This graph shows the change in value of a hypothetical investment of $10,000 in Class A of the Fund for the period indicated. For comparison, the same investment is shown in the indicated index.
| Growth of Investment2 | Amount Invested | Period Beginning | At NAV | With Maximum Sales Charge |
| Class C | $10,000 | 12/31/2012 | $25,135 | N.A. |
| Class I, at minimum investment | $1,000,000 | 12/31/2012 | $2,735,547 | N.A. |
| Class R | $10,000 | 12/31/2012 | $26,031 | N.A. |
| Class R6, at minimum investment | $5,000,000 | 12/31/2012 | $13,767,210 | N.A. |
See Endnotes and Additional Disclosures in this report.
Past performance is no guarantee of future results. Returns are historical and are calculated by determining the percentage change in net asset value (NAV) or offering price (as applicable) with all distributions reinvested. Furthermore, returns do not reflect the deduction of taxes that shareholders may have to pay on Fund distributions or upon the redemption of Fund shares. Investment return and principal value will fluctuate so that shares, when redeemed, may be worth more or less than their original cost. Performance for periods less than or equal to one year is cumulative. Performance is for the stated time period only; due to market volatility, current Fund performance may be lower or higher than the quoted return. For performance as of the most recent month-end, please refer to eatonvance.com.
Eaton Vance
Large-Cap Value Fund
December 31, 2022
| Sector Allocation (% of net assets)1 |
| Top 10 Holdings (% of net assets)1 |
| Wells Fargo & Co. | 3.3% |
| Charles Schwab Corp. (The) | 3.1 |
| NextEra Energy, Inc. | 3.0 |
| American International Group, Inc. | 2.9 |
| Chevron Corp. | 2.7 |
| Huntington Ingalls Industries, Inc. | 2.6 |
| Constellation Brands, Inc., Class A | 2.4 |
| Walt Disney Co. (The) | 2.4 |
| Alphabet, Inc., Class A | 2.4 |
| Hershey Co. (The) | 2.3 |
| Total | 27.1% |
Footnotes:
| 1 | Excludes cash and cash equivalents. |
Eaton Vance
Large-Cap Value Fund
December 31, 2022
Endnotes and Additional Disclosures
| † | The views expressed in this report are those of the portfolio manager(s) and are current only through the date stated at the top of this page. These views are subject to change at any time based upon market or other conditions, and Eaton Vance and the Fund(s) disclaim any responsibility to update such views. These views may not be relied upon as investment advice and, because investment decisions are based on many factors, may not be relied upon as an indication of trading intent on behalf of any Eaton Vance fund. This commentary may contain statements that are not historical facts, referred to as “forward-looking statements.” The Fund’s actual future results may differ significantly from those stated in any forward-looking statement, depending on factors such as changes in securities or financial markets or general economic conditions, the volume of sales and purchases of Fund shares, the continuation of investment advisory, administrative and service contracts, and other risks discussed from time to time in the Fund’s filings with the Securities and Exchange Commission. |
| | |
| 1 | Russell 1000® Value Index is an unmanaged index of U.S. large-cap value stocks. Unless otherwise stated, index returns do not reflect the effect of any applicable sales charges, commissions, expenses, taxes or leverage, as applicable. It is not possible to invest directly in an index. |
| 2 | Total Returns at NAV do not include applicable sales charges. If sales charges were deducted, the returns would be lower. Total Returns shown with maximum sales charge reflect the stated maximum sales charge. Unless otherwise stated, performance does not reflect the deduction of taxes on Fund distributions or redemptions of Fund shares.Effective November 5, 2020, Class C shares automatically convert to Class A shares eight years after purchase. The average annual total returns listed for Class C reflect conversion to Class A shares after eight years. Prior to November 5, 2020, Class C shares automatically converted to Class A shares ten years after purchase.Performance prior to the inception date of a class may be linked to the performance of an older class of the Fund. This linked performance is adjusted for any applicable sales charge, but is not adjusted for class expense differences. If adjusted for such differences, the performance would be different. The performance of Class R6 is linked to Class I. Performance presented in the Financial Highlights included in the financial statements is not linked. |
| 3 | Source: Fund prospectus. The expense ratios for the current reporting period can be found in the Financial Highlights section of this report. Performance reflects expenses waived and/or reimbursed, if applicable. Without such waivers and/or reimbursements, performance would have been lower. |
| | Fund profile subject to change due to active management. |
| | Additional Information |
| | S&P 500® Index is an unmanaged index of large-cap stocks commonly used as a measure of U.S. stock market performance. Dow Jones Industrial Average® is a price-weighted average of 30 blue-chip stocks that are generally the leaders in their industry. S&P Dow Jones Indices are a product of S&P Dow Jones Indices LLC (“S&P DJI”) and have been licensed for use. S&P® and S&P 500® are registered trademarks of S&P DJI; Dow Jones® is a registered trademark of Dow Jones Trademark Holdings LLC (“Dow Jones”); S&P DJI, Dow Jones and their respective affiliates do not sponsor, endorse, sell or promote the Fund, will not have any liability with respect thereto and do not have any liability for any errors, omissions, or interruptions of the S&P Dow Jones Indices. Nasdaq Composite Index is a market capitalization-weighted index of all domestic and international securities listed on Nasdaq. Source: Nasdaq, Inc. The information is provided by Nasdaq (with its affiliates, are referred to as the “Corporations”) and Nasdaq’s third party licensors on an “as is” basis and the Corporations make no guarantees and bear no liability of any kind with respect to the information or the Fund. |
Eaton Vance
Large-Cap Value Fund
December 31, 2022
Example
As a Fund shareholder, you incur two types of costs: (1) transaction costs, including sales charges (loads) on purchases; and (2) ongoing costs, including management fees; distribution and/or service fees; and other Fund expenses. This Example is intended to help you understand your ongoing costs (in dollars) of Fund investing and to compare these costs with the ongoing costs of investing in other mutual funds. The Example is based on an investment of $1,000 invested at the beginning of the period and held for the entire period (July 1, 2022 to December 31, 2022).
Actual Expenses
The first section of the table below provides information about actual account values and actual expenses. You may use the information in this section, together with the amount you invested, to estimate the expenses that you paid over the period. Simply divide your account value by $1,000 (for example, an $8,600 account value divided by $1,000 = 8.6), then multiply the result by the number in the first section under the heading entitled “Expenses Paid During Period” to estimate the expenses you paid on your account during this period.
Hypothetical Example for Comparison Purposes
The second section of the table below provides information about hypothetical account values and hypothetical expenses based on the actual Fund expense ratio and an assumed rate of return of 5% per year (before expenses), which is not the actual Fund return. The hypothetical account values and expenses may not be used to estimate the actual ending account balance or expenses you paid for the period. You may use this information to compare the ongoing costs of investing in your Fund and other funds. To do so, compare this 5% hypothetical example with the 5% hypothetical examples that appear in the shareholder reports of the other funds.
Please note that the expenses shown in the table are meant to highlight your ongoing costs only and do not reflect any transactional costs, such as sales charges (loads). Therefore, the second section of the table is useful in comparing ongoing costs only, and will not help you determine the relative total costs of owning different funds. In addition, if these transactional costs were included, your costs would be higher.
| | Beginning
Account Value
(7/1/22) | Ending
Account Value
(12/31/22) | Expenses Paid
During Period*
(7/1/22 – 12/31/22) | Annualized
Expense
Ratio |
| Actual | | | | |
| Class A | $1,000.00 | $1,072.20 | $5.28 | 1.01% |
| Class C | $1,000.00 | $1,067.90 | $9.23 | 1.77% |
| Class I | $1,000.00 | $1,073.20 | $3.97 | 0.76% |
| Class R | $1,000.00 | $1,071.00 | $6.58 | 1.26% |
| Class R6 | $1,000.00 | $1,073.90 | $3.66 | 0.70% |
| |
| Hypothetical | | | | |
| (5% return per year before expenses) | | | | |
| Class A | $1,000.00 | $1,020.11 | $5.14 | 1.01% |
| Class C | $1,000.00 | $1,016.28 | $9.00 | 1.77% |
| Class I | $1,000.00 | $1,021.37 | $3.87 | 0.76% |
| Class R | $1,000.00 | $1,018.85 | $6.41 | 1.26% |
| Class R6 | $1,000.00 | $1,021.68 | $3.57 | 0.70% |
| * | Expenses are equal to the Fund's annualized expense ratio for the indicated Class, multiplied by the average account value over the period, multiplied by 184/365 (to reflect the one-half year period). The Example assumes that the $1,000 was invested at the net asset value per share determined at the close of business on June 30, 2022. |
Eaton Vance
Large-Cap Value Fund
December 31, 2022
| Security | Shares | Value |
| Aerospace & Defense — 4.0% |
| Hexcel Corp. | | 379,231 | $ 22,317,744 |
| Huntington Ingalls Industries, Inc. | | 174,900 | 40,345,932 |
| | | | $ 62,663,676 |
| Banks — 7.0% |
| Citizens Financial Group, Inc. | | 853,631 | $ 33,607,453 |
| M&T Bank Corp. | | 175,524 | 25,461,511 |
| Wells Fargo & Co. | | 1,240,574 | 51,223,300 |
| | | | $ 110,292,264 |
| Beverages — 2.4% |
| Constellation Brands, Inc., Class A | | 167,202 | $ 38,749,063 |
| | | | $ 38,749,063 |
| Biotechnology — 1.9% |
| AbbVie, Inc. | | 54,634 | $ 8,829,401 |
| Neurocrine Biosciences, Inc.(1) | | 182,200 | 21,761,968 |
| | | | $ 30,591,369 |
| Building Products — 2.1% |
| Johnson Controls International PLC | | 516,113 | $ 33,031,232 |
| | | | $ 33,031,232 |
| Capital Markets — 5.8% |
| Charles Schwab Corp. (The) | | 582,676 | $ 48,513,604 |
| Goldman Sachs Group, Inc. (The) | | 66,821 | 22,944,995 |
| Stifel Financial Corp. | | 355,309 | 20,739,386 |
| | | | $ 92,197,985 |
| Chemicals — 4.2% |
| FMC Corp. | | 159,654 | $ 19,924,819 |
| Linde PLC | | 90,742 | 29,598,225 |
| Sherwin-Williams Co. (The) | | 69,902 | 16,589,842 |
| | | | $ 66,112,886 |
| Communications Equipment — 1.7% |
| Cisco Systems, Inc. | | 551,054 | $ 26,252,213 |
| | | | $ 26,252,213 |
| Security | Shares | Value |
| Containers & Packaging — 0.6% |
| Packaging Corp. of America | | 70,389 | $ 9,003,457 |
| | | | $ 9,003,457 |
| Diversified Telecommunication Services — 2.1% |
| Verizon Communications, Inc. | | 847,789 | $ 33,402,887 |
| | | | $ 33,402,887 |
| Electric Utilities — 3.8% |
| Edison International | | 198,929 | $ 12,655,863 |
| NextEra Energy, Inc. | | 566,431 | 47,353,632 |
| | | | $ 60,009,495 |
| Electrical Equipment — 1.6% |
| Eaton Corp. PLC | | 160,847 | $ 25,244,937 |
| | | | $ 25,244,937 |
| Energy Equipment & Services — 1.8% |
| Halliburton Co. | | 724,493 | $ 28,508,800 |
| | | | $ 28,508,800 |
| Entertainment — 2.4% |
| Walt Disney Co. (The)(1) | | 440,817 | $ 38,298,181 |
| | | | $ 38,298,181 |
| Equity Real Estate Investment Trusts (REITs) — 5.9% |
| EastGroup Properties, Inc. | | 130,289 | $ 19,290,589 |
| First Industrial Realty Trust, Inc. | | 259,353 | 12,516,376 |
| Healthpeak Properties, Inc. | | 520,640 | 13,052,445 |
| Invitation Homes, Inc. | | 677,114 | 20,069,659 |
| Mid-America Apartment Communities, Inc. | | 182,014 | 28,574,378 |
| | | | $ 93,503,447 |
| Food & Staples Retailing — 2.4% |
| BJ's Wholesale Club Holdings, Inc.(1) | | 269,051 | $ 17,800,414 |
| Performance Food Group Co.(1) | | 357,311 | 20,863,389 |
| | | | $ 38,663,803 |
| Food Products — 2.3% |
| Hershey Co. (The) | | 160,236 | $ 37,105,850 |
| | | | $ 37,105,850 |
| Health Care Equipment & Supplies — 4.3% |
| Boston Scientific Corp.(1) | | 495,236 | $ 22,914,569 |
7
See Notes to Financial Statements.
Eaton Vance
Large-Cap Value Fund
December 31, 2022
Portfolio of Investments — continued
| Security | Shares | Value |
| Health Care Equipment & Supplies (continued) |
| Teleflex, Inc. | | 54,106 | $ 13,506,481 |
| Zimmer Biomet Holdings, Inc. | | 244,186 | 31,133,715 |
| | | | $ 67,554,765 |
| Health Care Providers & Services — 1.0% |
| Humana, Inc. | | 31,946 | $ 16,362,422 |
| | | | $ 16,362,422 |
| Hotels, Restaurants & Leisure — 1.3% |
| Papa John's International, Inc. | | 251,799 | $ 20,725,576 |
| | | | $ 20,725,576 |
| Insurance — 4.4% |
| American International Group, Inc. | | 726,195 | $ 45,924,572 |
| Arch Capital Group, Ltd.(1) | | 233,075 | 14,632,448 |
| Reinsurance Group of America, Inc. | | 70,523 | 10,020,613 |
| | | | $ 70,577,633 |
| Interactive Media & Services — 2.4% |
| Alphabet, Inc., Class A(1) | | 433,634 | $ 38,259,528 |
| | | | $ 38,259,528 |
| IT Services — 1.3% |
| Fiserv, Inc.(1) | | 205,794 | $ 20,799,600 |
| | | | $ 20,799,600 |
| Leisure Products — 2.1% |
| Hasbro, Inc. | | 542,443 | $ 33,094,447 |
| | | | $ 33,094,447 |
| Life Sciences Tools & Services — 3.6% |
| Thermo Fisher Scientific, Inc. | | 46,264 | $ 25,477,122 |
| Waters Corp.(1) | | 93,925 | 32,176,827 |
| | | | $ 57,653,949 |
| Machinery — 3.9% |
| PACCAR, Inc. | | 256,942 | $ 25,429,550 |
| Westinghouse Air Brake Technologies Corp. | | 357,330 | 35,665,107 |
| | | | $ 61,094,657 |
| Multiline Retail — 1.5% |
| Dollar Tree, Inc.(1) | | 171,096 | $ 24,199,818 |
| | | | $ 24,199,818 |
| Security | Shares | Value |
| Multi-Utilities — 1.8% |
| CMS Energy Corp. | | 176,201 | $ 11,158,810 |
| Sempra Energy | | 116,982 | 18,078,398 |
| | | | $ 29,237,208 |
| Oil, Gas & Consumable Fuels — 6.5% |
| Chevron Corp. | | 239,716 | $ 43,026,625 |
| ConocoPhillips | | 302,098 | 35,647,564 |
| EOG Resources, Inc. | | 188,654 | 24,434,466 |
| | | | $ 103,108,655 |
| Pharmaceuticals — 6.6% |
| Bristol-Myers Squibb Co. | | 504,426 | $ 36,293,451 |
| Novo Nordisk A/S ADR | | 231,377 | 31,314,563 |
| Royalty Pharma PLC, Class A | | 214,375 | 8,472,100 |
| Sanofi | | 297,083 | 28,646,683 |
| | | | $ 104,726,797 |
| Semiconductors & Semiconductor Equipment — 3.2% |
| Micron Technology, Inc. | | 554,828 | $ 27,730,304 |
| Texas Instruments, Inc. | | 135,760 | 22,430,267 |
| | | | $ 50,160,571 |
| Software — 1.5% |
| VMware, Inc., Class A(1) | | 197,036 | $ 24,188,139 |
| | | | $ 24,188,139 |
| Specialty Retail — 0.9% |
| Lithia Motors, Inc. | | 67,223 | $ 13,763,237 |
| | | | $ 13,763,237 |
| Wireless Telecommunication Services — 0.9% |
| T-Mobile US, Inc.(1) | | 107,392 | $ 15,034,880 |
| | | | $ 15,034,880 |
Total Common Stocks
(identified cost $1,351,387,064) | | | $1,574,173,427 |
8
See Notes to Financial Statements.
Eaton Vance
Large-Cap Value Fund
December 31, 2022
Portfolio of Investments — continued
| Short-Term Investments — 0.8% |
| Security | Shares | Value |
| Morgan Stanley Institutional Liquidity Funds - Government Portfolio, Institutional Class, 4.11%(2) | | 12,269,921 | $ 12,269,921 |
Total Short-Term Investments
(identified cost $12,269,921) | | | $ 12,269,921 |
Total Investments — 100.0%
(identified cost $1,363,656,985) | | | $1,586,443,348 |
| Other Assets, Less Liabilities — (0.0)%(3) | | | $ (690,379) |
| Net Assets — 100.0% | | | $1,585,752,969 |
| The percentage shown for each investment category in the Portfolio of Investments is based on net assets. |
| (1) | Non-income producing security. |
| (2) | May be deemed to be an affiliated investment company. The rate shown is the annualized seven-day yield as of December 31, 2022. |
| (3) | Amount is less than (0.05)%. |
| Abbreviations: |
| ADR | – American Depositary Receipt |
9
See Notes to Financial Statements.
Eaton Vance
Large-Cap Value Fund
December 31, 2022
Statement of Assets and Liabilities
| | December 31, 2022 |
| Assets | |
| Unaffiliated investments, at value (identified cost $1,351,387,064) | $ 1,574,173,427 |
| Affiliated investment, at value (identified cost $12,269,921) | 12,269,921 |
| Dividends receivable | 1,969,064 |
| Dividends receivable from affiliated investment | 33,799 |
| Receivable for Fund shares sold | 2,095,126 |
| Tax reclaims receivable | 68,342 |
| Total assets | $1,590,609,679 |
| Liabilities | |
| Payable for Fund shares redeemed | $ 3,234,787 |
| Payable to affiliates: | |
| Investment adviser fee | 852,381 |
| Distribution and service fees | 166,896 |
| Trustees' fees | 27,125 |
| Accrued expenses | 575,521 |
| Total liabilities | $ 4,856,710 |
| Net Assets | $1,585,752,969 |
| Sources of Net Assets | |
| Paid-in capital | $ 1,342,568,622 |
| Distributable earnings | 243,184,347 |
| Net Assets | $1,585,752,969 |
| Class A Shares | |
| Net Assets | $ 626,603,883 |
| Shares Outstanding | 27,688,846 |
Net Asset Value and Redemption Price Per Share
(net assets ÷ shares of beneficial interest outstanding) | $ 22.63 |
Maximum Offering Price Per Share
(100 ÷ 94.75 of net asset value per share) | $ 23.88 |
| Class C Shares | |
| Net Assets | $ 15,822,265 |
| Shares Outstanding | 695,227 |
Net Asset Value and Offering Price Per Share*
(net assets ÷ shares of beneficial interest outstanding) | $ 22.76 |
| Class I Shares | |
| Net Assets | $ 786,104,289 |
| Shares Outstanding | 34,563,298 |
Net Asset Value, Offering Price and Redemption Price Per Share
(net assets ÷ shares of beneficial interest outstanding) | $ 22.74 |
| Class R Shares | |
| Net Assets | $ 41,953,618 |
| Shares Outstanding | 1,859,639 |
Net Asset Value, Offering Price and Redemption Price Per Share
(net assets ÷ shares of beneficial interest outstanding) | $ 22.56 |
10
See Notes to Financial Statements.
Eaton Vance
Large-Cap Value Fund
December 31, 2022
Statement of Assets and Liabilities — continued
| | December 31, 2022 |
| Class R6 Shares | |
| Net Assets | $115,268,914 |
| Shares Outstanding | 5,064,145 |
Net Asset Value, Offering Price and Redemption Price Per Share
(net assets ÷ shares of beneficial interest outstanding) | $ 22.76 |
| On sales of $50,000 or more, the offering price of Class A shares is reduced. |
| * | Redemption price per share is equal to the net asset value less any applicable contingent deferred sales charge. |
11
See Notes to Financial Statements.
Eaton Vance
Large-Cap Value Fund
December 31, 2022
| | Year Ended |
| | December 31, 2022 |
| Investment Income | |
| Dividend income (net of foreign taxes withheld of $185,344) | $ 33,395,736 |
| Dividend income from affiliated investments | 132,711 |
| Securities lending income, net | 46,940 |
| Total investment income | $ 33,575,387 |
| Expenses | |
| Investment adviser fee | $ 10,096,449 |
| Distribution and service fees: | |
| Class A | 1,623,787 |
| Class C | 183,669 |
| Class R | 231,108 |
| Trustees’ fees and expenses | 104,084 |
| Custodian fee | 346,676 |
| Transfer and dividend disbursing agent fees | 1,144,480 |
| Legal and accounting services | 90,989 |
| Printing and postage | 106,206 |
| Registration fees | 83,094 |
| ReFlow liquidity program fees | 263,178 |
| Miscellaneous | 66,598 |
| Total expenses | $ 14,340,318 |
| Deduct: | |
| Waiver and/or reimbursement of expenses by affiliate | $ 7,777 |
| Total expense reductions | $ 7,777 |
| Net expenses | $ 14,332,541 |
| Net investment income | $ 19,242,846 |
| Realized and Unrealized Gain (Loss) | |
| Net realized gain (loss): | |
| Investment transactions | $ 102,175,501(1) |
| Investment transactions - affiliated investment | 365 |
| Foreign currency transactions | (61,197) |
| Net realized gain | $ 102,114,669 |
| Change in unrealized appreciation (depreciation): | |
| Investments | $ (167,955,644) |
| Foreign currency | (952) |
| Net change in unrealized appreciation (depreciation) | $(167,956,596) |
| Net realized and unrealized loss | $ (65,841,927) |
| Net decrease in net assets from operations | $ (46,599,081) |
| (1) | Includes $31,567,272 of net realized gains from redemptions in-kind. |
12
See Notes to Financial Statements.
Eaton Vance
Large-Cap Value Fund
December 31, 2022
Statements of Changes in Net Assets
| | Year Ended December 31, |
| | 2022 | 2021 |
| Increase (Decrease) in Net Assets | | |
| From operations: | | |
| Net investment income | $ 19,242,846 | $ 19,888,975 |
| Net realized gain | 102,114,669 (1) | 254,232,119 (2) |
| Net change in unrealized appreciation (depreciation) | (167,956,596) | 86,538,741 |
| Net increase (decrease) in net assets from operations | $ (46,599,081) | $ 360,659,835 |
| Distributions to shareholders: | | |
| Class A | $ (26,083,417) | $ (49,070,204) |
| Class C | (537,619) | (1,279,924) |
| Class I | (34,472,342) | (60,711,953) |
| Class R | (1,668,199) | (3,365,297) |
| Class R6 | (4,866,566) | (6,834,688) |
| Total distributions to shareholders | $ (67,628,143) | $ (121,262,066) |
| Transactions in shares of beneficial interest: | | |
| Class A | $ (26,581,798) | $ (28,510,581) |
| Class C | (3,450,356) | (3,645,096) |
| Class I | 1,098,266 | (48,148,635) |
| Class R | (4,018,631) | (5,676,395) |
| Class R6 | 26,139,494 | 16,717,425 |
| Net decrease in net assets from Fund share transactions | $ (6,813,025) | $ (69,263,282) |
| Net increase (decrease) in net assets | $ (121,040,249) | $ 170,134,487 |
| Net Assets | | |
| At beginning of year | $ 1,706,793,218 | $ 1,536,658,731 |
| At end of year | $1,585,752,969 | $1,706,793,218 |
| (1) | Includes $31,567,272 of net realized gains from redemptions in-kind. |
| (2) | Includes $59,907,056 of net realized gains from redemptions in-kind. |
13
See Notes to Financial Statements.
Eaton Vance
Large-Cap Value Fund
December 31, 2022
| | Class A |
| | Year Ended December 31, |
| | 2022 | 2021 | 2020 | 2019 | 2018 |
| Net asset value — Beginning of year | $ 24.260 | $ 21.000 | $ 20.980 | $ 16.500 | $ 19.520 |
| Income (Loss) From Operations | | | | | |
| Net investment income(1) | $ 0.248 | $ 0.254 | $ 0.274 | $ 0.256 | $ 0.254 |
| Net realized and unrealized gain (loss) | (0.917) | 4.782 | 0.154 (2) | 4.638 | (1.470) |
| Total income (loss) from operations | $ (0.669) | $ 5.036 | $ 0.428 | $ 4.894 | $ (1.216) |
| Less Distributions | | | | | |
| From net investment income | $ (0.248) | $ (0.244) | $ (0.259) | $ (0.248) | $ (0.240) |
| From net realized gain | (0.713) | (1.532) | (0.149) | (0.166) | (1.564) |
| Total distributions | $ (0.961) | $ (1.776) | $ (0.408) | $ (0.414) | $ (1.804) |
| Net asset value — End of year | $ 22.630 | $ 24.260 | $ 21.000 | $ 20.980 | $ 16.500 |
| Total Return(3) | (2.78)% | 24.29% | 2.28% | 29.79% | (6.83)% |
| Ratios/Supplemental Data | | | | | |
| Net assets, end of year (000’s omitted) | $626,604 | $699,076 | $630,544 | $711,972 | $549,515 |
| Ratios (as a percentage of average daily net assets):(4) | | | | | |
| Expenses | 1.01% (5) | 1.01% | 1.04% | 1.04% | 1.06% |
| Net investment income | 1.06% | 1.07% | 1.48% | 1.33% | 1.30% |
| Portfolio Turnover of the Portfolio(6) | — | — | — | — | 34% (7) |
| Portfolio Turnover of the Fund | 65% | 56% | 65% | 62% | 48% (7)(8) |
| (1) | Computed using average shares outstanding. |
| (2) | The per share amount is not in accord with the net realized and unrealized gain (loss) for the period because of the timing of Fund share transactions and the amount of the per share realized and unrealized gains and losses at such time. |
| (3) | Returns are historical and are calculated by determining the percentage change in net asset value with all distributions reinvested and do not reflect the effect of sales charges. |
| (4) | Includes the Fund’s share of the Portfolio’s allocated expenses for the period while the Fund was investing in the Portfolio. |
| (5) | Includes a reduction by the investment adviser of a portion of its adviser fee due to the Fund's investment in the Liquidity Fund (equal to less than 0.005% of average daily net assets for the year ended December 31, 2022). |
| (6) | Portfolio turnover represents the rate of portfolio activity for the period while the Fund was investing in the Portfolio. |
| (7) | Not annualized. |
| (8) | For the period from June 18, 2018 through December 31, 2018 when the Fund was making investments directly in securities. |
| References to Portfolio herein are to Large-Cap Value Portfolio, a Massachusetts business trust in which the Fund invested all of its investable assets prior to the close of business on June 15, 2018 and which had the same investment objective and policies as the Fund during such period. |
14
See Notes to Financial Statements.
Eaton Vance
Large-Cap Value Fund
December 31, 2022
Financial Highlights — continued
| | Class C |
| | Year Ended December 31, |
| | 2022 | 2021 | 2020 | 2019 | 2018 |
| Net asset value — Beginning of year | $ 24.390 | $ 21.100 | $ 21.050 | $ 16.520 | $ 19.540 |
| Income (Loss) From Operations | | | | | |
| Net investment income(1) | $ 0.073 | $ 0.073 | $ 0.139 | $ 0.103 | $ 0.107 |
| Net realized and unrealized gain (loss) | (0.929) | 4.810 | 0.150 (2) | 4.655 | (1.473) |
| Total income (loss) from operations | $ (0.856) | $ 4.883 | $ 0.289 | $ 4.758 | $ (1.366) |
| Less Distributions | | | | | |
| From net investment income | $ (0.061) | $ (0.061) | $ (0.090) | $ (0.062) | $ (0.090) |
| From net realized gain | (0.713) | (1.532) | (0.149) | (0.166) | (1.564) |
| Total distributions | $ (0.774) | $ (1.593) | $ (0.239) | $ (0.228) | $ (1.654) |
| Net asset value — End of year | $22.760 | $24.390 | $21.100 | $21.050 | $ 16.520 |
| Total Return(3) | (3.53)% | 23.39% | 1.52% | 28.82% | (7.53)% |
| Ratios/Supplemental Data | | | | | |
| Net assets, end of year (000’s omitted) | $ 15,822 | $ 20,594 | $ 21,069 | $ 56,344 | $168,783 |
| Ratios (as a percentage of average daily net assets):(4) | | | | | |
| Expenses | 1.77% (5) | 1.76% | 1.79% | 1.80% | 1.81% |
| Net investment income | 0.31% | 0.30% | 0.75% | 0.54% | 0.55% |
| Portfolio Turnover of the Portfolio(6) | — | — | — | — | 34% (7) |
| Portfolio Turnover of the Fund | 65% | 56% | 65% | 62% | 48% (7)(8) |
| (1) | Computed using average shares outstanding. |
| (2) | The per share amount is not in accord with the net realized and unrealized gain (loss) for the period because of the timing of Fund share transactions and the amount of the per share realized and unrealized gains and losses at such time. |
| (3) | Returns are historical and are calculated by determining the percentage change in net asset value with all distributions reinvested and do not reflect the effect of sales charges. |
| (4) | Includes the Fund’s share of the Portfolio’s allocated expenses for the period while the Fund was investing in the Portfolio. |
| (5) | Includes a reduction by the investment adviser of a portion of its adviser fee due to the Fund's investment in the Liquidity Fund (equal to less than 0.005% of average daily net assets for the year ended December 31, 2022). |
| (6) | Portfolio turnover represents the rate of portfolio activity for the period while the Fund was investing in the Portfolio. |
| (7) | Not annualized. |
| (8) | For the period from June 18, 2018 through December 31, 2018 when the Fund was making investments directly in securities. |
| References to Portfolio herein are to Large-Cap Value Portfolio, a Massachusetts business trust in which the Fund invested all of its investable assets prior to the close of business on June 15, 2018 and which had the same investment objective and policies as the Fund during such period. |
15
See Notes to Financial Statements.
Eaton Vance
Large-Cap Value Fund
December 31, 2022
Financial Highlights — continued
| | Class I |
| | Year Ended December 31, |
| | 2022 | 2021 | 2020 | 2019 | 2018 |
| Net asset value — Beginning of year | $ 24.380 | $ 21.090 | $ 21.070 | $ 16.570 | $ 19.590 |
| Income (Loss) From Operations | | | | | |
| Net investment income(1) | $ 0.308 | $ 0.314 | $ 0.322 | $ 0.305 | $ 0.306 |
| Net realized and unrealized gain (loss) | (0.927) | 4.812 | 0.152 (2) | 4.658 | (1.472) |
| Total income (loss) from operations | $ (0.619) | $ 5.126 | $ 0.474 | $ 4.963 | $ (1.166) |
| Less Distributions | | | | | |
| From net investment income | $ (0.308) | $ (0.304) | $ (0.305) | $ (0.297) | $ (0.290) |
| From net realized gain | (0.713) | (1.532) | (0.149) | (0.166) | (1.564) |
| Total distributions | $ (1.021) | $ (1.836) | $ (0.454) | $ (0.463) | $ (1.854) |
| Net asset value — End of year | $ 22.740 | $ 24.380 | $ 21.090 | $ 21.070 | $ 16.570 |
| Total Return(3) | (2.56)% | 24.64% | 2.52% | 30.11% | (6.57)% |
| Ratios/Supplemental Data | | | | | |
| Net assets, end of year (000’s omitted) | $786,104 | $841,350 | $768,930 | $819,292 | $736,581 |
| Ratios (as a percentage of average daily net assets):(4) | | | | | |
| Expenses | 0.76% (5) | 0.76% | 0.79% | 0.79% | 0.81% |
| Net investment income | 1.32% | 1.31% | 1.72% | 1.58% | 1.56% |
| Portfolio Turnover of the Portfolio(6) | — | — | — | — | 34% (7) |
| Portfolio Turnover of the Fund | 65% | 56% | 65% | 62% | 48% (7)(8) |
| (1) | Computed using average shares outstanding. |
| (2) | The per share amount is not in accord with the net realized and unrealized gain (loss) for the period because of the timing of Fund share transactions and the amount of the per share realized and unrealized gains and losses at such time. |
| (3) | Returns are historical and are calculated by determining the percentage change in net asset value with all distributions reinvested. |
| (4) | Includes the Fund’s share of the Portfolio’s allocated expenses for the period while the Fund was investing in the Portfolio. |
| (5) | Includes a reduction by the investment adviser of a portion of its adviser fee due to the Fund's investment in the Liquidity Fund (equal to less than 0.005% of average daily net assets for the year ended December 31, 2022). |
| (6) | Portfolio turnover represents the rate of portfolio activity for the period while the Fund was investing in the Portfolio. |
| (7) | Not annualized. |
| (8) | For the period from June 18, 2018 through December 31, 2018 when the Fund was making investments directly in securities. |
| References to Portfolio herein are to Large-Cap Value Portfolio, a Massachusetts business trust in which the Fund invested all of its investable assets prior to the close of business on June 15, 2018 and which had the same investment objective and policies as the Fund during such period. |
16
See Notes to Financial Statements.
Eaton Vance
Large-Cap Value Fund
December 31, 2022
Financial Highlights — continued
| | Class R |
| | Year Ended December 31, |
| | 2022 | 2021 | 2020 | 2019 | 2018 |
| Net asset value — Beginning of year | $ 24.190 | $ 20.940 | $ 20.920 | $ 16.450 | $ 19.460 |
| Income (Loss) From Operations | | | | | |
| Net investment income(1) | $ 0.188 | $ 0.193 | $ 0.228 | $ 0.206 | $ 0.204 |
| Net realized and unrealized gain (loss) | (0.918) | 4.773 | 0.152 (2) | 4.626 | (1.460) |
| Total income (loss) from operations | $ (0.730) | $ 4.966 | $ 0.380 | $ 4.832 | $ (1.256) |
| Less Distributions | | | | | |
| From net investment income | $ (0.187) | $ (0.184) | $ (0.211) | $ (0.196) | $ (0.190) |
| From net realized gain | (0.713) | (1.532) | (0.149) | (0.166) | (1.564) |
| Total distributions | $ (0.900) | $ (1.716) | $ (0.360) | $ (0.362) | $ (1.754) |
| Net asset value — End of year | $22.560 | $24.190 | $20.940 | $20.920 | $16.450 |
| Total Return(3) | (3.04)% | 24.01% | 2.03% | 29.48% | (7.04)% |
| Ratios/Supplemental Data | | | | | |
| Net assets, end of year (000’s omitted) | $ 41,954 | $ 49,462 | $ 47,772 | $ 59,473 | $ 60,984 |
| Ratios (as a percentage of average daily net assets):(4) | | | | | |
| Expenses | 1.26% (5) | 1.26% | 1.29% | 1.30% | 1.31% |
| Net investment income | 0.81% | 0.81% | 1.23% | 1.08% | 1.05% |
| Portfolio Turnover of the Portfolio(6) | — | — | — | — | 34% (7) |
| Portfolio Turnover of the Fund | 65% | 56% | 65% | 62% | 48% (7)(8) |
| (1) | Computed using average shares outstanding. |
| (2) | The per share amount is not in accord with the net realized and unrealized gain (loss) for the period because of the timing of Fund share transactions and the amount of the per share realized and unrealized gains and losses at such time. |
| (3) | Returns are historical and are calculated by determining the percentage change in net asset value with all distributions reinvested. |
| (4) | Includes the Fund’s share of the Portfolio’s allocated expenses for the period while the Fund was investing in the Portfolio. |
| (5) | Includes a reduction by the investment adviser of a portion of its adviser fee due to the Fund's investment in the Liquidity Fund (equal to less than 0.005% of average daily net assets for the year ended December 31, 2022). |
| (6) | Portfolio turnover represents the rate of portfolio activity for the period while the Fund was investing in the Portfolio. |
| (7) | Not annualized. |
| (8) | For the period from June 18, 2018 through December 31, 2018 when the Fund was making investments directly in securities. |
| References to Portfolio herein are to Large-Cap Value Portfolio, a Massachusetts business trust in which the Fund invested all of its investable assets prior to the close of business on June 15, 2018 and which had the same investment objective and policies as the Fund during such period. |
17
See Notes to Financial Statements.
Eaton Vance
Large-Cap Value Fund
December 31, 2022
Financial Highlights — continued
| | Class R6 |
| | Year Ended December 31, |
| | 2022 | 2021 | 2020 | 2019 | 2018 |
| Net asset value — Beginning of year | $ 24.400 | $ 21.110 | $ 21.080 | $ 16.580 | $ 19.610 |
| Income (Loss) From Operations | | | | | |
| Net investment income(1) | $ 0.323 | $ 0.334 | $ 0.337 | $ 0.320 | $ 0.310 |
| Net realized and unrealized gain (loss) | (0.929) | 4.806 | 0.160 (2) | 4.656 | (1.470) |
| Total income (loss) from operations | $ (0.606) | $ 5.140 | $ 0.497 | $ 4.976 | $ (1.160) |
| Less Distributions | | | | | |
| From net investment income | $ (0.321) | $ (0.318) | $ (0.318) | $ (0.310) | $ (0.306) |
| From net realized gain | (0.713) | (1.532) | (0.149) | (0.166) | (1.564) |
| Total distributions | $ (1.034) | $ (1.850) | $ (0.467) | $ (0.476) | $ (1.870) |
| Net asset value — End of year | $ 22.760 | $24.400 | $21.110 | $21.080 | $16.580 |
| Total Return(3) | (2.50)% | 24.69% | 2.64% | 30.17% | (6.54)% |
| Ratios/Supplemental Data | | | | | |
| Net assets, end of year (000’s omitted) | $115,269 | $ 96,311 | $ 68,343 | $ 76,714 | $ 73,019 |
| Ratios (as a percentage of average daily net assets):(4) | | | | | |
| Expenses | 0.71% (5) | 0.70% | 0.72% | 0.72% | 0.72% |
| Net investment income | 1.38% | 1.39% | 1.80% | 1.66% | 1.57% |
| Portfolio Turnover of the Portfolio(6) | — | — | — | — | 34% (7) |
| Portfolio Turnover of the Fund | 65% | 56% | 65% | 62% | 48% (7)(8) |
| (1) | Computed using average shares outstanding. |
| (2) | The per share amount is not in accord with the net realized and unrealized gain (loss) for the period because of the timing of Fund share transactions and the amount of the per share realized and unrealized gains and losses at such time. |
| (3) | Returns are historical and are calculated by determining the percentage change in net asset value with all distributions reinvested. |
| (4) | Includes the Fund’s share of the Portfolio’s allocated expenses for the period while the Fund was investing in the Portfolio. |
| (5) | Includes a reduction by the investment adviser of a portion of its adviser fee due to the Fund's investment in the Liquidity Fund (equal to less than 0.005% of average daily net assets for the year ended December 31, 2022). |
| (6) | Portfolio turnover represents the rate of portfolio activity for the period while the Fund was investing in the Portfolio. |
| (7) | Not annualized. |
| (8) | For the period from June 18, 2018 through December 31, 2018 when the Fund was making investments directly in securities. |
| References to Portfolio herein are to Large-Cap Value Portfolio, a Massachusetts business trust in which the Fund invested all of its investable assets prior to the close of business on June 15, 2018 and which had the same investment objective and policies as the Fund during such period. |
18
See Notes to Financial Statements.
Eaton Vance
Large-Cap Value Fund
December 31, 2022
Notes to Financial Statements
1 Significant Accounting Policies
Eaton Vance Large-Cap Value Fund (the Fund) is a diversified series of Eaton Vance Special Investment Trust (the Trust). The Trust is a Massachusetts business trust registered under the Investment Company Act of 1940, as amended (the 1940 Act), as an open-end management investment company. The Fund’s investment objective is to seek total return. The Fund offers five classes of shares. Class A shares are generally sold subject to a sales charge imposed at time of purchase. Class C shares are sold at net asset value and are generally subject to a contingent deferred sales charge (see Note 5). Effective November 5, 2020, Class C shares automatically convert to Class A shares eight years after their purchase as described in the Fund’s prospectus. Class I, Class R and Class R6 shares are sold at net asset value and are not subject to a sales charge.
Each class represents a pro-rata interest in the Fund, but votes separately on class-specific matters and (as noted below) is subject to different expenses. Realized and unrealized gains and losses and net investment income and losses, other than class-specific expenses, are allocated daily to each class of shares based on the relative net assets of each class to the total net assets of the Fund. Sub-accounting, recordkeeping and similar administrative fees payable to financial intermediaries, which are a component of transfer and dividend disbursing agent fees on the Statement of Operations, are not allocated to Class R6 shares. Each class of shares differs in its distribution plan and certain other class-specific expenses.
The following is a summary of significant accounting policies of the Fund. The policies are in conformity with accounting principles generally accepted in the United States of America (U.S. GAAP). The Fund is an investment company and follows accounting and reporting guidance in the Financial Accounting Standards Board (FASB) Accounting Standards Codification Topic 946.
A Investment Valuation—The following methodologies are used to determine the market value or fair value of investments.
Equity Securities. Equity securities listed on a U.S. securities exchange generally are valued at the last sale or closing price on the day of valuation or, if no sales took place on such date, at the mean between the closing bid and ask prices on the exchange where such securities are principally traded. Equity securities listed on the NASDAQ National Market System are valued at the NASDAQ official closing price. Unlisted or listed securities for which closing sales prices or closing quotations are not available are valued at the mean between the latest available bid and ask prices.
Foreign Securities and Currencies. Foreign securities and currencies are valued in U.S. dollars, based on foreign currency exchange rate quotations supplied by a third party pricing service. The pricing service uses a proprietary model to determine the exchange rate. Inputs to the model include reported trades and implied bid/ask spreads. The daily valuation of exchange-traded foreign securities generally is determined as of the close of trading on the principal exchange on which such securities trade. Events occurring after the close of trading on foreign exchanges may result in adjustments to the valuation of foreign securities to more accurately reflect their fair value as of the close of regular trading on the New York Stock Exchange. When valuing foreign equity securities that meet certain criteria, the Fund's Trustees have approved the use of a fair value service that values such securities to reflect market trading that occurs after the close of the applicable foreign markets of comparable securities or other instruments that have a strong correlation to the fair-valued securities.
Other. Investments in management investment companies (including money market funds) that do not trade on an exchange are valued at the net asset value as of the close of each business day.
Fair Valuation. In connection with Rule 2a-5 of the 1940 Act, which became effective September 8, 2022, the Trustees have designated the Fund’s investment adviser as its valuation designee. Investments for which valuations or market quotations are not readily available or are deemed unreliable are valued by the investment adviser, as valuation designee, at fair value using methods that most fairly reflect the security’s “fair value”, which is the amount that the Fund might reasonably expect to receive for the security upon its current sale in the ordinary course. Each such determination is based on a consideration of relevant factors, which are likely to vary from one pricing context to another. These factors may include, but are not limited to, the type of security, the existence of any contractual restrictions on the security’s disposition, the price and extent of public trading in similar securities of the issuer or of comparable companies or entities, quotations or relevant information obtained from broker/dealers or other market participants, information obtained from the issuer, analysts, and/or the appropriate stock exchange (for exchange-traded securities), an analysis of the company’s or entity’s financial statements, and an evaluation of the forces that influence the issuer and the market(s) in which the security is purchased and sold.
B Investment Transactions—Investment transactions for financial statement purposes are accounted for on a trade date basis. Realized gains and losses on investments sold are determined on the basis of identified cost.
C Income—Dividend income is recorded on the ex-dividend date for dividends received in cash and/or securities. However, if the ex-dividend date has passed, certain dividends from foreign securities are recorded as the Fund is informed of the ex-dividend date. Withholding taxes on foreign dividends and capital gains have been provided for in accordance with the Fund's understanding of the applicable countries’ tax rules and rates. In consideration of recent decisions rendered by European courts, the Fund has filed additional tax reclaims for previously withheld taxes on dividends earned in certain European Union countries. These filings are subject to various administrative and judicial proceedings within these countries. Due to the uncertainty as to the ultimate resolution of these proceedings, the likelihood of receipt of these reclaims, and the potential timing of payment, no amounts are reflected in the Fund’s financial statements for such outstanding reclaims.
Eaton Vance
Large-Cap Value Fund
December 31, 2022
Notes to Financial Statements — continued
D Federal Taxes—The Fund's policy is to comply with the provisions of the Internal Revenue Code applicable to regulated investment companies and to distribute to shareholders each year substantially all of its net investment income, and all or substantially all of its net realized capital gains. Accordingly, no provision for federal income or excise tax is necessary.
As of December 31, 2022, the Fund had no uncertain tax positions that would require financial statement recognition, de-recognition, or disclosure. The Fund files a U.S. federal income tax return annually after its fiscal year-end, which is subject to examination by the Internal Revenue Service for a period of three years from the date of filing.
E Expenses—The majority of expenses of the Trust are directly identifiable to an individual fund. Expenses which are not readily identifiable to a specific fund are allocated taking into consideration, among other things, the nature and type of expense and the relative size of the funds.
F Foreign Currency Translation—Investment valuations, other assets, and liabilities initially expressed in foreign currencies are translated each business day into U.S. dollars based upon current exchange rates. Purchases and sales of foreign investment securities and income and expenses denominated in foreign currencies are translated into U.S. dollars based upon currency exchange rates in effect on the respective dates of such transactions. Recognized gains or losses on investment transactions attributable to changes in foreign currency exchange rates are recorded for financial statement purposes as net realized gains and losses on investments. That portion of unrealized gains and losses on investments that results from fluctuations in foreign currency exchange rates is not separately disclosed.
G Use of Estimates—The preparation of the financial statements in conformity with U.S. GAAP requires management to make estimates and assumptions that affect the reported amounts of assets and liabilities at the date of the financial statements and the reported amounts of income and expense during the reporting period. Actual results could differ from those estimates.
H Indemnifications—Under the Trust’s organizational documents, its officers and Trustees may be indemnified against certain liabilities and expenses arising out of the performance of their duties to the Fund. Under Massachusetts law, if certain conditions prevail, shareholders of a Massachusetts business trust (such as the Trust) could be deemed to have personal liability for the obligations of the Trust. However, the Trust’s Declaration of Trust contains an express disclaimer of liability on the part of Fund shareholders and the By-laws provide that the Trust shall assume, upon request by the shareholder, the defense on behalf of any Fund shareholders. Moreover, the By-laws also provide for indemnification out of Fund property of any shareholder held personally liable solely by reason of being or having been a shareholder for all loss or expense arising from such liability. Additionally, in the normal course of business, the Fund enters into agreements with service providers that may contain indemnification clauses. The Fund’s maximum exposure under these arrangements is unknown as this would involve future claims that may be made against the Fund that have not yet occurred.
2 Distributions to Shareholders and Income Tax Information
It is the present policy of the Fund to make quarterly distributions of all or substantially all of its net investment income and to distribute annually all or substantially all of its net realized capital gains. Distributions to shareholders are recorded on the ex-dividend date. Distributions are declared separately for each class of shares. Shareholders may reinvest income and capital gain distributions in additional shares of the same class of the Fund at the net asset value as of the ex-dividend date or, at the election of the shareholder, receive distributions in cash. Distributions to shareholders are determined in accordance with income tax regulations, which may differ from U.S. GAAP. As required by U.S. GAAP, only distributions in excess of tax basis earnings and profits are reported in the financial statements as a return of capital. Permanent differences between book and tax accounting relating to distributions are reclassified to paid-in capital. For tax purposes, distributions from short-term capital gains are considered to be from ordinary income.
The tax character of distributions declared for the years ended December 31, 2022 and December 31, 2021 was as follows:
| | Year Ended December 31, |
| | 2022 | 2021 |
| Ordinary income | $19,054,024 | $ 18,959,123 |
| Long-term capital gains | $48,574,119 | $102,302,943 |
During the year ended December 31, 2022, distributable earnings was decreased by $36,701,184 and paid-in capital was increased by $36,701,184
due to the Fund's use of equalization accounting and differences between book and tax accounting for redemptions in-kind. Tax equalization accounting allows the Fund to treat as a distribution that portion of redemption proceeds representing a redeeming shareholder's portion of undistributed taxable income and net capital gains. These reclassifications had no effect on the net assets or net asset value per share of the Fund.
Eaton Vance
Large-Cap Value Fund
December 31, 2022
Notes to Financial Statements — continued
As of December 31, 2022, the components of distributable earnings (accumulated loss) on a tax basis were as follows:
| Undistributed long-term capital gains | $ 28,238,793 |
| Net unrealized appreciation | 214,945,554 |
| Distributable earnings | $243,184,347 |
The cost and unrealized appreciation (depreciation) of investments of the Fund at December 31, 2022, as determined on a federal income tax basis, were as follows:
| Aggregate cost | $1,371,497,219 |
| Gross unrealized appreciation | $ 246,597,299 |
| Gross unrealized depreciation | (31,651,170) |
| Net unrealized appreciation | $ 214,946,129 |
3 Investment Adviser Fee and Other Transactions with Affiliates
The investment adviser fee is earned by Boston Management and Research (BMR), an indirect, wholly-owned subsidiary of Morgan Stanley, as compensation for investment advisory services rendered to the Fund. The fee is computed at an annual rate as a percentage of the Fund’s average daily net assets as follows and is payable monthly:
| Average Daily Net Assets | Annual Fee Rate |
| Up to $2 billion | 0.625% |
| $2 billion but less than $5 billion | 0.600% |
| $5 billion but less than $10 billion | 0.575% |
| $10 billion but less than $15 billion | 0.555% |
| $15 billion but less than $20 billion | 0.540% |
| $20 billion but less than $25 billion | 0.530% |
| $25 billion and over | 0.520% |
For the year ended December 31, 2022, the investment adviser fee amounted to $10,096,449 or 0.625% of the Fund’s average daily net assets. Effective April 26, 2022, the Fund may invest in a money market fund, the Institutional Class of the Morgan Stanley Institutional Liquidity Funds - Government Portfolio (the “Liquidity Fund”), an open-end management investment company managed by Morgan Stanley Investment Management Inc., a wholly-owned subsidiary of Morgan Stanley. The investment adviser fee paid by the Fund is reduced by an amount equal to its pro-rata share of the advisory and administration fees paid by the Fund due to its investment in the Liquidity Fund. For the year ended December 31, 2022, the investment adviser fee paid was reduced by $7,777 relating to the Fund’s investment in the Liquidity Fund. Prior to April 26, 2022, the Fund may have invested its cash in Eaton Vance Cash Reserves Fund, LLC (Cash Reserves Fund), an affiliated investment company managed by Eaton Vance Management (EVM). EVM did not receive a fee for advisory services provided to Cash Reserves Fund. EVM, an affiliate of BMR and an indirect, wholly-owned subsidiary of Morgan Stanley, serves as the administrator of the Fund, but receives no compensation.
EVM provides sub-transfer agency and related services to the Fund pursuant to a Sub-Transfer Agency Support Services Agreement. For the year ended December 31, 2022, EVM earned $122,749 from the Fund pursuant to such agreement, which is included in transfer and dividend disbursing agent fees on the Statement of Operations. The Fund was informed that Eaton Vance Distributors, Inc. (EVD), an affiliate of EVM and the Fund’s principal underwriter, received $16,888 as its portion of the sales charge on sales of Class A shares for the year ended December 31, 2022. The Fund was informed that Morgan Stanley affiliated broker-dealers, which may be deemed to be affiliates of EVM, BMR and EVD, also received a portion of the sales charge on sales of Class A shares for the year ended December 31, 2022 in the amount of $4,892. EVD also received distribution and service fees from Class A, Class C and Class R shares (see Note 4) and contingent deferred sales charges (see Note 5).
Eaton Vance
Large-Cap Value Fund
December 31, 2022
Notes to Financial Statements — continued
Trustees and officers of the Fund who are members of EVM’s or BMR’s organizations receive remuneration for their services to the Fund out of the investment adviser fee. Trustees of the Fund who are not affiliated with the investment adviser may elect to defer receipt of all or a percentage of their annual fees in accordance with the terms of the Trustees Deferred Compensation Plan. For the year ended December 31, 2022, no significant amounts have been deferred. Certain officers and Trustees of the Fund are officers of the above organizations.
4 Distribution Plans
The Fund has in effect a distribution plan for Class A shares (Class A Plan) pursuant to Rule 12b-1 under the 1940 Act. Pursuant to the Class A Plan, the Fund pays EVD a distribution and service fee of 0.25% per annum of its average daily net assets attributable to Class A shares for distribution services and facilities provided to the Fund by EVD, as well as for personal services and/or the maintenance of shareholder accounts. Distribution and service fees paid or accrued to EVD for the year ended December 31, 2022 amounted to $1,623,787 for Class A shares.
The Fund also has in effect distribution plans for Class C shares (Class C Plan) and Class R shares (Class R Plan) pursuant to Rule 12b-1 under the 1940 Act. Pursuant to the Class C Plan, the Fund pays EVD amounts equal to 0.75% per annum of its average daily net assets attributable to Class C shares for providing ongoing distribution services and facilities to the Fund. For the year ended December 31, 2022, the Fund paid or accrued to EVD $137,752 for Class C shares.
The Class R Plan requires the Fund to pay EVD an amount up to 0.50% per annum of its average daily net assets attributable to Class R shares for providing ongoing distribution services and facilities to the Fund. The Trustees of the Trust have currently limited Class R distribution payments to 0.25% per annum of the average daily net assets attributable to Class R shares. For the year ended December 31, 2022, the Fund paid or accrued to EVD $115,554 for Class R shares.
Pursuant to the Class C and Class R Plans, the Fund also makes payments of service fees to EVD, financial intermediaries and other persons in amounts equal to 0.25% per annum of its average daily net assets attributable to that class. Service fees paid or accrued are for personal services and/or the maintenance of shareholder accounts. They are separate and distinct from the sales commissions and distribution fees payable to EVD. Service fees paid or accrued for the year ended December 31, 2022 amounted to $45,917 and $115,554 for Class C and Class R shares, respectively.
Distribution and service fees are subject to the limitations contained in the Financial Industry Regulatory Authority Rule 2341(d).
5 Contingent Deferred Sales Charges
A contingent deferred sales charge (CDSC) of 1% generally is imposed on redemptions of Class C shares made within 12 months of purchase. Class A shares may be subject to a 1% CDSC if redeemed within 12 months (18 months prior to April 29, 2022) of purchase (depending on the circumstances of purchase). Generally, the CDSC is based upon the lower of the net asset value at date of redemption or date of purchase. No charge is levied on shares acquired by reinvestment of dividends or capital gain distributions. For the year ended December 31, 2022, the Fund was informed that EVD received approximately $1,000 and $2,000 of CDSCs paid by Class A and Class C shareholders, respectively.
6 Purchases and Sales of Investments
Purchases and sales of investments, other than short-term obligations and in-kind transactions, aggregated $1,101,010,241 and $1,051,962,612, respectively, for the year ended December 31, 2022. In-kind sales for the year ended December 31, 2022 aggregated $104,458,568.
Eaton Vance
Large-Cap Value Fund
December 31, 2022
Notes to Financial Statements — continued
7 Shares of Beneficial Interest
The Fund’s Declaration of Trust permits the Trustees to issue an unlimited number of full and fractional shares of beneficial interest (without par value). Such shares may be issued in a number of different series (such as the Fund) and classes. Sales and redemptions of Class I shares include shares purchased and redeemed in connection with the ReFlow liquidity program, a program designed to provide an alternative liquidity source for mutual funds experiencing net redemptions of their shares. Transactions in Fund shares, including direct exchanges pursuant to share class conversions for all periods presented, were as follows:
| | Year Ended
December 31, 2022 | | Year Ended
December 31, 2021 |
| | Shares | Amount | | Shares | Amount |
| Class A | | | | | |
| Sales | 2,081,095 | $ 48,680,629 | | 2,182,886 | $ 52,037,343 |
| Issued to shareholders electing to receive payments of distributions in Fund shares | 1,022,039 | 23,413,517 | | 1,869,325 | 44,038,615 |
| Redemptions | (4,225,924) | (98,675,944) | | (5,267,155) | (124,586,539) |
| Net decrease | (1,122,790) | $ (26,581,798) | | (1,214,944) | $ (28,510,581) |
| Class C | | | | | |
| Sales | 183,732 | $ 4,331,716 | | 194,103 | $ 4,641,660 |
| Issued to shareholders electing to receive payments of distributions in Fund shares | 21,349 | 490,373 | | 50,234 | 1,188,427 |
| Redemptions | (354,377) | (8,272,445) | | (398,484) | (9,475,183) |
| Net decrease | (149,296) | $ (3,450,356) | | (154,147) | $ (3,645,096) |
| Class I | | | | | |
| Sales | 12,041,961 | $ 283,050,671 | | 12,148,514 | $ 289,525,969 |
| Issued to shareholders electing to receive payments of distributions in Fund shares | 1,271,728 | 29,294,408 | | 2,118,517 | 50,158,104 |
| Redemptions | (13,258,567) | (311,246,813) | | (16,212,717) | (387,832,708) |
| Net increase (decrease) | 55,122 | $ 1,098,266 | | (1,945,686) | $ (48,148,635) |
| Class R | | | | | |
| Sales | 294,995 | $ 6,931,587 | | 235,191 | $ 5,544,656 |
| Issued to shareholders electing to receive payments of distributions in Fund shares | 72,999 | 1,665,922 | | 142,734 | 3,350,945 |
| Redemptions | (553,279) | (12,616,140) | | (614,541) | (14,571,996) |
| Net decrease | (185,285) | $ (4,018,631) | | (236,616) | $ (5,676,395) |
| Class R6 | | | | | |
| Sales | 1,520,963 | $ 35,818,944 | | 1,230,661 | $ 29,415,674 |
| Issued to shareholders electing to receive payments of distributions in Fund shares | 209,551 | 4,829,281 | | 285,796 | 6,771,948 |
| Redemptions | (613,706) | (14,508,731) | | (806,934) | (19,470,197) |
| Net increase | 1,116,808 | $ 26,139,494 | | 709,523 | $ 16,717,425 |
Eaton Vance
Large-Cap Value Fund
December 31, 2022
Notes to Financial Statements — continued
8 Line of Credit
The Fund participates with other portfolios and funds managed by EVM and its affiliates in a $725 million unsecured line of credit agreement with a group of banks, which is in effect through October 24, 2023. In connection with the renewal of the agreement on October 25, 2022, the borrowing limit was decreased from $800 million. Borrowings are made by the Fund solely for temporary purposes related to redemptions and other short-term cash needs. Interest is charged to the Fund based on its borrowings at an amount above either the Secured Overnight Financing Rate (SOFR) or Federal Funds rate. In addition, a fee computed at an annual rate of 0.15% on the daily unused portion of the line of credit is allocated among the participating portfolios and funds at the end of each quarter. Also in connection with the renewal of the agreement, an arrangement fee totaling $150,000 was incurred that was allocated to the participating portfolios and funds. Because the line of credit is not available exclusively to the Fund, it may be unable to borrow some or all of its requested amounts at any particular time. The Fund did not have any significant borrowings or allocated fees during the year ended December 31, 2022.
9 Securities Lending Agreement
The Fund has established a securities lending agreement with State Street Bank and Trust Company (SSBT) as securities lending agent in which the Fund lends portfolio securities to qualified borrowers in exchange for collateral consisting of either cash or securities issued or guaranteed by the U.S. government or its agencies or instrumentalities in an amount at least equal to the market value of the securities on loan. The market value of securities loaned is determined daily and any additional required collateral is delivered to the Fund on the next business day. Cash collateral is invested in the State Street Navigator Securities Lending Government Money Market Portfolio, a money market fund registered under the 1940 Act. The Fund earns interest on the amount invested but it must pay (and at times receive from) the broker a loan rebate fee computed as a varying percentage of the collateral received. For security loans secured by non-cash collateral, the Fund earns a negotiated lending fee from the borrower. A portion of the income earned by the Fund from its investment of cash collateral, net of rebate fees, and lending fees received is allocated to SSBT for its services as lending agent and the portion allocated to the Fund is presented as securities lending income, net on the Statement of Operations. Non-cash collateral is held by the lending agent on behalf of the Fund and cannot be sold or re-pledged by the Fund; accordingly, such collateral is not reflected in the Statement of Assets and Liabilities.
The Fund is subject to possible delay in the recovery of loaned securities. Pursuant to the securities lending agreement, SSBT has provided indemnification to the Fund in the event of default by a borrower with respect to a loan. The Fund bears the risk of loss with respect to the investment of cash collateral. At December 31, 2022, the Fund had no securities on loan.
10 Investments in Affiliated Funds
At December 31, 2022, the value of the Fund's investment in affiliated funds, including funds that may be deemed to be affiliated, was $12,269,921, which represents 0.8% of the Fund's net assets. Transactions in such investments by the Fund for the year ended December 31, 2022 were as follows:
| Name | Value,
beginning
of period | Purchases | Sales
proceeds | Net
realized
gain (loss) | Change in
unrealized
appreciation
(depreciation) | Value, end
of period | Dividend
income | Units/Shares,
end of period |
| Short-Term Investments |
| Cash Reserves Fund | $6,681,683 | $ 73,592,438 | $ (80,274,486) | $ 365 | $ — | $ — | $ 1,360 | — |
| Liquidity Fund | — | 205,742,276 | (193,472,355) | — | — | 12,269,921 | 131,351 | 12,269,921 |
| Total | | | | $ 365 | $ — | $12,269,921 | $132,711 | |
11 Fair Value Measurements
Under generally accepted accounting principles for fair value measurements, a three-tier hierarchy to prioritize the assumptions, referred to as inputs, is used in valuation techniques to measure fair value. The three-tier hierarchy of inputs is summarized in the three broad levels listed below.
| • | Level 1 – quoted prices in active markets for identical investments |
| • | Level 2 – other significant observable inputs (including quoted prices for similar investments, interest rates, prepayment speeds, credit risk, etc.) |
| • | Level 3 – significant unobservable inputs (including a fund's own assumptions in determining the fair value of investments) |
In cases where the inputs used to measure fair value fall in different levels of the fair value hierarchy, the level disclosed is determined based on the lowest level input that is significant to the fair value measurement in its entirety. The inputs or methodology used for valuing securities are not necessarily an indication of the risk associated with investing in those securities.
Eaton Vance
Large-Cap Value Fund
December 31, 2022
Notes to Financial Statements — continued
At December 31, 2022, the hierarchy of inputs used in valuing the Fund's investments, which are carried at value, were as follows:
| Asset Description | Level 1 | Level 2 | Level 3 | Total |
| Common Stocks: | | | | |
| Communication Services | $ 124,995,476 | $ — | $ — | $ 124,995,476 |
| Consumer Discretionary | 91,783,078 | — | — | 91,783,078 |
| Consumer Staples | 114,518,716 | — | — | 114,518,716 |
| Energy | 131,617,455 | — | — | 131,617,455 |
| Financials | 273,067,882 | — | — | 273,067,882 |
| Health Care | 248,242,619 | 28,646,683 | — | 276,889,302 |
| Industrials | 182,034,502 | — | — | 182,034,502 |
| Information Technology | 121,400,523 | — | — | 121,400,523 |
| Materials | 75,116,343 | — | — | 75,116,343 |
| Real Estate | 93,503,447 | — | — | 93,503,447 |
| Utilities | 89,246,703 | — | — | 89,246,703 |
| Total Common Stocks | $1,545,526,744 | $28,646,683* | $ — | $1,574,173,427 |
| Short-Term Investments | $ 12,269,921 | $ — | $ — | $ 12,269,921 |
| Total Investments | $1,557,796,665 | $28,646,683 | $ — | $1,586,443,348 |
| * | Includes foreign equity securities whose values were adjusted to reflect market trading of comparable securities or other correlated instruments that occurred after the close of trading in their applicable foreign markets. |
12 Risks and Uncertainties
Pandemic Risk
An outbreak of respiratory disease caused by a novel coronavirus was first detected in China in late 2019 and subsequently spread internationally. This coronavirus has resulted in closing borders, enhanced health screenings, changes to healthcare service preparation and delivery, quarantines, cancellations, disruptions to supply chains and customer activity, as well as general concern and uncertainty. Health crises caused by outbreaks of disease, such as the coronavirus outbreak, may exacerbate other pre-existing political, social and economic risks and disrupt normal market conditions and operations. The impact of this outbreak has negatively affected the worldwide economy, as well as the economies of individual countries and industries, and could continue to affect the market in significant and unforeseen ways. Other epidemics and pandemics that may arise in the future may have similar effects. Any such impact could adversely affect the Fund's performance, or the performance of the securities in which the Fund invests.
Eaton Vance
Large-Cap Value Fund
December 31, 2022
Report of Independent Registered Public Accounting Firm
To the Trustees of Eaton Vance Special Investment Trust and Shareholders of Eaton Vance Large-Cap Value Fund:
Opinion on the Financial Statements and Financial Highlights
We have audited the accompanying statement of assets and liabilities of Eaton Vance Large-Cap Value Fund (the “Fund”) (one of the funds constituting Eaton Vance Special Investment Trust), including the portfolio of investments, as of December 31, 2022, the related statement of operations for the year then ended, the statements of changes in net assets for each of the two years in the period then ended, the financial highlights for each of the five years in the period then ended, and the related notes. In our opinion, the financial statements and financial highlights present fairly, in all material respects, the financial position of the Fund as of December 31, 2022, and the results of its operations for the year then ended, the changes in its net assets for each of the two years in the period then ended, and the financial highlights for each of the five years in the period then ended, in conformity with accounting principles generally accepted in the United States of America.
Basis for Opinion
These financial statements and financial highlights are the responsibility of the Fund's management. Our responsibility is to express an opinion on the Fund's financial statements and financial highlights based on our audits. We are a public accounting firm registered with the Public Company Accounting Oversight Board (United States) (PCAOB) and are required to be independent with respect to the Fund in accordance with the U.S. federal securities laws and the applicable rules and regulations of the Securities and Exchange Commission and the PCAOB.
We conducted our audits in accordance with the standards of the PCAOB. Those standards require that we plan and perform the audit to obtain reasonable assurance about whether the financial statements and financial highlights are free of material misstatement, whether due to error or fraud. The Fund is not required to have, nor were we engaged to perform, an audit of its internal control over financial reporting. As part of our audits, we are required to obtain an understanding of internal control over financial reporting but not for the purpose of expressing an opinion on the effectiveness of the Fund’s internal control over financial reporting. Accordingly, we express no such opinion.
Our audits included performing procedures to assess the risks of material misstatement of the financial statements and financial highlights, whether due to error or fraud, and performing procedures that respond to those risks. Such procedures included examining, on a test basis, evidence regarding the amounts and disclosures in the financial statements and financial highlights. Our audits also included evaluating the accounting principles used and significant estimates made by management, as well as evaluating the overall presentation of the financial statements and financial highlights. Our procedures included confirmation of securities owned as of December 31, 2022, by correspondence with the custodian and brokers; when replies were not received from brokers, we performed other auditing procedures. We believe that our audits provide a reasonable basis for our opinion.
/s/ Deloitte & Touche LLP
Boston, Massachusetts
February 21, 2023
We have served as the auditor of one or more Eaton Vance investment companies since 1959.
Eaton Vance
Large-Cap Value Fund
December 31, 2022
Federal Tax Information (Unaudited)
The Form 1099-DIV you received in February 2023 showed the tax status of all distributions paid to your account in calendar year 2022. Shareholders are advised to consult their own tax adviser with respect to the tax consequences of their investment in the Fund. As required by the Internal Revenue Code and/or regulations, shareholders must be notified regarding the status of qualified dividend income for individuals, the dividends received deduction for corporations and capital gains dividends.
Qualified Dividend Income. For the fiscal year ended December 31, 2022, the Fund designates approximately $31,001,559, or up to the maximum amount of such dividends allowable pursuant to the Internal Revenue Code, as qualified dividend income eligible for the reduced tax rate of 15%.
Dividends Received Deduction. Corporate shareholders are generally entitled to take the dividends received deduction on the portion of the Fund’s dividend distribution that qualifies under tax law. For the Fund’s fiscal 2022 ordinary income dividends, 100% qualifies for the corporate dividends received deduction.
Capital Gains Dividends. The Fund hereby designates as a capital gain dividend with respect to the taxable year ended December 31, 2022, $72,216,439 or, if subsequently determined to be different, the net capital gain of such year.
Eaton Vance
Large-Cap Value Fund
December 31, 2022
Management and Organization
Fund Management. The Trustees of Eaton Vance Special Investment Trust (the Trust) are responsible for the overall management and supervision of the Trust's affairs. The Board members and officers of the Trust are listed below. Except as indicated, each individual has held the office shown or other offices in the same company for the last five years. Board members hold indefinite terms of office. Each Trustee holds office until his or her successor is elected and qualified, subject to a prior death, resignation, retirement, disqualification or removal. Under the terms of the Fund’s current Trustee retirement policy, an Independent Trustee must retire and resign as a Trustee on the earlier of: (i) the first day of July following his or her 74th birthday; or (ii), with limited exception, December 31st of the 20th year in which he or she has served as a Trustee. However, if such retirement and resignation would cause the Fund to be out of compliance with Section 16 of the 1940 Act or any other regulations or guidance of the SEC, then such retirement and resignation will not become effective until such time as action has been taken for the Fund to be in compliance therewith. The “noninterested Trustees” consist of those Trustees who are not “interested persons” of the Trust, as that term is defined under the 1940 Act. The business address of each Board member and officer is Two International Place, Boston, Massachusetts 02110. As used below, “BMR” refers to Boston Management and Research, “EVC” refers to Eaton Vance Corp., “EV” refers to EV LLC, “EVM” refers to Eaton Vance Management and “EVD” refers to Eaton Vance Distributors, Inc. EV is the trustee of each of EVM and BMR. Effective March 1, 2021, each of EVM, BMR, EVD and EV are indirect, wholly owned subsidiaries of Morgan Stanley. Each officer affiliated with EVM may hold a position with other EVM affiliates that is comparable to his or her position with EVM listed below. Each Trustee oversees 130 funds in the Eaton Vance fund complex (including both funds and portfolios in a hub and spoke structure).
| Name and Year of Birth | Trust
Position(s) | Length of Service | Principal Occupation(s) and Other Directorships
During Past Five Years and Other Relevant Experience |
| Interested Trustee |
Thomas E. Faust Jr.
1958 | Trustee | Since 2007 | Chairman of Morgan Stanley Investment Management, Inc. (MSIM), member of the Board of Managers and President of EV (since 2021), Chief Executive Officer of EVM and BMR. Formerly, Chairman, Chief Executive Officer (2007-2021) and President (2006-2021) of EVC and Director of EVD (2007-2022). Mr. Faust is an interested person because of his positions with MSIM, BMR, EVM and EV, which are affiliates of the Trust.
Other Directorships. Formerly, Director of EVC (2007-2021) and Hexavest Inc. (investment management firm) (2012-2021). |
| Noninterested Trustees |
Alan C. Bowser(1)
1962 | Trustee | Since 2022 | Formerly, Chief Diversity Officer, Partner and a member of the Operating Committee, and formerly served as Senior Advisor on Diversity and Inclusion for the firm’s chief executive officer, Co-Head of the Americas Region, and Senior Client Advisor of Bridgewater Associates, an asset management firm (2011- 2023).
Other Directorships. None. |
Mark R. Fetting
1954 | Trustee | Since 2016 | Private investor. Formerly held various positions at Legg Mason, Inc. (investment management firm) (2000-2012), including President, Chief Executive Officer, Director and Chairman (2008-2012), Senior Executive Vice President (2004-2008) and Executive Vice President (2001-2004). Formerly, President of Legg Mason family of funds (2001-2008). Formerly, Division President and Senior Officer of Prudential Financial Group, Inc. and related companies (investment management firm) (1991-2000).
Other Directorships. None. |
Cynthia E. Frost
1961 | Trustee | Since 2014 | Private investor. Formerly, Chief Investment Officer of Brown University (university endowment) (2000-2012). Formerly, Portfolio Strategist for Duke Management Company (university endowment manager) (1995-2000). Formerly, Managing Director, Cambridge Associates (investment consulting company) (1989-1995). Formerly, Consultant, Bain and Company (management consulting firm) (1987-1989). Formerly, Senior Equity Analyst, BA Investment Management Company (1983-1985).
Other Directorships. None. |
George J. Gorman
1952 | Chairperson
of the Board
and Trustee | Since 2021
(Chairperson) and
2014 (Trustee) | Principal at George J. Gorman LLC (consulting firm). Formerly, Senior Partner at Ernst & Young LLP (a registered public accounting firm) (1974-2009).
Other Directorships. None. |
Eaton Vance
Large-Cap Value Fund
December 31, 2022
Management and Organization — continued
| Name and Year of Birth | Trust
Position(s) | Length of Service | Principal Occupation(s) and Other Directorships
During Past Five Years and Other Relevant Experience |
| Noninterested Trustees (continued) |
Valerie A. Mosley
1960 | Trustee | Since 2014 | Chairwoman and Chief Executive Officer of Valmo Ventures (a consulting and investment firm). Founder of Upward Wealth, Inc., dba BrightUp, a fintech platform. Formerly, Partner and Senior Vice President, Portfolio Manager and Investment Strategist at Wellington Management Company, LLP (investment management firm) (1992-2012). Formerly, Chief Investment Officer, PG Corbin Asset Management (1990-1992). Formerly worked in institutional corporate bond sales at Kidder Peabody (1986-1990).
Other Directorships. Director of DraftKings, Inc. (digital sports entertainment and gaming company) (since September 2020). Director of Envestnet, Inc. (provider of intelligent systems for wealth management and financial wellness) (since 2018). Formerly, Director of Dynex Capital, Inc. (mortgage REIT) (2013-2020) and Director of Groupon, Inc. (e-commerce provider) (2020-2022). |
Keith Quinton
1958 | Trustee | Since 2018 | Private investor, researcher and lecturer. Formerly, Independent Investment Committee Member at New Hampshire Retirement System (2017-2021). Formerly, Portfolio Manager and Senior Quantitative Analyst at Fidelity Investments (investment management firm) (2001-2014).
Other Directorships. Formerly, Director (2016-2021) and Chairman (2019-2021) of New Hampshire Municipal Bond Bank. |
Marcus L. Smith
1966 | Trustee | Since 2018 | Private investor and independent corporate director. Formerly, Chief Investment Officer, Canada (2012-2017), Chief Investment Officer, Asia (2010-2012), Director of Asian Research (2004-2010) and portfolio manager (2001-2017) at MFS Investment Management (investment management firm).
Other Directorships. Director of First Industrial Realty Trust, Inc. (an industrial REIT) (since 2021). Director of MSCI Inc. (global provider of investment decision support tools) (since 2017). Formerly, Director of DCT Industrial Trust Inc. (logistics real estate company) (2017-2018). |
Susan J. Sutherland
1957 | Trustee | Since 2015 | Private investor. Director of Ascot Group Limited and certain of its subsidiaries (insurance and reinsurance) (since 2017). Formerly, Director of Hagerty Holding Corp. (insurance) (2015-2018) and Montpelier Re Holdings Ltd. (insurance and reinsurance) (2013-2015). Formerly, Associate, Counsel and Partner at Skadden, Arps, Slate, Meagher & Flom LLP (law firm) (1982-2013).
Other Directorships. Formerly, Director of Kairos Acquisition Corp. (insurance/InsurTech acquisition company) (2021-2023). |
Scott E. Wennerholm
1959 | Trustee | Since 2016 | Private investor. Formerly, Trustee at Wheelock College (postsecondary institution) (2012-2018). Formerly, Consultant at GF Parish Group (executive recruiting firm) (2016-2017). Formerly, Chief Operating Officer and Executive Vice President at BNY Mellon Asset Management (investment management firm) (2005-2011). Formerly, Chief Operating Officer and Chief Financial Officer at Natixis Global Asset Management (investment management firm) (1997-2004). Formerly, Vice President at Fidelity Investments Institutional Services (investment management firm) (1994-1997).
Other Directorships. None. |
Nancy A. Wiser(1)
1967 | Trustee | Since 2022 | Formerly, Executive Vice President and the Global Head of Operations at Wells Fargo Asset Management (2011-2021).
Other Directorships. None. |
| Name and Year of Birth | Trust
Position(s) | Length of Service | Principal Occupation(s)
During Past Five Years |
| Principal Officers who are not Trustees |
Eric A. Stein
1980 | President | Since 2020 | Vice President and Chief Investment Officer, Fixed Income of EVM and BMR. Prior to November 1, 2020, Mr. Stein was a co-Director of Eaton Vance’s Global Income Investments. Also Vice President of Calvert Research and Management (“CRM”). |
Deidre E. Walsh
1971 | Vice President and
Chief Legal Officer | Since 2009 | Vice President of EVM and BMR. Also Vice President of CRM. |
James F. Kirchner
1967 | Treasurer | Since 2007 | Vice President of EVM and BMR. Also Vice President of CRM. |
Eaton Vance
Large-Cap Value Fund
December 31, 2022
Management and Organization — continued
| Name and Year of Birth | Trust
Position(s) | Length of Service | Principal Occupation(s)
During Past Five Years |
| Principal Officers who are not Trustees (continued) |
Nicholas Di Lorenzo
1987 | Secretary | Since 2022 | Formerly, associate (2012-2021) and counsel (2022) at Dechert LLP. |
Richard F. Froio
1968 | Chief Compliance
Officer | Since 2017 | Vice President of EVM and BMR since 2017. Formerly, Deputy Chief Compliance Officer (Adviser/Funds) and Chief Compliance Officer (Distribution) at PIMCO (2012-2017) and Managing Director at BlackRock/Barclays Global Investors (2009-2012). |
(1) Mr. Bowser and Ms. Wiser began serving as Trustees effective April 4, 2022.
The SAI for the Fund includes additional information about the Trustees and officers of the Fund and can be obtained without charge on Eaton Vance’s website at www.eatonvance.com or by calling 1-800-262-1122.
| FACTS | WHAT DOES EATON VANCE DO WITH YOUR
PERSONAL INFORMATION? |
| Why? | Financial companies choose how they share your personal information. Federal law gives consumers the right to limit some but not all sharing. Federal law also requires us to tell you how we collect, share, and protect your personal information. Please read this notice carefully to understand what we do. |
| |
| What? | The types of personal information we collect and share depend on the product or service you have with us. This information can include:■ Social Security number and income
■ investment experience and risk tolerance
■ checking account number and wire transfer instructions |
| |
| How? | All financial companies need to share customers’ personal information to run their everyday business. In the section below, we list the reasons financial companies can share their customers’ personal information; the reasons Eaton Vance chooses to share; and whether you can limit this sharing. |
Reasons we can share your
personal information | Does Eaton Vance
share? | Can you limit
this sharing? |
| For our everyday business purposes — such as to process your transactions, maintain your account(s), respond to court orders and legal investigations, or report to credit bureaus | Yes | No |
| For our marketing purposes — to offer our products and services to you | Yes | No |
| For joint marketing with other financial companies | No | We don’t share |
| For our investment management affiliates’ everyday business purposes — information about your transactions, experiences, and creditworthiness | Yes | Yes |
| For our affiliates’ everyday business purposes — information about your transactions and experiences | Yes | No |
| For our affiliates’ everyday business purposes — information about your creditworthiness | No | We don’t share |
| For our investment management affiliates to market to you | Yes | Yes |
| For our affiliates to market to you | No | We don’t share |
| For nonaffiliates to market to you | No | We don’t share |
To limit our
sharing | Call toll-free 1-800-262-1122 or email: EVPrivacy@eatonvance.comPlease note:If you are a new customer, we can begin sharing your information 30 days from the date we sent this notice. When you are no longer our customer, we continue to share your information as described in this notice. However, you can contact us at any time to limit our sharing. |
| Questions? | Call toll-free 1-800-262-1122 or email: EVPrivacy@eatonvance.com |
| Privacy Notice — continued | April 2021 |
| Who we are |
| Who is providing this notice? | Eaton Vance Management, Eaton Vance Distributors, Inc., Eaton Vance Trust Company, Eaton Vance Management (International) Limited, Eaton Vance Advisers International Ltd., Eaton Vance Global Advisors Limited, Eaton Vance Management’s Real Estate Investment Group, Boston Management and Research, Calvert Research and Management, Eaton Vance and Calvert Fund Families and our investment advisory affiliates (“Eaton Vance”) (see Investment Management Affiliates definition below) |
| What we do |
How does Eaton Vance
protect my personal
information? | To protect your personal information from unauthorized access and use, we use security measures that comply with federal law. These measures include computer safeguards and secured files and buildings. We have policies governing the proper handling of customer information by personnel and requiring third parties that provide support to adhere to appropriate security standards with respect to such information. |
How does Eaton Vance
collect my personal
information? | We collect your personal information, for example, when you■ open an account or make deposits or withdrawals from your account
■ buy securities from us or make a wire transfer
■ give us your contact informationWe also collect your personal information from others, such as credit bureaus, affiliates, or other companies. |
| Why can’t I limit all sharing? | Federal law gives you the right to limit only■ sharing for affiliates’ everyday business purposes — information about your creditworthiness
■ affiliates from using your information to market to you
■ sharing for nonaffiliates to market to youState laws and individual companies may give you additional rights to limit sharing. See below for more on your rights under state law. |
| Definitions |
Investment Management
Affiliates | Eaton Vance Investment Management Affiliates include registered investment advisers, registered broker- dealers, and registered and unregistered funds. Investment Management Affiliates does not include entities associated with Morgan Stanley Wealth Management, such as Morgan Stanley Smith Barney LLC and Morgan Stanley & Co. |
| Affiliates | Companies related by common ownership or control. They can be financial and nonfinancial companies.■ Our affiliates include companies with a Morgan Stanley name and financial companies such as Morgan Stanley Smith Barney LLC and Morgan Stanley & Co. |
| Nonaffiliates | Companies not related by common ownership or control. They can be financial and nonfinancial companies.■ Eaton Vance does not share with nonaffiliates so they can market to you. |
| Joint marketing | A formal agreement between nonaffiliated financial companies that together market financial products or services to you.■ Eaton Vance doesn’t jointly market. |
| Other important information |
| Vermont: Except as permitted by law, we will not share personal information we collect about Vermont residents with Nonaffiliates unless you provide us with your written consent to share such information.California: Except as permitted by law, we will not share personal information we collect about California residents with Nonaffiliates and we will limit sharing such personal information with our Affiliates to comply with California privacy laws that apply to us. |
Delivery of Shareholder Documents. The Securities and Exchange Commission (SEC) permits funds to deliver only one copy of shareholder documents, including prospectuses, proxy statements and shareholder reports, to fund investors with multiple accounts at the same residential or post office box address. This practice is often called “householding” and it helps eliminate duplicate mailings to shareholders. Eaton Vance, or your financial intermediary, may household the mailing of your documents indefinitely unless you instruct Eaton Vance, or your financial intermediary, otherwise. If you would prefer that your Eaton Vance documents not be householded, please contact Eaton Vance at 1-800-262-1122, or contact your financial intermediary. Your instructions that householding not apply to delivery of your Eaton Vance documents will typically be effective within 30 days of receipt by Eaton Vance or your financial intermediary.
Portfolio Holdings. Each Eaton Vance Fund and its underlying Portfolio(s) (if applicable) files a schedule of portfolio holdings on Part F to Form N-PORT with the SEC. Certain information filed on Form N-PORT may be viewed on the Eaton Vance website at www.eatonvance.com, by calling Eaton Vance at 1-800-262-1122 or in the EDGAR database on the SEC’s website at www.sec.gov.
Proxy Voting. From time to time, funds are required to vote proxies related to the securities held by the funds. The Eaton Vance Funds or their underlying Portfolios (if applicable) vote proxies according to a set of policies and procedures approved by the Funds’ and Portfolios’ Boards. You may obtain a description of these policies and procedures and information on how the Funds or Portfolios voted proxies relating to portfolio securities during the most recent 12-month period ended June 30, without charge, upon request, by calling 1-800-262-1122 and by accessing the SEC’s website at www.sec.gov.
This Page Intentionally Left Blank
This Page Intentionally Left Blank
This Page Intentionally Left Blank
Investment Adviser
Boston Management and Research
Two International Place
Boston, MA 02110
Administrator
Eaton Vance Management
Two International Place
Boston, MA 02110
Principal Underwriter*
Eaton Vance Distributors, Inc.
Two International Place
Boston, MA 02110
(617) 482-8260
Custodian
State Street Bank and Trust Company
State Street Financial Center, One Lincoln Street
Boston, MA 02111
Transfer Agent
BNY Mellon Investment Servicing (US) Inc.
Attn: Eaton Vance Funds
P.O. Box 534439
Pittsburgh, PA 15253-4439
(800) 262-1122
Independent Registered Public Accounting Firm
Deloitte & Touche LLP
200 Berkeley Street
Boston, MA 02116-5022
Fund Offices
Two International Place
Boston, MA 02110
* FINRA BrokerCheck. Investors may check the background of their Investment Professional by contacting the Financial Industry Regulatory Authority (FINRA). FINRA BrokerCheck is a free tool to help investors check the professional background of current and former FINRA-registered securities firms and brokers. FINRA BrokerCheck is available by calling 1-800-289-9999 and at www.FINRA.org. The FINRA BrokerCheck brochure describing this program is available to investors at www.FINRA.org.
Eaton Vance
Small-Cap Fund
Annual Report
December 31, 2022
Commodity Futures Trading Commission Registration. The Commodity Futures Trading Commission (“CFTC”) has adopted regulations that subject registered investment companies and advisers to regulation by the CFTC if a fund invests more than a prescribed level of its assets in certain CFTC-regulated instruments (including futures, certain options and swap agreements) or markets itself as providing investment exposure to such instruments. The investment adviser has claimed an exclusion from the definition of “commodity pool operator” under the Commodity Exchange Act with respect to its management of the Fund. Accordingly, neither the Fund nor the adviser with respect to the operation of the Fund is subject to CFTC regulation. Because of its management of other strategies, the Fund's adviser is registered with the CFTC as a commodity pool operator. The adviser is also registered as a commodity trading advisor.
Fund shares are not insured by the FDIC and are not deposits or other obligations of, or guaranteed by, any depository institution. Shares are subject to investment risks, including possible loss of principal invested.
This report must be preceded or accompanied by a current summary prospectus or prospectus. Before investing, investors should consider carefully the investment objective, risks, and charges and expenses of a mutual fund. This and other important information is contained in the summary prospectus and prospectus, which can be obtained from a financial intermediary. Prospective investors should read the prospectus carefully before investing. For further information, please call 1-800-262-1122.
Annual Report December 31, 2022
Eaton Vance
Small-Cap Fund
Eaton Vance
Small-Cap Fund
December 31, 2022
Management’s Discussion of Fund Performance†
Economic and Market Conditions
During the 12-month period starting January 1, 2022, the U.S. equity market was dominated by the ongoing effects of one black swan event -- the COVID-19 pandemic -- and fallout from another -- Russia’s invasion of Ukraine.
As the new year began, investors became increasingly concerned about the twin threats of inflation and interest rate hikes. As a result, stock performance turned negative -- a sharp about-face from the all-time highs many U.S. equity indexes had posted in late 2021.
In February, Russia’s invasion of Ukraine sent shock waves through U.S. and global markets, exacerbating inflationary pressures on energy and food costs. The U.S. Federal Reserve (the Fed) -- along with other central banks around the world -- initiated its first interest rate hikes in years.
Investors began to expect the Fed would raise interest rates at every policy meeting in 2022 and, in turn, worried that aggressive rate hikes could tip the economy into recession. At its June, July, September, and November 2022 policy meetings, the Fed hiked the federal funds rate 0.75% each time -- its first moves of that magnitude since 1994. Higher interest rates, inflation, and recessionary worries drove stock prices down, with rate-sensitive technology stocks -- star performers earlier in the pandemic -- suffering some of the worst declines.
In October and November 2022, however, U.S. stocks delivered positive performance for the first time in months. The rally was driven by a combination of better-than-expected company earnings, declining inflation, and hope that the Fed would temper the size of future rate hikes.
But while the Fed indeed delivered a smaller 0.50% rate hike in December, it raised its expectation of how high rates might go in 2023. As investors digested the news that rates could stay higher for longer than previously expected, equity prices declined in the final month of 2022.
For the period as a whole, the blue-chip Dow Jones Industrial Average® returned -6.86%; the S&P 500® Index, a broad measure of U.S. stocks, returned -18.11%; and the technology-laden Nasdaq Composite Index returned -32.54%.
Fund Performance
For the 12-month period ended December 31, 2022, Eaton Vance Small-Cap Fund (the Fund) returned -15.53% for Class A shares at net asset value (NAV), outperforming its benchmark, the Russell 2000® Index (the Index), which returned -20.44%.
Outperformance by the Fund relative to the Index was largely driven by stock selections, especially in the consumer discretionary and health care sectors. The Fund’s selections in consumer discretionary significantly reduced the negative impact of its overweight exposure to the sector -- one of the worst-performing sectors within the Index.
The Fund’s underweight exposure to, and selections in the health care sector -- also among the worst-performers -- contributed to returns relative to the Index during the period. Selections in the consumer staples sector benefited relative performance during the period.
In contrast, the Fund’s underweight exposure to the energy sector -- the only sector with positive returns during the period with gains of more than 50% -- was the leading detractor from Fund performance relative to the Index. Security selections in the communication services and industrials sectors also detracted from relative returns during the period.
Performance Food Group Co. (Performance) was a leading contributor to returns relative to the Index during the period. Performance’s share price rose on strong growth in sales and profits attributed in part to the food distributor’s 2021 acquisition of Core-Mark Holding Co., Inc., a distributor to convenience stores.
CBIZ, Inc., (CBIZ), a management consulting company, and RLI Corp. (RLI), a property and casualty insurance company, also contributed to Fund returns relative to the Index during the period. CBIZ’s share price rose after the company reported strong earnings and revenue growth during the first three quarters of 2022, and issued robust projections for the remainder of its fiscal year. The stock price of RLI rose sharply after the company reported better-than-expected earnings in the third quarter of 2022.
AZEK Co., Inc., (AZEK), an outdoor furniture manufacturer, was among the largest detractors from Fund returns relative to the Index during the period. AZEK’s stock price fell on concerns that rate-hike projections by the U.S. Federal Reserve might weigh on home purchases and improvements, thereby decreasing demand for its products.
In the information technology sector, Ambarella, Inc. (Ambarella), a designer of semiconductors for high-definition video, detracted from relative returns during the period. Ambarella’s stock price fell after the company announced lower-than-expected revenue and earnings projections for the first quarter of its 2023 fiscal year. Ambarella attributed the disappointing projections to slowing demand from disruptions in customer supply chains. By period-end, the stock was sold from the Fund.
See Endnotes and Additional Disclosures in this report.
Past performance is no guarantee of future results. Returns are historical and are calculated by determining the percentage change in net asset value (NAV) or offering price (as applicable) with all distributions reinvested. Furthermore, returns do not reflect the deduction of taxes that shareholders may have to pay on Fund distributions or upon the redemption of Fund shares. Investment return and principal value will fluctuate so that shares, when redeemed, may be worth more or less than their original cost. Performance for periods less than or equal to one year is cumulative. Performance is for the stated time period only; due to market volatility, current Fund performance may be lower or higher than the quoted return. For performance as of the most recent month-end, please refer to eatonvance.com.
Eaton Vance
Small-Cap Fund
December 31, 2022
Management’s Discussion of Fund Performance† — continued
Cargurus, Inc., an automotive research and shopping website, was also among the largest detractors from relative returns during the period. The company’s share price fell after its management projected lower-than-expected earnings for the second quarter of 2022, and declining traffic on its website.
See Endnotes and Additional Disclosures in this report.
Past performance is no guarantee of future results. Returns are historical and are calculated by determining the percentage change in net asset value (NAV) or offering price (as applicable) with all distributions reinvested. Furthermore, returns do not reflect the deduction of taxes that shareholders may have to pay on Fund distributions or upon the redemption of Fund shares. Investment return and principal value will fluctuate so that shares, when redeemed, may be worth more or less than their original cost. Performance for periods less than or equal to one year is cumulative. Performance is for the stated time period only; due to market volatility, current Fund performance may be lower or higher than the quoted return. For performance as of the most recent month-end, please refer to eatonvance.com.
Eaton Vance
Small-Cap Fund
December 31, 2022
Performance
Portfolio Manager(s) Michael D. McLean, CFA and J. Griffith Noble, CFA
| % Average Annual Total Returns1,2 | Class
Inception Date | Performance
Inception Date | One Year | Five Years | Ten Years |
| Class A at NAV | 01/02/1997 | 01/02/1997 | (15.53)% | 6.74% | 9.99% |
| Class A with 5.25% Maximum Sales Charge | — | — | (19.95) | 5.60 | 9.40 |
| Class C at NAV | 05/03/2002 | 01/02/1997 | (16.17) | 5.94 | 9.34 |
| Class C with 1% Maximum Deferred Sales Charge | — | — | (16.98) | 5.94 | 9.34 |
| Class I at NAV | 09/02/2008 | 01/02/1997 | (15.31) | 7.01 | 10.27 |
| Class R at NAV | 08/03/2009 | 01/02/1997 | (15.73) | 6.48 | 9.72 |
|
| Russell 2000® Index | — | — | (20.44)% | 4.12% | 9.01% |
| % Total Annual Operating Expense Ratios3 | Class A | Class C | Class I | Class R |
| Gross | 1.38% | 2.13% | 1.13% | 1.63% |
| Net | 1.21 | 1.96 | 0.96 | 1.46 |
Growth of $10,000
This graph shows the change in value of a hypothetical investment of $10,000 in Class A of the Fund for the period indicated. For comparison, the same investment is shown in the indicated index.
| Growth of Investment | Amount Invested | Period Beginning | At NAV | With Maximum Sales Charge |
| Class C | $10,000 | 12/31/2012 | $24,424 | N.A. |
| Class I, at minimum investment | $1,000,000 | 12/31/2012 | $2,658,828 | N.A. |
| Class R | $10,000 | 12/31/2012 | $25,302 | N.A. |
See Endnotes and Additional Disclosures in this report.
Past performance is no guarantee of future results. Returns are historical and are calculated by determining the percentage change in net asset value (NAV) or offering price (as applicable) with all distributions reinvested. Furthermore, returns do not reflect the deduction of taxes that shareholders may have to pay on Fund distributions or upon the redemption of Fund shares. Investment return and principal value will fluctuate so that shares, when redeemed, may be worth more or less than their original cost. Performance for periods less than or equal to one year is cumulative. Performance is for the stated time period only; due to market volatility, current Fund performance may be lower or higher than the quoted return. For performance as of the most recent month-end, please refer to eatonvance.com.
Eaton Vance
Small-Cap Fund
December 31, 2022
| Sector Allocation (% of net assets)1 |
| Top 10 Holdings (% of net assets)1 |
| Chemed Corp. | 2.8% |
| CBIZ, Inc. | 2.7 |
| Valvoline, Inc. | 2.6 |
| AAON, Inc. | 2.4 |
| Addus HomeCare Corp. | 2.4 |
| RLI Corp. | 2.4 |
| ONE Gas, Inc. | 2.3 |
| Dorman Products, Inc. | 2.3 |
| Essential Properties Realty Trust, Inc. | 2.3 |
| Commerce Bancshares, Inc. | 2.2 |
| Total | 24.4% |
Footnotes:
| 1 | Excludes cash and cash equivalents. |
Eaton Vance
Small-Cap Fund
December 31, 2022
Endnotes and Additional Disclosures
| † | The views expressed in this report are those of the portfolio manager(s) and are current only through the date stated at the top of this page. These views are subject to change at any time based upon market or other conditions, and Eaton Vance and the Fund(s) disclaim any responsibility to update such views. These views may not be relied upon as investment advice and, because investment decisions are based on many factors, may not be relied upon as an indication of trading intent on behalf of any Eaton Vance fund. This commentary may contain statements that are not historical facts, referred to as “forward-looking statements.” The Fund’s actual future results may differ significantly from those stated in any forward-looking statement, depending on factors such as changes in securities or financial markets or general economic conditions, the volume of sales and purchases of Fund shares, the continuation of investment advisory, administrative and service contracts, and other risks discussed from time to time in the Fund’s filings with the Securities and Exchange Commission. |
| | |
| 1 | Russell 2000® Index is an unmanaged index of 2,000 U.S. small-cap stocks. Unless otherwise stated, index returns do not reflect the effect of any applicable sales charges, commissions, expenses, taxes or leverage, as applicable. It is not possible to invest directly in an index. |
| 2 | Total Returns at NAV do not include applicable sales charges. If sales charges were deducted, the returns would be lower. Total Returns shown with maximum sales charge reflect the stated maximum sales charge. Unless otherwise stated, performance does not reflect the deduction of taxes on Fund distributions or redemptions of Fund shares.Effective November 5, 2020, Class C shares automatically convert to Class A shares eight years after purchase. The average annual total returns listed for Class C reflect conversion to Class A shares after eight years. Prior to November 5, 2020, Class C shares automatically converted to Class A shares ten years after purchase. |
| 3 | Source: Fund prospectus. Net expense ratios reflect a contractual expense reimbursement that continues through 4/30/23. The expense ratios for the current reporting period can be found in the Financial Highlights section of this report. Performance reflects expenses waived and/or reimbursed, if applicable. Without such waivers and/or reimbursements, performance would have been lower. |
| | Fund profile subject to change due to active management. |
| | Additional Information |
| | S&P 500® Index is an unmanaged index of large-cap stocks commonly used as a measure of U.S. stock market performance. Dow Jones Industrial Average® is a price-weighted average of 30 blue-chip stocks that are generally the leaders in their industry. S&P Dow Jones Indices are a product of S&P Dow Jones Indices LLC (“S&P DJI”) and have been licensed for use. S&P® and S&P 500® are registered trademarks of S&P DJI; Dow Jones® is a registered trademark of Dow Jones Trademark Holdings LLC (“Dow Jones”); S&P DJI, Dow Jones and their respective affiliates do not sponsor, endorse, sell or promote the Fund, will not have any liability with respect thereto and do not have any liability for any errors, omissions, or interruptions of the S&P Dow Jones Indices. Nasdaq Composite Index is a market capitalization-weighted index of all domestic and international securities listed on Nasdaq. |
| | Source: Nasdaq, Inc. The information is provided by Nasdaq (with its affiliates, are referred to as the “Corporations”) and Nasdaq’s third party licensors on an “as is” basis and the Corporations make no guarantees and bear no liability of any kind with respect to the information or the Fund. |
Eaton Vance
Small-Cap Fund
December 31, 2022
Example
As a Fund shareholder, you incur two types of costs: (1) transaction costs, including sales charges (loads) on purchases; and (2) ongoing costs, including management fees; distribution and/or service fees; and other Fund expenses. This Example is intended to help you understand your ongoing costs (in dollars) of Fund investing and to compare these costs with the ongoing costs of investing in other mutual funds. The Example is based on an investment of $1,000 invested at the beginning of the period and held for the entire period (July 1, 2022 to December 31, 2022).
Actual Expenses
The first section of the table below provides information about actual account values and actual expenses. You may use the information in this section, together with the amount you invested, to estimate the expenses that you paid over the period. Simply divide your account value by $1,000 (for example, an $8,600 account value divided by $1,000 = 8.6), then multiply the result by the number in the first section under the heading entitled “Expenses Paid During Period” to estimate the expenses you paid on your account during this period.
Hypothetical Example for Comparison Purposes
The second section of the table below provides information about hypothetical account values and hypothetical expenses based on the actual Fund expense ratio and an assumed rate of return of 5% per year (before expenses), which is not the actual Fund return. The hypothetical account values and expenses may not be used to estimate the actual ending account balance or expenses you paid for the period. You may use this information to compare the ongoing costs of investing in your Fund and other funds. To do so, compare this 5% hypothetical example with the 5% hypothetical examples that appear in the shareholder reports of the other funds.
Please note that the expenses shown in the table are meant to highlight your ongoing costs only and do not reflect any transactional costs, such as sales charges (loads). Therefore, the second section of the table is useful in comparing ongoing costs only, and will not help you determine the relative total costs of owning different funds. In addition, if these transactional costs were included, your costs would be higher.
| | Beginning
Account Value
(7/1/22) | Ending
Account Value
(12/31/22) | Expenses Paid
During Period*
(7/1/22 – 12/31/22) | Annualized
Expense
Ratio |
| Actual | | | | |
| Class A | $1,000.00 | $1,036.90 | $ 6.21** | 1.21% |
| Class C | $1,000.00 | $1,033.00 | $10.04** | 1.96% |
| Class I | $1,000.00 | $1,038.80 | $ 4.93** | 0.96% |
| Class R | $1,000.00 | $1,036.00 | $ 7.49** | 1.46% |
| |
| Hypothetical | | | | |
| (5% return per year before expenses) | | | | |
| Class A | $1,000.00 | $1,019.11 | $ 6.16** | 1.21% |
| Class C | $1,000.00 | $1,015.33 | $ 9.96** | 1.96% |
| Class I | $1,000.00 | $1,020.37 | $ 4.89** | 0.96% |
| Class R | $1,000.00 | $1,017.85 | $ 7.43** | 1.46% |
| * | Expenses are equal to the Fund's annualized expense ratio for the indicated Class, multiplied by the average account value over the period, multiplied by 184/365 (to reflect the one-half year period). The Example assumes that the $1,000 was invested at the net asset value per share determined at the close of business on June 30, 2022. |
| ** | Absent an allocation of certain expenses to an affiliate, expenses would be higher. |
Eaton Vance
Small-Cap Fund
December 31, 2022
| Security | Shares | Value |
| Aerospace & Defense — 3.3% |
| Hexcel Corp. | | 40,254 | $ 2,368,948 |
| Woodward, Inc. | | 18,661 | 1,802,839 |
| | | | $ 4,171,787 |
| Auto Components — 4.3% |
| Dana, Inc. | | 75,512 | $ 1,142,496 |
| Dorman Products, Inc.(1) | | 35,698 | 2,886,897 |
| Visteon Corp.(1) | | 11,196 | 1,464,773 |
| | | | $ 5,494,166 |
| Automobiles — 0.7% |
| Harley-Davidson, Inc. | | 22,531 | $ 937,290 |
| | | | $ 937,290 |
| Banks — 12.0% |
| Commerce Bancshares, Inc. | | 40,871 | $ 2,782,089 |
| Community Bank System, Inc. | | 38,802 | 2,442,586 |
| CVB Financial Corp. | | 57,095 | 1,470,196 |
| Glacier Bancorp, Inc. | | 25,612 | 1,265,745 |
| Independent Bank Corp. | | 23,116 | 1,951,684 |
| SouthState Corp. | | 35,015 | 2,673,745 |
| Stock Yards Bancorp, Inc. | | 18,477 | 1,200,636 |
| Wintrust Financial Corp. | | 17,212 | 1,454,758 |
| | | | $ 15,241,439 |
| Biotechnology — 1.2% |
| Neurocrine Biosciences, Inc.(1) | | 12,424 | $ 1,483,922 |
| | | | $ 1,483,922 |
| Building Products — 6.7% |
| AAON, Inc. | | 41,065 | $ 3,093,016 |
| AZEK Co., Inc. (The)(1) | | 134,741 | 2,737,937 |
| CSW Industrials, Inc. | | 17,050 | 1,976,607 |
| Hayward Holdings, Inc.(1) | | 78,473 | 737,646 |
| | | | $ 8,545,206 |
| Capital Markets — 2.0% |
| Cohen & Steers, Inc. | | 18,031 | $ 1,164,082 |
| Stifel Financial Corp. | | 23,871 | 1,393,350 |
| | | | $ 2,557,432 |
| Security | Shares | Value |
| Chemicals — 4.2% |
| Quaker Houghton(1) | | 11,953 | $ 1,994,956 |
| Valvoline, Inc. | | 103,507 | 3,379,503 |
| | | | $ 5,374,459 |
| Commercial Services & Supplies — 1.9% |
| Rentokil Initial PLC ADR | | 78,574 | $ 2,420,865 |
| | | | $ 2,420,865 |
| Containers & Packaging — 1.4% |
| AptarGroup, Inc. | | 15,895 | $ 1,748,132 |
| | | | $ 1,748,132 |
| Diversified Consumer Services — 1.2% |
| Bright Horizons Family Solutions, Inc.(1) | | 25,026 | $ 1,579,141 |
| | | | $ 1,579,141 |
| Electronic Equipment, Instruments & Components — 1.4% |
| National Instruments Corp. | | 47,631 | $ 1,757,584 |
| | | | $ 1,757,584 |
| Equity Real Estate Investment Trusts (REITs) — 7.4% |
| CubeSmart | | 55,064 | $ 2,216,326 |
| EastGroup Properties, Inc. | | 13,229 | 1,958,686 |
| Essential Properties Realty Trust, Inc. | | 122,349 | 2,871,531 |
| Rexford Industrial Realty, Inc. | | 20,699 | 1,130,993 |
| Terreno Realty Corp. | | 20,912 | 1,189,265 |
| | | | $ 9,366,801 |
| Food & Staples Retailing — 2.6% |
| Chefs' Warehouse, Inc. (The)(1) | | 20,010 | $ 665,933 |
| Performance Food Group Co.(1) | | 46,138 | 2,693,998 |
| | | | $ 3,359,931 |
| Food Products — 1.0% |
| J&J Snack Foods Corp. | | 8,427 | $ 1,261,606 |
| | | | $ 1,261,606 |
| Gas Utilities — 2.3% |
| ONE Gas, Inc. | | 38,855 | $ 2,942,101 |
| | | | $ 2,942,101 |
| Health Care Equipment & Supplies — 6.4% |
| Envista Holdings Corp.(1) | | 67,468 | $ 2,271,647 |
| ICU Medical, Inc.(1) | | 6,129 | 965,195 |
| Inari Medical, Inc.(1) | | 14,043 | 892,573 |
8
See Notes to Financial Statements.
Eaton Vance
Small-Cap Fund
December 31, 2022
Portfolio of Investments — continued
| Security | Shares | Value |
| Health Care Equipment & Supplies (continued) |
| Integra LifeSciences Holdings Corp.(1) | | 42,057 | $ 2,358,136 |
| Neogen Corp.(1) | | 104,412 | 1,590,195 |
| | | | $ 8,077,746 |
| Health Care Providers & Services — 9.1% |
| Addus HomeCare Corp.(1) | | 30,615 | $ 3,045,886 |
| Agiliti, Inc.(1) | | 127,329 | 2,076,736 |
| Chemed Corp. | | 7,032 | 3,589,344 |
| R1 RCM, Inc.(1) | | 99,198 | 1,086,218 |
| U.S. Physical Therapy, Inc. | | 22,300 | 1,806,969 |
| | | | $ 11,605,153 |
| Hotels, Restaurants & Leisure — 3.2% |
| Papa John's International, Inc. | | 7,595 | $ 625,144 |
| Planet Fitness, Inc., Class A(1) | | 8,422 | 663,654 |
| Texas Roadhouse, Inc. | | 6,556 | 596,268 |
| Wyndham Hotels & Resorts, Inc. | | 30,737 | 2,191,856 |
| | | | $ 4,076,922 |
| Insurance — 8.1% |
| RLI Corp. | | 22,919 | $ 3,008,577 |
| Ryan Specialty Holdings, Inc., Class A(1) | | 62,286 | 2,585,492 |
| Selective Insurance Group, Inc. | | 25,902 | 2,295,176 |
| White Mountains Insurance Group, Ltd. | | 1,653 | 2,337,888 |
| | | | $ 10,227,133 |
| Interactive Media & Services — 0.7% |
| CarGurus, Inc.(1) | | 61,766 | $ 865,342 |
| | | | $ 865,342 |
| IT Services — 0.9% |
| Euronet Worldwide, Inc.(1) | | 11,828 | $ 1,116,327 |
| | | | $ 1,116,327 |
| Leisure Products — 0.8% |
| Brunswick Corp. | | 13,794 | $ 994,271 |
| | | | $ 994,271 |
| Machinery — 2.2% |
| Chart Industries, Inc.(1) | | 6,586 | $ 758,905 |
| Middleby Corp.(1) | | 15,122 | 2,024,836 |
| | | | $ 2,783,741 |
| Security | Shares | Value |
| Professional Services — 2.7% |
| CBIZ, Inc.(1) | | 74,493 | $ 3,489,997 |
| | | | $ 3,489,997 |
| Road & Rail — 2.0% |
| Landstar System, Inc.(1) | | 15,257 | $ 2,485,365 |
| | | | $ 2,485,365 |
| Software — 6.8% |
| Altair Engineering, Inc., Class A(1) | | 49,905 | $ 2,269,180 |
| Clearwater Analytics Holdings, Inc., Class A(1) | | 74,482 | 1,396,538 |
| Envestnet, Inc.(1) | | 41,382 | 2,553,269 |
| SPS Commerce, Inc.(1) | | 18,340 | 2,355,406 |
| | | | $ 8,574,393 |
| Specialty Retail — 0.4% |
| Five Below, Inc.(1) | | 2,911 | $ 514,869 |
| | | | $ 514,869 |
| Trading Companies & Distributors — 2.4% |
| Core & Main, Inc., Class A(1) | | 98,246 | $ 1,897,130 |
| Herc Holdings, Inc. | | 8,583 | 1,129,265 |
| | | | $ 3,026,395 |
Total Common Stocks
(identified cost $111,260,645) | | | $126,079,516 |
| Short-Term Investments — 2.1% |
| Security | Shares | Value |
| Morgan Stanley Institutional Liquidity Funds - Government Portfolio, Institutional Class, 4.11%(2) | | 2,628,256 | $ 2,628,256 |
Total Short-Term Investments
(identified cost $2,628,256) | | | $ 2,628,256 |
Total Investments — 101.4%
(identified cost $113,888,901) | | | $128,707,772 |
| Other Assets, Less Liabilities — (1.4)% | | | $ (1,716,552) |
| Net Assets — 100.0% | | | $126,991,220 |
| The percentage shown for each investment category in the Portfolio of Investments is based on net assets. |
| (1) | Non-income producing security. |
| (2) | May be deemed to be an affiliated investment company. The rate shown is the annualized seven-day yield as of December 31, 2022. |
9
See Notes to Financial Statements.
Eaton Vance
Small-Cap Fund
December 31, 2022
Portfolio of Investments — continued
| Abbreviations: |
| ADR | – American Depositary Receipt |
10
See Notes to Financial Statements.
Eaton Vance
Small-Cap Fund
December 31, 2022
Statement of Assets and Liabilities
| | December 31, 2022 |
| Assets | |
| Unaffiliated investments, at value (identified cost $111,260,645) | $ 126,079,516 |
| Affiliated investment, at value (identified cost $2,628,256) | 2,628,256 |
| Dividends receivable | 136,173 |
| Dividends receivable from affiliated investment | 10,608 |
| Receivable for Fund shares sold | 278,650 |
| Receivable from affiliate | 21,594 |
| Total assets | $129,154,797 |
| Liabilities | |
| Payable for investments purchased | $ 849,783 |
| Payable for Fund shares redeemed | 1,101,194 |
| Payable to affiliate: | |
| Investment adviser fee | 82,062 |
| Administration fee | 16,502 |
| Distribution and service fees | 7,359 |
| Trustees' fees | 2,405 |
| Accrued expenses | 104,272 |
| Total liabilities | $ 2,163,577 |
| Net Assets | $126,991,220 |
| Sources of Net Assets | |
| Paid-in capital | $ 114,524,622 |
| Distributable earnings | 12,466,598 |
| Net Assets | $126,991,220 |
| Class A Shares | |
| Net Assets | $ 21,475,484 |
| Shares Outstanding | 1,682,149 |
Net Asset Value and Redemption Price Per Share
(net assets ÷ shares of beneficial interest outstanding) | $ 12.77 |
Maximum Offering Price Per Share
(100 ÷ 94.75 of net asset value per share) | $ 13.48 |
| Class C Shares | |
| Net Assets | $ 3,299,460 |
| Shares Outstanding | 343,349 |
Net Asset Value and Offering Price Per Share*
(net assets ÷ shares of beneficial interest outstanding) | $ 9.61 |
| Class I Shares | |
| Net Assets | $ 101,802,111 |
| Shares Outstanding | 6,927,346 |
Net Asset Value, Offering Price and Redemption Price Per Share
(net assets ÷ shares of beneficial interest outstanding) | $ 14.70 |
| Class R Shares | |
| Net Assets | $ 414,165 |
| Shares Outstanding | 34,485 |
Net Asset Value, Offering Price and Redemption Price Per Share
(net assets ÷ shares of beneficial interest outstanding) | $ 12.01 |
| On sales of $50,000 or more, the offering price of Class A shares is reduced. |
| * | Redemption price per share is equal to the net asset value less any applicable contingent deferred sales charge. |
11
See Notes to Financial Statements.
Eaton Vance
Small-Cap Fund
December 31, 2022
| | Year Ended |
| | December 31, 2022 |
| Investment Income | |
| Dividend income | $ 1,567,622 |
| Dividend income from affiliated investments | 38,125 |
| Total investment income | $ 1,605,747 |
| Expenses | |
| Investment adviser fee | $ 995,976 |
| Administration fee | 199,195 |
| Distribution and service fees: | |
| Class A | 60,337 |
| Class C | 28,692 |
| Class R | 2,198 |
| Trustees’ fees and expenses | 9,277 |
| Custodian fee | 44,672 |
| Transfer and dividend disbursing agent fees | 121,531 |
| Legal and accounting services | 44,270 |
| Printing and postage | 19,591 |
| Registration fees | 58,458 |
| Miscellaneous | 16,787 |
| Total expenses | $ 1,600,984 |
| Deduct: | |
| Waiver and/or reimbursement of expenses by affiliate | $ 236,918 |
| Total expense reductions | $ 236,918 |
| Net expenses | $ 1,364,066 |
| Net investment income | $ 241,681 |
| Realized and Unrealized Gain (Loss) | |
| Net realized gain (loss): | |
| Investment transactions | $ 799,579 |
| Investment transactions - affiliated investment | 494 |
| Net realized gain | $ 800,073 |
| Change in unrealized appreciation (depreciation): | |
| Investments | $ (24,484,989) |
| Net change in unrealized appreciation (depreciation) | $(24,484,989) |
| Net realized and unrealized loss | $(23,684,916) |
| Net decrease in net assets from operations | $(23,443,235) |
12
See Notes to Financial Statements.
Eaton Vance
Small-Cap Fund
December 31, 2022
Statements of Changes in Net Assets
| | Year Ended December 31, |
| | 2022 | 2021 |
| Increase (Decrease) in Net Assets | | |
| From operations: | | |
| Net investment income (loss) | $ 241,681 | $ (95,977) |
| Net realized gain | 800,073 | 18,348,401 |
| Net change in unrealized appreciation (depreciation) | (24,484,989) | 6,733,999 |
| Net increase (decrease) in net assets from operations | $ (23,443,235) | $ 24,986,423 |
| Distributions to shareholders: | | |
| Class A | $ (672,544) | $ (3,568,657) |
| Class C | (101,154) | (485,866) |
| Class I | (3,060,852) | (12,370,274) |
| Class R | (12,713) | (56,381) |
| Total distributions to shareholders | $ (3,847,263) | $ (16,481,178) |
| Transactions in shares of beneficial interest: | | |
| Class A | $ (2,246,859) | $ 359,461 |
| Class C | 681,812 | (402,915) |
| Class I | 12,153,067 | 21,857,792 |
| Class R | 50,437 | (161,144) |
| Net increase in net assets from Fund share transactions | $ 10,638,457 | $ 21,653,194 |
| Net increase (decrease) in net assets | $ (16,652,041) | $ 30,158,439 |
| Net Assets | | |
| At beginning of year | $ 143,643,261 | $ 113,484,822 |
| At end of year | $126,991,220 | $143,643,261 |
13
See Notes to Financial Statements.
Eaton Vance
Small-Cap Fund
December 31, 2022
| | Class A |
| | Year Ended December 31, |
| | 2022 | 2021 | 2020 | 2019 | 2018 |
| Net asset value — Beginning of year | $ 15.590 | $ 14.690 | $ 13.190 | $ 11.100 | $ 13.150 |
| Income (Loss) From Operations | | | | | |
| Net investment income (loss)(1) | $ (0.002) | $ (0.041) | $ 0.001 | $ (0.008) | $ (0.026) |
| Net realized and unrealized gain (loss) | (2.407) | 3.103 | 1.654 | 3.046 | (0.660) |
| Total income (loss) from operations | $ (2.409) | $ 3.062 | $ 1.655 | $ 3.038 | $ (0.686) |
| Less Distributions | | | | | |
| From net realized gain | $ (0.411) | $ (2.162) | $ (0.155) | $ (0.948) | $ (1.364) |
| Total distributions | $ (0.411) | $ (2.162) | $ (0.155) | $ (0.948) | $ (1.364) |
| Net asset value — End of year | $12.770 | $15.590 | $14.690 | $13.190 | $11.100 |
| Total Return(2)(3) | (15.53)% | 21.18% | 12.73% | 27.54% | (5.81)% |
| Ratios/Supplemental Data | | | | | |
| Net assets, end of year (000’s omitted) | $ 21,475 | $ 28,882 | $ 26,683 | $ 24,530 | $ 19,329 |
| Ratios (as a percentage of average daily net assets): | | | | | |
| Expenses (3) | 1.21% (4) | 1.21% | 1.21% | 1.21% | 1.35% |
| Net investment income (loss) | (0.02)% | (0.25)% | 0.01% | (0.06)% | (0.19)% |
| Portfolio Turnover | 53% | 55% | 71% | 54% | 44% |
| (1) | Computed using average shares outstanding. |
| (2) | Returns are historical and are calculated by determining the percentage change in net asset value with all distributions reinvested and do not reflect the effect of sales charges. |
| (3) | The administrator reimbursed certain operating expenses (equal to 0.18%, 0.17%, 0.25%, 0.29% and 0.17% of average daily net assets for the years ended December 31, 2022, 2021, 2020, 2019 and 2018, respectively). Absent this reimbursement, total return would be lower. |
| (4) | Includes a reduction by the investment adviser of a portion of its adviser fee due to the Fund's investment in the Liquidity Fund (equal to less than 0.005% of average daily net assets for the year ended December 31, 2022). |
14
See Notes to Financial Statements.
Eaton Vance
Small-Cap Fund
December 31, 2022
Financial Highlights — continued
| | Class C |
| | Year Ended December 31, |
| | 2022 | 2021 | 2020 | 2019 | 2018 |
| Net asset value — Beginning of year | $11.880 | $ 11.630 | $ 10.550 | $ 9.100 | $11.110 |
| Income (Loss) From Operations | | | | | |
| Net investment loss(1) | $ (0.076) | $ (0.131) | $ (0.074) | $ (0.092) | $ (0.108) |
| Net realized and unrealized gain (loss) | (1.834) | 2.440 | 1.309 | 2.490 | (0.538) |
| Total income (loss) from operations | $ (1.910) | $ 2.309 | $ 1.235 | $ 2.398 | $ (0.646) |
| Less Distributions | | | | | |
| From net realized gain | $ (0.360) | $ (2.059) | $ (0.155) | $ (0.948) | $ (1.364) |
| Total distributions | $ (0.360) | $ (2.059) | $ (0.155) | $ (0.948) | $ (1.364) |
| Net asset value — End of year | $ 9.610 | $11.880 | $11.630 | $10.550 | $ 9.100 |
| Total Return(2)(3) | (16.17)% | 20.25% | 11.93% | 26.54% | (6.52)% |
| Ratios/Supplemental Data | | | | | |
| Net assets, end of year (000’s omitted) | $ 3,299 | $ 3,254 | $ 3,517 | $ 4,564 | $ 7,356 |
| Ratios (as a percentage of average daily net assets): | | | | | |
| Expenses (3) | 1.96% (4) | 1.96% | 1.96% | 1.96% | 2.10% |
| Net investment loss | (0.74)% | (1.01)% | (0.76)% | (0.87)% | (0.94)% |
| Portfolio Turnover | 53% | 55% | 71% | 54% | 44% |
| (1) | Computed using average shares outstanding. |
| (2) | Returns are historical and are calculated by determining the percentage change in net asset value with all distributions reinvested and do not reflect the effect of sales charges. |
| (3) | The administrator reimbursed certain operating expenses (equal to 0.18%, 0.17%, 0.25%, 0.29% and 0.17% of average daily net assets for the years ended December 31, 2022, 2021, 2020, 2019 and 2018, respectively). Absent this reimbursement, total return would be lower. |
| (4) | Includes a reduction by the investment adviser of a portion of its adviser fee due to the Fund's investment in the Liquidity Fund (equal to less than 0.005% of average daily net assets for the year ended December 31, 2022). |
15
See Notes to Financial Statements.
Eaton Vance
Small-Cap Fund
December 31, 2022
Financial Highlights — continued
| | Class I |
| | Year Ended December 31, |
| | 2022 | 2021 | 2020 | 2019 | 2018 |
| Net asset value — Beginning of year | $ 17.870 | $ 16.570 | $ 14.830 | $ 12.360 | $ 14.450 |
| Income (Loss) From Operations | | | | | |
| Net investment income(1) | $ 0.040 | $ 0.003 | $ 0.037 | $ 0.029 | $ 0.010 |
| Net realized and unrealized gain (loss) | (2.762) | 3.502 | 1.873 | 3.389 | (0.736) |
| Total income (loss) from operations | $ (2.722) | $ 3.505 | $ 1.910 | $ 3.418 | $ (0.726) |
| Less Distributions | | | | | |
| From net investment income | $ (0.021) | $ (0.017) | $ (0.015) | $ — | $ — |
| From net realized gain | (0.427) | (2.188) | (0.155) | (0.948) | (1.364) |
| Total distributions | $ (0.448) | $ (2.205) | $ (0.170) | $ (0.948) | $ (1.364) |
| Net asset value — End of year | $ 14.700 | $ 17.870 | $16.570 | $14.830 | $12.360 |
| Total Return(2)(3) | (15.31)% | 21.46% | 13.05% | 27.81% | (5.57)% |
| Ratios/Supplemental Data | | | | | |
| Net assets, end of year (000’s omitted) | $101,802 | $111,052 | $ 82,716 | $ 57,202 | $ 35,097 |
| Ratios (as a percentage of average daily net assets): | | | | | |
| Expenses (3) | 0.96% (4) | 0.96% | 0.96% | 0.96% | 1.10% |
| Net investment income | 0.25% | 0.01% | 0.27% | 0.20% | 0.07% |
| Portfolio Turnover | 53% | 55% | 71% | 54% | 44% |
| (1) | Computed using average shares outstanding. |
| (2) | Returns are historical and are calculated by determining the percentage change in net asset value with all distributions reinvested. |
| (3) | The administrator reimbursed certain operating expenses (equal to 0.18%, 0.17%, 0.25%, 0.29% and 0.17% of average daily net assets for the years ended December 31, 2022, 2021, 2020, 2019 and 2018, respectively). Absent this reimbursement, total return would be lower. |
| (4) | Includes a reduction by the investment adviser of a portion of its adviser fee due to the Fund's investment in the Liquidity Fund (equal to less than 0.005% of average daily net assets for the year ended December 31, 2022). |
16
See Notes to Financial Statements.
Eaton Vance
Small-Cap Fund
December 31, 2022
Financial Highlights — continued
| | Class R |
| | Year Ended December 31, |
| | 2022 | 2021 | 2020 | 2019 | 2018 |
| Net asset value — Beginning of year | $ 14.690 | $ 13.930 | $ 12.540 | $ 10.620 | $ 12.670 |
| Income (Loss) From Operations | | | | | |
| Net investment loss(1) | $ (0.032) | $ (0.082) | $ (0.029) | $ (0.042) | $ (0.053) |
| Net realized and unrealized gain (loss) | (2.267) | 2.936 | 1.574 | 2.910 | (0.633) |
| Total income (loss) from operations | $ (2.299) | $ 2.854 | $ 1.545 | $ 2.868 | $ (0.686) |
| Less Distributions | | | | | |
| From net realized gain | $ (0.381) | $ (2.094) | $ (0.155) | $ (0.948) | $ (1.364) |
| Total distributions | $ (0.381) | $ (2.094) | $ (0.155) | $ (0.948) | $ (1.364) |
| Net asset value — End of year | $12.010 | $14.690 | $13.930 | $12.540 | $10.620 |
| Total Return(2)(3) | (15.73)% | 20.82% | 12.51% | 27.18% | (6.04)% |
| Ratios/Supplemental Data | | | | | |
| Net assets, end of year (000’s omitted) | $ 414 | $ 455 | $ 569 | $ 595 | $ 799 |
| Ratios (as a percentage of average daily net assets): | | | | | |
| Expenses (3) | 1.46% (4) | 1.46% | 1.46% | 1.46% | 1.60% |
| Net investment loss | (0.25)% | (0.53)% | (0.25)% | (0.34)% | (0.40)% |
| Portfolio Turnover | 53% | 55% | 71% | 54% | 44% |
| (1) | Computed using average shares outstanding. |
| (2) | Returns are historical and are calculated by determining the percentage change in net asset value with all distributions reinvested. |
| (3) | The administrator reimbursed certain operating expenses (equal to 0.18%, 0.17%, 0.25%, 0.29% and 0.17% of average daily net assets for the years ended December 31, 2022, 2021, 2020, 2019 and 2018, respectively). Absent this reimbursement, total return would be lower. |
| (4) | Includes a reduction by the investment adviser of a portion of its adviser fee due to the Fund's investment in the Liquidity Fund (equal to less than 0.005% of average daily net assets for the year ended December 31, 2022). |
17
See Notes to Financial Statements.
Eaton Vance
Small-Cap Fund
December 31, 2022
Notes to Financial Statements
1 Significant Accounting Policies
Eaton Vance Small-Cap Fund (the Fund) is a diversified series of Eaton Vance Special Investment Trust (the Trust). The Trust is a Massachusetts business trust registered under the Investment Company Act of 1940, as amended (the 1940 Act), as an open-end management investment company. The Fund’s investment objective is to seek long-term capital appreciation. The Fund offers four classes of shares. Class A shares are generally sold subject to a sales charge imposed at time of purchase. Class C shares are sold at net asset value and are generally subject to a contingent deferred sales charge (see Note 5). Effective November 5, 2020, Class C shares automatically convert to Class A shares eight years after their purchase as described in the Fund’s prospectus. Class I and Class R shares are sold at net asset value and are not subject to a sales charge. Each class represents a pro-rata interest in the Fund, but votes separately on class-specific matters and (as noted below) is subject to different expenses. Realized and unrealized gains and losses and net investment income and losses, other than class-specific expenses, are allocated daily to each class of shares based on the relative net assets of each class to the total net assets of the Fund. Each class of shares differs in its distribution plan and certain other class-specific expenses.
The following is a summary of significant accounting policies of the Fund. The policies are in conformity with accounting principles generally accepted in the United States of America (U.S. GAAP). The Fund is an investment company and follows accounting and reporting guidance in the Financial Accounting Standards Board (FASB) Accounting Standards Codification Topic 946.
A Investment Valuation—The following methodologies are used to determine the market value or fair value of investments.
Equity Securities. Equity securities listed on a U.S. securities exchange generally are valued at the last sale or closing price on the day of valuation or, if no sales took place on such date, at the mean between the closing bid and ask prices on the exchange where such securities are principally traded. Equity securities listed on the NASDAQ National Market System are valued at the NASDAQ official closing price. Unlisted or listed securities for which closing sales prices or closing quotations are not available are valued at the mean between the latest available bid and ask prices.
Other. Investments in management investment companies (including money market funds) that do not trade on an exchange are valued at the net asset value as of the close of each business day.
Fair Valuation. In connection with Rule 2a-5 of the 1940 Act, which became effective September 8, 2022, the Trustees have designated the Fund’s investment adviser as its valuation designee. Investments for which valuations or market quotations are not readily available or are deemed unreliable are valued by the investment adviser, as valuation designee, at fair value using methods that most fairly reflect the security’s “fair value”, which is the amount that the Fund might reasonably expect to receive for the security upon its current sale in the ordinary course. Each such determination is based on a consideration of relevant factors, which are likely to vary from one pricing context to another. These factors may include, but are not limited to, the type of security, the existence of any contractual restrictions on the security’s disposition, the price and extent of public trading in similar securities of the issuer or of comparable companies or entities, quotations or relevant information obtained from broker/dealers or other market participants, information obtained from the issuer, analysts, and/or the appropriate stock exchange (for exchange-traded securities), an analysis of the company’s or entity’s financial statements, and an evaluation of the forces that influence the issuer and the market(s) in which the security is purchased and sold.
B Investment Transactions—Investment transactions for financial statement purposes are accounted for on a trade date basis. Realized gains and losses on investments sold are determined on the basis of identified cost.
C Income—Dividend income is recorded on the ex-dividend date for dividends received in cash and/or securities.
D Federal Taxes—The Fund's policy is to comply with the provisions of the Internal Revenue Code applicable to regulated investment companies and to distribute to shareholders each year substantially all of its net investment income, and all or substantially all of its net realized capital gains. Accordingly, no provision for federal income or excise tax is necessary.
As of December 31, 2022, the Fund had no uncertain tax positions that would require financial statement recognition, de-recognition, or disclosure. The Fund files a U.S. federal income tax return annually after its fiscal year-end, which is subject to examination by the Internal Revenue Service for a period of three years from the date of filing.
E Expenses—The majority of expenses of the Trust are directly identifiable to an individual fund. Expenses which are not readily identifiable to a specific fund are allocated taking into consideration, among other things, the nature and type of expense and the relative size of the funds.
F Use of Estimates—The preparation of the financial statements in conformity with U.S. GAAP requires management to make estimates and assumptions that affect the reported amounts of assets and liabilities at the date of the financial statements and the reported amounts of income and expense during the reporting period. Actual results could differ from those estimates.
G Indemnifications—Under the Trust’s organizational documents, its officers and Trustees may be indemnified against certain liabilities and expenses arising out of the performance of their duties to the Fund. Under Massachusetts law, if certain conditions prevail, shareholders of a Massachusetts business trust (such as the Trust) could be deemed to have personal liability for the obligations of the Trust. However, the Trust’s Declaration of Trust contains an express disclaimer of liability on the part of Fund shareholders and the By-laws provide that the Trust shall assume, upon request by the shareholder, the defense on behalf of any Fund shareholders. Moreover, the By-laws also provide for indemnification out of Fund property of any shareholder held personally liable solely by reason of being or having been a shareholder for all loss or expense arising from such liability. Additionally, in the normal course of business,
Eaton Vance
Small-Cap Fund
December 31, 2022
Notes to Financial Statements — continued
the Fund enters into agreements with service providers that may contain indemnification clauses. The Fund’s maximum exposure under these arrangements is unknown as this would involve future claims that may be made against the Fund that have not yet occurred.
2 Distributions to Shareholders and Income Tax Information
It is the present policy of the Fund to make at least one distribution annually (normally in December) of all or substantially all of its net investment income and to distribute annually all or substantially all of its net realized capital gains. Distributions to shareholders are recorded on the ex-dividend date. Distributions are declared separately for each class of shares. Shareholders may reinvest income and capital gain distributions in additional shares of the same class of the Fund at the net asset value as of the ex-dividend date or, at the election of the shareholder, receive distributions in cash. Distributions to shareholders are determined in accordance with income tax regulations, which may differ from U.S. GAAP. As required by U.S. GAAP, only distributions in excess of tax basis earnings and profits are reported in the financial statements as a return of capital. Permanent differences between book and tax accounting relating to distributions are reclassified to paid-in capital. For tax purposes, distributions from short-term capital gains are considered to be from ordinary income.
The tax character of distributions declared for the years ended December 31, 2022 and December 31, 2021 was as follows:
| | Year Ended December 31, |
| | 2022 | 2021 |
| Ordinary income | $ 687,779 | $ 6,063,195 |
| Long-term capital gains | $3,159,484 | $10,417,983 |
During the year ended December 31, 2022, distributable earnings was decreased by $154,154 and paid-in capital was increased by $154,154 due to the Fund’s use of equalization accounting. Tax equalization accounting allows the Fund to treat as a distribution that portion of redemption proceeds representing a redeeming shareholder’s portion of undistributed taxable income and net capital gains. These reclassifications had no effect on the net assets or net asset value per share of the Fund.
As of December 31, 2022, the components of distributable earnings (accumulated loss) on a tax basis were as follows:
| Net unrealized appreciation | $ 12,466,598 |
| Distributable earnings | $12,466,598 |
The cost and unrealized appreciation (depreciation) of investments of the Fund at December 31, 2022, as determined on a federal income tax basis, were as follows:
| Aggregate cost | $116,241,174 |
| Gross unrealized appreciation | $ 18,542,813 |
| Gross unrealized depreciation | (6,076,215) |
| Net unrealized appreciation | $ 12,466,598 |
Eaton Vance
Small-Cap Fund
December 31, 2022
Notes to Financial Statements — continued
3 Investment Adviser Fee and Other Transactions with Affiliates
The investment adviser fee is earned by Boston Management and Research (BMR), an indirect, wholly-owned subsidiary of Morgan Stanley, as compensation for investment advisory services rendered to the Fund. The fee is computed at an annual rate as a percentage of the Fund’s average daily net assets as follows and is payable monthly:
| Average Daily Net Assets | Annual Fee Rate |
| Up to $500 million | 0.7500% |
| $500 million but less than $1 billion | 0.6875% |
| $1 billion but less than $1.5 billion | 0.6250% |
| $1.5 billion but less than $2 billion | 0.5625% |
| $2 billion but less than $3 billion | 0.5000% |
| $3 billion and over | 0.4375% |
For the year ended December 31, 2022, the Fund’s investment adviser fee amounted to $995,976 or 0.75% of the Fund’s average daily net assets. Effective April 26, 2022, the Fund may invest in a money market fund, the Institutional Class of the Morgan Stanley Institutional Liquidity Funds - Government Portfolio (the “Liquidity Fund”), an open-end management investment company managed by Morgan Stanley Investment Management Inc., a wholly-owned subsidiary of Morgan Stanley. The investment adviser fee paid by the Fund is reduced by an amount equal to its pro-rata share of the advisory and administration fees paid by the Fund due to its investment in the Liquidity Fund. For the year ended December 31, 2022, the investment adviser fee paid was reduced by $2,721 relating to the Fund’s investment in the Liquidity Fund. Prior to April 26, 2022, the Fund may have invested its cash in Eaton Vance Cash Reserves Fund, LLC (Cash Reserves Fund), an affiliated investment company managed by Eaton Vance Management (EVM). EVM did not receive a fee for advisory services provided to Cash Reserves Fund.
The administration fee is earned by EVM, an affiliate of BMR and an indirect, wholly-owned subsidiary of Morgan Stanley, as compensation for administrative services rendered to the Fund. The fee is computed at an annual rate of 0.15% of the Fund’s average daily net assets. For the year ended December 31, 2022, the administration fee amounted to $199,195.
EVM has agreed to reimburse the Fund's expenses to the extent that total annual operating expenses (relating to ordinary operating expenses only) exceed 1.21%, 1.96%, 0.96% and 1.46% of the Fund's average daily net assets for Class A, Class C, Class I and Class R, respectively. This agreement may be changed or terminated after April 30, 2023. Pursuant to this agreement, EVM was allocated $234,197 of the Fund's operating expenses for the year ended December 31, 2022.
EVM provides sub-transfer agency and related services to the Fund pursuant to a Sub-Transfer Agency Support Services Agreement. For the year ended December 31, 2022, EVM earned $16,653 from the Fund pursuant to such agreement, which is included in transfer and dividend disbursing agent fees on the Statement of Operations. The Fund was informed that Eaton Vance Distributors, Inc. (EVD), an affiliate of EVM and the Fund’s principal underwriter, received $1,755 as its portion of the sales charge on sales of Class A shares for the year ended December 31, 2022. EVD also received distribution and service fees from Class A, Class C and Class R shares (see Note 4) and contingent deferred sales charges (see Note 5).
Trustees and officers of the Fund who are members of EVM’s or BMR’s organizations receive remuneration for their services to the Fund out of the investment adviser fee. Trustees of the Fund who are not affiliated with the investment adviser may elect to defer receipt of all or a percentage of their annual fees in accordance with the terms of the Trustees Deferred Compensation Plan. For the year ended December 31, 2022, no significant amounts have been deferred. Certain officers and Trustees of the Fund are officers of the above organizations.
4 Distribution Plans
The Fund has in effect a distribution plan for Class A shares (Class A Plan) pursuant to Rule 12b-1 under the 1940 Act. Pursuant to the Class A Plan, the Fund pays EVD a distribution and service fee of 0.25% per annum of its average daily net assets attributable to Class A shares for distribution services and facilities provided to the Fund by EVD, as well as for personal services and/or the maintenance of shareholder accounts. Distribution and service fees paid or accrued to EVD for the year ended December 31, 2022 amounted to $60,337 for Class A shares.
The Fund also has in effect distribution plans for Class C shares (Class C Plan) and Class R shares (Class R Plan) pursuant to Rule 12b-1 under the 1940 Act. Pursuant to the Class C Plan, the Fund pays EVD amounts equal to 0.75% per annum of its average daily net assets attributable to Class C shares for providing ongoing distribution services and facilities to the Fund. For the year ended December 31, 2022, the Fund paid or accrued to EVD $21,518 for Class C shares.
Eaton Vance
Small-Cap Fund
December 31, 2022
Notes to Financial Statements — continued
The Class R Plan requires the Fund to pay EVD an amount up to 0.50% per annum of its average daily net assets attributable to Class R shares for providing ongoing distribution services and facilities to the Fund. The Trustees of the Trust have currently limited Class R distribution payments to 0.25% per annum of the average daily net assets attributable to Class R shares. For the year ended December 31, 2022, the Fund paid or accrued to EVD $1,099 for Class R shares.
Pursuant to the Class C and Class R Plans, the Fund also makes payments of service fees to EVD, financial intermediaries and other persons in amounts equal to 0.25% per annum of its average daily net assets attributable to that class. Service fees paid or accrued are for personal services and/or the maintenance of shareholder accounts. They are separate and distinct from the sales commissions and distribution fees payable to EVD. Service fees paid or accrued for the year ended December 31, 2022 amounted to $7,174 and $1,099 for Class C and Class R shares, respectively.
Distribution and service fees are subject to the limitations contained in the Financial Industry Regulatory Authority Rule 2341(d).
5 Contingent Deferred Sales Charges
A contingent deferred sales charge (CDSC) of 1% generally is imposed on redemptions of Class C shares made within 12 months of purchase. Class A shares may be subject to a 1% CDSC if redeemed within 12 months (18 months prior to April 29, 2022) of purchase (depending on the circumstances of purchase). Generally, the CDSC is based upon the lower of the net asset value at date of redemption or date of purchase. No charge is levied on shares acquired by reinvestment of dividends or capital gain distributions. For the year ended December 31, 2022, the Fund was informed that EVD received approximately $200 and less than $100 of CDSCs paid by Class A and Class C shareholders, respectively.
6 Purchases and Sales of Investments
Purchases and sales of investments, other than short-term obligations, aggregated $77,246,291 and $69,021,921, respectively, for the year ended December 31, 2022.
7 Shares of Beneficial Interest
The Fund’s Declaration of Trust permits the Trustees to issue an unlimited number of full and fractional shares of beneficial interest (without par value). Such shares may be issued in a number of different series (such as the Fund) and classes. Transactions in Fund shares, including direct exchanges pursuant to share class conversions for all periods presented, were as follows:
| | Year Ended
December 31, 2022 | | Year Ended
December 31, 2021 |
| | Shares | Amount | | Shares | Amount |
| Class A | | | | | |
| Sales | 113,341 | $ 1,502,130 | | 144,261 | $ 2,364,612 |
| Issued to shareholders electing to receive payments of distributions in Fund shares | 49,442 | 651,155 | | 227,276 | 3,463,684 |
| Redemptions | (333,761) | (4,400,144) | | (334,602) | (5,468,835) |
| Net increase (decrease) | (170,978) | $ (2,246,859) | | 36,935 | $ 359,461 |
| Class C | | | | | |
| Sales | 88,477 | $ 875,130 | | 61,246 | $ 801,257 |
| Issued to shareholders electing to receive payments of distributions in Fund shares | 10,199 | 101,177 | | 41,811 | 485,842 |
| Redemptions | (29,297) | (294,495) | | (131,493) | (1,690,014) |
| Net increase (decrease) | 69,379 | $ 681,812 | | (28,436) | $ (402,915) |
Eaton Vance
Small-Cap Fund
December 31, 2022
Notes to Financial Statements — continued
| | Year Ended
December 31, 2022 | | Year Ended
December 31, 2021 |
| | Shares | Amount | | Shares | Amount |
| Class I | | | | | |
| Sales | 3,112,164 | $ 49,698,926 | | 2,046,359 | $ 37,317,290 |
| Issued to shareholders electing to receive payments of distributions in Fund shares | 197,740 | 2,997,730 | | 693,653 | 12,118,112 |
| Redemptions | (2,597,758) | (40,543,589) | | (1,516,312) | (27,577,610) |
| Net increase | 712,146 | $ 12,153,067 | | 1,223,700 | $ 21,857,792 |
| Class R | | | | | |
| Sales | 10,750 | $ 136,904 | | 15,360 | $ 240,208 |
| Issued to shareholders electing to receive payments of distributions in Fund shares | 1,026 | 12,713 | | 3,923 | 56,381 |
| Redemptions | (8,257) | (99,180) | | (29,146) | (457,733) |
| Net increase (decrease) | 3,519 | $ 50,437 | | (9,863) | $ (161,144) |
8 Line of Credit
The Fund participates with other portfolios and funds managed by EVM and its affiliates in a $725 million unsecured line of credit agreement with a group of banks, which is in effect through October 24, 2023. In connection with the renewal of the agreement on October 25, 2022, the borrowing limit was decreased from $800 million. Borrowings are made by the Fund solely for temporary purposes related to redemptions and other short-term cash needs. Interest is charged to the Fund based on its borrowings at an amount above either the Secured Overnight Financing Rate (SOFR) or Federal Funds rate. In addition, a fee computed at an annual rate of 0.15% on the daily unused portion of the line of credit is allocated among the participating portfolios and funds at the end of each quarter. Also in connection with the renewal of the agreement, an arrangement fee totaling $150,000 was incurred that was allocated to the participating portfolios and funds. Because the line of credit is not available exclusively to the Fund, it may be unable to borrow some or all of its requested amounts at any particular time. The Fund did not have any significant borrowings or allocated fees during the year ended December 31, 2022.
9 Investments in Affiliated Funds
At December 31, 2022, the value of the Fund's investment in affiliated funds, including funds that may be deemed to be affiliated, was $2,628,256, which represents 2.1% of the Fund's net assets. Transactions in such investments by the Fund for the year ended December 31, 2022 were as follows:
| Name | Value,
beginning
of period | Purchases | Sales
proceeds | Net
realized
gain (loss) | Change in
unrealized
appreciation
(depreciation) | Value, end
of period | Dividend
income | Units/Shares,
end of period |
| Short-Term Investments |
| Cash Reserves Fund | $1,936,619 | $26,277,916 | $(28,215,029) | $ 494 | $ — | $ — | $ 915 | — |
| Liquidity Fund | — | 38,505,381 | (35,877,125) | — | — | 2,628,256 | 37,210 | 2,628,256 |
| Total | | | | $ 494 | $ — | $2,628,256 | $38,125 | |
Eaton Vance
Small-Cap Fund
December 31, 2022
Notes to Financial Statements — continued
10 Fair Value Measurements
Under generally accepted accounting principles for fair value measurements, a three-tier hierarchy to prioritize the assumptions, referred to as inputs, is used in valuation techniques to measure fair value. The three-tier hierarchy of inputs is summarized in the three broad levels listed below.
| • | Level 1 – quoted prices in active markets for identical investments |
| • | Level 2 – other significant observable inputs (including quoted prices for similar investments, interest rates, prepayment speeds, credit risk, etc.) |
| • | Level 3 – significant unobservable inputs (including a fund's own assumptions in determining the fair value of investments) |
In cases where the inputs used to measure fair value fall in different levels of the fair value hierarchy, the level disclosed is determined based on the lowest level input that is significant to the fair value measurement in its entirety. The inputs or methodology used for valuing securities are not necessarily an indication of the risk associated with investing in those securities.
At December 31, 2022, the hierarchy of inputs used in valuing the Fund's investments, which are carried at value, were as follows:
| Asset Description | Level 1 | Level 2 | Level 3 | Total |
| Common Stocks | $ 126,079,516* | $ — | $ — | $ 126,079,516 |
| Short-Term Investments | 2,628,256 | — | — | 2,628,256 |
| Total Investments | $128,707,772 | $ — | $ — | $128,707,772 |
| * | The level classification by major category of investments is the same as the category presentation in the Portfolio of Investments. |
11 Risks and Uncertainties
Pandemic Risk
An outbreak of respiratory disease caused by a novel coronavirus was first detected in China in late 2019 and subsequently spread internationally. This coronavirus has resulted in closing borders, enhanced health screenings, changes to healthcare service preparation and delivery, quarantines, cancellations, disruptions to supply chains and customer activity, as well as general concern and uncertainty. Health crises caused by outbreaks of disease, such as the coronavirus outbreak, may exacerbate other pre-existing political, social and economic risks and disrupt normal market conditions and operations. The impact of this outbreak has negatively affected the worldwide economy, as well as the economies of individual countries and industries, and could continue to affect the market in significant and unforeseen ways. Other epidemics and pandemics that may arise in the future may have similar effects. Any such impact could adversely affect the Fund's performance, or the performance of the securities in which the Fund invests.
Eaton Vance
Small-Cap Fund
December 31, 2022
Report of Independent Registered Public Accounting Firm
To the Trustees of Eaton Vance Special Investment Trust and Shareholders of Eaton Vance Small-Cap Fund:
Opinion on the Financial Statements and Financial Highlights
We have audited the accompanying statement of assets and liabilities of Eaton Vance Small-Cap Fund (the “Fund”) (one of the funds constituting Eaton Vance Special Investment Trust), including the portfolio of investments, as of December 31, 2022, the related statement of operations for the year then ended, the statements of changes in net assets for each of the two years in the period then ended, the financial highlights for each of the five years in the period then ended, and the related notes. In our opinion, the financial statements and financial highlights present fairly, in all material respects, the financial position of the Fund as of December 31, 2022, and the results of its operations for the year then ended, the changes in its net assets for each of the two years in the period then ended, and the financial highlights for each of the five years in the period then ended, in conformity with accounting principles generally accepted in the United States of America.
Basis for Opinion
These financial statements and financial highlights are the responsibility of the Fund's management. Our responsibility is to express an opinion on the Fund's financial statements and financial highlights based on our audits. We are a public accounting firm registered with the Public Company Accounting Oversight Board (United States) (PCAOB) and are required to be independent with respect to the Fund in accordance with the U.S. federal securities laws and the applicable rules and regulations of the Securities and Exchange Commission and the PCAOB.
We conducted our audits in accordance with the standards of the PCAOB. Those standards require that we plan and perform the audit to obtain reasonable assurance about whether the financial statements and financial highlights are free of material misstatement, whether due to error or fraud. The Fund is not required to have, nor were we engaged to perform, an audit of its internal control over financial reporting. As part of our audits, we are required to obtain an understanding of internal control over financial reporting but not for the purpose of expressing an opinion on the effectiveness of the Fund’s internal control over financial reporting. Accordingly, we express no such opinion.
Our audits included performing procedures to assess the risks of material misstatement of the financial statements and financial highlights, whether due to error or fraud, and performing procedures that respond to those risks. Such procedures included examining, on a test basis, evidence regarding the amounts and disclosures in the financial statements and financial highlights. Our audits also included evaluating the accounting principles used and significant estimates made by management, as well as evaluating the overall presentation of the financial statements and financial highlights. Our procedures included confirmation of securities owned as of December 31, 2022, by correspondence with the custodian and brokers; when replies were not received from brokers, we performed other auditing procedures. We believe that our audits provide a reasonable basis for our opinion.
/s/ Deloitte & Touche LLP
Boston, Massachusetts
February 21, 2023
We have served as the auditor of one or more Eaton Vance investment companies since 1959.
Eaton Vance
Small-Cap Fund
December 31, 2022
Federal Tax Information (Unaudited)
The Form 1099-DIV you received in February 2023 showed the tax status of all distributions paid to your account in calendar year 2022. Shareholders are advised to consult their own tax adviser with respect to the tax consequences of their investment in the Fund. As required by the Internal Revenue Code and/or regulations, shareholders must be notified regarding the status of qualified dividend income for individuals, the dividends received deduction for corporations and capital gains dividends.
Qualified Dividend Income. For the fiscal year ended December 31, 2022, the Fund designates approximately $1,223,664, or up to the maximum amount of such dividends allowable pursuant to the Internal Revenue Code, as qualified dividend income eligible for the reduced tax rate of 15%.
Dividends Received Deduction. Corporate shareholders are generally entitled to take the dividends received deduction on the portion of the Fund’s dividend distribution that qualifies under tax law. For the Fund’s fiscal 2022 ordinary income dividends, 100% qualifies for the corporate dividends received deduction.
Capital Gains Dividends. The Fund hereby designates as a capital gain dividend with respect to the taxable year ended December 31, 2022, $1,169,504 or, if subsequently determined to be different, the net capital gain of such year.
Eaton Vance
Small-Cap Fund
December 31, 2022
Management and Organization
Fund Management. The Trustees of Eaton Vance Special Investment Trust (the Trust) are responsible for the overall management and supervision of the Trust's affairs. The Board members and officers of the Trust are listed below. Except as indicated, each individual has held the office shown or other offices in the same company for the last five years. Board members hold indefinite terms of office. Each Trustee holds office until his or her successor is elected and qualified, subject to a prior death, resignation, retirement, disqualification or removal. Under the terms of the Fund’s current Trustee retirement policy, an Independent Trustee must retire and resign as a Trustee on the earlier of: (i) the first day of July following his or her 74th birthday; or (ii), with limited exception, December 31st of the 20th year in which he or she has served as a Trustee. However, if such retirement and resignation would cause the Fund to be out of compliance with Section 16 of the 1940 Act or any other regulations or guidance of the SEC, then such retirement and resignation will not become effective until such time as action has been taken for the Fund to be in compliance therewith. The “noninterested Trustees” consist of those Trustees who are not “interested persons” of the Trust, as that term is defined under the 1940 Act. The business address of each Board member and officer is Two International Place, Boston, Massachusetts 02110. As used below, “BMR” refers to Boston Management and Research, “EVC” refers to Eaton Vance Corp., “EV” refers to EV LLC, “EVM” refers to Eaton Vance Management and “EVD” refers to Eaton Vance Distributors, Inc. EV is the trustee of each of EVM and BMR. Effective March 1, 2021, each of EVM, BMR, EVD and EV are indirect, wholly owned subsidiaries of Morgan Stanley. Each officer affiliated with EVM may hold a position with other EVM affiliates that is comparable to his or her position with EVM listed below. Each Trustee oversees 130 funds in the Eaton Vance fund complex (including both funds and portfolios in a hub and spoke structure).
| Name and Year of Birth | Trust
Position(s) | Length of Service | Principal Occupation(s) and Other Directorships
During Past Five Years and Other Relevant Experience |
| Interested Trustee |
Thomas E. Faust Jr.
1958 | Trustee | Since 2007 | Chairman of Morgan Stanley Investment Management, Inc. (MSIM), member of the Board of Managers and President of EV (since 2021), Chief Executive Officer of EVM and BMR. Formerly, Chairman, Chief Executive Officer (2007-2021) and President (2006-2021) of EVC and Director of EVD (2007-2022). Mr. Faust is an interested person because of his positions with MSIM, BMR, EVM and EV, which are affiliates of the Trust.
Other Directorships. Formerly, Director of EVC (2007-2021) and Hexavest Inc. (investment management firm) (2012-2021). |
| Noninterested Trustees |
Alan C. Bowser(1)
1962 | Trustee | Since 2022 | Formerly, Chief Diversity Officer, Partner and a member of the Operating Committee, and formerly served as Senior Advisor on Diversity and Inclusion for the firm’s chief executive officer, Co-Head of the Americas Region, and Senior Client Advisor of Bridgewater Associates, an asset management firm (2011- 2023).
Other Directorships. None. |
Mark R. Fetting
1954 | Trustee | Since 2016 | Private investor. Formerly held various positions at Legg Mason, Inc. (investment management firm) (2000-2012), including President, Chief Executive Officer, Director and Chairman (2008-2012), Senior Executive Vice President (2004-2008) and Executive Vice President (2001-2004). Formerly, President of Legg Mason family of funds (2001-2008). Formerly, Division President and Senior Officer of Prudential Financial Group, Inc. and related companies (investment management firm) (1991-2000).
Other Directorships. None. |
Cynthia E. Frost
1961 | Trustee | Since 2014 | Private investor. Formerly, Chief Investment Officer of Brown University (university endowment) (2000-2012). Formerly, Portfolio Strategist for Duke Management Company (university endowment manager) (1995-2000). Formerly, Managing Director, Cambridge Associates (investment consulting company) (1989-1995). Formerly, Consultant, Bain and Company (management consulting firm) (1987-1989). Formerly, Senior Equity Analyst, BA Investment Management Company (1983-1985).
Other Directorships. None. |
George J. Gorman
1952 | Chairperson
of the Board
and Trustee | Since 2021
(Chairperson) and
2014 (Trustee) | Principal at George J. Gorman LLC (consulting firm). Formerly, Senior Partner at Ernst & Young LLP (a registered public accounting firm) (1974-2009).
Other Directorships. None. |
Eaton Vance
Small-Cap Fund
December 31, 2022
Management and Organization — continued
| Name and Year of Birth | Trust
Position(s) | Length of Service | Principal Occupation(s) and Other Directorships
During Past Five Years and Other Relevant Experience |
| Noninterested Trustees (continued) |
Valerie A. Mosley
1960 | Trustee | Since 2014 | Chairwoman and Chief Executive Officer of Valmo Ventures (a consulting and investment firm). Founder of Upward Wealth, Inc., dba BrightUp, a fintech platform. Formerly, Partner and Senior Vice President, Portfolio Manager and Investment Strategist at Wellington Management Company, LLP (investment management firm) (1992-2012). Formerly, Chief Investment Officer, PG Corbin Asset Management (1990-1992). Formerly worked in institutional corporate bond sales at Kidder Peabody (1986-1990).
Other Directorships. Director of DraftKings, Inc. (digital sports entertainment and gaming company) (since September 2020). Director of Envestnet, Inc. (provider of intelligent systems for wealth management and financial wellness) (since 2018). Formerly, Director of Dynex Capital, Inc. (mortgage REIT) (2013-2020) and Director of Groupon, Inc. (e-commerce provider) (2020-2022). |
Keith Quinton
1958 | Trustee | Since 2018 | Private investor, researcher and lecturer. Formerly, Independent Investment Committee Member at New Hampshire Retirement System (2017-2021). Formerly, Portfolio Manager and Senior Quantitative Analyst at Fidelity Investments (investment management firm) (2001-2014).
Other Directorships. Formerly, Director (2016-2021) and Chairman (2019-2021) of New Hampshire Municipal Bond Bank. |
Marcus L. Smith
1966 | Trustee | Since 2018 | Private investor and independent corporate director. Formerly, Chief Investment Officer, Canada (2012-2017), Chief Investment Officer, Asia (2010-2012), Director of Asian Research (2004-2010) and portfolio manager (2001-2017) at MFS Investment Management (investment management firm).
Other Directorships. Director of First Industrial Realty Trust, Inc. (an industrial REIT) (since 2021). Director of MSCI Inc. (global provider of investment decision support tools) (since 2017). Formerly, Director of DCT Industrial Trust Inc. (logistics real estate company) (2017-2018). |
Susan J. Sutherland
1957 | Trustee | Since 2015 | Private investor. Director of Ascot Group Limited and certain of its subsidiaries (insurance and reinsurance) (since 2017). Formerly, Director of Hagerty Holding Corp. (insurance) (2015-2018) and Montpelier Re Holdings Ltd. (insurance and reinsurance) (2013-2015). Formerly, Associate, Counsel and Partner at Skadden, Arps, Slate, Meagher & Flom LLP (law firm) (1982-2013).
Other Directorships. Formerly, Director of Kairos Acquisition Corp. (insurance/InsurTech acquisition company) (2021-2023). |
Scott E. Wennerholm
1959 | Trustee | Since 2016 | Private investor. Formerly, Trustee at Wheelock College (postsecondary institution) (2012-2018). Formerly, Consultant at GF Parish Group (executive recruiting firm) (2016-2017). Formerly, Chief Operating Officer and Executive Vice President at BNY Mellon Asset Management (investment management firm) (2005-2011). Formerly, Chief Operating Officer and Chief Financial Officer at Natixis Global Asset Management (investment management firm) (1997-2004). Formerly, Vice President at Fidelity Investments Institutional Services (investment management firm) (1994-1997).
Other Directorships. None. |
Nancy A. Wiser(1)
1967 | Trustee | Since 2022 | Formerly, Executive Vice President and the Global Head of Operations at Wells Fargo Asset Management (2011-2021).
Other Directorships. None. |
| Name and Year of Birth | Trust
Position(s) | Length of Service | Principal Occupation(s)
During Past Five Years |
| Principal Officers who are not Trustees |
Eric A. Stein
1980 | President | Since 2020 | Vice President and Chief Investment Officer, Fixed Income of EVM and BMR. Prior to November 1, 2020, Mr. Stein was a co-Director of Eaton Vance’s Global Income Investments. Also Vice President of Calvert Research and Management (“CRM”). |
Deidre E. Walsh
1971 | Vice President and
Chief Legal Officer | Since 2009 | Vice President of EVM and BMR. Also Vice President of CRM. |
James F. Kirchner
1967 | Treasurer | Since 2007 | Vice President of EVM and BMR. Also Vice President of CRM. |
Eaton Vance
Small-Cap Fund
December 31, 2022
Management and Organization — continued
| Name and Year of Birth | Trust
Position(s) | Length of Service | Principal Occupation(s)
During Past Five Years |
| Principal Officers who are not Trustees (continued) |
Nicholas Di Lorenzo
1987 | Secretary | Since 2022 | Formerly, associate (2012-2021) and counsel (2022) at Dechert LLP. |
Richard F. Froio
1968 | Chief Compliance
Officer | Since 2017 | Vice President of EVM and BMR since 2017. Formerly, Deputy Chief Compliance Officer (Adviser/Funds) and Chief Compliance Officer (Distribution) at PIMCO (2012-2017) and Managing Director at BlackRock/Barclays Global Investors (2009-2012). |
(1) Mr. Bowser and Ms. Wiser began serving as Trustees effective April 4, 2022.
The SAI for the Fund includes additional information about the Trustees and officers of the Fund and can be obtained without charge on Eaton Vance’s website at www.eatonvance.com or by calling 1-800-262-1122.
| FACTS | WHAT DOES EATON VANCE DO WITH YOUR
PERSONAL INFORMATION? |
| Why? | Financial companies choose how they share your personal information. Federal law gives consumers the right to limit some but not all sharing. Federal law also requires us to tell you how we collect, share, and protect your personal information. Please read this notice carefully to understand what we do. |
| |
| What? | The types of personal information we collect and share depend on the product or service you have with us. This information can include:■ Social Security number and income
■ investment experience and risk tolerance
■ checking account number and wire transfer instructions |
| |
| How? | All financial companies need to share customers’ personal information to run their everyday business. In the section below, we list the reasons financial companies can share their customers’ personal information; the reasons Eaton Vance chooses to share; and whether you can limit this sharing. |
Reasons we can share your
personal information | Does Eaton Vance
share? | Can you limit
this sharing? |
| For our everyday business purposes — such as to process your transactions, maintain your account(s), respond to court orders and legal investigations, or report to credit bureaus | Yes | No |
| For our marketing purposes — to offer our products and services to you | Yes | No |
| For joint marketing with other financial companies | No | We don’t share |
| For our investment management affiliates’ everyday business purposes — information about your transactions, experiences, and creditworthiness | Yes | Yes |
| For our affiliates’ everyday business purposes — information about your transactions and experiences | Yes | No |
| For our affiliates’ everyday business purposes — information about your creditworthiness | No | We don’t share |
| For our investment management affiliates to market to you | Yes | Yes |
| For our affiliates to market to you | No | We don’t share |
| For nonaffiliates to market to you | No | We don’t share |
To limit our
sharing | Call toll-free 1-800-262-1122 or email: EVPrivacy@eatonvance.comPlease note:If you are a new customer, we can begin sharing your information 30 days from the date we sent this notice. When you are no longer our customer, we continue to share your information as described in this notice. However, you can contact us at any time to limit our sharing. |
| Questions? | Call toll-free 1-800-262-1122 or email: EVPrivacy@eatonvance.com |
| Privacy Notice — continued | April 2021 |
| Who we are |
| Who is providing this notice? | Eaton Vance Management, Eaton Vance Distributors, Inc., Eaton Vance Trust Company, Eaton Vance Management (International) Limited, Eaton Vance Advisers International Ltd., Eaton Vance Global Advisors Limited, Eaton Vance Management’s Real Estate Investment Group, Boston Management and Research, Calvert Research and Management, Eaton Vance and Calvert Fund Families and our investment advisory affiliates (“Eaton Vance”) (see Investment Management Affiliates definition below) |
| What we do |
How does Eaton Vance
protect my personal
information? | To protect your personal information from unauthorized access and use, we use security measures that comply with federal law. These measures include computer safeguards and secured files and buildings. We have policies governing the proper handling of customer information by personnel and requiring third parties that provide support to adhere to appropriate security standards with respect to such information. |
How does Eaton Vance
collect my personal
information? | We collect your personal information, for example, when you■ open an account or make deposits or withdrawals from your account
■ buy securities from us or make a wire transfer
■ give us your contact informationWe also collect your personal information from others, such as credit bureaus, affiliates, or other companies. |
| Why can’t I limit all sharing? | Federal law gives you the right to limit only■ sharing for affiliates’ everyday business purposes — information about your creditworthiness
■ affiliates from using your information to market to you
■ sharing for nonaffiliates to market to youState laws and individual companies may give you additional rights to limit sharing. See below for more on your rights under state law. |
| Definitions |
Investment Management
Affiliates | Eaton Vance Investment Management Affiliates include registered investment advisers, registered broker- dealers, and registered and unregistered funds. Investment Management Affiliates does not include entities associated with Morgan Stanley Wealth Management, such as Morgan Stanley Smith Barney LLC and Morgan Stanley & Co. |
| Affiliates | Companies related by common ownership or control. They can be financial and nonfinancial companies.■ Our affiliates include companies with a Morgan Stanley name and financial companies such as Morgan Stanley Smith Barney LLC and Morgan Stanley & Co. |
| Nonaffiliates | Companies not related by common ownership or control. They can be financial and nonfinancial companies.■ Eaton Vance does not share with nonaffiliates so they can market to you. |
| Joint marketing | A formal agreement between nonaffiliated financial companies that together market financial products or services to you.■ Eaton Vance doesn’t jointly market. |
| Other important information |
| Vermont: Except as permitted by law, we will not share personal information we collect about Vermont residents with Nonaffiliates unless you provide us with your written consent to share such information.California: Except as permitted by law, we will not share personal information we collect about California residents with Nonaffiliates and we will limit sharing such personal information with our Affiliates to comply with California privacy laws that apply to us. |
Delivery of Shareholder Documents. The Securities and Exchange Commission (SEC) permits funds to deliver only one copy of shareholder documents, including prospectuses, proxy statements and shareholder reports, to fund investors with multiple accounts at the same residential or post office box address. This practice is often called “householding” and it helps eliminate duplicate mailings to shareholders. Eaton Vance, or your financial intermediary, may household the mailing of your documents indefinitely unless you instruct Eaton Vance, or your financial intermediary, otherwise. If you would prefer that your Eaton Vance documents not be householded, please contact Eaton Vance at 1-800-262-1122, or contact your financial intermediary. Your instructions that householding not apply to delivery of your Eaton Vance documents will typically be effective within 30 days of receipt by Eaton Vance or your financial intermediary.
Portfolio Holdings. Each Eaton Vance Fund and its underlying Portfolio(s) (if applicable) files a schedule of portfolio holdings on Part F to Form N-PORT with the SEC. Certain information filed on Form N-PORT may be viewed on the Eaton Vance website at www.eatonvance.com, by calling Eaton Vance at 1-800-262-1122 or in the EDGAR database on the SEC’s website at www.sec.gov.
Proxy Voting. From time to time, funds are required to vote proxies related to the securities held by the funds. The Eaton Vance Funds or their underlying Portfolios (if applicable) vote proxies according to a set of policies and procedures approved by the Funds’ and Portfolios’ Boards. You may obtain a description of these policies and procedures and information on how the Funds or Portfolios voted proxies relating to portfolio securities during the most recent 12-month period ended June 30, without charge, upon request, by calling 1-800-262-1122 and by accessing the SEC’s website at www.sec.gov.
This Page Intentionally Left Blank
Investment Adviser
Boston Management and Research
Two International Place
Boston, MA 02110
Administrator
Eaton Vance Management
Two International Place
Boston, MA 02110
Principal Underwriter*
Eaton Vance Distributors, Inc.
Two International Place
Boston, MA 02110
(617) 482-8260
Custodian
State Street Bank and Trust Company
State Street Financial Center, One Lincoln Street
Boston, MA 02111
Transfer Agent
BNY Mellon Investment Servicing (US) Inc.
Attn: Eaton Vance Funds
P.O. Box 534439
Pittsburgh, PA 15253-4439
(800) 262-1122
Independent Registered Public Accounting Firm
Deloitte & Touche LLP
200 Berkeley Street
Boston, MA 02116-5022
Fund Offices
Two International Place
Boston, MA 02110
* FINRA BrokerCheck. Investors may check the background of their Investment Professional by contacting the Financial Industry Regulatory Authority (FINRA). FINRA BrokerCheck is a free tool to help investors check the professional background of current and former FINRA-registered securities firms and brokers. FINRA BrokerCheck is available by calling 1-800-289-9999 and at www.FINRA.org. The FINRA BrokerCheck brochure describing this program is available to investors at www.FINRA.org.
The registrant (sometimes referred to as the “Fund”) has adopted a code of ethics applicable to its Principal Executive Officer, Principal Financial Officer and Principal Accounting Officer. The registrant undertakes to provide a copy of such code of ethics to any person upon request, without charge, by calling 1-800-262-1122. The registrant has not amended the code of ethics as described in Form N-CSR during the period covered by this report. The registrant has not granted any waiver, including an implicit waiver, from a provision of the code of ethics as described in Form N-CSR during the period covered by this report.
| Item 3. | Audit Committee Financial Expert |
The registrant’s Board of Trustees (the “Board”) has designated George J. Gorman and Scott E. Wennerholm, each an independent trustee, as audit committee financial experts. Mr. Gorman is a certified public accountant who is the Principal at George J. Gorman LLC (a consulting firm). Previously, Mr. Gorman served in various capacities at Ernst & Young LLP (a registered public accounting firm), including as Senior Partner. Mr. Gorman also has experience serving as an independent trustee and audit committee financial expert of other
mutual fund complexes. Mr. Wennerholm is a private investor. Previously, Mr. Wennerholm served as a Trustee at Wheelock College (postsecondary institution), as a Consultant at GF Parish Group (executive recruiting firm), Chief Operating Officer and Executive Vice President at BNY Mellon Asset Management (investment management firm), Chief Operating Officer and Chief Financial Officer at Natixis Global Asset Management (investment management firm), and Vice President at Fidelity Investments Institutional Services (investment management firm).
| Item 4. | Principal Accountant Fees and Services |
Eaton Vance Balanced Fund, Eaton Vance Core Bond Fund, Eaton Vance Dividend Builder Fund, Eaton Vance Greater India Fund, Eaton Vance Growth Fund, Eaton Vance Large-Cap Value Fund, Eaton Vance Small-Cap Fund and Eaton Vance Special Equities Fund (the “Fund(s)”) are series of Eaton Vance Special Investment Trust (the “Trust”), a Massachusetts business trust, which, including the Funds, contains a total of 9 series (the “Series”). The Trust is registered under the Investment Company Act of 1940 as an open-end management investment company. This Form N-CSR relates to the Funds’ annual reports.
(a)-(d)
The following tables present the aggregate fees billed to each Fund for the Fund’s fiscal years ended December 31, 2021 and December 31, 2022 by the registrant’s principal accountant, Deloitte & Touche LLP (“D&T”), for professional services rendered for the audit of the Fund’s annual financial statements and fees billed for other services rendered by D&T during such periods.
| | | | | | | | |
Eaton Vance Balanced Fund Fiscal Years Ended | | 12/31/21 | | | 12/31/22 | |
Audit Fees | | $ | 24,450 | | | $ | 27,650 | |
Audit-Related Fees(1) | | $ | 0 | | | $ | 0 | |
Tax Fees(2) | | $ | 16,608 | | | $ | 2,175 | |
All Other Fees(3) | | $ | 0 | | | $ | 0 | |
| | | | | | | | |
Total | | $ | 41,058 | | | $ | 29,825 | |
| | | | | | | | |
| | | | | | | | |
Eaton Vance Core Bond Fund Fiscal Years Ended | | 12/31/21 | | | 12/31/22 | |
Audit Fees | | $ | 15,250 | | | $ | 17,750 | |
Audit-Related Fees(1) | | $ | 0 | | | $ | 0 | |
Tax Fees(2) | | $ | 12,548 | | | $ | 2,175 | |
All Other Fees(3) | | $ | 0 | | | $ | 0 | |
| | | | | | | | |
Total | | $ | 27,798 | | | $ | 19,925 | |
| | | | | | | | |
| | | | | | | | |
Eaton Vance Dividend Builder Fund Fiscal Years Ended | | 12/31/21 | | | 12/31/22 | |
Audit Fees | | $ | 37,650 | | | $ | 41,750 | |
Audit-Related Fees(1) | | $ | 0 | | | $ | 0 | |
Tax Fees(2) | | $ | 13,576 | | | $ | 3,675 | |
All Other Fees(3) | | $ | 0 | | | $ | 0 | |
| | | | | | | | |
Total | | $ | 51,226 | | | $ | 45,425 | |
| | | | | | | | |
| | | | | | | | |
Eaton Vance Greater India Fund Fiscal Years Ended | | 12/31/21 | | | 12/31/22 | |
Audit Fees | | $ | 16,350 | | | $ | 18,950 | |
Audit-Related Fees(1) | | $ | 0 | | | $ | 0 | |
Tax Fees(2) | | $ | 7,056 | | | $ | 2,175 | |
All Other Fees(3) | | $ | 0 | | | $ | 0 | |
| | | | | | | | |
Total | | $ | 23,406 | | | $ | 21,125 | |
| | | | | | | | |
| | | | | | | | |
Eaton Vance Growth Fund Fiscal Years Ended | | 12/31/21 | | | 12/31/22 | |
Audit Fees | | $ | 27,050 | | | $ | 30,450 | |
Audit-Related Fees(1) | | $ | 0 | | | $ | 0 | |
Tax Fees(2) | | $ | 14,190 | | | $ | 2,175 | |
All Other Fees(3) | | $ | 0 | | | $ | 0 | |
| | | | | | | | |
Total | | $ | 41,240 | | | $ | 32,625 | |
| | | | | | | | |
| | | | | | | | |
Eaton Vance Large-Cap Value Fund Fiscal Years Ended | | 12/31/21 | | | 12/31/22 | |
Audit Fees | | $ | 38,950 | | | $ | 43,150 | |
Audit-Related Fees(1) | | $ | 0 | | | $ | 0 | |
Tax Fees(2) | | $ | 16,739 | | | $ | 3,175 | |
All Other Fees(3) | | $ | 0 | | | $ | 0 | |
| | | | | | | | |
Total | | $ | 55,689 | | | $ | 46,325 | |
| | | | | | | | |
| | | | | | | | |
Eaton Vance Small-Cap Fund Fiscal Years Ended | | 12/31/21 | | | 12/31/22 | |
Audit Fees | | $ | 28,050 | | | $ | 31,450 | |
Audit-Related Fees(1) | | $ | 0 | | | $ | 0 | |
Tax Fees(2) | | $ | 10,862 | | | $ | 2,175 | |
All Other Fees(3) | | $ | 0 | | | $ | 0 | |
| | | | | | | | |
Total | | $ | 38,912 | | | $ | 33,625 | |
| | | | | | | | |
| | | | | | | | |
Eaton Vance Special Equities Fund Fiscal Years Ended | | 12/31/21 | | | 12/31/22 | |
Audit Fees | | $ | 27,050 | | | $ | 30,450 | |
Audit-Related Fees(1) | | $ | 0 | | | $ | 0 | |
Tax Fees(2) | | $ | 10,303 | | | $ | 2,175 | |
All Other Fees(3) | | $ | 0 | | | $ | 0 | |
| | | | | | | | |
Total | | $ | 37,353 | | | $ | 32,625 | |
| | | | | | | | |
| (1) | Audit-related fees consist of the aggregate fees billed for assurance and related services that are reasonably related to the performance of the audit of financial statements and are not reported under the category of audit fees. |
| (2) | Tax fees consist of the aggregate fees billed for professional services rendered by the principal accountant relating to tax compliance, tax advice, and tax planning and specifically include fees for tax return preparation and other related tax compliance/planning matters. |
| (3) | All other fees consist of the aggregate fees billed for products and services provided by the principal accountant other than audit, audit-related, and tax services. |
The various Series comprising the Trust have differing fiscal year ends (October 31 and December 31). The following table presents the aggregate audit, audit-related, tax, and other fees billed to all of the Series in the Trust by D&T for the last two fiscal years of each Series.
| | | | | | | | | | | | | | | | |
Fiscal Years Ended | | 10/31/21 | | | 12/31/21 | | | 10/31/22 | | | 12/31/22 | |
Audit Fees | | $ | 40,350 | | | $ | 214,800 | | | $ | 27,450 | | | $ | 241,600 | |
Audit-Related Fees(1) | | $ | 0 | | | $ | 0 | | | $ | 0 | | | $ | 0 | |
Tax Fees(2) | | $ | 8,922 | | | $ | 101,882 | | | $ | 350 | | | $ | 19,900 | |
All Other Fees(3) | | $ | 0 | | | $ | 0 | | | $ | 0 | | | $ | 0 | |
| | | | | | | | | | | | | | | | |
Total | | $ | 49,272 | | | $ | 316,682 | | | $ | 27,800 | | | $ | 261,500 | |
| | | | | | | | | | | | | | | | |
| (1) | Audit-related fees consist of the aggregate fees billed for assurance and related services that are reasonably related to the performance of the audit of financial statements and are not reported under the category of audit fees. |
| (2) | Tax fees consist of the aggregate fees billed for professional services rendered by the principal accountant relating to tax compliance, tax advice, and tax planning and specifically include fees for tax return preparation and other related tax compliance/planning matters. |
| (3) | All other fees consist of the aggregate fees billed for products and services provided by the principal accountant other than audit, audit-related, and tax services. |
(e)(1) The registrant’s audit committee has adopted policies and procedures relating to the pre-approval of services provided by the registrant’s principal accountant (the “Pre-Approval Policies”). The Pre-Approval Policies establish a framework intended to assist the audit committee in the proper discharge of its pre-approval responsibilities. As a general matter, the Pre-Approval Policies (i) specify certain types of audit, audit-related, tax, and other services determined to be pre-approved by the audit committee; and (ii) delineate specific procedures governing the mechanics of the pre-approval process, including the approval and monitoring of audit and non-audit service fees. Unless a service is specifically pre-approved under the Pre-Approval Policies, it must be separately pre-approved by the audit committee.
The Pre-Approval Policies and the types of audit and non-audit services pre-approved therein must be reviewed and ratified by the registrant’s audit committee at least annually. The registrant’s audit committee maintains full responsibility for the appointment, compensation, and oversight of the work of the registrant’s principal accountant.
(e)(2) No services described in paragraphs (b)-(d) above were approved by the registrant’s audit committee pursuant to the “de minimis exception” set forth in Rule 2-01 (c)(7)(i)(C) of Regulation S-X.
(f) Not applicable.
(g) The following table presents (i) the aggregate non-audit fees (i.e., fees for audit-related, tax, and other services) billed for services rendered to all of the Series in the Trust by D&T for the last two fiscal years of each Series; and (ii) the aggregate non-audit fees (i.e., fees for audit-related, tax, and other services) billed to the Eaton Vance organization by D&T for the last two fiscal years of each Series.
| | | | | | | | | | | | | | | | |
Fiscal Years Ended | | 10/31/21 | | | 12/31/21 | | | 10/31/22 | | | 12/31/22 | |
Registrant(1) | | $ | 8,922 | | | $ | 101,882 | | | $ | 350 | | | $ | 19,900 | |
Eaton Vance(2) | | $ | 51,800 | | | $ | 51,800 | | | $ | 52,836 | | | $ | 52,836 | |
| (1) | Includes all of the Series of the Trust. During the fiscal years reported above, certain of the Funds were “feeder” funds in a “master-feeder” fund structure or funds of funds. |
| (2) | Various subsidiaries of Morgan Stanley act in either an investment advisory and/or service provider capacity with respect to the Series and/or their respective “master” funds (if applicable). |
(h) The registrant’s audit committee has considered whether the provision by the registrant’s principal accountant of non-audit services to the registrant’s investment adviser and any entity controlling, controlled by, or under common control with the adviser that provides ongoing services to the registrant that were not pre-approved pursuant to Rule 2-01(c)(7)(ii) of Regulation S-X is compatible with maintaining the principal accountant’s independence.
| Item 5. | Audit Committee of Listed Registrants |
Not applicable.
| Item 6. | Schedule of Investments |
Please see schedule of investments contained in the Report to Stockholders included under Item 1 of this Form N-CSR.
| Item 7. | Disclosure of Proxy Voting Policies and Procedures for Closed-End Management Investment Companies |
Not applicable.
| Item 8. | Portfolio Managers of Closed-End Management Investment Companies |
Not applicable.
| Item 9. | Purchases of Equity Securities by Closed-End Management Investment Company and Affiliated Purchasers |
Not applicable.
| Item 10. | Submission of Matters to a Vote of Security Holders |
No material changes.
| Item 11. | Controls and Procedures |
(a) It is the conclusion of the registrant’s principal executive officer and principal financial officer that the effectiveness of the registrant’s current disclosure controls and procedures (such disclosure controls and procedures having been evaluated within 90 days of the date of this filing) provide reasonable assurance that the information required to be disclosed by the registrant has been recorded, processed, summarized and reported within the time period specified in the Commission’s rules and forms and that the information required to be disclosed by the registrant has been accumulated and communicated to the registrant’s principal executive officer and principal financial officer in order to allow timely decisions regarding required disclosure.
(b) There have been no changes in the registrant’s internal controls over financial reporting during the period covered by this report that has materially affected, or is reasonably likely to materially affect, the registrant’s internal control over financial reporting.
| Item 12. | Disclosure of Securities Lending Activities for Closed-End Management Investment Companies |
Not applicable.
Signatures
Pursuant to the requirements of the Securities Exchange Act of 1934 and the Investment Company Act of 1940, the registrant has duly caused this report to be signed on its behalf by the undersigned, thereunto duly authorized.
Eaton Vance Special Investment Trust
| | |
| By: | | /s/ Eric A. Stein |
| | Eric A. Stein |
| | President |
| |
| Date: | | February 27, 2023 |
Pursuant to the requirements of the Securities Exchange Act of 1934 and the Investment Company Act of 1940, this report has been signed below by the following persons on behalf of the registrant and in the capacities and on the dates indicated.
| | |
| By: | | /s/ James F. Kirchner |
| | James F. Kirchner |
| | Treasurer |
| |
| Date: | | February 27, 2023 |
| |
| By: | | /s/ Eric A. Stein |
| | Eric A. Stein |
| | President |
| |
| Date: | | February 27, 2023 |