UNITED STATES
SECURITIES AND EXCHANGE COMMISSION
Washington, D.C. 20549
FORM N-CSR
CERTIFIED SHAREHOLDER REPORT OF REGISTERED
MANAGEMENT INVESTMENT COMPANIES
Investment Company Act file number: 811 02995
Exact name of registrant as specified in charter: NRM Investment Company
Address of principal executive offices: NRM Investment Company, 280 Abrahams Lane, Villanova, Pa., 19085
Name and address of agent for service: John H. McCoy, President, NRM Investment Company, 280 Abrahams Lane, Villanova, Pa., 19085
Registrant’s Telephone Number: (610) 995-0322
Date of fiscal year end: August 31
Date of Reporting Period: Period ending February 28, 2011
ITEM 1 - REPORTS TO STOCKHOLDERS
A copy of the report transmitted to shareholders pursuant to Rule 30e-1 under the Investment Company Act is attached hereto.
ITEM 2 - CODE OF ETHICS
This is a semi-annual report. A response is not required.
ITEM 3. - AUDIT COMMITTEE FINANCIAL EXPERT
This is a semi-annual report. A response is not required.
ITEM 4. ACCOUNTANT FEES AND SERVICES
This is a semi-annual report. A response is not required.
ITEM 5. - Registrant is not a listed issuer.
ITEM 6 - SCHEDULE OF INVESTMENTS
The information is included as part of the report to shareholders filed under Item 1 of this report and attached hereto.
ITEMS 7, 8, 9 – PROXY VOTING POLICIES AND PURCHASES OF EQUITY SECURITIES
The information requested is not applicable to this open-end company.
ITEM 10 – SUBMISSION OF MATTERS TO A VOTE OF SECURITY HOLDERS
The registrant does not have a nominating committee. John H. McCoy, the Company’s president and chairman of the board owns beneficially and of record approximately 80% of the Company’s outstanding shares, he controls the Company, and is entitled to vote for every board member. Five shareholders, including Mr. McCoy, own beneficially approximately 99.7% of the Company’s outstanding shares. These circumstances obviate a nominating committee. All of the Board members, John H. McCoy, George Connell, Raymond Welsh, Anthony Fisher and Joseph Fabrizio routinely participate in the nomination of the directors at the annual shareholders meeting and by consensus accept the board members heretofore elected and currently serving.
ITEM – 11 CONTROLS AND PROCEDURES
The Fund operates through its five-member board of directors sitting as an executive committee of the whole; the board members receive only nominal director’s fees. The Fund has no employees other than its officers none of whom receives compensation in such role. (The Assistant Secretary to the Fund is its counsel who receives compensation only for legal work, not in his role as a Fund officer.) The Fund engages independent contractors to provide investment, financial and custodial services. The Fund’s principal executive and financial officer is its major shareholder and one of the five directors. In his view the following controls and procedures are effective to comply with the Regulations under the Investment Company Act, and no changes have been made during the first half of the Company’s fiscal year commencing September 1, 2010.
Portfolio Procedures
1. The Investment Advisor has discretion in investing the Fund’s portfolio but only within the guidelines established by the Board of Directors, and those authorized to execute investment transactions act only on direction by the Board or Advisor.
2. Any significant inflows or outflows of cash will be brought to the President’s attention to confirm that a related purchase or sale of securities or other disbursement was authorized by him.
Investment Custody and Shareholder Services
All transactions with shareholders and the custody of the Fund’s securities are performed by an independent corporate custodian. Any changes to these functions must be authorized by the Board of Directors.
Accounting and Reporting
1. The recording, summarizing and reporting of all financial data will be performed by a CPA who is independent of the buying and selling of securities as well as the disbursement of the Fund’s cash and transfer of the Fund’s assets.
2. Upon discovery, the CPA will bring any unusual transaction directly to the President and/or Board’s attention.
3. The CPA will provide directly to the Board of Directors a Statement of Net Assets and a Statement of Operations in accordance with generally accepted accounting principles within ten business days of each month end.
Item 12 – Exhibits
The required certifications are attached.
SIGNATURES
Pursuant to the requirements of the Securities Exchange Act of 1934 and the Investment Company Act of 1940, the registrant has duly caused this report to be signed on its behalf by the undersigned, thereunto duly authorized.
Registrant: NRM Investment Company
| By: | /s/ John H. McCoy | |
| John H. McCoy, President and Treasurer |
| Date: | 4/29/11 |
Pursuant to the requirements of the Securities Exchange Act of 1934 and the Investment Company Act of 1940, this report has been signed below by the following persons on behalf of the registrant and in the capacities and on the dates indicated.
| By: | /s/ John H. McCoy | |
| John H. McCoy, President and Treasurer |
| Date: | 4/290/11 |
| By: | /s/ Edward Fackenthal | |
| Edward Fackenthal, Counsel and Assistant Secretary |
| Date: | 4/29/11 |
NRM Investment Company
Semi-Annual Report
February 28, 2011
NRM Investment Company
Semi-Annual Report
February 28, 2011
| Table of Contents | ||
| Page No. | ||
| Total Returns and Performance at a Glance | 2 | |
| Advisor’s Report | 2 | |
| Performance Summary | 3 | |
| Financial Statements: | ||
| Statement of Assets and Liabilities | 6 | |
| Schedule of Investments | 7 | |
| Statement of Operations | 10 | |
| Statement of Changes in Net Assets | 11 | |
| Financial Highlights | 12 | |
| Notes to Financial Statements | 13 | |
| Fund’s Expenses | 18 |
1
NRM Investment Company
Semi-Annual Report
February 28, 2011
Total Returns
Year Ended February 28, 2011
| Total Return | ||||
| NRM Investment Company | 7.21 | % | ||
Composite Index1 | 7.80 | % | ||
1 60% Barclays 5 Yr Muni / 40% ML PFD Stock DRD Eligible (9/1/09 to 7/31/10) 60% Barclays 5 Yr Muni / 20% S&P 500/ 20% CPI (8/1/09 to 2/28/11) | ||||
| Performance at a Glance |
| Distributions Per Share | ||||||||||||||||
Starting Share Price | Ending Share Price | Income Dividends | Capital Gains | |||||||||||||
| NRM Investment Company | $ | 3.25 | $ | 3.44 | $ | 0.047 | $ | 0.00 | ||||||||
Advisor’s Report
The portfolio performance for the six month period ended February 28, 2011 was positively impacted by a defensive positioning in the portfolio’s municipal bond holdings. The municipal bond holdings returned -1.06% compared to -1.59% for the benchmark Barclays Capital 5-year Municipal Bond Index. The period was heavily influenced by negative sentiment regarding credit and budget pressures on state and local governments. This resulted in substantial outflows from large, open-ended municipal bond mutual funds that had to liquidate holdings to meet their redemption needs. This particularly impacted longer maturity bonds that comprise a large portion of many funds’ portfolios. Although they are not benchmark comparisons for the Fund, other Barclays Capital Indices show how weak the overall market was during the six month period. The Barclays Capital Municipal Bond Index returned -3.51% for the period and the Long Bond component of that index returned -6.96%, reflecting the price pressure from fund liquidations discussed above.
The Fund’s total portfolio performance for the six month period was 7.21%. This was positively impacted by the addition of common equity securities prior to the start of the period. The portfolio’s equity holdings returned 22.87% for the six month period. This performance lagged the S&P 500 Index performance of 27.73% for the period primarily due to the portfolio’s exposure to stocks and funds tied to the metals, mining and natural resources sector. As an indication of that sector’s performance for the period, the price of Gold rose 12.5% from $1254.50/oz to $1411.30/oz.
Looking forward, we believe the portfolio’s combination of a defensively postured bond portfolio and an equity portfolio comprised of high quality, dividend-paying stocks and stocks with exposure to natural resources will result in performance consistent with the objectives of the Board of Directors.
2
NRM Investment Company
Semi-Annual Report
February 28, 2011
Performance Summary
The following is a line graph that compares the initial and subsequent account values at the end of each of the most recently completed ten fiscal years of the Fund. It assumes a $10,000 initial investment at the beginning of the first fiscal year and an appropriate broad-based securities market index for the same period.
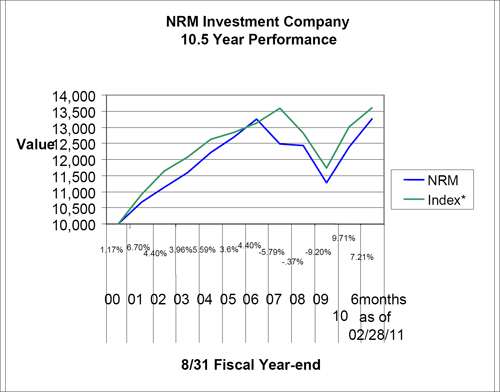
| * Index key | |
| Prior to 2008: | 100% Barclays 5 Yr Muni |
| 2008 thru 7/31/10: | 60% Barclays 5 Yr Muni / 40% ML PFD Stock DRD Eligible |
Beginning 7/31/10: S&P500/20% CPI | 60% Barclays 5 Yr Muni/ 20% |
3
NRM Investment Company
Semi-Annual Report
February 28, 2011
Performance Summary - Continued
The bar chart and table shown below provide some indication of the risks of investing in the Fund by showing changes in the Fund’s performance from year to year and by showing how the Fund’s average annual returns for 1, 5, and 10 years compared with those of broad-based securities market indexes. How the Fund has performed in the past (both before and after taxes) is not necessarily an indication of how the Fund will perform in the future.
Annual Total Returns
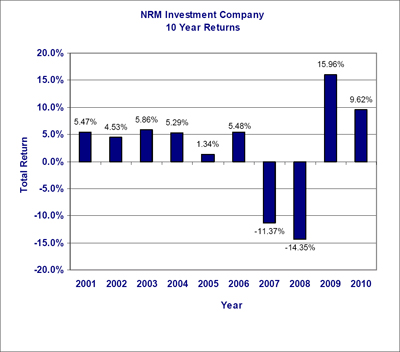
The return for the quarter ended March 31, 2011 was 2.76%.
During the 10 year period shown in the bar chart, the highest quarterly return was 17.36% (quarter ended 6/30/09) and the lowest quarterly return was -14.87% (quarter ended 9/30/08).
4
NRM Investment Company
Semi-Annual Report
February 28, 2011
Performance Summary - Continued
Average Annual Total returns for Periods Ended December 31, 2010
| 1 year | 5 years | 10 years | ||||||||||
| Return Before Taxes | 9.62 | % | .35 | % | 2.40 | % | ||||||
| Return After Taxes on Distributions | 9.04 | % | -.26 | % | 1.90 | % | ||||||
| Return After Taxes on Distributions and redemption of Fund Shares | 13.19 | % | -9.35 | % | -8.21 | % | ||||||
Comparative index (reflecting no deductions for fees, expenses or taxes) | ||||||||||||
Composite Index 1 | 8.32 | % | -1.50 | % | 2.18 | % | ||||||
1 60% Barclays 5 Yr Muni / 40% ML PFD Stock DRD Eligible. These indexes were used to compare the Company’s results with established benchmarks for asset categories similar to the Company’s investments throughout calendar year 2009. The results were blended to reflect the proportions of like-kind investments the Company held in its 2008 portfolio forward. Prior to 2008 the benchmark was 100% Barclays 5 Yr Muni. The Company selected Merrill Lynch Preferred DRD (Dividend Received Deduction) Eligible as a benchmark as the nearest equivalent to the pass-through treatment the Company shareholders received for QDI (Qualified Dividend Income) from the bulk of its preferred shares it held throughout 2009. The same indexes were used throughout July 2010 during which the Company owned a similar blend of securities. After July 31, 2010, the Company used three indexes to reflect new investments: 60% Barclays 5 Yr. Muni 20% S&P 500, and 20% CPI.
After Tax returns are calculated using the historical highest individual federal marginal income tax rates that do not reflect the impact of state and local taxes. Actual after-tax returns depend on an investor’s tax situation and may differ from those shown and are not relevant to investors who hold their fund shares through tax-deferred arrangements, such as 401K plans or individual retirement accounts and certain annuities.
| Assets | ||||
| Investments at fair value (cost $11,100,031) | $ | 11,391,566 | ||
| Interest and dividends receivable | 89,669 | |||
| Prepaid expenses | 2,700 | |||
| Total assets | 11,483,935 | |||
| Liabilities | ||||
| Dividends payable | 43,140 | |||
| Accrued expenses and other liabilities | 35,178 | |||
| Total liabilities | 78,318 | |||
| Net assets, applicable to 3,318,456 outstanding shares, Equivalent to $3.44 a share | $ | 11,405,617 | ||
See notes to financial statements
6
| NRM Investment Company |
Schedule of Investments Six Months Ended February 28, 2011 |
Principal Amount or Shares | Fair Value | |||||||
| Municipal Bonds –54.4% | ||||||||
General Obligation Bonds – 9.3% | ||||||||
| Pittsburgh, Pennsylvania, 5.00%, due 9/1/12, callable 3/1/12 at 100 (AMBAC) | 250,000 | $ | 260,178 | |||||
| Philadelphia, Pennsylvania School District, 5.625%, due 8/1/15, callable 8/1/12 at 100 (FGIC) | 300,000 | 321,105 | ||||||
| Pittsburgh, Pennsylvania, Refunding, 5.25%, due 9/1/16 | 100,000 | 110,785 | ||||||
| Puerto Rico, 5.50%, due 7/1/17 | 250,000 | 263,478 | ||||||
| Will County, Illinois, 5.0%, due 11/15/24 | 100,000 | 105,656 | ||||||
| Total General Obligation Bonds | 1,061,202 | |||||||
Housing Finance Agency Bonds - 1.8% | ||||||||
| California Housing Finance Agency, Home Mortgage, 10.25%, due 2/1/14, callable 2/1/99 at 100 | 15,000 | 15,207 | ||||||
| Louisiana LOC Government Environmental Facilities Community Development Authority, Multi-family Housing, 4.25%, due 4/15/39, put 4/15/16 at 100.00 | 185,000 | 185,585 | ||||||
| Total Housing Finance Agency Bonds | 200,792 | |||||||
Other Revenue Bonds – 43.3% | ||||||||
| Parkland, Pennsylvania School District, 5.375%, due 9/1/15 (FGIC) | 170,000 | 193,134 | ||||||
| Allegheny County, Pennsylvania Industrial Development Authority, 5.00%, due 11/1/11 (MBIA) | 100,000 | 102,601 | ||||||
Philadelphia, Pennsylvania Gas Works, 18th Series, 5.00%, due 8/1/11 (CIFG) | 300,000 | 303,360 | ||||||
| Pennsylvania Infrastructure Investment Authority, 5.00%, due 9/1/12 | 500,000 | 532,140 | ||||||
| Pennsylvania State Higher Educational Facilities Authority, 5.50%, prerefunded 1/01/16 | 350,000 | 380,387 | ||||||
| Philadelphia, Pennsylvania Wastewater, 5.00%, due 7/1/14 | 250,000 | 274,192 | ||||||
| Pennsylvania State Turnpike Commission, 5.25%, due 12/1/14, callable 12/1/10 at 101 (AMBAC) | 155,000 | 155,546 | ||||||
See notes to financial statements
7
| NRM Investment Company |
Schedule of Investments Six Months Ended February 28, 2011 |
Principal Amount or Shares | Fair Value | |||||||
| Municipal Bonds – 54.4% (Continued) | ||||||||
Other Revenue Bonds – 43.3% (Continued) | ||||||||
| St. Louis Missouri Municipal Finance Corporation, Leasehold Revenue (County Justice Center), 5.25%, due 2/15/15, callable 2/15/12 at 100 (AMBAC) | 50,000 | $ | 51,012 | |||||
| Pennsylvania State Turnpike Commission, 5.25%, due 12/1/15, callable 12/1/10 at 101 (AMBAC) | 140,000 | 140,487 | ||||||
| Allegheny County Sanitation Authority, Sewer Revenue, 5.00%, due 12/1/23, callable 12/1/15 at 100 | 300,000 | 309,036 | ||||||
| Allegheny County, Pennsylvania Higher Educational Building Authority, 5.50%, due 3/1/16, callable 6/15/12 at 100 (AMBAC) | 150,000 | 166,905 | ||||||
| Pennsylvania State Higher Educational Facilities Authority, 5.00%, due 6/15/16, callable 6/15/12 at 100 (AMBAC) | 100,000 | 103,974 | ||||||
| Philadelphia, Pennsylvania Gas Works, Fourth Series, 5.25%, due 8/1/16, callable 8/1/13 at 100 | 250,000 | 276,132 | ||||||
| Chester County, Pennsylvania Health and Educational Authority (Devereux), 5.00%, due 11/1/18 | 405,000 | 416,016 | ||||||
New York State Dorm Authority, 5.00%, due 7/01/17, callable 7/01/16 at 100 (SIENA) | 200,000 | 212,458 | ||||||
| Tobacco Settlement Financial Corporation, New Jersey, 5.00%, due 6/1/19, callable 6/1/17 at 100 | 200,000 | 194,124 | ||||||
| Pennsylvania State Public School Building Authority, 5.00%, due 5/15/22 | 150,000 | 155,826 | ||||||
| Pennsylvania State Higher Educational Facilities Authority (University of Pennsylvania Health System), 4.75%, due 8/15/22, callable 8/15/19 at 100 | 150,000 | 149,081 | ||||||
| North Carolina Medical Care Community Mortgage Revenue (Chatham Hospital), 5.25%, due 8/1/26, callable 2/1/17 at 100 (MBIA) | 230,000 | 225,232 | ||||||
| Virginia Port Facilities Authority, 4.50%, due 7/1/30, callable 7/1/19 at 100 | 200,000 | 195,690 | ||||||
Pennsylvania State Higher Educational Facilities Authority, 5.00%, due 11/01/30 | 400,000 | 396,024 | ||||||
| Total other revenue bonds | 4,933,357 | |||||||
| Total municipal bonds (cost $6,130,690) | 6,195,351 | |||||||
See notes to financial statements
8
| NRM Investment Company |
Schedule of Investments Six Months Ended February 28, 2011 |
Common Stocks – 21.3% | Shares | Fair Value | ||||||
| Altria Group, Inc. | 4,700 | $ | 119,239 | |||||
| AT & T, Inc. | 2,300 | 65,274 | ||||||
| Automatic Data Processing, Inc. | 200 | 10,000 | ||||||
| Bristol Myers Squibb Co. | 2,950 | 76,140 | ||||||
| Caterpillar, Inc. | 1,000 | 102,930 | ||||||
| Conocophillips | 1,250 | 97,337 | ||||||
| Consolidated Edison, Inc. | 1,950 | 97,461 | ||||||
| DuPont E.I. DeNemours & Co. | 1,200 | 65,844 | ||||||
| Eaton Corp. | 1,000 | 110,780 | ||||||
| Exelon Corp. | 1,850 | 77,256 | ||||||
| Genuine Parts Co. | 1,000 | 52,690 | ||||||
| Glaxosmithkline PLC, ADR | 2,700 | 104,247 | ||||||
| Home Depot Inc. | 2,000 | 74,940 | ||||||
| Intel Corp. | 4,000 | 85,880 | ||||||
| Johnson & Johnson | 1,000 | 61,440 | ||||||
| Kimberly Clark Corp. | 1,650 | 108,735 | ||||||
| Kraft Foods Inc., Class A | 2,100 | 66,864 | ||||||
| Lockheed Martin Corp. | 500 | 39,580 | ||||||
| M&T Bank Corp. | 600 | 52,830 | ||||||
| McDonalds Corp. | 900 | 68,112 | ||||||
| Merck & Co., Inc. | 3,000 | 97,710 | ||||||
| NYSE Euronext | 3,300 | 122,100 | ||||||
| Procter & Gamble Co. | 1,250 | 78,812 | ||||||
| Royal Dutch Shell, PLC, ADR | 1,700 | 122,825 | ||||||
| Sysco Corp. | 2,200 | 61,137 | ||||||
| Total Fina Elf SA, ADR | 2,250 | 137,925 | ||||||
| United Parcel Service | 150 | 11,070 | ||||||
| VF Corp. | 950 | 90,887 | ||||||
| Verizon Communications | 1,600 | 59,072 | ||||||
| Waste Management Inc. | 2,800 | 103,768 | ||||||
| Total common stocks (cost $2,085,880) | 2,422,885 | |||||||
| Other Securities – 23.2% | ||||||||
| Capital Trust, Inc. – REIT | 70,000 | 197,400 | ||||||
| Ishares Comex Gold Trust | 37,340 | 514,919 | ||||||
| SPDR Gold Trust | 3,875 | 533,436 | ||||||
| JPMorgan Chase & Co Aleran ML ETN | 5,350 | 212,398 | ||||||
| Pimco Real Return Strategy Fund | 60,839 | 588,312 | ||||||
| Vanguard Precious Metals & Mining Fund | 22,896 | 600,575 | ||||||
| Total other securities (cost $2,757,171) | 2,647,040 | |||||||
| Short-Term Investments - at Cost Approximating Fair Value - 1.1% | ||||||||
| Federated Pennsylvania Municipal Cash Trust #8 – (Cost $126,290) | 126,290 | 126,290 | ||||||
| Total investments - 100% (cost $11,100,031) | $ | $ 11,391,566 | ||||||
See notes to financial statements
9
| NRM Investment Company |
Statement of Operations Six Months Ended February 28, 2011 |
| Investment Income | ||||
| Interest | $ | 127,978 | ||
| Dividends | 99,043 | |||
| 227,021 | ||||
| Expenses | ||||
| Investment advisory fees | 16,450 | |||
| Custodian fees | 8,150 | |||
| Transfer and dividend disbursing agent fees | 1,325 | |||
| Legal and professional fees | 35,950 | |||
| Directors’ fees | 5,333 | |||
| Insurance | 758 | |||
| Capital stock tax | 2,300 | |||
| Miscellaneous | 3,600 | |||
| Total expenses | 73,866 | |||
| Net investment income | 153,155 | |||
| Realized and Unrealized Gain (Loss) on Investments | ||||
| Net realized loss from investment transactions | (6,928 | ) | ||
| Net unrealized appreciation of investments | 636,832 | |||
| Net realized and unrealized gain on investments | 629,904 | |||
| Net increase in net assets resulting from operations | $ | 783,059 | ||
See notes to financial statements
10
| NRM Investment Company |
Statement of Changes in Net Assets Period/Year Ended February 28, 2011 and August 31,2010 |
February 28, 2011 | August 31, 2010 | |||||||
| Increase (Decrease) in Net Assets from Operations | ||||||||
| Net investment income | $ | 153,155 | $ | 403,825 | ||||
| Net realized loss from investment transactions | (6,928 | ) | (985,719 | ) | ||||
| Net unrealized appreciation (depreciation) of investments | 636,832 | 1,622,695 | ||||||
| Net increase (decrease) in net assets resulting from operations | 783,059 | 1,040,801 | ||||||
| Distributions to Shareholders | (155,966 | ) | (401,100 | ) | ||||
| Capital Share Transactions | (657,977 | ) | 54 | |||||
| Total increase (decrease) in net assets | (30,886 | ) | 639,755 | |||||
| Net Assets, Beginning of Year | 11,436,503 | 10,796,748 | ||||||
| Net Assets, End of Year | $ | 11,405,617 | $ | 11,436,503 | ||||
See notes to financial statements
11
| NRM Investment Company |
Financial Highlights Period Ended February 28, 2011,August 31, 2010, 2009, 2008, 2007, and 2006 |
2/28/10 | 2010 | 2009 | 2008 | 2007 | 2006 | |||||||||||||||||||
| Unaudited | ||||||||||||||||||||||||
| Per Share Data (for a share outstanding throughout the indicated period) | ||||||||||||||||||||||||
| Net asset value, beginning of year | $ | 3.250 | $ | 3.069 | $ | 3.480 | $ | 3.551 | $ | 3.938 | $ | 3.900 | ||||||||||||
| Net investment income (loss) | .046 | .114 | .138 | .321 | (.131 | ) | .110 | |||||||||||||||||
| Net realized and unrealized gain (loss) on investments | .188 | .181 | (.454 | ) | (.336 | ) | (.088 | ) | .059 | |||||||||||||||
| Total from Investment Operations | .234 | .295 | (.316 | ) | (.015 | ) | (.219 | ) | .169 | |||||||||||||||
| Less distributions: | ||||||||||||||||||||||||
Dividends from capital gains | - | - | - | - | (.025 | ) | (.021 | ) | ||||||||||||||||
Dividends from net tax-exempt income | (.027 | ) | (.052 | ) | (.045 | ) | (.024 | ) | (.064 | ) | (.086 | ) | ||||||||||||
Dividends from net taxable income | (.020 | ) | (.062 | ) | (.050 | ) | (.032 | ) | (.079 | ) | (.024 | ) | ||||||||||||
| Total Distributions | (.047 | ) | (.114 | ) | (.095 | ) | (.056 | ) | (.168 | ) | (.131 | ) | ||||||||||||
| Net Asset Value, End of Period | $ | 3.437 | $ | 3.250 | $ | 3.069 | $ | 3.480 | $ | 3.551 | $ | 3.938 | ||||||||||||
| Total Return (Loss) | 7.21 | % | 9.71 | % | (9.20 | %) | (0.37 | %) | (5.79 | %) | 4.40 | % | ||||||||||||
| Ratios/Supplemental Data | ||||||||||||||||||||||||
| Net assets, end of period/year (in thousands) | $ | 11,406 | $ | 10,797 | $ | 10,797 | $ | 12,557 | $ | 12,815 | $ | 14,209 | ||||||||||||
| Ratio of expenses to average net assets | .66 | % | 1.39 | % | 1.40 | % | 1.33 | %* | 8.62 | % | 1.05 | % | ||||||||||||
| Ratio of net investment income (loss) to average net assets | 1.37 | % | 3.58 | % | 4.70 | % | 9.23 | % | (3.43 | %) | 2.77 | % | ||||||||||||
| Portfolio turnover rate | 8.15 | % | 38.07 | % | 17.27 | % | 9.27 | % | 18.00 | % | 88.85 | % | ||||||||||||
* Excludes the recovery of environmental claims and related costs.
See notes to financial statements
12
| NRM Investment Company |
Notes to Financial Statements February 28, 2011 |
| 1. | Nature of Business and Significant Accounting Policies |
Nature of Business
NRM Investment Company (the “Fund”) is registered under the Investment Company Act of 1940, as amended, as a diversified, open-end management investment company. The investment objective of the Fund is to maximize and distribute income and gains on a current basis. Its secondary objective is preservation of capital. The Fund generally invests in both bond and equity markets and is subject to the risks and uncertainty inherent therein. The following is a summary of significant accounting policies consistently followed by the Fund in the preparation of its financial statements.
Valuation of Investments
Investments in securities (other than debt securities maturing in 60 days or less) traded in the over-the-counter market, and listed securities for which no sale was reported on the last business day of the year, are valued based on prices furnished by a pricing service. This service determines the valuations using a matrix pricing system based on common bond features such as coupon rate, quality and expected maturity dates. Securities for which market quotations are not readily available are valued by the investment advisor under the supervision and responsibility of the Fund’s Board of Directors. Investments in securities that are traded on a national securities exchange are valued at the closing prices. Short-term investments are valued at amortized cost, which approximates fair value.
Investment Transactions and Related Investment Income
Investment transactions are accounted for on the date the securities are purchased or sold (trade date). Realized gains and losses from investment transactions are reported on the basis of identified cost for both financial and federal income tax purposes. Interest income is recorded on the accrual basis for both financial and income tax reporting. Dividend income is recognized on the ex-dividend date. In computing investment income, the Fund amortizes premiums over the life of the security, unless said premium is in excess of any call price, in which case the excess is amortized to the earliest call date. Discounts are accreted over the life of the security.
Transactions with Shareholders
Fund shares are sold and redeemed at the net asset value. Transactions of these shares are recorded on the trade date. Dividends and distributions are recorded by the Fund on the ex-dividend date.
Federal Income Taxes
It is the Fund’s policy to comply with the requirements of the Internal Revenue Code applicable to regulated investment companies and distribute substantially all of its net investment income and realized net gain from investment transactions to its shareholders and, accordingly, no provision has been made for federal income taxes.
The Fund adopted guidance on accounting for uncertain tax positions during the year ended August 31, 2010. The adoption did not have an impact on the Fund’s net assets or changes in net assets.
13
| NRM Investment Company |
| 1. | Nature of Business and Significant Accounting Policies (Continued) |
Estimates
The preparation of financial statements in conformity with accounting principles generally accepted in the United States of America requires management to make estimates and assumptions that affect the reported amounts of assets and liabilities and disclosure of contingent assets and liabilities at the date of the financial statements and the reported amounts of revenues and expenses during the reporting period. Actual results could differ from those estimates.
| 2. | Investment Advisor and Management Fees and Other Transactions with Affiliates |
The Fund has an investment advisory agreement which provides that the Fund pays to the investment advisor, as compensation for services provided and expenses assumed, a fee at the annual rate of .30% of the Fund’s net asset value. The chief executive officer of the investment advisor is on the Board of Directors of the Fund. Furthermore, the Fund’s president and chairman of the Board owns 80.1% of the Fund’s outstanding shares as of February 28, 2011.
| 3. | Cost, Purchases and Sales of Investment Securities |
Cost of purchases and proceeds from sales and maturities of investment securities, other than short-term investments, aggregated $933,886 and $892,531, respectively, during the six months ended February 28, 2011.
At February 28, 2011, the cost of investment securities owned is the same for financial reporting and federal income tax purposes. Net unrealized appreciation of investment securities is $291,535 (aggregate gross unrealized appreciation of $944,434, less aggregate unrealized depreciation of ($652,899).
| 4. | Dividends Payable |
On December 20, 2009 the Board of Directors declared a quarterly dividend of $.014 per share to shareholders of record as of February 23, 2011, payable March 1, 2011
| 5. | Fair Value Measurements |
The Fund adopted guidance on fair value measurements, issued by the Financial Accounting Standards Board (FASB) ASC 820-10, “Fair Value Measurements”. ASC 820-10 establishes a fair value hierarchy that prioritizes the inputs to valuation methods used to measure fair value. The hierarchy gives the highest priority to unadjusted quoted prices in active markets for identical assets or liabilities (Level 1 measurements) and the lowest priority to unobservable inputs (Level 3 measurements). The three levels of fair value hierarchy under ASC 820-10 are as follows:
Level 1 - Unadjusted quoted prices in active markets that are accessible at the measurement date for identical unrestricted assets or liabilities.
14
| NRM Investment Company |
| 5. | Fair Value Measurements (Continued) |
Level 2 - Quoted prices in markets that are not active, or inputs that are observable either directly or indirectly, for substantially the full term of the asset or liability.
Level 3 - Prices or valuation techniques that require inputs that are both significant to fair value measurement and unobservable (i.e. support with little or no market value activity).
For financial assets measured at fair value on a recurring basis, the fair value measurement by the level within the fair value hierarchy used as at February 28, 2011 are as follows:
Description | Total | (Level 1 - Quoted Prices in Active Markets for Identical Assets) | (Level 2 - Significant Other Observable Inputs) | (Level 3 - Significant Unobservable Inputs) | ||||||||||||
| Municipal bonds | $ | 6,195,351 | $ | - | $ | 6,195,351 | $ | - | ||||||||
| Common stocks | 2,422,887 | 2,422,885 | - | - | ||||||||||||
| Other securities | 2,647,040 | 2,647,040 | - | - | ||||||||||||
| Temporary cash investments | 126,290 | 126,290 | - | - | ||||||||||||
| Total | $ | 11,391,566 | $ | 5,196,215 | $ | 6,195,351 | $ | - | ||||||||
| 6. | Environmental Liability |
The Fund operated a steel processing factory between 1974 and 1979. During this period, it disposed of a relatively harmless chemical waste product consisting of a weak ferrous chloride solution. The independent transporters represented that its destination was at an approved site. Following various investigations beginning in the 1980’s and continuing to the present, the United States Environmental Protection Agency (EPA) determined that property on Broad Street in Doylestown, Pa. was used as an unapproved disposal site for many hazardous chemicals. In March 2008, it designated the site, called Chem-Fab, a National Priority “Super Fund” site requiring environmental remediation. Among the chemicals supposedly deposited there was ferrous chloride. Operations at Chem-Fab included ferrous chloride of greater strength than the Fund’s waste product. The EPA, supported by what it deems to be relevant documents and a witness statement, determined that the Fund and three others were responsible parties for disposal at Chem-Fab, and pursuant to statutory authorization, invited the four to participate in investigation and remediation. The expected cleanup cost for the site is uncertain but has been estimated at $5,000,000.
The Fund believes the EPA evidence of the Fund’s connection with the Chem-Fab site is weak and that any ferrous chloride of the kind the Fund produced and that may have been taken there caused no environmental harm. Based thereon, the Fund’s board of directors declined the invitation to remediate. On July 10, 2009, EPA acknowledged the refusal (as well as the refusals of the other three), indicating it would conduct an investigation and remediation study without outside participation. There has been no further contact from the EPA.
15
| NRM Investment Company |
| 6. | Environmental Liability (Continued) |
The EPA, if it persists in its position that the Fund was in any way responsible, may bring formal action for reimbursement. Although the Fund will defend vigorously any such action that might be brought, counsel, at this early stage of the investigation, is unable to evaluate the risk other than to say it is serious and for the indefinite future should be regarded as material.
| 7. | Transactions in Capital Stock and Components of Net Assets |
Transactions in fund shares for the period/year ended February 28 and August 31, 2010 were as follows:
February 28, 2011 | August 31, 2010 | |||||||||||||||
Shares | Amount | Shares | Amount | |||||||||||||
| Shares issued | - | $ | - | - | $ | - | ||||||||||
| Shares issued in reinvestment of dividends | 7 | 22 | 19 | 59 | ||||||||||||
| Shares redeemed | (200,000 | ) | (658,000 | ) | (1 | ) | (5 | ) | ||||||||
| Net increase (decrease) | (199,993 | ) | $ | (657,978 | ) | (18 | ) | $ | 54 | |||||||
The components of net assets at February 28 and August 31 are as follows:
February 28, 2011 | August 31, 2010 | |||||||
| Capital shares, par value $.01 per share, 3,518,456 shares and 3,518,449 shares issued and outstanding at February 28, 2011 and August 31, 2010 (10,000,000 full and fractional shares authorized); and capital paid-in | $ | 13,100,500 | $ | 13,758,424 | ||||
| Net realized loss on sale of investments* | (1,989,792 | ) | (1,982,864 | ) | ||||
| Unrealized appreciation (depreciation) of investments | 291,535 | (345,297 | ) | |||||
| Undistributed net investment income | 3,374 | 6,186 | ||||||
| Net assets | $ | 11,405,617 | $ | 11,436,503 | ||||
| * | Realized losses are the same for federal income tax purposes. Realized losses can be carried forward until the year ended August 31, 2016 ($12,051), August 31, 2017 ($985,094) and August 31, 2018 ($985,719). |
16
| NRM Investment Company |
| 8. | Distributions to Shareholders |
The tax character of distributions paid during the period/year ended February 28, 2011 and August 31, 2010 are as follows:
February 28, 2011 | August 31, 2010 | |||||||
| Distributions paid from: | ||||||||
Tax-exempt interest and dividends | $ | 89,142 | $ | 182,522 | ||||
Taxable qualified dividends | 42,446 | 218,578 | ||||||
Taxable ordinary dividends | 24,378 | - | ||||||
Long-term capital gains | - | - | ||||||
| $ | 155,966 | $ | 401,100 | |||||
| 9. | Subsequent Events |
During 2009, the Fund adopted Financial Accounting Standards Board (FASB) guidance now codified as FASB ASC Topic 855, Subsequent Events. This guidance establishes general standards for accounting and for disclosure of events that occur after the balance sheet date but before financial statements are issued. The subsequent event guidance sets forth the period after the balance sheet date during which management of a reporting entity should evaluate events or transactions that may occur for potential recognition in the financial statements, identifies the circumstances under which an entity should recognize events or transactions occurring after the balance sheet date in the financial statements, and the disclosures that should be made about events or transactions that occur after the balance sheet date.
| 10. | Concentration of Credit Risk |
During the current period, the Fund had cash balances in excess of federally insured limits.
| 11. | Cash and Cash Equivalents |
The Fund considers all short-term liquid investments with a maturity of three months or less when purchased to be cash equivalents.
In the normal course of business, the Fund’s marketable securities transactions, money balances and marketable security positions are transacted with a broker. The Fund is subject to credit risk to the extent any broker with which it conducts business is unable to fulfill contractual obligations on its behalf. The Fund monitors the financial condition of such brokers and does not anticipate any losses from these counterparties.
17
| NRM Investment Company |
Fund’s Expenses
Fees and Expenses
The following table describes the fees and expenses you may pay if you by and hold shares of the Fund. As is the case with all mutual funds, transaction costs incurred by the Fund for buying and selling securities are not reflected in the table. However, these costs are reflected in the investment performance figures included in the prospectus. The expenses shown in the following table are based on those incurred in the six months ended February 28, 2011:
Shareholder Fees
(Fees paid directly from your investment)
Sales Charge (Load) imposed on Purchases None
Purchase Fee None
Sales Charge (Load) imposed on Reinvested Dividends None
Redemption Fees None
Account Service Fees None
Semi-annual Fund Operating Expenses
(Expenses deducted from the Fund’s assets)
Management Expenses .15%
12b-1 Distribution Fees None
Other Expenses .51%
Total Semi-annual Fund Operating Expenses .66%
The accompanying table illustrates your Fund’s costs in two ways:
| 1. | Based on actual Fund return. This section helps you to estimate the actual expenses you paid over the period.. The “Ending Account Value” shown is derived from the Fund’s actual return, and the third column shows the dollar amount that would have been paid by an investor who started with a $1000 in the Fund. |
| 2. | Based on hypothetical 5% yearly return. This section is intended to help you compare the cost of investing in the Fund with the cost of investing in other mutual funds. It assumes that the fund had a yearly return of 5% before expenses, but the expenses ratio is unchanged. |
Six Months Ended February 28, 2011 |
Beginning Account Value 8/31/10 | Ending Account Value 2/28/11 | Expenses Paid During the Period | ||||||||||
| Based on Actual Fund Return | $ | 1,000.00 | $ | 1,072.10 | $ | 6.84 | ||||||
| Based on Hypothetical 5% Yearly Return | $ | 1,000.00 | $ | 1,045.40 | $ | 6.75 |
18