UNITED STATES
SECURITIES AND EXCHANGE COMMISSION
Washington, D.C. 20549
FORM N-CSR
CERTIFIED SHAREHOLDER REPORT OF REGISTERED
MANAGEMENT INVESTMENT COMPANIES
Investment Company Act File Number: 811-02958
T. Rowe Price International Funds, Inc.
(Exact name of registrant as specified in charter)
100 East Pratt Street, Baltimore, MD 21202
(Address of principal executive offices)
David Oestreicher
100 East Pratt Street, Baltimore, MD 21202
(Name and address of agent for service)
Registrant’s telephone number, including area code: (410) 345-2000
Date of fiscal year end: October 31
Date of reporting period: October 31, 2024
Item 1. Reports to Shareholders
(a) Report pursuant to Rule 30e-1
Annual Shareholder Report
October 31, 2024
This annual shareholder report contains important information about Emerging Europe Fund (the "fund") for the period of November 1, 2023 to October 31, 2024. You can find the fund’s prospectus, financial information on Form N‑CSR (which includes required tax information for dividends), holdings, proxy voting information, and other information atwww.troweprice.com/prospectus. You can also request this information without charge by contacting T. Rowe Price at 1‑800‑638‑5660 or info@troweprice.com or contacting your intermediary.
What were the fund costs for the last year? (based on a hypothetical $10,000 investment)
| | Costs of a $10,000 investment | Costs paid as a percentage of a $10,000 investment |
|---|
| Emerging Europe Fund - Investor Class | $178 | 1.47% |
What drove fund performance during the past 12 months?
Stocks in Türkiye gained ground, with investors encouraged by the adoption of more orthodox economic and monetary policies by the government of President Recep Tayyip Erdogan. In Poland, the formation of a pro-European Union coalition government in late 2023 was supportive to sentiment, as was the announcement in February 2024 that the country would gain access to previously withheld European Union funds as a result of the new government implementing reforms to restore judicial independence.
Versus the MSCI Emerging Markets Europe Index Net, stock selection in Türkiye made the biggest contribution to relative performance. Shares in D-Market Elektronik Hizmetler (operating as Hepsiburada) soared after Kazakh fintech giant Kaspi acquired a majority stake in the online retailer. Our positions in supermarket chain BIM and mobile phone operator Turkcell added further value. On a sector basis, financials contributed significantly to portfolio returns, driven by the National Bank of Greece and Halyk Savings Bank of Kazakhstan.
On the negative side, the main detractors from relative performance were largely idiosyncratic individual stocks, rather than due to allocations to particular countries or sectors. In particular, our position in Akbank held back portfolio returns; shares in the Turkish bank came under pressure in the second half of the review period. The position in Poland’s Bank Pekao also detracted from portfolio returns.
The fund uses fundamental analysis to identify companies in Central and Eastern Europe that have sustainable, above-market earnings growth rates, while taking into account the relevant macroeconomic backdrop. Notable changes in positioning included higher allocations to Türkiye and Kazakhstan and a lower allocation to Greece.
How has the fund performed?
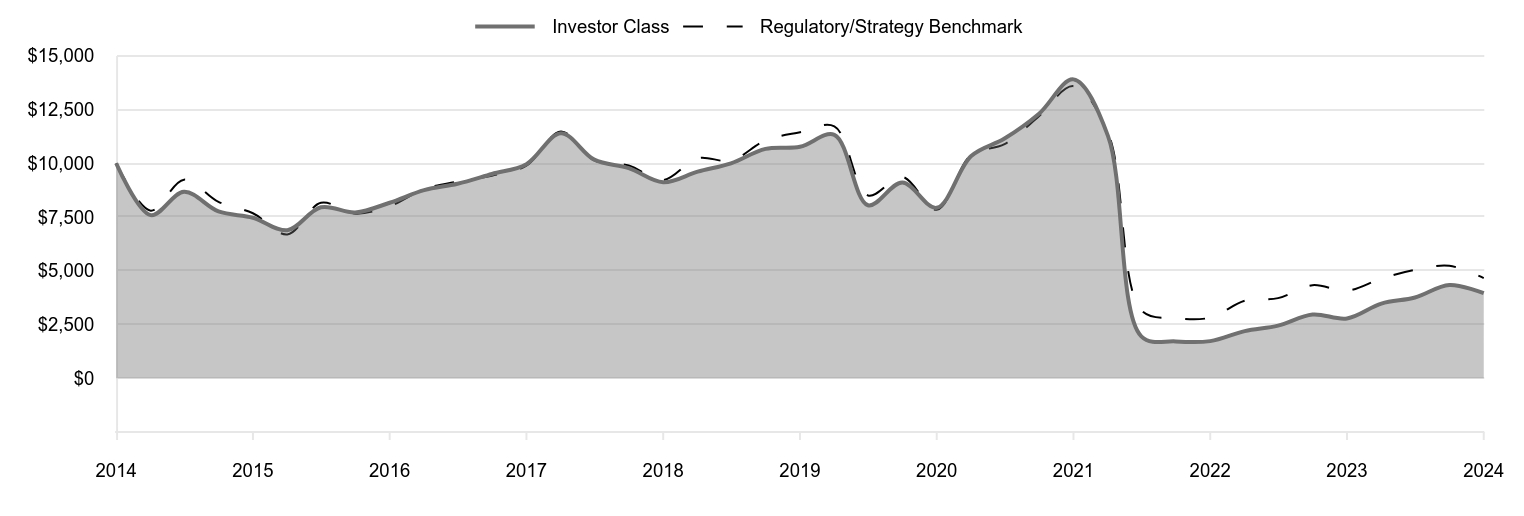
Cumulative Returns of a Hypothetical $10,000 Investment as of October 31, 2024
| Investor Class | Regulatory/Strategy Benchmark |
|---|
| 2014 | 10,000 | 10,000 |
| 2015 | 7,586 | 7,793 |
| 2015 | 8,671 | 9,237 |
| 2015 | 7,756 | 8,206 |
| 2015 | 7,466 | 7,673 |
| 2016 | 6,885 | 6,690 |
| 2016 | 7,951 | 8,161 |
| 2016 | 7,713 | 7,656 |
| 2016 | 8,163 | 8,004 |
| 2017 | 8,751 | 8,798 |
| 2017 | 9,044 | 9,153 |
| 2017 | 9,501 | 9,422 |
| 2017 | 9,958 | 9,892 |
| 2018 | 11,398 | 11,479 |
| 2018 | 10,167 | 10,130 |
| 2018 | 9,776 | 9,897 |
| 2018 | 9,115 | 9,218 |
| 2019 | 9,609 | 10,234 |
| 2019 | 9,998 | 10,121 |
| 2019 | 10,667 | 11,065 |
| 2019 | 10,763 | 11,446 |
| 2020 | 11,323 | 11,713 |
| 2020 | 8,047 | 8,503 |
| 2020 | 9,106 | 9,366 |
| 2020 | 7,927 | 7,835 |
| 2021 | 10,333 | 10,385 |
| 2021 | 11,147 | 10,884 |
| 2021 | 12,302 | 12,191 |
| 2021 | 13,901 | 13,585 |
| 2022 | 11,272 | 11,424 |
| 2022 | 1,949 | 3,164 |
| 2022 | 1,713 | 2,795 |
| 2022 | 1,727 | 2,819 |
| 2023 | 2,192 | 3,607 |
| 2023 | 2,449 | 3,726 |
| 2023 | 2,963 | 4,328 |
| 2023 | 2,782 | 4,069 |
| 2024 | 3,473 | 4,631 |
| 2024 | 3,756 | 5,038 |
| 2024 | 4,336 | 5,231 |
| 2024 | 3,954 | 4,661 |
202411-4029887, 202412-3916015
Average Annual Total Returns
| | 1 Year | 5 Years | 10 Years |
|---|
| Emerging Europe Fund (Investor Class) | 42.15% | -18.15% | -8.86% |
| MSCI Emerging Markets Europe Index Net (Regulatory/Strategy Benchmark) | 14.55 | -16.45 | -7.35 |
The preceding line graph shows the value of a hypothetical $10,000 investment in the fund over the past 10 fiscal year periods or since inception (for funds lacking 10-year records). The fund’s performance information included in the line graph and table above is compared with a regulatory required index that represents an overall securities market (Regulatory Benchmark). In addition, the line graph and table may also include one or more indexes that more closely aligns to the fund's investment strategy (Strategy Benchmark(s)). Due to new SEC Rules on shareholder reporting the fund adopted a new broad-based securities market index, referred to as the Regulatory Benchmark. Market index returns do not include expenses, which are deducted from fund returns. The fund's total return figures reflect the reinvestment of dividends and capital gains, if any.Neither the fund’s returns nor the index returns reflect the deduction of taxes that a shareholder would pay on fund distributions or redemptions of fund shares.The fund’s past performance is not a good predictor of the fund’s future performance.Updated performance information can be found at www.troweprice.com.
What are some fund statistics?
- Total Net Assets (000s)$49,190
- Number of Portfolio Holdings43
- Investment Advisory Fees Paid (000s)$(166)
- Portfolio Turnover Rate15.4%
What did the fund invest in?
Sector Allocation (as a % of Net Assets)
| Financials | 44.9% |
| Consumer Discretionary | 21.3 |
| Industrials & Business Services | 15.8 |
| Consumer Staples | 8.1 |
| Communication Services | 5.9 |
| Health Care | 2.4 |
| Real Estate | 1.5 |
| Materials | 0.5 |
| Energy | 0.0 |
| Other | -0.4 |
Top Ten Holdings (as a % of Net Assets)
| D-MARKET Elektronik Hizmetler ve Ticaret | 14.6% |
| OTP Bank | 9.1 |
| National Bank of Greece | 7.9 |
| BIM Birlesik Magazalar | 7.5 |
| KOC Holding | 5.0 |
| Halyk Savings Bank of Kazakhstan | 4.6 |
| InPost | 4.4 |
| Kaspi.KZ | 4.3 |
| Eurobank Ergasias Services & Holdings | 4.2 |
| Akbank | 3.8 |
If you invest directly with T. Rowe Price, you can elect to receive future shareholder reports or other important documents through electronic delivery by enrolling at www.troweprice.com/paperless. If you invest through a financial intermediary such as an investment advisor, a bank, retirement plan sponsor or a brokerage firm, please contact that organization and ask if it can provide electronic delivery.
MSCI does not accept any liability for any errors or omissions in the indexes or data, and hereby expressly disclaim all warranties of originality, accuracy, completeness, timeliness, merchantability and fitness for a particular purpose. No party may rely on any indexes or data contained in this communication. Visit www.troweprice.com/en/us/market-data-disclosures for additional legal notices & disclaimers.
Emerging Europe Fund
Investor Class (TREMX)
T. Rowe Price Investment Services, Inc.
100 East Pratt Street
Baltimore, MD 21202
Annual Shareholder Report
October 31, 2024
This annual shareholder report contains important information about Emerging Europe Fund (the "fund") for the period of November 1, 2023 to October 31, 2024. You can find the fund’s prospectus, financial information on Form N‑CSR (which includes required tax information for dividends), holdings, proxy voting information, and other information atwww.troweprice.com/prospectus. You can also request this information without charge by contacting T. Rowe Price at 1‑800‑638‑5660 or info@troweprice.com or contacting your intermediary.
What were the fund costs for the last year? (based on a hypothetical $10,000 investment)
| | Costs of a $10,000 investment | Costs paid as a percentage of a $10,000 investment |
|---|
| Emerging Europe Fund - I Class | $139 | 1.14% |
What drove fund performance during the past 12 months?
Stocks in Türkiye gained ground, with investors encouraged by the adoption of more orthodox economic and monetary policies by the government of President Recep Tayyip Erdogan. In Poland, the formation of a pro-European Union coalition government in late 2023 was supportive to sentiment, as was the announcement in February 2024 that the country would gain access to previously withheld European Union funds as a result of the new government implementing reforms to restore judicial independence.
Versus the MSCI Emerging Markets Europe Index Net, stock selection in Türkiye made the biggest contribution to relative performance. Shares in D-Market Elektronik Hizmetler (operating as Hepsiburada) soared after Kazakh fintech giant Kaspi acquired a majority stake in the online retailer. Our positions in supermarket chain BIM and mobile phone operator Turkcell added further value. On a sector basis, financials contributed significantly to portfolio returns, driven by the National Bank of Greece and Halyk Savings Bank of Kazakhstan.
On the negative side, the main detractors from relative performance were largely idiosyncratic individual stocks, rather than due to allocations to particular countries or sectors. In particular, our position in Akbank held back portfolio returns; shares in the Turkish bank came under pressure in the second half of the review period. The position in Poland’s Bank Pekao also detracted from portfolio returns.
The fund uses fundamental analysis to identify companies in Central and Eastern Europe that have sustainable, above-market earnings growth rates, while taking into account the relevant macroeconomic backdrop. Notable changes in positioning included higher allocations to Türkiye and Kazakhstan and a lower allocation to Greece.
How has the fund performed?
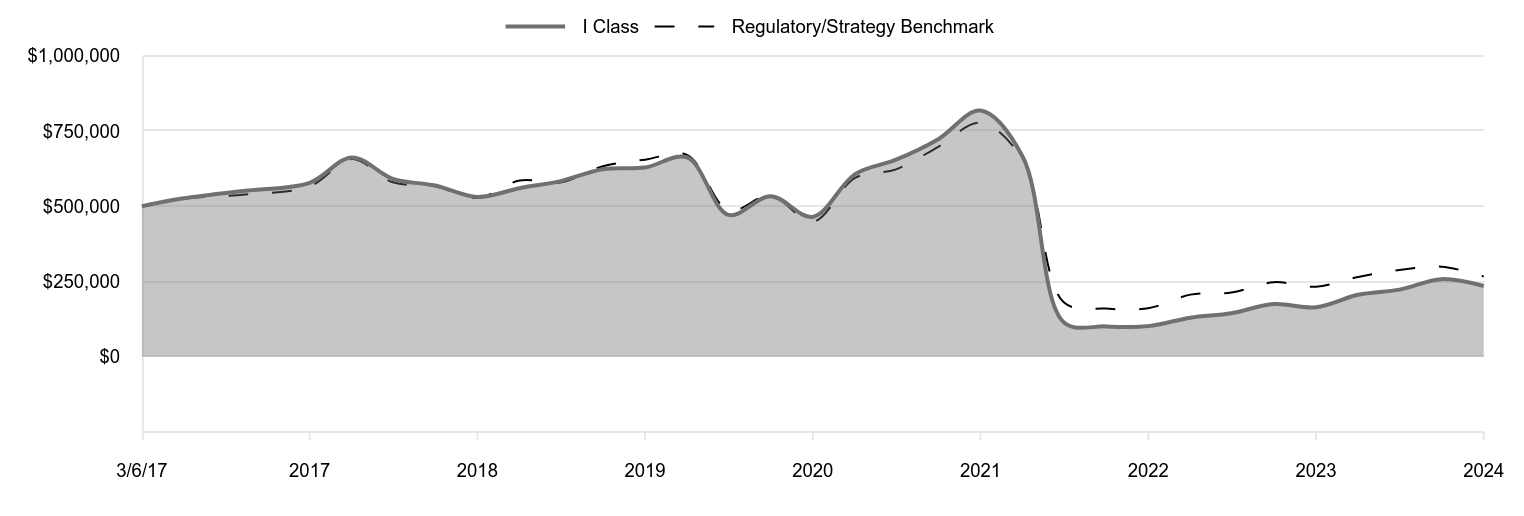
Cumulative Returns of a Hypothetical $500,000 Investment as of October 31, 2024
| I Class | Regulatory/Strategy Benchmark |
|---|
| 3/6/17 | 500,000 | 500,000 |
| 4/30/17 | 524,584 | 523,590 |
| 7/31/17 | 551,437 | 538,991 |
| 10/31/17 | 577,912 | 565,896 |
| 1/31/18 | 662,291 | 656,663 |
| 4/30/18 | 590,796 | 579,479 |
| 7/31/18 | 568,886 | 566,147 |
| 10/31/18 | 530,833 | 527,311 |
| 1/31/19 | 560,025 | 585,448 |
| 4/30/19 | 583,509 | 578,954 |
| 7/31/19 | 622,913 | 632,981 |
| 10/31/19 | 628,884 | 654,755 |
| 1/31/20 | 661,934 | 670,034 |
| 4/30/20 | 471,340 | 486,432 |
| 7/31/20 | 533,499 | 535,806 |
| 10/31/20 | 464,753 | 448,224 |
| 1/31/21 | 606,668 | 594,056 |
| 4/30/21 | 654,574 | 622,642 |
| 7/31/21 | 722,829 | 697,410 |
| 10/31/21 | 817,793 | 777,113 |
| 1/31/22 | 663,755 | 653,485 |
| 4/30/22 | 114,739 | 181,015 |
| 7/31/22 | 100,884 | 159,897 |
| 10/31/22 | 101,750 | 161,259 |
| 1/31/23 | 129,772 | 206,361 |
| 4/30/23 | 144,641 | 213,129 |
| 7/31/23 | 175,282 | 247,608 |
| 10/31/23 | 164,467 | 232,763 |
| 1/31/24 | 205,736 | 264,895 |
| 4/30/24 | 223,071 | 288,208 |
| 7/31/24 | 257,740 | 299,240 |
| 10/31/24 | 234,931 | 266,638 |
202411-4029887, 202412-3916015
Average Annual Total Returns
| | 1 Year | 5 Years | Since Inception 3/6/17 |
|---|
| Emerging Europe Fund (I Class) | 42.84% | -17.88% | -9.39% |
| MSCI Emerging Markets Europe Index Net (Regulatory/Strategy Benchmark) | 14.55 | -16.45 | -7.88 |
The preceding line graph shows the value of a hypothetical $500,000 investment in the fund over the past 10 fiscal year periods or since inception (for funds lacking 10-year records). The fund’s performance information included in the line graph and table above is compared with a regulatory required index that represents an overall securities market (Regulatory Benchmark). In addition, the line graph and table may also include one or more indexes that more closely aligns to the fund's investment strategy (Strategy Benchmark(s)). Due to new SEC Rules on shareholder reporting the fund adopted a new broad-based securities market index, referred to as the Regulatory Benchmark. Market index returns do not include expenses, which are deducted from fund returns. The fund's total return figures reflect the reinvestment of dividends and capital gains, if any.Neither the fund’s returns nor the index returns reflect the deduction of taxes that a shareholder would pay on fund distributions or redemptions of fund shares.The fund’s past performance is not a good predictor of the fund’s future performance.Updated performance information can be found at www.troweprice.com.
What are some fund statistics?
- Total Net Assets (000s)$49,190
- Number of Portfolio Holdings43
- Investment Advisory Fees Paid (000s)$(166)
- Portfolio Turnover Rate15.4%
What did the fund invest in?
Sector Allocation (as a % of Net Assets)
| Financials | 44.9% |
| Consumer Discretionary | 21.3 |
| Industrials & Business Services | 15.8 |
| Consumer Staples | 8.1 |
| Communication Services | 5.9 |
| Health Care | 2.4 |
| Real Estate | 1.5 |
| Materials | 0.5 |
| Energy | 0.0 |
| Other | -0.4 |
Top Ten Holdings (as a % of Net Assets)
| D-MARKET Elektronik Hizmetler ve Ticaret | 14.6% |
| OTP Bank | 9.1 |
| National Bank of Greece | 7.9 |
| BIM Birlesik Magazalar | 7.5 |
| KOC Holding | 5.0 |
| Halyk Savings Bank of Kazakhstan | 4.6 |
| InPost | 4.4 |
| Kaspi.KZ | 4.3 |
| Eurobank Ergasias Services & Holdings | 4.2 |
| Akbank | 3.8 |
If you invest directly with T. Rowe Price, you can elect to receive future shareholder reports or other important documents through electronic delivery by enrolling at www.troweprice.com/paperless. If you invest through a financial intermediary such as an investment advisor, a bank, retirement plan sponsor or a brokerage firm, please contact that organization and ask if it can provide electronic delivery.
MSCI does not accept any liability for any errors or omissions in the indexes or data, and hereby expressly disclaim all warranties of originality, accuracy, completeness, timeliness, merchantability and fitness for a particular purpose. No party may rely on any indexes or data contained in this communication. Visit www.troweprice.com/en/us/market-data-disclosures for additional legal notices & disclaimers.
Emerging Europe Fund
I Class (TTEEX)
T. Rowe Price Investment Services, Inc.
100 East Pratt Street
Baltimore, MD 21202
Annual Shareholder Report
October 31, 2024
This annual shareholder report contains important information about Emerging Europe Fund (the "fund") for the period of November 1, 2023 to October 31, 2024. You can find the fund’s prospectus, financial information on Form N‑CSR (which includes required tax information for dividends), holdings, proxy voting information, and other information atwww.troweprice.com/prospectus. You can also request this information without charge by contacting T. Rowe Price at 1‑800‑638‑5660 or info@troweprice.com or contacting your intermediary.
What were the fund costs for the last year? (based on a hypothetical $10,000 investment)
| | Costs of a $10,000 investment | Costs paid as a percentage of a $10,000 investment |
|---|
| Emerging Europe Fund - Z Class | $7 | 0.06% |
What drove fund performance during the past 12 months?
Stocks in Türkiye gained ground, with investors encouraged by the adoption of more orthodox economic and monetary policies by the government of President Recep Tayyip Erdogan. In Poland, the formation of a pro-European Union coalition government in late 2023 was supportive to sentiment, as was the announcement in February 2024 that the country would gain access to previously withheld European Union funds as a result of the new government implementing reforms to restore judicial independence.
Versus the MSCI Emerging Markets Europe Index Net, stock selection in Türkiye made the biggest contribution to relative performance. Shares in D-Market Elektronik Hizmetler (operating as Hepsiburada) soared after Kazakh fintech giant Kaspi acquired a majority stake in the online retailer. Our positions in supermarket chain BIM and mobile phone operator Turkcell added further value. On a sector basis, financials contributed significantly to portfolio returns, driven by the National Bank of Greece and Halyk Savings Bank of Kazakhstan.
On the negative side, the main detractors from relative performance were largely idiosyncratic individual stocks, rather than due to allocations to particular countries or sectors. In particular, our position in Akbank held back portfolio returns; shares in the Turkish bank came under pressure in the second half of the review period. The position in Poland’s Bank Pekao also detracted from portfolio returns.
The fund uses fundamental analysis to identify companies in Central and Eastern Europe that have sustainable, above-market earnings growth rates, while taking into account the relevant macroeconomic backdrop. Notable changes in positioning included higher allocations to Türkiye and Kazakhstan and a lower allocation to Greece.
How has the fund performed?
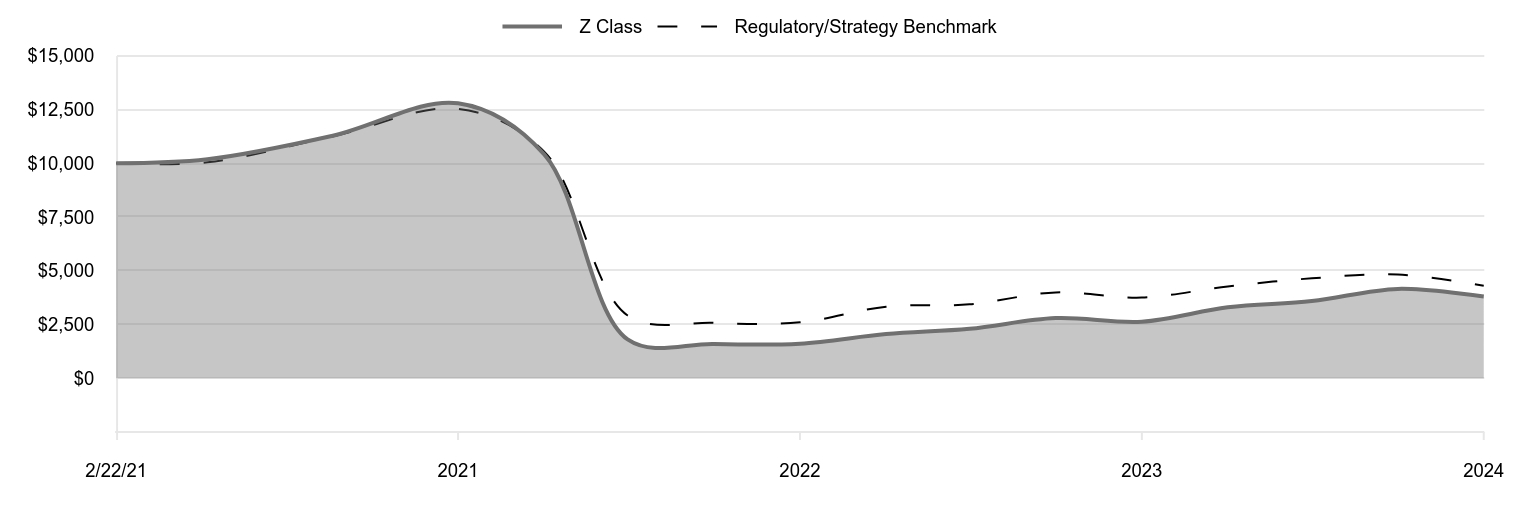
Cumulative Returns of a Hypothetical $10,000 Investment as of October 31, 2024
| Z Class | Regulatory/Strategy Benchmark |
|---|
| 2/22/21 | 10,000 | 10,000 |
| 4/30/21 | 10,185 | 10,041 |
| 7/31/21 | 11,278 | 11,247 |
| 10/31/21 | 12,788 | 12,532 |
| 1/31/22 | 10,410 | 10,538 |
| 4/30/22 | 1,807 | 2,919 |
| 7/31/22 | 1,595 | 2,579 |
| 10/31/22 | 1,609 | 2,601 |
| 1/31/23 | 2,056 | 3,328 |
| 4/30/23 | 2,301 | 3,437 |
| 7/31/23 | 2,799 | 3,993 |
| 10/31/23 | 2,633 | 3,754 |
| 1/31/24 | 3,301 | 4,272 |
| 4/30/24 | 3,589 | 4,648 |
| 7/31/24 | 4,156 | 4,826 |
| 10/31/24 | 3,803 | 4,300 |
202411-4029887, 202412-3916015
Average Annual Total Returns
| | 1 Year | Since Inception 2/22/21 |
|---|
| Emerging Europe Fund (Z Class) | 44.43% | -23.06% |
| MSCI Emerging Markets Europe Index Net (Regulatory/Strategy Benchmark) | 14.55 | -20.45 |
The preceding line graph shows the value of a hypothetical $10,000 investment in the fund over the past 10 fiscal year periods or since inception (for funds lacking 10-year records). The fund’s performance information included in the line graph and table above is compared with a regulatory required index that represents an overall securities market (Regulatory Benchmark). In addition, the line graph and table may also include one or more indexes that more closely aligns to the fund's investment strategy (Strategy Benchmark(s)). Due to new SEC Rules on shareholder reporting the fund adopted a new broad-based securities market index, referred to as the Regulatory Benchmark. Market index returns do not include expenses, which are deducted from fund returns. The fund's total return figures reflect the reinvestment of dividends and capital gains, if any.Neither the fund’s returns nor the index returns reflect the deduction of taxes that a shareholder would pay on fund distributions or redemptions of fund shares.The fund’s past performance is not a good predictor of the fund’s future performance.Updated performance information can be found at www.troweprice.com.
What are some fund statistics?
- Total Net Assets (000s)$49,190
- Number of Portfolio Holdings43
- Investment Advisory Fees Paid (000s)$(166)
- Portfolio Turnover Rate15.4%
What did the fund invest in?
Sector Allocation (as a % of Net Assets)
| Financials | 44.9% |
| Consumer Discretionary | 21.3 |
| Industrials & Business Services | 15.8 |
| Consumer Staples | 8.1 |
| Communication Services | 5.9 |
| Health Care | 2.4 |
| Real Estate | 1.5 |
| Materials | 0.5 |
| Energy | 0.0 |
| Other | -0.4 |
Top Ten Holdings (as a % of Net Assets)
| D-MARKET Elektronik Hizmetler ve Ticaret | 14.6% |
| OTP Bank | 9.1 |
| National Bank of Greece | 7.9 |
| BIM Birlesik Magazalar | 7.5 |
| KOC Holding | 5.0 |
| Halyk Savings Bank of Kazakhstan | 4.6 |
| InPost | 4.4 |
| Kaspi.KZ | 4.3 |
| Eurobank Ergasias Services & Holdings | 4.2 |
| Akbank | 3.8 |
If you invest directly with T. Rowe Price, you can elect to receive future shareholder reports or other important documents through electronic delivery by enrolling at www.troweprice.com/paperless. If you invest through a financial intermediary such as an investment advisor, a bank, retirement plan sponsor or a brokerage firm, please contact that organization and ask if it can provide electronic delivery.
MSCI does not accept any liability for any errors or omissions in the indexes or data, and hereby expressly disclaim all warranties of originality, accuracy, completeness, timeliness, merchantability and fitness for a particular purpose. No party may rely on any indexes or data contained in this communication. Visit www.troweprice.com/en/us/market-data-disclosures for additional legal notices & disclaimers.
Emerging Europe Fund
Z Class (TRZEX)
T. Rowe Price Investment Services, Inc.
100 East Pratt Street
Baltimore, MD 21202
Item 1. (b) Notice pursuant to Rule 30e-3.
Not applicable.
Item 2. Code of Ethics.
The registrant has adopted a code of ethics, as defined in Item 2 of Form N-CSR, applicable to its principal executive officer, principal financial officer, principal accounting officer or controller, or persons performing similar functions. A copy of this code of ethics is filed as an exhibit to this Form N-CSR. No substantive amendments were approved or waivers were granted to this code of ethics during the period covered by this report.
Item 3. Audit Committee Financial Expert.
The registrant’s Board of Directors has determined that Mr. Paul F. McBride qualifies as an audit committee financial expert, as defined in Item 3 of Form N-CSR. Mr. McBride is considered independent for purposes of Item 3 of Form N-CSR.
Item 4. Principal Accountant Fees and Services.
(a) – (d) Aggregate fees billed for the last two fiscal years for professional services rendered to, or on behalf of, the registrant by the registrant’s principal accountant were as follows:
| | | | | | | | | | |
| | | | | 2024 | | | 2023 | |
| | Audit Fees | | | $13,024 | | | | $12,815 | |
| | Audit-Related Fees | | | - | | | | - | |
| | Tax Fees | | | - | | | | - | |
| | All Other Fees | | | - | | | | - | |
Audit fees include amounts related to the audit of the registrant’s annual financial statements and services normally provided by the accountant in connection with statutory and regulatory filings. Audit-related fees include amounts reasonably related to the performance of the audit of the registrant’s financial statements and specifically include the issuance of a report on internal controls and, if applicable, agreed-upon procedures related to fund acquisitions. Tax fees include amounts related to services for tax compliance, tax planning, and tax advice. The nature of these services specifically includes the review of distribution calculations and the preparation of Federal, state, and excise tax returns. All other fees include the registrant’s pro-rata share of amounts for agreed-upon procedures in conjunction with service contract approvals by the registrant’s Board of Directors/Trustees.
(e)(1) The registrant’s audit committee has adopted a policy whereby audit and non-audit services performed by the registrant’s principal accountant for the registrant, its investment adviser, and any entity controlling, controlled by, or under common control with the investment adviser that provides ongoing services to the registrant require pre-approval in advance at regularly scheduled audit committee meetings. If such a service is required between regularly scheduled audit committee meetings, pre-approval may be authorized by one audit committee member with ratification at the next scheduled audit committee meeting. Waiver of pre-approval for audit or non-audit services requiring fees of a de minimis amount is not permitted.
(2) No services included in (b) – (d) above were approved pursuant to paragraph (c)(7)(i)(C) of Rule 2-01 of Regulation S-X.
(f) Less than 50 percent of the hours expended on the principal accountant’s engagement to audit the registrant’s financial statements for the most recent fiscal year were attributed to work performed by persons other than the principal accountant’s full-time, permanent employees.
(g) The aggregate fees billed for the most recent fiscal year and the preceding fiscal year by the registrant’s principal accountant for non-audit services rendered to the registrant, its investment adviser, and any entity controlling, controlled by, or under common control with the investment adviser that provides ongoing services to the registrant were $846,000 and $1,584,000, respectively.
(h) All non-audit services rendered in (g) above were pre-approved by the registrant’s audit committee. Accordingly, these services were considered by the registrant’s audit committee in maintaining the principal accountant’s independence.
(i) Not applicable.
(j) Not applicable.
Item 5. Audit Committee of Listed Registrants.
Not applicable.
Item 6. Investments.
(a) Not applicable. The complete schedule of investments is included in Item 7 of this Form N-CSR.
(b) Not applicable.
Item 7. Financial Statements and Financial Highlights for Open-End Management Investment Companies.
(a – b) Report pursuant to Regulation S-X.
Financial
Highlights
Portfolio
of
Investments
Financial
Statements
and
Notes
Additional
Fund
Information
Financial
Statements
and
Other
Information
For
more
insights
from
T.
Rowe
Price
investment
professionals,
go
to
troweprice.com
.
T.
ROWE
PRICE
TREMX
Emerging
Europe
Fund
TTEEX
Emerging
Europe
Fund–
.
I Class
TRZEX
Emerging
Europe
Fund–
.
Z Class
T.
ROWE
PRICE
Emerging
Europe
Fund
For
a
share
outstanding
throughout
each
period
The
accompanying
notes
are
an
integral
part
of
these
financial
statements.
Investor
Class
..
Year
..
..
Ended
.
10/31/24
10/31/23
10/31/22
10/31/21
10/31/20
NET
ASSET
VALUE
Beginning
of
period
$
3
.68
$
2
.34
$
19
.13
$
11
.23
$
15
.76
Investment
activities
Net
investment
income
(1)(2)
0
.11
0
.06
0
.10
0
.25
0
.43
Net
realized
and
unrealized
gain/loss
1
.43
1
.34
(
16
.63
)
8
.08
(
4
.42
)
Total
from
investment
activities
1
.54
1
.40
(
16
.53
)
8
.33
(
3
.99
)
Distributions
Net
investment
income
(
0
.04
)
(
0
.06
)
(
0
.26
)
(
0
.43
)
(
0
.50
)
Net
realized
gain
—
—
—
—
(
0
.04
)
Total
distributions
(
0
.04
)
(
0
.06
)
(
0
.26
)
(
0
.43
)
(
0
.54
)
NET
ASSET
VALUE
End
of
period
$
5
.18
$
3
.68
$
2
.34
$
19
.13
$
11
.23
Ratios/Supplemental
Data
Total
return
(2)(3)
42
.15
%
61
.05
%
(
87
.57
)
%
75
.35
%
(
26
.34
)
%
Ratios
to
average
net
assets:
(2)
Gross
expenses
before
waivers/payments
by
Price
Associates
2
.91
%
3
.63
%
2
.68
%
1
.67
%
1
.66
%
Net
expenses
after
waivers/
payments
by
Price
Associates
1
.47
%
1
.58
%
1
.42
%
1
.41
%
1
.41
%
Net
investment
income
2
.22
%
1
.70
%
1
.57
%
1
.59
%
3
.19
%
Portfolio
turnover
rate
15
.4
%
50
.9
%
65
.8
%
46
.0
%
31
.9
%
Net
assets,
end
of
period
(in
thousands)
$38,737
$32,913
$23,681
$162,619
$98,750
0
%
0
%
0
%
0
%
0
%
(1)
Per
share
amounts
calculated
using
average
shares
outstanding
method.
(2)
Includes
the
impact
of
expense-related
arrangements
with
Price
Associates.
(3)
Total
return
reflects
the
rate
that
an
investor
would
have
earned
on
an
investment
in
the
fund
during
each
period,
assuming
reinvestment
of
all
distributions,
and
payment
of
no
redemption
or
account
fees,
if
applicable.
T.
ROWE
PRICE
Emerging
Europe
Fund
For
a
share
outstanding
throughout
each
period
The
accompanying
notes
are
an
integral
part
of
these
financial
statements.
I
Class
..
Year
..
..
Ended
.
10/31/24
10/31/23
10/31/22
10/31/21
10/31/20
NET
ASSET
VALUE
Beginning
of
period
$
3
.65
$
2
.35
$
19
.29
$
11
.29
$
15
.80
Investment
activities
Net
investment
income
(1)(2)
0
.13
0
.07
0
.08
0
.32
0
.49
Net
realized
and
unrealized
gain/loss
1
.42
1
.34
(
16
.67
)
8
.12
(
4
.45
)
Total
from
investment
activities
1
.55
1
.41
(
16
.59
)
8
.44
(
3
.96
)
Distributions
Net
investment
income
(
0
.05
)
(
0
.11
)
(
0
.35
)
(
0
.44
)
(
0
.51
)
Net
realized
gain
—
—
—
—
(
0
.04
)
Total
distributions
(
0
.05
)
(
0
.11
)
(
0
.35
)
(
0
.44
)
(
0
.55
)
NET
ASSET
VALUE
End
of
period
$
5
.15
$
3
.65
$
2
.35
$
19
.29
$
11
.29
Ratios/Supplemental
Data
Total
return
(2)(3)
42
.84
%
61
.64
%
(
87
.56
)
%
75
.96
%
(
26
.10
)
%
Ratios
to
average
net
assets:
(2)
Gross
expenses
before
waivers/payments
by
Price
Associates
1
.85
%
2
.29
%
2
.59
%
1
.37
%
1
.33
%
Net
expenses
after
waivers/
payments
by
Price
Associates
1
.14
%
1
.26
%
1
.11
%
1
.08
%
1
.09
%
Net
investment
income
2
.58
%
2
.05
%
2
.17
%
1
.97
%
3
.57
%
Portfolio
turnover
rate
15
.4
%
50
.9
%
65
.8
%
46
.0
%
31
.9
%
Net
assets,
end
of
period
(in
thousands)
$6,367
$4,818
$3,146
$6,347
$3,284
0
%
0
%
0
%
0
%
0
%
(1)
Per
share
amounts
calculated
using
average
shares
outstanding
method.
(2)
Includes
the
impact
of
expense-related
arrangements
with
Price
Associates.
(3)
Total
return
reflects
the
rate
that
an
investor
would
have
earned
on
an
investment
in
the
fund
during
each
period,
assuming
reinvestment
of
all
distributions,
and
payment
of
no
redemption
or
account
fees,
if
applicable.
T.
ROWE
PRICE
Emerging
Europe
Fund
For
a
share
outstanding
throughout
each
period
The
accompanying
notes
are
an
integral
part
of
these
financial
statements.
Z
Class
(1)
..
Year
..
..
Ended
.
2/22/21
(1)
Through
10/31/21
10/31/24
10/31/23
10/31/22
NET
ASSET
VALUE
Beginning
of
period
$
3
.65
$
2
.36
$
19
.31
$
15
.10
Investment
activities
Net
investment
income
(2)(3)
0
.18
0
.10
0
.20
0
.52
Net
realized
and
unrealized
gain/loss
1
.42
1
.34
(
16
.67
)
3
.69
Total
from
investment
activities
1
.60
1
.44
(
16
.47
)
4
.21
Distributions
Net
investment
income
(
0
.09
)
(
0
.15
)
(
0
.48
)
—
NET
ASSET
VALUE
End
of
period
$
5
.16
$
3
.65
$
2
.36
$
19
.31
Ratios/Supplemental
Data
Total
return
(3)(4)
44
.43
%
63
.65
%
(
87
.42
)
%
27
.88
%
Ratios
to
average
net
assets:
(3)
Gross
expenses
before
waivers/payments
by
Price
Associates
1
.81
%
2
.25
%
1
.81
%
1
.41
%
(5)
Net
expenses
after
waivers/payments
by
Price
Associates
0
.06
%
0
.17
%
0
.00
%
0
.00
%
(5)
Net
investment
income
3
.65
%
3
.16
%
2
.87
%
4
.42
%
(5)
Portfolio
turnover
rate
15
.4
%
50
.9
%
65
.8
%
46
.0
%
Net
assets,
end
of
period
(in
thousands)
$4,086
$2,832
$1,735
$14,642
0
%
0
%
0
%
0
%
(1)
Inception
date
(2)
Per
share
amounts
calculated
using
average
shares
outstanding
method.
(3)
Includes
the
impact
of
expense-related
arrangements
with
Price
Associates.
(4)
Total
return
reflects
the
rate
that
an
investor
would
have
earned
on
an
investment
in
the
fund
during
each
period,
assuming
reinvestment
of
all
distributions,
and
payment
of
no
redemption
or
account
fees,
if
applicable.
Total
return
is
not
annualized
for
periods
less
than
one
year.
(5)
Annualized
T.
ROWE
PRICE
Emerging
Europe
Fund
October
31,
2024
Shares
$
Value
(
Cost
and
value
in
$000s)
‡
CYPRUS 0.0%
Common
Stocks 0.0%
Galaxy
Cosmos
Mezz
13,255
10
Total
Cyprus
(Cost
$–)
10
GREECE 19.6%
Common
Stocks 19.6%
Alpha
Services
and
Holdings
357,887
539
Eurobank
Ergasias
Services
&
Holdings
1,000,871
2,071
JUMBO
43,435
1,159
LAMDA
Development (1)
91,521
735
National
Bank
of
Greece
494,360
3,873
OPAP
73,605
1,258
Total
Greece
(Cost
$4,267)
9,635
HUNGARY 11.8%
Common
Stocks 11.8%
OTP
Bank
89,621
4,462
Richter
Gedeon
40,682
1,176
Wizz
Air
Holdings
(GBP) (1)(2)
8,390
149
Total
Hungary
(Cost
$3,374)
5,787
KAZAKHSTAN 8.9%
Common
Stocks 8.9%
Halyk
Savings
Bank
of
Kazakhstan,
GDR
(USD)
122,309
2,262
Kaspi.KZ,
ADR
(USD)
19,289
2,124
Kazakhstan
Kagazy,
GDR
(USD) (1)(3)(4)(5)
327,395
—
Total
Kazakhstan
(Cost
$20,021)
4,386
LITHUANIA 2.7%
Common
Stocks 2.7%
Baltic
Classifieds
Group
(GBP)
323,535
1,320
Total
Lithuania
(Cost
$737)
1,320
T.
ROWE
PRICE
Emerging
Europe
Fund
Shares
$
Value
(Cost
and
value
in
$000s)
POLAND 14.6%
Common
Stocks 14.6%
Allegro.eu (1)
102,804
905
Bank
Polska
Kasa
Opieki
21,162
740
InPost
(EUR) (1)
109,863
2,143
Powszechna
Kasa
Oszczednosci
Bank
Polski
124,914
1,736
Powszechny
Zaklad
Ubezpieczen
169,099
1,677
Total
Poland
(Cost
$6,311)
7,201
PORTUGAL 0.6%
Common
Stocks 0.6%
Jeronimo
Martins
15,623
303
Total
Portugal
(Cost
$329)
303
RUSSIA 0.0%
Common
Stocks 0.0%
Gazprom (1)(3)
3,658,844
—
GMK
Norilskiy
Nickel (3)
2,174,150
—
LUKOIL (3)
170,476
—
Magnit (3)
32,681
—
Moscow
Exchange (3)
207,430
—
Novatek (3)
230,520
—
Rosneft
Oil (3)
607,203
—
Sberbank
of
Russia (3)
10,373,360
—
Segezha
Group (1)(3)
11,000,000
—
Surgutneftegas (3)
2,584,700
—
Yandex,
Class
A (1)(3)
69,578
—
Total
Russia
(Cost
$57,533)
—
TüRKIYE 40.2%
Common
Stocks 40.2%
Akbank
1,253,543
1,853
BIM
Birlesik
Magazalar
268,633
3,666
D-MARKET
Elektronik
Hizmetler
ve
Ticaret,
ADR
(USD) (1)
2,257,733
7,202
Haci
Omer
Sabanci
Holding
550,200
1,338
KOC
Holding
495,811
2,445
TAV
Havalimanlari
Holding (1)
62,388
419
Turk
Hava
Yollari
AO (1)
156,896
1,248
T.
ROWE
PRICE
Emerging
Europe
Fund
Shares
$
Value
(Cost
and
value
in
$000s)
Turkcell
Iletisim
Hizmetleri
639,128
1,580
Total
Türkiye
(Cost
$13,571)
19,751
UNITED
KINGDOM 2.0%
Common
Stocks 2.0%
Central
Asia
Metals
103,390
233
Georgia
Capital (1)
57,189
748
Total
United
Kingdom
(Cost
$621)
981
SHORT-TERM
INVESTMENTS 0.0%
Money
Market
Funds 0.0%
T.
Rowe
Price
Government
Reserve
Fund,
4.86% (5)(6)
17,578
18
Total
Short-Term
Investments
(Cost
$18)
18
SECURITIES
LENDING
COLLATERAL 0.3%
INVESTMENTS
IN
A
POOLED
ACCOUNT
THROUGH
SECURITIES
LENDING
PROGRAM
WITH
JPMORGAN
CHASE
BANK 0.3%
Money
Market
Funds 0.3%
T.
Rowe
Price
Government
Reserve
Fund,
4.86% (5)(6)
140,830
141
Total
Investments
in
a
Pooled
Account
through
Securities
Lending
Program
with
JPMorgan
Chase
Bank
141
Total
Securities
Lending
Collateral
(Cost
$141)
141
Total
Investments
in
Securities
100.7%
of
Net
Assets
(Cost
$106,923)
$
49,533
‡
Country
classifications
are
generally
based
on
MSCI
categories
or
another
unaffiliated
third
party
data
provider;
Shares
are
denominated
in
the
currency
of
the
country
presented
unless
otherwise
noted.
(1)
Non-income
producing
(2)
See
Note
3
.
All
or
a
portion
of
this
security
is
on
loan
at
October
31,
2024.
(3)
See
Note
2.
Level
3
in
fair
value
hierarchy.
(4)
Security
was
purchased
pursuant
to
Rule
144A
under
the
Securities
Act
of
1933
and
may
be
resold
in
transactions
exempt
from
registration
only
to
qualified
institutional
buyers.
Total
value
of
such
securities
at
period-end
amounts
to
$0
and
represents
0.0%
of
net
assets.
(5)
Affiliated
Companies
T.
ROWE
PRICE
Emerging
Europe
Fund
.
.
.
.
.
.
.
.
.
.
(6)
Seven-day
yield
ADR
American
Depositary
Receipts
EUR
Euro
GBP
British
Pound
GDR
Global
Depositary
Receipts
USD
U.S.
Dollar
T.
ROWE
PRICE
Emerging
Europe
Fund
The
accompanying
notes
are
an
integral
part
of
these
financial
statements.
AFFILIATED
COMPANIES
($000s)
The
fund
may
invest
in
certain
securities
that
are
considered
affiliated
companies.
As
defined
by
the
1940
Act,
an
affiliated
company
is
one
in
which
the
fund
owns
5%
or
more
of
the
outstanding
voting
securities,
or
a
company
that
is
under
common
ownership
or
control.
The
following
securities
were
considered
affiliated
companies
for
all
or
some
portion
of
the
year
ended
October
31,
2024.
Net
realized
gain
(loss),
investment
income,
change
in
net
unrealized
gain/loss,
and
purchase
and
sales
cost
reflect
all
activity
for
the
period
then
ended.
Affiliate
Net
Realized
Gain
(Loss)
Change
in
Net
Unrealized
Gain/Loss
Investment
Income
Kazakhstan
Kagazy,
GDR
$
—
$
—
$
—
T.
Rowe
Price
Government
Reserve
Fund,
4.86%
—
—
33++
Totals
$
—#
$
—
$
33+
Supplementary
Investment
Schedule
Affiliate
Value
10/31/23
Purchase
Cost
Sales
Cost
Value
10/31/24
Kazakhstan
Kagazy,
GDR
$
—
$
—
$
—
$
—
T.
Rowe
Price
Government
Reserve
Fund,
4.86%
41
¤
¤
159
Total
$
159^
#
Capital
gain
distributions
from
underlying
Price
funds
represented
$0
of
the
net
realized
gain
(loss).
++
Excludes
earnings
on
securities
lending
collateral,
which
are
subject
to
rebates
and
fees
as
described
in
Note
3
.
+
Investment
income
comprised
$33
of
dividend
income
and
$0
of
interest
income.
¤
Purchase
and
sale
information
not
shown
for
cash
management
funds.
^
The
cost
basis
of
investments
in
affiliated
companies
was
$16,780.
T.
ROWE
PRICE
Emerging
Europe
Fund
October
31,
2024
Statement
of
Assets
and
Liabilities
($000s,
except
shares
and
per
share
amounts)
The
accompanying
notes
are
an
integral
part
of
these
financial
statements.
Assets
Investments
in
securities,
at
value
(cost
$106,923)
$
49,533
Foreign
currency
(cost
$19)
19
Due
from
affiliates
9
Other
assets
89
Total
assets
49,650
Liabilities
Payable
for
shares
redeemed
234
Obligation
to
return
securities
lending
collateral
141
Investment
management
fees
payable
43
Other
liabilities
42
Total
liabilities
460
Commitments
and
Contingent
Liabilities
(note
6
)
NET
ASSETS
$
49,190
Net
Assets
Consist
of:
Total
distributable
earnings
(loss)
$
(
95,285
)
Paid-in
capital
applicable
to
9,499,157
shares
of
$0.01
par
value
capital
stock
outstanding;
18,000,000,000
shares
of
the
Corporation
authorized
144,475
NET
ASSETS
$
49,190
NET
ASSET
VALUE
PER
SHARE
Investor
Class
(Net
assets:
$38,737;
Shares
outstanding:
7,472,037)
$
5.18
I
Class
(Net
assets:
$6,367;
Shares
outstanding:
1,235,292)
$
5.15
Z
Class
(Net
assets:
$4,086;
Shares
outstanding:
791,828)
$
5.16
T.
ROWE
PRICE
Emerging
Europe
Fund
Year
Ended
10/31/24
Investment
Income
(Loss)
Income
Dividend
(net
of
foreign
taxes
of
$53)
$
1,821
Securities
lending
4
Total
income
1,825
Expenses
Investment
management
511
Shareholder
servicing
Investor
Class
$
415
I
Class
2
417
Prospectus
and
shareholder
reports
Investor
Class
24
I
Class
1
Z
Class
1
26
Custody
and
accounting
218
Legal
and
audit
82
Registration
43
Miscellaneous
32
Waived
/
paid
by
Price
Associates
(
677
)
Total
expenses
652
Net
investment
income
1,173
T.
ROWE
PRICE
Emerging
Europe
Fund
The
accompanying
notes
are
an
integral
part
of
these
financial
statements.
Year
Ended
10/31/24
Realized
and
Unrealized
Gain
/
Loss
–
Net
realized
gain
(loss)
Securities
832
Foreign
currency
transactions
(
622
)
Net
realized
gain
210
Change
in
net
unrealized
gain
/
loss
Securities
14,358
Other
assets
and
liabilities
denominated
in
foreign
currencies
622
Change
in
net
unrealized
gain
/
loss
14,980
Net
realized
and
unrealized
gain
/
loss
15,190
INCREASE
IN
NET
ASSETS
FROM
OPERATIONS
$
16,363
T.
ROWE
PRICE
Emerging
Europe
Fund
Statement
of
Changes
in
Net
Assets
Year
.
.
.
.
.
.
.
.
.
.
.
.
.
.
Ended
.
.
.
.
.
.
.
.
.
.
.
.
.
.
10/31/24
10/31/23
Increase
(Decrease)
in
Net
Assets
Operations
Net
investment
income
$
1,173
$
727
Net
realized
gain
(loss)
210
(
18,564
)
Change
in
net
unrealized
gain
/
loss
14,980
35,257
Increase
in
net
assets
from
operations
16,363
17,420
Distributions
to
shareholders
Net
earnings
Investor
Class
(
361
)
(
651
)
I
Class
(
68
)
(
138
)
Z
Class
(
70
)
(
111
)
Decrease
in
net
assets
from
distributions
(
499
)
(
900
)
Capital
share
transactions
*
Shares
sold
Investor
Class
59
4,499
I
Class
369
2,083
Distributions
reinvested
Investor
Class
347
629
I
Class
65
132
Z
Class
70
111
Shares
redeemed
Investor
Class
(
7,272
)
(
9,474
)
I
Class
(
875
)
(
2,492
)
Z
Class
–
(
7
)
Decrease
in
net
assets
from
capital
share
transactions
(
7,237
)
(
4,519
)
T.
ROWE
PRICE
Emerging
Europe
Fund
Statement
of
Changes
in
Net
Assets
The
accompanying
notes
are
an
integral
part
of
these
financial
statements.
Year
.
.
.
.
.
.
.
.
.
.
.
.
.
.
Ended
.
.
.
.
.
.
.
.
.
.
.
.
.
.
10/31/24
10/31/23
Net
Assets
Increase
during
period
8,627
12,001
Beginning
of
period
40,563
28,562
End
of
period
$
49,190
$
40,563
*Share
information
(000s)
Shares
sold
Investor
Class
13
1,607
I
Class
73
748
Distributions
reinvested
Investor
Class
82
238
I
Class
15
50
Z
Class
17
43
Shares
redeemed
Investor
Class
(
1,568
)
(
3,033
)
I
Class
(
173
)
(
816
)
Z
Class
–
(
2
)
Decrease
in
shares
outstanding
(
1,541
)
(
1,165
)
T.
ROWE
PRICE
Emerging
Europe
Fund
NOTES
TO
FINANCIAL
STATEMENTS
T.
Rowe
Price
International
Funds,
Inc. (the
corporation) is
registered
under
the
Investment
Company
Act
of
1940
(the
1940
Act).
The
Emerging
Europe
Fund
(the
fund)
is a
nondiversified, open-end
management
investment
company
established
by
the
corporation. The
fund
seeks long-term
growth
of
capital
through
investments
primarily
in
the
common
stocks
of
companies
located
(or
with
primary
operations)
in
the
emerging
market
countries
of
Europe.
The
fund
has three classes
of
shares:
the
Emerging
Europe
Fund
(Investor
Class),
the
Emerging
Europe
Fund–I
Class
(I
Class)
and
the
Emerging
Europe
Fund–Z
Class
(Z
Class).
I
Class
shares
require
a
$500,000
initial
investment
minimum,
although
the
minimum
generally
is
waived
or
reduced
for
financial
intermediaries,
eligible
retirement
plans,
and
certain
other
accounts.
The
Z
Class
is
only
available
to
funds
advised
by
T.
Rowe
Price
Associates,
Inc.
and
its
affiliates
and
other
clients
that
are
subject
to
a
contractual
fee
for
investment
management
services. Each
class
has
exclusive
voting
rights
on
matters
related
solely
to
that
class;
separate
voting
rights
on
matters
that
relate
to
all
classes;
and,
in
all
other
respects,
the
same
rights
and
obligations
as
the
other
classes.
Effective
February
17,
2023,
the
fund
is
closed
to
all
purchases
from
new
and
existing
shareholders.
The
fund’s
closure
to
additional
purchases
does
not
restrict
existing
shareholders
from
redeeming
shares
of
the
fund.
NOTE
1
-
SIGNIFICANT
ACCOUNTING
POLICIES
Basis
of
Preparation
The fund
is
an
investment
company
and
follows
accounting
and
reporting
guidance
in
the
Financial
Accounting
Standards
Board
(FASB)
Accounting
Standards
Codification
Topic
946
(ASC
946).
The
accompanying
financial
statements
were
prepared
in
accordance
with
accounting
principles
generally
accepted
in
the
United
States
of
America
(GAAP),
including,
but
not
limited
to,
ASC
946.
GAAP
requires
the
use
of
estimates
made
by
management.
Management
believes
that
estimates
and
valuations
are
appropriate;
however,
actual
results
may
differ
from
those
estimates,
and
the
valuations
reflected
in
the
accompanying
financial
statements
may
differ
from
the
value
ultimately
realized
upon
sale
or
maturity.
Investment
Transactions,
Investment
Income,
and
Distributions
Investment
transactions
are
accounted
for
on
the
trade
date
basis.
Income
and
expenses
are
recorded
on
the
accrual
basis.
Realized
gains
and
losses
are
reported
on
the
identified
cost
basis. Income
tax-related
interest
and
penalties,
if
incurred,
are
recorded
as
income
tax
expense. Dividends
received
from other
investment
T.
ROWE
PRICE
Emerging
Europe
Fund
companies are
reflected
as
dividend income;
capital
gain
distributions
are
reflected
as
realized
gain/loss. Dividend
income and
capital
gain
distributions
are
recorded
on
the
ex-dividend
date. Non-cash
dividends,
if
any,
are
recorded
at
the
fair
market
value
of
the
asset
received. Proceeds
from
litigation
payments,
if
any,
are
included
in
either
net
realized
gain
(loss)
or
change
in
net
unrealized
gain/loss
from
securities. Distributions
to
shareholders
are
recorded
on
the
ex-dividend
date. Income
distributions,
if
any,
are
declared
and
paid
by
each
class annually. A
capital
gain
distribution,
if
any, may
also
be
declared
and
paid
by
the
fund
annually.
Currency
Translation
Assets,
including
investments,
and
liabilities
denominated
in
foreign
currencies
are
translated
into
U.S.
dollar
values
each
day
at
the
prevailing
exchange
rate,
using
the
mean
of
the
bid
and
asked
prices
of
such
currencies
against
U.S.
dollars
as
provided
by
an
outside
pricing
service.
Purchases
and
sales
of
securities,
income,
and
expenses
are
translated
into
U.S.
dollars
at
the
prevailing
exchange
rate
on
the
respective
date
of
such
transaction.
The
effect
of
changes
in
foreign
currency
exchange
rates
on
realized
and
unrealized
security
gains
and
losses
is
not
bifurcated
from
the
portion
attributable
to
changes
in
market
prices.
Class
Accounting
Shareholder
servicing,
prospectus,
and
shareholder
report
expenses
incurred
by
each
class
are
charged
directly
to
the
class
to
which
they
relate.
Expenses
common
to
all
classes,
investment
income,
and
realized
and
unrealized
gains
and
losses
are
allocated
to
the
classes
based
upon
the
relative
daily
net
assets
of
each
class.
Capital
Transactions
Each
investor’s
interest
in
the
net
assets
of the
fund
is
represented
by
fund
shares. The
fund’s
net
asset
value
(NAV)
per
share
is
computed
at
the
close
of
the
New
York
Stock
Exchange
(NYSE),
normally
4
p.m.
Eastern
time,
each
day
the
NYSE
is
open
for
business.
However,
the
NAV
per
share
may
be
calculated
at
a
time
other
than
the
normal
close
of
the
NYSE
if
trading
on
the
NYSE
is
restricted,
if
the
NYSE
closes
earlier,
or
as
may
be
permitted
by
the
SEC.
Purchases
and
redemptions
of
fund
shares
are
transacted
at
the
next-computed
NAV
per
share,
after
receipt
of
the
transaction
order
by
T.
Rowe
Price
Associates,
Inc.,
or
its
agents.
New
Accounting
Guidance
In
November
2023,
the
FASB
issued
Accounting
Standards
Update
(ASU),
ASU
2023-07,
Segment
Reporting
(Topic
280)
–
Improvements
to
Reportable
Segment
Disclosures,
which
improves
reportable
segment
disclosure
requirements,
primarily
through
enhanced
disclosures
about
segment
expenses.
In
addition,
the
ASU
clarifies
that
a
public
entity
with
a
single
reportable
segment
provide
all
disclosures
required
by
the
ASU
and
all
T.
ROWE
PRICE
Emerging
Europe
Fund
existing
segment
disclosures
in
Topic
280.
The
amendments
under
this
ASU
are
effective
for
fiscal
years
beginning
after
December
15,
2023.
Management
expects
that
adoption
of
the
guidance
will
not
have
a
material
impact
on
the
fund’s
financial
statements.
Indemnification
In
the
normal
course
of
business, the
fund
may
provide
indemnification
in
connection
with
its
officers
and
directors,
service
providers,
and/or
private
company
investments. The
fund’s
maximum
exposure
under
these
arrangements
is
unknown;
however,
the
risk
of
material
loss
is
currently
considered
to
be
remote.
NOTE
2
-
VALUATION
Fair
Value
The
fund’s
financial
instruments
are
valued
at
the
close
of
the
NYSE
and
are
reported
at
fair
value,
which
GAAP
defines
as
the
price
that
would
be
received
to
sell
an
asset
or
paid
to
transfer
a
liability
in
an
orderly
transaction
between
market
participants
at
the
measurement
date. The fund’s
Board
of
Directors
(the
Board)
has
designated
T.
Rowe
Price
Associates,
Inc.
as
the
fund’s
valuation
designee
(Valuation
Designee).
Subject
to
oversight
by
the
Board,
the
Valuation
Designee
performs
the
following
functions
in
performing
fair
value
determinations:
assesses
and
manages
valuation
risks;
establishes
and
applies
fair
value
methodologies;
tests
fair
value
methodologies;
and
evaluates
pricing
vendors
and
pricing
agents.
The
duties
and
responsibilities
of
the
Valuation
Designee
are
performed
by
its
Valuation
Committee. The
Valuation
Designee provides
periodic
reporting
to
the
Board
on
valuation
matters.
Various
valuation
techniques
and
inputs
are
used
to
determine
the
fair
value
of
financial
instruments.
GAAP
establishes
the
following
fair
value
hierarchy
that
categorizes
the
inputs
used
to
measure
fair
value:
Level
1
–
quoted
prices
(unadjusted)
in
active
markets
for
identical
financial
instruments
that
the
fund
can
access
at
the
reporting
date
Level
2
–
inputs
other
than
Level
1
quoted
prices
that
are
observable,
either
directly
or
indirectly
(including,
but
not
limited
to,
quoted
prices
for
similar
financial
instruments
in
active
markets,
quoted
prices
for
identical
or
similar
financial
instruments
in
inactive
markets,
interest
rates
and
yield
curves,
implied
volatilities,
and
credit
spreads)
Level
3
–
unobservable
inputs
(including
the Valuation
Designee’s assumptions
in
determining
fair
value)
T.
ROWE
PRICE
Emerging
Europe
Fund
Observable
inputs
are
developed
using
market
data,
such
as
publicly
available
information
about
actual
events
or
transactions,
and
reflect
the
assumptions
that
market
participants
would
use
to
price
the
financial
instrument.
Unobservable
inputs
are
those
for
which
market
data
are
not
available
and
are
developed
using
the
best
information
available
about
the
assumptions
that
market
participants
would
use
to
price
the
financial
instrument.
GAAP
requires
valuation
techniques
to
maximize
the
use
of
relevant
observable
inputs
and
minimize
the
use
of
unobservable
inputs.
When
multiple
inputs
are
used
to
derive
fair
value,
the
financial
instrument
is
assigned
to
the
level
within
the
fair
value
hierarchy
based
on
the
lowest-level
input
that
is
significant
to
the
fair
value
of
the
financial
instrument.
Input
levels
are
not
necessarily
an
indication
of
the
risk
or
liquidity
associated
with
financial
instruments
at
that
level
but
rather
the
degree
of
judgment
used
in
determining
those
values.
Valuation
Techniques
Equity
securities,
including
exchange-traded
funds, listed
or
regularly
traded
on
a
securities
exchange
or
in
the
over-the-
counter
(OTC)
market
are
valued
at
the
last
quoted
sale
price
or,
for
certain
markets,
the
official
closing
price
at
the
time
the
valuations
are
made.
OTC
Bulletin
Board
securities
are
valued
at
the
mean
of
the
closing
bid
and
asked
prices.
A
security
that
is
listed
or
traded
on
more
than
one
exchange
is
valued
at
the
quotation
on
the
exchange
determined
to
be
the
primary
market
for
such
security.
Listed
securities
not
traded
on
a
particular
day
are
valued
at
the
mean
of
the
closing
bid
and
asked
prices
for
domestic
securities
and
the
last
quoted
sale
or
closing
price
for
international
securities.
The
last
quoted
prices
of
non-U.S.
equity
securities
may
be
adjusted
to
reflect
the
fair
value
of
such
securities
at
the
close
of
the
NYSE,
if
the Valuation
Designee
determines
that
developments
between
the
close
of
a
foreign
market
and
the
close
of
the
NYSE
will
affect
the
value
of
some
or
all
of
the
fund’s portfolio
securities.
Each
business
day,
the
Valuation
Designee uses
information
from
outside
pricing
services
to
evaluate
the
quoted
prices
of
portfolio
securities
and,
if
appropriate,
decide whether
it
is
necessary
to
adjust
quoted
prices
to
reflect
fair
value
by
reviewing
a
variety
of
factors,
including
developments
in
foreign
markets,
the
performance
of
U.S.
securities
markets,
and
the
performance
of
instruments
trading
in
U.S.
markets
that
represent
foreign
securities
and
baskets
of
foreign
securities. The Valuation
Designee
uses
outside
pricing
services
to
provide
it
with
quoted
prices
and
information
to
evaluate
or
adjust
those
prices.
The Valuation
Designee
cannot
predict
how
often
it
will
use
quoted
prices
and
how
often
it
will
determine
it
necessary
to
adjust
those
prices
to
reflect
fair
value.
T.
ROWE
PRICE
Emerging
Europe
Fund
Investments
in
mutual
funds
are
valued
at
the
mutual
fund’s
closing
NAV
per
share
on
the
day
of
valuation.
Assets
and
liabilities
other
than
financial
instruments,
including
short-term
receivables
and
payables,
are
carried
at
cost,
or
estimated
realizable
value,
if
less,
which
approximates
fair
value.
Investments
for
which
market
quotations are
not
readily
available
or
deemed
unreliable
are
valued
at
fair
value
as
determined
in
good
faith
by
the
Valuation
Designee.
The
Valuation
Designee
has
adopted
methodologies
for
determining
the
fair
value
of
investments
for
which
market
quotations
are
not
readily
available
or
deemed
unreliable,
including
the
use
of
other
pricing
sources.
Factors
used
in
determining
fair
value
vary
by
type
of
investment
and
may
include
market
or
investment
specific
considerations.
The
Valuation
Designee typically
will
afford
greatest
weight
to
actual
prices
in
arm’s
length
transactions,
to
the
extent
they
represent
orderly
transactions
between
market
participants,
transaction
information
can
be
reliably
obtained,
and
prices
are
deemed
representative
of
fair
value.
However,
the
Valuation
Designee may
also
consider
other
valuation
methods
such
as
market-based
valuation
multiples;
a
discount
or
premium
from
market
value
of
a
similar,
freely
traded
security
of
the
same
issuer;
discounted
cash
flows;
yield
to
maturity;
or
some
combination.
Fair
value
determinations
are
reviewed
on
a
regular
basis.
Because
any
fair
value
determination
involves
a
significant
amount
of
judgment,
there
is
a
degree
of
subjectivity
inherent
in
such
pricing
decisions. Fair
value
prices
determined
by
the
Valuation
Designee could
differ
from
those
of
other
market
participants,
and
it
is
possible
that
the
fair
value
determined
for
a
security
may
be
materially
different
from
the
value
that
could
be
realized
upon
the
sale
of
that
security.
Valuation
Inputs
The
following
table
summarizes
the
fund’s
financial
instruments,
based
on
the
inputs
used
to
determine
their
fair
values
on
October
31,
2024
(for
further
detail
by
category,
please
refer
to
the
accompanying
Portfolio
of
Investments):
($000s)
Level
1
Level
2
Level
3
Total
Value
Assets
Common
Stocks
$
9,326
$
40,048
$
—
$
49,374
Short-Term
Investments
18
—
—
18
Securities
Lending
Collateral
141
—
—
141
Total
$
9,485
$
40,048
$
—
$
49,533
T.
ROWE
PRICE
Emerging
Europe
Fund
NOTE
3
-
OTHER
INVESTMENT
TRANSACTIONS
Consistent
with
its
investment
objective, the
fund
engages
in
the
following
practices
to
manage
exposure
to
certain
risks
and/or
to
enhance
performance.
The
investment
objective,
policies,
program,
and
risk
factors
of the
fund
are
described
more
fully
in the
fund’s prospectus
and
Statement
of
Additional
Information.
Emerging
and
Frontier
Markets
The fund
invests,
either
directly
or
through
investments
in
other
T.
Rowe
Price
funds,
in
securities
of
companies
located
in,
issued
by
governments
of,
or
denominated
in
or
linked
to
the
currencies
of
emerging
and
frontier
market
countries.
Emerging
markets,
and
to
a
greater
extent
frontier
markets, tend
to
have
economic
structures
that
are
less
diverse
and
mature,
less
developed
legal
and
regulatory
regimes,
and
political
systems
that
are
less
stable,
than
those
of
developed
countries.
These
markets
may
be
subject
to
greater
political,
economic,
and
social
uncertainty
and
differing
accounting
standards
and
regulatory
environments
that
may
potentially
impact
the
fund’s
ability
to
buy
or
sell
certain
securities
or
repatriate
proceeds
to
U.S.
dollars.
Emerging
markets
securities
exchanges
are
more
likely
to
experience
delays
with
the
clearing
and
settling
of
trades,
as
well
as
the
custody
of
holdings
by
local
banks,
agents,
and
depositories.
Such
securities
are
often
subject
to
greater
price
volatility,
less
liquidity,
and
higher
rates
of
inflation
than
U.S.
securities.
Investing
in
frontier
markets
is
typically
significantly
riskier
than
investing
in
other
countries,
including
emerging
markets.
In
February
2022,
Russia
launched
a
large-scale
military
invasion
of Ukraine,
leading
to
economic
sanctions
imposed
on
Russia
that
target certain
of
its
citizens, issuers
and
sectors
of
the
Russian
economy,
including
the
exclusion
of
Russia
from
the
SWIFT
global
payments
network.
As
a
result,
the
Russian
central
bank suspended
the
sales
of
Russian
securities
by
most
non-residents
of
Russia
on
its
local
stock
exchange.
In
addition,
U.S.
and
non-U.S.
exchanges
have
halted
trading
in
certain
ADRs
and
GDRs
of
Russian
companies.
Consequently,
the
Russian
equity
market
has
become
largely
uninvestable
for
foreign
investors,
such
as
the
fund,
and
it
is
uncertain
when
these
restrictions
on
trading
or
transferring
Russian
securities
will
be
reduced
or
eliminated. Prior
to
the
market
events
described
above,
the fund
had a
significant
amount
of
its
assets
invested
in Russian
securities.
As
a
result
of
the
market
events
described
above,
the
Russian
securities
that
continue
to
be
held
in
the
fund’s
portfolio
that
cannot
be
sold have
been
valued
effectively
at
zero,
and the
fund
may
not
be
able
to
receive
any
related
dividends to
which
it
would
otherwise
be
entitled. In
addition,
the
fund
holds
an
investment,
Sberbank
of
Russia,
that
T.
ROWE
PRICE
Emerging
Europe
Fund
is
included
on
the
U.S.
Specially
Designated
Nationals
and
Blocked
Persons
(SDN)
list.
T.
Rowe
Price,
as
a
U.S.
company,
is
required
to
report
investments
in
any
company
on
the
SDN
list
to
the
U.S.
Department
of
Treasury’s
Office
of
Foreign
Assets
Control.
As
this
conflict
and
market
events
continue
to
evolve,
there
may
be
additional
impacts
to
the
Russian investments
in
the
fund.
Management
is
actively
monitoring
the
risks
and
financial
impacts
arising
from
these
events.
Restricted
Securities
The
fund
invests
in
securities
that
are
subject
to
legal
or
contractual
restrictions
on
resale.
Prompt
sale
of
such
securities
at
an
acceptable
price
may
be
difficult
and
may
involve
substantial
delays
and
additional
costs.
Securities
Lending
The fund
may
lend
its
securities
to
approved
borrowers
to
earn
additional
income.
Its
securities
lending
activities
are
administered
by
a
lending
agent
in
accordance
with
a
securities
lending
agreement.
Security
loans
generally
do
not
have
stated
maturity
dates,
and
the
fund
may
recall
a
security
at
any
time.
The
fund
receives
collateral
in
the
form
of
cash
or
U.S.
government
securities.
Collateral
is
maintained
over
the
life
of
the
loan
in
an
amount
not
less
than
the
value
of
loaned
securities;
any
additional
collateral
required
due
to
changes
in
security
values
is
delivered
to
the
fund
the
next
business
day.
Cash
collateral
is
invested
in
accordance
with
investment
guidelines
approved
by
fund
management.
Additionally,
the
lending
agent
indemnifies
the
fund
against
losses
resulting
from
borrower
default.
Although
risk
is
mitigated
by
the
collateral
and
indemnification,
the
fund
could
experience
a
delay
in
recovering
its
securities
and
a
possible
loss
of
income
or
value
if
the
borrower
fails
to
return
the
securities,
collateral
investments
decline
in
value,
and
the
lending
agent
fails
to
perform.
Securities
lending
revenue
consists
of
earnings
on
invested
collateral
and
borrowing
fees,
net
of
any
rebates
to
the
borrower,
compensation
to
the
lending
agent,
and
other
administrative
costs.
In
accordance
with
GAAP,
investments
made
with
cash
collateral
are
reflected
in
the
accompanying
financial
statements,
but
collateral
received
in
the
form
of
securities
is
not.
At
October
31,
2024,
the
value
of
loaned
securities
was
$134,000;
the
value
of
cash
collateral
and
related
investments
was
$141,000.
Other
Purchases
and
sales
of
portfolio
securities
other
than
in-kind
transactions,
if
any,
and short-term securities
aggregated $7,415,000 and
$13,611,000,
respectively,
for
the
year ended
October
31,
2024.
T.
ROWE
PRICE
Emerging
Europe
Fund
NOTE
4
-
FEDERAL
INCOME
TAXES
Generally,
no
provision
for
federal
income
taxes
is
required
since
the
fund
intends
to continue
to
qualify
as
a
regulated
investment
company
under
Subchapter
M
of
the
Internal
Revenue
Code
and
distribute
to
shareholders
all
of
its taxable
income
and
gains.
Distributions
determined
in
accordance
with
federal
income
tax
regulations
may
differ
in
amount
or
character
from
net
investment
income
and
realized
gains
for
financial
reporting
purposes.
The
fund
files
U.S.
federal,
state,
and
local
tax
returns
as
required.
The
fund’s
tax
returns
are
subject
to
examination
by
the
relevant
tax
authorities
until
expiration
of
the
applicable
statute
of
limitations,
which
is
generally
three
years
after
the
filing
of
the
tax
return
but
which
can
be
extended
to
six
years
in
certain
circumstances.
Tax
returns
for
open
years
have
incorporated
no
uncertain
tax
positions
that
require
a
provision
for
income
taxes.
Capital
accounts
within
the
financial
reporting
records
are
adjusted
for
permanent
book/tax
differences
to
reflect
tax
character
but
are
not
adjusted
for
temporary
differences.
The
permanent
book/tax
adjustments,
if
any,
have
no
impact
on
results
of
operations
or
net
assets.
The
permanent
book/tax
adjustments
relate
primarily
to
the
character
of
net
currency
gains
or
losses.
The
tax
character
of
distributions
paid
for
the
periods
presented
was
as
follows:
At
October
31,
2024,
the
tax-basis
cost
of
investments
(including
derivatives,
if
any)
and
gross
unrealized
appreciation
and
depreciation
were as
follows:
($000s)
October
31,
2024
October
31,
2023
Ordinary
income
(including
short-term
capital
gains,
if
any)
$
499
$
900
($000s)
Cost
of
investments
$
109,295
Unrealized
appreciation
$
23,710
Unrealized
depreciation
(82,536)
Net
unrealized
appreciation
(depreciation)
$
(58,826)
T.
ROWE
PRICE
Emerging
Europe
Fund
At
October
31,
2024,
the
tax-basis
components
of
accumulated
net
earnings
(loss)
were
as
follows:
Temporary
differences
between
book-basis
and
tax-basis
components
of
total
distributable
earnings
(loss)
arise
when
certain
items
of
income,
gain,
or
loss
are
recognized
in
different
periods
for
financial
statement
purposes
versus
for
tax
purposes;
these
differences
will
reverse
in
a
subsequent
reporting
period.
The
temporary
differences
relate
primarily
to
the
deferral
of
losses
from
wash
sales.
The
loss
carryforwards
and
deferrals
primarily
relate
to
capital
loss
carryforwards.
Capital
loss
carryforwards
are
available
indefinitely
to
offset
future
realized
capital
gains.
During
the
year
ended
October
31,
2024,
the
fund
utilized
$758,000
of
capital
loss
carryforwards.
NOTE
5
-
FOREIGN TAXES
The
fund
is
subject
to
foreign
income
taxes
imposed
by
certain
countries
in
which
it
invests.
Additionally,
capital
gains
realized
upon
disposition
of
securities
issued
in
or
by
certain
foreign
countries
are
subject
to
capital
gains
tax
imposed
by
those
countries.
All
taxes
are
computed
in
accordance
with
the
applicable
foreign
tax
law,
and,
to
the
extent
permitted,
capital
losses
are
used
to
offset
capital
gains.
Taxes
attributable
to
income
are
accrued
by
the
fund
as
a
reduction
of
income.
Current
and
deferred
tax
expense
attributable
to
capital
gains
is
reflected
as
a
component
of
realized
or
change
in
unrealized
gain/
loss
on
securities
in
the
accompanying
financial
statements.
To
the
extent
that
the
fund
has
country
specific
capital
loss
carryforwards,
such
carryforwards
are
applied
against
net
unrealized
gains
when
determining
the
deferred
tax
liability.
Any
deferred
tax
liability
incurred
by
the
fund
is
included
in
either
Other
liabilities
or
Deferred
tax
liability
on
the
accompanying
Statement
of
Assets
and
Liabilities.
($000s)
Undistributed
ordinary
income
$
431
Net
unrealized
appreciation
(depreciation)
(58,826)
Loss
carryforwards
and
deferrals
(36,890)
Total
distributable
earnings
(loss)
$
(95,285)
T.
ROWE
PRICE
Emerging
Europe
Fund
NOTE
6
-
RELATED
PARTY
TRANSACTIONS
The
fund
is
managed
by
T.
Rowe
Price
Associates,
Inc.
(Price
Associates),
a
wholly
owned
subsidiary
of
T.
Rowe
Price
Group,
Inc.
(Price
Group). Price
Associates
has
entered
into
a
sub-advisory
agreement(s)
with
one
or
more
of
its
wholly
owned
subsidiaries,
to
provide
investment
advisory
services
to
the
fund.
The
investment
management
agreement
between
the
fund
and
Price
Associates
provides
for
an
annual
investment
management
fee,
which
is
computed
daily
and
paid
monthly. The
fee
consists
of
an
individual
fund
fee,
equal
to
0.75%
of
the
fund’s
average
daily
net
assets,
and
a
group
fee.
The
group
fee
rate
is
calculated
based
on
the
combined
net
assets
of
certain
mutual
funds
sponsored
by
Price
Associates
(the
group)
applied
to
a
graduated
fee
schedule,
with
rates
ranging
from
0.48%
for
the
first
$1
billion
of
assets
to
0.260%
for
assets
in
excess
of
$845
billion.
The
fund’s
group
fee
is
determined
by
applying
the
group
fee
rate
to
the
fund’s
average
daily
net
assets. At
October
31,
2024,
the
effective
annual
group
fee
rate
was
0.28%.
The Investor
Class is
subject
to
a
contractual
expense
limitation
through
the
expense
limitation
date
indicated
in
the
table
below.
This
agreement
will
continue
through
the
expense
limitation
date
indicated
in
the
table
below,
and
may
be
renewed,
revised,
or
revoked
only
with
approval
of
the
fund’s
Board.
During
the
limitation
period,
Price
Associates
is required
to
waive
or
pay
any
expenses
(excluding
interest;
expenses
related
to
borrowings,
taxes,
and
brokerage;
non-recurring,
extraordinary
expenses;
and
acquired
fund
fees
and
expenses)
that
would
otherwise
cause
the class’s ratio
of
annualized
total
expenses
to
average
net
assets
(net
expense
ratio)
to
exceed
its
expense
limitation.
The
class
is
required
to
repay
Price
Associates
for
expenses
previously
waived/paid
to
the
extent
the
class’s net
assets
grow
or
expenses
decline
sufficiently
to
allow
repayment
without
causing
the class’s net
expense
ratio
(after
the
repayment
is
taken
into
account)
to
exceed
the
lesser
of:
(1)
the
expense
limitation
in
place
at
the
time
such
amounts
were
waived;
or
(2)
the class’s
current
expense
limitation.
However,
no
repayment
will
be
made
more
than
three
years
after
the
date
of
a
payment
or
waiver.
The
I
Class
is
also
subject
to
an
operating
expense
limitation
(I
Class
Limit)
pursuant
to
which
Price
Associates
is
contractually
required
to
pay
all
operating
expenses
of
the
I
Class,
excluding
management
fees;
interest;
expenses
related
to
borrowings,
taxes,
and
brokerage; non-recurring,
extraordinary expenses; and
acquired
fund
fees
and
expenses, to
the
extent
such
operating
expenses,
on
an
annualized
basis,
exceed
the
I
Class
Limit. This
agreement
will
continue
through
the
expense
limitation
date
indicated
in
the
table
below,
and
may
T.
ROWE
PRICE
Emerging
Europe
Fund
be
renewed,
revised,
or
revoked
only
with
approval
of
the
fund’s
Board.
The
I
Class
is
required
to
repay
Price
Associates
for
expenses
previously
paid
to
the
extent
the
class’s
net
assets
grow
or
expenses
decline
sufficiently
to
allow
repayment
without
causing
the
class’s
operating
expenses
(after
the
repayment
is
taken
into
account)
to
exceed
the
lesser
of:
(1)
the
I
Class
Limit
in
place
at
the
time
such
amounts
were
paid;
or
(2)
the
current
I
Class
Limit.
However,
no
repayment
will
be
made
more
than
three
years
after
the
date
of
a
payment
or
waiver.
The
Z
Class
is
also
subject
to
a
contractual
expense
limitation
agreement
whereby
Price
Associates
has
agreed
to
waive
and/or
bear
all
of
the
Z
Class’
expenses
(excluding
interest;
expenses
related
to
borrowings,
taxes,
and
brokerage;
non-recurring,
extraordinary
expenses;
and
acquired
fund
fees
and
expenses)
in
their
entirety.
This
fee
waiver
and/or
expense
reimbursement
arrangement
is
expected
to
remain
in
place
indefinitely,
and
the
agreement
may
only
be
amended
or
terminated
with
approval
by
the
fund’s
Board.
Expenses
of
the
fund
waived/paid
by
the
manager
are
not
subject
to
later
repayment
by
the
fund.
Pursuant
to
these
agreements,
expenses
were waived/paid
by
and/or
repaid
to
Price
Associates
during
the year
ended October
31,
2024 as
indicated
in
the
table
below.
Including
these
amounts,
expenses
previously
waived/paid
by
Price
Associates
in
the
amount
of $2,055,000 remain
subject
to
repayment
by
the
fund
at
October
31,
2024. Any
repayment
of
expenses
previously
waived/paid
by
Price
Associates
during
the
period
would
be
included
in
the
net
investment
income
and
expense
ratios
presented
on
the
accompanying
Financial
Highlights.
In
addition,
the
fund
has
entered
into
service
agreements
with
Price
Associates
and
two
wholly
owned
subsidiaries
of
Price
Associates,
each
an
affiliate
of
the
fund
(collectively,
Price).
Price
Associates
provides
certain
accounting
and
administrative
services
to
the
fund.
T.
Rowe
Price
Services,
Inc.
provides
shareholder
and
administrative
services
in
its
capacity
as
the
fund’s
transfer
and
dividend-disbursing
agent.
T.
Rowe
Price
Retirement
Plan
Services,
Inc.
provides
subaccounting
and
recordkeeping
services
for
certain
retirement
Investor
Class
I
Class
Z
Class
Expense
limitation/I
Class
Limit
1.41%
0.05%
0.00%
Expense
limitation
date
02/28/26
02/28/26
N/A
(Waived)/repaid
during
the
period
($000s)
$(565)
$(45)
$(67)
T.
ROWE
PRICE
Emerging
Europe
Fund
accounts
invested
in
the
Investor
Class.
For
the
year
ended
October
31,
2024,
expenses
incurred
pursuant
to
these
service
agreements
were
$119,000
for
Price
Associates;
$367,000
for
T.
Rowe
Price
Services,
Inc.;
and
$1,000
for
T.
Rowe
Price
Retirement
Plan
Services,
Inc.
All
amounts
due
to
and
due
from
Price,
exclusive
of
investment
management
fees
payable,
are
presented
net
on
the
accompanying
Statement
of
Assets
and
Liabilities.
T.
Rowe
Price
Investment
Services,
Inc.
(Investment
Services)
serves
as
distributor
to
the
fund.
Pursuant
to
an
underwriting
agreement,
no
compensation
for
any
distribution
services
provided
is
paid
to
Investment
Services
by
the
fund
(except
for
12b-1
fees
under
a
Board-approved
Rule
12b-1
plan).
Mutual
funds,
trusts,
and
other
accounts
managed
by
Price
Associates
or
its
affiliates
(collectively,
Price
Funds
and
accounts)
may
invest
in
the
fund.
No
Price
fund
or
account
may
invest
for
the
purpose
of
exercising
management
or
control
over
the
fund.
At
October
31,
2024, 100%
of
the
Z
Class's
outstanding
shares
were
held
by
Price
Funds
and
accounts.
The fund
may
invest
its
cash
reserves
in
certain
open-end
management
investment
companies
managed
by
Price
Associates
and
considered
affiliates
of
the
fund:
the
T.
Rowe
Price
Government
Reserve
Fund
or
the
T.
Rowe
Price
Treasury
Reserve
Fund,
organized
as
money
market
funds
(together,
the
Price
Reserve
Funds).
The
Price
Reserve
Funds
are
offered
as
short-term
investment
options
to
mutual
funds,
trusts,
and
other
accounts
managed
by
Price
Associates
or
its
affiliates
and
are
not
available
for
direct
purchase
by
members
of
the
public.
Cash
collateral
from
securities
lending,
if
any,
is
invested
in
the
T.
Rowe
Price
Government
Reserve Fund. The
Price
Reserve
Funds
pay
no
investment
management
fees.
The fund may
participate
in
securities
purchase
and
sale
transactions
with
other
funds
or
accounts
advised
by
Price
Associates
(cross
trades),
in
accordance
with
procedures
adopted
by the
fund’s
Board
and
Securities
and
Exchange
Commission
rules,
which
require,
among
other
things,
that
such
purchase
and
sale
cross
trades
be
effected
at
the
independent
current
market
price
of
the
security.
During
the
year
ended
October
31,
2024,
the
fund
had
no
purchases
or
sales
cross
trades
with
other
funds
or
accounts
advised
by
Price
Associates.
T.
ROWE
PRICE
Emerging
Europe
Fund
NOTE
7
-
OTHER
MATTERS
Unpredictable environmental,
political,
social
and
economic
events,
including
but
not
limited
to,
environmental
or
natural
disasters,
war
and
conflict
(including
Russia’s
military
invasion
of
Ukraine
and
the
conflict
in
Israel,
Gaza
and
surrounding
areas),
terrorism,
geopolitical
developments
(including
trading
and
tariff
arrangements,
sanctions
and
cybersecurity
attacks),
and
public
health
epidemics
(including
the
global
outbreak
of
COVID-19)
and
similar
public
health
threats,
may
significantly
affect
the
economy
and
the
markets
and
issuers
in
which
a
fund
invests.
The
extent
and
duration
of
such
events
and
resulting
market
disruptions
cannot
be
predicted.
These
and
other
similar
events
may
cause
instability
across
global
markets,
including
reduced
liquidity
and
disruptions
in
trading
markets,
while
some
events
may
affect
certain
geographic
regions,
countries,
sectors,
and
industries
more
significantly
than
others,
and
exacerbate
other
pre-existing
political,
social,
and
economic
risks.
The
fund’s
performance
could
be
negatively
impacted
if
the
value
of
a
portfolio
holding
were
harmed
by
these
or
such
events.
Management
actively
monitors
the
risks
and
financial
impacts
arising
from
such
events.
T.
ROWE
PRICE
Emerging
Europe
Fund
REPORT
OF
INDEPENDENT
REGISTERED
PUBLIC
ACCOUNTING
FIRM
To
the
Board
of
Directors
of
T.
Rowe
Price
International
Funds,
Inc.
and
Shareholders
of
T.
Rowe
Price
Emerging
Europe
Fund
Opinion
on
the
Financial
Statements
We
have
audited
the
accompanying
statement
of
assets
and
liabilities,
including
the
portfolio
of
investments,
of
T.
Rowe
Price
Emerging
Europe
Fund
(one
of
the
funds
constituting
T.
Rowe
Price
International
Funds,
Inc.,
referred
to
hereafter
as
the
"Fund")
as
of
October
31,
2024,
the
related
statement
of
operations
for
the
year
ended
October
31,
2024,
the
statement
of
changes
in
net
assets
for
each
of
the
two
years
in
the
period
ended
October
31,
2024,
including
the
related
notes,
and
the
financial
highlights
for
each
of
the
periods
indicated
therein
(collectively
referred
to
as
the
“financial
statements”).
In
our
opinion,
the
financial
statements
present
fairly,
in
all
material
respects,
the
financial
position
of
the
Fund
as
of
October
31,
2024,
the
results
of
its
operations
for
the
year
then
ended,
the
changes
in
its
net
assets
for
each
of
the
two
years
in
the
period
ended
October
31,
2024
and
the
financial
highlights
for
each
of
the
periods
indicated
therein,
in
conformity
with
accounting
principles
generally
accepted
in
the
United
States
of
America.
Basis
for
Opinion
These
financial
statements
are
the
responsibility
of
the
Fund’s
management.
Our
responsibility
is
to
express
an
opinion
on
the
Fund’s
financial
statements
based
on
our
audits.
We
are
a
public
accounting
firm
registered
with
the
Public
Company
Accounting
Oversight
Board
(United
States)
(PCAOB)
and
are
required
to
be
independent
with
respect
to
the
Fund
in
accordance
with
the
U.S.
federal
securities
laws
and
the
applicable
rules
and
regulations
of
the
Securities
and
Exchange
Commission
and
the
PCAOB.
We
conducted
our
audits
of
these
financial
statements
in
accordance
with
the
standards
of
the
PCAOB.
Those
standards
require
that
we
plan
and
perform
the
audit
to
obtain
reasonable
assurance
about
whether
the
financial
statements
are
free
of
material
misstatement,
whether
due
to
error
or
fraud.
T.
ROWE
PRICE
Emerging
Europe
Fund
Our
audits
included
performing
procedures
to
assess
the
risks
of
material
misstatement
of
the
financial
statements,
whether
due
to
error
or
fraud,
and
performing
procedures
that
respond
to
those
risks.
Such
procedures
included
examining,
on
a
test
basis,
evidence
regarding
the
amounts
and
disclosures
in
the
financial
statements.
Our
audits
also
included
evaluating
the
accounting
principles
used
and
significant
estimates
made
by
management,
as
well
as
evaluating
the
overall
presentation
of
the
financial
statements.
Our
procedures
included
confirmation
of
securities
owned
as
of
October
31,
2024
by
correspondence
with
the
custodian
and
transfer
agent.
We
believe
that
our
audits
provide
a
reasonable
basis
for
our
opinion.
/s/
PricewaterhouseCoopers
LLP
Baltimore,
Maryland
December
18,
2024
We
have
served
as
the
auditor
of
one
or
more
investment
companies
in
the
T.
Rowe
Price
group
of
investment
companies
since
1973.
REPORT
OF
INDEPENDENT
REGISTERED
PUBLIC
ACCOUNTING
FIRM
(continued)
T.
ROWE
PRICE
Emerging
Europe
Fund
TAX
INFORMATION
(UNAUDITED)
FOR
THE
TAX
YEAR
ENDED 10/31/24
We
are
providing
this
information
as
required
by
the
Internal
Revenue
Code.
The
amounts
shown
may
differ
from
those
elsewhere
in
this
report
because
of
differences
between
tax
and
financial
reporting
requirements.
For
taxable
non-corporate
shareholders,
$1,593,000
of
the
fund's
income
represents
qualified
dividend
income
subject
to
a
long-term
capital
gains
tax
rate
of
not
greater
than
20%.
The
fund
will
pass
through
foreign
source
income
of
$1,148,000
and
foreign
taxes
paid
of
$10,000.
100
East
Pratt
Street
Baltimore,
MD
21202
T.
Rowe
Price
Investment
Services,
Inc.
Call
1-800-225-5132
to
request
a
prospectus
or
summary
prospectus;
each
includes
investment
objectives,
risks,
fees,
expenses,
and
other
information
that
you
should
read
and
consider
carefully
before
investing.
F131-050
12/24
Item 8. Changes in and Disagreements with Accountants for Open-End Management Investment Companies.
Not applicable.
Item 9. Proxy Disclosures for Open-End Management Investment Companies.
Not applicable.
Item 10. Remuneration Paid to Directors, Officers, and Others of Open-End Management Investment Companies.
Remuneration paid to Directors is included in Item 7 of this Form N-CSR.
Item 11. Statement Regarding Basis for Approval of Investment Advisory Contract.
If applicable, see Item 7.
Item 12. Disclosure of Proxy Voting Policies and Procedures for Closed-End Management Investment Companies.
Not applicable.
Item 13. Portfolio Managers of Closed-End Management Investment Companies.
Not applicable.
Item 14. Purchases of Equity Securities by Closed-End Management Investment Company and Affiliated Purchasers.
Not applicable.
Item 15. Submission of Matters to a Vote of Security Holders.
There has been no change to the procedures by which shareholders may recommend nominees to the registrant’s board of directors.
Item 16. Controls and Procedures.
(a) The registrant’s principal executive officer and principal financial officer have evaluated the registrant’s disclosure controls and procedures within 90 days of this filing and have concluded that the registrant’s disclosure controls and procedures were effective, as of that date, in ensuring that information required to be disclosed by the registrant in this Form N-CSR was recorded, processed, summarized, and reported timely.
(b) The registrant’s principal executive officer and principal financial officer are aware of no change in the registrant’s internal control over financial reporting that occurred during the period covered by this report that has materially affected, or is reasonably likely to materially affect, the registrant’s internal control over financial reporting.
Item 17. Disclosure of Securities Lending Activities for Closed-End Management Investment Companies.
Not applicable.
Item 18. Recovery of Erroneously Awarded Compensation.
Not applicable.
Item 19. Exhibits.
(a)(1) The registrant’s code of ethics pursuant to Item 2 of Form N-CSR is attached.
(2) Listing standards relating to recovery of erroneously awarded compensation: not applicable.
(3) Separate certifications by the registrant’s principal executive officer and principal financial officer, pursuant to Section 302 of the Sarbanes-Oxley Act of 2002 and required by Rule 30a-2(a) under the Investment Company Act of 1940, are attached.
(b) A certification by the registrant’s principal executive officer and principal financial officer, pursuant to Section 906 of the Sarbanes-Oxley Act of 2002 and required by Rule 30a-2(b) under the Investment Company Act of 1940, is attached.
SIGNATURES
Pursuant to the requirements of the Securities Exchange Act of 1934 and the Investment Company Act of 1940, the registrant has duly caused this report to be signed on its behalf by the undersigned, thereunto duly authorized.
| | | | |
| T. Rowe Price International Funds, Inc. |
| | |
| By | | /s/ David Oestreicher | | |
| | David Oestreicher | | |
| | Principal Executive Officer | | |
| | |
| Date | | December 18, 2024 | | |
Pursuant to the requirements of the Securities Exchange Act of 1934 and the Investment Company Act of 1940, this report has been signed below by the following persons on behalf of the registrant and in the capacities and on the dates indicated.
| | | | |
| T. Rowe Price International Funds, Inc. |
| | |
| By | | /s/ David Oestreicher | | |
| | David Oestreicher | | |
| | Principal Executive Officer | | |
| | |
| Date | | December 18, 2024 | | |
| | | | |
| By | | /s/ Alan S. Dupski | | |
| | Alan S. Dupski | | |
| | Principal Financial Officer | | |
| | |
| Date | | December 18, 2024 | | |