UNITED STATES
SECURITIES AND EXCHANGE COMMISSION
Washington, D.C. 20549
FORM N-CSR
CERTIFIED SHAREHOLDER REPORT OF REGISTERED
MANAGEMENT INVESTMENT COMPANIES
Investment Company Act File Number: 811-02958
T. Rowe Price International Funds, Inc.
(Exact name of registrant as specified in charter)
100 East Pratt Street, Baltimore, MD 21202
(Address of principal executive offices)
David Oestreicher
100 East Pratt Street, Baltimore, MD 21202
(Name and address of agent for service)
Registrant’s telephone number, including area code: (410) 345-2000
Date of fiscal year end: October 31
Date of reporting period: October 31, 2024
Item 1. Reports to Shareholders
(a) Report pursuant to Rule 30e-1
Annual Shareholder Report
October 31, 2024
International Discovery Fund
This annual shareholder report contains important information about International Discovery Fund (the "fund") for the period of November 1, 2023 to October 31, 2024. You can find the fund’s prospectus, financial information on Form N‑CSR (which includes required tax information for dividends), holdings, proxy voting information, and other information atwww.troweprice.com/prospectus. You can also request this information without charge by contacting T. Rowe Price at 1‑800‑638‑5660 or info@troweprice.com or contacting your intermediary.
What were the fund costs for the last year? (based on a hypothetical $10,000 investment)
| | Costs of a $10,000 investment | Costs paid as a percentage of a $10,000 investment |
|---|
| International Discovery Fund - Investor Class | $140 | 1.25% |
What drove fund performance during the past 12 months?
International small-cap stocks posted solid gains in the year ended October 31, 2024. Inflation decelerated almost universally across developed economies, clearing the path for central banks to start cutting interest rates. With employment and growth still quite resilient, the pace of monetary easing was gradual.
Versus the S&P Global ex-U.S. Small Cap Index Net, the leading contributor to relative performance was stock selection in Japan. Shares of IHI Corporation soared as markets rewarded the industrial conglomerate's solid growth, driven by its civil aero engines and defense equipment segment. Our overweight position and stock choices in China also added value.
On the negative side, the leading detractor from relative performance was stock selection in Italy. Amplifon was a major laggard. The retailer of hearing care solutions saw disappointing performance in European markets, particularly France, and faced some operational challenges in Spain. Our stock choices in the UK also weighed on performance.
The fund invests in rapidly growing, small to medium-sized companies outside the U.S. with a focus on durable growth opportunities. We focus on companies that have a sound business model and management team, a prudent balance sheet, and a reasonable valuation and that are operating within an attractive industry structure. We continued to try and ensure a balanced portfolio. The recent past has been a tough environment for quality compounders so this was an area of focus, especially as we started to see signs that major external disruptions (COVID on/off, supply chain collapse/overstock, China weakness) were beginning to normalize.
How has the fund performed?
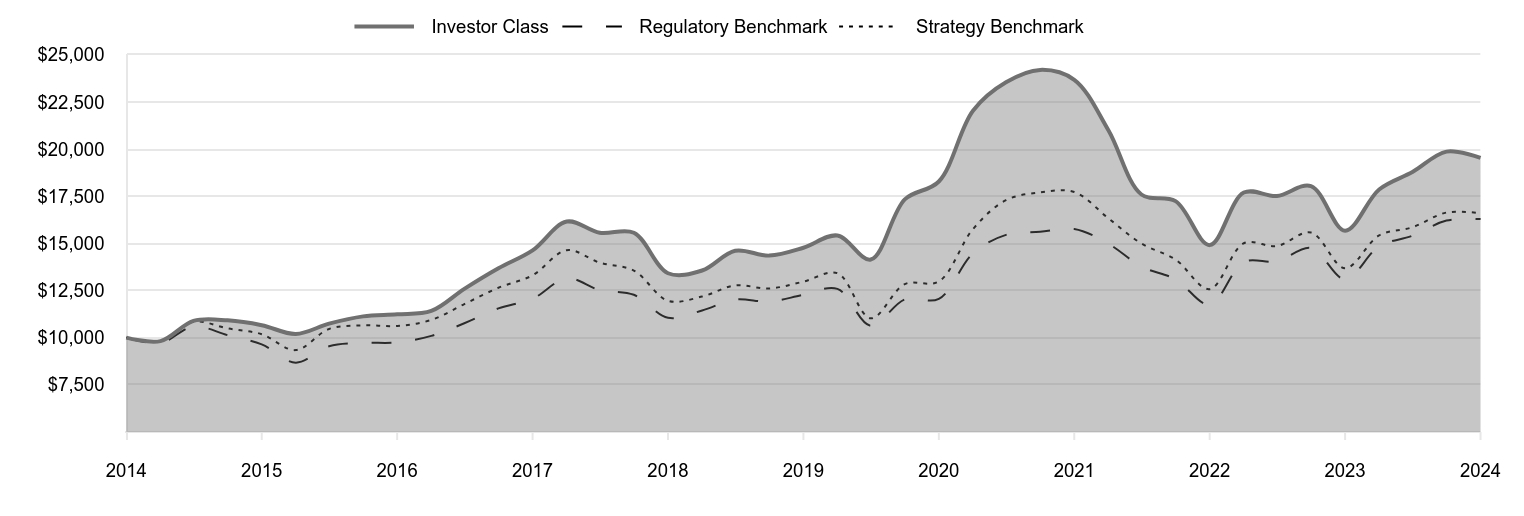
Cumulative Returns of a Hypothetical $10,000 Investment as of October 31, 2024
| Investor Class | Regulatory Benchmark | Strategy Benchmark |
|---|
| 2014 | 10,000 | 10,000 | 10,000 |
| 2015 | 9,819 | 9,720 | 9,812 |
| 2015 | 10,889 | 10,600 | 10,841 |
| 2015 | 10,918 | 10,133 | 10,494 |
| 2015 | 10,663 | 9,643 | 10,186 |
| 2016 | 10,196 | 8,675 | 9,341 |
| 2016 | 10,744 | 9,549 | 10,464 |
| 2016 | 11,129 | 9,720 | 10,652 |
| 2016 | 11,238 | 9,749 | 10,621 |
| 2017 | 11,416 | 10,096 | 10,940 |
| 2017 | 12,586 | 10,766 | 11,783 |
| 2017 | 13,679 | 11,551 | 12,648 |
| 2017 | 14,626 | 12,066 | 13,306 |
| 2018 | 16,156 | 13,148 | 14,639 |
| 2018 | 15,558 | 12,525 | 13,976 |
| 2018 | 15,562 | 12,273 | 13,559 |
| 2018 | 13,416 | 11,052 | 11,956 |
| 2019 | 13,560 | 11,441 | 12,182 |
| 2019 | 14,608 | 12,027 | 12,772 |
| 2019 | 14,351 | 11,911 | 12,609 |
| 2019 | 14,767 | 12,274 | 12,971 |
| 2020 | 15,417 | 12,587 | 13,417 |
| 2020 | 14,141 | 10,635 | 11,025 |
| 2020 | 17,329 | 12,032 | 12,841 |
| 2020 | 18,280 | 12,059 | 12,980 |
| 2021 | 22,032 | 14,475 | 15,758 |
| 2021 | 23,542 | 15,452 | 17,289 |
| 2021 | 24,197 | 15,613 | 17,701 |
| 2021 | 23,672 | 15,765 | 17,726 |
| 2022 | 20,996 | 14,982 | 16,329 |
| 2022 | 17,590 | 13,771 | 14,992 |
| 2022 | 17,238 | 13,095 | 14,140 |
| 2022 | 14,907 | 11,752 | 12,573 |
| 2023 | 17,693 | 14,011 | 15,005 |
| 2023 | 17,510 | 14,046 | 14,859 |
| 2023 | 18,034 | 14,763 | 15,574 |
| 2023 | 15,674 | 13,096 | 13,683 |
| 2024 | 17,858 | 14,850 | 15,423 |
| 2024 | 18,782 | 15,405 | 15,855 |
| 2024 | 19,864 | 16,209 | 16,634 |
| 2024 | 19,534 | 16,286 | 16,600 |
202411-4029887, 202412-3916123
Average Annual Total Returns
| | 1 Year | 5 Years | 10 Years |
|---|
| International Discovery Fund (Investor Class) | 24.63% | 5.76% | 6.92% |
| S&P Global ex US Broad Market Index (BMI) Net (Regulatory Benchmark) | 24.35 | 5.82 | 5.00 |
| S&P Global ex-U.S. Small Cap Index Net (Strategy Benchmark) | 21.32 | 5.06 | 5.20 |
The preceding line graph shows the value of a hypothetical $10,000 investment in the fund over the past 10 fiscal year periods or since inception (for funds lacking 10-year records). The fund’s performance information included in the line graph and table above is compared with a regulatory required index that represents an overall securities market (Regulatory Benchmark). In addition, the line graph and table may also include one or more indexes that more closely aligns to the fund's investment strategy (Strategy Benchmark(s)). Due to new SEC Rules on shareholder reporting the fund adopted a new broad-based securities market index, referred to as the Regulatory Benchmark. Market index returns do not include expenses, which are deducted from fund returns. The fund's total return figures reflect the reinvestment of dividends and capital gains, if any.Neither the fund’s returns nor the index returns reflect the deduction of taxes that a shareholder would pay on fund distributions or redemptions of fund shares.The fund’s past performance is not a good predictor of the fund’s future performance.Updated performance information can be found at www.troweprice.com.
What are some fund statistics?
- Total Net Assets (000s)$5,952,748
- Number of Portfolio Holdings233
- Investment Advisory Fees Paid (000s)$62,432
- Portfolio Turnover Rate29.3%
What did the fund invest in?
Sector Allocation (as a % of Net Assets)
| Industrials & Business Services | 23.3% |
| Consumer Discretionary | 16.9 |
| Information Technology | 11.0 |
| Financials | 10.5 |
| Materials | 9.9 |
| Health Care | 8.4 |
| Energy | 4.5 |
| Real Estate | 4.4 |
| Communication Services | 3.4 |
| Other | 7.7 |
Top Ten Holdings (as a % of Net Assets)
| BAWAG Group, Austria | 2.1% |
| MercadoLibre, Argentina | 1.8 |
| Redcare Pharmacy, Germany | 1.6 |
| SPIE, France | 1.5 |
| China Resources Mixc Lifestyle Services, China | 1.2 |
| Amplifon, Italy | 1.1 |
| FPT, Vietnam | 1.0 |
| Laboratorios Farmaceuticos Rovi, Spain | 1.0 |
| Croda International, United Kingdom | 0.9 |
| Descartes Systems Group, Canada | 0.9 |
If you invest directly with T. Rowe Price, you can elect to receive future shareholder reports or other important documents through electronic delivery by enrolling at www.troweprice.com/paperless. If you invest through a financial intermediary such as an investment advisor, a bank, retirement plan sponsor or a brokerage firm, please contact that organization and ask if it can provide electronic delivery.
S&P does not accept any liability for any errors or omissions in the indexes or data, and hereby expressly disclaim all warranties of originality, accuracy, completeness, timeliness, merchantability and fitness for a particular purpose. No party may rely on any indexes or data contained in this communication. Visit www.troweprice.com/en/us/market-data-disclosures for additional legal notices & disclaimers.
International Discovery Fund
Investor Class (PRIDX)
T. Rowe Price Investment Services, Inc.
100 East Pratt Street
Baltimore, MD 21202
Annual Shareholder Report
October 31, 2024
International Discovery Fund
This annual shareholder report contains important information about International Discovery Fund (the "fund") for the period of November 1, 2023 to October 31, 2024. You can find the fund’s prospectus, financial information on Form N‑CSR (which includes required tax information for dividends), holdings, proxy voting information, and other information atwww.troweprice.com/prospectus. You can also request this information without charge by contacting T. Rowe Price at 1‑800‑638‑5660 or info@troweprice.com or contacting your intermediary.
What were the fund costs for the last year? (based on a hypothetical $10,000 investment)
| | Costs of a $10,000 investment | Costs paid as a percentage of a $10,000 investment |
|---|
| International Discovery Fund - I Class | $121 | 1.08% |
What drove fund performance during the past 12 months?
International small-cap stocks posted solid gains in the year ended October 31, 2024. Inflation decelerated almost universally across developed economies, clearing the path for central banks to start cutting interest rates. With employment and growth still quite resilient, the pace of monetary easing was gradual.
Versus the S&P Global ex-U.S. Small Cap Index Net, the leading contributor to relative performance was stock selection in Japan. Shares of IHI Corporation soared as markets rewarded the industrial conglomerate's solid growth, driven by its civil aero engines and defense equipment segment. Our overweight position and stock choices in China also added value.
On the negative side, the leading detractor from relative performance was stock selection in Italy. Amplifon was a major laggard. The retailer of hearing care solutions saw disappointing performance in European markets, particularly France, and faced some operational challenges in Spain. Our stock choices in the UK also weighed on performance.
The fund invests in rapidly growing, small to medium-sized companies outside the U.S. with a focus on durable growth opportunities. We focus on companies that have a sound business model and management team, a prudent balance sheet, and a reasonable valuation and that are operating within an attractive industry structure. We continued to try and ensure a balanced portfolio. The recent past has been a tough environment for quality compounders so this was an area of focus, especially as we started to see signs that major external disruptions (COVID on/off, supply chain collapse/overstock, China weakness) were beginning to normalize.
How has the fund performed?
Cumulative Returns of a Hypothetical $500,000 Investment as of October 31, 2024
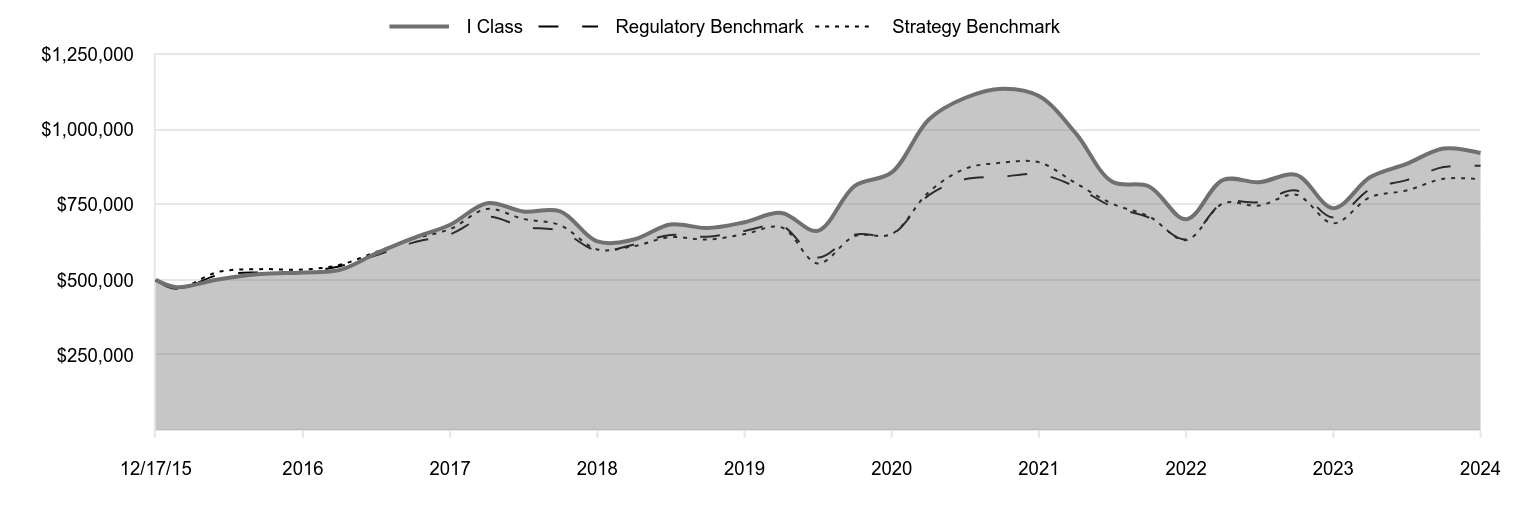
| I Class | Regulatory Benchmark | Strategy Benchmark |
|---|
| 12/17/15 | 500,000 | 500,000 | 500,000 |
| 1/31/16 | 475,756 | 468,738 | 469,923 |
| 4/30/16 | 501,503 | 515,954 | 526,403 |
| 7/31/16 | 519,677 | 525,191 | 535,847 |
| 10/31/16 | 524,850 | 526,800 | 534,291 |
| 1/31/17 | 533,356 | 545,557 | 550,341 |
| 4/30/17 | 588,175 | 581,726 | 592,736 |
| 7/31/17 | 639,430 | 624,151 | 636,236 |
| 10/31/17 | 683,844 | 651,991 | 669,345 |
| 1/31/18 | 755,611 | 710,421 | 736,441 |
| 4/30/18 | 727,958 | 676,769 | 703,056 |
| 7/31/18 | 728,357 | 663,160 | 682,110 |
| 10/31/18 | 628,128 | 597,188 | 601,455 |
| 1/31/19 | 635,139 | 618,205 | 612,808 |
| 4/30/19 | 684,429 | 649,850 | 642,507 |
| 7/31/19 | 672,638 | 643,599 | 634,280 |
| 10/31/19 | 692,290 | 663,243 | 652,500 |
| 1/31/20 | 723,058 | 680,119 | 674,966 |
| 4/30/20 | 663,394 | 574,661 | 554,626 |
| 7/31/20 | 813,252 | 650,119 | 645,984 |
| 10/31/20 | 858,080 | 651,597 | 652,939 |
| 1/31/21 | 1,034,494 | 782,143 | 792,728 |
| 4/30/21 | 1,105,850 | 834,957 | 869,713 |
| 7/31/21 | 1,136,977 | 843,638 | 890,433 |
| 10/31/21 | 1,112,592 | 851,865 | 891,686 |
| 1/31/22 | 987,267 | 809,553 | 821,424 |
| 4/30/22 | 827,505 | 744,088 | 754,176 |
| 7/31/22 | 811,203 | 707,598 | 711,318 |
| 10/31/22 | 701,912 | 635,017 | 632,483 |
| 1/31/23 | 833,248 | 757,099 | 754,843 |
| 4/30/23 | 825,046 | 758,983 | 747,494 |
| 7/31/23 | 849,921 | 797,689 | 783,453 |
| 10/31/23 | 738,992 | 707,644 | 688,329 |
| 1/31/24 | 842,374 | 802,424 | 775,873 |
| 4/30/24 | 886,391 | 832,396 | 797,585 |
| 7/31/24 | 937,698 | 875,826 | 836,760 |
| 10/31/24 | 922,567 | 879,987 | 835,047 |
202411-4029887, 202412-3916123
Average Annual Total Returns
| | 1 Year | 5 Years | Since Inception 12/17/15 |
|---|
| International Discovery Fund (I Class) | 24.84% | 5.91% | 7.15% |
| S&P Global ex US Broad Market Index (BMI) Net (Regulatory Benchmark) | 24.35 | 5.82 | 6.58 |
| S&P Global ex-U.S. Small Cap Index Net (Strategy Benchmark) | 21.32 | 5.06 | 5.95 |
The preceding line graph shows the value of a hypothetical $500,000 investment in the fund over the past 10 fiscal year periods or since inception (for funds lacking 10-year records). The fund’s performance information included in the line graph and table above is compared with a regulatory required index that represents an overall securities market (Regulatory Benchmark). In addition, the line graph and table may also include one or more indexes that more closely aligns to the fund's investment strategy (Strategy Benchmark(s)). Due to new SEC Rules on shareholder reporting the fund adopted a new broad-based securities market index, referred to as the Regulatory Benchmark. Market index returns do not include expenses, which are deducted from fund returns. The fund's total return figures reflect the reinvestment of dividends and capital gains, if any.Neither the fund’s returns nor the index returns reflect the deduction of taxes that a shareholder would pay on fund distributions or redemptions of fund shares.The fund’s past performance is not a good predictor of the fund’s future performance.Updated performance information can be found at www.troweprice.com.
What are some fund statistics?
- Total Net Assets (000s)$5,952,748
- Number of Portfolio Holdings233
- Investment Advisory Fees Paid (000s)$62,432
- Portfolio Turnover Rate29.3%
What did the fund invest in?
Sector Allocation (as a % of Net Assets)
| Industrials & Business Services | 23.3% |
| Consumer Discretionary | 16.9 |
| Information Technology | 11.0 |
| Financials | 10.5 |
| Materials | 9.9 |
| Health Care | 8.4 |
| Energy | 4.5 |
| Real Estate | 4.4 |
| Communication Services | 3.4 |
| Other | 7.7 |
Top Ten Holdings (as a % of Net Assets)
| BAWAG Group, Austria | 2.1% |
| MercadoLibre, Argentina | 1.8 |
| Redcare Pharmacy, Germany | 1.6 |
| SPIE, France | 1.5 |
| China Resources Mixc Lifestyle Services, China | 1.2 |
| Amplifon, Italy | 1.1 |
| FPT, Vietnam | 1.0 |
| Laboratorios Farmaceuticos Rovi, Spain | 1.0 |
| Croda International, United Kingdom | 0.9 |
| Descartes Systems Group, Canada | 0.9 |
If you invest directly with T. Rowe Price, you can elect to receive future shareholder reports or other important documents through electronic delivery by enrolling at www.troweprice.com/paperless. If you invest through a financial intermediary such as an investment advisor, a bank, retirement plan sponsor or a brokerage firm, please contact that organization and ask if it can provide electronic delivery.
S&P does not accept any liability for any errors or omissions in the indexes or data, and hereby expressly disclaim all warranties of originality, accuracy, completeness, timeliness, merchantability and fitness for a particular purpose. No party may rely on any indexes or data contained in this communication. Visit www.troweprice.com/en/us/market-data-disclosures for additional legal notices & disclaimers.
International Discovery Fund
I Class (TIDDX)
T. Rowe Price Investment Services, Inc.
100 East Pratt Street
Baltimore, MD 21202
Annual Shareholder Report
October 31, 2024
International Discovery Fund
This annual shareholder report contains important information about International Discovery Fund (the "fund") for the period of November 1, 2023 to October 31, 2024. You can find the fund’s prospectus, financial information on Form N‑CSR (which includes required tax information for dividends), holdings, proxy voting information, and other information atwww.troweprice.com/prospectus. You can also request this information without charge by contacting T. Rowe Price at 1‑800‑638‑5660 or info@troweprice.com or contacting your intermediary.
What were the fund costs for the last year? (based on a hypothetical $10,000 investment)
| | Costs of a $10,000 investment | Costs paid as a percentage of a $10,000 investment |
|---|
| International Discovery Fund - Z Class | $0 | 0.00% |
What drove fund performance during the past 12 months?
International small-cap stocks posted solid gains in the year ended October 31, 2024. Inflation decelerated almost universally across developed economies, clearing the path for central banks to start cutting interest rates. With employment and growth still quite resilient, the pace of monetary easing was gradual.
Versus the S&P Global ex-U.S. Small Cap Index Net, the leading contributor to relative performance was stock selection in Japan. Shares of IHI Corporation soared as markets rewarded the industrial conglomerate's solid growth, driven by its civil aero engines and defense equipment segment. Our overweight position and stock choices in China also added value.
On the negative side, the leading detractor from relative performance was stock selection in Italy. Amplifon was a major laggard. The retailer of hearing care solutions saw disappointing performance in European markets, particularly France, and faced some operational challenges in Spain. Our stock choices in the UK also weighed on performance.
The fund invests in rapidly growing, small to medium-sized companies outside the U.S. with a focus on durable growth opportunities. We focus on companies that have a sound business model and management team, a prudent balance sheet, and a reasonable valuation and that are operating within an attractive industry structure. We continued to try and ensure a balanced portfolio. The recent past has been a tough environment for quality compounders so this was an area of focus, especially as we started to see signs that major external disruptions (COVID on/off, supply chain collapse/overstock, China weakness) were beginning to normalize.
How has the fund performed?
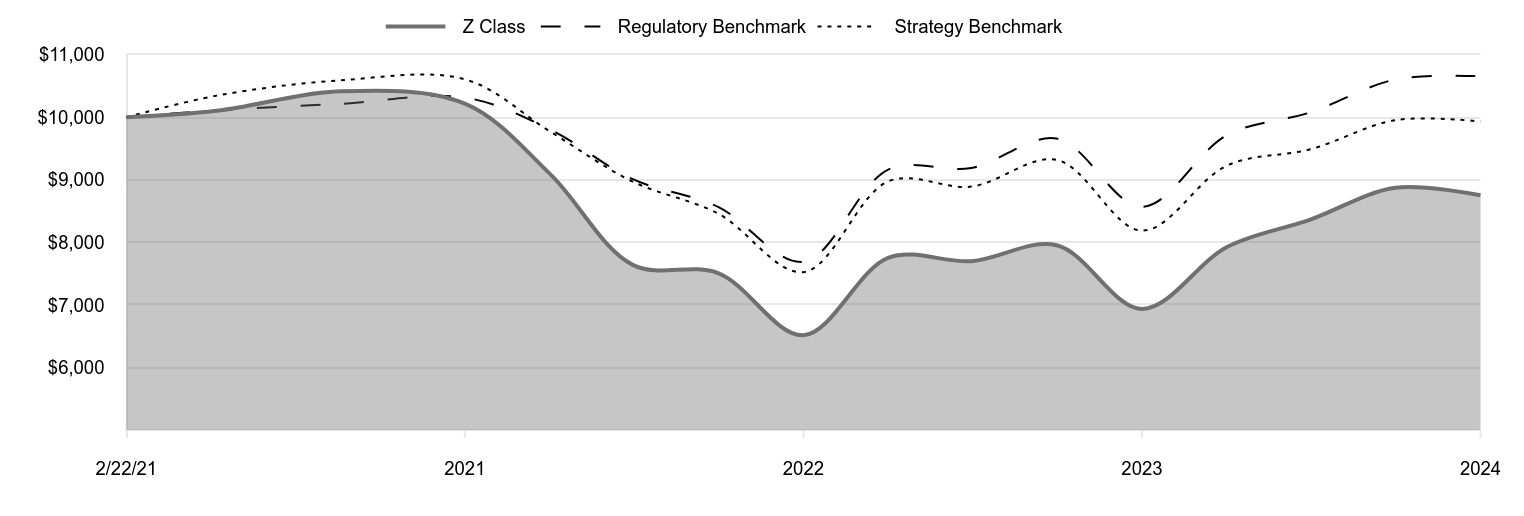
Cumulative Returns of a Hypothetical $10,000 Investment as of October 31, 2024
| Z Class | Regulatory Benchmark | Strategy Benchmark |
|---|
| 2/22/21 | 10,000 | 10,000 | 10,000 |
| 4/30/21 | 10,103 | 10,110 | 10,346 |
| 7/31/21 | 10,415 | 10,215 | 10,592 |
| 10/31/21 | 10,218 | 10,315 | 10,607 |
| 1/31/22 | 9,091 | 9,803 | 9,771 |
| 4/30/22 | 7,640 | 9,010 | 8,971 |
| 7/31/22 | 7,510 | 8,568 | 8,461 |
| 10/31/22 | 6,516 | 7,689 | 7,524 |
| 1/31/23 | 7,757 | 9,167 | 8,979 |
| 4/30/23 | 7,699 | 9,190 | 8,892 |
| 7/31/23 | 7,955 | 9,659 | 9,319 |
| 10/31/23 | 6,935 | 8,569 | 8,188 |
| 1/31/24 | 7,927 | 9,716 | 9,229 |
| 4/30/24 | 8,364 | 10,079 | 9,488 |
| 7/31/24 | 8,873 | 10,605 | 9,954 |
| 10/31/24 | 8,752 | 10,655 | 9,933 |
202411-4029887, 202412-3916123
Average Annual Total Returns
| | 1 Year | Since Inception 2/22/21 |
|---|
| International Discovery Fund (Z Class) | 26.21% | -3.55% |
| S&P Global ex US Broad Market Index (BMI) Net (Regulatory Benchmark) | 24.35 | 1.74 |
| S&P Global ex-U.S. Small Cap Index Net (Strategy Benchmark) | 21.32 | -0.18 |
The preceding line graph shows the value of a hypothetical $10,000 investment in the fund over the past 10 fiscal year periods or since inception (for funds lacking 10-year records). The fund’s performance information included in the line graph and table above is compared with a regulatory required index that represents an overall securities market (Regulatory Benchmark). In addition, the line graph and table may also include one or more indexes that more closely aligns to the fund's investment strategy (Strategy Benchmark(s)). Due to new SEC Rules on shareholder reporting the fund adopted a new broad-based securities market index, referred to as the Regulatory Benchmark. Market index returns do not include expenses, which are deducted from fund returns. The fund's total return figures reflect the reinvestment of dividends and capital gains, if any.Neither the fund’s returns nor the index returns reflect the deduction of taxes that a shareholder would pay on fund distributions or redemptions of fund shares.The fund’s past performance is not a good predictor of the fund’s future performance.Updated performance information can be found at www.troweprice.com.
What are some fund statistics?
- Total Net Assets (000s)$5,952,748
- Number of Portfolio Holdings233
- Investment Advisory Fees Paid (000s)$62,432
- Portfolio Turnover Rate29.3%
What did the fund invest in?
Sector Allocation (as a % of Net Assets)
| Industrials & Business Services | 23.3% |
| Consumer Discretionary | 16.9 |
| Information Technology | 11.0 |
| Financials | 10.5 |
| Materials | 9.9 |
| Health Care | 8.4 |
| Energy | 4.5 |
| Real Estate | 4.4 |
| Communication Services | 3.4 |
| Other | 7.7 |
Top Ten Holdings (as a % of Net Assets)
| BAWAG Group, Austria | 2.1% |
| MercadoLibre, Argentina | 1.8 |
| Redcare Pharmacy, Germany | 1.6 |
| SPIE, France | 1.5 |
| China Resources Mixc Lifestyle Services, China | 1.2 |
| Amplifon, Italy | 1.1 |
| FPT, Vietnam | 1.0 |
| Laboratorios Farmaceuticos Rovi, Spain | 1.0 |
| Croda International, United Kingdom | 0.9 |
| Descartes Systems Group, Canada | 0.9 |
If you invest directly with T. Rowe Price, you can elect to receive future shareholder reports or other important documents through electronic delivery by enrolling at www.troweprice.com/paperless. If you invest through a financial intermediary such as an investment advisor, a bank, retirement plan sponsor or a brokerage firm, please contact that organization and ask if it can provide electronic delivery.
S&P does not accept any liability for any errors or omissions in the indexes or data, and hereby expressly disclaim all warranties of originality, accuracy, completeness, timeliness, merchantability and fitness for a particular purpose. No party may rely on any indexes or data contained in this communication. Visit www.troweprice.com/en/us/market-data-disclosures for additional legal notices & disclaimers.
International Discovery Fund
Z Class (TRZKX)
T. Rowe Price Investment Services, Inc.
100 East Pratt Street
Baltimore, MD 21202
Item 1. (b) Notice pursuant to Rule 30e-3.
Not applicable.
Item 2. Code of Ethics.
The registrant has adopted a code of ethics, as defined in Item 2 of Form N-CSR, applicable to its principal executive officer, principal financial officer, principal accounting officer or controller, or persons performing similar functions. A copy of this code of ethics is filed as an exhibit to this Form N-CSR. No substantive amendments were approved or waivers were granted to this code of ethics during the period covered by this report.
Item 3. Audit Committee Financial Expert.
The registrant’s Board of Directors has determined that Mr. Paul F. McBride qualifies as an audit committee financial expert, as defined in Item 3 of Form N-CSR. Mr. McBride is considered independent for purposes of Item 3 of Form N-CSR.
Item 4. Principal Accountant Fees and Services.
(a) – (d) Aggregate fees billed for the last two fiscal years for professional services rendered to, or on behalf of, the registrant by the registrant’s principal accountant were as follows:
| | | | | | | | | | | | | | | | |
| | | | | 2024 | | | | | | 2023 | | | |
| | Audit Fees | | | $26,450 | | | | | | | | $25,925 | | | |
| | Audit-Related Fees | | | 4,850 | | | | | | | | 5,591 | | | |
| | Tax Fees | | | 1,681 | | | | | | | | - | | | |
| | All Other Fees | | | - | | | | | | | | - | | | |
Audit fees include amounts related to the audit of the registrant’s annual financial statements and services normally provided by the accountant in connection with statutory and regulatory filings. Audit-related fees include amounts reasonably related to the performance of the audit of the registrant’s financial statements and specifically include the issuance of a report on internal controls and, if applicable, agreed-upon procedures related to fund acquisitions. Tax fees include amounts related to services for tax compliance, tax planning, and tax advice. The nature of these services specifically includes the review of distribution calculations and the preparation of Federal, state, and excise tax returns. All other fees include the registrant’s pro-rata share of amounts for agreed-upon procedures in conjunction with service contract approvals by the registrant’s Board of Directors/Trustees.
(e)(1) The registrant’s audit committee has adopted a policy whereby audit and non-audit services performed by the registrant’s principal accountant for the registrant, its investment adviser, and any entity controlling, controlled by, or under common control with the investment adviser that provides ongoing services to the registrant require pre-approval in advance at regularly scheduled audit committee meetings. If such a service is required between regularly scheduled audit committee meetings, pre-approval may be authorized by one audit committee member with ratification at the next scheduled audit committee meeting. Waiver of pre-approval for audit or non-audit services requiring fees of a de minimis amount is not permitted.
(2) No services included in (b) – (d) above were approved pursuant to paragraph (c)(7)(i)(C) of Rule 2-01 of Regulation S-X.
(f) Less than 50 percent of the hours expended on the principal accountant’s engagement to audit the registrant’s financial statements for the most recent fiscal year were attributed to work performed by persons other than the principal accountant’s full-time, permanent employees.
(g) The aggregate fees billed for the most recent fiscal year and the preceding fiscal year by the registrant’s principal accountant for non-audit services rendered to the registrant, its investment adviser, and any entity controlling, controlled by, or under common control with the investment adviser that provides ongoing services to the registrant were $846,000 and $1,584,000, respectively.
(h) All non-audit services rendered in (g) above were pre-approved by the registrant’s audit committee. Accordingly, these services were considered by the registrant’s audit committee in maintaining the principal accountant’s independence.
(i) Not applicable.
(j) Not applicable.
Item 5. Audit Committee of Listed Registrants.
Not applicable.
Item 6. Investments.
(a) Not applicable. The complete schedule of investments is included in Item 7 of this Form N-CSR.
(b) Not applicable.
Item 7. Financial Statements and Financial Highlights for Open-End Management Investment Companies.
(a – b) Report pursuant to Regulation S-X.
Financial
Highlights
Portfolio
of
Investments
Financial
Statements
and
Notes
Additional
Fund
Information
Financial
Statements
and
Other
Information
For
more
insights
from
T.
Rowe
Price
investment
professionals,
go
to
troweprice.com
.
T.
ROWE
PRICE
PRIDX
International
Discovery
Fund
TIDDX
International
Discovery
Fund–
.
I Class
TRZKX
International
Discovery
Fund–
.
Z Class
T.
ROWE
PRICE
International
Discovery
Fund
For
a
share
outstanding
throughout
each
period
The
accompanying
notes
are
an
integral
part
of
these
financial
statements.
Investor
Class
..
Year
..
..
Ended
.
10/31/24
10/31/23
10/31/22
10/31/21
10/31/20
NET
ASSET
VALUE
Beginning
of
period
$
54.73
$
53.67
$
98.74
$
79.63
$
65.08
Investment
activities
Net
investment
income
(loss)
(1)(2)
1.03
0.51
0.18
(0.08)
0.05
Net
realized
and
unrealized
gain/loss
12.33
2.36
(32.33)
23.09
15.29
Total
from
investment
activities
13.36
2.87
(32.15)
23.01
15.34
Distributions
Net
investment
income
(0.79)
—
—
(0.07)
(0.57)
Net
realized
gain
(0.50)
(1.81)
(12.92)
(3.83)
(0.22)
Total
distributions
(1.29)
(1.81)
(12.92)
(3.90)
(0.79)
NET
ASSET
VALUE
End
of
period
$
66.80
$
54.73
$
53.67
$
98.74
$
79.63
Ratios/Supplemental
Data
Total
return
(2)(3)
24.63%
5.14%
(37.03)%
29.50%
23.79%
Ratios
to
average
net
assets:
(2)
Gross
expenses
before
waivers/
payments
by
Price
Associates
1.25%
1.24%
1.23%
1.18%
1.19%
Net
expenses
after
waivers/
payments
by
Price
Associates
1.25%
1.24%
1.23%
1.18%
1.19%
Net
investment
income
(loss)
1.61%
0.86%
0.25%
(0.08)%
0.08%
Portfolio
turnover
rate
29.3%
28.3%
24.6%
29.4%
26.8%
Net
assets,
end
of
period
(in
millions)
$2,168
$2,408
$2,647
$5,979
$5,081
0%
0%
0%
0%
0%
(1)
Per
share
amounts
calculated
using
average
shares
outstanding
method.
(2)
Includes
the
impact
of
expense-related
arrangements
with
Price
Associates.
(3)
Total
return
reflects
the
rate
that
an
investor
would
have
earned
on
an
investment
in
the
fund
during
each
period,
assuming
reinvestment
of
all
distributions,
and
payment
of
no
redemption
or
account
fees,
if
applicable.
T.
ROWE
PRICE
International
Discovery
Fund
For
a
share
outstanding
throughout
each
period
The
accompanying
notes
are
an
integral
part
of
these
financial
statements.
I
Class
..
Year
..
..
Ended
.
10/31/24
10/31/23
10/31/22
10/31/21
10/31/20
NET
ASSET
VALUE
Beginning
of
period
$
54.96
$
53.82
$
99.01
$
79.82
$
65.17
Investment
activities
Net
investment
income
(1)(2)
1.20
0.60
0.38
0.06
0.14
Net
realized
and
unrealized
gain/loss
12.32
2.35
(32.47)
23.12
15.32
Total
from
investment
activities
13.52
2.95
(32.09)
23.18
15.46
Distributions
Net
investment
income
(0.91)
—
—
(0.16)
(0.59)
Net
realized
gain
(0.50)
(1.81)
(13.10)
(3.83)
(0.22)
Total
distributions
(1.41)
(1.81)
(13.10)
(3.99)
(0.81)
NET
ASSET
VALUE
End
of
period
$
67.07
$
54.96
$
53.82
$
99.01
$
79.82
Ratios/Supplemental
Data
Total
return
(2)(3)
24.84%
5.28%
(36.91)%
29.66%
23.95%
Ratios
to
average
net
assets:
(2)
Gross
expenses
before
waivers/
payments
by
Price
Associates
1.09%
1.09%
1.08%
1.05%
1.06%
Net
expenses
after
waivers/
payments
by
Price
Associates
1.08%
1.09%
1.08%
1.05%
1.06%
Net
investment
income
1.84%
1.01%
0.56%
0.06%
0.21%
Portfolio
turnover
rate
29.3%
28.3%
24.6%
29.4%
26.8%
Net
assets,
end
of
period
(in
millions)
$3,667
$3,095
$3,172
$4,661
$3,965
0%
0%
0%
0%
0%
(1)
Per
share
amounts
calculated
using
average
shares
outstanding
method.
(2)
Includes
the
impact
of
expense-related
arrangements
with
Price
Associates.
(3)
Total
return
reflects
the
rate
that
an
investor
would
have
earned
on
an
investment
in
the
fund
during
each
period,
assuming
reinvestment
of
all
distributions,
and
payment
of
no
redemption
or
account
fees,
if
applicable.
T.
ROWE
PRICE
International
Discovery
Fund
For
a
share
outstanding
throughout
each
period
The
accompanying
notes
are
an
integral
part
of
these
financial
statements.
Z
Class
(1)
..
Year
..
..
Ended
.
2/22/21
(1)
Through
10/31/21
10/31/24
10/31/23
10/31/22
NET
ASSET
VALUE
Beginning
of
period
$
55
.84
$
54
.08
$
99
.53
$
97
.41
Investment
activities
Net
investment
income
(2)(3)
1
.92
1
.25
1
.08
1
.04
Net
realized
and
unrealized
gain/loss
12
.51
2
.32
(
32
.43
)
1
.08
Total
from
investment
activities
14
.43
3
.57
(
31
.35
)
2
.12
Distributions
Net
investment
income
(
1
.50
)
—
—
—
Net
realized
gain
(
0
.50
)
(
1
.81
)
(
14
.10
)
—
Total
distributions
(
2
.00
)
(
1
.81
)
(
14
.10
)
—
NET
ASSET
VALUE
End
of
period
$
68
.27
$
55
.84
$
54
.08
$
99
.53
Ratios/Supplemental
Data
Total
return
(3)(4)
26
.21
%
6
.43
%
(
36
.23
)
%
2
.18
%
Ratios
to
average
net
assets:
(3)
Gross
expenses
before
waivers/payments
by
Price
Associates
1
.06
%
1
.07
%
1
.07
%
1
.05
%
(5)
Net
expenses
after
waivers/payments
by
Price
Associates
0
.00
%
0
.00
%
0
.00
%
0
.00
%
(5)
Net
investment
income
2
.91
%
2
.07
%
1
.58
%
1
.51
%
(5)
Portfolio
turnover
rate
29
.3
%
28
.3
%
24
.6
%
29
.4
%
Net
assets,
end
of
period
(in
millions)
$118
$118
$122
$197
0
%
0
%
0
%
0
%
(1)
Inception
date
(2)
Per
share
amounts
calculated
using
average
shares
outstanding
method.
(3)
Includes
the
impact
of
expense-related
arrangements
with
Price
Associates.
(4)
Total
return
reflects
the
rate
that
an
investor
would
have
earned
on
an
investment
in
the
fund
during
each
period,
assuming
reinvestment
of
all
distributions,
and
payment
of
no
redemption
or
account
fees,
if
applicable.
Total
return
is
not
annualized
for
periods
less
than
one
year.
(5)
Annualized
T.
ROWE
PRICE
International
Discovery
Fund
October
31,
2024
Shares
$
Value
(
Cost
and
value
in
$000s)
‡
ARGENTINA 2.0%
Common
Stocks 2.0%
Arcos
Dorados
Holdings,
Class
A
(USD)
1,592,589
14,031
MercadoLibre
(USD) (1)
51,052
104,002
Total
Argentina
(Cost
$21,022)
118,033
AUSTRALIA 1.2%
Common
Stocks 1.2%
ALS
1,382,863
12,766
Cochlear
85,823
15,889
oOh!media
14,864,479
12,056
Pilbara
Minerals (1)
7,753,101
14,360
Reliance
Worldwide
4,468,797
15,216
Total
Australia
(Cost
$61,181)
70,287
AUSTRIA 2.3%
Common
Stocks 2.3%
BAWAG
Group
1,598,780
123,921
Schoeller-Bleckmann
Oilfield
Equipment
525,291
15,771
Total
Austria
(Cost
$97,375)
139,692
BRAZIL 1.6%
Common
Stocks 1.6%
CI&T,
Class
A
(USD) (1)
3,101,158
20,406
Intelbras
Industria
de
Telecomunicacao
Eletronica
Brasileira
3,748,024
12,416
Klabin
9,697,876
35,212
Multiplan
Empreendimentos
Imobiliarios
3,471,606
15,367
TOTVS
2,783,934
14,370
97,771
Preferred
Stocks 0.0%
Klabin
2
—
—
Total
Brazil
(Cost
$106,676)
97,771
T.
ROWE
PRICE
International
Discovery
Fund
Shares
$
Value
(Cost
and
value
in
$000s)
CANADA 9.0%
Common
Stocks 9.0%
Aritzia (1)
1,057,723
34,056
AtkinsRealis
Group (2)
1,013,470
48,768
ATS (1)
619,520
18,568
Aya
Gold
&
Silver (1)(2)
2,856,011
36,696
BRP (2)
228,907
11,286
Definity
Financial
952,547
36,758
dentalcorp
Holdings (1)(2)
2,153,715
14,525
Descartes
Systems
Group (1)
497,046
51,638
ERO
Copper (1)(2)
2,144,488
39,383
Exchange
Income (2)
767,671
30,186
Jamieson
Wellness (2)
967,335
23,045
Kinaxis (1)
166,404
18,481
Maple
Leaf
Foods
1,045,370
15,812
NuVista
Energy (1)
2,492,491
20,014
Osisko
Gold
Royalties
845,600
17,017
Richelieu
Hardware
678,062
17,868
Shopify,
Class
A (1)
482,753
37,764
Spin
Master
862,393
18,253
StorageVault
Canada (2)
7,338,233
21,450
Wesdome
Gold
Mines (1)
2,521,607
22,095
Total
Canada
(Cost
$409,652)
533,663
CHINA 12.1%
Common
Stocks 5.8%
Atour
Lifestyle
Holdings,
ADR
(USD)
484,742
12,700
Bilibili,
Class
Z
(HKD) (1)
790,420
17,464
BOC
Aviation
(HKD)
2,398,700
18,604
Bosideng
International
Holdings
(HKD)
49,484,000
27,748
China
Resources
Gas
Group
(HKD)
7,295,900
28,130
China
Resources
Mixc
Lifestyle
Services
(HKD)
17,816,600
73,501
COSCO
SHIPPING
Energy
Transportation,
Class
H
(HKD) (2)
9,518,000
9,109
H
World
Group
(HKD)
8,989,600
33,089
Haier
Smart
Home,
Class
H
(HKD)
4,995,800
18,131
Kanzhun,
ADR
(USD)
1,217,436
17,714
Kingboard
Laminates
Holdings
(HKD)
19,063,000
16,565
Ninebot,
CDR
3,686,451
22,961
Shandong
Weigao
Group
Medical
Polymer,
Class
H
(HKD)
27,432,400
17,071
T.
ROWE
PRICE
International
Discovery
Fund
Shares
$
Value
(Cost
and
value
in
$000s)
Tsingtao
Brewery,
Class
H
(HKD) (2)
2,926,000
18,841
Yangzijiang
Shipbuilding
Holdings
(SGD)
6,803,000
13,217
344,845
Common
Stocks
-
China
A
Shares 6.3%
Beijing
Huafeng
Test
&
Control
Technology,
A
Shares
(CNH)
723,054
12,173
China
Oilfield
Services,
A
Shares
(CNH)
11,805,120
25,032
CNOOC
Energy
Technology
&
Services,
A
Shares
(CNH)
40,611,824
24,935
Fuyao
Glass
Industry
Group,
A
Shares
(CNH)
1,534,918
12,293
Hongfa
Technology,
A
Shares
(CNH)
5,841,432
24,900
Huali
Industrial
Group,
A
Shares
(CNH)
1,312,230
12,337
Humanwell
Healthcare
Group,
A
Shares
(CNH)
4,658,000
14,114
Jiangsu
Hengli
Hydraulic,
A
Shares
(CNH)
3,310,813
24,106
Loncin
Motor,
A
Shares
(CNH)
10,476,200
12,037
Shandong
Pharmaceutical
Glass,
A
Shares
(CNH)
5,700,114
20,169
Shenzhen
Jufei
Optoelectronics,
A
Shares
(CNH)
17,257,604
18,702
WUS
Printed
Circuit
Kunshan,
A
Shares
(CNH)
2,066,610
11,736
Xiamen
Faratronic,
A
Shares
(CNH)
2,413,928
38,509
Xuji
Electric,
A
Shares
(CNH)
6,457,700
27,587
Yankershop
Food,
A
Shares
(CNH)
3,519,280
24,827
Yantai
Jereh
Oilfield
Services
Group,
A
Shares
(CNH)
6,023,044
28,407
YTO
Express
Group,
A
Shares
(CNH)
6,501,034
15,014
Yunnan
Aluminium,
A
Shares
(CNH)
14,039,200
28,024
374,902
Total
China
(Cost
$666,290)
719,747
DENMARK 0.8%
Common
Stocks 0.8%
Royal
Unibrew
225,316
16,951
Zealand
Pharma (1)(2)
275,991
31,861
Total
Denmark
(Cost
$22,831)
48,812
FINLAND 0.4%
Common
Stocks 0.4%
Mandatum
833,740
3,850
Valmet (2)
776,626
19,898
Total
Finland
(Cost
$23,616)
23,748
T.
ROWE
PRICE
International
Discovery
Fund
Shares
$
Value
(Cost
and
value
in
$000s)
FRANCE 6.3%
Common
Stocks 6.3%
Beneteau (2)
1,728,318
19,012
Coface
1,174,310
18,937
Edenred
586,437
18,967
Eramet (2)
265,339
15,680
Esker
113,596
32,384
Eurofins
Scientific
602,381
29,711
Lectra (2)
727,962
20,248
Nexity (1)(2)
2,070,747
32,347
Planisware (1)
1,544,989
37,782
Robertet
1,037
1,053
SPIE
2,394,261
86,657
Verallia
595,093
17,162
Virbac
110,813
42,117
Total
France
(Cost
$310,679)
372,057
GERMANY 5.3%
Common
Stocks 5.3%
Adesso (2)
120,492
8,793
flatexDEGIRO
3,250,900
47,756
Hypoport (1)(2)
92,465
21,711
Knaus
Tabbert (2)
334,692
8,230
Nagarro (1)(2)
176,570
17,249
Redcare
Pharmacy (1)(2)
634,565
97,183
Schott
Pharma (2)
860,983
27,889
Scout24
275,172
23,771
Siltronic (2)
760,334
43,191
Zalando (1)
747,050
22,615
Total
Germany
(Cost
$294,836)
318,388
HONG
KONG 0.3%
Common
Stocks 0.3%
Impro
Precision
Industries
31,938,000
9,407
Yue
Yuen
Industrial
Holdings
4,157,000
8,739
Total
Hong
Kong
(Cost
$21,369)
18,146
T.
ROWE
PRICE
International
Discovery
Fund
Shares
$
Value
(Cost
and
value
in
$000s)
INDIA 5.2%
Common
Stocks 5.2%
Astral
1,256,066
26,393
Blue
Star
1,534,706
34,039
Computer
Age
Management
Services
107,828
5,681
Craftsman
Automation
64,724
3,911
CreditAccess
Grameen
1,341,859
15,616
Dixon
Technologies
India
176,257
29,407
Info
Edge
India
297,371
26,238
Metro
Brands
1,116,438
15,899
Page
Industries
49,352
25,289
Polycab
India
436,081
33,446
Sapphire
Foods
India (1)
4,356,234
16,605
TeamLease
Services (1)
263,213
8,724
Torrent
Pharmaceuticals
424,709
16,143
Vedant
Fashions
1,196,564
19,914
Zomato (1)
11,417,006
32,755
Total
India
(Cost
$153,545)
310,060
IRELAND 0.7%
Common
Stocks 0.7%
Cairn
Homes
(GBP)
17,728,142
41,090
Total
Ireland
(Cost
$20,618)
41,090
ITALY 3.8%
Common
Stocks 3.8%
Amplifon (2)
2,283,732
63,794
Ariston
Holding (2)
2,707,959
11,398
BFF
Bank
1,899,657
18,550
Carel
Industries (2)
1,463,065
30,071
Ermenegildo
Zegna
(USD) (2)
3,064,085
23,287
FinecoBank
Banca
Fineco
2,170,955
34,658
GVS (1)
2,597,076
17,383
Interpump
Group
306,584
13,622
Technoprobe (1)(2)
2,345,741
15,928
Total
Italy
(Cost
$173,015)
228,691
T.
ROWE
PRICE
International
Discovery
Fund
Shares
$
Value
(Cost
and
value
in
$000s)
JAPAN 19.6%
Common
Stocks 19.6%
Aiful
19,715,900
41,430
Daicel
1,390,600
12,273
Daiei
Kankyo
1,316,400
27,152
Daiwabo
Holdings
1,496,700
26,943
Dexerials
946,600
14,452
eGuarantee
642,600
6,367
Eiken
Chemical
1,058,700
17,135
Fukuoka
Financial
Group
575,900
13,137
Fuso
Chemical
415,500
10,134
Hanwa
1,325,800
43,928
Hikari
Tsushin
144,500
29,165
Horiba
504,200
30,995
Idec
1,057,300
17,044
IHI
673,000
35,830
Konica
Minolta
8,828,200
36,853
Kyoritsu
Maintenance
340,000
5,459
METAWATER
1,394,700
16,137
Miura
1,699,300
39,680
Modec
1,023,400
22,284
Nakanishi
987,600
16,794
Nextage (2)
2,774,300
26,627
Nifco
1,291,500
30,003
Nippon
Seiki
2,659,100
20,791
Nippon
Soda
2,232,100
37,178
Nissan
Chemical
364,200
12,301
Niterra
1,220,900
34,602
Obara
Group (3)
1,460,000
40,408
Open
House
Group
351,200
12,946
Persol
Holdings
11,280,500
18,946
Rengo
3,764,000
22,798
Resorttrust
1,551,800
28,197
Round
One
2,612,900
16,537
Sakata
INX (3)
3,712,400
37,321
Sankyu
434,100
15,078
Sega
Sammy
Holdings
1,405,300
26,446
Shimizu
3,589,900
23,783
Sumitomo
Seika
Chemicals
504,400
16,747
Taiheiyo
Cement
2,214,500
48,243
Takashimaya
3,208,200
25,401
T.
ROWE
PRICE
International
Discovery
Fund
Shares
$
Value
(Cost
and
value
in
$000s)
Takeuchi
Manufacturing
471,300
14,687
Tokai
Carbon (2)
4,194,200
23,674
Tokyo
Century
1,649,300
16,780
Tokyo
Kiraboshi
Financial
Group
539,700
14,518
Tokyo
Seimitsu
352,800
18,984
Tokyo
Tatemono (2)
1,646,300
26,884
Toyo
Tire
3,045,200
43,205
TRYT (2)
5,890,900
14,405
Yamaha (2)
2,765,000
22,328
Yellow
Hat
813,900
13,266
Total
Japan
(Cost
$1,022,760)
1,166,276
LITHUANIA 0.4%
Common
Stocks 0.4%
Baltic
Classifieds
Group
(GBP)
5,862,993
23,918
Total
Lithuania
(Cost
$13,364)
23,918
MAURITIUS 0.3%
Common
Stocks 0.3%
Alphamin
Resources
(CAD) (2)
19,122,691
16,069
Total
Mauritius
(Cost
$14,585)
16,069
MEXICO 0.7%
Common
Stocks 0.7%
Corp.
Inmobiliaria
Vesta (2)
6,746,098
17,565
Corp.
Inmobiliaria
Vesta,
ADR
(USD)
162,396
4,232
Grupo
Aeroportuario
del
Sureste,
ADR
(USD)
65,558
17,654
Total
Mexico
(Cost
$28,471)
39,451
NETHERLANDS 1.1%
Common
Stocks 1.1%
Aalberts
487,175
17,580
IMCD
301,286
47,902
Total
Netherlands
(Cost
$20,130)
65,482
T.
ROWE
PRICE
International
Discovery
Fund
Shares
$
Value
(Cost
and
value
in
$000s)
NEW
ZEALAND 0.4%
Common
Stocks 0.4%
Fisher
&
Paykel
Healthcare
1,114,925
23,894
Total
New
Zealand
(Cost
$1,014)
23,894
NORWAY 1.9%
Common
Stocks 1.9%
Frontline (2)
954,769
18,461
Seadrill
(USD) (1)
313,196
12,324
Subsea
7
2,692,050
41,377
TGS
4,354,314
39,507
Total
Norway
(Cost
$131,326)
111,669
SLOVENIA 0.3%
Common
Stocks 0.3%
Nova
Ljubljanska
Banka,
GDR
631,858
16,900
Total
Slovenia
(Cost
$15,408)
16,900
SOUTH
KOREA 0.3%
Common
Stocks 0.3%
JYP
Entertainment
426,659
15,007
Total
South
Korea
(Cost
$16,431)
15,007
SPAIN 2.6%
Common
Stocks 2.6%
Aedas
Homes
956,874
27,320
Amadeus
IT
Group
534,916
38,778
Fluidra
1,074,572
29,044
Laboratorios
Farmaceuticos
Rovi
668,506
56,790
Total
Spain
(Cost
$80,784)
151,932
SWEDEN 2.5%
Common
Stocks 2.5%
Beijer
Ref (2)
1,418,470
21,367
Camurus (1)
410,839
23,103
Nordnet (2)
1,579,989
32,876
T.
ROWE
PRICE
International
Discovery
Fund
Shares
$
Value
(Cost
and
value
in
$000s)
Norva24
Group (1)
6,897,787
20,243
Sweco,
Class
B
1,107,446
18,721
Trelleborg,
Class
B
495,577
16,486
Troax
Group
754,333
15,329
Total
Sweden
(Cost
$117,189)
148,125
SWITZERLAND 2.1%
Common
Stocks 2.1%
ams-OSRAM (1)(2)
671,434
6,508
Bossard
Holding,
Class
A (2)
54,725
13,149
DKSH
Holding
490,967
35,075
Montana
Aerospace (1)
2,549,027
45,022
Sensirion
Holding (1)(2)
36,681
2,674
SKAN
Group
116,069
10,383
Tecan
Group
58,892
14,881
Total
Switzerland
(Cost
$149,000)
127,692
TAIWAN 0.3%
Common
Stocks 0.3%
Accton
Technology
922,000
15,493
Total
Taiwan
(Cost
$15,699)
15,493
UNITED
KINGDOM 10.2%
Common
Stocks 10.2%
Adriatic
Metals,
CDI
(AUD) (1)
13,792,115
38,547
Auction
Technology
Group (1)
4,954,964
28,775
Big
Yellow
Group
2,094,033
32,475
Bridgepoint
Group
7,471,970
30,227
Croda
International
1,076,909
51,674
Diploma
291,072
16,001
Genuit
Group
4,828,579
29,194
Genus
1,250,218
33,793
Helios
Towers (1)
16,765,031
22,868
Hiscox
2,108,219
29,313
Intermediate
Capital
Group
1,472,648
39,120
IQE (1)(2)(3)
64,350,632
9,905
Oxford
Nanopore
Technologies (1)
4,837,816
8,431
Persimmon
1,106,272
20,965
Renishaw
427,627
17,318
Rightmove
2,201,254
16,762
T.
ROWE
PRICE
International
Discovery
Fund
Shares
$
Value
(Cost
and
value
in
$000s)
Rotork
11,649,171
45,206
Spirax
Group
554,053
46,247
Syncona (1)
7,941,657
11,114
Watches
of
Switzerland
Group (1)
4,055,451
21,320
Weir
Group
1,182,992
31,858
YouGov
4,528,318
26,974
Total
United
Kingdom
(Cost
$560,324)
608,087
UNITED
STATES 0.3%
Common
Stocks 0.3%
Kosmos
Energy (1)
5,147,628
19,355
Total
United
States
(Cost
$31,938)
19,355
VIETNAM 2.3%
Common
Stocks 2.3%
Asia
Commercial
Bank
30,652,910
32,487
FPT
10,902,328
58,365
Hoa
Phat
Group (1)
29,795,040
31,608
Military
Commercial
Joint
Stock
Bank
15,901,200
16,754
Total
Vietnam
(Cost
$101,037)
139,214
SHORT-TERM
INVESTMENTS 2.6%
Money
Market
Funds 2.6%
T.
Rowe
Price
Government
Reserve
Fund,
4.86% (3)(4)
155,766,383
155,766
Total
Short-Term
Investments
(Cost
$155,766)
155,766
T.
ROWE
PRICE
International
Discovery
Fund
Shares
$
Value
(Cost
and
value
in
$000s)
SECURITIES
LENDING
COLLATERAL 3.2%
INVESTMENTS
IN
A
POOLED
ACCOUNT
THROUGH
SECURITIES
LENDING
PROGRAM
WITH
JPMORGAN
CHASE
BANK 3.2%
Money
Market
Funds 3.2%
T.
Rowe
Price
Government
Reserve
Fund,
4.86% (3)(4)
192,325,487
192,325
Total
Investments
in
a
Pooled
Account
through
Securities
Lending
Program
with
JPMorgan
Chase
Bank
192,325
Total
Securities
Lending
Collateral
(Cost
$192,325)
192,325
Total
Investments
in
Securities
102.1%
of
Net
Assets
(Cost
$5,050,256)
$
6,076,840
‡
Country
classifications
are
generally
based
on
MSCI
categories
or
another
unaffiliated
third
party
data
provider;
Shares
are
denominated
in
the
currency
of
the
country
presented
unless
otherwise
noted.
(1)
Non-income
producing
(2)
See
Note
3.
All
or
a
portion
of
this
security
is
on
loan
at
October
31,
2024.
(3)
Affiliated
Companies
(4)
Seven-day
yield
ADR
American
Depositary
Receipts
AUD
Australian
Dollar
CAD
Canadian
Dollar
CDI
CHESS
or
CREST
Depositary
Interest
CDR
China
Depositary
Receipt
CNH
Offshore
China
Renminbi
GBP
British
Pound
GDR
Global
Depositary
Receipts
HKD
Hong
Kong
Dollar
SGD
Singapore
Dollar
USD
U.S.
Dollar
T.
ROWE
PRICE
International
Discovery
Fund
The
accompanying
notes
are
an
integral
part
of
these
financial
statements.
AFFILIATED
COMPANIES
($000s)
The
fund
may
invest
in
certain
securities
that
are
considered
affiliated
companies.
As
defined
by
the
1940
Act,
an
affiliated
company
is
one
in
which
the
fund
owns
5%
or
more
of
the
outstanding
voting
securities,
or
a
company
that
is
under
common
ownership
or
control.
The
following
securities
were
considered
affiliated
companies
for
all
or
some
portion
of
the
year
ended
October
31,
2024.
Net
realized
gain
(loss),
investment
income,
change
in
net
unrealized
gain/loss,
and
purchase
and
sales
cost
reflect
all
activity
for
the
period
then
ended.
Affiliate
Net
Realized
Gain
(Loss)
Change
in
Net
Unrealized
Gain/Loss
Investment
Income
IQE
$
(6,153)
$
6,172
$
—
Nippon
Soda
1,072
(4,480)
1,732
Obara
Group
(217)
5,553
1,279
Sakata
INX
(654)
7,182
962
T.
Rowe
Price
Government
Reserve
Fund,
4.86%
—
—
2,903++
Affiliates
not
held
at
period
end
54,941
3,295
41,101
Totals
$
48,989#
$
17,722
$
47,977+
Supplementary
Investment
Schedule
Affiliate
Value
10/31/23
Purchase
Cost
Sales
Cost
Value
10/31/24
Ascential
$
111,644
$
—
$
129,501
$
—
IQE
12,059
—
8,326
9,905
Marcopolo
43,858
—
29,296
—
Nippon
Soda
53,725
—
12,067
*
Obara
Group
31,492
4,231
868
40,408
Sakata
INX
32,265
—
2,126
37,321
T.
Rowe
Price
Government
Reserve
Fund,
4.86%
130,552
¤
¤
348,091
Total
$
435,725^
#
Capital
gain
distributions
from
underlying
Price
funds
represented
$0
of
the
net
realized
gain
(loss).
++
Excludes
earnings
on
securities
lending
collateral,
which
are
subject
to
rebates
and
fees
as
described
in
Note
3.
+
Investment
income
comprised
$47,977
of
dividend
income
and
$0
of
interest
income.
¤
Purchase
and
sale
information
not
shown
for
cash
management
funds.
^
The
cost
basis
of
investments
in
affiliated
companies
was
$457,011.
*
On
the
date
indicated,
issuer
was
held
but
not
considered
an
affiliated
company.
T.
ROWE
PRICE
International
Discovery
Fund
October
31,
2024
Statement
of
Assets
and
Liabilities
($000s,
except
shares
and
per
share
amounts)
Assets
Investments
in
securities,
at
value
(cost
$5,050,256)
$
6,076,840
Receivable
for
investment
securities
sold
86,554
Dividends
receivable
15,693
Foreign
currency
(cost
$5,616)
5,596
Receivable
for
shares
sold
2,246
Cash
1
Other
assets
7,968
Total
assets
6,194,898
Liabilities
Obligation
to
return
securities
lending
collateral
192,325
Payable
for
investment
securities
purchased
12,675
Payable
for
shares
redeemed
5,698
Investment
management
fees
payable
5,491
Due
to
affiliates
87
Payable
to
directors
2
Other
liabilities
25,872
Total
liabilities
242,150
Commitments
and
Contingent
Liabilities
(note
6
)
NET
ASSETS
$
5,952,748
T.
ROWE
PRICE
International
Discovery
Fund
October
31,
2024
Statement
of
Assets
and
Liabilities
($000s,
except
shares
and
per
share
amounts)
The
accompanying
notes
are
an
integral
part
of
these
financial
statements.
Net
Assets
Consist
of:
Total
distributable
earnings
(loss)
$
1,151,234
Paid-in
capital
applicable
to
88,853,437
shares
of
$0.01
par
value
capital
stock
outstanding;
18,000,000,000
shares
of
the
Corporation
authorized
4,801,514
NET
ASSETS
$
5,952,748
NET
ASSET
VALUE
PER
SHARE
Investor
Class
(Net
assets:
$2,167,983;
Shares
outstanding:
32,454,065)
$
66.80
I
Class
(Net
assets:
$3,666,908;
Shares
outstanding:
54,673,083)
$
67.07
Z
Class
(Net
assets:
$117,857;
Shares
outstanding:
1,726,289)
$
68.27
T.
ROWE
PRICE
International
Discovery
Fund
Year
Ended
10/31/24
Investment
Income
(Loss)
Income
Dividend
(net
of
foreign
taxes
of
$7,893)
$
177,289
Securities
lending
1,729
Other
3
Total
income
179,021
Expenses
Investment
management
63,905
Shareholder
servicing
Investor
Class
$
3,885
I
Class
392
4,277
Prospectus
and
shareholder
reports
Investor
Class
475
I
Class
441
916
Custody
and
accounting
1,105
Legal
and
audit
129
Registration
103
Proxy
and
annual
meeting
59
Directors
21
Miscellaneous
338
Waived
/
paid
by
Price
Associates
(
1,473
)
Total
expenses
69,380
Net
investment
income
109,641
T.
ROWE
PRICE
International
Discovery
Fund
The
accompanying
notes
are
an
integral
part
of
these
financial
statements.
Year
Ended
10/31/24
Realized
and
Unrealized
Gain
/
Loss
–
Net
realized
gain
(loss)
Securities
(net
of
foreign
taxes
of
$7,151)
172,570
Foreign
currency
transactions
746
Net
realized
gain
173,316
Change
in
net
unrealized
gain
/
loss
Securities
(net
of
increase
in
deferred
foreign
taxes
of
$9,935)
1,063,607
Other
assets
and
liabilities
denominated
in
foreign
currencies
(
451
)
Change
in
net
unrealized
gain
/
loss
1,063,156
Net
realized
and
unrealized
gain
/
loss
1,236,472
INCREASE
IN
NET
ASSETS
FROM
OPERATIONS
$
1,346,113
T.
ROWE
PRICE
International
Discovery
Fund
Statement
of
Changes
in
Net
Assets
Year
.
.
.
.
.
.
.
.
.
.
.
.
.
.
Ended
.
.
.
.
.
.
.
.
.
.
.
.
.
.
10/31/24
10/31/23
Increase
(Decrease)
in
Net
Assets
Operations
Net
investment
income
$
109,641
$
61,812
Net
realized
gain
173,316
64,921
Change
in
net
unrealized
gain
/
loss
1,063,156
240,596
Increase
in
net
assets
from
operations
1,346,113
367,329
Distributions
to
shareholders
Net
earnings
Investor
Class
(
55,858
)
(
86,849
)
I
Class
(
79,486
)
(
104,031
)
Z
Class
(
4,206
)
(
4,042
)
Decrease
in
net
assets
from
distributions
(
139,550
)
(
194,922
)
Capital
share
transactions
*
Shares
sold
Investor
Class
214,125
242,609
I
Class
574,779
588,081
Z
Class
13,022
1,868
Distributions
reinvested
Investor
Class
53,982
84,420
I
Class
71,463
95,330
Z
Class
4,206
4,042
Shares
redeemed
Investor
Class
(
999,550
)
(
640,871
)
I
Class
(
763,092
)
(
853,276
)
Z
Class
(
44,106
)
(
14,250
)
Decrease
in
net
assets
from
capital
share
transactions
(
875,171
)
(
492,047
)
T.
ROWE
PRICE
International
Discovery
Fund
Statement
of
Changes
in
Net
Assets
The
accompanying
notes
are
an
integral
part
of
these
financial
statements.
Year
.
.
.
.
.
.
.
.
.
.
.
.
.
.
Ended
.
.
.
.
.
.
.
.
.
.
.
.
.
.
10/31/24
10/31/23
Net
Assets
Increase
(decrease)
during
period
331,392
(
319,640
)
Beginning
of
period
5,621,356
5,940,996
End
of
period
$
5,952,748
$
5,621,356
*Share
information
(000s)
Shares
sold
Investor
Class
3,386
4,076
I
Class
8,997
10,013
Z
Class
193
31
Distributions
reinvested
Investor
Class
882
1,451
I
Class
1,165
1,634
Z
Class
68
69
Shares
redeemed
Investor
Class
(
15,814
)
(
10,834
)
I
Class
(
11,803
)
(
14,279
)
Z
Class
(
658
)
(
237
)
Decrease
in
shares
outstanding
(
13,584
)
(
8,076
)
T.
ROWE
PRICE
International
Discovery
Fund
NOTES
TO
FINANCIAL
STATEMENTS
T.
Rowe
Price
International
Funds,
Inc. (the
corporation) is
registered
under
the
Investment
Company
Act
of
1940
(the
1940
Act).
The
International
Discovery
Fund
(the
fund)
is a
diversified, open-end
management
investment
company
established
by
the
corporation. The
fund
seeks long-term
growth
of
capital
through
investments
primarily
in
the
common
stocks
of
rapidly
growing,
small-
to
medium-sized
companies
outside
the
U.S.
The
fund
has three classes
of
shares:
the
International
Discovery
Fund
(Investor
Class),
the
International
Discovery
Fund–I
Class
(I
Class)
and
the
International
Discovery
Fund–Z
Class
(Z
Class).
I
Class
shares
require
a
$500,000
initial
investment
minimum,
although
the
minimum
generally
is
waived
or
reduced
for
financial
intermediaries,
eligible
retirement
plans,
and
certain
other
accounts.
The
Z
Class
is
only
available
to
funds
advised
by
T.
Rowe
Price
Associates,
Inc.
and
its
affiliates
and
other
clients
that
are
subject
to
a
contractual
fee
for
investment
management
services. Each
class
has
exclusive
voting
rights
on
matters
related
solely
to
that
class;
separate
voting
rights
on
matters
that
relate
to
all
classes;
and,
in
all
other
respects,
the
same
rights
and
obligations
as
the
other
classes.
NOTE
1
-
SIGNIFICANT
ACCOUNTING
POLICIES
Basis
of
Preparation
The fund
is
an
investment
company
and
follows
accounting
and
reporting
guidance
in
the
Financial
Accounting
Standards
Board
(FASB)
Accounting
Standards
Codification
Topic
946
(ASC
946).
The
accompanying
financial
statements
were
prepared
in
accordance
with
accounting
principles
generally
accepted
in
the
United
States
of
America
(GAAP),
including,
but
not
limited
to,
ASC
946.
GAAP
requires
the
use
of
estimates
made
by
management.
Management
believes
that
estimates
and
valuations
are
appropriate;
however,
actual
results
may
differ
from
those
estimates,
and
the
valuations
reflected
in
the
accompanying
financial
statements
may
differ
from
the
value
ultimately
realized
upon
sale
or
maturity.
Investment
Transactions,
Investment
Income,
and
Distributions
Investment
transactions
are
accounted
for
on
the
trade
date
basis.
Income
and
expenses
are
recorded
on
the
accrual
basis.
Realized
gains
and
losses
are
reported
on
the
identified
cost
basis. Income
tax-related
interest
and
penalties,
if
incurred,
are
recorded
as
income
tax
expense. Dividends
received
from other
investment
companies are
reflected
as
dividend income;
capital
gain
distributions
are
reflected
as
realized
gain/loss. Dividend
income and
capital
gain
distributions
are
recorded
on
the
ex-dividend
date. Non-cash
dividends,
if
any,
are
recorded
T.
ROWE
PRICE
International
Discovery
Fund
at
the
fair
market
value
of
the
asset
received. Proceeds
from
litigation
payments,
if
any,
are
included
in
either
net
realized
gain
(loss)
or
change
in
net
unrealized
gain/loss
from
securities. Distributions
to
shareholders
are
recorded
on
the
ex-dividend
date. Income
distributions,
if
any,
are
declared
and
paid
by
each
class annually. A
capital
gain
distribution,
if
any, may
also
be
declared
and
paid
by
the
fund
annually.
Currency
Translation
Assets,
including
investments,
and
liabilities
denominated
in
foreign
currencies
are
translated
into
U.S.
dollar
values
each
day
at
the
prevailing
exchange
rate,
using
the
mean
of
the
bid
and
asked
prices
of
such
currencies
against
U.S.
dollars
as
provided
by
an
outside
pricing
service.
Purchases
and
sales
of
securities,
income,
and
expenses
are
translated
into
U.S.
dollars
at
the
prevailing
exchange
rate
on
the
respective
date
of
such
transaction.
The
effect
of
changes
in
foreign
currency
exchange
rates
on
realized
and
unrealized
security
gains
and
losses
is
not
bifurcated
from
the
portion
attributable
to
changes
in
market
prices.
Class
Accounting
Shareholder
servicing,
prospectus,
and
shareholder
report
expenses
incurred
by
each
class
are
charged
directly
to
the
class
to
which
they
relate.
Expenses
common
to
all
classes,
investment
income,
and
realized
and
unrealized
gains
and
losses
are
allocated
to
the
classes
based
upon
the
relative
daily
net
assets
of
each
class.
Capital
Transactions
Each
investor’s
interest
in
the
net
assets
of the
fund
is
represented
by
fund
shares. The
fund’s
net
asset
value
(NAV)
per
share
is
computed
at
the
close
of
the
New
York
Stock
Exchange
(NYSE),
normally
4
p.m.
Eastern
time,
each
day
the
NYSE
is
open
for
business.
However,
the
NAV
per
share
may
be
calculated
at
a
time
other
than
the
normal
close
of
the
NYSE
if
trading
on
the
NYSE
is
restricted,
if
the
NYSE
closes
earlier,
or
as
may
be
permitted
by
the
SEC.
Purchases
and
redemptions
of
fund
shares
are
transacted
at
the
next-computed
NAV
per
share,
after
receipt
of
the
transaction
order
by
T.
Rowe
Price
Associates,
Inc.,
or
its
agents.
New
Accounting
Guidance
In
November
2023,
the
FASB
issued
Accounting
Standards
Update
(ASU),
ASU
2023-07,
Segment
Reporting
(Topic
280)
–
Improvements
to
Reportable
Segment
Disclosures,
which
improves
reportable
segment
disclosure
requirements,
primarily
through
enhanced
disclosures
about
segment
expenses.
In
addition,
the
ASU
clarifies
that
a
public
entity
with
a
single
reportable
segment
provide
all
disclosures
required
by
the
ASU
and
all
existing
segment
disclosures
in
Topic
280.
The
amendments
under
this
ASU
T.
ROWE
PRICE
International
Discovery
Fund
are
effective
for
fiscal
years
beginning
after
December
15,
2023.
Management
expects
that
adoption
of
the
guidance
will
not
have
a
material
impact
on
the
fund’s
financial
statements.
Indemnification
In
the
normal
course
of
business, the
fund
may
provide
indemnification
in
connection
with
its
officers
and
directors,
service
providers,
and/or
private
company
investments. The
fund’s
maximum
exposure
under
these
arrangements
is
unknown;
however,
the
risk
of
material
loss
is
currently
considered
to
be
remote.
NOTE
2
-
VALUATION
Fair
Value
The
fund’s
financial
instruments
are
valued
at
the
close
of
the
NYSE
and
are
reported
at
fair
value,
which
GAAP
defines
as
the
price
that
would
be
received
to
sell
an
asset
or
paid
to
transfer
a
liability
in
an
orderly
transaction
between
market
participants
at
the
measurement
date. The fund’s
Board
of
Directors
(the
Board)
has
designated
T.
Rowe
Price
Associates,
Inc.
as
the
fund’s
valuation
designee
(Valuation
Designee).
Subject
to
oversight
by
the
Board,
the
Valuation
Designee
performs
the
following
functions
in
performing
fair
value
determinations:
assesses
and
manages
valuation
risks;
establishes
and
applies
fair
value
methodologies;
tests
fair
value
methodologies;
and
evaluates
pricing
vendors
and
pricing
agents.
The
duties
and
responsibilities
of
the
Valuation
Designee
are
performed
by
its
Valuation
Committee. The
Valuation
Designee provides
periodic
reporting
to
the
Board
on
valuation
matters.
Various
valuation
techniques
and
inputs
are
used
to
determine
the
fair
value
of
financial
instruments.
GAAP
establishes
the
following
fair
value
hierarchy
that
categorizes
the
inputs
used
to
measure
fair
value:
Level
1
–
quoted
prices
(unadjusted)
in
active
markets
for
identical
financial
instruments
that
the
fund
can
access
at
the
reporting
date
Level
2
–
inputs
other
than
Level
1
quoted
prices
that
are
observable,
either
directly
or
indirectly
(including,
but
not
limited
to,
quoted
prices
for
similar
financial
instruments
in
active
markets,
quoted
prices
for
identical
or
similar
financial
instruments
in
inactive
markets,
interest
rates
and
yield
curves,
implied
volatilities,
and
credit
spreads)
Level
3
–
unobservable
inputs
(including
the Valuation
Designee’s assumptions
in
determining
fair
value)
T.
ROWE
PRICE
International
Discovery
Fund
Observable
inputs
are
developed
using
market
data,
such
as
publicly
available
information
about
actual
events
or
transactions,
and
reflect
the
assumptions
that
market
participants
would
use
to
price
the
financial
instrument.
Unobservable
inputs
are
those
for
which
market
data
are
not
available
and
are
developed
using
the
best
information
available
about
the
assumptions
that
market
participants
would
use
to
price
the
financial
instrument.
GAAP
requires
valuation
techniques
to
maximize
the
use
of
relevant
observable
inputs
and
minimize
the
use
of
unobservable
inputs.
When
multiple
inputs
are
used
to
derive
fair
value,
the
financial
instrument
is
assigned
to
the
level
within
the
fair
value
hierarchy
based
on
the
lowest-level
input
that
is
significant
to
the
fair
value
of
the
financial
instrument.
Input
levels
are
not
necessarily
an
indication
of
the
risk
or
liquidity
associated
with
financial
instruments
at
that
level
but
rather
the
degree
of
judgment
used
in
determining
those
values.
Valuation
Techniques
Equity
securities,
including
exchange-traded
funds, listed
or
regularly
traded
on
a
securities
exchange
or
in
the
over-the-
counter
(OTC)
market
are
valued
at
the
last
quoted
sale
price
or,
for
certain
markets,
the
official
closing
price
at
the
time
the
valuations
are
made.
OTC
Bulletin
Board
securities
are
valued
at
the
mean
of
the
closing
bid
and
asked
prices.
A
security
that
is
listed
or
traded
on
more
than
one
exchange
is
valued
at
the
quotation
on
the
exchange
determined
to
be
the
primary
market
for
such
security.
Listed
securities
not
traded
on
a
particular
day
are
valued
at
the
mean
of
the
closing
bid
and
asked
prices
for
domestic
securities
and
the
last
quoted
sale
or
closing
price
for
international
securities.
The
last
quoted
prices
of
non-U.S.
equity
securities
may
be
adjusted
to
reflect
the
fair
value
of
such
securities
at
the
close
of
the
NYSE,
if
the Valuation
Designee
determines
that
developments
between
the
close
of
a
foreign
market
and
the
close
of
the
NYSE
will
affect
the
value
of
some
or
all
of
the
fund’s portfolio
securities.
Each
business
day,
the
Valuation
Designee uses
information
from
outside
pricing
services
to
evaluate
the
quoted
prices
of
portfolio
securities
and,
if
appropriate,
decide whether
it
is
necessary
to
adjust
quoted
prices
to
reflect
fair
value
by
reviewing
a
variety
of
factors,
including
developments
in
foreign
markets,
the
performance
of
U.S.
securities
markets,
and
the
performance
of
instruments
trading
in
U.S.
markets
that
represent
foreign
securities
and
baskets
of
foreign
securities. The Valuation
Designee
uses
outside
pricing
services
to
provide
it
with
quoted
prices
and
information
to
evaluate
or
adjust
those
prices.
The Valuation
Designee
cannot
predict
how
often
it
will
use
quoted
prices
and
how
often
it
will
determine
it
necessary
to
adjust
those
prices
to
reflect
fair
value.
T.
ROWE
PRICE
International
Discovery
Fund
Investments
in
mutual
funds
are
valued
at
the
mutual
fund’s
closing
NAV
per
share
on
the
day
of
valuation.
Assets
and
liabilities
other
than
financial
instruments,
including
short-term
receivables
and
payables,
are
carried
at
cost,
or
estimated
realizable
value,
if
less,
which
approximates
fair
value.
Investments
for
which
market
quotations are
not
readily
available
or
deemed
unreliable
are
valued
at
fair
value
as
determined
in
good
faith
by
the
Valuation
Designee.
The
Valuation
Designee
has
adopted
methodologies
for
determining
the
fair
value
of
investments
for
which
market
quotations
are
not
readily
available
or
deemed
unreliable,
including
the
use
of
other
pricing
sources.
Factors
used
in
determining
fair
value
vary
by
type
of
investment
and
may
include
market
or
investment
specific
considerations.
The
Valuation
Designee typically
will
afford
greatest
weight
to
actual
prices
in
arm’s
length
transactions,
to
the
extent
they
represent
orderly
transactions
between
market
participants,
transaction
information
can
be
reliably
obtained,
and
prices
are
deemed
representative
of
fair
value.
However,
the
Valuation
Designee may
also
consider
other
valuation
methods
such
as
market-based
valuation
multiples;
a
discount
or
premium
from
market
value
of
a
similar,
freely
traded
security
of
the
same
issuer;
discounted
cash
flows;
yield
to
maturity;
or
some
combination.
Fair
value
determinations
are
reviewed
on
a
regular
basis.
Because
any
fair
value
determination
involves
a
significant
amount
of
judgment,
there
is
a
degree
of
subjectivity
inherent
in
such
pricing
decisions. Fair
value
prices
determined
by
the
Valuation
Designee could
differ
from
those
of
other
market
participants,
and
it
is
possible
that
the
fair
value
determined
for
a
security
may
be
materially
different
from
the
value
that
could
be
realized
upon
the
sale
of
that
security.
T.
ROWE
PRICE
International
Discovery
Fund
Valuation
Inputs
The
following
table
summarizes
the
fund’s
financial
instruments,
based
on
the
inputs
used
to
determine
their
fair
values
on
October
31,
2024
(for
further
detail
by
category,
please
refer
to
the
accompanying
Portfolio
of
Investments):
NOTE
3
-
OTHER
INVESTMENT
TRANSACTIONS
Consistent
with
its
investment
objective, the
fund
engages
in
the
following
practices
to
manage
exposure
to
certain
risks
and/or
to
enhance
performance.
The
investment
objective,
policies,
program,
and
risk
factors
of the
fund
are
described
more
fully
in the
fund’s prospectus
and
Statement
of
Additional
Information.
Emerging
and
Frontier
Markets
The fund
invests,
either
directly
or
through
investments
in
other
T.
Rowe
Price
funds,
in
securities
of
companies
located
in,
issued
by
governments
of,
or
denominated
in
or
linked
to
the
currencies
of
emerging
and
frontier
market
countries.
Emerging
markets,
and
to
a
greater
extent
frontier
markets, tend
to
have
economic
structures
that
are
less
diverse
and
mature,
less
developed
legal
and
regulatory
regimes,
and
political
systems
that
are
less
stable,
than
those
of
developed
countries.
These
markets
may
be
subject
to
greater
political,
economic,
and
social
uncertainty
and
differing
accounting
standards
and
regulatory
environments
that
may
potentially
impact
the
fund’s
ability
to
buy
or
sell
certain
securities
or
repatriate
proceeds
to
U.S.
dollars.
Emerging
markets
securities
exchanges
are
more
likely
to
experience
delays
with
the
clearing
and
settling
of
trades,
as
well
as
the
custody
of
holdings
by
local
banks,
agents,
and
depositories.
Such
securities
are
often
subject
($000s)
Level
1
Level
2
Level
3
Total
Value
Assets
Common
Stocks
$
245,705
$
5,483,044
$
—
$
5,728,749
Preferred
Stocks
—
—
—
—
Short-Term
Investments
155,766
—
—
155,766
Securities
Lending
Collateral
192,325
—
—
192,325
Total
$
593,796
$
5,483,044
$
—
$
6,076,840
T.
ROWE
PRICE
International
Discovery
Fund
to
greater
price
volatility,
less
liquidity,
and
higher
rates
of
inflation
than
U.S.
securities.
Investing
in
frontier
markets
is
typically
significantly
riskier
than
investing
in
other
countries,
including
emerging
markets.
China
A
Shares
The
fund
invests
in
certain
Chinese
equity
securities
(A
shares)
that
have
limited
availability
to
investors
outside
of
China.
The
fund
gains
access
to
the
A
share
market
through
the
Shanghai-Hong
Kong
Stock
Connect
program
(Shanghai
Stock
Connect),
through
the
Shenzhen-Hong
Kong
Stock
Connect
program
(Shenzhen
Stock
Connect),
or
through
a
wholly
owned
subsidiary
of
Price
Associates,
which
serves
as
the
registered
Qualified
Foreign
Institutional
Investor
(QFII)
for
all
participating
T.
Rowe
Price-sponsored
products
(each
a
participating
account).
Related
to
A
shares
held
through
the
QFII,
investment
decisions
are
specific
to
each
participating
account,
and
each
account
bears
the
economic
consequences
of
its
holdings
and
transactions
in
A
shares.
Further,
the
fund’s
ability
to
repatriate
cash
associated
with
its
A
shares
held
through
the
QFII
is
subject
to
certain
restrictions
and
administrative
processes
involving
the
Chinese
government;
consequently,
the
fund
may
experience
substantial
delays
in
gaining
access
to
its
assets
or
incur
a
loss
of
value
in
the
event
of
noncompliance
with
governmental
requirements.
A
shares
acquired
through
the
QFII
are
valued
using
the
onshore
renminbi
exchange
rate
(CNY),
and
those
acquired
through
the
Shanghai
Stock
Connect
and
the
Shenzhen
Stock
Connect
are
valued
using
the
offshore
renminbi
exchange
rate
(CNH).
CNY
and
CNH
exchange
rates
may
differ;
accordingly,
A
shares
of
the
same
issue
purchased
through
different
channels
may
not
have
the
same
U.S.
dollar
value.
Generally,
the
fund
is
not
subject
to
capital
gains
tax
in
China
related
to
its
A
share
investments
through
the
QFII
(pursuant
to
a
temporary
exemption
from
tax
on
gains
derived
from
the
sale
or
disposition
of
equity
investments,
including
A
shares,
via
a
QFII).
Securities
Lending
The fund
may
lend
its
securities
to
approved
borrowers
to
earn
additional
income.
Its
securities
lending
activities
are
administered
by
a
lending
agent
in
accordance
with
a
securities
lending
agreement.
Security
loans
generally
do
not
have
stated
maturity
dates,
and
the
fund
may
recall
a
security
at
any
time.
The
fund
receives
collateral
in
the
form
of
cash
or
U.S.
government
securities.
Collateral
is
maintained
over
the
life
of
the
loan
in
an
amount
not
less
than
the
value
of
loaned
securities;
any
additional
collateral
required
due
to
changes
in
security
values
is
delivered
to
the
fund
the
next
business
day.
Cash
collateral
is
invested
in
accordance
with
investment
guidelines
approved
by
fund
management.
Additionally,
the
lending
agent
indemnifies
the
fund
against
losses
resulting
from
borrower
default.
Although
risk
is
mitigated
by
the
collateral
and
indemnification,
the
fund
could
experience
a
delay
in
recovering
its
T.
ROWE
PRICE
International
Discovery
Fund
securities
and
a
possible
loss
of
income
or
value
if
the
borrower
fails
to
return
the
securities,
collateral
investments
decline
in
value,
and
the
lending
agent
fails
to
perform.
Securities
lending
revenue
consists
of
earnings
on
invested
collateral
and
borrowing
fees,
net
of
any
rebates
to
the
borrower,
compensation
to
the
lending
agent,
and
other
administrative
costs.
In
accordance
with
GAAP,
investments
made
with
cash
collateral
are
reflected
in
the
accompanying
financial
statements,
but
collateral
received
in
the
form
of
securities
is
not.
At
October
31,
2024,
the
value
of
loaned
securities
was
$182,465,000;
the
value
of
cash
collateral
and
related
investments
was
$192,325,000.
Other
Purchases
and
sales
of
portfolio
securities
other
than
in-kind
transactions,
if
any,
and short-term securities
aggregated $1,774,226,000 and
$2,773,786,000,
respectively,
for
the
year ended
October
31,
2024.
NOTE
4
-
FEDERAL
INCOME
TAXES
Generally,
no
provision
for
federal
income
taxes
is
required
since
the
fund
intends
to continue
to
qualify
as
a
regulated
investment
company
under
Subchapter
M
of
the
Internal
Revenue
Code
and
distribute
to
shareholders
all
of
its taxable
income
and
gains.
Distributions
determined
in
accordance
with
federal
income
tax
regulations
may
differ
in
amount
or
character
from
net
investment
income
and
realized
gains
for
financial
reporting
purposes.
The
fund
files
U.S.
federal,
state,
and
local
tax
returns
as
required.
The
fund’s
tax
returns
are
subject
to
examination
by
the
relevant
tax
authorities
until
expiration
of
the
applicable
statute
of
limitations,
which
is
generally
three
years
after
the
filing
of
the
tax
return
but
which
can
be
extended
to
six
years
in
certain
circumstances.
Tax
returns
for
open
years
have
incorporated
no
uncertain
tax
positions
that
require
a
provision
for
income
taxes.
Capital
accounts
within
the
financial
reporting
records
are
adjusted
for
permanent
book/tax
differences
to
reflect
tax
character
but
are
not
adjusted
for
temporary
differences.
The
permanent
book/tax
adjustments,
if
any,
have
no
impact
on
results
of
operations
or
net
assets.
The
permanent
book/
tax
adjustments
relate
primarily
to
deemed
distributions
on
shareholder
redemptions,
the
character
of
income
on
passive
foreign
investment
companies
and
the
character
of
foreign
capital
gains
taxes.
T.
ROWE
PRICE
International
Discovery
Fund
The
tax
character
of
distributions
paid
for
the
periods
presented
was
as
follows:
At
October
31,
2024,
the
tax-basis
cost
of
investments
(including
derivatives,
if
any)
and
gross
unrealized
appreciation
and
depreciation
were as
follows:
At
October
31,
2024,
the
tax-basis
components
of
accumulated
net
earnings
(loss)
were
as
follows:
Temporary
differences
between
book-basis
and
tax-basis
components
of
total
distributable
earnings
(loss)
arise
when
certain
items
of
income,
gain,
or
loss
are
recognized
in
different
periods
for
financial
statement
purposes
versus
for
tax
purposes;
these
differences
will
reverse
in
a
subsequent
reporting
period.
The
temporary
differences
relate
primarily
to
the
deferral
of
losses
from
wash
sales
and
the
realization
of
gains/losses
on
passive
foreign
investment
companies.
($000s)
October
31,
2024
October
31,
2023
Ordinary
income
(including
short-term
capital
gains,
if
any)
$
104,167
$
—
Long-term
capital
gain
35,383
194,922
Total
distributions
$
139,550
$
194,922
($000s)
Cost
of
investments
$
5,130,931
Unrealized
appreciation
$
1,686,352
Unrealized
depreciation
(766,154)
Net
unrealized
appreciation
(depreciation)
$
920,198
($000s)
Undistributed
ordinary
income
$
139,870
Undistributed
long-term
capital
gain
91,166
Net
unrealized
appreciation
(depreciation)
920,198
Total
distributable
earnings
(loss)
$
1,151,234
T.
ROWE
PRICE
International
Discovery
Fund
NOTE
5
-
FOREIGN TAXES
The
fund
is
subject
to
foreign
income
taxes
imposed
by
certain
countries
in
which
it
invests.
Additionally,
capital
gains
realized
upon
disposition
of
securities
issued
in
or
by
certain
foreign
countries
are
subject
to
capital
gains
tax
imposed
by
those
countries.
All
taxes
are
computed
in
accordance
with
the
applicable
foreign
tax
law,
and,
to
the
extent
permitted,
capital
losses
are
used
to
offset
capital
gains.
Taxes
attributable
to
income
are
accrued
by
the
fund
as
a
reduction
of
income.
Current
and
deferred
tax
expense
attributable
to
capital
gains
is
reflected
as
a
component
of
realized
or
change
in
unrealized
gain/
loss
on
securities
in
the
accompanying
financial
statements.
To
the
extent
that
the
fund
has
country
specific
capital
loss
carryforwards,
such
carryforwards
are
applied
against
net
unrealized
gains
when
determining
the
deferred
tax
liability.
Any
deferred
tax
liability
incurred
by
the
fund
is
included
in
either
Other
liabilities
or
Deferred
tax
liability
on
the
accompanying
Statement
of
Assets
and
Liabilities.
NOTE
6
-
RELATED
PARTY
TRANSACTIONS
The
fund
is
managed
by
T.
Rowe
Price
Associates,
Inc.
(Price
Associates),
a
wholly
owned
subsidiary
of
T.
Rowe
Price
Group,
Inc.
(Price
Group). Price
Associates
has
entered
into
a
sub-advisory
agreement(s)
with
one
or
more
of
its
wholly
owned
subsidiaries,
to
provide
investment
advisory
services
to
the
fund.
The
investment
management
agreement
between
the
fund
and
Price
Associates
provides
for
an
annual
investment
management
fee,
which
is
computed
daily
and
paid
monthly. The
fee
consists
of
an
individual
fund
fee,
equal
to
0.75%
of
the
fund’s
average
daily
net
assets,
and
a
group
fee.
The
group
fee
rate
is
calculated
based
on
the
combined
net
assets
of
certain
mutual
funds
sponsored
by
Price
Associates
(the
group)
applied
to
a
graduated
fee
schedule,
with
rates
ranging
from
0.48%
for
the
first
$1
billion
of
assets
to
0.260%
for
assets
in
excess
of
$845
billion.
The
fund’s
group
fee
is
determined
by
applying
the
group
fee
rate
to
the
fund’s
average
daily
net
assets. At
October
31,
2024,
the
effective
annual
group
fee
rate
was
0.28%.
The Investor
Class is
subject
to
a
contractual
expense
limitation
through
the
expense
limitation
date
indicated
in
the
table
below.
This
agreement
will
continue
through
the
expense
limitation
date
indicated
in
the
table
below,
and
may
be
renewed,
revised,
or
revoked
only
with
approval
of
the
fund’s
Board.
During
the
limitation
period,
Price
Associates
is required
to
waive
or
pay
any
expenses
(excluding
interest;
expenses
related
to
borrowings,
taxes,
and
T.
ROWE
PRICE
International
Discovery
Fund
brokerage;
non-recurring,
extraordinary
expenses;
and
acquired
fund
fees
and
expenses)
that
would
otherwise
cause
the class’s ratio
of
annualized
total
expenses
to
average
net
assets
(net
expense
ratio)
to
exceed
its
expense
limitation.
The
class
is
required
to
repay
Price
Associates
for
expenses
previously
waived/paid
to
the
extent
the
class’s net
assets
grow
or
expenses
decline
sufficiently
to
allow
repayment
without
causing
the class’s net
expense
ratio
(after
the
repayment
is
taken
into
account)
to
exceed
the
lesser
of:
(1)
the
expense
limitation
in
place
at
the
time
such
amounts
were
waived;
or
(2)
the class’s
current
expense
limitation.
However,
no
repayment
will
be
made
more
than
three
years
after
the
date
of
a
payment
or
waiver.
The
I
Class
is
also
subject
to
an
operating
expense
limitation
(I
Class
Limit)
pursuant
to
which
Price
Associates
is
contractually
required
to
pay
all
operating
expenses
of
the
I
Class,
excluding
management
fees;
interest;
expenses
related
to
borrowings,
taxes,
and
brokerage; non-recurring,
extraordinary expenses; and
acquired
fund
fees
and
expenses, to
the
extent
such
operating
expenses,
on
an
annualized
basis,
exceed
the
I
Class
Limit. This
agreement
will
continue
through
the
expense
limitation
date
indicated
in
the
table
below,
and
may
be
renewed,
revised,
or
revoked
only
with
approval
of
the
fund’s
Board.
The
I
Class
is
required
to
repay
Price
Associates
for
expenses
previously
paid
to
the
extent
the
class’s
net
assets
grow
or
expenses
decline
sufficiently
to
allow
repayment
without
causing
the
class’s
operating
expenses
(after
the
repayment
is
taken
into
account)
to
exceed
the
lesser
of:
(1)
the
I
Class
Limit
in
place
at
the
time
such
amounts
were
paid;
or
(2)
the
current
I
Class
Limit.
However,
no
repayment
will
be
made
more
than
three
years
after
the
date
of
a
payment
or
waiver.
The
Z
Class
is
also
subject
to
a
contractual
expense
limitation
agreement
whereby
Price
Associates
has
agreed
to
waive
and/or
bear
all
of
the
Z
Class’
expenses
(excluding
interest;
expenses
related
to
borrowings,
taxes,
and
brokerage;
non-recurring,
extraordinary
expenses;
and
acquired
fund
fees
and
expenses)
in
their
entirety.
This
fee
waiver
and/or
expense
reimbursement
arrangement
is
expected
to
remain
in
place
indefinitely,
and
the
agreement
may
only
be
amended
or
terminated
with
approval
by
the
fund’s
Board.
Expenses
of
the
fund
waived/paid
by
the
manager
are
not
subject
to
later
repayment
by
the
fund.
Pursuant
to
these
agreements,
expenses
were waived/paid
by
and/or
repaid
to
Price
Associates
during
the year
ended October
31,
2024 as
indicated
in
the
table
below.
Including
these
amounts,
expenses
previously
waived/paid
by
Price
Associates
in
the
amount
of $34,000 remain
subject
to
repayment
by
the
fund
at
T.
ROWE
PRICE
International
Discovery
Fund
October
31,
2024. Any
repayment
of
expenses
previously
waived/paid
by
Price
Associates
during
the
period
would
be
included
in
the
net
investment
income
and
expense
ratios
presented
on
the
accompanying
Financial
Highlights.
In
addition,
the
fund
has
entered
into
service
agreements
with
Price
Associates
and
two
wholly
owned
subsidiaries
of
Price
Associates,
each
an
affiliate
of
the
fund
(collectively,
Price).
Price
Associates
provides
certain
accounting
and
administrative
services
to
the
fund.
T.
Rowe
Price
Services,
Inc.
provides
shareholder
and
administrative
services
in
its
capacity
as
the
fund’s
transfer
and
dividend-disbursing
agent.
T.
Rowe
Price
Retirement
Plan
Services,
Inc.
provides
subaccounting
and
recordkeeping
services
for
certain
retirement
accounts
invested
in
the
Investor
Class.
For
the
year
ended
October
31,
2024,
expenses
incurred
pursuant
to
these
service
agreements
were
$119,000
for
Price
Associates;
$1,596,000
for
T.
Rowe
Price
Services,
Inc.;
and
$139,000
for
T.
Rowe
Price
Retirement
Plan
Services,
Inc.
All
amounts
due
to
and
due
from
Price,
exclusive
of
investment
management
fees
payable,
are
presented
net
on
the
accompanying
Statement
of
Assets
and
Liabilities.
T.
Rowe
Price
Investment
Services,
Inc.
(Investment
Services)
serves
as
distributor
to
the
fund.
Pursuant
to
an
underwriting
agreement,
no
compensation
for
any
distribution
services
provided
is
paid
to
Investment
Services
by
the
fund
(except
for
12b-1
fees
under
a
Board-approved
Rule
12b-1
plan).
Mutual
funds,
trusts,
and
other
accounts
managed
by
Price
Associates
or
its
affiliates
(collectively,
Price
Funds
and
accounts)
may
invest
in
the
fund.
No
Price
fund
or
account
may
invest
for
the
purpose
of
exercising
management
or
control
over
the
fund.
At
October
31,
2024, 100%
of
the
Z
Class's
outstanding
shares
were
held
by
Price
Funds
and
accounts.
The fund
may
invest
its
cash
reserves
in
certain
open-end
management
investment
companies
managed
by
Price
Associates
and
considered
affiliates
of
the
fund:
the
T.
Rowe
Price
Government
Reserve
Fund
or
the
T.
Rowe
Price
Treasury
Reserve
Fund,
organized
as
money
market
funds
(together,
the
Price
Reserve
Funds).
The
Price
Reserve
Funds
are
offered
as
short-term
investment
Investor
Class
I
Class
Z
Class
Expense
limitation/I
Class
Limit
1.39%
0.05%
0.00%
Expense
limitation
date
02/28/26
02/28/26
N/A
(Waived)/repaid
during
the
period
($000s)
$—
$(35)
$(1,438)
T.
ROWE
PRICE
International
Discovery
Fund
options
to
mutual
funds,
trusts,
and
other
accounts
managed
by
Price
Associates
or
its
affiliates
and
are
not
available
for
direct
purchase
by
members
of
the
public.
Cash
collateral
from
securities
lending,
if
any,
is
invested
in
the
T.
Rowe
Price
Government
Reserve Fund. The
Price
Reserve
Funds
pay
no
investment
management
fees.
The fund may
participate
in
securities
purchase
and
sale
transactions
with
other
funds
or
accounts
advised
by
Price
Associates
(cross
trades),
in
accordance
with
procedures
adopted
by the
fund’s
Board
and
Securities
and
Exchange
Commission
rules,
which
require,
among
other
things,
that
such
purchase
and
sale
cross
trades
be
effected
at
the
independent
current
market
price
of
the
security.
During
the
year
ended
October
31,
2024,
the
aggregate
value
of
purchases
and
sales
cross
trades
with
other
funds
or
accounts
advised
by
Price
Associates
was
less
than
1%
of
the
fund’s
net
assets
as
of
October
31,
2024.
NOTE
7
-
BORROWING
To
provide
temporary
liquidity,
the
fund
may
borrow
from
other
T.
Rowe
Price-
sponsored
mutual
funds
under
an
interfund
borrowing
program
developed
and
managed
by
Price
Associates.
The
program
permits
the
borrowing
and
lending
of
cash
at
rates
beneficial
to
both
the
borrowing
and
lending
funds.
Pursuant
to
program
guidelines,
loans
totaling
10%
or
more
of
a
borrowing
fund’s
total
assets
require
collateralization
at
102%
of
the
value
of
the
loan;
loans
of
less
than
10%
are
unsecured.
During
the
year ended
October
31,
2024,
the
fund
incurred
$4,000
in
interest
expense
related
to
outstanding
borrowings
on
two
days
in
the
average
amount
of
$10,850,000
and
at
an
average
annual
rate
of
6.92%.
At
October
31,
2024,
there
were
no
borrowings
outstanding.
NOTE
8
-
OTHER
MATTERS
Unpredictable environmental,
political,
social
and
economic
events,
including
but
not
limited
to,
environmental
or
natural
disasters,
war
and
conflict
(including
Russia’s
military
invasion
of
Ukraine
and
the
conflict
in
Israel,
Gaza
and
surrounding
areas),
terrorism,
geopolitical
developments
(including
trading
and
tariff
arrangements,
sanctions
and
cybersecurity
attacks),
and
public
health
epidemics
(including
the
global
outbreak
of
COVID-19)
and
similar
public
health
threats,
may
significantly
affect
the
economy
and
the
markets
and
issuers
in
which
a
fund
invests.
The
extent
and
duration
of
such
events
and
resulting
market
disruptions
cannot
be
predicted.
These
and
other
similar
events
T.
ROWE
PRICE
International
Discovery
Fund
may
cause
instability
across
global
markets,
including
reduced
liquidity
and
disruptions
in
trading
markets,
while
some
events
may
affect
certain
geographic
regions,
countries,
sectors,
and
industries
more
significantly
than
others,
and
exacerbate
other
pre-existing
political,
social,
and
economic
risks.
The
fund’s
performance
could
be
negatively
impacted
if
the
value
of
a
portfolio
holding
were
harmed
by
these
or
such
events.
Management
actively
monitors
the
risks
and
financial
impacts
arising
from
such
events.
T.
ROWE
PRICE
International
Discovery
Fund
REPORT
OF
INDEPENDENT
REGISTERED
PUBLIC
ACCOUNTING
FIRM
To
the
Board
of
Directors
of
T.
Rowe
Price
International
Funds,
Inc.
and
Shareholders
of
T.
Rowe
Price
International
Discovery
Fund
Opinion
on
the
Financial
Statements
We
have
audited
the
accompanying
statement
of
assets
and
liabilities,
including
the
portfolio
of
investments,
of
T.
Rowe
Price
International
Discovery
Fund
(one
of
the
funds
constituting
T.
Rowe
Price
International
Funds,
Inc.,
referred
to
hereafter
as
the
"Fund")
as
of
October
31,
2024,
the
related
statement
of
operations
for
the
year
ended
October
31,
2024,
the
statement
of
changes
in
net
assets
for
each
of
the
two
years
in
the
period
ended
October
31,
2024,
including
the
related
notes,
and
the
financial
highlights
for
each
of
the
periods
indicated
therein
(collectively
referred
to
as
the
“financial
statements”).
In
our
opinion,
the
financial
statements
present
fairly,
in
all
material
respects,
the
financial
position
of
the
Fund
as
of
October
31,
2024,
the
results
of
its
operations
for
the
year
then
ended,
the
changes
in
its
net
assets
for
each
of
the
two
years
in
the
period
ended
October
31,
2024
and
the
financial
highlights
for
each
of
the
periods
indicated
therein,
in
conformity
with
accounting
principles
generally
accepted
in
the
United
States
of
America.
Basis
for
Opinion
These
financial
statements
are
the
responsibility
of
the
Fund’s
management.
Our
responsibility
is
to
express
an
opinion
on
the
Fund’s
financial
statements
based
on
our
audits.
We
are
a
public
accounting
firm
registered
with
the
Public
Company
Accounting
Oversight
Board
(United
States)
(PCAOB)
and
are
required
to
be
independent
with
respect
to
the
Fund
in
accordance
with
the
U.S.
federal
securities
laws
and
the
applicable
rules
and
regulations
of
the
Securities
and
Exchange
Commission
and
the
PCAOB.
We
conducted
our
audits
of
these
financial
statements
in
accordance
with
the
standards
of
the
PCAOB.
Those
standards
require
that
we
plan
and
perform
the
audit
to
obtain
reasonable
assurance
about
whether
the
financial
statements
are
free
of
material
misstatement,
whether
due
to
error
or
fraud.
T.
ROWE
PRICE
International
Discovery
Fund
Our
audits
included
performing
procedures
to
assess
the
risks
of
material
misstatement
of
the
financial
statements,
whether
due
to
error
or
fraud,
and
performing
procedures
that
respond
to
those
risks.
Such
procedures
included
examining,
on
a
test
basis,
evidence
regarding
the
amounts
and
disclosures
in
the
financial
statements.
Our
audits
also
included
evaluating
the
accounting
principles
used
and
significant
estimates
made
by
management,
as
well
as
evaluating
the
overall
presentation
of
the
financial
statements.
Our
procedures
included
confirmation
of
securities
owned
as
of
October
31,
2024
by
correspondence
with
the
custodian,
transfer
agent
and
brokers;
when
replies
were
not
received
from
brokers,
we
performed
other
auditing
procedures.
We
believe
that
our
audits
provide
a
reasonable
basis
for
our
opinion.
/s/
PricewaterhouseCoopers
LLP
Baltimore,
Maryland
December
18,
2024
We
have
served
as
the
auditor
of
one
or
more
investment
companies
in
the
T.
Rowe
Price
group
of
investment
companies
since
1973.
REPORT
OF
INDEPENDENT
REGISTERED
PUBLIC
ACCOUNTING
FIRM
(continued)
T.
ROWE
PRICE
International
Discovery
Fund
TAX
INFORMATION
(UNAUDITED)
FOR
THE
TAX
YEAR
ENDED 10/31/24
We
are
providing
this
information
as
required
by
the
Internal
Revenue
Code.
The
amounts
shown
may
differ
from
those
elsewhere
in
this
report
because
of
differences
between
tax
and
financial
reporting
requirements.
The
fund’s
distributions
to
shareholders
included:
$42,670,000
from
long-term
capital
gains,
subject
to
a
long-term
capital
gains
tax
rate
of
not
greater
than
20%.
For
nonresident
alien
shareholders,
100%
of
short-term
capital
gain
dividends
distributed
by
the
fund
for
the
fiscal
year
are
qualified
short-term
capital
gains.
For
taxable
non-corporate
shareholders,
$107,406,000
of
the
fund's
income
represents
qualified
dividend
income
subject
to
a
long-term
capital
gains
tax
rate
of
not
greater
than
20%.
The
fund
will
pass
through
foreign
source
income
of
$128,965,000
and
foreign
taxes
paid
of
$13,794,000.
100
East
Pratt
Street
Baltimore,
MD
21202
T.
Rowe
Price
Investment
Services,
Inc.
Call
1-800-225-5132
to
request
a
prospectus
or
summary
prospectus;
each
includes
investment
objectives,
risks,
fees,
expenses,
and
other
information
that
you
should
read
and
consider
carefully
before
investing.
F38-050
12/24
Item 8. Changes in and Disagreements with Accountants for Open-End Management Investment Companies.
Not applicable.
Item 9. Proxy Disclosures for Open-End Management Investment Companies.
Not applicable.
Item 10. Remuneration Paid to Directors, Officers, and Others of Open-End Management Investment Companies.
Remuneration paid to Directors is included in Item 7 of this Form N-CSR.
Item 11. Statement Regarding Basis for Approval of Investment Advisory Contract.
If applicable, see Item 7.
Item 12. Disclosure of Proxy Voting Policies and Procedures for Closed-End Management Investment Companies.
Not applicable.
Item 13. Portfolio Managers of Closed-End Management Investment Companies.
Not applicable.
Item 14. Purchases of Equity Securities by Closed-End Management Investment Company and Affiliated Purchasers.
Not applicable.
Item 15. Submission of Matters to a Vote of Security Holders.
There has been no change to the procedures by which shareholders may recommend nominees to the registrant’s board of directors.
Item 16. Controls and Procedures.
(a) The registrant’s principal executive officer and principal financial officer have evaluated the registrant’s disclosure controls and procedures within 90 days of this filing and have concluded that the registrant’s disclosure controls and procedures were effective, as of that date, in ensuring that information required to be disclosed by the registrant in this Form N-CSR was recorded, processed, summarized, and reported timely.
(b) The registrant’s principal executive officer and principal financial officer are aware of no change in the registrant’s internal control over financial reporting that occurred during the period covered by this report that has materially affected, or is reasonably likely to materially affect, the registrant’s internal control over financial reporting.
Item 17. Disclosure of Securities Lending Activities for Closed-End Management Investment Companies.
Not applicable.
Item 18. Recovery of Erroneously Awarded Compensation.
Not applicable.
Item 19. Exhibits.
SIGNATURES
Pursuant to the requirements of the Securities Exchange Act of 1934 and the Investment Company Act of 1940, the registrant has duly caused this report to be signed on its behalf by the undersigned, thereunto duly authorized.
| | | | |
| T. Rowe Price International Funds, Inc. |
| | |
| By | | /s/ David Oestreicher | | |
| | David Oestreicher | | |
| | Principal Executive Officer | | |
| | |
| Date | | December 18, 2024 | | |
Pursuant to the requirements of the Securities Exchange Act of 1934 and the Investment Company Act of 1940, this report has been signed below by the following persons on behalf of the registrant and in the capacities and on the dates indicated.
| | | | |
| By | | /s/ David Oestreicher | | |
| | David Oestreicher | | |
| | Principal Executive Officer | | |
| | |
| Date | | December 18, 2024 | | |
| By | | /s/ Alan S. Dupski | | |
| | Alan S. Dupski | | |
| | Principal Financial Officer | | |
| | |
| Date | | December 18, 2024 | | |