UNITED STATES
SECURITIES AND EXCHANGE COMMISSION
Washington, D.C. 20549
FORM N-CSR
CERTIFIED SHAREHOLDER REPORT OF REGISTERED
MANAGEMENT INVESTMENT COMPANIES
Investment Company Act File Number: 811-02958
T. Rowe Price International Funds, Inc.
(Exact name of registrant as specified in charter)
100 East Pratt Street, Baltimore, MD 21202
(Address of principal executive offices)
David Oestreicher
100 East Pratt Street, Baltimore, MD 21202
(Name and address of agent for service)
Registrant’s telephone number, including area code: (410) 345-2000
Date of fiscal year end: October 31
Date of reporting period: October 31, 2024
Item 1. Reports to Shareholders
(a) Report pursuant to Rule 30e-1
Annual Shareholder Report
October 31, 2024
International Value Equity Fund
This annual shareholder report contains important information about International Value Equity Fund (the "fund") for the period of November 1, 2023 to October 31, 2024. You can find the fund’s prospectus, financial information on Form N‑CSR (which includes required tax information for dividends), holdings, proxy voting information, and other information atwww.troweprice.com/prospectus. You can also request this information without charge by contacting T. Rowe Price at 1‑800‑638‑5660 or info@troweprice.com or contacting your intermediary.
What were the fund costs for the last year? (based on a hypothetical $10,000 investment)
| | Costs of a $10,000 investment | Costs paid as a percentage of a $10,000 investment |
|---|
| International Value Equity Fund - Investor Class | $98 | 0.87% |
What drove fund performance during the past 12 months?
Non-U.S. developed markets stocks recorded a double-digit return over the 12-month reporting period as anticipation of interest rate cuts by the Federal Reserve and other central banks outweighed concerns about rising geopolitical tensions and persistent inflation in many markets. Emerging markets stocks also recorded strong gains.
The industrials and business services sector contributed the most to relative performance versus the MSCI EAFE Index Net due to favorable stock selection. UK jet engine manufacturer Rolls-Royce, whose shares more than doubled over the period as it continued to turn itself around under a new chief executive, was a substantial contributor. Consumer staples helped relative returns largely owing to positive stock selection and an underweight to the sector, which trailed the benchmark return.
The communication services sector detracted the most from relative performance due to adverse stock selection. An overweight to the energy sector, which lagged the benchmark with a negative return, also weighed on relative returns.
The fund relies on a disciplined value investing approach leveraging the firm’s global research platform to identify attractive businesses when they have fallen out of favor and trade at a material discount to intrinsic value. Sector and regional allocations are primarily driven by bottom-up stock selection. Financials was the largest overweight sector at period-end, while information technology was the largest underweight.
How has the fund performed?
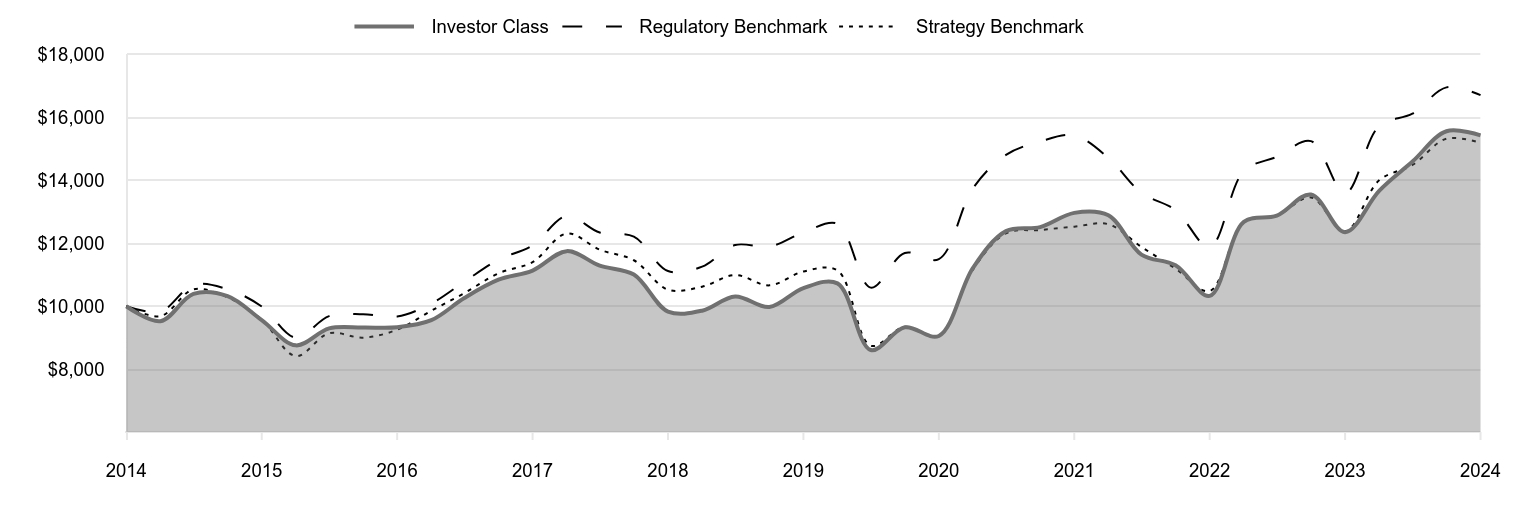
Cumulative Returns of a Hypothetical $10,000 Investment as of October 31, 2024
| Investor Class | Regulatory Benchmark | Strategy Benchmark |
|---|
| 2014 | 10,000 | 10,000 | 10,000 |
| 2015 | 9,524 | 9,833 | 9,684 |
| 2015 | 10,393 | 10,681 | 10,535 |
| 2015 | 10,323 | 10,540 | 10,286 |
| 2015 | 9,559 | 9,993 | 9,577 |
| 2016 | 8,756 | 9,003 | 8,414 |
| 2016 | 9,295 | 9,686 | 9,143 |
| 2016 | 9,323 | 9,746 | 9,000 |
| 2016 | 9,330 | 9,671 | 9,255 |
| 2017 | 9,556 | 10,087 | 9,856 |
| 2017 | 10,262 | 10,780 | 10,415 |
| 2017 | 10,844 | 11,478 | 11,046 |
| 2017 | 11,135 | 11,937 | 11,403 |
| 2018 | 11,753 | 12,871 | 12,313 |
| 2018 | 11,291 | 12,344 | 11,798 |
| 2018 | 11,008 | 12,213 | 11,463 |
| 2018 | 9,831 | 11,119 | 10,526 |
| 2019 | 9,859 | 11,260 | 10,622 |
| 2019 | 10,310 | 11,947 | 10,994 |
| 2019 | 9,974 | 11,895 | 10,664 |
| 2019 | 10,577 | 12,347 | 11,106 |
| 2020 | 10,727 | 12,623 | 11,139 |
| 2020 | 8,608 | 10,592 | 8,743 |
| 2020 | 9,330 | 11,696 | 9,348 |
| 2020 | 9,055 | 11,500 | 9,061 |
| 2021 | 11,221 | 13,752 | 11,166 |
| 2021 | 12,390 | 14,816 | 12,322 |
| 2021 | 12,517 | 15,241 | 12,425 |
| 2021 | 12,970 | 15,430 | 12,532 |
| 2022 | 12,892 | 14,718 | 12,609 |
| 2022 | 11,644 | 13,609 | 11,888 |
| 2022 | 11,302 | 13,059 | 11,196 |
| 2022 | 10,331 | 11,881 | 10,483 |
| 2023 | 12,682 | 14,302 | 12,692 |
| 2023 | 12,883 | 14,755 | 12,884 |
| 2023 | 13,555 | 15,252 | 13,461 |
| 2023 | 12,355 | 13,592 | 12,382 |
| 2024 | 13,670 | 15,733 | 14,006 |
| 2024 | 14,601 | 16,124 | 14,494 |
| 2024 | 15,567 | 16,962 | 15,332 |
| 2024 | 15,437 | 16,714 | 15,199 |
202411-4029887, 202412-3916152
Average Annual Total Returns
| | 1 Year | 5 Years | 10 Years |
|---|
| International Value Equity Fund (Investor Class) | 24.95% | 7.86% | 4.44% |
| MSCI EAFE Index Net (Regulatory Benchmark) | 22.97 | 6.24 | 5.27 |
| MSCI EAFE Value Index Net (Strategy Benchmark) | 22.75 | 6.47 | 4.28 |
The preceding line graph shows the value of a hypothetical $10,000 investment in the fund over the past 10 fiscal year periods or since inception (for funds lacking 10-year records). The fund’s performance information included in the line graph and table above is compared with a regulatory required index that represents an overall securities market (Regulatory Benchmark). In addition, the line graph and table may also include one or more indexes that more closely aligns to the fund's investment strategy (Strategy Benchmark(s)). Due to new SEC Rules on shareholder reporting the fund adopted a new broad-based securities market index, referred to as the Regulatory Benchmark. Market index returns do not include expenses, which are deducted from fund returns. The fund's total return figures reflect the reinvestment of dividends and capital gains, if any.Neither the fund’s returns nor the index returns reflect the deduction of taxes that a shareholder would pay on fund distributions or redemptions of fund shares.The fund’s past performance is not a good predictor of the fund’s future performance.Updated performance information can be found at www.troweprice.com.
What are some fund statistics?
- Total Net Assets (000s)$12,105,262
- Number of Portfolio Holdings142
- Investment Advisory Fees Paid (000s)$6,736
- Portfolio Turnover Rate15.9%
What did the fund invest in?
Sector Allocation (as a % of Net Assets)
| Financials | 26.4% |
| Industrials & Business Services | 15.5 |
| Health Care | 11.5 |
| Consumer Discretionary | 8.8 |
| Consumer Staples | 6.9 |
| Materials | 6.3 |
| Communication Services | 5.5 |
| Energy | 5.4 |
| Information Technology | 5.2 |
| Other | 8.5 |
Top Ten Holdings (as a % of Net Assets)
| AstraZeneca | 2.4% |
| Rolls-Royce Holdings | 2.3 |
| TotalEnergies | 2.0 |
| ING Groep | 1.9 |
| Sanofi | 1.9 |
| AXA | 1.8 |
| UniCredit | 1.8 |
| Roche Holding | 1.7 |
| Unilever | 1.7 |
| Hitachi | 1.7 |
If you invest directly with T. Rowe Price, you can elect to receive future shareholder reports or other important documents through electronic delivery by enrolling at www.troweprice.com/paperless. If you invest through a financial intermediary such as an investment advisor, a bank, retirement plan sponsor or a brokerage firm, please contact that organization and ask if it can provide electronic delivery.
MSCI does not accept any liability for any errors or omissions in the indexes or data, and hereby expressly disclaim all warranties of originality, accuracy, completeness, timeliness, merchantability and fitness for a particular purpose. No party may rely on any indexes or data contained in this communication. Visit www.troweprice.com/en/us/market-data-disclosures for additional legal notices & disclaimers.
International Value Equity Fund
Investor Class (TRIGX)
T. Rowe Price Investment Services, Inc.
100 East Pratt Street
Baltimore, MD 21202
Annual Shareholder Report
October 31, 2024
International Value Equity Fund
This annual shareholder report contains important information about International Value Equity Fund (the "fund") for the period of November 1, 2023 to October 31, 2024. You can find the fund’s prospectus, financial information on Form N‑CSR (which includes required tax information for dividends), holdings, proxy voting information, and other information atwww.troweprice.com/prospectus. You can also request this information without charge by contacting T. Rowe Price at 1‑800‑638‑5660 or info@troweprice.com or contacting your intermediary.
What were the fund costs for the last year? (based on a hypothetical $10,000 investment)
| | Costs of a $10,000 investment | Costs paid as a percentage of a $10,000 investment |
|---|
| International Value Equity Fund - Advisor Class | $122 | 1.09% |
What drove fund performance during the past 12 months?
Non-U.S. developed markets stocks recorded a double-digit return over the 12-month reporting period as anticipation of interest rate cuts by the Federal Reserve and other central banks outweighed concerns about rising geopolitical tensions and persistent inflation in many markets. Emerging markets stocks also recorded strong gains.
The industrials and business services sector contributed the most to relative performance versus the MSCI EAFE Index Net due to favorable stock selection. UK jet engine manufacturer Rolls-Royce, whose shares more than doubled over the period as it continued to turn itself around under a new chief executive, was a substantial contributor. Consumer staples helped relative returns largely owing to positive stock selection and an underweight to the sector, which trailed the benchmark return.
The communication services sector detracted the most from relative performance due to adverse stock selection. An overweight to the energy sector, which lagged the benchmark with a negative return, also weighed on relative returns.
The fund relies on a disciplined value investing approach leveraging the firm’s global research platform to identify attractive businesses when they have fallen out of favor and trade at a material discount to intrinsic value. Sector and regional allocations are primarily driven by bottom-up stock selection. Financials was the largest overweight sector at period-end, while information technology was the largest underweight.
How has the fund performed?
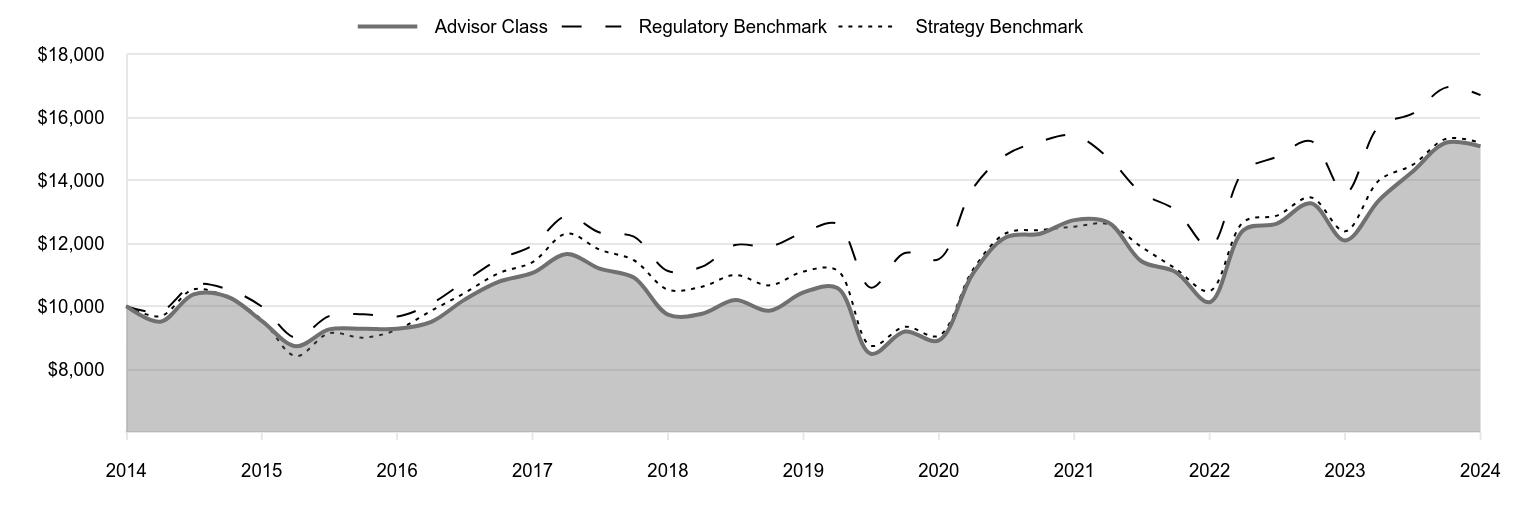
Cumulative Returns of a Hypothetical $10,000 Investment as of October 31, 2024
| Advisor Class | Regulatory Benchmark | Strategy Benchmark |
|---|
| 2014 | 10,000 | 10,000 | 10,000 |
| 2015 | 9,509 | 9,833 | 9,684 |
| 2015 | 10,378 | 10,681 | 10,535 |
| 2015 | 10,302 | 10,540 | 10,286 |
| 2015 | 9,537 | 9,993 | 9,577 |
| 2016 | 8,727 | 9,003 | 8,414 |
| 2016 | 9,263 | 9,686 | 9,143 |
| 2016 | 9,284 | 9,746 | 9,000 |
| 2016 | 9,284 | 9,671 | 9,255 |
| 2017 | 9,505 | 10,087 | 9,856 |
| 2017 | 10,203 | 10,780 | 10,415 |
| 2017 | 10,773 | 11,478 | 11,046 |
| 2017 | 11,058 | 11,937 | 11,403 |
| 2018 | 11,661 | 12,871 | 12,313 |
| 2018 | 11,196 | 12,344 | 11,798 |
| 2018 | 10,912 | 12,213 | 11,463 |
| 2018 | 9,735 | 11,119 | 10,526 |
| 2019 | 9,760 | 11,260 | 10,622 |
| 2019 | 10,196 | 11,947 | 10,994 |
| 2019 | 9,856 | 11,895 | 10,664 |
| 2019 | 10,440 | 12,347 | 11,106 |
| 2020 | 10,579 | 12,623 | 11,139 |
| 2020 | 8,489 | 10,592 | 8,743 |
| 2020 | 9,196 | 11,696 | 9,348 |
| 2020 | 8,914 | 11,500 | 9,061 |
| 2021 | 11,042 | 13,752 | 11,166 |
| 2021 | 12,192 | 14,816 | 12,322 |
| 2021 | 12,308 | 15,241 | 12,425 |
| 2021 | 12,740 | 15,430 | 12,532 |
| 2022 | 12,663 | 14,718 | 12,609 |
| 2022 | 11,431 | 13,609 | 11,888 |
| 2022 | 11,092 | 13,059 | 11,196 |
| 2022 | 10,129 | 11,881 | 10,483 |
| 2023 | 12,431 | 14,302 | 12,692 |
| 2023 | 12,626 | 14,755 | 12,884 |
| 2023 | 13,274 | 15,252 | 13,461 |
| 2023 | 12,091 | 13,592 | 12,382 |
| 2024 | 13,378 | 15,733 | 14,006 |
| 2024 | 14,276 | 16,124 | 14,494 |
| 2024 | 15,208 | 16,962 | 15,332 |
| 2024 | 15,083 | 16,714 | 15,199 |
202411-4029887, 202412-3916152
Average Annual Total Returns
| | 1 Year | 5 Years | 10 Years |
|---|
| International Value Equity Fund (Advisor Class) | 24.74% | 7.63% | 4.20% |
| MSCI EAFE Index Net (Regulatory Benchmark) | 22.97 | 6.24 | 5.27 |
| MSCI EAFE Value Index Net (Strategy Benchmark) | 22.75 | 6.47 | 4.28 |
The preceding line graph shows the value of a hypothetical $10,000 investment in the fund over the past 10 fiscal year periods or since inception (for funds lacking 10-year records). The fund’s performance information included in the line graph and table above is compared with a regulatory required index that represents an overall securities market (Regulatory Benchmark). In addition, the line graph and table may also include one or more indexes that more closely aligns to the fund's investment strategy (Strategy Benchmark(s)). Due to new SEC Rules on shareholder reporting the fund adopted a new broad-based securities market index, referred to as the Regulatory Benchmark. Market index returns do not include expenses, which are deducted from fund returns. The fund's total return figures reflect the reinvestment of dividends and capital gains, if any.Neither the fund’s returns nor the index returns reflect the deduction of taxes that a shareholder would pay on fund distributions or redemptions of fund shares.The fund’s past performance is not a good predictor of the fund’s future performance.Updated performance information can be found at www.troweprice.com.
What are some fund statistics?
- Total Net Assets (000s)$12,105,262
- Number of Portfolio Holdings142
- Investment Advisory Fees Paid (000s)$6,736
- Portfolio Turnover Rate15.9%
What did the fund invest in?
Sector Allocation (as a % of Net Assets)
| Financials | 26.4% |
| Industrials & Business Services | 15.5 |
| Health Care | 11.5 |
| Consumer Discretionary | 8.8 |
| Consumer Staples | 6.9 |
| Materials | 6.3 |
| Communication Services | 5.5 |
| Energy | 5.4 |
| Information Technology | 5.2 |
| Other | 8.5 |
Top Ten Holdings (as a % of Net Assets)
| AstraZeneca | 2.4% |
| Rolls-Royce Holdings | 2.3 |
| TotalEnergies | 2.0 |
| ING Groep | 1.9 |
| Sanofi | 1.9 |
| AXA | 1.8 |
| UniCredit | 1.8 |
| Roche Holding | 1.7 |
| Unilever | 1.7 |
| Hitachi | 1.7 |
If you invest directly with T. Rowe Price, you can elect to receive future shareholder reports or other important documents through electronic delivery by enrolling at www.troweprice.com/paperless. If you invest through a financial intermediary such as an investment advisor, a bank, retirement plan sponsor or a brokerage firm, please contact that organization and ask if it can provide electronic delivery.
MSCI does not accept any liability for any errors or omissions in the indexes or data, and hereby expressly disclaim all warranties of originality, accuracy, completeness, timeliness, merchantability and fitness for a particular purpose. No party may rely on any indexes or data contained in this communication. Visit www.troweprice.com/en/us/market-data-disclosures for additional legal notices & disclaimers.
International Value Equity Fund
Advisor Class (PAIGX)
T. Rowe Price Investment Services, Inc.
100 East Pratt Street
Baltimore, MD 21202
Annual Shareholder Report
October 31, 2024
International Value Equity Fund
This annual shareholder report contains important information about International Value Equity Fund (the "fund") for the period of November 1, 2023 to October 31, 2024. You can find the fund’s prospectus, financial information on Form N‑CSR (which includes required tax information for dividends), holdings, proxy voting information, and other information atwww.troweprice.com/prospectus. You can also request this information without charge by contacting T. Rowe Price at 1‑800‑638‑5660 or info@troweprice.com or contacting your intermediary.
What were the fund costs for the last year? (based on a hypothetical $10,000 investment)
| | Costs of a $10,000 investment | Costs paid as a percentage of a $10,000 investment |
|---|
| International Value Equity Fund - R Class | $149 | 1.33% |
What drove fund performance during the past 12 months?
Non-U.S. developed markets stocks recorded a double-digit return over the 12-month reporting period as anticipation of interest rate cuts by the Federal Reserve and other central banks outweighed concerns about rising geopolitical tensions and persistent inflation in many markets. Emerging markets stocks also recorded strong gains.
The industrials and business services sector contributed the most to relative performance versus the MSCI EAFE Index Net due to favorable stock selection. UK jet engine manufacturer Rolls-Royce, whose shares more than doubled over the period as it continued to turn itself around under a new chief executive, was a substantial contributor. Consumer staples helped relative returns largely owing to positive stock selection and an underweight to the sector, which trailed the benchmark return.
The communication services sector detracted the most from relative performance due to adverse stock selection. An overweight to the energy sector, which lagged the benchmark with a negative return, also weighed on relative returns.
The fund relies on a disciplined value investing approach leveraging the firm’s global research platform to identify attractive businesses when they have fallen out of favor and trade at a material discount to intrinsic value. Sector and regional allocations are primarily driven by bottom-up stock selection. Financials was the largest overweight sector at period-end, while information technology was the largest underweight.
How has the fund performed?
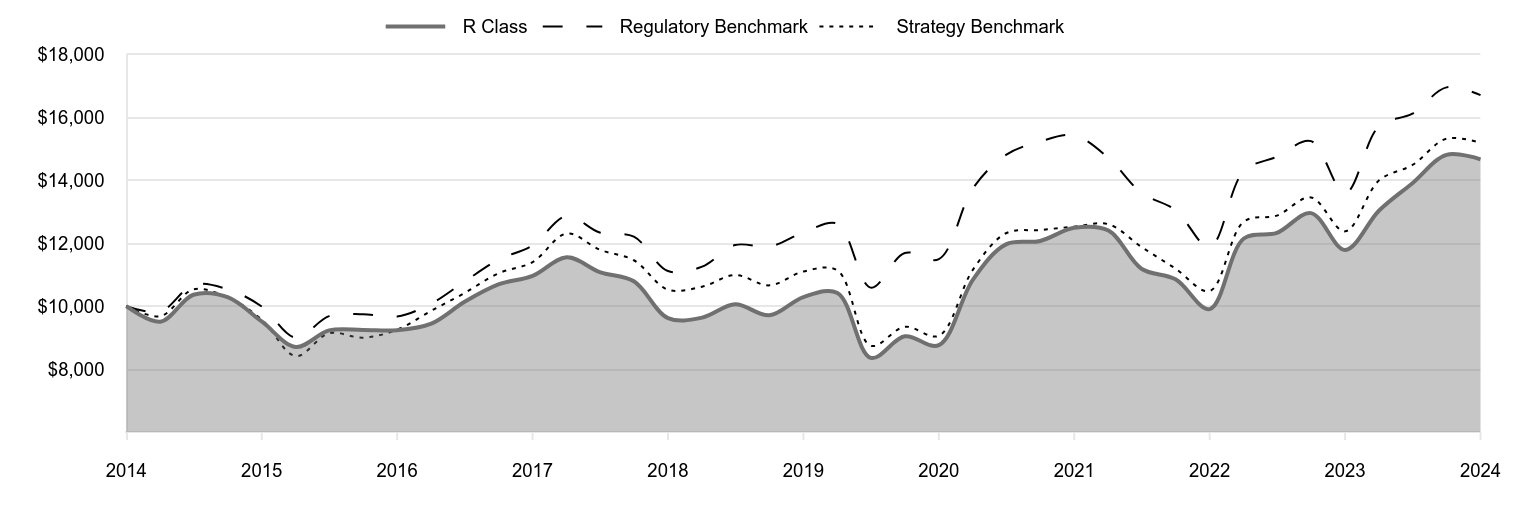
Cumulative Returns of a Hypothetical $10,000 Investment as of October 31, 2024
| R Class | Regulatory Benchmark | Strategy Benchmark |
|---|
| 2014 | 10,000 | 10,000 | 10,000 |
| 2015 | 9,508 | 9,833 | 9,684 |
| 2015 | 10,365 | 10,681 | 10,535 |
| 2015 | 10,289 | 10,540 | 10,286 |
| 2015 | 9,515 | 9,993 | 9,577 |
| 2016 | 8,706 | 9,003 | 8,414 |
| 2016 | 9,231 | 9,686 | 9,143 |
| 2016 | 9,245 | 9,746 | 9,000 |
| 2016 | 9,238 | 9,671 | 9,255 |
| 2017 | 9,446 | 10,087 | 9,856 |
| 2017 | 10,134 | 10,780 | 10,415 |
| 2017 | 10,692 | 11,478 | 11,046 |
| 2017 | 10,964 | 11,937 | 11,403 |
| 2018 | 11,555 | 12,871 | 12,313 |
| 2018 | 11,088 | 12,344 | 11,798 |
| 2018 | 10,796 | 12,213 | 11,463 |
| 2018 | 9,622 | 11,119 | 10,526 |
| 2019 | 9,638 | 11,260 | 10,622 |
| 2019 | 10,061 | 11,947 | 10,994 |
| 2019 | 9,712 | 11,895 | 10,664 |
| 2019 | 10,291 | 12,347 | 11,106 |
| 2020 | 10,423 | 12,623 | 11,139 |
| 2020 | 8,358 | 10,592 | 8,743 |
| 2020 | 9,044 | 11,696 | 9,348 |
| 2020 | 8,762 | 11,500 | 9,061 |
| 2021 | 10,849 | 13,752 | 11,166 |
| 2021 | 11,969 | 14,816 | 12,322 |
| 2021 | 12,077 | 15,241 | 12,425 |
| 2021 | 12,494 | 15,430 | 12,532 |
| 2022 | 12,408 | 14,718 | 12,609 |
| 2022 | 11,194 | 13,609 | 11,888 |
| 2022 | 10,855 | 13,059 | 11,196 |
| 2022 | 9,909 | 11,881 | 10,483 |
| 2023 | 12,155 | 14,302 | 12,692 |
| 2023 | 12,333 | 14,755 | 12,884 |
| 2023 | 12,962 | 15,252 | 13,461 |
| 2023 | 11,792 | 13,592 | 12,382 |
| 2024 | 13,046 | 15,733 | 14,006 |
| 2024 | 13,914 | 16,124 | 14,494 |
| 2024 | 14,815 | 16,962 | 15,332 |
| 2024 | 14,674 | 16,714 | 15,199 |
202411-4029887, 202412-3916152
Average Annual Total Returns
| | 1 Year | 5 Years | 10 Years |
|---|
| International Value Equity Fund (R Class) | 24.44% | 7.35% | 3.91% |
| MSCI EAFE Index Net (Regulatory Benchmark) | 22.97 | 6.24 | 5.27 |
| MSCI EAFE Value Index Net (Strategy Benchmark) | 22.75 | 6.47 | 4.28 |
The preceding line graph shows the value of a hypothetical $10,000 investment in the fund over the past 10 fiscal year periods or since inception (for funds lacking 10-year records). The fund’s performance information included in the line graph and table above is compared with a regulatory required index that represents an overall securities market (Regulatory Benchmark). In addition, the line graph and table may also include one or more indexes that more closely aligns to the fund's investment strategy (Strategy Benchmark(s)). Due to new SEC Rules on shareholder reporting the fund adopted a new broad-based securities market index, referred to as the Regulatory Benchmark. Market index returns do not include expenses, which are deducted from fund returns. The fund's total return figures reflect the reinvestment of dividends and capital gains, if any.Neither the fund’s returns nor the index returns reflect the deduction of taxes that a shareholder would pay on fund distributions or redemptions of fund shares.The fund’s past performance is not a good predictor of the fund’s future performance.Updated performance information can be found at www.troweprice.com.
What are some fund statistics?
- Total Net Assets (000s)$12,105,262
- Number of Portfolio Holdings142
- Investment Advisory Fees Paid (000s)$6,736
- Portfolio Turnover Rate15.9%
What did the fund invest in?
Sector Allocation (as a % of Net Assets)
| Financials | 26.4% |
| Industrials & Business Services | 15.5 |
| Health Care | 11.5 |
| Consumer Discretionary | 8.8 |
| Consumer Staples | 6.9 |
| Materials | 6.3 |
| Communication Services | 5.5 |
| Energy | 5.4 |
| Information Technology | 5.2 |
| Other | 8.5 |
Top Ten Holdings (as a % of Net Assets)
| AstraZeneca | 2.4% |
| Rolls-Royce Holdings | 2.3 |
| TotalEnergies | 2.0 |
| ING Groep | 1.9 |
| Sanofi | 1.9 |
| AXA | 1.8 |
| UniCredit | 1.8 |
| Roche Holding | 1.7 |
| Unilever | 1.7 |
| Hitachi | 1.7 |
If you invest directly with T. Rowe Price, you can elect to receive future shareholder reports or other important documents through electronic delivery by enrolling at www.troweprice.com/paperless. If you invest through a financial intermediary such as an investment advisor, a bank, retirement plan sponsor or a brokerage firm, please contact that organization and ask if it can provide electronic delivery.
MSCI does not accept any liability for any errors or omissions in the indexes or data, and hereby expressly disclaim all warranties of originality, accuracy, completeness, timeliness, merchantability and fitness for a particular purpose. No party may rely on any indexes or data contained in this communication. Visit www.troweprice.com/en/us/market-data-disclosures for additional legal notices & disclaimers.
International Value Equity Fund
R Class (RRIGX)
T. Rowe Price Investment Services, Inc.
100 East Pratt Street
Baltimore, MD 21202
Annual Shareholder Report
October 31, 2024
International Value Equity Fund
This annual shareholder report contains important information about International Value Equity Fund (the "fund") for the period of November 1, 2023 to October 31, 2024. You can find the fund’s prospectus, financial information on Form N‑CSR (which includes required tax information for dividends), holdings, proxy voting information, and other information atwww.troweprice.com/prospectus. You can also request this information without charge by contacting T. Rowe Price at 1‑800‑638‑5660 or info@troweprice.com or contacting your intermediary.
What were the fund costs for the last year? (based on a hypothetical $10,000 investment)
| | Costs of a $10,000 investment | Costs paid as a percentage of a $10,000 investment |
|---|
| International Value Equity Fund - I Class | $77 | 0.68% |
What drove fund performance during the past 12 months?
Non-U.S. developed markets stocks recorded a double-digit return over the 12-month reporting period as anticipation of interest rate cuts by the Federal Reserve and other central banks outweighed concerns about rising geopolitical tensions and persistent inflation in many markets. Emerging markets stocks also recorded strong gains.
The industrials and business services sector contributed the most to relative performance versus the MSCI EAFE Index Net due to favorable stock selection. UK jet engine manufacturer Rolls-Royce, whose shares more than doubled over the period as it continued to turn itself around under a new chief executive, was a substantial contributor. Consumer staples helped relative returns largely owing to positive stock selection and an underweight to the sector, which trailed the benchmark return.
The communication services sector detracted the most from relative performance due to adverse stock selection. An overweight to the energy sector, which lagged the benchmark with a negative return, also weighed on relative returns.
The fund relies on a disciplined value investing approach leveraging the firm’s global research platform to identify attractive businesses when they have fallen out of favor and trade at a material discount to intrinsic value. Sector and regional allocations are primarily driven by bottom-up stock selection. Financials was the largest overweight sector at period-end, while information technology was the largest underweight.
How has the fund performed?
Cumulative Returns of a Hypothetical $500,000 Investment as of October 31, 2024
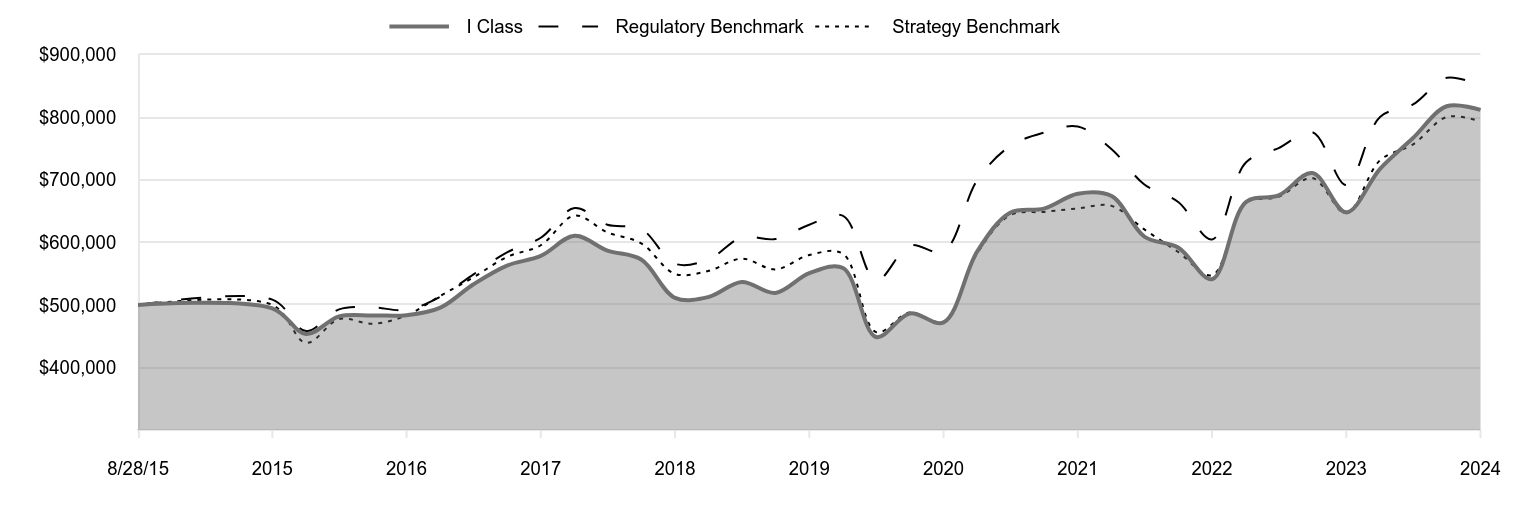
| I Class | Regulatory Benchmark | Strategy Benchmark |
|---|
| 8/28/15 | 500,000 | 500,000 | 500,000 |
| 10/31/15 | 494,612 | 508,493 | 500,012 |
| 1/31/16 | 453,448 | 458,126 | 439,312 |
| 4/30/16 | 481,674 | 492,864 | 477,341 |
| 7/31/16 | 483,140 | 495,913 | 469,893 |
| 10/31/16 | 483,507 | 492,086 | 483,239 |
| 1/31/17 | 495,604 | 513,245 | 514,608 |
| 4/30/17 | 532,651 | 548,526 | 543,793 |
| 7/31/17 | 562,894 | 584,028 | 576,734 |
| 10/31/17 | 578,393 | 607,419 | 595,387 |
| 1/31/18 | 610,519 | 654,924 | 642,866 |
| 4/30/18 | 586,873 | 628,114 | 615,973 |
| 7/31/18 | 572,531 | 621,423 | 598,506 |
| 10/31/18 | 511,285 | 565,784 | 549,575 |
| 1/31/19 | 512,829 | 572,974 | 554,586 |
| 4/30/19 | 536,719 | 607,910 | 574,011 |
| 7/31/19 | 519,199 | 605,263 | 556,786 |
| 10/31/19 | 550,654 | 628,268 | 579,870 |
| 1/31/20 | 558,883 | 642,297 | 581,604 |
| 4/30/20 | 448,745 | 538,964 | 456,460 |
| 7/31/20 | 486,413 | 595,140 | 488,061 |
| 10/31/20 | 472,082 | 585,142 | 473,060 |
| 1/31/21 | 585,864 | 699,736 | 582,988 |
| 4/30/21 | 647,292 | 753,902 | 643,367 |
| 7/31/21 | 653,978 | 775,522 | 648,726 |
| 10/31/21 | 677,797 | 785,146 | 654,303 |
| 1/31/22 | 674,125 | 748,906 | 658,353 |
| 4/30/22 | 609,288 | 692,493 | 620,664 |
| 7/31/22 | 591,684 | 664,488 | 584,548 |
| 10/31/22 | 541,017 | 604,571 | 547,351 |
| 1/31/23 | 664,378 | 727,723 | 662,672 |
| 4/30/23 | 675,015 | 750,813 | 672,696 |
| 7/31/23 | 710,916 | 776,087 | 702,821 |
| 10/31/23 | 647,979 | 691,635 | 646,456 |
| 1/31/24 | 717,606 | 800,568 | 731,275 |
| 4/30/24 | 766,938 | 820,471 | 756,737 |
| 7/31/24 | 817,641 | 863,092 | 800,502 |
| 10/31/24 | 811,703 | 850,476 | 793,537 |
202411-4029887, 202412-3916152
Average Annual Total Returns
| | 1 Year | 5 Years | Since Inception 8/28/15 |
|---|
| International Value Equity Fund (I Class) | 25.27% | 8.07% | 5.42% |
| MSCI EAFE Index Net (Regulatory Benchmark) | 22.97 | 6.24 | 5.96 |
| MSCI EAFE Value Index Net (Strategy Benchmark) | 22.75 | 6.47 | 5.16 |
The preceding line graph shows the value of a hypothetical $500,000 investment in the fund over the past 10 fiscal year periods or since inception (for funds lacking 10-year records). The fund’s performance information included in the line graph and table above is compared with a regulatory required index that represents an overall securities market (Regulatory Benchmark). In addition, the line graph and table may also include one or more indexes that more closely aligns to the fund's investment strategy (Strategy Benchmark(s)). Due to new SEC Rules on shareholder reporting the fund adopted a new broad-based securities market index, referred to as the Regulatory Benchmark. Market index returns do not include expenses, which are deducted from fund returns. The fund's total return figures reflect the reinvestment of dividends and capital gains, if any.Neither the fund’s returns nor the index returns reflect the deduction of taxes that a shareholder would pay on fund distributions or redemptions of fund shares.The fund’s past performance is not a good predictor of the fund’s future performance.Updated performance information can be found at www.troweprice.com.
What are some fund statistics?
- Total Net Assets (000s)$12,105,262
- Number of Portfolio Holdings142
- Investment Advisory Fees Paid (000s)$6,736
- Portfolio Turnover Rate15.9%
What did the fund invest in?
Sector Allocation (as a % of Net Assets)
| Financials | 26.4% |
| Industrials & Business Services | 15.5 |
| Health Care | 11.5 |
| Consumer Discretionary | 8.8 |
| Consumer Staples | 6.9 |
| Materials | 6.3 |
| Communication Services | 5.5 |
| Energy | 5.4 |
| Information Technology | 5.2 |
| Other | 8.5 |
Top Ten Holdings (as a % of Net Assets)
| AstraZeneca | 2.4% |
| Rolls-Royce Holdings | 2.3 |
| TotalEnergies | 2.0 |
| ING Groep | 1.9 |
| Sanofi | 1.9 |
| AXA | 1.8 |
| UniCredit | 1.8 |
| Roche Holding | 1.7 |
| Unilever | 1.7 |
| Hitachi | 1.7 |
If you invest directly with T. Rowe Price, you can elect to receive future shareholder reports or other important documents through electronic delivery by enrolling at www.troweprice.com/paperless. If you invest through a financial intermediary such as an investment advisor, a bank, retirement plan sponsor or a brokerage firm, please contact that organization and ask if it can provide electronic delivery.
MSCI does not accept any liability for any errors or omissions in the indexes or data, and hereby expressly disclaim all warranties of originality, accuracy, completeness, timeliness, merchantability and fitness for a particular purpose. No party may rely on any indexes or data contained in this communication. Visit www.troweprice.com/en/us/market-data-disclosures for additional legal notices & disclaimers.
International Value Equity Fund
I Class (TRTIX)
T. Rowe Price Investment Services, Inc.
100 East Pratt Street
Baltimore, MD 21202
Annual Shareholder Report
October 31, 2024
International Value Equity Fund
This annual shareholder report contains important information about International Value Equity Fund (the "fund") for the period of November 1, 2023 to October 31, 2024. You can find the fund’s prospectus, financial information on Form N‑CSR (which includes required tax information for dividends), holdings, proxy voting information, and other information atwww.troweprice.com/prospectus. You can also request this information without charge by contacting T. Rowe Price at 1‑800‑638‑5660 or info@troweprice.com or contacting your intermediary.
What were the fund costs for the last year? (based on a hypothetical $10,000 investment)
| | Costs of a $10,000 investment | Costs paid as a percentage of a $10,000 investment |
|---|
| International Value Equity Fund - Z Class | $0 | 0.00% |
What drove fund performance during the past 12 months?
Non-U.S. developed markets stocks recorded a double-digit return over the 12-month reporting period as anticipation of interest rate cuts by the Federal Reserve and other central banks outweighed concerns about rising geopolitical tensions and persistent inflation in many markets. Emerging markets stocks also recorded strong gains.
The industrials and business services sector contributed the most to relative performance versus the MSCI EAFE Index Net due to favorable stock selection. UK jet engine manufacturer Rolls-Royce, whose shares more than doubled over the period as it continued to turn itself around under a new chief executive, was a substantial contributor. Consumer staples helped relative returns largely owing to positive stock selection and an underweight to the sector, which trailed the benchmark return.
The communication services sector detracted the most from relative performance due to adverse stock selection. An overweight to the energy sector, which lagged the benchmark with a negative return, also weighed on relative returns.
The fund relies on a disciplined value investing approach leveraging the firm’s global research platform to identify attractive businesses when they have fallen out of favor and trade at a material discount to intrinsic value. Sector and regional allocations are primarily driven by bottom-up stock selection. Financials was the largest overweight sector at period-end, while information technology was the largest underweight.
How has the fund performed?
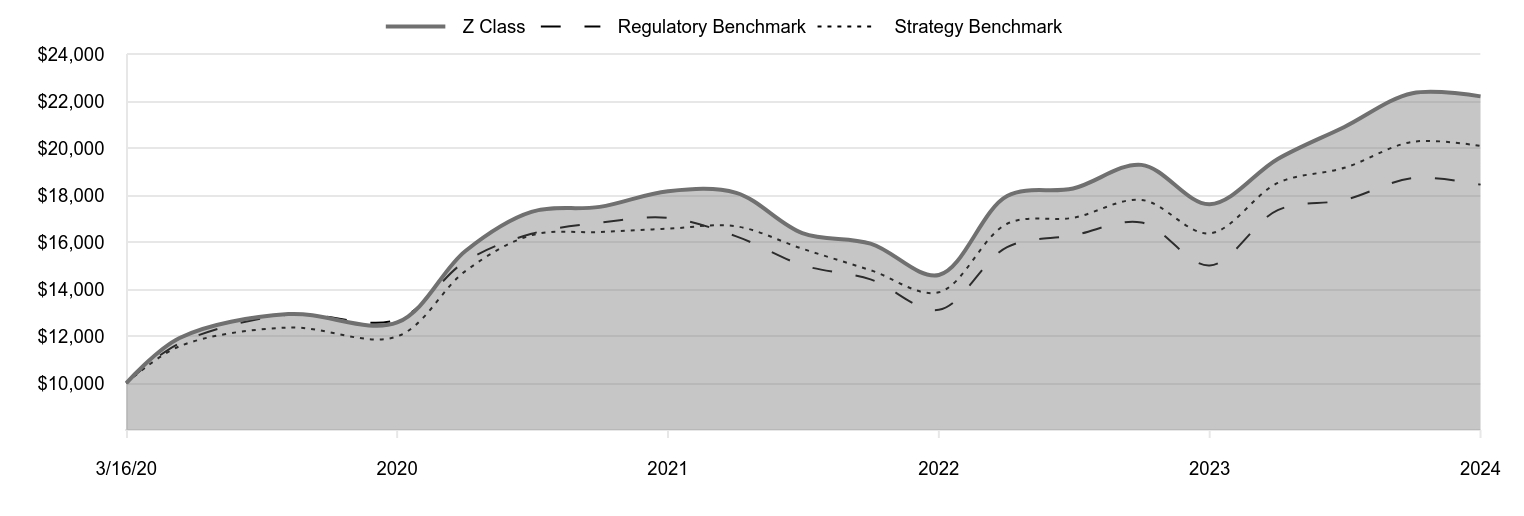
Cumulative Returns of a Hypothetical $10,000 Investment as of October 31, 2024
| Z Class | Regulatory Benchmark | Strategy Benchmark |
|---|
| 3/16/20 | 10,000 | 10,000 | 10,000 |
| 4/30/20 | 11,922 | 11,700 | 11,568 |
| 7/31/20 | 12,942 | 12,919 | 12,369 |
| 10/31/20 | 12,584 | 12,702 | 11,989 |
| 1/31/21 | 15,634 | 15,190 | 14,775 |
| 4/30/21 | 17,302 | 16,365 | 16,305 |
| 7/31/21 | 17,513 | 16,835 | 16,441 |
| 10/31/21 | 18,181 | 17,044 | 16,582 |
| 1/31/22 | 18,109 | 16,257 | 16,684 |
| 4/30/22 | 16,395 | 15,032 | 15,729 |
| 7/31/22 | 15,946 | 14,424 | 14,814 |
| 10/31/22 | 14,611 | 13,124 | 13,871 |
| 1/31/23 | 17,975 | 15,797 | 16,794 |
| 4/30/23 | 18,298 | 16,298 | 17,048 |
| 7/31/23 | 19,304 | 16,847 | 17,811 |
| 10/31/23 | 17,627 | 15,014 | 16,383 |
| 1/31/24 | 19,557 | 17,378 | 18,533 |
| 4/30/24 | 20,922 | 17,810 | 19,178 |
| 7/31/24 | 22,361 | 18,736 | 20,287 |
| 10/31/24 | 22,225 | 18,462 | 20,110 |
202411-4029887, 202412-3916152
Average Annual Total Returns
| | 1 Year | Since Inception 3/16/20 |
|---|
| International Value Equity Fund (Z Class) | 26.08% | 18.83% |
| MSCI EAFE Index Net (Regulatory Benchmark) | 22.97 | 14.16 |
| MSCI EAFE Value Index Net (Strategy Benchmark) | 22.75 | 16.29 |
The preceding line graph shows the value of a hypothetical $10,000 investment in the fund over the past 10 fiscal year periods or since inception (for funds lacking 10-year records). The fund’s performance information included in the line graph and table above is compared with a regulatory required index that represents an overall securities market (Regulatory Benchmark). In addition, the line graph and table may also include one or more indexes that more closely aligns to the fund's investment strategy (Strategy Benchmark(s)). Due to new SEC Rules on shareholder reporting the fund adopted a new broad-based securities market index, referred to as the Regulatory Benchmark. Market index returns do not include expenses, which are deducted from fund returns. The fund's total return figures reflect the reinvestment of dividends and capital gains, if any.Neither the fund’s returns nor the index returns reflect the deduction of taxes that a shareholder would pay on fund distributions or redemptions of fund shares.The fund’s past performance is not a good predictor of the fund’s future performance.Updated performance information can be found at www.troweprice.com.
What are some fund statistics?
- Total Net Assets (000s)$12,105,262
- Number of Portfolio Holdings142
- Investment Advisory Fees Paid (000s)$6,736
- Portfolio Turnover Rate15.9%
What did the fund invest in?
Sector Allocation (as a % of Net Assets)
| Financials | 26.4% |
| Industrials & Business Services | 15.5 |
| Health Care | 11.5 |
| Consumer Discretionary | 8.8 |
| Consumer Staples | 6.9 |
| Materials | 6.3 |
| Communication Services | 5.5 |
| Energy | 5.4 |
| Information Technology | 5.2 |
| Other | 8.5 |
Top Ten Holdings (as a % of Net Assets)
| AstraZeneca | 2.4% |
| Rolls-Royce Holdings | 2.3 |
| TotalEnergies | 2.0 |
| ING Groep | 1.9 |
| Sanofi | 1.9 |
| AXA | 1.8 |
| UniCredit | 1.8 |
| Roche Holding | 1.7 |
| Unilever | 1.7 |
| Hitachi | 1.7 |
If you invest directly with T. Rowe Price, you can elect to receive future shareholder reports or other important documents through electronic delivery by enrolling at www.troweprice.com/paperless. If you invest through a financial intermediary such as an investment advisor, a bank, retirement plan sponsor or a brokerage firm, please contact that organization and ask if it can provide electronic delivery.
MSCI does not accept any liability for any errors or omissions in the indexes or data, and hereby expressly disclaim all warranties of originality, accuracy, completeness, timeliness, merchantability and fitness for a particular purpose. No party may rely on any indexes or data contained in this communication. Visit www.troweprice.com/en/us/market-data-disclosures for additional legal notices & disclaimers.
International Value Equity Fund
Z Class (TROZX)
T. Rowe Price Investment Services, Inc.
100 East Pratt Street
Baltimore, MD 21202
Item 1. (b) Notice pursuant to Rule 30e-3.
Not applicable.
Item 2. Code of Ethics.
The registrant has adopted a code of ethics, as defined in Item 2 of Form N-CSR, applicable to its principal executive officer, principal financial officer, principal accounting officer or controller, or persons performing similar functions. A copy of this code of ethics is filed as an exhibit to this Form N-CSR. No substantive amendments were approved or waivers were granted to this code of ethics during the period covered by this report.
Item 3. Audit Committee Financial Expert.
The registrant’s Board of Directors has determined that Mr. Paul F. McBride qualifies as an audit committee financial expert, as defined in Item 3 of Form N-CSR. Mr. McBride is considered independent for purposes of Item 3 of Form N-CSR.
Item 4. Principal Accountant Fees and Services.
(a) – (d) Aggregate fees billed for the last two fiscal years for professional services rendered to, or on behalf of, the registrant by the registrant’s principal accountant were as follows:
| | | | | | | | | | |
| | | 2024 | | | 2023 | | | |
Audit Fees | | $ | 26,450 | | | $ | 25,925 | |
Audit-Related Fees | | | - | | | | - | |
Tax Fees | | | - | | | | - | |
All Other Fees | | | - | | | | - | |
Audit fees include amounts related to the audit of the registrant’s annual financial statements and services normally provided by the accountant in connection with statutory and regulatory filings. Audit-related fees include amounts reasonably related to the performance of the audit of the registrant’s financial statements and specifically include the issuance of a report on internal controls and, if applicable, agreed-upon procedures related to fund acquisitions. Tax fees include amounts related to services for tax compliance, tax planning, and tax advice. The nature of these services specifically includes the review of distribution calculations and the preparation of Federal, state, and excise tax returns. All other fees include the registrant’s pro-rata share of amounts for agreed-upon procedures in conjunction with service contract approvals by the registrant’s Board of Directors/Trustees.
(e)(1) The registrant’s audit committee has adopted a policy whereby audit and non-audit services performed by the registrant’s principal accountant for the registrant, its investment adviser, and any entity controlling, controlled by, or under common control with the investment adviser that provides ongoing services to the registrant require pre-approval in advance at regularly scheduled audit committee meetings. If such a service is required between regularly scheduled audit committee meetings, pre-approval may be authorized by one audit committee member with ratification at the next scheduled audit committee meeting. Waiver of pre-approval for audit or non-audit services requiring fees of a de minimis amount is not permitted.
(2) No services included in (b) – (d) above were approved pursuant to paragraph (c)(7)(i)(C) of Rule 2-01 of Regulation S-X.
(f) Less than 50 percent of the hours expended on the principal accountant’s engagement to audit the registrant’s financial statements for the most recent fiscal year were attributed to work performed by persons other than the principal accountant’s full-time, permanent employees.
(g) The aggregate fees billed for the most recent fiscal year and the preceding fiscal year by the registrant’s principal accountant for non-audit services rendered to the registrant, its investment adviser, and any entity controlling, controlled by, or under common control with the investment adviser that provides ongoing services to the registrant were $846,000 and $1,584,000, respectively.
(h) All non-audit services rendered in (g) above were pre-approved by the registrant’s audit committee. Accordingly, these services were considered by the registrant’s audit committee in maintaining the principal accountant’s independence.
(i) Not applicable.
(j) Not applicable.
Item 5. Audit Committee of Listed Registrants.
Not applicable.
Item 6. Investments.
(a) Not applicable. The complete schedule of investments is included in Item 7 of this Form N-CSR.
(b) Not applicable.
Item 7. Financial Statements and Financial Highlights for Open-End Management Investment Companies.
(a – b) Report pursuant to Regulation S-X.
Financial
Highlights
Portfolio
of
Investments
Financial
Statements
and
Notes
Additional
Fund
Information
Financial
Statements
and
Other
Information
For
more
insights
from
T.
Rowe
Price
investment
professionals,
go
to
troweprice.com
.
T.
ROWE
PRICE
TRIGX
International
Value
Equity
Fund
PAIGX
International
Value
Equity
Fund–
.
Advisor Class
RRIGX
International
Value
Equity
Fund–
.
R Class
TRTIX
International
Value
Equity
Fund–
.
I Class
TROZX
International
Value
Equity
Fund–
.
Z Class
T.
ROWE
PRICE
International
Value
Equity
Fund
For
a
share
outstanding
throughout
each
period
The
accompanying
notes
are
an
integral
part
of
these
financial
statements.
Investor
Class
..
Year
..
..
Ended
.
10/31/24
10/31/23
10/31/22
10/31/21
10/31/20
NET
ASSET
VALUE
Beginning
of
period
$
14.72
$
12.67
$
16.31
$
11.54
$
13.86
Investment
activities
Net
investment
income
(1)(2)
0.44
0.46
0.43
0.30
0.26
Net
realized
and
unrealized
gain/loss
3.18
2.00
(3.68)
4.66
(2.18)
Total
from
investment
activities
3.62
2.46
(3.25)
4.96
(1.92)
Distributions
Net
investment
income
(0.43)
(0.41)
(0.37)
(0.19)
(0.40)
Net
realized
gain
—
—
(0.02)
—
—
Total
distributions
(0.43)
(0.41)
(0.39)
(0.19)
(0.40)
NET
ASSET
VALUE
End
of
period
$
17.91
$
14.72
$
12.67
$
16.31
$
11.54
Ratios/Supplemental
Data
Total
return
(2)(3)
24.95%
19.59%
(20.35)%
43.23%
(14.38)%
Ratios
to
average
net
assets:
(2)
Gross
expenses
before
waivers/payments
by
Price
Associates
0.87%
0.85%
0.89%
0.79%
0.81%
Net
expenses
after
waivers/
payments
by
Price
Associates
0.87%
0.85%
0.89%
0.79%
0.81%
Net
investment
income
2.59%
3.06%
2.96%
1.98%
2.04%
Portfolio
turnover
rate
15.9%
17.5%
20.7%
21.7%
24.2%
Net
assets,
end
of
period
(in
millions)
$391
$386
$205
$392
$1,049
0%
0%
0%
0%
0%
(1)
Per
share
amounts
calculated
using
average
shares
outstanding
method.
(2)
Includes
the
impact
of
expense-related
arrangements
with
Price
Associates.
(3)
Total
return
reflects
the
rate
that
an
investor
would
have
earned
on
an
investment
in
the
fund
during
each
period,
assuming
reinvestment
of
all
distributions,
and
payment
of
no
redemption
or
account
fees,
if
applicable.
T.
ROWE
PRICE
International
Value
Equity
Fund
For
a
share
outstanding
throughout
each
period
The
accompanying
notes
are
an
integral
part
of
these
financial
statements.
Advisor
Class
..
Year
..
..
Ended
.
10/31/24
10/31/23
10/31/22
10/31/21
10/31/20
NET
ASSET
VALUE
Beginning
of
period
$
14.92
$
12.83
$
16.50
$
11.73
$
14.11
Investment
activities
Net
investment
income
(1)(2)
0.42
0.39
0.42
0.32
0.21
Net
realized
and
unrealized
gain/loss
3.22
2.08
(3.74)
4.68
(2.20)
Total
from
investment
activities
3.64
2.47
(3.32)
5.00
(1.99)
Distributions
Net
investment
income
(0.42)
(0.38)
(0.33)
(0.23)
(0.39)
Net
realized
gain
—
—
(0.02)
—
—
Total
distributions
(0.42)
(0.38)
(0.35)
(0.23)
(0.39)
NET
ASSET
VALUE
End
of
period
$
18.14
$
14.92
$
12.83
$
16.50
$
11.73
Ratios/Supplemental
Data
Total
return
(2)(3)
24.74%
19.37%
(20.50)%
42.92%
(14.62)%
Ratios
to
average
net
assets:
(2)
Gross
expenses
before
waivers/payments
by
Price
Associates
1.09%
1.07%
1.08%
1.07%
1.09%
Net
expenses
after
waivers/
payments
by
Price
Associates
1.09%
1.07%
1.08%
1.07%
1.09%
Net
investment
income
2.45%
2.59%
2.84%
2.07%
1.67%
Portfolio
turnover
rate
15.9%
17.5%
20.7%
21.7%
24.2%
Net
assets,
end
of
period
(in
thousands)
$33,513
$27,085
$24,983
$36,712
$30,221
0%
0%
0%
0%
0%
(1)
Per
share
amounts
calculated
using
average
shares
outstanding
method.
(2)
Includes
the
impact
of
expense-related
arrangements
with
Price
Associates.
(3)
Total
return
reflects
the
rate
that
an
investor
would
have
earned
on
an
investment
in
the
fund
during
each
period,
assuming
reinvestment
of
all
distributions,
and
payment
of
no
redemption
or
account
fees,
if
applicable.
T.
ROWE
PRICE
International
Value
Equity
Fund
For
a
share
outstanding
throughout
each
period
The
accompanying
notes
are
an
integral
part
of
these
financial
statements.
R
Class
..
Year
..
..
Ended
.
10/31/24
10/31/23
10/31/22
10/31/21
10/31/20
NET
ASSET
VALUE
Beginning
of
period
$
14.61
$
12.57
$
16.17
$
11.50
$
13.87
Investment
activities
Net
investment
income
(1)(2)
0.37
0.35
0.38
0.28
0.19
Net
realized
and
unrealized
gain/loss
3.16
2.03
(3.67)
4.59
(2.18)
Total
from
investment
activities
3.53
2.38
(3.29)
4.87
(1.99)
Distributions
Net
investment
income
(0.39)
(0.34)
(0.29)
(0.20)
(0.38)
Net
realized
gain
—
—
(0.02)
—
—
Total
distributions
(0.39)
(0.34)
(0.31)
(0.20)
(0.38)
NET
ASSET
VALUE
End
of
period
$
17.75
$
14.61
$
12.57
$
16.17
$
11.50
Ratios/Supplemental
Data
Total
return
(2)(3)
24.44%
19.00%
(20.69)%
42.60%
(14.86)%
Ratios
to
average
net
assets:
(2)
Gross
expenses
before
waivers/payments
by
Price
Associates
1.33%
1.31%
1.33%
1.32%
1.35%
Net
expenses
after
waivers/
payments
by
Price
Associates
1.33%
1.31%
1.33%
1.32%
1.35%
Net
investment
income
2.19%
2.33%
2.65%
1.83%
1.51%
Portfolio
turnover
rate
15.9%
17.5%
20.7%
21.7%
24.2%
Net
assets,
end
of
period
(in
thousands)
$35,663
$30,645
$29,692
$35,836
$26,821
0%
0%
0%
0%
0%
(1)
Per
share
amounts
calculated
using
average
shares
outstanding
method.
(2)
Includes
the
impact
of
expense-related
arrangements
with
Price
Associates.
(3)
Total
return
reflects
the
rate
that
an
investor
would
have
earned
on
an
investment
in
the
fund
during
each
period,
assuming
reinvestment
of
all
distributions,
and
payment
of
no
redemption
or
account
fees,
if
applicable.
T.
ROWE
PRICE
International
Value
Equity
Fund
For
a
share
outstanding
throughout
each
period
The
accompanying
notes
are
an
integral
part
of
these
financial
statements.
I
Class
..
Year
..
..
Ended
.
10/31/24
10/31/23
10/31/22
10/31/21
10/31/20
NET
ASSET
VALUE
Beginning
of
period
$
14.62
$
12.60
$
16.22
$
11.53
$
13.83
Investment
activities
Net
investment
income
(1)(2)
0.49
0.44
0.48
0.39
0.26
Net
realized
and
unrealized
gain/loss
3.14
2.03
(3.68)
4.59
(2.16)
Total
from
investment
activities
3.63
2.47
(3.20)
4.98
(1.90)
Distributions
Net
investment
income
(0.48)
(0.45)
(0.40)
(0.29)
(0.40)
Net
realized
gain
—
—
(0.02)
—
—
Total
distributions
(0.48)
(0.45)
(0.42)
(0.29)
(0.40)
NET
ASSET
VALUE
End
of
period
$
17.77
$
14.62
$
12.60
$
16.22
$
11.53
Ratios/Supplemental
Data
Total
return
(2)(3)
25.27%
19.77%
(20.18)%
43.58%
(14.27)%
Ratios
to
average
net
assets:
(2)
Gross
expenses
before
waivers/payments
by
Price
Associates
0.68%
0.69%
0.69%
0.68%
0.66%
Net
expenses
after
waivers/
payments
by
Price
Associates
0.68%
0.69%
0.68%
0.68%
0.66%
Net
investment
income
2.89%
2.98%
3.31%
2.51%
2.06%
Portfolio
turnover
rate
15.9%
17.5%
20.7%
21.7%
24.2%
Net
assets,
end
of
period
(in
millions)
$1,078
$826
$671
$834
$207
0%
0%
0%
0%
0%
(1)
Per
share
amounts
calculated
using
average
shares
outstanding
method.
(2)
Includes
the
impact
of
expense-related
arrangements
with
Price
Associates.
(3)
Total
return
reflects
the
rate
that
an
investor
would
have
earned
on
an
investment
in
the
fund
during
each
period,
assuming
reinvestment
of
all
distributions,
and
payment
of
no
redemption
or
account
fees,
if
applicable.
T.
ROWE
PRICE
International
Value
Equity
Fund
For
a
share
outstanding
throughout
each
period
Z
Class
(1)
..
Year
..
..
Ended
.
3/16/20
(1)
Through
10/31/20
10/31/24
10/31/23
10/31/22
10/31/21
NET
ASSET
VALUE
Beginning
of
period
$
14.72
$
12.70
$
16.35
$
11.59
$
9.21
Investment
activities
Net
investment
income
(2)(3)
0.61
0.54
0.57
0.48
0.22
Net
realized
and
unrealized
gain/loss
3.15
2.05
(3.69)
4.62
2.16
(4)
Total
from
investment
activities
3.76
2.59
(3.12)
5.10
2.38
Distributions
Net
investment
income
(0.57)
(0.57)
(0.51)
(0.34)
—
Net
realized
gain
—
—
(0.02)
—
—
Total
distributions
(0.57)
(0.57)
(0.53)
(0.34)
—
NET
ASSET
VALUE
End
of
period
$
17.91
$
14.72
$
12.70
$
16.35
$
11.59
T.
ROWE
PRICE
International
Value
Equity
Fund
For
a
share
outstanding
throughout
each
period
The
accompanying
notes
are
an
integral
part
of
these
financial
statements.
Z
Class
(1)
..
Year
..
..
Ended
.
3/16/20
(1)
Through
10/31/20
10/31/24
10/31/23
10/31/22
10/31/21
Ratios/Supplemental
Data
Total
return
(3)(5)
26.08%
20.64%
(19.63)%
44.47%
25.84%
Ratios
to
average
net
assets:
(3)
Gross
expenses
before
waivers/payments
by
Price
Associates
0.66%
0.66%
0.66%
0.65%
0.66%
(6)
Net
expenses
after
waivers/
payments
by
Price
Associates
0.00%
0.00%
0.00%
0.00%
0.00%
(6)
Net
investment
income
3.58%
3.65%
3.92%
3.15%
3.01%
(6)
Portfolio
turnover
rate
15.9%
17.5%
20.7%
21.7%
24.2%
Net
assets,
end
of
period
(in
millions)
$10,567
$8,536
$8,218
$12,257
$8,798
0%
0%
0%
0%
0%
(1)
Inception
date
(2)
Per
share
amounts
calculated
using
average
shares
outstanding
method.
(3)
Includes
the
impact
of
expense-related
arrangements
with
Price
Associates.
(4)
The
amount
presented
is
inconsistent
with
the
fund's
aggregate
gains
and
losses
because
of
the
timing
of
sales
and
redemptions
of
fund
shares
in
relation
to
fluctuating
market
values
for
the
investment
portfolio.
(5)
Total
return
reflects
the
rate
that
an
investor
would
have
earned
on
an
investment
in
the
fund
during
each
period,
assuming
reinvestment
of
all
distributions,
and
payment
of
no
redemption
or
account
fees,
if
applicable.
Total
return
is
not
annualized
for
periods
less
than
one
year.
(6)
Annualized
T.
ROWE
PRICE
International
Value
Equity
Fund
October
31,
2024
Shares
$
Value
(
Cost
and
value
in
$000s)
‡
AUSTRALIA 2.0%
Common
Stocks 2.0%
BHP
Group
2,682,818
74,536
BHP
Group
(GBP) (1)
2,912,482
80,832
Downer
EDI
17,111,646
62,698
Worley
3,335,858
30,632
Total
Australia
(Cost
$234,877)
248,698
AUSTRIA 2.4%
Common
Stocks 2.4%
BAWAG
Group
1,947,645
150,961
Erste
Group
Bank
1,411,507
79,843
OMV
1,345,958
55,778
Total
Austria
(Cost
$182,935)
286,582
BRAZIL 0.7%
Common
Stocks 0.7%
B3
25,739,000
47,329
Multiplan
Empreendimentos
Imobiliarios
7,500,903
33,204
Total
Brazil
(Cost
$92,111)
80,533
CANADA 2.9%
Common
Stocks 2.9%
BRP (1)
857,310
42,270
Cenovus
Energy
6,001,093
96,502
Definity
Financial
1,372,592
52,967
Magna
International
(USD)
600,117
23,687
National
Bank
of
Canada
702,739
67,026
Sun
Life
Financial
1,146,885
63,590
Total
Canada
(Cost
$293,679)
346,042
CHINA 1.4%
Common
Stocks 1.4%
Alibaba
Group
Holding,
ADR
(USD)
1,104,896
108,258
Baidu,
ADR
(USD) (1)(2)
427,041
38,959
Fosun
International
(HKD)
30,259,500
17,179
Total
China
(Cost
$222,424)
164,396
T.
ROWE
PRICE
International
Value
Equity
Fund
Shares
$
Value
(Cost
and
value
in
$000s)
FINLAND 0.6%
Common
Stocks 0.6%
Sampo,
Class
A
1,773,240
78,627
Total
Finland
(Cost
$63,206)
78,627
FRANCE 12.8%
Common
Stocks 12.8%
Airbus
970,627
148,061
Alstom (2)
2,727,648
59,998
ArcelorMittal
2,188,739
54,137
AXA
5,737,827
215,440
BNP
Paribas
1,987,185
135,713
Cie
de
Saint-Gobain
1,074,246
97,418
Dassault
Aviation
245,659
49,602
Edenred
1,845,369
59,684
Engie
4,762,617
79,829
Euronext
490,092
54,074
Forvia
2,157,260
20,580
Sanofi
2,148,708
227,075
TotalEnergies
3,943,062
247,449
Ubisoft
Entertainment (1)(2)
2,352,001
35,444
Vinci
549,638
61,571
Total
France
(Cost
$1,327,963)
1,546,075
GERMANY 9.1%
Common
Stocks 8.5%
Allianz
383,830
120,832
BASF
963,284
46,828
Bayer
1,750,970
47,183
Covestro (2)
1,572,284
99,583
Daimler
Truck
Holding
1,693,927
70,045
Deutsche
Post
1,651,409
66,336
Deutsche
Telekom
4,653,577
140,694
Fresenius (2)
1,128,934
41,218
Heidelberg
Materials
600,129
66,098
KION
Group
862,907
33,504
Mercedes-Benz
Group
967,228
58,760
Puma
791,598
36,097
Siemens
863,066
167,909
T.
ROWE
PRICE
International
Value
Equity
Fund
Shares
$
Value
(Cost
and
value
in
$000s)
Springer
Nature (2)
1,176,390
29,687
1,024,774
Preferred
Stocks 0.6%
Volkswagen
798,025
77,459
77,459
Total
Germany
(Cost
$1,056,306)
1,102,233
HONG
KONG 2.2%
Common
Stocks 2.2%
AIA
Group
13,741,800
108,455
CK
Hutchison
Holdings
9,058,500
47,640
Galaxy
Entertainment
Group
11,581,000
51,542
Hongkong
Land
Holdings
(USD)
9,363,603
40,147
Wharf
Real
Estate
Investment
7,198,000
21,641
Total
Hong
Kong
(Cost
$324,184)
269,425
HUNGARY 0.5%
Common
Stocks 0.5%
OTP
Bank
1,181,911
58,843
Total
Hungary
(Cost
$40,453)
58,843
INDIA 0.5%
Common
Stocks 0.5%
ICICI
Bank,
ADR
(USD)
1,845,097
56,110
Total
India
(Cost
$19,738)
56,110
ITALY 4.2%
Common
Stocks 4.2%
Enel
18,184,430
137,912
Leonardo
4,657,837
111,023
Stellantis
3,863,809
52,959
UniCredit
4,805,062
212,572
Total
Italy
(Cost
$321,427)
514,466
T.
ROWE
PRICE
International
Value
Equity
Fund
Shares
$
Value
(Cost
and
value
in
$000s)
JAPAN 18.3%
Common
Stocks 18.3%
Asahi
Group
Holdings
6,989,900
83,916
Fujitsu
4,378,600
84,182
Hitachi
7,973,100
200,323
Isetan
Mitsukoshi
Holdings
2,108,000
31,367
Kao
1,573,100
69,335
MatsukiyoCocokara
3,460,000
47,107
Minebea
Mitsumi
1,708,900
30,084
Mitsubishi
Electric
5,033,800
88,557
Mitsubishi
Estate
6,309,700
93,308
Mitsubishi
UFJ
Financial
Group
15,661,500
165,076
Mitsui
Fudosan
10,303,000
87,909
Nippon
Sanso
Holdings
1,670,500
57,986
Nippon
Steel
2,316,100
46,344
Nippon
Telegraph
&
Telephone
84,062,000
81,106
Niterra
1,151,200
32,627
Open
House
Group (1)
987,300
36,393
ORIX
4,220,900
88,934
Persol
Holdings
36,681,100
61,607
Renesas
Electronics
4,481,200
60,041
Resona
Holdings
8,503,400
56,103
Sega
Sammy
Holdings
2,434,900
45,823
Seven
&
i
Holdings
7,623,200
109,774
Sompo
Holdings
4,317,300
92,559
Stanley
Electric
1,682,000
28,768
SUMCO (1)
3,216,700
30,756
Sumitomo
2,584,100
54,515
Taiheiyo
Cement
1,937,500
42,209
Takeda
Pharmaceutical
3,733,600
104,172
Toyota
Motor
10,566,200
182,060
Yamaha
3,321,000
26,818
Total
Japan
(Cost
$1,702,888)
2,219,759
NETHERLANDS 7.2%
Common
Stocks 7.2%
AerCap
Holdings
(USD)
708,745
66,303
Akzo
Nobel
915,360
58,412
ASML
Holding
163,205
109,859
ASR
Nederland
1,006,984
47,730
T.
ROWE
PRICE
International
Value
Equity
Fund
Shares
$
Value
(Cost
and
value
in
$000s)
Heineken
869,755
71,335
ING
Groep
13,758,100
233,480
Koninklijke
Philips (2)
5,701,782
150,007
Prosus
2,278,119
96,067
Signify
1,658,441
40,606
Total
Netherlands
(Cost
$716,916)
873,799
PORTUGAL 1.7%
Common
Stocks 1.7%
Banco
Comercial
Portugues,
Class
R
148,206,983
74,763
Galp
Energia
5,677,339
97,036
Jeronimo
Martins
1,615,488
31,340
Total
Portugal
(Cost
$146,032)
203,139
SINGAPORE 0.8%
Common
Stocks 0.8%
United
Overseas
Bank
4,208,936
102,315
Total
Singapore
(Cost
$66,280)
102,315
SOUTH
KOREA 2.1%
Common
Stocks 2.1%
KB
Financial
Group
683,205
44,455
KT,
ADR
(USD) (2)
4,264,898
67,087
LG
Chem
153,661
34,550
Samsung
Electronics
2,586,768
109,837
Total
South
Korea
(Cost
$219,027)
255,929
SWEDEN 2.3%
Common
Stocks 2.3%
Boliden
1,517,645
47,478
Millicom
International
Cellular,
SDR (2)
2,232,834
61,934
Swedbank,
Class
A
3,655,374
74,170
Telefonaktiebolaget
LM
Ericsson,
Class
B
10,730,694
89,967
Total
Sweden
(Cost
$241,848)
273,549
SWITZERLAND 3.9%
Common
Stocks 3.9%
Julius
Baer
Group
990,037
60,364
T.
ROWE
PRICE
International
Value
Equity
Fund
Shares
$
Value
(Cost
and
value
in
$000s)
Novartis
1,048,639
113,784
Roche
Holding
669,728
207,551
Sandoz
Group
1,985,539
90,518
Total
Switzerland
(Cost
$328,725)
472,217
TAIWAN 1.2%
Common
Stocks 1.2%
Taiwan
Semiconductor
Manufacturing
4,671,000
146,480
Total
Taiwan
(Cost
$17,999)
146,480
UNITED
KINGDOM 20.2%
Common
Stocks 20.2%
Amcor,
CDI
(AUD)
4,339,662
47,841
AstraZeneca,
ADR
(USD)
4,139,458
294,522
Barclays
36,301,121
111,281
BP
31,033,213
151,778
British
American
Tobacco
1,500,934
52,486
BT
Group (1)
35,805,147
63,933
GSK,
ADR
(USD) (1)
3,156,785
116,043
HSBC
Holdings
18,127,182
166,372
Imperial
Brands
5,145,278
155,274
Informa
6,054,065
63,246
Investec
5,106,180
39,314
Legal
&
General
Group
11,010,208
30,882
Lloyds
Banking
Group
124,055,136
85,152
National
Grid
8,733,684
109,662
Pearson
4,110,709
60,363
Prudential
9,596,808
79,892
Rolls-Royce
Holdings (2)
40,844,947
281,846
Smiths
Group
2,590,881
51,126
SSE
2,875,466
65,340
Standard
Chartered
5,974,314
69,281
Taylor
Wimpey
26,483,343
50,072
Unilever
3,335,100
203,448
WPP
8,713,558
91,588
Total
United
Kingdom
(Cost
$1,977,019)
2,440,742
T.
ROWE
PRICE
International
Value
Equity
Fund
Shares
$
Value
(Cost
and
value
in
$000s)
SHORT-TERM
INVESTMENTS 2.1%
Money
Market
Funds 2.1%
T.
Rowe
Price
Government
Reserve
Fund,
4.86% (3)(4)
254,836,370
254,836
Total
Short-Term
Investments
(Cost
$254,836)
254,836
SECURITIES
LENDING
COLLATERAL 1.5%
INVESTMENTS
IN
A
POOLED
ACCOUNT
THROUGH
SECURITIES
LENDING
PROGRAM
WITH
JPMORGAN
CHASE
BANK 1.5%
Money
Market
Funds 1.5%
T.
Rowe
Price
Government
Reserve
Fund,
4.86% (3)(4)
183,684,292
183,684
Total
Investments
in
a
Pooled
Account
through
Securities
Lending
Program
with
JPMorgan
Chase
Bank
183,684
Total
Securities
Lending
Collateral
(Cost
$183,684)
183,684
Total
Investments
in
Securities
100.6%
of
Net
Assets
(Cost
$10,034,557)
$
12,178,479
‡
Country
classifications
are
generally
based
on
MSCI
categories
or
another
unaffiliated
third
party
data
provider;
Shares
are
denominated
in
the
currency
of
the
country
presented
unless
otherwise
noted.
(1)
See
Note
4
.
All
or
a
portion
of
this
security
is
on
loan
at
October
31,
2024.
(2)
Non-income
producing
(3)
Seven-day
yield
(4)
Affiliated
Companies
ADR
American
Depositary
Receipts
AUD
Australian
Dollar
CDI
CHESS
or
CREST
Depositary
Interest
GBP
British
Pound
HKD
Hong
Kong
Dollar
JPY
Japanese
Yen
SDR
Swedish
Depository
Receipts
USD
U.S.
Dollar
T.
ROWE
PRICE
International
Value
Equity
Fund
(Amounts
in
000s)
FORWARD
CURRENCY
EXCHANGE
CONTRACTS
Counterparty
Settlement
Receive
Deliver
Unrealized
Gain/(Loss)
UBS
Investment
Bank
11/15/24
JPY
34,210,222
USD
234,399
$
(8,809)
Net
unrealized
gain
(loss)
on
open
forward
currency
exchange
contracts
$
(8,809)
T.
ROWE
PRICE
International
Value
Equity
Fund
The
accompanying
notes
are
an
integral
part
of
these
financial
statements.
AFFILIATED
COMPANIES
($000s)
The
fund
may
invest
in
certain
securities
that
are
considered
affiliated
companies.
As
defined
by
the
1940
Act,
an
affiliated
company
is
one
in
which
the
fund
owns
5%
or
more
of
the
outstanding
voting
securities,
or
a
company
that
is
under
common
ownership
or
control.
The
following
securities
were
considered
affiliated
companies
for
all
or
some
portion
of
the
year
ended
October
31,
2024.
Net
realized
gain
(loss),
investment
income,
change
in
net
unrealized
gain/loss,
and
purchase
and
sales
cost
reflect
all
activity
for
the
period
then
ended.
Affiliate
Net
Realized
Gain
(Loss)
Change
in
Net
Unrealized
Gain/Loss
Investment
Income
T.
Rowe
Price
Government
Reserve
Fund,
4.86%
$
—
$
—
$
11,432++
Totals
$
—#
$
—
$
11,432+
Supplementary
Investment
Schedule
Affiliate
Value
10/31/23
Purchase
Cost
Sales
Cost
Value
10/31/24
T.
Rowe
Price
Government
Reserve
Fund,
4.86%
$
109,222
¤
¤
$
438,520
Total
$
438,520^
#
Capital
gain
distributions
from
underlying
Price
funds
represented
$0
of
the
net
realized
gain
(loss).
++
Excludes
earnings
on
securities
lending
collateral,
which
are
subject
to
rebates
and
fees
as
described
in
Note
4
.
+
Investment
income
comprised
$11,432
of
dividend
income
and
$0
of
interest
income.
¤
Purchase
and
sale
information
not
shown
for
cash
management
funds.
^
The
cost
basis
of
investments
in
affiliated
companies
was
$438,520.
T.
ROWE
PRICE
International
Value
Equity
Fund
October
31,
2024
Statement
of
Assets
and
Liabilities
($000s,
except
shares
and
per
share
amounts)
Assets
Investments
in
securities,
at
value
(cost
$10,034,557)
$
12,178,479
Foreign
currency
(cost
$35,831)
32,481
Dividends
receivable
24,024
Restricted
cash
pledged
for
bilateral
derivatives
10,990
Receivable
for
shares
sold
8,980
Due
from
affiliates
5,947
Receivable
for
investment
securities
sold
2,286
Cash
3
Other
assets
52,301
Total
assets
12,315,491
Liabilities
Obligation
to
return
securities
lending
collateral
183,684
Unrealized
loss
on
forward
currency
exchange
contracts
8,809
Investment
management
fees
payable
6,685
Payable
for
investment
securities
purchased
5,709
Payable
for
shares
redeemed
4,932
Payable
to
directors
3
Other
liabilities
407
Total
liabilities
210,229
Commitments
and
Contingent
Liabilities
(note
7
)
NET
ASSETS
$
12,105,262
T.
ROWE
PRICE
International
Value
Equity
Fund
October
31,
2024
Statement
of
Assets
and
Liabilities
($000s,
except
shares
and
per
share
amounts)
The
accompanying
notes
are
an
integral
part
of
these
financial
statements.
Net
Assets
Consist
of:
Total
distributable
earnings
(loss)
$
2,021,192
Paid-in
capital
applicable
to
676,365,369
shares
of
$0.01
par
value
capital
stock
outstanding;
18,000,000,000
shares
of
the
Corporation
authorized
10,084,070
NET
ASSETS
$
12,105,262
NET
ASSET
VALUE
PER
SHARE
Investor
Class
(Net
assets:
$390,935;
Shares
outstanding:
21,823,736)
$
17.91
Advisor
Class
(Net
assets:
$33,513;
Shares
outstanding:
1,847,752)
$
18.14
R
Class
(Net
assets:
$35,663;
Shares
outstanding:
2,009,140)
$
17.75
I
Class
(Net
assets:
$1,078,270;
Shares
outstanding:
60,682,662)
$
17.77
Z
Class
(Net
assets:
$10,566,881;
Shares
outstanding:
590,002,079)
$
17.91
T.
ROWE
PRICE
International
Value
Equity
Fund
Year
Ended
10/31/24
Investment
Income
(Loss)
Income
Dividend
(net
of
foreign
taxes
of
$20,768)
$
413,032
Securities
lending
984
.
Interest
3
Other
30
Total
income
414,049
Expenses
Investment
management
73,479
Shareholder
servicing
Investor
Class
$
696
Advisor
Class
56
R
Class
58
I
Class
258
1,068
Rule
12b-1
fees
Advisor
Class
79
R
Class
170
249
Prospectus
and
shareholder
reports
Investor
Class
40
Advisor
Class
1
I
Class
8
Z Class
7
56
Custody
and
accounting
1,761
Legal
and
audit
224
Registration
99
Directors
38
Proxy
and
annual
meeting
4
Miscellaneous
424
Waived
/
paid
by
Price
Associates
(66,743)
Total
expenses
10,659
Net
investment
income
403,390
T.
ROWE
PRICE
International
Value
Equity
Fund
The
accompanying
notes
are
an
integral
part
of
these
financial
statements.
Year
Ended
10/31/24
Realized
and
Unrealized
Gain
/
Loss
–
Net
realized
gain
(loss)
Securities
(net
of
foreign
taxes
of
$3,905)
550,874
Forward
currency
exchange
contracts
18,703
Foreign
currency
transactions
(699)
Net
realized
gain
568,878
Change
in
net
unrealized
gain
/
loss
Securities
1,561,297
Forward
currency
exchange
contracts
(8,809)
Other
assets
and
liabilities
denominated
in
foreign
currencies
765
Change
in
net
unrealized
gain
/
loss
1,553,253
Net
realized
and
unrealized
gain
/
loss
2,122,131
INCREASE
IN
NET
ASSETS
FROM
OPERATIONS
$
2,525,521
T.
ROWE
PRICE
International
Value
Equity
Fund
Statement
of
Changes
in
Net
Assets
Year
.
.
.
.
.
.
.
.
.
.
.
.
.
.
Ended
.
.
.
.
.
.
.
.
.
.
.
.
.
.
10/31/24
10/31/23
Increase
(Decrease)
in
Net
Assets
Operations
Net
investment
income
$
403,390
$
369,444
Net
realized
gain
568,878
98,510
Change
in
net
unrealized
gain
/
loss
1,553,253
1,409,070
Increase
in
net
assets
from
operations
2,525,521
1,877,024
Distributions
to
shareholders
Net
earnings
Investor
Class
(8,326)
(6,537)
Advisor
Class
(751)
(725)
R
Class
(787)
(781)
I
Class
(27,353)
(24,273)
Z Class
(329,127)
(358,628)
Decrease
in
net
assets
from
distributions
(366,344)
(390,944)
Capital
share
transactions
*
Shares
sold
Investor
Class
149,973
275,586
Advisor
Class
9,427
4,812
R
Class
5,925
3,638
I
Class
223,273
172,326
Z Class
1,219,722
561,041
Distributions
reinvested
Investor
Class
7,847
6,035
Advisor
Class
738
715
R
Class
787
781
I
Class
25,522
23,349
Z Class
329,127
358,628
Shares
redeemed
Investor
Class
(215,748)
(130,477)
Advisor
Class
(9,493)
(7,539)
R
Class
(8,073)
(8,347)
I
Class
(179,991)
(150,961)
Z Class
(1,418,695)
(1,938,370)
Increase
(decrease)
in
net
assets
from
capital
share
transactions
140,341
(828,783)
T.
ROWE
PRICE
International
Value
Equity
Fund
Statement
of
Changes
in
Net
Assets
The
accompanying
notes
are
an
integral
part
of
these
financial
statements.
Year
.
.
.
.
.
.
.
.
.
.
.
.
.
.
Ended
.
.
.
.
.
.
.
.
.
.
.
.
.
.
10/31/24
10/31/23
Net
Assets
Increase
during
period
2,299,518
657,297
Beginning
of
period
9,805,744
9,148,447
End
of
period
$
12,105,262
$
9,805,744
*Share
information
(000s)
Shares
sold
Investor
Class
8,630
18,335
Advisor
Class
540
315
R
Class
345
242
I
Class
13,185
11,751
Z Class
74,044
37,421
Distributions
reinvested
Investor
Class
492
426
Advisor
Class
46
50
R
Class
49
55
I
Class
1,615
1,663
Z Class
20,791
25,525
Shares
redeemed
Investor
Class
(13,531)
(8,686)
Advisor
Class
(554)
(496)
R
Class
(482)
(562)
I
Class
(10,588)
(10,193)
Z Class
(84,888)
(129,904)
Increase
(decrease)
in
shares
outstanding
9,694
(54,058)
T.
ROWE
PRICE
International
Value
Equity
Fund
NOTES
TO
FINANCIAL
STATEMENTS
T.
Rowe
Price
International
Funds,
Inc. (the
corporation) is
registered
under
the
Investment
Company
Act
of
1940
(the
1940
Act).
The
International
Value
Equity
Fund
(the
fund)
is a
diversified, open-end
management
investment
company
established
by
the
corporation. The
fund
seeks long-term
capital
growth
and
current
income
primarily
through
investments
in
non-U.S.
stocks.
The
fund
has five classes
of
shares:
the
International
Value
Equity
Fund
(Investor
Class),
the
International
Value
Equity
Fund–Advisor
Class
(Advisor
Class),
the
International
Value
Equity
Fund–R
Class
(R
Class),
the
International
Value
Equity
Fund–I
Class
(I
Class)
and
the
International
Value
Equity
Fund–Z
Class
(Z
Class).
Advisor
Class
shares
are
sold
only
through
various
brokers
and
other
financial
intermediaries,
and
R
Class
shares
are
available
through
financial
intermediaries
for
employer-sponsored
defined
contribution
retirement
plans
and
certain
other
retirement
accounts.
I
Class
shares
require
a
$500,000
initial
investment
minimum,
although
the
minimum
generally
is
waived
or
reduced
for
financial
intermediaries,
eligible
retirement
plans,
and
certain
other
accounts.
The
Z
Class
is
only
available
to
funds
advised
by
T.
Rowe
Price
Associates,
Inc.
and
its
affiliates
and
other
clients
that
are
subject
to
a
contractual
fee
for
investment
management
services.
The
Advisor
Class
and
R
Class
each
operate
under
separate
Board-approved
Rule
12b-1
plans,
pursuant
to
which
each
class
compensates
financial
intermediaries
for
distribution,
shareholder
servicing,
and/
or
certain
administrative
services;
the
Investor,
I
and
Z
Classes
do
not
pay
Rule
12b-1
fees. Each
class
has
exclusive
voting
rights
on
matters
related
solely
to
that
class;
separate
voting
rights
on
matters
that
relate
to
all
classes;
and,
in
all
other
respects,
the
same
rights
and
obligations
as
the
other
classes.
NOTE
1
-
SIGNIFICANT
ACCOUNTING
POLICIES
Basis
of
Preparation
The fund
is
an
investment
company
and
follows
accounting
and
reporting
guidance
in
the
Financial
Accounting
Standards
Board
(FASB)
Accounting
Standards
Codification
Topic
946
(ASC
946).
The
accompanying
financial
statements
were
prepared
in
accordance
with
accounting
principles
generally
accepted
in
the
United
States
of
America
(GAAP),
including,
but
not
limited
to,
ASC
946.
GAAP
requires
the
use
of
estimates
made
by
management.
Management
believes
that
estimates
and
valuations
are
appropriate;
however,
actual
results
may
differ
from
those
estimates,
and
the
valuations
reflected
in
the
accompanying
financial
statements
may
differ
from
the
value
ultimately
realized
upon
sale
or
maturity.
T.
ROWE
PRICE
International
Value
Equity
Fund
Investment
Transactions,
Investment
Income,
and
Distributions
Investment
transactions
are
accounted
for
on
the
trade
date
basis.
Income
and
expenses
are
recorded
on
the
accrual
basis.
Realized
gains
and
losses
are
reported
on
the
identified
cost
basis. Income
tax-related
interest
and
penalties,
if
incurred,
are
recorded
as
income
tax
expense. Dividends
received
from other
investment
companies are
reflected
as
dividend income;
capital
gain
distributions
are
reflected
as
realized
gain/loss. Dividend
income and
capital
gain
distributions
are
recorded
on
the
ex-dividend
date. Non-cash
dividends,
if
any,
are
recorded
at
the
fair
market
value
of
the
asset
received. Proceeds
from
litigation
payments,
if
any,
are
included
in
either
net
realized
gain
(loss)
or
change
in
net
unrealized
gain/loss
from
securities. Distributions
to
shareholders
are
recorded
on
the
ex-dividend
date. Income
distributions,
if
any,
are
declared
and
paid
by
each
class annually. A
capital
gain
distribution,
if
any, may
also
be
declared
and
paid
by
the
fund
annually.
Currency
Translation
Assets,
including
investments,
and
liabilities
denominated
in
foreign
currencies
are
translated
into
U.S.
dollar
values
each
day
at
the
prevailing
exchange
rate,
using
the
mean
of
the
bid
and
asked
prices
of
such
currencies
against
U.S.
dollars
as
provided
by
an
outside
pricing
service.
Purchases
and
sales
of
securities,
income,
and
expenses
are
translated
into
U.S.
dollars
at
the
prevailing
exchange
rate
on
the
respective
date
of
such
transaction.
The
effect
of
changes
in
foreign
currency
exchange
rates
on
realized
and
unrealized
security
gains
and
losses
is
not
bifurcated
from
the
portion
attributable
to
changes
in
market
prices.
Class
Accounting
Shareholder
servicing,
prospectus,
and
shareholder
report
expenses
incurred
by
each
class
are
charged
directly
to
the
class
to
which
they
relate.
Expenses
common
to
all
classes,
investment
income,
and
realized
and
unrealized
gains
and
losses
are
allocated
to
the
classes
based
upon
the
relative
daily
net
assets
of
each
class.
The
Advisor
Class
and
R
Class
each
pay
Rule
12b-1
fees,
in
an
amount
not
exceeding
0.25%
and
0.50%,
respectively,
of
the
class’s
average
daily
net
assets.
In-Kind
Redemptions
In
accordance
with
guidelines
described
in
the
fund’s
prospectus,
and
when
considered
to
be
in
the
best
interest
of
all
shareholders,
the
fund
may
distribute
portfolio
securities
rather
than
cash
as
payment
for
a
redemption
of
fund
shares
(in-kind
redemption).
Gains
and
losses
realized
on
in-kind
redemptions
are
not
recognized
for
tax
purposes
and
are
reclassified
from
undistributed
realized
gain
(loss)
to
paid-in
capital.
During
the
year ended
October
31,
2024,
the
fund
realized
$96,186,000 of
net
gain
on
$303,974,000
of
in-kind
redemptions.
T.
ROWE
PRICE
International
Value
Equity
Fund
Capital
Transactions
Each
investor’s
interest
in
the
net
assets
of the
fund
is
represented
by
fund
shares. The
fund’s
net
asset
value
(NAV)
per
share
is
computed
at
the
close
of
the
New
York
Stock
Exchange
(NYSE),
normally
4
p.m.
Eastern
time,
each
day
the
NYSE
is
open
for
business.
However,
the
NAV
per
share
may
be
calculated
at
a
time
other
than
the
normal
close
of
the
NYSE
if
trading
on
the
NYSE
is
restricted,
if
the
NYSE
closes
earlier,
or
as
may
be
permitted
by
the
SEC.
Purchases
and
redemptions
of
fund
shares
are
transacted
at
the
next-computed
NAV
per
share,
after
receipt
of
the
transaction
order
by
T.
Rowe
Price
Associates,
Inc.,
or
its
agents.
New
Accounting
Guidance
In
November
2023,
the
FASB
issued
Accounting
Standards
Update
(ASU),
ASU
2023-07,
Segment
Reporting
(Topic
280)
–
Improvements
to
Reportable
Segment
Disclosures,
which
improves
reportable
segment
disclosure
requirements,
primarily
through
enhanced
disclosures
about
segment
expenses.
In
addition,
the
ASU
clarifies
that
a
public
entity
with
a
single
reportable
segment
provide
all
disclosures
required
by
the
ASU
and
all
existing
segment
disclosures
in
Topic
280.
The
amendments
under
this
ASU
are
effective
for
fiscal
years
beginning
after
December
15,
2023.
Management
expects
that
adoption
of
the
guidance
will
not
have
a
material
impact
on
the
fund’s
financial
statements.
Indemnification
In
the
normal
course
of
business, the
fund
may
provide
indemnification
in
connection
with
its
officers
and
directors,
service
providers,
and/or
private
company
investments. The
fund’s
maximum
exposure
under
these
arrangements
is
unknown;
however,
the
risk
of
material
loss
is
currently
considered
to
be
remote.
NOTE
2
-
VALUATION
Fair
Value
The
fund’s
financial
instruments
are
valued
at
the
close
of
the
NYSE
and
are
reported
at
fair
value,
which
GAAP
defines
as
the
price
that
would
be
received
to
sell
an
asset
or
paid
to
transfer
a
liability
in
an
orderly
transaction
between
market
participants
at
the
measurement
date. The fund’s
Board
of
Directors
(the
Board)
has
designated
T.
Rowe
Price
Associates,
Inc.
as
the
fund’s
valuation
designee
(Valuation
Designee).
Subject
to
oversight
by
the
Board,
the
Valuation
Designee
performs
the
following
functions
in
performing
fair
value
determinations:
assesses
and
manages
valuation
risks;
establishes
and
applies
fair
value
methodologies;
tests
fair
value
methodologies;
and
evaluates
pricing
vendors
and
pricing
agents.
The
duties
T.
ROWE
PRICE
International
Value
Equity
Fund
and
responsibilities
of
the
Valuation
Designee
are
performed
by
its
Valuation
Committee. The
Valuation
Designee provides
periodic
reporting
to
the
Board
on
valuation
matters.
Various
valuation
techniques
and
inputs
are
used
to
determine
the
fair
value
of
financial
instruments.
GAAP
establishes
the
following
fair
value
hierarchy
that
categorizes
the
inputs
used
to
measure
fair
value:
Level
1
–
quoted
prices
(unadjusted)
in
active
markets
for
identical
financial
instruments
that
the
fund
can
access
at
the
reporting
date
Level
2
–
inputs
other
than
Level
1
quoted
prices
that
are
observable,
either
directly
or
indirectly
(including,
but
not
limited
to,
quoted
prices
for
similar
financial
instruments
in
active
markets,
quoted
prices
for
identical
or
similar
financial
instruments
in
inactive
markets,
interest
rates
and
yield
curves,
implied
volatilities,
and
credit
spreads)
Level
3
–
unobservable
inputs
(including
the Valuation
Designee’s assumptions
in
determining
fair
value)
Observable
inputs
are
developed
using
market
data,
such
as
publicly
available
information
about
actual
events
or
transactions,
and
reflect
the
assumptions
that
market
participants
would
use
to
price
the
financial
instrument.
Unobservable
inputs
are
those
for
which
market
data
are
not
available
and
are
developed
using
the
best
information
available
about
the
assumptions
that
market
participants
would
use
to
price
the
financial
instrument.
GAAP
requires
valuation
techniques
to
maximize
the
use
of
relevant
observable
inputs
and
minimize
the
use
of
unobservable
inputs.
When
multiple
inputs
are
used
to
derive
fair
value,
the
financial
instrument
is
assigned
to
the
level
within
the
fair
value
hierarchy
based
on
the
lowest-level
input
that
is
significant
to
the
fair
value
of
the
financial
instrument.
Input
levels
are
not
necessarily
an
indication
of
the
risk
or
liquidity
associated
with
financial
instruments
at
that
level
but
rather
the
degree
of
judgment
used
in
determining
those
values.
Valuation
Techniques
Equity
securities,
including
exchange-traded
funds, listed
or
regularly
traded
on
a
securities
exchange
or
in
the
over-the-
counter
(OTC)
market
are
valued
at
the
last
quoted
sale
price
or,
for
certain
markets,
the
official
closing
price
at
the
time
the
valuations
are
made.
OTC
Bulletin
Board
securities
are
valued
at
the
mean
of
the
closing
bid
and
asked
prices.
A
security
that
is
listed
or
traded
on
more
than
one
exchange
is
valued
at
the
quotation
on
the
exchange
determined
to
be
the
primary
market
for
such
T.
ROWE
PRICE
International
Value
Equity
Fund
security.
Listed
securities
not
traded
on
a
particular
day
are
valued
at
the
mean
of
the
closing
bid
and
asked
prices
for
domestic
securities
and
the
last
quoted
sale
or
closing
price
for
international
securities.
The
last
quoted
prices
of
non-U.S.
equity
securities
may
be
adjusted
to
reflect
the
fair
value
of
such
securities
at
the
close
of
the
NYSE,
if
the Valuation
Designee
determines
that
developments
between
the
close
of
a
foreign
market
and
the
close
of
the
NYSE
will
affect
the
value
of
some
or
all
of
the
fund’s portfolio
securities.
Each
business
day,
the
Valuation
Designee uses
information
from
outside
pricing
services
to
evaluate
the
quoted
prices
of
portfolio
securities
and,
if
appropriate,
decide whether
it
is
necessary
to
adjust
quoted
prices
to
reflect
fair
value
by
reviewing
a
variety
of
factors,
including
developments
in
foreign
markets,
the
performance
of
U.S.
securities
markets,
and
the
performance
of
instruments
trading
in
U.S.
markets
that
represent
foreign
securities
and
baskets
of
foreign
securities. The Valuation
Designee
uses
outside
pricing
services
to
provide
it
with
quoted
prices
and
information
to
evaluate
or
adjust
those
prices.
The Valuation
Designee
cannot
predict
how
often
it
will
use
quoted
prices
and
how
often
it
will
determine
it
necessary
to
adjust
those
prices
to
reflect
fair
value.
Investments
in
mutual
funds
are
valued
at
the
mutual
fund’s
closing
NAV
per
share
on
the
day
of
valuation.
Forward
currency
exchange
contracts
are
valued
using
the
prevailing
forward
exchange
rate.
Assets
and
liabilities
other
than
financial
instruments,
including
short-term
receivables
and
payables,
are
carried
at
cost,
or
estimated
realizable
value,
if
less,
which
approximates
fair
value.
Investments
for
which
market
quotations are
not
readily
available
or
deemed
unreliable
are
valued
at
fair
value
as
determined
in
good
faith
by
the
Valuation
Designee.
The
Valuation
Designee
has
adopted
methodologies
for
determining
the
fair
value
of
investments
for
which
market
quotations
are
not
readily
available
or
deemed
unreliable,
including
the
use
of
other
pricing
sources.
Factors
used
in
determining
fair
value
vary
by
type
of
investment
and
may
include
market
or
investment
specific
considerations.
The
Valuation
Designee typically
will
afford
greatest
weight
to
actual
prices
in
arm’s
length
transactions,
to
the
extent
they
represent
orderly
transactions
between
market
participants,
transaction
information
can
be
reliably
obtained,
and
prices
are
deemed
representative
of
fair
value.
However,
the
Valuation
Designee may
also
consider
other
valuation
methods
such
as
market-based
valuation
multiples;
a
discount
or
premium
from
market
value
of
a
similar,
freely
traded
security
of
the
same
issuer;
discounted
cash
flows;
yield
to
maturity;
or
some
combination.
Fair
value
determinations
are
reviewed
on
a
regular
basis.
Because
any
fair
T.
ROWE
PRICE
International
Value
Equity
Fund
value
determination
involves
a
significant
amount
of
judgment,
there
is
a
degree
of
subjectivity
inherent
in
such
pricing
decisions. Fair
value
prices
determined
by
the
Valuation
Designee could
differ
from
those
of
other
market
participants,
and
it
is
possible
that
the
fair
value
determined
for
a
security
may
be
materially
different
from
the
value
that
could
be
realized
upon
the
sale
of
that
security.
Valuation
Inputs
The
following
table
summarizes
the
fund’s
financial
instruments,
based
on
the
inputs
used
to
determine
their
fair
values
on
October
31,
2024
(for
further
detail
by
category,
please
refer
to
the
accompanying
Portfolio
of
Investments):
NOTE
3
-
DERIVATIVE
INSTRUMENTS
During
the
year ended
October
31,
2024,
the
fund
invested
in
derivative
instruments.
As
defined
by
GAAP,
a
derivative
is
a
financial
instrument
whose
value
is
derived
from
an
underlying
security
price,
foreign
exchange
rate,
interest
rate,
index
of
prices
or
rates,
or
other
variable;
it
requires
little
or
no
initial
investment
and
permits
or
requires
net
settlement
or
delivery
of
cash
or
other
assets.
The
fund
invests
in
derivatives
only
if
the
expected
risks
and
rewards
are
consistent
with
its
investment
objectives,
policies,
and
overall
risk
profile,
as
described
in
its
prospectus
and
Statement
of
Additional
Information.
The
fund
may
use
derivatives
for
a
variety
of
purposes
and
may
use
them
to
establish
both
long
and
short
positions
within
the
fund’s
portfolio.
Potential
uses
include
to
hedge
against
declines
in
principal
value,
increase
yield,
invest
in
an
($000s)
Level
1
Level
2
Level
3
Total
Value
Assets
Common
Stocks
$
770,969
$
10,891,531
$
—
$
11,662,500
Preferred
Stocks
—
77,459
—
77,459
Short-Term
Investments
254,836
—
—
254,836
Securities
Lending
Collateral
183,684
—
—
183,684
Total
$
1,209,489
$
10,968,990
$
—
$
12,178,479
Liabilities
Forward
Currency
Exchange
Contracts
$
—
$
8,809
$
—
$
8,809
T.
ROWE
PRICE
International
Value
Equity
Fund
asset
with
greater
efficiency
and
at
a
lower
cost
than
is
possible
through
direct
investment,
to
enhance
return,
or
to
adjust
credit
exposure.
The
risks
associated
with
the
use
of
derivatives
are
different
from,
and
potentially
much
greater
than,
the
risks
associated
with
investing
directly
in
the
instruments
on
which
the
derivatives
are
based.
The
fund
values
its
derivatives
at
fair
value
and
recognizes
changes
in
fair
value
currently
in
its
results
of
operations.
Accordingly,
the
fund
does
not
follow
hedge
accounting,
even
for
derivatives
employed
as
economic
hedges.
Generally,
the
fund
accounts
for
its
derivatives
on
a
gross
basis.
It
does
not
offset
the
fair
value
of
derivative
liabilities
against
the
fair
value
of
derivative
assets
on
its
financial
statements,
nor
does
it
offset
the
fair
value
of
derivative
instruments
against
the
right
to
reclaim
or
obligation
to
return
collateral.
The
following
table
summarizes
the
fair
value
of
the
fund’s
derivative
instruments
held
as
of
October
31,
2024,
and
the
related
location
on
the
accompanying
Statement
of
Assets
and
Liabilities,
presented
by
primary
underlying
risk
exposure:
($000s)
Location
on
Statement
of
Assets
and
Liabilities
Fair
Value
Liabilities
Foreign
exchange
derivatives
Forwards
$
8,809
Total
$
8,809
T.
ROWE
PRICE
International
Value
Equity
Fund
Additionally,
the
amount
of
gains
and
losses
on
derivative
instruments
recognized
in
fund
earnings
during
the
year ended
October
31,
2024,
and
the
related
location
on
the
accompanying
Statement
of
Operations
is
summarized
in
the
following
table
by
primary
underlying
risk
exposure:
Counterparty
Risk
and
Collateral
The
fund
invests
in
derivatives,
such
as
non-cleared
bilateral
swaps,
forward
currency
exchange
contracts,
and/or
OTC
options,
that
are
transacted
and
settle
directly
with
a
counterparty
(bilateral
derivatives),
and
thereby
may
expose
the
fund
to
counterparty
risk.
To
mitigate
this
risk,
the
fund
has
entered
into
master
netting
arrangements
(MNAs)
with
certain
counterparties
that
permit
net
settlement
under
specified
conditions
and,
for
certain
counterparties,
also
require
the
exchange
of
collateral
to
cover
mark-to-market
exposure.
MNAs
may
be
in
the
form
of
International
Swaps
and
Derivatives
Association
master
agreements
(ISDAs)
or
foreign
exchange
letter
agreements
(FX
letters).
MNAs
govern
the
ability
to
offset
amounts
the
fund
owes
a
counterparty
against
amounts
the
counterparty
owes
the
fund
(net
settlement).
Both
ISDAs
and
FX
letters
generally
allow
termination
of
transactions
and
net
settlement
upon
the
occurrence
of
contractually
specified
events,
such
as
failure
to
pay
or
bankruptcy.
In
addition,
ISDAs
specify
other
events,
the
occurrence
of
which
would
allow
one
of
the
parties
to
terminate.
For
example,
a
downgrade
in
credit
rating
of
a
counterparty
below
a
specified
rating
would
allow
the
fund
to
terminate,
while
a
decline
in
the
fund’s
net
assets
of
more
than
a
specified
($000s)
Location
of
Gain
(Loss)
on
Statement
of
Operations
Forward
Currency
Exchange
Contracts
Realized
Gain
(Loss)
Foreign
exchange
derivatives
$
18,703
Total
$
18,703
Change
in
Unrealized
Gain
(Loss)
Foreign
exchange
derivatives
$
(8,809)
Total
$
(8,809)
T.
ROWE
PRICE
International
Value
Equity
Fund
percentage
would
allow
the
counterparty
to
terminate.
Upon
termination,
all
transactions
with
that
counterparty
would
be
liquidated
and
a
net
termination
amount
determined.
ISDAs
typically
include
collateral
agreements
whereas
FX
letters
do
not.
Collateral
requirements
are
determined
daily
based
on
the
net
aggregate
unrealized
gain
or
loss
on
all
bilateral
derivatives
with
each
counterparty,
subject
to
minimum
transfer
amounts
that
typically
range
from
$100,000
to
$250,000.
Any
additional
collateral
required
due
to
changes
in
security
values
is
typically
transferred
the
next
business
day.
Collateral may
be
in
the
form
of
cash
or
debt
securities
issued
by
the
U.S.
government
or
related
agencies,
although
other
securities
may
be
used
depending
on
the
terms
outlined
in
the
applicable
MNA.
Cash
posted
by
the
fund
is
reflected
as
cash
deposits
in
the
accompanying
financial
statements
and
generally
is
restricted
from
withdrawal
by
the
fund;
securities
posted
by
the
fund
are
so
noted
in
the
accompanying
Portfolio
of
Investments;
both
remain
in
the
fund’s
assets.
Collateral
pledged
by
counterparties
is
not
included
in
the
fund’s
assets
because
the
fund
does
not
obtain
effective
control
over
those
assets.
For
bilateral
derivatives,
collateral
posted
or
received
by
the
fund
is
held
in
a
segregated
account
at
the
fund’s
custodian.
While
typically
not
sold
in
the
same
manner
as
equity
or
fixed
income
securities,
OTC
and
bilateral
derivatives
may
be
unwound
with
counterparties
or
transactions
assigned
to
other
counterparties
to
allow
the
fund
to
exit
the
transaction.
This
ability
is
subject
to
the
liquidity
of
underlying
positions. As
of
October
31,
2024,
cash of
$10,990,000
had
been
posted
by
the
fund
to
counterparties
for
bilateral
derivatives. As
of
October
31,
2024,
no
collateral
was
pledged
by
counterparties
to
the
fund
for
bilateral
derivatives.
Forward
Currency
Exchange
Contracts
The
fund
is
subject
to
foreign
currency
exchange
rate
risk
in
the
normal
course
of
pursuing
its
investment
objectives.
It may use
forward
currency
exchange
contracts
(forwards)
primarily
to
protect
its
non-U.S.
dollar-denominated
securities
from
adverse
currency
movements
or
to
increase
exposure
to
a
particular
foreign
currency,
to
shift
the
fund’s
foreign
currency
exposure
from
one
country
to
another,
or
to
enhance
the
fund’s
return.
A
forward
involves
an
obligation
to
purchase
or
sell
a
fixed
amount
of
a
specific
currency
on
a
future
date
at
a
price
set
at
the
time
of
the
contract.
Although
certain
forwards
may
be
settled
by
exchanging
only
the
net
gain
or
loss
on
the
contract,
most
forwards
are
settled
with
the
exchange
of
the
underlying
currencies
in
accordance
with
the
specified
terms.
Forwards
are
valued
at
the
unrealized
gain
or
loss
on
the
contract,
which
reflects
the
net
amount
the
fund
either
is
entitled
to
receive
or
obligated
to
deliver,
as
measured
by
the
difference
between
the
forward
exchange
rates
at
the
date
of
entry
into
T.
ROWE
PRICE
International
Value
Equity
Fund
the
contract
and
the
forward
rates
at
the
reporting
date.
Appreciated
forwards
are
reflected
as
assets
and
depreciated
forwards
are
reflected
as
liabilities
on
the
accompanying
Statement
of
Assets
and
Liabilities.
When
a
contract
is
closed,
a
realized
gain
or
loss
is
recorded
on
the
accompanying
Statement
of
Operations.
Risks
related
to
the
use
of
forwards
include
the
possible
failure
of
counterparties
to
meet
the
terms
of
the
agreements;
that
anticipated
currency
movements
will
not
occur,
thereby
reducing
the
fund’s
total
return;
and
the
potential
for
losses
in
excess
of
the
fund’s
initial
investment.
During
the
year ended
October
31,
2024,
the
volume
of
the
fund’s
activity
in
forwards,
based
on
underlying
notional
amounts,
was
generally
between
0%
and
2%
of
net
assets.
NOTE
4
-
OTHER
INVESTMENT
TRANSACTIONS
Consistent
with
its
investment
objective, the
fund
engages
in
the
following
practices
to
manage
exposure
to
certain
risks
and/or
to
enhance
performance.
The
investment
objective,
policies,
program,
and
risk
factors
of the
fund
are
described
more
fully
in the
fund’s prospectus
and
Statement
of
Additional
Information.
Securities
Lending
The fund
may
lend
its
securities
to
approved
borrowers
to
earn
additional
income.
Its
securities
lending
activities
are
administered
by
a
lending
agent
in
accordance
with
a
securities
lending
agreement.
Security
loans
generally
do
not
have
stated
maturity
dates,
and
the
fund
may
recall
a
security
at
any
time.
The
fund
receives
collateral
in
the
form
of
cash
or
U.S.
government
securities.
Collateral
is
maintained
over
the
life
of
the
loan
in
an
amount
not
less
than
the
value
of
loaned
securities;
any
additional
collateral
required
due
to
changes
in
security
values
is
delivered
to
the
fund
the
next
business
day.
Cash
collateral
is
invested
in
accordance
with
investment
guidelines
approved
by
fund
management.
Additionally,
the
lending
agent
indemnifies
the
fund
against
losses
resulting
from
borrower
default.
Although
risk
is
mitigated
by
the
collateral
and
indemnification,
the
fund
could
experience
a
delay
in
recovering
its
securities
and
a
possible
loss
of
income
or
value
if
the
borrower
fails
to
return
the
securities,
collateral
investments
decline
in
value,
and
the
lending
agent
fails
to
perform.
Securities
lending
revenue
consists
of
earnings
on
invested
collateral
and
borrowing
fees,
net
of
any
rebates
to
the
borrower,
compensation
to
the
lending
agent,
and
other
administrative
costs.
In
accordance
with
GAAP,
investments
made
with
cash
collateral
are
reflected
in
the
accompanying
T.
ROWE
PRICE
International
Value
Equity
Fund
financial
statements,
but
collateral
received
in
the
form
of
securities
is
not.
At
October
31,
2024,
the
value
of
loaned
securities
was
$174,875,000;
the
value
of
cash
collateral
and
related
investments
was
$183,684,000.
Other
Purchases
and
sales
of
portfolio
securities
other
than
in-kind
transactions,
if
any,
and short-term securities
aggregated $2,071,453,000 and
$1,781,081,000,
respectively,
for
the
year ended
October
31,
2024.
NOTE
5
-
FEDERAL
INCOME
TAXES
Generally,
no
provision
for
federal
income
taxes
is
required
since
the
fund
intends
to continue
to
qualify
as
a
regulated
investment
company
under
Subchapter
M
of
the
Internal
Revenue
Code
and
distribute
to
shareholders
all
of
its taxable
income
and
gains.
Distributions
determined
in
accordance
with
federal
income
tax
regulations
may
differ
in
amount
or
character
from
net
investment
income
and
realized
gains
for
financial
reporting
purposes.
The
fund
files
U.S.
federal,
state,
and
local
tax
returns
as
required.
The
fund’s
tax
returns
are
subject
to
examination
by
the
relevant
tax
authorities
until
expiration
of
the
applicable
statute
of
limitations,
which
is
generally
three
years
after
the
filing
of
the
tax
return
but
which
can
be
extended
to
six
years
in
certain
circumstances.
Tax
returns
for
open
years
have
incorporated
no
uncertain
tax
positions
that
require
a
provision
for
income
taxes.
Capital
accounts
within
the
financial
reporting
records
are
adjusted
for
permanent
book/tax
differences
to
reflect
tax
character
but
are
not
adjusted
for
temporary
differences.
The
permanent
book/tax
adjustments,
if
any,
have
no
impact
on
results
of
operations
or
net
assets.
The
permanent
book/tax
adjustments
relate
primarily
to
redemptions
in
kind,
deemed
distributions
on
shareholder
redemptions,
the
character
of
net
currency
gains
or
losses
and
the
character
of
income
on
passive
foreign
investment
companies.
The
tax
character
of
distributions
paid
for
the
periods
presented
was
as
follows:
($000s)
October
31,
2024
October
31,
2023
Ordinary
income
(including
short-term
capital
gains,
if
any)
$
366,344
$
390,944
T.
ROWE
PRICE
International
Value
Equity
Fund
At
October
31,
2024,
the
tax-basis
cost
of
investments
(including
derivatives,
if
any)
and
gross
unrealized
appreciation
and
depreciation
were as
follows:
At
October
31,
2024,
the
tax-basis
components
of
accumulated
net
earnings
(loss)
were
as
follows:
Temporary
differences
between
book-basis
and
tax-basis
components
of
total
distributable
earnings
(loss)
arise
when
certain
items
of
income,
gain,
or
loss
are
recognized
in
different
periods
for
financial
statement
purposes
versus
for
tax
purposes;
these
differences
will
reverse
in
a
subsequent
reporting
period.
The
temporary
differences
relate
primarily
to
the
deferral
of
losses
from
wash
sales,
the
realization
of
gains/losses
on
passive
foreign
investment
companies
and
certain
open
derivative
contracts
and
differences
in
treatment
of
corporate
actions.
The
loss
carryforwards
and
deferrals
primarily
relate
to
capital
loss
carryforwards.
Capital
loss
carryforwards
are
available
indefinitely
to
offset
future
realized
capital
gains.
During
the
year
ended
October
31,
2024,
the
fund
utilized
$405,974,000
of
capital
loss
carryforwards.
NOTE
6
-
FOREIGN TAXES
The
fund
is
subject
to
foreign
income
taxes
imposed
by
certain
countries
in
which
it
invests.
Additionally,
capital
gains
realized
upon
disposition
of
securities
issued
in
or
by
certain
foreign
countries
are
subject
to
capital
gains
tax
imposed
by
those
countries.
All
taxes
are
computed
in
accordance
with
the
applicable
foreign
tax
law,
and,
to
the
extent
permitted,
capital
losses
are
used
to
offset
capital
gains.
Taxes
attributable
to
income
are
accrued
by
the
fund
as
a
($000s)
Cost
of
investments
$
10,127,696
Unrealized
appreciation
$
3,310,792
Unrealized
depreciation
(1,261,846)
Net
unrealized
appreciation
(depreciation)
$
2,048,946
($000s)
Undistributed
ordinary
income
$
361,761
Net
unrealized
appreciation
(depreciation)
2,048,946
Loss
carryforwards
and
deferrals
(389,515)
Total
distributable
earnings
(loss)
$
2,021,192
T.
ROWE
PRICE
International
Value
Equity
Fund
reduction
of
income.
Current
and
deferred
tax
expense
attributable
to
capital
gains
is
reflected
as
a
component
of
realized
or
change
in
unrealized
gain/
loss
on
securities
in
the
accompanying
financial
statements.
To
the
extent
that
the
fund
has
country
specific
capital
loss
carryforwards,
such
carryforwards
are
applied
against
net
unrealized
gains
when
determining
the
deferred
tax
liability.
Any
deferred
tax
liability
incurred
by
the
fund
is
included
in
either
Other
liabilities
or
Deferred
tax
liability
on
the
accompanying
Statement
of
Assets
and
Liabilities.
NOTE
7
-
RELATED
PARTY
TRANSACTIONS
The
fund
is
managed
by
T.
Rowe
Price
Associates,
Inc.
(Price
Associates),
a
wholly
owned
subsidiary
of
T.
Rowe
Price
Group,
Inc.
(Price
Group). Price
Associates
has
entered
into
a
sub-advisory
agreement(s)
with
one
or
more
of
its
wholly
owned
subsidiaries,
to
provide
investment
advisory
services
to
the
fund.
The
investment
management
agreement
between
the
fund
and
Price
Associates
provides
for
an
annual
investment
management
fee,
which
is
computed
daily
and
paid
monthly. The
fee
consists
of
an
individual
fund
fee,
equal
to
0.35%
of
the
fund’s
average
daily
net
assets,
and
a
group
fee.
The
group
fee
rate
is
calculated
based
on
the
combined
net
assets
of
certain
mutual
funds
sponsored
by
Price
Associates
(the
group)
applied
to
a
graduated
fee
schedule,
with
rates
ranging
from
0.48%
for
the
first
$1
billion
of
assets
to
0.260%
for
assets
in
excess
of
$845
billion.
The
fund’s
group
fee
is
determined
by
applying
the
group
fee
rate
to
the
fund’s
average
daily
net
assets. At
October
31,
2024,
the
effective
annual
group
fee
rate
was
0.28%.
The
Investor
Class, Advisor
Class,
and R
Class are
each
subject
to
a
contractual
expense
limitation
through
the
expense
limitation
dates
indicated
in
the
table
below.
This
agreement
will
continue
through
the
expense
limitation
dates
indicated
in
the
table
below,
and
may
be
renewed,
revised,
or
revoked
only
with
approval
of
the
fund’s
Board.
During
the
limitation
period,
Price
Associates
is required
to
waive
or
pay
any
expenses
(excluding
interest;
expenses
related
to
borrowings,
taxes,
and
brokerage;
non-recurring,
extraordinary
expenses;
and
acquired
fund
fees
and
expenses)
that
would
otherwise
cause
the class’s ratio
of
annualized
total
expenses
to
average
net
assets
(net
expense
ratio)
to
exceed
its
expense
limitation.
Each
class
is
required
to
repay
Price
Associates
for
expenses
previously
waived/paid
to
the
extent
the
class’s net
assets
grow
or
expenses
decline
sufficiently
to
allow
repayment
without
causing
the class’s net
expense
ratio
(after
the
repayment
is
taken
into
account)
to
exceed
the
lesser
of:
(1)
the
expense
limitation
in
T.
ROWE
PRICE
International
Value
Equity
Fund
place
at
the
time
such
amounts
were
waived;
or
(2)
the class’s
current
expense
limitation.
However,
no
repayment
will
be
made
more
than
three
years
after
the
date
of
a
payment
or
waiver.
The
I
Class
is
also
subject
to
an
operating
expense
limitation
(I
Class
Limit)
pursuant
to
which
Price
Associates
is
contractually
required
to
pay
all
operating
expenses
of
the
I
Class,
excluding
management
fees;
interest;
expenses
related
to
borrowings,
taxes,
and
brokerage; non-recurring,
extraordinary expenses; and
acquired
fund
fees
and
expenses, to
the
extent
such
operating
expenses,
on
an
annualized
basis,
exceed
the
I
Class
Limit. This
agreement
will
continue
through
the
expense
limitation
date
indicated
in
the
table
below,
and
may
be
renewed,
revised,
or
revoked
only
with
approval
of
the
fund’s
Board.
The
I
Class
is
required
to
repay
Price
Associates
for
expenses
previously
paid
to
the
extent
the
class’s
net
assets
grow
or
expenses
decline
sufficiently
to
allow
repayment
without
causing
the
class’s
operating
expenses
(after
the
repayment
is
taken
into
account)
to
exceed
the
lesser
of:
(1)
the
I
Class
Limit
in
place
at
the
time
such
amounts
were
paid;
or
(2)
the
current
I
Class
Limit.
However,
no
repayment
will
be
made
more
than
three
years
after
the
date
of
a
payment
or
waiver.
The
Z
Class
is
also
subject
to
a
contractual
expense
limitation
agreement
whereby
Price
Associates
has
agreed
to
waive
and/or
bear
all
of
the
Z
Class’
expenses
(excluding
interest;
expenses
related
to
borrowings,
taxes,
and
brokerage;
non-recurring,
extraordinary
expenses;
and
acquired
fund
fees
and
expenses)
in
their
entirety.
This
fee
waiver
and/or
expense
reimbursement
arrangement
is
expected
to
remain
in
place
indefinitely,
and
the
agreement
may
only
be
amended
or
terminated
with
approval
by
the
fund’s
Board.
Expenses
of
the
fund
waived/paid
by
the
manager
are
not
subject
to
later
repayment
by
the
fund.
Pursuant
to
these
agreements,
expenses
were waived/paid
by
and/or
repaid
to
Price
Associates
during
the year
ended October
31,
2024 as
indicated
in
the
table
below.
Including
these
amounts,
expenses
previously
waived/paid
by
Price
Associates
in
the
amount
of $55,000 remain
subject
to
repayment
by
the
fund
at
October
31,
2024. Any
repayment
of
expenses
previously
waived/paid
by
Price
Associates
during
the
period
would
be
included
in
the
net
investment
income
and
expense
ratios
presented
on
the
accompanying
Financial
Highlights.
T.
ROWE
PRICE
International
Value
Equity
Fund
In
addition,
the
fund
has
entered
into
service
agreements
with
Price
Associates
and
two
wholly
owned
subsidiaries
of
Price
Associates,
each
an
affiliate
of
the
fund
(collectively,
Price).
Price
Associates
provides
certain
accounting
and
administrative
services
to
the
fund.
T.
Rowe
Price
Services,
Inc.
provides
shareholder
and
administrative
services
in
its
capacity
as
the
fund’s
transfer
and
dividend-disbursing
agent.
T.
Rowe
Price
Retirement
Plan
Services,
Inc.
provides
subaccounting
and
recordkeeping
services
for
certain
retirement
accounts
invested
in
the
Investor
Class,
R
Class
and
Advisor
Class.
For
the
year
ended
October
31,
2024,
expenses
incurred
pursuant
to
these
service
agreements
were
$119,000
for
Price
Associates;
$391,000
for
T.
Rowe
Price
Services,
Inc.;
and
$50,000
for
T.
Rowe
Price
Retirement
Plan
Services,
Inc.
All
amounts
due
to
and
due
from
Price,
exclusive
of
investment
management
fees
payable,
are
presented
net
on
the
accompanying
Statement
of
Assets
and
Liabilities.
T.
Rowe
Price
Investment
Services,
Inc.
(Investment
Services)
serves
as
distributor
to
the
fund.
Pursuant
to
an
underwriting
agreement,
no
compensation
for
any
distribution
services
provided
is
paid
to
Investment
Services
by
the
fund
(except
for
12b-1
fees
under
a
Board-approved
Rule
12b-1
plan).
Additionally,
the
fund
is
one
of
several
mutual
funds
in
which
certain
college
savings
plans
managed
by
Price
Associates invests.
As
approved
by
the
fund’s
Board
of
Directors,
shareholder
servicing
costs
associated
with
each
college
savings
plan
are
borne
by
the
fund
in
proportion
to
the
average
daily
value
of
its
shares
owned
by
the
college
savings
plan.
Price
has
agreed
to waive/reimburse
shareholder
servicing
costs in
excess
of
0.05%
of
the
fund’s
average
daily
value
of
its
shares
owned
by
the
college
savings
plan.
Any
amounts
waived/
paid
by
Price
under
this
voluntary
agreement
are
not
subject
to
repayment
by
the
fund.
Price
may
amend
or
terminate
this
voluntary
arrangement
at
any
Investor
Class
Advisor
Class
R
Class
I
Class
Z
Class
Expense
limitation/I
Class
Limit
0.99%
1.24%
1.49%
0.05%
0.00%
Expense
limitation
date
02/28/26
02/28/26
02/28/26
02/28/26
N/A
(Waived)/
repaid
during
the
period
($000s)
$—
$—
$—
$17
$(66,760)
T.
ROWE
PRICE
International
Value
Equity
Fund
time
without
prior
notice.
For
the
year ended
October
31,
2024,
the
fund
was
charged $196,000 for
shareholder
servicing
costs
related
to
the
college
savings
plans, of
which
$69,000
was
for
services
provided
by
Price.
All
amounts
due
to
and
due
from
Price,
exclusive
of
investment
management
fees
payable,
are
presented
net
on
the
accompanying
Statement
of
Assets
and
Liabilities. At
October
31,
2024,
approximately
41%
of
the
outstanding
shares
of
the
I
Class
were
held
by
college
savings
plans.
Mutual
funds,
trusts,
and
other
accounts
managed
by
Price
Associates
or
its
affiliates
(collectively,
Price
Funds
and
accounts)
may
invest
in
the
fund.
No
Price
fund
or
account
may
invest
for
the
purpose
of
exercising
management
or
control
over
the
fund.
At
October
31,
2024, 100%
of
the
Z
Class's
outstanding
shares
were
held
by
Price
Funds
and
accounts.
The fund
may
invest
its
cash
reserves
in
certain
open-end
management
investment
companies
managed
by
Price
Associates
and
considered
affiliates
of
the
fund:
the
T.
Rowe
Price
Government
Reserve
Fund
or
the
T.
Rowe
Price
Treasury
Reserve
Fund,
organized
as
money
market
funds
(together,
the
Price
Reserve
Funds).
The
Price
Reserve
Funds
are
offered
as
short-term
investment
options
to
mutual
funds,
trusts,
and
other
accounts
managed
by
Price
Associates
or
its
affiliates
and
are
not
available
for
direct
purchase
by
members
of
the
public.
Cash
collateral
from
securities
lending,
if
any,
is
invested
in
the
T.
Rowe
Price
Government
Reserve Fund. The
Price
Reserve
Funds
pay
no
investment
management
fees.
The fund may
participate
in
securities
purchase
and
sale
transactions
with
other
funds
or
accounts
advised
by
Price
Associates
(cross
trades),
in
accordance
with
procedures
adopted
by the
fund’s
Board
and
Securities
and
Exchange
Commission
rules,
which
require,
among
other
things,
that
such
purchase
and
sale
cross
trades
be
effected
at
the
independent
current
market
price
of
the
security.
During
the
year
ended
October
31,
2024,
the
fund
had
no
purchases
or
sales
cross
trades
with
other
funds
or
accounts
advised
by
Price
Associates.
NOTE
8
-
INTERFUND
LENDING
PROGRAM
Price
Associates
has
developed
and
manages
an
interfund
lending
program
that
provides
temporary
liquidity
to
the
T.
Rowe
Price-sponsored
mutual
funds.
The
program
permits
the
borrowing
and
lending
of
cash
between
the
fund
and
other
T.
Rowe
Price-sponsored
mutual
funds
at
rates
beneficial
to
both
the
borrowing
and
lending
funds.
Pursuant
to
program
guidelines,
the
fund
may
lend
up
to
15%
of
its
net
assets,
and
no
more
than
5%
of
its
net
assets
may
T.
ROWE
PRICE
International
Value
Equity
Fund
be
lent
to
any
one
borrower.
Loans
totaling
10%
or
more
of
a
borrowing
fund’s
total
assets
require
collateralization
at
102%
of
the
value
of
the
loan;
loans
of
less
than
10%
are
unsecured.
During
the
year ended
October
31,
2024,
the
fund
earned $3,000
in
interest
income
related
to
loans
made
to
other
funds
on
two days
in
the
average
amount
of
$7,800,000
and
at
an
average
annual
rate
of
6.94%.
At
October
31,
2024,
there
were
no
loans
outstanding.
NOTE
9
-
OTHER
MATTERS
Unpredictable environmental,
political,
social
and
economic
events,
including
but
not
limited
to,
environmental
or
natural
disasters,
war
and
conflict
(including
Russia’s
military
invasion
of
Ukraine
and
the
conflict
in
Israel,
Gaza
and
surrounding
areas),
terrorism,
geopolitical
developments
(including
trading
and
tariff
arrangements,
sanctions
and
cybersecurity
attacks),
and
public
health
epidemics
(including
the
global
outbreak
of
COVID-19)
and
similar
public
health
threats,
may
significantly
affect
the
economy
and
the
markets
and
issuers
in
which
a
fund
invests.
The
extent
and
duration
of
such
events
and
resulting
market
disruptions
cannot
be
predicted.
These
and
other
similar
events
may
cause
instability
across
global
markets,
including
reduced
liquidity
and
disruptions
in
trading
markets,
while
some
events
may
affect
certain
geographic
regions,
countries,
sectors,
and
industries
more
significantly
than
others,
and
exacerbate
other
pre-existing
political,
social,
and
economic
risks.
The
fund’s
performance
could
be
negatively
impacted
if
the
value
of
a
portfolio
holding
were
harmed
by
these
or
such
events.
Management
actively
monitors
the
risks
and
financial
impacts
arising
from
such
events.
T.
ROWE
PRICE
International
Value
Equity
Fund
REPORT
OF
INDEPENDENT
REGISTERED
PUBLIC
ACCOUNTING
FIRM
To
the
Board
of
Directors
of
T.
Rowe
Price
International
Funds,
Inc.
and
Shareholders
of
T.
Rowe
Price
International
Value
Equity
Fund
Opinion
on
the
Financial
Statements
We
have
audited
the
accompanying
statement
of
assets
and
liabilities,
including
the
portfolio
of
investments,
of
T.
Rowe
Price
International
Value
Equity
Fund
(one
of
the
funds
constituting
T.
Rowe
Price
International
Funds,
Inc.,
referred
to
hereafter
as
the
"Fund")
as
of
October
31,
2024,
the
related
statement
of
operations
for
the
year
ended
October
31,
2024,
the
statement
of
changes
in
net
assets
for
each
of
the
two
years
in
the
period
ended
October
31,
2024,
including
the
related
notes,
and
the
financial
highlights
for
each
of
the
periods
indicated
therein
(collectively
referred
to
as
the
“financial
statements”).
In
our
opinion,
the
financial
statements
present
fairly,
in
all
material
respects,
the
financial
position
of
the
Fund
as
of
October
31,
2024,
the
results
of
its
operations
for
the
year
then
ended,
the
changes
in
its
net
assets
for
each
of
the
two
years
in
the
period
ended
October
31,
2024
and
the
financial
highlights
for
each
of
the
periods
indicated
therein,
in
conformity
with
accounting
principles
generally
accepted
in
the
United
States
of
America.
Basis
for
Opinion
These
financial
statements
are
the
responsibility
of
the
Fund’s
management.
Our
responsibility
is
to
express
an
opinion
on
the
Fund’s
financial
statements
based
on
our
audits.
We
are
a
public
accounting
firm
registered
with
the
Public
Company
Accounting
Oversight
Board
(United
States)
(PCAOB)
and
are
required
to
be
independent
with
respect
to
the
Fund
in
accordance
with
the
U.S.
federal
securities
laws
and
the
applicable
rules
and
regulations
of
the
Securities
and
Exchange
Commission
and
the
PCAOB.
We
conducted
our
audits
of
these
financial
statements
in
accordance
with
the
standards
of
the
PCAOB.
Those
standards
require
that
we
plan
and
perform
the
audit
to
obtain
reasonable
assurance
about
whether
the
financial
statements
are
free
of
material
misstatement,
whether
due
to
error
or
fraud.
T.
ROWE
PRICE
International
Value
Equity
Fund
Our
audits
included
performing
procedures
to
assess
the
risks
of
material
misstatement
of
the
financial
statements,
whether
due
to
error
or
fraud,
and
performing
procedures
that
respond
to
those
risks.
Such
procedures
included
examining,
on
a
test
basis,
evidence
regarding
the
amounts
and
disclosures
in
the
financial
statements.
Our
audits
also
included
evaluating
the
accounting
principles
used
and
significant
estimates
made
by
management,
as
well
as
evaluating
the
overall
presentation
of
the
financial
statements.
Our
procedures
included
confirmation
of
securities
owned
as
of
October
31,
2024
by
correspondence
with
the
custodian,
transfer
agent
and
brokers;
when
replies
were
not
received
from
brokers,
we
performed
other
auditing
procedures.
We
believe
that
our
audits
provide
a
reasonable
basis
for
our
opinion.
/s/
PricewaterhouseCoopers
LLP
Baltimore,
Maryland
December
18,
2024
We
have
served
as
the
auditor
of
one
or
more
investment
companies
in
the
T.
Rowe
Price
group
of
investment
companies
since
1973.
REPORT
OF
INDEPENDENT
REGISTERED
PUBLIC
ACCOUNTING
FIRM
(continued)
T.
ROWE
PRICE
International
Value
Equity
Fund
TAX
INFORMATION
(UNAUDITED)
FOR
THE
TAX
YEAR
ENDED 10/31/24
We
are
providing
this
information
as
required
by
the
Internal
Revenue
Code.
The
amounts
shown
may
differ
from
those
elsewhere
in
this
report
because
of
differences
between
tax
and
financial
reporting
requirements.
For
taxable
non-corporate
shareholders,
$353,353,000
of
the
fund's
income
represents
qualified
dividend
income
subject
to
a
long-term
capital
gains
tax
rate
of
not
greater
than
20%.
The
fund
will
pass
through
foreign
source
income
of
$406,818,000
and
foreign
taxes
paid
of
$19,145,000.
100
East
Pratt
Street
Baltimore,
MD
21202
T.
Rowe
Price
Investment
Services,
Inc.
Call
1-800-225-5132
to
request
a
prospectus
or
summary
prospectus;
each
includes
investment
objectives,
risks,
fees,
expenses,
and
other
information
that
you
should
read
and
consider
carefully
before
investing.
F127-050
12/24
Item 8. Changes in and Disagreements with Accountants for Open-End Management Investment Companies.
Not applicable.
Item 9. Proxy Disclosures for Open-End Management Investment Companies.
Not applicable.
Item 10. Remuneration Paid to Directors, Officers, and Others of Open-End Management Investment Companies.
Remuneration paid to Directors is included in Item 7 of this Form N-CSR.
Item 11. Statement Regarding Basis for Approval of Investment Advisory Contract.
If applicable, see Item 7.
Item 12. Disclosure of Proxy Voting Policies and Procedures for Closed-End Management Investment Companies.
Not applicable.
Item 13. Portfolio Managers of Closed-End Management Investment Companies.
Not applicable.
Item 14. Purchases of Equity Securities by Closed-End Management Investment Company and Affiliated Purchasers.
Not applicable.
Item 15. Submission of Matters to a Vote of Security Holders.
There has been no change to the procedures by which shareholders may recommend nominees to the registrant’s board of directors.
Item 16. Controls and Procedures.
(a) The registrant’s principal executive officer and principal financial officer have evaluated the registrant’s disclosure controls and procedures within 90 days of this filing and have concluded that the registrant’s disclosure controls and procedures were effective, as of that date, in ensuring that information required to be disclosed by the registrant in this Form N-CSR was recorded, processed, summarized, and reported timely.
(b) The registrant’s principal executive officer and principal financial officer are aware of no change in the registrant’s internal control over financial reporting that occurred during the period covered by this report that has materially affected, or is reasonably likely to materially affect, the registrant’s internal control over financial reporting.
Item 17. Disclosure of Securities Lending Activities for Closed-End Management Investment Companies.
Not applicable.
Item 18. Recovery of Erroneously Awarded Compensation.
Not applicable.
Item 19. Exhibits.
SIGNATURES
Pursuant to the requirements of the Securities Exchange Act of 1934 and the Investment Company Act of 1940, the registrant has duly caused this report to be signed on its behalf by the undersigned, thereunto duly authorized.
| | | | |
| T. Rowe Price International Funds, Inc. |
| By | | /s/ David Oestreicher | | |
| | David Oestreicher | | |
| | Principal Executive Officer | | |
| | |
| Date | | December 18, 2024 | | |
Pursuant to the requirements of the Securities Exchange Act of 1934 and the Investment Company Act of 1940, this report has been signed below by the following persons on behalf of the registrant and in the capacities and on the dates indicated.
| | | | |
| By | | /s/ David Oestreicher | | |
| | David Oestreicher | | |
| | Principal Executive Officer | | |
| | |
| Date | | December 18, 2024 | | |
| | |
| By | | /s/ Alan S. Dupski | | |
| | Alan S. Dupski | | |
| | Principal Financial Officer | | |
| | |
| Date | | December 18, 2024 | | |