UNITED STATES
SECURITIES AND EXCHANGE COMMISSION
Washington, D.C. 20549
FORM N-CSR
CERTIFIED SHAREHOLDER REPORT OF REGISTERED
MANAGEMENT INVESTMENT COMPANIES
Investment Company Act File Number: 811-02958
T. Rowe Price International Funds, Inc.
(Exact name of registrant as specified in charter)
100 East Pratt Street, Baltimore, MD 21202
(Address of principal executive offices)
David Oestreicher
100 East Pratt Street, Baltimore, MD 21202
(Name and address of agent for service)
Registrant’s telephone number, including area code: (410) 345-2000
Date of fiscal year end: October 31
Date of reporting period: October 31, 2024
Item 1. Reports to Shareholders
(a) Report pursuant to Rule 30e-1
Annual Shareholder Report
October 31, 2024
This annual shareholder report contains important information about International Stock Fund (the "fund") for the period of November 1, 2023 to October 31, 2024. You can find the fund’s prospectus, financial information on Form N‑CSR (which includes required tax information for dividends), holdings, proxy voting information, and other information atwww.troweprice.com/prospectus. You can also request this information without charge by contacting T. Rowe Price at 1‑800‑638‑5660 or info@troweprice.com or contacting your intermediary.
What were the fund costs for the last year? (based on a hypothetical $10,000 investment)
| | Costs of a $10,000 investment | Costs paid as a percentage of a $10,000 investment |
|---|
| International Stock Fund - Investor Class | $93 | 0.83% |
What drove fund performance during the past 12 months?
Non-U.S. developed and emerging markets stocks recorded a double-digit return over the 12-month reporting period as anticipation of interest rate cuts by the Federal Reserve and other central banks outweighed concerns about rising geopolitical tensions and persistent inflation in many markets.
Information technology (IT) contributed the most to relative performance versus the MSCI All Country World Index ex USA Net due to favorable stock selection, particularly in semiconductor-related names whose shares rallied amid investor enthusiasm for companies exposed to artificial intelligence. An overweight to IT, which outpaced the benchmark, also added value. Energy helped relative returns chiefly due to an underweight to the sector, which trailed the benchmark, and positive stock selection.
Financials detracted significantly from relative performance due to negative stock selection and an underweight to the sector, which outpaced the benchmark return. Health care stocks weighed on relative returns owing to an overweight to the sector, which underperformed the benchmark, and adverse selection.
The fund’s investment process relies on in-depth fundamental research to construct a diversified growth portfolio (i.e., cyclical growers, steady compounders, and high growth companies) with a focus on total return and companies with durable growth potential. Sector and country allocations are primarily driven by bottom-up stock selection. IT was the largest overweight versus the benchmark at period-end, driven by semiconductor industry holdings. Conversely, financials was the largest underweight.
How has the fund performed?
Cumulative Returns of a Hypothetical $10,000 Investment as of October 31, 2024
| Investor Class | Regulatory Benchmark | Strategy Benchmark |
|---|
| 2014 | 10,000 | 10,000 | 10,000 |
| 2015 | 9,792 | 9,695 | 9,877 |
| 2015 | 10,641 | 10,556 | 10,726 |
| 2015 | 10,486 | 10,073 | 10,360 |
| 2015 | 9,854 | 9,532 | 9,919 |
| 2016 | 9,021 | 8,536 | 9,084 |
| 2016 | 9,706 | 9,365 | 9,795 |
| 2016 | 9,939 | 9,515 | 10,159 |
| 2016 | 9,995 | 9,553 | 9,931 |
| 2017 | 10,224 | 9,910 | 10,083 |
| 2017 | 11,163 | 10,544 | 10,885 |
| 2017 | 11,966 | 11,323 | 11,772 |
| 2017 | 12,384 | 11,812 | 12,389 |
| 2018 | 13,283 | 12,852 | 13,463 |
| 2018 | 12,548 | 12,222 | 12,780 |
| 2018 | 12,588 | 11,995 | 12,719 |
| 2018 | 11,259 | 10,838 | 11,304 |
| 2019 | 11,763 | 11,235 | 11,783 |
| 2019 | 12,682 | 11,827 | 12,685 |
| 2019 | 12,552 | 11,723 | 12,807 |
| 2019 | 12,885 | 12,059 | 13,187 |
| 2020 | 13,517 | 12,352 | 13,810 |
| 2020 | 11,777 | 10,465 | 12,383 |
| 2020 | 13,547 | 11,800 | 14,498 |
| 2020 | 13,450 | 11,745 | 14,695 |
| 2021 | 15,931 | 14,075 | 17,143 |
| 2021 | 16,610 | 14,963 | 17,655 |
| 2021 | 16,708 | 15,079 | 17,875 |
| 2021 | 16,610 | 15,228 | 18,035 |
| 2022 | 15,635 | 14,585 | 16,464 |
| 2022 | 14,053 | 13,420 | 14,789 |
| 2022 | 13,834 | 12,777 | 14,209 |
| 2022 | 12,398 | 11,463 | 12,446 |
| 2023 | 14,754 | 13,752 | 14,945 |
| 2023 | 14,943 | 13,830 | 15,114 |
| 2023 | 15,614 | 14,491 | 15,729 |
| 2023 | 13,739 | 12,846 | 13,589 |
| 2024 | 15,556 | 14,560 | 15,592 |
| 2024 | 15,896 | 15,119 | 16,181 |
| 2024 | 16,848 | 15,903 | 16,938 |
| 2024 | 16,914 | 15,972 | 17,010 |
202411-4029887, 202412-3916157
Average Annual Total Returns
| | 1 Year | 5 Years | 10 Years |
|---|
| International Stock Fund (Investor Class) | 23.11% | 5.59% | 5.40% |
| MSCI All Country World Index ex-USA Net (Regulatory Benchmark) | 24.33 | 5.78 | 4.79 |
| MSCI All Country World Index ex USA Growth Net (Strategy Benchmark) | 25.18 | 5.22 | 5.46 |
The preceding line graph shows the value of a hypothetical $10,000 investment in the fund over the past 10 fiscal year periods or since inception (for funds lacking 10-year records). The fund’s performance information included in the line graph and table above is compared with a regulatory required index that represents an overall securities market (Regulatory Benchmark). In addition, the line graph and table may also include one or more indexes that more closely aligns to the fund's investment strategy (Strategy Benchmark(s)). Due to new SEC Rules on shareholder reporting the fund adopted a new broad-based securities market index, referred to as the Regulatory Benchmark. Market index returns do not include expenses, which are deducted from fund returns. The fund's total return figures reflect the reinvestment of dividends and capital gains, if any.Neither the fund’s returns nor the index returns reflect the deduction of taxes that a shareholder would pay on fund distributions or redemptions of fund shares.The fund’s past performance is not a good predictor of the fund’s future performance.Updated performance information can be found at www.troweprice.com.
What are some fund statistics?
- Total Net Assets (000s)$13,840,992
- Number of Portfolio Holdings132
- Investment Advisory Fees Paid (000s)$30,493
- Portfolio Turnover Rate31.0%
What did the fund invest in?
Sector Allocation (as a % of Net Assets)
| Information Technology | 19.8% |
| Industrials & Business Services | 16.6 |
| Health Care | 16.5 |
| Financials | 15.1 |
| Consumer Discretionary | 10.6 |
| Consumer Staples | 8.6 |
| Communication Services | 4.7 |
| Energy | 2.9 |
| Real Estate | 1.7 |
| Other | 3.5 |
Top Ten Holdings (as a % of Net Assets)
| Taiwan Semiconductor Manufacturing | 6.1% |
| ASML Holding | 2.2 |
| Prosus | 2.1 |
| Novo Nordisk | 2.1 |
| Deutsche Telekom | 1.8 |
| Canadian National Railway | 1.8 |
| SAP | 1.7 |
| MercadoLibre | 1.7 |
| Safran | 1.5 |
| Siemens | 1.5 |
If you invest directly with T. Rowe Price, you can elect to receive future shareholder reports or other important documents through electronic delivery by enrolling at www.troweprice.com/paperless. If you invest through a financial intermediary such as an investment advisor, a bank, retirement plan sponsor or a brokerage firm, please contact that organization and ask if it can provide electronic delivery.
MSCI does not accept any liability for any errors or omissions in the indexes or data, and hereby expressly disclaim all warranties of originality, accuracy, completeness, timeliness, merchantability and fitness for a particular purpose. No party may rely on any indexes or data contained in this communication. Visit www.troweprice.com/en/us/market-data-disclosures for additional legal notices & disclaimers.
International Stock Fund
Investor Class (PRITX)
T. Rowe Price Investment Services, Inc.
100 East Pratt Street
Baltimore, MD 21202
Annual Shareholder Report
October 31, 2024
This annual shareholder report contains important information about International Stock Fund (the "fund") for the period of November 1, 2023 to October 31, 2024. You can find the fund’s prospectus, financial information on Form N‑CSR (which includes required tax information for dividends), holdings, proxy voting information, and other information atwww.troweprice.com/prospectus. You can also request this information without charge by contacting T. Rowe Price at 1‑800‑638‑5660 or info@troweprice.com or contacting your intermediary.
What were the fund costs for the last year? (based on a hypothetical $10,000 investment)
| | Costs of a $10,000 investment | Costs paid as a percentage of a $10,000 investment |
|---|
| International Stock Fund - Advisor Class | $123 | 1.10% |
What drove fund performance during the past 12 months?
Non-U.S. developed and emerging markets stocks recorded a double-digit return over the 12-month reporting period as anticipation of interest rate cuts by the Federal Reserve and other central banks outweighed concerns about rising geopolitical tensions and persistent inflation in many markets.
Information technology (IT) contributed the most to relative performance versus the MSCI All Country World Index ex USA Net due to favorable stock selection, particularly in semiconductor-related names whose shares rallied amid investor enthusiasm for companies exposed to artificial intelligence. An overweight to IT, which outpaced the benchmark, also added value. Energy helped relative returns chiefly due to an underweight to the sector, which trailed the benchmark, and positive stock selection.
Financials detracted significantly from relative performance due to negative stock selection and an underweight to the sector, which outpaced the benchmark return. Health care stocks weighed on relative returns owing to an overweight to the sector, which underperformed the benchmark, and adverse selection.
The fund’s investment process relies on in-depth fundamental research to construct a diversified growth portfolio (i.e., cyclical growers, steady compounders, and high growth companies) with a focus on total return and companies with durable growth potential. Sector and country allocations are primarily driven by bottom-up stock selection. IT was the largest overweight versus the benchmark at period-end, driven by semiconductor industry holdings. Conversely, financials was the largest underweight.
How has the fund performed?
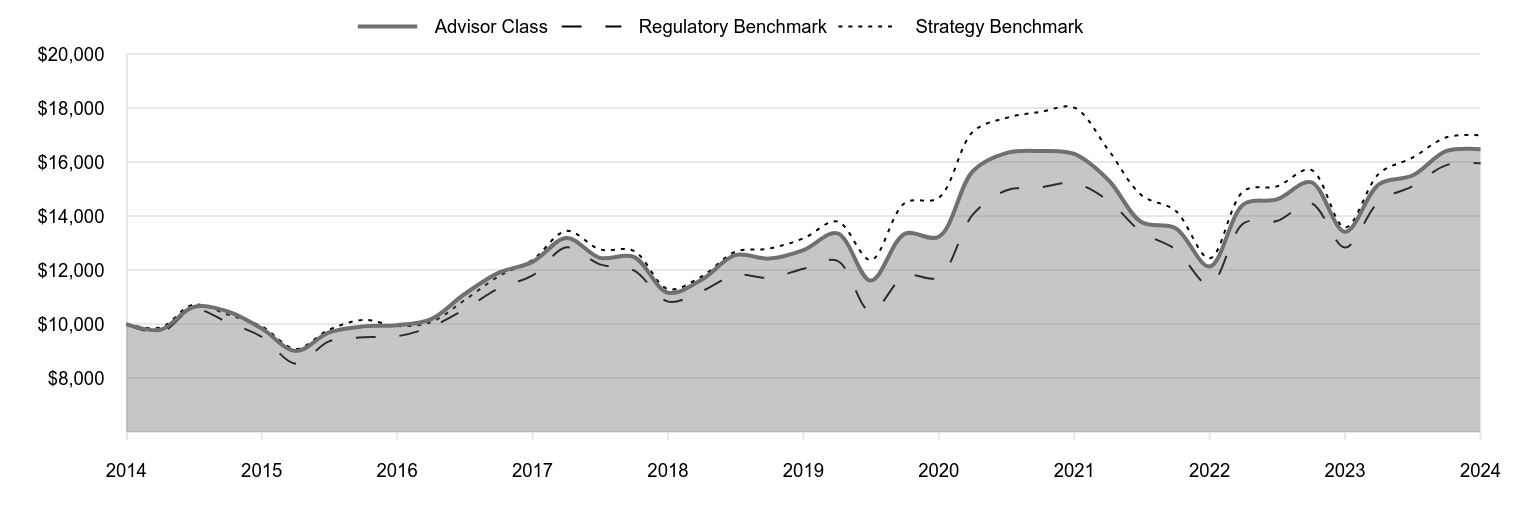
Cumulative Returns of a Hypothetical $10,000 Investment as of October 31, 2024
| Advisor Class | Regulatory Benchmark | Strategy Benchmark |
|---|
| 2014 | 10,000 | 10,000 | 10,000 |
| 2015 | 9,792 | 9,695 | 9,877 |
| 2015 | 10,640 | 10,556 | 10,726 |
| 2015 | 10,478 | 10,073 | 10,360 |
| 2015 | 9,842 | 9,532 | 9,919 |
| 2016 | 9,006 | 8,536 | 9,084 |
| 2016 | 9,693 | 9,365 | 9,795 |
| 2016 | 9,920 | 9,515 | 10,159 |
| 2016 | 9,964 | 9,553 | 9,931 |
| 2017 | 10,191 | 9,910 | 10,083 |
| 2017 | 11,112 | 10,544 | 10,885 |
| 2017 | 11,905 | 11,323 | 11,772 |
| 2017 | 12,314 | 11,812 | 12,389 |
| 2018 | 13,200 | 12,852 | 13,463 |
| 2018 | 12,464 | 12,222 | 12,780 |
| 2018 | 12,498 | 11,995 | 12,719 |
| 2018 | 11,168 | 10,838 | 11,304 |
| 2019 | 11,663 | 11,235 | 11,783 |
| 2019 | 12,563 | 11,827 | 12,685 |
| 2019 | 12,435 | 11,723 | 12,807 |
| 2019 | 12,749 | 12,059 | 13,187 |
| 2020 | 13,373 | 12,352 | 13,810 |
| 2020 | 11,621 | 10,465 | 12,383 |
| 2020 | 13,351 | 11,800 | 14,498 |
| 2020 | 13,248 | 11,745 | 14,695 |
| 2021 | 15,686 | 14,075 | 17,143 |
| 2021 | 16,347 | 14,963 | 17,655 |
| 2021 | 16,428 | 15,079 | 17,875 |
| 2021 | 16,317 | 15,228 | 18,035 |
| 2022 | 15,351 | 14,585 | 16,464 |
| 2022 | 13,792 | 13,420 | 14,789 |
| 2022 | 13,561 | 12,777 | 14,209 |
| 2022 | 12,145 | 11,463 | 12,446 |
| 2023 | 14,454 | 13,752 | 14,945 |
| 2023 | 14,630 | 13,830 | 15,114 |
| 2023 | 15,271 | 14,491 | 15,729 |
| 2023 | 13,429 | 12,846 | 13,589 |
| 2024 | 15,202 | 14,560 | 15,592 |
| 2024 | 15,517 | 15,119 | 16,181 |
| 2024 | 16,430 | 15,903 | 16,938 |
| 2024 | 16,495 | 15,972 | 17,010 |
202411-4029887, 202412-3916157
Average Annual Total Returns
| | 1 Year | 5 Years | 10 Years |
|---|
| International Stock Fund (Advisor Class) | 22.83% | 5.29% | 5.13% |
| MSCI All Country World Index ex-USA Net (Regulatory Benchmark) | 24.33 | 5.78 | 4.79 |
| MSCI All Country World Index ex USA Growth Net (Strategy Benchmark) | 25.18 | 5.22 | 5.46 |
The preceding line graph shows the value of a hypothetical $10,000 investment in the fund over the past 10 fiscal year periods or since inception (for funds lacking 10-year records). The fund’s performance information included in the line graph and table above is compared with a regulatory required index that represents an overall securities market (Regulatory Benchmark). In addition, the line graph and table may also include one or more indexes that more closely aligns to the fund's investment strategy (Strategy Benchmark(s)). Due to new SEC Rules on shareholder reporting the fund adopted a new broad-based securities market index, referred to as the Regulatory Benchmark. Market index returns do not include expenses, which are deducted from fund returns. The fund's total return figures reflect the reinvestment of dividends and capital gains, if any.Neither the fund’s returns nor the index returns reflect the deduction of taxes that a shareholder would pay on fund distributions or redemptions of fund shares.The fund’s past performance is not a good predictor of the fund’s future performance.Updated performance information can be found at www.troweprice.com.
What are some fund statistics?
- Total Net Assets (000s)$13,840,992
- Number of Portfolio Holdings132
- Investment Advisory Fees Paid (000s)$30,493
- Portfolio Turnover Rate31.0%
What did the fund invest in?
Sector Allocation (as a % of Net Assets)
| Information Technology | 19.8% |
| Industrials & Business Services | 16.6 |
| Health Care | 16.5 |
| Financials | 15.1 |
| Consumer Discretionary | 10.6 |
| Consumer Staples | 8.6 |
| Communication Services | 4.7 |
| Energy | 2.9 |
| Real Estate | 1.7 |
| Other | 3.5 |
Top Ten Holdings (as a % of Net Assets)
| Taiwan Semiconductor Manufacturing | 6.1% |
| ASML Holding | 2.2 |
| Prosus | 2.1 |
| Novo Nordisk | 2.1 |
| Deutsche Telekom | 1.8 |
| Canadian National Railway | 1.8 |
| SAP | 1.7 |
| MercadoLibre | 1.7 |
| Safran | 1.5 |
| Siemens | 1.5 |
If you invest directly with T. Rowe Price, you can elect to receive future shareholder reports or other important documents through electronic delivery by enrolling at www.troweprice.com/paperless. If you invest through a financial intermediary such as an investment advisor, a bank, retirement plan sponsor or a brokerage firm, please contact that organization and ask if it can provide electronic delivery.
MSCI does not accept any liability for any errors or omissions in the indexes or data, and hereby expressly disclaim all warranties of originality, accuracy, completeness, timeliness, merchantability and fitness for a particular purpose. No party may rely on any indexes or data contained in this communication. Visit www.troweprice.com/en/us/market-data-disclosures for additional legal notices & disclaimers.
International Stock Fund
Advisor Class (PAITX)
T. Rowe Price Investment Services, Inc.
100 East Pratt Street
Baltimore, MD 21202
Annual Shareholder Report
October 31, 2024
This annual shareholder report contains important information about International Stock Fund (the "fund") for the period of November 1, 2023 to October 31, 2024. You can find the fund’s prospectus, financial information on Form N‑CSR (which includes required tax information for dividends), holdings, proxy voting information, and other information atwww.troweprice.com/prospectus. You can also request this information without charge by contacting T. Rowe Price at 1‑800‑638‑5660 or info@troweprice.com or contacting your intermediary.
What were the fund costs for the last year? (based on a hypothetical $10,000 investment)
| | Costs of a $10,000 investment | Costs paid as a percentage of a $10,000 investment |
|---|
| International Stock Fund - R Class | $156 | 1.40% |
What drove fund performance during the past 12 months?
Non-U.S. developed and emerging markets stocks recorded a double-digit return over the 12-month reporting period as anticipation of interest rate cuts by the Federal Reserve and other central banks outweighed concerns about rising geopolitical tensions and persistent inflation in many markets.
Information technology (IT) contributed the most to relative performance versus the MSCI All Country World Index ex USA Net due to favorable stock selection, particularly in semiconductor-related names whose shares rallied amid investor enthusiasm for companies exposed to artificial intelligence. An overweight to IT, which outpaced the benchmark, also added value. Energy helped relative returns chiefly due to an underweight to the sector, which trailed the benchmark, and positive stock selection.
Financials detracted significantly from relative performance due to negative stock selection and an underweight to the sector, which outpaced the benchmark return. Health care stocks weighed on relative returns owing to an overweight to the sector, which underperformed the benchmark, and adverse selection.
The fund’s investment process relies on in-depth fundamental research to construct a diversified growth portfolio (i.e., cyclical growers, steady compounders, and high growth companies) with a focus on total return and companies with durable growth potential. Sector and country allocations are primarily driven by bottom-up stock selection. IT was the largest overweight versus the benchmark at period-end, driven by semiconductor industry holdings. Conversely, financials was the largest underweight.
How has the fund performed?
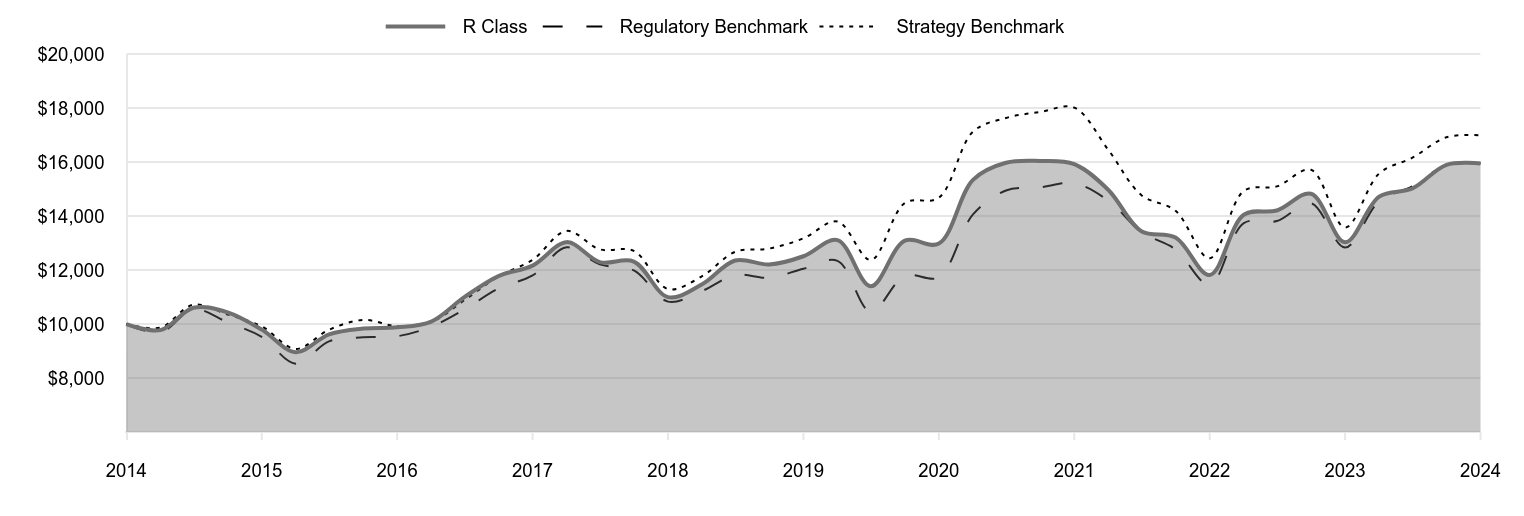
Cumulative Returns of a Hypothetical $10,000 Investment as of October 31, 2024
| R Class | Regulatory Benchmark | Strategy Benchmark |
|---|
| 2014 | 10,000 | 10,000 | 10,000 |
| 2015 | 9,781 | 9,695 | 9,877 |
| 2015 | 10,610 | 10,556 | 10,726 |
| 2015 | 10,442 | 10,073 | 10,360 |
| 2015 | 9,800 | 9,532 | 9,919 |
| 2016 | 8,960 | 8,536 | 9,084 |
| 2016 | 9,626 | 9,365 | 9,795 |
| 2016 | 9,839 | 9,515 | 10,159 |
| 2016 | 9,883 | 9,553 | 9,931 |
| 2017 | 10,097 | 9,910 | 10,083 |
| 2017 | 11,003 | 10,544 | 10,885 |
| 2017 | 11,787 | 11,323 | 11,772 |
| 2017 | 12,176 | 11,812 | 12,389 |
| 2018 | 13,046 | 12,852 | 13,463 |
| 2018 | 12,306 | 12,222 | 12,780 |
| 2018 | 12,326 | 11,995 | 12,719 |
| 2018 | 11,006 | 10,838 | 11,304 |
| 2019 | 11,484 | 11,235 | 11,783 |
| 2019 | 12,366 | 11,827 | 12,685 |
| 2019 | 12,216 | 11,723 | 12,807 |
| 2019 | 12,522 | 12,059 | 13,187 |
| 2020 | 13,122 | 12,352 | 13,810 |
| 2020 | 11,407 | 10,465 | 12,383 |
| 2020 | 13,100 | 11,800 | 14,498 |
| 2020 | 12,991 | 11,745 | 14,695 |
| 2021 | 15,358 | 14,075 | 17,143 |
| 2021 | 15,993 | 14,963 | 17,655 |
| 2021 | 16,060 | 15,079 | 17,875 |
| 2021 | 15,942 | 15,228 | 18,035 |
| 2022 | 14,981 | 14,585 | 16,464 |
| 2022 | 13,450 | 13,420 | 14,789 |
| 2022 | 13,214 | 12,777 | 14,209 |
| 2022 | 11,825 | 11,463 | 12,446 |
| 2023 | 14,063 | 13,752 | 14,945 |
| 2023 | 14,221 | 13,830 | 15,114 |
| 2023 | 14,840 | 14,491 | 15,729 |
| 2023 | 13,040 | 12,846 | 13,589 |
| 2024 | 14,735 | 14,560 | 15,592 |
| 2024 | 15,038 | 15,119 | 16,181 |
| 2024 | 15,915 | 15,903 | 16,938 |
| 2024 | 15,963 | 15,972 | 17,010 |
202411-4029887, 202412-3916157
Average Annual Total Returns
| | 1 Year | 5 Years | 10 Years |
|---|
| International Stock Fund (R Class) | 22.42% | 4.98% | 4.79% |
| MSCI All Country World Index ex-USA Net (Regulatory Benchmark) | 24.33 | 5.78 | 4.79 |
| MSCI All Country World Index ex USA Growth Net (Strategy Benchmark) | 25.18 | 5.22 | 5.46 |
The preceding line graph shows the value of a hypothetical $10,000 investment in the fund over the past 10 fiscal year periods or since inception (for funds lacking 10-year records). The fund’s performance information included in the line graph and table above is compared with a regulatory required index that represents an overall securities market (Regulatory Benchmark). In addition, the line graph and table may also include one or more indexes that more closely aligns to the fund's investment strategy (Strategy Benchmark(s)). Due to new SEC Rules on shareholder reporting the fund adopted a new broad-based securities market index, referred to as the Regulatory Benchmark. Market index returns do not include expenses, which are deducted from fund returns. The fund's total return figures reflect the reinvestment of dividends and capital gains, if any.Neither the fund’s returns nor the index returns reflect the deduction of taxes that a shareholder would pay on fund distributions or redemptions of fund shares.The fund’s past performance is not a good predictor of the fund’s future performance.Updated performance information can be found at www.troweprice.com.
What are some fund statistics?
- Total Net Assets (000s)$13,840,992
- Number of Portfolio Holdings132
- Investment Advisory Fees Paid (000s)$30,493
- Portfolio Turnover Rate31.0%
What did the fund invest in?
Sector Allocation (as a % of Net Assets)
| Information Technology | 19.8% |
| Industrials & Business Services | 16.6 |
| Health Care | 16.5 |
| Financials | 15.1 |
| Consumer Discretionary | 10.6 |
| Consumer Staples | 8.6 |
| Communication Services | 4.7 |
| Energy | 2.9 |
| Real Estate | 1.7 |
| Other | 3.5 |
Top Ten Holdings (as a % of Net Assets)
| Taiwan Semiconductor Manufacturing | 6.1% |
| ASML Holding | 2.2 |
| Prosus | 2.1 |
| Novo Nordisk | 2.1 |
| Deutsche Telekom | 1.8 |
| Canadian National Railway | 1.8 |
| SAP | 1.7 |
| MercadoLibre | 1.7 |
| Safran | 1.5 |
| Siemens | 1.5 |
If you invest directly with T. Rowe Price, you can elect to receive future shareholder reports or other important documents through electronic delivery by enrolling at www.troweprice.com/paperless. If you invest through a financial intermediary such as an investment advisor, a bank, retirement plan sponsor or a brokerage firm, please contact that organization and ask if it can provide electronic delivery.
MSCI does not accept any liability for any errors or omissions in the indexes or data, and hereby expressly disclaim all warranties of originality, accuracy, completeness, timeliness, merchantability and fitness for a particular purpose. No party may rely on any indexes or data contained in this communication. Visit www.troweprice.com/en/us/market-data-disclosures for additional legal notices & disclaimers.
International Stock Fund
R Class (RRITX)
T. Rowe Price Investment Services, Inc.
100 East Pratt Street
Baltimore, MD 21202
Annual Shareholder Report
October 31, 2024
This annual shareholder report contains important information about International Stock Fund (the "fund") for the period of November 1, 2023 to October 31, 2024. You can find the fund’s prospectus, financial information on Form N‑CSR (which includes required tax information for dividends), holdings, proxy voting information, and other information atwww.troweprice.com/prospectus. You can also request this information without charge by contacting T. Rowe Price at 1‑800‑638‑5660 or info@troweprice.com or contacting your intermediary.
What were the fund costs for the last year? (based on a hypothetical $10,000 investment)
| | Costs of a $10,000 investment | Costs paid as a percentage of a $10,000 investment |
|---|
| International Stock Fund - I Class | $76 | 0.68% |
What drove fund performance during the past 12 months?
Non-U.S. developed and emerging markets stocks recorded a double-digit return over the 12-month reporting period as anticipation of interest rate cuts by the Federal Reserve and other central banks outweighed concerns about rising geopolitical tensions and persistent inflation in many markets.
Information technology (IT) contributed the most to relative performance versus the MSCI All Country World Index ex USA Net due to favorable stock selection, particularly in semiconductor-related names whose shares rallied amid investor enthusiasm for companies exposed to artificial intelligence. An overweight to IT, which outpaced the benchmark, also added value. Energy helped relative returns chiefly due to an underweight to the sector, which trailed the benchmark, and positive stock selection.
Financials detracted significantly from relative performance due to negative stock selection and an underweight to the sector, which outpaced the benchmark return. Health care stocks weighed on relative returns owing to an overweight to the sector, which underperformed the benchmark, and adverse selection.
The fund’s investment process relies on in-depth fundamental research to construct a diversified growth portfolio (i.e., cyclical growers, steady compounders, and high growth companies) with a focus on total return and companies with durable growth potential. Sector and country allocations are primarily driven by bottom-up stock selection. IT was the largest overweight versus the benchmark at period-end, driven by semiconductor industry holdings. Conversely, financials was the largest underweight.
How has the fund performed?
Cumulative Returns of a Hypothetical $500,000 Investment as of October 31, 2024
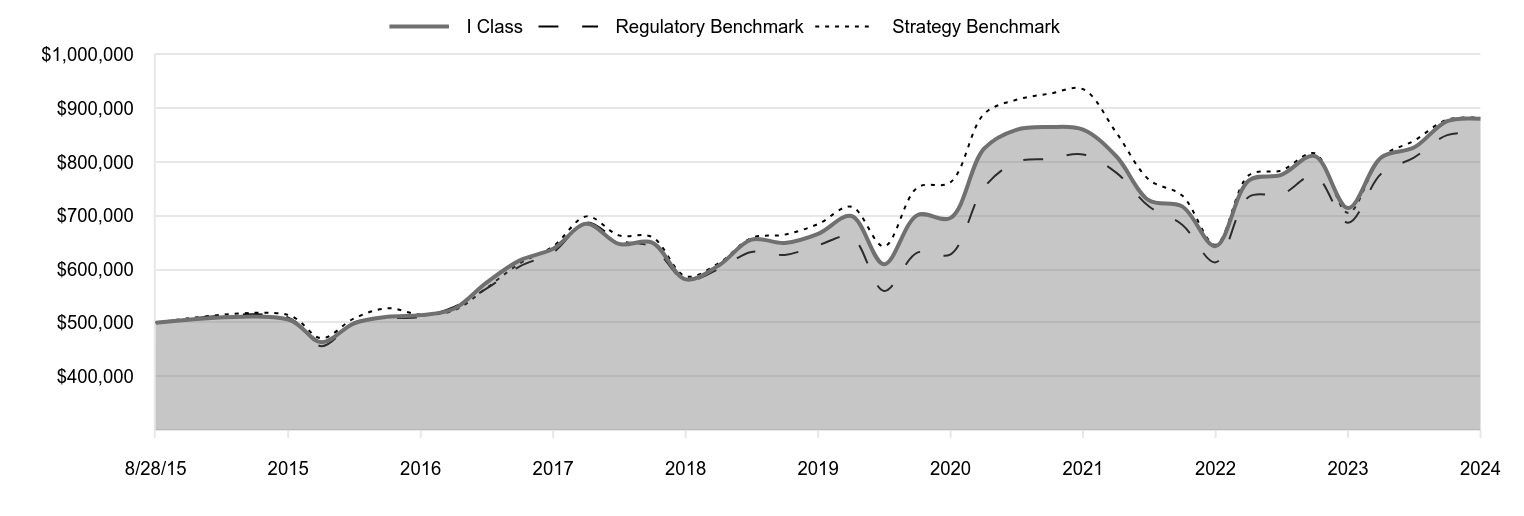
| I Class | Regulatory Benchmark | Strategy Benchmark |
|---|
| 8/28/15 | 500,000 | 500,000 | 500,000 |
| 10/31/15 | 506,047 | 509,520 | 514,619 |
| 1/31/16 | 463,629 | 456,299 | 471,295 |
| 4/30/16 | 499,119 | 500,598 | 508,189 |
| 7/31/16 | 511,057 | 508,585 | 527,110 |
| 10/31/16 | 514,283 | 510,663 | 515,283 |
| 1/31/17 | 526,112 | 529,735 | 523,155 |
| 4/30/17 | 574,753 | 563,639 | 564,761 |
| 7/31/17 | 616,444 | 605,251 | 610,773 |
| 10/31/17 | 637,952 | 631,372 | 642,804 |
| 1/31/18 | 684,663 | 686,970 | 698,492 |
| 4/30/18 | 647,090 | 653,299 | 663,055 |
| 7/31/18 | 649,526 | 641,196 | 659,894 |
| 10/31/18 | 580,990 | 579,341 | 586,491 |
| 1/31/19 | 607,389 | 600,542 | 611,344 |
| 4/30/19 | 655,262 | 632,194 | 658,168 |
| 7/31/19 | 648,903 | 626,611 | 664,472 |
| 10/31/19 | 665,734 | 644,620 | 684,219 |
| 1/31/20 | 699,156 | 660,238 | 716,507 |
| 4/30/20 | 609,215 | 559,414 | 642,494 |
| 7/31/20 | 700,694 | 630,751 | 752,228 |
| 10/31/20 | 695,697 | 627,789 | 762,425 |
| 1/31/21 | 824,749 | 752,365 | 889,439 |
| 4/30/21 | 859,977 | 799,831 | 916,003 |
| 7/31/21 | 865,066 | 806,000 | 927,419 |
| 10/31/21 | 860,369 | 813,999 | 935,733 |
| 1/31/22 | 810,188 | 779,642 | 854,199 |
| 4/30/22 | 728,496 | 717,364 | 767,313 |
| 7/31/22 | 717,126 | 682,964 | 737,214 |
| 10/31/22 | 643,013 | 612,722 | 645,724 |
| 1/31/23 | 765,695 | 735,078 | 775,387 |
| 4/30/23 | 775,961 | 739,237 | 784,193 |
| 7/31/23 | 811,038 | 774,585 | 816,092 |
| 10/31/23 | 713,936 | 686,689 | 705,055 |
| 1/31/24 | 808,633 | 778,299 | 808,993 |
| 4/30/24 | 826,824 | 808,171 | 839,522 |
| 7/31/24 | 876,199 | 850,078 | 878,833 |
| 10/31/24 | 880,531 | 853,778 | 882,559 |
202411-4029887, 202412-3916157
Average Annual Total Returns
| | 1 Year | 5 Years | Since Inception 8/28/15 |
|---|
| International Stock Fund (I Class) | 23.33% | 5.75% | 6.36% |
| MSCI All Country World Index ex-USA Net (Regulatory Benchmark) | 24.33 | 5.78 | 6.01 |
| MSCI All Country World Index ex USA Growth Net (Strategy Benchmark) | 25.18 | 5.22 | 6.39 |
The preceding line graph shows the value of a hypothetical $500,000 investment in the fund over the past 10 fiscal year periods or since inception (for funds lacking 10-year records). The fund’s performance information included in the line graph and table above is compared with a regulatory required index that represents an overall securities market (Regulatory Benchmark). In addition, the line graph and table may also include one or more indexes that more closely aligns to the fund's investment strategy (Strategy Benchmark(s)). Due to new SEC Rules on shareholder reporting the fund adopted a new broad-based securities market index, referred to as the Regulatory Benchmark. Market index returns do not include expenses, which are deducted from fund returns. The fund's total return figures reflect the reinvestment of dividends and capital gains, if any.Neither the fund’s returns nor the index returns reflect the deduction of taxes that a shareholder would pay on fund distributions or redemptions of fund shares.The fund’s past performance is not a good predictor of the fund’s future performance.Updated performance information can be found at www.troweprice.com.
What are some fund statistics?
- Total Net Assets (000s)$13,840,992
- Number of Portfolio Holdings132
- Investment Advisory Fees Paid (000s)$30,493
- Portfolio Turnover Rate31.0%
What did the fund invest in?
Sector Allocation (as a % of Net Assets)
| Information Technology | 19.8% |
| Industrials & Business Services | 16.6 |
| Health Care | 16.5 |
| Financials | 15.1 |
| Consumer Discretionary | 10.6 |
| Consumer Staples | 8.6 |
| Communication Services | 4.7 |
| Energy | 2.9 |
| Real Estate | 1.7 |
| Other | 3.5 |
Top Ten Holdings (as a % of Net Assets)
| Taiwan Semiconductor Manufacturing | 6.1% |
| ASML Holding | 2.2 |
| Prosus | 2.1 |
| Novo Nordisk | 2.1 |
| Deutsche Telekom | 1.8 |
| Canadian National Railway | 1.8 |
| SAP | 1.7 |
| MercadoLibre | 1.7 |
| Safran | 1.5 |
| Siemens | 1.5 |
If you invest directly with T. Rowe Price, you can elect to receive future shareholder reports or other important documents through electronic delivery by enrolling at www.troweprice.com/paperless. If you invest through a financial intermediary such as an investment advisor, a bank, retirement plan sponsor or a brokerage firm, please contact that organization and ask if it can provide electronic delivery.
MSCI does not accept any liability for any errors or omissions in the indexes or data, and hereby expressly disclaim all warranties of originality, accuracy, completeness, timeliness, merchantability and fitness for a particular purpose. No party may rely on any indexes or data contained in this communication. Visit www.troweprice.com/en/us/market-data-disclosures for additional legal notices & disclaimers.
International Stock Fund
I Class (PRIUX)
T. Rowe Price Investment Services, Inc.
100 East Pratt Street
Baltimore, MD 21202
Annual Shareholder Report
October 31, 2024
This annual shareholder report contains important information about International Stock Fund (the "fund") for the period of November 1, 2023 to October 31, 2024. You can find the fund’s prospectus, financial information on Form N‑CSR (which includes required tax information for dividends), holdings, proxy voting information, and other information atwww.troweprice.com/prospectus. You can also request this information without charge by contacting T. Rowe Price at 1‑800‑638‑5660 or info@troweprice.com or contacting your intermediary.
What were the fund costs for the last year? (based on a hypothetical $10,000 investment)
| | Costs of a $10,000 investment | Costs paid as a percentage of a $10,000 investment |
|---|
| International Stock Fund - Z Class | $0 | 0.00% |
What drove fund performance during the past 12 months?
Non-U.S. developed and emerging markets stocks recorded a double-digit return over the 12-month reporting period as anticipation of interest rate cuts by the Federal Reserve and other central banks outweighed concerns about rising geopolitical tensions and persistent inflation in many markets.
Information technology (IT) contributed the most to relative performance versus the MSCI All Country World Index ex USA Net due to favorable stock selection, particularly in semiconductor-related names whose shares rallied amid investor enthusiasm for companies exposed to artificial intelligence. An overweight to IT, which outpaced the benchmark, also added value. Energy helped relative returns chiefly due to an underweight to the sector, which trailed the benchmark, and positive stock selection.
Financials detracted significantly from relative performance due to negative stock selection and an underweight to the sector, which outpaced the benchmark return. Health care stocks weighed on relative returns owing to an overweight to the sector, which underperformed the benchmark, and adverse selection.
The fund’s investment process relies on in-depth fundamental research to construct a diversified growth portfolio (i.e., cyclical growers, steady compounders, and high growth companies) with a focus on total return and companies with durable growth potential. Sector and country allocations are primarily driven by bottom-up stock selection. IT was the largest overweight versus the benchmark at period-end, driven by semiconductor industry holdings. Conversely, financials was the largest underweight.
How has the fund performed?
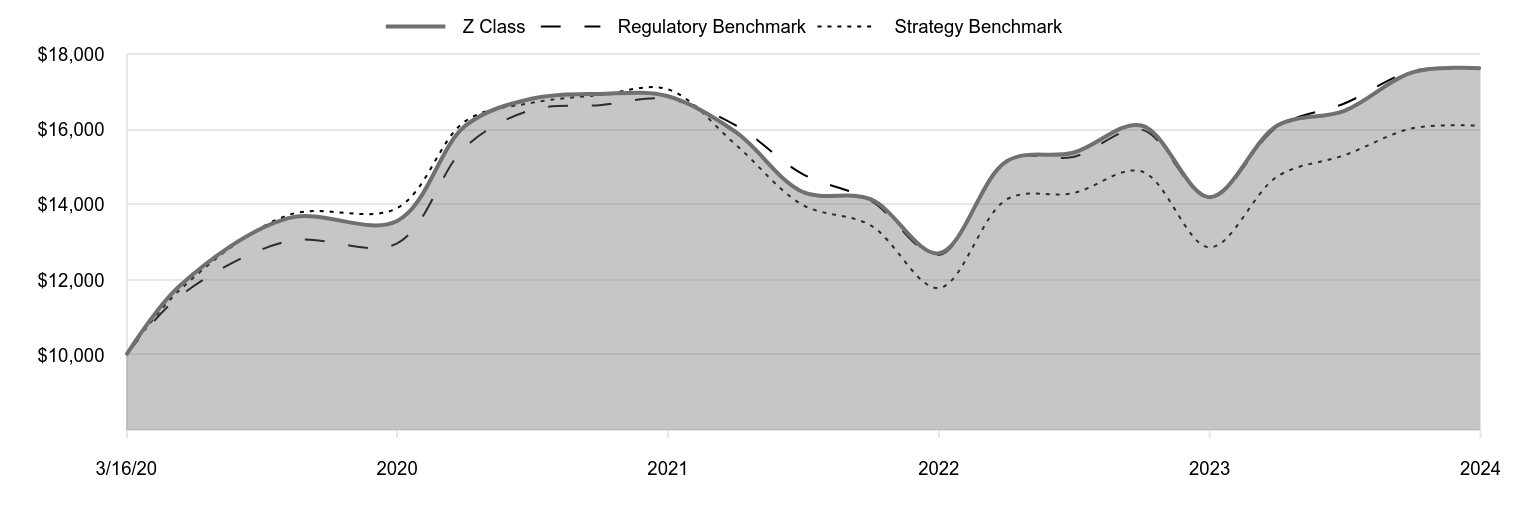
Cumulative Returns of a Hypothetical $10,000 Investment as of October 31, 2024
| Z Class | Regulatory Benchmark | Strategy Benchmark |
|---|
| 3/16/20 | 10,000 | 10,000 | 10,000 |
| 4/30/20 | 11,837 | 11,561 | 11,726 |
| 7/31/20 | 13,645 | 13,035 | 13,728 |
| 10/31/20 | 13,570 | 12,974 | 13,914 |
| 1/31/21 | 16,109 | 15,548 | 16,232 |
| 4/30/21 | 16,826 | 16,529 | 16,717 |
| 7/31/21 | 16,956 | 16,656 | 16,926 |
| 10/31/21 | 16,895 | 16,822 | 17,077 |
| 1/31/22 | 15,930 | 16,112 | 15,589 |
| 4/30/22 | 14,349 | 14,825 | 14,004 |
| 7/31/22 | 14,150 | 14,114 | 13,454 |
| 10/31/22 | 12,709 | 12,662 | 11,785 |
| 1/31/23 | 15,169 | 15,191 | 14,151 |
| 4/30/23 | 15,389 | 15,277 | 14,312 |
| 7/31/23 | 16,115 | 16,007 | 14,894 |
| 10/31/23 | 14,205 | 14,191 | 12,867 |
| 1/31/24 | 16,118 | 16,084 | 14,764 |
| 4/30/24 | 16,506 | 16,701 | 15,321 |
| 7/31/24 | 17,530 | 17,567 | 16,039 |
| 10/31/24 | 17,642 | 17,644 | 16,107 |
202411-4029887, 202412-3916157
Average Annual Total Returns
| | 1 Year | Since Inception 3/16/20 |
|---|
| International Stock Fund (Z Class) | 24.19% | 13.05% |
| MSCI All Country World Index ex-USA Net (Regulatory Benchmark) | 24.33 | 13.05 |
| MSCI All Country World Index ex USA Growth Net (Strategy Benchmark) | 25.18 | 10.85 |
The preceding line graph shows the value of a hypothetical $10,000 investment in the fund over the past 10 fiscal year periods or since inception (for funds lacking 10-year records). The fund’s performance information included in the line graph and table above is compared with a regulatory required index that represents an overall securities market (Regulatory Benchmark). In addition, the line graph and table may also include one or more indexes that more closely aligns to the fund's investment strategy (Strategy Benchmark(s)). Due to new SEC Rules on shareholder reporting the fund adopted a new broad-based securities market index, referred to as the Regulatory Benchmark. Market index returns do not include expenses, which are deducted from fund returns. The fund's total return figures reflect the reinvestment of dividends and capital gains, if any.Neither the fund’s returns nor the index returns reflect the deduction of taxes that a shareholder would pay on fund distributions or redemptions of fund shares.The fund’s past performance is not a good predictor of the fund’s future performance.Updated performance information can be found at www.troweprice.com.
What are some fund statistics?
- Total Net Assets (000s)$13,840,992
- Number of Portfolio Holdings132
- Investment Advisory Fees Paid (000s)$30,493
- Portfolio Turnover Rate31.0%
What did the fund invest in?
Sector Allocation (as a % of Net Assets)
| Information Technology | 19.8% |
| Industrials & Business Services | 16.6 |
| Health Care | 16.5 |
| Financials | 15.1 |
| Consumer Discretionary | 10.6 |
| Consumer Staples | 8.6 |
| Communication Services | 4.7 |
| Energy | 2.9 |
| Real Estate | 1.7 |
| Other | 3.5 |
Top Ten Holdings (as a % of Net Assets)
| Taiwan Semiconductor Manufacturing | 6.1% |
| ASML Holding | 2.2 |
| Prosus | 2.1 |
| Novo Nordisk | 2.1 |
| Deutsche Telekom | 1.8 |
| Canadian National Railway | 1.8 |
| SAP | 1.7 |
| MercadoLibre | 1.7 |
| Safran | 1.5 |
| Siemens | 1.5 |
If you invest directly with T. Rowe Price, you can elect to receive future shareholder reports or other important documents through electronic delivery by enrolling at www.troweprice.com/paperless. If you invest through a financial intermediary such as an investment advisor, a bank, retirement plan sponsor or a brokerage firm, please contact that organization and ask if it can provide electronic delivery.
MSCI does not accept any liability for any errors or omissions in the indexes or data, and hereby expressly disclaim all warranties of originality, accuracy, completeness, timeliness, merchantability and fitness for a particular purpose. No party may rely on any indexes or data contained in this communication. Visit www.troweprice.com/en/us/market-data-disclosures for additional legal notices & disclaimers.
International Stock Fund
Z Class (TRNZX)
T. Rowe Price Investment Services, Inc.
100 East Pratt Street
Baltimore, MD 21202
Item 1. (b) Notice pursuant to Rule 30e-3.
Not applicable.
Item 2. Code of Ethics.
The registrant has adopted a code of ethics, as defined in Item 2 of Form N-CSR, applicable to its principal executive officer, principal financial officer, principal accounting officer or controller, or persons performing similar functions. A copy of this code of ethics is filed as an exhibit to this Form N-CSR. No substantive amendments were approved or waivers were granted to this code of ethics during the period covered by this report.
Item 3. Audit Committee Financial Expert.
The registrant’s Board of Directors has determined that Mr. Paul F. McBride qualifies as an audit committee financial expert, as defined in Item 3 of Form N-CSR. Mr. McBride is considered independent for purposes of Item 3 of Form N-CSR.
Item 4. Principal Accountant Fees and Services.
(a) – (d) Aggregate fees billed for the last two fiscal years for professional services rendered to, or on behalf of, the registrant by the registrant’s principal accountant were as follows:
| | | | | | | | | | | | | | |
| | | | 2024 | | | | | | 2023 | |
| | Audit Fees | | | $26,450 | | | | | | | | $25,925 | |
| | Audit-Related Fees | | | - | | | | | | | | - | |
| | Tax Fees | | | - | | | | | | | | - | |
| | All Other Fees | | | - | | | | | | | | - | |
Audit fees include amounts related to the audit of the registrant’s annual financial statements and services normally provided by the accountant in connection with statutory and regulatory filings. Audit-related fees include amounts reasonably related to the performance of the audit of the registrant’s financial statements and specifically include the issuance of a report on internal controls and, if applicable, agreed-upon procedures related to fund acquisitions. Tax fees include amounts related to services for tax compliance, tax planning, and tax advice. The nature of these services specifically includes the review of distribution calculations and the preparation of Federal, state, and excise tax returns. All other fees include the registrant’s pro-rata share of amounts for agreed-upon procedures in conjunction with service contract approvals by the registrant’s Board of Directors/Trustees.
(e)(1) The registrant’s audit committee has adopted a policy whereby audit and non-audit services performed by the registrant’s principal accountant for the registrant, its investment adviser, and any entity controlling, controlled by, or under common control with the investment adviser that provides ongoing services to the registrant require pre-approval in advance at regularly scheduled audit committee meetings. If such a service is required between regularly scheduled audit committee meetings, pre-approval may be authorized by one audit committee member with ratification at the next scheduled audit committee meeting. Waiver of pre-approval for audit or non-audit services requiring fees of a de minimis amount is not permitted.
(2) No services included in (b) – (d) above were approved pursuant to paragraph (c)(7)(i)(C) of Rule 2-01 of Regulation S-X.
(f) Less than 50 percent of the hours expended on the principal accountant’s engagement to audit the registrant’s financial statements for the most recent fiscal year were attributed to work performed by persons other than the principal accountant’s full-time, permanent employees.
(g) The aggregate fees billed for the most recent fiscal year and the preceding fiscal year by the registrant’s principal accountant for non-audit services rendered to the registrant, its investment adviser, and any entity controlling, controlled by, or under common control with the investment adviser that provides ongoing services to the registrant were $846,000 and $1,584,000, respectively.
(h) All non-audit services rendered in (g) above were pre-approved by the registrant’s audit committee. Accordingly, these services were considered by the registrant’s audit committee in maintaining the principal accountant’s independence.
(i) Not applicable.
(j) Not applicable.
Item 5. Audit Committee of Listed Registrants.
Not applicable.
Item 6. Investments.
(a) Not applicable. The complete schedule of investments is included in Item 7 of this Form N-CSR.
(b) Not applicable.
Item 7. Financial Statements and Financial Highlights for Open-End Management Investment Companies.
(a – b) Report pursuant to Regulation S-X.
Financial
Highlights
Portfolio
of
Investments
Financial
Statements
and
Notes
Additional
Fund
Information
Financial
Statements
and
Other
Information
For
more
insights
from
T.
Rowe
Price
investment
professionals,
go
to
troweprice.com
.
T.
ROWE
PRICE
PRITX
International
Stock
Fund
PAITX
International
Stock
Fund–
.
Advisor Class
RRITX
International
Stock
Fund–
.
R Class
PRIUX
International
Stock
Fund–
.
I Class
TRNZX
International
Stock
Fund–
.
Z Class
T.
ROWE
PRICE
International
Stock
Fund
For
a
share
outstanding
throughout
each
period
The
accompanying
notes
are
an
integral
part
of
these
financial
statements.
Investor
Class
..
Year
..
..
Ended
.
10/31/24
10/31/23
10/31/22
10/31/21
10/31/20
NET
ASSET
VALUE
Beginning
of
period
$
16.78
$
15.28
$
22.00
$
18.09
$
17.80
Investment
activities
Net
investment
income
(1)(2)
0.16
0.18
0.14
0.17
0.11
Net
realized
and
unrealized
gain/loss
3.70
1.47
(5.40)
4.06
0.68
Total
from
investment
activities
3.86
1.65
(5.26)
4.23
0.79
Distributions
Net
investment
income
(0.21)
(0.07)
(0.17)
(0.08)
(0.43)
Net
realized
gain
—
(0.08)
(1.29)
(0.24)
(0.07)
Total
distributions
(0.21)
(0.15)
(1.46)
(0.32)
(0.50)
NET
ASSET
VALUE
End
of
period
$
20.43
$
16.78
$
15.28
$
22.00
$
18.09
Ratios/Supplemental
Data
Total
return
(2)(3)
23.11%
10.82%
(25.36)%
23.49%
4.39%
Ratios
to
average
net
assets:
(2)
Gross
expenses
before
waivers/payments
by
Price
Associates
0.83%
0.83%
0.84%
0.77%
0.79%
Net
expenses
after
waivers/
payments
by
Price
Associates
0.83%
0.83%
0.84%
0.77%
0.79%
Net
investment
income
0.81%
1.03%
0.77%
0.76%
0.63%
Portfolio
turnover
rate
31.0%
38.4%
33.6%
27.6%
31.3%
Net
assets,
end
of
period
(in
millions)
$1,737
$1,559
$1,523
$3,071
$3,582
0%
0%
0%
0%
0%
(1)
Per
share
amounts
calculated
using
average
shares
outstanding
method.
(2)
Includes
the
impact
of
expense-related
arrangements
with
Price
Associates.
(3)
Total
return
reflects
the
rate
that
an
investor
would
have
earned
on
an
investment
in
the
fund
during
each
period,
assuming
reinvestment
of
all
distributions,
and
payment
of
no
redemption
or
account
fees,
if
applicable.
T.
ROWE
PRICE
International
Stock
Fund
For
a
share
outstanding
throughout
each
period
The
accompanying
notes
are
an
integral
part
of
these
financial
statements.
Advisor
Class
..
Year
..
..
Ended
.
10/31/24
10/31/23
10/31/22
10/31/21
10/31/20
NET
ASSET
VALUE
Beginning
of
period
$
16.77
$
15.27
$
21.98
$
18.07
$
17.85
Investment
activities
Net
investment
income
(1)(2)
0.11
0.14
0.11
0.11
0.04
Net
realized
and
unrealized
gain/loss
3.70
1.47
(5.42)
4.06
0.67
Total
from
investment
activities
3.81
1.61
(5.31)
4.17
0.71
Distributions
Net
investment
income
(0.17)
(0.03)
(0.11)
(0.02)
(0.42)
Net
realized
gain
—
(0.08)
(1.29)
(0.24)
(0.07)
Total
distributions
(0.17)
(0.11)
(1.40)
(0.26)
(0.49)
NET
ASSET
VALUE
End
of
period
$
20.41
$
16.77
$
15.27
$
21.98
$
18.07
Ratios/Supplemental
Data
Total
return
(2)(3)
22.83%
10.57%
(25.57)%
23.16%
3.92%
Ratios
to
average
net
assets:
(2)
Gross
expenses
before
waivers/payments
by
Price
Associates
1.10%
1.07%
1.10%
1.07%
1.21%
Net
expenses
after
waivers/
payments
by
Price
Associates
1.10%
1.07%
1.10%
1.07%
1.21%
Net
investment
income
0.55%
0.80%
0.60%
0.49%
0.25%
Portfolio
turnover
rate
31.0%
38.4%
33.6%
27.6%
31.3%
Net
assets,
end
of
period
(in
thousands)
$13,507
$11,901
$12,223
$19,113
$15,512
0%
0%
0%
0%
0%
(1)
Per
share
amounts
calculated
using
average
shares
outstanding
method.
(2)
Includes
the
impact
of
expense-related
arrangements
with
Price
Associates.
(3)
Total
return
reflects
the
rate
that
an
investor
would
have
earned
on
an
investment
in
the
fund
during
each
period,
assuming
reinvestment
of
all
distributions,
and
payment
of
no
redemption
or
account
fees,
if
applicable.
T.
ROWE
PRICE
International
Stock
Fund
For
a
share
outstanding
throughout
each
period
The
accompanying
notes
are
an
integral
part
of
these
financial
statements.
R
Class
..
Year
..
..
Ended
.
10/31/24
10/31/23
10/31/22
10/31/21
10/31/20
NET
ASSET
VALUE
Beginning
of
period
$
16.45
$
14.99
$
21.59
$
17.80
$
17.61
Investment
activities
Net
investment
income
(1)(2)
0.07
0.07
0.05
0.04
0.02
Net
realized
and
unrealized
gain/loss
3.61
1.47
(5.33)
3.99
0.65
Total
from
investment
activities
3.68
1.54
(5.28)
4.03
0.67
Distributions
Net
investment
income
(0.12)
—
(0.03)
—
(0.41)
Net
realized
gain
—
(0.08)
(1.29)
(0.24)
(0.07)
Total
distributions
(0.12)
(0.08)
(1.32)
(0.24)
(0.48)
NET
ASSET
VALUE
End
of
period
$
20.01
$
16.45
$
14.99
$
21.59
$
17.80
Ratios/Supplemental
Data
Total
return
(2)(3)
22.42%
10.27%
(25.82)%
22.72%
3.74%
Ratios
to
average
net
assets:
(2)
Gross
expenses
before
waivers/payments
by
Price
Associates
2.25%
1.40%
1.41%
1.40%
1.45%
Net
expenses
after
waivers/
payments
by
Price
Associates
1.40%
1.40%
1.40%
1.40%
1.40%
Net
investment
income
0.36%
0.41%
0.31%
0.17%
0.11%
Portfolio
turnover
rate
31.0%
38.4%
33.6%
27.6%
31.3%
Net
assets,
end
of
period
(in
thousands)
$17,713
$11,027
$6,672
$9,316
$8,443
0%
0%
0%
0%
0%
(1)
Per
share
amounts
calculated
using
average
shares
outstanding
method.
(2)
Includes
the
impact
of
expense-related
arrangements
with
Price
Associates.
(3)
Total
return
reflects
the
rate
that
an
investor
would
have
earned
on
an
investment
in
the
fund
during
each
period,
assuming
reinvestment
of
all
distributions,
and
payment
of
no
redemption
or
account
fees,
if
applicable.
T.
ROWE
PRICE
International
Stock
Fund
For
a
share
outstanding
throughout
each
period
The
accompanying
notes
are
an
integral
part
of
these
financial
statements.
I
Class
..
Year
..
..
Ended
.
10/31/24
10/31/23
10/31/22
10/31/21
10/31/20
NET
ASSET
VALUE
Beginning
of
period
$
16.69
$
15.27
$
21.98
$
18.10
$
17.80
Investment
activities
Net
investment
income
(1)(2)
0.18
0.21
0.20
0.19
0.13
Net
realized
and
unrealized
gain/loss
3.69
1.48
(5.43)
4.07
0.68
Total
from
investment
activities
3.87
1.69
(5.23)
4.26
0.81
Distributions
Net
investment
income
(0.23)
(0.19)
(0.19)
(0.14)
(0.44)
Net
realized
gain
—
(0.08)
(1.29)
(0.24)
(0.07)
Total
distributions
(0.23)
(0.27)
(1.48)
(0.38)
(0.51)
NET
ASSET
VALUE
End
of
period
$
20.33
$
16.69
$
15.27
$
21.98
$
18.10
Ratios/Supplemental
Data
Total
return
(2)(3)
23.33%
11.03%
(25.26)%
23.67%
4.50%
Ratios
to
average
net
assets:
(2)
Gross
expenses
before
waivers/payments
by
Price
Associates
0.69%
0.68%
0.68%
0.66%
0.66%
Net
expenses
after
waivers/
payments
by
Price
Associates
0.68%
0.68%
0.68%
0.66%
0.66%
Net
investment
income
0.93%
1.19%
1.15%
0.88%
0.76%
Portfolio
turnover
rate
31.0%
38.4%
33.6%
27.6%
31.3%
Net
assets,
end
of
period
(in
millions)
$2,477
$3,309
$2,000
$1,957
$1,687
0%
0%
0%
0%
0%
(1)
Per
share
amounts
calculated
using
average
shares
outstanding
method.
(2)
Includes
the
impact
of
expense-related
arrangements
with
Price
Associates.
(3)
Total
return
reflects
the
rate
that
an
investor
would
have
earned
on
an
investment
in
the
fund
during
each
period,
assuming
reinvestment
of
all
distributions,
and
payment
of
no
redemption
or
account
fees,
if
applicable.
T.
ROWE
PRICE
International
Stock
Fund
For
a
share
outstanding
throughout
each
period
The
accompanying
notes
are
an
integral
part
of
these
financial
statements.
Z
Class
(1)
..
Year
..
..
Ended
.
3/16/20
(1)
Through
10/31/20
10/31/24
10/31/23
10/31/22
10/31/21
NET
ASSET
VALUE
Beginning
of
period
$
16.81
$
15.35
$
22.13
$
18.17
$
13.39
Investment
activities
Net
investment
income
(2)(3)
0.33
0.33
0.31
0.35
0.18
Net
realized
and
unrealized
gain/loss
3.70
1.48
(5.44)
4.07
4.60
Total
from
investment
activities
4.03
1.81
(5.13)
4.42
4.78
Distributions
Net
investment
income
(0.34)
(0.27)
(0.36)
(0.22)
—
Net
realized
gain
—
(0.08)
(1.29)
(0.24)
—
Total
distributions
(0.34)
(0.35)
(1.65)
(0.46)
—
NET
ASSET
VALUE
End
of
period
$
20.50
$
16.81
$
15.35
$
22.13
$
18.17
Ratios/Supplemental
Data
Total
return
(3)(4)
24.19%
11.77%
(24.77)%
24.50%
35.70%
Ratios
to
average
net
assets:
(3)
Gross
expenses
before
waivers/payments
by
Price
Associates
0.66%
0.66%
0.66%
0.65%
0.65%
(5)
Net
expenses
after
waivers/
payments
by
Price
Associates
0.00%
0.00%
0.00%
0.00%
0.00%
(5)
Net
investment
income
1.65%
1.87%
1.71%
1.58%
1.61%
(5)
Portfolio
turnover
rate
31.0%
38.4%
33.6%
27.6%
31.3%
Net
assets,
end
of
period
(in
millions)
$9,596
$8,021
$7,750
$10,299
$9,139
0%
0%
0%
0%
0%
(1)
Inception
date
(2)
Per
share
amounts
calculated
using
average
shares
outstanding
method.
(3)
Includes
the
impact
of
expense-related
arrangements
with
Price
Associates.
(4)
Total
return
reflects
the
rate
that
an
investor
would
have
earned
on
an
investment
in
the
fund
during
each
period,
assuming
reinvestment
of
all
distributions,
and
payment
of
no
redemption
or
account
fees,
if
applicable.
Total
return
is
not
annualized
for
periods
less
than
one
year.
(5)
Annualized
T.
ROWE
PRICE
International
Stock
Fund
October
31,
2024
Shares
$
Value
(
Cost
and
value
in
$000s)
‡
ARGENTINA 1.7%
Common
Stocks 1.7%
MercadoLibre
(USD) (1)
113,218
230,645
Total
Argentina
(Cost
$137,991)
230,645
BRAZIL 1.2%
Common
Stocks 1.2%
B3
37,510,718
68,975
Raia
Drogasil
11,617,009
49,134
WEG
4,655,546
43,794
Total
Brazil
(Cost
$173,190)
161,903
CANADA 9.3%
Common
Stocks 9.3%
Canadian
National
Railway
(USD)
2,321,217
250,506
Constellation
Software
65,648
197,981
Constellation
Software,
Warrants,
3/31/40 (1)(2)
75,919
—
Definity
Financial
1,665,859
64,285
Descartes
Systems
Group
(USD) (1)
775,313
80,578
Element
Fleet
Management
8,132,005
166,395
National
Bank
of
Canada
757,630
72,261
Shopify,
Class
A
(USD) (1)
1,897,199
148,380
Suncor
Energy
(USD)
5,366,580
202,696
TMX
Group
3,260,904
101,854
Total
Canada
(Cost
$973,934)
1,284,936
CAYMAN
ISLANDS 0.6%
Convertible
Preferred
Stocks 0.6%
ByteDance,
Series
E,
Acquisition
Date:
7/8/19,
Cost $13,909
(USD) (1)(2)(3)
282,204
77,454
Total
Cayman
Islands
(Cost
$13,909)
77,454
CHINA 7.0%
Common
Stocks 4.9%
58.com
(USD) (1)(2)
3,564,710
—
Alibaba
Group
Holding,
ADR
(USD)
1,457,734
142,829
BeiGene,
ADR
(USD) (1)(4)
625,425
126,736
T.
ROWE
PRICE
International
Stock
Fund
Shares
$
Value
(Cost
and
value
in
$000s)
KE
Holdings,
ADR
(USD)
8,651,509
189,728
PDD
Holdings,
ADR
(USD) (1)
717,385
86,509
Tencent
Holdings
(HKD)
2,409,100
125,616
671,418
Common
Stocks
-
China
A
Shares 2.1%
Kweichow
Moutai,
A
Shares
(CNH)
321,414
69,095
NARI
Technology,
A
Shares
(CNH)
25,517,866
93,325
Shandong
Pharmaceutical
Glass,
A
Shares
(CNH)
11,257,372
39,832
Shenzhen
Inovance
Technology,
A
Shares
(CNH)
11,741,422
91,757
294,009
Total
China
(Cost
$648,232)
965,427
DENMARK 2.7%
Common
Stocks 2.7%
Genmab (1)
363,577
81,426
Novo
Nordisk,
ADR
(USD)
2,597,927
290,838
Total
Denmark
(Cost
$304,522)
372,264
FRANCE 6.3%
Common
Stocks 6.3%
Capgemini
611,405
106,067
Dassault
Aviation (4)
683,214
137,950
LVMH
Moet
Hennessy
Louis
Vuitton
182,180
121,281
Safran
940,150
212,818
Sartorius
Stedim
Biotech
737,489
147,942
Schneider
Electric
88,023
22,802
Thales
745,440
120,164
Total
France
(Cost
$615,831)
869,024
GERMANY 7.6%
Common
Stocks 7.4%
Deutsche
Telekom
8,441,952
255,230
Douglas (1)
2,255,782
46,026
Evotec (1)(4)
4,404,852
34,067
Merck
314,197
51,945
SAP
1,031,321
240,798
Schott
Pharma (4)
1,146,910
37,151
Siemens
1,083,090
210,715
T.
ROWE
PRICE
International
Stock
Fund
Shares
$
Value
(Cost
and
value
in
$000s)
Siemens
Healthineers
2,767,330
144,467
1,020,399
Preferred
Stocks 0.2%
Sartorius (4)
95,223
24,668
24,668
Total
Germany
(Cost
$903,972)
1,045,067
HONG
KONG 1.1%
Common
Stocks 1.1%
AIA
Group
19,880,800
156,906
Total
Hong
Kong
(Cost
$63,748)
156,906
INDIA 6.0%
Common
Stocks 6.0%
Axis
Bank
11,729,942
161,136
HDFC
Bank
2,569,775
52,821
ICICI
Bank
2,445,370
37,511
InterGlobe
Aviation (1)
622,863
29,922
Kotak
Mahindra
Bank
5,509,223
113,106
Larsen
&
Toubro
2,849,860
122,421
NTPC
43,437,844
210,091
Reliance
Industries
4,188,442
66,227
Varun
Beverages
6,154,228
43,749
Total
India
(Cost
$511,707)
836,984
INDONESIA 1.7%
Common
Stocks 1.7%
Bank
Central
Asia
211,201,900
137,699
Sarana
Menara
Nusantara
371,826,400
18,954
Telkom
Indonesia
Persero
461,313,400
82,456
Total
Indonesia
(Cost
$144,740)
239,109
IRELAND 0.9%
Common
Stocks 0.9%
ICON
(USD) (1)
591,266
131,326
Total
Ireland
(Cost
$163,831)
131,326
T.
ROWE
PRICE
International
Stock
Fund
Shares
$
Value
(Cost
and
value
in
$000s)
ITALY 1.4%
Common
Stocks 1.4%
Banca
Mediolanum
6,558,258
81,066
DiaSorin (4)
896,628
97,383
Ermenegildo
Zegna
(USD) (4)
2,381,993
18,103
Total
Italy
(Cost
$182,422)
196,552
JAPAN 14.0%
Common
Stocks 14.0%
Calbee
4,290,600
95,935
Chugai
Pharmaceutical
3,956,200
188,242
Daiichi
Sankyo
2,864,400
93,231
Disco
446,100
126,931
Hamamatsu
Photonics
3,611,500
47,754
Hikari
Tsushin
416,000
83,962
Keyence
286,000
129,104
Kyushu
Railway
1,813,500
47,714
LY
1,711,500
4,669
Mitsui
Fudosan
5,052,500
43,110
Murata
Manufacturing
4,989,100
87,165
Nextage (4)
4,141,100
39,746
Olympus
10,032,900
176,602
Persol
Holdings
46,475,300
78,057
Recruit
Holdings
2,716,300
165,864
Renesas
Electronics
11,259,300
150,856
Seven
&
i
Holdings
13,537,900
194,945
Shimadzu
1,092,400
32,223
Sony
Group
8,595,200
151,254
Total
Japan
(Cost
$1,587,697)
1,937,364
LUXEMBOURG 0.7%
Common
Stocks 0.7%
CVC
Capital
Partners (1)
4,847,256
101,681
Total
Luxembourg
(Cost
$83,439)
101,681
T.
ROWE
PRICE
International
Stock
Fund
Shares
$
Value
(Cost
and
value
in
$000s)
MEXICO 0.5%
Common
Stocks 0.5%
Grupo
Mexico,
Series
B
12,870,823
67,533
Total
Mexico
(Cost
$69,151)
67,533
NETHERLANDS 6.7%
Common
Stocks 6.7%
Adyen (1)
35,094
53,612
Argenx,
ADR
(USD) (1)
183,127
107,367
ASML
Holding
451,417
303,863
Heineken
1,329,201
109,017
ING
Groep
3,216,102
54,578
Prosus
6,959,144
293,463
Total
Netherlands
(Cost
$524,728)
921,900
PHILIPPINES 0.7%
Common
Stocks 0.7%
SM
Investments
6,420,355
103,526
Total
Philippines
(Cost
$101,076)
103,526
PORTUGAL 1.8%
Common
Stocks 1.8%
Galp
Energia
6,924,578
118,354
Jeronimo
Martins
6,463,214
125,384
Total
Portugal
(Cost
$196,783)
243,738
SAUDI
ARABIA 0.8%
Common
Stocks 0.8%
Saudi
National
Bank
12,265,754
107,827
Total
Saudi
Arabia
(Cost
$113,410)
107,827
SINGAPORE 0.6%
Common
Stocks 0.6%
Sea,
ADR
(USD) (1)
928,832
87,357
Total
Singapore
(Cost
$37,938)
87,357
T.
ROWE
PRICE
International
Stock
Fund
Shares
$
Value
(Cost
and
value
in
$000s)
SOUTH
KOREA 1.6%
Common
Stocks 1.6%
LG
Chem
191,397
43,034
Samsung
Electronics
4,134,639
175,561
Total
South
Korea
(Cost
$172,272)
218,595
SPAIN 1.0%
Common
Stocks 1.0%
Amadeus
IT
Group
1,980,370
143,564
Total
Spain
(Cost
$96,694)
143,564
SWEDEN 2.4%
Common
Stocks 2.4%
Assa
Abloy,
Class
B
3,156,791
98,880
Essity,
Class
B
6,795,889
192,043
Hexagon,
Class
B
4,864,082
45,475
Total
Sweden
(Cost
$257,472)
336,398
SWITZERLAND 6.1%
Common
Stocks 6.1%
Alcon
1,454,190
133,571
Cie
Financiere
Richemont,
Class
A
999,047
145,462
Julius
Baer
Group
2,418,017
147,430
Nestle
2,062,399
194,882
Partners
Group
Holding
96,579
132,876
Sonova
Holding
236,912
86,695
Total
Switzerland
(Cost
$620,041)
840,916
TAIWAN 6.1%
Common
Stocks 6.1%
Taiwan
Semiconductor
Manufacturing
26,891,000
843,288
Total
Taiwan
(Cost
$76,272)
843,288
UNITED
KINGDOM 5.7%
Common
Stocks 5.7%
AstraZeneca,
ADR
(USD)
2,376,902
169,117
T.
ROWE
PRICE
International
Stock
Fund
Shares
$
Value
(Cost
and
value
in
$000s)
Bridgepoint
Group
15,114,595
61,144
Experian
1,635,878
79,840
Hiscox
6,599,471
91,761
London
Stock
Exchange
Group
681,427
92,358
Prudential
9,061,553
75,436
Smith
&
Nephew
8,277,455
102,912
Unilever
(EUR)
1,867,645
114,041
786,609
Convertible
Preferred
Stocks 0.0%
Yulife
Holdings,
Series
C,
Acquisition
Date:
10/11/22,
Cost $5,669 (1)(2)(3)
286,782
4,489
4,489
Total
United
Kingdom
(Cost
$659,232)
791,098
UNITED
STATES 2.7%
Common
Stocks 2.7%
Canva,
Acquisition
Date:
8/16/21
-
11/4/21,
Cost $23,865 (1)
(2)(3)
14,001
18,530
Coupang (1)
2,058,483
53,088
Linde
170,857
77,936
Mastercard,
Class
A
129,023
64,459
Waste
Connections
932,072
164,744
378,757
Convertible
Preferred
Stocks 0.0%
Canva,
Series
A,
Acquisition
Date:
11/4/21,
Cost $1,408 (1)
(2)(3)
826
1,093
Canva,
Series
A-3,
Acquisition
Date:
11/4/21,
Cost $58 (1)
(2)(3)
34
45
Canva,
Series
A-4,
Acquisition
Date:
11/4/21,
Cost $5 (1)(2)
(3)
3
4
Canva,
Series
A-5,
Acquisition
Date:
11/4/21,
Cost $4 (1)(2)
(3)
2
3
1,145
Total
United
States
(Cost
$209,645)
379,902
VIETNAM 0.4%
Common
Stocks 0.4%
Asia
Commercial
Bank
35,643,800
37,776
T.
ROWE
PRICE
International
Stock
Fund
Shares
$
Value
(Cost
and
value
in
$000s)
FPT
2,776,600
14,864
Total
Vietnam
(Cost
$51,767)
52,640
SHORT-TERM
INVESTMENTS 2.3%
Money
Market
Funds 2.3%
T.
Rowe
Price
Government
Reserve
Fund,
4.86% (5)(6)
311,518,152
311,518
Total
Short-Term
Investments
(Cost
$311,518)
311,518
SECURITIES
LENDING
COLLATERAL 0.4%
INVESTMENTS
IN
A
POOLED
ACCOUNT
THROUGH
SECURITIES
LENDING
PROGRAM
WITH
JPMORGAN
CHASE
BANK 0.4%
Money
Market
Funds 0.4%
T.
Rowe
Price
Government
Reserve
Fund,
4.86% (5)(6)
61,712,335
61,712
Total
Investments
in
a
Pooled
Account
through
Securities
Lending
Program
with
JPMorgan
Chase
Bank
61,712
Total
Securities
Lending
Collateral
(Cost
$61,712)
61,712
Total
Investments
in
Securities
102.0%
of
Net
Assets
(Cost
$10,068,876)
$
14,118,154
‡
Country
classifications
are
generally
based
on
MSCI
categories
or
another
unaffiliated
third
party
data
provider;
Shares
and
Notional
Amount
are
denominated
in
the
currency
of
the
country
presented
unless
otherwise
noted.
(1)
Non-income
producing
(2)
See
Note
2.
Level
3
in
fair
value
hierarchy.
(3)
Security
cannot
be
offered
for
public
resale
without
first
being
registered
under
the
Securities
Act
of
1933
and
related
rules
("restricted
security").
Acquisition
date
represents
the
day
on
which
an
enforceable
right
to
acquire
such
security
is
obtained
and
is
presented
along
with
related
cost
in
the
security
description.
The
fund
may
have
registration
rights
for
certain
restricted
securities.
Any
costs
related
to
such
registration
are
generally
borne
by
the
issuer.
The
aggregate
value
of
restricted
securities
(excluding
144A
holdings)
at
period
end
amounts
to
$101,618
and
represents
0.7%
of
net
assets.
(4)
See
Note
4.
All
or
a
portion
of
this
security
is
on
loan
at
October
31,
2024.
(5)
Seven-day
yield
T.
ROWE
PRICE
International
Stock
Fund
.
.
.
.
.
.
.
.
.
.
(6)
Affiliated
Companies
ADR
American
Depositary
Receipts
CNH
Offshore
China
Renminbi
EUR
Euro
HKD
Hong
Kong
Dollar
OTC
Over-the-counter
USD
U.S.
Dollar
T.
ROWE
PRICE
International
Stock
Fund
(Amounts
in
000s,
except
for
contracts)
OPTIONS
WRITTEN
(0.0)%
OTC
Options
Written (0.0)%
Counterparty
Description
Contracts
Notional
Amount
$
Value
Goldman
Sachs
Sartorius
Stedim
Biotech,
Call,
12/20/24
@
230.00
(EUR)
336
6,159
(61)
Morgan
Stanley
KE
Holdings,
Call,
11/15/24
@
$25.00
9,091
19,936
(336)
Morgan
Stanley
KE
Holdings,
Call,
11/15/24
@
$26.00
8,741
19,169
(219)
Morgan
Stanley
KE
Holdings,
Call,
1/17/25
@
$27.00
8,418
18,461
(888)
Morgan
Stanley
KE
Holdings,
Call,
1/17/25
@
$28.00
6,858
15,040
(600)
Total
Options
Written
(Premiums
$(6,270))
$
(2,104)
T.
ROWE
PRICE
International
Stock
Fund
The
accompanying
notes
are
an
integral
part
of
these
financial
statements.
AFFILIATED
COMPANIES
($000s)
The
fund
may
invest
in
certain
securities
that
are
considered
affiliated
companies.
As
defined
by
the
1940
Act,
an
affiliated
company
is
one
in
which
the
fund
owns
5%
or
more
of
the
outstanding
voting
securities,
or
a
company
that
is
under
common
ownership
or
control.
The
following
securities
were
considered
affiliated
companies
for
all
or
some
portion
of
the
year
ended
October
31,
2024.
Net
realized
gain
(loss),
investment
income,
change
in
net
unrealized
gain/loss,
and
purchase
and
sales
cost
reflect
all
activity
for
the
period
then
ended.
Affiliate
Net
Realized
Gain
(Loss)
Change
in
Net
Unrealized
Gain/Loss
Investment
Income
T.
Rowe
Price
Government
Reserve
Fund,
4.86%
$
—
$
—
$
16,025++
Totals
$
—#
$
—
$
16,025+
Supplementary
Investment
Schedule
Affiliate
Value
10/31/23
Purchase
Cost
Sales
Cost
Value
10/31/24
T.
Rowe
Price
Government
Reserve
Fund,
4.86%
$
331,870
¤
¤
$
373,230
Total
$
373,230^
#
Capital
gain
distributions
from
underlying
Price
funds
represented
$0
of
the
net
realized
gain
(loss).
++
Excludes
earnings
on
securities
lending
collateral,
which
are
subject
to
rebates
and
fees
as
described
in
Note
4.
+
Investment
income
comprised
$16,025
of
dividend
income
and
$0
of
interest
income.
¤
Purchase
and
sale
information
not
shown
for
cash
management
funds.
^
The
cost
basis
of
investments
in
affiliated
companies
was
$373,230.
T.
ROWE
PRICE
International
Stock
Fund
October
31,
2024
Statement
of
Assets
and
Liabilities
($000s,
except
shares
and
per
share
amounts)
Assets
Investments
in
securities,
at
value
(cost
$10,068,876)
$
14,118,154
Receivable
for
investment
securities
sold
99,587
Foreign
currency
(cost
$32,829)
32,789
Dividends
receivable
12,552
Due
from
affiliates
5,229
Restricted
cash
pledged
for
bilateral
derivatives
2,643
Receivable
for
shares
sold
1,460
Cash
4
Other
assets
24,579
Total
assets
14,296,997
Liabilities
Payable
for
shares
redeemed
319,889
Obligation
to
return
securities
lending
collateral
61,712
Payable
for
investment
securities
purchased
23,585
Investment
management
fees
payable
8,080
Options
written
(premiums
$6,270)
2,104
Payable
to
directors
4
Other
liabilities
40,631
Total
liabilities
456,005
Commitments
and
Contingent
Liabilities
(note
7
)
NET
ASSETS
$
13,840,992
T.
ROWE
PRICE
International
Stock
Fund
October
31,
2024
Statement
of
Assets
and
Liabilities
($000s,
except
shares
and
per
share
amounts)
The
accompanying
notes
are
an
integral
part
of
these
financial
statements.
Net
Assets
Consist
of:
Total
distributable
earnings
(loss)
$
4,182,170
Paid-in
capital
applicable
to
676,493,235
shares
of
$0.01
par
value
capital
stock
outstanding;
18,000,000,000
shares
of
the
Corporation
authorized
9,658,822
NET
ASSETS
$
13,840,992
NET
ASSET
VALUE
PER
SHARE
Investor
Class
(Net
assets:
$1,736,905;
Shares
outstanding:
84,998,743)
$
20.43
Advisor
Class
(Net
assets:
$13,507;
Shares
outstanding:
661,800)
$
20.41
R
Class
(Net
assets:
$17,713;
Shares
outstanding:
885,368)
$
20.01
I
Class
(Net
assets:
$2,477,084;
Shares
outstanding:
121,868,776)
$
20.33
Z
Class
(Net
assets:
$9,595,783;
Shares
outstanding:
468,078,548)
$
20.50
T.
ROWE
PRICE
International
Stock
Fund
Year
Ended
10/31/24
Investment
Income
(Loss)
Income
Dividend
(net
of
foreign
taxes
of
$25,152)
$
238,902
Securities
lending
775
Other
33
Total
income
239,710
Expenses
Investment
management
92,523
Shareholder
servicing
Investor
Class
$
3,042
Advisor
Class
29
R
Class
179
I
Class
533
3,783
Rule
12b-1
fees
Advisor
Class
34
R
Class
83
117
Prospectus
and
shareholder
reports
Investor
Class
41
R
Class
1
I
Class
474
Z
Class
5
521
Custody
and
accounting
2,075
Legal
and
audit
329
Registration
150
Proxy
and
annual
meeting
61
Directors
49
Miscellaneous
661
Waived
/
paid
by
Price
Associates
(
62,030
)
Total
expenses
38,239
Net
investment
income
201,471
T.
ROWE
PRICE
International
Stock
Fund
The
accompanying
notes
are
an
integral
part
of
these
financial
statements.
Year
Ended
10/31/24
Realized
and
Unrealized
Gain
/
Loss
–
Net
realized
gain
(loss)
Securities
(net
of
foreign
taxes
of
$17,130)
473,864
Options
written
2,988
Foreign
currency
transactions
(
1,069
)
Net
realized
gain
475,783
Change
in
net
unrealized
gain
/
loss
Securities
(net
of
increase
in
deferred
foreign
taxes
of
$9,426)
2,340,566
Options
written
3,837
Other
assets
and
liabilities
denominated
in
foreign
currencies
621
Change
in
net
unrealized
gain
/
loss
2,345,024
Net
realized
and
unrealized
gain
/
loss
2,820,807
INCREASE
IN
NET
ASSETS
FROM
OPERATIONS
$
3,022,278
T.
ROWE
PRICE
International
Stock
Fund
Statement
of
Changes
in
Net
Assets
Year
.
.
.
.
.
.
.
.
.
.
.
.
.
.
Ended
.
.
.
.
.
.
.
.
.
.
.
.
.
.
10/31/24
10/31/23
Increase
(Decrease)
in
Net
Assets
Operations
Net
investment
income
$
201,471
$
222,919
Net
realized
gain
475,783
232,250
Change
in
net
unrealized
gain
/
loss
2,345,024
957,069
Increase
in
net
assets
from
operations
3,022,278
1,412,238
Distributions
to
shareholders
Net
earnings
Investor
Class
(
19,307
)
(
15,312
)
Advisor
Class
(
123
)
(
92
)
R
Class
(
76
)
(
34
)
I
Class
(
45,878
)
(
55,154
)
Z
Class
(
162,223
)
(
177,113
)
Decrease
in
net
assets
from
distributions
(
227,607
)
(
247,705
)
Capital
share
transactions
*
Shares
sold
Investor
Class
65,623
75,983
Advisor
Class
2,554
1,212
R
Class
12,142
6,827
I
Class
296,845
1,483,750
Z
Class
1,030,547
602,233
Distributions
reinvested
Investor
Class
18,165
14,485
Advisor
Class
117
88
R
Class
76
34
I
Class
44,057
53,202
Z
Class
162,223
177,113
Shares
redeemed
Investor
Class
(
239,795
)
(
209,905
)
Advisor
Class
(
3,692
)
(
2,904
)
R
Class
(
8,176
)
(
2,931
)
I
Class
(
1,867,981
)
(
458,355
)
Z
Class
(
1,377,906
)
(
1,285,989
)
Increase
(decrease)
in
net
assets
from
capital
share
transactions
(
1,865,201
)
454,843
T.
ROWE
PRICE
International
Stock
Fund
Statement
of
Changes
in
Net
Assets
The
accompanying
notes
are
an
integral
part
of
these
financial
statements.
Year
.
.
.
.
.
.
.
.
.
.
.
.
.
.
Ended
.
.
.
.
.
.
.
.
.
.
.
.
.
.
10/31/24
10/31/23
Net
Assets
Increase
during
period
929,470
1,619,376
Beginning
of
period
12,911,522
11,292,146
End
of
period
$
13,840,992
$
12,911,522
*Share
information
(000s)
Shares
sold
Investor
Class
3,363
4,327
Advisor
Class
132
68
R
Class
633
399
I
Class
15,276
90,214
Z
Class
52,869
34,122
Distributions
reinvested
Investor
Class
966
843
Advisor
Class
6
5
R
Class
4
2
I
Class
2,358
3,119
Z
Class
8,661
10,370
Shares
redeemed
Investor
Class
(
12,249
)
(
11,930
)
Advisor
Class
(
186
)
(
164
)
R
Class
(
423
)
(
175
)
I
Class
(
93,993
)
(
26,103
)
Z
Class
(
70,592
)
(
72,188
)
Increase
(decrease)
in
shares
outstanding
(
93,175
)
32,909
T.
ROWE
PRICE
International
Stock
Fund
NOTES
TO
FINANCIAL
STATEMENTS
T.
Rowe
Price
International
Funds,
Inc. (the
corporation) is
registered
under
the
Investment
Company
Act
of
1940
(the
1940
Act).
The
International
Stock
Fund
(the
fund)
is a
diversified, open-end
management
investment
company
established
by
the
corporation. The
fund
seeks long-term
growth
of
capital
through
investments
primarily
in
the
common
stocks
of
established,
non-U.S.
companies.
The
fund
has five classes
of
shares:
the
International
Stock
Fund
(Investor
Class),
the
International
Stock
Fund–Advisor
Class
(Advisor
Class),
the
International
Stock
Fund–R
Class
(R
Class),
the
International
Stock
Fund–I
Class
(I
Class)
and
the
International
Stock
Fund–Z
Class
(Z
Class).
Advisor
Class
shares
are
sold
only
through
various
brokers
and
other
financial
intermediaries,
and
R
Class
shares
are
available
through
financial
intermediaries
for
employer-sponsored
defined
contribution
retirement
plans
and
certain
other
retirement
accounts.
I
Class
shares
require
a
$500,000
initial
investment
minimum,
although
the
minimum
generally
is
waived
or
reduced
for
financial
intermediaries,
eligible
retirement
plans,
and
certain
other
accounts.
The
Z
Class
is
only
available
to
funds
advised
by
T.
Rowe
Price
Associates,
Inc.
and
its
affiliates
and
other
clients
that
are
subject
to
a
contractual
fee
for
investment
management
services.
The
Advisor
Class
and
R
Class
each
operate
under
separate
Board-approved
Rule
12b-1
plans,
pursuant
to
which
each
class
compensates
financial
intermediaries
for
distribution,
shareholder
servicing,
and/
or
certain
administrative
services;
the
Investor,
I
and
Z
Classes
do
not
pay
Rule
12b-1
fees. Each
class
has
exclusive
voting
rights
on
matters
related
solely
to
that
class;
separate
voting
rights
on
matters
that
relate
to
all
classes;
and,
in
all
other
respects,
the
same
rights
and
obligations
as
the
other
classes.
NOTE
1
-
SIGNIFICANT
ACCOUNTING
POLICIES
Basis
of
Preparation
The fund
is
an
investment
company
and
follows
accounting
and
reporting
guidance
in
the
Financial
Accounting
Standards
Board
(FASB)
Accounting
Standards
Codification
Topic
946
(ASC
946).
The
accompanying
financial
statements
were
prepared
in
accordance
with
accounting
principles
generally
accepted
in
the
United
States
of
America
(GAAP),
including,
but
not
limited
to,
ASC
946.
GAAP
requires
the
use
of
estimates
made
by
management.
Management
believes
that
estimates
and
valuations
are
appropriate;
however,
actual
results
may
differ
from
those
estimates,
and
the
valuations
reflected
in
the
accompanying
financial
statements
may
differ
from
the
value
ultimately
realized
upon
sale
or
maturity.
T.
ROWE
PRICE
International
Stock
Fund
Investment
Transactions,
Investment
Income,
and
Distributions
Investment
transactions
are
accounted
for
on
the
trade
date
basis.
Income
and
expenses
are
recorded
on
the
accrual
basis.
Realized
gains
and
losses
are
reported
on
the
identified
cost
basis. Income
tax-related
interest
and
penalties,
if
incurred,
are
recorded
as
income
tax
expense. Dividends
received
from other
investment
companies are
reflected
as
dividend income;
capital
gain
distributions
are
reflected
as
realized
gain/loss. Dividend
income and
capital
gain
distributions
are
recorded
on
the
ex-dividend
date. Non-cash
dividends,
if
any,
are
recorded
at
the
fair
market
value
of
the
asset
received. Proceeds
from
litigation
payments,
if
any,
are
included
in
either
net
realized
gain
(loss)
or
change
in
net
unrealized
gain/loss
from
securities. Distributions
to
shareholders
are
recorded
on
the
ex-dividend
date. Income
distributions,
if
any,
are
declared
and
paid
by
each
class annually. A
capital
gain
distribution,
if
any, may
also
be
declared
and
paid
by
the
fund
annually.
Currency
Translation
Assets,
including
investments,
and
liabilities
denominated
in
foreign
currencies
are
translated
into
U.S.
dollar
values
each
day
at
the
prevailing
exchange
rate,
using
the
mean
of
the
bid
and
asked
prices
of
such
currencies
against
U.S.
dollars
as
provided
by
an
outside
pricing
service.
Purchases
and
sales
of
securities,
income,
and
expenses
are
translated
into
U.S.
dollars
at
the
prevailing
exchange
rate
on
the
respective
date
of
such
transaction.
The
effect
of
changes
in
foreign
currency
exchange
rates
on
realized
and
unrealized
security
gains
and
losses
is
not
bifurcated
from
the
portion
attributable
to
changes
in
market
prices.
Class
Accounting
Shareholder
servicing,
prospectus,
and
shareholder
report
expenses
incurred
by
each
class
are
charged
directly
to
the
class
to
which
they
relate.
Expenses
common
to
all
classes,
investment
income,
and
realized
and
unrealized
gains
and
losses
are
allocated
to
the
classes
based
upon
the
relative
daily
net
assets
of
each
class.
The
Advisor
Class
and
R
Class
each
pay
Rule
12b-1
fees,
in
an
amount
not
exceeding
0.25%
and
0.50%,
respectively,
of
the
class’s
average
daily
net
assets.
In-Kind
Redemptions
In
accordance
with
guidelines
described
in
the
fund’s
prospectus,
and
when
considered
to
be
in
the
best
interest
of
all
shareholders,
the
fund
may
distribute
portfolio
securities
rather
than
cash
as
payment
for
a
redemption
of
fund
shares
(in-kind
redemption).
Gains
and
losses
realized
on
in-kind
redemptions
are
not
recognized
for
tax
purposes
and
are
reclassified
from
undistributed
realized
gain
(loss)
to
paid-in
capital.
During
the
year ended
October
31,
2024,
the
fund
realized
$87,349,000 of
net
gain
on
$240,496,000
of
in-kind
redemptions.
T.
ROWE
PRICE
International
Stock
Fund
Capital
Transactions
Each
investor’s
interest
in
the
net
assets
of the
fund
is
represented
by
fund
shares. The
fund’s
net
asset
value
(NAV)
per
share
is
computed
at
the
close
of
the
New
York
Stock
Exchange
(NYSE),
normally
4
p.m.
Eastern
time,
each
day
the
NYSE
is
open
for
business.
However,
the
NAV
per
share
may
be
calculated
at
a
time
other
than
the
normal
close
of
the
NYSE
if
trading
on
the
NYSE
is
restricted,
if
the
NYSE
closes
earlier,
or
as
may
be
permitted
by
the
SEC.
Purchases
and
redemptions
of
fund
shares
are
transacted
at
the
next-computed
NAV
per
share,
after
receipt
of
the
transaction
order
by
T.
Rowe
Price
Associates,
Inc.,
or
its
agents.
New
Accounting
Guidance
In
November
2023,
the
FASB
issued
Accounting
Standards
Update
(ASU),
ASU
2023-07,
Segment
Reporting
(Topic
280)
–
Improvements
to
Reportable
Segment
Disclosures,
which
improves
reportable
segment
disclosure
requirements,
primarily
through
enhanced
disclosures
about
segment
expenses.
In
addition,
the
ASU
clarifies
that
a
public
entity
with
a
single
reportable
segment
provide
all
disclosures
required
by
the
ASU
and
all
existing
segment
disclosures
in
Topic
280.
The
amendments
under
this
ASU
are
effective
for
fiscal
years
beginning
after
December
15,
2023.
Management
expects
that
adoption
of
the
guidance
will
not
have
a
material
impact
on
the
fund’s
financial
statements.
Indemnification
In
the
normal
course
of
business, the
fund
may
provide
indemnification
in
connection
with
its
officers
and
directors,
service
providers,
and/or
private
company
investments. The
fund’s
maximum
exposure
under
these
arrangements
is
unknown;
however,
the
risk
of
material
loss
is
currently
considered
to
be
remote.
NOTE
2
-
VALUATION
Fair
Value
The
fund’s
financial
instruments
are
valued
at
the
close
of
the
NYSE
and
are
reported
at
fair
value,
which
GAAP
defines
as
the
price
that
would
be
received
to
sell
an
asset
or
paid
to
transfer
a
liability
in
an
orderly
transaction
between
market
participants
at
the
measurement
date. The fund’s
Board
of
Directors
(the
Board)
has
designated
T.
Rowe
Price
Associates,
Inc.
as
the
fund’s
valuation
designee
(Valuation
Designee).
Subject
to
oversight
by
the
Board,
the
Valuation
Designee
performs
the
following
functions
in
performing
fair
value
determinations:
assesses
and
manages
valuation
risks;
establishes
and
applies
fair
value
methodologies;
tests
fair
value
methodologies;
and
evaluates
pricing
vendors
and
pricing
agents.
The
duties
T.
ROWE
PRICE
International
Stock
Fund
and
responsibilities
of
the
Valuation
Designee
are
performed
by
its
Valuation
Committee. The
Valuation
Designee provides
periodic
reporting
to
the
Board
on
valuation
matters.
Various
valuation
techniques
and
inputs
are
used
to
determine
the
fair
value
of
financial
instruments.
GAAP
establishes
the
following
fair
value
hierarchy
that
categorizes
the
inputs
used
to
measure
fair
value:
Level
1
–
quoted
prices
(unadjusted)
in
active
markets
for
identical
financial
instruments
that
the
fund
can
access
at
the
reporting
date
Level
2
–
inputs
other
than
Level
1
quoted
prices
that
are
observable,
either
directly
or
indirectly
(including,
but
not
limited
to,
quoted
prices
for
similar
financial
instruments
in
active
markets,
quoted
prices
for
identical
or
similar
financial
instruments
in
inactive
markets,
interest
rates
and
yield
curves,
implied
volatilities,
and
credit
spreads)
Level
3
–
unobservable
inputs
(including
the Valuation
Designee’s assumptions
in
determining
fair
value)
Observable
inputs
are
developed
using
market
data,
such
as
publicly
available
information
about
actual
events
or
transactions,
and
reflect
the
assumptions
that
market
participants
would
use
to
price
the
financial
instrument.
Unobservable
inputs
are
those
for
which
market
data
are
not
available
and
are
developed
using
the
best
information
available
about
the
assumptions
that
market
participants
would
use
to
price
the
financial
instrument.
GAAP
requires
valuation
techniques
to
maximize
the
use
of
relevant
observable
inputs
and
minimize
the
use
of
unobservable
inputs.
When
multiple
inputs
are
used
to
derive
fair
value,
the
financial
instrument
is
assigned
to
the
level
within
the
fair
value
hierarchy
based
on
the
lowest-level
input
that
is
significant
to
the
fair
value
of
the
financial
instrument.
Input
levels
are
not
necessarily
an
indication
of
the
risk
or
liquidity
associated
with
financial
instruments
at
that
level
but
rather
the
degree
of
judgment
used
in
determining
those
values.
Valuation
Techniques
Equity
securities,
including
exchange-traded
funds, listed
or
regularly
traded
on
a
securities
exchange
or
in
the
over-the-
counter
(OTC)
market
are
valued
at
the
last
quoted
sale
price
or,
for
certain
markets,
the
official
closing
price
at
the
time
the
valuations
are
made.
OTC
Bulletin
Board
securities
are
valued
at
the
mean
of
the
closing
bid
and
asked
prices.
A
security
that
is
listed
or
traded
on
more
than
one
exchange
is
valued
at
the
quotation
on
the
exchange
determined
to
be
the
primary
market
for
such
T.
ROWE
PRICE
International
Stock
Fund
security.
Listed
securities
not
traded
on
a
particular
day
are
valued
at
the
mean
of
the
closing
bid
and
asked
prices
for
domestic
securities
and
the
last
quoted
sale
or
closing
price
for
international
securities.
The
last
quoted
prices
of
non-U.S.
equity
securities
may
be
adjusted
to
reflect
the
fair
value
of
such
securities
at
the
close
of
the
NYSE,
if
the Valuation
Designee
determines
that
developments
between
the
close
of
a
foreign
market
and
the
close
of
the
NYSE
will
affect
the
value
of
some
or
all
of
the
fund’s portfolio
securities.
Each
business
day,
the
Valuation
Designee uses
information
from
outside
pricing
services
to
evaluate
the
quoted
prices
of
portfolio
securities
and,
if
appropriate,
decide whether
it
is
necessary
to
adjust
quoted
prices
to
reflect
fair
value
by
reviewing
a
variety
of
factors,
including
developments
in
foreign
markets,
the
performance
of
U.S.
securities
markets,
and
the
performance
of
instruments
trading
in
U.S.
markets
that
represent
foreign
securities
and
baskets
of
foreign
securities. The Valuation
Designee
uses
outside
pricing
services
to
provide
it
with
quoted
prices
and
information
to
evaluate
or
adjust
those
prices.
The Valuation
Designee
cannot
predict
how
often
it
will
use
quoted
prices
and
how
often
it
will
determine
it
necessary
to
adjust
those
prices
to
reflect
fair
value.
Investments
in
mutual
funds
are
valued
at
the
mutual
fund’s
closing
NAV
per
share
on
the
day
of
valuation.
Listed
options,
and
OTC
options
with
a
listed
equivalent,
are
valued
at
the
mean
of
the
closing
bid
and
asked
prices
and
exchange-traded
options
on
futures
contracts
are
valued
at
closing
settlement
prices.
Assets
and
liabilities
other
than
financial
instruments,
including
short-
term
receivables
and
payables,
are
carried
at
cost,
or
estimated
realizable
value,
if
less,
which
approximates
fair
value.
Investments
for
which
market
quotations are
not
readily
available
or
deemed
unreliable
are
valued
at
fair
value
as
determined
in
good
faith
by
the
Valuation
Designee.
The
Valuation
Designee
has
adopted
methodologies
for
determining
the
fair
value
of
investments
for
which
market
quotations
are
not
readily
available
or
deemed
unreliable,
including
the
use
of
other
pricing
sources.
Factors
used
in
determining
fair
value
vary
by
type
of
investment
and
may
include
market
or
investment
specific
considerations.
The
Valuation
Designee typically
will
afford
greatest
weight
to
actual
prices
in
arm’s
length
transactions,
to
the
extent
they
represent
orderly
transactions
between
market
participants,
transaction
information
can
be
reliably
obtained,
and
prices
are
deemed
representative
of
fair
value.
However,
the
Valuation
Designee may
also
consider
other
valuation
methods
such
as
market-based
valuation
multiples;
a
discount
or
premium
from
market
value
of
a
similar,
freely
traded
security
of
T.
ROWE
PRICE
International
Stock
Fund
the
same
issuer;
discounted
cash
flows;
yield
to
maturity;
or
some
combination.
Fair
value
determinations
are
reviewed
on
a
regular
basis.
Because
any
fair
value
determination
involves
a
significant
amount
of
judgment,
there
is
a
degree
of
subjectivity
inherent
in
such
pricing
decisions. Fair
value
prices
determined
by
the
Valuation
Designee could
differ
from
those
of
other
market
participants,
and
it
is
possible
that
the
fair
value
determined
for
a
security
may
be
materially
different
from
the
value
that
could
be
realized
upon
the
sale
of
that
security.
Valuation
Inputs
The
following
table
summarizes
the
fund’s
financial
instruments,
based
on
the
inputs
used
to
determine
their
fair
values
on
October
31,
2024
(for
further
detail
by
category,
please
refer
to
the
accompanying
Portfolio
of
Investments):
NOTE
3
-
DERIVATIVE
INSTRUMENTS
During
the
year ended
October
31,
2024,
the
fund
invested
in
derivative
instruments.
As
defined
by
GAAP,
a
derivative
is
a
financial
instrument
whose
value
is
derived
from
an
underlying
security
price,
foreign
exchange
rate,
interest
rate,
index
of
prices
or
rates,
or
other
variable;
it
requires
little
or
no
initial
investment
and
permits
or
requires
net
settlement
or
delivery
of
cash
or
other
assets.
The
fund
invests
in
derivatives
only
if
the
expected
risks
and
rewards
are
consistent
with
its
investment
objectives,
policies,
and
overall
risk
profile,
as
described
in
its
prospectus
and
Statement
of
Additional
Information.
The
fund
may
use
derivatives
for
a
variety
of
purposes
and
may
use
them
to
($000s)
Level
1
Level
2
Level
3
Total
Value
Assets
Common
Stocks
$
2,622,942
$
10,995,696
$
18,530
$
13,637,168
Convertible
Preferred
Stocks
—
—
83,088
83,088
Preferred
Stocks
—
24,668
—
24,668
Short-Term
Investments
311,518
—
—
311,518
Securities
Lending
Collateral
61,712
—
—
61,712
Total
$
2,996,172
$
11,020,364
$
101,618
$
14,118,154
Liabilities
Options
Written
$
—
$
2,104
$
—
$
2,104
T.
ROWE
PRICE
International
Stock
Fund
establish
both
long
and
short
positions
within
the
fund’s
portfolio.
Potential
uses
include
to
hedge
against
declines
in
principal
value,
increase
yield,
invest
in
an
asset
with
greater
efficiency
and
at
a
lower
cost
than
is
possible
through
direct
investment,
to
enhance
return,
or
to
adjust
credit
exposure.
The
risks
associated
with
the
use
of
derivatives
are
different
from,
and
potentially
much
greater
than,
the
risks
associated
with
investing
directly
in
the
instruments
on
which
the
derivatives
are
based.
The
fund
values
its
derivatives
at
fair
value
and
recognizes
changes
in
fair
value
currently
in
its
results
of
operations.
Accordingly,
the
fund
does
not
follow
hedge
accounting,
even
for
derivatives
employed
as
economic
hedges.
Generally,
the
fund
accounts
for
its
derivatives
on
a
gross
basis.
It
does
not
offset
the
fair
value
of
derivative
liabilities
against
the
fair
value
of
derivative
assets
on
its
financial
statements,
nor
does
it
offset
the
fair
value
of
derivative
instruments
against
the
right
to
reclaim
or
obligation
to
return
collateral.
The
following
table
summarizes
the
fair
value
of
the
fund’s
derivative
instruments
held
as
of
October
31,
2024,
and
the
related
location
on
the
accompanying
Statement
of
Assets
and
Liabilities,
presented
by
primary
underlying
risk
exposure:
Additionally,
the
amount
of
gains
and
losses
on
derivative
instruments
recognized
in
fund
earnings
during
the
year ended
October
31,
2024,
and
the
related
location
on
the
accompanying
Statement
of
Operations
is
summarized
in
the
following
table
by
primary
underlying
risk
exposure:
($000s)
Location
on
Statement
of
Assets
and
Liabilities
Fair
Value
Liabilities
Equity
derivatives
Options
Written
$
2,104
Total
$
2,104
($000s)
Location
of
Gain
(Loss)
on
Statement
of
Operations
Options
Written
Realized
Gain
(Loss)
Equity
derivatives
$
2,988
Total
$
2,988
T.
ROWE
PRICE
International
Stock
Fund
Counterparty
Risk
and
Collateral
The
fund
invests
in
derivatives,
such
as
non-cleared
bilateral
swaps,
forward
currency
exchange
contracts,
and/or
OTC
options,
that
are
transacted
and
settle
directly
with
a
counterparty
(bilateral
derivatives),
and
thereby
may
expose
the
fund
to
counterparty
risk.
To
mitigate
this
risk,
the
fund
has
entered
into
master
netting
arrangements
(MNAs)
with
certain
counterparties
that
permit
net
settlement
under
specified
conditions
and,
for
certain
counterparties,
also
require
the
exchange
of
collateral
to
cover
mark-to-market
exposure.
MNAs
may
be
in
the
form
of
International
Swaps
and
Derivatives
Association
master
agreements
(ISDAs)
or
foreign
exchange
letter
agreements
(FX
letters).
MNAs
govern
the
ability
to
offset
amounts
the
fund
owes
a
counterparty
against
amounts
the
counterparty
owes
the
fund
(net
settlement).
Both
ISDAs
and
FX
letters
generally
allow
termination
of
transactions
and
net
settlement
upon
the
occurrence
of
contractually
specified
events,
such
as
failure
to
pay
or
bankruptcy.
In
addition,
ISDAs
specify
other
events,
the
occurrence
of
which
would
allow
one
of
the
parties
to
terminate.
For
example,
a
downgrade
in
credit
rating
of
a
counterparty
below
a
specified
rating
would
allow
the
fund
to
terminate,
while
a
decline
in
the
fund’s
net
assets
of
more
than
a
specified
percentage
would
allow
the
counterparty
to
terminate.
Upon
termination,
all
transactions
with
that
counterparty
would
be
liquidated
and
a
net
termination
amount
determined.
ISDAs
typically
include
collateral
agreements
whereas
FX
letters
do
not.
Collateral
requirements
are
determined
daily
based
on
the
net
aggregate
unrealized
gain
or
loss
on
all
bilateral
derivatives
with
each
counterparty,
subject
to
minimum
transfer
amounts
that
typically
range
from
$100,000
to
$250,000.
Any
additional
collateral
required
due
to
changes
in
security
values
is
typically
transferred
the
next
business
day.
Collateral may
be
in
the
form
of
cash
or
debt
securities
issued
by
the
U.S.
government
or
related
agencies,
although
other
securities
may
be
used
depending
on
the
terms
outlined
in
the
applicable
MNA.
Cash
posted
by
the
($000s)
Location
of
Gain
(Loss)
on
Statement
of
Operations
Options
Written
Change
in
Unrealized
Gain
(Loss)
Equity
derivatives
$
3,837
Total
$
3,837
T.
ROWE
PRICE
International
Stock
Fund
fund
is
reflected
as
cash
deposits
in
the
accompanying
financial
statements
and
generally
is
restricted
from
withdrawal
by
the
fund;
securities
posted
by
the
fund
are
so
noted
in
the
accompanying
Portfolio
of
Investments;
both
remain
in
the
fund’s
assets.
Collateral
pledged
by
counterparties
is
not
included
in
the
fund’s
assets
because
the
fund
does
not
obtain
effective
control
over
those
assets.
For
bilateral
derivatives,
collateral
posted
or
received
by
the
fund
is
held
in
a
segregated
account
at
the
fund’s
custodian.
While
typically
not
sold
in
the
same
manner
as
equity
or
fixed
income
securities,
OTC
and
bilateral
derivatives
may
be
unwound
with
counterparties
or
transactions
assigned
to
other
counterparties
to
allow
the
fund
to
exit
the
transaction.
This
ability
is
subject
to
the
liquidity
of
underlying
positions. As
of
October
31,
2024,
cash of
$2,643,000
had
been
posted
by
the
fund
to
counterparties
for
bilateral
derivatives. As
of
October
31,
2024,
no
collateral
was
pledged
by
counterparties
to
the
fund
for
bilateral
derivatives.
Options
The
fund
is
subject
to equity
price
risk in
the
normal
course
of
pursuing
its
investment
objectives
and
uses
options
to
help
manage
such
risk.
The
fund
may
use
options
to
manage
exposure
to
security
prices,
interest
rates,
foreign
currencies,
and
credit
quality;
as
an
efficient
means
of
adjusting
exposure
to
all
or
a
part
of
a
target
market;
to
enhance
income;
as
a
cash
management
tool;
or
to
adjust
credit
exposure.
The
fund
may
buy
or
sell
options
that
can
be
settled
either
directly
with
the
counterparty
(OTC
option)
or
through
a
central
clearinghouse
(exchange-traded
option).
Options
are
included
in
net
assets
at
fair
value,
options
purchased
are
included
in
Investments
in
Securities,
and
options
written
are
separately
reflected
as
a
liability
on
the
accompanying
Statement
of
Assets
and
Liabilities.
Premiums
on
unexercised,
expired
options
are
recorded
as
realized
gains
or
losses
on
the
accompanying
Statement
of
Operations;
premiums
on
exercised
options
are
recorded
as
an
adjustment
to
the
proceeds
from
the
sale
or
cost
of
the
purchase.
The
difference
between
the
premium
and
the
amount
received
or
paid
in
a
closing
transaction
is
also
treated
as
realized
gain
or
loss
on
the
accompanying
Statement
of
Operations.
In
return
for
a
premium
paid,
call
and
put
options
give
the
holder
the
right,
but
not
the
obligation,
to
purchase
or
sell,
respectively,
a
security
at
a
specified
exercise
price. Risks related
to
the
use
of
options
include
possible
illiquidity
of
the
options
markets;
trading
restrictions
imposed
by
an
exchange
or
counterparty;
possible
failure
of
counterparties
to
meet
the
terms
of
the
agreements;
movements
in
the
underlying
asset
values
and,
for
options
written,
the
potential
for
losses
to
exceed
any
premium
received
by
the
fund.
During
the
year ended
October
31,
2024,
the
volume
of
the
fund’s
activity
in
options,
based
on
underlying
notional
amounts,
was
generally
less
than
1%
of
net
assets.
T.
ROWE
PRICE
International
Stock
Fund
NOTE
4
-
OTHER
INVESTMENT
TRANSACTIONS
Consistent
with
its
investment
objective, the
fund
engages
in
the
following
practices
to
manage
exposure
to
certain
risks
and/or
to
enhance
performance.
The
investment
objective,
policies,
program,
and
risk
factors
of the
fund
are
described
more
fully
in the
fund’s prospectus
and
Statement
of
Additional
Information.
Emerging
and
Frontier
Markets
The fund
invests,
either
directly
or
through
investments
in
other
T.
Rowe
Price
funds,
in
securities
of
companies
located
in,
issued
by
governments
of,
or
denominated
in
or
linked
to
the
currencies
of
emerging
and
frontier
market
countries.
Emerging
markets,
and
to
a
greater
extent
frontier
markets, tend
to
have
economic
structures
that
are
less
diverse
and
mature,
less
developed
legal
and
regulatory
regimes,
and
political
systems
that
are
less
stable,
than
those
of
developed
countries.
These
markets
may
be
subject
to
greater
political,
economic,
and
social
uncertainty
and
differing
accounting
standards
and
regulatory
environments
that
may
potentially
impact
the
fund’s
ability
to
buy
or
sell
certain
securities
or
repatriate
proceeds
to
U.S.
dollars.
Emerging
markets
securities
exchanges
are
more
likely
to
experience
delays
with
the
clearing
and
settling
of
trades,
as
well
as
the
custody
of
holdings
by
local
banks,
agents,
and
depositories.
Such
securities
are
often
subject
to
greater
price
volatility,
less
liquidity,
and
higher
rates
of
inflation
than
U.S.
securities.
Investing
in
frontier
markets
is
typically
significantly
riskier
than
investing
in
other
countries,
including
emerging
markets.
Restricted
Securities
The
fund
invests
in
securities
that
are
subject
to
legal
or
contractual
restrictions
on
resale.
Prompt
sale
of
such
securities
at
an
acceptable
price
may
be
difficult
and
may
involve
substantial
delays
and
additional
costs.
Securities
Lending
The fund
may
lend
its
securities
to
approved
borrowers
to
earn
additional
income.
Its
securities
lending
activities
are
administered
by
a
lending
agent
in
accordance
with
a
securities
lending
agreement.
Security
loans
generally
do
not
have
stated
maturity
dates,
and
the
fund
may
recall
a
security
at
any
time.
The
fund
receives
collateral
in
the
form
of
cash
or
U.S.
government
securities.
Collateral
is
maintained
over
the
life
of
the
loan
in
an
amount
not
less
than
the
value
of
loaned
securities;
any
additional
collateral
required
due
to
changes
in
security
values
is
delivered
to
the
fund
the
next
business
day.
Cash
collateral
is
invested
in
accordance
with
investment
guidelines
approved
by
fund
management.
Additionally,
the
lending
agent
indemnifies
the
fund
against
losses
resulting
from
borrower
default.
Although
risk
is
mitigated
by
the
collateral
and
indemnification,
the
fund
could
experience
a
delay
in
recovering
its
T.
ROWE
PRICE
International
Stock
Fund
securities
and
a
possible
loss
of
income
or
value
if
the
borrower
fails
to
return
the
securities,
collateral
investments
decline
in
value,
and
the
lending
agent
fails
to
perform.
Securities
lending
revenue
consists
of
earnings
on
invested
collateral
and
borrowing
fees,
net
of
any
rebates
to
the
borrower,
compensation
to
the
lending
agent,
and
other
administrative
costs.
In
accordance
with
GAAP,
investments
made
with
cash
collateral
are
reflected
in
the
accompanying
financial
statements,
but
collateral
received
in
the
form
of
securities
is
not.
At
October
31,
2024,
the
value
of
loaned
securities
was
$58,934,000;
the
value
of
cash
collateral
and
related
investments
was
$61,712,000.
Other
Purchases
and
sales
of
portfolio
securities
other
than
in-kind
transactions,
if
any,
and short-term securities
aggregated $4,387,525,000 and
$5,898,687,000,
respectively,
for
the
year ended
October
31,
2024.
NOTE
5
-
FEDERAL
INCOME
TAXES
Generally,
no
provision
for
federal
income
taxes
is
required
since
the
fund
intends
to continue
to
qualify
as
a
regulated
investment
company
under
Subchapter
M
of
the
Internal
Revenue
Code
and
distribute
to
shareholders
all
of
its taxable
income
and
gains.
Distributions
determined
in
accordance
with
federal
income
tax
regulations
may
differ
in
amount
or
character
from
net
investment
income
and
realized
gains
for
financial
reporting
purposes.
The
fund
files
U.S.
federal,
state,
and
local
tax
returns
as
required.
The
fund’s
tax
returns
are
subject
to
examination
by
the
relevant
tax
authorities
until
expiration
of
the
applicable
statute
of
limitations,
which
is
generally
three
years
after
the
filing
of
the
tax
return
but
which
can
be
extended
to
six
years
in
certain
circumstances.
Tax
returns
for
open
years
have
incorporated
no
uncertain
tax
positions
that
require
a
provision
for
income
taxes.
Capital
accounts
within
the
financial
reporting
records
are
adjusted
for
permanent
book/tax
differences
to
reflect
tax
character
but
are
not
adjusted
for
temporary
differences.
The
permanent
book/tax
adjustments,
if
any,
have
no
impact
on
results
of
operations
or
net
assets.
The
permanent
book/tax
adjustments
relate
primarily
to
redemptions
in
kind,
deemed
distributions
on
shareholder
redemptions
and
the
character
of
foreign
capital
gains
taxes.
T.
ROWE
PRICE
International
Stock
Fund
The
tax
character
of
distributions
paid
for
the
periods
presented
was
as
follows:
At
October
31,
2024,
the
tax-basis
cost
of
investments
(including
derivatives,
if
any)
and
gross
unrealized
appreciation
and
depreciation
were as
follows:
At
October
31,
2024,
the
tax-basis
components
of
accumulated
net
earnings
(loss)
were
as
follows:
Temporary
differences
between
book-basis
and
tax-basis
components
of
total
distributable
earnings
(loss)
arise
when
certain
items
of
income,
gain,
or
loss
are
recognized
in
different
periods
for
financial
statement
purposes
versus
for
tax
purposes;
these
differences
will
reverse
in
a
subsequent
reporting
period.
The
temporary
differences
relate
primarily
to
the
deferral
of
losses
from
wash
sales
and
the
realization
of
gains/losses
on
passive
foreign
investment
companies.
During
the
year
ended
October
31,
2024,
the
fund
utilized
$218,991,000
of
capital
loss
carryforwards.
($000s)
October
31,
2024
October
31,
2023
Ordinary
income
(including
short-term
capital
gains,
if
any)
$
227,607
$
247,705
($000s)
Cost
of
investments
$
10,136,597
Unrealized
appreciation
$
4,760,186
Unrealized
depreciation
(821,261)
Net
unrealized
appreciation
(depreciation)
$
3,938,925
($000s)
Undistributed
ordinary
income
$
190,212
Undistributed
long-term
capital
gain
53,033
Net
unrealized
appreciation
(depreciation)
3,938,925
Total
distributable
earnings
(loss)
$
4,182,170
T.
ROWE
PRICE
International
Stock
Fund
NOTE
6
-
FOREIGN TAXES
The
fund
is
subject
to
foreign
income
taxes
imposed
by
certain
countries
in
which
it
invests.
Additionally,
capital
gains
realized
upon
disposition
of
securities
issued
in
or
by
certain
foreign
countries
are
subject
to
capital
gains
tax
imposed
by
those
countries.
All
taxes
are
computed
in
accordance
with
the
applicable
foreign
tax
law,
and,
to
the
extent
permitted,
capital
losses
are
used
to
offset
capital
gains.
Taxes
attributable
to
income
are
accrued
by
the
fund
as
a
reduction
of
income.
Current
and
deferred
tax
expense
attributable
to
capital
gains
is
reflected
as
a
component
of
realized
or
change
in
unrealized
gain/
loss
on
securities
in
the
accompanying
financial
statements.
To
the
extent
that
the
fund
has
country
specific
capital
loss
carryforwards,
such
carryforwards
are
applied
against
net
unrealized
gains
when
determining
the
deferred
tax
liability.
Any
deferred
tax
liability
incurred
by
the
fund
is
included
in
either
Other
liabilities
or
Deferred
tax
liability
on
the
accompanying
Statement
of
Assets
and
Liabilities.
NOTE
7
-
RELATED
PARTY
TRANSACTIONS
The
fund
is
managed
by
T.
Rowe
Price
Associates,
Inc.
(Price
Associates),
a
wholly
owned
subsidiary
of
T.
Rowe
Price
Group,
Inc.
(Price
Group).
The
investment
management
agreement
between
the
fund
and
Price
Associates
provides
for
an
annual
investment
management
fee,
which
is
computed
daily
and
paid
monthly. The
fee
consists
of
an
individual
fund
fee,
equal
to
0.35%
of
the
fund’s
average
daily
net
assets,
and
a
group
fee.
The
group
fee
rate
is
calculated
based
on
the
combined
net
assets
of
certain
mutual
funds
sponsored
by
Price
Associates
(the
group)
applied
to
a
graduated
fee
schedule,
with
rates
ranging
from
0.48%
for
the
first
$1
billion
of
assets
to
0.260%
for
assets
in
excess
of
$845
billion.
The
fund’s
group
fee
is
determined
by
applying
the
group
fee
rate
to
the
fund’s
average
daily
net
assets. At
October
31,
2024,
the
effective
annual
group
fee
rate
was
0.28%. Price
Associates
has
agreed
to
permanently
waive
a
portion
of
the
fund’s
annual
investment
management
fee
in
order
to
limit
the
fund’s
management
fees
to
0.70%
of
the
fund’s
average
daily
net
assets.
This
agreement
can
only
be
modified
or
terminated
with
approval
by
the
fund’s
shareholders.
The
fund
has
no
obligation
to
repay
fees
waived
under
this
arrangement. No
management
fees
were
waived
under
this
arrangement
for
the
year ended
October
31,
2024.
T.
ROWE
PRICE
International
Stock
Fund
The
Investor
Class, Advisor
Class,
and R
Class are
each
subject
to
a
contractual
expense
limitation
through
the
expense
limitation
dates
indicated
in
the
table
below.
This
agreement
will
continue
through
the
expense
limitation
dates
indicated
in
the
table
below,
and
may
be
renewed,
revised,
or
revoked
only
with
approval
of
the
fund’s
Board.
During
the
limitation
period,
Price
Associates
is required
to
waive
or
pay
any
expenses
(excluding
interest;
expenses
related
to
borrowings,
taxes,
and
brokerage;
non-recurring,
extraordinary
expenses;
and
acquired
fund
fees
and
expenses)
that
would
otherwise
cause
the class’s ratio
of
annualized
total
expenses
to
average
net
assets
(net
expense
ratio)
to
exceed
its
expense
limitation.
Each
class
is
required
to
repay
Price
Associates
for
expenses
previously
waived/paid
to
the
extent
the
class’s net
assets
grow
or
expenses
decline
sufficiently
to
allow
repayment
without
causing
the class’s net
expense
ratio
(after
the
repayment
is
taken
into
account)
to
exceed
the
lesser
of:
(1)
the
expense
limitation
in
place
at
the
time
such
amounts
were
waived;
or
(2)
the class’s
current
expense
limitation.
However,
no
repayment
will
be
made
more
than
three
years
after
the
date
of
a
payment
or
waiver.
The
I
Class
is
also
subject
to
an
operating
expense
limitation
(I
Class
Limit)
pursuant
to
which
Price
Associates
is
contractually
required
to
pay
all
operating
expenses
of
the
I
Class,
excluding
management
fees;
interest;
expenses
related
to
borrowings,
taxes,
and
brokerage; non-recurring,
extraordinary expenses; and
acquired
fund
fees
and
expenses, to
the
extent
such
operating
expenses,
on
an
annualized
basis,
exceed
the
I
Class
Limit. This
agreement
will
continue
through
the
expense
limitation
date
indicated
in
the
table
below,
and
may
be
renewed,
revised,
or
revoked
only
with
approval
of
the
fund’s
Board.
The
I
Class
is
required
to
repay
Price
Associates
for
expenses
previously
paid
to
the
extent
the
class’s
net
assets
grow
or
expenses
decline
sufficiently
to
allow
repayment
without
causing
the
class’s
operating
expenses
(after
the
repayment
is
taken
into
account)
to
exceed
the
lesser
of:
(1)
the
I
Class
Limit
in
place
at
the
time
such
amounts
were
paid;
or
(2)
the
current
I
Class
Limit.
However,
no
repayment
will
be
made
more
than
three
years
after
the
date
of
a
payment
or
waiver.
The
Z
Class
is
also
subject
to
a
contractual
expense
limitation
agreement
whereby
Price
Associates
has
agreed
to
waive
and/or
bear
all
of
the
Z
Class’
expenses
(excluding
interest;
expenses
related
to
borrowings,
taxes,
and
brokerage;
non-recurring,
extraordinary
expenses;
and
acquired
fund
fees
and
expenses)
in
their
entirety.
This
fee
waiver
and/or
expense
reimbursement
arrangement
is
expected
to
remain
in
place
indefinitely,
and
the
agreement
may
T.
ROWE
PRICE
International
Stock
Fund
only
be
amended
or
terminated
with
approval
by
the
fund’s
Board.
Expenses
of
the
fund
waived/paid
by
the
manager
are
not
subject
to
later
repayment
by
the
fund.
Pursuant
to
these
agreements,
expenses
were waived/paid
by
and/or
repaid
to
Price
Associates
during
the year
ended October
31,
2024 as
indicated
in
the
table
below.
Including
these
amounts,
expenses
previously
waived/paid
by
Price
Associates
in
the
amount
of $214,000 remain
subject
to
repayment
by
the
fund
at
October
31,
2024. Any
repayment
of
expenses
previously
waived/paid
by
Price
Associates
during
the
period
would
be
included
in
the
net
investment
income
and
expense
ratios
presented
on
the
accompanying
Financial
Highlights.
In
addition,
the
fund
has
entered
into
service
agreements
with
Price
Associates
and
two
wholly
owned
subsidiaries
of
Price
Associates,
each
an
affiliate
of
the
fund
(collectively,
Price).
Price
Associates
provides
certain
accounting
and
administrative
services
to
the
fund.
T.
Rowe
Price
Services,
Inc.
provides
shareholder
and
administrative
services
in
its
capacity
as
the
fund’s
transfer
and
dividend-disbursing
agent.
T.
Rowe
Price
Retirement
Plan
Services,
Inc.
provides
subaccounting
and
recordkeeping
services
for
certain
retirement
accounts
invested
in
the
Investor
Class,
R
Class
and
Advisor
Class.
For
the
year
ended
October
31,
2024,
expenses
incurred
pursuant
to
these
service
agreements
were
$119,000
for
Price
Associates;
$2,226,000
for
T.
Rowe
Price
Services,
Inc.;
and
$189,000
for
T.
Rowe
Price
Retirement
Plan
Services,
Inc.
All
amounts
due
to
and
due
from
Price,
exclusive
of
investment
management
fees
payable,
are
presented
net
on
the
accompanying
Statement
of
Assets
and
Liabilities.
Investor
Class
Advisor
Class
R
Class
I
Class
Z
Class
Expense
limitation/I
Class
Limit
0.99%
1.24%
1.40%
0.05%
0.00%
Expense
limitation
date
02/28/26
02/28/26
02/28/26
02/28/26
N/A
(Waived)/
repaid
during
the
period
($000s)
$—
$—
$(140)
$(72)
$(61,818)
T.
ROWE
PRICE
International
Stock
Fund
T.
Rowe
Price
Investment
Services,
Inc.
(Investment
Services)
serves
as
distributor
to
the
fund.
Pursuant
to
an
underwriting
agreement,
no
compensation
for
any
distribution
services
provided
is
paid
to
Investment
Services
by
the
fund
(except
for
12b-1
fees
under
a
Board-approved
Rule
12b-1
plan).
Additionally,
the
fund
is
one
of
several
mutual
funds
in
which
certain
college
savings
plans
managed
by
Price
Associates invests.
As
approved
by
the
fund’s
Board
of
Directors,
shareholder
servicing
costs
associated
with
each
college
savings
plan
are
borne
by
the
fund
in
proportion
to
the
average
daily
value
of
its
shares
owned
by
the
college
savings
plan.
Price
has
agreed
to waive/reimburse
shareholder
servicing
costs in
excess
of
0.05%
of
the
fund’s
average
daily
value
of
its
shares
owned
by
the
college
savings
plan.
Any
amounts
waived/
paid
by
Price
under
this
voluntary
agreement
are
not
subject
to
repayment
by
the
fund.
Price
may
amend
or
terminate
this
voluntary
arrangement
at
any
time
without
prior
notice.
For
the
year ended
October
31,
2024,
the
fund
was
charged $184,000 for
shareholder
servicing
costs
related
to
the
college
savings
plans, of
which
$66,000
was
for
services
provided
by
Price.
All
amounts
due
to
and
due
from
Price,
exclusive
of
investment
management
fees
payable,
are
presented
net
on
the
accompanying
Statement
of
Assets
and
Liabilities. At
October
31,
2024,
approximately
16%
of
the
outstanding
shares
of
the
I
Class
were
held
by
college
savings
plans.
Mutual
funds,
trusts,
and
other
accounts
managed
by
Price
Associates
or
its
affiliates
(collectively,
Price
Funds
and
accounts)
may
invest
in
the
fund.
No
Price
fund
or
account
may
invest
for
the
purpose
of
exercising
management
or
control
over
the
fund.
At
October
31,
2024, 100%
of
the
Z
Class's
outstanding
shares
were
held
by
Price
Funds
and
accounts.
The fund
may
invest
its
cash
reserves
in
certain
open-end
management
investment
companies
managed
by
Price
Associates
and
considered
affiliates
of
the
fund:
the
T.
Rowe
Price
Government
Reserve
Fund
or
the
T.
Rowe
Price
Treasury
Reserve
Fund,
organized
as
money
market
funds
(together,
the
Price
Reserve
Funds).
The
Price
Reserve
Funds
are
offered
as
short-term
investment
options
to
mutual
funds,
trusts,
and
other
accounts
managed
by
Price
Associates
or
its
affiliates
and
are
not
available
for
direct
purchase
by
members
of
the
public.
Cash
collateral
from
securities
lending,
if
any,
is
invested
in
the
T.
Rowe
Price
Government
Reserve Fund. The
Price
Reserve
Funds
pay
no
investment
management
fees.
The fund may
participate
in
securities
purchase
and
sale
transactions
with
other
funds
or
accounts
advised
by
Price
Associates
(cross
trades),
in
accordance
with
procedures
adopted
by the
fund’s
Board
and
Securities
and
Exchange
T.
ROWE
PRICE
International
Stock
Fund
Commission
rules,
which
require,
among
other
things,
that
such
purchase
and
sale
cross
trades
be
effected
at
the
independent
current
market
price
of
the
security.
During
the
year
ended
October
31,
2024,
the
fund
had
no
purchases
or
sales
cross
trades
with
other
funds
or
accounts
advised
by
Price
Associates.
NOTE
8
-
OTHER
MATTERS
Unpredictable environmental,
political,
social
and
economic
events,
including
but
not
limited
to,
environmental
or
natural
disasters,
war
and
conflict
(including
Russia’s
military
invasion
of
Ukraine
and
the
conflict
in
Israel,
Gaza
and
surrounding
areas),
terrorism,
geopolitical
developments
(including
trading
and
tariff
arrangements,
sanctions
and
cybersecurity
attacks),
and
public
health
epidemics
(including
the
global
outbreak
of
COVID-19)
and
similar
public
health
threats,
may
significantly
affect
the
economy
and
the
markets
and
issuers
in
which
a
fund
invests.
The
extent
and
duration
of
such
events
and
resulting
market
disruptions
cannot
be
predicted.
These
and
other
similar
events
may
cause
instability
across
global
markets,
including
reduced
liquidity
and
disruptions
in
trading
markets,
while
some
events
may
affect
certain
geographic
regions,
countries,
sectors,
and
industries
more
significantly
than
others,
and
exacerbate
other
pre-existing
political,
social,
and
economic
risks.
The
fund’s
performance
could
be
negatively
impacted
if
the
value
of
a
portfolio
holding
were
harmed
by
these
or
such
events.
Management
actively
monitors
the
risks
and
financial
impacts
arising
from
such
events.
T.
ROWE
PRICE
International
Stock
Fund
REPORT
OF
INDEPENDENT
REGISTERED
PUBLIC
ACCOUNTING
FIRM
To
the
Board
of
Directors
of
T.
Rowe
Price
International
Funds,
Inc.
and
Shareholders
of
T.
Rowe
Price
International
Stock
Fund
Opinion
on
the
Financial
Statements
We
have
audited
the
accompanying
statement
of
assets
and
liabilities,
including
the
portfolio
of
investments,
of
T.
Rowe
Price
International
Stock
Fund
(one
of
the
funds
constituting
T.
Rowe
Price
International
Funds,
Inc.,
referred
to
hereafter
as
the
"Fund")
as
of
October
31,
2024,
the
related
statement
of
operations
for
the
year
ended
October
31,
2024,
the
statement
of
changes
in
net
assets
for
each
of
the
two
years
in
the
period
ended
October
31,
2024,
including
the
related
notes,
and
the
financial
highlights
for
each
of
the
periods
indicated
therein
(collectively
referred
to
as
the
“financial
statements”).
In
our
opinion,
the
financial
statements
present
fairly,
in
all
material
respects,
the
financial
position
of
the
Fund
as
of
October
31,
2024,
the
results
of
its
operations
for
the
year
then
ended,
the
changes
in
its
net
assets
for
each
of
the
two
years
in
the
period
ended
October
31,
2024
and
the
financial
highlights
for
each
of
the
periods
indicated
therein,
in
conformity
with
accounting
principles
generally
accepted
in
the
United
States
of
America.
Basis
for
Opinion
These
financial
statements
are
the
responsibility
of
the
Fund’s
management.
Our
responsibility
is
to
express
an
opinion
on
the
Fund’s
financial
statements
based
on
our
audits.
We
are
a
public
accounting
firm
registered
with
the
Public
Company
Accounting
Oversight
Board
(United
States)
(PCAOB)
and
are
required
to
be
independent
with
respect
to
the
Fund
in
accordance
with
the
U.S.
federal
securities
laws
and
the
applicable
rules
and
regulations
of
the
Securities
and
Exchange
Commission
and
the
PCAOB.
We
conducted
our
audits
of
these
financial
statements
in
accordance
with
the
standards
of
the
PCAOB.
Those
standards
require
that
we
plan
and
perform
the
audit
to
obtain
reasonable
assurance
about
whether
the
financial
statements
are
free
of
material
misstatement,
whether
due
to
error
or
fraud.
T.
ROWE
PRICE
International
Stock
Fund
Our
audits
included
performing
procedures
to
assess
the
risks
of
material
misstatement
of
the
financial
statements,
whether
due
to
error
or
fraud,
and
performing
procedures
that
respond
to
those
risks.
Such
procedures
included
examining,
on
a
test
basis,
evidence
regarding
the
amounts
and
disclosures
in
the
financial
statements.
Our
audits
also
included
evaluating
the
accounting
principles
used
and
significant
estimates
made
by
management,
as
well
as
evaluating
the
overall
presentation
of
the
financial
statements.
Our
procedures
included
confirmation
of
securities
owned
as
of
October
31,
2024
by
correspondence
with
the
custodian,
transfer
agent
and
brokers;
when
replies
were
not
received
from
brokers,
we
performed
other
auditing
procedures.
We
believe
that
our
audits
provide
a
reasonable
basis
for
our
opinion.
/s/
PricewaterhouseCoopers
LLP
Baltimore,
Maryland
December
18,
2024
We
have
served
as
the
auditor
of
one
or
more
investment
companies
in
the
T.
Rowe
Price
group
of
investment
companies
since
1973.
REPORT
OF
INDEPENDENT
REGISTERED
PUBLIC
ACCOUNTING
FIRM
(continued)
T.
ROWE
PRICE
International
Stock
Fund
TAX
INFORMATION
(UNAUDITED)
FOR
THE
TAX
YEAR
ENDED 10/31/24
We
are
providing
this
information
as
required
by
the
Internal
Revenue
Code.
The
amounts
shown
may
differ
from
those
elsewhere
in
this
report
because
of
differences
between
tax
and
financial
reporting
requirements.
The
fund’s
distributions
to
shareholders
included
$112,535,000
from
long-term
capital
gains,
subject
to
a
long-term
capital
gains
tax
rate
of
not
greater
than
20%.
For
taxable
non-corporate
shareholders,
$193,027,000
of
the
fund's
income
represents
qualified
dividend
income
subject
to
a
long-term
capital
gains
tax
rate
of
not
greater
than
20%.
For
corporate
shareholders,
$1,121,000
of
the
fund's
income
qualifies
for
the
dividends-received
deduction.
The
fund
will
pass
through
foreign
source
income
of
$214,429,000
and
foreign
taxes
paid
of
$38,930,000.
100
East
Pratt
Street
Baltimore,
MD
21202
T.
Rowe
Price
Investment
Services,
Inc.
Call
1-800-225-5132
to
request
a
prospectus
or
summary
prospectus;
each
includes
investment
objectives,
risks,
fees,
expenses,
and
other
information
that
you
should
read
and
consider
carefully
before
investing.
F37-050
12/24
Item 8. Changes in and Disagreements with Accountants for Open-End Management Investment Companies.
Not applicable.
Item 9. Proxy Disclosures for Open-End Management Investment Companies.
Not applicable.
Item 10. Remuneration Paid to Directors, Officers, and Others of Open-End Management Investment Companies.
Remuneration paid to Directors is included in Item 7 of this Form N-CSR.
Item 11. Statement Regarding Basis for Approval of Investment Advisory Contract.
If applicable, see Item 7.
Item 12. Disclosure of Proxy Voting Policies and Procedures for Closed-End Management Investment Companies.
Not applicable.
Item 13. Portfolio Managers of Closed-End Management Investment Companies.
Not applicable.
Item 14. Purchases of Equity Securities by Closed-End Management Investment Company and Affiliated Purchasers.
Not applicable.
Item 15. Submission of Matters to a Vote of Security Holders.
There has been no change to the procedures by which shareholders may recommend nominees to the registrant’s board of directors.
Item 16. Controls and Procedures.
(a) The registrant’s principal executive officer and principal financial officer have evaluated the registrant’s disclosure controls and procedures within 90 days of this filing and have concluded that the registrant’s disclosure controls and procedures were effective, as of that date, in ensuring that information required to be disclosed by the registrant in this Form N-CSR was recorded, processed, summarized, and reported timely.
(b) The registrant’s principal executive officer and principal financial officer are aware of no change in the registrant’s internal control over financial reporting that occurred during the period covered by this report that has materially affected, or is reasonably likely to materially affect, the registrant’s internal control over financial reporting.
Item 17. Disclosure of Securities Lending Activities for Closed-End Management Investment Companies.
Not applicable.
Item 18. Recovery of Erroneously Awarded Compensation.
Not applicable.
Item 19. Exhibits.
SIGNATURES
Pursuant to the requirements of the Securities Exchange Act of 1934 and the Investment Company Act of 1940, the registrant has duly caused this report to be signed on its behalf by the undersigned, thereunto duly authorized.
| | | | |
| T. Rowe Price International Funds, Inc. |
| By | | /s/ David Oestreicher | | |
| | David Oestreicher | | |
| | Principal Executive Officer | | |
| | |
| Date | | December 18, 2024 | | |
Pursuant to the requirements of the Securities Exchange Act of 1934 and the Investment Company Act of 1940, this report has been signed below by the following persons on behalf of the registrant and in the capacities and on the dates indicated.
| | | | |
| | |
| By | | /s/ David Oestreicher | | |
| | David Oestreicher | | |
| | Principal Executive Officer | | |
| | |
| Date | | December 18, 2024 | | |
| | |
| By | | /s/ Alan S. Dupski | | |
| | Alan S. Dupski | | |
| | Principal Financial Officer | | |
| | |
| Date | | December 18, 2024 | | |