UNITED STATES
SECURITIES AND EXCHANGE COMMISSION
Washington, D.C. 20549
FORM N-CSR
CERTIFIED SHAREHOLDER REPORT OF REGISTERED
MANAGEMENT INVESTMENT COMPANIES
Investment Company Act file number 811-03010
Fidelity Advisor Series VII
(Exact name of registrant as specified in charter)
245 Summer St., Boston, Massachusetts 02210
(Address of principal executive offices) (Zip code)
Margaret Carey, Secretary
245 Summer St.
Boston, Massachusetts 02210
(Name and address of agent for service)
Registrant's telephone number, including area code:
617-563-7000
| |
Date of fiscal year end: | July 31 |
|
|
Date of reporting period: | July 31, 2023 |
Item 1.
Reports to Stockholders
Fidelity Advisor Focus Funds®
Fidelity Advisor® Biotechnology Fund
Fidelity Advisor® Consumer Discretionary Fund
Fidelity Advisor® Energy Fund
Fidelity Advisor® Financials Fund
Fidelity Advisor® Health Care Fund
Fidelity Advisor® Industrials Fund
Fidelity Advisor® Semiconductors Fund
Fidelity Advisor® Technology Fund
Fidelity Advisor® Utilities Fund
(Fidelity Advisor® Financials Fund formerly named Fidelity Advisor® Financial Services Fund)
Annual Report
July 31, 2023
Contents
To view a fund's proxy voting guidelines and proxy voting record for the 12-month period ended June 30, visit http://www.fidelity.com/proxyvotingresults or visit the Securities and Exchange Commission's (SEC) web site at http://www.sec.gov.
You may also call 1-877-208-0098 to request a free copy of the proxy voting guidelines.
Standard & Poor's, S&P and S&P 500 are registered service marks of The McGraw-Hill Companies, Inc. and have been licensed for use by Fidelity Distributors Corporation.
Other third-party marks appearing herein are the property of their respective owners.
All other marks appearing herein are registered or unregistered trademarks or service marks of FMR LLC or an affiliated company. © 2023 FMR LLC. All rights reserved.
This report and the financial statements contained herein are submitted for the general information of the shareholders of the Funds. This report is not authorized for distribution to prospective investors in the Funds unless preceded or accompanied by an effective prospectus.
A fund files its complete schedule of portfolio holdings with the SEC for the first and third quarters of each fiscal year on Form N-PORT. Forms N-PORT are available on the SEC's web site at http://www.sec.gov. A fund's Forms N-PORT may be reviewed and copied at the SEC's Public Reference Room in Washington, DC. Information regarding the operation of the SEC's Public Reference Room may be obtained by calling 1-800-SEC-0330.
For a complete list of a fund's portfolio holdings, view the most recent holdings listing, semiannual report, or annual report on Fidelity's web site at http://www.fidelity.com, http://www.institutional.fidelity.com, or http://www.401k.com, as applicable.
NOT FDIC INSURED •MAY LOSE VALUE •NO BANK GUARANTEE
Neither the Funds nor Fidelity Distributors Corporation is a bank.
Average annual total return reflects the change in the value of an investment, assuming reinvestment of distributions from dividend income and capital gains (the profits earned upon the sale of securities that have grown in value, if any) and assuming a constant rate of performance each year. The hypothetical investment and the average annual total returns do not reflect the deduction of taxes that a shareholder would pay on fund distributions or the redemption of fund shares. During periods of reimbursement by Fidelity, a fund's total return will be greater than it would be had the reimbursement not occurred. How a fund did yesterday is no guarantee of how it will do tomorrow.
| Average Annual Total Returns |
| | | | |
Periods ended July 31, 2023 | Past 1 year | Past 5 years | Past 10 years |
Class A (incl. 5.75% sales charge) | 8.56% | 4.12% | 7.86% |
Class M (incl. 3.50% sales charge) | 10.85% | 4.32% | 7.78% |
Class C (incl. contingent deferred sales charge) | 13.36% | 4.59% | 7.85% |
| Class I | 15.51% | 5.65% | 8.79% |
| Class Z | 15.68% | 5.78% | 8.86% |
Class C shares' contingent deferred sales charges included in the past one year, past five years and past ten years total return figures are 1%, 0% and 0%, respectively.
The initial offering of Class Z shares took place on October 2, 2018. Returns prior to October 2, 2018, are those of Class I.
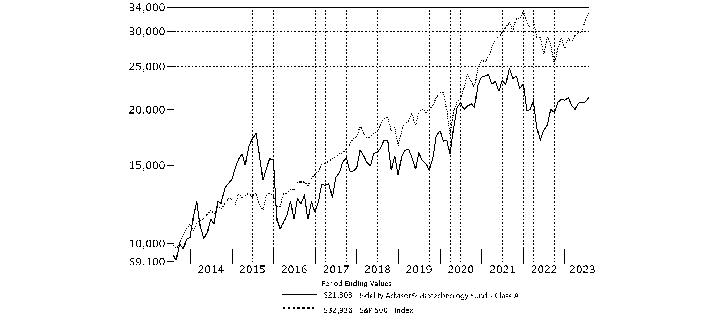
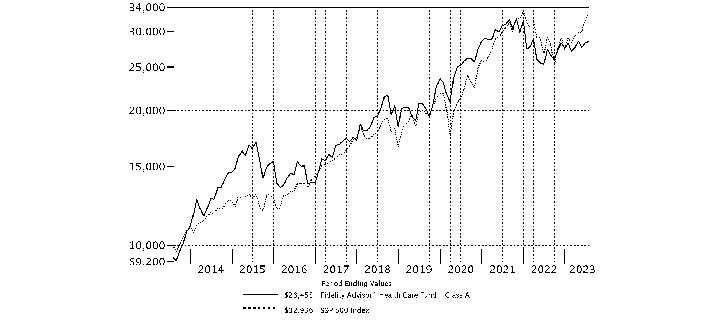
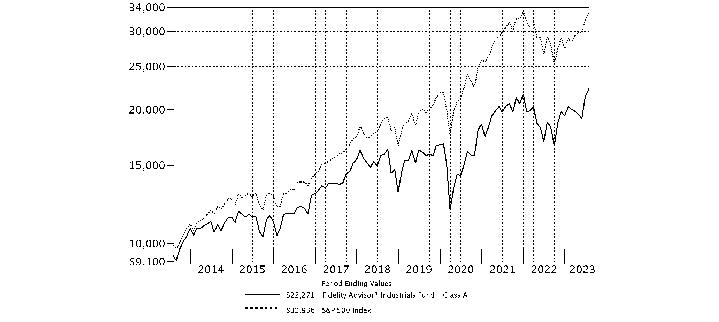
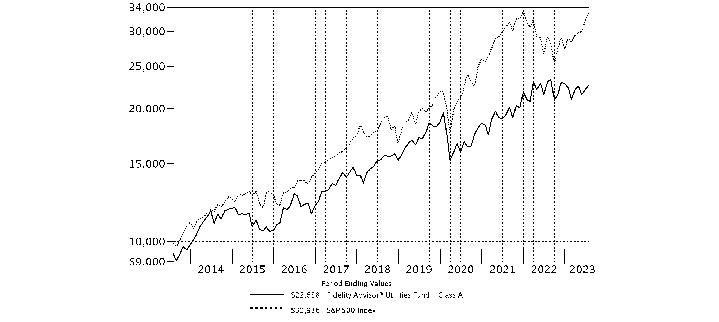
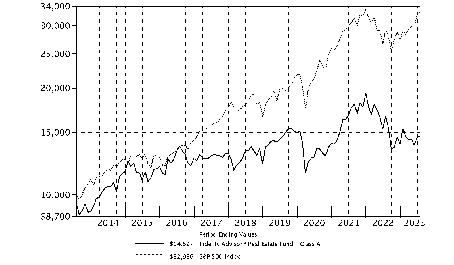
| $10,000 Over 10 Years |
| |
Let's say hypothetically that $10,000 was invested in Fidelity Advisor® Biotechnology Fund - Class A, a class of the fund, on July 31, 2013, and the current 5.75% sales charge was paid. The chart shows how the value of your investment would have changed, and also shows how the S&P 500® Index performed over the same period. |
|
|
Fidelity Advisor® Biotechnology Fund
Market Recap:
U.S. equities gained 13.02% for the 12 months ending July 31, 2023, according to the S&P 500® index, as continued global economic expansion, falling commodity prices and a slowing in the pace of inflation provided a favorable backdrop for higher-risk assets. Large-cap stocks spearheaded the rally, which was driven by the shares of a narrow set of mega-cap companies in the information technology and communication services sectors, largely due to exuberance related to generative artificial intelligence. Aggressive monetary tightening by the U.S. Federal Reserve continued amid consistent pressure on core inflation, a measure that excludes food and energy. Since March 2022, the Fed has hiked its benchmark interest rate 11 times. The latest bump came in late July, a fourth consecutive raise of a stepped down 25 basis points. The S&P 500® gained 3.21% in July, as a "soft landing" of the U.S. economy became the consensus view amid better-than-expected earnings, slowing inflation and easing financial conditions, bringing the index's year-to-date gain to 20.65%. July saw a continuance of the recent shift to wider market breadth and lower dispersion. For the full 12 months, value (+17%) handily topped growth (+8%) within the index. By sector, tech (+28%), communication services (+21%) and industrials (+17%) led, whereas real estate (-10%) lagged most, due to high borrowing costs, low home inventory and a deteriorating commercial property market.
Comments from Portfolio Manager Eirene Kontopoulos:
For the fiscal year ending July 31, 2023, the fund's share classes (excluding sales charges, if applicable) gained about 14% to 16%, versus 9.32% for the MSCI US IMI Biotechnology 25/50 Index and 13.02% for the broad-based S&P 500® index. Relative to the MSCI industry index, security selection was the primary contributor the past 12 months, especially within the core biotechnology group. Mostly non-index exposure to the pharmaceuticals group boosted relative performance to a much lesser degree. Not owning Moderna, an index component that returned approximately -28%, was the top individual relative contributor. A second notable relative contributor was an overweight in Alnylam Pharmaceuticals (+35%). It was one of the fund's biggest holdings. A non-index stake in Moonlake Immunotherapeutics gained roughly 852% and notably helped. This period we decreased our investment in the stock. In contrast, the largest individual relative detractor was an underweight in Seagen (+7%), which was not held at period end. The second-largest relative detractor was an underweight in Gilead Sciences (+32%). This was a stake we established this period. An underweight in Biogen (+26%) also hurt, and we exited the position by July 31. Notable changes in positioning include a higher allocation to pharmaceuticals and reduced exposure to biotechnology.
The views expressed above reflect those of the portfolio manager(s) only through the end of the period as stated on the cover of this report and do not necessarily represent the views of Fidelity or any other person in the Fidelity organization. Any such views are subject to change at any time based upon market or other conditions and Fidelity disclaims any responsibility to update such views. These views may not be relied on as investment advice and, because investment decisions for a Fidelity fund are based on numerous factors, may not be relied on as an indication of trading intent on behalf of any Fidelity fund.
Fidelity Advisor® Biotechnology Fund
Top Holdings (% of Fund's net assets) |
| |
| AbbVie, Inc. | 24.6 | |
| Regeneron Pharmaceuticals, Inc. | 6.4 | |
| Argenx SE ADR | 5.1 | |
| Alnylam Pharmaceuticals, Inc. | 4.4 | |
| Celldex Therapeutics, Inc. | 2.9 | |
| Ascendis Pharma A/S sponsored ADR | 2.8 | |
| Vaxcyte, Inc. | 2.6 | |
| Karuna Therapeutics, Inc. | 2.4 | |
| Ventyx Biosciences, Inc. | 2.3 | |
| Blueprint Medicines Corp. | 2.1 | |
| | 55.6 | |
| |
| Industries (% of Fund's net assets) |
| |
| Biotechnology | 88.7 | |
| Pharmaceuticals | 9.8 | |
| Health Care Providers & Services | 0.2 | |
| Health Care Technology | 0.2 | |
| |
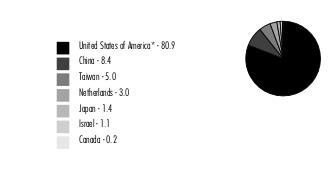
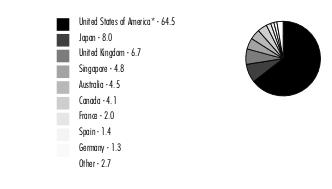
Geographic Diversification (% of Fund's net assets) |
|
* Includes Short-Term investments and Net Other Assets (Liabilities). Percentages are adjusted for the effect of derivatives, if applicable. |
| |
Fidelity Advisor® Biotechnology Fund
Showing Percentage of Net Assets
| Common Stocks - 96.5% |
| | | Shares | Value ($) |
| Biotechnology - 86.9% | | | |
| Biotechnology - 86.9% | | | |
| AbbVie, Inc. | | 2,687,780 | 402,038,130 |
| Acelyrin, Inc. | | 122,700 | 3,047,868 |
| Acelyrin, Inc. | | 681,353 | 15,232,328 |
| Acelyrin, Inc. rights (a)(b) | | 82,794 | 1,758,396 |
| Aerovate Therapeutics, Inc. (a)(c) | | 322,400 | 5,625,880 |
| Allogene Therapeutics, Inc. (a) | | 519,200 | 2,575,232 |
| Alnylam Pharmaceuticals, Inc. (a) | | 364,786 | 71,279,184 |
| Alpine Immune Sciences, Inc. (a)(c) | | 394,000 | 4,940,760 |
| ALX Oncology Holdings, Inc. (a)(c) | | 1,350,373 | 8,250,779 |
| Apellis Pharmaceuticals, Inc. (a) | | 77,900 | 2,005,925 |
| Apogee Therapeutics, Inc. | | 141,800 | 3,034,520 |
| Apogee Therapeutics, Inc. | | 398,923 | 7,683,257 |
| Arcellx, Inc. (a) | | 458,900 | 15,717,325 |
| Arcutis Biotherapeutics, Inc. (a)(c) | | 1,076,984 | 11,749,895 |
| Argenx SE ADR (a) | | 165,800 | 83,642,784 |
| Arrowhead Pharmaceuticals, Inc. (a) | | 472,000 | 16,293,440 |
| Ascendis Pharma A/S sponsored ADR (a)(c) | | 506,125 | 45,627,169 |
| Astria Therapeutics, Inc. (a) | | 1,288,878 | 11,548,347 |
| Biohaven Ltd. | | 282,800 | 5,622,064 |
| Blueprint Medicines Corp. (a) | | 515,826 | 34,044,516 |
| Celldex Therapeutics, Inc. (a) | | 1,331,300 | 47,074,768 |
| Century Therapeutics, Inc. (a) | | 757,500 | 2,310,375 |
| Cerevel Therapeutics Holdings (a) | | 455,458 | 13,932,460 |
| Cogent Biosciences, Inc. (a) | | 255,800 | 3,322,842 |
| Crinetics Pharmaceuticals, Inc. (a) | | 16,838 | 319,922 |
| Cytokinetics, Inc. (a)(c) | | 840,571 | 28,033,043 |
| Day One Biopharmaceuticals, Inc. (a) | | 406,669 | 5,384,298 |
| Exact Sciences Corp. (a) | | 212,900 | 20,766,266 |
| Fusion Pharmaceuticals, Inc. (a)(c) | | 1,546,014 | 5,024,546 |
| Fusion Pharmaceuticals, Inc. (d) | | 505,596 | 1,643,187 |
| Gilead Sciences, Inc. | | 188,300 | 14,337,162 |
| Icosavax, Inc. (a)(c) | | 1,572,165 | 13,882,217 |
| Inhibrx, Inc. (a)(c) | | 256,500 | 5,142,825 |
| Janux Therapeutics, Inc. (a)(c) | | 585,685 | 8,199,590 |
| Karuna Therapeutics, Inc. (a) | | 198,167 | 39,587,822 |
| Keros Therapeutics, Inc. (a) | | 599,500 | 25,107,060 |
| Madrigal Pharmaceuticals, Inc. (a) | | 18,100 | 3,715,930 |
| Mineralys Therapeutics, Inc. | | 477,000 | 6,740,010 |
| Monte Rosa Therapeutics, Inc. (a)(c) | | 1,305,558 | 9,230,295 |
| Moonlake Immunotherapeutics (a)(c) | | 398,062 | 24,206,150 |
| Morphic Holding, Inc. (a) | | 290,912 | 16,503,438 |
| Nuvalent, Inc. Class A (a)(c) | | 368,088 | 18,349,187 |
| ORIC Pharmaceuticals, Inc. (a)(c) | | 816,716 | 6,827,746 |
| PepGen, Inc. (a)(c) | | 544,800 | 3,263,352 |
| Poseida Therapeutics, Inc. (a)(c) | | 493,046 | 852,970 |
| Prelude Therapeutics, Inc. (a)(c) | | 1,424,292 | 5,568,982 |
| Prothena Corp. PLC (a) | | 258,857 | 17,827,482 |
| PTC Therapeutics, Inc. (a) | | 406,740 | 16,407,892 |
| Regeneron Pharmaceuticals, Inc. (a) | | 140,100 | 103,941,591 |
| Replimune Group, Inc. (a) | | 350,300 | 7,380,821 |
| Sage Therapeutics, Inc. (a) | | 215,400 | 7,470,072 |
| Sagimet Biosciences, Inc. (c) | | 179,770 | 2,867,332 |
| Sarepta Therapeutics, Inc. (a) | | 137,200 | 14,871,108 |
| Scholar Rock Holding Corp. (a)(c) | | 1,231,780 | 8,745,638 |
| Scholar Rock Holding Corp. warrants 12/31/25 (a)(d) | | 6,000 | 14,024 |
| Shattuck Labs, Inc. (a) | | 708,134 | 1,805,742 |
| Tango Therapeutics, Inc. (a)(c) | | 2,404,869 | 8,128,457 |
| Tenaya Therapeutics, Inc. (a) | | 622,323 | 3,012,043 |
| Turnstone Biologics Corp. (c) | | 310,000 | 4,014,500 |
| Tyra Biosciences, Inc. (a)(c) | | 1,320,000 | 19,562,400 |
| Vaxcyte, Inc. (a) | | 896,429 | 43,082,378 |
| Vera Therapeutics, Inc. (a)(c) | | 359,925 | 6,755,792 |
| Verve Therapeutics, Inc. (a)(c) | | 545,894 | 11,185,368 |
| Viking Therapeutics, Inc. (a) | | 704,989 | 10,222,341 |
| Xenon Pharmaceuticals, Inc. (a)(c) | | 862,458 | 31,841,949 |
| Zentalis Pharmaceuticals, Inc. (a) | | 707,866 | 18,907,101 |
| | | | 1,419,088,273 |
| Pharmaceuticals - 9.6% | | | |
| Pharmaceuticals - 9.6% | | | |
| Afferent Pharmaceuticals, Inc. rights 12/31/24 (a)(b) | | 1,915,787 | 2,069,050 |
| Amylyx Pharmaceuticals, Inc. (a)(c) | | 326,800 | 7,663,460 |
| Arvinas Holding Co. LLC (a) | | 244,500 | 6,044,040 |
| Axsome Therapeutics, Inc. (a)(c) | | 291,300 | 22,858,311 |
| Edgewise Therapeutics, Inc. (a)(c) | | 1,118,700 | 8,155,323 |
| Enliven Therapeutics, Inc. (a)(c) | | 965,013 | 18,277,346 |
| Enliven Therapeutics, Inc. rights (a)(b) | | 739,725 | 7 |
| GH Research PLC (a)(c) | | 385,500 | 5,069,325 |
| Ikena Oncology, Inc. (a)(c) | | 1,541,666 | 7,939,580 |
| Intra-Cellular Therapies, Inc. (a) | | 104,300 | 6,449,912 |
| Longboard Pharmaceuticals, Inc. (a) | | 968,770 | 6,975,144 |
| Pharvaris BV (a)(c) | | 270,933 | 4,605,861 |
| Terns Pharmaceuticals, Inc. (a) | | 1,001,806 | 7,233,039 |
| Ventyx Biosciences, Inc. (a)(c) | | 1,007,219 | 37,317,464 |
| Verona Pharma PLC ADR (a)(c) | | 768,067 | 16,966,600 |
| | | | 157,624,462 |
| TOTAL COMMON STOCKS (Cost $1,208,615,494) | | | 1,576,712,735 |
| | | | |
| Convertible Preferred Stocks - 2.4% |
| | | Shares | Value ($) |
| Biotechnology - 1.8% | | | |
| Biotechnology - 1.8% | | | |
| Aeglea BioTherapeutics, Inc. Series A (d) | | 600 | 305,154 |
| Bright Peak Therapeutics AG Series B (a)(b)(d) | | 1,920,122 | 5,318,738 |
| Dianthus Therapeutics, Inc. Series A (a)(b)(d) | | 906,629 | 4,043,565 |
| Fog Pharmaceuticals, Inc. Series D (b)(d) | | 239,281 | 2,598,592 |
| LifeMine Therapeutics, Inc. Series C (a)(b)(d) | | 1,950,028 | 3,588,052 |
| Sonoma Biotherapeutics, Inc.: | | | |
| Series B (a)(b)(d) | | 1,967,762 | 5,096,504 |
| Series B1 (a)(b)(d) | | 1,049,456 | 3,106,390 |
| T-Knife Therapeutics, Inc. Series B (a)(b)(d) | | 1,300,097 | 5,122,382 |
| Treeline Biosciences Series A (a)(b)(d) | | 47,600 | 371,280 |
| | | | 29,550,657 |
| Health Care Providers & Services - 0.2% | | | |
| Health Care Facilities - 0.2% | | | |
| Boundless Bio, Inc. Series B (a)(b)(d) | | 3,703,704 | 3,185,185 |
| Health Care Technology - 0.2% | | | |
| Health Care Technology - 0.2% | | | |
| Wugen, Inc. Series B (a)(b)(d) | | 580,277 | 2,895,582 |
| Pharmaceuticals - 0.2% | | | |
| Pharmaceuticals - 0.2% | | | |
| Afferent Pharmaceuticals, Inc. Series C (a)(b)(d) | | 1,915,787 | 19 |
| Aristea Therapeutics, Inc. Series B (a)(b)(d) | | 677,328 | 3,732,077 |
| | | | 3,732,096 |
| TOTAL CONVERTIBLE PREFERRED STOCKS (Cost $46,269,283) | | | 39,363,520 |
| | | | |
| Money Market Funds - 13.2% |
| | | Shares | Value ($) |
| Fidelity Cash Central Fund 5.32% (e) | | 14,189,526 | 14,192,363 |
| Fidelity Securities Lending Cash Central Fund 5.32% (e)(f) | | 200,774,835 | 200,794,912 |
| TOTAL MONEY MARKET FUNDS (Cost $214,983,152) | | | 214,987,275 |
| | | | |
| TOTAL INVESTMENT IN SECURITIES - 112.1% (Cost $1,469,867,929) | 1,831,063,530 |
NET OTHER ASSETS (LIABILITIES) - (12.1)% | (197,925,572) |
| NET ASSETS - 100.0% | 1,633,137,958 |
| | |
Legend
| (c) | Security or a portion of the security is on loan at period end. |
| (d) | Restricted securities (including private placements) - Investment in securities not registered under the Securities Act of 1933 (excluding 144A issues). At the end of the period, the value of restricted securities (excluding 144A issues) amounted to $41,020,731 or 2.5% of net assets. |
| (e) | Affiliated fund that is generally available only to investment companies and other accounts managed by Fidelity Investments. The rate quoted is the annualized seven-day yield of the fund at period end. A complete unaudited listing of the fund's holdings as of its most recent quarter end is available upon request. In addition, each Fidelity Central Fund's financial statements, which are not covered by the Fund's Report of Independent Registered Public Accounting Firm, are available on the SEC's website or upon request. |
| (f) | Investment made with cash collateral received from securities on loan. |
| Additional information on each restricted holding is as follows: |
| Security | Acquisition Date | Acquisition Cost ($) |
| Aeglea BioTherapeutics, Inc. Series A | 6/22/23 | 174,648 |
| | | |
| Afferent Pharmaceuticals, Inc. Series C | 7/01/15 | 0 |
| | | |
| Aristea Therapeutics, Inc. Series B | 10/06/20 - 7/27/21 | 3,734,584 |
| | | |
| Boundless Bio, Inc. Series B | 4/23/21 | 5,000,000 |
| | | |
| Bright Peak Therapeutics AG Series B | 5/14/21 | 7,499,997 |
| | | |
| Dianthus Therapeutics, Inc. Series A | 4/06/22 | 3,940,663 |
| | | |
| Fog Pharmaceuticals, Inc. Series D | 11/17/22 | 2,575,405 |
| | | |
| Fusion Pharmaceuticals, Inc. | 2/13/23 | 1,719,026 |
| | | |
| LifeMine Therapeutics, Inc. Series C | 2/15/22 | 3,971,408 |
| | | |
| Scholar Rock Holding Corp. warrants 12/31/25 | 6/17/22 | 0 |
| | | |
| Sonoma Biotherapeutics, Inc. Series B | 7/26/21 | 3,888,888 |
| | | |
| Sonoma Biotherapeutics, Inc. Series B1 | 7/26/21 | 3,111,112 |
| | | |
| T-Knife Therapeutics, Inc. Series B | 6/30/21 | 7,500,000 |
| | | |
| Treeline Biosciences Series A | 7/30/21 | 372,589 |
| | | |
| Wugen, Inc. Series B | 7/09/21 | 4,499,990 |
| | | |
Affiliated Central Funds
Fiscal year to date information regarding the Fund's investments in Fidelity Central Funds, including the ownership percentage, is presented below.
| Affiliate | Value, beginning of period ($) | Purchases ($) | Sales Proceeds ($) | Dividend Income ($) | Realized Gain (loss) ($) | Change in Unrealized appreciation (depreciation) ($) | Value, end of period ($) | % ownership, end of period |
| Fidelity Cash Central Fund 5.32% | 7,889,645 | 623,445,561 | 617,142,843 | 532,033 | - | - | 14,192,363 | 0.0% |
| Fidelity Securities Lending Cash Central Fund 5.32% | 195,515,949 | 853,674,924 | 848,395,961 | 2,359,326 | - | - | 200,794,912 | 0.7% |
| Total | 203,405,594 | 1,477,120,485 | 1,465,538,804 | 2,891,359 | - | - | 214,987,275 | |
| | | | | | | | | |
Amounts in the dividend income column in the above table include any capital gain distributions from underlying funds, which are presented in the corresponding line item in the Statement of Operations, if applicable.
Amounts in the dividend income column for Fidelity Securities Lending Cash Central Fund represents the income earned on investing cash collateral, less rebates paid to borrowers and any lending agent fees associated with the loan, plus any premium payments received for lending certain types of securities.
Amounts included in the purchases and sales proceeds columns may include in-kind transactions, if applicable.
Other Affiliated Issuers
An affiliated company is a company in which the Fund has ownership of at least 5% of the voting securities. Fiscal year to date transactions with companies which are or were affiliates are presented in the table below. Certain corporate actions, such as mergers, are excluded from the amounts in this table if applicable. A dash in the Value end of period ($) column means either the issuer is no longer held at period end, or the issuer is held at period end but is no longer an affiliate.
| Affiliate | Value, beginning of period ($) | Purchases ($) | Sales Proceeds ($) | Dividend Income ($) | Realized Gain (loss) ($) | Change in Unrealized appreciation (depreciation) ($) | Value, end of period ($) |
| Astria Therapeutics, Inc. | 1,547,525 | 13,000,002 | 2,685,277 | - | 406,241 | (720,144) | - |
| Enliven Therapeutics, Inc. | - | 8,105,912 | - | - | - | - | - |
| Enliven Therapeutics, Inc. | - | 6,446,041 | - | 231,164 | - | 3,725,393 | - |
| Icosavax, Inc. | 7,535,255 | 6,567,649 | 5,941,419 | - | (3,617,746) | 9,338,478 | - |
| Ikena Oncology, Inc. | 5,294,759 | 2,919,186 | 2,443,050 | - | (11,651,920) | 13,820,605 | - |
| Longboard Pharmaceuticals, Inc. | 1,743,340 | 4,732,221 | 4,231,983 | - | (2,097,626) | 6,829,192 | - |
| Total | 16,120,879 | 41,771,011 | 15,301,729 | 231,164 | (16,961,051) | 32,993,524 | - |
Amounts included in the purchases and sales proceeds columns may include in-kind transactions, if applicable.
Investment Valuation
The following is a summary of the inputs used, as of July 31, 2023, involving the Fund's assets and liabilities carried at fair value. The inputs or methodology used for valuing securities may not be an indication of the risk associated with investing in those securities. For more information on valuation inputs, and their aggregation into the levels used below, please refer to the Investment Valuation section in the accompanying Notes to Financial Statements.
| Valuation Inputs at Reporting Date: |
| Description | Total ($) | Level 1 ($) | Level 2 ($) | Level 3 ($) |
Investments in Securities: | | | | |
|
| Common Stocks | 1,576,712,735 | 1,549,955,673 | 22,929,609 | 3,827,453 |
|
| Convertible Preferred Stocks | 39,363,520 | - | 305,154 | 39,058,366 |
|
| Money Market Funds | 214,987,275 | 214,987,275 | - | - |
| Total Investments in Securities: | 1,831,063,530 | 1,764,942,948 | 23,234,763 | 42,885,819 |
| | | | | |
|
| Net Unrealized Depreciation on Unfunded Commitments | (100,846) | - | - | (100,846) |
| Total | (100,846) | - | - | (100,846) |
The following is a reconciliation of Investments in Securities for which Level 3 inputs were used in determining value:
| |
| Investments in Securities: | |
| Convertible Preferred Stocks | | | |
| Beginning Balance | $ | 36,066,970 | |
| Net Realized Gain (Loss) on Investment Securities | | - | |
| Net Unrealized Gain (Loss) on Investment Securities | | 8,888,942 | |
| Cost of Purchases | | 2,575,405 | |
| Proceeds of Sales | | (8,472,951) | |
| Amortization/Accretion | | - | |
| Transfers into Level 3 | | - | |
| Transfers out of Level 3 | | - | |
| Ending Balance | $ | 39,058,366 | |
| The change in unrealized gain (loss) for the period attributable to Level 3 securities held at July 31, 2023 | $ | 5,099,686 | |
| Other Investments in Securities | | | |
| Beginning Balance | $ | 1,800,841 | |
| Net Realized Gain (Loss) on Investment Securities | | (3) | |
| Net Unrealized Gain (Loss) on Investment Securities | | 916,255 | |
| Cost of Purchases | | 1,110,360 | |
| Proceeds of Sales | | - | |
| Amortization/Accretion | | - | |
| Transfers into Level 3 | | - | |
| Transfers out of Level 3 | | - | |
| Ending Balance | $ | 3,827,453 | |
| The change in unrealized gain (loss) for the period attributable to Level 3 securities held at July 31, 2023 | $ | 916,255 | |
| The information used in the above reconciliation represents fiscal year to date activity for any Investments in Securities identified as using Level 3 inputs at either the beginning or the end of the current fiscal period. Cost of purchases and proceeds of sales may include securities received and/or delivered through in-kind transactions, corporate actions or exchanges. Transfers into Level 3 were attributable to a lack of observable market data resulting from decreases in market activity, decreases in liquidity, security restructurings or corporate actions. Transfers out of Level 3 were attributable to observable market data becoming available for those securities. Transfers in or out of Level 3 represent the beginning value of any Security or Instrument where a change in the pricing level occurred from the beginning to the end of the period. Realized and unrealized gains (losses) disclosed in the reconciliation are included in Net Gain (Loss) on the Fund's Statement of Operations. | |
Fidelity Advisor® Biotechnology Fund
| Statement of Assets and Liabilities |
| | | | July 31, 2023 |
| | | | | |
| Assets | | | | |
| Investment in securities, at value (including securities loaned of $196,950,345) - See accompanying schedule: | | | | |
Unaffiliated issuers (cost $1,254,884,777) | $ | 1,616,076,255 | | |
Fidelity Central Funds (cost $214,983,152) | | 214,987,275 | | |
| | | | | |
| | | | | |
| Total Investment in Securities (cost $1,469,867,929) | | | $ | 1,831,063,530 |
| Receivable for investments sold | | | | 93,271,248 |
| Receivable for fund shares sold | | | | 1,155,286 |
| Dividends receivable | | | | 3,225,187 |
| Distributions receivable from Fidelity Central Funds | | | | 351,299 |
| Prepaid expenses | | | | 8,464 |
Total assets | | | | 1,929,075,014 |
| Liabilities | | | | |
| Payable for investments purchased | $ | 91,658,657 | | |
| Unrealized depreciation on unfunded commitments | | 100,846 | | |
| Payable for fund shares redeemed | | 2,080,546 | | |
| Accrued management fee | | 704,975 | | |
| Distribution and service plan fees payable | | 278,868 | | |
| Other affiliated payables | | 282,352 | | |
| Other payables and accrued expenses | | 69,003 | | |
| Collateral on securities loaned | | 200,761,809 | | |
| Total Liabilities | | | | 295,937,056 |
| Commitments and contingent liabilities (see Commitments note) | | | | |
| Net Assets | | | $ | 1,633,137,958 |
| Net Assets consist of: | | | | |
| Paid in capital | | | $ | 1,310,993,038 |
| Total accumulated earnings (loss) | | | | 322,144,920 |
| Net Assets | | | $ | 1,633,137,958 |
| | | | | |
| Net Asset Value and Maximum Offering Price | | | | |
| Class A : | | | | |
Net Asset Value and redemption price per share ($636,504,638 ÷ 25,115,438 shares)(a) | | | $ | 25.34 |
| Maximum offering price per share (100/94.25 of $25.34) | | | $ | 26.89 |
| Class M : | | | | |
Net Asset Value and redemption price per share ($113,960,429 ÷ 4,917,814 shares)(a) | | | $ | 23.17 |
| Maximum offering price per share (100/96.50 of $23.17) | | | $ | 24.01 |
| Class C : | | | | |
Net Asset Value and offering price per share ($119,843,423 ÷ 6,069,170 shares)(a) | | | $ | 19.75 |
| Class I : | | | | |
Net Asset Value, offering price and redemption price per share ($701,785,844 ÷ 25,321,902 shares) | | | $ | 27.71 |
| Class Z : | | | | |
Net Asset Value, offering price and redemption price per share ($61,043,624 ÷ 2,195,250 shares) | | | $ | 27.81 |
(a)Redemption price per share is equal to net asset value less any applicable contingent deferred sales charge. |
| Statement of Operations |
| | | | Year ended July 31, 2023 |
| Investment Income | | | | |
| Dividends (including $231,164 earned from affiliated issuers) | | | $ | 15,473,117 |
| Income from Fidelity Central Funds (including $2,359,326 from security lending) | | | | 2,891,359 |
| Total Income | | | | 18,364,476 |
| Expenses | | | | |
| Management fee | $ | 9,009,399 | | |
| Transfer agent fees | | 3,068,318 | | |
| Distribution and service plan fees | | 3,736,417 | | |
| Accounting fees | | 468,096 | | |
| Custodian fees and expenses | | 69,376 | | |
| Independent trustees' fees and expenses | | 8,905 | | |
| Registration fees | | 88,562 | | |
| Audit | | 69,152 | | |
| Legal | | 3,404 | | |
| Interest | | 2,617 | | |
| Miscellaneous | | 13,815 | | |
| Total expenses before reductions | | 16,538,061 | | |
| Expense reductions | | (90,610) | | |
| Total expenses after reductions | | | | 16,447,451 |
| Net Investment income (loss) | | | | 1,917,025 |
| Realized and Unrealized Gain (Loss) | | | | |
| Net realized gain (loss) on: | | | | |
| Investment Securities: | | | | |
| Unaffiliated issuers | | 97,739,707 | | |
| Affiliated issuers | | (16,961,051) | | |
| Foreign currency transactions | | 5,293 | | |
| Total net realized gain (loss) | | | | 80,783,949 |
| Change in net unrealized appreciation (depreciation) on: | | | | |
| Investment Securities: | | | | |
| Unaffiliated issuers | | 125,130,435 | | |
| Affiliated issuers | | 32,993,524 | | |
| Unfunded commitments | | (100,846) | | |
| Total change in net unrealized appreciation (depreciation) | | | | 158,023,113 |
| Net gain (loss) | | | | 238,807,062 |
| Net increase (decrease) in net assets resulting from operations | | | $ | 240,724,087 |
| Statement of Changes in Net Assets |
| |
| | Year ended July 31, 2023 | | Year ended July 31, 2022 |
| Increase (Decrease) in Net Assets | | | | |
| Operations | | | | |
| Net investment income (loss) | $ | 1,917,025 | $ | (4,304,003) |
| Net realized gain (loss) | | 80,783,949 | | (9,400,446) |
| Change in net unrealized appreciation (depreciation) | | 158,023,113 | | (408,605,977) |
| Net increase (decrease) in net assets resulting from operations | | 240,724,087 | | (422,310,426) |
| Distributions to shareholders | | - | | (389,242,813) |
| | | | | |
| Share transactions - net increase (decrease) | | (240,917,348) | | (72,894,135) |
| Total increase (decrease) in net assets | | (193,261) | | (884,447,374) |
| | | | | |
| Net Assets | | | | |
| Beginning of period | | 1,633,331,219 | | 2,517,778,593 |
| End of period | $ | 1,633,137,958 | $ | 1,633,331,219 |
| | | | | |
| | | | | |
| Fidelity Advisor® Biotechnology Fund Class A |
| |
| Years ended July 31, | | 2023 | | 2022 | | 2021 | | 2020 | | 2019 |
Selected Per-Share Data | | | | | | | | | | |
| Net asset value, beginning of period | $ | 22.00 | $ | 32.58 | $ | 31.03 | $ | 25.48 | $ | 27.80 |
| Income from Investment Operations | | | | | | | | | | |
Net investment income (loss) A,B | | .02 | | (.06) | | .07 | | .03 | | .03 |
| Net realized and unrealized gain (loss) | | 3.32 | | (5.16) | | 4.42 | | 7.40 | | (1.76) |
| Total from investment operations | | 3.34 | | (5.22) | | 4.49 | | 7.43 | | (1.73) |
| Distributions from net investment income | | - | | (.11) | | (.13) | | - | | - |
| Distributions from net realized gain | | - | | (5.25) | | (2.81) | | (1.88) | | (.59) |
| Total distributions | | - | | (5.36) | | (2.94) | | (1.88) | | (.59) |
| Net asset value, end of period | $ | 25.34 | $ | 22.00 | $ | 32.58 | $ | 31.03 | $ | 25.48 |
Total Return C,D | | 15.18% | | (18.95)% | | 14.03% | | 30.00% | | (6.17)% |
Ratios to Average Net Assets B,E,F | | | | | | | | | | |
| Expenses before reductions | | 1.01% | | 1.00% | | 1.01% | | 1.02% | | 1.04% |
| Expenses net of fee waivers, if any | | 1.00% | | 1.00% | | 1.00% | | 1.02% | | 1.03% |
| Expenses net of all reductions | | 1.00% | | 1.00% | | 1.00% | | 1.02% | | 1.03% |
| Net investment income (loss) | | .07% | | (.23)% | | .20% | | .11% | | .13% |
| Supplemental Data | | | | | | | | | | |
| Net assets, end of period (000 omitted) | $ | 636,505 | $ | 594,911 | $ | 808,610 | $ | 722,896 | $ | 616,894 |
Portfolio turnover rate G | | 78% | | 43% | | 72% | | 66% | | 62% |
ACalculated based on average shares outstanding during the period.
BNet investment income (loss) is affected by the timing of the declaration of dividends by any underlying mutual funds or exchange-traded funds (ETFs). Net investment income (loss) of any mutual funds or ETFs is not included in the Fund's net investment income (loss) ratio.
CTotal returns would have been lower if certain expenses had not been reduced during the applicable periods shown.
DTotal returns do not include the effect of the sales charges.
EFees and expenses of any underlying mutual funds or exchange-traded funds (ETFs) are not included in the Fund's expense ratio. The Fund indirectly bears its proportionate share of these expenses. For additional expense information related to investments in Fidelity Central Funds, please refer to the "Investments in Fidelity Central Funds" note found in the Notes to Financial Statements section of the most recent Annual or Semi-Annual report.
FExpense ratios reflect operating expenses of the class. Expenses before reductions do not reflect amounts reimbursed, waived, or reduced through arrangements with the investment adviser, brokerage services, or other offset arrangements, if applicable, and do not represent the amount paid by the class during periods when reimbursements, waivers or reductions occur.
GAmount does not include the portfolio activity of any underlying mutual funds or exchange-traded funds (ETFs).
| Fidelity Advisor® Biotechnology Fund Class M |
| |
| Years ended July 31, | | 2023 | | 2022 | | 2021 | | 2020 | | 2019 |
Selected Per-Share Data | | | | | | | | | | |
| Net asset value, beginning of period | $ | 20.17 | $ | 30.35 | $ | 29.08 | $ | 24.02 | $ | 26.32 |
| Income from Investment Operations | | | | | | | | | | |
Net investment income (loss) A,B | | (.05) | | (.13) | | (.02) | | (.05) | | (.04) |
| Net realized and unrealized gain (loss) | | 3.05 | | (4.73) | | 4.14 | | 6.96 | | (1.67) |
| Total from investment operations | | 3.00 | | (4.86) | | 4.12 | | 6.91 | | (1.71) |
| Distributions from net investment income | | - | | (.07) | | (.07) | | - | | - |
| Distributions from net realized gain | | - | | (5.25) | | (2.78) | | (1.85) | | (.59) |
| Total distributions | | - | | (5.32) | | (2.85) | | (1.85) | | (.59) |
| Net asset value, end of period | $ | 23.17 | $ | 20.17 | $ | 30.35 | $ | 29.08 | $ | 24.02 |
Total Return C,D | | 14.87% | | (19.18)% | | 13.69% | | 29.64% | | (6.44)% |
Ratios to Average Net Assets B,E,F | | | | | | | | | | |
| Expenses before reductions | | 1.29% | | 1.28% | | 1.28% | | 1.32% | | 1.34% |
| Expenses net of fee waivers, if any | | 1.28% | | 1.28% | | 1.28% | | 1.32% | | 1.34% |
| Expenses net of all reductions | | 1.28% | | 1.28% | | 1.28% | | 1.31% | | 1.34% |
| Net investment income (loss) | | (.20)% | | (.51)% | | (.07)% | | (.18)% | | (.18)% |
| Supplemental Data | | | | | | | | | | |
| Net assets, end of period (000 omitted) | $ | 113,960 | $ | 109,815 | $ | 161,619 | $ | 144,568 | $ | 119,312 |
Portfolio turnover rate G | | 78% | | 43% | | 72% | | 66% | | 62% |
ACalculated based on average shares outstanding during the period.
BNet investment income (loss) is affected by the timing of the declaration of dividends by any underlying mutual funds or exchange-traded funds (ETFs). Net investment income (loss) of any mutual funds or ETFs is not included in the Fund's net investment income (loss) ratio.
CTotal returns would have been lower if certain expenses had not been reduced during the applicable periods shown.
DTotal returns do not include the effect of the sales charges.
EFees and expenses of any underlying mutual funds or exchange-traded funds (ETFs) are not included in the Fund's expense ratio. The Fund indirectly bears its proportionate share of these expenses. For additional expense information related to investments in Fidelity Central Funds, please refer to the "Investments in Fidelity Central Funds" note found in the Notes to Financial Statements section of the most recent Annual or Semi-Annual report.
FExpense ratios reflect operating expenses of the class. Expenses before reductions do not reflect amounts reimbursed, waived, or reduced through arrangements with the investment adviser, brokerage services, or other offset arrangements, if applicable, and do not represent the amount paid by the class during periods when reimbursements, waivers or reductions occur.
GAmount does not include the portfolio activity of any underlying mutual funds or exchange-traded funds (ETFs).
| Fidelity Advisor® Biotechnology Fund Class C |
| |
| Years ended July 31, | | 2023 | | 2022 | | 2021 | | 2020 | | 2019 |
Selected Per-Share Data | | | | | | | | | | |
| Net asset value, beginning of period | $ | 17.27 | $ | 26.79 | $ | 25.97 | $ | 21.71 | $ | 23.96 |
| Income from Investment Operations | | | | | | | | | | |
Net investment income (loss) A,B | | (.13) | | (.21) | | (.15) | | (.15) | | (.14) |
| Net realized and unrealized gain (loss) | | 2.61 | | (4.07) | | 3.71 | | 6.26 | | (1.52) |
| Total from investment operations | | 2.48 | | (4.28) | | 3.56 | | 6.11 | | (1.66) |
| Distributions from net investment income | | - | | - | | (.01) | | - | | - |
| Distributions from net realized gain | | - | | (5.24) | | (2.73) | | (1.85) | | (.59) |
| Total distributions | | - | | (5.24) | | (2.74) | | (1.85) | | (.59) |
| Net asset value, end of period | $ | 19.75 | $ | 17.27 | $ | 26.79 | $ | 25.97 | $ | 21.71 |
Total Return C,D | | 14.36% | | (19.54)% | | 13.15% | | 29.07% | | (6.87)% |
Ratios to Average Net Assets B,E,F | | | | | | | | | | |
| Expenses before reductions | | 1.76% | | 1.75% | | 1.75% | | 1.77% | | 1.78% |
| Expenses net of fee waivers, if any | | 1.76% | | 1.74% | | 1.75% | | 1.77% | | 1.77% |
| Expenses net of all reductions | | 1.76% | | 1.74% | | 1.75% | | 1.76% | | 1.77% |
| Net investment income (loss) | | (.69)% | | (.97)% | | (.55)% | | (.63)% | | (.61)% |
| Supplemental Data | | | | | | | | | | |
| Net assets, end of period (000 omitted) | $ | 119,843 | $ | 168,797 | $ | 328,417 | $ | 384,420 | $ | 398,749 |
Portfolio turnover rate G | | 78% | | 43% | | 72% | | 66% | | 62% |
ACalculated based on average shares outstanding during the period.
BNet investment income (loss) is affected by the timing of the declaration of dividends by any underlying mutual funds or exchange-traded funds (ETFs). Net investment income (loss) of any mutual funds or ETFs is not included in the Fund's net investment income (loss) ratio.
CTotal returns would have been lower if certain expenses had not been reduced during the applicable periods shown.
DTotal returns do not include the effect of the contingent deferred sales charge.
EFees and expenses of any underlying mutual funds or exchange-traded funds (ETFs) are not included in the Fund's expense ratio. The Fund indirectly bears its proportionate share of these expenses. For additional expense information related to investments in Fidelity Central Funds, please refer to the "Investments in Fidelity Central Funds" note found in the Notes to Financial Statements section of the most recent Annual or Semi-Annual report.
FExpense ratios reflect operating expenses of the class. Expenses before reductions do not reflect amounts reimbursed, waived, or reduced through arrangements with the investment adviser, brokerage services, or other offset arrangements, if applicable, and do not represent the amount paid by the class during periods when reimbursements, waivers or reductions occur.
GAmount does not include the portfolio activity of any underlying mutual funds or exchange-traded funds (ETFs).
| Fidelity Advisor® Biotechnology Fund Class I |
| |
| Years ended July 31, | | 2023 | | 2022 | | 2021 | | 2020 | | 2019 |
Selected Per-Share Data | | | | | | | | | | |
| Net asset value, beginning of period | $ | 23.99 | $ | 35.00 | $ | 33.16 | $ | 27.08 | $ | 29.42 |
| Income from Investment Operations | | | | | | | | | | |
Net investment income (loss) A,B | | .09 | | .01 | | .17 | | .11 | | .11 |
| Net realized and unrealized gain (loss) | | 3.63 | | (5.61) | | 4.72 | | 7.88 | | (1.86) |
| Total from investment operations | | 3.72 | | (5.60) | | 4.89 | | 7.99 | | (1.75) |
| Distributions from net investment income | | - | | (.16) | | (.21) | | - | | - |
| Distributions from net realized gain | | - | | (5.25) | | (2.85) | | (1.91) | | (.59) |
| Total distributions | | - | | (5.41) | | (3.05) C | | (1.91) | | (.59) |
| Net asset value, end of period | $ | 27.71 | $ | 23.99 | $ | 35.00 | $ | 33.16 | $ | 27.08 |
Total Return D | | 15.51% | | (18.74)% | | 14.34% | | 30.32% | | (5.89)% |
Ratios to Average Net Assets B,E,F | | | | | | | | | | |
| Expenses before reductions | | .74% | | .73% | | .74% | | .75% | | .76% |
| Expenses net of fee waivers, if any | | .73% | | .73% | | .74% | | .75% | | .76% |
| Expenses net of all reductions | | .73% | | .73% | | .74% | | .75% | | .76% |
| Net investment income (loss) | | .34% | | .04% | | .47% | | .38% | | .40% |
| Supplemental Data | | | | | | | | | | |
| Net assets, end of period (000 omitted) | $ | 701,786 | $ | 697,079 | $ | 1,129,492 | $ | 1,092,145 | $ | 1,006,084 |
Portfolio turnover rate G | | 78% | | 43% | | 72% | | 66% | | 62% |
ACalculated based on average shares outstanding during the period.
BNet investment income (loss) is affected by the timing of the declaration of dividends by any underlying mutual funds or exchange-traded funds (ETFs). Net investment income (loss) of any mutual funds or ETFs is not included in the Fund's net investment income (loss) ratio.
CTotal distributions per share do not sum due to rounding.
DTotal returns would have been lower if certain expenses had not been reduced during the applicable periods shown.
EFees and expenses of any underlying mutual funds or exchange-traded funds (ETFs) are not included in the Fund's expense ratio. The Fund indirectly bears its proportionate share of these expenses. For additional expense information related to investments in Fidelity Central Funds, please refer to the "Investments in Fidelity Central Funds" note found in the Notes to Financial Statements section of the most recent Annual or Semi-Annual report.
FExpense ratios reflect operating expenses of the class. Expenses before reductions do not reflect amounts reimbursed, waived, or reduced through arrangements with the investment adviser, brokerage services, or other offset arrangements, if applicable, and do not represent the amount paid by the class during periods when reimbursements, waivers or reductions occur.
GAmount does not include the portfolio activity of any underlying mutual funds or exchange-traded funds (ETFs).
| Fidelity Advisor® Biotechnology Fund Class Z |
| |
| Years ended July 31, | | 2023 | | 2022 | | 2021 | | 2020 | | 2019 A |
Selected Per-Share Data | | | | | | | | | | |
| Net asset value, beginning of period | $ | 24.04 | $ | 35.05 | $ | 33.22 | $ | 27.10 | $ | 30.06 |
| Income from Investment Operations | | | | | | | | | | |
Net investment income (loss) B,C | | .13 | | .05 | | .21 | | .15 | | .16 |
| Net realized and unrealized gain (loss) | | 3.64 | | (5.62) | | 4.74 | | 7.90 | | (2.53) |
| Total from investment operations | | 3.77 | | (5.57) | | 4.95 | | 8.05 | | (2.37) |
| Distributions from net investment income | | - | | (.19) | | (.26) | | (.02) | | - |
| Distributions from net realized gain | | - | | (5.25) | | (2.87) | | (1.91) | | (.59) |
| Total distributions | | - | | (5.44) | | (3.12) D | | (1.93) | | (.59) |
| Net asset value, end of period | $ | 27.81 | $ | 24.04 | $ | 35.05 | $ | 33.22 | $ | 27.10 |
Total Return E,F | | 15.68% | | (18.63)% | | 14.49% | | 30.53% | | (7.83)% |
Ratios to Average Net Assets C,G,H | | | | | | | | | | |
| Expenses before reductions | | .61% | | .61% | | .61% | | .62% | | .63% I |
| Expenses net of fee waivers, if any | | .60% | | .60% | | .61% | | .62% | | .63% I |
| Expenses net of all reductions | | .60% | | .60% | | .61% | | .62% | | .62% I |
| Net investment income (loss) | | .47% | | .16% | | .60% | | .51% | | .73% I |
| Supplemental Data | | | | | | | | | | |
| Net assets, end of period (000 omitted) | $ | 61,044 | $ | 62,729 | $ | 89,641 | $ | 62,743 | $ | 30,116 |
Portfolio turnover rate J | | 78% | | 43% | | 72% | | 66% | | 62% |
AFor the period October 2, 2018 (commencement of sale of shares) through July 31, 2019.
BCalculated based on average shares outstanding during the period.
CNet investment income (loss) is affected by the timing of the declaration of dividends by any underlying mutual funds or exchange-traded funds (ETFs). Net investment income (loss) of any mutual funds or ETFs is not included in the Fund's net investment income (loss) ratio.
DTotal distributions per share do not sum due to rounding.
ETotal returns for periods of less than one year are not annualized.
FTotal returns would have been lower if certain expenses had not been reduced during the applicable periods shown.
GFees and expenses of any underlying mutual funds or exchange-traded funds (ETFs) are not included in the Fund's expense ratio. The Fund indirectly bears its proportionate share of these expenses. For additional expense information related to investments in Fidelity Central Funds, please refer to the "Investments in Fidelity Central Funds" note found in the Notes to Financial Statements section of the most recent Annual or Semi-Annual report.
HExpense ratios reflect operating expenses of the class. Expenses before reductions do not reflect amounts reimbursed, waived, or reduced through arrangements with the investment adviser, brokerage services, or other offset arrangements, if applicable, and do not represent the amount paid by the class during periods when reimbursements, waivers or reductions occur.
IAnnualized.
JAmount does not include the portfolio activity of any underlying mutual funds or exchange-traded funds (ETFs).
Average annual total return reflects the change in the value of an investment, assuming reinvestment of distributions from dividend income and capital gains (the profits earned upon the sale of securities that have grown in value, if any) and assuming a constant rate of performance each year. The hypothetical investment and the average annual total returns do not reflect the deduction of taxes that a shareholder would pay on fund distributions or the redemption of fund shares. During periods of reimbursement by Fidelity, a fund's total return will be greater than it would be had the reimbursement not occurred. How a fund did yesterday is no guarantee of how it will do tomorrow.
| Average Annual Total Returns |
| | | | |
Periods ended July 31, 2023 | Past 1 year | Past 5 years | Past 10 years |
Class A (incl. 5.75% sales charge) | 5.69% | 8.07% | 10.26% |
Class M (incl. 3.50% sales charge) | 7.95% | 8.30% | 10.22% |
Class C (incl. contingent deferred sales charge) | 10.32% | 8.54% | 10.25% |
| Class I | 12.45% | 9.66% | 11.22% |
| Class Z | 12.59% | 9.79% | 11.29% |
Class C shares' contingent deferred sales charges included in the past one year, past five years and past ten years total return figures are 1%, 0% and 0%, respectively.
The initial offering of Class Z shares took place on October 2, 2018. Returns prior to October 2, 2018, are those of Class I.
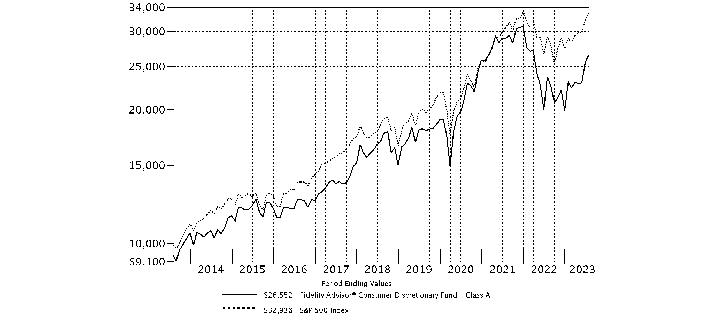
| $10,000 Over 10 Years |
| |
Let's say hypothetically that $10,000 was invested in Fidelity Advisor® Consumer Discretionary Fund - Class A, a class of the fund, on July 31, 2013, and the current 5.75% sales charge was paid. The chart shows how the value of your investment would have changed, and also shows how the S&P 500® Index performed over the same period. |
|
|
Fidelity Advisor® Consumer Discretionary Fund
Market Recap:
U.S. equities gained 13.02% for the 12 months ending July 31, 2023, according to the S&P 500® index, as continued global economic expansion, falling commodity prices and a slowing in the pace of inflation provided a favorable backdrop for higher-risk assets. Large-cap stocks spearheaded the rally, which was driven by the shares of a narrow set of mega-cap companies in the information technology and communication services sectors, largely due to exuberance related to generative artificial intelligence. Aggressive monetary tightening by the U.S. Federal Reserve continued amid consistent pressure on core inflation, a measure that excludes food and energy. Since March 2022, the Fed has hiked its benchmark interest rate 11 times. The latest bump came in late July, a fourth consecutive raise of a stepped down 25 basis points. The S&P 500® gained 3.21% in July, as a "soft landing" of the U.S. economy became the consensus view amid better-than-expected earnings, slowing inflation and easing financial conditions, bringing the index's year-to-date gain to 20.65%. July saw a continuance of the recent shift to wider market breadth and lower dispersion. For the full 12 months, value (+17%) handily topped growth (+8%) within the index. By sector, tech (+28%), communication services (+21%) and industrials (+17%) led, whereas real estate (-10%) lagged most, due to high borrowing costs, low home inventory and a deteriorating commercial property market.
Comments from Portfolio Manager Jordan Michaels:
For the fiscal year ending July 31, 2023, the fund's share classes (excluding sales charges, if applicable) gained about 11% to 13%, versus 10.16% for the MSCI U.S. IMI Consumer Discretionary 25/50 Index and 13.02% for the broad-based S&P 500® index. From an industry group perspective, the primary contributor to the fund's performance versus the sector index was stock picking in footwear. Stock choices in apparel, accessories & luxury goods also boosted the fund's relative performance. Also bolstering our result were stock selection and an overweight in the other specialty retail category. The fund's top individual relative contributor was an overweight in Deckers Outdoor (+74%). We reduced our stake this period. The second-largest relative contributor was an overweight in TJX (+43%). TJX was among our largest holdings. Another notable relative contributor was our stake in Five Below (+55%). Five Below was not held at period end. In contrast, the biggest detractor from the fund's performance versus the sector index was stock picking in casinos & gaming. An underweight in homebuilding also hampered the fund's result. Also detracting from the fund's relative performance were stock selection and an underweight in restaurants. The fund's biggest individual relative detractor was an underweight in Starbucks (+22%). We established a stake in the stock this period. A second notable relative detractor was an underweight in DR Horton (+65%). DR Horton was not held at period end. Not owning MercadoLibre, an index component that gained 52%, was another notable relative detractor for the fund. Notable changes in positioning include decreased exposure to the consumer staples merchandise retail industry and a higher allocation to restaurants.
Note to shareholders: On October 1, 2022, Katie Shaw came off the fund, leaving Jordan Michaels as sole portfolio manager.
The views expressed above reflect those of the portfolio manager(s) only through the end of the period as stated on the cover of this report and do not necessarily represent the views of Fidelity or any other person in the Fidelity organization. Any such views are subject to change at any time based upon market or other conditions and Fidelity disclaims any responsibility to update such views. These views may not be relied on as investment advice and, because investment decisions for a Fidelity fund are based on numerous factors, may not be relied on as an indication of trading intent on behalf of any Fidelity fund.
Fidelity Advisor® Consumer Discretionary Fund
Top Holdings (% of Fund's net assets) |
| |
| Amazon.com, Inc. | 24.0 | |
| Tesla, Inc. | 14.1 | |
| The Home Depot, Inc. | 4.8 | |
| Lowe's Companies, Inc. | 4.8 | |
| TJX Companies, Inc. | 4.0 | |
| NIKE, Inc. Class B | 3.2 | |
| Hilton Worldwide Holdings, Inc. | 2.9 | |
| McDonald's Corp. | 2.3 | |
| Booking Holdings, Inc. | 2.3 | |
| Aptiv PLC | 2.1 | |
| | 64.5 | |
| |
| Industries (% of Fund's net assets) |
| |
| Broadline Retail | 24.7 | |
| Specialty Retail | 20.3 | |
| Hotels, Restaurants & Leisure | 18.3 | |
| Automobiles | 14.3 | |
| Textiles, Apparel & Luxury Goods | 10.7 | |
| Household Durables | 3.9 | |
| Automobile Components | 3.6 | |
| Consumer Staples Distribution & Retail | 3.1 | |
| Building Products | 0.4 | |
| |
Fidelity Advisor® Consumer Discretionary Fund
Showing Percentage of Net Assets
| Common Stocks - 99.3% |
| | | Shares | Value ($) |
| Automobile Components - 3.6% | | | |
| Automotive Parts & Equipment - 3.6% | | | |
| Adient PLC (a) | | 97,321 | 4,141,982 |
| Aptiv PLC (a) | | 98,450 | 10,779,291 |
| Magna International, Inc. Class A (b) | | 51,860 | 3,336,154 |
| | | | 18,257,427 |
| Automobiles - 14.3% | | | |
| Automobile Manufacturers - 14.3% | | | |
| General Motors Co. | | 31,500 | 1,208,655 |
| Tesla, Inc. (a) | | 267,715 | 71,595,022 |
| | | | 72,803,677 |
| Broadline Retail - 24.7% | | | |
| Broadline Retail - 24.7% | | | |
| Amazon.com, Inc. (a) | | 912,969 | 122,045,694 |
| eBay, Inc. | | 16,994 | 756,403 |
| Ollie's Bargain Outlet Holdings, Inc. (a) | | 35,843 | 2,612,238 |
| | | | 125,414,335 |
| Building Products - 0.4% | | | |
| Building Products - 0.4% | | | |
| The AZEK Co., Inc. (a) | | 64,371 | 2,008,375 |
| Consumer Staples Distribution & Retail - 3.1% | | | |
| Consumer Staples Merchandise Retail - 2.2% | | | |
| Dollar Tree, Inc. (a) | | 63,894 | 9,860,761 |
| Target Corp. | | 10,264 | 1,400,728 |
| | | | 11,261,489 |
| Food Distributors - 0.9% | | | |
| Performance Food Group Co. (a) | | 77,392 | 4,624,946 |
TOTAL CONSUMER STAPLES DISTRIBUTION & RETAIL | | | 15,886,435 |
| Hotels, Restaurants & Leisure - 18.3% | | | |
| Casinos & Gaming - 2.6% | | | |
| Caesars Entertainment, Inc. (a) | | 53,341 | 3,148,186 |
| Churchill Downs, Inc. | | 35,694 | 4,135,150 |
| Penn Entertainment, Inc. (a) | | 133,135 | 3,500,119 |
| Red Rock Resorts, Inc. | | 48,100 | 2,332,850 |
| | | | 13,116,305 |
| Hotels, Resorts & Cruise Lines - 7.8% | | | |
| Booking Holdings, Inc. (a) | | 3,895 | 11,571,266 |
| Hilton Worldwide Holdings, Inc. | | 95,395 | 14,832,969 |
| Marriott International, Inc. Class A | | 47,994 | 9,685,669 |
| Royal Caribbean Cruises Ltd. (a) | | 30,890 | 3,370,408 |
| | | | 39,460,312 |
| Leisure Facilities - 0.3% | | | |
| Planet Fitness, Inc. (a) | | 21,097 | 1,424,891 |
| Restaurants - 7.6% | | | |
| ARAMARK Holdings Corp. | | 80,649 | 3,255,800 |
| Brinker International, Inc. (a) | | 25,820 | 1,014,210 |
| Chipotle Mexican Grill, Inc. (a) | | 3,198 | 6,275,371 |
| Domino's Pizza, Inc. | | 23,109 | 9,168,265 |
| Dutch Bros, Inc. (a)(b) | | 20,129 | 624,200 |
| McDonald's Corp. | | 40,541 | 11,886,621 |
| Starbucks Corp. | | 65,400 | 6,642,678 |
| | | | 38,867,145 |
TOTAL HOTELS, RESTAURANTS & LEISURE | | | 92,868,653 |
| Household Durables - 3.9% | | | |
| Home Furnishings - 1.9% | | | |
| Tempur Sealy International, Inc. | | 208,625 | 9,310,934 |
| Homebuilding - 2.0% | | | |
| KB Home | | 78,560 | 4,239,883 |
| PulteGroup, Inc. | | 70,740 | 5,969,749 |
| | | | 10,209,632 |
TOTAL HOUSEHOLD DURABLES | | | 19,520,566 |
| Specialty Retail - 20.3% | | | |
| Apparel Retail - 5.0% | | | |
| Burlington Stores, Inc. (a) | | 23,563 | 4,185,260 |
| TJX Companies, Inc. | | 235,649 | 20,390,708 |
| Victoria's Secret & Co. (a) | | 48,829 | 1,000,506 |
| | | | 25,576,474 |
| Automotive Retail - 0.6% | | | |
| O'Reilly Automotive, Inc. (a) | | 3,125 | 2,893,094 |
| Home Improvement Retail - 11.5% | | | |
| Floor & Decor Holdings, Inc. Class A (a)(b) | | 84,028 | 9,650,616 |
| Lowe's Companies, Inc. | | 103,797 | 24,316,523 |
| The Home Depot, Inc. | | 73,663 | 24,591,656 |
| | | | 58,558,795 |
| Homefurnishing Retail - 0.7% | | | |
| Wayfair LLC Class A (a) | | 3,100 | 241,397 |
| Williams-Sonoma, Inc. (b) | | 22,280 | 3,088,899 |
| | | | 3,330,296 |
| Other Specialty Retail - 2.5% | | | |
| Bath & Body Works, Inc. | | 40,808 | 1,512,344 |
| Dick's Sporting Goods, Inc. | | 76,344 | 10,764,504 |
| Sally Beauty Holdings, Inc. (a) | | 50,990 | 610,350 |
| | | | 12,887,198 |
TOTAL SPECIALTY RETAIL | | | 103,245,857 |
| Textiles, Apparel & Luxury Goods - 10.7% | | | |
| Apparel, Accessories & Luxury Goods - 5.3% | | | |
| Capri Holdings Ltd. (a) | | 128,070 | 4,727,064 |
| Levi Strauss & Co. Class A (b) | | 103,650 | 1,562,006 |
| lululemon athletica, Inc. (a) | | 21,270 | 8,051,333 |
| LVMH Moet Hennessy Louis Vuitton SE | | 2,237 | 2,077,654 |
| PVH Corp. | | 50,659 | 4,541,073 |
| Tapestry, Inc. | | 132,744 | 5,727,904 |
| | | | 26,687,034 |
| Footwear - 5.4% | | | |
| Deckers Outdoor Corp. (a) | | 15,327 | 8,333,137 |
| NIKE, Inc. Class B | | 148,302 | 16,371,058 |
| On Holding AG (a) | | 30,284 | 1,090,224 |
| Skechers U.S.A., Inc. Class A (sub. vtg.) (a) | | 21,100 | 1,172,738 |
| Wolverine World Wide, Inc. | | 57,567 | 729,374 |
| | | | 27,696,531 |
TOTAL TEXTILES, APPAREL & LUXURY GOODS | | | 54,383,565 |
| TOTAL COMMON STOCKS (Cost $284,935,874) | | | 504,388,890 |
| | | | |
| Money Market Funds - 3.1% |
| | | Shares | Value ($) |
| Fidelity Cash Central Fund 5.32% (c) | | 7,174,528 | 7,175,962 |
| Fidelity Securities Lending Cash Central Fund 5.32% (c)(d) | | 8,747,800 | 8,748,675 |
| TOTAL MONEY MARKET FUNDS (Cost $15,924,637) | | | 15,924,637 |
| | | | |
| TOTAL INVESTMENT IN SECURITIES - 102.4% (Cost $300,860,511) | 520,313,527 |
NET OTHER ASSETS (LIABILITIES) - (2.4)% | (12,203,569) |
| NET ASSETS - 100.0% | 508,109,958 |
| | |
Legend
| (b) | Security or a portion of the security is on loan at period end. |
| (c) | Affiliated fund that is generally available only to investment companies and other accounts managed by Fidelity Investments. The rate quoted is the annualized seven-day yield of the fund at period end. A complete unaudited listing of the fund's holdings as of its most recent quarter end is available upon request. In addition, each Fidelity Central Fund's financial statements, which are not covered by the Fund's Report of Independent Registered Public Accounting Firm, are available on the SEC's website or upon request. |
| (d) | Investment made with cash collateral received from securities on loan. |
Affiliated Central Funds
Fiscal year to date information regarding the Fund's investments in Fidelity Central Funds, including the ownership percentage, is presented below.
| Affiliate | Value, beginning of period ($) | Purchases ($) | Sales Proceeds ($) | Dividend Income ($) | Realized Gain (loss) ($) | Change in Unrealized appreciation (depreciation) ($) | Value, end of period ($) | % ownership, end of period |
| Fidelity Cash Central Fund 5.32% | - | 127,844,784 | 120,668,822 | 92,491 | - | - | 7,175,962 | 0.0% |
| Fidelity Securities Lending Cash Central Fund 5.32% | 3,926,447 | 134,615,295 | 129,793,067 | 101,069 | - | - | 8,748,675 | 0.0% |
| Total | 3,926,447 | 262,460,079 | 250,461,889 | 193,560 | - | - | 15,924,637 | |
| | | | | | | | | |
Amounts in the dividend income column in the above table include any capital gain distributions from underlying funds, which are presented in the corresponding line item in the Statement of Operations, if applicable.
Amounts in the dividend income column for Fidelity Securities Lending Cash Central Fund represents the income earned on investing cash collateral, less rebates paid to borrowers and any lending agent fees associated with the loan, plus any premium payments received for lending certain types of securities.
Amounts included in the purchases and sales proceeds columns may include in-kind transactions, if applicable.
Investment Valuation
The following is a summary of the inputs used, as of July 31, 2023, involving the Fund's assets and liabilities carried at fair value. The inputs or methodology used for valuing securities may not be an indication of the risk associated with investing in those securities. For more information on valuation inputs, and their aggregation into the levels used below, please refer to the Investment Valuation section in the accompanying Notes to Financial Statements.
| Valuation Inputs at Reporting Date: |
| Description | Total ($) | Level 1 ($) | Level 2 ($) | Level 3 ($) |
Investments in Securities: | | | | |
|
| Common Stocks | 504,388,890 | 502,311,236 | 2,077,654 | - |
|
| Money Market Funds | 15,924,637 | 15,924,637 | - | - |
| Total Investments in Securities: | 520,313,527 | 518,235,873 | 2,077,654 | - |
Fidelity Advisor® Consumer Discretionary Fund
| Statement of Assets and Liabilities |
| | | | July 31, 2023 |
| | | | | |
| Assets | | | | |
| Investment in securities, at value (including securities loaned of $8,560,563) - See accompanying schedule: | | | | |
Unaffiliated issuers (cost $284,935,874) | $ | 504,388,890 | | |
Fidelity Central Funds (cost $15,924,637) | | 15,924,637 | | |
| | | | | |
| | | | | |
| Total Investment in Securities (cost $300,860,511) | | | $ | 520,313,527 |
| Foreign currency held at value (cost $21,151) | | | | 19,964 |
| Receivable for investments sold | | | | 1,159,382 |
| Receivable for fund shares sold | | | | 309,751 |
| Dividends receivable | | | | 155,397 |
| Distributions receivable from Fidelity Central Funds | | | | 21,908 |
| Prepaid expenses | | | | 1,541 |
| Other receivables | | | | 7,283 |
Total assets | | | | 521,988,753 |
| Liabilities | | | | |
| Payable for investments purchased | $ | 4,417,408 | | |
| Payable for fund shares redeemed | | 288,960 | | |
| Accrued management fee | | 215,509 | | |
| Distribution and service plan fees payable | | 92,325 | | |
| Other affiliated payables | | 75,966 | | |
| Other payables and accrued expenses | | 40,127 | | |
| Collateral on securities loaned | | 8,748,500 | | |
| Total Liabilities | | | | 13,878,795 |
| Net Assets | | | $ | 508,109,958 |
| Net Assets consist of: | | | | |
| Paid in capital | | | $ | 299,378,740 |
| Total accumulated earnings (loss) | | | | 208,731,218 |
| Net Assets | | | $ | 508,109,958 |
| | | | | |
| Net Asset Value and Maximum Offering Price | | | | |
| Class A : | | | | |
Net Asset Value and redemption price per share ($203,467,528 ÷ 5,400,310 shares)(a) | | | $ | 37.68 |
| Maximum offering price per share (100/94.25 of $37.68) | | | $ | 39.98 |
| Class M : | | | | |
Net Asset Value and redemption price per share ($35,810,782 ÷ 1,041,160 shares)(a) | | | $ | 34.40 |
| Maximum offering price per share (100/96.50 of $34.40) | | | $ | 35.65 |
| Class C : | | | | |
Net Asset Value and offering price per share ($43,294,442 ÷ 1,527,121 shares)(a) | | | $ | 28.35 |
| Class I : | | | | |
Net Asset Value, offering price and redemption price per share ($139,087,691 ÷ 3,342,982 shares) | | | $ | 41.61 |
| Class Z : | | | | |
Net Asset Value, offering price and redemption price per share ($86,449,515 ÷ 2,067,397 shares) | | | $ | 41.82 |
(a)Redemption price per share is equal to net asset value less any applicable contingent deferred sales charge. |
| Statement of Operations |
| | | | Year ended July 31, 2023 |
| Investment Income | | | | |
| Dividends | | | $ | 3,077,796 |
| Income from Fidelity Central Funds (including $101,069 from security lending) | | | | 193,560 |
| Total Income | | | | 3,271,356 |
| Expenses | | | | |
| Management fee | $ | 2,237,821 | | |
| Transfer agent fees | | 692,142 | | |
| Distribution and service plan fees | | 1,032,795 | | |
| Accounting fees | | 150,649 | | |
| Custodian fees and expenses | | 15,456 | | |
| Independent trustees' fees and expenses | | 2,219 | | |
| Registration fees | | 85,463 | | |
| Audit | | 56,085 | | |
| Legal | | 3,149 | | |
| Interest | | 5,131 | | |
| Miscellaneous | | 2,798 | | |
| Total expenses before reductions | | 4,283,708 | | |
| Expense reductions | | (21,522) | | |
| Total expenses after reductions | | | | 4,262,186 |
| Net Investment income (loss) | | | | (990,830) |
| Realized and Unrealized Gain (Loss) | | | | |
| Net realized gain (loss) on: | | | | |
| Investment Securities: | | | | |
| Unaffiliated issuers | | 11,409,307 | | |
| Foreign currency transactions | | (2,503) | | |
| Total net realized gain (loss) | | | | 11,406,804 |
| Change in net unrealized appreciation (depreciation) on: | | | | |
| Investment Securities: | | | | |
| Unaffiliated issuers | | 43,205,140 | | |
| Assets and liabilities in foreign currencies | | 2,136 | | |
| Total change in net unrealized appreciation (depreciation) | | | | 43,207,276 |
| Net gain (loss) | | | | 54,614,080 |
| Net increase (decrease) in net assets resulting from operations | | | $ | 53,623,250 |
| Statement of Changes in Net Assets |
| |
| | Year ended July 31, 2023 | | Year ended July 31, 2022 |
| Increase (Decrease) in Net Assets | | | | |
| Operations | | | | |
| Net investment income (loss) | $ | (990,830) | $ | (2,177,425) |
| Net realized gain (loss) | | 11,406,804 | | 22,343,203 |
| Change in net unrealized appreciation (depreciation) | | 43,207,276 | | (130,859,779) |
| Net increase (decrease) in net assets resulting from operations | | 53,623,250 | | (110,694,001) |
| Distributions to shareholders | | (17,163,089) | | (44,840,619) |
| | | | | |
| Share transactions - net increase (decrease) | | 30,658,500 | | (144,288,903) |
| Total increase (decrease) in net assets | | 67,118,661 | | (299,823,523) |
| | | | | |
| Net Assets | | | | |
| Beginning of period | | 440,991,297 | | 740,814,820 |
| End of period | $ | 508,109,958 | $ | 440,991,297 |
| | | | | |
| | | | | |
| Fidelity Advisor® Consumer Discretionary Fund Class A |
| |
| Years ended July 31, | | 2023 | | 2022 | | 2021 | | 2020 | | 2019 |
Selected Per-Share Data | | | | | | | | | | |
| Net asset value, beginning of period | $ | 35.05 | $ | 45.74 | $ | 33.70 | $ | 29.83 | $ | 28.22 |
| Income from Investment Operations | | | | | | | | | | |
Net investment income (loss) A,B | | (.09) | | (.16) | | (.20) | | (.04) | | (.02) |
| Net realized and unrealized gain (loss) | | 4.07 | | (7.62) | | 12.82 | | 4.73 | | 1.90 |
| Total from investment operations | | 3.98 | | (7.78) | | 12.62 | | 4.69 | | 1.88 |
| Distributions from net realized gain | | (1.35) | | (2.91) | | (.58) | | (.82) | | (.27) |
| Total distributions | | (1.35) | | (2.91) | | (.58) | | (.82) | | (.27) |
| Net asset value, end of period | $ | 37.68 | $ | 35.05 | $ | 45.74 | $ | 33.70 | $ | 29.83 |
Total Return C,D | | 12.14% | | (18.26)% | | 37.68% | | 16.03% | | 6.81% |
Ratios to Average Net Assets B,E,F | | | | | | | | | | |
| Expenses before reductions | | 1.04% | | 1.01% | | 1.03% | | 1.07% | | 1.08% |
| Expenses net of fee waivers, if any | | 1.04% | | 1.01% | | 1.03% | | 1.07% | | 1.08% |
| Expenses net of all reductions | | 1.04% | | 1.01% | | 1.03% | | 1.06% | | 1.07% |
| Net investment income (loss) | | (.27)% | | (.38)% | | (.48)% | | (.14)% | | (.09)% |
| Supplemental Data | | | | | | | | | | |
| Net assets, end of period (000 omitted) | $ | 203,468 | $ | 188,092 | $ | 259,488 | $ | 159,603 | $ | 159,298 |
Portfolio turnover rate G | | 43% | | 34% | | 35% | | 41% H | | 60% |
ACalculated based on average shares outstanding during the period.
BNet investment income (loss) is affected by the timing of the declaration of dividends by any underlying mutual funds or exchange-traded funds (ETFs). Net investment income (loss) of any mutual funds or ETFs is not included in the Fund's net investment income (loss) ratio.
CTotal returns would have been lower if certain expenses had not been reduced during the applicable periods shown.
DTotal returns do not include the effect of the sales charges.
EFees and expenses of any underlying mutual funds or exchange-traded funds (ETFs) are not included in the Fund's expense ratio. The Fund indirectly bears its proportionate share of these expenses. For additional expense information related to investments in Fidelity Central Funds, please refer to the "Investments in Fidelity Central Funds" note found in the Notes to Financial Statements section of the most recent Annual or Semi-Annual report.
FExpense ratios reflect operating expenses of the class. Expenses before reductions do not reflect amounts reimbursed, waived, or reduced through arrangements with the investment adviser, brokerage services, or other offset arrangements, if applicable, and do not represent the amount paid by the class during periods when reimbursements, waivers or reductions occur.
GAmount does not include the portfolio activity of any underlying mutual funds or exchange-traded funds (ETFs).
HPortfolio turnover rate excludes securities received or delivered in-kind.
| Fidelity Advisor® Consumer Discretionary Fund Class M |
| |
| Years ended July 31, | | 2023 | | 2022 | | 2021 | | 2020 | | 2019 |
Selected Per-Share Data | | | | | | | | | | |
| Net asset value, beginning of period | $ | 32.20 | $ | 42.23 | $ | 31.23 | $ | 27.78 | $ | 26.36 |
| Income from Investment Operations | | | | | | | | | | |
Net investment income (loss) A,B | | (.16) | | (.24) | | (.29) | | (.11) | | (.09) |
| Net realized and unrealized gain (loss) | | 3.71 | | (7.02) | | 11.87 | | 4.38 | | 1.78 |
| Total from investment operations | | 3.55 | | (7.26) | | 11.58 | | 4.27 | | 1.69 |
| Distributions from net realized gain | | (1.35) | | (2.77) | | (.58) | | (.82) | | (.27) |
| Total distributions | | (1.35) | | (2.77) | | (.58) | | (.82) | | (.27) |
| Net asset value, end of period | $ | 34.40 | $ | 32.20 | $ | 42.23 | $ | 31.23 | $ | 27.78 |
Total Return C,D | | 11.87% | | (18.49)% | | 37.32% | | 15.70% | | 6.56% |
Ratios to Average Net Assets B,E,F | | | | | | | | | | |
| Expenses before reductions | | 1.31% | | 1.28% | | 1.30% | | 1.34% | | 1.34% |
| Expenses net of fee waivers, if any | | 1.30% | | 1.27% | | 1.30% | | 1.34% | | 1.34% |
| Expenses net of all reductions | | 1.30% | | 1.27% | | 1.29% | | 1.33% | | 1.34% |
| Net investment income (loss) | | (.53)% | | (.64)% | | (.75)% | | (.41)% | | (.35)% |
| Supplemental Data | | | | | | | | | | |
| Net assets, end of period (000 omitted) | $ | 35,811 | $ | 35,219 | $ | 48,288 | $ | 33,896 | $ | 32,792 |
Portfolio turnover rate G | | 43% | | 34% | | 35% | | 41% H | | 60% |
ACalculated based on average shares outstanding during the period.
BNet investment income (loss) is affected by the timing of the declaration of dividends by any underlying mutual funds or exchange-traded funds (ETFs). Net investment income (loss) of any mutual funds or ETFs is not included in the Fund's net investment income (loss) ratio.
CTotal returns would have been lower if certain expenses had not been reduced during the applicable periods shown.
DTotal returns do not include the effect of the sales charges.
EFees and expenses of any underlying mutual funds or exchange-traded funds (ETFs) are not included in the Fund's expense ratio. The Fund indirectly bears its proportionate share of these expenses. For additional expense information related to investments in Fidelity Central Funds, please refer to the "Investments in Fidelity Central Funds" note found in the Notes to Financial Statements section of the most recent Annual or Semi-Annual report.
FExpense ratios reflect operating expenses of the class. Expenses before reductions do not reflect amounts reimbursed, waived, or reduced through arrangements with the investment adviser, brokerage services, or other offset arrangements, if applicable, and do not represent the amount paid by the class during periods when reimbursements, waivers or reductions occur.
GAmount does not include the portfolio activity of any underlying mutual funds or exchange-traded funds (ETFs).
HPortfolio turnover rate excludes securities received or delivered in-kind.
| Fidelity Advisor® Consumer Discretionary Fund Class C |
| |
| Years ended July 31, | | 2023 | | 2022 | | 2021 | | 2020 | | 2019 |
Selected Per-Share Data | | | | | | | | | | |
| Net asset value, beginning of period | $ | 26.92 | $ | 35.82 | $ | 26.69 | $ | 23.97 | $ | 22.90 |
| Income from Investment Operations | | | | | | | | | | |
Net investment income (loss) A,B | | (.25) | | (.36) | | (.40) | | (.21) | | (.19) |
| Net realized and unrealized gain (loss) | | 3.03 | | (5.87) | | 10.11 | | 3.75 | | 1.53 |
| Total from investment operations | | 2.78 | | (6.23) | | 9.71 | | 3.54 | | 1.34 |
| Distributions from net realized gain | | (1.35) | | (2.67) | | (.58) | | (.82) | | (.27) |
| Total distributions | | (1.35) | | (2.67) | | (.58) | | (.82) | | (.27) |
| Net asset value, end of period | $ | 28.35 | $ | 26.92 | $ | 35.82 | $ | 26.69 | $ | 23.97 |
Total Return C,D | | 11.32% | | (18.88)% | | 36.66% | | 15.14% | | 6.02% |
Ratios to Average Net Assets B,E,F | | | | | | | | | | |
| Expenses before reductions | | 1.80% | | 1.77% | | 1.79% | | 1.82% | | 1.83% |
| Expenses net of fee waivers, if any | | 1.79% | | 1.76% | | 1.79% | | 1.82% | | 1.83% |
| Expenses net of all reductions | | 1.79% | | 1.76% | | 1.79% | | 1.82% | | 1.82% |
| Net investment income (loss) | | (1.02)% | | (1.13)% | | (1.24)% | | (.90)% | | (.83)% |
| Supplemental Data | | | | | | | | | | |
| Net assets, end of period (000 omitted) | $ | 43,294 | $ | 54,035 | $ | 85,549 | $ | 65,223 | $ | 70,890 |
Portfolio turnover rate G | | 43% | | 34% | | 35% | | 41% H | | 60% |
ACalculated based on average shares outstanding during the period.
BNet investment income (loss) is affected by the timing of the declaration of dividends by any underlying mutual funds or exchange-traded funds (ETFs). Net investment income (loss) of any mutual funds or ETFs is not included in the Fund's net investment income (loss) ratio.
CTotal returns would have been lower if certain expenses had not been reduced during the applicable periods shown.
DTotal returns do not include the effect of the contingent deferred sales charge.
EFees and expenses of any underlying mutual funds or exchange-traded funds (ETFs) are not included in the Fund's expense ratio. The Fund indirectly bears its proportionate share of these expenses. For additional expense information related to investments in Fidelity Central Funds, please refer to the "Investments in Fidelity Central Funds" note found in the Notes to Financial Statements section of the most recent Annual or Semi-Annual report.
FExpense ratios reflect operating expenses of the class. Expenses before reductions do not reflect amounts reimbursed, waived, or reduced through arrangements with the investment adviser, brokerage services, or other offset arrangements, if applicable, and do not represent the amount paid by the class during periods when reimbursements, waivers or reductions occur.
GAmount does not include the portfolio activity of any underlying mutual funds or exchange-traded funds (ETFs).
HPortfolio turnover rate excludes securities received or delivered in-kind.
| Fidelity Advisor® Consumer Discretionary Fund Class I |
| |
| Years ended July 31, | | 2023 | | 2022 | | 2021 | | 2020 | | 2019 |
Selected Per-Share Data | | | | | | | | | | |
| Net asset value, beginning of period | $ | 38.45 | $ | 49.91 | $ | 36.63 | $ | 32.27 | $ | 30.42 |
| Income from Investment Operations | | | | | | | | | | |
Net investment income (loss) A,B | | - C | | (.05) | | (.10) | | .04 | | .06 |
| Net realized and unrealized gain (loss) | | 4.51 | | (8.36) | | 13.96 | | 5.14 | | 2.06 |
| Total from investment operations | | 4.51 | | (8.41) | | 13.86 | | 5.18 | | 2.12 |
| Distributions from net realized gain | | (1.35) | | (3.05) | | (.58) | | (.82) | | (.27) |
| Total distributions | | (1.35) | | (3.05) | | (.58) | | (.82) | | (.27) |
| Net asset value, end of period | $ | 41.61 | $ | 38.45 | $ | 49.91 | $ | 36.63 | $ | 32.27 |
Total Return D | | 12.45% | | (18.04)% | | 38.05% | | 16.34% | | 7.10% |
Ratios to Average Net Assets B,E,F | | | | | | | | | | |
| Expenses before reductions | | .77% | | .75% | | .77% | | .79% | | .80% |
| Expenses net of fee waivers, if any | | .76% | | .74% | | .76% | | .79% | | .80% |
| Expenses net of all reductions | | .76% | | .74% | | .76% | | .79% | | .80% |
| Net investment income (loss) | | .01% | | (.11)% | | (.22)% | | .13% | | .19% |
| Supplemental Data | | | | | | | | | | |
| Net assets, end of period (000 omitted) | $ | 139,088 | $ | 118,859 | $ | 259,846 | $ | 134,907 | $ | 159,613 |
Portfolio turnover rate G | | 43% | | 34% | | 35% | | 41% H | | 60% |
ACalculated based on average shares outstanding during the period.
BNet investment income (loss) is affected by the timing of the declaration of dividends by any underlying mutual funds or exchange-traded funds (ETFs). Net investment income (loss) of any mutual funds or ETFs is not included in the Fund's net investment income (loss) ratio.
CAmount represents less than $.005 per share.
DTotal returns would have been lower if certain expenses had not been reduced during the applicable periods shown.
EFees and expenses of any underlying mutual funds or exchange-traded funds (ETFs) are not included in the Fund's expense ratio. The Fund indirectly bears its proportionate share of these expenses. For additional expense information related to investments in Fidelity Central Funds, please refer to the "Investments in Fidelity Central Funds" note found in the Notes to Financial Statements section of the most recent Annual or Semi-Annual report.
FExpense ratios reflect operating expenses of the class. Expenses before reductions do not reflect amounts reimbursed, waived, or reduced through arrangements with the investment adviser, brokerage services, or other offset arrangements, if applicable, and do not represent the amount paid by the class during periods when reimbursements, waivers or reductions occur.
GAmount does not include the portfolio activity of any underlying mutual funds or exchange-traded funds (ETFs).
HPortfolio turnover rate excludes securities received or delivered in-kind.
| Fidelity Advisor® Consumer Discretionary Fund Class Z |
| |
| Years ended July 31, | | 2023 | | 2022 | | 2021 | | 2020 | | 2019 A |
Selected Per-Share Data | | | | | | | | | | |
| Net asset value, beginning of period | $ | 38.59 | $ | 50.10 | $ | 36.72 | $ | 32.31 | $ | 31.56 |
| Income from Investment Operations | | | | | | | | | | |
Net investment income (loss) B,C | | .05 | | - D | | (.04) | | .09 | | .10 |
| Net realized and unrealized gain (loss) | | 4.53 | | (8.38) | | 14.00 | | 5.14 | | .92 |
| Total from investment operations | | 4.58 | | (8.38) | | 13.96 | | 5.23 | | 1.02 |
| Distributions from net realized gain | | (1.35) | | (3.13) | | (.58) | | (.82) | | (.27) |
| Total distributions | | (1.35) | | (3.13) | | (.58) | | (.82) | | (.27) |
| Net asset value, end of period | $ | 41.82 | $ | 38.59 | $ | 50.10 | $ | 36.72 | $ | 32.31 |
Total Return E,F | | 12.59% | | (17.93)% | | 38.23% | | 16.48% | | 3.36% |
Ratios to Average Net Assets C,G,H | | | | | | | | | | |
| Expenses before reductions | | .64% | | .62% | | .64% | | .66% | | .67% I |
| Expenses net of fee waivers, if any | | .64% | | .62% | | .64% | | .66% | | .66% I |
| Expenses net of all reductions | | .64% | | .62% | | .64% | | .66% | | .66% I |
| Net investment income (loss) | | .13% | | .01% | | (.09)% | | .26% | | .39% I |
| Supplemental Data | | | | | | | | | | |
| Net assets, end of period (000 omitted) | $ | 86,450 | $ | 44,785 | $ | 87,644 | $ | 48,668 | $ | 6,786 |
Portfolio turnover rate J | | 43% | | 34% | | 35% | | 41% K | | 60% |
AFor the period October 2, 2018 (commencement of sale of shares) through July 31, 2019.
BCalculated based on average shares outstanding during the period.
CNet investment income (loss) is affected by the timing of the declaration of dividends by any underlying mutual funds or exchange-traded funds (ETFs). Net investment income (loss) of any mutual funds or ETFs is not included in the Fund's net investment income (loss) ratio.
DAmount represents less than $.005 per share.
ETotal returns for periods of less than one year are not annualized.
FTotal returns would have been lower if certain expenses had not been reduced during the applicable periods shown.
GFees and expenses of any underlying mutual funds or exchange-traded funds (ETFs) are not included in the Fund's expense ratio. The Fund indirectly bears its proportionate share of these expenses. For additional expense information related to investments in Fidelity Central Funds, please refer to the "Investments in Fidelity Central Funds" note found in the Notes to Financial Statements section of the most recent Annual or Semi-Annual report.
HExpense ratios reflect operating expenses of the class. Expenses before reductions do not reflect amounts reimbursed, waived, or reduced through arrangements with the investment adviser, brokerage services, or other offset arrangements, if applicable, and do not represent the amount paid by the class during periods when reimbursements, waivers or reductions occur.
IAnnualized.
JAmount does not include the portfolio activity of any underlying mutual funds or exchange-traded funds (ETFs).
KPortfolio turnover rate excludes securities received or delivered in-kind.
Average annual total return reflects the change in the value of an investment, assuming reinvestment of distributions from dividend income and capital gains (the profits earned upon the sale of securities that have grown in value, if any) and assuming a constant rate of performance each year. The hypothetical investment and the average annual total returns do not reflect the deduction of taxes that a shareholder would pay on fund distributions or the redemption of fund shares. During periods of reimbursement by Fidelity, a fund's total return will be greater than it would be had the reimbursement not occurred. How a fund did yesterday is no guarantee of how it will do tomorrow.
| Average Annual Total Returns |
| | | | |
Periods ended July 31, 2023 | Past 1 year | Past 5 years | Past 10 years |
Class A (incl. 5.75% sales charge) | 9.28% | 4.45% | 2.66% |
Class M (incl. 3.50% sales charge) | 11.59% | 4.67% | 2.64% |
Class C (incl. contingent deferred sales charge) | 14.09% | 4.93% | 2.67% |
| Class I | 16.25% | 6.02% | 3.57% |
| Class Z | 16.40% | 6.17% | 3.64% |
Class C shares' contingent deferred sales charges included in the past one year, past five years and past ten years total return figures are 1%, 0% and 0%, respectively.
The initial offering of Class Z shares took place on October 2, 2018. Returns prior to October 2, 2018, are those of Class I.
| $10,000 Over 10 Years |
| |
Let's say hypothetically that $10,000 was invested in Fidelity Advisor® Energy Fund - Class A, a class of the fund, on July 31, 2013, and the current 5.75% sales charge was paid. The chart shows how the value of your investment would have changed, and also shows how the S&P 500® Index performed over the same period. |
|
|
Fidelity Advisor® Energy Fund
Market Recap:
U.S. equities gained 13.02% for the 12 months ending July 31, 2023, according to the S&P 500® index, as continued global economic expansion, falling commodity prices and a slowing in the pace of inflation provided a favorable backdrop for higher-risk assets. Large-cap stocks spearheaded the rally, which was driven by the shares of a narrow set of mega-cap companies in the information technology and communication services sectors, largely due to exuberance related to generative artificial intelligence. Aggressive monetary tightening by the U.S. Federal Reserve continued amid consistent pressure on core inflation, a measure that excludes food and energy. Since March 2022, the Fed has hiked its benchmark interest rate 11 times. The latest bump came in late July, a fourth consecutive raise of a stepped down 25 basis points. The S&P 500® gained 3.21% in July, as a "soft landing" of the U.S. economy became the consensus view amid better-than-expected earnings, slowing inflation and easing financial conditions, bringing the index's year-to-date gain to 20.65%. July saw a continuance of the recent shift to wider market breadth and lower dispersion. For the full 12 months, value (+17%) handily topped growth (+8%) within the index. By sector, tech (+28%), communication services (+21%) and industrials (+17%) led, whereas real estate (-10%) lagged most, due to high borrowing costs, low home inventory and a deteriorating commercial property market.
Comments from Portfolio Manager Maurice FitzMaurice:
For the fiscal year ending July 31, 2023, the fund's share classes (excluding sales charges, if applicable) gained about 15% to 16%, versus 16.10% for the MSCI U.S. IMI Energy 25/50 Index and 13.02% for the broad-based S&P 500® index. Relative to the index, sector and industry positioning was the primary contributor to the fund's performance, especially an overweight in the oil & gas equipment & services group. Stock picks and an underweight in oil & gas storage & transportation boosted the fund's relative performance. Also contributing to our result was an overweight in oil & gas drilling. The fund's top individual relative contributor was an underweight in Chevron (+4%), but the company was one of our largest holdings. A second notable relative contributor was an overweight in TechnipFMC (+126%), and we trimmed our position. An overweight in Halliburton (+36%) also contributed. Halliburton was one of the fund's biggest holdings. In contrast, stock selection in the oil & gas exploration & production and the independent power producers & energy traders groups hampered the fund's result. The largest individual relative detractor was an overweight in Antero Resources (-33%), and we reduced our stake. A non-index position in Cenovus Energy gained 1% and was the fund's second-largest relative detractor, and we reduced our stake. An underweight in Baker Hughes (+43%) also detracted. Baker Hughes was not held at period end. Notable changes in positioning include increased exposure to the oil & gas equipment & services and oil & gas refining & marketing industries.
The views expressed above reflect those of the portfolio manager(s) only through the end of the period as stated on the cover of this report and do not necessarily represent the views of Fidelity or any other person in the Fidelity organization. Any such views are subject to change at any time based upon market or other conditions and Fidelity disclaims any responsibility to update such views. These views may not be relied on as investment advice and, because investment decisions for a Fidelity fund are based on numerous factors, may not be relied on as an indication of trading intent on behalf of any Fidelity fund.
Fidelity Advisor® Energy Fund
Top Holdings (% of Fund's net assets) |
| |
| Exxon Mobil Corp. | 21.2 | |
| Chevron Corp. | 6.4 | |
| ConocoPhillips Co. | 5.0 | |
| Schlumberger Ltd. | 4.9 | |
| Halliburton Co. | 4.6 | |
| Marathon Petroleum Corp. | 4.5 | |
| Valero Energy Corp. | 4.1 | |
| Hess Corp. | 4.0 | |
| Occidental Petroleum Corp. | 3.7 | |
| Canadian Natural Resources Ltd. | 3.7 | |
| | 62.1 | |
| |
| Industries (% of Fund's net assets) |
| |
| Oil, Gas & Consumable Fuels | 81.8 | |
| Energy Equipment & Services | 17.5 | |
| Independent Power and Renewable Electricity Producers | 0.5 | |
| |
Geographic Diversification (% of Fund's net assets) |
|
* Includes Short-Term investments and Net Other Assets (Liabilities). Percentages are adjusted for the effect of derivatives, if applicable. |
| |
Fidelity Advisor® Energy Fund
Showing Percentage of Net Assets
| Common Stocks - 99.8% |
| | | Shares | Value ($) |
| Energy Equipment & Services - 17.5% | | | |
| Oil & Gas Drilling - 1.8% | | | |
| Nabors Industries Ltd. warrants 6/11/26 (a) | | 6,604 | 122,174 |
| Noble Corp. PLC | | 106,400 | 5,561,528 |
| Odfjell Drilling Ltd. (a) | | 691,156 | 1,957,186 |
| Shelf Drilling Ltd. (a)(b) | | 579,628 | 1,421,183 |
| Valaris Ltd. (a) | | 208,100 | 15,982,080 |
| | | | 25,044,151 |
| Oil & Gas Equipment & Services - 15.7% | | | |
| Halliburton Co. | | 1,581,900 | 61,820,652 |
| Nextier Oilfield Solutions, Inc. (a) | | 2,063,200 | 24,593,344 |
| NOV, Inc. | | 431,000 | 8,654,480 |
| Oceaneering International, Inc. (a) | | 474,600 | 10,654,770 |
| ProFrac Holding Corp. (a)(c) | | 349,100 | 4,492,917 |
| ProPetro Holding Corp. (a) | | 479,700 | 5,008,068 |
| Schlumberger Ltd. | | 1,143,718 | 66,724,508 |
| TechnipFMC PLC | | 1,716,400 | 31,478,776 |
| | | | 213,427,515 |
TOTAL ENERGY EQUIPMENT & SERVICES | | | 238,471,666 |
| Independent Power and Renewable Electricity Producers - 0.5% | | | |
| Independent Power Producers & Energy Traders - 0.5% | | | |
| Vistra Corp. | | 222,200 | 6,234,932 |
| Oil, Gas & Consumable Fuels - 81.8% | | | |
| Coal & Consumable Fuels - 0.2% | | | |
| Arch Resources, Inc. | | 18,300 | 2,350,452 |
| Integrated Oil & Gas - 36.7% | | | |
| Cenovus Energy, Inc. (Canada) | | 2,171,600 | 41,302,641 |
| Chevron Corp. | | 532,470 | 87,144,040 |
| Exxon Mobil Corp. | | 2,689,761 | 288,449,969 |
| Imperial Oil Ltd. | | 236,800 | 12,757,193 |
| Occidental Petroleum Corp. (c) | | 805,700 | 50,863,841 |
| Occidental Petroleum Corp. warrants 8/3/27 (a) | | 36,987 | 1,523,125 |
| Suncor Energy, Inc. | | 552,500 | 17,287,491 |
| | | | 499,328,300 |
| Oil & Gas Exploration & Production - 29.5% | | | |
| Antero Resources Corp. (a) | | 614,700 | 16,443,225 |
| APA Corp. (c) | | 480,900 | 19,471,641 |
| Callon Petroleum Co. (a) | | 33,340 | 1,252,250 |
| Canadian Natural Resources Ltd. | | 819,300 | 49,823,431 |
| Chord Energy Corp. | | 38,930 | 6,105,781 |
| Civitas Resources, Inc. | | 103,744 | 7,766,276 |
| ConocoPhillips Co. | | 580,950 | 68,389,434 |
| Coterra Energy, Inc. | | 248,621 | 6,847,022 |
| Devon Energy Corp. | | 359,500 | 19,413,000 |
| Diamondback Energy, Inc. | | 87,800 | 12,934,696 |
| EOG Resources, Inc. | | 143,486 | 19,016,200 |
| EQT Corp. | | 138,100 | 5,825,058 |
| Hess Corp. | | 354,100 | 53,727,593 |
| Magnolia Oil & Gas Corp. Class A | | 202,000 | 4,474,300 |
| National Energy Services Reunited Corp. (a) | | 922,000 | 2,996,500 |
| Northern Oil & Gas, Inc. | | 67,730 | 2,666,530 |
| Ovintiv, Inc. (c) | | 399,000 | 18,389,910 |
| PDC Energy, Inc. | | 505,688 | 38,376,662 |
| Pioneer Natural Resources Co. | | 99,225 | 22,392,106 |
| Range Resources Corp. | | 663,400 | 20,850,662 |
| SM Energy Co. | | 112,100 | 4,068,109 |
| | | | 401,230,386 |
| Oil & Gas Refining & Marketing - 10.4% | | | |
| Marathon Petroleum Corp. | | 457,678 | 60,880,328 |
| Phillips 66 Co. | | 224,218 | 25,011,518 |
| Valero Energy Corp. | | 430,700 | 55,521,537 |
| | | | 141,413,383 |
| Oil & Gas Storage & Transportation - 5.0% | | | |
| Cheniere Energy, Inc. | | 286,600 | 46,389,076 |
| Energy Transfer LP | | 1,347,900 | 17,913,591 |
| Golar LNG Ltd. | | 188,900 | 4,556,268 |
| | | | 68,858,935 |
TOTAL OIL, GAS & CONSUMABLE FUELS | | | 1,113,181,456 |
| TOTAL COMMON STOCKS (Cost $765,319,535) | | | 1,357,888,054 |
| | | | |
| Money Market Funds - 3.2% |
| | | Shares | Value ($) |
| Fidelity Cash Central Fund 5.32% (d) | | 4,272,251 | 4,273,105 |
| Fidelity Securities Lending Cash Central Fund 5.32% (d)(e) | | 39,718,878 | 39,722,849 |
| TOTAL MONEY MARKET FUNDS (Cost $43,995,954) | | | 43,995,954 |
| | | | |
| TOTAL INVESTMENT IN SECURITIES - 103.0% (Cost $809,315,489) | 1,401,884,008 |
NET OTHER ASSETS (LIABILITIES) - (3.0)% | (40,596,040) |
| NET ASSETS - 100.0% | 1,361,287,968 |
| | |
Legend
| (b) | Security exempt from registration under Rule 144A of the Securities Act of 1933. These securities may be resold in transactions exempt from registration, normally to qualified institutional buyers. At the end of the period, the value of these securities amounted to $1,421,183 or 0.1% of net assets. |
| (c) | Security or a portion of the security is on loan at period end. |
| (d) | Affiliated fund that is generally available only to investment companies and other accounts managed by Fidelity Investments. The rate quoted is the annualized seven-day yield of the fund at period end. A complete unaudited listing of the fund's holdings as of its most recent quarter end is available upon request. In addition, each Fidelity Central Fund's financial statements, which are not covered by the Fund's Report of Independent Registered Public Accounting Firm, are available on the SEC's website or upon request. |
| (e) | Investment made with cash collateral received from securities on loan. |
Affiliated Central Funds
Fiscal year to date information regarding the Fund's investments in Fidelity Central Funds, including the ownership percentage, is presented below.
| Affiliate | Value, beginning of period ($) | Purchases ($) | Sales Proceeds ($) | Dividend Income ($) | Realized Gain (loss) ($) | Change in Unrealized appreciation (depreciation) ($) | Value, end of period ($) | % ownership, end of period |
| Fidelity Cash Central Fund 5.32% | 5,552,227 | 173,524,476 | 174,803,598 | 85,901 | - | - | 4,273,105 | 0.0% |
| Fidelity Securities Lending Cash Central Fund 5.32% | 58,002,499 | 731,174,234 | 749,453,884 | 89,636 | - | - | 39,722,849 | 0.1% |
| Total | 63,554,726 | 904,698,710 | 924,257,482 | 175,537 | - | - | 43,995,954 | |
| | | | | | | | | |
Amounts in the dividend income column in the above table include any capital gain distributions from underlying funds, which are presented in the corresponding line item in the Statement of Operations, if applicable.
Amounts in the dividend income column for Fidelity Securities Lending Cash Central Fund represents the income earned on investing cash collateral, less rebates paid to borrowers and any lending agent fees associated with the loan, plus any premium payments received for lending certain types of securities.
Amounts included in the purchases and sales proceeds columns may include in-kind transactions, if applicable.
Investment Valuation
The following is a summary of the inputs used, as of July 31, 2023, involving the Fund's assets and liabilities carried at fair value. The inputs or methodology used for valuing securities may not be an indication of the risk associated with investing in those securities. For more information on valuation inputs, and their aggregation into the levels used below, please refer to the Investment Valuation section in the accompanying Notes to Financial Statements.
| Valuation Inputs at Reporting Date: |
| Description | Total ($) | Level 1 ($) | Level 2 ($) | Level 3 ($) |
Investments in Securities: | | | | |
|
| Common Stocks | 1,357,888,054 | 1,357,888,054 | - | - |
|
| Money Market Funds | 43,995,954 | 43,995,954 | - | - |
| Total Investments in Securities: | 1,401,884,008 | 1,401,884,008 | - | - |
Fidelity Advisor® Energy Fund
| Statement of Assets and Liabilities |
| | | | July 31, 2023 |
| | | | | |
| Assets | | | | |
| Investment in securities, at value (including securities loaned of $39,416,803) - See accompanying schedule: | | | | |
Unaffiliated issuers (cost $765,319,535) | $ | 1,357,888,054 | | |
Fidelity Central Funds (cost $43,995,954) | | 43,995,954 | | |
| | | | | |
| | | | | |
| Total Investment in Securities (cost $809,315,489) | | | $ | 1,401,884,008 |
| Receivable for investments sold | | | | 673,528 |
| Receivable for fund shares sold | | | | 2,268,070 |
| Dividends receivable | | | | 154,697 |
| Distributions receivable from Fidelity Central Funds | | | | 7,338 |
| Prepaid expenses | | | | 4,062 |
| Other receivables | | | | 136,188 |
Total assets | | | | 1,405,127,891 |
| Liabilities | | | | |
| Payable to custodian bank | $ | 6 | | |
| Payable for fund shares redeemed | | 3,017,267 | | |
| Accrued management fee | | 569,233 | | |
| Distribution and service plan fees payable | | 194,918 | | |
| Other affiliated payables | | 200,454 | | |
| Other payables and accrued expenses | | 135,520 | | |
| Collateral on securities loaned | | 39,722,525 | | |
| Total Liabilities | | | | 43,839,923 |
| Net Assets | | | $ | 1,361,287,968 |
| Net Assets consist of: | | | | |
| Paid in capital | | | $ | 1,041,322,684 |
| Total accumulated earnings (loss) | | | | 319,965,284 |
| Net Assets | | | $ | 1,361,287,968 |
| | | | | |
| Net Asset Value and Maximum Offering Price | | | | |
| Class A : | | | | |
Net Asset Value and redemption price per share ($379,350,819 ÷ 8,465,974 shares)(a) | | | $ | 44.81 |
| Maximum offering price per share (100/94.25 of $44.81) | | | $ | 47.54 |
| Class M : | | | | |
Net Asset Value and redemption price per share ($109,405,556 ÷ 2,376,949 shares)(a) | | | $ | 46.03 |
| Maximum offering price per share (100/96.50 of $46.03) | | | $ | 47.70 |
| Class C : | | | | |
Net Asset Value and offering price per share ($94,348,384 ÷ 2,310,624 shares)(a) | | | $ | 40.83 |
| Class I : | | | | |
Net Asset Value, offering price and redemption price per share ($511,736,671 ÷ 10,764,547 shares) | | | $ | 47.54 |
| Class Z : | | | | |
Net Asset Value, offering price and redemption price per share ($266,446,538 ÷ 5,613,706 shares) | | | $ | 47.46 |
(a)Redemption price per share is equal to net asset value less any applicable contingent deferred sales charge. |
| Statement of Operations |
| | | | Year ended July 31, 2023 |
| Investment Income | | | | |
| Dividends | | | $ | 48,245,105 |
| Income from Fidelity Central Funds (including $89,636 from security lending) | | | | 175,537 |
| Total Income | | | | 48,420,642 |
| Expenses | | | | |
| Management fee | $ | 7,724,142 | | |
| Transfer agent fees | | 2,222,895 | | |
| Distribution and service plan fees | | 2,585,778 | | |
| Accounting fees | | 409,429 | | |
| Custodian fees and expenses | | 38,277 | | |
| Independent trustees' fees and expenses | | 7,302 | | |
| Registration fees | | 141,629 | | |
| Audit | | 55,212 | | |
| Legal | | 2,672 | | |
| Interest | | 33,747 | | |
| Miscellaneous | | 8,781 | | |
| Total expenses before reductions | | 13,229,864 | | |
| Expense reductions | | (74,247) | | |
| Total expenses after reductions | | | | 13,155,617 |
| Net Investment income (loss) | | | | 35,265,025 |
| Realized and Unrealized Gain (Loss) | | | | |
| Net realized gain (loss) on: | | | | |
| Investment Securities: | | | | |
| Unaffiliated issuers | | 43,364,091 | | |
| Foreign currency transactions | | (14,179) | | |
| Total net realized gain (loss) | | | | 43,349,912 |
| Change in net unrealized appreciation (depreciation) on: | | | | |
| Investment Securities: | | | | |
| Unaffiliated issuers | | 113,844,045 | | |
| Assets and liabilities in foreign currencies | | (1,505) | | |
| Total change in net unrealized appreciation (depreciation) | | | | 113,842,540 |
| Net gain (loss) | | | | 157,192,452 |
| Net increase (decrease) in net assets resulting from operations | | | $ | 192,457,477 |
| Statement of Changes in Net Assets |
| |
| | Year ended July 31, 2023 | | Year ended July 31, 2022 |
| Increase (Decrease) in Net Assets | | | | |
| Operations | | | | |
| Net investment income (loss) | $ | 35,265,025 | $ | 24,482,840 |
| Net realized gain (loss) | | 43,349,912 | | 12,411,332 |
| Change in net unrealized appreciation (depreciation) | | 113,842,540 | | 401,011,911 |
| Net increase (decrease) in net assets resulting from operations | | 192,457,477 | | 437,906,083 |
| Distributions to shareholders | | (33,434,847) | | (14,774,337) |
| | | | | |
| Share transactions - net increase (decrease) | | (175,324,623) | | 401,499,038 |
| Total increase (decrease) in net assets | | (16,301,993) | | 824,630,784 |
| | | | | |
| Net Assets | | | | |
| Beginning of period | | 1,377,589,961 | | 552,959,177 |
| End of period | $ | 1,361,287,968 | $ | 1,377,589,961 |
| | | | | |
| | | | | |
| Fidelity Advisor® Energy Fund Class A |
| |
| Years ended July 31, | | 2023 | | 2022 | | 2021 | | 2020 | | 2019 |
Selected Per-Share Data | | | | | | | | | | |
| Net asset value, beginning of period | $ | 39.49 | $ | 23.59 | $ | 16.59 | $ | 27.88 | $ | 37.52 |
| Income from Investment Operations | | | | | | | | | | |
Net investment income (loss) A,B | | .96 | | .80 | | .65 C | | .57 | | .35 |
| Net realized and unrealized gain (loss) | | 5.26 | | 15.68 | | 6.94 | | (11.42) | | (9.76) |
| Total from investment operations | | 6.22 | | 16.48 | | 7.59 | | (10.85) | | (9.41) |
| Distributions from net investment income | | (.90) | | (.58) | | (.59) | | (.44) | | (.18) D |
| Distributions from net realized gain | | - | | - | | - | | - | | (.05) D |
| Total distributions | | (.90) | | (.58) | | (.59) | | (.44) | | (.23) |
| Net asset value, end of period | $ | 44.81 | $ | 39.49 | $ | 23.59 | $ | 16.59 | $ | 27.88 |
Total Return E,F | | 15.94% | | 71.12% | | 46.78% | | (39.54)% | | (25.07)% |
Ratios to Average Net Assets B,G,H | | | | | | | | | | |
| Expenses before reductions | | 1.01% | | 1.05% | | 1.11% | | 1.14% | | 1.10% |
| Expenses net of fee waivers, if any | | 1.01% | | 1.04% | | 1.11% | | 1.14% | | 1.10% |
| Expenses net of all reductions | | 1.01% | | 1.04% | | 1.11% | | 1.12% | | 1.09% |
| Net investment income (loss) | | 2.29% | | 2.43% | | 3.15% C | | 2.62% | | 1.14% |
| Supplemental Data | | | | | | | | | | |
| Net assets, end of period (000 omitted) | $ | 379,351 | $ | 361,023 | $ | 175,221 | $ | 114,321 | $ | 190,992 |
Portfolio turnover rate I | | 21% | | 37% | | 45% | | 84% J | | 47% |
ACalculated based on average shares outstanding during the period.
BNet investment income (loss) is affected by the timing of the declaration of dividends by any underlying mutual funds or exchange-traded funds (ETFs). Net investment income (loss) of any mutual funds or ETFs is not included in the Fund's net investment income (loss) ratio.
CNet investment income per share reflects one or more large, non-recurring dividend(s) which amounted to $.11 per share. Excluding such non-recurring dividend(s), the ratio of net investment income (loss) to average net assets would have been 2.60%.
DThe amount shown reflects reclassifications related to book to tax differences that were made in the year shown.
ETotal returns would have been lower if certain expenses had not been reduced during the applicable periods shown.
FTotal returns do not include the effect of the sales charges.
GFees and expenses of any underlying mutual funds or exchange-traded funds (ETFs) are not included in the Fund's expense ratio. The Fund indirectly bears its proportionate share of these expenses. For additional expense information related to investments in Fidelity Central Funds, please refer to the "Investments in Fidelity Central Funds" note found in the Notes to Financial Statements section of the most recent Annual or Semi-Annual report.
HExpense ratios reflect operating expenses of the class. Expenses before reductions do not reflect amounts reimbursed, waived, or reduced through arrangements with the investment adviser, brokerage services, or other offset arrangements, if applicable, and do not represent the amount paid by the class during periods when reimbursements, waivers or reductions occur.
IAmount does not include the portfolio activity of any underlying mutual funds or exchange-traded funds (ETFs).
JPortfolio turnover rate excludes securities received or delivered in-kind.
| Fidelity Advisor® Energy Fund Class M |
| |
| Years ended July 31, | | 2023 | | 2022 | | 2021 | | 2020 | | 2019 |
Selected Per-Share Data | | | | | | | | | | |
| Net asset value, beginning of period | $ | 40.53 | $ | 24.20 | $ | 17.00 | $ | 28.53 | $ | 38.36 |
| Income from Investment Operations | | | | | | | | | | |
Net investment income (loss) A,B | | .88 | | .73 | | .60 C | | .53 | | .27 |
| Net realized and unrealized gain (loss) | | 5.39 | | 16.11 | | 7.13 | | (11.71) | | (9.97) |
| Total from investment operations | | 6.27 | | 16.84 | | 7.73 | | (11.18) | | (9.70) |
| Distributions from net investment income | | (.77) | | (.51) | | (.53) | | (.35) | | (.08) D |
| Distributions from net realized gain | | - | | - | | - | | - | | (.05) D |
| Total distributions | | (.77) | | (.51) | | (.53) | | (.35) | | (.13) |
| Net asset value, end of period | $ | 46.03 | $ | 40.53 | $ | 24.20 | $ | 17.00 | $ | 28.53 |
Total Return E,F | | 15.64% | | 70.66% | | 46.37% | | (39.66)% | | (25.28)% |
Ratios to Average Net Assets A,G,H | | | | | | | | | | |
| Expenses before reductions | | 1.27% | | 1.31% | | 1.38% | | 1.40% | | 1.37% |
| Expenses net of fee waivers, if any | | 1.27% | | 1.31% | | 1.38% | | 1.40% | | 1.36% |
| Expenses net of all reductions | | 1.27% | | 1.31% | | 1.38% | | 1.38% | | 1.36% |
| Net investment income (loss) | | 2.04% | | 2.16% | | 2.88% C | | 2.36% | | .88% |
| Supplemental Data | | | | | | | | | | |
| Net assets, end of period (000 omitted) | $ | 109,406 | $ | 114,014 | $ | 62,519 | $ | 43,768 | $ | 87,147 |
Portfolio turnover rate I | | 21% | | 37% | | 45% | | 84% J | | 47% |
ANet investment income (loss) is affected by the timing of the declaration of dividends by any underlying mutual funds or exchange-traded funds (ETFs). Net investment income (loss) of any mutual funds or ETFs is not included in the Fund's net investment income (loss) ratio.
BCalculated based on average shares outstanding during the period.
CNet investment income per share reflects one or more large, non-recurring dividend(s) which amounted to $.11 per share. Excluding such non-recurring dividend(s), the ratio of net investment income (loss) to average net assets would have been 2.34%.
DThe amount shown reflects reclassifications related to book to tax differences that were made in the year shown.
ETotal returns would have been lower if certain expenses had not been reduced during the applicable periods shown.
FTotal returns do not include the effect of the sales charges.
GFees and expenses of any underlying mutual funds or exchange-traded funds (ETFs) are not included in the Fund's expense ratio. The Fund indirectly bears its proportionate share of these expenses. For additional expense information related to investments in Fidelity Central Funds, please refer to the "Investments in Fidelity Central Funds" note found in the Notes to Financial Statements section of the most recent Annual or Semi-Annual report.
HExpense ratios reflect operating expenses of the class. Expenses before reductions do not reflect amounts reimbursed, waived, or reduced through arrangements with the investment adviser, brokerage services, or other offset arrangements, if applicable, and do not represent the amount paid by the class during periods when reimbursements, waivers or reductions occur.
IAmount does not include the portfolio activity of any underlying mutual funds or exchange-traded funds (ETFs).
JPortfolio turnover rate excludes securities received or delivered in-kind.
| Fidelity Advisor® Energy Fund Class C |
| |
| Years ended July 31, | | 2023 | | 2022 | | 2021 | | 2020 | | 2019 |
Selected Per-Share Data | | | | | | | | | | |
| Net asset value, beginning of period | $ | 36.08 | $ | 21.60 | $ | 15.23 | $ | 25.58 | $ | 34.39 |
| Income from Investment Operations | | | | | | | | | | |
�� Net investment income (loss) A,B | | .59 | | .51 | | .45 C | | .39 | | .12 |
| Net realized and unrealized gain (loss) | | 4.80 | | 14.38 | | 6.38 | | (10.52) | | (8.93) |
| Total from investment operations | | 5.39 | | 14.89 | | 6.83 | | (10.13) | | (8.81) |
| Distributions from net investment income | | (.64) | | (.41) | | (.46) | | (.22) | | - |
| Total distributions | | (.64) | | (.41) | | (.46) | | (.22) | | - |
| Net asset value, end of period | $ | 40.83 | $ | 36.08 | $ | 21.60 | $ | 15.23 | $ | 25.58 |
Total Return D,E | | 15.09% | | 69.86% | | 45.68% | | (39.95)% | | (25.62)% |
Ratios to Average Net Assets B,F,G | | | | | | | | | | |
| Expenses before reductions | | 1.76% | | 1.79% | | 1.84% | | 1.86% | | 1.82% |
| Expenses net of fee waivers, if any | | 1.75% | | 1.78% | | 1.84% | | 1.86% | | 1.82% |
| Expenses net of all reductions | | 1.75% | | 1.78% | | 1.84% | | 1.84% | | 1.81% |
| Net investment income (loss) | | 1.55% | | 1.69% | | 2.42% C | | 1.90% | | .42% |
| Supplemental Data | | | | | | | | | | |
| Net assets, end of period (000 omitted) | $ | 94,348 | $ | 105,747 | $ | 56,068 | $ | 45,212 | $ | 90,437 |
Portfolio turnover rate H | | 21% | | 37% | | 45% | | 84% I | | 47% |
ACalculated based on average shares outstanding during the period.
BNet investment income (loss) is affected by the timing of the declaration of dividends by any underlying mutual funds or exchange-traded funds (ETFs). Net investment income (loss) of any mutual funds or ETFs is not included in the Fund's net investment income (loss) ratio.
CNet investment income per share reflects one or more large, non-recurring dividend(s) which amounted to $.10 per share. Excluding such non-recurring dividend(s), the ratio of net investment income (loss) to average net assets would have been 1.88%.
DTotal returns would have been lower if certain expenses had not been reduced during the applicable periods shown.
ETotal returns do not include the effect of the contingent deferred sales charge.
FFees and expenses of any underlying mutual funds or exchange-traded funds (ETFs) are not included in the Fund's expense ratio. The Fund indirectly bears its proportionate share of these expenses. For additional expense information related to investments in Fidelity Central Funds, please refer to the "Investments in Fidelity Central Funds" note found in the Notes to Financial Statements section of the most recent Annual or Semi-Annual report.
GExpense ratios reflect operating expenses of the class. Expenses before reductions do not reflect amounts reimbursed, waived, or reduced through arrangements with the investment adviser, brokerage services, or other offset arrangements, if applicable, and do not represent the amount paid by the class during periods when reimbursements, waivers or reductions occur.
HAmount does not include the portfolio activity of any underlying mutual funds or exchange-traded funds (ETFs).
IPortfolio turnover rate excludes securities received or delivered in-kind.
| Fidelity Advisor® Energy Fund Class I |
| |
| Years ended July 31, | | 2023 | | 2022 | | 2021 | | 2020 | | 2019 |
Selected Per-Share Data | | | | | | | | | | |
| Net asset value, beginning of period | $ | 41.83 | $ | 24.95 | $ | 17.51 | $ | 29.39 | $ | 39.57 |
| Income from Investment Operations | | | | | | | | | | |
Net investment income (loss) A,B | | 1.14 | | .97 | | .74 C | | .67 | | .47 |
| Net realized and unrealized gain (loss) | | 5.57 | | 16.57 | | 7.35 | | (12.02) | | (10.31) |
| Total from investment operations | | 6.71 | | 17.54 | | 8.09 | | (11.35) | | (9.84) |
| Distributions from net investment income | | (1.00) | | (.66) | | (.65) | | (.53) | | (.30) D |
| Distributions from net realized gain | | - | | - | | - | | - | | (.05) D |
| Total distributions | | (1.00) | | (.66) | | (.65) | | (.53) | | (.34) E |
| Net asset value, end of period | $ | 47.54 | $ | 41.83 | $ | 24.95 | $ | 17.51 | $ | 29.39 |
Total Return F | | 16.25% | | 71.63% | | 47.26% | | (39.33)% | | (24.85)% |
Ratios to Average Net Assets B,G,H | | | | | | | | | | |
| Expenses before reductions | | .74% | | .76% | | .79% | | .82% | | .80% |
| Expenses net of fee waivers, if any | | .74% | | .76% | | .79% | | .82% | | .80% |
| Expenses net of all reductions | | .74% | | .76% | | .79% | | .80% | | .79% |
| Net investment income (loss) | | 2.57% | | 2.71% | | 3.47% C | | 2.95% | | 1.44% |
| Supplemental Data | | | | | | | | | | |
| Net assets, end of period (000 omitted) | $ | 511,737 | $ | 533,005 | $ | 177,248 | $ | 154,575 | $ | 224,599 |
Portfolio turnover rate I | | 21% | | 37% | | 45% | | 84% J | | 47% |
ACalculated based on average shares outstanding during the period.
BNet investment income (loss) is affected by the timing of the declaration of dividends by any underlying mutual funds or exchange-traded funds (ETFs). Net investment income (loss) of any mutual funds or ETFs is not included in the Fund's net investment income (loss) ratio.
CNet investment income per share reflects one or more large, non-recurring dividend(s) which amounted to $.12 per share. Excluding such non-recurring dividend(s), the ratio of net investment income (loss) to average net assets would have been 2.93%.
DThe amount shown reflects reclassifications related to book to tax differences that were made in the year shown.
ETotal distributions per share do not sum due to rounding.
FTotal returns would have been lower if certain expenses had not been reduced during the applicable periods shown.
GFees and expenses of any underlying mutual funds or exchange-traded funds (ETFs) are not included in the Fund's expense ratio. The Fund indirectly bears its proportionate share of these expenses. For additional expense information related to investments in Fidelity Central Funds, please refer to the "Investments in Fidelity Central Funds" note found in the Notes to Financial Statements section of the most recent Annual or Semi-Annual report.
HExpense ratios reflect operating expenses of the class. Expenses before reductions do not reflect amounts reimbursed, waived, or reduced through arrangements with the investment adviser, brokerage services, or other offset arrangements, if applicable, and do not represent the amount paid by the class during periods when reimbursements, waivers or reductions occur.
IAmount does not include the portfolio activity of any underlying mutual funds or exchange-traded funds (ETFs).
JPortfolio turnover rate excludes securities received or delivered in-kind.
| Fidelity Advisor® Energy Fund Class Z |
| |
| Years ended July 31, | | 2023 | | 2022 | | 2021 | | 2020 | | 2019 A |
Selected Per-Share Data | | | | | | | | | | |
| Net asset value, beginning of period | $ | 41.75 | $ | 24.91 | $ | 17.48 | $ | 29.35 | $ | 39.35 |
| Income from Investment Operations | | | | | | | | | | |
Net investment income (loss) B,C | | 1.19 | | 1.02 | | .80 D | | .69 | | .45 |
| Net realized and unrealized gain (loss) | | 5.56 | | 16.52 | | 7.30 | | (11.97) | | (10.03) |
| Total from investment operations | | 6.75 | | 17.54 | | 8.10 | | (11.28) | | (9.58) |
| Distributions from net investment income | | (1.04) | | (.70) | | (.67) | | (.59) | | (.37) E |
| Distributions from net realized gain | | - | | - | | - | | - | | (.05) E |
| Total distributions | | (1.04) | | (.70) | | (.67) | | (.59) | | (.42) |
| Net asset value, end of period | $ | 47.46 | $ | 41.75 | $ | 24.91 | $ | 17.48 | $ | 29.35 |
Total Return F,G | | 16.40% | | 71.83% | | 47.47% | | (39.22)% | | (24.34)% |
Ratios to Average Net Assets C,H,I | | | | | | | | | | |
| Expenses before reductions | | .62% | | .63% | | .65% | | .66% | | .65% J |
| Expenses net of fee waivers, if any | | .61% | | .62% | | .64% | | .66% | | .64% J |
| Expenses net of all reductions | | .61% | | .62% | | .64% | | .64% | | .64% J |
| Net investment income (loss) | | 2.69% | | 2.85% | | 3.62% D | | 3.10% | | 1.82% J |
| Supplemental Data | | | | | | | | | | |
| Net assets, end of period (000 omitted) | $ | 266,447 | $ | 263,802 | $ | 81,903 | $ | 40,742 | $ | 9,255 |
Portfolio turnover rate K | | 21% | | 37% | | 45% | | 84% L | | 47% |
AFor the period October 2, 2018 (commencement of sale of shares) through July 31, 2019.
BCalculated based on average shares outstanding during the period.
CNet investment income (loss) is affected by the timing of the declaration of dividends by any underlying mutual funds or exchange-traded funds (ETFs). Net investment income (loss) of any mutual funds or ETFs is not included in the Fund's net investment income (loss) ratio.
DNet investment income per share reflects one or more large, non-recurring dividend(s) which amounted to $.12 per share. Excluding such non-recurring dividend(s), the ratio of net investment income (loss) to average net assets would have been 3.07%.
EThe amount shown reflects reclassifications related to book to tax differences that were made in the year shown.
FTotal returns for periods of less than one year are not annualized.
GTotal returns would have been lower if certain expenses had not been reduced during the applicable periods shown.
HFees and expenses of any underlying mutual funds or exchange-traded funds (ETFs) are not included in the Fund's expense ratio. The Fund indirectly bears its proportionate share of these expenses. For additional expense information related to investments in Fidelity Central Funds, please refer to the "Investments in Fidelity Central Funds" note found in the Notes to Financial Statements section of the most recent Annual or Semi-Annual report.
IExpense ratios reflect operating expenses of the class. Expenses before reductions do not reflect amounts reimbursed, waived, or reduced through arrangements with the investment adviser, brokerage services, or other offset arrangements, if applicable, and do not represent the amount paid by the class during periods when reimbursements, waivers or reductions occur.
JAnnualized.
KAmount does not include the portfolio activity of any underlying mutual funds or exchange-traded funds (ETFs).
LPortfolio turnover rate excludes securities received or delivered in-kind.
Average annual total return reflects the change in the value of an investment, assuming reinvestment of distributions from dividend income and capital gains (the profits earned upon the sale of securities that have grown in value, if any) and assuming a constant rate of performance each year. The hypothetical investment and the average annual total returns do not reflect the deduction of taxes that a shareholder would pay on fund distributions or the redemption of fund shares. During periods of reimbursement by Fidelity, a fund's total return will be greater than it would be had the reimbursement not occurred. How a fund did yesterday is no guarantee of how it will do tomorrow.
| Average Annual Total Returns |
| | | | |
Periods ended July 31, 2023 | Past 1 year | Past 5 years | Past 10 years |
Class A (incl. 5.75% sales charge) | -1.82% | 5.85% | 8.31% |
Class M (incl. 3.50% sales charge) | 0.24% | 6.08% | 8.28% |
Class C (incl. contingent deferred sales charge) | 2.40% | 6.31% | 8.31% |
| Class I | 4.47% | 7.43% | 9.28% |
| Class Z | 4.58% | 7.56% | 9.34% |
Class C shares' contingent deferred sales charges included in the past one year, past five years and past ten years total return figures are 1%, 0% and 0%, respectively.
The initial offering of Class Z shares took place on October 2, 2018. Returns prior to October 2, 2018, are those of Class I.
| $10,000 Over 10 Years |
| |
Let's say hypothetically that $10,000 was invested in Fidelity Advisor® Financials Fund - Class A, a class of the fund, on July 31, 2013, and the current 5.75% sales charge was paid. The chart shows how the value of your investment would have changed, and also shows how the S&P 500® Index performed over the same period. |
|
|
Fidelity Advisor® Financials Fund
Market Recap:
U.S. equities gained 13.02% for the 12 months ending July 31, 2023, according to the S&P 500® index, as continued global economic expansion, falling commodity prices and a slowing in the pace of inflation provided a favorable backdrop for higher-risk assets. Large-cap stocks spearheaded the rally, which was driven by the shares of a narrow set of mega-cap companies in the information technology and communication services sectors, largely due to exuberance related to generative artificial intelligence. Aggressive monetary tightening by the U.S. Federal Reserve continued amid consistent pressure on core inflation, a measure that excludes food and energy. Since March 2022, the Fed has hiked its benchmark interest rate 11 times. The latest bump came in late July, a fourth consecutive raise of a stepped down 25 basis points. The S&P 500® gained 3.21% in July, as a "soft landing" of the U.S. economy became the consensus view amid better-than-expected earnings, slowing inflation and easing financial conditions, bringing the index's year-to-date gain to 20.65%. July saw a continuance of the recent shift to wider market breadth and lower dispersion. For the full 12 months, value (+17%) handily topped growth (+8%) within the index. By sector, tech (+28%), communication services (+21%) and industrials (+17%) led, whereas real estate (-10%) lagged most, due to high borrowing costs, low home inventory and a deteriorating commercial property market.
Comments from Portfolio Manager Matthew Reed:
For the fiscal year ending July 31, 2023, the fund's share classes (excluding sales charges, if applicable) gained about 3% to 5%, versus 5.39% for the MSCI US IMI Financials 5% Capped Linked Index and 13.02% for the broad-based S&P 500® index. Relative to the MSCI sector index, security selection was the primary detractor, especially among asset management & custody banks. A large underweight and stock picks in the multi-sector holdings category further hampered the portfolio's relative result. Investment choices in regional banks and multi-line insurance hurt as well. An overweighted position in the failed Signature Bank - whose stock lost essentially all its value during the period - detracted the most versus the sector index. The fund did not own this stock at period end. Not owning Berkshire Hathaway, an index component that gained 17%, also detracted on a relative basis. An outsized stake in Keycorp (-25%), an investment we established this period, proved detrimental as well. In contrast, investment choices among life & health insurance firms notably contributed to performance versus the sector index. Security selection and an overweight in the diversified financial services segment also boosted the portfolio's relative performance. Further contributing to the fund's relative result was stock picking in consumer finance. The top-2 individual relative contributors were First Republic Bank and SVB Financial Group, two other regional banks that failed during the period. The fund had no exposure to these two index components. Also lifting the fund's relative result was an overweight in Apollo Global Management (+46%). Notable changes in positioning include increased exposure to the transaction & payment processing services industry and a lower allocation to commercial & residential mortgage finance stocks.
Note to Shareholders: On April 28, 2023, the fund's name changed from Fidelity Advisor Financial Services Fund to Fidelity Advisor Financials Fund, better aligning it with the GICS Financials sector.
The views expressed above reflect those of the portfolio manager(s) only through the end of the period as stated on the cover of this report and do not necessarily represent the views of Fidelity or any other person in the Fidelity organization. Any such views are subject to change at any time based upon market or other conditions and Fidelity disclaims any responsibility to update such views. These views may not be relied on as investment advice and, because investment decisions for a Fidelity fund are based on numerous factors, may not be relied on as an indication of trading intent on behalf of any Fidelity fund.
Fidelity Advisor® Financials Fund
Top Holdings (% of Fund's net assets) |
| |
| MasterCard, Inc. Class A | 10.0 | |
| Wells Fargo & Co. | 6.4 | |
| Bank of America Corp. | 5.8 | |
| U.S. Bancorp | 3.5 | |
| Reinsurance Group of America, Inc. | 3.2 | |
| Morgan Stanley | 3.0 | |
| Citigroup, Inc. | 3.0 | |
| Chubb Ltd. | 2.8 | |
| Marsh & McLennan Companies, Inc. | 2.5 | |
| State Street Corp. | 2.3 | |
| | 42.5 | |
| |
| Industries (% of Fund's net assets) |
| |
| Banks | 35.8 | |
| Insurance | 23.3 | |
| Financial Services | 21.4 | |
| Capital Markets | 14.3 | |
| Consumer Finance | 4.2 | |
| Professional Services | 0.8 | |
| |
Fidelity Advisor® Financials Fund
Showing Percentage of Net Assets
| Common Stocks - 99.4% |
| | | Shares | Value ($) |
| Banks - 35.8% | | | |
| Diversified Banks - 21.6% | | | |
| Bank of America Corp. | | 855,556 | 27,377,792 |
| Citigroup, Inc. | | 294,305 | 14,026,576 |
| JPMorgan Chase & Co. | | 33,100 | 5,228,476 |
| KeyCorp | | 676,300 | 8,325,253 |
| U.S. Bancorp | | 420,100 | 16,669,568 |
| Wells Fargo & Co. | | 659,328 | 30,434,580 |
| | | | 102,062,245 |
| Regional Banks - 14.2% | | | |
| Associated Banc-Corp. | | 205,300 | 3,890,435 |
| Cadence Bank | | 128,724 | 3,224,536 |
| East West Bancorp, Inc. | | 133,900 | 8,329,919 |
| First Hawaiian, Inc. | | 147,400 | 3,049,706 |
| First Interstate Bancsystem, Inc. | | 184,152 | 5,290,687 |
| Heartland Financial U.S.A., Inc. | | 68,628 | 2,356,686 |
| M&T Bank Corp. | | 55,588 | 7,774,538 |
| Popular, Inc. | | 124,271 | 9,015,861 |
| Truist Financial Corp. | | 263,800 | 8,763,436 |
| UMB Financial Corp. | | 45,700 | 3,244,700 |
| Wintrust Financial Corp. | | 75,566 | 6,374,748 |
| Zions Bancorp NA | | 153,700 | 5,879,025 |
| | | | 67,194,277 |
TOTAL BANKS | | | 169,256,522 |
| Capital Markets - 14.3% | | | |
| Asset Management & Custody Banks - 8.1% | | | |
| Bank of New York Mellon Corp. | | 198,500 | 9,003,960 |
| Brookfield Asset Management Ltd. Class A | | 75 | 2,529 |
| Brookfield Corp. Class A | | 127,400 | 4,446,260 |
| Carlyle Group LP | | 146,000 | 5,204,900 |
| Northern Trust Corp. | | 53,500 | 4,286,420 |
| Patria Investments Ltd. | | 281,300 | 4,281,386 |
| State Street Corp. | | 150,300 | 10,887,732 |
| | | | 38,113,187 |
| Financial Exchanges & Data - 0.8% | | | |
| Bolsa Mexicana de Valores S.A.B. de CV | | 1,752,900 | 3,716,211 |
| Investment Banking & Brokerage - 5.4% | | | |
| Lazard Ltd. Class A | | 87,952 | 3,087,115 |
| Morgan Stanley | | 156,500 | 14,329,140 |
| Raymond James Financial, Inc. | | 50,750 | 5,586,053 |
| Virtu Financial, Inc. Class A | | 145,760 | 2,705,306 |
| | | | 25,707,614 |
TOTAL CAPITAL MARKETS | | | 67,537,012 |
| Consumer Finance - 4.2% | | | |
| Consumer Finance - 4.2% | | | |
| Capital One Financial Corp. | | 70,338 | 8,230,953 |
| FirstCash Holdings, Inc. | | 64,651 | 6,159,947 |
| OneMain Holdings, Inc. | | 124,700 | 5,671,356 |
| | | | 20,062,256 |
| Financial Services - 21.0% | | | |
| Commercial & Residential Mortgage Finance - 3.1% | | | |
| Essent Group Ltd. | | 176,000 | 8,729,600 |
| NMI Holdings, Inc. (a) | | 95,189 | 2,542,498 |
| Walker & Dunlop, Inc. | | 39,500 | 3,593,710 |
| | | | 14,865,808 |
| Diversified Financial Services - 2.7% | | | |
| Apollo Global Management, Inc. | | 122,500 | 10,009,475 |
| Corebridge Financial, Inc. (b) | | 147,500 | 2,759,725 |
| | | | 12,769,200 |
| Multi-Sector Holdings - 0.7% | | | |
| Cannae Holdings, Inc. (a) | | 155,840 | 3,176,019 |
| Transaction & Payment Processing Services - 14.5% | | | |
| Fiserv, Inc. (a) | | 78,200 | 9,869,622 |
| FleetCor Technologies, Inc. (a) | | 19,700 | 4,903,527 |
| Global Payments, Inc. | | 58,000 | 6,394,500 |
| MasterCard, Inc. Class A | | 120,500 | 47,510,739 |
| | | | 68,678,388 |
TOTAL FINANCIAL SERVICES | | | 99,489,415 |
| Insurance - 23.3% | | | |
| Insurance Brokers - 4.8% | | | |
| Arthur J. Gallagher & Co. | | 27,900 | 5,992,920 |
| BRP Group, Inc. (a) | | 187,904 | 4,680,689 |
| Marsh & McLennan Companies, Inc. | | 64,100 | 12,077,722 |
| | | | 22,751,331 |
| Life & Health Insurance - 2.6% | | | |
| Globe Life, Inc. | | 63,927 | 7,170,692 |
| Primerica, Inc. | | 23,200 | 4,934,640 |
| | | | 12,105,332 |
| Multi-Line Insurance - 1.5% | | | |
| Assurant, Inc. | | 200 | 26,902 |
| Hartford Financial Services Group, Inc. | | 99,600 | 7,159,248 |
| | | | 7,186,150 |
| Property & Casualty Insurance - 11.1% | | | |
| American Financial Group, Inc. | | 36,200 | 4,402,282 |
| Beazley PLC | | 538,800 | 3,792,707 |
| Chubb Ltd. | | 65,200 | 13,327,532 |
| Direct Line Insurance Group PLC | | 2,191,600 | 4,231,541 |
| Fidelity National Financial, Inc. | | 105,700 | 4,140,269 |
| First American Financial Corp. | | 82,619 | 5,236,392 |
| Hiscox Ltd. | | 466,600 | 6,461,172 |
| Lancashire Holdings Ltd. | | 618,100 | 4,735,635 |
| Selective Insurance Group, Inc. | | 32,146 | 3,317,146 |
| The Travelers Companies, Inc. | | 16,703 | 2,883,105 |
| | | | 52,527,781 |
| Reinsurance - 3.3% | | | |
| Enstar Group Ltd. (a) | | 1,349 | 345,182 |
| Reinsurance Group of America, Inc. | | 108,400 | 15,213,940 |
| | | | 15,559,122 |
TOTAL INSURANCE | | | 110,129,716 |
| Professional Services - 0.8% | | | |
| Research & Consulting Services - 0.8% | | | |
| Dun & Bradstreet Holdings, Inc. (b) | | 325,200 | 3,843,864 |
| TOTAL COMMON STOCKS (Cost $409,038,916) | | | 470,318,785 |
| | | | |
| Convertible Bonds - 0.4% |
| | | Principal Amount (c) | Value ($) |
| Financial Services - 0.4% | | | |
| Transaction & Payment Processing Services - 0.4% | | | |
Affirm Holdings, Inc. 0% 11/15/26 (Cost $1,689,794) | | 2,536,000 | 1,879,810 |
| | | | |
| Money Market Funds - 0.7% |
| | | Shares | Value ($) |
Fidelity Securities Lending Cash Central Fund 5.32% (d)(e) (Cost $3,295,125) | | 3,294,796 | 3,295,125 |
| | | | |
| TOTAL INVESTMENT IN SECURITIES - 100.5% (Cost $414,023,835) | 475,493,720 |
NET OTHER ASSETS (LIABILITIES) - (0.5)% | (2,232,700) |
| NET ASSETS - 100.0% | 473,261,020 |
| | |
Legend
| (b) | Security or a portion of the security is on loan at period end. |
| (c) | Amount is stated in United States dollars unless otherwise noted. |
| (d) | Affiliated fund that is generally available only to investment companies and other accounts managed by Fidelity Investments. The rate quoted is the annualized seven-day yield of the fund at period end. A complete unaudited listing of the fund's holdings as of its most recent quarter end is available upon request. In addition, each Fidelity Central Fund's financial statements, which are not covered by the Fund's Report of Independent Registered Public Accounting Firm, are available on the SEC's website or upon request. |
| (e) | Investment made with cash collateral received from securities on loan. |
Affiliated Central Funds
Fiscal year to date information regarding the Fund's investments in Fidelity Central Funds, including the ownership percentage, is presented below.
| Affiliate | Value, beginning of period ($) | Purchases ($) | Sales Proceeds ($) | Dividend Income ($) | Realized Gain (loss) ($) | Change in Unrealized appreciation (depreciation) ($) | Value, end of period ($) | % ownership, end of period |
| Fidelity Cash Central Fund 5.32% | 1,162,568 | 116,172,371 | 117,334,939 | 54,738 | - | - | - | 0.0% |
| Fidelity Securities Lending Cash Central Fund 5.32% | 4,928,049 | 92,239,237 | 93,872,161 | 5,678 | - | - | 3,295,125 | 0.0% |
| Total | 6,090,617 | 208,411,608 | 211,207,100 | 60,416 | - | - | 3,295,125 | |
| | | | | | | | | |
Amounts in the dividend income column in the above table include any capital gain distributions from underlying funds, which are presented in the corresponding line item in the Statement of Operations, if applicable.
Amounts in the dividend income column for Fidelity Securities Lending Cash Central Fund represents the income earned on investing cash collateral, less rebates paid to borrowers and any lending agent fees associated with the loan, plus any premium payments received for lending certain types of securities.
Amounts included in the purchases and sales proceeds columns may include in-kind transactions, if applicable.
Investment Valuation
The following is a summary of the inputs used, as of July 31, 2023, involving the Fund's assets and liabilities carried at fair value. The inputs or methodology used for valuing securities may not be an indication of the risk associated with investing in those securities. For more information on valuation inputs, and their aggregation into the levels used below, please refer to the Investment Valuation section in the accompanying Notes to Financial Statements.
| Valuation Inputs at Reporting Date: |
| Description | Total ($) | Level 1 ($) | Level 2 ($) | Level 3 ($) |
Investments in Securities: | | | | |
|
| Common Stocks | 470,318,785 | 470,318,785 | - | - |
|
| Convertible Bonds | 1,879,810 | - | 1,879,810 | - |
|
| Money Market Funds | 3,295,125 | 3,295,125 | - | - |
| Total Investments in Securities: | 475,493,720 | 473,613,910 | 1,879,810 | - |
Fidelity Advisor® Financials Fund
| Statement of Assets and Liabilities |
| | | | July 31, 2023 |
| | | | | |
| Assets | | | | |
| Investment in securities, at value (including securities loaned of $3,165,627) - See accompanying schedule: | | | | |
Unaffiliated issuers (cost $410,728,710) | $ | 472,198,595 | | |
Fidelity Central Funds (cost $3,295,125) | | 3,295,125 | | |
| | | | | |
| | | | | |
| Total Investment in Securities (cost $414,023,835) | | | $ | 475,493,720 |
| Receivable for investments sold | | | | 2,306,321 |
| Receivable for fund shares sold | | | | 768,758 |
| Dividends receivable | | | | 412,808 |
| Distributions receivable from Fidelity Central Funds | | | | 3,738 |
| Prepaid expenses | | | | 1,859 |
Total assets | | | | 478,987,204 |
| Liabilities | | | | |
| Payable to custodian bank | $ | 1,319,251 | | |
| Payable for fund shares redeemed | | 692,936 | | |
| Accrued management fee | | 202,714 | | |
| Distribution and service plan fees payable | | 94,853 | | |
| Other affiliated payables | | 74,489 | | |
| Other payables and accrued expenses | | 46,816 | | |
| Collateral on securities loaned | | 3,295,125 | | |
| Total Liabilities | | | | 5,726,184 |
| Net Assets | | | $ | 473,261,020 |
| Net Assets consist of: | | | | |
| Paid in capital | | | $ | 418,296,447 |
| Total accumulated earnings (loss) | | | | 54,964,573 |
| Net Assets | | | $ | 473,261,020 |
| | | | | |
| Net Asset Value and Maximum Offering Price | | | | |
| Class A : | | | | |
Net Asset Value and redemption price per share ($169,271,084 ÷ 6,550,286 shares)(a) | | | $ | 25.84 |
| Maximum offering price per share (100/94.25 of $25.84) | | | $ | 27.42 |
| Class M : | | | | |
Net Asset Value and redemption price per share ($64,588,318 ÷ 2,533,375 shares)(a) | | | $ | 25.49 |
| Maximum offering price per share (100/96.50 of $25.49) | | | $ | 26.41 |
| Class C : | | | | |
Net Asset Value and offering price per share ($41,338,668 ÷ 1,727,859 shares)(a) | | | $ | 23.92 |
| Class I : | | | | |
Net Asset Value, offering price and redemption price per share ($110,243,589 ÷ 4,118,678 shares) | | | $ | 26.77 |
| Class Z : | | | | |
Net Asset Value, offering price and redemption price per share ($87,819,361 ÷ 3,287,644 shares) | | | $ | 26.71 |
(a)Redemption price per share is equal to net asset value less any applicable contingent deferred sales charge. |
| Statement of Operations |
| | | | Year ended July 31, 2023 |
| Investment Income | | | | |
| Dividends | | | $ | 15,286,962 |
| Interest | | | | 328,347 |
| Income from Fidelity Central Funds (including $5,678 from security lending) | | | | 60,416 |
| Total Income | | | | 15,675,725 |
| Expenses | | | | |
| Management fee | $ | 2,698,749 | | |
| Transfer agent fees | | 818,625 | | |
| Distribution and service plan fees | | 1,276,429 | | |
| Accounting fees | | 178,635 | | |
| Custodian fees and expenses | | 39,506 | | |
| Independent trustees' fees and expenses | | 2,672 | | |
| Registration fees | | 89,814 | | |
| Audit | | 51,637 | | |
| Legal | | 689 | | |
| Interest | | 10,963 | | |
| Miscellaneous | | 3,400 | | |
| Total expenses before reductions | | 5,171,119 | | |
| Expense reductions | | (25,534) | | |
| Total expenses after reductions | | | | 5,145,585 |
| Net Investment income (loss) | | | | 10,530,140 |
| Realized and Unrealized Gain (Loss) | | | | |
| Net realized gain (loss) on: | | | | |
| Investment Securities: | | | | |
| Unaffiliated issuers | | (3,816,022) | | |
| Foreign currency transactions | | 11,872 | | |
| Total net realized gain (loss) | | | | (3,804,150) |
| Change in net unrealized appreciation (depreciation) on investment securities | | | | 9,650,146 |
| Net gain (loss) | | | | 5,845,996 |
| Net increase (decrease) in net assets resulting from operations | | | $ | 16,376,136 |
| Statement of Changes in Net Assets |
| |
| | Year ended July 31, 2023 | | Year ended July 31, 2022 |
| Increase (Decrease) in Net Assets | | | | |
| Operations | | | | |
| Net investment income (loss) | $ | 10,530,140 | $ | 8,232,044 |
| Net realized gain (loss) | | (3,804,150) | | 30,550,934 |
| Change in net unrealized appreciation (depreciation) | | 9,650,146 | | (69,481,639) |
| Net increase (decrease) in net assets resulting from operations | | 16,376,136 | | (30,698,661) |
| Distributions to shareholders | | (30,785,451) | | (21,010,596) |
| | | | | |
| Share transactions - net increase (decrease) | | (23,222,656) | | 95,349,433 |
| Total increase (decrease) in net assets | | (37,631,971) | | 43,640,176 |
| | | | | |
| Net Assets | | | | |
| Beginning of period | | 510,892,991 | | 467,252,815 |
| End of period | $ | 473,261,020 | $ | 510,892,991 |
| | | | | |
| | | | | |
| Fidelity Advisor® Financials Fund Class A |
| |
| Years ended July 31, | | 2023 | | 2022 | | 2021 | | 2020 | | 2019 |
Selected Per-Share Data | | | | | | | | | | |
| Net asset value, beginning of period | $ | 26.31 | $ | 28.41 | $ | 18.00 | $ | 21.47 | $ | 21.84 |
| Income from Investment Operations | | | | | | | | | | |
Net investment income (loss) A,B | | .51 | | .44 | | .42 | | .40 | | .27 |
| Net realized and unrealized gain (loss) | | .50 | | (1.32) | | 10.55 | | (3.59) | | .07 |
| Total from investment operations | | 1.01 | | (.88) | | 10.97 | | (3.19) | | .34 |
| Distributions from net investment income | | (.45) | | (.43) | | (.45) | | (.28) | | (.18) |
| Distributions from net realized gain | | (1.03) | | (.80) | | (.11) | | - | | (.53) |
| Total distributions | | (1.48) | | (1.22) C | | (.56) | | (.28) | | (.71) |
| Net asset value, end of period | $ | 25.84 | $ | 26.31 | $ | 28.41 | $ | 18.00 | $ | 21.47 |
Total Return D,E | | 4.17% | | (3.40)% | | 61.84% | | (15.15)% | | 2.05% |
Ratios to Average Net Assets B,F,G | | | | | | | | | | |
| Expenses before reductions | | 1.05% | | 1.03% | | 1.07% | | 1.09% | | 1.08% |
| Expenses net of fee waivers, if any | | 1.04% | | 1.03% | | 1.07% | | 1.09% | | 1.07% |
| Expenses net of all reductions | | 1.04% | | 1.03% | | 1.06% | | 1.08% | | 1.07% |
| Net investment income (loss) | | 2.02% | | 1.55% | | 1.76% | | 1.97% | | 1.31% |
| Supplemental Data | | | | | | | | | | |
| Net assets, end of period (000 omitted) | $ | 169,271 | $ | 189,413 | $ | 181,251 | $ | 104,761 | $ | 145,799 |
Portfolio turnover rate H | | 55% | | 40% | | 51% | | 88% I | | 51% |
ACalculated based on average shares outstanding during the period.
BNet investment income (loss) is affected by the timing of the declaration of dividends by any underlying mutual funds or exchange-traded funds (ETFs). Net investment income (loss) of any mutual funds or ETFs is not included in the Fund's net investment income (loss) ratio.
CTotal distributions per share do not sum due to rounding.
DTotal returns would have been lower if certain expenses had not been reduced during the applicable periods shown.
ETotal returns do not include the effect of the sales charges.
FFees and expenses of any underlying mutual funds or exchange-traded funds (ETFs) are not included in the Fund's expense ratio. The Fund indirectly bears its proportionate share of these expenses. For additional expense information related to investments in Fidelity Central Funds, please refer to the "Investments in Fidelity Central Funds" note found in the Notes to Financial Statements section of the most recent Annual or Semi-Annual report.
GExpense ratios reflect operating expenses of the class. Expenses before reductions do not reflect amounts reimbursed, waived, or reduced through arrangements with the investment adviser, brokerage services, or other offset arrangements, if applicable, and do not represent the amount paid by the class during periods when reimbursements, waivers or reductions occur.
HAmount does not include the portfolio activity of any underlying mutual funds or exchange-traded funds (ETFs).
IPortfolio turnover rate excludes securities received or delivered in-kind.
| Fidelity Advisor® Financials Fund Class M |
| |
| Years ended July 31, | | 2023 | | 2022 | | 2021 | | 2020 | | 2019 |
Selected Per-Share Data | | | | | | | | | | |
| Net asset value, beginning of period | $ | 25.98 | $ | 28.08 | $ | 17.79 | $ | 21.23 | $ | 21.60 |
| Income from Investment Operations | | | | | | | | | | |
Net investment income (loss) A,B | | .44 | | .37 | | .36 | | .34 | | .21 |
| Net realized and unrealized gain (loss) | | .49 | | (1.31) | | 10.44 | | (3.55) | | .07 |
| Total from investment operations | | .93 | | (.94) | | 10.80 | | (3.21) | | .28 |
| Distributions from net investment income | | (.39) | | (.37) | | (.39) | | (.23) | | (.13) |
| Distributions from net realized gain | | (1.03) | | (.80) | | (.11) | | - | | (.53) |
| Total distributions | | (1.42) | | (1.16) C | | (.51) C | | (.23) | | (.65) C |
| Net asset value, end of period | $ | 25.49 | $ | 25.98 | $ | 28.08 | $ | 17.79 | $ | 21.23 |
Total Return D,E | | 3.88% | | (3.63)% | | 61.48% | | (15.38)% | | 1.77% |
Ratios to Average Net Assets B,F,G | | | | | | | | | | |
| Expenses before reductions | | 1.29% | | 1.28% | | 1.32% | | 1.35% | | 1.34% |
| Expenses net of fee waivers, if any | | 1.28% | | 1.28% | | 1.32% | | 1.35% | | 1.34% |
| Expenses net of all reductions | | 1.28% | | 1.28% | | 1.31% | | 1.34% | | 1.33% |
| Net investment income (loss) | | 1.78% | | 1.30% | | 1.51% | | 1.72% | | 1.04% |
| Supplemental Data | | | | | | | | | | |
| Net assets, end of period (000 omitted) | $ | 64,588 | $ | 69,176 | $ | 60,508 | $ | 34,828 | $ | 48,210 |
Portfolio turnover rate H | | 55% | | 40% | | 51% | | 88% I | | 51% |
ACalculated based on average shares outstanding during the period.
BNet investment income (loss) is affected by the timing of the declaration of dividends by any underlying mutual funds or exchange-traded funds (ETFs). Net investment income (loss) of any mutual funds or ETFs is not included in the Fund's net investment income (loss) ratio.
CTotal distributions per share do not sum due to rounding.
DTotal returns would have been lower if certain expenses had not been reduced during the applicable periods shown.
ETotal returns do not include the effect of the sales charges.
FFees and expenses of any underlying mutual funds or exchange-traded funds (ETFs) are not included in the Fund's expense ratio. The Fund indirectly bears its proportionate share of these expenses. For additional expense information related to investments in Fidelity Central Funds, please refer to the "Investments in Fidelity Central Funds" note found in the Notes to Financial Statements section of the most recent Annual or Semi-Annual report.
GExpense ratios reflect operating expenses of the class. Expenses before reductions do not reflect amounts reimbursed, waived, or reduced through arrangements with the investment adviser, brokerage services, or other offset arrangements, if applicable, and do not represent the amount paid by the class during periods when reimbursements, waivers or reductions occur.
HAmount does not include the portfolio activity of any underlying mutual funds or exchange-traded funds (ETFs).
IPortfolio turnover rate excludes securities received or delivered in-kind.
| Fidelity Advisor® Financials Fund Class C |
| |
| Years ended July 31, | | 2023 | | 2022 | | 2021 | | 2020 | | 2019 |
Selected Per-Share Data | | | | | | | | | | |
| Net asset value, beginning of period | $ | 24.44 | $ | 26.48 | $ | 16.80 | $ | 20.04 | $ | 20.41 |
| Income from Investment Operations | | | | | | | | | | |
Net investment income (loss) A,B | | .30 | | .21 | | .22 | | .23 | | .11 |
| Net realized and unrealized gain (loss) | | .46 | | (1.23) | | 9.85 | | (3.37) | | .07 |
| Total from investment operations | | .76 | | (1.02) | | 10.07 | | (3.14) | | .18 |
| Distributions from net investment income | | (.25) | | (.23) | | (.28) | | (.10) | | (.03) |
| Distributions from net realized gain | | (1.03) | | (.80) | | (.11) | | - | | (.53) |
| Total distributions | | (1.28) | | (1.02) C | | (.39) | | (.10) | | (.55) C |
| Net asset value, end of period | $ | 23.92 | $ | 24.44 | $ | 26.48 | $ | 16.80 | $ | 20.04 |
Total Return D,E | | 3.38% | | (4.13)% | | 60.62% | | (15.79)% | | 1.29% |
Ratios to Average Net Assets B,F,G | | | | | | | | | | |
| Expenses before reductions | | 1.79% | | 1.79% | | 1.83% | | 1.84% | | 1.83% |
| Expenses net of fee waivers, if any | | 1.79% | | 1.78% | | 1.82% | | 1.84% | | 1.82% |
| Expenses net of all reductions | | 1.79% | | 1.78% | | 1.82% | | 1.83% | | 1.82% |
| Net investment income (loss) | | 1.27% | | .80% | | 1.00% | | 1.22% | | .56% |
| Supplemental Data | | | | | | | | | | |
| Net assets, end of period (000 omitted) | $ | 41,339 | $ | 58,177 | $ | 57,856 | $ | 41,947 | $ | 71,609 |
Portfolio turnover rate H | | 55% | | 40% | | 51% | | 88% I | | 51% |
ACalculated based on average shares outstanding during the period.
BNet investment income (loss) is affected by the timing of the declaration of dividends by any underlying mutual funds or exchange-traded funds (ETFs). Net investment income (loss) of any mutual funds or ETFs is not included in the Fund's net investment income (loss) ratio.
CTotal distributions per share do not sum due to rounding.
DTotal returns would have been lower if certain expenses had not been reduced during the applicable periods shown.
ETotal returns do not include the effect of the contingent deferred sales charge.
FFees and expenses of any underlying mutual funds or exchange-traded funds (ETFs) are not included in the Fund's expense ratio. The Fund indirectly bears its proportionate share of these expenses. For additional expense information related to investments in Fidelity Central Funds, please refer to the "Investments in Fidelity Central Funds" note found in the Notes to Financial Statements section of the most recent Annual or Semi-Annual report.
GExpense ratios reflect operating expenses of the class. Expenses before reductions do not reflect amounts reimbursed, waived, or reduced through arrangements with the investment adviser, brokerage services, or other offset arrangements, if applicable, and do not represent the amount paid by the class during periods when reimbursements, waivers or reductions occur.
HAmount does not include the portfolio activity of any underlying mutual funds or exchange-traded funds (ETFs).
IPortfolio turnover rate excludes securities received or delivered in-kind.
| Fidelity Advisor® Financials Fund Class I |
| |
| Years ended July 31, | | 2023 | | 2022 | | 2021 | | 2020 | | 2019 |
Selected Per-Share Data | | | | | | | | | | |
| Net asset value, beginning of period | $ | 27.20 | $ | 29.32 | $ | 18.55 | $ | 22.11 | $ | 22.47 |
| Income from Investment Operations | | | | | | | | | | |
Net investment income (loss) A,B | | .60 | | .54 | | .52 | | .47 | | .33 |
| Net realized and unrealized gain (loss) | | .52 | | (1.37) | | 10.86 | | (3.69) | | .08 |
| Total from investment operations | | 1.12 | | (.83) | | 11.38 | | (3.22) | | .41 |
| Distributions from net investment income | | (.53) | | (.50) | | (.50) | | (.34) | | (.25) |
| Distributions from net realized gain | | (1.03) | | (.80) | | (.11) | | - | | (.53) |
| Total distributions | | (1.55) C | | (1.29) C | | (.61) | | (.34) | | (.77) C |
| Net asset value, end of period | $ | 26.77 | $ | 27.20 | $ | 29.32 | $ | 18.55 | $ | 22.11 |
Total Return D | | 4.47% | | (3.13)% | | 62.31% | | (14.91)% | | 2.36% |
Ratios to Average Net Assets B,E,F | | | | | | | | | | |
| Expenses before reductions | | .77% | | .76% | | .79% | | .80% | | .80% |
| Expenses net of fee waivers, if any | | .77% | | .76% | | .79% | | .80% | | .79% |
| Expenses net of all reductions | | .77% | | .76% | | .78% | | .78% | | .79% |
| Net investment income (loss) | | 2.29% | | 1.82% | | 2.04% | | 2.27% | | 1.59% |
| Supplemental Data | | | | | | | | | | |
| Net assets, end of period (000 omitted) | $ | 110,244 | $ | 131,118 | $ | 118,424 | $ | 85,299 | $ | 107,059 |
Portfolio turnover rate G | | 55% | | 40% | | 51% | | 88% H | | 51% |
ACalculated based on average shares outstanding during the period.
BNet investment income (loss) is affected by the timing of the declaration of dividends by any underlying mutual funds or exchange-traded funds (ETFs). Net investment income (loss) of any mutual funds or ETFs is not included in the Fund's net investment income (loss) ratio.
CTotal distributions per share do not sum due to rounding.
DTotal returns would have been lower if certain expenses had not been reduced during the applicable periods shown.
EFees and expenses of any underlying mutual funds or exchange-traded funds (ETFs) are not included in the Fund's expense ratio. The Fund indirectly bears its proportionate share of these expenses. For additional expense information related to investments in Fidelity Central Funds, please refer to the "Investments in Fidelity Central Funds" note found in the Notes to Financial Statements section of the most recent Annual or Semi-Annual report.
FExpense ratios reflect operating expenses of the class. Expenses before reductions do not reflect amounts reimbursed, waived, or reduced through arrangements with the investment adviser, brokerage services, or other offset arrangements, if applicable, and do not represent the amount paid by the class during periods when reimbursements, waivers or reductions occur.
GAmount does not include the portfolio activity of any underlying mutual funds or exchange-traded funds (ETFs).
HPortfolio turnover rate excludes securities received or delivered in-kind.
| Fidelity Advisor® Financials Fund Class Z |
| |
| Years ended July 31, | | 2023 | | 2022 | | 2021 | | 2020 | | 2019 A |
Selected Per-Share Data | | | | | | | | | | |
| Net asset value, beginning of period | $ | 27.16 | $ | 29.28 | $ | 18.53 | $ | 22.09 | $ | 21.99 |
| Income from Investment Operations | | | | | | | | | | |
Net investment income (loss) B,C | | .63 | | .57 | | .54 | | .49 | | .25 |
| Net realized and unrealized gain (loss) | | .51 | | (1.37) | | 10.86 | | (3.67) | | .66 |
| Total from investment operations | | 1.14 | | (.80) | | 11.40 | | (3.18) | | .91 |
| Distributions from net investment income | | (.57) | | (.53) | | (.54) | | (.38) | | (.29) |
| Distributions from net realized gain | | (1.03) | | (.80) | | (.11) | | - | | (.53) |
| Total distributions | | (1.59) D | | (1.32) D | | (.65) | | (.38) | | (.81) D |
| Net asset value, end of period | $ | 26.71 | $ | 27.16 | $ | 29.28 | $ | 18.53 | $ | 22.09 |
Total Return E,F | | 4.58% | | (3.03)% | | 62.53% | | (14.79)% | | 4.72% |
Ratios to Average Net Assets C,G,H | | | | | | | | | | |
| Expenses before reductions | | .64% | | .64% | | .66% | | .67% | | .66% I |
| Expenses net of fee waivers, if any | | .64% | | .63% | | .66% | | .67% | | .65% I |
| Expenses net of all reductions | | .64% | | .63% | | .65% | | .65% | | .65% I |
| Net investment income (loss) | | 2.42% | | 1.95% | | 2.17% | | 2.40% | | 1.44% I |
| Supplemental Data | | | | | | | | | | |
| Net assets, end of period (000 omitted) | $ | 87,819 | $ | 63,009 | $ | 49,214 | $ | 30,790 | $ | 7,041 |
Portfolio turnover rate J | | 55% | | 40% | | 51% | | 88% K | | 51% |
AFor the period October 2, 2018 (commencement of sale of shares) through July 31, 2019.
BCalculated based on average shares outstanding during the period.
CNet investment income (loss) is affected by the timing of the declaration of dividends by any underlying mutual funds or exchange-traded funds (ETFs). Net investment income (loss) of any mutual funds or ETFs is not included in the Fund's net investment income (loss) ratio.
DTotal distributions per share do not sum due to rounding.
ETotal returns for periods of less than one year are not annualized.
FTotal returns would have been lower if certain expenses had not been reduced during the applicable periods shown.
GFees and expenses of any underlying mutual funds or exchange-traded funds (ETFs) are not included in the Fund's expense ratio. The Fund indirectly bears its proportionate share of these expenses. For additional expense information related to investments in Fidelity Central Funds, please refer to the "Investments in Fidelity Central Funds" note found in the Notes to Financial Statements section of the most recent Annual or Semi-Annual report.
HExpense ratios reflect operating expenses of the class. Expenses before reductions do not reflect amounts reimbursed, waived, or reduced through arrangements with the investment adviser, brokerage services, or other offset arrangements, if applicable, and do not represent the amount paid by the class during periods when reimbursements, waivers or reductions occur.
IAnnualized.
JAmount does not include the portfolio activity of any underlying mutual funds or exchange-traded funds (ETFs).
KPortfolio turnover rate excludes securities received or delivered in-kind.
Average annual total return reflects the change in the value of an investment, assuming reinvestment of distributions from dividend income and capital gains (the profits earned upon the sale of securities that have grown in value, if any) and assuming a constant rate of performance each year. The hypothetical investment and the average annual total returns do not reflect the deduction of taxes that a shareholder would pay on fund distributions or the redemption of fund shares. During periods of reimbursement by Fidelity, a fund's total return will be greater than it would be had the reimbursement not occurred. How a fund did yesterday is no guarantee of how it will do tomorrow.
| Average Annual Total Returns |
| | | | |
Periods ended July 31, 2023 | Past 1 year | Past 5 years | Past 10 years |
Class A (incl. 5.75% sales charge) | -2.25% | 5.89% | 11.02% |
Class M (incl. 3.50% sales charge) | -0.17% | 6.12% | 11.00% |
Class C (incl. contingent deferred sales charge) | 1.93% | 6.35% | 11.02% |
| Class I | 3.98% | 7.43% | 11.98% |
| Class Z | 4.11% | 7.56% | 12.05% |
Class C shares' contingent deferred sales charges included in the past one year, past five years and past ten years total return figures are 1%, 0% and 0%, respectively.
The initial offering of Class Z shares took place on October 2, 2018. Returns prior to October 2, 2018, are those of Class I.
| $10,000 Over 10 Years |
| |
Let's say hypothetically that $10,000 was invested in Fidelity Advisor® Health Care Fund - Class A, a class of the fund, on July 31, 2013, and the current 5.75% sales charge was paid. The chart shows how the value of your investment would have changed, and also shows how the S&P 500® Index performed over the same period. |
|
|
Fidelity Advisor® Health Care Fund
Market Recap:
U.S. equities gained 13.02% for the 12 months ending July 31, 2023, according to the S&P 500® index, as continued global economic expansion, falling commodity prices and a slowing in the pace of inflation provided a favorable backdrop for higher-risk assets. Large-cap stocks spearheaded the rally, which was driven by the shares of a narrow set of mega-cap companies in the information technology and communication services sectors, largely due to exuberance related to generative artificial intelligence. Aggressive monetary tightening by the U.S. Federal Reserve continued amid consistent pressure on core inflation, a measure that excludes food and energy. Since March 2022, the Fed has hiked its benchmark interest rate 11 times. The latest bump came in late July, a fourth consecutive raise of a stepped down 25 basis points. The S&P 500® gained 3.21% in July, as a "soft landing" of the U.S. economy became the consensus view amid better-than-expected earnings, slowing inflation and easing financial conditions, bringing the index's year-to-date gain to 20.65%. July saw a continuance of the recent shift to wider market breadth and lower dispersion. For the full 12 months, value (+17%) handily topped growth (+8%) within the index. By sector, tech (+28%), communication services (+21%) and industrials (+17%) led, whereas real estate (-10%) lagged most, due to high borrowing costs, low home inventory and a deteriorating commercial property market.
Comments from Portfolio Manager Eddie Yoon:
For the fiscal year ending July 31, 2023, the fund's share classes (excluding sales charges, if applicable) gained about 3% to 4%, versus 2.63% for the MSCI U.S. IMI Health Care 25/50 Index and 13.02% for the broad-based S&P 500® index. From a category standpoint, the primary contributor to the fund's performance versus the industry index was stock selection in health care services. Stock picks and an overweight in health care equipment also notably boosted the fund's relative performance. Also lifting the fund's relative result was security selection in pharmaceuticals. The top individual relative contributor was an overweight in Penumbra (+118%). Penumbra was one of our largest holdings, but we reduced our stake this period. The fund's second-largest relative contributor the past 12 months was avoiding Pfizer, an index component that returned about -26%. An overweight in Boston Scientific (+26%) also helped. Boston Scientific was among our biggest holdings. In contrast, the biggest detractor from performance versus the industry index was security selection and an overweight in managed health care. Stock picks in health care facilities also hampered the fund's relative result. Also detracting from our relative performance was an overweight in life sciences tools & services. The fund's biggest individual relative detractor was an underweight in Merck (+23%). This period we increased our position in Merck. The fund's second-largest relative detractor was an overweight in Royalty Pharma (-26%). We reduced our stake. An overweight in Masimo (-15%) also detracted. This period we increased our stake in Masimo. Notable changes in positioning include increased exposure to the health care services industry and a lower allocation to managed health care.
The views expressed above reflect those of the portfolio manager(s) only through the end of the period as stated on the cover of this report and do not necessarily represent the views of Fidelity or any other person in the Fidelity organization. Any such views are subject to change at any time based upon market or other conditions and Fidelity disclaims any responsibility to update such views. These views may not be relied on as investment advice and, because investment decisions for a Fidelity fund are based on numerous factors, may not be relied on as an indication of trading intent on behalf of any Fidelity fund.
Fidelity Advisor® Health Care Fund
Top Holdings (% of Fund's net assets) |
| |
| UnitedHealth Group, Inc. | 10.5 | |
| Boston Scientific Corp. | 7.1 | |
| Danaher Corp. | 6.4 | |
| Eli Lilly & Co. | 5.0 | |
| Thermo Fisher Scientific, Inc. | 4.8 | |
| Penumbra, Inc. | 3.9 | |
| Cigna Group | 3.5 | |
| Regeneron Pharmaceuticals, Inc. | 2.9 | |
| Argenx SE ADR | 2.7 | |
| AstraZeneca PLC (United Kingdom) | 2.5 | |
| | 49.3 | |
| |
| Industries (% of Fund's net assets) |
| |
| Health Care Providers & Services | 28.6 | |
| Health Care Equipment & Supplies | 19.4 | |
| Biotechnology | 18.3 | |
| Life Sciences Tools & Services | 17.4 | |
| Pharmaceuticals | 13.4 | |
| Health Care Technology | 2.4 | |
| Financial Services | 0.2 | |
| Personal Care Products | 0.2 | |
| |
Fidelity Advisor® Health Care Fund
Showing Percentage of Net Assets
| Common Stocks - 98.6% |
| | | Shares | Value ($) |
| Biotechnology - 17.7% | | | |
| Biotechnology - 17.7% | | | |
| Acelyrin, Inc. (a) | | 600,000 | 14,904,000 |
| Akero Therapeutics, Inc. (b) | | 750,000 | 32,550,000 |
| Allogene Therapeutics, Inc. (a)(b) | | 2,870,355 | 14,236,961 |
| Alnylam Pharmaceuticals, Inc. (b) | | 87,500 | 17,097,500 |
| Ambrx Biopharma, Inc. ADR (b) | | 227,300 | 3,466,325 |
| Arcellx, Inc. (b) | | 330,000 | 11,302,500 |
| Arcus Biosciences, Inc. (b) | | 350,000 | 6,965,000 |
| Arcutis Biotherapeutics, Inc. (b) | | 750,000 | 8,182,500 |
| Argenx SE ADR (b) | | 305,000 | 153,866,400 |
| Ascendis Pharma A/S sponsored ADR (b) | | 565,607 | 50,989,471 |
| Avidity Biosciences, Inc. (b) | | 1,000,000 | 9,510,000 |
| Blueprint Medicines Corp. (b) | | 450,000 | 29,700,000 |
| Caris Life Sciences, Inc. (c)(d) | | 1,098,028 | 6,148,957 |
| Celldex Therapeutics, Inc. (b) | | 540,000 | 19,094,400 |
| Cerevel Therapeutics Holdings (b) | | 1,000,000 | 30,590,000 |
| Cytokinetics, Inc. (b) | | 1,080,000 | 36,018,000 |
| Generation Bio Co. (b) | | 297,443 | 1,511,010 |
| Janux Therapeutics, Inc. (b) | | 400,000 | 5,600,000 |
| Karuna Therapeutics, Inc. (b) | | 198,800 | 39,714,276 |
| Keros Therapeutics, Inc. (b) | | 380,000 | 15,914,400 |
| Legend Biotech Corp. ADR (b) | | 1,140,000 | 86,092,800 |
| Morphic Holding, Inc. (b) | | 280,000 | 15,884,400 |
| Nuvalent, Inc. Class A (a)(b) | | 400,000 | 19,940,000 |
| Poseida Therapeutics, Inc. (b) | | 1,168,620 | 2,021,713 |
| PTC Therapeutics, Inc. (b) | | 385,000 | 15,530,900 |
| Regeneron Pharmaceuticals, Inc. (b) | | 224,000 | 166,187,840 |
| Repligen Corp. (a)(b) | | 190,000 | 32,596,400 |
| Sarepta Therapeutics, Inc. (b) | | 169,000 | 18,317,910 |
| Shattuck Labs, Inc. (b) | | 668,725 | 1,705,249 |
| Vaxcyte, Inc. (b) | | 869,719 | 41,798,695 |
| Vera Therapeutics, Inc. (a)(b) | | 700,000 | 13,139,000 |
| Vertex Pharmaceuticals, Inc. (b) | | 46,000 | 16,207,640 |
| Xencor, Inc. (b) | | 1,000,000 | 24,290,000 |
| Xenon Pharmaceuticals, Inc. (b) | | 540,000 | 19,936,800 |
| Zentalis Pharmaceuticals, Inc. (b) | | 900,000 | 24,039,000 |
| | | | 1,005,050,047 |
| Health Care Equipment & Supplies - 19.4% | | | |
| Health Care Equipment - 19.4% | | | |
| Boston Scientific Corp. (b) | | 7,740,000 | 401,319,000 |
| Glaukos Corp. (b) | | 180,000 | 13,885,200 |
| Insulet Corp. (b) | | 385,000 | 106,548,750 |
| Intuitive Surgical, Inc. (b) | | 116,000 | 37,630,400 |
| iRhythm Technologies, Inc. (b) | | 280,000 | 29,416,800 |
| Masimo Corp. (b) | | 870,000 | 106,401,000 |
| Novocure Ltd. (b) | | 350,000 | 11,424,000 |
| Outset Medical, Inc. (b) | | 600,000 | 12,348,000 |
| Penumbra, Inc. (b) | | 730,000 | 221,452,800 |
| PROCEPT BioRobotics Corp. (a)(b) | | 400,000 | 13,776,000 |
| ResMed, Inc. | | 320,000 | 71,152,000 |
| Stryker Corp. | | 228,000 | 64,617,480 |
| Tandem Diabetes Care, Inc. (b) | | 250,000 | 8,730,000 |
| | | | 1,098,701,430 |
| Health Care Providers & Services - 28.6% | | | |
| Health Care Facilities - 2.7% | | | |
| Acadia Healthcare Co., Inc. (b) | | 660,000 | 52,159,800 |
| Surgery Partners, Inc. (b) | | 2,600,000 | 100,438,000 |
| | | | 152,597,800 |
| Health Care Services - 9.8% | | | |
| agilon health, Inc. (a)(b) | | 7,250,000 | 138,837,500 |
| Cigna Group | | 680,000 | 200,668,000 |
| CVS Health Corp. | | 1,570,000 | 117,263,300 |
| LifeStance Health Group, Inc. (b) | | 4,000,000 | 37,560,000 |
| Privia Health Group, Inc. (a)(b) | | 2,200,000 | 61,424,000 |
| | | | 555,752,800 |
| Managed Health Care - 16.1% | | | |
| Alignment Healthcare, Inc. (b) | | 2,686,618 | 16,683,898 |
| Centene Corp. (b) | | 1,750,000 | 119,157,500 |
| Elevance Health, Inc. | | 160,000 | 75,460,800 |
| Humana, Inc. | | 169,000 | 77,204,270 |
| Molina Healthcare, Inc. (b) | | 100,000 | 30,449,000 |
| UnitedHealth Group, Inc. | | 1,180,000 | 597,516,600 |
| | | | 916,472,068 |
TOTAL HEALTH CARE PROVIDERS & SERVICES | | | 1,624,822,668 |
| Health Care Technology - 2.1% | | | |
| Health Care Technology - 2.1% | | | |
| Doximity, Inc. (a)(b) | | 475,000 | 16,971,750 |
| Evolent Health, Inc. (b) | | 596,774 | 18,135,962 |
| Evolent Health, Inc. (c) | | 803,226 | 23,189,536 |
| Phreesia, Inc. (b) | | 800,000 | 25,376,000 |
| Veeva Systems, Inc. Class A (b) | | 160,000 | 32,675,200 |
| | | | 116,348,448 |
| Life Sciences Tools & Services - 17.4% | | | |
| Life Sciences Tools & Services - 17.4% | | | |
| 10X Genomics, Inc. (a)(b) | | 1,350,000 | 85,023,000 |
| Bruker Corp. | | 740,000 | 50,852,800 |
| Danaher Corp. | | 1,420,000 | 362,185,200 |
| Fortrea Holdings, Inc. | | 213,900 | 6,836,244 |
| IQVIA Holdings, Inc. (b) | | 400,000 | 89,504,000 |
| Lonza Group AG | | 48,000 | 27,807,580 |
| Olink Holding AB ADR (b) | | 776,107 | 14,746,033 |
| Sartorius Stedim Biotech | | 86,000 | 26,901,467 |
| Thermo Fisher Scientific, Inc. | | 500,000 | 274,330,000 |
| West Pharmaceutical Services, Inc. | | 128,000 | 47,109,120 |
| | | | 985,295,444 |
| Personal Care Products - 0.2% | | | |
| Personal Care Products - 0.2% | | | |
| The Beauty Health Co. (a)(b) | | 546,577 | 4,531,123 |
| The Beauty Health Co. (b)(c) | | 1,000,000 | 8,290,000 |
| | | | 12,821,123 |
| Pharmaceuticals - 13.2% | | | |
| Pharmaceuticals - 13.2% | | | |
| Arvinas Holding Co. LLC (a)(b) | | 500,000 | 12,360,000 |
| AstraZeneca PLC (United Kingdom) | | 1,000,000 | 143,676,275 |
| Eli Lilly & Co. (a) | | 618,000 | 280,911,900 |
| Enliven Therapeutics, Inc. (b) | | 280,000 | 5,303,200 |
| Merck & Co., Inc. | | 950,000 | 101,317,500 |
| Novo Nordisk A/S Series B | | 420,000 | 67,725,941 |
| Pharvaris BV (b) | | 400,000 | 6,800,000 |
| Royalty Pharma PLC | | 2,000,000 | 62,760,000 |
| UCB SA | | 410,000 | 36,298,013 |
| Ventyx Biosciences, Inc. (b) | | 570,000 | 21,118,500 |
| Verona Pharma PLC ADR (b) | | 400,000 | 8,836,000 |
| | | | 747,107,329 |
| TOTAL COMMON STOCKS (Cost $3,810,225,082) | | | 5,590,146,489 |
| | | | |
| Preferred Stocks - 1.3% |
| | | Shares | Value ($) |
| Convertible Preferred Stocks - 1.2% | | | |
| Biotechnology - 0.6% | | | |
| Biotechnology - 0.6% | | | |
| Asimov, Inc. Series B (b)(c)(d) | | 67,547 | 3,440,169 |
| Caris Life Sciences, Inc. Series D (b)(c)(d) | | 2,082,481 | 11,661,894 |
| Cleerly, Inc. Series C (b)(c)(d) | | 882,089 | 10,249,874 |
| Element Biosciences, Inc. Series C (b)(c)(d) | | 376,690 | 6,023,273 |
| ElevateBio LLC Series C (b)(c)(d) | | 163,300 | 684,227 |
| Inscripta, Inc. Series E (b)(c)(d) | | 826,424 | 3,495,774 |
| | | | 35,555,211 |
| Financial Services - 0.1% | | | |
| Specialized Finance - 0.1% | | | |
| Saluda Medical, Inc. Series E (c)(d) | | 781,583 | 6,283,927 |
| | | | |
| Health Care Providers & Services - 0.0% | | | |
| Health Care Services - 0.0% | | | |
| dMed Biopharmaceutical Co. Ltd. Series C (b)(c)(d) | | 236,142 | 1,848,992 |
| | | | |
| Health Care Technology - 0.3% | | | |
| Health Care Technology - 0.3% | | | |
| Aledade, Inc.: | | | |
| Series B1(b)(c)(d) | | 130,618 | 6,546,574 |
| Series E1(b)(c)(d) | | 46,526 | 2,331,883 |
| Omada Health, Inc. Series E (b)(c)(d) | | 1,456,953 | 5,070,196 |
| Wugen, Inc. Series B (b)(c)(d) | | 300,054 | 1,497,269 |
| | | | 15,445,922 |
| Pharmaceuticals - 0.2% | | | |
| Pharmaceuticals - 0.2% | | | |
| Aristea Therapeutics, Inc. Series B (b)(c)(d) | | 638,900 | 3,520,339 |
| Galvanize Therapeutics Series B (b)(c)(d) | | 2,552,870 | 4,135,649 |
| | | | 7,655,988 |
| TOTAL CONVERTIBLE PREFERRED STOCKS | | | 66,790,040 |
| Nonconvertible Preferred Stocks - 0.1% | | | |
| Financial Services - 0.1% | | | |
| Diversified Financial Services - 0.1% | | | |
| Thriveworks TopCo LLC Series B (b)(c)(d)(e) | | 327,591 | 4,743,518 |
| | | | |
| TOTAL PREFERRED STOCKS (Cost $94,686,616) | | | 71,533,558 |
| | | | |
| Money Market Funds - 5.3% |
| | | Shares | Value ($) |
| Fidelity Cash Central Fund 5.32% (f) | | 41,914,442 | 41,922,825 |
| Fidelity Securities Lending Cash Central Fund 5.32% (f)(g) | | 260,905,442 | 260,931,533 |
| TOTAL MONEY MARKET FUNDS (Cost $302,854,358) | | | 302,854,358 |
| | | | |
| TOTAL INVESTMENT IN SECURITIES - 105.2% (Cost $4,207,766,056) | 5,964,534,405 |
NET OTHER ASSETS (LIABILITIES) - (5.2)% | (292,605,587) |
| NET ASSETS - 100.0% | 5,671,928,818 |
| | |
Legend
| (a) | Security or a portion of the security is on loan at period end. |
| (c) | Restricted securities (including private placements) - Investment in securities not registered under the Securities Act of 1933 (excluding 144A issues). At the end of the period, the value of restricted securities (excluding 144A issues) amounted to $109,162,051 or 1.9% of net assets. |
| (e) | Investment is owned by a wholly-owned subsidiary (Subsidiary) that is treated as a corporation for U.S. tax purposes. |
| (f) | Affiliated fund that is generally available only to investment companies and other accounts managed by Fidelity Investments. The rate quoted is the annualized seven-day yield of the fund at period end. A complete unaudited listing of the fund's holdings as of its most recent quarter end is available upon request. In addition, each Fidelity Central Fund's financial statements, which are not covered by the Fund's Report of Independent Registered Public Accounting Firm, are available on the SEC's website or upon request. |
| (g) | Investment made with cash collateral received from securities on loan. |
| Additional information on each restricted holding is as follows: |
| Security | Acquisition Date | Acquisition Cost ($) |
| Aledade, Inc. Series B1 | 5/07/21 | 5,001,455 |
| | | |
| Aledade, Inc. Series E1 | 5/20/22 | 2,317,665 |
| | | |
| Aristea Therapeutics, Inc. Series B | 10/06/20 | 3,522,703 |
| | | |
| Asimov, Inc. Series B | 10/29/21 | 6,260,303 |
| | | |
| Caris Life Sciences, Inc. | 10/06/22 | 6,148,957 |
| | | |
| Caris Life Sciences, Inc. Series D | 5/11/21 | 16,868,096 |
| | | |
| Cleerly, Inc. Series C | 7/08/22 | 10,391,538 |
| | | |
| dMed Biopharmaceutical Co. Ltd. Series C | 12/01/20 | 3,353,960 |
| | | |
| Element Biosciences, Inc. Series C | 6/21/21 | 7,743,503 |
| | | |
| ElevateBio LLC Series C | 3/09/21 | 685,044 |
| | | |
| Evolent Health, Inc. | 3/28/23 | 23,293,554 |
| | | |
| Galvanize Therapeutics Series B | 3/29/22 | 4,419,746 |
| | | |
| Inscripta, Inc. Series E | 3/30/21 | 7,297,324 |
| | | |
| Omada Health, Inc. Series E | 12/22/21 | 8,734,725 |
| | | |
| Saluda Medical, Inc. Series E | 4/06/23 | 6,310,345 |
| | | |
| The Beauty Health Co. | 12/08/20 | 10,000,000 |
| | | |
| Thriveworks TopCo LLC Series B | 7/23/21 - 2/25/22 | 9,402,913 |
| | | |
| Wugen, Inc. Series B | 7/09/21 | 2,326,889 |
| | | |
Affiliated Central Funds
Fiscal year to date information regarding the Fund's investments in Fidelity Central Funds, including the ownership percentage, is presented below.
| Affiliate | Value, beginning of period ($) | Purchases ($) | Sales Proceeds ($) | Dividend Income ($) | Realized Gain (loss) ($) | Change in Unrealized appreciation (depreciation) ($) | Value, end of period ($) | % ownership, end of period |
| Fidelity Cash Central Fund 5.32% | 37,778,923 | 978,551,640 | 974,407,738 | 1,248,397 | - | - | 41,922,825 | 0.1% |
| Fidelity Securities Lending Cash Central Fund 5.32% | 346,068,627 | 1,272,404,583 | 1,357,541,677 | 658,716 | - | - | 260,931,533 | 0.9% |
| Total | 383,847,550 | 2,250,956,223 | 2,331,949,415 | 1,907,113 | - | - | 302,854,358 | |
| | | | | | | | | |
Amounts in the dividend income column in the above table include any capital gain distributions from underlying funds, which are presented in the corresponding line item in the Statement of Operations, if applicable.
Amounts in the dividend income column for Fidelity Securities Lending Cash Central Fund represents the income earned on investing cash collateral, less rebates paid to borrowers and any lending agent fees associated with the loan, plus any premium payments received for lending certain types of securities.
Amounts included in the purchases and sales proceeds columns may include in-kind transactions, if applicable.
Investment Valuation
The following is a summary of the inputs used, as of July 31, 2023, involving the Fund's assets and liabilities carried at fair value. The inputs or methodology used for valuing securities may not be an indication of the risk associated with investing in those securities. For more information on valuation inputs, and their aggregation into the levels used below, please refer to the Investment Valuation section in the accompanying Notes to Financial Statements.
| Valuation Inputs at Reporting Date: |
| Description | Total ($) | Level 1 ($) | Level 2 ($) | Level 3 ($) |
Investments in Securities: | | | | |
|
| Common Stocks | 5,590,146,489 | 5,349,405,780 | 234,591,752 | 6,148,957 |
|
| Preferred Stocks | 71,533,558 | - | - | 71,533,558 |
|
| Money Market Funds | 302,854,358 | 302,854,358 | - | - |
| Total Investments in Securities: | 5,964,534,405 | 5,652,260,138 | 234,591,752 | 77,682,515 |
The following is a reconciliation of Investments in Securities for which Level 3 inputs were used in determining value:
| |
| Investments in Securities: | |
| Preferred Stock | | | |
| Beginning Balance | $ | 73,588,926 | |
| Net Realized Gain (Loss) on Investment Securities | | - | |
| Net Unrealized Gain (Loss) on Investment Securities | | (8,394,087) | |
| Cost of Purchases | | 6,338,719 | |
| Proceeds of Sales | | - | |
| Amortization/Accretion | | - | |
| Transfers into Level 3 | | - | |
| Transfers out of Level 3 | | - | |
| Ending Balance | $ | 71,533,558 | |
| The change in unrealized gain (loss) for the period attributable to Level 3 securities held at July 31, 2023 | $ | (8,394,087) | |
| Other Investments in Securities | | | |
| Beginning Balance | $ | - | |
| Net Realized Gain (Loss) on Investment Securities | | - | |
| Net Unrealized Gain (Loss) on Investment Securities | | - | |
| Cost of Purchases | | 6,148,957 | |
| Proceeds of Sales | | - | |
| Amortization/Accretion | | - | |
| Transfers into Level 3 | | - | |
| Transfers out of Level 3 | | - | |
| Ending Balance | $ | 6,148,957 | |
| The change in unrealized gain (loss) for the period attributable to Level 3 securities held at July 31, 2023 | $ | - | |
| The information used in the above reconciliation represents fiscal year to date activity for any Investments in Securities identified as using Level 3 inputs at either the beginning or the end of the current fiscal period. Cost of purchases and proceeds of sales may include securities received and/or delivered through in-kind transactions, corporate actions or exchanges. Transfers into Level 3 were attributable to a lack of observable market data resulting from decreases in market activity, decreases in liquidity, security restructurings or corporate actions. Transfers out of Level 3 were attributable to observable market data becoming available for those securities. Transfers in or out of Level 3 represent the beginning value of any Security or Instrument where a change in the pricing level occurred from the beginning to the end of the period. Realized and unrealized gains (losses) disclosed in the reconciliation are included in Net Gain (Loss) on the Fund's Statement of Operations. | |
Fidelity Advisor® Health Care Fund
| Statement of Assets and Liabilities |
| | | | July 31, 2023 |
| | | | | |
| Assets | | | | |
| Investment in securities, at value (including securities loaned of $258,569,298) - See accompanying schedule: | | | | |
Unaffiliated issuers (cost $3,904,911,698) | $ | 5,661,680,047 | | |
Fidelity Central Funds (cost $302,854,358) | | 302,854,358 | | |
| | | | | |
| | | | | |
| Total Investment in Securities (cost $4,207,766,056) | | | $ | 5,964,534,405 |
| Foreign currency held at value (cost $261) | | | | 259 |
| Receivable for investments sold | | | | 56,167,179 |
| Receivable for fund shares sold | | | | 3,018,188 |
| Dividends receivable | | | | 1,796,640 |
| Distributions receivable from Fidelity Central Funds | | | | 143,510 |
| Prepaid expenses | | | | 16,189 |
Total assets | | | | 6,025,676,370 |
| Liabilities | | | | |
| Payable to custodian bank | $ | 135,000 | | |
| Payable for investments purchased | | 82,641,687 | | |
| Payable for fund shares redeemed | | 5,930,387 | | |
| Accrued management fee | | 2,456,749 | | |
| Distribution and service plan fees payable | | 752,968 | | |
| Other affiliated payables | | 811,202 | | |
| Other payables and accrued expenses | | 89,904 | | |
| Collateral on securities loaned | | 260,929,655 | | |
| Total Liabilities | | | | 353,747,552 |
| Net Assets | | | $ | 5,671,928,818 |
| Net Assets consist of: | | | | |
| Paid in capital | | | $ | 3,969,267,624 |
| Total accumulated earnings (loss) | | | | 1,702,661,194 |
| Net Assets | | | $ | 5,671,928,818 |
| | | | | |
| Net Asset Value and Maximum Offering Price | | | | |
| Class A : | | | | |
Net Asset Value and redemption price per share ($1,535,211,649 ÷ 25,704,497 shares)(a) | | | $ | 59.73 |
| Maximum offering price per share (100/94.25 of $59.73) | | | $ | 63.37 |
| Class M : | | | | |
Net Asset Value and redemption price per share ($315,963,116 ÷ 5,789,144 shares)(a) | | | $ | 54.58 |
| Maximum offering price per share (100/96.50 of $54.58) | | | $ | 56.56 |
| Class C : | | | | |
Net Asset Value and offering price per share ($365,164,822 ÷ 8,250,033 shares)(a) | | | $ | 44.26 |
| Class I : | | | | |
Net Asset Value, offering price and redemption price per share ($2,593,538,489 ÷ 39,074,500 shares) | | | $ | 66.37 |
| Class Z : | | | | |
Net Asset Value, offering price and redemption price per share ($862,050,742 ÷ 12,950,974 shares) | | | $ | 66.56 |
(a)Redemption price per share is equal to net asset value less any applicable contingent deferred sales charge. |
| Statement of Operations |
| | | | Year ended July 31, 2023 |
| Investment Income | | | | |
| Dividends | | | $ | 30,175,469 |
| Income from Fidelity Central Funds (including $658,716 from security lending) | | | | 1,907,113 |
| Total Income | | | | 32,082,582 |
| Expenses | | | | |
| Management fee | $ | 30,264,359 | | |
| Transfer agent fees | | 8,896,994 | | |
| Distribution and service plan fees | | 9,720,365 | | |
| Accounting fees | | 989,429 | | |
| Custodian fees and expenses | | 140,096 | | |
| Independent trustees' fees and expenses | | 29,701 | | |
| Registration fees | | 158,778 | | |
| Audit | | 53,811 | | |
| Legal | | 6,938 | | |
| Interest | | 8,038 | | |
| Miscellaneous | | 37,723 | | |
| Total expenses before reductions | | 50,306,232 | | |
| Expense reductions | | (290,741) | | |
| Total expenses after reductions | | | | 50,015,491 |
| Net Investment income (loss) | | | | (17,932,909) |
| Realized and Unrealized Gain (Loss) | | | | |
| Net realized gain (loss) on: | | | | |
| Investment Securities: | | | | |
| Unaffiliated issuers | | 45,705,363 | | |
| Foreign currency transactions | | (144,325) | | |
| Total net realized gain (loss) | | | | 45,561,038 |
| Change in net unrealized appreciation (depreciation) on: | | | | |
| Investment Securities: | | | | |
| Unaffiliated issuers | | 188,189,867 | | |
| Assets and liabilities in foreign currencies | | 78,904 | | |
| Total change in net unrealized appreciation (depreciation) | | | | 188,268,771 |
| Net gain (loss) | | | | 233,829,809 |
| Net increase (decrease) in net assets resulting from operations | | | $ | 215,896,900 |
| Statement of Changes in Net Assets |
| |
| | Year ended July 31, 2023 | | Year ended July 31, 2022 |
| Increase (Decrease) in Net Assets | | | | |
| Operations | | | | |
| Net investment income (loss) | $ | (17,932,909) | $ | (21,390,615) |
| Net realized gain (loss) | | 45,561,038 | | 27,533,492 |
| Change in net unrealized appreciation (depreciation) | | 188,268,771 | | (866,631,680) |
| Net increase (decrease) in net assets resulting from operations | | 215,896,900 | | (860,488,803) |
| Distributions to shareholders | | - | | (421,462,568) |
| | | | | |
| Share transactions - net increase (decrease) | | (425,461,599) | | (34,838,590) |
| Total increase (decrease) in net assets | | (209,564,699) | | (1,316,789,961) |
| | | | | |
| Net Assets | | | | |
| Beginning of period | | 5,881,493,517 | | 7,198,283,478 |
| End of period | $ | 5,671,928,818 | $ | 5,881,493,517 |
| | | | | |
| | | | | |
| Fidelity Advisor® Health Care Fund Class A |
| |
| Years ended July 31, | | 2023 | | 2022 | | 2021 | | 2020 | | 2019 |
Selected Per-Share Data | | | | | | | | | | |
| Net asset value, beginning of period | $ | 57.59 | $ | 69.58 | $ | 61.07 | $ | 49.21 | $ | 50.14 |
| Income from Investment Operations | | | | | | | | | | |
Net investment income (loss) A,B | | (.24) | | (.26) | | (.26) | | (.04) | | (.07) |
| Net realized and unrealized gain (loss) | | 2.38 | | (7.58) | | 12.55 | | 12.08 | | 1.36 |
| Total from investment operations | | 2.14 | | (7.84) | | 12.29 | | 12.04 | | 1.29 |
| Distributions from net investment income | | - | | - | | (.16) | | - | | - |
| Distributions from net realized gain | | - | | (4.15) | | (3.62) | | (.18) | | (2.22) |
| Total distributions | | - | | (4.15) | | (3.78) | | (.18) | | (2.22) |
| Net asset value, end of period | $ | 59.73 | $ | 57.59 | $ | 69.58 | $ | 61.07 | $ | 49.21 |
Total Return C,D | | 3.72% | | (11.90)% | | 20.70% | | 24.50% | | 2.87% |
Ratios to Average Net Assets B,E,F | | | | | | | | | | |
| Expenses before reductions | | .98% | | .97% | | .98% | | 1.01% | | 1.02% |
| Expenses net of fee waivers, if any | | .97% | | .97% | | .98% | | 1.00% | | 1.02% |
| Expenses net of all reductions | | .97% | | .97% | | .98% | | 1.00% | | 1.02% |
| Net investment income (loss) | | (.42)% | | (.42)% | | (.39)% | | (.07)% | | (.14)% |
| Supplemental Data | | | | | | | | | | |
| Net assets, end of period (000 omitted) | $ | 1,535,212 | $ | 1,488,238 | $ | 1,735,235 | $ | 1,372,082 | $ | 1,121,411 |
Portfolio turnover rate G | | 47% | | 33% | | 38% | | 53% H | | 45% |
ACalculated based on average shares outstanding during the period.
BNet investment income (loss) is affected by the timing of the declaration of dividends by any underlying mutual funds or exchange-traded funds (ETFs). Net investment income (loss) of any mutual funds or ETFs is not included in the Fund's net investment income (loss) ratio.
CTotal returns would have been lower if certain expenses had not been reduced during the applicable periods shown.
DTotal returns do not include the effect of the sales charges.
EFees and expenses of any underlying mutual funds or exchange-traded funds (ETFs) are not included in the Fund's expense ratio. The Fund indirectly bears its proportionate share of these expenses. For additional expense information related to investments in Fidelity Central Funds, please refer to the "Investments in Fidelity Central Funds" note found in the Notes to Financial Statements section of the most recent Annual or Semi-Annual report.
FExpense ratios reflect operating expenses of the class. Expenses before reductions do not reflect amounts reimbursed, waived, or reduced through arrangements with the investment adviser, brokerage services, or other offset arrangements, if applicable, and do not represent the amount paid by the class during periods when reimbursements, waivers or reductions occur.
GAmount does not include the portfolio activity of any underlying mutual funds or exchange-traded funds (ETFs).
HPortfolio turnover rate excludes securities received or delivered in-kind.
| Fidelity Advisor® Health Care Fund Class M |
| |
| Years ended July 31, | | 2023 | | 2022 | | 2021 | | 2020 | | 2019 |
Selected Per-Share Data | | | | | | | | | | |
| Net asset value, beginning of period | $ | 52.76 | $ | 64.25 | $ | 56.62 | $ | 45.75 | $ | 46.89 |
| Income from Investment Operations | | | | | | | | | | |
Net investment income (loss) A,B | | (.36) | | (.38) | | (.39) | | (.16) | | (.18) |
| Net realized and unrealized gain (loss) | | 2.18 | | (6.96) | | 11.61 | | 11.21 | | 1.26 |
| Total from investment operations | | 1.82 | | (7.34) | | 11.22 | | 11.05 | | 1.08 |
| Distributions from net investment income | | - | | - | | (.02) | | - | | - |
| Distributions from net realized gain | | - | | (4.15) | | (3.57) | | (.18) | | (2.22) |
| Total distributions | | - | | (4.15) | | (3.59) | | (.18) | | (2.22) |
| Net asset value, end of period | $ | 54.58 | $ | 52.76 | $ | 64.25 | $ | 56.62 | $ | 45.75 |
Total Return C,D | | 3.45% | | (12.12)% | | 20.39% | | 24.19% | | 2.61% |
Ratios to Average Net Assets B,E,F | | | | | | | | | | |
| Expenses before reductions | | 1.23% | | 1.22% | | 1.23% | | 1.26% | | 1.28% |
| Expenses net of fee waivers, if any | | 1.23% | | 1.22% | | 1.23% | | 1.26% | | 1.28% |
| Expenses net of all reductions | | 1.23% | | 1.22% | | 1.23% | | 1.26% | | 1.28% |
| Net investment income (loss) | | (.67)% | | (.67)% | | (.65)% | | (.33)% | | (.40)% |
| Supplemental Data | | | | | | | | | | |
| Net assets, end of period (000 omitted) | $ | 315,963 | $ | 330,452 | $ | 402,175 | $ | 349,280 | $ | 306,758 |
Portfolio turnover rate G | | 47% | | 33% | | 38% | | 53% H | | 45% |
ACalculated based on average shares outstanding during the period.
BNet investment income (loss) is affected by the timing of the declaration of dividends by any underlying mutual funds or exchange-traded funds (ETFs). Net investment income (loss) of any mutual funds or ETFs is not included in the Fund's net investment income (loss) ratio.
CTotal returns would have been lower if certain expenses had not been reduced during the applicable periods shown.
DTotal returns do not include the effect of the sales charges.
EFees and expenses of any underlying mutual funds or exchange-traded funds (ETFs) are not included in the Fund's expense ratio. The Fund indirectly bears its proportionate share of these expenses. For additional expense information related to investments in Fidelity Central Funds, please refer to the "Investments in Fidelity Central Funds" note found in the Notes to Financial Statements section of the most recent Annual or Semi-Annual report.
FExpense ratios reflect operating expenses of the class. Expenses before reductions do not reflect amounts reimbursed, waived, or reduced through arrangements with the investment adviser, brokerage services, or other offset arrangements, if applicable, and do not represent the amount paid by the class during periods when reimbursements, waivers or reductions occur.
GAmount does not include the portfolio activity of any underlying mutual funds or exchange-traded funds (ETFs).
HPortfolio turnover rate excludes securities received or delivered in-kind.
| Fidelity Advisor® Health Care Fund Class C |
| |
| Years ended July 31, | | 2023 | | 2022 | | 2021 | | 2020 | | 2019 |
Selected Per-Share Data | | | | | | | | | | |
| Net asset value, beginning of period | $ | 43.00 | $ | 53.40 | $ | 47.63 | $ | 38.70 | $ | 40.21 |
| Income from Investment Operations | | | | | | | | | | |
Net investment income (loss) A,B | | (.51) | | (.55) | | (.58) | | (.34) | | (.34) |
| Net realized and unrealized gain (loss) | | 1.77 | | (5.70) | | 9.71 | | 9.45 | | 1.05 |
| Total from investment operations | | 1.26 | | (6.25) | | 9.13 | | 9.11 | | .71 |
| Distributions from net realized gain | | - | | (4.15) | | (3.36) | | (.18) | | (2.22) |
| Total distributions | | - | | (4.15) | | (3.36) | | (.18) | | (2.22) |
| Net asset value, end of period | $ | 44.26 | $ | 43.00 | $ | 53.40 | $ | 47.63 | $ | 38.70 |
Total Return C,D | | 2.93% | | (12.56)% | | 19.78% | | 23.58% | | 2.10% |
Ratios to Average Net Assets B,E,F | | | | | | | | | | |
| Expenses before reductions | | 1.73% | | 1.72% | | 1.73% | | 1.76% | | 1.77% |
| Expenses net of fee waivers, if any | | 1.73% | | 1.72% | | 1.73% | | 1.76% | | 1.77% |
| Expenses net of all reductions | | 1.73% | | 1.72% | | 1.73% | | 1.75% | | 1.77% |
| Net investment income (loss) | | (1.17)% | | (1.17)% | | (1.15)% | | (.82)% | | (.88)% |
| Supplemental Data | | | | | | | | | | |
| Net assets, end of period (000 omitted) | $ | 365,165 | $ | 501,742 | $ | 697,626 | $ | 654,487 | $ | 585,093 |
Portfolio turnover rate G | | 47% | | 33% | | 38% | | 53% H | | 45% |
ACalculated based on average shares outstanding during the period.
BNet investment income (loss) is affected by the timing of the declaration of dividends by any underlying mutual funds or exchange-traded funds (ETFs). Net investment income (loss) of any mutual funds or ETFs is not included in the Fund's net investment income (loss) ratio.
CTotal returns would have been lower if certain expenses had not been reduced during the applicable periods shown.
DTotal returns do not include the effect of the contingent deferred sales charge.
EFees and expenses of any underlying mutual funds or exchange-traded funds (ETFs) are not included in the Fund's expense ratio. The Fund indirectly bears its proportionate share of these expenses. For additional expense information related to investments in Fidelity Central Funds, please refer to the "Investments in Fidelity Central Funds" note found in the Notes to Financial Statements section of the most recent Annual or Semi-Annual report.
FExpense ratios reflect operating expenses of the class. Expenses before reductions do not reflect amounts reimbursed, waived, or reduced through arrangements with the investment adviser, brokerage services, or other offset arrangements, if applicable, and do not represent the amount paid by the class during periods when reimbursements, waivers or reductions occur.
GAmount does not include the portfolio activity of any underlying mutual funds or exchange-traded funds (ETFs).
HPortfolio turnover rate excludes securities received or delivered in-kind.
| Fidelity Advisor® Health Care Fund Class I |
| |
| Years ended July 31, | | 2023 | | 2022 | | 2021 | | 2020 | | 2019 |
Selected Per-Share Data | | �� | | | | | | | | |
| Net asset value, beginning of period | $ | 63.83 | $ | 76.48 | $ | 66.81 | $ | 53.77 | $ | 54.43 |
| Income from Investment Operations | | | | | | | | | | |
Net investment income (loss) A,B | | (.10) | | (.11) | | (.10) | | .11 | | .07 |
| Net realized and unrealized gain (loss) | | 2.64 | | (8.39) | | 13.76 | | 13.22 | | 1.49 |
| Total from investment operations | | 2.54 | | (8.50) | | 13.66 | | 13.33 | | 1.56 |
| Distributions from net investment income | | - | | - | | (.30) | | - | | - |
| Distributions from net realized gain | | - | | (4.15) | | (3.69) | | (.29) | | (2.22) |
| Total distributions | | - | | (4.15) | | (3.99) | | (.29) | | (2.22) |
| Net asset value, end of period | $ | 66.37 | $ | 63.83 | $ | 76.48 | $ | 66.81 | $ | 53.77 |
Total Return C | | 3.98% | | (11.68)% | | 21.01% | | 24.84% | | 3.14% |
Ratios to Average Net Assets B,D,E | | | | | | | | | | |
| Expenses before reductions | | .72% | | .71% | | .72% | | .74% | | .76% |
| Expenses net of fee waivers, if any | | .71% | | .71% | | .72% | | .74% | | .76% |
| Expenses net of all reductions | | .71% | | .71% | | .72% | | .74% | | .76% |
| Net investment income (loss) | | (.16)% | | (.16)% | | (.13)% | | .19% | | .13% |
| Supplemental Data | | | | | | | | | | |
| Net assets, end of period (000 omitted) | $ | 2,593,539 | $ | 2,743,740 | $ | 3,410,787 | $ | 2,546,323 | $ | 1,783,417 |
Portfolio turnover rate F | | 47% | | 33% | | 38% | | 53% G | | 45% |
ACalculated based on average shares outstanding during the period.
BNet investment income (loss) is affected by the timing of the declaration of dividends by any underlying mutual funds or exchange-traded funds (ETFs). Net investment income (loss) of any mutual funds or ETFs is not included in the Fund's net investment income (loss) ratio.
CTotal returns would have been lower if certain expenses had not been reduced during the applicable periods shown.
DFees and expenses of any underlying mutual funds or exchange-traded funds (ETFs) are not included in the Fund's expense ratio. The Fund indirectly bears its proportionate share of these expenses. For additional expense information related to investments in Fidelity Central Funds, please refer to the "Investments in Fidelity Central Funds" note found in the Notes to Financial Statements section of the most recent Annual or Semi-Annual report.
EExpense ratios reflect operating expenses of the class. Expenses before reductions do not reflect amounts reimbursed, waived, or reduced through arrangements with the investment adviser, brokerage services, or other offset arrangements, if applicable, and do not represent the amount paid by the class during periods when reimbursements, waivers or reductions occur.
FAmount does not include the portfolio activity of any underlying mutual funds or exchange-traded funds (ETFs).
GPortfolio turnover rate excludes securities received or delivered in-kind.
| Fidelity Advisor® Health Care Fund Class Z |
| |
| Years ended July 31, | | 2023 | | 2022 | | 2021 | | 2020 | | 2019 A |
Selected Per-Share Data | | | | | | | | | | |
| Net asset value, beginning of period | $ | 63.93 | $ | 76.55 | $ | 66.88 | $ | 53.84 | $ | 57.87 |
| Income from Investment Operations | | | | | | | | | | |
Net investment income (loss) B,C | | (.02) | | (.03) | | (.01) | | .19 | | .13 |
| Net realized and unrealized gain (loss) | | 2.65 | | (8.38) | | 13.77 | | 13.22 | | (1.94) |
| Total from investment operations | | 2.63 | | (8.41) | | 13.76 | | 13.41 | | (1.81) |
| Distributions from net investment income | | - | | - | | (.37) | | - | | - |
| Distributions from net realized gain | | - | | (4.21) | | (3.73) | | (.37) | | (2.22) |
| Total distributions | | - | | (4.21) | | (4.09) D | | (.37) | | (2.22) |
| Net asset value, end of period | $ | 66.56 | $ | 63.93 | $ | 76.55 | $ | 66.88 | $ | 53.84 |
Total Return E,F | | 4.11% | | (11.56)% | | 21.15% | | 24.98% | | (2.86)% |
Ratios to Average Net Assets C,G,H | | | | | | | | | | |
| Expenses before reductions | | .59% | | .59% | | .60% | | .61% | | .62% I |
| Expenses net of fee waivers, if any | | .59% | | .59% | | .60% | | .61% | | .62% I |
| Expenses net of all reductions | | .59% | | .59% | | .59% | | .61% | | .62% I |
| Net investment income (loss) | | (.03)% | | (.04)% | | (.01)% | | .32% | | .30% I |
| Supplemental Data | | | | | | | | | | |
| Net assets, end of period (000 omitted) | $ | 862,051 | $ | 817,321 | $ | 952,460 | $ | 610,481 | $ | 238,873 |
Portfolio turnover rate J | | 47% | | 33% | | 38% | | 53% K | | 45% |
AFor the period October 2, 2018 (commencement of sale of shares) through July 31, 2019.
BCalculated based on average shares outstanding during the period.
CNet investment income (loss) is affected by the timing of the declaration of dividends by any underlying mutual funds or exchange-traded funds (ETFs). Net investment income (loss) of any mutual funds or ETFs is not included in the Fund's net investment income (loss) ratio.
DTotal distributions per share do not sum due to rounding.
ETotal returns for periods of less than one year are not annualized.
FTotal returns would have been lower if certain expenses had not been reduced during the applicable periods shown.
GFees and expenses of any underlying mutual funds or exchange-traded funds (ETFs) are not included in the Fund's expense ratio. The Fund indirectly bears its proportionate share of these expenses. For additional expense information related to investments in Fidelity Central Funds, please refer to the "Investments in Fidelity Central Funds" note found in the Notes to Financial Statements section of the most recent Annual or Semi-Annual report.
HExpense ratios reflect operating expenses of the class. Expenses before reductions do not reflect amounts reimbursed, waived, or reduced through arrangements with the investment adviser, brokerage services, or other offset arrangements, if applicable, and do not represent the amount paid by the class during periods when reimbursements, waivers or reductions occur.
IAnnualized.
JAmount does not include the portfolio activity of any underlying mutual funds or exchange-traded funds (ETFs).
KPortfolio turnover rate excludes securities received or delivered in-kind.
Average annual total return reflects the change in the value of an investment, assuming reinvestment of distributions from dividend income and capital gains (the profits earned upon the sale of securities that have grown in value, if any) and assuming a constant rate of performance each year. The hypothetical investment and the average annual total returns do not reflect the deduction of taxes that a shareholder would pay on fund distributions or the redemption of fund shares. During periods of reimbursement by Fidelity, a fund's total return will be greater than it would be had the reimbursement not occurred. How a fund did yesterday is no guarantee of how it will do tomorrow.
| Average Annual Total Returns |
| | | | |
Periods ended July 31, 2023 | Past 1 year | Past 5 years | Past 10 years |
Class A (incl. 5.75% sales charge) | 11.85% | 5.93% | 8.34% |
Class M (incl. 3.50% sales charge) | 14.25% | 6.15% | 8.31% |
Class C (incl. contingent deferred sales charge) | 16.81% | 6.38% | 8.32% |
| Class I | 19.02% | 7.48% | 9.27% |
| Class Z | 19.14% | 7.61% | 9.34% |
Class C shares' contingent deferred sales charges included in the past one year, past five years and past ten years total return figures are 1%, 0% and 0%, respectively.
The initial offering of Class Z shares took place on October 2, 2018. Returns prior to October 2, 2018, are those of Class I.
| $10,000 Over 10 Years |
| |
Let's say hypothetically that $10,000 was invested in Fidelity Advisor® Industrials Fund - Class A, a class of the fund, on July 31, 2013, and the current 5.75% sales charge was paid. The chart shows how the value of your investment would have changed, and also shows how the S&P 500® Index performed over the same period. |
|
|
Fidelity Advisor® Industrials Fund
Market Recap:
U.S. equities gained 13.02% for the 12 months ending July 31, 2023, according to the S&P 500® index, as continued global economic expansion, falling commodity prices and a slowing in the pace of inflation provided a favorable backdrop for higher-risk assets. Large-cap stocks spearheaded the rally, which was driven by the shares of a narrow set of mega-cap companies in the information technology and communication services sectors, largely due to exuberance related to generative artificial intelligence. Aggressive monetary tightening by the U.S. Federal Reserve continued amid consistent pressure on core inflation, a measure that excludes food and energy. Since March 2022, the Fed has hiked its benchmark interest rate 11 times. The latest bump came in late July, a fourth consecutive raise of a stepped down 25 basis points. The S&P 500® gained 3.21% in July, as a "soft landing" of the U.S. economy became the consensus view amid better-than-expected earnings, slowing inflation and easing financial conditions, bringing the index's year-to-date gain to 20.65%. July saw a continuance of the recent shift to wider market breadth and lower dispersion. For the full 12 months, value (+17%) handily topped growth (+8%) within the index. By sector, tech (+28%), communication services (+21%) and industrials (+17%) led, whereas real estate (-10%) lagged most, due to high borrowing costs, low home inventory and a deteriorating commercial property market.
Comments from Portfolio Manager David Wagner:
For the fiscal year ending July 31, 2023, the fund's share classes (excluding sales charges, if applicable) gained about 18% to 19%, versus 19.36% for the MSCI US IMI Industrials 25/50 Linked Index and 13.02% for the broad-based S&P 500® index. Relative to the MSCI sector index, stock picking in industrial machinery & supplies & components notably detracted from fund performance, as did non-index exposure to application software. Investment choices in trading companies & distributors further weighed on relative performance, as did construction machinery and heavy transportation equipment. The biggest individual relative detractor was our non-index stake in Roper Technologies (+1%), which was not held at period end. The second-largest relative detractor was an underweight in General Electric (+100%) -among the largest holdings at period end. This was an investment we established the past year. An overweight in Chart Industries (-22%) also detracted. Conversely, stock picking in aerospace & defense made the biggest contribution to performance versus the sector index, by far. Stock selection and an underweight in air freight & logistics also boosted the fund's relative performance. The combination of a sizable overweight and stock picking in cargo ground transportation was helpful as well. The top individual relative contributor was an overweight in Saia (+75%), one of our biggest holdings and an investment we established the past year. A second notable relative contributor was an overweight in FedEx (+50%), which was among our largest holdings and another position we established this period. An overweight in TransDigm (+48%) also helped. TransDigm was one of our biggest holdings. Notable changes in positioning include higher allocations to the building products and cargo ground transportation industries.
Note to Shareholders: On July 1, 2023, David Wagner assumed management responsibilities for the fund, succeeding Janet Glazer.
The views expressed above reflect those of the portfolio manager(s) only through the end of the period as stated on the cover of this report and do not necessarily represent the views of Fidelity or any other person in the Fidelity organization. Any such views are subject to change at any time based upon market or other conditions and Fidelity disclaims any responsibility to update such views. These views may not be relied on as investment advice and, because investment decisions for a Fidelity fund are based on numerous factors, may not be relied on as an indication of trading intent on behalf of any Fidelity fund.
Fidelity Advisor® Industrials Fund
Top Holdings (% of Fund's net assets) |
| |
| Union Pacific Corp. | 6.3 | |
| The Boeing Co. | 6.2 | |
| General Electric Co. | 5.7 | |
| FedEx Corp. | 4.9 | |
| Ingersoll Rand, Inc. | 4.4 | |
| Knight-Swift Transportation Holdings, Inc. Class A | 4.4 | |
| Parker Hannifin Corp. | 4.1 | |
| Fortive Corp. | 3.8 | |
| TransDigm Group, Inc. | 3.6 | |
| Howmet Aerospace, Inc. | 3.4 | |
| | 46.8 | |
| |
| Industries (% of Fund's net assets) |
| |
| Machinery | 21.6 | |
| Ground Transportation | 17.8 | |
| Aerospace & Defense | 15.2 | |
| Building Products | 11.0 | |
| Electrical Equipment | 7.9 | |
| Industrial Conglomerates | 5.7 | |
| Air Freight & Logistics | 4.9 | |
| Construction & Engineering | 4.3 | |
| Commercial Services & Supplies | 4.0 | |
| Trading Companies & Distributors | 3.0 | |
| Professional Services | 2.3 | |
| Construction Materials | 1.9 | |
| |
Fidelity Advisor® Industrials Fund
Showing Percentage of Net Assets
| Common Stocks - 99.6% |
| | | Shares | Value ($) |
| Aerospace & Defense - 15.2% | | | |
| Aerospace & Defense - 15.2% | | | |
| Howmet Aerospace, Inc. | | 376,758 | 19,267,404 |
| Lockheed Martin Corp. | | 25,020 | 11,168,177 |
| The Boeing Co. (a) | | 144,304 | 34,467,010 |
| TransDigm Group, Inc. | | 22,214 | 19,986,380 |
| | | | 84,888,971 |
| Air Freight & Logistics - 4.9% | | | |
| Air Freight & Logistics - 4.9% | | | |
| FedEx Corp. | | 100,800 | 27,210,960 |
| Building Products - 11.0% | | | |
| Building Products - 11.0% | | | |
| Carlisle Companies, Inc. | | 36,724 | 10,179,893 |
| Johnson Controls International PLC | | 242,757 | 16,883,749 |
| Owens Corning | | 32,500 | 4,549,675 |
| Simpson Manufacturing Co. Ltd. | | 82,679 | 13,063,282 |
| Trane Technologies PLC | | 84,200 | 16,792,848 |
| | | | 61,469,447 |
| Commercial Services & Supplies - 4.0% | | | |
| Environmental & Facilities Services - 4.0% | | | |
| GFL Environmental, Inc. | | 290,714 | 9,924,976 |
| Republic Services, Inc. | | 82,654 | 12,489,846 |
| | | | 22,414,822 |
| Construction & Engineering - 4.3% | | | |
| Construction & Engineering - 4.3% | | | |
| AECOM | | 140,858 | 12,254,646 |
| Willscot Mobile Mini Holdings (a) | | 247,400 | 11,862,830 |
| | | | 24,117,476 |
| Construction Materials - 1.9% | | | |
| Construction Materials - 1.9% | | | |
| Eagle Materials, Inc. | | 58,400 | 10,767,208 |
| Electrical Equipment - 7.9% | | | |
| Electrical Components & Equipment - 7.9% | | | |
| AMETEK, Inc. | | 63,634 | 10,092,352 |
| Eaton Corp. PLC | | 76,116 | 15,628,137 |
| Regal Rexnord Corp. | | 117,005 | 18,273,841 |
| | | | 43,994,330 |
| Ground Transportation - 17.8% | | | |
| Cargo Ground Transportation - 7.5% | | | |
| Knight-Swift Transportation Holdings, Inc. Class A | | 403,200 | 24,494,400 |
| Saia, Inc. (a) | | 41,500 | 17,560,310 |
| | | | 42,054,710 |
| Passenger Ground Transportation - 2.5% | | | |
| Uber Technologies, Inc. (a) | | 280,300 | 13,863,638 |
| Rail Transportation - 7.8% | | | |
| CSX Corp. | | 252,083 | 8,399,406 |
| Union Pacific Corp. | | 152,200 | 35,313,446 |
| | | | 43,712,852 |
TOTAL GROUND TRANSPORTATION | | | 99,631,200 |
| Industrial Conglomerates - 5.7% | | | |
| Industrial Conglomerates - 5.7% | | | |
| General Electric Co. | | 280,037 | 31,991,427 |
| Machinery - 21.6% | | | |
| Industrial Machinery & Supplies & Components - 21.6% | | | |
| Chart Industries, Inc. (a) | | 86,659 | 15,785,803 |
| Dover Corp. | | 124,800 | 18,217,056 |
| Fortive Corp. | | 271,275 | 21,254,396 |
| Ingersoll Rand, Inc. | | 376,943 | 24,603,070 |
| ITT, Inc. | | 176,609 | 17,590,256 |
| Parker Hannifin Corp. | | 56,513 | 23,170,895 |
| | | | 120,621,476 |
| Professional Services - 2.3% | | | |
| Research & Consulting Services - 2.3% | | | |
| Leidos Holdings, Inc. | | 137,800 | 12,888,434 |
| Trading Companies & Distributors - 3.0% | | | |
| Trading Companies & Distributors - 3.0% | | | |
| Beacon Roofing Supply, Inc. (a) | | 21,020 | 1,800,783 |
| W.W. Grainger, Inc. | | 19,900 | 14,695,951 |
| | | | 16,496,734 |
| TOTAL COMMON STOCKS (Cost $479,464,028) | | | 556,492,485 |
| | | | |
| Money Market Funds - 0.4% |
| | | Shares | Value ($) |
Fidelity Cash Central Fund 5.32% (b) (Cost $2,126,016) | | 2,125,591 | 2,126,016 |
| | | | |
| TOTAL INVESTMENT IN SECURITIES - 100.0% (Cost $481,590,044) | 558,618,501 |
NET OTHER ASSETS (LIABILITIES) - 0.0% | 103,596 |
| NET ASSETS - 100.0% | 558,722,097 |
| | |
Legend
| (b) | Affiliated fund that is generally available only to investment companies and other accounts managed by Fidelity Investments. The rate quoted is the annualized seven-day yield of the fund at period end. A complete unaudited listing of the fund's holdings as of its most recent quarter end is available upon request. In addition, each Fidelity Central Fund's financial statements, which are not covered by the Fund's Report of Independent Registered Public Accounting Firm, are available on the SEC's website or upon request. |
Affiliated Central Funds
Fiscal year to date information regarding the Fund's investments in Fidelity Central Funds, including the ownership percentage, is presented below.
| Affiliate | Value, beginning of period ($) | Purchases ($) | Sales Proceeds ($) | Dividend Income ($) | Realized Gain (loss) ($) | Change in Unrealized appreciation (depreciation) ($) | Value, end of period ($) | % ownership, end of period |
| Fidelity Cash Central Fund 5.32% | 1,335,472 | 252,503,075 | 251,712,531 | 93,271 | - | - | 2,126,016 | 0.0% |
| Fidelity Securities Lending Cash Central Fund 5.32% | 61,455,075 | 284,537,570 | 345,992,645 | 24,368 | - | - | - | 0.0% |
| Total | 62,790,547 | 537,040,645 | 597,705,176 | 117,639 | - | - | 2,126,016 | |
| | | | | | | | | |
Amounts in the dividend income column in the above table include any capital gain distributions from underlying funds, which are presented in the corresponding line item in the Statement of Operations, if applicable.
Amounts in the dividend income column for Fidelity Securities Lending Cash Central Fund represents the income earned on investing cash collateral, less rebates paid to borrowers and any lending agent fees associated with the loan, plus any premium payments received for lending certain types of securities.
Amounts included in the purchases and sales proceeds columns may include in-kind transactions, if applicable.
Investment Valuation
The following is a summary of the inputs used, as of July 31, 2023, involving the Fund's assets and liabilities carried at fair value. The inputs or methodology used for valuing securities may not be an indication of the risk associated with investing in those securities. For more information on valuation inputs, and their aggregation into the levels used below, please refer to the Investment Valuation section in the accompanying Notes to Financial Statements.
| Valuation Inputs at Reporting Date: |
| Description | Total ($) | Level 1 ($) | Level 2 ($) | Level 3 ($) |
Investments in Securities: | | | | |
|
| Common Stocks | 556,492,485 | 556,492,485 | - | - |
|
| Money Market Funds | 2,126,016 | 2,126,016 | - | - |
| Total Investments in Securities: | 558,618,501 | 558,618,501 | - | - |
Fidelity Advisor® Industrials Fund
| Statement of Assets and Liabilities |
| | | | July 31, 2023 |
| | | | | |
| Assets | | | | |
| Investment in securities, at value - See accompanying schedule: | | | | |
Unaffiliated issuers (cost $479,464,028) | $ | 556,492,485 | | |
Fidelity Central Funds (cost $2,126,016) | | 2,126,016 | | |
| | | | | |
| | | | | |
| Total Investment in Securities (cost $481,590,044) | | | $ | 558,618,501 |
| Cash | | | | 852 |
| Receivable for investments sold | | | | 3,486,722 |
| Receivable for fund shares sold | | | | 409,988 |
| Dividends receivable | | | | 20,458 |
| Distributions receivable from Fidelity Central Funds | | | | 15,129 |
| Prepaid expenses | | | | 2,717 |
Total assets | | | | 562,554,367 |
| Liabilities | | | | |
| Payable for investments purchased | $ | 2,678,351 | | |
| Payable for fund shares redeemed | | 697,068 | | |
| Accrued management fee | | 238,140 | | |
| Distribution and service plan fees payable | | 95,182 | | |
| Other affiliated payables | | 81,213 | | |
| Other payables and accrued expenses | | 42,316 | | |
| Total Liabilities | | | | 3,832,270 |
| Net Assets | | | $ | 558,722,097 |
| Net Assets consist of: | | | | |
| Paid in capital | | | $ | 444,122,608 |
| Total accumulated earnings (loss) | | | | 114,599,489 |
| Net Assets | | | $ | 558,722,097 |
| | | | | |
| Net Asset Value and Maximum Offering Price | | | | |
| Class A : | | | | |
Net Asset Value and redemption price per share ($226,370,317 ÷ 5,768,527 shares)(a) | | | $ | 39.24 |
| Maximum offering price per share (100/94.25 of $39.24) | | | $ | 41.63 |
| Class M : | | | | |
Net Asset Value and redemption price per share ($54,174,849 ÷ 1,434,326 shares)(a) | | | $ | 37.77 |
| Maximum offering price per share (100/96.50 of $37.77) | | | $ | 39.14 |
| Class C : | | | | |
Net Asset Value and offering price per share ($33,292,753 ÷ 1,025,049 shares)(a) | | | $ | 32.48 |
| Class I : | | | | |
Net Asset Value, offering price and redemption price per share ($140,764,336 ÷ 3,308,259 shares) | | | $ | 42.55 |
| Class Z : | | | | |
Net Asset Value, offering price and redemption price per share ($104,119,842 ÷ 2,448,819 shares) | | | $ | 42.52 |
(a)Redemption price per share is equal to net asset value less any applicable contingent deferred sales charge. |
| Statement of Operations |
| | | | Year ended July 31, 2023 |
| Investment Income | | | | |
| Dividends | | | $ | 3,775,281 |
| Special dividends | | | | 618,159 |
| Income from Fidelity Central Funds (including $24,368 from security lending) | | | | 117,639 |
| Total Income | | | | 4,511,079 |
| Expenses | | | | |
| Management fee | $ | 2,655,406 | | |
| Transfer agent fees | | 795,509 | | |
| Distribution and service plan fees | | 1,110,624 | | |
| Accounting fees | | 176,790 | | |
| Custodian fees and expenses | | 24,140 | | |
| Independent trustees' fees and expenses | | 2,583 | | |
| Registration fees | | 83,412 | | |
| Audit | | 49,397 | | |
| Legal | | 3,171 | | |
| Interest | | 7,425 | | |
| Miscellaneous | | 3,962 | | |
| Total expenses before reductions | | 4,912,419 | | |
| Expense reductions | | (26,212) | | |
| Total expenses after reductions | | | | 4,886,207 |
| Net Investment income (loss) | | | | (375,128) |
| Realized and Unrealized Gain (Loss) | | | | |
| Net realized gain (loss) on: | | | | |
| Investment Securities: | | | | |
| Unaffiliated issuers | | 47,412,157 | | |
| Redemptions in-kind | | 16,690,939 | | |
| Foreign currency transactions | | 3,395 | | |
| Total net realized gain (loss) | | | | 64,106,491 |
| Change in net unrealized appreciation (depreciation) on investment securities | | | | 32,286,790 |
| Net gain (loss) | | | | 96,393,281 |
| Net increase (decrease) in net assets resulting from operations | | | $ | 96,018,153 |
| Statement of Changes in Net Assets |
| |
| | Year ended July 31, 2023 | | Year ended July 31, 2022 |
| Increase (Decrease) in Net Assets | | | | |
| Operations | | | | |
| Net investment income (loss) | $ | (375,128) | $ | (1,839,444) |
| Net realized gain (loss) | | 64,106,491 | | 43,048,318 |
| Change in net unrealized appreciation (depreciation) | | 32,286,790 | | (88,564,513) |
| Net increase (decrease) in net assets resulting from operations | | 96,018,153 | | (47,355,639) |
| Distributions to shareholders | | (17,549,942) | | (121,901,185) |
| | | | | |
| Share transactions - net increase (decrease) | | 8,937,216 | | (34,069,737) |
| Total increase (decrease) in net assets | | 87,405,427 | | (203,326,561) |
| | | | | |
| Net Assets | | | | |
| Beginning of period | | 471,316,670 | | 674,643,231 |
| End of period | $ | 558,722,097 | $ | 471,316,670 |
| | | | | |
| | | | | |
| Fidelity Advisor® Industrials Fund Class A |
| |
| Years ended July 31, | | 2023 | | 2022 | | 2021 | | 2020 | | 2019 |
Selected Per-Share Data | | | | | | | | | | |
| Net asset value, beginning of period | $ | 34.23 | $ | 45.64 | $ | 33.85 | $ | 38.95 | $ | 42.62 |
| Income from Investment Operations | | | | | | | | | | |
Net investment income (loss) A,B | | (.05) C | | (.14) | | (.17) | | .18 D | | .24 |
| Net realized and unrealized gain (loss) | | 6.24 | | (2.62) | | 12.20 | | (2.46) | | (.02) |
| Total from investment operations | | 6.19 | | (2.76) | | 12.03 | | (2.28) | | .22 |
| Distributions from net investment income | | (.02) | | - | | - | | (.25) | | (.19) |
| Distributions from net realized gain | | (1.16) | | (8.65) | | (.24) | | (2.57) | | (3.70) |
| Total distributions | | (1.18) | | (8.65) | | (.24) | | (2.82) | | (3.89) |
| Net asset value, end of period | $ | 39.24 | $ | 34.23 | $ | 45.64 | $ | 33.85 | $ | 38.95 |
Total Return E,F | | 18.68% | | (7.79)% | | 35.63% | | (6.58)% | | 2.06% |
Ratios to Average Net Assets B,G,H | | | | | | | | | | |
| Expenses before reductions | | 1.03% | | 1.02% | | 1.03% | | 1.05% | | 1.04% |
| Expenses net of fee waivers, if any | | 1.03% | | 1.01% | | 1.03% | | 1.05% | | 1.04% |
| Expenses net of all reductions | | 1.03% | | 1.01% | | 1.01% | | 1.03% | | 1.03% |
| Net investment income (loss) | | (.13)% C | | (.35)% | | (.40)% | | .49% D | | .63% |
| Supplemental Data | | | | | | | | | | |
| Net assets, end of period (000 omitted) | $ | 226,370 | $ | 214,576 | $ | 264,130 | $ | 199,835 | $ | 268,483 |
Portfolio turnover rate I | | 189% J | | 106% | | 205% | | 219% J | | 125% |
ACalculated based on average shares outstanding during the period.
BNet investment income (loss) is affected by the timing of the declaration of dividends by any underlying mutual funds or exchange-traded funds (ETFs). Net investment income (loss) of any mutual funds or ETFs is not included in the Fund's net investment income (loss) ratio.
CNet investment income per share reflects one or more large, non-recurring dividend(s) which amounted to $.04 per share. Excluding such non-recurring dividend(s), the ratio of net investment income (loss) to average net assets would have been (.25)%.
DNet investment income per share reflects one or more large, non-recurring dividend(s) which amounted to $.07 per share. Excluding such non-recurring dividend(s), the ratio of net investment income (loss) to average net assets would have been .29%.
ETotal returns would have been lower if certain expenses had not been reduced during the applicable periods shown.
FTotal returns do not include the effect of the sales charges.
GFees and expenses of any underlying mutual funds or exchange-traded funds (ETFs) are not included in the Fund's expense ratio. The Fund indirectly bears its proportionate share of these expenses. For additional expense information related to investments in Fidelity Central Funds, please refer to the "Investments in Fidelity Central Funds" note found in the Notes to Financial Statements section of the most recent Annual or Semi-Annual report.
HExpense ratios reflect operating expenses of the class. Expenses before reductions do not reflect amounts reimbursed, waived, or reduced through arrangements with the investment adviser, brokerage services, or other offset arrangements, if applicable, and do not represent the amount paid by the class during periods when reimbursements, waivers or reductions occur.
IAmount does not include the portfolio activity of any underlying mutual funds or exchange-traded funds (ETFs).
JPortfolio turnover rate excludes securities received or delivered in-kind.
| Fidelity Advisor® Industrials Fund Class M |
| |
| Years ended July 31, | | 2023 | | 2022 | | 2021 | | 2020 | | 2019 |
Selected Per-Share Data | | | | | | | | | | |
| Net asset value, beginning of period | $ | 33.05 | $ | 44.31 | $ | 32.96 | $ | 37.99 | $ | 41.65 |
| Income from Investment Operations | | | | | | | | | | |
Net investment income (loss) A,B | | (.13) C | | (.23) | | (.27) | | .08 D | | .14 |
| Net realized and unrealized gain (loss) | | 6.01 | | (2.53) | | 11.86 | | (2.39) | | (.03) |
| Total from investment operations | | 5.88 | | (2.76) | | 11.59 | | (2.31) | | .11 |
| Distributions from net investment income | | - | | - | | - | | (.15) | | (.07) |
| Distributions from net realized gain | | (1.16) | | (8.50) | | (.24) | | (2.57) | | (3.70) |
| Total distributions | | (1.16) | | (8.50) | | (.24) | | (2.72) | | (3.77) |
| Net asset value, end of period | $ | 37.77 | $ | 33.05 | $ | 44.31 | $ | 32.96 | $ | 37.99 |
Total Return E,F | | 18.39% | | (8.03)% | | 35.25% | | (6.82)% | | 1.78% |
Ratios to Average Net Assets B,G,H | | | | | | | | | | |
| Expenses before reductions | | 1.29% | | 1.27% | | 1.29% | | 1.31% | | 1.31% |
| Expenses net of fee waivers, if any | | 1.28% | | 1.27% | | 1.29% | | 1.31% | | 1.30% |
| Expenses net of all reductions | | 1.28% | | 1.27% | | 1.27% | | 1.30% | | 1.30% |
| Net investment income (loss) | | (.38)% C | | (.60)% | | (.66)% | | .23% D | | .37% |
| Supplemental Data | | | | | | | | | | |
| Net assets, end of period (000 omitted) | $ | 54,175 | $ | 49,501 | $ | 56,680 | $ | 45,157 | $ | 61,570 |
Portfolio turnover rate I | | 189% J | | 106% | | 205% | | 219% J | | 125% |
ACalculated based on average shares outstanding during the period.
BNet investment income (loss) is affected by the timing of the declaration of dividends by any underlying mutual funds or exchange-traded funds (ETFs). Net investment income (loss) of any mutual funds or ETFs is not included in the Fund's net investment income (loss) ratio.
CNet investment income per share reflects one or more large, non-recurring dividend(s) which amounted to $.04 per share. Excluding such non-recurring dividend(s), the ratio of net investment income (loss) to average net assets would have been (.51)%.
DNet investment income per share reflects one or more large, non-recurring dividend(s) which amounted to $.07 per share. Excluding such non-recurring dividend(s), the ratio of net investment income (loss) to average net assets would have been .03%.
ETotal returns would have been lower if certain expenses had not been reduced during the applicable periods shown.
FTotal returns do not include the effect of the sales charges.
GFees and expenses of any underlying mutual funds or exchange-traded funds (ETFs) are not included in the Fund's expense ratio. The Fund indirectly bears its proportionate share of these expenses. For additional expense information related to investments in Fidelity Central Funds, please refer to the "Investments in Fidelity Central Funds" note found in the Notes to Financial Statements section of the most recent Annual or Semi-Annual report.
HExpense ratios reflect operating expenses of the class. Expenses before reductions do not reflect amounts reimbursed, waived, or reduced through arrangements with the investment adviser, brokerage services, or other offset arrangements, if applicable, and do not represent the amount paid by the class during periods when reimbursements, waivers or reductions occur.
IAmount does not include the portfolio activity of any underlying mutual funds or exchange-traded funds (ETFs).
JPortfolio turnover rate excludes securities received or delivered in-kind.
| Fidelity Advisor® Industrials Fund Class C |
| |
| Years ended July 31, | | 2023 | | 2022 | | 2021 | | 2020 | | 2019 |
Selected Per-Share Data | | | | | | | | | | |
| Net asset value, beginning of period | $ | 28.72 | $ | 39.46 | $ | 29.52 | $ | 34.27 | $ | 38.09 |
| Income from Investment Operations | | | | | | | | | | |
Net investment income (loss) A,B | | (.26) C | | (.37) | | (.41) | | (.08) D | | (.04) |
| Net realized and unrealized gain (loss) | | 5.18 | | (2.19) | | 10.59 | | (2.15) | | (.08) |
| Total from investment operations | | 4.92 | | (2.56) | | 10.18 | | (2.23) | | (.12) |
| Distributions from net investment income | | - | | - | | - | | (.03) | | - |
| Distributions from net realized gain | | (1.16) | | (8.18) | | (.24) | | (2.49) | | (3.70) |
| Total distributions | | (1.16) | | (8.18) | | (.24) | | (2.52) | | (3.70) |
| Net asset value, end of period | $ | 32.48 | $ | 28.72 | $ | 39.46 | $ | 29.52 | $ | 34.27 |
Total Return E,F | | 17.81% | | (8.48)% | | 34.58% | | (7.27)% | | 1.28% |
Ratios to Average Net Assets B,G,H | | | | | | | | | | |
| Expenses before reductions | | 1.79% | | 1.77% | | 1.79% | | 1.81% | | 1.80% |
| Expenses net of fee waivers, if any | | 1.78% | | 1.77% | | 1.79% | | 1.81% | | 1.80% |
| Expenses net of all reductions | | 1.78% | | 1.77% | | 1.77% | | 1.79% | | 1.79% |
| Net investment income (loss) | | (.89)% C | | (1.10)% | | (1.16)% | | (.26)% D | | (.12)% |
| Supplemental Data | | | | | | | | | | |
| Net assets, end of period (000 omitted) | $ | 33,293 | $ | 37,417 | $ | 55,576 | $ | 53,969 | $ | 90,512 |
Portfolio turnover rate I | | 189% J | | 106% | | 205% | | 219% J | | 125% |
ACalculated based on average shares outstanding during the period.
BNet investment income (loss) is affected by the timing of the declaration of dividends by any underlying mutual funds or exchange-traded funds (ETFs). Net investment income (loss) of any mutual funds or ETFs is not included in the Fund's net investment income (loss) ratio.
CNet investment income per share reflects one or more large, non-recurring dividend(s) which amounted to $.04 per share. Excluding such non-recurring dividend(s), the ratio of net investment income (loss) to average net assets would have been (1.01)%.
DNet investment income per share reflects one or more large, non-recurring dividend(s) which amounted to $.06 per share. Excluding such non-recurring dividend(s), the ratio of net investment income (loss) to average net assets would have been (.46)%.
ETotal returns would have been lower if certain expenses had not been reduced during the applicable periods shown.
FTotal returns do not include the effect of the contingent deferred sales charge.
GFees and expenses of any underlying mutual funds or exchange-traded funds (ETFs) are not included in the Fund's expense ratio. The Fund indirectly bears its proportionate share of these expenses. For additional expense information related to investments in Fidelity Central Funds, please refer to the "Investments in Fidelity Central Funds" note found in the Notes to Financial Statements section of the most recent Annual or Semi-Annual report.
HExpense ratios reflect operating expenses of the class. Expenses before reductions do not reflect amounts reimbursed, waived, or reduced through arrangements with the investment adviser, brokerage services, or other offset arrangements, if applicable, and do not represent the amount paid by the class during periods when reimbursements, waivers or reductions occur.
IAmount does not include the portfolio activity of any underlying mutual funds or exchange-traded funds (ETFs).
JPortfolio turnover rate excludes securities received or delivered in-kind.
| Fidelity Advisor® Industrials Fund Class I |
| |
| Years ended July 31, | | 2023 | | 2022 | | 2021 | | 2020 | | 2019 |
Selected Per-Share Data | | | | | | | | | | |
| Net asset value, beginning of period | $ | 36.95 | $ | 48.64 | $ | 35.97 | $ | 41.20 | $ | 44.85 |
| Income from Investment Operations | | | | | | | | | | |
Net investment income (loss) A,B | | .05 C | | (.03) | | (.06) | | .29 D | | .37 |
| Net realized and unrealized gain (loss) | | 6.77 | | (2.84) | | 12.97 | | (2.60) | | (.02) |
| Total from investment operations | | 6.82 | | (2.87) | | 12.91 | | (2.31) | | .35 |
| Distributions from net investment income | | (.06) | | - | | - | | (.35) | | (.30) |
| Distributions from net realized gain | | (1.16) | | (8.82) | | (.24) | | (2.57) | | (3.70) |
| Total distributions | | (1.22) | | (8.82) | | (.24) | | (2.92) | | (4.00) |
| Net asset value, end of period | $ | 42.55 | $ | 36.95 | $ | 48.64 | $ | 35.97 | $ | 41.20 |
Total Return E | | 19.02% | | (7.55)% | | 35.98% | | (6.32)% | | 2.31% |
Ratios to Average Net Assets B,F,G | | | | | | | | | | |
| Expenses before reductions | | .76% | | .75% | | .76% | | .78% | | .78% |
| Expenses net of fee waivers, if any | | .76% | | .75% | | .76% | | .78% | | .77% |
| Expenses net of all reductions | | .76% | | .75% | | .74% | | .76% | | .77% |
| Net investment income (loss) | | .14% C | | (.08)% | | (.14)% | | .76% D | | .90% |
| Supplemental Data | | | | | | | | | | |
| Net assets, end of period (000 omitted) | $ | 140,764 | $ | 145,849 | $ | 248,090 | $ | 123,603 | $ | 219,218 |
Portfolio turnover rate H | | 189% I | | 106% | | 205% | | 219% I | | 125% |
ACalculated based on average shares outstanding during the period.
BNet investment income (loss) is affected by the timing of the declaration of dividends by any underlying mutual funds or exchange-traded funds (ETFs). Net investment income (loss) of any mutual funds or ETFs is not included in the Fund's net investment income (loss) ratio.
CNet investment income per share reflects one or more large, non-recurring dividend(s) which amounted to $.05 per share. Excluding such non-recurring dividend(s), the ratio of net investment income (loss) to average net assets would have been .02%.
DNet investment income per share reflects one or more large, non-recurring dividend(s) which amounted to $.08 per share. Excluding such non-recurring dividend(s), the ratio of net investment income (loss) to average net assets would have been .56%.
ETotal returns would have been lower if certain expenses had not been reduced during the applicable periods shown.
FFees and expenses of any underlying mutual funds or exchange-traded funds (ETFs) are not included in the Fund's expense ratio. The Fund indirectly bears its proportionate share of these expenses. For additional expense information related to investments in Fidelity Central Funds, please refer to the "Investments in Fidelity Central Funds" note found in the Notes to Financial Statements section of the most recent Annual or Semi-Annual report.
GExpense ratios reflect operating expenses of the class. Expenses before reductions do not reflect amounts reimbursed, waived, or reduced through arrangements with the investment adviser, brokerage services, or other offset arrangements, if applicable, and do not represent the amount paid by the class during periods when reimbursements, waivers or reductions occur.
HAmount does not include the portfolio activity of any underlying mutual funds or exchange-traded funds (ETFs).
IPortfolio turnover rate excludes securities received or delivered in-kind.
| Fidelity Advisor® Industrials Fund Class Z |
| |
| Years ended July 31, | | 2023 | | 2022 | | 2021 | | 2020 | | 2019 A |
Selected Per-Share Data | | | | | | | | | | |
| Net asset value, beginning of period | $ | 36.91 | $ | 48.61 | $ | 35.90 | $ | 41.15 | $ | 46.84 |
| Income from Investment Operations | | | | | | | | | | |
Net investment income (loss) B,C | | .10 D | | .02 | | - E | | .34 F | | .34 |
| Net realized and unrealized gain (loss) | | 6.75 | | (2.83) | | 12.95 | | (2.60) | | (1.94) |
| Total from investment operations | | 6.85 | | (2.81) | | 12.95 | | (2.26) | | (1.60) |
| Distributions from net investment income | | (.08) | | - | | - | | (.42) | | (.39) |
| Distributions from net realized gain | | (1.16) | | (8.89) | | (.24) | | (2.57) | | (3.70) |
| Total distributions | | (1.24) | | (8.89) | | (.24) | | (2.99) | | (4.09) |
| Net asset value, end of period | $ | 42.52 | $ | 36.91 | $ | 48.61 | $ | 35.90 | $ | 41.15 |
Total Return G,H | | 19.14% | | (7.42)% | | 36.16% | | (6.21)% | | (1.92)% |
Ratios to Average Net Assets C,I,J | | | | | | | | | | |
| Expenses before reductions | | .64% | | .63% | | .64% | | .65% | | .64% K |
| Expenses net of fee waivers, if any | | .63% | | .62% | | .64% | | .65% | | .64% K |
| Expenses net of all reductions | | .63% | | .62% | | .62% | | .63% | | .64% K |
| Net investment income (loss) | | .26% D | | .04% | | (.01)% | | .89% F | | 1.04% K |
| Supplemental Data | | | | | | | | | | |
| Net assets, end of period (000 omitted) | $ | 104,120 | $ | 23,974 | $ | 50,167 | $ | 29,168 | $ | 11,077 |
Portfolio turnover rate L | | 189% M | | 106% | | 205% | | 219% M | | 125% |
AFor the period October 2, 2018 (commencement of sale of shares) through July 31, 2019.
BCalculated based on average shares outstanding during the period.
CNet investment income (loss) is affected by the timing of the declaration of dividends by any underlying mutual funds or exchange-traded funds (ETFs). Net investment income (loss) of any mutual funds or ETFs is not included in the Fund's net investment income (loss) ratio.
DNet investment income per share reflects one or more large, non-recurring dividend(s) which amounted to $.05 per share. Excluding such non-recurring dividend(s), the ratio of net investment income (loss) to average net assets would have been .14%.
EAmount represents less than $.005 per share.
FNet investment income per share reflects one or more large, non-recurring dividend(s) which amounted to $.08 per share. Excluding such non-recurring dividend(s), the ratio of net investment income (loss) to average net assets would have been .69%.
GTotal returns for periods of less than one year are not annualized.
HTotal returns would have been lower if certain expenses had not been reduced during the applicable periods shown.
IFees and expenses of any underlying mutual funds or exchange-traded funds (ETFs) are not included in the Fund's expense ratio. The Fund indirectly bears its proportionate share of these expenses. For additional expense information related to investments in Fidelity Central Funds, please refer to the "Investments in Fidelity Central Funds" note found in the Notes to Financial Statements section of the most recent Annual or Semi-Annual report.
JExpense ratios reflect operating expenses of the class. Expenses before reductions do not reflect amounts reimbursed, waived, or reduced through arrangements with the investment adviser, brokerage services, or other offset arrangements, if applicable, and do not represent the amount paid by the class during periods when reimbursements, waivers or reductions occur.
KAnnualized.
LAmount does not include the portfolio activity of any underlying mutual funds or exchange-traded funds (ETFs).
MPortfolio turnover rate excludes securities received or delivered in-kind.
Average annual total return reflects the change in the value of an investment, assuming reinvestment of distributions from dividend income and capital gains (the profits earned upon the sale of securities that have grown in value, if any) and assuming a constant rate of performance each year. The hypothetical investment and the average annual total returns do not reflect the deduction of taxes that a shareholder would pay on fund distributions or the redemption of fund shares. During periods of reimbursement by Fidelity, a fund's total return will be greater than it would be had the reimbursement not occurred. How a fund did yesterday is no guarantee of how it will do tomorrow.
| Average Annual Total Returns |
| | | | |
Periods ended July 31, 2023 | Past 1 year | Past 5 years | Past 10 years |
Class A (incl. 5.75% sales charge) | 40.73% | 26.08% | 25.30% |
Class M (incl. 3.50% sales charge) | 43.74% | 26.33% | 25.22% |
Class C (incl. contingent deferred sales charge) | 47.18% | 26.62% | 25.28% |
| Class I | 49.71% | 27.92% | 26.40% |
| Class Z | 49.89% | 28.09% | 26.48% |
Class C shares' contingent deferred sales charges included in the past one year, past five years and past ten years total return figures are 1%, 0% and 0%, respectively.
The initial offering of Class Z shares took place on October 2, 2018. Returns prior to October 2, 2018, are those of Class I.
| $10,000 Over 10 Years |
| |
Let's say hypothetically that $10,000 was invested in Fidelity Advisor® Semiconductors Fund - Class A, a class of the fund, on July 31, 2013, and the current 5.75% sales charge was paid. The chart shows how the value of your investment would have changed, and also shows how the S&P 500® Index performed over the same period. |
|
|
Fidelity Advisor® Semiconductors Fund
Market Recap:
U.S. equities gained 13.02% for the 12 months ending July 31, 2023, according to the S&P 500® index, as continued global economic expansion, falling commodity prices and a slowing in the pace of inflation provided a favorable backdrop for higher-risk assets. Large-cap stocks spearheaded the rally, which was driven by the shares of a narrow set of mega-cap companies in the information technology and communication services sectors, largely due to exuberance related to generative artificial intelligence. Aggressive monetary tightening by the U.S. Federal Reserve continued amid consistent pressure on core inflation, a measure that excludes food and energy. Since March 2022, the Fed has hiked its benchmark interest rate 11 times. The latest bump came in late July, a fourth consecutive raise of a stepped down 25 basis points. The S&P 500® gained 3.21% in July, as a "soft landing" of the U.S. economy became the consensus view amid better-than-expected earnings, slowing inflation and easing financial conditions, bringing the index's year-to-date gain to 20.65%. July saw a continuance of the recent shift to wider market breadth and lower dispersion. For the full 12 months, value (+17%) handily topped growth (+8%) within the index. By sector, tech (+28%), communication services (+21%) and industrials (+17%) led, whereas real estate (-10%) lagged most, due to high borrowing costs, low home inventory and a deteriorating commercial property market.
Comments from Portfolio Manager Adam Benjamin:
For the fiscal year ending July 31, 2023, the fund's share classes (excluding sales charges, if applicable) gained about 48% to 50%, versus 49.34% for the MSCI U.S. IMI Semiconductors & Semiconductor Equipment 25/50 Index and 13.02% for the broad-based S&P 500® index. Relative to the MSCI index, sector and industry positioning was the primary contributor for the fund, led by an underweight in the semiconductor materials & equipment category. Stock picking in semiconductors and a small out-of-index stake in electronic manufacturing services also boosted the fund's relative performance. The top individual relative contributor was an underweight in index constituent Qualcomm (-7%), which we sold during the period. A second notable relative contributor was an underweight in Texas Instruments (+4%). An underweight in Intel (+3%) also helped. The fund did not own Intel at period end. In contrast, stock selection in the semiconductor materials & equipment group meaningfully detracted from the fund's relative result. Modest non-index exposure to the technology hardware, storage & peripherals segment also hampered the fund's relative performance. The biggest individual relative detractor was an overweight in Marvell Technology (+17%), which was among our largest holdings. The second-largest relative detractor was an overweight in NXP Semiconductors (+23%). NXP Semiconductors was one of the fund's biggest holdings. A sizable non-index stake in Taiwan Semiconductor Manufacturing gained 14% and notably hurt. Taiwan Semiconductor Manufacturing was one of our largest holdings. This period we increased our stake in that stock. Notable changes in positioning include a higher allocation to semiconductor materials & equipment and a lower position in application software and some other non-index groups.
The views expressed above reflect those of the portfolio manager(s) only through the end of the period as stated on the cover of this report and do not necessarily represent the views of Fidelity or any other person in the Fidelity organization. Any such views are subject to change at any time based upon market or other conditions and Fidelity disclaims any responsibility to update such views. These views may not be relied on as investment advice and, because investment decisions for a Fidelity fund are based on numerous factors, may not be relied on as an indication of trading intent on behalf of any Fidelity fund.
Fidelity Advisor® Semiconductors Fund
Top Holdings (% of Fund's net assets) |
| |
| NVIDIA Corp. | 24.9 | |
| NXP Semiconductors NV | 8.4 | |
| ON Semiconductor Corp. | 8.3 | |
| Marvell Technology, Inc. | 6.4 | |
| GlobalFoundries, Inc. | 5.0 | |
| Taiwan Semiconductor Manufacturing Co. Ltd. sponsored ADR | 5.0 | |
| Lam Research Corp. | 3.7 | |
| Broadcom, Inc. | 3.5 | |
| Teradyne, Inc. | 3.3 | |
| Advanced Micro Devices, Inc. | 3.2 | |
| | 71.7 | |
| |
| Industries (% of Fund's net assets) |
| |
| Semiconductors & Semiconductor Equipment | 94.3 | |
| Electrical Equipment | 0.1 | |
| Metals & Mining | 0.1 | |
| Electronic Equipment, Instruments & Components | 0.0 | |
| Software | 0.0 | |
| Technology Hardware, Storage & Peripherals | 0.0 | |
| |
Geographic Diversification (% of Fund's net assets) |
|
* Includes Short-Term investments and Net Other Assets (Liabilities). Percentages are adjusted for the effect of derivatives, if applicable. |
| |
Fidelity Advisor® Semiconductors Fund
Showing Percentage of Net Assets
| Common Stocks - 94.0% |
| | | Shares | Value ($) |
| Electrical Equipment - 0.1% | | | |
| Electrical Components & Equipment - 0.1% | | | |
| Array Technologies, Inc. (a) | | 44,700 | 851,535 |
| Electronic Equipment, Instruments & Components - 0.0% | | | |
| Electronic Equipment & Instruments - 0.0% | | | |
| Aeva Technologies, Inc. (a)(b) | | 118,100 | 147,625 |
| Semiconductors & Semiconductor Equipment - 93.9% | | | |
| Semiconductor Materials & Equipment - 14.0% | | | |
| Applied Materials, Inc. | | 66,400 | 10,065,576 |
| ASML Holding NV (depository receipt) | | 60,000 | 42,984,600 |
| Enphase Energy, Inc. (a) | | 202,737 | 30,781,559 |
| KLA Corp. | | 2,700 | 1,387,665 |
| Lam Research Corp. | | 73,246 | 52,626,519 |
| Nova Ltd. (a)(b) | | 132,732 | 16,450,804 |
| Teradyne, Inc. | | 414,700 | 46,836,218 |
| | | | 201,132,941 |
| Semiconductors - 79.9% | | | |
| Advanced Micro Devices, Inc. (a) | | 397,574 | 45,482,466 |
| Allegro MicroSystems LLC (a) | | 385,900 | 19,916,299 |
| Ambarella, Inc. (a) | | 37,201 | 3,103,307 |
| Analog Devices, Inc. | | 33,706 | 6,725,358 |
| Broadcom, Inc. | | 55,225 | 49,627,946 |
| Cirrus Logic, Inc. (a) | | 75,228 | 6,078,422 |
| GlobalFoundries, Inc. (a) | | 1,127,531 | 71,812,449 |
| Impinj, Inc. (a)(b) | | 218,753 | 14,573,325 |
| Lattice Semiconductor Corp. (a)(b) | | 275,629 | 25,065,701 |
| MACOM Technology Solutions Holdings, Inc. (a) | | 258,562 | 18,078,655 |
| Marvell Technology, Inc. | | 1,412,265 | 91,980,819 |
| Microchip Technology, Inc. | | 482,477 | 45,323,889 |
| Micron Technology, Inc. | | 145,429 | 10,382,176 |
| Monolithic Power Systems, Inc. | | 58,073 | 32,491,263 |
| NVIDIA Corp. | | 763,227 | 356,648,347 |
| NXP Semiconductors NV | | 541,653 | 120,777,786 |
| ON Semiconductor Corp. (a) | | 1,101,476 | 118,684,039 |
| Qualcomm, Inc. | | 29,100 | 3,846,147 |
| Skyworks Solutions, Inc. | | 185,000 | 21,158,450 |
| Taiwan Semiconductor Manufacturing Co. Ltd. sponsored ADR | | 720,500 | 71,437,575 |
| Texas Instruments, Inc. | | 57,310 | 10,315,800 |
| | | | 1,143,510,219 |
TOTAL SEMICONDUCTORS & SEMICONDUCTOR EQUIPMENT | | | 1,344,643,160 |
| Technology Hardware, Storage & Peripherals - 0.0% | | | |
| Technology Hardware, Storage & Peripherals - 0.0% | | | |
| IonQ, Inc. (a)(c) | | 15,000 | 288,750 |
| TOTAL COMMON STOCKS (Cost $764,432,790) | | | 1,345,931,070 |
| | | | |
| Convertible Preferred Stocks - 0.4% |
| | | Shares | Value ($) |
| Electronic Equipment, Instruments & Components - 0.0% | | | |
| Electronic Components - 0.0% | | | |
| Menlo Micro, Inc. Series C (a)(c)(d) | | 79,800 | 84,588 |
| Metals & Mining - 0.1% | | | |
| Precious Metals & Minerals - 0.1% | | | |
| Diamond Foundry, Inc. Series C (a)(c)(d) | | 18,335 | 609,455 |
| Semiconductors & Semiconductor Equipment - 0.3% | | | |
| Semiconductor Materials & Equipment - 0.1% | | | |
| Astera Labs, Inc.: | | | |
| Series A (a)(c)(d) | | 30,452 | 306,956 |
| Series B (a)(c)(d) | | 5,185 | 52,265 |
| Series C (a)(c)(d) | | 19,433 | 195,885 |
| Series D (a)(c)(d) | | 123,852 | 1,248,428 |
| | | | 1,803,534 |
| Semiconductors - 0.2% | | | |
| Alif Semiconductor Series C (a)(c)(d) | | 48,363 | 972,580 |
| GaN Systems, Inc.: | | | |
| Series F1 (a)(c)(d) | | 52,877 | 588,521 |
| Series F2 (a)(c)(d) | | 27,921 | 310,761 |
| Retym, Inc. Series C (c)(d) | | 55,074 | 428,476 |
| SiMa.ai: | | | |
| Series B (a)(c)(d) | | 30,638 | 189,036 |
| Series B1 (a)(c)(d) | | 18,145 | 130,825 |
| | | | 2,620,199 |
TOTAL SEMICONDUCTORS & SEMICONDUCTOR EQUIPMENT | | | 4,423,733 |
| Software - 0.0% | | | |
| Systems Software - 0.0% | | | |
| Tenstorrent, Inc. Series C1 (a)(c)(d) | | 900 | 55,557 |
| Technology Hardware, Storage & Peripherals - 0.0% | | | |
| Technology Hardware, Storage & Peripherals - 0.0% | | | |
| Lightmatter, Inc. Series C (c)(d) | | 32,553 | 533,218 |
| TOTAL CONVERTIBLE PREFERRED STOCKS (Cost $5,203,493) | | | 5,706,551 |
| | | | |
| Preferred Securities - 0.1% |
| | | Principal Amount (e) | Value ($) |
| Semiconductors & Semiconductor Equipment - 0.1% | | | |
| Semiconductors - 0.1% | | | |
| GaN Systems, Inc. 0% (c)(d)(f) | | 1,239,360 | 1,531,850 |
| Software - 0.0% | | | |
| Systems Software - 0.0% | | | |
| Tenstorrent, Inc. 0% (c)(d)(f) | | 50,000 | 51,900 |
| TOTAL PREFERRED SECURITIES (Cost $1,289,360) | | | 1,583,750 |
| | | | |
| Money Market Funds - 7.1% |
| | | Shares | Value ($) |
| Fidelity Cash Central Fund 5.32% (g) | | 62,335,138 | 62,347,605 |
| Fidelity Securities Lending Cash Central Fund 5.32% (g)(h) | | 39,625,812 | 39,629,775 |
| TOTAL MONEY MARKET FUNDS (Cost $101,977,380) | | | 101,977,380 |
| | | | |
| TOTAL INVESTMENT IN SECURITIES - 101.6% (Cost $872,903,023) | 1,455,198,751 |
NET OTHER ASSETS (LIABILITIES) - (1.6)% | (23,461,652) |
| NET ASSETS - 100.0% | 1,431,737,099 |
| | |
Legend
| (b) | Security or a portion of the security is on loan at period end. |
| (c) | Restricted securities (including private placements) - Investment in securities not registered under the Securities Act of 1933 (excluding 144A issues). At the end of the period, the value of restricted securities (excluding 144A issues) amounted to $7,579,051 or 0.5% of net assets. |
| (e) | Amount is stated in United States dollars unless otherwise noted. |
| (f) | Security is perpetual in nature with no stated maturity date. |
| (g) | Affiliated fund that is generally available only to investment companies and other accounts managed by Fidelity Investments. The rate quoted is the annualized seven-day yield of the fund at period end. A complete unaudited listing of the fund's holdings as of its most recent quarter end is available upon request. In addition, each Fidelity Central Fund's financial statements, which are not covered by the Fund's Report of Independent Registered Public Accounting Firm, are available on the SEC's website or upon request. |
| (h) | Investment made with cash collateral received from securities on loan. |
| Additional information on each restricted holding is as follows: |
| Security | Acquisition Date | Acquisition Cost ($) |
| Alif Semiconductor Series C | 3/08/22 | 981,698 |
| | | |
| Astera Labs, Inc. Series A | 5/17/22 | 309,682 |
| | | |
| Astera Labs, Inc. Series B | 5/17/22 | 52,729 |
| | | |
| Astera Labs, Inc. Series C | 8/24/21 | 65,330 |
| | | |
| Astera Labs, Inc. Series D | 5/17/22 - 5/27/22 | 1,259,513 |
| | | |
| Diamond Foundry, Inc. Series C | 3/15/21 | 440,040 |
| | | |
| GaN Systems, Inc. Series F1 | 11/30/21 | 448,397 |
| | | |
| GaN Systems, Inc. Series F2 | 11/30/21 | 236,770 |
| | | |
| GaN Systems, Inc. 0% | 11/30/21 | 1,239,360 |
| | | |
| IonQ, Inc. | 3/07/21 | 150,000 |
| | | |
| Lightmatter, Inc. Series C | 5/19/23 | 535,718 |
| | | |
| Menlo Micro, Inc. Series C | 2/09/22 | 105,775 |
| | | |
| Retym, Inc. Series C | 5/17/23 - 6/20/23 | 428,575 |
| | | |
| SiMa.ai Series B | 5/10/21 | 157,093 |
| | | |
| SiMa.ai Series B1 | 4/25/22 - 10/17/22 | 128,665 |
| | | |
| Tenstorrent, Inc. Series C1 | 4/23/21 | 53,509 |
| | | |
| Tenstorrent, Inc. 0% | 4/23/21 | 50,000 |
| | | |
Affiliated Central Funds
Fiscal year to date information regarding the Fund's investments in Fidelity Central Funds, including the ownership percentage, is presented below.
| Affiliate | Value, beginning of period ($) | Purchases ($) | Sales Proceeds ($) | Dividend Income ($) | Realized Gain (loss) ($) | Change in Unrealized appreciation (depreciation) ($) | Value, end of period ($) | % ownership, end of period |
| Fidelity Cash Central Fund 5.32% | 23,994,086 | 323,062,501 | 284,708,982 | 903,059 | - | - | 62,347,605 | 0.2% |
| Fidelity Securities Lending Cash Central Fund 5.32% | 43,554,325 | 492,050,134 | 495,974,684 | 713,912 | - | - | 39,629,775 | 0.1% |
| Total | 67,548,411 | 815,112,635 | 780,683,666 | 1,616,971 | - | - | 101,977,380 | |
| | | | | | | | | |
Amounts in the dividend income column in the above table include any capital gain distributions from underlying funds, which are presented in the corresponding line item in the Statement of Operations, if applicable.
Amounts in the dividend income column for Fidelity Securities Lending Cash Central Fund represents the income earned on investing cash collateral, less rebates paid to borrowers and any lending agent fees associated with the loan, plus any premium payments received for lending certain types of securities.
Amounts included in the purchases and sales proceeds columns may include in-kind transactions, if applicable.
Investment Valuation
The following is a summary of the inputs used, as of July 31, 2023, involving the Fund's assets and liabilities carried at fair value. The inputs or methodology used for valuing securities may not be an indication of the risk associated with investing in those securities. For more information on valuation inputs, and their aggregation into the levels used below, please refer to the Investment Valuation section in the accompanying Notes to Financial Statements.
| Valuation Inputs at Reporting Date: |
| Description | Total ($) | Level 1 ($) | Level 2 ($) | Level 3 ($) |
Investments in Securities: | | | | |
|
| Common Stocks | 1,345,931,070 | 1,345,931,070 | - | - |
|
| Convertible Preferred Stocks | 5,706,551 | - | - | 5,706,551 |
|
| Preferred Securities | 1,583,750 | - | - | 1,583,750 |
|
| Money Market Funds | 101,977,380 | 101,977,380 | - | - |
| Total Investments in Securities: | 1,455,198,751 | 1,447,908,450 | - | 7,290,301 |
Fidelity Advisor® Semiconductors Fund
| Statement of Assets and Liabilities |
| | | | July 31, 2023 |
| | | | | |
| Assets | | | | |
| Investment in securities, at value (including securities loaned of $38,914,093) - See accompanying schedule: | | | | |
Unaffiliated issuers (cost $770,925,643) | $ | 1,353,221,371 | | |
Fidelity Central Funds (cost $101,977,380) | | 101,977,380 | | |
| | | | | |
| | | | | |
| Total Investment in Securities (cost $872,903,023) | | | $ | 1,455,198,751 |
| Receivable for investments sold | | | | 48,957,701 |
| Receivable for fund shares sold | | | | 5,569,823 |
| Dividends receivable | | | | 71,064 |
| Distributions receivable from Fidelity Central Funds | | | | 187,295 |
| Prepaid expenses | | | | 3,015 |
Total assets | | | | 1,509,987,649 |
| Liabilities | | | | |
| Payable for investments purchased | $ | 24,109,416 | | |
| Payable for fund shares redeemed | | 13,416,497 | | |
| Accrued management fee | | 599,422 | | |
| Distribution and service plan fees payable | | 256,547 | | |
| Other affiliated payables | | 198,025 | | |
| Other payables and accrued expenses | | 40,868 | | |
| Collateral on securities loaned | | 39,629,775 | | |
| Total Liabilities | | | | 78,250,550 |
| Net Assets | | | $ | 1,431,737,099 |
| Net Assets consist of: | | | | |
| Paid in capital | | | $ | 804,012,476 |
| Total accumulated earnings (loss) | | | | 627,724,623 |
| Net Assets | | | $ | 1,431,737,099 |
| | | | | |
| Net Asset Value and Maximum Offering Price | | | | |
| Class A : | | | | |
Net Asset Value and redemption price per share ($581,690,317 ÷ 9,362,307 shares)(a) | | | $ | 62.13 |
| Maximum offering price per share (100/94.25 of $62.13) | | | $ | 65.92 |
| Class M : | | | | |
Net Asset Value and redemption price per share ($94,005,605 ÷ 1,614,153 shares)(a) | | | $ | 58.24 |
| Maximum offering price per share (100/96.50 of $58.24) | | | $ | 60.35 |
| Class C : | | | | |
Net Asset Value and offering price per share ($129,390,281 ÷ 2,568,330 shares)(a) | | | $ | 50.38 |
| Class I : | | | | |
Net Asset Value, offering price and redemption price per share ($530,775,289 ÷ 7,932,454 shares) | | | $ | 66.91 |
| Class Z : | | | | |
Net Asset Value, offering price and redemption price per share ($95,875,607 ÷ 1,431,212 shares) | | | $ | 66.99 |
(a)Redemption price per share is equal to net asset value less any applicable contingent deferred sales charge. |
| Statement of Operations |
| | | | Year ended July 31, 2023 |
| Investment Income | | | | |
| Dividends | | | $ | 6,491,003 |
| Income from Fidelity Central Funds (including $713,912 from security lending) | | | | 1,616,971 |
| Total Income | | | | 8,107,974 |
| Expenses | | | | |
| Management fee | $ | 4,750,703 | | |
| Transfer agent fees | | 1,475,540 | | |
| Distribution and service plan fees | | 2,108,553 | | |
| Accounting fees | | 273,927 | | |
| Custodian fees and expenses | | 16,843 | | |
| Independent trustees' fees and expenses | | 4,309 | | |
| Registration fees | | 123,030 | | |
| Audit | | 46,635 | | |
| Legal | | 2,459 | | |
| Miscellaneous | | 5,099 | | |
| Total expenses before reductions | | 8,807,098 | | |
| Expense reductions | | (49,318) | | |
| Total expenses after reductions | | | | 8,757,780 |
| Net Investment income (loss) | | | | (649,806) |
| Realized and Unrealized Gain (Loss) | | | | |
| Net realized gain (loss) on: | | | | |
| Investment Securities: | | | | |
| Unaffiliated issuers | | 49,400,839 | | |
| Foreign currency transactions | | (3,580) | | |
| Total net realized gain (loss) | | | | 49,397,259 |
| Change in net unrealized appreciation (depreciation) on: | | | | |
| Investment Securities: | | | | |
| Unaffiliated issuers | | 374,255,119 | | |
| Assets and liabilities in foreign currencies | | 1,901 | | |
| Total change in net unrealized appreciation (depreciation) | | | | 374,257,020 |
| Net gain (loss) | | | | 423,654,279 |
| Net increase (decrease) in net assets resulting from operations | | | $ | 423,004,473 |
| Statement of Changes in Net Assets |
| |
| | Year ended July 31, 2023 | | Year ended July 31, 2022 |
| Increase (Decrease) in Net Assets | | | | |
| Operations | | | | |
| Net investment income (loss) | $ | (649,806) | $ | (2,178,215) |
| Net realized gain (loss) | | 49,397,259 | | 35,703,217 |
| Change in net unrealized appreciation (depreciation) | | 374,257,020 | | (87,724,624) |
| Net increase (decrease) in net assets resulting from operations | | 423,004,473 | | (54,199,622) |
| Distributions to shareholders | | (22,158,679) | | (43,908,446) |
| | | | | |
| Share transactions - net increase (decrease) | | 216,742,474 | | 211,964,262 |
| Total increase (decrease) in net assets | | 617,588,268 | | 113,856,194 |
| | | | | |
| Net Assets | | | | |
| Beginning of period | | 814,148,831 | | 700,292,637 |
| End of period | $ | 1,431,737,099 | $ | 814,148,831 |
| | | | | |
| | | | | |
| Fidelity Advisor® Semiconductors Fund Class A |
| |
| Years ended July 31, | | 2023 | | 2022 | | 2021 | | 2020 | | 2019 |
Selected Per-Share Data | | | | | | | | | | |
| Net asset value, beginning of period | $ | 42.85 | $ | 46.29 | $ | 29.79 | $ | 23.03 | $ | 25.06 |
| Income from Investment Operations | | | | | | | | | | |
Net investment income (loss) A,B | | (.05) | | (.13) | | (.08) | | .14 | | .15 |
| Net realized and unrealized gain (loss) | | 20.53 | | (.83) | | 18.29 | | 6.90 | | 1.25 |
| Total from investment operations | | 20.48 | | (.96) | | 18.21 | | 7.04 | | 1.40 |
| Distributions from net investment income | | - | | - | | (.04) | | (.07) | | (.10) |
| Distributions from net realized gain | | (1.20) | | (2.48) | | (1.67) | | (.20) | | (3.33) |
| Total distributions | | (1.20) | | (2.48) | | (1.71) | | (.28) C | | (3.43) |
| Net asset value, end of period | $ | 62.13 | $ | 42.85 | $ | 46.29 | $ | 29.79 | $ | 23.03 |
Total Return D,E | | 49.31% | | (3.21)% | | 62.45% | | 30.65% | | 10.18% |
Ratios to Average Net Assets B,F,G | | | | | | | | | | |
| Expenses before reductions | | 1.01% | | 1.01% | | 1.04% | | 1.10% | | 1.12% |
| Expenses net of fee waivers, if any | | 1.00% | | 1.01% | | 1.04% | | 1.09% | | 1.11% |
| Expenses net of all reductions | | 1.00% | | 1.01% | | 1.03% | | 1.08% | | 1.11% |
| Net investment income (loss) | | (.10)% | | (.27)% | | (.21)% | | .53% | | .70% |
| Supplemental Data | | | | | | | | | | |
| Net assets, end of period (000 omitted) | $ | 581,690 | $ | 319,402 | $ | 279,755 | $ | 140,072 | $ | 98,459 |
Portfolio turnover rate H | | 40% | | 32% | | 41% | | 136% | | 110% |
ACalculated based on average shares outstanding during the period.
BNet investment income (loss) is affected by the timing of the declaration of dividends by any underlying mutual funds or exchange-traded funds (ETFs). Net investment income (loss) of any mutual funds or ETFs is not included in the Fund's net investment income (loss) ratio.
CTotal distributions per share do not sum due to rounding.
DTotal returns would have been lower if certain expenses had not been reduced during the applicable periods shown.
ETotal returns do not include the effect of the sales charges.
FFees and expenses of any underlying mutual funds or exchange-traded funds (ETFs) are not included in the Fund's expense ratio. The Fund indirectly bears its proportionate share of these expenses. For additional expense information related to investments in Fidelity Central Funds, please refer to the "Investments in Fidelity Central Funds" note found in the Notes to Financial Statements section of the most recent Annual or Semi-Annual report.
GExpense ratios reflect operating expenses of the class. Expenses before reductions do not reflect amounts reimbursed, waived, or reduced through arrangements with the investment adviser, brokerage services, or other offset arrangements, if applicable, and do not represent the amount paid by the class during periods when reimbursements, waivers or reductions occur.
HAmount does not include the portfolio activity of any underlying mutual funds or exchange-traded funds (ETFs).
| Fidelity Advisor® Semiconductors Fund Class M |
| |
| Years ended July 31, | | 2023 | | 2022 | | 2021 | | 2020 | | 2019 |
Selected Per-Share Data | | | | | | | | | | |
| Net asset value, beginning of period | $ | 40.34 | $ | 43.75 | $ | 28.25 | $ | 21.89 | $ | 24.04 |
| Income from Investment Operations | | | | | | | | | | |
Net investment income (loss) A,B | | (.15) | | (.23) | | (.17) | | .06 | | .08 |
| Net realized and unrealized gain (loss) | | 19.25 | | (.76) | | 17.31 | | 6.55 | | 1.16 |
| Total from investment operations | | 19.10 | | (.99) | | 17.14 | | 6.61 | | 1.24 |
| Distributions from net investment income | | - | | - | | - | | (.05) | | (.06) |
| Distributions from net realized gain | | (1.20) | | (2.42) | | (1.64) | | (.20) | | (3.33) |
| Total distributions | | (1.20) | | (2.42) | | (1.64) | | (.25) | | (3.39) |
| Net asset value, end of period | $ | 58.24 | $ | 40.34 | $ | 43.75 | $ | 28.25 | $ | 21.89 |
Total Return C,D | | 48.95% | | (3.43)% | | 61.98% | | 30.28% | | 9.84% |
Ratios to Average Net Assets B,E,F | | | | | | | | | | |
| Expenses before reductions | | 1.25% | | 1.26% | | 1.30% | | 1.38% | | 1.44% |
| Expenses net of fee waivers, if any | | 1.25% | | 1.25% | | 1.30% | | 1.38% | | 1.43% |
| Expenses net of all reductions | | 1.25% | | 1.25% | | 1.29% | | 1.37% | | 1.43% |
| Net investment income (loss) | | (.35)% | | (.52)% | | (.47)% | | .24% | | .38% |
| Supplemental Data | | | | | | | | | | |
| Net assets, end of period (000 omitted) | $ | 94,006 | $ | 48,499 | $ | 49,963 | $ | 29,262 | $ | 22,587 |
Portfolio turnover rate G | | 40% | | 32% | | 41% | | 136% | | 110% |
ACalculated based on average shares outstanding during the period.
BNet investment income (loss) is affected by the timing of the declaration of dividends by any underlying mutual funds or exchange-traded funds (ETFs). Net investment income (loss) of any mutual funds or ETFs is not included in the Fund's net investment income (loss) ratio.
CTotal returns would have been lower if certain expenses had not been reduced during the applicable periods shown.
DTotal returns do not include the effect of the sales charges.
EFees and expenses of any underlying mutual funds or exchange-traded funds (ETFs) are not included in the Fund's expense ratio. The Fund indirectly bears its proportionate share of these expenses. For additional expense information related to investments in Fidelity Central Funds, please refer to the "Investments in Fidelity Central Funds" note found in the Notes to Financial Statements section of the most recent Annual or Semi-Annual report.
FExpense ratios reflect operating expenses of the class. Expenses before reductions do not reflect amounts reimbursed, waived, or reduced through arrangements with the investment adviser, brokerage services, or other offset arrangements, if applicable, and do not represent the amount paid by the class during periods when reimbursements, waivers or reductions occur.
GAmount does not include the portfolio activity of any underlying mutual funds or exchange-traded funds (ETFs).
| Fidelity Advisor® Semiconductors Fund Class C |
| |
| Years ended July 31, | | 2023 | | 2022 | | 2021 | | 2020 | | 2019 |
Selected Per-Share Data | | | | | | | | | | |
| Net asset value, beginning of period | $ | 35.24 | $ | 38.59 | $ | 25.18 | $ | 19.59 | $ | 21.88 |
| Income from Investment Operations | | | | | | | | | | |
Net investment income (loss) A,B | | (.31) | | (.40) | | (.31) | | (.05) | | (.01) |
| Net realized and unrealized gain (loss) | | 16.65 | | (.61) | | 15.35 | | 5.86 | | .98 |
| Total from investment operations | | 16.34 | | (1.01) | | 15.04 | | 5.81 | | .97 |
| Distributions from net investment income | | - | | - | | - | | (.01) | | - |
| Distributions from net realized gain | | (1.20) | | (2.34) | | (1.63) | | (.20) | | (3.26) |
| Total distributions | | (1.20) | | (2.34) | | (1.63) | | (.22) C | | (3.26) |
| Net asset value, end of period | $ | 50.38 | $ | 35.24 | $ | 38.59 | $ | 25.18 | $ | 19.59 |
Total Return D,E | | 48.18% | | (3.93)% | | 61.17% | | 29.73% | | 9.33% |
Ratios to Average Net Assets B,F,G | | | | | | | | | | |
| Expenses before reductions | | 1.76% | | 1.76% | | 1.79% | | 1.85% | | 1.87% |
| Expenses net of fee waivers, if any | | 1.76% | | 1.76% | | 1.79% | | 1.85% | | 1.87% |
| Expenses net of all reductions | | 1.76% | | 1.76% | | 1.79% | | 1.83% | | 1.87% |
| Net investment income (loss) | | (.86)% | | (1.03)% | | (.97)% | | (.23)% | | (.06)% |
| Supplemental Data | | | | | | | | | | |
| Net assets, end of period (000 omitted) | $ | 129,390 | $ | 88,592 | $ | 86,217 | $ | 57,320 | $ | 45,659 |
Portfolio turnover rate H | | 40% | | 32% | | 41% | | 136% | | 110% |
ACalculated based on average shares outstanding during the period.
BNet investment income (loss) is affected by the timing of the declaration of dividends by any underlying mutual funds or exchange-traded funds (ETFs). Net investment income (loss) of any mutual funds or ETFs is not included in the Fund's net investment income (loss) ratio.
CTotal distributions per share do not sum due to rounding.
DTotal returns would have been lower if certain expenses had not been reduced during the applicable periods shown.
ETotal returns do not include the effect of the contingent deferred sales charge.
FFees and expenses of any underlying mutual funds or exchange-traded funds (ETFs) are not included in the Fund's expense ratio. The Fund indirectly bears its proportionate share of these expenses. For additional expense information related to investments in Fidelity Central Funds, please refer to the "Investments in Fidelity Central Funds" note found in the Notes to Financial Statements section of the most recent Annual or Semi-Annual report.
GExpense ratios reflect operating expenses of the class. Expenses before reductions do not reflect amounts reimbursed, waived, or reduced through arrangements with the investment adviser, brokerage services, or other offset arrangements, if applicable, and do not represent the amount paid by the class during periods when reimbursements, waivers or reductions occur.
HAmount does not include the portfolio activity of any underlying mutual funds or exchange-traded funds (ETFs).
| Fidelity Advisor® Semiconductors Fund Class I |
| |
| Years ended July 31, | | 2023 | | 2022 | | 2021 | | 2020 | | 2019 |
Selected Per-Share Data | | | | | | | | | | |
| Net asset value, beginning of period | $ | 45.93 | $ | 49.39 | $ | 31.68 | $ | 24.42 | $ | 26.33 |
| Income from Investment Operations | | | | | | | | | | |
Net investment income (loss) A,B | | .08 | | (.01) | | .03 | | .22 | | .23 |
| Net realized and unrealized gain (loss) | | 22.10 | | (.92) | | 19.47 | | 7.34 | | 1.35 |
| Total from investment operations | | 22.18 | | (.93) | | 19.50 | | 7.56 | | 1.58 |
| Distributions from net investment income | | - | | - | | (.12) | | (.10) | | (.16) |
| Distributions from net realized gain | | (1.20) | | (2.53) | | (1.67) | | (.20) | | (3.33) |
| Total distributions | | (1.20) | | (2.53) | | (1.79) | | (.30) | | (3.49) |
| Net asset value, end of period | $ | 66.91 | $ | 45.93 | $ | 49.39 | $ | 31.68 | $ | 24.42 |
Total Return C | | 49.71% | | (2.96)% | | 62.86% | | 31.08% | | 10.46% |
Ratios to Average Net Assets B,D,E | | | | | | | | | | |
| Expenses before reductions | | .74% | | .75% | | .77% | | .81% | | .83% |
| Expenses net of fee waivers, if any | | .74% | | .74% | | .77% | | .81% | | .82% |
| Expenses net of all reductions | | .74% | | .74% | | .76% | | .79% | | .82% |
| Net investment income (loss) | | .16% | | (.01)% | | .06% | | .81% | | .98% |
| Supplemental Data | | | | | | | | | | |
| Net assets, end of period (000 omitted) | $ | 530,775 | $ | 309,873 | $ | 257,502 | $ | 126,660 | $ | 98,451 |
Portfolio turnover rate F | | 40% | | 32% | | 41% | | 136% | | 110% |
ACalculated based on average shares outstanding during the period.
BNet investment income (loss) is affected by the timing of the declaration of dividends by any underlying mutual funds or exchange-traded funds (ETFs). Net investment income (loss) of any mutual funds or ETFs is not included in the Fund's net investment income (loss) ratio.
CTotal returns would have been lower if certain expenses had not been reduced during the applicable periods shown.
DFees and expenses of any underlying mutual funds or exchange-traded funds (ETFs) are not included in the Fund's expense ratio. The Fund indirectly bears its proportionate share of these expenses. For additional expense information related to investments in Fidelity Central Funds, please refer to the "Investments in Fidelity Central Funds" note found in the Notes to Financial Statements section of the most recent Annual or Semi-Annual report.
EExpense ratios reflect operating expenses of the class. Expenses before reductions do not reflect amounts reimbursed, waived, or reduced through arrangements with the investment adviser, brokerage services, or other offset arrangements, if applicable, and do not represent the amount paid by the class during periods when reimbursements, waivers or reductions occur.
FAmount does not include the portfolio activity of any underlying mutual funds or exchange-traded funds (ETFs).
| Fidelity Advisor® Semiconductors Fund Class Z |
| |
| Years ended July 31, | | 2023 | | 2022 | | 2021 | | 2020 | | 2019 A |
Selected Per-Share Data | | | | | | | | | | |
| Net asset value, beginning of period | $ | 45.93 | $ | 49.35 | $ | 31.65 | $ | 24.38 | $ | 26.00 |
| Income from Investment Operations | | | | | | | | | | |
Net investment income (loss) B,C | | .14 | | .06 | | .08 | | .26 | | .17 |
| Net realized and unrealized gain (loss) | | 22.12 | | (.92) | | 19.45 | | 7.33 | | 1.76 |
| Total from investment operations | | 22.26 | | (.86) | | 19.53 | | 7.59 | | 1.93 |
| Distributions from net investment income | | - | | - | | (.16) | | (.11) | | (.22) |
| Distributions from net realized gain | | (1.20) | | (2.56) | | (1.67) | | (.20) | | (3.33) |
| Total distributions | | (1.20) | | (2.56) | | (1.83) | | (.32) D | | (3.55) |
| Net asset value, end of period | $ | 66.99 | $ | 45.93 | $ | 49.35 | $ | 31.65 | $ | 24.38 |
Total Return E,F | | 49.89% | | (2.83)% | | 63.06% | | 31.22% | | 12.03% |
Ratios to Average Net Assets C,G,H | | | | | | | | | | |
| Expenses before reductions | | .62% | | .62% | | .64% | | .68% | | .69% I |
| Expenses net of fee waivers, if any | | .62% | | .62% | | .64% | | .68% | | .69% I |
| Expenses net of all reductions | | .62% | | .62% | | .64% | | .66% | | .68% I |
| Net investment income (loss) | | .28% | | .11% | | .18% | | .94% | | .91% I |
| Supplemental Data | | | | | | | | | | |
| Net assets, end of period (000 omitted) | $ | 95,876 | $ | 47,782 | $ | 26,856 | $ | 7,920 | $ | 2,629 |
Portfolio turnover rate J | | 40% | | 32% | | 41% | | 136% | | 110% |
AFor the period October 2, 2018 (commencement of sale of shares) through July 31, 2019.
BCalculated based on average shares outstanding during the period.
CNet investment income (loss) is affected by the timing of the declaration of dividends by any underlying mutual funds or exchange-traded funds (ETFs). Net investment income (loss) of any mutual funds or ETFs is not included in the Fund's net investment income (loss) ratio.
DTotal distributions per share do not sum due to rounding.
ETotal returns for periods of less than one year are not annualized.
FTotal returns would have been lower if certain expenses had not been reduced during the applicable periods shown.
GFees and expenses of any underlying mutual funds or exchange-traded funds (ETFs) are not included in the Fund's expense ratio. The Fund indirectly bears its proportionate share of these expenses. For additional expense information related to investments in Fidelity Central Funds, please refer to the "Investments in Fidelity Central Funds" note found in the Notes to Financial Statements section of the most recent Annual or Semi-Annual report.
HExpense ratios reflect operating expenses of the class. Expenses before reductions do not reflect amounts reimbursed, waived, or reduced through arrangements with the investment adviser, brokerage services, or other offset arrangements, if applicable, and do not represent the amount paid by the class during periods when reimbursements, waivers or reductions occur.
IAnnualized.
JAmount does not include the portfolio activity of any underlying mutual funds or exchange-traded funds (ETFs).
Average annual total return reflects the change in the value of an investment, assuming reinvestment of distributions from dividend income and capital gains (the profits earned upon the sale of securities that have grown in value, if any) and assuming a constant rate of performance each year. The hypothetical investment and the average annual total returns do not reflect the deduction of taxes that a shareholder would pay on fund distributions or the redemption of fund shares. During periods of reimbursement by Fidelity, a fund's total return will be greater than it would be had the reimbursement not occurred. How a fund did yesterday is no guarantee of how it will do tomorrow.
| Average Annual Total Returns |
| | | | |
Periods ended July 31, 2023 | Past 1 year | Past 5 years | Past 10 years |
Class A (incl. 5.75% sales charge) | 23.00% | 18.80% | 19.76% |
Class M (incl. 3.50% sales charge) | 25.64% | 19.07% | 19.74% |
Class C (incl. contingent deferred sales charge) | 28.50% | 19.30% | 19.75% |
| Class I | 30.84% | 20.53% | 20.81% |
| Class Z | 31.00% | 20.67% | 20.88% |
Class C shares' contingent deferred sales charges included in the past one year, past five years and past ten years total return figures are 1%, 0% and 0%, respectively.
The initial offering of Class Z shares took place on October 2, 2018. Returns prior to October 2, 2018, are those of Class I.
| $10,000 Over 10 Years |
| |
Let's say hypothetically that $10,000 was invested in Fidelity Advisor® Technology Fund - Class A, a class of the fund, on July 31, 2013, and the current 5.75% sales charge was paid. The chart shows how the value of your investment would have changed, and also shows how the S&P 500® Index performed over the same period. |
|
|
Fidelity Advisor® Technology Fund
Market Recap:
U.S. equities gained 13.02% for the 12 months ending July 31, 2023, according to the S&P 500® index, as continued global economic expansion, falling commodity prices and a slowing in the pace of inflation provided a favorable backdrop for higher-risk assets. Large-cap stocks spearheaded the rally, which was driven by the shares of a narrow set of mega-cap companies in the information technology and communication services sectors, largely due to exuberance related to generative artificial intelligence. Aggressive monetary tightening by the U.S. Federal Reserve continued amid consistent pressure on core inflation, a measure that excludes food and energy. Since March 2022, the Fed has hiked its benchmark interest rate 11 times. The latest bump came in late July, a fourth consecutive raise of a stepped down 25 basis points. The S&P 500® gained 3.21% in July, as a "soft landing" of the U.S. economy became the consensus view amid better-than-expected earnings, slowing inflation and easing financial conditions, bringing the index's year-to-date gain to 20.65%. July saw a continuance of the recent shift to wider market breadth and lower dispersion. For the full 12 months, value (+17%) handily topped growth (+8%) within the index. By sector, tech (+28%), communication services (+21%) and industrials (+17%) led, whereas real estate (-10%) lagged most, due to high borrowing costs, low home inventory and a deteriorating commercial property market.
Comments from Portfolio Manager Adam Benjamin:
For the fiscal year ending July 31, 2023, the fund's share classes (excluding sales charges, if applicable) gained about 30% to 31%, versus 24.07% for the MSCI U.S. IMI Information Technology 25/50 Index and 13.02% for the broad-based S&P 500® index. The biggest contributor to the fund's performance versus the industry index - by a wide margin - was positioning in semiconductors, where both an overweight and security selection were helpful. Stock picks in transaction & payment processing services and out-of-benchmark exposure to passenger ground transportation also boosted the fund's relative performance. The top individual relative contributor was an overweight in Nvidia (+156%). Nvidia was one of our largest holdings. The second-largest relative contributor was an overweight in onsemi (formerly ON Semiconductor), which gained 62%. Onsemi was among our biggest holdings. Another notable relative contributor was our non-index stake in Uber Technologies (+112%). This period we increased our investment in Uber Technologies. In contrast, the largest detractor from performance versus the industry index was an overweight in internet services & infrastructure. Stock picks in systems software also hampered the fund's relative result. Further detracting from the fund's performance were security selection and an underweight in application software. Not owning Broadcom, an index component that gained 73%, was the fund's largest individual relative detractor. A second notable relative detractor was an overweight in Okta (-21%). Okta was among the largest holdings at period end, and we increased our position here this period. An overweight in Cisco Systems (+17%) also hurt on a relative basis. Cisco Systems was one of our biggest holdings. Notable changes in positioning include decreased exposure to the transaction & payment processing services industry and a higher allocation to semiconductors.
The views expressed above reflect those of the portfolio manager(s) only through the end of the period as stated on the cover of this report and do not necessarily represent the views of Fidelity or any other person in the Fidelity organization. Any such views are subject to change at any time based upon market or other conditions and Fidelity disclaims any responsibility to update such views. These views may not be relied on as investment advice and, because investment decisions for a Fidelity fund are based on numerous factors, may not be relied on as an indication of trading intent on behalf of any Fidelity fund.
Fidelity Advisor® Technology Fund
Top Holdings (% of Fund's net assets) |
| |
| Apple, Inc. | 17.2 | |
| Microsoft Corp. | 17.0 | |
| NVIDIA Corp. | 13.3 | |
| Marvell Technology, Inc. | 4.7 | |
| NXP Semiconductors NV | 4.6 | |
| ON Semiconductor Corp. | 4.4 | |
| Cisco Systems, Inc. | 3.3 | |
| Salesforce, Inc. | 3.2 | |
| ServiceNow, Inc. | 3.1 | |
| Okta, Inc. | 2.5 | |
| | 73.3 | |
| |
| Industries (% of Fund's net assets) |
| |
| Semiconductors & Semiconductor Equipment | 33.5 | |
| Software | 29.8 | |
| Technology Hardware, Storage & Peripherals | 17.4 | |
| IT Services | 6.4 | |
| Communications Equipment | 3.3 | |
| Financial Services | 2.5 | |
| Ground Transportation | 2.1 | |
| Hotels, Restaurants & Leisure | 1.2 | |
| Interactive Media & Services | 1.0 | |
| Professional Services | 1.0 | |
| Entertainment | 0.7 | |
| Aerospace & Defense | 0.2 | |
| Broadline Retail | 0.1 | |
| Chemicals | 0.1 | |
| Consumer Staples Distribution & Retail | 0.1 | |
| Electronic Equipment, Instruments & Components | 0.1 | |
| Metals & Mining | 0.1 | |
| Life Sciences Tools & Services | 0.0 | |
| Pharmaceuticals | 0.0 | |
| |
Fidelity Advisor® Technology Fund
Showing Percentage of Net Assets
| Common Stocks - 98.1% |
| | | Shares | Value ($) |
| Chemicals - 0.1% | | | |
| Commodity Chemicals - 0.1% | | | |
| LG Chemical Ltd. | | 9,410 | 4,772,313 |
| Communications Equipment - 3.3% | | | |
| Communications Equipment - 3.3% | | | |
| Cisco Systems, Inc. | | 3,271,000 | 170,222,840 |
| Entertainment - 0.7% | | | |
| Movies & Entertainment - 0.7% | | | |
| Netflix, Inc. (a) | | 80,266 | 35,234,366 |
| Financial Services - 2.5% | | | |
| Diversified Financial Services - 0.1% | | | |
| Ant International Co. Ltd. Class C (a)(b)(c) | | 2,163,455 | 4,067,295 |
| Transaction & Payment Processing Services - 2.4% | | | |
| MasterCard, Inc. Class A | | 262,000 | 103,301,360 |
| Visa, Inc. Class A | | 77,016 | 18,309,014 |
| | | | 121,610,374 |
TOTAL FINANCIAL SERVICES | | | 125,677,669 |
| Ground Transportation - 2.1% | | | |
| Cargo Ground Transportation - 0.0% | | | |
| TuSimple Holdings, Inc. (a)(d) | | 86,300 | 201,942 |
| Passenger Ground Transportation - 2.1% | | | |
| Lyft, Inc. (a) | | 713,642 | 9,070,390 |
| Uber Technologies, Inc. (a) | | 1,958,764 | 96,880,467 |
| | | | 105,950,857 |
TOTAL GROUND TRANSPORTATION | | | 106,152,799 |
| Hotels, Restaurants & Leisure - 1.2% | | | |
| Hotels, Resorts & Cruise Lines - 1.2% | | | |
| Airbnb, Inc. Class A (a) | | 405,500 | 61,713,045 |
| Interactive Media & Services - 0.7% | | | |
| Interactive Media & Services - 0.7% | | | |
| Snap, Inc. Class A (a) | | 3,041,667 | 34,553,337 |
| IT Services - 6.4% | | | |
| Internet Services & Infrastructure - 6.4% | | | |
| MongoDB, Inc. Class A (a) | | 207,842 | 88,000,303 |
| Okta, Inc. (a) | | 1,676,200 | 128,832,732 |
| Shopify, Inc. Class A (a) | | 443,200 | 29,951,456 |
| Snowflake, Inc. (a) | | 336,660 | 59,827,849 |
| Twilio, Inc. Class A (a) | | 327,500 | 21,624,825 |
| | | | 328,237,165 |
| Life Sciences Tools & Services - 0.0% | | | |
| Life Sciences Tools & Services - 0.0% | | | |
| Eden Biologics, Inc. (a)(c) | | 387,462 | 0 |
| Pharmaceuticals - 0.0% | | | |
| Pharmaceuticals - 0.0% | | | |
| Chime Biologics Wuhan Co. Ltd. (a)(c) | | 387,462 | 201,802 |
| Professional Services - 1.0% | | | |
| Human Resource & Employment Services - 1.0% | | | |
| Paycom Software, Inc. | | 135,269 | 49,881,796 |
| Semiconductors & Semiconductor Equipment - 33.3% | | | |
| Semiconductor Materials & Equipment - 2.0% | | | |
| ASML Holding NV (Netherlands) | | 53,700 | 38,463,635 |
| Teradyne, Inc. | | 581,200 | 65,640,728 |
| | | | 104,104,363 |
| Semiconductors - 31.3% | | | |
| GlobalFoundries, Inc. (a) | | 1,850,000 | 117,826,500 |
| Marvell Technology, Inc. | | 3,721,260 | 242,365,664 |
| Microchip Technology, Inc. | | 291,600 | 27,392,904 |
| NVIDIA Corp. | | 1,454,700 | 679,766,763 |
| NXP Semiconductors NV | | 1,049,280 | 233,968,454 |
| ON Semiconductor Corp. (a) | | 2,096,700 | 225,919,425 |
| Taiwan Semiconductor Manufacturing Co. Ltd. | | 4,225,000 | 76,149,204 |
| | | | 1,603,388,914 |
TOTAL SEMICONDUCTORS & SEMICONDUCTOR EQUIPMENT | | | 1,707,493,277 |
| Software - 29.4% | | | |
| Application Software - 9.3% | | | |
| Bill Holdings, Inc. (a)(d) | | 421,400 | 52,818,276 |
| Convoy, Inc. warrants (a)(b)(c) | | 5,358 | 15,485 |
| Dynatrace, Inc. (a) | | 615,500 | 33,661,695 |
| HashiCorp, Inc. (a) | | 1,111,779 | 32,919,776 |
| HubSpot, Inc. (a) | | 84,403 | 49,000,162 |
| Intuit, Inc. | | 46,600 | 23,845,220 |
| Manhattan Associates, Inc. (a) | | 136,877 | 26,091,494 |
| Pine Labs Private Ltd. (a)(b)(c) | | 3,660 | 1,955,392 |
| Salesforce, Inc. (a) | | 729,739 | 164,198,572 |
| Splunk, Inc. (a) | | 866,180 | 93,833,279 |
| | | | 478,339,351 |
| Systems Software - 20.1% | | | |
| Microsoft Corp. | | 2,594,800 | 871,645,216 |
| ServiceNow, Inc. (a) | | 268,469 | 156,517,427 |
| | | | 1,028,162,643 |
TOTAL SOFTWARE | | | 1,506,501,994 |
| Technology Hardware, Storage & Peripherals - 17.4% | | | |
| Technology Hardware, Storage & Peripherals - 17.4% | | | |
| Apple, Inc. | | 4,469,416 | 878,016,776 |
| IonQ, Inc. (a)(b) | | 119,300 | 2,296,525 |
| Seagate Technology Holdings PLC | | 189,455 | 12,030,393 |
| | | | 892,343,694 |
| TOTAL COMMON STOCKS (Cost $2,575,955,918) | | | 5,022,986,097 |
| | | | |
| Preferred Stocks - 1.5% |
| | | Shares | Value ($) |
| Convertible Preferred Stocks - 1.3% | | | |
| Aerospace & Defense - 0.2% | | | |
| Aerospace & Defense - 0.2% | | | |
| Relativity Space, Inc. Series E (a)(b)(c) | | 482,616 | 8,720,871 |
| | | | |
| Broadline Retail - 0.1% | | | |
| Broadline Retail - 0.1% | | | |
| Meesho Series F (a)(b)(c) | | 46,600 | 3,686,526 |
| | | | |
| Consumer Staples Distribution & Retail - 0.1% | | | |
| Consumer Staples Merchandise Retail - 0.0% | | | |
| Instacart, Inc. Series I (a)(b)(c) | | 29,110 | 1,312,861 |
| | | | |
| Food Retail - 0.1% | | | |
| GoBrands, Inc. Series G (a)(b)(c) | | 14,100 | 1,405,911 |
| | | | |
TOTAL CONSUMER STAPLES DISTRIBUTION & RETAIL | | | 2,718,772 |
| | | | |
| Electronic Equipment, Instruments & Components - 0.1% | | | |
| Electronic Equipment & Instruments - 0.1% | | | |
| Enevate Corp. Series E (a)(b)(c) | | 9,477,386 | 5,781,205 |
| | | | |
| Hotels, Restaurants & Leisure - 0.0% | | | |
| Casinos & Gaming - 0.0% | | | |
| Discord, Inc. Series I (a)(b)(c) | | 500 | 161,805 |
| | | | |
| Interactive Media & Services - 0.3% | | | |
| Interactive Media & Services - 0.3% | | | |
| ByteDance Ltd. Series E1 (a)(b)(c) | | 26,036 | 6,242,131 |
| Reddit, Inc.: | | | |
| Series D(a)(b)(c) | | 94,300 | 3,344,821 |
| Series E(a)(b)(c) | | 5,300 | 187,991 |
| Series F(a)(b)(c) | | 154,614 | 5,484,159 |
| | | | 15,259,102 |
| Metals & Mining - 0.1% | | | |
| Precious Metals & Minerals - 0.1% | | | |
| Diamond Foundry, Inc. Series C (a)(b)(c) | | 151,757 | 5,044,403 |
| | | | |
| Semiconductors & Semiconductor Equipment - 0.2% | | | |
| Semiconductor Materials & Equipment - 0.2% | | | |
| Astera Labs, Inc.: | | | |
| Series A(a)(b)(c) | | 144,502 | 1,456,580 |
| Series B(a)(b)(c) | | 24,603 | 247,998 |
| Series C(a)(b)(c) | | 135,400 | 1,364,832 |
| Series D(a)(b)(c) | | 590,802 | 5,955,284 |
| | | | 9,024,694 |
| Semiconductors - 0.0% | | | |
| Retym, Inc. Series C (b)(c) | | 139,441 | 1,084,851 |
| SiMa.ai: | | | |
| Series B(a)(b)(c) | | 231,000 | 1,425,270 |
| Series B1(a)(b)(c) | | 100,683 | 725,924 |
| Xsight Labs Ltd. Series D (a)(b)(c) | | 101,300 | 582,475 |
| | | | 3,818,520 |
TOTAL SEMICONDUCTORS & SEMICONDUCTOR EQUIPMENT | | | 12,843,214 |
| | | | |
| Software - 0.2% | | | |
| Application Software - 0.2% | | | |
| Convoy, Inc. Series D (a)(b)(c) | | 81,762 | 505,289 |
| Databricks, Inc.: | | | |
| Series G(a)(b)(c) | | 37,800 | 1,924,020 |
| Series H(a)(b)(c) | | 99,786 | 5,079,107 |
| | | | 7,508,416 |
| Systems Software - 0.0% | | | |
| Tenstorrent, Inc. Series C1 (a)(b)(c) | | 6,600 | 407,418 |
| | | | |
TOTAL SOFTWARE | | | 7,915,834 |
| | | | |
| Technology Hardware, Storage & Peripherals - 0.0% | | | |
| Technology Hardware, Storage & Peripherals - 0.0% | | | |
| Lightmatter, Inc. Series C (b)(c) | | 82,421 | 1,350,056 |
| | | | |
| TOTAL CONVERTIBLE PREFERRED STOCKS | | | 63,481,788 |
| Nonconvertible Preferred Stocks - 0.2% | | | |
| Software - 0.2% | | | |
| Application Software - 0.2% | | | |
| Pine Labs Private Ltd.: | | | |
| Series 1(a)(b)(c) | | 8,747 | 4,673,172 |
| Series A(a)(b)(c) | | 2,186 | 1,167,892 |
| Series B(a)(b)(c) | | 2,378 | 1,270,470 |
| Series B2(a)(b)(c) | | 1,923 | 1,027,382 |
| Series C(a)(b)(c) | | 3,578 | 1,911,582 |
| Series C1(a)(b)(c) | | 754 | 402,832 |
| Series D(a)(b)(c) | | 806 | 430,614 |
| | | | 10,883,944 |
| TOTAL PREFERRED STOCKS (Cost $82,851,266) | | | 74,365,732 |
| | | | |
| Convertible Bonds - 0.0% |
| | | Principal Amount (e) | Value ($) |
| Software - 0.0% | | | |
| Application Software - 0.0% | | | |
Convoy, Inc. 15% 9/30/26 (b)(c) (Cost $35,680) | | 35,680 | 38,249 |
| | | | |
| Preferred Securities - 0.0% |
| | | Principal Amount (e) | Value ($) |
| Software - 0.0% | | | |
| Systems Software - 0.0% | | | |
Tenstorrent, Inc. 0% (b)(c)(f) (Cost $370,000) | | 370,000 | 384,060 |
| | | | |
| Money Market Funds - 0.3% |
| | | Shares | Value ($) |
| Fidelity Cash Central Fund 5.32% (g) | | 12,457,583 | 12,460,075 |
| Fidelity Securities Lending Cash Central Fund 5.32% (g)(h) | | 5,022,757 | 5,023,259 |
| TOTAL MONEY MARKET FUNDS (Cost $17,483,334) | | | 17,483,334 |
| | | | |
| TOTAL INVESTMENT IN SECURITIES - 99.9% (Cost $2,676,696,198) | 5,115,257,472 |
NET OTHER ASSETS (LIABILITIES) - 0.1% | 4,499,608 |
| NET ASSETS - 100.0% | 5,119,757,080 |
| | |
Legend
| (b) | Restricted securities (including private placements) - Investment in securities not registered under the Securities Act of 1933 (excluding 144A issues). At the end of the period, the value of restricted securities (excluding 144A issues) amounted to $83,122,738 or 1.6% of net assets. |
| (d) | Security or a portion of the security is on loan at period end. |
| (e) | Amount is stated in United States dollars unless otherwise noted. |
| (f) | Security is perpetual in nature with no stated maturity date. |
| (g) | Affiliated fund that is generally available only to investment companies and other accounts managed by Fidelity Investments. The rate quoted is the annualized seven-day yield of the fund at period end. A complete unaudited listing of the fund's holdings as of its most recent quarter end is available upon request. In addition, each Fidelity Central Fund's financial statements, which are not covered by the Fund's Report of Independent Registered Public Accounting Firm, are available on the SEC's website or upon request. |
| (h) | Investment made with cash collateral received from securities on loan. |
| Additional information on each restricted holding is as follows: |
| Security | Acquisition Date | Acquisition Cost ($) |
| Ant International Co. Ltd. Class C | 5/16/18 | 8,245,741 |
| | | |
| Astera Labs, Inc. Series A | 5/17/22 | 1,469,513 |
| | | |
| Astera Labs, Inc. Series B | 5/17/22 | 250,200 |
| | | |
| Astera Labs, Inc. Series C | 8/24/21 | 455,188 |
| | | |
| Astera Labs, Inc. Series D | 5/17/22 - 5/27/22 | 6,008,161 |
| | | |
| ByteDance Ltd. Series E1 | 11/18/20 | 2,852,873 |
| | | |
| Convoy, Inc. Series D | 10/30/19 | 1,107,057 |
| | | |
| Convoy, Inc. warrants | 3/24/23 | 0 |
| | | |
| Convoy, Inc. 15% 9/30/26 | 3/24/23 | 35,680 |
| | | |
| Databricks, Inc. Series G | 2/01/21 | 2,234,836 |
| | | |
| Databricks, Inc. Series H | 8/31/21 | 7,332,688 |
| | | |
| Diamond Foundry, Inc. Series C | 3/15/21 | 3,642,168 |
| | | |
| Discord, Inc. Series I | 9/15/21 | 275,312 |
| | | |
| Enevate Corp. Series E | 1/29/21 | 10,507,436 |
| | | |
| GoBrands, Inc. Series G | 3/02/21 | 3,521,014 |
| | | |
| Instacart, Inc. Series I | 2/26/21 | 3,638,750 |
| | | |
| IonQ, Inc. | 3/07/21 | 1,193,000 |
| | | |
| Lightmatter, Inc. Series C | 5/19/23 | 1,356,386 |
| | | |
| Meesho Series F | 9/21/21 | 3,572,929 |
| | | |
| Pine Labs Private Ltd. | 6/30/21 | 1,364,668 |
| | | |
| Pine Labs Private Ltd. Series 1 | 6/30/21 | 3,261,406 |
| | | |
| Pine Labs Private Ltd. Series A | 6/30/21 | 815,072 |
| | | |
| Pine Labs Private Ltd. Series B | 6/30/21 | 886,661 |
| | | |
| Pine Labs Private Ltd. Series B2 | 6/30/21 | 717,010 |
| | | |
| Pine Labs Private Ltd. Series C | 6/30/21 | 1,334,093 |
| | | |
| Pine Labs Private Ltd. Series C1 | 6/30/21 | 281,136 |
| | | |
| Pine Labs Private Ltd. Series D | 6/30/21 | 300,525 |
| | | |
| Reddit, Inc. Series D | 2/04/19 | 2,045,018 |
| | | |
| Reddit, Inc. Series E | 5/18/21 | 225,113 |
| | | |
| Reddit, Inc. Series F | 8/11/21 | 9,554,279 |
| | | |
| Relativity Space, Inc. Series E | 5/27/21 | 11,020,585 |
| | | |
| Retym, Inc. Series C | 5/17/23 - 6/20/23 | 1,085,102 |
| | | |
| SiMa.ai Series B | 5/10/21 | 1,184,429 |
| | | |
| SiMa.ai Series B1 | 4/25/22 - 10/17/22 | 713,934 |
| | | |
| Tenstorrent, Inc. Series C1 | 4/23/21 | 392,398 |
| | | |
| Tenstorrent, Inc. 0% | 4/23/21 | 370,000 |
| | | |
| Xsight Labs Ltd. Series D | 2/16/21 | 809,995 |
| | | |
Affiliated Central Funds
Fiscal year to date information regarding the Fund's investments in Fidelity Central Funds, including the ownership percentage, is presented below.
| Affiliate | Value, beginning of period ($) | Purchases ($) | Sales Proceeds ($) | Dividend Income ($) | Realized Gain (loss) ($) | Change in Unrealized appreciation (depreciation) ($) | Value, end of period ($) | % ownership, end of period |
| Fidelity Cash Central Fund 5.32% | 66,682,813 | 764,782,198 | 819,004,936 | 2,292,269 | - | - | 12,460,075 | 0.0% |
| Fidelity Securities Lending Cash Central Fund 5.32% | 3,262,284 | 302,054,775 | 300,293,800 | 310,792 | - | - | 5,023,259 | 0.0% |
| Total | 69,945,097 | 1,066,836,973 | 1,119,298,736 | 2,603,061 | - | - | 17,483,334 | |
| | | | | | | | | |
Amounts in the dividend income column in the above table include any capital gain distributions from underlying funds, which are presented in the corresponding line item in the Statement of Operations, if applicable.
Amounts in the dividend income column for Fidelity Securities Lending Cash Central Fund represents the income earned on investing cash collateral, less rebates paid to borrowers and any lending agent fees associated with the loan, plus any premium payments received for lending certain types of securities.
Amounts included in the purchases and sales proceeds columns may include in-kind transactions, if applicable.
Investment Valuation
The following is a summary of the inputs used, as of July 31, 2023, involving the Fund's assets and liabilities carried at fair value. The inputs or methodology used for valuing securities may not be an indication of the risk associated with investing in those securities. For more information on valuation inputs, and their aggregation into the levels used below, please refer to the Investment Valuation section in the accompanying Notes to Financial Statements.
| Valuation Inputs at Reporting Date: |
| Description | Total ($) | Level 1 ($) | Level 2 ($) | Level 3 ($) |
Investments in Securities: | | | | |
|
| Common Stocks | 5,022,986,097 | 4,902,133,284 | 114,612,839 | 6,239,974 |
|
| Preferred Stocks | 74,365,732 | - | - | 74,365,732 |
|
| Convertible Bonds | 38,249 | - | - | 38,249 |
|
| Preferred Securities | 384,060 | - | - | 384,060 |
|
| Money Market Funds | 17,483,334 | 17,483,334 | - | - |
| Total Investments in Securities: | 5,115,257,472 | 4,919,616,618 | 114,612,839 | 81,028,015 |
The following is a reconciliation of Investments in Securities for which Level 3 inputs were used in determining value:
| |
| Investments in Securities: | |
| Preferred Stocks | | | |
| Beginning Balance | $ | 78,187,657 | |
| Net Realized Gain (Loss) on Investment Securities | | - | |
| Net Unrealized Gain (Loss) on Investment Securities | | (6,867,628) | |
| Cost of Purchases | | 3,045,703 | |
| Proceeds of Sales | | - | |
| Amortization/Accretion | | - | |
| Transfers into Level 3 | | - | |
| Transfers out of Level 3 | | - | |
| Ending Balance | $ | 74,365,732 | |
| The change in unrealized gain (loss) for the period attributable to Level 3 securities held at July 31, 2023 | $ | (6,867,628) | |
| Other Investments in Securities | | | |
| Beginning Balance | $ | 10,743,924 | |
| Net Realized Gain (Loss) on Investment Securities | | - | |
| Net Unrealized Gain (Loss) on Investment Securities | | (82,265) | |
| Cost of Purchases | | 35,680 | |
| Proceeds of Sales | | (4,035,056) | |
| Amortization/Accretion | | - | |
| Transfers into Level 3 | | - | |
| Transfers out of Level 3 | | - | |
| Ending Balance | $ | 6,662,283 | |
| The change in unrealized gain (loss) for the period attributable to Level 3 securities held at July 31, 2023 | $ | (82,265) | |
| The information used in the above reconciliation represents fiscal year to date activity for any Investments in Securities identified as using Level 3 inputs at either the beginning or the end of the current fiscal period. Cost of purchases and proceeds of sales may include securities received and/or delivered through in-kind transactions, corporate actions or exchanges. Transfers into Level 3 were attributable to a lack of observable market data resulting from decreases in market activity, decreases in liquidity, security restructurings or corporate actions. Transfers out of Level 3 were attributable to observable market data becoming available for those securities. Transfers in or out of Level 3 represent the beginning value of any Security or Instrument where a change in the pricing level occurred from the beginning to the end of the period. Realized and unrealized gains (losses) disclosed in the reconciliation are included in Net Gain (Loss) on the Fund's Statement of Operations. | |
Fidelity Advisor® Technology Fund
| Statement of Assets and Liabilities |
| | | | July 31, 2023 |
| | | | | |
| Assets | | | | |
| Investment in securities, at value (including securities loaned of $4,940,322) - See accompanying schedule: | | | | |
Unaffiliated issuers (cost $2,659,212,864) | $ | 5,097,774,138 | | |
Fidelity Central Funds (cost $17,483,334) | | 17,483,334 | | |
| | | | | |
| | | | | |
| Total Investment in Securities (cost $2,676,696,198) | | | $ | 5,115,257,472 |
| Receivable for investments sold | | | | 20,345,896 |
| Receivable for fund shares sold | | | | 6,089,844 |
| Dividends receivable | | | | 235,979 |
| Interest receivable | | | | 1,903 |
| Distributions receivable from Fidelity Central Funds | | | | 140,039 |
| Prepaid expenses | | | | 12,924 |
| Other receivables | | | | 140,704 |
Total assets | | | | 5,142,224,761 |
| Liabilities | | | | |
| Payable for investments purchased | $ | 10,234,320 | | |
| Payable for fund shares redeemed | | 3,298,566 | | |
| Accrued management fee | | 2,174,701 | | |
| Distribution and service plan fees payable | | 895,611 | | |
| Other affiliated payables | | 660,736 | | |
| Other payables and accrued expenses | | 196,322 | | |
| Collateral on securities loaned | | 5,007,425 | | |
| Total Liabilities | | | | 22,467,681 |
| Net Assets | | | $ | 5,119,757,080 |
| Net Assets consist of: | | | | |
| Paid in capital | | | $ | 2,591,308,148 |
| Total accumulated earnings (loss) | | | | 2,528,448,932 |
| Net Assets | | | $ | 5,119,757,080 |
| | | | | |
| Net Asset Value and Maximum Offering Price | | | | |
| Class A : | | | | |
Net Asset Value and redemption price per share ($1,906,584,694 ÷ 20,034,444 shares)(a) | | | $ | 95.17 |
| Maximum offering price per share (100/94.25 of $95.17) | | | $ | 100.98 |
| Class M : | | | | |
Net Asset Value and redemption price per share ($624,611,743 ÷ 7,186,066 shares)(a) | | | $ | 86.92 |
| Maximum offering price per share (100/96.50 of $86.92) | | | $ | 90.07 |
| Class C : | | | | |
Net Asset Value and offering price per share ($313,456,992 ÷ 4,412,235 shares)(a) | | | $ | 71.04 |
| Class I : | | | | |
Net Asset Value, offering price and redemption price per share ($1,515,475,090 ÷ 14,158,921 shares) | | | $ | 107.03 |
| Class Z : | | | | |
Net Asset Value, offering price and redemption price per share ($759,628,561 ÷ 7,094,559 shares) | | | $ | 107.07 |
(a)Redemption price per share is equal to net asset value less any applicable contingent deferred sales charge. |
| Statement of Operations |
| | | | Year ended July 31, 2023 |
| Investment Income | | | | |
| Dividends | | | $ | 24,055,920 |
| Interest | | | | 2,147 |
| Income from Fidelity Central Funds (including $310,792 from security lending) | | | | 2,603,061 |
| Total Income | | | | 26,661,128 |
| Expenses | | | | |
| Management fee | $ | 20,403,935 | | |
| Transfer agent fees | | 5,882,100 | | |
| Distribution and service plan fees | | 8,645,645 | | |
| Accounting fees | | 906,018 | | |
| Custodian fees and expenses | | 49,332 | | |
| Independent trustees' fees and expenses | | 19,493 | | |
| Registration fees | | 157,899 | | |
| Audit | | 70,476 | | |
| Legal | | 7,768 | | |
| Interest | | 2,349 | | |
| Miscellaneous | | 24,614 | | |
| Total expenses before reductions | | 36,169,629 | | |
| Expense reductions | | (204,020) | | |
| Total expenses after reductions | | | | 35,965,609 |
| Net Investment income (loss) | | | | (9,304,481) |
| Realized and Unrealized Gain (Loss) | | | | |
| Net realized gain (loss) on: | | | | |
| Investment Securities: | | | | |
| Unaffiliated issuers (net of foreign taxes of $880,311) | | 139,830,496 | | |
| Foreign currency transactions | | (9,783) | | |
| Total net realized gain (loss) | | | | 139,820,713 |
| Change in net unrealized appreciation (depreciation) on: | | | | |
| Investment Securities: | | | | |
| Unaffiliated issuers(net of decrease in deferred foreign taxes of $875,019) | | 1,053,541,597 | | |
| Assets and liabilities in foreign currencies | | 2,534 | | |
| Total change in net unrealized appreciation (depreciation) | | | | 1,053,544,131 |
| Net gain (loss) | | | | 1,193,364,844 |
| Net increase (decrease) in net assets resulting from operations | | | $ | 1,184,060,363 |
| Statement of Changes in Net Assets |
| |
| | Year ended July 31, 2023 | | Year ended July 31, 2022 |
| Increase (Decrease) in Net Assets | | | | |
| Operations | | | | |
| Net investment income (loss) | $ | (9,304,481) | $ | (17,513,519) |
| Net realized gain (loss) | | 139,820,713 | | 197,665,080 |
| Change in net unrealized appreciation (depreciation) | | 1,053,544,131 | | (964,396,406) |
| Net increase (decrease) in net assets resulting from operations | | 1,184,060,363 | | (784,244,845) |
| Distributions to shareholders | | (117,622,896) | | (600,971,502) |
| | | | | |
| Share transactions - net increase (decrease) | | 221,530,897 | | 337,954,182 |
| Total increase (decrease) in net assets | | 1,287,968,364 | | (1,047,262,165) |
| | | | | |
| Net Assets | | | | |
| Beginning of period | | 3,831,788,716 | | 4,879,050,881 |
| End of period | $ | 5,119,757,080 | $ | 3,831,788,716 |
| | | | | |
| | | | | |
| Fidelity Advisor® Technology Fund Class A |
| |
| Years ended July 31, | | 2023 | | 2022 | | 2021 | | 2020 | | 2019 |
Selected Per-Share Data | | | | | | | | | | |
| Net asset value, beginning of period | $ | 75.41 | $ | 102.43 | $ | 76.36 | $ | 52.61 | $ | 60.37 |
| Income from Investment Operations | | | | | | | | | | |
Net investment income (loss) A,B | | (.21) | | (.37) | | (.39) | | (.12) | | .02 |
| Net realized and unrealized gain (loss) | | 22.28 | | (13.94) | | 33.48 | | 25.35 | | 1.84 |
| Total from investment operations | | 22.07 | | (14.31) | | 33.09 | | 25.23 | | 1.86 |
| Distributions from net realized gain | | (2.31) | | (12.71) | | (7.02) | | (1.48) | | (9.62) |
| Total distributions | | (2.31) | | (12.71) | | (7.02) | | (1.48) | | (9.62) |
| Net asset value, end of period | $ | 95.17 | $ | 75.41 | $ | 102.43 | $ | 76.36 | $ | 52.61 |
Total Return C,D | | 30.51% | | (16.78)% | | 44.80% | | 48.83% | | 7.26% |
Ratios to Average Net Assets B,E,F | | | | | | | | | | |
| Expenses before reductions | | .98% | | .97% | | .98% | | 1.01% | | 1.03% |
| Expenses net of fee waivers, if any | | .98% | | .97% | | .98% | | 1.01% | | 1.03% |
| Expenses net of all reductions | | .98% | | .97% | | .98% | | 1.01% | | 1.02% |
| Net investment income (loss) | | (.29)% | | (.41)% | | (.43)% | | (.20)% | | .04% |
| Supplemental Data | | | | | | | | | | |
| Net assets, end of period (000 omitted) | $ | 1,906,585 | $ | 1,467,792 | $ | 1,848,643 | $ | 1,339,059 | $ | 884,749 |
Portfolio turnover rate G | | 30% | | 20% | | 44% | | 40% H | | 88% |
ACalculated based on average shares outstanding during the period.
BNet investment income (loss) is affected by the timing of the declaration of dividends by any underlying mutual funds or exchange-traded funds (ETFs). Net investment income (loss) of any mutual funds or ETFs is not included in the Fund's net investment income (loss) ratio.
CTotal returns would have been lower if certain expenses had not been reduced during the applicable periods shown.
DTotal returns do not include the effect of the sales charges.
EFees and expenses of any underlying mutual funds or exchange-traded funds (ETFs) are not included in the Fund's expense ratio. The Fund indirectly bears its proportionate share of these expenses. For additional expense information related to investments in Fidelity Central Funds, please refer to the "Investments in Fidelity Central Funds" note found in the Notes to Financial Statements section of the most recent Annual or Semi-Annual report.
FExpense ratios reflect operating expenses of the class. Expenses before reductions do not reflect amounts reimbursed, waived, or reduced through arrangements with the investment adviser, brokerage services, or other offset arrangements, if applicable, and do not represent the amount paid by the class during periods when reimbursements, waivers or reductions occur.
GAmount does not include the portfolio activity of any underlying mutual funds or exchange-traded funds (ETFs).
HPortfolio turnover rate excludes securities received or delivered in-kind.
| Fidelity Advisor® Technology Fund Class M |
| |
| Years ended July 31, | | 2023 | | 2022 | | 2021 | | 2020 | | 2019 |
Selected Per-Share Data | | | | | | | | | | |
| Net asset value, beginning of period | $ | 69.25 | $ | 95.15 | $ | 71.37 | $ | 49.28 | $ | 57.23 |
| Income from Investment Operations | | | | | | | | | | |
Net investment income (loss) A,B | | (.36) | | (.55) | | (.57) | | (.25) | | (.10) |
| Net realized and unrealized gain (loss) | | 20.34 | | (12.76) | | 31.22 | | 23.71 | | 1.63 |
| Total from investment operations | | 19.98 | | (13.31) | | 30.65 | | 23.46 | | 1.53 |
| Distributions from net realized gain | | (2.31) | | (12.59) | | (6.87) | | (1.37) | | (9.48) |
| Total distributions | | (2.31) | | (12.59) | | (6.87) | | (1.37) | | (9.48) |
| Net asset value, end of period | $ | 86.92 | $ | 69.25 | $ | 95.15 | $ | 71.37 | $ | 49.28 |
Total Return C,D | | 30.20% | | (16.99)% | | 44.47% | | 48.44% | | 7.00% |
Ratios to Average Net Assets B,E,F | | | | | | | | | | |
| Expenses before reductions | | 1.22% | | 1.21% | | 1.23% | | 1.26% | | 1.28% |
| Expenses net of fee waivers, if any | | 1.22% | | 1.21% | | 1.23% | | 1.26% | | 1.28% |
| Expenses net of all reductions | | 1.22% | | 1.21% | | 1.22% | | 1.26% | | 1.28% |
| Net investment income (loss) | | (.53)% | | (.65)% | | (.68)% | | (.45)% | | (.22)% |
| Supplemental Data | | | | | | | | | | |
| Net assets, end of period (000 omitted) | $ | 624,612 | $ | 484,293 | $ | 624,534 | $ | 464,093 | $ | 321,915 |
Portfolio turnover rate G | | 30% | | 20% | | 44% | | 40% H | | 88% |
ACalculated based on average shares outstanding during the period.
BNet investment income (loss) is affected by the timing of the declaration of dividends by any underlying mutual funds or exchange-traded funds (ETFs). Net investment income (loss) of any mutual funds or ETFs is not included in the Fund's net investment income (loss) ratio.
CTotal returns would have been lower if certain expenses had not been reduced during the applicable periods shown.
DTotal returns do not include the effect of the sales charges.
EFees and expenses of any underlying mutual funds or exchange-traded funds (ETFs) are not included in the Fund's expense ratio. The Fund indirectly bears its proportionate share of these expenses. For additional expense information related to investments in Fidelity Central Funds, please refer to the "Investments in Fidelity Central Funds" note found in the Notes to Financial Statements section of the most recent Annual or Semi-Annual report.
FExpense ratios reflect operating expenses of the class. Expenses before reductions do not reflect amounts reimbursed, waived, or reduced through arrangements with the investment adviser, brokerage services, or other offset arrangements, if applicable, and do not represent the amount paid by the class during periods when reimbursements, waivers or reductions occur.
GAmount does not include the portfolio activity of any underlying mutual funds or exchange-traded funds (ETFs).
HPortfolio turnover rate excludes securities received or delivered in-kind.
| Fidelity Advisor® Technology Fund Class C |
| |
| Years ended July 31, | | 2023 | | 2022 | | 2021 | | 2020 | | 2019 |
Selected Per-Share Data | | | | | | | | | | |
| Net asset value, beginning of period | $ | 57.35 | $ | 80.98 | $ | 61.67 | $ | 42.81 | $ | 51.18 |
| Income from Investment Operations | | | | | | | | | | |
Net investment income (loss) A,B | | (.58) | | (.83) | | (.85) | | (.46) | | (.30) |
| Net realized and unrealized gain (loss) | | 16.58 | | (10.43) | | 26.79 | | 20.52 | | 1.22 |
| Total from investment operations | | 16.00 | | (11.26) | | 25.94 | | 20.06 | | .92 |
| Distributions from net realized gain | | (2.31) | | (12.37) | | (6.63) | | (1.20) | | (9.29) |
| Total distributions | | (2.31) | | (12.37) | | (6.63) | | (1.20) | | (9.29) |
| Net asset value, end of period | $ | 71.04 | $ | 57.35 | $ | 80.98 | $ | 61.67 | $ | 42.81 |
Total Return C,D | | 29.50% | | (17.41)% | | 43.73% | | 47.69% | | 6.44% |
Ratios to Average Net Assets B,E,F | | | | | | | | | | |
| Expenses before reductions | | 1.75% | | 1.73% | | 1.75% | | 1.77% | | 1.79% |
| Expenses net of fee waivers, if any | | 1.74% | | 1.73% | | 1.74% | | 1.77% | | 1.79% |
| Expenses net of all reductions | | 1.74% | | 1.73% | | 1.74% | | 1.77% | | 1.78% |
| Net investment income (loss) | | (1.05)% | | (1.17)% | | (1.20)% | | (.96)% | | (.72)% |
| Supplemental Data | | | | | | | | | | |
| Net assets, end of period (000 omitted) | $ | 313,457 | $ | 288,008 | $ | 410,661 | $ | 343,585 | $ | 240,358 |
Portfolio turnover rate G | | 30% | | 20% | | 44% | | 40% H | | 88% |
ACalculated based on average shares outstanding during the period.
BNet investment income (loss) is affected by the timing of the declaration of dividends by any underlying mutual funds or exchange-traded funds (ETFs). Net investment income (loss) of any mutual funds or ETFs is not included in the Fund's net investment income (loss) ratio.
CTotal returns would have been lower if certain expenses had not been reduced during the applicable periods shown.
DTotal returns do not include the effect of the contingent deferred sales charge.
EFees and expenses of any underlying mutual funds or exchange-traded funds (ETFs) are not included in the Fund's expense ratio. The Fund indirectly bears its proportionate share of these expenses. For additional expense information related to investments in Fidelity Central Funds, please refer to the "Investments in Fidelity Central Funds" note found in the Notes to Financial Statements section of the most recent Annual or Semi-Annual report.
FExpense ratios reflect operating expenses of the class. Expenses before reductions do not reflect amounts reimbursed, waived, or reduced through arrangements with the investment adviser, brokerage services, or other offset arrangements, if applicable, and do not represent the amount paid by the class during periods when reimbursements, waivers or reductions occur.
GAmount does not include the portfolio activity of any underlying mutual funds or exchange-traded funds (ETFs).
HPortfolio turnover rate excludes securities received or delivered in-kind.
| Fidelity Advisor® Technology Fund Class I |
| |
| Years ended July 31, | | 2023 | | 2022 | | 2021 | | 2020 | | 2019 |
Selected Per-Share Data | | | | | | | | | | |
| Net asset value, beginning of period | $ | 84.29 | $ | 112.95 | $ | 83.56 | $ | 57.41 | $ | 64.86 |
| Income from Investment Operations | | | | | | | | | | |
Net investment income (loss) A,B | | (.02) | | (.15) | | (.17) | | .04 | | .17 |
| Net realized and unrealized gain (loss) | | 25.07 | | (15.67) | | 36.76 | | 27.72 | | 2.15 |
| Total from investment operations | | 25.05 | | (15.82) | | 36.59 | | 27.76 | | 2.32 |
| Distributions from net investment income | | - | | - | | - | | - | | (.01) |
| Distributions from net realized gain | | (2.31) | | (12.84) | | (7.20) | | (1.61) | | (9.76) |
| Total distributions | | (2.31) | | (12.84) | | (7.20) | | (1.61) | | (9.77) |
| Net asset value, end of period | $ | 107.03 | $ | 84.29 | $ | 112.95 | $ | 83.56 | $ | 57.41 |
Total Return C | | 30.84% | | (16.56)% | | 45.18% | | 49.22% | | 7.56% |
Ratios to Average Net Assets B,D,E | | | | | | | | | | |
| Expenses before reductions | | .72% | | .71% | | .72% | | .74% | | .76% |
| Expenses net of fee waivers, if any | | .71% | | .71% | | .72% | | .74% | | .76% |
| Expenses net of all reductions | | .71% | | .71% | | .72% | | .74% | | .76% |
| Net investment income (loss) | | (.03)% | | (.15)% | | (.18)% | | .07% | | .30% |
| Supplemental Data | | | | | | | | | | |
| Net assets, end of period (000 omitted) | $ | 1,515,475 | $ | 1,129,418 | $ | 1,470,830 | $ | 1,035,091 | $ | 674,914 |
Portfolio turnover rate F | | 30% | | 20% | | 44% | | 40% G | | 88% |
ACalculated based on average shares outstanding during the period.
BNet investment income (loss) is affected by the timing of the declaration of dividends by any underlying mutual funds or exchange-traded funds (ETFs). Net investment income (loss) of any mutual funds or ETFs is not included in the Fund's net investment income (loss) ratio.
CTotal returns would have been lower if certain expenses had not been reduced during the applicable periods shown.
DFees and expenses of any underlying mutual funds or exchange-traded funds (ETFs) are not included in the Fund's expense ratio. The Fund indirectly bears its proportionate share of these expenses. For additional expense information related to investments in Fidelity Central Funds, please refer to the "Investments in Fidelity Central Funds" note found in the Notes to Financial Statements section of the most recent Annual or Semi-Annual report.
EExpense ratios reflect operating expenses of the class. Expenses before reductions do not reflect amounts reimbursed, waived, or reduced through arrangements with the investment adviser, brokerage services, or other offset arrangements, if applicable, and do not represent the amount paid by the class during periods when reimbursements, waivers or reductions occur.
FAmount does not include the portfolio activity of any underlying mutual funds or exchange-traded funds (ETFs).
GPortfolio turnover rate excludes securities received or delivered in-kind.
| Fidelity Advisor® Technology Fund Class Z |
| |
| Years ended July 31, | | 2023 | | 2022 | | 2021 | | 2020 | | 2019 A |
Selected Per-Share Data | | | | | | | | | | |
| Net asset value, beginning of period | $ | 84.22 | $ | 112.81 | $ | 83.44 | $ | 57.34 | $ | 67.88 |
| Income from Investment Operations | | | | | | | | | | |
Net investment income (loss) B,C | | .08 | | (.04) | | (.06) | | .12 | | .23 |
| Net realized and unrealized gain (loss) | | 25.08 | | (15.63) | | 36.72 | | 27.68 | | (.90) |
| Total from investment operations | | 25.16 | | (15.67) | | 36.66 | | 27.80 | | (.67) |
| Distributions from net investment income | | - | | - | | - | | - | | (.11) |
| Distributions from net realized gain | | (2.31) | | (12.92) | | (7.29) | | (1.70) | | (9.76) |
| Total distributions | | (2.31) | | (12.92) | | (7.29) | | (1.70) | | (9.87) |
| Net asset value, end of period | $ | 107.07 | $ | 84.22 | $ | 112.81 | $ | 83.44 | $ | 57.34 |
Total Return D,E | | 31.00% | | (16.46)% | | 45.37% | | 49.39% | | 2.88% |
Ratios to Average Net Assets C,F,G | | | | | | | | | | |
| Expenses before reductions | | .60% | | .59% | | .60% | | .62% | | .63% H |
| Expenses net of fee waivers, if any | | .59% | | .59% | | .60% | | .62% | | .63% H |
| Expenses net of all reductions | | .59% | | .59% | | .60% | | .62% | | .62% H |
| Net investment income (loss) | | .09% | | (.04)% | | (.06)% | | .19% | | .53% H |
| Supplemental Data | | | | | | | | | | |
| Net assets, end of period (000 omitted) | $ | 759,629 | $ | 462,278 | $ | 524,383 | $ | 298,255 | $ | 31,619 |
Portfolio turnover rate I | | 30% | | 20% | | 44% | | 40% J | | 88% |
AFor the period October 2, 2018 (commencement of sale of shares) through July 31, 2019.
BCalculated based on average shares outstanding during the period.
CNet investment income (loss) is affected by the timing of the declaration of dividends by any underlying mutual funds or exchange-traded funds (ETFs). Net investment income (loss) of any mutual funds or ETFs is not included in the Fund's net investment income (loss) ratio.
DTotal returns for periods of less than one year are not annualized.
ETotal returns would have been lower if certain expenses had not been reduced during the applicable periods shown.
FFees and expenses of any underlying mutual funds or exchange-traded funds (ETFs) are not included in the Fund's expense ratio. The Fund indirectly bears its proportionate share of these expenses. For additional expense information related to investments in Fidelity Central Funds, please refer to the "Investments in Fidelity Central Funds" note found in the Notes to Financial Statements section of the most recent Annual or Semi-Annual report.
GExpense ratios reflect operating expenses of the class. Expenses before reductions do not reflect amounts reimbursed, waived, or reduced through arrangements with the investment adviser, brokerage services, or other offset arrangements, if applicable, and do not represent the amount paid by the class during periods when reimbursements, waivers or reductions occur.
HAnnualized.
IAmount does not include the portfolio activity of any underlying mutual funds or exchange-traded funds (ETFs).
JPortfolio turnover rate excludes securities received or delivered in-kind.
Average annual total return reflects the change in the value of an investment, assuming reinvestment of distributions from dividend income and capital gains (the profits earned upon the sale of securities that have grown in value, if any) and assuming a constant rate of performance each year. The hypothetical investment and the average annual total returns do not reflect the deduction of taxes that a shareholder would pay on fund distributions or the redemption of fund shares. During periods of reimbursement by Fidelity, a fund's total return will be greater than it would be had the reimbursement not occurred. How a fund did yesterday is no guarantee of how it will do tomorrow.
| Average Annual Total Returns |
| | | | |
Periods ended July 31, 2023 | Past 1 year | Past 5 years | Past 10 years |
Class A (incl. 5.75% sales charge) | -7.24% | 6.84% | 8.51% |
Class M (incl. 3.50% sales charge) | -5.28% | 7.05% | 8.45% |
Class C (incl. contingent deferred sales charge) | -3.28% | 7.29% | 8.51% |
| Class I | -1.34% | 8.40% | 9.46% |
| Class Z | -1.21% | 8.54% | 9.53% |
Class C shares' contingent deferred sales charges included in the past one year, past five years and past ten years total return figures are 1%, 0% and 0%, respectively.
The initial offering of Class Z shares took place on October 2, 2018. Returns prior to October 2, 2018, are those of Class I.
| $10,000 Over 10 Years |
| |
Let's say hypothetically that $10,000 was invested in Fidelity Advisor® Utilities Fund - Class A, a class of the fund, on July 31, 2013, and the current 5.75% sales charge was paid. The chart shows how the value of your investment would have changed, and also shows how the S&P 500® Index performed over the same period. |
|
|
Fidelity Advisor® Utilities Fund
Market Recap: U.S. equities gained 13.02% for the 12 months ending July 31, 2023, according to the S&P 500® index, as continued global economic expansion, falling commodity prices and a slowing in the pace of inflation provided a favorable backdrop for higher-risk assets. Large-cap stocks spearheaded the rally, which was driven by the shares of a narrow set of mega-cap companies in the information technology and communication services sectors, largely due to exuberance related to generative artificial intelligence. Aggressive monetary tightening by the U.S. Federal Reserve continued amid consistent pressure on core inflation, a measure that excludes food and energy. Since March 2022, the Fed has hiked its benchmark interest rate 11 times. The latest bump came in late July, a fourth consecutive raise of a stepped down 25 basis points. The S&P 500® gained 3.21% in July, as a "soft landing" of the U.S. economy became the consensus view amid better-than-expected earnings, slowing inflation and easing financial conditions, bringing the index's year-to-date gain to 20.65%. July saw a continuance of the recent shift to wider market breadth and lower dispersion. For the full 12 months, value (+17%) handily topped growth (+8%) within the index. By sector, tech (+28%), communication services (+21%) and industrials (+17%) led, whereas real estate (-10%) lagged most, due to high borrowing costs, low home inventory and a deteriorating commercial property market.
Comments from Portfolio Manager Douglas Simmons: For the fiscal year ending July 31, 2023, the fund's share classes (excluding sales charges, if applicable) returned about -2% to -1%, versus -6.58% for the MSCI US IMI Utilities 25/50 Index and 13.02% for the broad-based S&P 500® index. The biggest contributor to performance versus the sector index was stock selection in electric utilities. Stock picking and an overweight in independent power producers & energy traders also boosted the fund's relative performance. Also helping the fund's result was an underweight in multi-utilities. The top individual relative contributor was an overweight in PG&E (+62%). PG&E was one of the fund's biggest holdings. The second-largest relative contributor was an overweight in Constellation Energy (+47%), also among the fund's largest holdings. An overweight in AES Corporation (+15%) contributed as well. In contrast, the primary detractors from performance versus the sector index were picks and an overweight in renewable electricity. Security selection in integrated telecommunication services and choices in multi-utilities also modestly hampered the fund's result. The largest individual relative detractor was an overweight in NextEra Energy Partners (-31%). A second notable relative detractor was an underweight in Consolidated Edison (-6%). Consolidated Edison was not held at period end. Avoiding Atmos Energy, an index component that gained 3%, also hurt. Notable changes in positioning include increased exposure to independent power producers & energy traders and a reduced allocation to electric utilities.
The views expressed above reflect those of the portfolio manager(s) only through the end of the period as stated on the cover of this report and do not necessarily represent the views of Fidelity or any other person in the Fidelity organization. Any such views are subject to change at any time based upon market or other conditions and Fidelity disclaims any responsibility to update such views. These views may not be relied on as investment advice and, because investment decisions for a Fidelity fund are based on numerous factors, may not be relied on as an indication of trading intent on behalf of any Fidelity fund.
Fidelity Advisor® Utilities Fund
Top Holdings (% of Fund's net assets) |
| |
| NextEra Energy, Inc. | 13.8 | |
| Southern Co. | 13.0 | |
| Constellation Energy Corp. | 7.2 | |
| Sempra Energy | 6.9 | |
| PG&E Corp. | 6.9 | |
| Edison International | 4.9 | |
| American Water Works Co., Inc. | 4.5 | |
| Public Service Enterprise Group, Inc. | 4.1 | |
| Vistra Corp. | 4.0 | |
| Eversource Energy | 3.9 | |
| | 69.2 | |
| |
| Industries (% of Fund's net assets) |
| |
| Electric Utilities | 65.2 | |
| Multi-Utilities | 20.8 | |
| Independent Power and Renewable Electricity Producers | 8.4 | |
| Water Utilities | 4.6 | |
| Oil, Gas & Consumable Fuels | 1.2 | |
| Gas Utilities | 0.1 | |
| |
Fidelity Advisor® Utilities Fund
Showing Percentage of Net Assets
| Common Stocks - 100.3% |
| | | Shares | Value ($) |
| Electric Utilities - 65.2% | | | |
| Electric Utilities - 65.2% | | | |
| Constellation Energy Corp. | | 611,377 | 59,089,587 |
| Duke Energy Corp. | | 229,785 | 21,512,472 |
| Edison International | | 553,190 | 39,807,552 |
| Eversource Energy | | 443,200 | 32,056,656 |
| Exelon Corp. | | 484,572 | 20,284,184 |
| FirstEnergy Corp. | | 585,347 | 23,056,818 |
| NextEra Energy, Inc. | | 1,536,148 | 112,599,648 |
| NRG Energy, Inc. | | 417,226 | 15,850,416 |
| PG&E Corp. (a) | | 3,197,098 | 56,300,896 |
| Pinnacle West Capital Corp. | | 220,422 | 18,255,350 |
| PPL Corp. | | 636,137 | 17,512,852 |
| Southern Co. | | 1,465,372 | 106,005,010 |
| Xcel Energy, Inc. | | 177,600 | 11,140,848 |
| | | | 533,472,289 |
| Gas Utilities - 0.1% | | | |
| Gas Utilities - 0.1% | | | |
| Southwest Gas Holdings, Inc. | | 12,500 | 824,250 |
| Independent Power and Renewable Electricity Producers - 8.4% | | | |
| Independent Power Producers & Energy Traders - 6.7% | | | |
| Energy Harbor Corp. (a) | | 142,300 | 10,978,445 |
| The AES Corp. | | 516,300 | 11,167,569 |
| Vistra Corp. | | 1,179,062 | 33,084,480 |
| | | | 55,230,494 |
| Renewable Electricity - 1.7% | | | |
| Clearway Energy, Inc.: | | | |
| Class A | | 93,226 | 2,299,885 |
| Class C | | 14,800 | 390,868 |
| NextEra Energy Partners LP | | 200,700 | 10,928,115 |
| | | | 13,618,868 |
TOTAL INDEPENDENT POWER AND RENEWABLE ELECTRICITY PRODUCERS | | | 68,849,362 |
| Multi-Utilities - 20.8% | | | |
| Multi-Utilities - 20.8% | | | |
| Dominion Energy, Inc. | | 471,576 | 25,252,895 |
| DTE Energy Co. | | 241,200 | 27,569,160 |
| NiSource, Inc. | | 1,003,244 | 27,930,313 |
| Public Service Enterprise Group, Inc. | | 529,705 | 33,434,980 |
| Sempra Energy | | 379,600 | 56,567,992 |
| | | | 170,755,340 |
| Oil, Gas & Consumable Fuels - 1.2% | | | |
| Oil & Gas Storage & Transportation - 1.2% | | | |
| Cheniere Energy, Inc. | | 58,700 | 9,501,182 |
| Water Utilities - 4.6% | | | |
| Water Utilities - 4.6% | | | |
| American Water Works Co., Inc. | | 248,400 | 36,621,612 |
| Essential Utilities, Inc. | | 19,283 | 815,478 |
| | | | 37,437,090 |
| TOTAL COMMON STOCKS (Cost $677,557,256) | | | 820,839,513 |
| | | | |
| Money Market Funds - 0.1% |
| | | Shares | Value ($) |
Fidelity Securities Lending Cash Central Fund 5.32% (b)(c) (Cost $1,061,200) | | 1,061,094 | 1,061,200 |
| | | | |
| TOTAL INVESTMENT IN SECURITIES - 100.4% (Cost $678,618,456) | 821,900,713 |
NET OTHER ASSETS (LIABILITIES) - (0.4)% | (3,300,535) |
| NET ASSETS - 100.0% | 818,600,178 |
| | |
Legend
| (b) | Affiliated fund that is generally available only to investment companies and other accounts managed by Fidelity Investments. The rate quoted is the annualized seven-day yield of the fund at period end. A complete unaudited listing of the fund's holdings as of its most recent quarter end is available upon request. In addition, each Fidelity Central Fund's financial statements, which are not covered by the Fund's Report of Independent Registered Public Accounting Firm, are available on the SEC's website or upon request. |
| (c) | Investment made with cash collateral received from securities on loan. |
Affiliated Central Funds
Fiscal year to date information regarding the Fund's investments in Fidelity Central Funds, including the ownership percentage, is presented below.
| Affiliate | Value, beginning of period ($) | Purchases ($) | Sales Proceeds ($) | Dividend Income ($) | Realized Gain (loss) ($) | Change in Unrealized appreciation (depreciation) ($) | Value, end of period ($) | % ownership, end of period |
| Fidelity Cash Central Fund 5.32% | 19,544,478 | 364,516,282 | 384,060,760 | 586,283 | - | - | - | 0.0% |
| Fidelity Securities Lending Cash Central Fund 5.32% | 16,918,340 | 121,377,989 | 137,235,129 | 12,071 | - | - | 1,061,200 | 0.0% |
| Total | 36,462,818 | 485,894,271 | 521,295,889 | 598,354 | - | - | 1,061,200 | |
| | | | | | | | | |
Amounts in the dividend income column in the above table include any capital gain distributions from underlying funds, which are presented in the corresponding line item in the Statement of Operations, if applicable.
Amounts in the dividend income column for Fidelity Securities Lending Cash Central Fund represents the income earned on investing cash collateral, less rebates paid to borrowers and any lending agent fees associated with the loan, plus any premium payments received for lending certain types of securities.
Amounts included in the purchases and sales proceeds columns may include in-kind transactions, if applicable.
Investment Valuation
The following is a summary of the inputs used, as of July 31, 2023, involving the Fund's assets and liabilities carried at fair value. The inputs or methodology used for valuing securities may not be an indication of the risk associated with investing in those securities. For more information on valuation inputs, and their aggregation into the levels used below, please refer to the Investment Valuation section in the accompanying Notes to Financial Statements.
| Valuation Inputs at Reporting Date: |
| Description | Total ($) | Level 1 ($) | Level 2 ($) | Level 3 ($) |
Investments in Securities: | | | | |
|
| Common Stocks | 820,839,513 | 820,839,513 | - | - |
|
| Money Market Funds | 1,061,200 | 1,061,200 | - | - |
| Total Investments in Securities: | 821,900,713 | 821,900,713 | - | - |
Fidelity Advisor® Utilities Fund
| Statement of Assets and Liabilities |
| | | | July 31, 2023 |
| | | | | |
| Assets | | | | |
| Investment in securities, at value - See accompanying schedule: | | | | |
Unaffiliated issuers (cost $677,557,256) | $ | 820,839,513 | | |
Fidelity Central Funds (cost $1,061,200) | | 1,061,200 | | |
| | | | | |
| | | | | |
| Total Investment in Securities (cost $678,618,456) | | | $ | 821,900,713 |
| Receivable for investments sold | | | | 1,475,867 |
| Receivable for fund shares sold | | | | 499,934 |
| Dividends receivable | | | | 692,905 |
| Distributions receivable from Fidelity Central Funds | | | | 18,106 |
| Prepaid expenses | | | | 2,115 |
Total assets | | | | 824,589,640 |
| Liabilities | | | | |
| Payable to custodian bank | $ | 1,264,272 | | |
| Payable for investments purchased | | 824,512 | | |
| Payable for fund shares redeemed | | 2,157,201 | | |
| Accrued management fee | | 362,171 | | |
| Distribution and service plan fees payable | | 145,817 | | |
| Other affiliated payables | | 133,749 | | |
| Other payables and accrued expenses | | 40,540 | | |
| Collateral on securities loaned | | 1,061,200 | | |
| Total Liabilities | | | | 5,989,462 |
| Net Assets | | | $ | 818,600,178 |
| Net Assets consist of: | | | | |
| Paid in capital | | | $ | 668,694,800 |
| Total accumulated earnings (loss) | | | | 149,905,378 |
| Net Assets | | | $ | 818,600,178 |
| | | | | |
| Net Asset Value and Maximum Offering Price | | | | |
| Class A : | | | | |
Net Asset Value and redemption price per share ($327,807,285 ÷ 8,796,547 shares)(a) | | | $ | 37.27 |
| Maximum offering price per share (100/94.25 of $37.27) | | | $ | 39.54 |
| Class M : | | | | |
Net Asset Value and redemption price per share ($68,732,975 ÷ 1,839,360 shares)(a) | | | $ | 37.37 |
| Maximum offering price per share (100/96.50 of $37.37) | | | $ | 38.73 |
| Class C : | | | | |
Net Asset Value and offering price per share ($58,041,667 ÷ 1,598,922 shares)(a) | | | $ | 36.30 |
| Class I : | | | | |
Net Asset Value, offering price and redemption price per share ($255,200,771 ÷ 6,676,953 shares) | | | $ | 38.22 |
| Class Z : | | | | |
Net Asset Value, offering price and redemption price per share ($108,817,480 ÷ 2,848,735 shares) | | | $ | 38.20 |
(a)Redemption price per share is equal to net asset value less any applicable contingent deferred sales charge. |
| Statement of Operations |
| | | | Year ended July 31, 2023 |
| Investment Income | | | | |
| Dividends | | | $ | 22,988,824 |
| Income from Fidelity Central Funds (including $12,071 from security lending) | | | | 598,354 |
| Total Income | | | | 23,587,178 |
| Expenses | | | | |
| Management fee | $ | 4,563,655 | | |
| Transfer agent fees | | 1,416,754 | | |
| Distribution and service plan fees | | 1,804,554 | | |
| Accounting fees | | 265,243 | | |
| Custodian fees and expenses | | 10,474 | | |
| Independent trustees' fees and expenses | | 4,280 | | |
| Registration fees | | 113,910 | | |
| Audit | | 48,187 | | |
| Legal | | 976 | | |
| Interest | | 5,270 | | |
| Miscellaneous | | 5,138 | | |
| Total expenses before reductions | | 8,238,441 | | |
| Expense reductions | | (45,054) | | |
| Total expenses after reductions | | | | 8,193,387 |
| Net Investment income (loss) | | | | 15,393,791 |
| Realized and Unrealized Gain (Loss) | | | | |
| Net realized gain (loss) on: | | | | |
| Investment Securities: | | | | |
| Unaffiliated issuers | | 16,244,222 | | |
| Foreign currency transactions | | (94) | | |
| Total net realized gain (loss) | | | | 16,244,128 |
| Change in net unrealized appreciation (depreciation) on: | | | | |
| Investment Securities: | | | | |
| Unaffiliated issuers | | (49,018,587) | | |
| Assets and liabilities in foreign currencies | | 582 | | |
| Total change in net unrealized appreciation (depreciation) | | | | (49,018,005) |
| Net gain (loss) | | | | (32,773,877) |
| Net increase (decrease) in net assets resulting from operations | | | $ | (17,380,086) |
| Statement of Changes in Net Assets |
| |
| | Year ended July 31, 2023 | | Year ended July 31, 2022 |
| Increase (Decrease) in Net Assets | | | | |
| Operations | | | | |
| Net investment income (loss) | $ | 15,393,791 | $ | 9,352,235 |
| Net realized gain (loss) | | 16,244,128 | | 20,793,548 |
| Change in net unrealized appreciation (depreciation) | | (49,018,005) | | 75,436,746 |
| Net increase (decrease) in net assets resulting from operations | | (17,380,086) | | 105,582,529 |
| Distributions to shareholders | | (42,208,285) | | (19,701,144) |
| | | | | |
| Share transactions - net increase (decrease) | | 47,417,119 | | 184,796,381 |
| Total increase (decrease) in net assets | | (12,171,252) | | 270,677,766 |
| | | | | |
| Net Assets | | | | |
| Beginning of period | | 830,771,430 | | 560,093,664 |
| End of period | $ | 818,600,178 | $ | 830,771,430 |
| | | | | |
| | | | | |
| Fidelity Advisor® Utilities Fund Class A |
| |
| Years ended July 31, | | 2023 | | 2022 | | 2021 | | 2020 | | 2019 |
Selected Per-Share Data | | | | | | | | | | |
| Net asset value, beginning of period | $ | 39.71 | $ | 34.53 | $ | 30.67 | $ | 31.73 | $ | 31.54 |
| Income from Investment Operations | | | | | | | | | | |
Net investment income (loss) A,B | | .64 | | .52 | | .56 | | .60 | | .67 |
| Net realized and unrealized gain (loss) | | (1.29) | | 5.84 | | 3.98 | | (1.03) | | 2.81 |
| Total from investment operations | | (.65) | | 6.36 | | 4.54 | | (.43) | | 3.48 |
| Distributions from net investment income | | (.64) | | (.67) | | (.68) | | (.62) | | (.48) |
| Distributions from net realized gain | | (1.15) | | (.51) | | - | | - C | | (2.81) |
| Total distributions | | (1.79) | | (1.18) | | (.68) | | (.63) D | | (3.29) |
| Net asset value, end of period | $ | 37.27 | $ | 39.71 | $ | 34.53 | $ | 30.67 | $ | 31.73 |
Total Return E,F | | (1.58)% | | 18.70% | | 14.95% | | (1.56)% | | 11.73% |
Ratios to Average Net Assets B,G,H | | | | | | | | | | |
| Expenses before reductions | | 1.01% | | 1.02% | | 1.05% | | 1.06% | | 1.08% |
| Expenses net of fee waivers, if any | | 1.01% | | 1.02% | | 1.04% | | 1.06% | | 1.07% |
| Expenses net of all reductions | | 1.01% | | 1.02% | | 1.03% | | 1.05% | | 1.06% |
| Net investment income (loss) | | 1.71% | | 1.41% | | 1.70% | | 1.88% | | 2.14% |
| Supplemental Data | | | | | | | | | | |
| Net assets, end of period (000 omitted) | $ | 327,807 | $ | 322,060 | $ | 254,388 | $ | 249,158 | $ | 268,246 |
Portfolio turnover rate I | | 66% | | 36% | | 45% | | 80% J | | 56% |
ACalculated based on average shares outstanding during the period.
BNet investment income (loss) is affected by the timing of the declaration of dividends by any underlying mutual funds or exchange-traded funds (ETFs). Net investment income (loss) of any mutual funds or ETFs is not included in the Fund's net investment income (loss) ratio.
CAmount represents less than $.005 per share.
DTotal distributions per share do not sum due to rounding.
ETotal returns would have been lower if certain expenses had not been reduced during the applicable periods shown.
FTotal returns do not include the effect of the sales charges.
GFees and expenses of any underlying mutual funds or exchange-traded funds (ETFs) are not included in the Fund's expense ratio. The Fund indirectly bears its proportionate share of these expenses. For additional expense information related to investments in Fidelity Central Funds, please refer to the "Investments in Fidelity Central Funds" note found in the Notes to Financial Statements section of the most recent Annual or Semi-Annual report.
HExpense ratios reflect operating expenses of the class. Expenses before reductions do not reflect amounts reimbursed, waived, or reduced through arrangements with the investment adviser, brokerage services, or other offset arrangements, if applicable, and do not represent the amount paid by the class during periods when reimbursements, waivers or reductions occur.
IAmount does not include the portfolio activity of any underlying mutual funds or exchange-traded funds (ETFs).
JPortfolio turnover rate excludes securities received or delivered in-kind.
| Fidelity Advisor® Utilities Fund Class M |
| |
| Years ended July 31, | | 2023 | | 2022 | | 2021 | | 2020 | | 2019 |
Selected Per-Share Data | | | | | | | | | | |
| Net asset value, beginning of period | $ | 39.81 | $ | 34.57 | $ | 30.71 | $ | 31.77 | $ | 31.58 |
| Income from Investment Operations | | | | | | | | | | |
Net investment income (loss) A,B | | .54 | | .42 | | .47 | | .51 | | .58 |
| Net realized and unrealized gain (loss) | | (1.29) | | 5.85 | | 3.99 | | (1.03) | | 2.81 |
| Total from investment operations | | (.75) | | 6.27 | | 4.46 | | (.52) | | 3.39 |
| Distributions from net investment income | | (.54) | | (.51) | | (.60) | | (.53) | | (.39) |
| Distributions from net realized gain | | (1.15) | | (.51) | | - | | - C | | (2.81) |
| Total distributions | | (1.69) | | (1.03) D | | (.60) | | (.54) D | | (3.20) |
| Net asset value, end of period | $ | 37.37 | $ | 39.81 | $ | 34.57 | $ | 30.71 | $ | 31.77 |
Total Return E,F | | (1.85)% | | 18.37% | | 14.63% | | (1.82)% | | 11.38% |
Ratios to Average Net Assets B,G,H | | | | | | | | | | |
| Expenses before reductions | | 1.28% | | 1.30% | | 1.32% | | 1.33% | | 1.36% |
| Expenses net of fee waivers, if any | | 1.27% | | 1.29% | | 1.32% | | 1.33% | | 1.36% |
| Expenses net of all reductions | | 1.27% | | 1.29% | | 1.31% | | 1.33% | | 1.35% |
| Net investment income (loss) | | 1.45% | | 1.14% | | 1.42% | | 1.60% | | 1.86% |
| Supplemental Data | | | | | | | | | | |
| Net assets, end of period (000 omitted) | $ | 68,733 | $ | 71,690 | $ | 58,065 | $ | 58,773 | $ | 61,741 |
Portfolio turnover rate I | | 66% | | 36% | | 45% | | 80% J | | 56% |
ACalculated based on average shares outstanding during the period.
BNet investment income (loss) is affected by the timing of the declaration of dividends by any underlying mutual funds or exchange-traded funds (ETFs). Net investment income (loss) of any mutual funds or ETFs is not included in the Fund's net investment income (loss) ratio.
CAmount represents less than $.005 per share.
DTotal distributions per share do not sum due to rounding.
ETotal returns would have been lower if certain expenses had not been reduced during the applicable periods shown.
FTotal returns do not include the effect of the sales charges.
GFees and expenses of any underlying mutual funds or exchange-traded funds (ETFs) are not included in the Fund's expense ratio. The Fund indirectly bears its proportionate share of these expenses. For additional expense information related to investments in Fidelity Central Funds, please refer to the "Investments in Fidelity Central Funds" note found in the Notes to Financial Statements section of the most recent Annual or Semi-Annual report.
HExpense ratios reflect operating expenses of the class. Expenses before reductions do not reflect amounts reimbursed, waived, or reduced through arrangements with the investment adviser, brokerage services, or other offset arrangements, if applicable, and do not represent the amount paid by the class during periods when reimbursements, waivers or reductions occur.
IAmount does not include the portfolio activity of any underlying mutual funds or exchange-traded funds (ETFs).
JPortfolio turnover rate excludes securities received or delivered in-kind.
| Fidelity Advisor® Utilities Fund Class C |
| |
| Years ended July 31, | | 2023 | | 2022 | | 2021 | | 2020 | | 2019 |
Selected Per-Share Data | | | | | | | | | | |
| Net asset value, beginning of period | $ | 38.73 | $ | 33.60 | $ | 29.83 | $ | 30.90 | $ | 30.81 |
| Income from Investment Operations | | | | | | | | | | |
Net investment income (loss) A,B | | .35 | | .24 | | .30 | | .35 | | .42 |
| Net realized and unrealized gain (loss) | | (1.26) | | 5.67 | | 3.88 | | (1.01) | | 2.74 |
| Total from investment operations | | (.91) | | 5.91 | | 4.18 | | (.66) | | 3.16 |
| Distributions from net investment income | | (.37) | | (.27) | | (.41) | | (.40) | | (.26) |
| Distributions from net realized gain | | (1.15) | | (.51) | | - | | - C | | (2.81) |
| Total distributions | | (1.52) | | (.78) | | (.41) | | (.41) D | | (3.07) |
| Net asset value, end of period | $ | 36.30 | $ | 38.73 | $ | 33.60 | $ | 29.83 | $ | 30.90 |
Total Return E,F | | (2.34)% | | 17.78% | | 14.10% | | (2.28)% | | 10.87% |
Ratios to Average Net Assets B,G,H | | | | | | | | | | |
| Expenses before reductions | | 1.77% | | 1.78% | | 1.80% | | 1.81% | | 1.83% |
| Expenses net of fee waivers, if any | | 1.76% | | 1.78% | | 1.80% | | 1.81% | | 1.83% |
| Expenses net of all reductions | | 1.76% | | 1.78% | | 1.79% | | 1.80% | | 1.82% |
| Net investment income (loss) | | .96% | | .65% | | .94% | | 1.12% | | 1.39% |
| Supplemental Data | | | | | | | | | | |
| Net assets, end of period (000 omitted) | $ | 58,042 | $ | 61,087 | $ | 49,312 | $ | 63,458 | $ | 66,525 |
Portfolio turnover rate I | | 66% | | 36% | | 45% | | 80% J | | 56% |
ACalculated based on average shares outstanding during the period.
BNet investment income (loss) is affected by the timing of the declaration of dividends by any underlying mutual funds or exchange-traded funds (ETFs). Net investment income (loss) of any mutual funds or ETFs is not included in the Fund's net investment income (loss) ratio.
CAmount represents less than $.005 per share.
DTotal distributions per share do not sum due to rounding.
ETotal returns would have been lower if certain expenses had not been reduced during the applicable periods shown.
FTotal returns do not include the effect of the contingent deferred sales charge.
GFees and expenses of any underlying mutual funds or exchange-traded funds (ETFs) are not included in the Fund's expense ratio. The Fund indirectly bears its proportionate share of these expenses. For additional expense information related to investments in Fidelity Central Funds, please refer to the "Investments in Fidelity Central Funds" note found in the Notes to Financial Statements section of the most recent Annual or Semi-Annual report.
HExpense ratios reflect operating expenses of the class. Expenses before reductions do not reflect amounts reimbursed, waived, or reduced through arrangements with the investment adviser, brokerage services, or other offset arrangements, if applicable, and do not represent the amount paid by the class during periods when reimbursements, waivers or reductions occur.
IAmount does not include the portfolio activity of any underlying mutual funds or exchange-traded funds (ETFs).
JPortfolio turnover rate excludes securities received or delivered in-kind.
| Fidelity Advisor® Utilities Fund Class I |
| |
| Years ended July 31, | | 2023 | | 2022 | | 2021 | | 2020 | | 2019 |
Selected Per-Share Data | | | | | | | | | | |
| Net asset value, beginning of period | $ | 40.68 | $ | 35.39 | $ | 31.40 | $ | 32.47 | $ | 32.21 |
| Income from Investment Operations | | | | �� | | | | | | |
Net investment income (loss) A,B | | .76 | | .64 | | .66 | | .71 | | .76 |
| Net realized and unrealized gain (loss) | | (1.33) | | 5.98 | | 4.10 | | (1.07) | | 2.88 |
| Total from investment operations | | (.57) | | 6.62 | | 4.76 | | (.36) | | 3.64 |
| Distributions from net investment income | | (.74) | | (.81) | | (.77) | | (.71) | | (.58) |
| Distributions from net realized gain | | (1.15) | | (.51) | | - | | - C | | (2.81) |
| Total distributions | | (1.89) | | (1.33) D | | (.77) | | (.71) | | (3.38) D |
| Net asset value, end of period | $ | 38.22 | $ | 40.68 | $ | 35.39 | $ | 31.40 | $ | 32.47 |
Total Return E | | (1.34)% | | 19.00% | | 15.30% | | (1.30)% | | 12.04% |
Ratios to Average Net Assets B,F,G | | | | | | | | | | |
| Expenses before reductions | | .75% | | .76% | | .77% | | .79% | | .81% |
| Expenses net of fee waivers, if any | | .74% | | .75% | | .77% | | .78% | | .80% |
| Expenses net of all reductions | | .74% | | .75% | | .76% | | .78% | | .79% |
| Net investment income (loss) | | 1.98% | | 1.68% | | 1.97% | | 2.15% | | 2.41% |
| Supplemental Data | | | | | | | | | | |
| Net assets, end of period (000 omitted) | $ | 255,201 | $ | 269,667 | $ | 143,582 | $ | 187,833 | $ | 229,777 |
Portfolio turnover rate H | | 66% | | 36% | | 45% | | 80% I | | 56% |
ACalculated based on average shares outstanding during the period.
BNet investment income (loss) is affected by the timing of the declaration of dividends by any underlying mutual funds or exchange-traded funds (ETFs). Net investment income (loss) of any mutual funds or ETFs is not included in the Fund's net investment income (loss) ratio.
CAmount represents less than $.005 per share.
DTotal distributions per share do not sum due to rounding.
ETotal returns would have been lower if certain expenses had not been reduced during the applicable periods shown.
FFees and expenses of any underlying mutual funds or exchange-traded funds (ETFs) are not included in the Fund's expense ratio. The Fund indirectly bears its proportionate share of these expenses. For additional expense information related to investments in Fidelity Central Funds, please refer to the "Investments in Fidelity Central Funds" note found in the Notes to Financial Statements section of the most recent Annual or Semi-Annual report.
GExpense ratios reflect operating expenses of the class. Expenses before reductions do not reflect amounts reimbursed, waived, or reduced through arrangements with the investment adviser, brokerage services, or other offset arrangements, if applicable, and do not represent the amount paid by the class during periods when reimbursements, waivers or reductions occur.
HAmount does not include the portfolio activity of any underlying mutual funds or exchange-traded funds (ETFs).
IPortfolio turnover rate excludes securities received or delivered in-kind.
| Fidelity Advisor® Utilities Fund Class Z |
| |
| Years ended July 31, | | 2023 | | 2022 | | 2021 | | 2020 | | 2019 A |
Selected Per-Share Data | | | | | | | | | | |
| Net asset value, beginning of period | $ | 40.66 | $ | 35.38 | $ | 31.42 | $ | 32.48 | $ | 33.14 |
| Income from Investment Operations | | | | | | | | | | |
Net investment income (loss) B,C | | .81 | | .69 | | .71 | | .74 | | .63 |
| Net realized and unrealized gain (loss) | | (1.33) | | 5.98 | | 4.08 | | (1.04) | | 2.13 |
| Total from investment operations | | (.52) | | 6.67 | | 4.79 | | (.30) | | 2.76 |
| Distributions from net investment income | | (.79) | | (.88) | | (.83) | | (.75) | | (.61) |
| Distributions from net realized gain | | (1.15) | | (.51) | | - | | - D | | (2.81) |
| Total distributions | | (1.94) | | (1.39) | | (.83) | | (.76) E | | (3.42) |
| Net asset value, end of period | $ | 38.20 | $ | 40.66 | $ | 35.38 | $ | 31.42 | $ | 32.48 |
Total Return F,G | | (1.21)% | | 19.17% | | 15.41% | | (1.15)% | | 9.04% |
Ratios to Average Net Assets B,H,I | | | | | | | | | | |
| Expenses before reductions | | .62% | | .63% | | .64% | | .65% | | .66% J |
| Expenses net of fee waivers, if any | | .62% | | .63% | | .64% | | .65% | | .66% J |
| Expenses net of all reductions | | .62% | | .63% | | .63% | | .64% | | .64% J |
| Net investment income (loss) | | 2.10% | | 1.81% | | 2.10% | | 2.29% | | 2.41% J |
| Supplemental Data | | | | | | | | | | |
| Net assets, end of period (000 omitted) | $ | 108,817 | $ | 106,266 | $ | 54,746 | $ | 52,034 | $ | 17,071 |
Portfolio turnover rate K | | 66% | | 36% | | 45% | | 80% L | | 56% |
AFor the period October 2, 2018 (commencement of sale of shares) through July 31, 2019.
BNet investment income (loss) is affected by the timing of the declaration of dividends by any underlying mutual funds or exchange-traded funds (ETFs). Net investment income (loss) of any mutual funds or ETFs is not included in the Fund's net investment income (loss) ratio.
CCalculated based on average shares outstanding during the period.
DAmount represents less than $.005 per share.
ETotal distributions per share do not sum due to rounding.
FTotal returns for periods of less than one year are not annualized.
GTotal returns would have been lower if certain expenses had not been reduced during the applicable periods shown.
HFees and expenses of any underlying mutual funds or exchange-traded funds (ETFs) are not included in the Fund's expense ratio. The Fund indirectly bears its proportionate share of these expenses. For additional expense information related to investments in Fidelity Central Funds, please refer to the "Investments in Fidelity Central Funds" note found in the Notes to Financial Statements section of the most recent Annual or Semi-Annual report.
IExpense ratios reflect operating expenses of the class. Expenses before reductions do not reflect amounts reimbursed, waived, or reduced through arrangements with the investment adviser, brokerage services, or other offset arrangements, if applicable, and do not represent the amount paid by the class during periods when reimbursements, waivers or reductions occur.
JAnnualized.
KAmount does not include the portfolio activity of any underlying mutual funds or exchange-traded funds (ETFs).
LPortfolio turnover rate excludes securities received or delivered in-kind.
For the period ended July 31, 2023
1. Organization.
Fidelity Advisor Biotechnology Fund, Fidelity Advisor Consumer Discretionary Fund, Fidelity Advisor Energy Fund, Fidelity Advisor Financials Fund (formerly Fidelity Advisor Financial Services Fund), Fidelity Advisor Health Care Fund, Fidelity Advisor Industrials Fund, Fidelity Advisor Semiconductors Fund, Fidelity Advisor Technology Fund and Fidelity Advisor Utilities Fund (the Funds) are funds of Fidelity Advisor Series VII (the Trust) and are authorized to issue an unlimited number of shares. The Trust is registered under the Investment Company Act of 1940, as amended (the 1940 Act), as an open-end management investment company organized as a Massachusetts business trust. The Funds are non-diversified with the exception of Fidelity Advisor Financials Fund and Fidelity Advisor Health Care Fund. Each Fund offers Class A, Class M, Class C, Class I and Class Z shares, each of which has equal rights as to assets and voting privileges. Class A, Class M, Class C, Class I and Class Z are Fidelity Advisor classes. Each class has exclusive voting rights with respect to matters that affect that class. Class C shares will automatically convert to Class A shares after a holding period of eight years from the initial date of purchase, with certain exceptions. The Fund's investments in emerging markets can be subject to social, economic, regulatory, and political uncertainties and can be extremely volatile.
2. Investments in Fidelity Central Funds.
Funds may invest in Fidelity Central Funds, which are open-end investment companies generally available only to other investment companies and accounts managed by the investment adviser and its affiliates. The Schedule of Investments lists any Fidelity Central Funds held as an investment as of period end, but does not include the underlying holdings of each Fidelity Central Fund. An investing fund indirectly bears its proportionate share of the expenses of the underlying Fidelity Central Funds.
Based on its investment objective, each Fidelity Central Fund may invest or participate in various investment vehicles or strategies that are similar to those of the investing fund. These strategies are consistent with the investment objectives of the investing fund and may involve certain economic risks which may cause a decline in value of each of the Fidelity Central Funds and thus a decline in the value of the investing fund.
| Fidelity Central Fund | Investment Manager | Investment Objective | Investment Practices | Expense RatioA |
| Fidelity Money Market Central Funds | Fidelity Management & Research Company LLC (FMR) | Each fund seeks to obtain a high level of current income consistent with the preservation of capital and liquidity. | Short-term Investments | Less than .005% |
A Expenses expressed as a percentage of average net assets and are as of each underlying Central Fund's most recent annual or semi-annual shareholder report.
A complete unaudited list of holdings for each Fidelity Central Fund is available upon request or at the Securities and Exchange Commission website at www.sec.gov. In addition, the financial statements of the Fidelity Central Funds which contain the significant accounting policies (including investment valuation policies) of those funds, and are not covered by the Report of Independent Registered Public Accounting Firm, are available on the Securities and Exchange Commission website or upon request.
3. Significant Accounting Policies.
Each Fund is an investment company and applies the accounting and reporting guidance of the Financial Accounting Standards Board (FASB) Accounting Standards Codification Topic 946 Financial Services - Investment Companies. The financial statements have been prepared in conformity with accounting principles generally accepted in the United States of America (GAAP), which require management to make certain estimates and assumptions at the date of the financial statements. Actual results could differ from those estimates. Subsequent events, if any, through the date that the financial statements were issued have been evaluated in the preparation of the financial statements. Each Fund's Schedule of Investments lists any underlying mutual funds or exchange-traded funds (ETFs) but does not include the underlying holdings of these funds. The following summarizes the significant accounting policies of each Fund:
Investment Valuation. Investments are valued as of 4:00 p.m. Eastern time on the last calendar day of the period. The Board of Trustees (the Board) has designated each Fund's investment adviser as the valuation designee responsible for the fair valuation function and performing fair value determinations as needed. The investment adviser has established a Fair Value Committee (the Committee) to carry out the day-to-day fair valuation responsibilities and has adopted policies and procedures to govern the fair valuation process and the activities of the Committee. In accordance with these fair valuation policies and procedures, which have been approved by the Board, each Fund attempts to obtain prices from one or more third party pricing services or brokers to value its investments. When current market prices, quotations or currency exchange rates are not readily available or reliable, investments will be fair valued in good faith by the Committee, in accordance with the policies and procedures. Factors used in determining fair value vary by investment type and may include market or investment specific events, transaction data, estimated cash flows, and market observations of comparable investments. The frequency that the fair valuation procedures are used cannot be predicted and they may be utilized to a significant extent. The Committee manages each Fund's fair valuation practices and maintains the fair valuation policies and procedures. Each Fund's investment adviser reports to the Board information regarding the fair valuation process and related material matters.
Each Fund categorizes the inputs to valuation techniques used to value its investments into a disclosure hierarchy consisting of three levels as shown below:
Level 1 - unadjusted quoted prices in active markets for identical investments
Level 2 - other significant observable inputs (including quoted prices for similar investments, interest rates, prepayment speeds, etc.)
Level 3 - unobservable inputs (including the Fund's own assumptions based on the best information available)
Valuation techniques used to value each Fund's investments by major category are as follows:
Equity securities, including restricted securities, for which market quotations are readily available, are valued at the last reported sale price or official closing price as reported by a third party pricing service on the primary market or exchange on which they are traded and are categorized as Level 1 in the hierarchy. In the event there were no sales during the day or closing prices are not available, securities are valued at the last quoted bid price or may be valued using the last available price and are generally categorized as Level 2 in the hierarchy. For foreign equity securities, when market or security specific events arise, comparisons to the valuation of American Depositary Receipts (ADRs), futures contracts, ETFs and certain indexes as well as quoted prices for similar securities may be used and would be categorized as Level 2 in the hierarchy. For equity securities, including restricted securities, where observable inputs are limited, assumptions about market activity and risk are used and these securities may be categorized as Level 3 in the hierarchy. Securities, including private placements or other restricted securities, for which observable inputs are not available are valued using alternate valuation approaches, including the market approach, the income approach and cost approach, and are categorized as Level 3 in the hierarchy. The market approach considers factors including the price of recent investments in the same or a similar security or financial metrics of comparable securities. The income approach considers factors including expected future cash flows, security specific risks and corresponding discount rates. The cost approach considers factors including the value of the security's underlying assets and liabilities.
Debt securities, including restricted securities, are valued based on evaluated prices received from third party pricing services or from brokers who make markets in such securities. Corporate bonds and preferred securities are valued by pricing services who utilize matrix pricing which considers yield or price of bonds of comparable quality, coupon, maturity and type or by broker-supplied prices. When independent prices are unavailable or unreliable, debt securities may be valued utilizing pricing methodologies which consider similar factors that would be used by third party pricing services. Debt securities are generally categorized as Level 2 in the hierarchy but may be Level 3 depending on the circumstances.
Investments in open-end mutual funds, including the Fidelity Central Funds, are valued at their closing net asset value (NAV) each business day and are categorized as Level 1 in the hierarchy.
The following provides information on Level 3 securities held by the Fund that were valued at period end based on unobservable inputs. These amounts exclude valuations provided by a broker.
Fidelity Advisor Biotechnology Fund
| Asset Type | Fair Value | Valuation Technique(s) | Unobservable Input | Amount or Range/Weighted Average | Impact to Valuation from an Increase in InputA |
| Equities | $42,885,819 | Recovery value | Recovery value | $0.00 - $5.51 / $5.51 | Increase |
| | | Market approach | Transaction price | $0.70 - $10.76 / $4.49 | Increase |
| | | | Discount rate | 5.0% - 40.0% / 27.7% | Decrease |
| | | | Discount for lack of marketability (DLOM) | 10.0% | Decrease |
| | | Discounted cash flow | Discount rate | 4.9% - 6.3% / 5.3% | Decrease |
| | | | Probability rate | 0.0% - 80.0% / 37.0% | Increase |
| | | | Term | 0.9 - 7.8 / 4.8 | Increase |
| | | Black scholes | Discount rate | 4.3% - 9.6% / 5.1% | Increase |
| | | | Volatility | 75.0% - 100.0% / 85.0% | Increase |
| | | | Term | 0.3 - 3.0 / 2.7 | Increase |
A Represents the directional change in the fair value of the Level 3 investments that could have resulted from an increase in the corresponding input as of period end. A decrease to the unobservable input would have had the opposite effect. Significant changes in these inputs may have resulted in a significantly higher or lower fair value measurement at period end.
Fidelity Advisor Health Care Fund
| Asset Type | Fair Value | Valuation Technique(s) | Unobservable Input | Amount or Range/Weighted Average | Impact to Valuation from an Increase in InputA |
| Equities | $77,682,515 | Market comparable | Enterprise value/Revenue multiple (EV/R) | 3.3 - 24.9 / 6.9 | Increase |
| | | Recovery value | Recovery value | $5.51 | Increase |
| | | Market approach | Transaction price | $7.75 - $20.56 / $13.50 | Increase |
| | | | Discount rate | 20.0% - 50.0% / 32.2% | Decrease |
| | | Black scholes | Discount rate | 4.3% - 5.1% / 4.6% | Increase |
| | | | Volatility | 45.0% - 90.0% / 52.7% | Increase |
| | | | Term | 1.5 - 4.0 / 2.9 | Increase |
A Represents the directional change in the fair value of the Level 3 investments that could have resulted from an increase in the corresponding input as of period end. A decrease to the unobservable input would have had the opposite effect. Significant changes in these inputs may have resulted in a significantly higher or lower fair value measurement at period end.
Fidelity Advisor Technology Fund
| Asset Type | Fair Value | Valuation Technique(s) | Unobservable Input | Amount or Range/Weighted Average | Impact to Valuation from an Increase in InputA |
| Equities | $80,605,706 | Market comparable | Enterprise value/Revenue multiple (EV/R) | 1.5 - 25.0 / 11.2 | Increase |
| | | | Enterprise value/Gross profit multiple (EV/GP) | 5.8 | Increase |
| | | Recovery value | Recovery value | $0.00 - $0.31 / $0.31 | Increase |
| | | Market approach | Transaction price | $1.11 - $59.45 / $5.66 | Increase |
| | | | Discount rate | 35.0% - 75.0% / 45.0% | Decrease |
| | | | Premium rate | 20.0% | Increase |
| | | Book value | Book value multiple | 1.7 | Increase |
| | | Discounted cash flow | Weighted average cost of capital (WACC) | 29.0% | Decrease |
| | | | Exit multiple | 1.8 | Increase |
| | | Black scholes | Discount rate | 4.1% - 4.8% / 4.3% | Increase |
| | | | Volatility | 50.0% - 100.0% / 78.8% | Increase |
| | | | Term | 2.0 - 5.0 / 3.9 | Increase |
| Corporate Bonds | $38,249 | Market comparable | Enterprise value/Revenue multiple (EV/R) | 1.5 | Increase |
| | | Black scholes | Discount rate | 4.8% | Increase |
| | | | Volatility | 60.0% | Increase |
| | | | Term | 2.0 | Increase |
| Preferred Securities | $384,060 | Market approach | Transaction price | $59.45 | Increase |
| | | | Premium rate | 20.0% | Increase |
| | | Black scholes | Discount rate | 4.7% | Increase |
| | | | Volatility | 70.0% | Increase |
| | | | Term | 2.0 | Increase |
A Represents the directional change in the fair value of the Level 3 investments that could have resulted from an increase in the corresponding input as of period end. A decrease to the unobservable input would have had the opposite effect. Significant changes in these inputs may have resulted in a significantly higher or lower fair value measurement at period end.
Changes in valuation techniques may result in transfers in or out of an assigned level within the disclosure hierarchy. The aggregate value of investments by input level as of July 31, 2023, as well as a roll forward of Level 3 investments, is included at the end of each Fund's Schedule of Investments.
Foreign Currency. Certain Funds may use foreign currency contracts to facilitate transactions in foreign-denominated securities. Gains and losses from these transactions may arise from changes in the value of the foreign currency or if the counterparties do not perform under the contracts' terms.
Foreign-denominated assets, including investment securities, and liabilities are translated into U.S. dollars at the exchange rates at period end. Purchases and sales of investment securities, income and dividends received, and expenses denominated in foreign currencies are translated into U.S. dollars at the exchange rate in effect on the transaction date.
The effects of exchange rate fluctuations on investments are included with the net realized and unrealized gain (loss) on investment securities. Other foreign currency transactions resulting in realized and unrealized gain (loss) are disclosed separately.
Investment Transactions and Income. For financial reporting purposes, the Funds' investment holdings and NAV include trades executed through the end of the last business day of the period. The NAV per share for processing shareholder transactions is calculated as of the close of business of the New York Stock Exchange (NYSE), normally 4:00 p.m. Eastern time and includes trades executed through the end of the prior business day. Gains and losses on securities sold are determined on the basis of identified cost and for certain Funds include proceeds received from litigation. Commissions paid to certain brokers with whom the investment adviser, or its affiliates, places trades on behalf of a fund include an amount in addition to trade execution, which may be rebated back to a fund. Any such rebates are included in net realized gain (loss) on investments in the Statement of Operations. Dividend income is recorded on the ex-dividend date, except for certain dividends from foreign securities where the ex-dividend date may have passed, which are recorded as soon as the Funds are informed of the ex-dividend date. Non-cash dividends included in dividend income, if any, are recorded at the fair market value of the securities received. Income and capital gain distributions from Fidelity Central Funds, if any, are recorded on the ex-dividend date. Certain distributions received by the Funds represent a return of capital or capital gain. The Funds determine the components of these distributions subsequent to the ex-dividend date, based upon receipt of tax filings or other correspondence relating to the underlying investment. These distributions are recorded as a reduction of cost of investments and/or as a realized gain. Large, non-recurring dividends recognized by the Funds are presented separately on the Statement of Operations as "Special Dividends" and the impact of these dividends is presented in the Financial Highlights. Interest income is accrued as earned and includes coupon interest and amortization of premium and accretion of discount on debt securities as applicable. Investment income is recorded net of foreign taxes withheld where recovery of such taxes is uncertain. Funds may file withholding tax reclaims in certain jurisdictions to recover a portion of amounts previously withheld. Any withholding tax reclaims income is included in the Statement of Operations in dividends. Any receivables for withholding tax reclaims are included in the Statement of Assets and Liabilities in dividends receivable.
Class Allocations and Expenses. Investment income, realized and unrealized capital gains and losses, common expenses of a fund, and certain fund-level expense reductions, if any, are allocated daily on a pro-rata basis to each class based on the relative net assets of each class to the total net assets of a fund. Each class differs with respect to transfer agent and distribution and service plan fees incurred, as applicable. Certain expense reductions may also differ by class, if applicable. For the reporting period, the allocated portion of income and expenses to each class as a percent of its average net assets may vary due to the timing of recording these transactions in relation to fluctuating net assets of the classes. Expenses directly attributable to a fund are charged to that fund. Expenses attributable to more than one fund are allocated among the respective funds on the basis of relative net assets or other appropriate methods. Expenses included in the accompanying financial statements reflect the expenses of that fund and do not include any expenses associated with any underlying mutual funds or ETFs. Although not included in a fund's expenses, a fund indirectly bears its proportionate share of these expenses through the net asset value of each underlying mutual fund or ETF. Expense estimates are accrued in the period to which they relate and adjustments are made when actual amounts are known.
Deferred Trustee Compensation. Under a Deferred Compensation Plan (the Plan) for certain Funds, certain independent Trustees have elected to defer receipt of a portion of their annual compensation. Deferred amounts are invested in affiliated mutual funds, are marked-to-market and remain in a fund until distributed in accordance with the Plan. The investment of deferred amounts and the offsetting payable to the Trustees presented below are included in the accompanying Statement of Assets and Liabilities in other receivables and other payables and accrued expenses, as applicable.
| Fidelity Advisor Energy Fund | 87,701 |
| Fidelity Advisor Technology Fund | 140,704 |
Income Tax Information and Distributions to Shareholders. Each year, each Fund intends to qualify as a regulated investment company under Subchapter M of the Internal Revenue Code, including distributing substantially all of its taxable income and realized gains. As a result, no provision for U.S. Federal income taxes is required. As of July 31, 2023, each Fund did not have any unrecognized tax benefits in the financial statements; nor is each Fund aware of any tax positions for which it is reasonably possible that the total amounts of unrecognized tax benefits will significantly change in the next twelve months. Each Fund files a U.S. federal tax return, in addition to state and local tax returns as required. Each Fund's federal income tax returns are subject to examination by the Internal Revenue Service (IRS) for a period of three fiscal years after they are filed. State and local tax returns may be subject to examination for an additional fiscal year depending on the jurisdiction. Foreign taxes are provided for based on each Fund's understanding of the tax rules and rates that exist in the foreign markets in which it invests.
Distributions are declared and recorded on the ex-dividend date. Income and capital gain distributions are declared separately for each class. Income and capital gain distributions are determined in accordance with income tax regulations, which may differ from GAAP. In addition, certain Funds claimed a portion of the payment made to redeeming shareholders as a distribution for income tax purposes.
Capital accounts within the financial statements are adjusted for permanent book-tax differences. These adjustments have no impact on net assets or the results of operations. Capital accounts are not adjusted for temporary book-tax differences which will reverse in a subsequent period.
Book-tax differences are primarily due to foreign currency transactions, partnerships, certain foreign taxes, passive foreign investment companies (PFIC), deferred Trustee compensation, redemptions in-kind, net operating losses, capital loss carryforwards and losses deferred due to wash sales and excise tax regulations.
As of period end, the cost and unrealized appreciation (depreciation) in securities, and derivatives if applicable, for federal income tax purposes were as follows for each Fund:
| | Tax cost | Gross unrealized appreciation | Gross unrealized depreciation | Net unrealized appreciation (depreciation) |
| Fidelity Advisor Biotechnology Fund | $1,499,199,312 | $467,559,656 | $ (135,796,284) | $331,763,372 |
Fidelity Advisor Consumer Discretionary Fund | 304,453,631 | 221,355,699 | (5,495,803) | 215,859,896 |
| Fidelity Advisor Energy Fund | 814,022,000 | 595,217,249 | (7,355,241) | 587,862,008 |
| Fidelity Advisor Financials Fund | 419,215,157 | 81,812,465 | (25,533,902) | 56,278,563 |
| Fidelity Advisor Health Care Fund | 4,229,898,081 | 1,977,815,645 | (243,179,321) | 1,734,636,324 |
| Fidelity Advisor Industrials Fund | 482,898,770 | 80,181,668 | (4,461,937) | 75,719,731 |
Fidelity Advisor Semiconductors Fund | 878,308,700 | 603,356,134 | (26,466,083) | 576,890,051 |
| Fidelity Advisor Technology Fund | 2,739,313,679 | 2,589,421,863 | (213,478,070) | 2,375,943,793 |
| Fidelity Advisor Utilities Fund | 681,809,847 | 150,457,128 | (10,366,262) | 140,090,866 |
The tax-based components of distributable earnings as of period end were as follows for each Fund:
| | Undistributed ordinary income | Undistributed long-term capital gain | Capital loss carryforward | Net unrealized appreciation (depreciation) on securities and other investments |
| Fidelity Advisor Biotechnology Fund | $18,648,745 | $ - | $ (28,267,198) | $331,763,372 |
Fidelity Advisor Consumer Discretionary Fund | - | - | (6,500,519) | 215,857,939 |
| Fidelity Advisor Energy Fund | 11,444,140 | - | (278,020,129) | 586,608,022 |
| Fidelity Advisor Financials Fund | 4,703,994 | - | (6,017,984) | 56,278,563 |
| Fidelity Advisor Health Care Fund | - | - | (16,082,102) | 1,734,657,765 |
| Fidelity Advisor Industrials Fund | 552,412 | 39,205,700 | - | 75,719,731 |
Fidelity Advisor Semiconductors Fund | - | 51,791,425 | - | 576,890,051 |
| Fidelity Advisor Technology Fund | - | 159,122,364 | - | 2,375,940,003 |
| Fidelity Advisor Utilities Fund | 804,358 | 9,010,303 | - | 140,090,717 |
Capital loss carryforwards are only available to offset future capital gains of the Funds to the extent provided by regulations and may be limited. The capital loss carryforward information presented below, including any applicable limitation, is estimated as of fiscal period end and is subject to adjustment.
| | Short-term | Long-term | Total capital loss carryforward |
| Fidelity Advisor Biotechnology Fund | $ (28,267,198) | $- | $ (28,267,198) |
Fidelity Advisor Consumer Discretionary Fund | (6,500,519) | - | (6,500,519) |
| Fidelity Advisor Energy Fund | (189,871,773) | (88,148,356) | (278,020,129) |
| Fidelity Advisor Financials Fund | (6,017,984) | - | (6,017,984) |
| Fidelity Advisor Health Care Fund | (16,082,102) | - | (16,082,102) |
Certain of the Funds intend to elect to defer to the next fiscal year ordinary losses recognized during the period January 1,2023 to July 31,2023. Loss deferrals were as follows:
| | Ordinary losses |
| Fidelity Advisor Consumer Discretionary Fund | (626,203) |
| Fidelity Advisor Health Care Fund | (15,914,470) |
| Fidelity Advisor Industrials Fund | (878,354) |
| Fidelity Advisor Technology Fund | (6,507,619) |
| Fidelity Advisor Semiconductors Fund | (956,851) |
The tax character of distributions paid was as follows:
| July 31, 2023 | | | |
| | Ordinary Income | Long-term Capital Gains | Total |
Fidelity Advisor Consumer Discretionary Fund | - | 17,163,089 | 17,163,089 |
| Fidelity Advisor Energy Fund | 33,434,847 | - | 33,434,847 |
| Fidelity Advisor Financials Fund | 9,591,816 | 21,193,635 | 30,785,451 |
| Fidelity Advisor Industrials Fund | 508,799 | 17,041,143 | 17,549,942 |
Fidelity Advisor Semiconductors Fund | - | 22,158,679 | 22,158,679 |
| Fidelity Advisor Technology Fund | - | 117,622,896 | 117,622,896 |
| Fidelity Advisor Utilities Fund | 15,146,470 | 27,061,815 | 42,208,285 |
| July 31, 2022 | | | |
| | Ordinary Income | Long-term Capital Gains | Total |
| Fidelity Advisor Biotechnology Fund | $114,816,987 | $274,425,826 | $389,242,813 |
Fidelity Advisor Consumer Discretionary Fund | 4,008,843 | 40,831,776 | 44,840,619 |
| Fidelity Advisor Energy Fund | 14,774,337 | - | 14,774,337 |
| Fidelity Advisor Financials Fund | 8,808,931 | 12,201,665 | 21,010,596 |
| Fidelity Advisor Health Care Fund | 876,414 | 420,586,154 | 421,462,568 |
| Fidelity Advisor Industrials Fund | 20,972,599 | 100,928,586 | 121,901,185 |
Fidelity Advisor Semiconductors Fund | 16,705,837 | 27,202,609 | 43,908,446 |
| Fidelity Advisor Technology Fund | 224,707,897 | 376,263,605 | 600,971,502 |
| Fidelity Advisor Utilities Fund | 11,491,678 | 8,209,466 | 19,701,144 |
Restricted Securities (including Private Placements). Funds may invest in securities that are subject to legal or contractual restrictions on resale. These securities generally may be resold in transactions exempt from registration or to the public if the securities are registered. Disposal of these securities may involve time-consuming negotiations and expense, and prompt sale at an acceptable price may be difficult. Information regarding restricted securities held at period end is included at the end of the Schedule of Investments, if applicable.
Commitments. A commitment is an agreement to acquire an investment at a future date (subject to conditions) in connection with a potential public or non-public offering. Commitments outstanding at period end are presented in the table below. Unrealized appreciation (depreciation) on any commitments outstanding at period end is separately presented in the Statements of Assets and Liabilities as Unrealized appreciation (depreciation) on unfunded commitments, and any change in unrealized appreciation (depreciation) on unfunded commitments during the period is separately presented in the Statement of Operations, as applicable based on contractual conditions of each commitment.
| | Investment to be Acquired | Commitment Amount | Unrealized Appreciation (Depreciation) |
| Fidelity Advisor Biotechnology Fund | Dianthus Therapeutics, Inc. | $790,362 | $(100,846) |
Consolidated Subsidiary. The Funds included in the table below hold certain investments through a wholly-owned subsidiary ("Subsidiary"), which may be subject to federal and state taxes upon disposition.
As of period end, investments in Subsidiaries were as follows:
| | $ Amount | % of Net Assets |
| Fidelity Advisor Health Care Fund | 4,743,518 | .08 |
The financial statements have been consolidated to include the Subsidiary accounts where applicable. Accordingly, all inter-company transactions and balances have been eliminated.
At period end, any estimated tax liability for these investments is presented as "Deferred taxes" in the Statement of Assets and Liabilities and included in "Change in net unrealized appreciation (depreciation) on investment securities" in the Statement of Operations. The tax liability incurred may differ materially depending on conditions when these investments are disposed. Any cash held by a Subsidiary is restricted as to its use and is presented as "Restricted cash" in the Statement of Assets and Liabilities, if applicable.
New Accounting Pronouncement. In June 2022, the Financial Accounting Standards Board (FASB) issued Accounting Standards Update (ASU) 2022-03 Fair Value Measurement (Topic 820): Fair Value Measurement of Equity Securities Subject to Contractual Sale Restrictions. The amendments in this ASU clarify that a contractual restriction on the sale of an equity security is not considered part of the unit of account of the equity security and, therefore, is not considered in measuring fair value. They also clarify that an entity cannot, as a separate unit of account, recognize and measure a contractual sale restriction. They also require additional disclosures for equity securities subject to contractual sale restrictions. ASU 2022-03 will be effective for fiscal years, including interim periods within those fiscal years, beginning after December 15, 2023, and allows for early adoption. ASU 2022-03 will only be applicable to an equity security in which the contractual arrangement that restricts its sale is executed or modified on or after the adoption date. Management is currently evaluating the potential impact of ASU 2022-03 to the financial statements.
4. Purchases and Sales of Investments.
Purchases and sales of securities, other than short-term securities and in-kind transactions, as applicable, are noted in the table below.
| | Purchases ($) | Sales ($) |
| Fidelity Advisor Biotechnology Fund | 1,315,608,485 | 1,563,780,600 |
| Fidelity Advisor Consumer Discretionary Fund | 196,777,563 | 181,102,190 |
| Fidelity Advisor Energy Fund | 301,308,905 | 471,212,957 |
| Fidelity Advisor Financials Fund | 280,362,742 | 323,810,641 |
| Fidelity Advisor Health Care Fund | 2,697,771,676 | 3,105,918,023 |
| Fidelity Advisor Industrials Fund | 965,974,297 | 950,729,203 |
| Fidelity Advisor Semiconductors Fund | 503,619,840 | 360,414,052 |
| Fidelity Advisor Technology Fund | 1,289,363,083 | 1,151,255,665 |
| Fidelity Advisor Utilities Fund | 610,006,088 | 555,671,139 |
Unaffiliated Redemptions In-Kind. Shares that were redeemed in-kind for investments, including accrued interest and cash, if any, are shown in the table below. The net realized gain or loss on investments delivered through in-kind redemptions is included in the "Net realized gain (loss) on: Redemptions in-kind" line in the accompanying Statement of Operations. The amount of the in-kind redemptions is included in share transactions in the accompanying Statement of Changes in Net Assets. There was no gain or loss for federal income tax purposes.
| | Shares | Total net realized gain or loss ($) | Total Proceeds ($) | Participating classes |
| Fidelity Advisor Industrials Fund | 634,301 | 16,690,939 | 26,323,494 | Class C |
5. Fees and Other Transactions with Affiliates.
Management Fee. Fidelity Management & Research Company LLC (the investment adviser) and its affiliates provide the Funds with investment management related services for which the Funds pay a monthly management fee. The management fee is the sum of an individual fund fee rate and an annualized group fee rate. The individual fund fee rate is applied to each Fund's average net assets. The group fee rate is based upon the monthly average net assets of a group of registered investment companies with which the investment adviser has management contracts. The group fee rate decreases as assets under management increase and increases as assets under management decrease. For the reporting period, each Fund's annual management fee rate expressed as a percentage of each Fund's average net assets was as follows:
| | Individual Rate | Group Rate | Total |
| Fidelity Advisor Biotechnology Fund | .30% | .23% | .53% |
| Fidelity Advisor Consumer Discretionary Fund | .30% | .23% | .53% |
| Fidelity Advisor Energy Fund | .30% | .23% | .53% |
| Fidelity Advisor Financials Fund | .30% | .23% | .53% |
| Fidelity Advisor Health Care Fund | .30% | .23% | .53% |
| Fidelity Advisor Industrials Fund | .30% | .23% | .53% |
| Fidelity Advisor Semiconductors Fund | .30% | .23% | .53% |
| Fidelity Advisor Technology Fund | .30% | .23% | .53% |
| Fidelity Advisor Utilities Fund | .30% | .23% | .53% |
Distribution and Service Plan Fees. In accordance with Rule 12b-1 of the 1940 Act, each Fund has adopted separate Distribution and Service Plans for each class of shares. Certain classes pay Fidelity Distributors Company LLC (FDC), an affiliate of the investment adviser, separate Distribution and Service Fees, each of which is based on an annual percentage of each class' average net assets. In addition, FDC may pay financial intermediaries for selling shares of each Fund and providing shareholder support services. For the period, the Distribution and Service Fee rates, total fees and amounts retained by FDC were as follows:
| | Distribution Fee | Service Fee | Total Fees | Retained by FDC |
| Fidelity Advisor Biotechnology Fund | | | | |
Class A | - % | .25% | $1,607,026 | $11,982 |
Class M | .25% | .25% | 587,608 | 1,234 |
Class C | .75% | .25% | 1,541,783 | 74,710 |
| | | | $3,736,417 | $87,926 |
| Fidelity Advisor Consumer Discretionary Fund | | | | |
Class A | - % | .25% | $431,850 | $3,378 |
Class M | .25% | .25% | 158,580 | 518 |
Class C | .75% | .25% | 442,365 | 23,617 |
| | | | $1,032,795 | $27,513 |
| Fidelity Advisor Energy Fund | | | | |
Class A | - % | .25% | $973,591 | $27,025 |
Class M | .25% | .25% | 568,514 | 2,484 |
Class C | .75% | .25% | 1,043,673 | 220,286 |
| | | | $2,585,778 | $249,795 |
| Fidelity Advisor Financials Fund | | | | |
Class A | - % | .25% | $445,222 | $8,144 |
Class M | .25% | .25% | 332,266 | 1,076 |
Class C | .75% | .25% | 498,941 | 58,796 |
| | | | $1,276,429 | $68,016 |
| Fidelity Advisor Health Care Fund | | | | |
Class A | - % | .25% | $3,742,464 | $39,829 |
Class M | .25% | .25% | 1,605,342 | 4,524 |
Class C | .75% | .25% | 4,372,559 | 263,367 |
| | | | $9,720,365 | $307,720 |
| Fidelity Advisor Industrials Fund | | | | |
Class A | - % | .25% | $524,969 | $4,162 |
Class M | .25% | .25% | 249,208 | 1,054 |
Class C | .75% | .25% | 336,447 | 17,297 |
| | | | $1,110,624 | $22,513 |
| Fidelity Advisor Semiconductors Fund | | | | |
Class A | - % | .25% | $910,950 | $24,628 |
Class M | .25% | .25% | 290,512 | 388 |
Class C | .75% | .25% | 907,091 | 142,061 |
| | | | $2,108,553 | $167,077 |
| Fidelity Advisor Technology Fund | | | | |
Class A | - % | .25% | $3,643,773 | $42,842 |
Class M | .25% | .25% | 2,378,488 | 3,956 |
Class C | .75% | .25% | 2,623,384 | 199,167 |
| | | | $8,645,645 | $245,965 |
| Fidelity Advisor Utilities Fund | | | | |
Class A | - % | .25% | $ 830,831 | $20,724 |
Class M | .25% | .25% | 352,246 | 658 |
Class C | .75% | .25% | 621,477 | 124,911 |
| | | | $1,804,554 | $146,293 |
| | | | | |
| | | | | |
Sales Load. FDC may receive a front-end sales charge of up to 5.75% for selling Class A shares and 3.50% for selling Class M shares, some of which is paid to financial intermediaries for selling shares of each Fund. Depending on the holding period, FDC may receive contingent deferred sales charges levied on Class A, Class M and Class C redemptions. The deferred sales charges are 1.00% for Class C shares, 1.00% for certain purchases of Class A shares and .25% for certain purchases of Class M shares.
For the period, sales charge amounts retained by FDC were as follows:
| | Retained by FDC |
| Fidelity Advisor Biotechnology Fund | |
Class A | $156,383 |
Class M | 10,641 |
Class C A | 15,627 |
| | $182,651 |
| Fidelity Advisor Consumer Discretionary Fund | |
Class A | $108,331 |
Class M | 6,046 |
Class C A | 6,678 |
| | $121,055 |
| Fidelity Advisor Energy Fund | |
Class A | $482,703 |
Class M | 20,343 |
Class C A | 38,609 |
| | $541,655 |
Fidelity Advisor Financials Fund | |
Class A | $81,261 |
Class M | 4,536 |
Class C A | 10,258 |
| | $96,055 |
| Fidelity Advisor Health Care Fund | |
Class A | $648,512 |
Class M | 58,468 |
Class C A | 76,676 |
| | $783,656 |
| Fidelity Advisor Industrials Fund | |
Class A | $53,475 |
Class M | 3,830 |
Class C A | 6,029 |
| | $63,334 |
| Fidelity Advisor Semiconductors Fund | |
Class A | $1,409,081 |
Class M | 49,757 |
Class C A | 99,314 |
| | $1,558,152 |
| Fidelity Advisor Technology Fund | |
Class A | $1,159,374 |
Class M | 52,373 |
Class C A | 111,672 |
| | $1,323,419 |
| Fidelity Advisor Utilities Fund | |
Class A | $361,481 |
Class M | 20,532 |
Class C A | 31,508 |
| | $413,521 |
A When Class C shares are initially sold, FDC pays commissions from its own resources to financial intermediaries through which the sales are made.
Transfer Agent Fees. Fidelity Investments Institutional Operations Company LLC (FIIOC), an affiliate of the investment adviser, is the transfer, dividend disbursing and shareholder servicing agent for each class of the Funds. FIIOC receives account fees and asset-based fees that vary according to the account size and type of account of the shareholders of the respective classes of each Fund, except for Class Z. FIIOC receives an asset-based fee of Class Z's average net assets. FIIOC pays for typesetting, printing and mailing of shareholder reports, except proxy statements. For the period, transfer agent fees for each class were as follows:
| | Amount | % of Class-Level Average Net Assets |
| Fidelity Advisor Biotechnology Fund | | |
Class A | $1,225,749 | .19 |
Class M | 255,389 | .22 |
Class C | 305,364 | .20 |
Class I | 1,256,666 | .17 |
Class Z | 25,150 | .04 |
| | $3,068,318 | |
| Fidelity Advisor Consumer Discretionary Fund | | |
Class A | $328,282 | .19 |
Class M | 65,458 | .21 |
Class C | 86,791 | .20 |
Class I | 184,035 | .17 |
Class Z | 27,576 | .04 |
| | $692,142 | |
| Fidelity Advisor Energy Fund | | |
Class A | $736,379 | .19 |
Class M | 226,527 | .20 |
Class C | 191,021 | .18 |
Class I | 947,235 | .17 |
Class Z | 121,733 | .04 |
| | $2,222,895 | |
| Fidelity Advisor Financials Fund | | |
Class A | $348,563 | .20 |
Class M | 124,189 | .19 |
Class C | 96,216 | .19 |
Class I | 208,721 | .17 |
Class Z | 40,936 | .04 |
| | $818,625 | |
| Fidelity Advisor Health Care Fund | | |
Class A | $2,674,652 | .18 |
Class M | 582,593 | .18 |
Class C | 799,017 | .18 |
Class I | 4,489,042 | .17 |
Class Z | 351,690 | .04 |
| | $8,896,994 | |
| Fidelity Advisor Industrials Fund | | |
Class A | $388,453 | .19 |
Class M | 94,153 | .19 |
Class C | 64,750 | .19 |
Class I | 214,040 | .16 |
Class Z | 34,113 | .04 |
| | $795,509 | |
| Fidelity Advisor Semiconductors Fund | | |
Class A | $641,020 | .18 |
Class M | 100,305 | .17 |
Class C | 166,224 | .18 |
Class I | 545,196 | .16 |
Class Z | 22,795 | .04 |
| | $1,475,540 | |
| Fidelity Advisor Technology Fund | | |
Class A | $2,515,809 | .17 |
Class M | 792,085 | .17 |
Class C | 492,992 | .19 |
Class I | 1,854,840 | .16 |
Class Z | 226,374 | .04 |
| | $5,882,100 | |
| Fidelity Advisor Utilities Fund | | |
Class A | $612,365 | .18 |
Class M | 141,487 | .20 |
Class C | 117,451 | .19 |
Class I | 499,807 | .17 |
Class Z | 45,644 | .04 |
| | $1,416,754 | |
Accounting Fees. Fidelity Service Company, Inc. (FSC), an affiliate of the investment adviser, maintains each Fund's accounting records. The accounting fee is based on the level of average net assets for each month. For the period, the fees were equivalent to the following annual rates:
| | % of Average Net Assets |
| Fidelity Advisor Biotechnology Fund | .03 |
| Fidelity Advisor Consumer Discretionary Fund | .04 |
| Fidelity Advisor Energy Fund | .03 |
| Fidelity Advisor Financials Fund | .03 |
| Fidelity Advisor Health Care Fund | .02 |
| Fidelity Advisor Industrials Fund | .04 |
| Fidelity Advisor Semiconductors Fund | .03 |
| Fidelity Advisor Technology Fund | .02 |
| Fidelity Advisor Utilities Fund | .03 |
Brokerage Commissions. A portion of portfolio transactions were placed with brokerage firms which are affiliates of the investment adviser. Brokerage commissions are included in net realized gain (loss) and change in net unrealized appreciation (depreciation) in the Statement of Operations. The commissions paid to these affiliated firms were as follows:
| | Amount |
| Fidelity Advisor Biotechnology Fund | $ 48,945 |
| Fidelity Advisor Consumer Discretionary Fund | 3,189 |
| Fidelity Advisor Energy Fund | 8,503 |
| Fidelity Advisor Financials Fund | 4,963 |
| Fidelity Advisor Health Care Fund | 49,756 |
| Fidelity Advisor Industrials Fund | 18,480 |
| Fidelity Advisor Semiconductors Fund | 4,979 |
| Fidelity Advisor Technology Fund | 12,612 |
| Fidelity Advisor Utilities Fund | 7,920 |
Interfund Lending Program. Pursuant to an Exemptive Order issued by the Securities and Exchange Commission (the SEC), each Fund, along with other registered investment companies having management contracts with Fidelity Management & Research Company LLC (FMR), or other affiliated entities of FMR, may participate in an interfund lending program. This program provides an alternative credit facility allowing each Fund to borrow from, or lend money to, other participating affiliated funds. At period end, there were no interfund loans outstanding. Activity in this program during the period for which loans were outstanding was as follows:
| | Borrower or Lender | Average Loan Balance | Weighted Average Interest Rate | Interest Expense |
| Fidelity Advisor Biotechnology Fund | Borrower | $ 17,729,000 | 5.32% | $ 2,617 |
Fidelity Advisor Consumer Discretionary Fund | Borrower | 4,960,000 | 5.32% | 5,131 |
| Fidelity Advisor Energy Fund | Borrower | $4,407,360 | 4.89% | $ 29,898 |
| Fidelity Advisor Financials Fund | Borrower | $ 4,443,250 | 4.98% | $ 9,828 |
| Fidelity Advisor Health Care Fund | Borrower | $ 7,198,375 | 5.02% | $ 8,038 |
| Fidelity Advisor Industrials Fund | Borrower | $ 5,264,100 | 5.08% | $ 7,425 |
| Fidelity Advisor Technology Fund | Borrower | $ 15,543,000 | 5.44% | $ 2,349 |
| Fidelity Advisor Utilities Fund | Borrower | $ 5,783,000 | 4.69% | $ 5,270 |
Interfund Trades. Funds may purchase from or sell securities to other Fidelity Funds under procedures adopted by the Board. The procedures have been designed to ensure these interfund trades are executed in accordance with Rule 17a-7 of the 1940 Act. Any interfund trades are included within the respective purchases and sales amounts shown in the Purchases and Sales of Investments note. Interfund trades during the period are noted in the table below.
| | Purchases ($) | Sales ($) | Realized Gain (Loss) ($) |
| Fidelity Advisor Biotechnology Fund | 82,085,762 | 88,172,244 | 13,463,784 |
| Fidelity Advisor Consumer Discretionary Fund | 16,632,376 | 5,427,876 | 644,272 |
| Fidelity Advisor Energy Fund | 31,781,131 | 30,547,895 | 1,586,583 |
| Fidelity Advisor Financials Fund | 8,172,274 | 18,893,282 | (560,224) |
| Fidelity Advisor Health Care Fund | 176,915,112 | 211,369,233 | 19,210,245 |
| Fidelity Advisor Industrials Fund | 28,881,595 | 57,138,594 | 5,934,110 |
| Fidelity Advisor Semiconductors Fund | 25,362,521 | 14,087,180 | 425,972 |
| Fidelity Advisor Technology Fund | 77,465,755 | 98,933,978 | 28,076,617 |
| Fidelity Advisor Utilities Fund | 9,265,589 | 9,186,082 | (731,990) |
| | | | |
Other. During the period, the investment adviser reimbursed the Funds for certain losses as follows:
| | Amount ($) |
| Fidelity Advisor Biotechnology Fund | 33,577 |
6. Committed Line of Credit.
Certain Funds participate with other funds managed by the investment adviser or an affiliate in a $4.25 billion credit facility (the "line of credit") to be utilized for temporary or emergency purposes to fund shareholder redemptions or for other short-term liquidity purposes. The participating funds have agreed to pay commitment fees on their pro-rata portion of the line of credit, which are reflected in Miscellaneous expenses on the Statement of Operations, and are listed below. During the period, there were no borrowings on this line of credit.
| | Amount |
| Fidelity Advisor Biotechnology Fund | $3,931 |
| Fidelity Advisor Consumer Discretionary Fund | 973 |
| Fidelity Advisor Energy Fund | 3,355 |
| Fidelity Advisor Financials Fund | 1,199 |
| Fidelity Advisor Health Care Fund | 13,174 |
| Fidelity Advisor Industrials Fund | 1,142 |
| Fidelity Advisor Semiconductors Fund | 1,914 |
| Fidelity Advisor Technology Fund | 8,630 |
| Fidelity Advisor Utilities Fund | 1,923 |
7. Security Lending.
Funds lend portfolio securities from time to time in order to earn additional income. Lending agents are used, including National Financial Services (NFS), an affiliate of the investment adviser. Pursuant to a securities lending agreement, NFS will receive a fee, which is capped at 9.9% of a fund's daily lending revenue, for its services as lending agent. A fund may lend securities to certain qualified borrowers, including NFS. On the settlement date of the loan, a fund receives collateral (in the form of U.S. Treasury obligations, letters of credit and/or cash) against the loaned securities and maintains collateral in an amount not less than 100% of the market value of the loaned securities during the period of the loan. The market value of the loaned securities is determined at the close of business of a fund and any additional required collateral is delivered to a fund on the next business day. A fund or borrower may terminate the loan at any time, and if the borrower defaults on its obligation to return the securities loaned because of insolvency or other reasons, a fund may apply collateral received from the borrower against the obligation. A fund may experience delays and costs in recovering the securities loaned. Any cash collateral received is invested in the Fidelity Securities Lending Cash Central Fund. Any loaned securities are identified as such in the Schedule of Investments, and the value of loaned securities and cash collateral at period end, as applicable, are presented in the Statement of Assets and Liabilities. Security lending income represents the income earned on investing cash collateral, less rebates paid to borrowers and any lending agent fees associated with the loan, plus any premium payments received for lending certain types of securities. Security lending income is presented in the Statement of Operations as a component of income from Fidelity Central Funds. Affiliated security lending activity, if any, was as follows:
| | Total Security Lending Fees Paid to NFS | Security Lending Income From Securities Loaned to NFS | Value of Securities Loaned to NFS at Period End |
| Fidelity Advisor Biotechnology Fund | $255,319 | $42,589 | $3,948,158 |
| Fidelity Advisor Consumer Discretionary Fund | $10,045 | $28,905 | $- |
| Fidelity Advisor Energy Fund | $9,387 | $- | $- |
| Fidelity Advisor Financials Fund | $614 | $- | $- |
| Fidelity Advisor Health Care Fund | $68,350 | $9,600 | $- |
| Fidelity Advisor Industrials Fund | $2,571 | $1 | $- |
| Fidelity Advisor Semiconductors Fund | $76,619 | $30,825 | $- |
| Fidelity Advisor Technology Fund | $33,025 | $5,569 | $- |
| Fidelity Advisor Utilities Fund | $1,223 | $- | $- |
8. Bank Borrowings.
Each Fund is permitted to have bank borrowings for temporary or emergency purposes to fund shareholder redemptions or for other short-term liquidity requirements. Each Fund has established borrowing arrangements with certain banks. The interest rate on the borrowings is the bank's base rate, as revised from time to time. Any open loans, including accrued interest, at period end are presented under the caption "Notes payable" in the Statement of Assets and Liabilities, if applicable. Activity in this program during the period for which loans were outstanding was as follows:
| | Average Loan Balance | Weighted Average Interest Rate | Interest Expense |
| Fidelity Advisor Energy Fund | $ 961,769 | 5.54% | $3,849 |
| Fidelity Advisor Financials Fund | $ 609,917 | 5.58% | $1,135 |
9. Expense Reductions.
Through arrangements with each applicable Fund's custodian and each class' transfer agent, credits realized as a result of certain uninvested cash balances were used to reduce each applicable Fund's or class' expenses. All of the applicable expense reductions are noted in the table below.
| | Custodian credits | Transfer Agent credits |
| Fidelity Advisor Biotechnology Fund | - | 5,248 |
| Fidelity Advisor Consumer Discretionary Fund | - | 214 |
| Fidelity Advisor Energy Fund | - | 2,817 |
| Fidelity Advisor Financials Fund | - | 580 |
| Fidelity Advisor Health Care Fund | 633 | 2,883 |
| Fidelity Advisor Industrials Fund | - | 984 |
| Fidelity Advisor Semiconductors Fund | - | 1,339 |
| Fidelity Advisor Technology Fund | 2,208 | 2,399 |
| Fidelity Advisor Utilities Fund | - | 1,445 |
In addition, during the period the investment adviser or an affiliate reimbursed and/or waived a portion of fund-level operating expenses as follows:
| | Fund-Level Amount |
| Fidelity Advisor Biotechnology Fund | $ 85,362 |
| Fidelity Advisor Consumer Discretionary Fund | 21,308 |
| Fidelity Advisor Energy Fund | 71,430 |
| Fidelity Advisor Financials Fund | 24,954 |
| Fidelity Advisor Health Care Fund | 287,225 |
| Fidelity Advisor Industrials Fund | 25,228 |
| Fidelity Advisor Semiconductors Fund | 47,979 |
| Fidelity Advisor Technology Fund | 199,413 |
| Fidelity Advisor Utilities Fund | 43,609 |
10. Distributions to Shareholders.
Distributions to shareholders of each class were as follows:
| | Year ended July 31, 2023 | Year ended July 31, 2022 |
| Fidelity Advisor Biotechnology Fund | | |
| Distributions to shareholders | | |
| Class A | $- | $130,319,328 |
| Class M | - | 27,259,940 |
| Class C | - | 56,696,827 |
| Class I | - | 161,275,417 |
| Class Z | - | 13,691,301 |
Total | $- | $389,242,813 |
| Fidelity Advisor Consumer Discretionary Fund | | |
| Distributions to shareholders | | |
| Class A | $ 6,880,690 | $16,168,980 |
| Class M | 1,398,366 | 3,125,065 |
| Class C | 2,489,252 | 6,086,253 |
| Class I | 3,782,125 | 13,848,199 |
| Class Z | 2,612,656 | 5,612,122 |
Total | $17,163,089 | $44,840,619 |
| Fidelity Advisor Energy Fund | | |
| Distributions to shareholders | | |
| Class A | $8,545,498 | $4,229,952 |
| Class M | 2,095,293 | 1,304,332 |
| Class C | 1,833,534 | 978,471 |
| Class I | 13,584,550 | 4,763,295 |
| Class Z | 7,375,972 | 3,498,287 |
Total | $33,434,847 | $14,774,337 |
| Fidelity Advisor Financials Fund | | |
| Distributions to shareholders | | |
| Class A | $10,343,831 | $8,215,386 |
| Class M | 3,691,281 | 2,766,606 |
| Class C | 2,770,639 | 2,294,171 |
| Class I | 7,089,508 | 5,648,531 |
| Class Z | 6,890,192 | 2,085,902 |
Total | $ 30,785,451 | $21,010,596 |
| Fidelity Advisor Health Care Fund | | |
| Distributions to shareholders | | |
| Class A | $- | $103,562,390 |
| Class M | - | 25,573,033 |
| Class C | - | 52,054,574 |
| Class I | - | 186,427,506 |
| Class Z | - | 53,845,065 |
Total | $- | $ 421,462,568 |
| Fidelity Advisor Industrials Fund | | |
| Distributions to shareholders | | |
| Class A | $7,071,012 | $48,588,464 |
| Class M | 1,678,793 | 10,790,903 |
| Class C | 1,387,568 | 10,633,855 |
| Class I | 4,233,189 | 43,185,214 |
| Class Z | 3,179,380 | 8,702,749 |
Total | $17,549,942 | $121,901,185 |
| Fidelity Advisor Semiconductors Fund | | |
| Distributions to shareholders | | |
| Class A | $8,928,808 | $ 16,894,260 |
| Class M | 1,417,206 | 3,024,406 |
| Class C | 2,898,996 | 5,665,807 |
| Class I | 7,802,658 | 15,905,080 |
| Class Z | 1,111,011 | 2,418,893 |
Total | $22,158,679 | $43,908,446 |
| Fidelity Advisor Technology Fund | | |
| Distributions to shareholders | | |
| Class A | $44,657,722 | 228,756,732 |
| Class M | 15,873,515 | 82,459,541 |
| Class C | 11,031,237 | 60,838,976 |
| Class I | 31,149,239 | 166,955,477 |
| Class Z | 14,911,183 | 61,960,776 |
Total | $117,622,896 | $600,971,502 |
| Fidelity Advisor Utilities Fund | | |
| Distributions to shareholders | | |
| Class A | $ 15,827,969 | $ 8,686,807 |
| Class M | 3,178,096 | 1,704,212 |
| Class C | 2,595,233 | 1,133,319 |
| Class I | 14,746,535 | 5,976,790 |
| Class Z | 5,860,452 | 2,200,016 |
Total | $42,208,285 | $19,701,144 |
11. Share Transactions.
Share transactions for each class were as follows and may contain in-kind transactions, automatic conversions between classes or exchanges between affiliated funds:
| | Shares | Shares | Dollars | Dollars |
| | Year ended July 31, 2023 | Year ended July 31, 2022 | Year ended July 31, 2023 | Year ended July 31, 2022 |
| Fidelity Advisor Biotechnology Fund | | | | |
| Class A | | | | |
| Shares sold | 3,200,209 | 4,418,691 | $78,997,743 | $117,800,031 |
| Reinvestment of distributions | - | 4,440,754 | - | 118,923,402 |
| Shares redeemed | (5,129,445) | (6,636,216) | (126,229,442) | (173,909,401) |
| Net increase (decrease) | (1,929,236) | 2,223,229 | $(47,231,699) | $62,814,032 |
| Class M | | | | |
| Shares sold | 585,052 | 525,275 | $13,155,289 | $13,292,225 |
| Reinvestment of distributions | - | 1,096,046 | - | 26,962,677 |
| Shares redeemed | (1,112,087) | (1,501,866) | (25,079,956) | (35,974,200) |
| Net increase (decrease) | (527,035) | 119,455 | $(11,924,667) | $4,280,702 |
| Class C | | | | |
| Shares sold | 406,454 | 766,454 | $7,809,259 | $16,982,361 |
| Reinvestment of distributions | - | 2,615,104 | - | 55,231,000 |
| Shares redeemed | (4,111,528) | (5,864,679) | (79,272,567) | (124,192,429) |
| Net increase (decrease) | (3,705,074) | (2,483,121) | $(71,463,308) | $(51,979,068) |
| Class I | | | | |
| Shares sold | 3,930,484 | 6,204,658 | $105,588,310 | $172,889,033 |
| Reinvestment of distributions | - | 4,712,583 | - | 137,418,918 |
| Shares redeemed | (7,664,664) | (14,133,354) | (205,027,950) | (400,482,702) |
| Net increase (decrease) | (3,734,180) | (3,216,113) | $(99,439,640) | $(90,174,751) |
| Class Z | | | | |
| Shares sold | 772,947 | 880,421 | $20,513,188 | $25,302,163 |
| Reinvestment of distributions | - | 396,056 | - | 11,564,840 |
| Shares redeemed | (1,187,102) | (1,224,670) | (31,371,222) | (34,702,053) |
| Net increase (decrease) | (414,155) | 51,807 | $(10,858,034) | $2,164,950 |
| Fidelity Advisor Consumer Discretionary Fund | | | | |
| Class A | | | | |
| Shares sold | 982,071 | 723,542 | $32,708,559 | $30,840,312 |
| Reinvestment of distributions | 213,159 | 360,797 | 6,684,934 | 15,705,493 |
| Shares redeemed | (1,161,794) | (1,390,561) | (37,480,011) | (56,239,450) |
| Net increase (decrease) | 33,436 | (306,222) | $1,913,482 | $(9,693,645) |
| Class M | | | | |
| Shares sold | 139,907 | 86,533 | $4,259,426 | $3,353,263 |
| Reinvestment of distributions | 48,202 | 76,937 | 1,382,434 | 3,082,116 |
| Shares redeemed | (240,619) | (213,236) | (7,160,832) | (7,704,372) |
| Net increase (decrease) | (52,510) | (49,766) | $(1,518,972) | $(1,268,993) |
| Class C | | | | |
| Shares sold | 166,292 | 194,917 | $4,242,334 | $6,446,705 |
| Reinvestment of distributions | 104,574 | 180,010 | 2,479,122 | 6,046,548 |
| Shares redeemed | (750,676) | (756,125) | (18,507,976) | (23,161,684) |
| Net increase (decrease) | (479,810) | (381,198) | $(11,786,520) | $(10,668,431) |
| Class I | | | | |
| Shares sold | 1,961,206 | 957,939 | $72,509,098 | $43,970,719 |
| Reinvestment of distributions | 105,097 | 261,935 | 3,632,142 | 12,486,421 |
| Shares redeemed | (1,814,837) | (3,334,868) | (64,112,469) | (149,620,424) |
| Net increase (decrease) | 251,466 | (2,114,994) | $12,028,771 | $(93,163,284) |
| Class Z | | | | |
| Shares sold | 1,607,768 | 921,806 | $55,088,683 | $38,859,222 |
| Reinvestment of distributions | 73,211 | 92,881 | 2,541,170 | 4,440,626 |
| Shares redeemed | (774,213) | (1,603,367) | (27,608,114) | (72,794,398) |
| Net increase (decrease) | 906,766 | (588,680) | $30,021,739 | $(29,494,550) |
| Fidelity Advisor Energy Fund | | | | |
| Class A | | | | |
| Shares sold | 2,965,090 | 5,586,497 | $125,359,435 | $197,644,201 |
| Reinvestment of distributions | 200,714 | 154,393 | 8,281,444 | 4,035,842 |
| Shares redeemed | (3,841,903) | (4,025,817) | (159,054,801) | (132,157,901) |
| Net increase (decrease) | (676,099) | 1,715,073 | $(25,413,922) | $69,522,142 |
| Class M | | | | |
| Shares sold | 390,349 | 1,108,281 | $16,951,245 | $38,124,228 |
| Reinvestment of distributions | 48,467 | 47,378 | 2,057,403 | 1,273,515 |
| Shares redeemed | (875,129) | (925,853) | (37,005,996) | (30,500,389) |
| Net increase (decrease) | (436,313) | 229,806 | $(17,997,348) | $8,897,354 |
| Class C | | | | |
| Shares sold | 662,408 | 1,487,293 | $25,703,152 | $49,538,922 |
| Reinvestment of distributions | 46,957 | 39,776 | 1,773,567 | 954,633 |
| Shares redeemed | (1,329,293) | (1,191,755) | (50,167,462) | (35,900,925) |
| Net increase (decrease) | (619,928) | 335,314 | $(22,690,743) | $14,592,630 |
| Class I | | | | |
| Shares sold | 5,904,399 | 11,878,651 | $264,297,953 | $442,734,533 |
| Reinvestment of distributions | 282,440 | 152,645 | 12,342,610 | 4,219,114 |
| Shares redeemed | (8,165,711) | (6,391,600) | (357,278,979) | (232,390,112) |
| Net increase (decrease) | (1,978,872) | 5,639,696 | $(80,638,416) | $214,563,535 |
| Class Z | | | | |
| Shares sold | 3,968,517 | 8,049,496 | $175,402,328 | $277,617,915 |
| Reinvestment of distributions | 162,239 | 121,637 | 7,071,987 | 3,353,536 |
| Shares redeemed | (4,835,412) | (5,140,446) | (211,058,509) | (187,048,074) |
| Net increase (decrease) | (704,656) | 3,030,687 | $(28,584,194) | $93,923,377 |
| Fidelity Advisor Financials Fund | | | | |
| Class A | | | | |
| Shares sold | 1,007,482 | 2,078,376 | $25,570,300 | $61,073,336 |
| Reinvestment of distributions | 408,292 | 277,980 | 9,950,068 | 7,866,833 |
| Shares redeemed | (2,063,576) | (1,537,466) | (51,294,760) | (43,023,094) |
| Net increase (decrease) | (647,802) | 818,890 | $(15,774,392) | $25,917,075 |
| Class M | | | | |
| Shares sold | 382,498 | 1,004,137 | $9,695,969 | $29,329,128 |
| Reinvestment of distributions | 150,930 | 97,289 | 3,634,395 | 2,722,139 |
| Shares redeemed | (663,018) | (593,594) | (16,163,119) | (16,539,094) |
| Net increase (decrease) | (129,590) | 507,832 | $(2,832,755) | $15,512,173 |
| Class C | | | | |
| Shares sold | 158,220 | 727,321 | $3,741,582 | $19,854,552 |
| Reinvestment of distributions | 121,519 | 86,295 | 2,753,627 | 2,279,042 |
| Shares redeemed | (931,916) | (618,443) | (21,566,685) | (16,237,901) |
| Net increase (decrease) | (652,177) | 195,173 | $(15,071,476) | $5,895,693 |
| Class I | | | | |
| Shares sold | 1,989,855 | 3,616,649 | $52,766,831 | $109,262,113 |
| Reinvestment of distributions | 277,356 | 187,755 | 6,989,374 | 5,484,338 |
| Shares redeemed | (2,968,307) | (3,023,204) | (75,651,884) | (87,083,084) |
| Net increase (decrease) | (701,096) | 781,200 | $(15,895,679) | $27,663,367 |
| Class Z | | | | |
| Shares sold | 3,844,623 | 2,119,564 | $99,675,825 | $63,792,422 |
| Reinvestment of distributions | 239,686 | 66,623 | 6,020,924 | 1,941,402 |
| Shares redeemed | (3,116,457) | (1,547,460) | (79,345,103) | (45,372,699) |
| Net increase (decrease) | 967,852 | 638,727 | $26,351,646 | $20,361,125 |
| Fidelity Advisor Health Care Fund | | | | |
| Class A | | | | |
| Shares sold | 3,952,012 | 3,747,789 | $229,948,864 | $233,179,014 |
| Reinvestment of distributions | - | 1,495,405 | - | 96,348,946 |
| Shares redeemed | (4,091,037) | (4,339,266) | (237,824,749) | (264,349,157) |
| Net increase (decrease) | (139,025) | 903,928 | $(7,875,885) | $65,178,803 |
| Class M | | | | |
| Shares sold | 323,729 | 435,333 | $17,197,627 | $25,121,427 |
| Reinvestment of distributions | - | 424,487 | - | 25,095,629 |
| Shares redeemed | (798,274) | (855,683) | (42,502,451) | (48,110,063) |
| Net increase (decrease) | (474,545) | 4,137 | $(25,304,824) | $2,106,993 |
| Class C | | | | |
| Shares sold | 724,395 | 1,035,114 | $31,252,102 | $49,790,284 |
| Reinvestment of distributions | - | 1,046,899 | - | 50,596,635 |
| Shares redeemed | (4,142,787) | (3,477,708) | (179,275,708) | (158,966,919) |
| Net increase (decrease) | (3,418,392) | (1,395,695) | $(148,023,606) | $(58,580,000) |
| Class I | | | | |
| Shares sold | 7,285,756 | 10,728,410 | $469,523,346 | $730,079,020 |
| Reinvestment of distributions | - | 2,309,604 | - | 164,674,774 |
| Shares redeemed | (11,196,061) | (14,652,690) | (721,560,464) | (969,895,308) |
| Net increase (decrease) | (3,910,305) | (1,614,676) | $(252,037,118) | $(75,141,514) |
| Class Z | | | | |
| Shares sold | 5,264,645 | 4,032,990 | $334,148,597 | $272,822,935 |
| Reinvestment of distributions | - | 589,521 | - | 42,068,205 |
| Shares redeemed | (5,098,057) | (4,279,711) | (326,368,763) | (283,294,012) |
| Net increase (decrease) | 166,588 | 342,800 | $7,779,834 | $31,597,128 |
| Fidelity Advisor Industrials Fund | | | | |
| Class A | | | | |
| Shares sold | 406,707 | 603,316 | $14,207,996 | $23,516,059 |
| Reinvestment of distributions | 199,881 | 1,213,535 | 6,692,020 | 45,750,285 |
| Shares redeemed | (1,106,776) | (1,335,197) | (38,331,064) | (50,895,928) |
| Net increase (decrease) | (500,188) | 481,654 | $(17,431,048) | $18,370,416 |
| Class M | | | | |
| Shares sold | 126,166 | 174,759 | $4,217,090 | $6,661,118 |
| Reinvestment of distributions | 51,559 | 291,480 | 1,664,332 | 10,627,377 |
| Shares redeemed | (241,056) | (247,645) | (8,188,209) | (9,084,966) |
| Net increase (decrease) | (63,331) | 218,594 | $(2,306,787) | $8,203,529 |
| Class C | | | | |
| Shares sold | 76,596 | 111,395 | $2,255,873 | $3,612,202 |
| Reinvestment of distributions | 49,445 | 331,819 | 1,376,542 | 10,545,204 |
| Shares redeemed | (403,651) | (548,802) | (11,609,090) | (17,779,500) |
| Net increase (decrease) | (277,610) | (105,588) | $(7,976,675) | $(3,622,094) |
| Class I | | | | |
| Shares sold | 1,580,336 | 1,309,576 | $62,430,757 | $56,025,544 |
| Reinvestment of distributions | 106,079 | 874,167 | 3,845,348 | 35,517,393 |
| Shares redeemed | (2,324,872) | (3,337,326) | (89,149,470) | (133,702,575) |
| Net increase (decrease) | (638,457) | (1,153,583) | $(22,873,365) | $(42,159,638) |
| Class Z | | | | |
| Shares sold | 2,596,658 | 414,017 | $89,451,331 | $17,587,181 |
| Reinvestment of distributions | 86,441 | 127,360 | 3,128,307 | 5,164,450 |
| Shares redeemed | (883,875) | (923,868) | (33,054,547) | (37,613,581) |
| Net increase (decrease) | 1,799,224 | (382,491) | $59,525,091 | $(14,861,950) |
| Fidelity Advisor Semiconductors Fund | | | | |
| Class A | | | | |
| Shares sold | 3,139,559 | 2,860,692 | $151,745,716 | $141,379,185 |
| Reinvestment of distributions | 219,674 | 305,160 | 8,824,286 | 16,570,155 |
| Shares redeemed | (1,450,894) | (1,755,975) | (63,995,324) | (81,055,946) |
| Net increase (decrease) | 1,908,339 | 1,409,877 | $96,574,678 | $76,893,394 |
| Class M | | | | |
| Shares sold | 543,026 | 274,328 | $24,086,971 | $13,314,173 |
| Reinvestment of distributions | 37,061 | 58,420 | 1,398,675 | 2,991,086 |
| Shares redeemed | (168,156) | (272,402) | (6,902,970) | (12,460,105) |
| Net increase (decrease) | 411,931 | 60,346 | $18,582,676 | $3,845,154 |
| Class C | | | | |
| Shares sold | 750,418 | 848,794 | $29,626,090 | $34,916,166 |
| Reinvestment of distributions | 88,413 | 126,023 | 2,894,656 | 5,653,413 |
| Shares redeemed | (784,500) | (694,995) | (28,516,396) | (26,741,267) |
| Net increase (decrease) | 54,331 | 279,822 | $4,004,350 | $13,828,312 |
| Class I | | | | |
| Shares sold | 4,070,496 | 4,659,880 | $212,088,692 | $244,049,201 |
| Reinvestment of distributions | 177,505 | 250,734 | 7,666,452 | 14,570,164 |
| Shares redeemed | (3,061,827) | (3,378,308) | (145,241,848) | (169,937,377) |
| Net increase (decrease) | 1,186,174 | 1,532,306 | $74,513,296 | $88,681,988 |
| Class Z | | | | |
| Shares sold | 773,142 | 955,357 | $40,811,429 | $50,804,090 |
| Reinvestment of distributions | 20,319 | 35,604 | 877,292 | 2,067,182 |
| Shares redeemed | (402,594) | (494,861) | (18,621,247) | (24,155,858) |
| Net increase (decrease) | 390,867 | 496,100 | $23,067,474 | $28,715,414 |
| Fidelity Advisor Technology Fund | | | | |
| Class A | | | | |
| Shares sold | 2,719,769 | 2,519,136 | $206,725,335 | $232,706,169 |
| Reinvestment of distributions | 628,818 | 2,240,274 | 42,658,884 | 218,314,727 |
| Shares redeemed | (2,778,801) | (3,342,272) | (202,519,149) | (298,760,229) |
| Net increase (decrease) | 569,786 | 1,417,138 | $46,865,070 | $152,260,667 |
| Class M | | | | |
| Shares sold | 889,665 | 697,044 | $63,637,995 | $59,786,363 |
| Reinvestment of distributions | 252,456 | 907,716 | 15,667,387 | 81,358,575 |
| Shares redeemed | (949,000) | (1,175,809) | (63,257,879) | (96,678,322) |
| Net increase (decrease) | 193,121 | 428,951 | $16,047,503 | $44,466,616 |
| Class C | | | | |
| Shares sold | 560,367 | 583,339 | $32,443,071 | $41,708,463 |
| Reinvestment of distributions | 213,030 | 804,256 | 10,843,236 | 59,884,931 |
| Shares redeemed | (1,383,227) | (1,436,860) | (76,050,104) | (98,189,544) |
| Net increase (decrease) | (609,830) | (49,265) | $(32,763,797) | $3,403,850 |
| Class I | | | | |
| Shares sold | 4,444,591 | 3,867,129 | $375,313,502 | $384,870,571 |
| Reinvestment of distributions | 387,393 | 1,447,115 | 29,507,702 | 157,373,714 |
| Shares redeemed | (4,072,906) | (4,936,086) | (338,992,438) | (483,932,095) |
| Net increase (decrease) | 759,078 | 378,158 | $65,828,766 | $58,312,190 |
| Class Z | | | | |
| Shares sold | 3,452,388 | 2,088,418 | $279,946,819 | $199,301,687 |
| Reinvestment of distributions | 169,093 | 520,545 | 12,873,087 | 56,520,804 |
| Shares redeemed | (2,016,130) | (1,767,962) | (167,266,551) | (176,311,632) |
| Net increase (decrease) | 1,605,351 | 841,001 | $125,553,355 | $79,510,859 |
| Fidelity Advisor Utilities Fund | | | | |
| Class A | | | | |
| Shares sold | 2,215,949 | 2,038,098 | $84,107,146 | $76,451,481 |
| Reinvestment of distributions | 413,410 | 227,863 | 15,411,688 | 8,404,572 |
| Shares redeemed | (1,942,608) | (1,522,462) | (72,156,394) | (55,946,312) |
| Net increase (decrease) | 686,751 | 743,499 | $27,362,440 | $28,909,741 |
| Class M | | | | |
| Shares sold | 249,639 | 280,727 | $9,574,291 | $10,659,633 |
| Reinvestment of distributions | 83,223 | 45,465 | 3,114,610 | 1,678,440 |
| Shares redeemed | (294,172) | (204,995) | (10,991,952) | (7,562,685) |
| Net increase (decrease) | 38,690 | 121,197 | $1,696,949 | $4,775,388 |
| Class C | | | | |
| Shares sold | 551,415 | 455,467 | $20,505,123 | $16,708,391 |
| Reinvestment of distributions | 70,929 | 31,528 | 2,585,729 | 1,129,916 |
| Shares redeemed | (600,716) | (377,473) | (21,673,319) | (13,548,566) |
| Net increase (decrease) | 21,628 | 109,522 | $1,417,533 | $4,289,741 |
| Class I | | | | |
| Shares sold | 4,966,694 | 4,333,877 | $194,190,345 | $167,495,499 |
| Reinvestment of distributions | 377,332 | 154,482 | 14,409,343 | 5,854,917 |
| Shares redeemed | (5,296,143) | (1,916,822) | (200,737,485) | (71,914,451) |
| Net increase (decrease) | 47,883 | 2,571,537 | $7,862,203 | $101,435,965 |
| Class Z | | | | |
| Shares sold | 2,267,279 | 2,215,889 | $86,908,960 | $87,714,810 |
| Reinvestment of distributions | 135,003 | 46,255 | 5,151,177 | 1,754,820 |
| Shares redeemed | (2,167,228) | (1,195,749) | (82,982,143) | (44,084,084) |
| Net increase (decrease) | 235,054 | 1,066,395 | $9,077,994 | $45,385,546 |
12. Other.
A fund's organizational documents provide former and current trustees and officers with a limited indemnification against liabilities arising in connection with the performance of their duties to the fund. In the normal course of business, a fund may also enter into contracts that provide general indemnifications. A fund's maximum exposure under these arrangements is unknown as this would be dependent on future claims that may be made against a fund. The risk of material loss from such claims is considered remote.
13. Risk and Uncertainties.
Many factors affect a fund's performance. Developments that disrupt global economies and financial markets, such as pandemics, epidemics, outbreaks of infectious diseases, war, terrorism, and environmental disasters, may significantly affect a fund's investment performance. The effects of these developments to a fund will be impacted by the types of securities in which a fund invests, the financial condition, industry, economic sector, and geographic location of an issuer, and a fund's level of investment in the securities of that issuer. Significant concentrations in security types, issuers, industries, sectors, and geographic locations may magnify the factors that affect a fund's performance.
To the Board of Trustees of Fidelity Advisor Series VII and the Shareholders of Fidelity Advisor Biotechnology Fund, Fidelity Advisor Consumer Discretionary Fund, Fidelity Advisor Energy Fund, Fidelity Advisor Financials Fund (formerly Fidelity Advisor Financial Services Fund), Fidelity Advisor Health Care Fund, Fidelity Advisor Industrials Fund, Fidelity Advisor Semiconductors Fund, Fidelity Advisor Technology Fund, and Fidelity Advisor Utilities Fund:
Opinion on the Financial Statements and Financial Highlights
We have audited the accompanying statements of assets and liabilities of Fidelity Advisor Biotechnology Fund, Fidelity Advisor Consumer Discretionary Fund, Fidelity Advisor Energy Fund, Fidelity Advisor Financials Fund (formerly Fidelity Advisor Financial Services Fund), Fidelity Advisor Health Care Fund, Fidelity Advisor Industrials Fund, Fidelity Advisor Semiconductors Fund, Fidelity Advisor Technology Fund, and Fidelity Advisor Utilities Fund (the "Funds"), each a fund of Fidelity Advisor Series VII, including the schedules of investments, as of July 31, 2023, the related statements of operations for the year then ended, the statements of changes in net assets for each of the two years in the period then ended, the financial highlights for each of the five years in the period then ended, and the related notes. In our opinion, the financial statements and financial highlights present fairly, in all material respects, the financial position of each of the Funds as of July 31, 2023, and the results of their operations for the year then ended, the changes in their net assets for each of the two years in the period then ended, and the financial highlights for each of the five years in the period then ended in conformity with accounting principles generally accepted in the United States of America.
Basis for Opinion
These financial statements and financial highlights are the responsibility of the Funds' management. Our responsibility is to express an opinion on the Funds' financial statements and financial highlights based on our audits. We are a public accounting firm registered with the Public Company Accounting Oversight Board (United States) (PCAOB) and are required to be independent with respect to the Funds in accordance with the U.S. federal securities laws and the applicable rules and regulations of the Securities and Exchange Commission and the PCAOB.
We conducted our audits in accordance with the standards of the PCAOB. Those standards require that we plan and perform the audit to obtain reasonable assurance about whether the financial statements and financial highlights are free of material misstatement, whether due to error or fraud. The Funds are not required to have, nor were we engaged to perform, an audit of their internal control over financial reporting. As part of our audits we are required to obtain an understanding of internal control over financial reporting but not for the purpose of expressing an opinion on the effectiveness of the Funds' internal control over financial reporting. Accordingly, we express no such opinion.
Our audits included performing procedures to assess the risks of material misstatement of the financial statements and financial highlights, whether due to error or fraud, and performing procedures that respond to those risks. Such procedures included examining, on a test basis, evidence regarding the amounts and disclosures in the financial statements and financial highlights. Our audits also included evaluating the accounting principles used and significant estimates made by management, as well as evaluating the overall presentation of the financial statements and financial highlights. Our procedures included confirmation of securities owned as of July 31, 2023, by correspondence with the custodian and brokers; when replies were not received from brokers, we performed other auditing procedures. We believe that our audits provide a reasonable basis for our opinion.
/s/ Deloitte & Touche LLP
Boston, Massachusetts
September 15, 2023
We have served as the auditor of one or more of the Fidelity investment companies since 1999.
The Trustees, Members of the Advisory Board (if any), and officers of the trust and funds, as applicable, are listed below. The Board of Trustees governs each fund and is responsible for protecting the interests of shareholders. The Trustees are experienced executives who meet periodically throughout the year to oversee each fund's activities, review contractual arrangements with companies that provide services to each fund, oversee management of the risks associated with such activities and contractual arrangements, and review each fund's performance. Except for Vijay Advani, each of the Trustees oversees 321 funds. Mr. Advani oversees 215 funds.
The Trustees hold office without limit in time except that (a) any Trustee may resign; (b) any Trustee may be removed by written instrument, signed by at least two-thirds of the number of Trustees prior to such removal; (c) any Trustee who requests to be retired or who has become incapacitated by illness or injury may be retired by written instrument signed by a majority of the other Trustees; and (d) any Trustee may be removed at any special meeting of shareholders by a two-thirds vote of the outstanding voting securities of the trust. Each Trustee who is not an interested person (as defined in the 1940 Act) of the trust and the funds is referred to herein as an Independent Trustee. Each Independent Trustee shall retire not later than the last day of the calendar year in which his or her 75th birthday occurs. The Independent Trustees may waive this mandatory retirement age policy with respect to individual Trustees. Officers and Advisory Board Members hold office without limit in time, except that any officer or Advisory Board Member may resign or may be removed by a vote of a majority of the Trustees at any regular meeting or any special meeting of the Trustees. Except as indicated, each individual has held the office shown or other offices in the same company for the past five years.
The funds' Statement of Additional Information (SAI) includes more information about the Trustees. To request a free copy, call Fidelity at 1-877-208-0098.
Experience, Skills, Attributes, and Qualifications of the Trustees. The Governance and Nominating Committee has adopted a statement of policy that describes the experience, qualifications, attributes, and skills that are necessary and desirable for potential Independent Trustee candidates (Statement of Policy). The Board believes that each Trustee satisfied at the time he or she was initially elected or appointed a Trustee, and continues to satisfy, the standards contemplated by the Statement of Policy. The Governance and Nominating Committee also engages professional search firms to help identify potential Independent Trustee candidates who have the experience, qualifications, attributes, and skills consistent with the Statement of Policy. From time to time, additional criteria based on the composition and skills of the current Independent Trustees, as well as experience or skills that may be appropriate in light of future changes to board composition, business conditions, and regulatory or other developments, have also been considered by the professional search firms and the Governance and Nominating Committee. In addition, the Board takes into account the Trustees' commitment and participation in Board and committee meetings, as well as their leadership of standing and ad hoc committees throughout their tenure.
In determining that a particular Trustee was and continues to be qualified to serve as a Trustee, the Board has considered a variety of criteria, none of which, in isolation, was controlling. The Board believes that, collectively, the Trustees have balanced and diverse experience, qualifications, attributes, and skills, which allow the Board to operate effectively in governing each fund and protecting the interests of shareholders. Information about the specific experience, skills, attributes, and qualifications of each Trustee, which in each case led to the Board's conclusion that the Trustee should serve (or continue to serve) as a trustee of the funds, is provided below.
Board Structure and Oversight Function. Robert A. Lawrence is an interested person and currently serves as Chair. The Trustees have determined that an interested Chair is appropriate and benefits shareholders because an interested Chair has a personal and professional stake in the quality and continuity of services provided to the funds. Independent Trustees exercise their informed business judgment to appoint an individual of their choosing to serve as Chair, regardless of whether the Trustee happens to be independent or a member of management. The Independent Trustees have determined that they can act independently and effectively without having an Independent Trustee serve as Chair and that a key structural component for assuring that they are in a position to do so is for the Independent Trustees to constitute a substantial majority for the Board. The Independent Trustees also regularly meet in executive session. David M. Thomas serves as Lead Independent Trustee and as such (i) acts as a liaison between the Independent Trustees and management with respect to matters important to the Independent Trustees and (ii) with management prepares agendas for Board meetings.
Fidelity® funds are overseen by different Boards of Trustees. The funds' Board oversees Fidelity's high income and certain equity funds, and other Boards oversee Fidelity's alternative investment, investment-grade bond, money market, asset allocation, and other equity funds. The asset allocation funds may invest in Fidelity® funds overseen by the funds' Board. The use of separate Boards, each with its own committee structure, allows the Trustees of each group of Fidelity® funds to focus on the unique issues of the funds they oversee, including common research, investment, and operational issues. On occasion, the separate Boards establish joint committees to address issues of overlapping consequences for the Fidelity® funds overseen by each Board.
The Trustees operate using a system of committees to facilitate the timely and efficient consideration of all matters of importance to the Trustees, each fund, and fund shareholders and to facilitate compliance with legal and regulatory requirements and oversight of the funds' activities and associated risks. The Board, acting through its committees, has charged FMR and its affiliates with (i) identifying events or circumstances the occurrence of which could have demonstrably adverse effects on the funds' business and/or reputation; (ii) implementing processes and controls to lessen the possibility that such events or circumstances occur or to mitigate the effects of such events or circumstances if they do occur; and (iii) creating and maintaining a system designed to evaluate continuously business and market conditions in order to facilitate the identification and implementation processes described in (i) and (ii) above. Because the day-to-day operations and activities of the funds are carried out by or through FMR, its affiliates, and other service providers, the funds' exposure to risks is mitigated but not eliminated by the processes overseen by the Trustees. While each of the Board's committees has responsibility for overseeing different aspects of the funds' activities, oversight is exercised primarily through the Operations, Audit, and Compliance Committees. Appropriate personnel, including but not limited to the funds' Chief Compliance Officer (CCO), FMR's internal auditor, the independent accountants, the funds' Treasurer and portfolio management personnel, make periodic reports to the Board's committees, as appropriate, including an annual review of Fidelity's risk management program for the Fidelity® funds. The responsibilities of each standing committee, including their oversight responsibilities, are described further under "Standing Committees of the Trustees."
Interested Trustees*:
Correspondence intended for a Trustee who is an interested person may be sent to Fidelity Investments, 245 Summer Street, Boston, Massachusetts 02210.
Name, Year of Birth; Principal Occupations and Other Relevant Experience+
Bettina Doulton (1964)
Year of Election or Appointment: 2020
Trustee
Ms. Doulton also serves as Trustee of other Fidelity® funds. Prior to her retirement, Ms. Doulton served in a variety of positions at Fidelity Investments, including as a managing director of research (2006-2007), portfolio manager to certain Fidelity® funds (1993-2005), equity analyst and portfolio assistant (1990-1993), and research assistant (1987-1990). Ms. Doulton currently owns and operates Phi Builders + Architects and Cellardoor Winery. Previously, Ms. Doulton served as a member of the Board of Brown Capital Management, LLC (2014-2018).
Robert A. Lawrence (1952)
Year of Election or Appointment: 2020
Trustee
Chair of the Board of Trustees
Mr. Lawrence also serves as Trustee of other funds. Previously, Mr. Lawrence served as a Trustee and Member of the Advisory Board of certain funds. Prior to his retirement in 2008, Mr. Lawrence served as Vice President of certain Fidelity® funds (2006-2008), Senior Vice President, Head of High Income Division of Fidelity Management & Research Company (investment adviser firm, 2006-2008), and President of Fidelity Strategic Investments (investment adviser firm, 2002-2005).
* Determined to be an "Interested Trustee" by virtue of, among other things, his or her affiliation with the trust or various entities under common control with FMR.
+ The information includes the Trustee's principal occupation during the last five years and other information relating to the experience, attributes, and skills relevant to the Trustee's qualifications to serve as a Trustee, which led to the conclusion that the Trustee should serve as a Trustee for each fund.
Independent Trustees:
Correspondence intended for an Independent Trustee may be sent to Fidelity Investments, P.O. Box 55235, Boston, Massachusetts 02205-5235.
Name, Year of Birth; Principal Occupations and Other Relevant Experience+
Vijay C. Advani (1960)
Year of Election or Appointment: 2023
Trustee
Mr. Advani also serves as Trustee or Member of the Advisory Board of other funds. Previously, Mr. Advani served as Executive Chairman (2020-2022), Chief Executive Officer (2017-2020) and Chief Operating Officer (2016-2017) of Nuveen (global investment manager). He also served in various capacities at Franklin Resources (global investment manager), including Co-President (2015-2016), Executive Vice President, Global Advisory Services (2008-2015), Head of Global Retail Distribution (2005-2008), Executive Managing Director, International Retail Development (2002-2005), Managing Director, Product Developments, Sales & Marketing, Asia, Eastern Europe and Africa (2000-2002) and President, Templeton Asset Management India (1995-2000). Mr. Advani also served as Senior Investment Officer of International Finance Corporation (private equity and venture capital arm of The World Bank, 1984-1995). Mr. Advani is Chairman Emeritus of the U.S. India Business Council (2018-present), a Director of The Global Impact Investing Network (2019-present), a Director of LOK Capital (Mauritius) (2022-present), a member of the Advisory Council of LOK Capital (2022-present), a Senior Advisor of Neuberger Berman (2021-present), a Senior Advisor of Seviora Holdings Pte. Ltd (Temasek-Singapore) (2021-present), a Director of Seviora Capital (Singapore) (2021-present) and an Advisor of EQUIAM (2021-present). Mr. Advani formerly served as a member of the Board of BowX Acquisition Corp. (special purpose acquisition company, 2020-2021), a member of the Board of Intellecap (advisory arm of The Aavishkaar Group, 2018-2020), a member of the Board of Nuveen Investments, Inc. (2017-2020) and a member of the Board of Docusign (software, 2016-2019).
Thomas P. Bostick (1956)
Year of Election or Appointment: 2021
Trustee
Lieutenant General Bostick also serves as Trustee of other Fidelity® funds. Prior to his retirement, General Bostick (United States Army, Retired) held a variety of positions within the U.S. Army, including Commanding General and Chief of Engineers, U.S. Army Corps of Engineers (2012-2016) and Deputy Chief of Staff and Director of Human Resources, U.S. Army (2009-2012). General Bostick currently serves as a member of the Board and Finance and Governance & Sustainability Committees of CSX Corporation (transportation, 2020-present) and a member of the Board and Corporate Governance and Nominating Committee of Perma-Fix Environmental Services, Inc. (nuclear waste management, 2020-present). General Bostick serves as Chief Executive Officer of Bostick Global Strategies, LLC (consulting, 2016-present), as a member of the Board of HireVue, Inc. (video interview and assessment, 2020-present), as a member of the Board of Allonnia (biotechnology and engineering solutions, 2022-present) and on the Advisory Board of Solugen, Inc. (specialty bio-based chemicals manufacturer, 2022-present). Previously, General Bostick served as a Member of the Advisory Board of certain Fidelity® funds (2021), President, Intrexon Bioengineering (2018-2020) and Chief Operating Officer (2017-2020) and Senior Vice President of the Environment Sector (2016-2017) of Intrexon Corporation (biopharmaceutical company).
Dennis J. Dirks (1948)
Year of Election or Appointment: 2018
Trustee
Mr. Dirks also serves as Trustee of other Fidelity® funds. Prior to his retirement in May 2003, Mr. Dirks served as Chief Operating Officer and as a member of the Board of The Depository Trust & Clearing Corporation (financial markets infrastructure), President, Chief Operating Officer and a member of the Board of The Depository Trust Company (DTC), President and a member of the Board of the National Securities Clearing Corporation (NSCC), Chief Executive Officer and a member of the Board of the Government Securities Clearing Corporation and Chief Executive Officer and a member of the Board of the Mortgage-Backed Securities Clearing Corporation. Mr. Dirks currently serves as a member of the Finance Committee (2016-present) and Board (2017-present) and is Treasurer (2018-present) of the Asolo Repertory Theatre.
Donald F. Donahue (1950)
Year of Election or Appointment: 2018
Trustee
Mr. Donahue also serves as Trustee of other Fidelity® funds. Mr. Donahue serves as President and Chief Executive Officer of Miranda Partners, LLC (risk consulting for the financial services industry, 2012-present). Previously, Mr. Donahue served as Chief Executive Officer (2006-2012), Chief Operating Officer (2003-2006) and Managing Director, Customer Marketing and Development (1999-2003) of The Depository Trust & Clearing Corporation (financial markets infrastructure). Mr. Donahue currently serves as a member (2007-present) and Co-Chairman (2016-present) of the Board of United Way of New York. Mr. Donahue previously served as a member of the Advisory Board of certain Fidelity® funds (2015-2018) and as a member of the Board of The Leadership Academy (previously NYC Leadership Academy) (2012-2022).
Vicki L. Fuller (1957)
Year of Election or Appointment: 2020
Trustee
Ms. Fuller also serves as Trustee of other Fidelity® funds. Previously, Ms. Fuller served as a member of the Advisory Board of certain Fidelity® funds (2018-2020), Chief Investment Officer of the New York State Common Retirement Fund (2012-2018) and held a variety of positions at AllianceBernstein L.P. (global asset management, 1985-2012), including Managing Director (2006-2012) and Senior Vice President and Senior Portfolio Manager (2001-2006). Ms. Fuller currently serves as a member of the Board, Audit Committee and Nominating and Governance Committee of two Blackstone business development companies (2020-present), as a member of the Board of Treliant, LLC (consulting, 2019-present), as a member of the Board of Ariel Alternatives, LLC (private equity, 2022-present) and as a member of the Board and Chair of the Audit Committee of Gusto, Inc. (software, 2021-present). In addition, Ms. Fuller currently serves as a member of the Board of Roosevelt University (2019-present) and as a member of the Executive Board of New York University's Stern School of Business. Ms. Fuller previously served as a member of the Board, Audit Committee and Nominating and Governance Committee of The Williams Companies, Inc. (natural gas infrastructure, 2018-2021).
Patricia L. Kampling (1959)
Year of Election or Appointment: 2020
Trustee
Ms. Kampling also serves as Trustee of other Fidelity® funds. Prior to her retirement, Ms. Kampling served as Chairman of the Board and Chief Executive Officer (2012-2019), President and Chief Operating Officer (2011-2012) and Executive Vice President and Chief Financial Officer (2010-2011) of Alliant Energy Corporation. Ms. Kampling currently serves as a member of the Board, Finance Committee and Governance, Compensation and Nominating Committee of Xcel Energy Inc. (utilities company, 2020-present) and as a member of the Board, Audit, Finance and Risk Committee and Safety, Environmental, Technology and Operations Committee and Chair of the Executive Development and Compensation Committee of American Water Works Company, Inc. (utilities company, 2019-present). In addition, Ms. Kampling currently serves as a member of the Board of the Nature Conservancy, Wisconsin Chapter (2019-present). Previously, Ms. Kampling served as a Member of the Advisory Board of certain Fidelity® funds (2020), a member of the Board, Compensation Committee and Executive Committee and Chair of the Audit Committee of Briggs & Stratton Corporation (manufacturing, 2011-2021), a member of the Board of Interstate Power and Light Company (2012-2019) and Wisconsin Power and Light Company (2012-2019) (each a subsidiary of Alliant Energy Corporation) and as a member of the Board and Workforce Development Committee of the Business Roundtable (2018-2019).
Thomas A. Kennedy (1955)
Year of Election or Appointment: 2021
Trustee
Mr. Kennedy also serves as Trustee of other Fidelity® funds. Previously, Mr. Kennedy served as a Member of the Advisory Board of certain Fidelity® funds (2020) and held a variety of positions at Raytheon Company (aerospace and defense, 1983-2020), including Chairman and Chief Executive Officer (2014-2020) and Executive Vice President and Chief Operating Officer (2013-2014). Mr. Kennedy served as Executive Chairman of the Board of Directors of Raytheon Technologies Corporation (aerospace and defense, 2020-2021). Mr. Kennedy serves as a Director of the Board of Directors of Textron Inc. (aerospace and defense, 2023-present).
Oscar Munoz (1959)
Year of Election or Appointment: 2021
Trustee
Mr. Munoz also serves as Trustee of other Fidelity® funds. Prior to his retirement, Mr. Munoz served as Executive Chairman (2020-2021), Chief Executive Officer (2015-2020), President (2015-2016) and a member of the Board (2010-2021) of United Airlines Holdings, Inc. Mr. Munoz currently serves as a member of the Board of CBRE Group, Inc. (commercial real estate, 2020-present), a member of the Board of Univision Communications, Inc. (Hispanic media, 2020-present), a member of the Board of Archer Aviation Inc. (2021-present), a member of the Defense Business Board of the United States Department of Defense (2021-present) and a member of the Board of Salesforce.com, Inc. (cloud-based software, 2022-present). Previously, Mr. Munoz served as a Member of the Advisory Board of certain Fidelity® funds (2021).
David M. Thomas (1949)
Year of Election or Appointment: 2018
Trustee
Lead Independent Trustee
Mr. Thomas also serves as Trustee of other Fidelity® funds. Previously, Mr. Thomas served as Executive Chairman (2005-2006) and Chairman and Chief Executive Officer (2000-2005) of IMS Health, Inc. (pharmaceutical and healthcare information solutions). Mr. Thomas currently serves as a member of the Board of Fortune Brands Home and Security (home and security products, 2004-present) and as Director (2013-present) and Non-Executive Chairman of the Board (2022-present) of Interpublic Group of Companies, Inc. (marketing communication).
Susan Tomasky (1953)
Year of Election or Appointment: 2020
Trustee
Ms. Tomasky also serves as Trustee of other Fidelity® funds. Prior to her retirement, Ms. Tomasky served in various executive officer positions at American Electric Power Company, Inc. (1998-2011), including most recently as President of AEP Transmission (2007-2011). Ms. Tomasky currently serves as a member of the Board and Sustainability Committee and as Chair of the Audit Committee of Marathon Petroleum Corporation (2018-present) and as a member of the Board, Executive Committee, Corporate Governance Committee and Organization and Compensation Committee and as Lead Director of the Board of Public Service Enterprise Group, Inc. (utilities company, 2012-present) and as a member of the Board of its subsidiary company, Public Service Electric and Gas Co. (2021-present). In addition, Ms. Tomasky currently serves as a member (2009-present) and President (2020-present) of the Board of the Royal Shakespeare Company - America (2009-present), as a member of the Board of the Columbus Association for the Performing Arts (2011-present) and as a member of the Board and Kenyon in the World Committee of Kenyon College (2016-present). Previously, Ms. Tomasky served as a Member of the Advisory Board of certain Fidelity® funds (2020), as a member of the Board of the Columbus Regional Airport Authority (2007-2020), as a member of the Board (2011-2018) and Lead Independent Director (2015-2018) of Andeavor Corporation (previously Tesoro Corporation) (independent oil refiner and marketer) and as a member of the Board of Summit Midstream Partners LP (energy, 2012-2018).
Michael E. Wiley (1950)
Year of Election or Appointment: 2008
Trustee
Mr. Wiley also serves as Trustee of other Fidelity® funds. Previously, Mr. Wiley served as a member of the Advisory Board of certain Fidelity® funds (2018-2020), Chairman, President and CEO of Baker Hughes, Inc. (oilfield services, 2000-2004). Mr. Wiley also previously served as a member of the Board of Andeavor Corporation (independent oil refiner and marketer, 2005-2018), a member of the Board of Andeavor Logistics LP (natural resources logistics, 2015-2018) and a member of the Board of High Point Resources (exploration and production, 2005-2020).
+ The information includes the Trustee's principal occupation during the last five years and other information relating to the experience, attributes, and skills relevant to the Trustee's qualifications to serve as a Trustee, which led to the conclusion that the Trustee should serve as a Trustee for each fund.
Advisory Board Members and Officers:
Correspondence intended for a Member of the Advisory Board (if any) may be sent to Fidelity Investments, P.O. Box 55235, Boston, Massachusetts 02205-5235. Correspondence intended for an officer or Peter S. Lynch may be sent to Fidelity Investments, 245 Summer Street, Boston, Massachusetts 02210. Officers appear below in alphabetical order.
Name, Year of Birth; Principal Occupation
Peter S. Lynch (1944)
Year of Election or Appointment: 2018
Member of the Advisory Board
Mr. Lynch also serves as a Member of the Advisory Board of other Fidelity® funds. Mr. Lynch is Vice Chairman and a Director of Fidelity Management & Research Company LLC (investment adviser firm). In addition, Mr. Lynch serves as a Trustee of Boston College and as the Chairman of the Inner-City Scholarship Fund. Previously, Mr. Lynch served as Vice Chairman and a Director of FMR Co., Inc. (investment adviser firm) and on the Special Olympics International Board of Directors (1997-2006).
Karen B. Peetz (1955)
Year of Election or Appointment: 2023
Member of the Advisory Board
Ms. Peetz also serves as a Member of the Advisory Board of other funds. Previously, Ms. Peetz served as Chief Administration Officer (2020-2023) of Citigroup Inc. (a diversified financial service company). She also served in various capacities at Bank of New York Mellon Corporation, including President (2013-2016), Vice Chairman, Senior Executive Vice President and Chief Executive Officer of Financial Markets & Treasury Services (2010-2013), Senior Executive Vice President and Chief Executive Officer of Global Corporate Trust (2003-2008), Senior Vice President and Division Manager of Global Payments & Trade Services (2002-2003) and Senior Vice President and Division Manager of Domestic Corporate Trust (1998-2002). Ms. Peetz also served in various capacities at Chase Manhattan Corporation (1982-1998), including Senior Vice President and Manager of Corporate Trust International Business (1996-1998), Managing Director and Manager of Corporate Trust Services (1994-1996) and Managing Director and Group Manager of Financial Institution Sales (1990-1993). Ms. Peetz currently serves as Chair of Amherst Holdings Advisory Council (2018-present), Trustee of Johns Hopkins University (2016-present), Chair of the Carey Business School Advisory Council, Member of the Johns Hopkins Medicine Board and Finance Committee and Chair of the Lyme and Tick Related Disease Institute Advisory Council. Ms. Peetz previously served as a member of the Board of Guardian Life Insurance Company of America (2019-2023), a member of the Board of Trane Technologies (2018-2022), a member of the Board of Wells Fargo Corp. (2017-2019), a member of the Board of SunCoke Energy Inc. (2012-2016), a member of the Board of Private Export Funding Corporation (2010-2016) and as a Trustee of Penn State University (2010-2014) and the United Way of New York City (2008-2010).
Heather Bonner (1977)
Year of Election or Appointment: 2023
Assistant Treasurer
Ms. Bonner also serves as an officer of other funds. Ms. Bonner serves as Senior Vice President (2022-present), and is an employee of Fidelity Investments. Ms. Bonner serves as Assistant Treasurer of Fidelity CRET Trustee LLC (2022-present). Prior to joining Fidelity, Ms. Bonner served as Managing Director at AQR Capital Management (2013-2022) and was the Treasurer and Principal Financial Officer of the AQR Funds (2013-2022).
Craig S. Brown (1977)
Year of Election or Appointment: 2022
Deputy Treasurer
Mr. Brown also serves as an officer of other funds. Mr. Brown serves as Assistant Treasurer of FIMM, LLC (2021-present) and is an employee of Fidelity Investments (2013-present). Previously, Mr. Brown served as Assistant Treasurer of certain Fidelity® funds (2019-2022).
John J. Burke III (1964)
Year of Election or Appointment: 2018
Chief Financial Officer
Mr. Burke also serves as Chief Financial Officer of other funds. Mr. Burke serves as Head of Investment Operations for Fidelity Fund and Investment Operations (2018-present) and is an employee of Fidelity Investments (1998-present). Previously Mr. Burke served as head of Asset Management Investment Operations (2012-2018).
Margaret Carey (1973)
Year of Election or Appointment: 2023
Secretary and Chief Legal Officer (CLO)
Ms. Carey also serves as an officer of other funds and as CLO of certain other Fidelity entities. She is a Senior Vice President and Deputy General Counsel of FMR LLC (diversified financial services company, 2019-present), and is an employee of Fidelity Investments.
William C. Coffey (1969)
Year of Election or Appointment: 2019
Assistant Secretary
Mr. Coffey also serves as Assistant Secretary of other funds. He is Senior Vice President and Deputy General Counsel of FMR LLC (diversified financial services company, 2010-present), and is an employee of Fidelity Investments. Previously, Mr. Coffey served as Secretary and CLO of certain funds (2018-2019); CLO, Secretary, and Senior Vice President of Fidelity Management & Research Company and FMR Co., Inc. (investment adviser firms, 2018-2019); Secretary of Fidelity SelectCo, LLC and Fidelity Investments Money Management, Inc. (investment adviser firms, 2018-2019); CLO of Fidelity Management & Research (Hong Kong) Limited, FMR Investment Management (UK) Limited, and Fidelity Management & Research (Japan) Limited (investment adviser firms, 2018-2019); and Assistant Secretary of certain funds (2009-2018).
Timothy M. Cohen (1969)
Year of Election or Appointment: 2018
Vice President
Mr. Cohen also serves as Vice President of other funds. Mr. Cohen serves as Co-Head of Equity (2018-present), a Director of Fidelity Management & Research (Japan) Limited (investment adviser firm, 2016-present), and is an employee of Fidelity Investments. Previously, Mr. Cohen served as Executive Vice President of Fidelity SelectCo, LLC (2019), Head of Global Equity Research (2016-2018), Chief Investment Officer - Equity and a Director of Fidelity Management & Research (U.K.) Inc. (investment adviser firm, 2013-2015) and as a Director of Fidelity Management & Research (Hong Kong) Limited (investment adviser firm, 2017).
Jonathan Davis (1968)
Year of Election or Appointment: 2010
Assistant Treasurer
Mr. Davis also serves as an officer of other funds. Mr. Davis serves as Vice President Assistant Treasurer and is an employee of Fidelity Investments. Mr. Davis serves as Assistant Treasurer of certain Fidelity entities.
Laura M. Del Prato (1964)
Year of Election or Appointment: 2018
Assistant Treasurer
Ms. Del Prato also serves as an officer of other funds. Ms. Del Prato serves as Assistant Treasurer of FIMM, LLC (2021-present) and is an employee of Fidelity Investments (2017-present). Previously, Ms. Del Prato served as President and Treasurer of The North Carolina Capital Management Trust: Cash Portfolio and Term Portfolio (2018-2020). Prior to joining Fidelity Investments, Ms. Del Prato served as a Managing Director and Treasurer of the JPMorgan Mutual Funds (2014-2017). Prior to JPMorgan, Ms. Del Prato served as a partner at Cohen Fund Audit Services (accounting firm, 2012-2013) and KPMG LLP (accounting firm, 2004-2012).
Colm A. Hogan (1973)
Year of Election or Appointment: 2020
Assistant Treasurer
Mr. Hogan also serves as an officer of other funds. Mr. Hogan serves as Assistant Treasurer of FIMM, LLC (2021-present) and FMR Capital, Inc. (2017-present) and is an employee of Fidelity Investments (2005-present). Previously, Mr. Hogan served as Deputy Treasurer of certain Fidelity® funds (2016-2020) and Assistant Treasurer of certain Fidelity® funds (2016-2018).
Pamela R. Holding (1964)
Year of Election or Appointment: 2018
Vice President
Ms. Holding also serves as Vice President of other funds. Ms. Holding serves as Co-Head of Equity (2018-present) and is an employee of Fidelity Investments (2013-present). Previously, Ms. Holding served as Executive Vice President of Fidelity SelectCo, LLC (2019) and as Chief Investment Officer of Fidelity Institutional Asset Management (2013-2018).
Chris Maher (1972)
Year of Election or Appointment: 2020
Deputy Treasurer
Mr. Maher also serves as an officer of other funds. Mr. Maher serves as Assistant Treasurer of FIMM, LLC (2021-present) and FMR Capital, Inc. (2017-present), and is an employee of Fidelity Investments (2008-present). Previously, Mr. Maher served as Assistant Treasurer of certain funds (2013-2020); Vice President of Asset Management Compliance (2013), Vice President of the Program Management Group of FMR (investment adviser firm, 2010-2013), and Vice President of Valuation Oversight (2008-2010).
Jason P. Pogorelec (1975)
Year of Election or Appointment: 2020
Chief Compliance Officer
Mr. Pogorelec also serves as Chief Compliance Officer of other funds. Mr. Pogorelec is a Senior Vice President of Asset Management Compliance for Fidelity Investments and is an employee of Fidelity Investments. Mr. Pogorelec serves as Compliance Officer of Fidelity Management & Research Company LLC (investment adviser firm, 2023-present). Previously, Mr. Pogorelec served as Vice President, Associate General Counsel for Fidelity Investments (2010-2020) and Assistant Secretary of certain Fidelity® funds (2015-2020).
Brett Segaloff (1972)
Year of Election or Appointment: 2021
Anti-Money Laundering (AML) Officer
Mr. Segaloff also serves as an AML Officer of other funds and other related entities. He is Director, Anti-Money Laundering (2007-present) of FMR LLC (diversified financial services company) and is an employee of Fidelity Investments (1996-present).
Stacie M. Smith (1974)
Year of Election or Appointment: 2018
President and Treasurer
Ms. Smith also serves as an officer of other funds. Ms. Smith serves as Assistant Treasurer of FIMM, LLC (2021-present) and FMR Capital, Inc. (2017-present), is an employee of Fidelity Investments (2009-present), and has served in other fund officer roles. Prior to joining Fidelity Investments, Ms. Smith served as Senior Audit Manager of Ernst & Young LLP (accounting firm, 1996-2009). Previously, Ms. Smith served as Assistant Treasurer (2013-2019) and Deputy Treasurer (2013-2016) of certain Fidelity® funds.
Jim Wegmann (1979)
Year of Election or Appointment: 2019
Assistant Treasurer
Mr. Wegmann also serves as an officer of other funds. Mr. Wegmann serves as Assistant Treasurer of FIMM, LLC (2021-present) and is an employee of Fidelity Investments (2011-present). Previously, Mr. Wegmann served as Assistant Treasurer of certain Fidelity® funds (2019-2021).
As a shareholder, you incur two types of costs: (1) transaction costs, which may include sales charges (loads) on purchase payments or redemption proceeds, as applicable and (2) ongoing costs, which generally include management fees, distribution and/or service (12b-1) fees and other Fund expenses. This Example is intended to help you understand your ongoing costs (in dollars) of investing in a fund and to compare these costs with the ongoing costs of investing in other mutual funds.
| The Example is based on an investment of $1,000 invested at the beginning of the period and held for the entire period (February 1, 2023 to July 31, 2023). |
Actual Expenses
The first line of the accompanying table provides information about actual account values and actual expenses. You may use the information in this line, together with the amount you invested, to estimate the expenses that you paid over the period. Simply divide your account value by $1,000.00 (for example, an $8,600 account value divided by $1,000.00 = 8.6), then multiply the result by the number in the first line for a class/Fund under the heading entitled "Expenses Paid During Period" to estimate the expenses you paid on your account during this period. If any fund is a shareholder of any underlying mutual funds or exchange-traded funds (ETFs) (the Underlying Funds), such fund indirectly bears its proportional share of the expenses of the Underlying Funds in addition to the direct expenses incurred presented in the table. These fees and expenses are not included in the annualized expense ratio used to calculate the expense estimate in the table below.
Hypothetical Example for Comparison Purposes
The second line of the accompanying table provides information about hypothetical account values and hypothetical expenses based on the actual expense ratio and an assumed rate of return of 5% per year before expenses, which is not the actual return. The hypothetical account values and expenses may not be used to estimate the actual ending account balance or expenses you paid for the period. You may use this information to compare the ongoing costs of investing in the Fund and other funds. To do so, compare this 5% hypothetical example with the 5% hypothetical examples that appear in the shareholder reports of the other funds. If any fund is a shareholder of any Underlying Funds, such fund indirectly bears its proportional share of the expenses of the Underlying Funds in addition to the direct expenses as presented in the table. These fees and expenses are not included in the annualized expense ratio used to calculate the expense estimate in the table below.
Please note that the expenses shown in the table are meant to highlight your ongoing costs only and do not reflect any transaction costs. Therefore, the second line of the table is useful in comparing ongoing costs only, and will not help you determine the relative total costs of owning different funds. In addition, if these transactional costs were included, your costs would have been higher.
| | | | | Annualized Expense Ratio- A | | Beginning Account Value February 1, 2023 | | Ending Account Value July 31, 2023 | | Expenses Paid During Period- C February 1, 2023 to July 31, 2023 |
| Fidelity Advisor® Biotechnology Fund | | | | | | | | | | |
| Class A | | | | 1.00% | | | | | | |
| Actual | | | | | | $ 1,000 | | $ 1,002.00 | | $ 4.96 |
Hypothetical-B | | | | | | $ 1,000 | | $ 1,019.84 | | $ 5.01 |
| Class M | | | | 1.28% | | | | | | |
| Actual | | | | | | $ 1,000 | | $ 1,000.90 | | $ 6.35 |
Hypothetical-B | | | | | | $ 1,000 | | $ 1,018.45 | | $ 6.41 |
| Class C | | | | 1.76% | | | | | | |
| Actual | | | | | | $ 1,000 | | $ 998.50 | | $ 8.72 |
Hypothetical-B | | | | | | $ 1,000 | | $ 1,016.07 | | $ 8.80 |
| Class I | | | | .73% | | | | | | |
| Actual | | | | | | $ 1,000 | | $ 1,003.60 | | $ 3.63 |
Hypothetical-B | | | | | | $ 1,000 | | $ 1,021.17 | | $ 3.66 |
| Class Z | | | | .60% | | | | | | |
| Actual | | | | | | $ 1,000 | | $ 1,004.30 | | $ 2.98 |
Hypothetical-B | | | | | | $ 1,000 | | $ 1,021.82 | | $ 3.01 |
| Fidelity Advisor® Consumer Discretionary Fund | | | | | | | | | | |
| Class A | | | | 1.02% | | | | | | |
| Actual | | | | | | $ 1,000 | | $ 1,149.80 | | $ 5.44 |
Hypothetical-B | | | | | | $ 1,000 | | $ 1,019.74 | | $ 5.11 |
| Class M | | | | 1.29% | | | | | | |
| Actual | | | | | | $ 1,000 | | $ 1,148.20 | | $ 6.87 |
Hypothetical-B | | | | | | $ 1,000 | | $ 1,018.40 | | $ 6.46 |
| Class C | | | | 1.78% | | | | | | |
| Actual | | | | | | $ 1,000 | | $ 1,145.50 | | $ 9.47 |
Hypothetical-B | | | | | | $ 1,000 | | $ 1,015.97 | | $ 8.90 |
| Class I | | | | .75% | | | | | | |
| Actual | | | | | | $ 1,000 | | $ 1,151.40 | | $ 4.00 |
Hypothetical-B | | | | | | $ 1,000 | | $ 1,021.08 | | $ 3.76 |
| Class Z | | | | .62% | | | | | | |
| Actual | | | | | | $ 1,000 | | $ 1,152.10 | | $ 3.31 |
Hypothetical-B | | | | | | $ 1,000 | | $ 1,021.72 | | $ 3.11 |
| Fidelity Advisor® Energy Fund | | | | | | | | | | |
| Class A | | | | 1.01% | | | | | | |
| Actual | | | | | | $ 1,000 | | $ 996.00 | | $ 5.00 |
Hypothetical-B | | | | | | $ 1,000 | | $ 1,019.79 | | $ 5.06 |
| Class M | | | | 1.27% | | | | | | |
| Actual | | | | | | $ 1,000 | | $ 994.80 | | $ 6.28 |
Hypothetical-B | | | | | | $ 1,000 | | $ 1,018.50 | | $ 6.36 |
| Class C | | | | 1.75% | | | | | | |
| Actual | | | | | | $ 1,000 | | $ 992.20 | | $ 8.64 |
Hypothetical-B | | | | | | $ 1,000 | | $ 1,016.12 | | $ 8.75 |
| Class I | | | | .74% | | | | | | |
| Actual | | | | | | $ 1,000 | | $ 997.30 | | $ 3.66 |
Hypothetical-B | | | | | | $ 1,000 | | $ 1,021.12 | | $ 3.71 |
| Class Z | | | | .61% | | | | | | |
| Actual | | | | | | $ 1,000 | | $ 997.90 | | $ 3.02 |
Hypothetical-B | | | | | | $ 1,000 | | $ 1,021.77 | | $ 3.06 |
| Fidelity Advisor® Financials Fund | | | | | | | | | | |
| Class A | | | | 1.04% | | | | | | |
| Actual | | | | | | $ 1,000 | | $ 947.60 | | $ 5.02 |
Hypothetical-B | | | | | | $ 1,000 | | $ 1,019.64 | | $ 5.21 |
| Class M | | | | 1.28% | | | | | | |
| Actual | | | | | | $ 1,000 | | $ 946.20 | | $ 6.18 |
Hypothetical-B | | | | | | $ 1,000 | | $ 1,018.45 | | $ 6.41 |
| Class C | | | | 1.79% | | | | | | |
| Actual | | | | | | $ 1,000 | | $ 944.00 | | $ 8.63 |
Hypothetical-B | | | | | | $ 1,000 | | $ 1,015.92 | | $ 8.95 |
| Class I | | | | .77% | | | | | | |
| Actual | | | | | | $ 1,000 | | $ 949.00 | | $ 3.72 |
Hypothetical-B | | | | | | $ 1,000 | | $ 1,020.98 | | $ 3.86 |
| Class Z | | | | .63% | | | | | | |
| Actual | | | | | | $ 1,000 | | $ 949.50 | | $ 3.05 |
Hypothetical-B | | | | | | $ 1,000 | | $ 1,021.67 | | $ 3.16 |
| Fidelity Advisor® Health Care Fund | | | | | | | | | | |
| Class A | | | | .97% | | | | | | |
| Actual | | | | | | $ 1,000 | | $ 1,007.60 | | $ 4.83 |
Hypothetical-B | | | | | | $ 1,000 | | $ 1,019.98 | | $ 4.86 |
| Class M | | | | 1.22% | | | | | | |
| Actual | | | | | | $ 1,000 | | $ 1,006.30 | | $ 6.07 |
Hypothetical-B | | | | | | $ 1,000 | | $ 1,018.74 | | $ 6.11 |
| Class C | | | | 1.73% | | | | | | |
| Actual | | | | | | $ 1,000 | | $ 1,003.60 | | $ 8.59 |
Hypothetical-B | | | | | | $ 1,000 | | $ 1,016.22 | | $ 8.65 |
| Class I | | | | .71% | | | | | | |
| Actual | | | | | | $ 1,000 | | $ 1,008.70 | | $ 3.54 |
Hypothetical-B | | | | | | $ 1,000 | | $ 1,021.27 | | $ 3.56 |
| Class Z | | | | .59% | | | | | | |
| Actual | | | | | | $ 1,000 | | $ 1,009.40 | | $ 2.94 |
Hypothetical-B | | | | | | $ 1,000 | | $ 1,021.87 | | $ 2.96 |
| Fidelity Advisor® Industrials Fund | | | | | | | | | | |
| Class A | | | | 1.01% | | | | | | |
| Actual | | | | | | $ 1,000 | | $ 1,096.70 | | $ 5.25 |
Hypothetical-B | | | | | | $ 1,000 | | $ 1,019.79 | | $ 5.06 |
| Class M | | | | 1.27% | | | | | | |
| Actual | | | | | | $ 1,000 | | $ 1,095.40 | | $ 6.60 |
Hypothetical-B | | | | | | $ 1,000 | | $ 1,018.50 | | $ 6.36 |
| Class C | | | | 1.77% | | | | | | |
| Actual | | | | | | $ 1,000 | | $ 1,092.90 | | $ 9.18 |
Hypothetical-B | | | | | | $ 1,000 | | $ 1,016.02 | | $ 8.85 |
| Class I | | | | .74% | | | | | | |
| Actual | | | | | | $ 1,000 | | $ 1,098.30 | | $ 3.85 |
Hypothetical-B | | | | | | $ 1,000 | | $ 1,021.12 | | $ 3.71 |
| Class Z | | | | .62% | | | | | | |
| Actual | | | | | | $ 1,000 | | $ 1,099.00 | | $ 3.23 |
Hypothetical-B | | | | | | $ 1,000 | | $ 1,021.72 | | $ 3.11 |
| Fidelity Advisor® Semiconductors Fund | | | | | | | | | | |
| Class A | | | | .98% | | | | | | |
| Actual | | | | | | $ 1,000 | | $ 1,443.20 | | $ 5.94 |
Hypothetical-B | | | | | | $ 1,000 | | $ 1,019.93 | | $ 4.91 |
| Class M | | | | 1.22% | | | | | | |
| Actual | | | | | | $ 1,000 | | $ 1,441.60 | | $ 7.39 |
Hypothetical-B | | | | | | $ 1,000 | | $ 1,018.74 | | $ 6.11 |
| Class C | | | | 1.74% | | | | | | |
| Actual | | | | | | $ 1,000 | | $ 1,437.80 | | $ 10.52 |
Hypothetical-B | | | | | | $ 1,000 | | $ 1,016.17 | | $ 8.70 |
| Class I | | | | .72% | | | | | | |
| Actual | | | | | | $ 1,000 | | $ 1,445.10 | | $ 4.37 |
Hypothetical-B | | | | | | $ 1,000 | | $ 1,021.22 | | $ 3.61 |
| Class Z | | | | .60% | | | | | | |
| Actual | | | | | | $ 1,000 | | $ 1,446.20 | | $ 3.64 |
Hypothetical-B | | | | | | $ 1,000 | | $ 1,021.82 | | $ 3.01 |
| Fidelity Advisor® Technology Fund | | | | | | | | | | |
| Class A | | | | .97% | | | | | | |
| Actual | | | | | | $ 1,000 | | $ 1,362.10 | | $ 5.68 |
Hypothetical-B | | | | | | $ 1,000 | | $ 1,019.98 | | $ 4.86 |
| Class M | | | | 1.21% | | | | | | |
| Actual | | | | | | $ 1,000 | | $ 1,360.30 | | $ 7.08 |
Hypothetical-B | | | | | | $ 1,000 | | $ 1,018.79 | | $ 6.06 |
| Class C | | | | 1.73% | | | | | | |
| Actual | | | | | | $ 1,000 | | $ 1,356.80 | | $ 10.11 |
Hypothetical-B | | | | | | $ 1,000 | | $ 1,016.22 | | $ 8.65 |
| Class I | | | | .71% | | | | | | |
| Actual | | | | | | $ 1,000 | | $ 1,363.80 | | $ 4.16 |
Hypothetical-B | | | | | | $ 1,000 | | $ 1,021.27 | | $ 3.56 |
| Class Z | | | | .59% | | | | | | |
| Actual | | | | | | $ 1,000 | | $ 1,364.50 | | $ 3.46 |
Hypothetical-B | | | | | | $ 1,000 | | $ 1,021.87 | | $ 2.96 |
| Fidelity Advisor® Utilities Fund | | | | | | | | | | |
| Class A | | | | 1.00% | | | | | | |
| Actual | | | | | | $ 1,000 | | $ 1,015.10 | | $ 5.00 |
Hypothetical-B | | | | | | $ 1,000 | | $ 1,019.84 | | $ 5.01 |
| Class M | | | | 1.27% | | | | | | |
| Actual | | | | | | $ 1,000 | | $ 1,013.80 | | $ 6.34 |
Hypothetical-B | | | | | | $ 1,000 | | $ 1,018.50 | | $ 6.36 |
| Class C | | | | 1.75% | | | | | | |
| Actual | | | | | | $ 1,000 | | $ 1,011.20 | | $ 8.73 |
Hypothetical-B | | | | | | $ 1,000 | | $ 1,016.12 | | $ 8.75 |
| Class I | | | | .74% | | | | | | |
| Actual | | | | | | $ 1,000 | | $ 1,016.50 | | $ 3.70 |
Hypothetical-B | | | | | | $ 1,000 | | $ 1,021.12 | | $ 3.71 |
| Class Z | | | | .61% | | | | | | |
| Actual | | | | | | $ 1,000 | | $ 1,017.20 | | $ 3.05 |
Hypothetical-B | | | | | | $ 1,000 | | $ 1,021.77 | | $ 3.06 |
| |
A Annualized expense ratio reflects expenses net of applicable fee waivers.
B 5% return per year before expenses
C Expenses are equal to the annualized expense ratio, multiplied by the average account value over the period, multiplied by 181/ 365 (to reflect the one-half year period). The fees and expenses of any Underlying Funds are not included in each annualized expense ratio.
The dividend and capital gains distributions for the fund(s) are available on Fidelity.com or Institutional.Fidelity.com.
The funds hereby designate as capital gain dividend the amounts noted below for the taxable year ended July 31, 2023, or, if subsequently determined to be different, the net capital gain of such year.
| Fidelity Advisor Industrials Fund | $39,230,614 |
| Fidelity Advisor Semiconductors Fund | $52,895,806 |
| Fidelity Advisor Technology Fund | $203,004,873 |
| Fidelity Advisor Utilities Fund | $16,773,703 |
A percentage of the dividends distributed during the fiscal year for the following funds were derived from interest on U.S. Government securities which is generally exempt from state income tax.
| Fidelity Advisor Utilities Fund | 0.01% |
A percentage of the dividends distributed during the fiscal year for the following funds qualify for the dividends-received deduction for corporate shareholders:
| | Class A | Class M | Class C | Class I | Class Z |
| Fidelity Advisor Energy Fund | | | | | |
| December 2022 | 100% | 100% | 100% | 100% | 100% |
| Fidelity Advisor Financials Fund | | | | | |
| December 2022 | 100% | 100% | 100% | 100% | 100% |
| Fidelity Advisor Industrials Fund | | | | | |
| December 2022 | 100% | - | - | 100% | 100% |
| Fidelity Advisor Utilities Fund | | | | | |
| October 2022 | 100% | 100% | 100% | 100% | 100% |
| December 2022 | 100% | 100% | 100% | 100% | 100% |
| April 2023 | 100% | 100% | 100% | 100% | 100% |
| July 2023 | 100% | 100% | 100% | 100% | 100% |
A percentage of the dividends distributed during the fiscal year for the following funds may be taken into account as a dividend for purposes of the maximum rate under section 1(h)(11) of the Internal Revenue Code.
| | Class A | Class M | Class C | Class I | Class Z |
| Fidelity Advisor Energy Fund | | | | | |
| December 2022 | 100% | 100% | 100% | 100% | 100% |
| Fidelity Advisor Financials Fund | | | | | |
| December 2022 | 100% | 100% | 100% | 100% | 100% |
| Fidelity Advisor Industrials Fund | | | | | |
| December 2022 | 100% | - | - | 100% | 100% |
| Fidelity Advisor Utilities Fund | | | | | |
| October 2022 | 100% | 100% | 100% | 100% | 100% |
| December 2022 | 100% | 100% | 100% | 100% | 100% |
| April 2023 | 100% | 100% | 100% | 100% | 100% |
| July 2023 | 100% | 100% | 100% | 100% | 100% |
The funds will notify shareholders in January 2024 of amounts for use in preparing 2023 income tax returns.
Board Approval of Investment Advisory Contracts and Management Fees
Fidelity Advisor Focus Funds
Each year, the Board of Trustees, including the Independent Trustees (together, the Board), considers the renewal of the management contract with Fidelity Management & Research Company LLC (FMR) and the sub-advisory agreements (together, the Advisory Contracts) for each fund. FMR and the sub-advisers are referred to herein as the Investment Advisers. The Board, assisted by the advice of fund counsel and Independent Trustees' counsel, requests and considers a broad range of information relevant to the renewal of the Advisory Contracts throughout the year.
The Board meets regularly and, at each of its meetings, covers an extensive agenda of topics and materials and considers factors that are relevant to its annual consideration of the renewal of each fund's Advisory Contracts, including the services and support provided to each fund and its shareholders. The Board, acting directly and through its Committees (each of which is composed of and chaired by Independent Trustees), requests and receives information concerning the annual consideration of the renewal of each fund's Advisory Contracts. The Board also meets as needed to review matters specifically related to the Board's annual consideration of the renewal of the Advisory Contracts. Members of the Board may also meet with trustees of other Fidelity funds through joint ad hoc committees to discuss certain matters relevant to all of the Fidelity funds.
Approval of Stub Period Continuation. At its May 2023 meeting, the Board of Trustees voted to continue each fund's management contract with FMR, and the sub-advisory agreements and sub-sub-advisory agreements, in each case, where applicable (together, the Advisory Contracts), without modification, for two months from June 1, 2023 through July 31, 2023. The Board considered that the approval of each fund's Advisory Contracts will not result in any changes in (i) the investment process or strategies employed in the management of each fund's assets; (ii) the fees and expenses paid by shareholders; (iii) the nature, extent or quality of services provided under each fund's Advisory Contracts; or (iv) the day-to-day management of each fund or the persons primarily responsible for such management. The Board also considered that since its last approval of each fund's Advisory Contracts, FMR had provided additional information on each fund in support of the annual contract renewal process, including competitive analyses on total expenses and management fees and in-depth reviews of fund performance and fund profitability information. The Board concluded that each fund's Advisory Contracts are fair and reasonable, and that each fund's Advisory Contracts should be renewed, without modification, through July 31, 2023, with the understanding that the Board would consider the annual renewal for a full one year period in July 2023.
At its July 2023 meeting, the Board unanimously determined to renew each fund's Advisory Contracts. In reaching its determination, the Board considered all factors it believed relevant, including (i) the nature, extent, and quality of the services provided to each fund and its shareholders (including the investment performance of each fund); (ii) the competitiveness relative to peer funds of each fund's management fee and the total expense ratio of a representative class of each fund (Class I, which was selected because it is the largest class without 12b-1 fees); (iii) the total costs of the services provided by and the profits realized by FMR and its affiliates (Fidelity) from its relationships with each fund; and (iv) the extent to which, if any, economies of scale exist and are realized as each fund grows, and whether any economies of scale are appropriately shared with fund shareholders. The Board also considered the broad range of investment choices available to shareholders from FMR's competitors and that each fund's shareholders have chosen to invest in the fund, which is part of the Fidelity family of funds. The Board's decision to renew the Advisory Contracts was not based on any single factor.
The Board reached a determination, with the assistance of fund counsel and Independent Trustees' counsel and through the exercise of its business judgment, that the renewal of the Advisory Contracts was in the best interests of each fund and its shareholders and that the compensation payable under the Advisory Contracts was fair and reasonable in light of all of the surrounding circumstances.
Nature, Extent, and Quality of Services Provided. The Board considered staffing as it relates to the funds, including the backgrounds and experience of investment personnel of the Investment Advisers, and also considered the Investment Advisers' implementation of the funds' investment programs. The Independent Trustees also had discussions with senior management of Fidelity's investment operations and investment groups. The Board considered the structure of the investment personnel compensation program and whether this structure provides appropriate incentives to act in the best interests of each fund. Additionally, the Board considered the portfolio managers' investments, if any, in the funds that they manage.
Resources Dedicated to Investment Management and Support Services. The Board and the Fund Oversight and Research Committees reviewed the general qualifications and capabilities of Fidelity's investment staff, including its size, education, experience, and resources, as well as Fidelity's approach to recruiting, training, managing, and compensating investment personnel. The Board noted the resources devoted to expansion of Fidelity's global investment organization, and that Fidelity's analysts have extensive resources, tools and capabilities that allow them to conduct sophisticated quantitative and fundamental analysis, as well as credit analysis of issuers, counterparties and guarantors. Further, the Board considered that Fidelity's investment professionals have sufficient access to global information and data so as to provide competitive investment results over time, and that those professionals also have access to sophisticated tools that permit them to assess portfolio construction and risk and performance attribution characteristics continuously, as well as to transmit new information and research conclusions rapidly around the world. Additionally, in its deliberations, the Board considered Fidelity's trading, risk management, compliance, and technology and operations capabilities and resources, which are integral parts of the investment management process.
Shareholder and Administrative Services. The Board considered (i) the nature, extent, quality, and cost of advisory, administrative, and shareholder services performed by the Investment Advisers and their affiliates under the Advisory Contracts and under separate agreements covering transfer agency, pricing and bookkeeping, and securities lending services for each fund; (ii) the nature and extent of Fidelity's supervision of third party service providers, principally custodians, subcustodians, and pricing vendors; and (iii) the resources devoted by Fidelity to, and the record of compliance with, each fund's compliance policies and procedures. The Board also reviewed the allocation of fund brokerage, including allocations to brokers affiliated with the Investment Advisers, the use of brokerage commissions to pay fund expenses, and the use of "soft" commission dollars to pay for research services. The Board also considered each fund's securities lending activities and any payments made to Fidelity relating to securities lending.
The Board noted that the growth of fund assets over time across the complex allows Fidelity to reinvest in the development of services designed to enhance the value and convenience of the Fidelity funds as investment vehicles. These services include 24-hour access to account information and market information over the Internet and through telephone representatives, investor education materials and asset allocation tools. The Board also considered that it reviews customer service metrics such as telephone response times, continuity of services on the website and metrics addressing services at Fidelity Investor Centers.
Investment in a Large Fund Family. The Board considered the benefits to shareholders of investing in a fund that is part of a large family of funds offering a variety of investment disciplines and providing a large variety of fund investor services. The Board noted that Fidelity had taken, or had made recommendations that resulted in the Fidelity funds taking, a number of actions over the previous year that benefited particular funds and/or the Fidelity funds in general.
Investment Performance. The Board took into account discussions that occur with representatives of the Investment Advisers, and reports that it receives, at Board meetings throughout the year, relating to fund investment performance. In this regard, the Board noted that as part of regularly scheduled fund reviews and other reports to the Board on fund performance, the Board considered annualized return information for the fund for different time periods, measured against an appropriate securities market index (benchmark index) and an appropriate peer group of funds with similar objectives (peer group). The Board also considered information about performance attribution. In its ongoing evaluation of fund investment performance, the Board gives particular attention to information indicating changes in performance of the funds over different time periods and discussed with the Investment Advisers the reasons for any overperformance or underperformance. Each of Fidelity Advisor Biotechnology Fund, Fidelity Advisor Consumer Discretionary Fund, Fidelity Advisor Health Care Fund, Fidelity Advisor Industrials Fund, and Fidelity Advisor Technology Fund, underperformed its benchmark and peers for the one- and three-year periods ended February 28, 2023, and as a result, the Board continues to engage in discussions with FMR about the steps it is taking to address the fund's performance.
In addition to reviewing absolute and relative fund performance, the Independent Trustees periodically consider the appropriateness of fund performance metrics in evaluating the results achieved. The Independent Trustees generally give greater weight to fund performance over longer time periods than over shorter time periods. Depending on the circumstances, the Independent Trustees may be satisfied with a fund's performance notwithstanding that it lags its benchmark index or peer group for certain periods.
Based on its review, the Board concluded that the nature, extent, and quality of services provided to each fund under the Advisory Contracts should continue to benefit the shareholders of each fund.
Competitiveness of Management Fee and Total Expense Ratio. The Board was provided with information regarding industry trends in management fees and expenses. In its review of each fund's management fee and the total expense ratio of Class I of each fund, the Board considered each fund's management fee rate as well as other fund or class expenses, as applicable, such as transfer agent fees, pricing and bookkeeping fees, fund-paid 12b-1 fees, and custodial, legal, and audit fees. The Board noted that Fidelity may agree to waive fees or reimburse expenses from time to time, and the extent to which, if any, it has done so for each fund.
Comparisons of Management Fees and Total Expense Ratios. Among other things, the Board reviewed data for selected groups of competitive funds and classes (referred to as "mapped groups") that were compiled by Fidelity based on combining similar investment objective categories (as classified by Lipper) that have comparable investment mandates. The data reviewed by the Board included (i) gross management fee comparisons (before taking into account expense reimbursements or caps) relative to the total universe of funds within the mapped group; (ii) gross management fee comparisons relative to a subset of non-Fidelity funds in the mapped group that are similar in size and management fee structure to each fund (referred to as the "asset size peer group"); (iii) total expense comparisons of Class I of each fund relative to funds and classes in the mapped group that have a similar sales load structure to the fund (referred to as the "similar sales load structure group"); and (iv) total expense comparisons of Class I of each fund relative to funds and classes in the similar load structure group that are similar in size and management fee structure to the fund (referred to as the "total expense asset size peer group"). The total expense asset size peer group comparison excludes performance adjustments and fund-paid 12b-1 fees to eliminate variability in fee structures.
The information provided to the Board indicated that each fund's management fee rate ranked below the competitive median of the mapped group for the 12-month period ended September 30, 2022 and below the competitive median of the asset size peer group for the 12-month period ended September 30, 2022. Further, the information provided to the Board indicated that the total expense ratio of Class I of each fund ranked below the competitive median of the similar sales load structure group for the 12-month period ended September 30, 2022 and below the competitive median of the total expense asset size peer group for the 12-month period ended September 30, 2022.
The Board also considered that, for funds subject to the group fee, FMR agreed to voluntarily waive fees over a specified period of time in amounts designed to account for assets converted from certain funds to certain collective investment trusts.
Based on its review, the Board concluded that each fund's management fee is fair and reasonable in light of the services that the fund receives and the other factors considered.
Fees Charged to Other Fidelity Clients. The Board also considered Fidelity fee structures and other information with respect to clients of Fidelity, such as other funds advised or subadvised by Fidelity, pension plan clients, and other institutional clients with similar mandates. The Board noted that a joint ad hoc committee created by it and the boards of other Fidelity funds periodically reviews and compares Fidelity's institutional investment advisory business with its business of providing services to the Fidelity funds and also noted the most recent findings of the committee. The Board noted that the committee's review included a consideration of the differences in services provided, fees charged, and costs incurred, as well as competition in the markets serving the different categories of clients.
Based on its review, the Board concluded that each fund's management fee is fair and reasonable in light of the services that the fund receives and the other factors considered. Further, based on its review of total expense ratios and fees charged to other Fidelity clients, the Board concluded that the total expense ratio of each class of each fund was reasonable in light of the services that the fund and its shareholders receive and the other factors considered.
Costs of the Services and Profitability. The Board considered the revenues earned and the expenses incurred by Fidelity in conducting the business of developing, marketing, distributing, managing, administering and servicing each fund and servicing each fund's shareholders. The Board also considered the level of Fidelity's profits in respect of all the Fidelity funds.
On an annual basis, Fidelity presents to the Board information about the profitability of its relationships with each fund. Fidelity calculates profitability information for each fund, as well as aggregate profitability information for groups of Fidelity funds and all Fidelity funds, using a series of detailed revenue and cost allocation methodologies which originate with the books and records of Fidelity on which Fidelity's audited financial statements are based. The Audit Committee of the Board reviews any significant changes from the prior year's methodologies and the full Board approves such changes.
A public accounting firm has been engaged annually by the Board as part of the Board's assessment of Fidelity's profitability analysis. The engagement includes the review and assessment of the methodologies used by Fidelity in determining the revenues and expenses attributable to Fidelity's fund business, and completion of agreed-upon procedures in respect of the mathematical accuracy of certain fund profitability information and its conformity to established allocation methodologies. After considering the reports issued under the engagement and information provided by Fidelity, the Board concluded that while other allocation methods may also be reasonable, Fidelity's profitability methodologies are reasonable in all material respects.
The Board also reviewed Fidelity's non-fund businesses and potential indirect benefits such businesses may have received as a result of their association with Fidelity's fund business (i.e., fall-out benefits) as well as cases where Fidelity's affiliates may benefit from the funds' business. The Board considered areas where potential indirect benefits to the Fidelity funds from their relationships with Fidelity may exist. The Board's consideration of these matters was informed by the findings of a joint ad hoc committee created by it and the boards of other Fidelity funds to evaluate potential fall-out benefits.
The Board considered the costs of the services provided by and the profits realized by Fidelity in connection with the operation of each fund and was satisfied that the profitability was not excessive.
Economies of Scale. The Board considered whether there have been economies of scale in respect of the management of the Fidelity funds, whether the Fidelity funds (including each fund) have appropriately benefited from any such economies of scale, and whether there is potential for realization of any further economies of scale. The Board considered the extent to which each fund will benefit from economies of scale as assets grow through increased services to the fund, through waivers or reimbursements, or through fee or expense ratio reductions. The Board also noted that a committee (the Economies of Scale Committee) created by it and the boards of other Fidelity funds periodically analyzes whether Fidelity attains economies of scale in respect of the management and servicing of the Fidelity funds, whether the Fidelity funds have appropriately benefited from such economies of scale, and whether there is potential for realization of any further economies of scale.
The Board recognized that each fund's management contract incorporates a "group fee" structure, which provides for lower group fee rates as total "group assets" increase, and for higher group fee rates as total "group assets" decrease ("group assets" as defined in the management contracts). FMR calculates the group fee rates based on a tiered asset "breakpoint" schedule that varies based on asset class. The Board considered that the group fee is designed to deliver the benefits of economies of scale to fund shareholders when total Fidelity fund assets increase, even if assets of any particular fund are unchanged or have declined, because some portion of Fidelity's costs are attributable to services provided to all Fidelity funds, and all funds benefit if those costs can be allocated among more assets. The Board further considered that Fidelity agreed to impose a temporary fee waiver in the form of additional breakpoints to the current breakpoint schedule. The Board concluded that, given the group fee structure, fund shareholders will benefit from lower management fees as "group assets" increase at the fund complex level, regardless of whether Fidelity achieves any such economies of scale.
The Board concluded, taking into account the analysis of the Economies of Scale Committee, that economies of scale, if any, are being appropriately shared between fund shareholders and Fidelity.
Additional Information Requested by the Board. In order to develop fully the factual basis for consideration of the Fidelity funds' advisory contracts, the Board requested and received additional information on certain topics, including: (i) fund flow and performance trends, in particular the underperformance of certain funds and strategies, and Fidelity's long-term strategies for certain funds, including any consideration of fund liquidations or mergers; (ii) the operation of performance fees and competitor use of performance fees; (iii) Fidelity's pricing philosophy compared to competitors; (iv) fund profitability methodology and data; (v) evaluation of competitive fund data and peer group classifications and fee and expense comparisons; (vi) the management fee and expense structures for different funds and classes and information about the differences between various fee and expense structures; (vii) group fee breakpoints and related voluntary fee waivers; and (viii) information regarding other accounts managed by Fidelity and the funds' sub-advisory arrangements.
Conclusion. Based on its evaluation of all of the conclusions noted above, and after considering all factors it believed relevant, the Board, including the Independent Trustees, concluded that the advisory and sub-advisory fee arrangements are fair and reasonable in light of all of the surrounding circumstances and that each fund's Advisory Contracts should be renewed through July 31, 2024.
1.762411.122
AFOC-ANN-0923
Fidelity Advisor® Real Estate Fund
Annual Report
July 31, 2023
Contents
To view a fund's proxy voting guidelines and proxy voting record for the 12-month period ended June 30, visit http://www.fidelity.com/proxyvotingresults or visit the Securities and Exchange Commission's (SEC) web site at http://www.sec.gov.
You may also call 1-877-208-0098 to request a free copy of the proxy voting guidelines.
Standard & Poor's, S&P and S&P 500 are registered service marks of The McGraw-Hill Companies, Inc. and have been licensed for use by Fidelity Distributors Corporation.
Other third-party marks appearing herein are the property of their respective owners.
All other marks appearing herein are registered or unregistered trademarks or service marks of FMR LLC or an affiliated company. © 2023 FMR LLC. All rights reserved.
This report and the financial statements contained herein are submitted for the general information of the shareholders of the Fund. This report is not authorized for distribution to prospective investors in the Fund unless preceded or accompanied by an effective prospectus.
A fund files its complete schedule of portfolio holdings with the SEC for the first and third quarters of each fiscal year on Form N-PORT. Forms N-PORT are available on the SEC's web site at http://www.sec.gov. A fund's Forms N-PORT may be reviewed and copied at the SEC's Public Reference Room in Washington, DC. Information regarding the operation of the SEC's Public Reference Room may be obtained by calling 1-800-SEC-0330.
For a complete list of a fund's portfolio holdings, view the most recent holdings listing, semiannual report, or annual report on Fidelity's web site at http://www.fidelity.com, http://www.institutional.fidelity.com, or http://www.401k.com, as applicable.
NOT FDIC INSURED •MAY LOSE VALUE •NO BANK GUARANTEE
Neither the Fund nor Fidelity Distributors Corporation is a bank.
Average annual total return reflects the change in the value of an investment, assuming reinvestment of distributions from dividend income and capital gains (the profits earned upon the sale of securities that have grown in value, if any) and assuming a constant rate of performance each year. The hypothetical investment and the average annual total returns do not reflect the deduction of taxes that a shareholder would pay on fund distributions or the redemption of fund shares. During periods of reimbursement by Fidelity, a fund's total return will be greater than it would be had the reimbursement not occurred. How a fund did yesterday is no guarantee of how it will do tomorrow.
| Average Annual Total Returns |
| | | | |
Periods ended July 31, 2023 | Past 1 year | Past 5 years | Past 10 years |
Class A (incl.5.75% sales charge) | -16.78% | 0.81% | 3.93% |
Class M (incl.3.50% sales charge) | -14.95% | 1.08% | 3.94% |
Class C (incl. contingent deferred sales charge) | -13.11% | 1.22% | 3.89% |
| Class I | -11.43% | 2.27% | 4.81% |
| Class Z | -11.30% | 2.47% | 4.91% |
Class C shares' contingent deferred sales charges included in the past one year, past five years and past ten years total return figures are 1%, 0% and 0%, respectively.
The initial offering of Class Z shares took place on October 2, 2018. Returns prior to October 2, 2018, are those of Class I.
| $10,000 Over 10 Years |
| |
Let's say hypothetically that $10,000 was invested in Fidelity Advisor® Real Estate Fund - Class A, a class of the fund, on July 31, 2013, and the current 5.75% sales charge was paid. The chart shows how the value of your investment would have changed, and also shows how the S&P 500® Index performed over the same period. |
|
|
Market Recap:
U.S. equities gained 13.02% for the 12 months ending July 31, 2023, according to the S&P 500® index, as continued global economic expansion, falling commodity prices and a slowing in the pace of inflation provided a favorable backdrop for higher-risk assets. Large-cap stocks spearheaded the rally, which was driven by the shares of a narrow set of mega-cap companies in the information technology and communication services sectors, largely due to exuberance related to generative artificial intelligence. Aggressive monetary tightening by the U.S. Federal Reserve continued amid consistent pressure on core inflation, a measure that excludes food and energy. Since March 2022, the Fed has hiked its benchmark interest rate 11 times. The latest bump came in late July, a fourth consecutive raise of a stepped down 25 basis points. The S&P 500® gained 3.21% in July, as a "soft landing" of the U.S. economy became the consensus view amid better-than-expected earnings, slowing inflation and easing financial conditions, bringing the index's year-to-date gain to 20.65%. July saw a continuance of the recent shift to wider market breadth and lower dispersion. For the full 12 months, value (+17%) handily topped growth (+8%) within the index. By sector, tech (+28%), communication services (+21%) and industrials (+17%) led, whereas real estate (-10%) lagged most, due to high borrowing costs, low home inventory and a deteriorating commercial property market.
Comments from Portfolio Manager Samuel Wald:
For the fiscal year ending July 31, 2023, the fund's share classes (excluding sales charges, if applicable) returned about -12% to -11%, versus -9.65% for the MSCI US IMI Real Estate 25/50 Linked Index and 13.02% for the broad-based S&P 500® index. The primary detractor from performance versus the sector index was non-index security selection in the internet services & infrastructure industry. Stock selection and an overweight among real estate operating companies also hampered the portfolio's relative result. Further detracting was an underweight in retail REITs. The fund's non-index stake in Cyxtera Technologies returned roughly -99% and was the largest individual relative detractor. Outsized exposure to Crown Castle (-37%), which was among the fund's largest holdings, also hurt. Not owning Simon Property Group, an index component that gained approximately 22%, was another notable relative detractor. In contrast, the biggest contributor to performance versus the sector index was favorable picks among self-storage REITs. Investment choices and an overweight in data center REITs also boosted the fund's relative performance. An underweight in office REITs proved beneficial as well. The top individual relative contributor was an overweight in Equinix (+17%), one of our biggest holdings. The decision to avoid SBA Communications, an index component that returned -34%, was another plus. An overweight in CubeSmart (-1%) also helped. The stock was among the fund's largest holdings. Notable changes in positioning include higher allocations to data center REITs and industrial REITs.
The views expressed above reflect those of the portfolio manager(s) only through the end of the period as stated on the cover of this report and do not necessarily represent the views of Fidelity or any other person in the Fidelity organization. Any such views are subject to change at any time based upon market or other conditions and Fidelity disclaims any responsibility to update such views. These views may not be relied on as investment advice and, because investment decisions for a Fidelity fund are based on numerous factors, may not be relied on as an indication of trading intent on behalf of any Fidelity fund.
Top Holdings (% of Fund's net assets) |
| |
| Prologis (REIT), Inc. | 11.0 | |
| Equinix, Inc. | 8.1 | |
| Crown Castle International Corp. | 7.5 | |
| CubeSmart | 6.0 | |
| American Tower Corp. | 5.7 | |
| Ventas, Inc. | 5.5 | |
| CBRE Group, Inc. | 4.7 | |
| Mid-America Apartment Communities, Inc. | 4.4 | |
| Essex Property Trust, Inc. | 4.0 | |
| Digital Realty Trust, Inc. | 3.7 | |
| | 60.6 | |
| |
| Top REIT Sectors (% of Fund's net assets) |
| |
| REITs - Diversified | 24.1 | |
| REITs - Warehouse/Industrial | 14.6 | |
| REITs - Apartments | 13.5 | |
| REITs - Health Care | 8.9 | |
| REITs - Storage | 7.6 | |
| |
Asset Allocation (% of Fund's net assets) |
|
|
Showing Percentage of Net Assets
| Common Stocks - 98.9% |
| | | Shares | Value ($) |
| Commercial Services & Supplies - 0.7% | | | |
| REITs - Diversified - 0.7% | | | |
| The GEO Group, Inc. (a) | | 240,181 | 1,794,152 |
| Equity Real Estate Investment Trusts (REITs) - 91.8% | | | |
| REITs - Apartments - 13.5% | | | |
| Essex Property Trust, Inc. | | 43,147 | 10,508,452 |
| Invitation Homes, Inc. | | 224,700 | 7,976,850 |
| Mid-America Apartment Communities, Inc. | | 75,600 | 11,314,296 |
| UDR, Inc. | | 127,600 | 5,216,288 |
| | | | 35,015,886 |
| REITs - Diversified - 23.4% | | | |
| Crown Castle International Corp. | | 178,200 | 19,297,278 |
| Digital Realty Trust, Inc. | | 75,800 | 9,446,196 |
| Equinix, Inc. | | 26,000 | 21,057,920 |
| Lamar Advertising Co. Class A | | 57,100 | 5,635,770 |
| Outfront Media, Inc. | | 135,100 | 2,088,646 |
| VICI Properties, Inc. | | 93,100 | 2,930,788 |
| | | | 60,456,598 |
| REITs - Health Care - 8.9% | | | |
| Ventas, Inc. | | 292,405 | 14,187,491 |
| Welltower, Inc. | | 107,200 | 8,806,480 |
| | | | 22,993,971 |
| REITs - Hotels - 3.1% | | | |
| Ryman Hospitality Properties, Inc. | | 83,100 | 7,918,599 |
| REITs - Management/Investment - 5.7% | | | |
| American Tower Corp. | | 78,000 | 14,844,180 |
| REITs - Manufactured Homes - 3.1% | | | |
| Equity Lifestyle Properties, Inc. | | 112,306 | 7,993,941 |
| REITs - Office Property - 2.3% | | | |
| Alexandria Real Estate Equities, Inc. | | 48,400 | 6,082,912 |
| REITs - Regional Malls - 0.4% | | | |
| Tanger Factory Outlet Centers, Inc. | | 48,500 | 1,135,385 |
| REITs - Shopping Centers - 4.5% | | | |
| SITE Centers Corp. | | 429,100 | 6,028,855 |
| Urban Edge Properties | | 323,000 | 5,494,230 |
| | | | 11,523,085 |
| REITs - Single Tenant - 4.7% | | | |
| Four Corners Property Trust, Inc. | | 306,500 | 8,060,950 |
| Spirit Realty Capital, Inc. | | 104,300 | 4,206,419 |
| | | | 12,267,369 |
| REITs - Storage - 7.6% | | | |
| CubeSmart | | 356,200 | 15,444,832 |
| Extra Space Storage, Inc. | | 29,900 | 4,173,143 |
| | | | 19,617,975 |
| REITs - Warehouse/Industrial - 14.6% | | | |
| Americold Realty Trust | | 42,600 | 1,381,092 |
| EastGroup Properties, Inc. | | 23,300 | 4,128,294 |
| Prologis (REIT), Inc. | | 228,316 | 28,482,421 |
| Terreno Realty Corp. | | 61,500 | 3,649,410 |
| | | | 37,641,217 |
TOTAL EQUITY REAL ESTATE INVESTMENT TRUSTS (REITS) | | | 237,491,118 |
| Real Estate Management & Development - 6.4% | | | |
| Real Estate Operating Companies - 0.0% | | | |
| WeWork, Inc. (a)(b) | | 719,800 | 155,837 |
| Real Estate Services - 6.4% | | | |
| CBRE Group, Inc. (a) | | 146,300 | 12,188,253 |
| Jones Lang LaSalle, Inc. (a) | | 5,600 | 932,680 |
| Zillow Group, Inc. Class C (a) | | 61,700 | 3,341,672 |
| | | | 16,462,605 |
TOTAL REAL ESTATE MANAGEMENT & DEVELOPMENT | | | 16,618,442 |
| TOTAL COMMON STOCKS (Cost $209,350,276) | | | 255,903,712 |
| | | | |
| Money Market Funds - 1.4% |
| | | Shares | Value ($) |
| Fidelity Cash Central Fund 5.32% (c) | | 3,118,757 | 3,119,380 |
| Fidelity Securities Lending Cash Central Fund 5.32% (c)(d) | | 478,152 | 478,200 |
| TOTAL MONEY MARKET FUNDS (Cost $3,597,580) | | | 3,597,580 |
| | | | |
| TOTAL INVESTMENT IN SECURITIES - 100.3% (Cost $212,947,856) | 259,501,292 |
NET OTHER ASSETS (LIABILITIES) - (0.3)% | (883,368) |
| NET ASSETS - 100.0% | 258,617,924 |
| | |
Legend
| (b) | Security or a portion of the security is on loan at period end. |
| (c) | Affiliated fund that is generally available only to investment companies and other accounts managed by Fidelity Investments. The rate quoted is the annualized seven-day yield of the fund at period end. A complete unaudited listing of the fund's holdings as of its most recent quarter end is available upon request. In addition, each Fidelity Central Fund's financial statements, which are not covered by the Fund's Report of Independent Registered Public Accounting Firm, are available on the SEC's website or upon request. |
| (d) | Investment made with cash collateral received from securities on loan. |
Affiliated Central Funds
Fiscal year to date information regarding the Fund's investments in Fidelity Central Funds, including the ownership percentage, is presented below.
| Affiliate | Value, beginning of period ($) | Purchases ($) | Sales Proceeds ($) | Dividend Income ($) | Realized Gain (loss) ($) | Change in Unrealized appreciation (depreciation) ($) | Value, end of period ($) | % ownership, end of period |
| Fidelity Cash Central Fund 5.32% | 1,565,719 | 63,280,708 | 61,727,047 | 97,877 | - | - | 3,119,380 | 0.0% |
| Fidelity Securities Lending Cash Central Fund 5.32% | 5,187,000 | 16,458,813 | 21,167,613 | 74,289 | - | - | 478,200 | 0.0% |
| Total | 6,752,719 | 79,739,521 | 82,894,660 | 172,166 | - | - | 3,597,580 | |
| | | | | | | | | |
Amounts in the dividend income column in the above table include any capital gain distributions from underlying funds, which are presented in the corresponding line item in the Statement of Operations, if applicable.
Amounts in the dividend income column for Fidelity Securities Lending Cash Central Fund represents the income earned on investing cash collateral, less rebates paid to borrowers and any lending agent fees associated with the loan, plus any premium payments received for lending certain types of securities.
Amounts included in the purchases and sales proceeds columns may include in-kind transactions, if applicable.
Investment Valuation
The following is a summary of the inputs used, as of July 31, 2023, involving the Fund's assets and liabilities carried at fair value. The inputs or methodology used for valuing securities may not be an indication of the risk associated with investing in those securities. For more information on valuation inputs, and their aggregation into the levels used below, please refer to the Investment Valuation section in the accompanying Notes to Financial Statements.
| Valuation Inputs at Reporting Date: |
| Description | Total ($) | Level 1 ($) | Level 2 ($) | Level 3 ($) |
Investments in Securities: | | | | |
|
| Common Stocks | 255,903,712 | 255,903,712 | - | - |
|
| Money Market Funds | 3,597,580 | 3,597,580 | - | - |
| Total Investments in Securities: | 259,501,292 | 259,501,292 | - | - |
| Statement of Assets and Liabilities |
| | | | July 31, 2023 |
| | | | | |
| Assets | | | | |
| Investment in securities, at value (including securities loaned of $103,530) - See accompanying schedule: | | | | |
Unaffiliated issuers (cost $209,350,276) | $ | 255,903,712 | | |
Fidelity Central Funds (cost $3,597,580) | | 3,597,580 | | |
| | | | | |
| | | | | |
| Total Investment in Securities (cost $212,947,856) | | | $ | 259,501,292 |
| Receivable for investments sold | | | | 619,237 |
| Receivable for fund shares sold | | | | 540,138 |
| Dividends receivable | | | | 11,074 |
| Distributions receivable from Fidelity Central Funds | | | | 14,189 |
| Prepaid expenses | | | | 1,780 |
| Other receivables | | | | 89,716 |
Total assets | | | | 260,777,426 |
| Liabilities | | | | |
| Payable for investments purchased | $ | 796,517 | | |
| Payable for fund shares redeemed | | 522,782 | | |
| Accrued management fee | | 113,677 | | |
| Distribution and service plan fees payable | | 60,314 | | |
| Other affiliated payables | | 53,263 | | |
| Other payables and accrued expenses | | 134,749 | | |
| Collateral on securities loaned | | 478,200 | | |
| Total Liabilities | | | | 2,159,502 |
| Net Assets | | | $ | 258,617,924 |
| Net Assets consist of: | | | | |
| Paid in capital | | | $ | 219,394,993 |
| Total accumulated earnings (loss) | | | | 39,222,931 |
| Net Assets | | | $ | 258,617,924 |
| | | | | |
| Net Asset Value and Maximum Offering Price | | | | |
| Class A : | | | | |
Net Asset Value and redemption price per share ($91,784,374 ÷ 5,650,604 shares)(a) | | | $ | 16.24 |
| Maximum offering price per share (100/94.25 of $16.24) | | | $ | 17.23 |
| Class M : | | | | |
Net Asset Value and redemption price per share ($84,125,607 ÷ 5,206,540 shares)(a) | | | $ | 16.16 |
| Maximum offering price per share (100/96.50 of $16.16) | | | $ | 16.75 |
| Class C : | | | | |
Net Asset Value and offering price per share ($6,936,535 ÷ 450,955 shares)(a) | | | $ | 15.38 |
| Class I : | | | | |
Net Asset Value, offering price and redemption price per share ($69,081,368 ÷ 4,177,755 shares) | | | $ | 16.54 |
| Class Z : | | | | |
Net Asset Value, offering price and redemption price per share ($6,690,040 ÷ 404,901 shares) | | | $ | 16.52 |
(a)Redemption price per share is equal to net asset value less any applicable contingent deferred sales charge. |
| Statement of Operations |
| | | | Year ended July 31, 2023 |
| Investment Income | | | | |
| Dividends | | | $ | 8,927,406 |
| Income from Fidelity Central Funds (including $74,289 from security lending) | | | | 172,166 |
| Total Income | | | | 9,099,572 |
| Expenses | | | | |
| Management fee | $ | 1,560,899 | | |
| Transfer agent fees | | 658,464 | | |
| Distribution and service plan fees | | 758,360 | | |
| Accounting fees | | 105,033 | | |
| Custodian fees and expenses | | 11,451 | | |
| Independent trustees' fees and expenses | | 1,680 | | |
| Registration fees | | 85,091 | | |
| Audit | | 52,856 | | |
| Legal | | 862 | | |
| Miscellaneous | | 2,600 | | |
| Total expenses before reductions | | 3,237,296 | | |
| Expense reductions | | (16,336) | | |
| Total expenses after reductions | | | | 3,220,960 |
| Net Investment income (loss) | | | | 5,878,612 |
| Realized and Unrealized Gain (Loss) | | | | |
| Net realized gain (loss) on: | | | | |
| Investment Securities: | | | | |
| Unaffiliated issuers | | (4,606,425) | | |
| Total net realized gain (loss) | | | | (4,606,425) |
| Change in net unrealized appreciation (depreciation) on investment securities | | | | (51,993,325) |
| Net gain (loss) | | | | (56,599,750) |
| Net increase (decrease) in net assets resulting from operations | | | $ | (50,721,138) |
| Statement of Changes in Net Assets |
| |
| | Year ended July 31, 2023 | | Year ended July 31, 2022 |
| Increase (Decrease) in Net Assets | | | | |
| Operations | | | | |
| Net investment income (loss) | $ | 5,878,612 | $ | 4,457,219 |
| Net realized gain (loss) | | (4,606,425) | | 46,296,510 |
| Change in net unrealized appreciation (depreciation) | | (51,993,325) | | (77,776,668) |
| Net increase (decrease) in net assets resulting from operations | | (50,721,138) | | (27,022,939) |
| Distributions to shareholders | | (43,497,468) | | (28,289,351) |
| | | | | |
| Share transactions - net increase (decrease) | | (57,482,753) | | (21,794,093) |
| Total increase (decrease) in net assets | | (151,701,359) | | (77,106,383) |
| | | | | |
| Net Assets | | | | |
| Beginning of period | | 410,319,283 | | 487,425,666 |
| End of period | $ | 258,617,924 | $ | 410,319,283 |
| | | | | |
| | | | | |
| Fidelity Advisor® Real Estate Fund Class A |
| |
| Years ended July 31, | | 2023 | | 2022 | | 2021 | | 2020 | | 2019 |
Selected Per-Share Data | | | | | | | | | | |
| Net asset value, beginning of period | $ | 21.95 | $ | 24.66 | $ | 19.62 | $ | 22.91 | $ | 22.07 |
| Income from Investment Operations | | | | | | | | | | |
Net investment income (loss) A,B | | .34 | | .22 | | .26 | | .41 | | .37 |
| Net realized and unrealized gain (loss) | | (3.09) | | (1.47) | | 5.50 | | (1.91) | | 1.63 |
| Total from investment operations | | (2.75) | | (1.25) | | 5.76 | | (1.50) | | 2.00 |
| Distributions from net investment income | | (.26) | | (.17) | | (.24) | | (.38) | | (.43) |
| Distributions from net realized gain | | (2.69) | | (1.30) | | (.48) | | (1.41) | | (.73) |
| Total distributions | | (2.96) C | | (1.46) C | | (.72) | | (1.79) | | (1.16) |
| Net asset value, end of period | $ | 16.24 | $ | 21.95 | $ | 24.66 | $ | 19.62 | $ | 22.91 |
Total Return D,E | | (11.70)% | | (5.65)% | | 30.38% | | (7.21)% | | 9.62% |
Ratios to Average Net Assets B,F,G | | | | | | | | | | |
| Expenses before reductions | | 1.11% | | 1.07% | | 1.09% | | 1.10% | | 1.10% |
| Expenses net of fee waivers, if any | | 1.10% | | 1.07% | | 1.09% | | 1.10% | | 1.09% |
| Expenses net of all reductions | | 1.10% | | 1.07% | | 1.08% | | 1.09% | | 1.09% |
| Net investment income (loss) | | 1.96% | | .95% | | 1.24% | | 1.93% | | 1.68% |
| Supplemental Data | | | | | | | | | | |
| Net assets, end of period (000 omitted) | $ | 91,784 | $ | 122,949 | $ | 138,134 | $ | 115,736 | $ | 151,536 |
Portfolio turnover rate H | | 31% | | 48% | | 53% | | 56% | | 49% |
ACalculated based on average shares outstanding during the period.
BNet investment income (loss) is affected by the timing of the declaration of dividends by any underlying mutual funds or exchange-traded funds (ETFs). Net investment income (loss) of any mutual funds or ETFs is not included in the Fund's net investment income (loss) ratio.
CTotal distributions per share do not sum due to rounding.
DTotal returns would have been lower if certain expenses had not been reduced during the applicable periods shown.
ETotal returns do not include the effect of the sales charges.
FFees and expenses of any underlying mutual funds or exchange-traded funds (ETFs) are not included in the Fund's expense ratio. The Fund indirectly bears its proportionate share of these expenses. For additional expense information related to investments in Fidelity Central Funds, please refer to the "Investments in Fidelity Central Funds" note found in the Notes to Financial Statements section of the most recent Annual or Semi-Annual report.
GExpense ratios reflect operating expenses of the class. Expenses before reductions do not reflect amounts reimbursed, waived, or reduced through arrangements with the investment adviser, brokerage services, or other offset arrangements, if applicable, and do not represent the amount paid by the class during periods when reimbursements, waivers or reductions occur.
HAmount does not include the portfolio activity of any underlying mutual funds or exchange-traded funds (ETFs).
| Fidelity Advisor® Real Estate Fund Class M |
| |
| Years ended July 31, | | 2023 | | 2022 | | 2021 | | 2020 | | 2019 |
Selected Per-Share Data | | | | | | | | | | |
| Net asset value, beginning of period | $ | 21.87 | $ | 24.59 | $ | 19.58 | $ | 22.87 | $ | 22.05 |
| Income from Investment Operations | | | | | | | | | | |
Net investment income (loss) A,B | | .30 | | .17 | | .21 | | .36 | | .32 |
| Net realized and unrealized gain (loss) | | (3.08) | | (1.46) | | 5.49 | | (1.90) | | 1.62 |
| Total from investment operations | | (2.78) | | (1.29) | | 5.70 | | (1.54) | | 1.94 |
| Distributions from net investment income | | (.24) | | (.13) | | (.22) | | (.34) | | (.39) |
| Distributions from net realized gain | | (2.69) | | (1.30) | | (.48) | | (1.41) | | (.73) |
| Total distributions | | (2.93) | | (1.43) | | (.69) C | | (1.75) | | (1.12) |
| Net asset value, end of period | $ | 16.16 | $ | 21.87 | $ | 24.59 | $ | 19.58 | $ | 22.87 |
Total Return D,E | | (11.87)% | | (5.83)% | | 30.14% | | (7.42)% | | 9.35% |
Ratios to Average Net Assets B,F,G | | | | | | | | | | |
| Expenses before reductions | | 1.31% | | 1.29% | | 1.31% | | 1.31% | | 1.32% |
| Expenses net of fee waivers, if any | | 1.31% | | 1.28% | | 1.31% | | 1.31% | | 1.31% |
| Expenses net of all reductions | | 1.31% | | 1.28% | | 1.30% | | 1.30% | | 1.31% |
| Net investment income (loss) | | 1.75% | | .73% | | 1.03% | | 1.71% | | 1.46% |
| Supplemental Data | | | | | | | | | | |
| Net assets, end of period (000 omitted) | $ | 84,126 | $ | 100,892 | $ | 118,778 | $ | 98,724 | $ | 128,754 |
Portfolio turnover rate H | | 31% | | 48% | | 53% | | 56% | | 49% |
ACalculated based on average shares outstanding during the period.
BNet investment income (loss) is affected by the timing of the declaration of dividends by any underlying mutual funds or exchange-traded funds (ETFs). Net investment income (loss) of any mutual funds or ETFs is not included in the Fund's net investment income (loss) ratio.
CTotal distributions per share do not sum due to rounding.
DTotal returns would have been lower if certain expenses had not been reduced during the applicable periods shown.
ETotal returns do not include the effect of the sales charges.
FFees and expenses of any underlying mutual funds or exchange-traded funds (ETFs) are not included in the Fund's expense ratio. The Fund indirectly bears its proportionate share of these expenses. For additional expense information related to investments in Fidelity Central Funds, please refer to the "Investments in Fidelity Central Funds" note found in the Notes to Financial Statements section of the most recent Annual or Semi-Annual report.
GExpense ratios reflect operating expenses of the class. Expenses before reductions do not reflect amounts reimbursed, waived, or reduced through arrangements with the investment adviser, brokerage services, or other offset arrangements, if applicable, and do not represent the amount paid by the class during periods when reimbursements, waivers or reductions occur.
HAmount does not include the portfolio activity of any underlying mutual funds or exchange-traded funds (ETFs).
| Fidelity Advisor® Real Estate Fund Class C |
| |
| Years ended July 31, | | 2023 | | 2022 | | 2021 | | 2020 | | 2019 |
Selected Per-Share Data | | | | | | | | | | |
| Net asset value, beginning of period | $ | 21.00 | $ | 23.74 | $ | 18.97 | $ | 22.26 | $ | 21.54 |
| Income from Investment Operations | | | | | | | | | | |
Net investment income (loss) A,B | | .20 | | .03 | | .09 | | .23 | | .19 |
| Net realized and unrealized gain (loss) | | (2.97) | | (1.39) | | 5.30 | | (1.85) | | 1.58 |
| Total from investment operations | | (2.77) | | (1.36) | | 5.39 | | (1.62) | | 1.77 |
| Distributions from net investment income | | (.16) | | (.08) | | (.15) | | (.26) | | (.32) |
| Distributions from net realized gain | | (2.69) | | (1.30) | | (.48) | | (1.41) | | (.73) |
| Total distributions | | (2.85) | | (1.38) | | (.62) C | | (1.67) | | (1.05) |
| Net asset value, end of period | $ | 15.38 | $ | 21.00 | $ | 23.74 | $ | 18.97 | $ | 22.26 |
Total Return D,E | | (12.38)% | | (6.35)% | | 29.36% | | (7.95)% | | 8.72% |
Ratios to Average Net Assets B,F,G | | | | | | | | | | |
| Expenses before reductions | | 1.87% | | 1.86% | | 1.88% | | 1.89% | | 1.88% |
| Expenses net of fee waivers, if any | | 1.86% | | 1.86% | | 1.88% | | 1.89% | | 1.88% |
| Expenses net of all reductions | | 1.86% | | 1.86% | | 1.87% | | 1.88% | | 1.88% |
| Net investment income (loss) | | 1.20% | | .15% | | .46% | | 1.14% | | .89% |
| Supplemental Data | | | | | | | | | | |
| Net assets, end of period (000 omitted) | $ | 6,937 | $ | 12,375 | $ | 16,069 | $ | 20,774 | $ | 28,982 |
Portfolio turnover rate H | | 31% | | 48% | | 53% | | 56% | | 49% |
ACalculated based on average shares outstanding during the period.
BNet investment income (loss) is affected by the timing of the declaration of dividends by any underlying mutual funds or exchange-traded funds (ETFs). Net investment income (loss) of any mutual funds or ETFs is not included in the Fund's net investment income (loss) ratio.
CTotal distributions per share do not sum due to rounding.
DTotal returns would have been lower if certain expenses had not been reduced during the applicable periods shown.
ETotal returns do not include the effect of the contingent deferred sales charge.
FFees and expenses of any underlying mutual funds or exchange-traded funds (ETFs) are not included in the Fund's expense ratio. The Fund indirectly bears its proportionate share of these expenses. For additional expense information related to investments in Fidelity Central Funds, please refer to the "Investments in Fidelity Central Funds" note found in the Notes to Financial Statements section of the most recent Annual or Semi-Annual report.
GExpense ratios reflect operating expenses of the class. Expenses before reductions do not reflect amounts reimbursed, waived, or reduced through arrangements with the investment adviser, brokerage services, or other offset arrangements, if applicable, and do not represent the amount paid by the class during periods when reimbursements, waivers or reductions occur.
HAmount does not include the portfolio activity of any underlying mutual funds or exchange-traded funds (ETFs).
| Fidelity Advisor® Real Estate Fund Class I |
| |
| Years ended July 31, | | 2023 | | 2022 | | 2021 | | 2020 | | 2019 |
Selected Per-Share Data | | | | | | | | | | |
| Net asset value, beginning of period | $ | 22.26 | $ | 24.96 | $ | 19.84 | $ | 23.15 | $ | 22.28 |
| Income from Investment Operations | | | | | | | | | | |
Net investment income (loss) A,B | | .40 | | .27 | | .31 | | .46 | | .43 |
| Net realized and unrealized gain (loss) | | (3.14) | | (1.48) | | 5.56 | | (1.92) | | 1.65 |
| Total from investment operations | | (2.74) | | (1.21) | | 5.87 | | (1.46) | | 2.08 |
| Distributions from net investment income | | (.29) | | (.19) | | (.27) | | (.44) | | (.48) |
| Distributions from net realized gain | | (2.69) | | (1.30) | | (.48) | | (1.41) | | (.73) |
| Total distributions | | (2.98) | | (1.49) | | (.75) | | (1.85) | | (1.21) |
| Net asset value, end of period | $ | 16.54 | $ | 22.26 | $ | 24.96 | $ | 19.84 | $ | 23.15 |
Total Return C | | (11.43)% | | (5.43)% | | 30.65% | | (6.99)% | | 9.93% |
Ratios to Average Net Assets B,D,E | | | | | | | | | | |
| Expenses before reductions | | .84% | | .86% | | .88% | | .86% | | .81% |
| Expenses net of fee waivers, if any | | .83% | | .86% | | .87% | | .86% | | .81% |
| Expenses net of all reductions | | .83% | | .86% | | .87% | | .85% | | .81% |
| Net investment income (loss) | | 2.23% | | 1.15% | | 1.46% | | 2.17% | | 1.96% |
| Supplemental Data | | | | | | | | | | |
| Net assets, end of period (000 omitted) | $ | 69,081 | $ | 160,565 | $ | 197,873 | $ | 180,346 | $ | 225,407 |
Portfolio turnover rate F | | 31% | | 48% | | 53% | | 56% | | 49% |
ACalculated based on average shares outstanding during the period.
BNet investment income (loss) is affected by the timing of the declaration of dividends by any underlying mutual funds or exchange-traded funds (ETFs). Net investment income (loss) of any mutual funds or ETFs is not included in the Fund's net investment income (loss) ratio.
CTotal returns would have been lower if certain expenses had not been reduced during the applicable periods shown.
DFees and expenses of any underlying mutual funds or exchange-traded funds (ETFs) are not included in the Fund's expense ratio. The Fund indirectly bears its proportionate share of these expenses. For additional expense information related to investments in Fidelity Central Funds, please refer to the "Investments in Fidelity Central Funds" note found in the Notes to Financial Statements section of the most recent Annual or Semi-Annual report.
EExpense ratios reflect operating expenses of the class. Expenses before reductions do not reflect amounts reimbursed, waived, or reduced through arrangements with the investment adviser, brokerage services, or other offset arrangements, if applicable, and do not represent the amount paid by the class during periods when reimbursements, waivers or reductions occur.
FAmount does not include the portfolio activity of any underlying mutual funds or exchange-traded funds (ETFs).
| Fidelity Advisor® Real Estate Fund Class Z |
| |
| Years ended July 31, | | 2023 | | 2022 | | 2021 | | 2020 | | 2019 A |
Selected Per-Share Data | | | | | | | | | | |
| Net asset value, beginning of period | $ | 22.29 | $ | 24.97 | $ | 19.85 | $ | 23.16 | $ | 21.91 |
| Income from Investment Operations | | | | | | | | | | |
Net investment income (loss) B,C | | .43 | | .33 | | .36 | | .50 | | .40 |
| Net realized and unrealized gain (loss) | | (3.15) | | (1.48) | | 5.56 | | (1.92) | | 1.94 |
| Total from investment operations | | (2.72) | | (1.15) | | 5.92 | | (1.42) | | 2.34 |
| Distributions from net investment income | | (.36) | | (.23) | | (.32) | | (.48) | | (.36) |
| Distributions from net realized gain | | (2.69) | | (1.30) | | (.48) | | (1.41) | | (.73) |
| Total distributions | | (3.05) | | (1.53) | | (.80) | | (1.89) | | (1.09) |
| Net asset value, end of period | $ | 16.52 | $ | 22.29 | $ | 24.97 | $ | 19.85 | $ | 23.16 |
Total Return D,E | | (11.30)% | | (5.21)% | | 30.95% | | (6.80)% | | 11.22% |
Ratios to Average Net Assets C,F,G | | | | | | | | | | |
| Expenses before reductions | | .65% | | .64% | | .64% | | .65% | | .65% H |
| Expenses net of fee waivers, if any | | .65% | | .63% | | .64% | | .65% | | .64% H |
| Expenses net of all reductions | | .65% | | .63% | | .64% | | .64% | | .64% H |
| Net investment income (loss) | | 2.41% | | 1.38% | | 1.69% | | 2.38% | | 2.20% H |
| Supplemental Data | | | | | | | | | | |
| Net assets, end of period (000 omitted) | $ | 6,690 | $ | 13,539 | $ | 16,573 | $ | 9,157 | $ | 6,634 |
Portfolio turnover rate I | | 31% | | 48% | | 53% | | 56% | | 49% |
AFor the period October 2, 2018 (commencement of sale of shares) through July 31, 2019.
BCalculated based on average shares outstanding during the period.
CNet investment income (loss) is affected by the timing of the declaration of dividends by any underlying mutual funds or exchange-traded funds (ETFs). Net investment income (loss) of any mutual funds or ETFs is not included in the Fund's net investment income (loss) ratio.
DTotal returns for periods of less than one year are not annualized.
ETotal returns would have been lower if certain expenses had not been reduced during the applicable periods shown.
FFees and expenses of any underlying mutual funds or exchange-traded funds (ETFs) are not included in the Fund's expense ratio. The Fund indirectly bears its proportionate share of these expenses. For additional expense information related to investments in Fidelity Central Funds, please refer to the "Investments in Fidelity Central Funds" note found in the Notes to Financial Statements section of the most recent Annual or Semi-Annual report.
GExpense ratios reflect operating expenses of the class. Expenses before reductions do not reflect amounts reimbursed, waived, or reduced through arrangements with the investment adviser, brokerage services, or other offset arrangements, if applicable, and do not represent the amount paid by the class during periods when reimbursements, waivers or reductions occur.
HAnnualized.
IAmount does not include the portfolio activity of any underlying mutual funds or exchange-traded funds (ETFs).
For the period ended July 31, 2023
1. Organization.
Fidelity Advisor Real Estate Fund (the Fund) is a non-diversified fund of Fidelity Advisor Series VII (the Trust) and is authorized to issue an unlimited number of shares. The Trust is registered under the Investment Company Act of 1940, as amended (the 1940 Act), as an open-end management investment company organized as a Massachusetts business trust. The Fund offers Class A, Class M, Class C, Class I and Class Z shares shares, each of which has equal rights as to assets and voting privileges. Class A, Class M, Class C, Class I and Class Z are Fidelity Advisor classes. Each class has exclusive voting rights with respect to matters that affect that class. Class C shares will automatically convert to Class A shares after a holding period of eight years from the initial date of purchase, with certain exceptions.
2. Investments in Fidelity Central Funds.
Funds may invest in Fidelity Central Funds, which are open-end investment companies generally available only to other investment companies and accounts managed by the investment adviser and its affiliates. The Schedule of Investments lists any Fidelity Central Funds held as an investment as of period end, but does not include the underlying holdings of each Fidelity Central Fund. An investing fund indirectly bears its proportionate share of the expenses of the underlying Fidelity Central Funds.
Based on its investment objective, each Fidelity Central Fund may invest or participate in various investment vehicles or strategies that are similar to those of the investing fund. These strategies are consistent with the investment objectives of the investing fund and may involve certain economic risks which may cause a decline in value of each of the Fidelity Central Funds and thus a decline in the value of the investing fund.
| Fidelity Central Fund | Investment Manager | Investment Objective | Investment Practices | Expense RatioA |
| Fidelity Money Market Central Funds | Fidelity Management & Research Company LLC (FMR) | Each fund seeks to obtain a high level of current income consistent with the preservation of capital and liquidity. | Short-term Investments | Less than .005% |
A Expenses expressed as a percentage of average net assets and are as of each underlying Central Fund's most recent annual or semi-annual shareholder report.
A complete unaudited list of holdings for each Fidelity Central Fund is available upon request or at the Securities and Exchange Commission website at www.sec.gov. In addition, the financial statements of the Fidelity Central Funds which contain the significant accounting policies (including investment valuation policies) of those funds, and are not covered by the Report of Independent Registered Public Accounting Firm, are available on the Securities and Exchange Commission website or upon request.
3. Significant Accounting Policies.
The Fund is an investment company and applies the accounting and reporting guidance of the Financial Accounting Standards Board (FASB) Accounting Standards Codification Topic 946 Financial Services - Investment Companies. The financial statements have been prepared in conformity with accounting principles generally accepted in the United States of America (GAAP), which require management to make certain estimates and assumptions at the date of the financial statements. Actual results could differ from those estimates. Subsequent events, if any, through the date that the financial statements were issued have been evaluated in the preparation of the financial statements. The Fund's Schedule of Investments lists any underlying mutual funds or exchange-traded funds (ETFs) but does not include the underlying holdings of these funds. The following summarizes the significant accounting policies of the Fund:
Investment Valuation. Investments are valued as of 4:00 p.m. Eastern time on the last calendar day of the period. The Board of Trustees (the Board) has designated the Fund's investment adviser as the valuation designee responsible for the fair valuation function and performing fair value determinations as needed. The investment adviser has established a Fair Value Committee (the Committee) to carry out the day-to-day fair valuation responsibilities and has adopted policies and procedures to govern the fair valuation process and the activities of the Committee. In accordance with these fair valuation policies and procedures, which have been approved by the Board, the Fund attempts to obtain prices from one or more third party pricing services or brokers to value its investments. When current market prices, quotations or currency exchange rates are not readily available or reliable, investments will be fair valued in good faith by the Committee, in accordance with the policies and procedures. Factors used in determining fair value vary by investment type and may include market or investment specific events, transaction data, estimated cash flows, and market observations of comparable investments. The frequency that the fair valuation procedures are used cannot be predicted and they may be utilized to a significant extent. The Committee manages the Fund's fair valuation practices and maintains the fair valuation policies and procedures. The Fund's investment adviser reports to the Board information regarding the fair valuation process and related material matters.
The Fund categorizes the inputs to valuation techniques used to value its investments into a disclosure hierarchy consisting of three levels as shown below:
Level 1 - unadjusted quoted prices in active markets for identical investments
Level 2 - other significant observable inputs (including quoted prices for similar investments, interest rates, prepayment speeds, etc.)
Level 3 - unobservable inputs (including the Fund's own assumptions based on the best information available)
Valuation techniques used to value the Fund's investments by major category are as follows:
Equity securities, including restricted securities, for which market quotations are readily available, are valued at the last reported sale price or official closing price as reported by a third party pricing service on the primary market or exchange on which they are traded and are categorized as Level 1 in the hierarchy. In the event there were no sales during the day or closing prices are not available, securities are valued at the last quoted bid price or may be valued using the last available price and are generally categorized as Level 2 in the hierarchy. For foreign equity securities, when market or security specific events arise, comparisons to the valuation of American Depositary Receipts (ADRs), futures contracts, ETFs and certain indexes as well as quoted prices for similar securities may be used and would be categorized as Level 2 in the hierarchy. For equity securities, including restricted securities, where observable inputs are limited, assumptions about market activity and risk are used and these securities may be categorized as Level 3 in the hierarchy.
Investments in open-end mutual funds, including the Fidelity Central Funds, are valued at their closing net asset value (NAV) each business day and are categorized as Level 1 in the hierarchy.
Changes in valuation techniques may result in transfers in or out of an assigned level within the disclosure hierarchy. The aggregate value of investments by input level as of July 31, 2023 is included at the end of the Fund's Schedule of Investments.
Investment Transactions and Income. For financial reporting purposes, the Fund's investment holdings and NAV include trades executed through the end of the last business day of the period. The NAV per share for processing shareholder transactions is calculated as of the close of business of the New York Stock Exchange (NYSE), normally 4:00 p.m. Eastern time and includes trades executed through the end of the prior business day. Gains and losses on securities sold are determined on the basis of identified cost. Commissions paid to certain brokers with whom the investment adviser, or its affiliates, places trades on behalf of a fund include an amount in addition to trade execution, which may be rebated back to a fund. Any such rebates are included in net realized gain (loss) on investments in the Statement of Operations. Dividend income is recorded on the ex-dividend date, except for certain dividends from foreign securities where the ex-dividend date may have passed, which are recorded as soon as the Fund is informed of the ex-dividend date. Non-cash dividends included in dividend income, if any, are recorded at the fair market value of the securities received. Income and capital gain distributions from Fidelity Central Funds, if any, are recorded on the ex-dividend date. Certain distributions received by the Fund represent a return of capital or capital gain. The Fund determines the components of these distributions subsequent to the ex-dividend date, based upon receipt of tax filings or other correspondence relating to the underlying investment. These distributions are recorded as a reduction of cost of investments and/or as a realized gain.
Class Allocations and Expenses. Investment income, realized and unrealized capital gains and losses, common expenses of a fund, and certain fund-level expense reductions, if any, are allocated daily on a pro-rata basis to each class based on the relative net assets of each class to the total net assets of a fund. Each class differs with respect to transfer agent and distribution and service plan fees incurred, as applicable. Certain expense reductions may also differ by class, if applicable. For the reporting period, the allocated portion of income and expenses to each class as a percent of its average net assets may vary due to the timing of recording these transactions in relation to fluctuating net assets of the classes. Expenses directly attributable to a fund are charged to that fund. Expenses attributable to more than one fund are allocated among the respective funds on the basis of relative net assets or other appropriate methods. Expenses included in the accompanying financial statements reflect the expenses of that fund and do not include any expenses associated with any underlying mutual funds or exchange-traded funds (ETFs). Although not included in a fund's expenses, a fund indirectly bears its proportionate share of these expenses through the net asset value of each underlying mutual fund or exchange-traded fund (ETF). Expense estimates are accrued in the period to which they relate and adjustments are made when actual amounts are known.
Deferred Trustee Compensation. Under a Deferred Compensation Plan (the Plan) for certain Funds, certain independent Trustees have elected to defer receipt of a portion of their annual compensation. Deferred amounts are invested in affiliated mutual funds, are marked-to-market and remain in a fund until distributed in accordance with the Plan. The investment of deferred amounts and the offsetting payable to the Trustees presented below are included in the accompanying Statement of Assets and Liabilities in other receivables and other payables and accrued expenses, as applicable.
| Fidelity Advisor Real Estate Fund | $89,716 |
Income Tax Information and Distributions to Shareholders. Each year, the Fund intends to qualify as a regulated investment company under Subchapter M of the Internal Revenue Code, including distributing substantially all of its taxable income and realized gains. As a result, no provision for U.S. Federal income taxes is required. As of July 31, 2023, the Fund did not have any unrecognized tax benefits in the financial statements; nor is the Fund aware of any tax positions for which it is reasonably possible that the total amounts of unrecognized tax benefits will significantly change in the next twelve months. The Fund files a U.S. federal tax return, in addition to state and local tax returns as required. The Fund's federal income tax returns are subject to examination by the Internal Revenue Service (IRS) for a period of three fiscal years after they are filed. State and local tax returns may be subject to examination for an additional fiscal year depending on the jurisdiction.
Distributions are declared and recorded on the ex-dividend date. Income and capital gain distributions are declared separately for each class. Income and capital gain distributions are determined in accordance with income tax regulations, which may differ from GAAP. In addition, the Fund claimed a portion of the payment made to redeeming shareholders as a distribution for income tax purposes.
Capital accounts within the financial statements are adjusted for permanent book-tax differences. These adjustments have no impact on net assets or the results of operations. Capital accounts are not adjusted for temporary book-tax differences which will reverse in a subsequent period.
Book-tax differences are primarily due to deferred Trustee compensation and losses deferred due to wash sales and excise tax regulations.
As of period end, the cost and unrealized appreciation (depreciation) in securities, and derivatives if applicable, for federal income tax purposes were as follows:
| Gross unrealized appreciation | $66,035,320 |
| Gross unrealized depreciation | (21,199,141) |
| Net unrealized appreciation (depreciation) | $44,836,179 |
| Tax Cost | $214,665,113 |
The tax-based components of distributable earnings as of period end were as follows:
| Undistributed ordinary income | $1,497,221 |
| Net unrealized appreciation (depreciation) on securities and other investments | $44,836,179 |
The Fund intends to elect to defer to its next fiscal year $7,042,237 of capital losses recognized during the period November 1, 2022 to July 31, 2023.
The tax character of distributions paid was as follows:
| | July 31, 2023 | July 31, 2022 |
| Ordinary Income | $3,931,675 | $4,114,116 |
| Long-term Capital Gains | 39,565,793 | 24,175,235 |
| Total | $43,497,468 | $28,289,351 |
4. Purchases and Sales of Investments.
Purchases and sales of securities, other than short-term securities and in-kind transactions, as applicable, are noted in the table below.
| | Purchases ($) | Sales ($) |
| Fidelity Advisor Real Estate Fund | 92,347,487 | 188,504,754 |
5. Fees and Other Transactions with Affiliates.
Management Fee. Fidelity Management & Research Company LLC (the investment adviser) and its affiliates provide the Fund with investment management related services for which the Fund pays a monthly management fee. The management fee is the sum of an individual fund fee rate that is based on an annual rate of .30% of the Fund's average net assets and an annualized group fee rate that averaged .23% during the period. The group fee rate is based upon the monthly average net assets of a group of registered investment companies with which the investment adviser has management contracts. The group fee rate decreases as assets under management increase and increases as assets under management decrease. For the reporting period, the total annual management fee rate was .52% of the Fund's average net assets.
Distribution and Service Plan Fees. In accordance with Rule 12b-1 of the 1940 Act, the Fund has adopted separate Distribution and Service Plans for each class of shares. Certain classes pay Fidelity Distributors Company LLC (FDC), an affiliate of the investment adviser, separate Distribution and Service Fees, each of which is based on an annual percentage of each class' average net assets. In addition, FDC may pay financial intermediaries for selling shares of the Fund and providing shareholder support services. For the period, the Distribution and Service Fee rates, total fees and amounts retained by FDC were as follows:
| | Distribution Fee | Service Fee | Total Fees | Retained by FDC |
| Class A | - % | .25% | $245,471 | $2,824 |
| Class M | .25% | .25% | 425,184 | 1,362 |
| Class C | .75% | .25% | 87,705 | 6,730 |
| | | | $758,360 | $10,916 |
Sales Load. FDC may receive a front-end sales charge of up to 5.75% for selling Class A shares and 3.50% for selling Class M shares, some of which is paid to financial intermediaries for selling shares of the Fund. Depending on the holding period, FDC may receive contingent deferred sales charges levied on Class A, Class M and Class C redemptions. The deferred sales charges are 1.00% for Class C shares, 1.00% for certain purchases of Class A shares and .25% for certain purchases of Class M shares.
For the period, sales charge amounts retained by FDC were as follows:
| | Retained by FDC |
| Class A | $21,705 |
| Class M | 1,871 |
Class CA | 779 |
| | $24,355 |
A When Class C shares are initially sold, FDC pays commissions from its own resources to financial intermediaries through which the sales are made.
Transfer Agent Fees. Fidelity Investments Institutional Operations Company LLC (FIIOC), an affiliate of the investment adviser, is the transfer, dividend disbursing and shareholder servicing agent for each class of the Fund. FIIOC receives account fees and asset-based fees that vary according to the account size and type of account of the shareholders of the respective classes of the Fund, except for Class Z. FIIOC receives an asset-based fee of Class Z's average net assets. FIIOC pays for typesetting, printing and mailing of shareholder reports, except proxy statements.
For the period, transfer agent fees for each class were as follows:
| | Amount | % of Class-Level Average Net Assets |
| Class A | $241,881 | .25 |
| Class M | 172,110 | .20 |
| Class C | 22,598 | .26 |
| Class I | 218,524 | .22 |
| Class Z | 3,351 | .04 |
| | $658,464 | |
Accounting Fees. Fidelity Service Company, Inc. (FSC), an affiliate of the investment adviser, maintains the Fund's accounting records. The accounting fee is based on the level of average net assets for each month. For the period, the fees were equivalent to the following annual rates:
| | % of Average Net Assets |
| Fidelity Advisor Real Estate Fund | .04 |
Brokerage Commissions. A portion of portfolio transactions were placed with brokerage firms which are affiliates of the investment adviser. Brokerage commissions are included in net realized gain (loss) and change in net unrealized appreciation (depreciation) in the Statement of Operations. The commissions paid to these affiliated firms were as follows:
| | Amount |
| Fidelity Advisor Real Estate Fund | $ 1,885 |
Interfund Trades. Funds may purchase from or sell securities to other Fidelity Funds under procedures adopted by the Board. The procedures have been designed to ensure these interfund trades are executed in accordance with Rule 17a-7 of the 1940 Act. Any interfund trades are included within the respective purchases and sales amounts shown in the Purchases and Sales of Investments note. Interfund trades during the period are noted in the table below.
| | Purchases ($) | Sales ($) | Realized Gain (Loss) ($) |
| Fidelity Advisor Real Estate Fund | 7,703,681 | 10,357,753 | (447,984) |
6. Committed Line of Credit.
Certain Funds participate with other funds managed by the investment adviser or an affiliate in a $4.25 billion credit facility (the "line of credit") to be utilized for temporary or emergency purposes to fund shareholder redemptions or for other short-term liquidity purposes. The participating funds have agreed to pay commitment fees on their pro-rata portion of the line of credit, which are reflected in Miscellaneous expenses on the Statement of Operations, and are listed below. During the period, there were no borrowings on this line of credit.
| | Amount |
| Fidelity Advisor Real Estate Fund | $759 |
7. Security Lending.
Funds lend portfolio securities from time to time in order to earn additional income. Lending agents are used, including National Financial Services (NFS), an affiliate of the investment adviser. Pursuant to a securities lending agreement, NFS will receive a fee, which is capped at 9.9% of a fund's daily lending revenue, for its services as lending agent. A fund may lend securities to certain qualified borrowers, including NFS. On the settlement date of the loan, a fund receives collateral (in the form of U.S. Treasury obligations, letters of credit and/or cash) against the loaned securities and maintains collateral in an amount not less than 100% of the market value of the loaned securities during the period of the loan. The market value of the loaned securities is determined at the close of business of a fund and any additional required collateral is delivered to a fund on the next business day. A fund or borrower may terminate the loan at any time, and if the borrower defaults on its obligation to return the securities loaned because of insolvency or other reasons, a fund may apply collateral received from the borrower against the obligation. A fund may experience delays and costs in recovering the securities loaned. Any cash collateral received is invested in the Fidelity Securities Lending Cash Central Fund. Any loaned securities are identified as such in the Schedule of Investments, and the value of loaned securities and cash collateral at period end, as applicable, are presented in the Statement of Assets and Liabilities. Security lending income represents the income earned on investing cash collateral, less rebates paid to borrowers and any lending agent fees associated with the loan, plus any premium payments received for lending certain types of securities. Security lending income is presented in the Statement of Operations as a component of income from Fidelity Central Funds. Affiliated security lending activity, if any, was as follows:
| | Total Security Lending Fees Paid to NFS | Security Lending Income From Securities Loaned to NFS | Value of Securities Loaned to NFS at Period End |
| Fidelity Advisor Real Estate Fund | $7,723 | $- | $- |
8. Expense Reductions.
Through arrangements with each class' transfer agent, credits realized as a result of certain uninvested cash balances were used to reduce the Fund's expenses. During the period, transfer agent credits reduced each class' expenses as noted in the table below.
| | Expense reduction |
| Class A | $625 |
| Class M | 1,635 |
| | $2,260 |
In addition, during the period the investment adviser or an affiliate reimbursed and/or waived a portion of fund-level operating expenses in the amount of $14,076.
9. Distributions to Shareholders.
Distributions to shareholders of each class were as follows:
| | Year ended July 31, 2023 | Year ended July 31, 2022 |
| Fidelity Advisor Real Estate Fund | | |
| Distributions to shareholders | | |
| Class A | $15,393,613 | $7,993,209 |
| Class M | 13,294,219 | 6,745,913 |
| Class C | 1,438,033 | 908,708 |
| Class I | 12,249,509 | 11,703,981 |
| Class Z | 1,122,094 | 937,540 |
Total | $43,497,468 | $28,289,351 |
10. Share Transactions.
Share transactions for each class were as follows and may contain in-kind transactions, automatic conversions between classes or exchanges between affiliated funds:
| | Shares | Shares | Dollars | Dollars |
| | Year ended July 31, 2023 | Year ended July 31, 2022 | Year ended July 31, 2023 | Year ended July 31, 2022 |
| Fidelity Advisor Real Estate Fund | | | | |
| Class A | | | | |
| Shares sold | 548,565 | 994,036 | $9,379,631 | $23,589,069 |
| Reinvestment of distributions | 988,337 | 322,393 | 15,169,887 | 7,866,495 |
| Shares redeemed | (1,486,572) | (1,318,681) | (25,486,524) | (30,889,788) |
| Net increase (decrease) | 50,330 | (2,252) | $(937,006) | $565,776 |
| Class M | | | | |
| Shares sold | 415,463 | 392,434 | $7,039,884 | $9,212,673 |
| Reinvestment of distributions | 868,723 | 276,620 | 13,263,543 | 6,729,626 |
| Shares redeemed | (691,075) | (886,642) | (11,816,775) | (20,661,409) |
| Net increase (decrease) | 593,111 | (217,588) | $8,486,652 | $(4,719,110) |
| Class C | | | | |
| Shares sold | 34,213 | 106,372 | $548,005 | $2,458,841 |
| Reinvestment of distributions | 97,245 | 38,746 | 1,414,160 | 908,210 |
| Shares redeemed | (269,790) | (232,612) | (4,377,700) | (5,110,047) |
| Net increase (decrease) | (138,332) | (87,494) | $(2,415,535) | $(1,742,996) |
| Class I | | | | |
| Shares sold | 1,212,683 | 2,116,894 | $21,265,339 | $52,046,309 |
| Reinvestment of distributions | 773,432 | 440,622 | 12,074,421 | 10,890,582 |
| Shares redeemed | (5,020,909) | (3,272,627) | (92,269,058) | (77,697,577) |
| Net increase (decrease) | (3,034,794) | (715,111) | $(58,929,298) | $(14,760,686) |
| Class Z | | | | |
| Shares sold | 147,772 | 345,140 | $2,504,135 | $8,205,866 |
| Reinvestment of distributions | 66,006 | 31,131 | 1,033,635 | 769,941 |
| Shares redeemed | (416,258) | (432,603) | (7,225,336) | (10,112,884) |
| Net increase (decrease) | (202,480) | (56,332) | $(3,687,566) | $(1,137,077) |
11. Other.
A fund's organizational documents provide former and current trustees and officers with a limited indemnification against liabilities arising in connection with the performance of their duties to the fund. In the normal course of business, a fund may also enter into contracts that provide general indemnifications. A fund's maximum exposure under these arrangements is unknown as this would be dependent on future claims that may be made against a fund. The risk of material loss from such claims is considered remote.
12. Risk and Uncertainties.
Many factors affect a fund's performance. Developments that disrupt global economies and financial markets, such as pandemics, epidemics, outbreaks of infectious diseases, war, terrorism, and environmental disasters, may significantly affect a fund's investment performance. The effects of these developments to a fund will be impacted by the types of securities in which a fund invests, the financial condition, industry, economic sector, and geographic location of an issuer, and a fund's level of investment in the securities of that issuer. Significant concentrations in security types, issuers, industries, sectors, and geographic locations may magnify the factors that affect a fund's performance.
To the Board of Trustees of Fidelity Advisor Series VII and the Shareholders of Fidelity Advisor Real Estate Fund:
Opinion on the Financial Statements and Financial Highlights
We have audited the accompanying statement of assets and liabilities of Fidelity Advisor Real Estate Fund (the "Fund"), a fund of Fidelity Advisor Series VII, including the schedule of investments, as of July 31, 2023, the related statement of operations for the year then ended, the statement of changes in net assets for each of the two years in the period then ended, the financial highlights for each of the five years in the period then ended, and the related notes. In our opinion, the financial statements and financial highlights present fairly, in all material respects, the financial position of the Fund as of July 31, 2023, and the results of its operations for the year then ended, the changes in its net assets for each of the two years in the period then ended, and the financial highlights for each of the five years in the period then ended in conformity with accounting principles generally accepted in the United States of America.
Basis for Opinion
These financial statements and financial highlights are the responsibility of the Fund's management. Our responsibility is to express an opinion on the Fund's financial statements and financial highlights based on our audits. We are a public accounting firm registered with the Public Company Accounting Oversight Board (United States) (PCAOB) and are required to be independent with respect to the Fund in accordance with the U.S. federal securities laws and the applicable rules and regulations of the Securities and Exchange Commission and the PCAOB.
We conducted our audits in accordance with the standards of the PCAOB. Those standards require that we plan and perform the audit to obtain reasonable assurance about whether the financial statements and financial highlights are free of material misstatement, whether due to error or fraud. The Fund is not required to have, nor were we engaged to perform, an audit of its internal control over financial reporting. As part of our audits we are required to obtain an understanding of internal control over financial reporting but not for the purpose of expressing an opinion on the effectiveness of the Fund's internal control over financial reporting. Accordingly, we express no such opinion.
Our audits included performing procedures to assess the risks of material misstatement of the financial statements and financial highlights, whether due to error or fraud, and performing procedures that respond to those risks. Such procedures included examining, on a test basis, evidence regarding the amounts and disclosures in the financial statements and financial highlights. Our audits also included evaluating the accounting principles used and significant estimates made by management, as well as evaluating the overall presentation of the financial statements and financial highlights. Our procedures included confirmation of securities owned as of July 31, 2023, by correspondence with the custodian and brokers; when replies were not received from brokers, we performed other auditing procedures. We believe that our audits provide a reasonable basis for our opinion.
/s/ Deloitte & Touche LLP
Boston, Massachusetts
September 14, 2023
We have served as the auditor of one or more of the Fidelity investment companies since 1999.
The Trustees, Members of the Advisory Board (if any), and officers of the trust and fund, as applicable, are listed below. The Board of Trustees governs the fund and is responsible for protecting the interests of shareholders. The Trustees are experienced executives who meet periodically throughout the year to oversee the fund's activities, review contractual arrangements with companies that provide services to the fund, oversee management of the risks associated with such activities and contractual arrangements, and review the fund's performance. Except for Vijay Advani, each of the Trustees oversees 321 funds. Mr. Advani oversees 215 funds.
The Trustees hold office without limit in time except that (a) any Trustee may resign; (b) any Trustee may be removed by written instrument, signed by at least two-thirds of the number of Trustees prior to such removal; (c) any Trustee who requests to be retired or who has become incapacitated by illness or injury may be retired by written instrument signed by a majority of the other Trustees; and (d) any Trustee may be removed at any special meeting of shareholders by a two-thirds vote of the outstanding voting securities of the trust. Each Trustee who is not an interested person (as defined in the 1940 Act) of the trust and the fund is referred to herein as an Independent Trustee. Each Independent Trustee shall retire not later than the last day of the calendar year in which his or her 75th birthday occurs. The Independent Trustees may waive this mandatory retirement age policy with respect to individual Trustees. Officers and Advisory Board Members hold office without limit in time, except that any officer or Advisory Board Member may resign or may be removed by a vote of a majority of the Trustees at any regular meeting or any special meeting of the Trustees. Except as indicated, each individual has held the office shown or other offices in the same company for the past five years.
The fund's Statement of Additional Information (SAI) includes more information about the Trustees. To request a free copy, call Fidelity at 1-877-208-0098.
Experience, Skills, Attributes, and Qualifications of the Trustees. The Governance and Nominating Committee has adopted a statement of policy that describes the experience, qualifications, attributes, and skills that are necessary and desirable for potential Independent Trustee candidates (Statement of Policy). The Board believes that each Trustee satisfied at the time he or she was initially elected or appointed a Trustee, and continues to satisfy, the standards contemplated by the Statement of Policy. The Governance and Nominating Committee also engages professional search firms to help identify potential Independent Trustee candidates who have the experience, qualifications, attributes, and skills consistent with the Statement of Policy. From time to time, additional criteria based on the composition and skills of the current Independent Trustees, as well as experience or skills that may be appropriate in light of future changes to board composition, business conditions, and regulatory or other developments, have also been considered by the professional search firms and the Governance and Nominating Committee. In addition, the Board takes into account the Trustees' commitment and participation in Board and committee meetings, as well as their leadership of standing and ad hoc committees throughout their tenure.
In determining that a particular Trustee was and continues to be qualified to serve as a Trustee, the Board has considered a variety of criteria, none of which, in isolation, was controlling. The Board believes that, collectively, the Trustees have balanced and diverse experience, qualifications, attributes, and skills, which allow the Board to operate effectively in governing the fund and protecting the interests of shareholders. Information about the specific experience, skills, attributes, and qualifications of each Trustee, which in each case led to the Board's conclusion that the Trustee should serve (or continue to serve) as a trustee of the fund, is provided below.
Board Structure and Oversight Function. Robert A. Lawrence is an interested person and currently serves as Chair. The Trustees have determined that an interested Chair is appropriate and benefits shareholders because an interested Chair has a personal and professional stake in the quality and continuity of services provided to the fund. Independent Trustees exercise their informed business judgment to appoint an individual of their choosing to serve as Chair, regardless of whether the Trustee happens to be independent or a member of management. The Independent Trustees have determined that they can act independently and effectively without having an Independent Trustee serve as Chair and that a key structural component for assuring that they are in a position to do so is for the Independent Trustees to constitute a substantial majority for the Board. The Independent Trustees also regularly meet in executive session. David M. Thomas serves as Lead Independent Trustee and as such (i) acts as a liaison between the Independent Trustees and management with respect to matters important to the Independent Trustees and (ii) with management prepares agendas for Board meetings.
Fidelity® funds are overseen by different Boards of Trustees. The fund's Board oversees Fidelity's high income and certain equity funds, and other Boards oversee Fidelity's alternative investment, investment-grade bond, money market, asset allocation, and other equity funds. The asset allocation funds may invest in Fidelity® funds overseen by the fund's Board. The use of separate Boards, each with its own committee structure, allows the Trustees of each group of Fidelity® funds to focus on the unique issues of the funds they oversee, including common research, investment, and operational issues. On occasion, the separate Boards establish joint committees to address issues of overlapping consequences for the Fidelity® funds overseen by each Board.
The Trustees operate using a system of committees to facilitate the timely and efficient consideration of all matters of importance to the Trustees, the fund, and fund shareholders and to facilitate compliance with legal and regulatory requirements and oversight of the fund's activities and associated risks. The Board, acting through its committees, has charged FMR and its affiliates with (i) identifying events or circumstances the occurrence of which could have demonstrably adverse effects on the fund's business and/or reputation; (ii) implementing processes and controls to lessen the possibility that such events or circumstances occur or to mitigate the effects of such events or circumstances if they do occur; and (iii) creating and maintaining a system designed to evaluate continuously business and market conditions in order to facilitate the identification and implementation processes described in (i) and (ii) above. Because the day-to-day operations and activities of the fund are carried out by or through FMR, its affiliates, and other service providers, the fund's exposure to risks is mitigated but not eliminated by the processes overseen by the Trustees. While each of the Board's committees has responsibility for overseeing different aspects of the fund's activities, oversight is exercised primarily through the Operations, Audit, and Compliance Committees. Appropriate personnel, including but not limited to the fund's Chief Compliance Officer (CCO), FMR's internal auditor, the independent accountants, the fund's Treasurer and portfolio management personnel, make periodic reports to the Board's committees, as appropriate, including an annual review of Fidelity's risk management program for the Fidelity® funds. The responsibilities of each standing committee, including their oversight responsibilities, are described further under "Standing Committees of the Trustees."
Interested Trustees*:
Correspondence intended for a Trustee who is an interested person may be sent to Fidelity Investments, 245 Summer Street, Boston, Massachusetts 02210.
Name, Year of Birth; Principal Occupations and Other Relevant Experience+
Bettina Doulton (1964)
Year of Election or Appointment: 2020
Trustee
Ms. Doulton also serves as Trustee of other Fidelity® funds. Prior to her retirement, Ms. Doulton served in a variety of positions at Fidelity Investments, including as a managing director of research (2006-2007), portfolio manager to certain Fidelity® funds (1993-2005), equity analyst and portfolio assistant (1990-1993), and research assistant (1987-1990). Ms. Doulton currently owns and operates Phi Builders + Architects and Cellardoor Winery. Previously, Ms. Doulton served as a member of the Board of Brown Capital Management, LLC (2014-2018).
Robert A. Lawrence (1952)
Year of Election or Appointment: 2020
Trustee
Chair of the Board of Trustees
Mr. Lawrence also serves as Trustee of other funds. Previously, Mr. Lawrence served as a Trustee and Member of the Advisory Board of certain funds. Prior to his retirement in 2008, Mr. Lawrence served as Vice President of certain Fidelity® funds (2006-2008), Senior Vice President, Head of High Income Division of Fidelity Management & Research Company (investment adviser firm, 2006-2008), and President of Fidelity Strategic Investments (investment adviser firm, 2002-2005).
* Determined to be an "Interested Trustee" by virtue of, among other things, his or her affiliation with the trust or various entities under common control with FMR.
+ The information includes the Trustee's principal occupation during the last five years and other information relating to the experience, attributes, and skills relevant to the Trustee's qualifications to serve as a Trustee, which led to the conclusion that the Trustee should serve as a Trustee for the fund.
Independent Trustees:
Correspondence intended for an Independent Trustee may be sent to Fidelity Investments, P.O. Box 55235, Boston, Massachusetts 02205-5235.
Name, Year of Birth; Principal Occupations and Other Relevant Experience+
Vijay C. Advani (1960)
Year of Election or Appointment: 2023
Trustee
Mr. Advani also serves as Trustee or Member of the Advisory Board of other funds. Previously, Mr. Advani served as Executive Chairman (2020-2022), Chief Executive Officer (2017-2020) and Chief Operating Officer (2016-2017) of Nuveen (global investment manager). He also served in various capacities at Franklin Resources (global investment manager), including Co-President (2015-2016), Executive Vice President, Global Advisory Services (2008-2015), Head of Global Retail Distribution (2005-2008), Executive Managing Director, International Retail Development (2002-2005), Managing Director, Product Developments, Sales & Marketing, Asia, Eastern Europe and Africa (2000-2002) and President, Templeton Asset Management India (1995-2000). Mr. Advani also served as Senior Investment Officer of International Finance Corporation (private equity and venture capital arm of The World Bank, 1984-1995). Mr. Advani is Chairman Emeritus of the U.S. India Business Council (2018-present), a Director of The Global Impact Investing Network (2019-present), a Director of LOK Capital (Mauritius) (2022-present), a member of the Advisory Council of LOK Capital (2022-present), a Senior Advisor of Neuberger Berman (2021-present), a Senior Advisor of Seviora Holdings Pte. Ltd (Temasek-Singapore) (2021-present), a Director of Seviora Capital (Singapore) (2021-present) and an Advisor of EQUIAM (2021-present). Mr. Advani formerly served as a member of the Board of BowX Acquisition Corp. (special purpose acquisition company, 2020-2021), a member of the Board of Intellecap (advisory arm of The Aavishkaar Group, 2018-2020), a member of the Board of Nuveen Investments, Inc. (2017-2020) and a member of the Board of Docusign (software, 2016-2019).
Thomas P. Bostick (1956)
Year of Election or Appointment: 2021
Trustee
Lieutenant General Bostick also serves as Trustee of other Fidelity® funds. Prior to his retirement, General Bostick (United States Army, Retired) held a variety of positions within the U.S. Army, including Commanding General and Chief of Engineers, U.S. Army Corps of Engineers (2012-2016) and Deputy Chief of Staff and Director of Human Resources, U.S. Army (2009-2012). General Bostick currently serves as a member of the Board and Finance and Governance & Sustainability Committees of CSX Corporation (transportation, 2020-present) and a member of the Board and Corporate Governance and Nominating Committee of Perma-Fix Environmental Services, Inc. (nuclear waste management, 2020-present). General Bostick serves as Chief Executive Officer of Bostick Global Strategies, LLC (consulting, 2016-present), as a member of the Board of HireVue, Inc. (video interview and assessment, 2020-present), as a member of the Board of Allonnia (biotechnology and engineering solutions, 2022-present) and on the Advisory Board of Solugen, Inc. (specialty bio-based chemicals manufacturer, 2022-present). Previously, General Bostick served as a Member of the Advisory Board of certain Fidelity® funds (2021), President, Intrexon Bioengineering (2018-2020) and Chief Operating Officer (2017-2020) and Senior Vice President of the Environment Sector (2016-2017) of Intrexon Corporation (biopharmaceutical company).
Dennis J. Dirks (1948)
Year of Election or Appointment: 2018
Trustee
Mr. Dirks also serves as Trustee of other Fidelity® funds. Prior to his retirement in May 2003, Mr. Dirks served as Chief Operating Officer and as a member of the Board of The Depository Trust & Clearing Corporation (financial markets infrastructure), President, Chief Operating Officer and a member of the Board of The Depository Trust Company (DTC), President and a member of the Board of the National Securities Clearing Corporation (NSCC), Chief Executive Officer and a member of the Board of the Government Securities Clearing Corporation and Chief Executive Officer and a member of the Board of the Mortgage-Backed Securities Clearing Corporation. Mr. Dirks currently serves as a member of the Finance Committee (2016-present) and Board (2017-present) and is Treasurer (2018-present) of the Asolo Repertory Theatre.
Donald F. Donahue (1950)
Year of Election or Appointment: 2018
Trustee
Mr. Donahue also serves as Trustee of other Fidelity® funds. Mr. Donahue serves as President and Chief Executive Officer of Miranda Partners, LLC (risk consulting for the financial services industry, 2012-present). Previously, Mr. Donahue served as Chief Executive Officer (2006-2012), Chief Operating Officer (2003-2006) and Managing Director, Customer Marketing and Development (1999-2003) of The Depository Trust & Clearing Corporation (financial markets infrastructure). Mr. Donahue currently serves as a member (2007-present) and Co-Chairman (2016-present) of the Board of United Way of New York. Mr. Donahue previously served as a member of the Advisory Board of certain Fidelity® funds (2015-2018) and as a member of the Board of The Leadership Academy (previously NYC Leadership Academy) (2012-2022).
Vicki L. Fuller (1957)
Year of Election or Appointment: 2020
Trustee
Ms. Fuller also serves as Trustee of other Fidelity® funds. Previously, Ms. Fuller served as a member of the Advisory Board of certain Fidelity® funds (2018-2020), Chief Investment Officer of the New York State Common Retirement Fund (2012-2018) and held a variety of positions at AllianceBernstein L.P. (global asset management, 1985-2012), including Managing Director (2006-2012) and Senior Vice President and Senior Portfolio Manager (2001-2006). Ms. Fuller currently serves as a member of the Board, Audit Committee and Nominating and Governance Committee of two Blackstone business development companies (2020-present), as a member of the Board of Treliant, LLC (consulting, 2019-present), as a member of the Board of Ariel Alternatives, LLC (private equity, 2022-present) and as a member of the Board and Chair of the Audit Committee of Gusto, Inc. (software, 2021-present). In addition, Ms. Fuller currently serves as a member of the Board of Roosevelt University (2019-present) and as a member of the Executive Board of New York University's Stern School of Business. Ms. Fuller previously served as a member of the Board, Audit Committee and Nominating and Governance Committee of The Williams Companies, Inc. (natural gas infrastructure, 2018-2021).
Patricia L. Kampling (1959)
Year of Election or Appointment: 2020
Trustee
Ms. Kampling also serves as Trustee of other Fidelity® funds. Prior to her retirement, Ms. Kampling served as Chairman of the Board and Chief Executive Officer (2012-2019), President and Chief Operating Officer (2011-2012) and Executive Vice President and Chief Financial Officer (2010-2011) of Alliant Energy Corporation. Ms. Kampling currently serves as a member of the Board, Finance Committee and Governance, Compensation and Nominating Committee of Xcel Energy Inc. (utilities company, 2020-present) and as a member of the Board, Audit, Finance and Risk Committee and Safety, Environmental, Technology and Operations Committee and Chair of the Executive Development and Compensation Committee of American Water Works Company, Inc. (utilities company, 2019-present). In addition, Ms. Kampling currently serves as a member of the Board of the Nature Conservancy, Wisconsin Chapter (2019-present). Previously, Ms. Kampling served as a Member of the Advisory Board of certain Fidelity® funds (2020), a member of the Board, Compensation Committee and Executive Committee and Chair of the Audit Committee of Briggs & Stratton Corporation (manufacturing, 2011-2021), a member of the Board of Interstate Power and Light Company (2012-2019) and Wisconsin Power and Light Company (2012-2019) (each a subsidiary of Alliant Energy Corporation) and as a member of the Board and Workforce Development Committee of the Business Roundtable (2018-2019).
Thomas A. Kennedy (1955)
Year of Election or Appointment: 2021
Trustee
Mr. Kennedy also serves as Trustee of other Fidelity® funds. Previously, Mr. Kennedy served as a Member of the Advisory Board of certain Fidelity® funds (2020) and held a variety of positions at Raytheon Company (aerospace and defense, 1983-2020), including Chairman and Chief Executive Officer (2014-2020) and Executive Vice President and Chief Operating Officer (2013-2014). Mr. Kennedy served as Executive Chairman of the Board of Directors of Raytheon Technologies Corporation (aerospace and defense, 2020-2021). Mr. Kennedy serves as a Director of the Board of Directors of Textron Inc. (aerospace and defense, 2023-present).
Oscar Munoz (1959)
Year of Election or Appointment: 2021
Trustee
Mr. Munoz also serves as Trustee of other Fidelity® funds. Prior to his retirement, Mr. Munoz served as Executive Chairman (2020-2021), Chief Executive Officer (2015-2020), President (2015-2016) and a member of the Board (2010-2021) of United Airlines Holdings, Inc. Mr. Munoz currently serves as a member of the Board of CBRE Group, Inc. (commercial real estate, 2020-present), a member of the Board of Univision Communications, Inc. (Hispanic media, 2020-present), a member of the Board of Archer Aviation Inc. (2021-present), a member of the Defense Business Board of the United States Department of Defense (2021-present) and a member of the Board of Salesforce.com, Inc. (cloud-based software, 2022-present). Previously, Mr. Munoz served as a Member of the Advisory Board of certain Fidelity® funds (2021).
David M. Thomas (1949)
Year of Election or Appointment: 2018
Trustee
Lead Independent Trustee
Mr. Thomas also serves as Trustee of other Fidelity® funds. Previously, Mr. Thomas served as Executive Chairman (2005-2006) and Chairman and Chief Executive Officer (2000-2005) of IMS Health, Inc. (pharmaceutical and healthcare information solutions). Mr. Thomas currently serves as a member of the Board of Fortune Brands Home and Security (home and security products, 2004-present) and as Director (2013-present) and Non-Executive Chairman of the Board (2022-present) of Interpublic Group of Companies, Inc. (marketing communication).
Susan Tomasky (1953)
Year of Election or Appointment: 2020
Trustee
Ms. Tomasky also serves as Trustee of other Fidelity® funds. Prior to her retirement, Ms. Tomasky served in various executive officer positions at American Electric Power Company, Inc. (1998-2011), including most recently as President of AEP Transmission (2007-2011). Ms. Tomasky currently serves as a member of the Board and Sustainability Committee and as Chair of the Audit Committee of Marathon Petroleum Corporation (2018-present) and as a member of the Board, Executive Committee, Corporate Governance Committee and Organization and Compensation Committee and as Lead Director of the Board of Public Service Enterprise Group, Inc. (utilities company, 2012-present) and as a member of the Board of its subsidiary company, Public Service Electric and Gas Co. (2021-present). In addition, Ms. Tomasky currently serves as a member (2009-present) and President (2020-present) of the Board of the Royal Shakespeare Company - America (2009-present), as a member of the Board of the Columbus Association for the Performing Arts (2011-present) and as a member of the Board and Kenyon in the World Committee of Kenyon College (2016-present). Previously, Ms. Tomasky served as a Member of the Advisory Board of certain Fidelity® funds (2020), as a member of the Board of the Columbus Regional Airport Authority (2007-2020), as a member of the Board (2011-2018) and Lead Independent Director (2015-2018) of Andeavor Corporation (previously Tesoro Corporation) (independent oil refiner and marketer) and as a member of the Board of Summit Midstream Partners LP (energy, 2012-2018).
Michael E. Wiley (1950)
Year of Election or Appointment: 2008
Trustee
Mr. Wiley also serves as Trustee of other Fidelity® funds. Previously, Mr. Wiley served as a member of the Advisory Board of certain Fidelity® funds (2018-2020), Chairman, President and CEO of Baker Hughes, Inc. (oilfield services, 2000-2004). Mr. Wiley also previously served as a member of the Board of Andeavor Corporation (independent oil refiner and marketer, 2005-2018), a member of the Board of Andeavor Logistics LP (natural resources logistics, 2015-2018) and a member of the Board of High Point Resources (exploration and production, 2005-2020).
+ The information includes the Trustee's principal occupation during the last five years and other information relating to the experience, attributes, and skills relevant to the Trustee's qualifications to serve as a Trustee, which led to the conclusion that the Trustee should serve as a Trustee for the fund.
Advisory Board Members and Officers:
Correspondence intended for a Member of the Advisory Board (if any) may be sent to Fidelity Investments, P.O. Box 55235, Boston, Massachusetts 02205-5235. Correspondence intended for an officer or Peter S. Lynch may be sent to Fidelity Investments, 245 Summer Street, Boston, Massachusetts 02210. Officers appear below in alphabetical order.
Name, Year of Birth; Principal Occupation
Peter S. Lynch (1944)
Year of Election or Appointment: 2018
Member of the Advisory Board
Mr. Lynch also serves as a Member of the Advisory Board of other Fidelity® funds. Mr. Lynch is Vice Chairman and a Director of Fidelity Management & Research Company LLC (investment adviser firm). In addition, Mr. Lynch serves as a Trustee of Boston College and as the Chairman of the Inner-City Scholarship Fund. Previously, Mr. Lynch served as Vice Chairman and a Director of FMR Co., Inc. (investment adviser firm) and on the Special Olympics International Board of Directors (1997-2006).
Karen B. Peetz (1955)
Year of Election or Appointment: 2023
Member of the Advisory Board
Ms. Peetz also serves as a Member of the Advisory Board of other funds. Previously, Ms. Peetz served as Chief Administration Officer (2020-2023) of Citigroup Inc. (a diversified financial service company). She also served in various capacities at Bank of New York Mellon Corporation, including President (2013-2016), Vice Chairman, Senior Executive Vice President and Chief Executive Officer of Financial Markets & Treasury Services (2010-2013), Senior Executive Vice President and Chief Executive Officer of Global Corporate Trust (2003-2008), Senior Vice President and Division Manager of Global Payments & Trade Services (2002-2003) and Senior Vice President and Division Manager of Domestic Corporate Trust (1998-2002). Ms. Peetz also served in various capacities at Chase Manhattan Corporation (1982-1998), including Senior Vice President and Manager of Corporate Trust International Business (1996-1998), Managing Director and Manager of Corporate Trust Services (1994-1996) and Managing Director and Group Manager of Financial Institution Sales (1990-1993). Ms. Peetz currently serves as Chair of Amherst Holdings Advisory Council (2018-present), Trustee of Johns Hopkins University (2016-present), Chair of the Carey Business School Advisory Council, Member of the Johns Hopkins Medicine Board and Finance Committee and Chair of the Lyme and Tick Related Disease Institute Advisory Council. Ms. Peetz previously served as a member of the Board of Guardian Life Insurance Company of America (2019-2023), a member of the Board of Trane Technologies (2018-2022), a member of the Board of Wells Fargo Corp. (2017-2019), a member of the Board of SunCoke Energy Inc. (2012-2016), a member of the Board of Private Export Funding Corporation (2010-2016) and as a Trustee of Penn State University (2010-2014) and the United Way of New York City (2008-2010).
Heather Bonner (1977)
Year of Election or Appointment: 2023
Assistant Treasurer
Ms. Bonner also serves as an officer of other funds. Ms. Bonner serves as Senior Vice President (2022-present), and is an employee of Fidelity Investments. Ms. Bonner serves as Assistant Treasurer of Fidelity CRET Trustee LLC (2022-present). Prior to joining Fidelity, Ms. Bonner served as Managing Director at AQR Capital Management (2013-2022) and was the Treasurer and Principal Financial Officer of the AQR Funds (2013-2022).
Craig S. Brown (1977)
Year of Election or Appointment: 2022
Deputy Treasurer
Mr. Brown also serves as an officer of other funds. Mr. Brown serves as Assistant Treasurer of FIMM, LLC (2021-present) and is an employee of Fidelity Investments (2013-present). Previously, Mr. Brown served as Assistant Treasurer of certain Fidelity® funds (2019-2022).
John J. Burke III (1964)
Year of Election or Appointment: 2018
Chief Financial Officer
Mr. Burke also serves as Chief Financial Officer of other funds. Mr. Burke serves as Head of Investment Operations for Fidelity Fund and Investment Operations (2018-present) and is an employee of Fidelity Investments (1998-present). Previously Mr. Burke served as head of Asset Management Investment Operations (2012-2018).
Margaret Carey (1973)
Year of Election or Appointment: 2023
Secretary and Chief Legal Officer (CLO)
Ms. Carey also serves as an officer of other funds and as CLO of certain other Fidelity entities. She is a Senior Vice President and Deputy General Counsel of FMR LLC (diversified financial services company, 2019-present), and is an employee of Fidelity Investments.
William C. Coffey (1969)
Year of Election or Appointment: 2019
Assistant Secretary
Mr. Coffey also serves as Assistant Secretary of other funds. He is Senior Vice President and Deputy General Counsel of FMR LLC (diversified financial services company, 2010-present), and is an employee of Fidelity Investments. Previously, Mr. Coffey served as Secretary and CLO of certain funds (2018-2019); CLO, Secretary, and Senior Vice President of Fidelity Management & Research Company and FMR Co., Inc. (investment adviser firms, 2018-2019); Secretary of Fidelity SelectCo, LLC and Fidelity Investments Money Management, Inc. (investment adviser firms, 2018-2019); CLO of Fidelity Management & Research (Hong Kong) Limited, FMR Investment Management (UK) Limited, and Fidelity Management & Research (Japan) Limited (investment adviser firms, 2018-2019); and Assistant Secretary of certain funds (2009-2018).
Timothy M. Cohen (1969)
Year of Election or Appointment: 2018
Vice President
Mr. Cohen also serves as Vice President of other funds. Mr. Cohen serves as Co-Head of Equity (2018-present), a Director of Fidelity Management & Research (Japan) Limited (investment adviser firm, 2016-present), and is an employee of Fidelity Investments. Previously, Mr. Cohen served as Executive Vice President of Fidelity SelectCo, LLC (2019), Head of Global Equity Research (2016-2018), Chief Investment Officer - Equity and a Director of Fidelity Management & Research (U.K.) Inc. (investment adviser firm, 2013-2015) and as a Director of Fidelity Management & Research (Hong Kong) Limited (investment adviser firm, 2017).
Jonathan Davis (1968)
Year of Election or Appointment: 2010
Assistant Treasurer
Mr. Davis also serves as an officer of other funds. Mr. Davis serves as Vice President Assistant Treasurer and is an employee of Fidelity Investments. Mr. Davis serves as Assistant Treasurer of certain Fidelity entities.
Laura M. Del Prato (1964)
Year of Election or Appointment: 2018
Assistant Treasurer
Ms. Del Prato also serves as an officer of other funds. Ms. Del Prato serves as Assistant Treasurer of FIMM, LLC (2021-present) and is an employee of Fidelity Investments (2017-present). Previously, Ms. Del Prato served as President and Treasurer of The North Carolina Capital Management Trust: Cash Portfolio and Term Portfolio (2018-2020). Prior to joining Fidelity Investments, Ms. Del Prato served as a Managing Director and Treasurer of the JPMorgan Mutual Funds (2014-2017). Prior to JPMorgan, Ms. Del Prato served as a partner at Cohen Fund Audit Services (accounting firm, 2012-2013) and KPMG LLP (accounting firm, 2004-2012).
Colm A. Hogan (1973)
Year of Election or Appointment: 2020
Assistant Treasurer
Mr. Hogan also serves as an officer of other funds. Mr. Hogan serves as Assistant Treasurer of FIMM, LLC (2021-present) and FMR Capital, Inc. (2017-present) and is an employee of Fidelity Investments (2005-present). Previously, Mr. Hogan served as Deputy Treasurer of certain Fidelity® funds (2016-2020) and Assistant Treasurer of certain Fidelity® funds (2016-2018).
Pamela R. Holding (1964)
Year of Election or Appointment: 2018
Vice President
Ms. Holding also serves as Vice President of other funds. Ms. Holding serves as Co-Head of Equity (2018-present) and is an employee of Fidelity Investments (2013-present). Previously, Ms. Holding served as Executive Vice President of Fidelity SelectCo, LLC (2019) and as Chief Investment Officer of Fidelity Institutional Asset Management (2013-2018).
Chris Maher (1972)
Year of Election or Appointment: 2020
Deputy Treasurer
Mr. Maher also serves as an officer of other funds. Mr. Maher serves as Assistant Treasurer of FIMM, LLC (2021-present) and FMR Capital, Inc. (2017-present), and is an employee of Fidelity Investments (2008-present). Previously, Mr. Maher served as Assistant Treasurer of certain funds (2013-2020); Vice President of Asset Management Compliance (2013), Vice President of the Program Management Group of FMR (investment adviser firm, 2010-2013), and Vice President of Valuation Oversight (2008-2010).
Jason P. Pogorelec (1975)
Year of Election or Appointment: 2020
Chief Compliance Officer
Mr. Pogorelec also serves as Chief Compliance Officer of other funds. Mr. Pogorelec is a Senior Vice President of Asset Management Compliance for Fidelity Investments and is an employee of Fidelity Investments. Mr. Pogorelec serves as Compliance Officer of Fidelity Management & Research Company LLC (investment adviser firm, 2023-present). Previously, Mr. Pogorelec served as Vice President, Associate General Counsel for Fidelity Investments (2010-2020) and Assistant Secretary of certain Fidelity® funds (2015-2020).
Brett Segaloff (1972)
Year of Election or Appointment: 2021
Anti-Money Laundering (AML) Officer
Mr. Segaloff also serves as an AML Officer of other funds and other related entities. He is Director, Anti-Money Laundering (2007-present) of FMR LLC (diversified financial services company) and is an employee of Fidelity Investments (1996-present).
Stacie M. Smith (1974)
Year of Election or Appointment: 2018
President and Treasurer
Ms. Smith also serves as an officer of other funds. Ms. Smith serves as Assistant Treasurer of FIMM, LLC (2021-present) and FMR Capital, Inc. (2017-present), is an employee of Fidelity Investments (2009-present), and has served in other fund officer roles. Prior to joining Fidelity Investments, Ms. Smith served as Senior Audit Manager of Ernst & Young LLP (accounting firm, 1996-2009). Previously, Ms. Smith served as Assistant Treasurer (2013-2019) and Deputy Treasurer (2013-2016) of certain Fidelity® funds.
Jim Wegmann (1979)
Year of Election or Appointment: 2019
Assistant Treasurer
Mr. Wegmann also serves as an officer of other funds. Mr. Wegmann serves as Assistant Treasurer of FIMM, LLC (2021-present) and is an employee of Fidelity Investments (2011-present). Previously, Mr. Wegmann served as Assistant Treasurer of certain Fidelity® funds (2019-2021).
As a shareholder, you incur two types of costs: (1) transaction costs, which may include sales charges (loads) on purchase payments or redemption proceeds, as applicable and (2) ongoing costs, which generally include management fees, distribution and/or service (12b-1) fees and other Fund expenses. This Example is intended to help you understand your ongoing costs (in dollars) of investing in a fund and to compare these costs with the ongoing costs of investing in other mutual funds.
| The Example is based on an investment of $1,000 invested at the beginning of the period and held for the entire period (February 1, 2023 to July 31, 2023). |
Actual Expenses
The first line of the accompanying table provides information about actual account values and actual expenses. You may use the information in this line, together with the amount you invested, to estimate the expenses that you paid over the period. Simply divide your account value by $1,000.00 (for example, an $8,600 account value divided by $1,000.00 = 8.6), then multiply the result by the number in the first line for a class/Fund under the heading entitled "Expenses Paid During Period" to estimate the expenses you paid on your account during this period. If any fund is a shareholder of any underlying mutual funds or exchange-traded funds (ETFs) (the Underlying Funds), such fund indirectly bears its proportional share of the expenses of the Underlying Funds in addition to the direct expenses incurred presented in the table. These fees and expenses are not included in the annualized expense ratio used to calculate the expense estimate in the table below.
Hypothetical Example for Comparison Purposes
The second line of the accompanying table provides information about hypothetical account values and hypothetical expenses based on the actual expense ratio and an assumed rate of return of 5% per year before expenses, which is not the actual return. The hypothetical account values and expenses may not be used to estimate the actual ending account balance or expenses you paid for the period. You may use this information to compare the ongoing costs of investing in the Fund and other funds. To do so, compare this 5% hypothetical example with the 5% hypothetical examples that appear in the shareholder reports of the other funds. If any fund is a shareholder of any Underlying Funds, such fund indirectly bears its proportional share of the expenses of the Underlying Funds in addition to the direct expenses as presented in the table. These fees and expenses are not included in the annualized expense ratio used to calculate the expense estimate in the table below.
Please note that the expenses shown in the table are meant to highlight your ongoing costs only and do not reflect any transaction costs. Therefore, the second line of the table is useful in comparing ongoing costs only, and will not help you determine the relative total costs of owning different funds. In addition, if these transactional costs were included, your costs would have been higher.
| | | | | Annualized Expense Ratio- A | | Beginning Account Value February 1, 2023 | | Ending Account Value July 31, 2023 | | Expenses Paid During Period- C February 1, 2023 to July 31, 2023 |
| Fidelity Advisor® Real Estate Fund | | | | | | | | | | |
| Class A | | | | 1.10% | | | | | | |
| Actual | | | | | | $ 1,000 | | $ 954.20 | | $ 5.33 |
Hypothetical-B | | | | | | $ 1,000 | | $ 1,019.34 | | $ 5.51 |
| Class M | | | | 1.30% | | | | | | |
| Actual | | | | | | $ 1,000 | | $ 953.20 | | $ 6.30 |
Hypothetical-B | | | | | | $ 1,000 | | $ 1,018.35 | | $ 6.51 |
| Class C | | | | 1.86% | | | | | | |
| Actual | | | | | | $ 1,000 | | $ 950.80 | | $ 9.00 |
Hypothetical-B | | | | | | $ 1,000 | | $ 1,015.57 | | $ 9.30 |
| Class I | | | | .79% | | | | | | |
| Actual | | | | | | $ 1,000 | | $ 955.70 | | $ 3.83 |
Hypothetical-B | | | | | | $ 1,000 | | $ 1,020.88 | | $ 3.96 |
| Class Z | | | | .64% | | | | | | |
| Actual | | | | | | $ 1,000 | | $ 956.20 | | $ 3.10 |
Hypothetical-B | | | | | | $ 1,000 | | $ 1,021.62 | | $ 3.21 |
| |
A Annualized expense ratio reflects expenses net of applicable fee waivers.
B 5% return per year before expenses
C Expenses are equal to the annualized expense ratio, multiplied by the average account value over the period, multiplied by 181/ 365 (to reflect the one-half year period). The fees and expenses of any Underlying Funds are not included in each annualized expense ratio.
The dividend and capital gains distributions for the fund(s) are available on Fidelity.com or Institutional.Fidelity.com.
The fund hereby designates as a capital gain dividend with respect to the taxable year ended July 31, 2023, $3,307,605, or, if subsequently determined to be different, the net capital gain of such year.
Class A, Class C, Class I, Class M and Class Z designates 100% of the dividends distributed in September 2022, December 2022, and June 2023 respectively during the fiscal year as a section 199A dividend.
The fund will notify shareholders in January 2024 of amounts for use in preparing 2023 income tax returns.
Board Approval of Investment Advisory Contracts and Management Fees
Fidelity Advisor Real Estate Fund
Each year, the Board of Trustees, including the Independent Trustees (together, the Board), considers the renewal of the fund's management contract with Fidelity Management & Research Company LLC (FMR) and the sub-advisory agreements (together, the Advisory Contracts) for the fund. FMR and the sub-advisers are referred to herein as the Investment Advisers. The Board, assisted by the advice of fund counsel and Independent Trustees' counsel, requests and considers a broad range of information relevant to the renewal of the Advisory Contracts throughout the year.
The Board meets regularly and, at each of its meetings, covers an extensive agenda of topics and materials and considers factors that are relevant to its annual consideration of the renewal of the fund's Advisory Contracts, including the services and support provided to the fund and its shareholders. The Board, acting directly and through its Committees (each of which is composed of and chaired by Independent Trustees), requests and receives information concerning the annual consideration of the renewal of the fund's Advisory Contracts. The Board also meets as needed to review matters specifically related to the Board's annual consideration of the renewal of the Advisory Contracts. Members of the Board may also meet with trustees of other Fidelity funds through joint ad hoc committees to discuss certain matters relevant to all of the Fidelity funds.
Approval of Stub Period Continuation. At its May 2023 meeting, the Board of Trustees voted to continue the fund's management contract with FMR, and the sub-advisory agreements and sub-sub-advisory agreements, in each case, where applicable (together, the Advisory Contracts), without modification, for two months from June 1, 2023 through July 31, 2023. The Board considered that the approval of the fund's Advisory Contracts will not result in any changes in (i) the investment process or strategies employed in the management of the fund's assets; (ii) the fees and expenses paid by shareholders; (iii) the nature, extent or quality of services provided under the fund's Advisory Contracts; or (iv) the day-to-day management of the fund or the persons primarily responsible for such management. The Board also considered that since its last approval of the fund's Advisory Contracts, FMR had provided additional information on the fund in support of the annual contract renewal process, including competitive analyses on total expenses and management fees and in-depth reviews of fund performance and fund profitability information. The Board concluded that the fund's Advisory Contracts are fair and reasonable, and that the fund's Advisory Contracts should be renewed, without modification, through July 31, 2023, with the understanding that the Board would consider the annual renewal for a full one year period in July 2023.
At its July 2023 meeting, the Board unanimously determined to renew the fund's Advisory Contracts. In reaching its determination, the Board considered all factors it believed relevant, including (i) the nature, extent, and quality of the services provided to the fund and its shareholders (including the investment performance of the fund); (ii) the competitiveness relative to peer funds of the fund's management fee and the total expense ratio of a representative class (Class I, which was selected because it is the largest class without 12b-1 fees); (iii) the total costs of the services provided by and the profits realized by FMR and its affiliates (Fidelity) from its relationships with the fund; and (iv) the extent to which, if any, economies of scale exist and are realized as the fund grows, and whether any economies of scale are appropriately shared with fund shareholders. The Board also considered the broad range of investment choices available to shareholders from FMR's competitors and that the fund's shareholders have chosen to invest in the fund, which is part of the Fidelity family of funds. The Board's decision to renew the Advisory Contracts was not based on any single factor.
The Board reached a determination, with the assistance of fund counsel and Independent Trustees' counsel and through the exercise of its business judgment, that the renewal of the Advisory Contracts was in the best interests of the fund and its shareholders and that the compensation payable under the Advisory Contracts was fair and reasonable in light of all of the surrounding circumstances.
Nature, Extent, and Quality of Services Provided. The Board considered staffing as it relates to the fund, including the backgrounds and experience of investment personnel of the Investment Advisers, and also considered the Investments Advisers' implementation of the fund's investment program. The Independent Trustees also had discussions with senior management of Fidelity's investment operations and investment groups. The Board considered the structure of the investment personnel compensation program and whether this structure provides appropriate incentives to act in the best interests of the fund. Additionally, the Board considered the portfolio managers' investments, if any, in the funds that they manage.
Resources Dedicated to Investment Management and Support Services. The Board and the Fund Oversight and Research Committees reviewed the general qualifications and capabilities of Fidelity's investment staff, including its size, education, experience, and resources, as well as Fidelity's approach to recruiting, training, managing, and compensating investment personnel. The Board noted the resources devoted to expansion of Fidelity's global investment organization, and that Fidelity's analysts have extensive resources, tools and capabilities that allow them to conduct sophisticated quantitative and fundamental analysis, as well as credit analysis of issuers, counterparties and guarantors. Further, the Board considered that Fidelity's investment professionals have sufficient access to global information and data so as to provide competitive investment results over time, and that those professionals also have access to sophisticated tools that permit them to assess portfolio construction and risk and performance attribution characteristics continuously, as well as to transmit new information and research conclusions rapidly around the world. Additionally, in its deliberations, the Board considered Fidelity's trading, risk management, compliance, and technology and operations capabilities and resources, which are integral parts of the investment management process.
Shareholder and Administrative Services. The Board considered (i) the nature, extent, quality, and cost of advisory, administrative, and shareholder services performed by the Investment Advisers and their affiliates under the Advisory Contracts and under separate agreements covering transfer agency, pricing and bookkeeping, and securities lending services for the fund; (ii) the nature and extent of Fidelity's supervision of third party service providers, principally custodians, subcustodians, and pricing vendors; and (iii) the resources devoted by Fidelity to, and the record of compliance with, the fund's compliance policies and procedures. The Board also reviewed the allocation of fund brokerage, including allocations to brokers affiliated with the Investment Advisers, the use of brokerage commissions to pay fund expenses, and the use of "soft" commission dollars to pay for research services. The Board also considered the fund's securities lending activities and any payments made to Fidelity relating to securities lending.
The Board noted that the growth of fund assets over time across the complex allows Fidelity to reinvest in the development of services designed to enhance the value and convenience of the Fidelity funds as investment vehicles. These services include 24-hour access to account information and market information over the Internet and through telephone representatives, investor education materials and asset allocation tools. The Board also considered that it reviews customer service metrics such as telephone response times, continuity of services on the website and metrics addressing services at Fidelity Investor Centers.
Investment in a Large Fund Family. The Board considered the benefits to shareholders of investing in a fund that is part of a large family of funds offering a variety of investment disciplines and providing a large variety of fund investor services. The Board noted that Fidelity had taken, or had made recommendations that resulted in the Fidelity funds taking, a number of actions over the previous year that benefited particular funds and/or the Fidelity funds in general.
Investment Performance. The Board took into account discussions that occur with representatives of the Investment Advisers, and reports that it receives, at Board meetings throughout the year, relating to fund investment performance. In this regard the Board noted that as part of regularly scheduled fund reviews and other reports to the Board on fund performance, the Board considered annualized return information for the fund for different time periods, measured against an appropriate securities market index (benchmark index) and an appropriate peer group of funds with similar objectives (peer group). The Board also considered information about performance attribution. In its ongoing evaluation of fund investment performance, the Board gives particular attention to information indicating changes in performance of the funds over different time periods and discussed with the Investment Advisers the reasons for any overperformance or underperformance.
In addition to reviewing absolute and relative fund performance, the Independent Trustees periodically consider the appropriateness of fund performance metrics in evaluating the results achieved. The Independent Trustees generally give greater weight to fund performance over longer time periods than over shorter time periods. Depending on the circumstances, the Independent Trustees may be satisfied with a fund's performance notwithstanding that it lags its benchmark index or peer group for certain periods.
Based on its review, the Board concluded that the nature, extent, and quality of services provided to the fund under the Advisory Contracts should continue to benefit the shareholders of the fund.
Competitiveness of Management Fee and Total Expense Ratio. The Board was provided with information regarding industry trends in management fees and expenses. In its review of the fund's management fee and the total expense ratio of Class I, the Board considered the fund's management fee rate as well as other fund or class expenses, as applicable, such as transfer agent fees, pricing and bookkeeping fees, fund-paid 12b-1 fees, and custodial, legal, and audit fees. The Board noted that Fidelity may agree to waive fees or reimburse expenses from time to time, and the extent to which, if any, it has done so for the fund.
Comparisons of Management Fees and Total Expense Ratios. Among other things, the Board reviewed data for selected groups of competitive funds and classes (referred to as "mapped groups") that were compiled by Fidelity based on combining similar investment objective categories (as classified by Lipper) that have comparable investment mandates. The data reviewed by the Board included (i) gross management fee comparisons (before taking into account expense reimbursements or caps) relative to the total universe of funds within the mapped group; (ii) gross management fee comparisons relative to a subset of non-Fidelity funds in the mapped group that are similar in size and management fee structure to the fund (referred to as the "asset size peer group"); (iii) total expense comparisons of Class I of the fund relative to funds and classes in the mapped group that have a similar sales load structure to Class I of the fund (referred to as the "similar sales load structure group"); and (iv) total expense comparisons of Class I of the fund relative to funds and classes in the similar sales load structure group that are similar in size and management fee structure to the fund (referred to as the "total expense asset size peer group"). The total expense asset size peer group comparison excludes performance adjustments and fund-paid 12b-1 fees to eliminate variability in fee structures.
The information provided to the Board indicated that the fund's management fee rate ranked below the competitive median of the mapped group for the 12-month period ended September 30, 2022 and below the competitive median of the asset size peer group for the 12-month period ended September 30, 2022. Further, the information provided to the Board indicated that the total expense ratio of Class I of the fund ranked below the competitive median of the similar sales load structure group for the 12-month period ended September 30, 2022 and below the competitive median of the total expense asset size peer group for the 12-month period ended September 30, 2022.
The Board also considered that, for funds subject to the group fee, FMR agreed to voluntarily waive fees over a specified period of time in amounts designed to account for assets converted from certain funds to certain collective investment trusts.
Fees Charged to Other Fidelity Clients. The Board also considered Fidelity fee structures and other information with respect to clients of Fidelity, such as other funds advised or subadvised by Fidelity, pension plan clients, and other institutional clients with similar mandates. The Board noted that a joint ad hoc committee created by it and the boards of other Fidelity funds periodically reviews and compares Fidelity's institutional investment advisory business with its business of providing services to the Fidelity funds and also noted the most recent findings of the committee. The Board noted that the committee's review included a consideration of the differences in services provided, fees charged, and costs incurred, as well as competition in the markets serving the different categories of clients.
Based on its review, the Board concluded that the fund's management fee is fair and reasonable in light of the services that the fund receives and the other factors considered. Further, based on its review of total expense ratios and fees charged to other Fidelity clients, the Board concluded that the total expense ratio of each class of the fund was reasonable in light of the services that the fund and its shareholders receive and the other factors considered.
Costs of the Services and Profitability. The Board considered the revenues earned and the expenses incurred by Fidelity in conducting the business of developing, marketing, distributing, managing, administering and servicing the fund and servicing the fund's shareholders. The Board also considered the level of Fidelity's profits in respect of all the Fidelity funds.
On an annual basis, Fidelity presents to the Board information about the profitability of its relationships with the fund. Fidelity calculates profitability information for each fund, as well as aggregate profitability information for groups of Fidelity funds and all Fidelity funds, using a series of detailed revenue and cost allocation methodologies which originate with the books and records of Fidelity on which Fidelity's audited financial statements are based. The Audit Committee of the Board reviews any significant changes from the prior year's methodologies and the full Board approves such changes.
A public accounting firm has been engaged annually by the Board as part of the Board's assessment of Fidelity's profitability analysis. The engagement includes the review and assessment of the methodologies used by Fidelity in determining the revenues and expenses attributable to Fidelity's fund business, and completion of agreed-upon procedures in respect of the mathematical accuracy of certain fund profitability information and its conformity to established allocation methodologies. After considering the reports issued under the engagement and information provided by Fidelity, the Board concluded that while other allocation methods may also be reasonable, Fidelity's profitability methodologies are reasonable in all material respects.
The Board also reviewed Fidelity's non-fund businesses and potential indirect benefits such businesses may have received as a result of their association with Fidelity's fund business (i.e., fall-out benefits) as well as cases where Fidelity's affiliates may benefit from the funds' business. The Board considered areas where potential indirect benefits to the Fidelity funds from their relationships with Fidelity may exist. The Board's consideration of these matters was informed by the findings of a joint ad hoc committee created by it and the boards of other Fidelity funds to evaluate potential fall-out benefits.
The Board considered the costs of the services provided by and the profits realized by Fidelity in connection with the operation of the fund and was satisfied that the profitability was not excessive.
Economies of Scale. The Board considered whether there have been economies of scale in respect of the management of the Fidelity funds, whether the Fidelity funds (including the fund) have appropriately benefited from any such economies of scale, and whether there is potential for realization of any further economies of scale. The Board considered the extent to which the fund will benefit from economies of scale as assets grow through increased services to the fund, through waivers or reimbursements, or through fee or expense ratio reductions. The Board also noted that a committee (the Economies of Scale Committee) created by it and the boards of other Fidelity funds periodically analyzes whether Fidelity attains economies of scale in respect of the management and servicing of the Fidelity funds, whether the Fidelity funds have appropriately benefited from such economies of scale, and whether there is potential for realization of any further economies of scale.
The Board recognized that the fund's management contract incorporates a "group fee" structure, which provides for lower group fee rates as total "group assets" increase, and for higher group fee rates as total "group assets" decrease ("group assets" as defined in the management contract). FMR calculates the group fee rates based on a tiered asset "breakpoint" schedule that varies based on asset class. The Board considered that the group fee is designed to deliver the benefits of economies of scale to fund shareholders when total Fidelity fund assets increase, even if assets of any particular fund are unchanged or have declined, because some portion of Fidelity's costs are attributable to services provided to all Fidelity funds, and all funds benefit if those costs can be allocated among more assets. The Board further considered that Fidelity agreed to impose a temporary fee waiver in the form of additional breakpoints to the current breakpoint schedule. The Board concluded that, given the group fee structure, fund shareholders will benefit from lower management fees as "group assets" increase at the fund complex level, regardless of whether Fidelity achieves any such economies of scale.
The Board concluded, taking into account the analysis of the Economies of Scale Committee, that economies of scale, if any, are being appropriately shared between fund shareholders and Fidelity.
Additional Information Requested by the Board. In order to develop fully the factual basis for consideration of the Fidelity funds' advisory contracts, the Board requested and received additional information on certain topics, including: (i) fund flow and performance trends, in particular the underperformance of certain funds and strategies, and Fidelity's long-term strategies for certain funds, including any consideration of fund liquidations or mergers; (ii) the operation of performance fees and competitor use of performance fees; (iii) Fidelity's pricing philosophy compared to competitors; (iv) fund profitability methodology and data; (v) evaluation of competitive fund data and peer group classifications and fee and expense comparisons; (vi) the management fee and expense structures for different funds and classes and information about the differences between various fee and expense structures; (vii) group fee breakpoints and related voluntary fee waivers; and (viii) information regarding other accounts managed by Fidelity and the funds' sub-advisory arrangements.
Conclusion. Based on its evaluation of all of the conclusions noted above, and after considering all factors it believed relevant, the Board, including the Independent Trustees, concluded that the advisory and sub-advisory fee arrangements are fair and reasonable in light of all of the surrounding circumstances and that the fund's Advisory Contracts should be renewed through July 31, 2024.
1.789690.120
ARE-ANN-0923
Fidelity Advisor® Global Real Estate Fund
Annual Report
July 31, 2023
Contents
To view a fund's proxy voting guidelines and proxy voting record for the 12-month period ended June 30, visit http://www.fidelity.com/proxyvotingresults or visit the Securities and Exchange Commission's (SEC) web site at http://www.sec.gov.
You may also call 1-877-208-0098 to request a free copy of the proxy voting guidelines.
Standard & Poor's, S&P and S&P 500 are registered service marks of The McGraw-Hill Companies, Inc. and have been licensed for use by Fidelity Distributors Corporation.
Other third-party marks appearing herein are the property of their respective owners.
All other marks appearing herein are registered or unregistered trademarks or service marks of FMR LLC or an affiliated company. © 2023 FMR LLC. All rights reserved.
This report and the financial statements contained herein are submitted for the general information of the shareholders of the Fund. This report is not authorized for distribution to prospective investors in the Fund unless preceded or accompanied by an effective prospectus.
A fund files its complete schedule of portfolio holdings with the SEC for the first and third quarters of each fiscal year on Form N-PORT. Forms N-PORT are available on the SEC's web site at http://www.sec.gov. A fund's Forms N-PORT may be reviewed and copied at the SEC's Public Reference Room in Washington, DC. Information regarding the operation of the SEC's Public Reference Room may be obtained by calling 1-800-SEC-0330.
For a complete list of a fund's portfolio holdings, view the most recent holdings listing, semiannual report, or annual report on Fidelity's web site at http://www.fidelity.com, http://www.institutional.fidelity.com, or http://www.401k.com, as applicable.
NOT FDIC INSURED •MAY LOSE VALUE •NO BANK GUARANTEE
Neither the Fund nor Fidelity Distributors Corporation is a bank.
Average annual total return reflects the change in the value of an investment, assuming reinvestment of distributions from dividend income and capital gains (the profits earned upon the sale of securities that have grown in value, if any) and assuming a constant rate of performance each year. The hypothetical investment and the average annual total returns do not reflect the deduction of taxes that a shareholder would pay on fund distributions or the redemption of fund shares. During periods of reimbursement by Fidelity, a fund's total return will be greater than it would be had the reimbursement not occurred. How a fund did yesterday is no guarantee of how it will do tomorrow.
| Average Annual Total Returns |
| | | | |
Periods ended July 31, 2023 | Past 1 year | Past 5 years | Life of Fund A |
Class A (incl.5.75% sales charge) | -13.11% | 1.20% | 1.58% |
Class M (incl.3.50% sales charge) | -11.30% | 1.44% | 1.68% |
Class C (incl. contingent deferred sales charge) | -9.44% | 1.66% | 1.69% |
| Class I | -7.61% | 2.65% | 2.70% |
| Class Z | -7.48% | 2.81% | 2.81% |
A From August 11, 2016
Class C shares' contingent deferred sales charges included in the past one year, past five years and life of fund total return figures are 1%, 0% and 0%, respectively.
The initial offering of Class Z shares took place on October 2, 2018. Returns prior to October 2, 2018, are those of Class I.
| $10,000 Over Life of Fund |
| |
Let's say hypothetically that $10,000 was invested in Fidelity Advisor® Global Real Estate Fund - Class A, a class of the fund, on August 11, 2016, when the fund started, and the current 5.75% sales charge was paid. The chart shows how the value of your investment would have changed, and also shows how the FTSE EPRA/NAREIT Developed Index performed over the same period. |
|
|
Market Recap:
For the 12 months ending July 31, 2023, continued global economic expansion, falling commodity prices and a slowing in the pace of inflation provided a favorable backdrop for risk assets. The U.S. Federal Reserve and other central banks aggressively tightened monetary policy throughout the period to combat persistently high inflation, leading to a broad retreat from riskier assets and declining prices for stocks and bonds through September 2022. Since then, markets experienced a sharp reversal amid optimism driven by moderating inflation and policy easing, allowing risk assets to rally through the first seven months of 2023. In this environment, global real estate stocks returned -7.32%, per the FTSE® EPRASM/NAREIT® Developed Index. The supply/demand backdrop for commercial real estate remained generally solid. However, significantly higher interest rates challenged the asset class by raising the cost of investment capital for real estate companies - a headwind for this capital-intensive category. In this environment, the U.S., which made up 62% of the index, on average, returned -6%. Japan, the index's second-largest allocation, returned -7%. The U.K. (-16%), the third-largest index weight and a market that features multiple companies with weaker balance sheets, struggled.
Comments from Portfolio Manager Steve Buller:
For the fiscal year, the fund's share classes (excluding sales charges, if applicable) returned about -9% to -7%, versus -7.32% for the benchmark FTSE EPRA/NAREIT Developed Index (Gross). From a regional standpoint, stock selection in Canada and the United States contributed to the fund's performance versus the benchmark. By industry, market selection was the primary contributor, especially an underweight in office REITs. Stock picking in multi-family residential REITs also boosted the fund's relative result. Also contributing was an overweight in data center REITs. The top individual relative contributor was an overweight in Boardwalk REIT Unit (+31%). A second notable relative contributor was an overweight in Dream Industrial REIT (+14%), which was among the biggest holdings at period end. An overweight in Equinix (+17%) also helped. Equinix was one of our largest holdings. In contrast, from a regional standpoint, stock picks in Japan, France and Australia detracted from the fund's relative result. By industry, the primary detractor from performance versus the benchmark was stock selection in telecom tower REITs. Also hurting our result was security selection in diversified real estate activities and stock picking in real estate operating companies. The fund's non-benchmark stake in Crown Castle returned about -37% and was the biggest individual relative detractor. A second notable relative detractor this period was avoiding Simon Property Group, a benchmark component that gained 22%. Lastly, an overweight in Vonovia (-28%) also detracted.
The views expressed above reflect those of the portfolio manager(s) only through the end of the period as stated on the cover of this report and do not necessarily represent the views of Fidelity or any other person in the Fidelity organization. Any such views are subject to change at any time based upon market or other conditions and Fidelity disclaims any responsibility to update such views. These views may not be relied on as investment advice and, because investment decisions for a Fidelity fund are based on numerous factors, may not be relied on as an indication of trading intent on behalf of any Fidelity fund.
Top Holdings (% of Fund's net assets) |
| |
| Prologis (REIT), Inc. | 8.6 | |
| Equinix, Inc. | 5.7 | |
| Ventas, Inc. | 3.8 | |
| Welltower, Inc. | 3.3 | |
| UDR, Inc. | 3.1 | |
| Digital Realty Trust, Inc. | 2.9 | |
| Mid-America Apartment Communities, Inc. | 2.7 | |
| Mitsubishi Estate Co. Ltd. | 2.4 | |
| Grainger Trust PLC | 2.3 | |
| Dream Industrial (REIT) | 2.2 | |
| | 37.0 | |
| |
| Top REIT Sectors (% of Fund's net assets) |
| |
| REITs - Diversified | 19.3 | |
| REITs - Apartments | 14.6 | |
| REITs - Shopping Centers | 11.8 | |
| REITs - Warehouse/Industrial | 10.1 | |
| REITs - Health Care | 8.2 | |
| |
Asset Allocation (% of Fund's net assets) |
|
|
Geographic Diversification (% of Fund's net assets) |
|
* Includes Short-Term investments and Net Other Assets (Liabilities). Percentages are adjusted for the effect of derivatives, if applicable. |
| |
Showing Percentage of Net Assets
| Common Stocks - 97.9% |
| | | Shares | Value ($) |
| Australia - 4.5% | | | |
| Arena (REIT) unit | | 24,902 | 63,561 |
| Charter Hall Retail REIT | | 25,386 | 63,944 |
| National Storage REIT unit | | 32,073 | 49,981 |
| Scentre Group unit | | 30,726 | 57,995 |
TOTAL AUSTRALIA | | | 235,481 |
| Canada - 4.1% | | | |
| Boardwalk (REIT) | | 1,990 | 98,862 |
| Dream Industrial (REIT) | | 10,917 | 117,478 |
TOTAL CANADA | | | 216,340 |
| France - 2.0% | | | |
| ARGAN SA | | 684 | 51,666 |
| Covivio | | 1,049 | 50,679 |
TOTAL FRANCE | | | 102,345 |
| Germany - 1.3% | | | |
| Vonovia SE | | 2,912 | 67,850 |
| Hong Kong - 1.1% | | | |
| Hysan Development Co. Ltd. | | 10,262 | 24,211 |
| Link (REIT) | | 6,473 | 36,229 |
TOTAL HONG KONG | | | 60,440 |
| Ireland - 0.5% | | | |
| Dalata Hotel Group PLC (a) | | 5,244 | 24,533 |
| Japan - 8.0% | | | |
| Advance Residence Investment Corp. | | 16 | 38,970 |
| GLP J-REIT | | 15 | 14,772 |
| LaSalle Logiport REIT | | 64 | 68,424 |
| Mitsubishi Estate Co. Ltd. | | 10,330 | 126,601 |
| Mitsui Fudosan Co. Ltd. | | 5,310 | 108,932 |
| Mitsui Fudosan Logistics Park, Inc. | | 17 | 60,465 |
TOTAL JAPAN | | | 418,164 |
| Singapore - 4.8% | | | |
| CapitaMall Trust | | 66,860 | 102,571 |
| CDL Hospitality Trusts unit | | 23,257 | 20,813 |
| Mapletree Pan Asia Commercial Trust | | 12,343 | 15,316 |
| UOL Group Ltd. | | 20,892 | 110,450 |
TOTAL SINGAPORE | | | 249,150 |
| Spain - 1.4% | | | |
| Lar Espana Real Estate Socimi SA | | 2,793 | 18,088 |
| Merlin Properties Socimi SA | | 5,884 | 54,796 |
TOTAL SPAIN | | | 72,884 |
| Sweden - 1.1% | | | |
| Catena AB | | 1,497 | 57,483 |
| United Kingdom - 6.7% | | | |
| Assura PLC | | 92,966 | 56,504 |
| Grainger Trust PLC | | 37,045 | 119,710 |
| Helical PLC | | 4,931 | 17,023 |
| Segro PLC | | 5,697 | 55,785 |
| Shaftesbury Capital PLC | | 27,573 | 42,392 |
| Unite Group PLC | | 4,893 | 61,130 |
TOTAL UNITED KINGDOM | | | 352,544 |
| United States of America - 62.4% | | | |
| American Homes 4 Rent Class A | | 2,407 | 90,214 |
| Apartment Income (REIT) Corp. | | 1,896 | 65,488 |
| Crown Castle International Corp. | | 891 | 96,486 |
| CubeSmart | | 2,422 | 105,018 |
| DiamondRock Hospitality Co. | | 7,016 | 59,636 |
| Digital Realty Trust, Inc. | | 1,202 | 149,793 |
| Elme Communities (SBI) | | 605 | 9,831 |
| Equinix, Inc. | | 369 | 298,860 |
| Equity Lifestyle Properties, Inc. | | 765 | 54,453 |
| Equity Residential (SBI) | | 1,382 | 91,129 |
| Extra Space Storage, Inc. | | 465 | 64,900 |
| Flagship Communities (REIT) | | 4,121 | 66,966 |
| Gaming & Leisure Properties | | 1,018 | 48,314 |
| Host Hotels & Resorts, Inc. | | 5,019 | 92,350 |
| Invitation Homes, Inc. | | 2,395 | 85,023 |
| Kimco Realty Corp. | | 5,279 | 106,953 |
| Mid-America Apartment Communities, Inc. | | 945 | 141,429 |
| NNN (REIT), Inc. | | 2,566 | 109,517 |
| Phillips Edison & Co., Inc. | | 1,661 | 58,650 |
| Prologis (REIT), Inc. | | 3,627 | 452,471 |
| Regency Centers Corp. | | 1,596 | 104,586 |
| RLJ Lodging Trust | | 2,332 | 24,020 |
| Ryman Hospitality Properties, Inc. | | 472 | 44,977 |
| SITE Centers Corp. | | 2,249 | 31,598 |
| Spirit Realty Capital, Inc. | | 2,188 | 88,242 |
| Sun Communities, Inc. | | 868 | 113,100 |
| Tanger Factory Outlet Centers, Inc. | | 628 | 14,701 |
| Terreno Realty Corp. | | 442 | 26,228 |
| UDR, Inc. | | 3,953 | 161,599 |
| Urban Edge Properties | | 2,332 | 39,667 |
| Ventas, Inc. | | 4,097 | 198,786 |
| Welltower, Inc. | | 2,127 | 174,733 |
TOTAL UNITED STATES OF AMERICA | | | 3,269,718 |
| TOTAL COMMON STOCKS (Cost $4,482,550) | | | 5,126,932 |
| | | | |
| Money Market Funds - 2.4% |
| | | Shares | Value ($) |
Fidelity Cash Central Fund 5.32% (b) (Cost $128,414) | | 128,388 | 128,414 |
| | | | |
| TOTAL INVESTMENT IN SECURITIES - 100.3% (Cost $4,610,964) | 5,255,346 |
NET OTHER ASSETS (LIABILITIES) - (0.3)% | (17,638) |
| NET ASSETS - 100.0% | 5,237,708 |
| | |
Legend
| (b) | Affiliated fund that is generally available only to investment companies and other accounts managed by Fidelity Investments. The rate quoted is the annualized seven-day yield of the fund at period end. A complete unaudited listing of the fund's holdings as of its most recent quarter end is available upon request. In addition, each Fidelity Central Fund's financial statements, which are not covered by the Fund's Report of Independent Registered Public Accounting Firm, are available on the SEC's website or upon request. |
Affiliated Central Funds
Fiscal year to date information regarding the Fund's investments in Fidelity Central Funds, including the ownership percentage, is presented below.
| Affiliate | Value, beginning of period ($) | Purchases ($) | Sales Proceeds ($) | Dividend Income ($) | Realized Gain (loss) ($) | Change in Unrealized appreciation (depreciation) ($) | Value, end of period ($) | % ownership, end of period |
| Fidelity Cash Central Fund 5.32% | 80,792 | 4,349,980 | 4,302,358 | 3,957 | - | - | 128,414 | 0.0% |
| Total | 80,792 | 4,349,980 | 4,302,358 | 3,957 | - | - | 128,414 | |
| | | | | | | | | |
Amounts in the dividend income column in the above table include any capital gain distributions from underlying funds, which are presented in the corresponding line item in the Statement of Operations, if applicable.
Amounts included in the purchases and sales proceeds columns may include in-kind transactions, if applicable.
Investment Valuation
The following is a summary of the inputs used, as of July 31, 2023, involving the Fund's assets and liabilities carried at fair value. The inputs or methodology used for valuing securities may not be an indication of the risk associated with investing in those securities. For more information on valuation inputs, and their aggregation into the levels used below, please refer to the Investment Valuation section in the accompanying Notes to Financial Statements.
| Valuation Inputs at Reporting Date: |
| Description | Total ($) | Level 1 ($) | Level 2 ($) | Level 3 ($) |
Investments in Securities: | | | | |
|
| Equities: | | | | |
Consumer Discretionary | 24,533 | 24,533 | - | - |
Real Estate | 5,102,399 | 4,907,948 | 194,451 | - |
|
| Money Market Funds | 128,414 | 128,414 | - | - |
| Total Investments in Securities: | 5,255,346 | 5,060,895 | 194,451 | - |
| Statement of Assets and Liabilities |
| | | | July 31, 2023 |
| | | | | |
| Assets | | | | |
| Investment in securities, at value - See accompanying schedule: | | | | |
Unaffiliated issuers (cost $4,482,550) | $ | 5,126,932 | | |
Fidelity Central Funds (cost $128,414) | | 128,414 | | |
| | | | | |
| | | | | |
| Total Investment in Securities (cost $4,610,964) | | | $ | 5,255,346 |
| Foreign currency held at value (cost $836) | | | | 836 |
| Receivable for investments sold | | | | 5,108 |
| Receivable for fund shares sold | | | | 13,463 |
| Dividends receivable | | | | 11,037 |
| Distributions receivable from Fidelity Central Funds | | | | 636 |
| Prepaid expenses | | | | 15 |
| Receivable from investment adviser for expense reductions | | | | 35,871 |
| Other receivables | | | | 573 |
Total assets | | | | 5,322,885 |
| Liabilities | | | | |
| Payable for investments purchased | $ | 28,909 | | |
| Accrued management fee | | 2,889 | | |
| Distribution and service plan fees payable | | 1,118 | | |
| Other affiliated payables | | 1,022 | | |
| Audit fee payable | | 48,108 | | |
| Other payables and accrued expenses | | 3,131 | | |
| Total Liabilities | | | | 85,177 |
| Net Assets | | | $ | 5,237,708 |
| Net Assets consist of: | | | | |
| Paid in capital | | | $ | 5,429,830 |
| Total accumulated earnings (loss) | | | | (192,122) |
| Net Assets | | | $ | 5,237,708 |
| | | | | |
| Net Asset Value and Maximum Offering Price | | | | |
| Class A : | | | | |
Net Asset Value and redemption price per share ($2,771,350 ÷ 271,357 shares)(a) | | | $ | 10.21 |
| Maximum offering price per share (100/94.25 of $10.21) | | | $ | 10.83 |
| Class M : | | | | |
Net Asset Value and redemption price per share ($917,957 ÷ 90,096 shares)(a) | | | $ | 10.19 |
| Maximum offering price per share (100/96.50 of $10.19) | | | $ | 10.56 |
| Class C : | | | | |
Net Asset Value and offering price per share ($192,535 ÷ 18,858 shares)(a) | | | $ | 10.21 |
| Class I : | | | | |
Net Asset Value, offering price and redemption price per share ($1,162,168 ÷ 113,554 shares) | | | $ | 10.23 |
| Class Z : | | | | |
Net Asset Value, offering price and redemption price per share ($193,698 ÷ 18,789 shares) | | | $ | 10.31 |
(a)Redemption price per share is equal to net asset value less any applicable contingent deferred sales charge. |
| Statement of Operations |
| | | | Year ended July 31, 2023 |
| Investment Income | | | | |
| Dividends | | | $ | 202,565 |
| Income from Fidelity Central Funds | | | | 3,957 |
| Income before foreign taxes withheld | | | $ | 206,522 |
| Less foreign taxes withheld | | | | (6,712) |
| Total Income | | | | 199,810 |
| Expenses | | | | |
| Management fee | $ | 38,625 | | |
| Transfer agent fees | | 11,848 | | |
| Distribution and service plan fees | | 13,169 | | |
| Accounting fees and expenses | | 2,023 | | |
| Custodian fees and expenses | | 20,419 | | |
| Independent trustees' fees and expenses | | 31 | | |
| Registration fees | | 66,403 | | |
| Audit | | 60,228 | | |
| Legal | | 6 | | |
| Miscellaneous | | 125 | | |
| Total expenses before reductions | | 212,877 | | |
| Expense reductions | | (146,550) | | |
| Total expenses after reductions | | | | 66,327 |
| Net Investment income (loss) | | | | 133,483 |
| Realized and Unrealized Gain (Loss) | | | | |
| Net realized gain (loss) on: | | | | |
| Investment Securities: | | | | |
| Unaffiliated issuers | | (687,933) | | |
| Foreign currency transactions | | (2,037) | | |
| Total net realized gain (loss) | | | | (689,970) |
| Change in net unrealized appreciation (depreciation) on: | | | | |
| Investment Securities: | | | | |
| Unaffiliated issuers | | (11,283) | | |
| Assets and liabilities in foreign currencies | | (47) | | |
| Total change in net unrealized appreciation (depreciation) | | | | (11,330) |
| Net gain (loss) | | | | (701,300) |
| Net increase (decrease) in net assets resulting from operations | | | $ | (567,817) |
| Statement of Changes in Net Assets |
| |
| | Year ended July 31, 2023 | | Year ended July 31, 2022 |
| Increase (Decrease) in Net Assets | | | | |
| Operations | | | | |
| Net investment income (loss) | $ | 133,483 | $ | 113,743 |
| Net realized gain (loss) | | (689,970) | | (60,440) |
| Change in net unrealized appreciation (depreciation) | | (11,330) | | (838,298) |
| Net increase (decrease) in net assets resulting from operations | | (567,817) | | (784,995) |
| Distributions to shareholders | | (76,041) | | (92,097) |
| | | | | |
| Share transactions - net increase (decrease) | | (1,482,271) | | 1,732,182 |
| Total increase (decrease) in net assets | | (2,126,129) | | 855,090 |
| | | | | |
| Net Assets | | | | |
| Beginning of period | | 7,363,837 | | 6,508,747 |
| End of period | $ | 5,237,708 | $ | 7,363,837 |
| | | | | |
| | | | | |
| Fidelity Advisor® Global Real Estate Fund Class A |
| |
| Years ended July 31, | | 2023 | | 2022 | | 2021 | | 2020 | | 2019 |
Selected Per-Share Data | | | | | | | | | | |
| Net asset value, beginning of period | $ | 11.18 | $ | 12.49 | $ | 9.69 | $ | 10.72 | $ | 10.13 |
| Income from Investment Operations | | | | | | | | | | |
Net investment income (loss) A,B | | .23 | | .17 | | .17 | | .15 | | .22 |
| Net realized and unrealized gain (loss) | | (1.11) | | (1.33) | | 2.76 | | (.58) | | .58 |
| Total from investment operations | | (.88) | | (1.16) | | 2.93 | | (.43) | | .80 |
| Distributions from net investment income | | (.09) | | (.15) | | (.13) | | (.23) | | (.15) |
| Distributions from net realized gain | | - | | - | | - | | (.37) | | (.06) |
| Total distributions | | (.09) | | (.15) | | (.13) | | (.60) | | (.21) |
| Net asset value, end of period | $ | 10.21 | $ | 11.18 | $ | 12.49 | $ | 9.69 | $ | 10.72 |
Total Return C,D | | (7.81)% | | (9.40)% | | 30.59% | | (4.61)% | | 8.25% |
Ratios to Average Net Assets B,E,F | | | | | | | | | | |
| Expenses before reductions | | 3.85% | | 3.19% | | 4.19% | | 4.22% | | 4.56% |
| Expenses net of fee waivers, if any | | 1.20% | | 1.28% | | 1.38% | | 1.40% | | 1.40% |
| Expenses net of all reductions | | 1.19% | | 1.28% | | 1.37% | | 1.39% | | 1.39% |
| Net investment income (loss) | | 2.31% | | 1.45% | | 1.60% | | 1.47% | | 2.09% |
| Supplemental Data | | | | | | | | | | |
| Net assets, end of period (000 omitted) | $ | 2,771 | $ | 3,021 | $ | 2,747 | $ | 1,732 | $ | 3,290 |
Portfolio turnover rate G | | 84% | | 33% | | 32% | | 52% | | 60% |
ACalculated based on average shares outstanding during the period.
BNet investment income (loss) is affected by the timing of the declaration of dividends by any underlying mutual funds or exchange-traded funds (ETFs). Net investment income (loss) of any mutual funds or ETFs is not included in the Fund's net investment income (loss) ratio.
CTotal returns would have been lower if certain expenses had not been reduced during the applicable periods shown.
DTotal returns do not include the effect of the sales charges.
EFees and expenses of any underlying mutual funds or exchange-traded funds (ETFs) are not included in the Fund's expense ratio. The Fund indirectly bears its proportionate share of these expenses. For additional expense information related to investments in Fidelity Central Funds, please refer to the "Investments in Fidelity Central Funds" note found in the Notes to Financial Statements section of the most recent Annual or Semi-Annual report.
FExpense ratios reflect operating expenses of the class. Expenses before reductions do not reflect amounts reimbursed, waived, or reduced through arrangements with the investment adviser, brokerage services, or other offset arrangements, if applicable, and do not represent the amount paid by the class during periods when reimbursements, waivers or reductions occur.
GAmount does not include the portfolio activity of any underlying mutual funds or exchange-traded funds (ETFs).
| Fidelity Advisor® Global Real Estate Fund Class M |
| |
| Years ended July 31, | | 2023 | | 2022 | | 2021 | | 2020 | | 2019 |
Selected Per-Share Data | | | | | | | | | | |
| Net asset value, beginning of period | $ | 11.16 | $ | 12.46 | $ | 9.67 | $ | 10.71 | $ | 10.11 |
| Income from Investment Operations | | | | | | | | | | |
Net investment income (loss) A,B | | .20 | | .14 | | .14 | | .12 | | .19 |
| Net realized and unrealized gain (loss) | | (1.11) | | (1.31) | | 2.76 | | (.58) | | .60 |
| Total from investment operations | | (.91) | | (1.17) | | 2.90 | | (.46) | | .79 |
| Distributions from net investment income | | (.06) | | (.13) | | (.11) | | (.21) | | (.13) |
| Distributions from net realized gain | | - | | - | | - | | (.37) | | (.06) |
| Total distributions | | (.06) | | (.13) | | (.11) | | (.58) | | (.19) |
| Net asset value, end of period | $ | 10.19 | $ | 11.16 | $ | 12.46 | $ | 9.67 | $ | 10.71 |
Total Return C,D | | (8.09)% | | (9.51)% | | 30.20% | | (4.87)% | | 8.06% |
Ratios to Average Net Assets B,E,F | | | | | | | | | | |
| Expenses before reductions | | 4.03% | | 3.39% | | 4.41% | | 4.46% | | 4.79% |
| Expenses net of fee waivers, if any | | 1.45% | | 1.52% | | 1.63% | | 1.66% | | 1.65% |
| Expenses net of all reductions | | 1.45% | | 1.52% | | 1.62% | | 1.64% | | 1.64% |
| Net investment income (loss) | | 2.05% | | 1.21% | | 1.35% | | 1.22% | | 1.84% |
| Supplemental Data | | | | | | | | | | |
| Net assets, end of period (000 omitted) | $ | 918 | $ | 1,070 | $ | 876 | $ | 658 | $ | 810 |
Portfolio turnover rate G | | 84% | | 33% | | 32% | | 52% | | 60% |
ACalculated based on average shares outstanding during the period.
BNet investment income (loss) is affected by the timing of the declaration of dividends by any underlying mutual funds or exchange-traded funds (ETFs). Net investment income (loss) of any mutual funds or ETFs is not included in the Fund's net investment income (loss) ratio.
CTotal returns would have been lower if certain expenses had not been reduced during the applicable periods shown.
DTotal returns do not include the effect of the sales charges.
EFees and expenses of any underlying mutual funds or exchange-traded funds (ETFs) are not included in the Fund's expense ratio. The Fund indirectly bears its proportionate share of these expenses. For additional expense information related to investments in Fidelity Central Funds, please refer to the "Investments in Fidelity Central Funds" note found in the Notes to Financial Statements section of the most recent Annual or Semi-Annual report.
FExpense ratios reflect operating expenses of the class. Expenses before reductions do not reflect amounts reimbursed, waived, or reduced through arrangements with the investment adviser, brokerage services, or other offset arrangements, if applicable, and do not represent the amount paid by the class during periods when reimbursements, waivers or reductions occur.
GAmount does not include the portfolio activity of any underlying mutual funds or exchange-traded funds (ETFs).
| Fidelity Advisor® Global Real Estate Fund Class C |
| |
| Years ended July 31, | | 2023 | | 2022 | | 2021 | | 2020 | | 2019 |
Selected Per-Share Data | | | | | | | | | | |
| Net asset value, beginning of period | $ | 11.17 | $ | 12.47 | $ | 9.63 | $ | 10.63 | $ | 10.08 |
| Income from Investment Operations | | | | | | | | | | |
Net investment income (loss) A,B | | .16 | | .09 | | .09 | | .07 | | .14 |
| Net realized and unrealized gain (loss) | | (1.11) | | (1.33) | | 2.75 | | (.58) | | .59 |
| Total from investment operations | | (.95) | | (1.24) | | 2.84 | | (.51) | | .73 |
| Distributions from net investment income | | (.01) | | (.06) | | - | | (.12) | | (.12) |
| Distributions from net realized gain | | - | | - | | - | | (.37) | | (.06) |
| Total distributions | | (.01) | | (.06) | | - | | (.49) | | (.18) |
| Net asset value, end of period | $ | 10.21 | $ | 11.17 | $ | 12.47 | $ | 9.63 | $ | 10.63 |
Total Return C,D | | (8.53)% | | (9.97)% | | 29.49% | | (5.31)% | | 7.52% |
Ratios to Average Net Assets B,E,F | | | | | | | | | | |
| Expenses before reductions | | 4.59% | | 3.93% | | 5.02% | | 4.46% | | 5.04% |
| Expenses net of fee waivers, if any | | 1.94% | | 2.02% | | 2.14% | | 2.16% | | 2.15% |
| Expenses net of all reductions | | 1.93% | | 2.02% | | 2.13% | | 2.15% | | 2.14% |
| Net investment income (loss) | | 1.57% | | .72% | | .85% | | .71% | | 1.34% |
| Supplemental Data | | | | | | | | | | |
| Net assets, end of period (000 omitted) | $ | 193 | $ | 203 | $ | 223 | $ | 185 | $ | 1,060 |
Portfolio turnover rate G | | 84% | | 33% | | 32% | | 52% | | 60% |
ACalculated based on average shares outstanding during the period.
BNet investment income (loss) is affected by the timing of the declaration of dividends by any underlying mutual funds or exchange-traded funds (ETFs). Net investment income (loss) of any mutual funds or ETFs is not included in the Fund's net investment income (loss) ratio.
CTotal returns would have been lower if certain expenses had not been reduced during the applicable periods shown.
DTotal returns do not include the effect of the contingent deferred sales charge.
EFees and expenses of any underlying mutual funds or exchange-traded funds (ETFs) are not included in the Fund's expense ratio. The Fund indirectly bears its proportionate share of these expenses. For additional expense information related to investments in Fidelity Central Funds, please refer to the "Investments in Fidelity Central Funds" note found in the Notes to Financial Statements section of the most recent Annual or Semi-Annual report.
FExpense ratios reflect operating expenses of the class. Expenses before reductions do not reflect amounts reimbursed, waived, or reduced through arrangements with the investment adviser, brokerage services, or other offset arrangements, if applicable, and do not represent the amount paid by the class during periods when reimbursements, waivers or reductions occur.
GAmount does not include the portfolio activity of any underlying mutual funds or exchange-traded funds (ETFs).
| Fidelity Advisor® Global Real Estate Fund Class I |
| |
| Years ended July 31, | | 2023 | | 2022 | | 2021 | | 2020 | | 2019 |
Selected Per-Share Data | | | | | | | | | | |
| Net asset value, beginning of period | $ | 11.21 | $ | 12.51 | $ | 9.71 | $ | 10.75 | $ | 10.15 |
| Income from Investment Operations | | | | | | | | | | |
Net investment income (loss) A,B | | .25 | | .20 | | .20 | | .17 | | .24 |
| Net realized and unrealized gain (loss) | | (1.11) | | (1.32) | | 2.76 | | (.58) | | .59 |
| Total from investment operations | | (.86) | | (1.12) | | 2.96 | | (.41) | | .83 |
| Distributions from net investment income | | (.12) | | (.18) | | (.16) | | (.26) | | (.17) |
| Distributions from net realized gain | | - | | - | | - | | (.37) | | (.06) |
| Total distributions | | (.12) | | (.18) | | (.16) | | (.63) | | (.23) |
| Net asset value, end of period | $ | 10.23 | $ | 11.21 | $ | 12.51 | $ | 9.71 | $ | 10.75 |
Total Return C | | (7.61)% | | (9.12)% | | 30.82% | | (4.40)% | | 8.55% |
Ratios to Average Net Assets B,D,E | | | | | | | | | | |
| Expenses before reductions | | 3.31% | | 2.94% | | 3.81% | | 3.97% | | 4.20% |
| Expenses net of fee waivers, if any | | .95% | | 1.02% | | 1.13% | | 1.16% | | 1.15% |
| Expenses net of all reductions | | .95% | | 1.02% | | 1.12% | | 1.14% | | 1.14% |
| Net investment income (loss) | | 2.55% | | 1.71% | | 1.85% | | 1.71% | | 2.34% |
| Supplemental Data | | | | | | | | | | |
| Net assets, end of period (000 omitted) | $ | 1,162 | $ | 1,766 | $ | 1,483 | $ | 1,066 | $ | 1,056 |
Portfolio turnover rate F | | 84% | | 33% | | 32% | | 52% | | 60% |
ACalculated based on average shares outstanding during the period.
BNet investment income (loss) is affected by the timing of the declaration of dividends by any underlying mutual funds or exchange-traded funds (ETFs). Net investment income (loss) of any mutual funds or ETFs is not included in the Fund's net investment income (loss) ratio.
CTotal returns would have been lower if certain expenses had not been reduced during the applicable periods shown.
DFees and expenses of any underlying mutual funds or exchange-traded funds (ETFs) are not included in the Fund's expense ratio. The Fund indirectly bears its proportionate share of these expenses. For additional expense information related to investments in Fidelity Central Funds, please refer to the "Investments in Fidelity Central Funds" note found in the Notes to Financial Statements section of the most recent Annual or Semi-Annual report.
EExpense ratios reflect operating expenses of the class. Expenses before reductions do not reflect amounts reimbursed, waived, or reduced through arrangements with the investment adviser, brokerage services, or other offset arrangements, if applicable, and do not represent the amount paid by the class during periods when reimbursements, waivers or reductions occur.
FAmount does not include the portfolio activity of any underlying mutual funds or exchange-traded funds (ETFs).
| Fidelity Advisor® Global Real Estate Fund Class Z |
| |
| Years ended July 31, | | 2023 | | 2022 | | 2021 | | 2020 | | 2019 A |
Selected Per-Share Data | | | | | | | | | | |
| Net asset value, beginning of period | $ | 11.28 | $ | 12.56 | $ | 9.73 | $ | 10.76 | $ | 10.01 |
| Income from Investment Operations | | | | | | | | | | |
Net investment income (loss) B,C | | .28 | | .22 | | .22 | | .19 | | .22 |
| Net realized and unrealized gain (loss) | | (1.13) | | (1.32) | | 2.77 | | (.59) | | .76 |
| Total from investment operations | | (.85) | | (1.10) | | 2.99 | | (.40) | | .98 |
| Distributions from net investment income | | (.12) | | (.18) | | (.16) | | (.26) | | (.17) |
| Distributions from net realized gain | | - | | - | | - | | (.37) | | (.06) |
| Total distributions | | (.12) | | (.18) | | (.16) | | (.63) | | (.23) |
| Net asset value, end of period | $ | 10.31 | $ | 11.28 | $ | 12.56 | $ | 9.73 | $ | 10.76 |
Total Return D,E | | (7.48)% | | (8.93)% | | 31.07% | | (4.29)% | | 10.17% |
Ratios to Average Net Assets C,F,G | | | | | | | | | | |
| Expenses before reductions | | 3.38% | | 2.71% | | 3.72% | | 3.54% | | 3.87% H |
| Expenses net of fee waivers, if any | | .80% | | .89% | | .97% | | 1.02% | | 1.00% H |
| Expenses net of all reductions | | .80% | | .89% | | .96% | | 1.00% | | 1.00% H |
| Net investment income (loss) | | 2.70% | | 1.84% | | 2.01% | | 1.86% | | 2.50% H |
| Supplemental Data | | | | | | | | | | |
| Net assets, end of period (000 omitted) | $ | 194 | $ | 1,303 | $ | 1,180 | $ | 233 | $ | 306 |
Portfolio turnover rate I | | 84% | | 33% | | 32% | | 52% | | 60% |
AFor the period October 2, 2018 (commencement of sale of shares) through July 31, 2019.
BCalculated based on average shares outstanding during the period.
CNet investment income (loss) is affected by the timing of the declaration of dividends by any underlying mutual funds or exchange-traded funds (ETFs). Net investment income (loss) of any mutual funds or ETFs is not included in the Fund's net investment income (loss) ratio.
DTotal returns for periods of less than one year are not annualized.
ETotal returns would have been lower if certain expenses had not been reduced during the applicable periods shown.
FFees and expenses of any underlying mutual funds or exchange-traded funds (ETFs) are not included in the Fund's expense ratio. The Fund indirectly bears its proportionate share of these expenses. For additional expense information related to investments in Fidelity Central Funds, please refer to the "Investments in Fidelity Central Funds" note found in the Notes to Financial Statements section of the most recent Annual or Semi-Annual report.
GExpense ratios reflect operating expenses of the class. Expenses before reductions do not reflect amounts reimbursed, waived, or reduced through arrangements with the investment adviser, brokerage services, or other offset arrangements, if applicable, and do not represent the amount paid by the class during periods when reimbursements, waivers or reductions occur.
HAnnualized.
IAmount does not include the portfolio activity of any underlying mutual funds or exchange-traded funds (ETFs).
For the period ended July 31, 2023
1. Organization.
Fidelity Advisor Global Real Estate Fund (the Fund) is a fund of Fidelity Advisor Series VII (the Trust) and is authorized to issue an unlimited number of shares. The Trust is registered under the Investment Company Act of 1940, as amended (the 1940 Act), as an open-end management investment company organized as a Massachusetts business trust. The Fund offers Class A, Class M, Class C, Class I and Class Z shares, each of which has equal rights as to assets and voting privileges. Class A, Class M, Class C, Class I and Class Z are Fidelity Advisor classes. Each class has exclusive voting rights with respect to matters that affect that class. Class C shares will automatically convert to Class A shares after a holding period of eight years from the initial date of purchase, with certain exceptions.
2. Investments in Fidelity Central Funds.
Funds may invest in Fidelity Central Funds, which are open-end investment companies generally available only to other investment companies and accounts managed by the investment adviser and its affiliates. The Schedule of Investments lists any Fidelity Central Funds held as an investment as of period end, but does not include the underlying holdings of each Fidelity Central Fund. An investing fund indirectly bears its proportionate share of the expenses of the underlying Fidelity Central Funds.
Based on its investment objective, each Fidelity Central Fund may invest or participate in various investment vehicles or strategies that are similar to those of the investing fund. These strategies are consistent with the investment objectives of the investing fund and may involve certain economic risks which may cause a decline in value of each of the Fidelity Central Funds and thus a decline in the value of the investing fund.
| Fidelity Central Fund | Investment Manager | Investment Objective | Investment Practices | Expense RatioA |
| Fidelity Money Market Central Funds | Fidelity Management & Research Company LLC (FMR) | Each fund seeks to obtain a high level of current income consistent with the preservation of capital and liquidity. | Short-term Investments | Less than .005% |
A Expenses expressed as a percentage of average net assets and are as of each underlying Central Fund's most recent annual or semi-annual shareholder report.
A complete unaudited list of holdings for each Fidelity Central Fund is available upon request or at the Securities and Exchange Commission website at www.sec.gov. In addition, the financial statements of the Fidelity Central Funds which contain the significant accounting policies (including investment valuation policies) of those funds, and are not covered by the Report of Independent Registered Public Accounting Firm, are available on the Securities and Exchange Commission website or upon request.
3. Significant Accounting Policies.
The Fund is an investment company and applies the accounting and reporting guidance of the Financial Accounting Standards Board (FASB) Accounting Standards Codification Topic 946 Financial Services - Investment Companies. The financial statements have been prepared in conformity with accounting principles generally accepted in the United States of America (GAAP), which require management to make certain estimates and assumptions at the date of the financial statements. Actual results could differ from those estimates. Subsequent events, if any, through the date that the financial statements were issued have been evaluated in the preparation of the financial statements. The Fund's Schedule of Investments lists any underlying mutual funds or exchange-traded funds (ETFs) but does not include the underlying holdings of these funds. The following summarizes the significant accounting policies of the Fund:
Investment Valuation. Investments are valued as of 4:00 p.m. Eastern time on the last calendar day of the period. The Board of Trustees (the Board) has designated the Fund's investment adviser as the valuation designee responsible for the fair valuation function and performing fair value determinations as needed. The investment adviser has established a Fair Value Committee (the Committee) to carry out the day-to-day fair valuation responsibilities and has adopted policies and procedures to govern the fair valuation process and the activities of the Committee. In accordance with these fair valuation policies and procedures, which have been approved by the Board, the Fund attempts to obtain prices from one or more third party pricing services or brokers to value its investments. When current market prices, quotations or currency exchange rates are not readily available or reliable, investments will be fair valued in good faith by the Committee, in accordance with the policies and procedures. Factors used in determining fair value vary by investment type and may include market or investment specific events, transaction data, estimated cash flows, and market observations of comparable investments. The frequency that the fair valuation procedures are used cannot be predicted and they may be utilized to a significant extent. The Committee manages the Fund's fair valuation practices and maintains the fair valuation policies and procedures. The Fund's investment adviser reports to the Board information regarding the fair valuation process and related material matters.
The Fund categorizes the inputs to valuation techniques used to value its investments into a disclosure hierarchy consisting of three levels as shown below:
Level 1 - unadjusted quoted prices in active markets for identical investments
Level 2 - other significant observable inputs (including quoted prices for similar investments, interest rates, prepayment speeds, etc.)
Level 3 - unobservable inputs (including the Fund's own assumptions based on the best information available)
Valuation techniques used to value the Fund's investments by major category are as follows:
Equity securities, including restricted securities, for which market quotations are readily available, are valued at the last reported sale price or official closing price as reported by a third party pricing service on the primary market or exchange on which they are traded and are categorized as Level 1 in the hierarchy. In the event there were no sales during the day or closing prices are not available, securities are valued at the last quoted bid price or may be valued using the last available price and are generally categorized as Level 2 in the hierarchy. For foreign equity securities, when market or security specific events arise, comparisons to the valuation of American Depositary Receipts (ADRs), futures contracts, ETFs and certain indexes as well as quoted prices for similar securities may be used and would be categorized as Level 2 in the hierarchy. For equity securities, including restricted securities, where observable inputs are limited, assumptions about market activity and risk are used and these securities may be categorized as Level 3 in the hierarchy.
Investments in open-end mutual funds ,including the Fidelity Central Funds, are valued at their closing net asset value (NAV) each business day and are categorized as Level 1 in the hierarchy.
Changes in valuation techniques may result in transfers in or out of an assigned level within the disclosure hierarchy. The aggregate value of investments by input level as of July 31, 2023 is included at the end of the Fund's Schedule of Investments.
Foreign Currency. Certain Funds may use foreign currency contracts to facilitate transactions in foreign-denominated securities. Gains and losses from these transactions may arise from changes in the value of the foreign currency or if the counterparties do not perform under the contracts' terms.
Foreign-denominated assets, including investment securities, and liabilities are translated into U.S. dollars at the exchange rates at period end. Purchases and sales of investment securities, income and dividends received, and expenses denominated in foreign currencies are translated into U.S. dollars at the exchange rate in effect on the transaction date.
The effects of exchange rate fluctuations on investments are included with the net realized and unrealized gain (loss) on investment securities. Other foreign currency transactions resulting in realized and unrealized gain (loss) are disclosed separately.
Investment Transactions and Income. For financial reporting purposes, the Fund's investment holdings and NAV include trades executed through the end of the last business day of the period. The NAV per share for processing shareholder transactions is calculated as of the close of business of the New York Stock Exchange (NYSE), normally 4:00 p.m. Eastern time and includes trades executed through the end of the prior business day. Gains and losses on securities sold are determined on the basis of identified cost. Commissions paid to certain brokers with whom the investment adviser, or its affiliates, places trades on behalf of a fund include an amount in addition to trade execution, which may be rebated back to a fund. Any such rebates are included in net realized gain (loss) on investments in the Statement of Operations. Dividend income is recorded on the ex-dividend date, except for certain dividends from foreign securities where the ex-dividend date may have passed, which are recorded as soon as the Fund is informed of the ex-dividend date. Non-cash dividends included in dividend income, if any, are recorded at the fair market value of the securities received. Income and capital gain distributions from Fidelity Central Funds, if any, are recorded on the ex-dividend date. Certain distributions received by the Fund represent a return of capital or capital gain. The Fund determines the components of these distributions subsequent to the ex-dividend date, based upon receipt of tax filings or other correspondence relating to the underlying investment. These distributions are recorded as a reduction of cost of investments and/or as a realized gain. Investment income is recorded net of foreign taxes withheld where recovery of such taxes is uncertain. Funds may file withholding tax reclaims in certain jurisdictions to recover a portion of amounts previously withheld. Any withholding tax reclaims income is included in the Statement of Operations in foreign taxes withheld. Any receivables for withholding tax reclaims are included in the Statement of Assets and Liabilities in dividends receivable.
Class Allocations and Expenses. Investment income, realized and unrealized capital gains and losses, common expenses of a fund, and certain fund-level expense reductions, if any, are allocated daily on a pro-rata basis to each class based on the relative net assets of each class to the total net assets of a fund. Each class differs with respect to transfer agent and distribution and service plan fees incurred, as applicable. Certain expense reductions may also differ by class, if applicable. For the reporting period, the allocated portion of income and expenses to each class as a percent of its average net assets may vary due to the timing of recording these transactions in relation to fluctuating net assets of the classes. Expenses directly attributable to a fund are charged to that fund. Expenses attributable to more than one fund are allocated among the respective funds on the basis of relative net assets or other appropriate methods. Expenses included in the accompanying financial statements reflect the expenses of that fund and do not include any expenses associated with any underlying mutual funds or exchange-traded funds (ETFs). Although not included in a fund's expenses, a fund indirectly bears its proportionate share of these expenses through the net asset value of each underlying mutual fund or exchange-traded fund (ETF). Expense estimates are accrued in the period to which they relate and adjustments are made when actual amounts are known.
Income Tax Information and Distributions to Shareholders. Each year, the Fund intends to qualify as a regulated investment company under Subchapter M of the Internal Revenue Code, including distributing substantially all of its taxable income and realized gains. As a result, no provision for U.S. Federal income taxes is required. As of July 31, 2023, the Fund did not have any unrecognized tax benefits in the financial statements; nor is the Fund aware of any tax positions for which it is reasonably possible that the total amounts of unrecognized tax benefits will significantly change in the next twelve months. The Fund files a U.S. federal tax return, in addition to state and local tax returns as required. The Fund's federal income tax returns are subject to examination by the Internal Revenue Service (IRS) for a period of three fiscal years after they are filed. State and local tax returns may be subject to examination for an additional fiscal year depending on the jurisdiction. Foreign taxes are provided for based on the Fund's understanding of the tax rules and rates that exist in the foreign markets in which it invests.
Distributions are declared and recorded on the ex-dividend date. Income and capital gain distributions are declared separately for each class. Income and capital gain distributions are determined in accordance with income tax regulations, which may differ from GAAP.
Capital accounts within the financial statements are adjusted for permanent book-tax differences. These adjustments have no impact on net assets or the results of operations. Capital accounts are not adjusted for temporary book-tax differences which will reverse in a subsequent period.
Book-tax differences are primarily due to foreign currency transactions, passive foreign investment companies (PFIC), capital loss carryforwards and losses deferred due to wash sales.
As of period end, the cost and unrealized appreciation (depreciation) in securities, and derivatives if applicable, for federal income tax purposes were as follows:
| Gross unrealized appreciation | $795,649 |
| Gross unrealized depreciation | (196,254) |
| Net unrealized appreciation (depreciation) | $599,395 |
| Tax Cost | $4,655,951 |
The tax-based components of distributable earnings as of period end were as follows:
| Undistributed ordinary income | $80,273 |
| Capital loss carryforward | $(871,694) |
| Net unrealized appreciation (depreciation) on securities and other investments | $599,299 |
Capital loss carryforwards are only available to offset future capital gains of the Fund to the extent provided by regulations and may be limited. The capital loss carryforward information presented below, including any applicable limitation, is estimated as of fiscal period end and is subject to adjustment.
Short-term | $(531,240) |
Long-term | (340,454) |
| Total capital loss carryforward | $(871,694) |
The tax character of distributions paid was as follows:
| | July 31, 2023 | July 31, 2022 |
| Ordinary Income | $76,041 | $92,097 |
| Total | $76,041 | $92,097 |
4. Purchases and Sales of Investments.
Purchases and sales of securities, other than short-term securities and in-kind transactions, as applicable, are noted in the table below.
| | Purchases ($) | Sales ($) |
| Fidelity Advisor Global Real Estate Fund | 4,768,257 | 6,171,463 |
5. Fees and Other Transactions with Affiliates.
Management Fee. Fidelity Management & Research Company LLC (the investment adviser) and its affiliates provide the Fund with investment management related services for which the Fund pays a monthly management fee. The management fee is the sum of an individual fund fee rate that is based on an annual rate of .45% of the Fund's average net assets and an annualized group fee rate that averaged .23% during the period. The group fee rate is based upon the monthly average net assets of a group of registered investment companies with which the investment adviser has management contracts. The group fee rate decreases as assets under management increase and increases as assets under management decrease. For the reporting period, the total annual management fee rate was .68% of the Fund's average net assets.
Distribution and Service Plan Fees. In accordance with Rule 12b-1 of the 1940 Act, the Fund has adopted separate Distribution and Service Plans for each class of shares. Certain classes pay Fidelity Distributors Company LLC (FDC), an affiliate of the investment adviser, separate Distribution and Service Fees, each of which is based on an annual percentage of each class' average net assets. In addition, FDC may pay financial intermediaries for selling shares of the Fund and providing shareholder support services. For the period, the Distribution and Service Fee rates, total fees and amounts retained by FDC were as follows:
| | Distribution Fee | Service Fee | Total Fees | Retained by FDC |
| Class A | - % | .25% | $6,692 | $2,778 |
| Class M | .25% | .25% | 4,590 | 2,668 |
| Class C | .75% | .25% | 1,887 | 508 |
| | | | $13,169 | $5,954 |
Sales Load. FDC may receive a front-end sales charge of up to 5.75% for selling Class A shares and 3.50% for selling Class M shares, some of which is paid to financial intermediaries for selling shares of the Fund. Depending on the holding period, FDC may receive contingent deferred sales charges levied on Class A, Class M and Class C redemptions. The deferred sales charges are 1.00% for Class C shares, 1.00% for certain purchases of Class A shares and .25% for certain purchases of Class M shares.
For the period, sales charge amounts retained by FDC were as follows:
| | Retained by FDC |
| Class A | $1,472 |
| Class M | 91 |
Class CA | 20 |
| | $1,583 |
A When Class C shares are initially sold, FDC pays commissions from its own resources to financial intermediaries through which the sales are made.
Transfer Agent Fees. Fidelity Investments Institutional Operations Company LLC (FIIOC), an affiliate of the investment adviser, is the transfer, dividend disbursing and shareholder servicing agent for each class of the Fund. FIIOC receives account fees and asset-based fees that vary according to the account size and type of account of the shareholders of the respective classes of the Fund, except for Class Z. FIIOC receives an asset-based fee of Class Z's average net assets. FIIOC pays for typesetting, printing and mailing of shareholder reports, except proxy statements.
For the period, transfer agent fees for each class were as follows:
| | Amount | % of Class-Level Average Net Assets |
| Class A | $6,810 | .25 |
| Class M | 1,873 | .20 |
| Class C | 480 | .25 |
| Class I | 2,486 | .17 |
| Class Z | 199 | .04 |
| | $11,848 | |
Accounting Fees. Fidelity Service Company, Inc. (FSC), an affiliate of the investment adviser, maintains the Fund's accounting records. The accounting fee is based on the level of average net assets for each month. For the period, the fees were equivalent to the following annual rates:
| | % of Average Net Assets |
| Fidelity Advisor Global Real Estate Fund | .04 |
Brokerage Commissions. A portion of portfolio transactions were placed with brokerage firms which are affiliates of the investment adviser. Brokerage commissions are included in net realized gain (loss) and change in net unrealized appreciation (depreciation) in the Statement of Operations. The commissions paid to these affiliated firms were as follows:
| | Amount |
| Fidelity Advisor Global Real Estate Fund | $102 |
Interfund Trades. Funds may purchase from or sell securities to other Fidelity Funds under procedures adopted by the Board. The procedures have been designed to ensure these interfund trades are executed in accordance with Rule 17a-7 of the 1940 Act. Any interfund trades are included within the respective purchases and sales amounts shown in the Purchases and Sales of Investments note. Interfund trades during the period are noted in the table below.
| | Purchases ($) | Sales ($) | Realized Gain (Loss) ($) |
| Fidelity Advisor Global Real Estate Fund | 99,814 | 177,485 | 10,668 |
6. Committed Line of Credit.
Certain Funds participate with other funds managed by the investment adviser or an affiliate in a $4.25 billion credit facility (the "line of credit") to be utilized for temporary or emergency purposes to fund shareholder redemptions or for other short-term liquidity purposes. The participating funds have agreed to pay commitment fees on their pro-rata portion of the line of credit, which are reflected in Miscellaneous expenses on the Statement of Operations, and are listed below. During the period, there were no borrowings on this line of credit.
| | Amount |
| Fidelity Advisor Global Real Estate Fund | $14 |
7. Expense Reductions.
The investment adviser contractually agreed to reimburse expenses of each class to the extent annual operating expenses exceeded certain levels of class-level average net assets as noted in the table below. This reimbursement will remain in place through November 30, 2024. Some expenses, for example the compensation of the independent Trustees, and certain miscellaneous expenses such as proxy and shareholder meeting expenses, are excluded from this reimbursement.
The following classes were in reimbursement during the period:
| | Expense Limitations | Reimbursement |
| Class A | 1.20% | $70,841 |
| Class M | 1.45% | 23,723 |
| Class C | 1.95% | 4,973 |
| Class I | .95% | 34,350 |
| Class Z | .80% | 12,220 |
| | | $146,107 |
Through arrangements with the Fund's custodian, credits realized as a result of certain uninvested cash balances were used to reduce the Fund's expenses. During the period, custodian credits reduced the Fund's expenses by $17. During the period, transfer agent credits reduced each class' expenses as noted in the table below.
| | Expense reduction |
| Class A | $120 |
| Class C | 30 |
| | $150 |
In addition, during the period the investment adviser or an affiliate reimbursed and/or waived a portion of fund-level operating expenses in the amount of $276.
8. Distributions to Shareholders.
Distributions to shareholders of each class were as follows:
| | Year ended July 31, 2023 | Year ended July 31, 2022 |
| Fidelity Advisor Global Real Estate Fund | | |
| Distributions to shareholders | | |
| Class A | $23,736 | $40,544 |
| Class M | 5,995 | 10,997 |
| Class C | 136 | 1,175 |
| Class I | 43,870 | 21,272 |
| Class Z | 2,304 | 18,109 |
Total | $76,041 | $92,097 |
9. Share Transactions.
Share transactions for each class were as follows and may contain in-kind transactions, automatic conversions between classes or exchanges between affiliated funds:
| | Shares | Shares | Dollars | Dollars |
| | Year ended July 31, 2023 | Year ended July 31, 2022 | Year ended July 31, 2023 | Year ended July 31, 2022 |
| Fidelity Advisor Global Real Estate Fund | | | | |
| Class A | | | | |
| Shares sold | 40,105 | 92,564 | $395,082 | $1,135,946 |
| Reinvestment of distributions | 2,489 | 3,246 | 23,736 | 40,544 |
| Shares redeemed | (41,363) | (45,679) | (410,949) | (547,402) |
| Net increase (decrease) | 1,231 | 50,131 | $7,869 | $629,088 |
| Class M | | | | |
| Shares sold | 7,122 | 31,478 | $70,044 | $387,783 |
| Reinvestment of distributions | 629 | 881 | 5,995 | 10,997 |
| Shares redeemed | (13,581) | (6,761) | (130,257) | (71,550) |
| Net increase (decrease) | (5,830) | 25,598 | $(54,218) | $327,230 |
| Class C | | | | |
| Shares sold | 5,080 | 7,240 | $50,554 | $88,337 |
| Reinvestment of distributions | 14 | 94 | 136 | 1,175 |
| Shares redeemed | (4,441) | (7,027) | (44,663) | (75,141) |
| Net increase (decrease) | 653 | 307 | $6,027 | $14,371 |
| Class I | | | | |
| Shares sold | 267,118 | 45,989 | $2,612,072 | $534,191 |
| Reinvestment of distributions | 4,304 | 1,446 | 41,084 | 18,078 |
| Shares redeemed | (315,343) | (8,457) | (3,144,342) | (90,325) |
| Net increase (decrease) | (43,921) | 38,978 | $(491,186) | $461,944 |
| Class Z | | | | |
| Shares sold | 79,530 | 127,231 | $764,368 | $1,565,852 |
| Reinvestment of distributions | 240 | 1,442 | 2,304 | 18,109 |
| Shares redeemed | (176,559) | (106,982) | (1,717,435) | (1,284,412) |
| Net increase (decrease) | (96,789) | 21,691 | $(950,763) | $299,549 |
10. Other.
A fund's organizational documents provide former and current trustees and officers with a limited indemnification against liabilities arising in connection with the performance of their duties to the fund. In the normal course of business, a fund may also enter into contracts that provide general indemnifications. A fund's maximum exposure under these arrangements is unknown as this would be dependent on future claims that may be made against a fund. The risk of material loss from such claims is considered remote.
At the end of the period, the investment adviser or its affiliates were owners of record of more than 10% of the outstanding shares as follows:
| Fund | Affiliated % |
Fidelity Advisor Global Real Estate Fund | 46% |
11. Risk and Uncertainties.
Many factors affect a fund's performance. Developments that disrupt global economies and financial markets, such as pandemics, epidemics, outbreaks of infectious diseases, war, terrorism, and environmental disasters, may significantly affect a fund's investment performance. The effects of these developments to a fund will be impacted by the types of securities in which a fund invests, the financial condition, industry, economic sector, and geographic location of an issuer, and a fund's level of investment in the securities of that issuer. Significant concentrations in security types, issuers, industries, sectors, and geographic locations may magnify the factors that affect a fund's performance.
To the Board of Trustees of Fidelity Advisor Series VII and the Shareholders of Fidelity Advisor Global Real Estate Fund:
Opinion on the Financial Statements and Financial Highlights
We have audited the accompanying statement of assets and liabilities of Fidelity Advisor Global Real Estate Fund (the "Fund"), a fund of Fidelity Advisor Series VII, including the schedule of investments, as of July 31, 2023, the related statement of operations for the year then ended, the statement of changes in net assets for each of the two years in the period then ended, the financial highlights for each of the five years in the period then ended, and the related notes. In our opinion, the financial statements and financial highlights present fairly, in all material respects, the financial position of the Fund as of July 31, 2023, and the results of its operations for the year then ended, the changes in its net assets for each of the two years in the period then ended, and the financial highlights for each of the five years in the period then ended in conformity with accounting principles generally accepted in the United States of America.
Basis for Opinion
These financial statements and financial highlights are the responsibility of the Fund's management. Our responsibility is to express an opinion on the Fund's financial statements and financial highlights based on our audits. We are a public accounting firm registered with the Public Company Accounting Oversight Board (United States) (PCAOB) and are required to be independent with respect to the Fund in accordance with the U.S. federal securities laws and the applicable rules and regulations of the Securities and Exchange Commission and the PCAOB.
We conducted our audits in accordance with the standards of the PCAOB. Those standards require that we plan and perform the audit to obtain reasonable assurance about whether the financial statements and financial highlights are free of material misstatement, whether due to error or fraud. The Fund is not required to have, nor were we engaged to perform, an audit of its internal control over financial reporting. As part of our audits we are required to obtain an understanding of internal control over financial reporting but not for the purpose of expressing an opinion on the effectiveness of the Fund's internal control over financial reporting. Accordingly, we express no such opinion.
Our audits included performing procedures to assess the risks of material misstatement of the financial statements and financial highlights, whether due to error or fraud, and performing procedures that respond to those risks. Such procedures included examining, on a test basis, evidence regarding the amounts and disclosures in the financial statements and financial highlights. Our audits also included evaluating the accounting principles used and significant estimates made by management, as well as evaluating the overall presentation of the financial statements and financial highlights. Our procedures included confirmation of securities owned as of July 31, 2023, by correspondence with the custodian and brokers; when replies were not received from brokers, we performed other auditing procedures. We believe that our audits provide a reasonable basis for our opinion.
/s/ Deloitte & Touche LLP
Boston, Massachusetts
September 13, 2023
We have served as the auditor of one or more of the Fidelity investment companies since 1999.
The Trustees, Members of the Advisory Board (if any), and officers of the trust and fund, as applicable, are listed below. The Board of Trustees governs the fund and is responsible for protecting the interests of shareholders. The Trustees are experienced executives who meet periodically throughout the year to oversee the fund's activities, review contractual arrangements with companies that provide services to the fund, oversee management of the risks associated with such activities and contractual arrangements, and review the fund's performance. Except for Vijay Advani, each of the Trustees oversees 321 funds. Mr. Advani oversees 215 funds.
The Trustees hold office without limit in time except that (a) any Trustee may resign; (b) any Trustee may be removed by written instrument, signed by at least two-thirds of the number of Trustees prior to such removal; (c) any Trustee who requests to be retired or who has become incapacitated by illness or injury may be retired by written instrument signed by a majority of the other Trustees; and (d) any Trustee may be removed at any special meeting of shareholders by a two-thirds vote of the outstanding voting securities of the trust. Each Trustee who is not an interested person (as defined in the 1940 Act) of the trust and the fund is referred to herein as an Independent Trustee. Each Independent Trustee shall retire not later than the last day of the calendar year in which his or her 75th birthday occurs. The Independent Trustees may waive this mandatory retirement age policy with respect to individual Trustees. Officers and Advisory Board Members hold office without limit in time, except that any officer or Advisory Board Member may resign or may be removed by a vote of a majority of the Trustees at any regular meeting or any special meeting of the Trustees. Except as indicated, each individual has held the office shown or other offices in the same company for the past five years.
The fund's Statement of Additional Information (SAI) includes more information about the Trustees. To request a free copy, call Fidelity at 1-877-208-0098.
Experience, Skills, Attributes, and Qualifications of the Trustees. The Governance and Nominating Committee has adopted a statement of policy that describes the experience, qualifications, attributes, and skills that are necessary and desirable for potential Independent Trustee candidates (Statement of Policy). The Board believes that each Trustee satisfied at the time he or she was initially elected or appointed a Trustee, and continues to satisfy, the standards contemplated by the Statement of Policy. The Governance and Nominating Committee also engages professional search firms to help identify potential Independent Trustee candidates who have the experience, qualifications, attributes, and skills consistent with the Statement of Policy. From time to time, additional criteria based on the composition and skills of the current Independent Trustees, as well as experience or skills that may be appropriate in light of future changes to board composition, business conditions, and regulatory or other developments, have also been considered by the professional search firms and the Governance and Nominating Committee. In addition, the Board takes into account the Trustees' commitment and participation in Board and committee meetings, as well as their leadership of standing and ad hoc committees throughout their tenure.
In determining that a particular Trustee was and continues to be qualified to serve as a Trustee, the Board has considered a variety of criteria, none of which, in isolation, was controlling. The Board believes that, collectively, the Trustees have balanced and diverse experience, qualifications, attributes, and skills, which allow the Board to operate effectively in governing the fund and protecting the interests of shareholders. Information about the specific experience, skills, attributes, and qualifications of each Trustee, which in each case led to the Board's conclusion that the Trustee should serve (or continue to serve) as a trustee of the fund, is provided below.
Board Structure and Oversight Function. Robert A. Lawrence is an interested person and currently serves as Chair. The Trustees have determined that an interested Chair is appropriate and benefits shareholders because an interested Chair has a personal and professional stake in the quality and continuity of services provided to the fund. Independent Trustees exercise their informed business judgment to appoint an individual of their choosing to serve as Chair, regardless of whether the Trustee happens to be independent or a member of management. The Independent Trustees have determined that they can act independently and effectively without having an Independent Trustee serve as Chair and that a key structural component for assuring that they are in a position to do so is for the Independent Trustees to constitute a substantial majority for the Board. The Independent Trustees also regularly meet in executive session. David M. Thomas serves as Lead Independent Trustee and as such (i) acts as a liaison between the Independent Trustees and management with respect to matters important to the Independent Trustees and (ii) with management prepares agendas for Board meetings.
Fidelity® funds are overseen by different Boards of Trustees. The fund's Board oversees Fidelity's high income and certain equity funds, and other Boards oversee Fidelity's alternative investment, investment-grade bond, money market, asset allocation, and other equity funds. The asset allocation funds may invest in Fidelity® funds overseen by the fund's Board. The use of separate Boards, each with its own committee structure, allows the Trustees of each group of Fidelity® funds to focus on the unique issues of the funds they oversee, including common research, investment, and operational issues. On occasion, the separate Boards establish joint committees to address issues of overlapping consequences for the Fidelity® funds overseen by each Board.
The Trustees operate using a system of committees to facilitate the timely and efficient consideration of all matters of importance to the Trustees, the fund, and fund shareholders and to facilitate compliance with legal and regulatory requirements and oversight of the fund's activities and associated risks. The Board, acting through its committees, has charged FMR and its affiliates with (i) identifying events or circumstances the occurrence of which could have demonstrably adverse effects on the fund's business and/or reputation; (ii) implementing processes and controls to lessen the possibility that such events or circumstances occur or to mitigate the effects of such events or circumstances if they do occur; and (iii) creating and maintaining a system designed to evaluate continuously business and market conditions in order to facilitate the identification and implementation processes described in (i) and (ii) above. Because the day-to-day operations and activities of the fund are carried out by or through FMR, its affiliates, and other service providers, the fund's exposure to risks is mitigated but not eliminated by the processes overseen by the Trustees. While each of the Board's committees has responsibility for overseeing different aspects of the fund's activities, oversight is exercised primarily through the Operations, Audit, and Compliance Committees. Appropriate personnel, including but not limited to the fund's Chief Compliance Officer (CCO), FMR's internal auditor, the independent accountants, the fund's Treasurer and portfolio management personnel, make periodic reports to the Board's committees, as appropriate, including an annual review of Fidelity's risk management program for the Fidelity® funds. The responsibilities of each standing committee, including their oversight responsibilities, are described further under "Standing Committees of the Trustees."
Interested Trustees*:
Correspondence intended for a Trustee who is an interested person may be sent to Fidelity Investments, 245 Summer Street, Boston, Massachusetts 02210.
Name, Year of Birth; Principal Occupations and Other Relevant Experience+
Bettina Doulton (1964)
Year of Election or Appointment: 2020
Trustee
Ms. Doulton also serves as Trustee of other Fidelity® funds. Prior to her retirement, Ms. Doulton served in a variety of positions at Fidelity Investments, including as a managing director of research (2006-2007), portfolio manager to certain Fidelity® funds (1993-2005), equity analyst and portfolio assistant (1990-1993), and research assistant (1987-1990). Ms. Doulton currently owns and operates Phi Builders + Architects and Cellardoor Winery. Previously, Ms. Doulton served as a member of the Board of Brown Capital Management, LLC (2014-2018).
Robert A. Lawrence (1952)
Year of Election or Appointment: 2020
Trustee
Chair of the Board of Trustees
Mr. Lawrence also serves as Trustee of other funds. Previously, Mr. Lawrence served as a Trustee and Member of the Advisory Board of certain funds. Prior to his retirement in 2008, Mr. Lawrence served as Vice President of certain Fidelity® funds (2006-2008), Senior Vice President, Head of High Income Division of Fidelity Management & Research Company (investment adviser firm, 2006-2008), and President of Fidelity Strategic Investments (investment adviser firm, 2002-2005).
* Determined to be an "Interested Trustee" by virtue of, among other things, his or her affiliation with the trust or various entities under common control with FMR.
+ The information includes the Trustee's principal occupation during the last five years and other information relating to the experience, attributes, and skills relevant to the Trustee's qualifications to serve as a Trustee, which led to the conclusion that the Trustee should serve as a Trustee for the fund.
Independent Trustees:
Correspondence intended for an Independent Trustee may be sent to Fidelity Investments, P.O. Box 55235, Boston, Massachusetts 02205-5235.
Name, Year of Birth; Principal Occupations and Other Relevant Experience+
Vijay C. Advani (1960)
Year of Election or Appointment: 2023
Trustee
Mr. Advani also serves as Trustee or Member of the Advisory Board of other funds. Previously, Mr. Advani served as Executive Chairman (2020-2022), Chief Executive Officer (2017-2020) and Chief Operating Officer (2016-2017) of Nuveen (global investment manager). He also served in various capacities at Franklin Resources (global investment manager), including Co-President (2015-2016), Executive Vice President, Global Advisory Services (2008-2015), Head of Global Retail Distribution (2005-2008), Executive Managing Director, International Retail Development (2002-2005), Managing Director, Product Developments, Sales & Marketing, Asia, Eastern Europe and Africa (2000-2002) and President, Templeton Asset Management India (1995-2000). Mr. Advani also served as Senior Investment Officer of International Finance Corporation (private equity and venture capital arm of The World Bank, 1984-1995). Mr. Advani is Chairman Emeritus of the U.S. India Business Council (2018-present), a Director of The Global Impact Investing Network (2019-present), a Director of LOK Capital (Mauritius) (2022-present), a member of the Advisory Council of LOK Capital (2022-present), a Senior Advisor of Neuberger Berman (2021-present), a Senior Advisor of Seviora Holdings Pte. Ltd (Temasek-Singapore) (2021-present), a Director of Seviora Capital (Singapore) (2021-present) and an Advisor of EQUIAM (2021-present). Mr. Advani formerly served as a member of the Board of BowX Acquisition Corp. (special purpose acquisition company, 2020-2021), a member of the Board of Intellecap (advisory arm of The Aavishkaar Group, 2018-2020), a member of the Board of Nuveen Investments, Inc. (2017-2020) and a member of the Board of Docusign (software, 2016-2019).
Thomas P. Bostick (1956)
Year of Election or Appointment: 2021
Trustee
Lieutenant General Bostick also serves as Trustee of other Fidelity® funds. Prior to his retirement, General Bostick (United States Army, Retired) held a variety of positions within the U.S. Army, including Commanding General and Chief of Engineers, U.S. Army Corps of Engineers (2012-2016) and Deputy Chief of Staff and Director of Human Resources, U.S. Army (2009-2012). General Bostick currently serves as a member of the Board and Finance and Governance & Sustainability Committees of CSX Corporation (transportation, 2020-present) and a member of the Board and Corporate Governance and Nominating Committee of Perma-Fix Environmental Services, Inc. (nuclear waste management, 2020-present). General Bostick serves as Chief Executive Officer of Bostick Global Strategies, LLC (consulting, 2016-present), as a member of the Board of HireVue, Inc. (video interview and assessment, 2020-present), as a member of the Board of Allonnia (biotechnology and engineering solutions, 2022-present) and on the Advisory Board of Solugen, Inc. (specialty bio-based chemicals manufacturer, 2022-present). Previously, General Bostick served as a Member of the Advisory Board of certain Fidelity® funds (2021), President, Intrexon Bioengineering (2018-2020) and Chief Operating Officer (2017-2020) and Senior Vice President of the Environment Sector (2016-2017) of Intrexon Corporation (biopharmaceutical company).
Dennis J. Dirks (1948)
Year of Election or Appointment: 2018
Trustee
Mr. Dirks also serves as Trustee of other Fidelity® funds. Prior to his retirement in May 2003, Mr. Dirks served as Chief Operating Officer and as a member of the Board of The Depository Trust & Clearing Corporation (financial markets infrastructure), President, Chief Operating Officer and a member of the Board of The Depository Trust Company (DTC), President and a member of the Board of the National Securities Clearing Corporation (NSCC), Chief Executive Officer and a member of the Board of the Government Securities Clearing Corporation and Chief Executive Officer and a member of the Board of the Mortgage-Backed Securities Clearing Corporation. Mr. Dirks currently serves as a member of the Finance Committee (2016-present) and Board (2017-present) and is Treasurer (2018-present) of the Asolo Repertory Theatre.
Donald F. Donahue (1950)
Year of Election or Appointment: 2018
Trustee
Mr. Donahue also serves as Trustee of other Fidelity® funds. Mr. Donahue serves as President and Chief Executive Officer of Miranda Partners, LLC (risk consulting for the financial services industry, 2012-present). Previously, Mr. Donahue served as Chief Executive Officer (2006-2012), Chief Operating Officer (2003-2006) and Managing Director, Customer Marketing and Development (1999-2003) of The Depository Trust & Clearing Corporation (financial markets infrastructure). Mr. Donahue currently serves as a member (2007-present) and Co-Chairman (2016-present) of the Board of United Way of New York. Mr. Donahue previously served as a member of the Advisory Board of certain Fidelity® funds (2015-2018) and as a member of the Board of The Leadership Academy (previously NYC Leadership Academy) (2012-2022).
Vicki L. Fuller (1957)
Year of Election or Appointment: 2020
Trustee
Ms. Fuller also serves as Trustee of other Fidelity® funds. Previously, Ms. Fuller served as a member of the Advisory Board of certain Fidelity® funds (2018-2020), Chief Investment Officer of the New York State Common Retirement Fund (2012-2018) and held a variety of positions at AllianceBernstein L.P. (global asset management, 1985-2012), including Managing Director (2006-2012) and Senior Vice President and Senior Portfolio Manager (2001-2006). Ms. Fuller currently serves as a member of the Board, Audit Committee and Nominating and Governance Committee of two Blackstone business development companies (2020-present), as a member of the Board of Treliant, LLC (consulting, 2019-present), as a member of the Board of Ariel Alternatives, LLC (private equity, 2022-present) and as a member of the Board and Chair of the Audit Committee of Gusto, Inc. (software, 2021-present). In addition, Ms. Fuller currently serves as a member of the Board of Roosevelt University (2019-present) and as a member of the Executive Board of New York University's Stern School of Business. Ms. Fuller previously served as a member of the Board, Audit Committee and Nominating and Governance Committee of The Williams Companies, Inc. (natural gas infrastructure, 2018-2021).
Patricia L. Kampling (1959)
Year of Election or Appointment: 2020
Trustee
Ms. Kampling also serves as Trustee of other Fidelity® funds. Prior to her retirement, Ms. Kampling served as Chairman of the Board and Chief Executive Officer (2012-2019), President and Chief Operating Officer (2011-2012) and Executive Vice President and Chief Financial Officer (2010-2011) of Alliant Energy Corporation. Ms. Kampling currently serves as a member of the Board, Finance Committee and Governance, Compensation and Nominating Committee of Xcel Energy Inc. (utilities company, 2020-present) and as a member of the Board, Audit, Finance and Risk Committee and Safety, Environmental, Technology and Operations Committee and Chair of the Executive Development and Compensation Committee of American Water Works Company, Inc. (utilities company, 2019-present). In addition, Ms. Kampling currently serves as a member of the Board of the Nature Conservancy, Wisconsin Chapter (2019-present). Previously, Ms. Kampling served as a Member of the Advisory Board of certain Fidelity® funds (2020), a member of the Board, Compensation Committee and Executive Committee and Chair of the Audit Committee of Briggs & Stratton Corporation (manufacturing, 2011-2021), a member of the Board of Interstate Power and Light Company (2012-2019) and Wisconsin Power and Light Company (2012-2019) (each a subsidiary of Alliant Energy Corporation) and as a member of the Board and Workforce Development Committee of the Business Roundtable (2018-2019).
Thomas A. Kennedy (1955)
Year of Election or Appointment: 2021
Trustee
Mr. Kennedy also serves as Trustee of other Fidelity® funds. Previously, Mr. Kennedy served as a Member of the Advisory Board of certain Fidelity® funds (2020) and held a variety of positions at Raytheon Company (aerospace and defense, 1983-2020), including Chairman and Chief Executive Officer (2014-2020) and Executive Vice President and Chief Operating Officer (2013-2014). Mr. Kennedy served as Executive Chairman of the Board of Directors of Raytheon Technologies Corporation (aerospace and defense, 2020-2021). Mr. Kennedy serves as a Director of the Board of Directors of Textron Inc. (aerospace and defense, 2023-present).
Oscar Munoz (1959)
Year of Election or Appointment: 2021
Trustee
Mr. Munoz also serves as Trustee of other Fidelity® funds. Prior to his retirement, Mr. Munoz served as Executive Chairman (2020-2021), Chief Executive Officer (2015-2020), President (2015-2016) and a member of the Board (2010-2021) of United Airlines Holdings, Inc. Mr. Munoz currently serves as a member of the Board of CBRE Group, Inc. (commercial real estate, 2020-present), a member of the Board of Univision Communications, Inc. (Hispanic media, 2020-present), a member of the Board of Archer Aviation Inc. (2021-present), a member of the Defense Business Board of the United States Department of Defense (2021-present) and a member of the Board of Salesforce.com, Inc. (cloud-based software, 2022-present). Previously, Mr. Munoz served as a Member of the Advisory Board of certain Fidelity® funds (2021).
David M. Thomas (1949)
Year of Election or Appointment: 2018
Trustee
Lead Independent Trustee
Mr. Thomas also serves as Trustee of other Fidelity® funds. Previously, Mr. Thomas served as Executive Chairman (2005-2006) and Chairman and Chief Executive Officer (2000-2005) of IMS Health, Inc. (pharmaceutical and healthcare information solutions). Mr. Thomas currently serves as a member of the Board of Fortune Brands Home and Security (home and security products, 2004-present) and as Director (2013-present) and Non-Executive Chairman of the Board (2022-present) of Interpublic Group of Companies, Inc. (marketing communication).
Susan Tomasky (1953)
Year of Election or Appointment: 2020
Trustee
Ms. Tomasky also serves as Trustee of other Fidelity® funds. Prior to her retirement, Ms. Tomasky served in various executive officer positions at American Electric Power Company, Inc. (1998-2011), including most recently as President of AEP Transmission (2007-2011). Ms. Tomasky currently serves as a member of the Board and Sustainability Committee and as Chair of the Audit Committee of Marathon Petroleum Corporation (2018-present) and as a member of the Board, Executive Committee, Corporate Governance Committee and Organization and Compensation Committee and as Lead Director of the Board of Public Service Enterprise Group, Inc. (utilities company, 2012-present) and as a member of the Board of its subsidiary company, Public Service Electric and Gas Co. (2021-present). In addition, Ms. Tomasky currently serves as a member (2009-present) and President (2020-present) of the Board of the Royal Shakespeare Company - America (2009-present), as a member of the Board of the Columbus Association for the Performing Arts (2011-present) and as a member of the Board and Kenyon in the World Committee of Kenyon College (2016-present). Previously, Ms. Tomasky served as a Member of the Advisory Board of certain Fidelity® funds (2020), as a member of the Board of the Columbus Regional Airport Authority (2007-2020), as a member of the Board (2011-2018) and Lead Independent Director (2015-2018) of Andeavor Corporation (previously Tesoro Corporation) (independent oil refiner and marketer) and as a member of the Board of Summit Midstream Partners LP (energy, 2012-2018).
Michael E. Wiley (1950)
Year of Election or Appointment: 2008
Trustee
Mr. Wiley also serves as Trustee of other Fidelity® funds. Previously, Mr. Wiley served as a member of the Advisory Board of certain Fidelity® funds (2018-2020), Chairman, President and CEO of Baker Hughes, Inc. (oilfield services, 2000-2004). Mr. Wiley also previously served as a member of the Board of Andeavor Corporation (independent oil refiner and marketer, 2005-2018), a member of the Board of Andeavor Logistics LP (natural resources logistics, 2015-2018) and a member of the Board of High Point Resources (exploration and production, 2005-2020).
+ The information includes the Trustee's principal occupation during the last five years and other information relating to the experience, attributes, and skills relevant to the Trustee's qualifications to serve as a Trustee, which led to the conclusion that the Trustee should serve as a Trustee for the fund.
Advisory Board Members and Officers:
Correspondence intended for a Member of the Advisory Board (if any) may be sent to Fidelity Investments, P.O. Box 55235, Boston, Massachusetts 02205-5235. Correspondence intended for an officer or Peter S. Lynch may be sent to Fidelity Investments, 245 Summer Street, Boston, Massachusetts 02210. Officers appear below in alphabetical order.
Name, Year of Birth; Principal Occupation
Peter S. Lynch (1944)
Year of Election or Appointment: 2018
Member of the Advisory Board
Mr. Lynch also serves as a Member of the Advisory Board of other Fidelity® funds. Mr. Lynch is Vice Chairman and a Director of Fidelity Management & Research Company LLC (investment adviser firm). In addition, Mr. Lynch serves as a Trustee of Boston College and as the Chairman of the Inner-City Scholarship Fund. Previously, Mr. Lynch served as Vice Chairman and a Director of FMR Co., Inc. (investment adviser firm) and on the Special Olympics International Board of Directors (1997-2006).
Karen B. Peetz (1955)
Year of Election or Appointment: 2023
Member of the Advisory Board
Ms. Peetz also serves as a Member of the Advisory Board of other funds. Previously, Ms. Peetz served as Chief Administration Officer (2020-2023) of Citigroup Inc. (a diversified financial service company). She also served in various capacities at Bank of New York Mellon Corporation, including President (2013-2016), Vice Chairman, Senior Executive Vice President and Chief Executive Officer of Financial Markets & Treasury Services (2010-2013), Senior Executive Vice President and Chief Executive Officer of Global Corporate Trust (2003-2008), Senior Vice President and Division Manager of Global Payments & Trade Services (2002-2003) and Senior Vice President and Division Manager of Domestic Corporate Trust (1998-2002). Ms. Peetz also served in various capacities at Chase Manhattan Corporation (1982-1998), including Senior Vice President and Manager of Corporate Trust International Business (1996-1998), Managing Director and Manager of Corporate Trust Services (1994-1996) and Managing Director and Group Manager of Financial Institution Sales (1990-1993). Ms. Peetz currently serves as Chair of Amherst Holdings Advisory Council (2018-present), Trustee of Johns Hopkins University (2016-present), Chair of the Carey Business School Advisory Council, Member of the Johns Hopkins Medicine Board and Finance Committee and Chair of the Lyme and Tick Related Disease Institute Advisory Council. Ms. Peetz previously served as a member of the Board of Guardian Life Insurance Company of America (2019-2023), a member of the Board of Trane Technologies (2018-2022), a member of the Board of Wells Fargo Corp. (2017-2019), a member of the Board of SunCoke Energy Inc. (2012-2016), a member of the Board of Private Export Funding Corporation (2010-2016) and as a Trustee of Penn State University (2010-2014) and the United Way of New York City (2008-2010).
Heather Bonner (1977)
Year of Election or Appointment: 2023
Assistant Treasurer
Ms. Bonner also serves as an officer of other funds. Ms. Bonner serves as Senior Vice President (2022-present), and is an employee of Fidelity Investments. Ms. Bonner serves as Assistant Treasurer of Fidelity CRET Trustee LLC (2022-present). Prior to joining Fidelity, Ms. Bonner served as Managing Director at AQR Capital Management (2013-2022) and was the Treasurer and Principal Financial Officer of the AQR Funds (2013-2022).
Craig S. Brown (1977)
Year of Election or Appointment: 2022
Deputy Treasurer
Mr. Brown also serves as an officer of other funds. Mr. Brown serves as Assistant Treasurer of FIMM, LLC (2021-present) and is an employee of Fidelity Investments (2013-present). Previously, Mr. Brown served as Assistant Treasurer of certain Fidelity® funds (2019-2022).
John J. Burke III (1964)
Year of Election or Appointment: 2018
Chief Financial Officer
Mr. Burke also serves as Chief Financial Officer of other funds. Mr. Burke serves as Head of Investment Operations for Fidelity Fund and Investment Operations (2018-present) and is an employee of Fidelity Investments (1998-present). Previously Mr. Burke served as head of Asset Management Investment Operations (2012-2018).
Margaret Carey (1973)
Year of Election or Appointment: 2023
Secretary and Chief Legal Officer (CLO)
Ms. Carey also serves as an officer of other funds and as CLO of certain other Fidelity entities. She is a Senior Vice President and Deputy General Counsel of FMR LLC (diversified financial services company, 2019-present), and is an employee of Fidelity Investments.
William C. Coffey (1969)
Year of Election or Appointment: 2019
Assistant Secretary
Mr. Coffey also serves as Assistant Secretary of other funds. He is Senior Vice President and Deputy General Counsel of FMR LLC (diversified financial services company, 2010-present), and is an employee of Fidelity Investments. Previously, Mr. Coffey served as Secretary and CLO of certain funds (2018-2019); CLO, Secretary, and Senior Vice President of Fidelity Management & Research Company and FMR Co., Inc. (investment adviser firms, 2018-2019); Secretary of Fidelity SelectCo, LLC and Fidelity Investments Money Management, Inc. (investment adviser firms, 2018-2019); CLO of Fidelity Management & Research (Hong Kong) Limited, FMR Investment Management (UK) Limited, and Fidelity Management & Research (Japan) Limited (investment adviser firms, 2018-2019); and Assistant Secretary of certain funds (2009-2018).
Timothy M. Cohen (1969)
Year of Election or Appointment: 2018
Vice President
Mr. Cohen also serves as Vice President of other funds. Mr. Cohen serves as Co-Head of Equity (2018-present), a Director of Fidelity Management & Research (Japan) Limited (investment adviser firm, 2016-present), and is an employee of Fidelity Investments. Previously, Mr. Cohen served as Executive Vice President of Fidelity SelectCo, LLC (2019), Head of Global Equity Research (2016-2018), Chief Investment Officer - Equity and a Director of Fidelity Management & Research (U.K.) Inc. (investment adviser firm, 2013-2015) and as a Director of Fidelity Management & Research (Hong Kong) Limited (investment adviser firm, 2017).
Jonathan Davis (1968)
Year of Election or Appointment: 2010
Assistant Treasurer
Mr. Davis also serves as an officer of other funds. Mr. Davis serves as Vice President Assistant Treasurer and is an employee of Fidelity Investments. Mr. Davis serves as Assistant Treasurer of certain Fidelity entities.
Laura M. Del Prato (1964)
Year of Election or Appointment: 2018
Assistant Treasurer
Ms. Del Prato also serves as an officer of other funds. Ms. Del Prato serves as Assistant Treasurer of FIMM, LLC (2021-present) and is an employee of Fidelity Investments (2017-present). Previously, Ms. Del Prato served as President and Treasurer of The North Carolina Capital Management Trust: Cash Portfolio and Term Portfolio (2018-2020). Prior to joining Fidelity Investments, Ms. Del Prato served as a Managing Director and Treasurer of the JPMorgan Mutual Funds (2014-2017). Prior to JPMorgan, Ms. Del Prato served as a partner at Cohen Fund Audit Services (accounting firm, 2012-2013) and KPMG LLP (accounting firm, 2004-2012).
Colm A. Hogan (1973)
Year of Election or Appointment: 2020
Assistant Treasurer
Mr. Hogan also serves as an officer of other funds. Mr. Hogan serves as Assistant Treasurer of FIMM, LLC (2021-present) and FMR Capital, Inc. (2017-present) and is an employee of Fidelity Investments (2005-present). Previously, Mr. Hogan served as Deputy Treasurer of certain Fidelity® funds (2016-2020) and Assistant Treasurer of certain Fidelity® funds (2016-2018).
Pamela R. Holding (1964)
Year of Election or Appointment: 2018
Vice President
Ms. Holding also serves as Vice President of other funds. Ms. Holding serves as Co-Head of Equity (2018-present) and is an employee of Fidelity Investments (2013-present). Previously, Ms. Holding served as Executive Vice President of Fidelity SelectCo, LLC (2019) and as Chief Investment Officer of Fidelity Institutional Asset Management (2013-2018).
Chris Maher (1972)
Year of Election or Appointment: 2020
Deputy Treasurer
Mr. Maher also serves as an officer of other funds. Mr. Maher serves as Assistant Treasurer of FIMM, LLC (2021-present) and FMR Capital, Inc. (2017-present), and is an employee of Fidelity Investments (2008-present). Previously, Mr. Maher served as Assistant Treasurer of certain funds (2013-2020); Vice President of Asset Management Compliance (2013), Vice President of the Program Management Group of FMR (investment adviser firm, 2010-2013), and Vice President of Valuation Oversight (2008-2010).
Jason P. Pogorelec (1975)
Year of Election or Appointment: 2020
Chief Compliance Officer
Mr. Pogorelec also serves as Chief Compliance Officer of other funds. Mr. Pogorelec is a Senior Vice President of Asset Management Compliance for Fidelity Investments and is an employee of Fidelity Investments. Mr. Pogorelec serves as Compliance Officer of Fidelity Management & Research Company LLC (investment adviser firm, 2023-present). Previously, Mr. Pogorelec served as Vice President, Associate General Counsel for Fidelity Investments (2010-2020) and Assistant Secretary of certain Fidelity® funds (2015-2020).
Brett Segaloff (1972)
Year of Election or Appointment: 2021
Anti-Money Laundering (AML) Officer
Mr. Segaloff also serves as an AML Officer of other funds and other related entities. He is Director, Anti-Money Laundering (2007-present) of FMR LLC (diversified financial services company) and is an employee of Fidelity Investments (1996-present).
Stacie M. Smith (1974)
Year of Election or Appointment: 2018
President and Treasurer
Ms. Smith also serves as an officer of other funds. Ms. Smith serves as Assistant Treasurer of FIMM, LLC (2021-present) and FMR Capital, Inc. (2017-present), is an employee of Fidelity Investments (2009-present), and has served in other fund officer roles. Prior to joining Fidelity Investments, Ms. Smith served as Senior Audit Manager of Ernst & Young LLP (accounting firm, 1996-2009). Previously, Ms. Smith served as Assistant Treasurer (2013-2019) and Deputy Treasurer (2013-2016) of certain Fidelity® funds.
Jim Wegmann (1979)
Year of Election or Appointment: 2019
Assistant Treasurer
Mr. Wegmann also serves as an officer of other funds. Mr. Wegmann serves as Assistant Treasurer of FIMM, LLC (2021-present) and is an employee of Fidelity Investments (2011-present). Previously, Mr. Wegmann served as Assistant Treasurer of certain Fidelity® funds (2019-2021).
As a shareholder, you incur two types of costs: (1) transaction costs, which may include sales charges (loads) on purchase payments or redemption proceeds, as applicable and (2) ongoing costs, which generally include management fees, distribution and/or service (12b-1) fees and other Fund expenses. This Example is intended to help you understand your ongoing costs (in dollars) of investing in a fund and to compare these costs with the ongoing costs of investing in other mutual funds.
| The Example is based on an investment of $1,000 invested at the beginning of the period and held for the entire period (February 1, 2023 to July 31, 2023). |
Actual Expenses
The first line of the accompanying table provides information about actual account values and actual expenses. You may use the information in this line, together with the amount you invested, to estimate the expenses that you paid over the period. Simply divide your account value by $1,000.00 (for example, an $8,600 account value divided by $1,000.00 = 8.6), then multiply the result by the number in the first line for a class/Fund under the heading entitled "Expenses Paid During Period" to estimate the expenses you paid on your account during this period. If any fund is a shareholder of any underlying mutual funds or exchange-traded funds (ETFs) (the Underlying Funds), such fund indirectly bears its proportional share of the expenses of the Underlying Funds in addition to the direct expenses incurred presented in the table. These fees and expenses are not included in the annualized expense ratio used to calculate the expense estimate in the table below.
Hypothetical Example for Comparison Purposes
The second line of the accompanying table provides information about hypothetical account values and hypothetical expenses based on the actual expense ratio and an assumed rate of return of 5% per year before expenses, which is not the actual return. The hypothetical account values and expenses may not be used to estimate the actual ending account balance or expenses you paid for the period. You may use this information to compare the ongoing costs of investing in the Fund and other funds. To do so, compare this 5% hypothetical example with the 5% hypothetical examples that appear in the shareholder reports of the other funds. If any fund is a shareholder of any Underlying Funds, such fund indirectly bears its proportional share of the expenses of the Underlying Funds in addition to the direct expenses as presented in the table. These fees and expenses are not included in the annualized expense ratio used to calculate the expense estimate in the table below.
Please note that the expenses shown in the table are meant to highlight your ongoing costs only and do not reflect any transaction costs. Therefore, the second line of the table is useful in comparing ongoing costs only, and will not help you determine the relative total costs of owning different funds. In addition, if these transactional costs were included, your costs would have been higher.
| | | | | Annualized Expense Ratio- A | | Beginning Account Value February 1, 2023 | | Ending Account Value July 31, 2023 | | Expenses Paid During Period- C February 1, 2023 to July 31, 2023 |
| Fidelity Advisor® Global Real Estate Fund | | | | | | | | | | |
| Class A | | | | 1.20% | | | | | | |
| Actual | | | | | | $ 1,000 | | $ 966.90 | | $ 5.85 |
Hypothetical-B | | | | | | $ 1,000 | | $ 1,018.84 | | $ 6.01 |
| Class M | | | | 1.45% | | | | | | |
| Actual | | | | | | $ 1,000 | | $ 965.90 | | $ 7.07 |
Hypothetical-B | | | | | | $ 1,000 | | $ 1,017.60 | | $ 7.25 |
| Class C | | | | 1.95% | | | | | | |
| Actual | | | | | | $ 1,000 | | $ 963.20 | | $ 9.49 |
Hypothetical-B | | | | | | $ 1,000 | | $ 1,015.12 | | $ 9.74 |
| Class I | | | | .95% | | | | | | |
| Actual | | | | | | $ 1,000 | | $ 967.80 | | $ 4.64 |
Hypothetical-B | | | | | | $ 1,000 | | $ 1,020.08 | | $ 4.76 |
| Class Z | | | | .80% | | | | | | |
| Actual | | | | | | $ 1,000 | | $ 969.00 | | $ 3.91 |
Hypothetical-B | | | | | | $ 1,000 | | $ 1,020.83 | | $ 4.01 |
| |
A Annualized expense ratio reflects expenses net of applicable fee waivers.
B 5% return per year before expenses
C Expenses are equal to the annualized expense ratio, multiplied by the average account value over the period, multiplied by 181/ 365 (to reflect the one-half year period). The fees and expenses of any Underlying Funds are not included in each annualized expense ratio.
The dividend and capital gains distributions for the fund(s) are available on Fidelity.com or Institutional.Fidelity.com.
Class A designates 69.67% and 33.49%; Class M designates 100% and 33.49%; Class C designates 33.49%, Class I designates 52.10% and 33.49% and Class Z designates 52.10% and 33.49%; of the dividends distributed December 23rd and December 29th, respectively during the fiscal year as amounts which may be taken into account as a dividend for purposes of the maximum rate under section 1(h)(11) of the Internal Revenue Code.
Class A designates 30.33% and 66.51%; Class M designates 65.51% and 0.00%; Class C designates 66.51%; Class I designates 47.90% and 66.51%; and Class Z designates 47.90% and 66.51%; of the dividends distributed December 23rd and December 29th, respectively during the fiscal year as a section 199A dividend.
The fund designates $570 of distributions paid during the fiscal year ended 2023 as qualifying to be taxed as section 163(j) interest dividends.
The fund will notify shareholders in January 2024 of amounts for use in preparing 2023 income tax returns.
Board Approval of Investment Advisory Contracts and Management Fees
Fidelity Advisor Global Real Estate Fund
Each year, the Board of Trustees, including the Independent Trustees (together, the Board), considers the renewal of the fund's management contract with Fidelity Management & Research Company LLC (FMR) and the sub-advisory agreements (together, the Advisory Contracts) for the fund. FMR and the sub-advisers are referred to herein as the Investment Advisers. The Board, assisted by the advice of fund counsel and Independent Trustees' counsel, requests and considers a broad range of information relevant to the renewal of the Advisory Contracts throughout the year.
The Board meets regularly and, at each of its meetings, covers an extensive agenda of topics and materials and considers factors that are relevant to its annual consideration of the renewal of the fund's Advisory Contracts, including the services and support provided to the fund and its shareholders. The Board, acting directly and through its Committees (each of which is composed of and chaired by Independent Trustees), requests and receives information concerning the annual consideration of the renewal of the fund's Advisory Contracts. The Board also meets as needed to review matters specifically related to the Board's annual consideration of the renewal of the Advisory Contracts. Members of the Board may also meet with trustees of other Fidelity funds through joint ad hoc committees to discuss certain matters relevant to all of the Fidelity funds.
Approval of Stub Period Continuation. At its May 2023 meeting, the Board of Trustees voted to continue the fund's management contract with FMR, and the sub-advisory agreements and sub-sub-advisory agreements, in each case, where applicable (together, the Advisory Contracts), without modification, for two months from June 1, 2023 through July 31, 2023. The Board considered that the approval of the fund's Advisory Contracts will not result in any changes in (i) the investment process or strategies employed in the management of the fund's assets; (ii) the fees and expenses paid by shareholders; (iii) the nature, extent or quality of services provided under the fund's Advisory Contracts; or (iv) the day-to-day management of the fund or the persons primarily responsible for such management. The Board also considered that since its last approval of the fund's Advisory Contracts, FMR had provided additional information on the fund in support of the annual contract renewal process, including competitive analyses on total expenses and management fees and in-depth reviews of fund performance and fund profitability information. The Board concluded that the fund's Advisory Contracts are fair and reasonable, and that the fund's Advisory Contracts should be renewed, without modification, through July 31, 2023, with the understanding that the Board would consider the annual renewal for a full one year period in July 2023.
At its July 2023 meeting, the Board unanimously determined to renew the fund's Advisory Contracts. In reaching its determination, the Board considered all factors it believed relevant, including (i) the nature, extent, and quality of the services provided to the fund and its shareholders (including the investment performance of the fund); (ii) the competitiveness relative to peer funds of the fund's management fee and the total expense ratio of a representative class (Class I, which was selected because it is the largest class without 12b-1 fees); (iii) the total costs of the services provided by and the profits realized by FMR and its affiliates (Fidelity) from its relationships with the fund; and (iv) the extent to which, if any, economies of scale exist and are realized as the fund grows, and whether any economies of scale are appropriately shared with fund shareholders. The Board also considered the broad range of investment choices available to shareholders from FMR's competitors and that the fund's shareholders have chosen to invest in the fund, which is part of the Fidelity family of funds. The Board's decision to renew the Advisory Contracts was not based on any single factor.
The Board reached a determination, with the assistance of fund counsel and Independent Trustees' counsel and through the exercise of its business judgment, that the renewal of the Advisory Contracts was in the best interests of the fund and its shareholders and that the compensation payable under the Advisory Contracts was fair and reasonable in light of all of the surrounding circumstances.
Nature, Extent, and Quality of Services Provided. The Board considered staffing as it relates to the fund, including the backgrounds and experience of investment personnel of the Investment Advisers, and also considered the Investment Advisers' implementation of the fund's investment program. The Independent Trustees also had discussions with senior management of Fidelity's investment operations and investment groups. The Board considered the structure of the investment personnel compensation program and whether this structure provides appropriate incentives to act in the best interests of the fund. Additionally, the Board considered the portfolio managers' investments, if any, in the funds that they manage.
Resources Dedicated to Investment Management and Support Services. The Board and the Fund Oversight and Research Committees reviewed the general qualifications and capabilities of Fidelity's investment staff, including its size, education, experience, and resources, as well as Fidelity's approach to recruiting, training, managing, and compensating investment personnel. The Board noted the resources devoted to expansion of Fidelity's global investment organization, and that Fidelity's analysts have extensive resources, tools and capabilities that allow them to conduct sophisticated quantitative and fundamental analysis, as well as credit analysis of issuers, counterparties and guarantors. Further, the Board considered that Fidelity's investment professionals have sufficient access to global information and data so as to provide competitive investment results over time, and that those professionals also have access to sophisticated tools that permit them to assess portfolio construction and risk and performance attribution characteristics continuously, as well as to transmit new information and research conclusions rapidly around the world. Additionally, in its deliberations, the Board considered Fidelity's trading, risk management, compliance, and technology and operations capabilities and resources, which are integral parts of the investment management process.
Shareholder and Administrative Services. The Board considered (i) the nature, extent, quality, and cost of advisory, administrative, and shareholder services performed by the Investment Advisers and their affiliates under the Advisory Contracts and under separate agreements covering transfer agency, pricing and bookkeeping, and securities lending services for the fund; (ii) the nature and extent of Fidelity's supervision of third party service providers, principally custodians, subcustodians, and pricing vendors; and (iii) the resources devoted by Fidelity to, and the record of compliance with, the fund's compliance policies and procedures. The Board also reviewed the allocation of fund brokerage, including allocations to brokers affiliated with the Investment Advisers, the use of brokerage commissions to pay fund expenses, and the use of "soft" commission dollars to pay for research services. The Board also considered the fund's securities lending activities and any payments made to Fidelity relating to securities lending.
The Board noted that the growth of fund assets over time across the complex allows Fidelity to reinvest in the development of services designed to enhance the value and convenience of the Fidelity funds as investment vehicles. These services include 24-hour access to account information and market information over the Internet and through telephone representatives, investor education materials and asset allocation tools. The Board also considered that it reviews customer service metrics such as telephone response times, continuity of services on the website and metrics addressing services at Fidelity Investor Centers.
Investment in a Large Fund Family. The Board considered the benefits to shareholders of investing in a fund that is part of a large family of funds offering a variety of investment disciplines and providing a large variety of fund investor services. The Board noted that Fidelity had taken, or had made recommendations that resulted in the Fidelity funds taking, a number of actions over the previous year that benefited particular funds and/or the Fidelity funds in general.
Investment Performance. The Board took into account discussions that occur with representatives of the Investment Advisers, and reports that it receives, at Board meetings throughout the year, relating to fund investment performance. In this regard the Board noted that as part of regularly scheduled fund reviews and other reports to the Board on fund performance, the Board considered annualized return information for the fund for different time periods, measured against an appropriate securities market index (benchmark index) and an appropriate peer group of funds with similar objectives (peer group). The Board also considered information about performance attribution. In its ongoing evaluation of fund investment performance, the Board gives particular attention to information indicating changes in performance of the funds over different time periods and discussed with the Investment Advisers the reasons for any overperformance or underperformance.
In addition to reviewing absolute and relative fund performance, the Independent Trustees periodically consider the appropriateness of fund performance metrics in evaluating the results achieved. The Independent Trustees generally give greater weight to fund performance over longer time periods than over shorter time periods. Depending on the circumstances, the Independent Trustees may be satisfied with a fund's performance notwithstanding that it lags its benchmark index or peer group for certain periods.
Based on its review, the Board concluded that the nature, extent, and quality of services provided to the fund under the Advisory Contracts should continue to benefit the shareholders of the fund.
Competitiveness of Management Fee and Total Expense Ratio. The Board was provided with information regarding industry trends in management fees and expenses. In its review of the fund's management fee and the total expense ratio of Class I, the Board considered the fund's management fee rate as well as other fund or class expenses, as applicable, such as transfer agent fees, pricing and bookkeeping fees, fund-paid 12b-1 fees, and custodial, legal, and audit fees. The Board noted that Fidelity may agree to waive fees or reimburse expenses from time to time, and the extent to which, if any, it has done so for the fund.
Comparisons of Management Fees and Total Expense Ratios. Among other things, the Board reviewed data for selected groups of competitive funds and classes (referred to as "mapped groups") that were compiled by Fidelity based on combining similar investment objective categories (as classified by Lipper) that have comparable investment mandates. The data reviewed by the Board included (i) gross management fee comparisons (before taking into account expense reimbursements or caps) relative to the total universe of funds within the mapped group; (ii) gross management fee comparisons relative to a subset of non-Fidelity funds in the mapped group that are similar in size and management fee structure to the fund (referred to as the "asset size peer group"); (iii) total expense comparisons of Class I of the fund relative to funds and classes in the mapped group that have a similar sales load structure to Class I of the fund (referred to as the "similar sales load structure group"); and (iv) total expense comparisons of Class I of the fund relative to funds and classes in the similar sales load structure group that are similar in size and management fee structure to the fund (referred to as the "total expense asset size peer group"). The total expense asset size peer group comparison excludes performance adjustments and fund-paid 12b-1 fees to eliminate variability in fee structures.
The information provided to the Board indicated that the fund's management fee rate ranked below the competitive median of the mapped group for the 12-month period ended September 30, 2022 and below the competitive median of the asset size peer group for the 12-month period ended September 30, 2022. Further, the information provided to the Board indicated that the total expense ratio of Class I of the fund ranked below the competitive median of the similar sales load structure group for the 12-month period ended September 30, 2022 and below the competitive median of the total expense asset size peer group for the 12-month period ended September 30, 2022.
The Board also considered that, for funds subject to the group fee, FMR agreed to voluntarily waive fees over a specified period of time in amounts designed to account for assets converted from certain funds to certain collective investment trusts.
Other Contractual Arrangements. The Board further considered that the investment adviser has contractually agreed to reimburse Class A, Class M, Class C, Class I, and Class Z of the fund to the extent that total operating expenses, with certain exceptions, as a percentage of their respective average net assets, exceed 1.20%, 1.45%, 1.95%,0.95%, and 0.80% through November 30, 2023.
Fees Charged to Other Fidelity Clients. The Board also considered Fidelity fee structures and other information with respect to clients of Fidelity, such as other funds advised or subadvised by Fidelity, pension plan clients, and other institutional clients with similar mandates. The Board noted that a joint ad hoc committee created by it and the boards of other Fidelity funds periodically reviews and compares Fidelity's institutional investment advisory business with its business of providing services to the Fidelity funds and also noted the most recent findings of the committee. The Board noted that the committee's review included a consideration of the differences in services provided, fees charged, and costs incurred, as well as competition in the markets serving the different categories of clients.
Based on its review, the Board concluded that the fund's management fee is fair and reasonable in light of the services that the fund receives and the other factors considered. Further, based on its review of total expense ratios and fees charged to other Fidelity clients, the Board concluded that the total expense ratio of each class of the fund was reasonable in light of the services that the fund and its shareholders receive and the other factors considered.
Costs of the Services and Profitability. The Board considered the revenues earned and the expenses incurred by Fidelity in conducting the business of developing, marketing, distributing, managing, administering and servicing the fund and servicing the fund's shareholders. The Board also considered the level of Fidelity's profits in respect of all the Fidelity funds.
On an annual basis, Fidelity presents to the Board information about the profitability of its relationships with the fund. Fidelity calculates profitability information for each fund, as well as aggregate profitability information for groups of Fidelity funds and all Fidelity funds, using a series of detailed revenue and cost allocation methodologies which originate with the books and records of Fidelity on which Fidelity's audited financial statements are based. The Audit Committee of the Board reviews any significant changes from the prior year's methodologies and the full Board approves such changes.
A public accounting firm has been engaged annually by the Board as part of the Board's assessment of Fidelity's profitability analysis. The engagement includes the review and assessment of the methodologies used by Fidelity in determining the revenues and expenses attributable to Fidelity's fund business, and completion of agreed-upon procedures in respect of the mathematical accuracy of certain fund profitability information and its conformity to established allocation methodologies. After considering the reports issued under the engagement and information provided by Fidelity, the Board concluded that while other allocation methods may also be reasonable, Fidelity's profitability methodologies are reasonable in all material respects.
The Board also reviewed Fidelity's non-fund businesses and potential indirect benefits such businesses may have received as a result of their association with Fidelity's fund business (i.e., fall-out benefits) as well as cases where Fidelity's affiliates may benefit from the funds' business. The Board considered areas where potential indirect benefits to the Fidelity funds from their relationships with Fidelity may exist. The Board's consideration of these matters was informed by the findings of a joint ad hoc committee created by it and the boards of other Fidelity funds to evaluate potential fall-out benefits.
The Board considered the costs of the services provided by and the profits realized by Fidelity in connection with the operation of the fund and was satisfied that the profitability was not excessive.
Economies of Scale. The Board considered whether there have been economies of scale in respect of the management of the Fidelity funds, whether the Fidelity funds (including the fund) have appropriately benefited from any such economies of scale, and whether there is potential for realization of any further economies of scale. The Board considered the extent to which the fund will benefit from economies of scale as assets grow through increased services to the fund, through waivers or reimbursements, or through fee or expense ratio reductions. The Board also noted that a committee (the Economies of Scale Committee) created by it and the boards of other Fidelity funds periodically analyzes whether Fidelity attains economies of scale in respect of the management and servicing of the Fidelity funds, whether the Fidelity funds have appropriately benefited from such economies of scale, and whether there is potential for realization of any further economies of scale.
The Board recognized that the fund's management contract incorporates a "group fee" structure, which provides for lower group fee rates as total "group assets" increase, and for higher group fee rates as total "group assets" decrease ("group assets" as defined in the management contract). FMR calculates the group fee rates based on a tiered asset "breakpoint" schedule that varies based on asset class. The Board considered that the group fee is designed to deliver the benefits of economies of scale to fund shareholders when total Fidelity fund assets increase, even if assets of any particular fund are unchanged or have declined, because some portion of Fidelity's costs are attributable to services provided to all Fidelity funds, and all funds benefit if those costs can be allocated among more assets. The Board further considered that Fidelity agreed to impose a temporary fee waiver in the form of additional breakpoints to the current breakpoint schedule. The Board concluded that, given the group fee structure, fund shareholders will benefit from lower management fees as "group assets" increase at the fund complex level, regardless of whether Fidelity achieves any such economies of scale.
The Board concluded, taking into account the analysis of the Economies of Scale Committee, that economies of scale, if any, are being appropriately shared between fund shareholders and Fidelity.
Additional Information Requested by the Board. In order to develop fully the factual basis for consideration of the Fidelity funds' advisory contracts, the Board requested and received additional information on certain topics, including: (i) fund flow and performance trends, in particular the underperformance of certain funds and strategies, and Fidelity's long-term strategies for certain funds, including any consideration of fund liquidations or mergers; (ii) the operation of performance fees and competitor use of performance fees; (iii) Fidelity's pricing philosophy compared to competitors; (iv) fund profitability methodology and data; (v) evaluation of competitive fund data and peer group classifications and fee and expense comparisons; (vi) the management fee and expense structures for different funds and classes and information about the differences between various fee and expense structures; (vii) group fee breakpoints and related voluntary fee waivers; and (viii) information regarding other accounts managed by Fidelity and the funds' sub-advisory arrangements.
Conclusion. Based on its evaluation of all of the conclusions noted above, and after considering all factors it believed relevant, the Board, including the Independent Trustees, concluded that the advisory and sub-advisory fee arrangements are fair and reasonable in light of all of the surrounding circumstances and that the fund's Advisory Contracts should be renewed through July 31, 2024.
1.9881280.106
AGRE-ANN-0923
Item 2.
Code of Ethics
As of the end of the period, July 31, 2023, Fidelity Advisor Series VII (the trust) has adopted a code of ethics, as defined in Item 2 of Form N-CSR, that applies to its President and Treasurer and its Chief Financial Officer. A copy of the code of ethics is filed as an exhibit to this Form N-CSR.
Item 3.
Audit Committee Financial Expert
The Board of Trustees of the trust has determined that Donald F. Donahue is an audit committee financial expert, as defined in Item 3 of Form N-CSR. Mr. Donahue is independent for purposes of Item 3 of Form N-CSR.
Item 4.
Principal Accountant Fees and Services
Fees and Services
The following table presents fees billed by Deloitte & Touche LLP, the member firms of Deloitte Touche Tohmatsu, and their respective affiliates (collectively, “Deloitte Entities”) in each of the last two fiscal years for services rendered to Fidelity Advisor Biotechnology Fund, Fidelity Advisor Consumer Discretionary Fund, Fidelity Advisor Energy Fund, Fidelity Advisor Financials Fund, Fidelity Advisor Global Real Estate Fund, Fidelity Advisor Health Care Fund, Fidelity Advisor Industrials Fund, Fidelity Advisor Real Estate Fund, Fidelity Advisor Semiconductors Fund, Fidelity Advisor Technology Fund and Fidelity Advisor Utilities Fund (the “Funds”):
Services Billed by Deloitte Entities
July 31, 2023 FeesA
| | | | |
| Audit Fees | Audit-Related Fees | Tax Fees | All Other Fees |
Fidelity Advisor Biotechnology Fund | $51,900 | $- | $7,200 | $1,300 |
Fidelity Advisor Consumer Discretionary Fund | $34,500 | $- | $8,700 | $900 |
Fidelity Advisor Energy Fund | $36,500 | $- | $10,000 | $1,000 |
Fidelity Advisor Financials Fund | $36,400 | $- | $9,700 | $1,000 |
Fidelity Advisor Global Real Estate Fund | $43,900 | $- | $8,900 | $1,100 |
Fidelity Advisor Health Care Fund | $36,400 | $- | $8,900 | $1,000 |
Fidelity Advisor Industrials Fund | $35,400 | $- | $8,700 | $900 |
Fidelity Advisor Real Estate Fund | $38,500 | $- | $8,700 | $1,000 |
Fidelity Advisor Semiconductors Fund | $34,500 | $- | $7,200 | $900 |
Fidelity Advisor Technology Fund | $38,100 | $- | $8,900 | $1,000 |
Fidelity Advisor Utilities Fund | $34,100 | $- | $8,900 | $900 |
| | | | |
| | | | |
| Audit Fees | Audit-Related Fees | Tax Fees | All Other Fees |
Fidelity Advisor Biotechnology Fund | $51,600 | $- | $7,100 | $1,200 |
Fidelity Advisor Consumer Discretionary Fund | $34,100 | $- | $8,500 | $900 |
Fidelity Advisor Energy Fund | $36,000 | $- | $9,900 | $900 |
Fidelity Advisor Financials Fund | $35,900 | $- | $9,700 | $900 |
Fidelity Advisor Global Real Estate Fund | $43,500 | $- | $8,700 | $1,000 |
Fidelity Advisor Health Care Fund | $35,800 | $- | $9,000 | $900 |
Fidelity Advisor Industrials Fund | $35,000 | $- | $8,500 | $900 |
Fidelity Advisor Real Estate Fund | $38,000 | $- | $8,500 | $900 |
Fidelity Advisor Semiconductors Fund | $33,900 | $- | $7,400 | $800 |
Fidelity Advisor Technology Fund | $37,400 | $- | $8,700 | $900 |
Fidelity Advisor Utilities Fund | $33,700 | $- | $8,700 | $800 |
A Amounts may reflect rounding.
The following table(s) present(s) fees billed by Deloitte Entities that were required to be approved by the Audit Committee for services that relate directly to the operations and financial reporting of the Fund(s) and that are rendered on behalf of Fidelity Management & Research Company LLC ("FMR") and entities controlling, controlled by, or under common control with FMR (not including any sub-adviser whose role is primarily portfolio management and is subcontracted with or overseen by another investment adviser) that provide ongoing services to the Fund(s) (“Fund Service Providers”):
Services Billed by Deloitte Entities
| | |
| July 31, 2023A | July 31, 2022A |
Audit-Related Fees | $- | $- |
Tax Fees | $- | $- |
All Other Fees | $- | $- |
A Amounts may reflect rounding.
“Audit-Related Fees” represent fees billed for assurance and related services that are reasonably related to the performance of the fund audit or the review of the fund's financial statements and that are not reported under Audit Fees.
“Tax Fees” represent fees billed for tax compliance, tax advice or tax planning that relate directly to the operations and financial reporting of the fund.
“All Other Fees” represent fees billed for services provided to the fund or Fund Service Provider, a significant portion of which are assurance related, that relate directly to the operations and financial reporting of the fund, excluding those services that are reported under Audit Fees, Audit-Related Fees or Tax Fees.
Assurance services must be performed by an independent public accountant.
* * *
The aggregate non-audit fees billed by Deloitte Entities for services rendered to the Fund(s), FMR (not including any sub-adviser whose role is primarily portfolio management and is subcontracted with or overseen by another investment adviser), and any Fund Service Provider for each of the last two fiscal years of the Fund(s) are as follows:
| | |
Billed By | July 31, 2023A | July 31, 2022A |
Deloitte Entities | $349,400 | $562,400 |
A Amounts may reflect rounding.
The trust's Audit Committee has considered non-audit services that were not pre-approved that were provided by Deloitte Entities to Fund Service Providers to be compatible with maintaining the independence of Deloitte Entities in its(their) audit of the Fund(s), taking into account representations from Deloitte Entities, in accordance with Public Company Accounting Oversight Board rules, regarding its independence from the Fund(s) and its(their) related entities and FMR’s review of the appropriateness and permissibility under applicable law of such non-audit services prior to their provision to the Fund(s) Service Providers.
Audit Committee Pre-Approval Policies and Procedures
The trust’s Audit Committee must pre-approve all audit and non-audit services provided by a fund’s independent registered public accounting firm relating to the operations or financial reporting of the fund. Prior to the commencement of any audit or non-audit services to a fund, the Audit Committee reviews the services to determine whether they are appropriate and permissible under applicable law.
The Audit Committee has adopted policies and procedures to, among other purposes, provide a framework for the Committee’s consideration of non-audit services by the audit firms that audit the Fidelity funds. The policies and procedures require that any non-audit service provided by a fund audit firm to a Fidelity fund and any non-audit service provided by a fund auditor to a Fund Service Provider that relates directly to the operations and financial reporting of a Fidelity fund (“Covered Service”) are subject to approval by the Audit Committee before such service is provided.
All Covered Services must be approved in advance of provision of the service either: (i) by formal resolution of the Audit Committee, or (ii) by oral or written approval of the service by the Chair of the Audit Committee (or if the Chair is unavailable, such other member of the Audit Committee as may be designated by the Chair to act in the Chair’s absence). The approval contemplated by (ii) above is permitted where the Treasurer determines that action on such an engagement is necessary before the next meeting of the Audit Committee.
Non-audit services provided by a fund audit firm to a Fund Service Provider that do not relate directly to the operations and financial reporting of a Fidelity fund are reported to the Audit Committee periodically.
Non-Audit Services Approved Pursuant to Rule 2-01(c)(7)(i)(C) and (ii) of Regulation S-X (“De Minimis Exception”)
There were no non-audit services approved or required to be approved by the Audit Committee pursuant to the De Minimis Exception during the Fund’s(s’) last two fiscal years relating to services provided to (i) the Fund(s) or (ii) any Fund Service Provider that relate directly to the operations and financial reporting of the Fund(s).
The Registrant has not retained, for the preparation of the audit report on the financial statements included in the Form N-CSR, a registered public accounting firm that has a branch or office that is located in a foreign jurisdiction and that the Public Company Accounting Oversight Board (the “PCAOB”) has determined that the PCAOB is unable to inspect or investigate completely because of a position taken by an authority in the foreign jurisdiction.
The Registrant is not a “foreign issuer,” as defined in 17 CFR 240.3b-4.
Item 5.
Audit Committee of Listed Registrants
Not applicable.
Item 6.
Investments
(a)
Not applicable.
(b)
Not applicable.
Item 7.
Disclosure of Proxy Voting Policies and Procedures for Closed-End Management Investment Companies
Not applicable.
Item 8.
Portfolio Managers of Closed-End Management Investment Companies
Not applicable.
Item 9.
Purchase of Equity Securities by Closed-End Management Investment Company and Affiliated Purchasers
Not applicable.
Item 10.
Submission of Matters to a Vote of Security Holders
There were no material changes to the procedures by which shareholders may recommend nominees to the trust’s Board of Trustees.
Item 11.
Controls and Procedures
(a)(i) The President and Treasurer and the Chief Financial Officer have concluded that the trust’s disclosure controls and procedures (as defined in Rule 30a-3(c) under the Investment Company Act) provide reasonable assurances that material information relating to the trust is made known to them by the appropriate persons, based on their evaluation of these controls and procedures as of a date within 90 days of the filing date of this report.
(a)(ii) There was no change in the trust’s internal control over financial reporting (as defined in Rule 30a-3(d) under the Investment Company Act) that occurred during the period covered by this report that has materially affected, or is reasonably likely to materially affect, the trust’s internal control over financial reporting.
Item 12.
Disclosure of Securities Lending Activities for Closed-End Management
Investment Companies
Not applicable.
Item 13.
Exhibits
SIGNATURES
Pursuant to the requirements of the Securities Exchange Act of 1934 and the Investment Company Act of 1940, the registrant has duly caused this report to be signed on its behalf by the undersigned, thereunto duly authorized.
Fidelity Advisor Series VII
| |
By: | /s/Stacie M. Smith |
| Stacie M. Smith |
| President and Treasurer |
| |
Date: | September 21, 2023 |
Pursuant to the requirements of the Securities Exchange Act of 1934 and the Investment Company Act of 1940, this report has been signed below by the following persons on behalf of the registrant and in the capacities and on the dates indicated.
| |
By: | /s/Stacie M. Smith |
| Stacie M. Smith |
| President and Treasurer |
| |
Date: | September 21, 2023 |
| |
By: | /s/John J. Burke III |
| John J. Burke III |
| Chief Financial Officer |
| |
Date: | September 21, 2023 |