Fidelity Advisor Focus Funds®
Fidelity Advisor® Biotechnology Fund
Fidelity Advisor® Consumer Discretionary Fund
Fidelity Advisor® Energy Fund
Fidelity Advisor® Financial Services Fund
Fidelity Advisor® Health Care Fund
Fidelity Advisor® Industrials Fund
Fidelity Advisor® Semiconductors Fund
Fidelity Advisor® Technology Fund
Fidelity Advisor® Utilities Fund
Annual Report
July 31, 2022


Contents
To view a fund's proxy voting guidelines and proxy voting record for the 12-month period ended June 30, visit http://www.fidelity.com/proxyvotingresults or visit the Securities and Exchange Commission's (SEC) web site at http://www.sec.gov.
You may also call 1-877-208-0098 to request a free copy of the proxy voting guidelines.
Standard & Poor's, S&P and S&P 500 are registered service marks of The McGraw-Hill Companies, Inc. and have been licensed for use by Fidelity Distributors Corporation.
Other third-party marks appearing herein are the property of their respective owners.
All other marks appearing herein are registered or unregistered trademarks or service marks of FMR LLC or an affiliated company. © 2022 FMR LLC. All rights reserved.
This report and the financial statements contained herein are submitted for the general information of the shareholders of the Funds. This report is not authorized for distribution to prospective investors in the Funds unless preceded or accompanied by an effective prospectus.
A fund files its complete schedule of portfolio holdings with the SEC for the first and third quarters of each fiscal year on Form N-PORT. Forms N-PORT are available on the SEC’s web site at http://www.sec.gov. A fund's Forms N-PORT may be reviewed and copied at the SEC’s Public Reference Room in Washington, DC. Information regarding the operation of the SEC's Public Reference Room may be obtained by calling 1-800-SEC-0330.
For a complete list of a fund's portfolio holdings, view the most recent holdings listing, semiannual report, or annual report on Fidelity's web site at http://www.fidelity.com, http://www.institutional.fidelity.com, or http://www.401k.com, as applicable.
NOT FDIC INSURED •MAY LOSE VALUE •NO BANK GUARANTEE
Neither the Funds nor Fidelity Distributors Corporation is a bank.
Note to Shareholders:
Early in 2020, the outbreak and spread of COVID-19 emerged as a public health emergency that had a major influence on financial markets, primarily based on its impact on the global economy and corporate earnings. On March 11, 2020, the World Health Organization declared the COVID-19 outbreak a pandemic, citing sustained risk of further global spread. The pandemic prompted a number of measures to limit the spread of COVID-19, including travel and border restrictions, quarantines, and restrictions on large gatherings. In turn, these resulted in lower consumer activity, diminished demand for a wide range of products and services, disruption in manufacturing and supply chains, and – given the wide variability in outcomes regarding the outbreak – significant market uncertainty and volatility. To help stem the turmoil, the U.S. government took unprecedented action – in concert with the U.S. Federal Reserve and central banks around the world – to help support consumers, businesses, and the broader economy, and to limit disruption to the financial system.
In general, the overall impact of the pandemic lessened in 2021, amid a resilient economy and widespread distribution of three COVID-19 vaccines granted emergency use authorization from the U.S. Food and Drug Administration (FDA) early in the year. Still, the situation remains dynamic, and the extent and duration of its influence on financial markets and the economy is highly uncertain, due in part to a recent spike in cases based on highly contagious variants of the coronavirus.
Extreme events such as the COVID-19 crisis are exogenous shocks that can have significant adverse effects on mutual funds and their investments. Although multiple asset classes may be affected by market disruption, the duration and impact may not be the same for all types of assets. Fidelity is committed to helping you stay informed amid news about COVID-19 and during increased market volatility, and we continue to take extra steps to be responsive to customer needs. We encourage you to visit us online, where we offer ongoing updates, commentary, and analysis on the markets and our funds.
Fidelity Advisor® Biotechnology Fund
Performance: The Bottom Line
Average annual total return reflects the change in the value of an investment, assuming reinvestment of distributions from dividend income and capital gains (the profits earned upon the sale of securities that have grown in value, if any) and assuming a constant rate of performance each year. The hypothetical investment and the average annual total returns do not reflect the deduction of taxes that a shareholder would pay on fund distributions or the redemption of fund shares. During periods of reimbursement by Fidelity, a fund’s total return will be greater than it would be had the reimbursement not occurred. How a fund did yesterday is no guarantee of how it will do tomorrow.
Average Annual Total Returns
| For the periods ended July 31, 2022 | Past 1 year | Past 5 years | Past 10 years |
| Class A (incl. 5.75% sales charge) | (23.61)% | 3.86% | 11.10% |
| Class M (incl. 3.50% sales charge) | (22.00)% | 4.04% | 11.02% |
| Class C (incl. contingent deferred sales charge) | (20.18)% | 4.31% | 11.10% |
| Class I | (18.74)% | 5.38% | 12.06% |
| Class Z | (18.63)% | 5.48% | 12.12% |
Class C shares' contingent deferred sales charges included in the past one year, past five years and past ten years total return figures are 1%, 0% and 0%, respectively.
The initial offering of Class Z shares took place on October 2, 2018. Returns prior to October 2, 2018, are those of Class I.
$10,000 Over 10 Years
Let's say hypothetically that $10,000 was invested in Fidelity Advisor® Biotechnology Fund - Class A on July 31, 2012, and the current 5.75% sales charge was paid.
The chart shows how the value of your investment would have changed, and also shows how the S&P 500® Index performed over the same period.
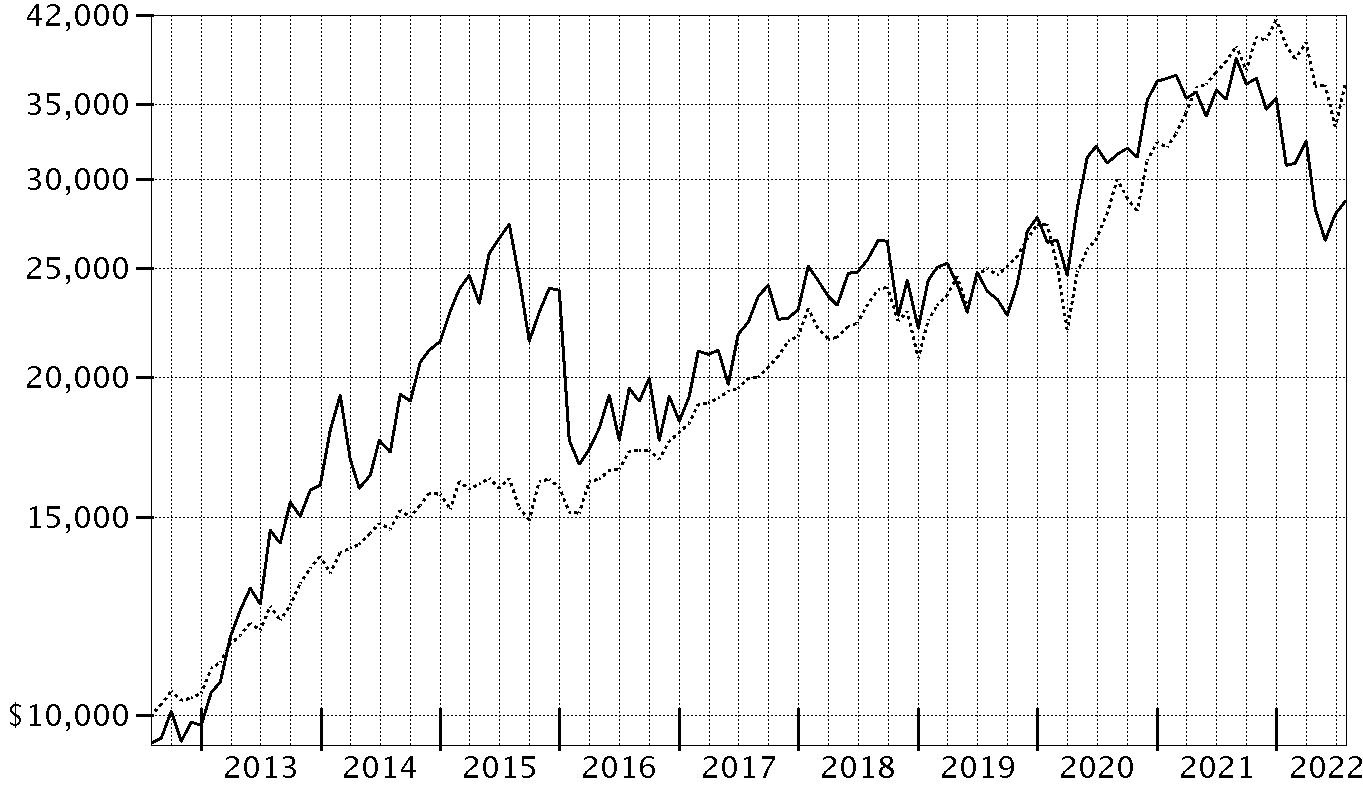
| Period Ending Values |
| $28,655 | Fidelity Advisor® Biotechnology Fund - Class A |
| $36,428 | S&P 500® Index |
Fidelity Advisor® Biotechnology Fund
Management's Discussion of Fund Performance
Market Recap: The S&P 500
® index returned -4.64% for the 12 months ending July 31, 2022, as a multitude of crosscurrents challenged the global economy and financial markets. Persistently high inflation, exacerbated by energy price shocks from the Russia–Ukraine conflict, spurred the U.S. Federal Reserve to hike interest rates more aggressively than anticipated, and concerns about the outlook for economic growth sent stocks into bear market territory. In early May, the Fed approved a rare half-percentage-point interest rate increase and announced plans to shrink its $9 trillion asset portfolio. June began with the Fed allowing up to billions in Treasuries and mortgage bonds to mature every month without investing the proceeds. Two weeks later, the central bank raised rates by 0.75 percentage points, its largest increase since 1994, and said it was becoming more difficult to achieve a soft landing, in which the economy slows enough to bring down inflation while avoiding a recession. Against this volatile backdrop, the S&P 500
® posted its worst first-half result (-19.96%) to begin a year since 1970. Stocks sharply reversed course in July (+9.22%), as the Fed again raised its benchmark interest rate by 0.75% but signaled that, at some point, it will likely slow the pace of tightening to assess the impact on the economy. For the full 12 months, growth-oriented communication services (-29%) and consumer discretionary (-10%) stocks lagged most. In contrast, energy (+67%) rode a surge in commodity prices and led by a wide margin, followed by the defensive utilities (+16%) and consumer staples (+7%) sectors.
Comments from Portfolio Manager Eirene Kontopoulos: For the fiscal year ending July 31, 2022, the fund's share classes (excluding sales charges, if applicable) returned about -20% to -19%, trailing the -11.37% result of the MSCI US IMI Biotechnology 25/50 Index, as well as the broad-based S&P 500
® index. Versus the industry index, security selection was the primary detractor, especially within the fund's core biotechnology segment. Out-of-index exposure to pharmaceuticals also hurt. An underweighting in Amgen (+6%), a position we established this period, was the fund's biggest individual relative detractor. Also hampering relative performance was an underweighting in AbbVie, which gained roughly 29%. We notably reduced our investment in AbbVie the past 12 months, but the company was nevertheless the fund's largest holding as of July 31. Also hindering performance was an overweighting in TG Therapeutics, which returned -87%. TG Therapeutics was not held at period end. In contrast, the largest contributor to performance versus the industry index was an out-of-index allocation to health care services. Specialty chemicals, where the fund also had non-index exposure, further boosted its relative result. The top individual relative contributor by far was an underweighting in Moderna, which returned about -54% the past year. Moderna was not held at period end. Also bolstering performance was our overweighting in Vertex Pharmaceuticals, which gained roughly 39%. Vertex Pharmaceuticals was among the fund's biggest holdings. The fund's non-index stake in Argenx, one of our largest holdings, gained about 20% and helped.
The views expressed above reflect those of the portfolio manager(s) only through the end of the period as stated on the cover of this report and do not necessarily represent the views of Fidelity or any other person in the Fidelity organization. Any such views are subject to change at any time based upon market or other conditions and Fidelity disclaims any responsibility to update such views. These views may not be relied on as investment advice and, because investment decisions for a Fidelity fund are based on numerous factors, may not be relied on as an indication of trading intent on behalf of any Fidelity fund.
Fidelity Advisor® Biotechnology Fund
Investment Summary (Unaudited)
Top Ten Stocks as of July 31, 2022
| | % of fund's net assets |
| AbbVie, Inc. | 13.5 |
| Vertex Pharmaceuticals, Inc. | 9.2 |
| Regeneron Pharmaceuticals, Inc. | 6.7 |
| Alnylam Pharmaceuticals, Inc. | 5.7 |
| Seagen, Inc. | 5.5 |
| Argenx SE ADR | 4.7 |
| Cytokinetics, Inc. | 4.1 |
| Blueprint Medicines Corp. | 3.3 |
| Ascendis Pharma A/S sponsored ADR | 2.7 |
| Xenon Pharmaceuticals, Inc. | 2.2 |
| | 57.6 |
Industries (% of fund's net assets)
| As of July 31, 2022 |
| | Biotechnology | 92.7% |
| | Pharmaceuticals | 6.5% |
| | Health Care Providers & Services | 0.2% |
| | Health Care Technology | 0.1% |
| | All Others* | 0.5% |

* Includes Short-Term investments and Net Other Assets (Liabilities).
Geographic Diversification (% of fund's net assets)
| As of July 31, 2022 |
| | United States of America* | 88.3% |
| | Netherlands | 4.7% |
| | Denmark | 2.7% |
| | Canada | 2.5% |
| | Ireland | 0.7% |
| | Cayman Islands | 0.6%�� |
| | Switzerland | 0.5% |

* Includes Short-Term investments and Net Other Assets (Liabilities).
Percentages are based on country or territory of incorporation and are adjusted for the effect of futures contracts, if applicable.
Fidelity Advisor® Biotechnology Fund
Schedule of Investments July 31, 2022
Showing Percentage of Net Assets
| Common Stocks - 97.3% | | | |
| | | Shares | Value |
| Biotechnology - 91.2% | | | |
| Biotechnology - 91.2% | | | |
| AbbVie, Inc. | | 1,535,180 | $220,313,681 |
| ADC Therapeutics SA (a)(b) | | 474,023 | 3,512,510 |
| Aerovate Therapeutics, Inc. (b) | | 432,100 | 9,614,225 |
| Alnylam Pharmaceuticals, Inc. (a) | | 652,886 | 92,735,927 |
| ALX Oncology Holdings, Inc. (a)(b) | | 543,283 | 5,258,979 |
| Ambrx Biopharma, Inc. ADR (a)(b) | | 757,124 | 2,104,805 |
| Amgen, Inc. | | 130,200 | 32,220,594 |
| Arcutis Biotherapeutics, Inc. (a) | | 835,833 | 20,277,309 |
| Argenx SE ADR (a) | | 211,100 | 76,884,731 |
| Ascendis Pharma A/S sponsored ADR (a)(b) | | 506,125 | 43,288,871 |
| Astria Therapeutics, Inc. (a) | | 377,445 | 1,547,525 |
| Aurinia Pharmaceuticals, Inc. (a)(b) | | 678,900 | 5,553,402 |
| Blueprint Medicines Corp. (a) | | 1,063,100 | 54,281,886 |
| Celldex Therapeutics, Inc. (a) | | 872,200 | 26,793,984 |
| Cerevel Therapeutics Holdings (a)(b) | | 725,938 | 19,084,910 |
| ChemoCentryx, Inc. (a) | | 548,074 | 12,945,508 |
| Cyteir Therapeutics, Inc. (a)(b) | | 1,419,670 | 4,131,240 |
| Cytokinetics, Inc. (a)(b) | | 1,561,771 | 66,109,766 |
| Day One Biopharmaceuticals, Inc. (a) | | 413,269 | 7,079,298 |
| Erasca, Inc. (b) | | 1,695,700 | 12,785,578 |
| Exelixis, Inc. (a) | | 1,587,700 | 33,214,684 |
| Fusion Pharmaceuticals, Inc. (a) | | 1,546,014 | 3,617,673 |
| Global Blood Therapeutics, Inc. (a) | | 408,089 | 13,352,672 |
| Gossamer Bio, Inc. (a)(b) | | 894,500 | 10,045,235 |
| Graphite Bio, Inc. (a) | | 1,113,180 | 3,506,517 |
| Icosavax, Inc. (a)(b) | | 1,076,465 | 7,535,255 |
| Imago BioSciences, Inc. (b) | | 897,025 | 14,442,103 |
| Instil Bio, Inc. (a)(b) | | 2,208,798 | 12,457,621 |
| Intellia Therapeutics, Inc. (a) | | 221,600 | 14,350,816 |
| Janux Therapeutics, Inc. (a)(b) | | 851,400 | 10,574,388 |
| Karuna Therapeutics, Inc. (a) | | 124,538 | 16,221,075 |
| Keros Therapeutics, Inc. (a) | | 611,257 | 19,609,125 |
| Kronos Bio, Inc. (a)(b) | | 753,100 | 3,163,020 |
| Mirati Therapeutics, Inc. (a)(b) | | 260,920 | 16,803,248 |
| Monte Rosa Therapeutics, Inc. (a)(b) | | 698,958 | 6,339,549 |
| Moonlake Immunotherapeutics (a)(b) | | 1,170,005 | 7,371,032 |
| Morphic Holding, Inc. (a) | | 210,200 | 5,563,994 |
| Nuvalent, Inc. Class A (a)(b) | | 727,806 | 10,815,197 |
| ORIC Pharmaceuticals, Inc. (a)(b) | | 1,206,016 | 4,414,019 |
| Poseida Therapeutics, Inc. (a)(b) | | 428,946 | 1,068,076 |
| Prelude Therapeutics, Inc. (a)(b) | | 1,590,970 | 7,954,850 |
| Protagonist Therapeutics, Inc. (a) | | 531,437 | 5,287,798 |
| Prothena Corp. PLC (a) | | 202,400 | 6,286,544 |
| PTC Therapeutics, Inc. (a) | | 788,740 | 34,349,627 |
| Regeneron Pharmaceuticals, Inc. (a) | | 188,892 | 109,876,587 |
| Relay Therapeutics, Inc. (a)(b) | | 535,800 | 10,190,916 |
| Scholar Rock Holding Corp. (a) | | 478,030 | 3,279,286 |
| Scholar Rock Holding Corp. warrants 12/31/25 (a)(c) | | 6,000 | 15,039 |
| Seagen, Inc. (a) | | 500,914 | 90,154,502 |
| Shattuck Labs, Inc. (a) | | 706,434 | 2,691,514 |
| Stoke Therapeutics, Inc. (a)(b) | | 446,619 | 6,605,495 |
| Tango Therapeutics, Inc. (a)(b) | | 1,603,500 | 6,558,315 |
| Tenaya Therapeutics, Inc. (a)(b) | | 802,290 | 3,826,923 |
| Tyra Biosciences, Inc. (b) | | 730,700 | 7,781,955 |
| Vaxcyte, Inc. (a) | | 931,529 | 21,499,689 |
| Vera Therapeutics, Inc. (a)(b) | | 980,468 | 16,913,073 |
| Vertex Pharmaceuticals, Inc. (a) | | 534,927 | 149,998,880 |
| Verve Therapeutics, Inc. (a)(b) | | 470,100 | 11,573,862 |
| Xenon Pharmaceuticals, Inc. (a) | | 1,061,058 | 35,174,073 |
| Zentalis Pharmaceuticals, Inc. (a)(b) | | 975,192 | 28,475,606 |
| | | | 1,489,484,562 |
| Pharmaceuticals - 6.1% | | | |
| Pharmaceuticals - 6.1% | | | |
| Afferent Pharmaceuticals, Inc. rights 12/31/24 (a)(d) | | 1,915,787 | 1,800,840 |
| Arvinas Holding Co. LLC (a) | | 390,800 | 20,755,388 |
| Chiasma, Inc. warrants 12/16/24 (a)(d) | | 81,298 | 1 |
| DICE Therapeutics, Inc. (b) | | 353,800 | 6,099,512 |
| Edgewise Therapeutics, Inc. (a)(b) | | 931,400 | 9,006,638 |
| Fulcrum Therapeutics, Inc. (a)(b) | | 778,000 | 4,574,640 |
| GH Research PLC (a)(b) | | 385,500 | 4,302,180 |
| Ikena Oncology, Inc. (a)(b) | | 1,046,395 | 5,294,759 |
| Longboard Pharmaceuticals, Inc. (a) | | 520,400 | 1,743,340 |
| NGM Biopharmaceuticals, Inc. (a) | | 690,000 | 9,991,200 |
| Pharvaris BV (a) | | 315,564 | 6,658,400 |
| Royalty Pharma PLC | | 384,000 | 16,700,160 |
| Theseus Pharmaceuticals, Inc. (b) | | 988,400 | 7,126,364 |
| Ventyx Biosciences, Inc. (b) | | 385,400 | 5,823,394 |
| | | | 99,876,816 |
| TOTAL COMMON STOCKS | | | |
| (Cost $1,370,368,648) | | | 1,589,361,378 |
|
| Convertible Preferred Stocks - 2.2% | | | |
| Biotechnology - 1.5% | | | |
| Biotechnology - 1.5% | | | |
| Bright Peak Therapeutics AG Series B (a)(c)(d) | | 1,920,122 | 4,416,281 |
| Dianthus Therapeutics, Inc. Series A (c)(d) | | 906,629 | 3,384,355 |
| LifeMine Therapeutics, Inc. Series C (c)(d) | | 1,950,028 | 3,334,548 |
| Sonoma Biotherapeutics, Inc.: | | | |
| Series B (c)(d) | | 1,967,762 | 2,754,867 |
| Series B1 (c)(d) | | 1,049,456 | 1,469,238 |
| T-Knife Therapeutics, Inc. Series B (a)(c)(d) | | 1,300,097 | 4,134,308 |
| Treeline Biosciences Series A (c)(d) | | 47,600 | 225,624 |
| ValenzaBio, Inc. Series A (a)(c)(d) | | 951,971 | 4,683,697 |
| | | | 24,402,918 |
| Health Care Providers & Services - 0.2% | | | |
| Health Care Facilities - 0.2% | | | |
| Boundless Bio, Inc. Series B (a)(c)(d) | | 3,703,704 | 2,777,778 |
| Health Care Technology - 0.1% | | | |
| Health Care Technology - 0.1% | | | |
| Wugen, Inc. Series B (a)(c)(d) | | 580,277 | 2,512,599 |
| Pharmaceuticals - 0.4% | | | |
| Pharmaceuticals - 0.4% | | | |
| Afferent Pharmaceuticals, Inc. Series C (a)(c)(d) | | 1,915,787 | 19 |
| Aristea Therapeutics, Inc. Series B (a)(c)(d) | | 677,328 | 6,373,656 |
| | | | 6,373,675 |
| TOTAL CONVERTIBLE PREFERRED STOCKS | | | |
| (Cost $51,992,181) | | | 36,066,970 |
|
| Money Market Funds - 12.5% | | | |
| Fidelity Cash Central Fund 2.01% (e) | | 7,888,067 | 7,889,645 |
| Fidelity Securities Lending Cash Central Fund 2.01% (e)(f) | | 195,496,399 | 195,515,949 |
| TOTAL MONEY MARKET FUNDS | | | |
| (Cost $203,401,471) | | | 203,405,594 |
| TOTAL INVESTMENT IN SECURITIES - 112.0% | | | |
| (Cost $1,625,762,300) | | | 1,828,833,942 |
| NET OTHER ASSETS (LIABILITIES) - (12.0)% | | | (195,502,723) |
| NET ASSETS - 100% | | | $1,633,331,219 |
Legend
(a) Non-income producing
(b) Security or a portion of the security is on loan at period end.
(c) Restricted securities (including private placements) - Investment in securities not registered under the Securities Act of 1933 (excluding 144A issues). At the end of the period, the value of restricted securities (excluding 144A issues) amounted to $36,082,009 or 2.2% of net assets.
(d) Level 3 security
(e) Affiliated fund that is generally available only to investment companies and other accounts managed by Fidelity Investments. The rate quoted is the annualized seven-day yield of the fund at period end. A complete unaudited listing of the fund's holdings as of its most recent quarter end is available upon request. In addition, each Fidelity Central Fund's financial statements, which are not covered by the Fund's Report of Independent Registered Public Accounting Firm, are available on the SEC's website or upon request.
(f) Investment made with cash collateral received from securities on loan.
Additional information on each restricted holding is as follows:
| Security | Acquisition Date | Acquisition Cost |
| Afferent Pharmaceuticals, Inc. Series C | 7/1/15 | $0 |
| Aristea Therapeutics, Inc. Series B | 10/6/20 - 7/27/21 | $3,734,584 |
| Boundless Bio, Inc. Series B | 4/23/21 | $5,000,000 |
| Bright Peak Therapeutics AG Series B | 5/14/21 | $7,499,997 |
| Dianthus Therapeutics, Inc. Series A | 4/6/22 | $3,940,663 |
| LifeMine Therapeutics, Inc. Series C | 2/15/22 | $3,971,408 |
| Scholar Rock Holding Corp. warrants 12/31/25 | 6/17/22 | $0 |
| Sonoma Biotherapeutics, Inc. Series B | 7/26/21 | $3,888,888 |
| Sonoma Biotherapeutics, Inc. Series B1 | 7/26/21 | $3,111,112 |
| T-Knife Therapeutics, Inc. Series B | 6/30/21 | $7,500,000 |
| Treeline Biosciences Series A | 7/30/21 | $372,589 |
| ValenzaBio, Inc. Series A | 3/25/21 | $8,472,951 |
| Wugen, Inc. Series B | 7/9/21 | $4,499,990 |
Affiliated Central Funds
Fiscal year to date information regarding the Fund's investments in Fidelity Central Funds, including the ownership percentage, is presented below.
| Fund | Value, beginning of period | Purchases | Sales Proceeds | Dividend Income | Realized Gain/Loss | Change in Unrealized appreciation (depreciation) | Value, end of period | % ownership, end of period |
| Fidelity Cash Central Fund 2.01% | $19,154,488 | $655,000,880 | $666,265,723 | $36,567 | $-- | $-- | $7,889,645 | 0.0% |
| Fidelity Securities Lending Cash Central Fund 2.01% | 217,621,603 | 1,165,353,491 | 1,187,459,145 | 2,684,283 | -- | -- | 195,515,949 | 0.5% |
| Total | $236,776,091 | $1,820,354,371 | $1,853,724,868 | $2,720,850 | $-- | $-- | $203,405,594 | |
Amounts in the income column in the above table include any capital gain distributions from underlying funds, which are presented in the corresponding line-item in the Statement of Operations, if applicable. Amount for Fidelity Securities Lending Cash Central Fund represents the income earned on investing cash collateral, less rebates paid to borrowers and any lending agent fees associated with the loan, plus any premium payments received for lending certain types of securities.
Other Affiliated Issuers
An affiliated company is a company in which the Fund has ownership of at least 5% of the voting securities. Fiscal year to date transactions with companies which are or were affiliates are presented in the table below. Certain corporate actions, such as mergers, are excluded from the amounts in this table if applicable.
| Affiliate | Value, beginning of period | Purchases | Sales Proceeds | Dividend Income | Realized Gain (loss) | Change in Unrealized appreciation (depreciation) | Value, end of period |
| Moonlake Immunotherapeutics | $-- | $11,914,529 | $185,533 | $-- | $(44,865) | $(4,313,100) | $-- |
| Total | $-- | $11,914,529 | $185,533 | $-- | $(44,865) | $(4,313,100) | $-- |
Investment Valuation
The following is a summary of the inputs used, as of July 31, 2022, involving the Fund's assets and liabilities carried at fair value. The inputs or methodology used for valuing securities may not be an indication of the risk associated with investing in those securities. For more information on valuation inputs, and their aggregation into the levels used below, please refer to the Investment Valuation section in the accompanying Notes to Financial Statements.
| | Valuation Inputs at Reporting Date: |
| Description | Total | Level 1 | Level 2 | Level 3 |
| Investments in Securities: | | | | |
| Common Stocks | $1,589,361,378 | $1,587,545,498 | $15,039 | $1,800,841 |
| Convertible Preferred Stocks | 36,066,970 | -- | -- | 36,066,970 |
| Money Market Funds | 203,405,594 | 203,405,594 | -- | -- |
| Total Investments in Securities: | $1,828,833,942 | $1,790,951,092 | $15,039 | $37,867,811 |
The following is a reconciliation of Investments in Securities for which Level 3 inputs were used in determining value:
| Investments in Securities: | |
| Convertible Preferred Stocks | |
| Beginning Balance | $46,590,455 |
| Total Realized Gain (Loss) | -- |
| Total Unrealized Gain (Loss) | (18,435,555) |
| Cost of Purchases | 7,912,070 |
| Proceeds of Sales | -- |
| Amortization/Accretion | -- |
| Transfers in to Level 3 | -- |
| Transfers out of Level 3 | -- |
| Ending Balance | $36,066,970 |
| The change in unrealized gain (loss) for the period attributable to Level 3 securities held at July 31, 2022 | $(18,435,555) |
| Other Investments in Securities | |
| Beginning Balance | $3,122,735 |
| Total Realized Gain (Loss) | (566,645) |
| Total Unrealized Gain (Loss) | (789,268) |
| Cost of Purchases | -- |
| Proceeds of Sales | (9,938) |
| Amortization/Accretion | -- |
| Transfers in to Level 3 | 43,957 |
| Transfers out of Level 3 | -- |
| Ending Balance | $1,800,841 |
| The change in unrealized gain (loss) for the period attributable to Level 3 securities held at July 31, 2022 | $(1,365,849) |
The information used in the above reconciliations represents fiscal year to date activity for any Investments in Securities identified as using Level 3 inputs at either the beginning or the end of the current fiscal period. Transfers into Level 3 were attributable to a lack of observable market data resulting from decreases in market activity, decreases in liquidity, security restructurings or corporate actions. Transfers out of Level 3 were attributable to observable market data becoming available for those securities. Cost of purchases and proceeds of sales may include securities received and/or delivered through in-kind transactions. Transfers in or out of Level 3 represent the beginning value of any Security or Instrument where a change in the pricing level occurred from the beginning to the end of the period. The cost of purchases and the proceeds of sales may include securities received or delivered through corporate actions or exchanges. Realized and unrealized gains (losses) disclosed in the reconciliations are included in Net Gain (Loss) on the Fund's Statement of Operations.
See accompanying notes which are an integral part of the financial statements.
Fidelity Advisor® Biotechnology Fund
Financial Statements
Statement of Assets and Liabilities
| | | July 31, 2022 |
| Assets | | |
Investment in securities, at value (including securities loaned of $185,510,495) — See accompanying schedule:
Unaffiliated issuers (cost $1,422,360,829) | $1,625,428,348 | |
| Fidelity Central Funds (cost $203,401,471) | 203,405,594 | |
| Total Investment in Securities (cost $1,625,762,300) | | $1,828,833,942 |
| Receivable for investments sold | | 62,645 |
| Receivable for fund shares sold | | 432,268 |
| Dividends receivable | | 2,468,458 |
| Distributions receivable from Fidelity Central Funds | | 208,233 |
| Prepaid expenses | | 8,329 |
| Total assets | | 1,832,013,875 |
| Liabilities | | |
| Payable for investments purchased | $11,788 | |
| Payable for fund shares redeemed | 1,793,365 | |
| Accrued management fee | 732,786 | |
| Distribution and service plan fees payable | 318,763 | |
| Other affiliated payables | 274,190 | |
| Other payables and accrued expenses | 68,918 | |
| Collateral on securities loaned | 195,482,846 | |
| Total liabilities | | 198,682,656 |
| Net Assets | | $1,633,331,219 |
| Net Assets consist of: | | |
| Paid in capital | | $1,548,066,155 |
| Total accumulated earnings (loss) | | 85,265,064 |
| Net Assets | | $1,633,331,219 |
| Net Asset Value and Maximum Offering Price | | |
| Class A: | | |
| Net Asset Value and redemption price per share ($594,911,472 ÷ 27,044,674 shares)(a) | | $22.00 |
| Maximum offering price per share (100/94.25 of $22.00) | | $23.34 |
| Class M: | | |
| Net Asset Value and redemption price per share ($109,815,145 ÷ 5,444,849 shares)(a) | | $20.17 |
| Maximum offering price per share (100/96.50 of $20.17) | | $20.90 |
| Class C: | | |
| Net Asset Value and offering price per share ($168,796,936 ÷ 9,774,244 shares)(a) | | $17.27 |
| Class I: | | |
| Net Asset Value, offering price and redemption price per share ($697,078,898 ÷ 29,056,082 shares) | | $23.99 |
| Class Z: | | |
| Net Asset Value, offering price and redemption price per share ($62,728,768 ÷ 2,609,405 shares) | | $24.04 |
(a) Redemption price per share is equal to net asset value less any applicable contingent deferred sales charge.
See accompanying notes which are an integral part of the financial statements.
Statement of Operations
| | | Year ended July 31, 2022 |
| Investment Income | | |
| Dividends | | $13,474,591 |
| Income from Fidelity Central Funds (including $2,684,283 from security lending) | | 2,720,850 |
| Total income | | 16,195,441 |
| Expenses | | |
| Management fee | $11,021,643 | |
| Transfer agent fees | 3,644,752 | |
| Distribution and service plan fees | 4,979,889 | |
| Accounting fees | 625,099 | |
| Custodian fees and expenses | 74,313 | |
| Independent trustees' fees and expenses | 7,257 | |
| Registration fees | 100,572 | |
| Audit | 92,188 | |
| Legal | 7,595 | |
| Interest | 747 | |
| Miscellaneous | 11,383 | |
| Total expenses before reductions | 20,565,438 | |
| Expense reductions | (65,994) | |
| Total expenses after reductions | | 20,499,444 |
| Net investment income (loss) | | (4,304,003) |
| Realized and Unrealized Gain (Loss) | | |
| Net realized gain (loss) on: | | |
| Investment securities: | | |
| Unaffiliated issuers | (9,356,160) | |
| Affiliated issuers | (44,865) | |
| Foreign currency transactions | 579 | |
| Total net realized gain (loss) | | (9,400,446) |
| Change in net unrealized appreciation (depreciation) on: | | |
| Investment securities: | | |
| Unaffiliated issuers | (404,508,277) | |
| Affiliated issuers | (4,313,100) | |
| Unfunded commitments | 215,400 | |
| Total change in net unrealized appreciation (depreciation) | | (408,605,977) |
| Net gain (loss) | | (418,006,423) |
| Net increase (decrease) in net assets resulting from operations | | $(422,310,426) |
See accompanying notes which are an integral part of the financial statements.
Statement of Changes in Net Assets
| | Year ended July 31, 2022 | Year ended July 31, 2021 |
| Increase (Decrease) in Net Assets | | |
| Operations | | |
| Net investment income (loss) | $(4,304,003) | $5,459,452 |
| Net realized gain (loss) | (9,400,446) | 577,411,240 |
| Change in net unrealized appreciation (depreciation) | (408,605,977) | (244,829,280) |
| Net increase (decrease) in net assets resulting from operations | (422,310,426) | 338,041,412 |
| Distributions to shareholders | (389,242,813) | (228,190,286) |
| Share transactions - net increase (decrease) | (72,894,135) | 1,156,643 |
| Total increase (decrease) in net assets | (884,447,374) | 111,007,769 |
| Net Assets | | |
| Beginning of period | 2,517,778,593 | 2,406,770,824 |
| End of period | $1,633,331,219 | $2,517,778,593 |
See accompanying notes which are an integral part of the financial statements.
Financial Highlights
Fidelity Advisor Biotechnology Fund Class A
| Years ended July 31, | 2022 | 2021 | 2020 | 2019 | 2018 |
| Selected Per–Share Data | | | | | |
| Net asset value, beginning of period | $32.58 | $31.03 | $25.48 | $27.80 | $24.45 |
| Income from Investment Operations | | | | | |
| Net investment income (loss)A,B | (.06) | .07 | .03 | .03 | (.14) |
| Net realized and unrealized gain (loss) | (5.16) | 4.42 | 7.40 | (1.76) | 3.49 |
| Total from investment operations | (5.22) | 4.49 | 7.43 | (1.73) | 3.35 |
| Distributions from net investment income | (.11) | (.13) | – | – | – |
| Distributions from net realized gain | (5.25) | (2.81) | (1.88) | (.59) | – |
| Total distributions | (5.36) | (2.94) | (1.88) | (.59) | – |
| Net asset value, end of period | $22.00 | $32.58 | $31.03 | $25.48 | $27.80 |
| Total ReturnC,D | (18.95)% | 14.03% | 30.00% | (6.17)% | 13.70% |
| Ratios to Average Net AssetsB,E,F | | | | | |
| Expenses before reductions | 1.00% | 1.01% | 1.02% | 1.04% | 1.06% |
| Expenses net of fee waivers, if any | 1.00% | 1.00% | 1.02% | 1.03% | 1.06% |
| Expenses net of all reductions | 1.00% | 1.00% | 1.02% | 1.03% | 1.06% |
| Net investment income (loss) | (.23)% | .20% | .11% | .13% | (.53)% |
| Supplemental Data | | | | | |
| Net assets, end of period (000 omitted) | $594,911 | $808,610 | $722,896 | $616,894 | $766,303 |
| Portfolio turnover rateG | 43% | 72% | 66% | 62% | 45% |
A Calculated based on average shares outstanding during the period.
B Net investment income (loss) is affected by the timing of the declaration of dividends by any underlying mutual funds or exchange-traded funds (ETFs). Net investment income (loss) of any such underlying funds is not included in the Fund's net investment income (loss) ratio.
C Total returns would have been lower if certain expenses had not been reduced during the applicable periods shown.
D Total returns do not include the effect of the sales charges.
E Fees and expenses of any underlying mutual funds or exchange-traded funds (ETFs) are not included in the Fund's expense ratio. The Fund indirectly bears its proportionate share of these expenses. For additional expense information related to investments in Fidelity Central Funds, please refer to the "Investments in Fidelity Central Funds" note found in the Notes to Financial Statements section of the most recent Annual or Semi-Annual report.
F Expense ratios reflect operating expenses of the class. Expenses before reductions do not reflect amounts reimbursed, waived, or reduced through arrangements with the investment adviser, brokerage services, or other offset arrangements, if applicable, and do not represent the amount paid by the class during periods when reimbursements, waivers or reductions occur.
G Amount does not include the portfolio activity of any underlying mutual funds or exchange-traded funds (ETFs).
See accompanying notes which are an integral part of the financial statements.
Fidelity Advisor Biotechnology Fund Class M
| Years ended July 31, | 2022 | 2021 | 2020 | 2019 | 2018 |
| Selected Per–Share Data | | | | | |
| Net asset value, beginning of period | $30.35 | $29.08 | $24.02 | $26.32 | $23.22 |
| Income from Investment Operations | | | | | |
| Net investment income (loss)A,B | (.13) | (.02) | (.05) | (.04) | (.21) |
| Net realized and unrealized gain (loss) | (4.73) | 4.14 | 6.96 | (1.67) | 3.31 |
| Total from investment operations | (4.86) | 4.12 | 6.91 | (1.71) | 3.10 |
| Distributions from net investment income | (.07) | (.07) | – | – | –�� |
| Distributions from net realized gain | (5.25) | (2.78) | (1.85) | (.59) | – |
| Total distributions | (5.32) | (2.85) | (1.85) | (.59) | – |
| Net asset value, end of period | $20.17 | $30.35 | $29.08 | $24.02 | $26.32 |
| Total ReturnC,D | (19.18)% | 13.69% | 29.64% | (6.44)% | 13.35% |
| Ratios to Average Net AssetsB,E,F | | | | | |
| Expenses before reductions | 1.28% | 1.28% | 1.32% | 1.34% | 1.38% |
| Expenses net of fee waivers, if any | 1.28% | 1.28% | 1.32% | 1.34% | 1.38% |
| Expenses net of all reductions | 1.28% | 1.28% | 1.31% | 1.34% | 1.38% |
| Net investment income (loss) | (.51)% | (.07)% | (.18)% | (.18)% | (.84)% |
| Supplemental Data | | | | | |
| Net assets, end of period (000 omitted) | $109,815 | $161,619 | $144,568 | $119,312 | $135,879 |
| Portfolio turnover rateG | 43% | 72% | 66% | 62% | 45% |
A Calculated based on average shares outstanding during the period.
B Net investment income (loss) is affected by the timing of the declaration of dividends by any underlying mutual funds or exchange-traded funds (ETFs). Net investment income (loss) of any such underlying funds is not included in the Fund's net investment income (loss) ratio.
C Total returns would have been lower if certain expenses had not been reduced during the applicable periods shown.
D Total returns do not include the effect of the sales charges.
E Fees and expenses of any underlying mutual funds or exchange-traded funds (ETFs) are not included in the Fund's expense ratio. The Fund indirectly bears its proportionate share of these expenses. For additional expense information related to investments in Fidelity Central Funds, please refer to the "Investments in Fidelity Central Funds" note found in the Notes to Financial Statements section of the most recent Annual or Semi-Annual report.
F Expense ratios reflect operating expenses of the class. Expenses before reductions do not reflect amounts reimbursed, waived, or reduced through arrangements with the investment adviser, brokerage services, or other offset arrangements, if applicable, and do not represent the amount paid by the class during periods when reimbursements, waivers or reductions occur.
G Amount does not include the portfolio activity of any underlying mutual funds or exchange-traded funds (ETFs).
See accompanying notes which are an integral part of the financial statements.
Fidelity Advisor Biotechnology Fund Class C
| Years ended July 31, | 2022 | 2021 | 2020 | 2019 | 2018 |
| Selected Per–Share Data | | | | | |
| Net asset value, beginning of period | $26.79 | $25.97 | $21.71 | $23.96 | $21.23 |
| Income from Investment Operations | | | | | |
| Net investment income (loss)A,B | (.21) | (.15) | (.15) | (.14) | (.29) |
| Net realized and unrealized gain (loss) | (4.07) | 3.71 | 6.26 | (1.52) | 3.02 |
| Total from investment operations | (4.28) | 3.56 | 6.11 | (1.66) | 2.73 |
| Distributions from net investment income | – | (.01) | – | – | – |
| Distributions from net realized gain | (5.24) | (2.73) | (1.85) | (.59) | – |
| Total distributions | (5.24) | (2.74) | (1.85) | (.59) | – |
| Net asset value, end of period | $17.27 | $26.79 | $25.97 | $21.71 | $23.96 |
| Total ReturnC,D | (19.54)% | 13.15% | 29.07% | (6.87)% | 12.86% |
| Ratios to Average Net AssetsB,E,F | | | | | |
| Expenses before reductions | 1.75% | 1.75% | 1.77% | 1.78% | 1.80% |
| Expenses net of fee waivers, if any | 1.74% | 1.75% | 1.77% | 1.77% | 1.80% |
| Expenses net of all reductions | 1.74% | 1.75% | 1.76% | 1.77% | 1.80% |
| Net investment income (loss) | (.97)% | (.55)% | (.63)% | (.61)% | (1.27)% |
| Supplemental Data | | | | | |
| Net assets, end of period (000 omitted) | $168,797 | $328,417 | $384,420 | $398,749 | $558,420 |
| Portfolio turnover rateG | 43% | 72% | 66% | 62% | 45% |
A Calculated based on average shares outstanding during the period.
B Net investment income (loss) is affected by the timing of the declaration of dividends by any underlying mutual funds or exchange-traded funds (ETFs). Net investment income (loss) of any such underlying funds is not included in the Fund's net investment income (loss) ratio.
C Total returns would have been lower if certain expenses had not been reduced during the applicable periods shown.
D Total returns do not include the effect of the contingent deferred sales charge.
E Fees and expenses of any underlying mutual funds or exchange-traded funds (ETFs) are not included in the Fund's expense ratio. The Fund indirectly bears its proportionate share of these expenses. For additional expense information related to investments in Fidelity Central Funds, please refer to the "Investments in Fidelity Central Funds" note found in the Notes to Financial Statements section of the most recent Annual or Semi-Annual report.
F Expense ratios reflect operating expenses of the class. Expenses before reductions do not reflect amounts reimbursed, waived, or reduced through arrangements with the investment adviser, brokerage services, or other offset arrangements, if applicable, and do not represent the amount paid by the class during periods when reimbursements, waivers or reductions occur.
G Amount does not include the portfolio activity of any underlying mutual funds or exchange-traded funds (ETFs).
See accompanying notes which are an integral part of the financial statements.
Fidelity Advisor Biotechnology Fund Class I
| Years ended July 31, | 2022 | 2021 | 2020 | 2019 | 2018 |
| Selected Per–Share Data | | | | | |
| Net asset value, beginning of period | $35.00 | $33.16 | $27.08 | $29.42 | $25.80 |
| Income from Investment Operations | | | | | |
| Net investment income (loss)A,B | .01 | .17 | .11 | .11 | (.07) |
| Net realized and unrealized gain (loss) | (5.61) | 4.72 | 7.88 | (1.86) | 3.69 |
| Total from investment operations | (5.60) | 4.89 | 7.99 | (1.75) | 3.62 |
| Distributions from net investment income | (.16) | (.21) | – | – | – |
| Distributions from net realized gain | (5.25) | (2.85) | (1.91) | (.59) | – |
| Total distributions | (5.41) | (3.05)C | (1.91) | (.59) | – |
| Net asset value, end of period | $23.99 | $35.00 | $33.16 | $27.08 | $29.42 |
| Total ReturnD | (18.74)% | 14.34% | 30.32% | (5.89)% | 14.03% |
| Ratios to Average Net AssetsB,E,F | | | | | |
| Expenses before reductions | .73% | .74% | .75% | .76% | .79% |
| Expenses net of fee waivers, if any | .73% | .74% | .75% | .76% | .79% |
| Expenses net of all reductions | .73% | .74% | .75% | .76% | .79% |
| Net investment income (loss) | .04% | .47% | .38% | .40% | (.26)% |
| Supplemental Data | | | | | |
| Net assets, end of period (000 omitted) | $697,079 | $1,129,492 | $1,092,145 | $1,006,084 | $1,307,833 |
| Portfolio turnover rateG | 43% | 72% | 66% | 62% | 45% |
A Calculated based on average shares outstanding during the period.
B Net investment income (loss) is affected by the timing of the declaration of dividends by any underlying mutual funds or exchange-traded funds (ETFs). Net investment income (loss) of any such underlying funds is not included in the Fund's net investment income (loss) ratio.
C Total distributions per share do not sum due to rounding.
D Total returns would have been lower if certain expenses had not been reduced during the applicable periods shown.
E Fees and expenses of any underlying mutual funds or exchange-traded funds (ETFs) are not included in the Fund's expense ratio. The Fund indirectly bears its proportionate share of these expenses. For additional expense information related to investments in Fidelity Central Funds, please refer to the "Investments in Fidelity Central Funds" note found in the Notes to Financial Statements section of the most recent Annual or Semi-Annual report.
F Expense ratios reflect operating expenses of the class. Expenses before reductions do not reflect amounts reimbursed, waived, or reduced through arrangements with the investment adviser, brokerage services, or other offset arrangements, if applicable, and do not represent the amount paid by the class during periods when reimbursements, waivers or reductions occur.
G Amount does not include the portfolio activity of any underlying mutual funds or exchange-traded funds (ETFs).
See accompanying notes which are an integral part of the financial statements.
Fidelity Advisor Biotechnology Fund Class Z
| Years ended July 31, | 2022 | 2021 | 2020 | 2019 A |
| Selected Per–Share Data | | | | |
| Net asset value, beginning of period | $35.05 | $33.22 | $27.10 | $30.06 |
| Income from Investment Operations | | | | |
| Net investment income (loss)B,C | .05 | .21 | .15 | .16 |
| Net realized and unrealized gain (loss) | (5.62) | 4.74 | 7.90 | (2.53) |
| Total from investment operations | (5.57) | 4.95 | 8.05 | (2.37) |
| Distributions from net investment income | (.19) | (.26) | (.02) | – |
| Distributions from net realized gain | (5.25) | (2.87) | (1.91) | (.59) |
| Total distributions | (5.44) | (3.12)D | (1.93) | (.59) |
| Net asset value, end of period | $24.04 | $35.05 | $33.22 | $27.10 |
| Total ReturnE,F | (18.63)% | 14.49% | 30.53% | (7.83)% |
| Ratios to Average Net AssetsC,G,H | | | | |
| Expenses before reductions | .61% | .61% | .62% | .63%I |
| Expenses net of fee waivers, if any | .60% | .61% | .62% | .63%I |
| Expenses net of all reductions | .60% | .61% | .62% | .62%I |
| Net investment income (loss) | .16% | .60% | .51% | .73%I |
| Supplemental Data | | | | |
| Net assets, end of period (000 omitted) | $62,729 | $89,641 | $62,743 | $30,116 |
| Portfolio turnover rateJ | 43% | 72% | 66% | 62% |
A For the period October 2, 2018 (commencement of sale of shares) through July 31, 2019.
B Calculated based on average shares outstanding during the period.
C Net investment income (loss) is affected by the timing of the declaration of dividends by any underlying mutual funds or exchange-traded funds (ETFs). Net investment income (loss) of any such underlying funds is not included in the Fund's net investment income (loss) ratio.
D Total distributions per share do not sum due to rounding.
E Total returns for periods of less than one year are not annualized.
F Total returns would have been lower if certain expenses had not been reduced during the applicable periods shown.
G Fees and expenses of any underlying mutual funds or exchange-traded funds (ETFs) are not included in the Fund's expense ratio. The Fund indirectly bears its proportionate share of these expenses. For additional expense information related to investments in Fidelity Central Funds, please refer to the "Investments in Fidelity Central Funds" note found in the Notes to Financial Statements section of the most recent Annual or Semi-Annual report.
H Expense ratios reflect operating expenses of the class. Expenses before reductions do not reflect amounts reimbursed, waived, or reduced through arrangements with the investment adviser, brokerage services, or other offset arrangements, if applicable, and do not represent the amount paid by the class during periods when reimbursements, waivers or reductions occur.
I Annualized
J Amount does not include the portfolio activity of any underlying mutual funds or exchange-traded funds (ETFs).
See accompanying notes which are an integral part of the financial statements.
Fidelity Advisor® Consumer Discretionary Fund
Performance: The Bottom Line
Average annual total return reflects the change in the value of an investment, assuming reinvestment of distributions from dividend income and capital gains (the profits earned upon the sale of securities that have grown in value, if any) and assuming a constant rate of performance each year. The hypothetical investment and the average annual total returns do not reflect the deduction of taxes that a shareholder would pay on fund distributions or the redemption of fund shares. During periods of reimbursement by Fidelity, a fund’s total return will be greater than it would be had the reimbursement not occurred. How a fund did yesterday is no guarantee of how it will do tomorrow.
Average Annual Total Returns
| For the periods ended July 31, 2022 | Past 1 year | Past 5 years | Past 10 years |
| Class A (incl. 5.75% sales charge) | (22.96)% | 10.11% | 12.21% |
| Class M (incl. 3.50% sales charge) | (21.34)% | 10.33% | 12.16% |
| Class C (incl. contingent deferred sales charge) | (19.64)% | 10.58% | 12.20% |
| Class I | (18.04)% | 11.72% | 13.19% |
| Class Z | (17.93)% | 11.83% | 13.25% |
Class C shares' contingent deferred sales charges included in the past one year, past five years and past ten years total return figures are 1%, 0% and 0%, respectively.
The initial offering of Class Z shares took place on October 2, 2018. Returns prior to October 2, 2018, are those of Class I.
$10,000 Over 10 Years
Let's say hypothetically that $10,000 was invested in Fidelity Advisor® Consumer Discretionary Fund - Class A on July 31, 2012, and the current 5.75% sales charge was paid.
The chart shows how the value of your investment would have changed, and also shows how the S&P 500® Index performed over the same period.
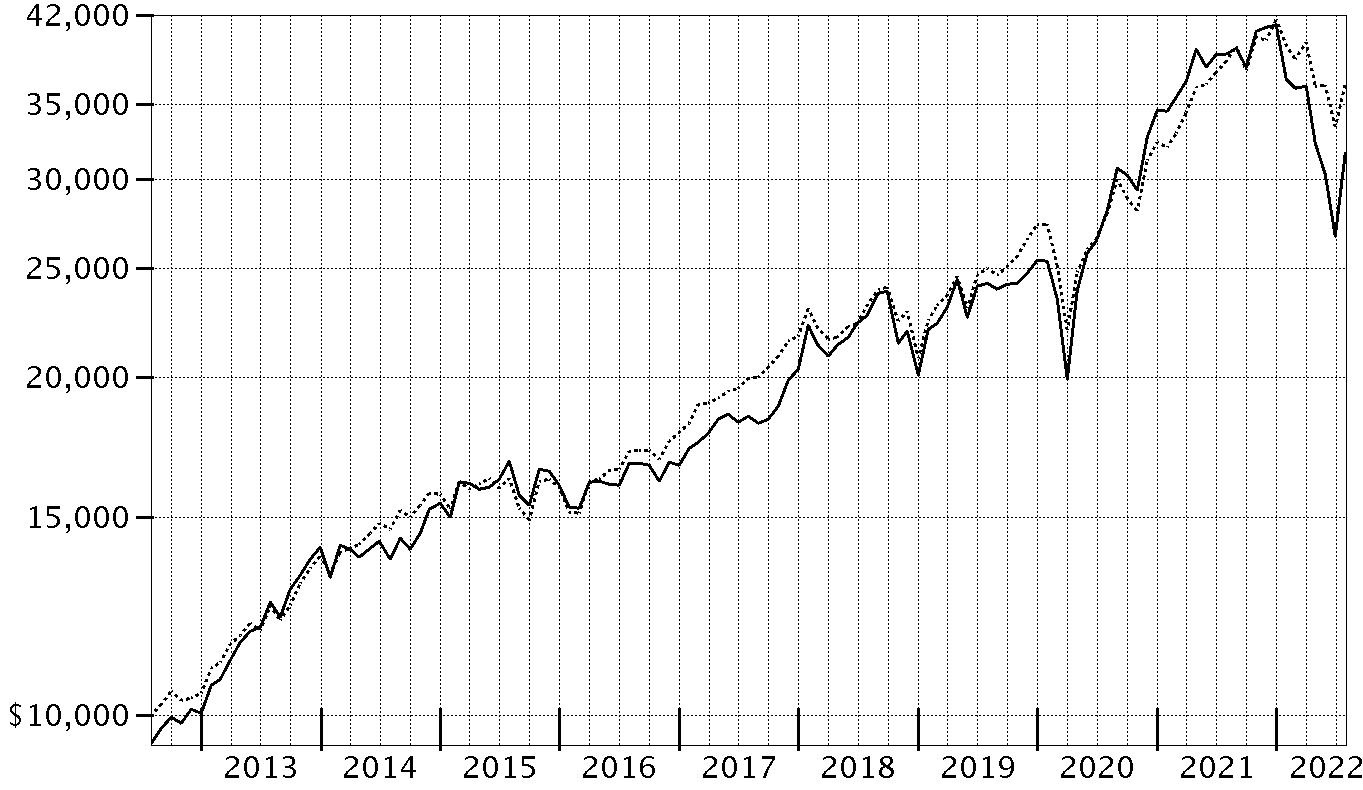
| Period Ending Values |
| $31,645 | Fidelity Advisor® Consumer Discretionary Fund - Class A |
| $36,428 | S&P 500® Index |
Fidelity Advisor® Consumer Discretionary Fund
Management's Discussion of Fund Performance
Market Recap: The S&P 500
® index returned -4.64% for the 12 months ending July 31, 2022, as a multitude of crosscurrents challenged the global economy and financial markets. Persistently high inflation, exacerbated by energy price shocks from the Russia–Ukraine conflict, spurred the U.S. Federal Reserve to hike interest rates more aggressively than anticipated, and concerns about the outlook for economic growth sent stocks into bear market territory. In early May, the Fed approved a rare half-percentage-point interest rate increase and announced plans to shrink its $9 trillion asset portfolio. June began with the Fed allowing up to billions in Treasuries and mortgage bonds to mature every month without investing the proceeds. Two weeks later, the central bank raised rates by 0.75 percentage points, its largest increase since 1994, and said it was becoming more difficult to achieve a soft landing, in which the economy slows enough to bring down inflation while avoiding a recession. Against this volatile backdrop, the S&P 500 posted its worst first-half result (-19.96%) to begin a year since 1970. Stocks sharply reversed course in July (+9.22%), as the Fed again raised its benchmark interest rate by 0.75% but signaled that, at some point, it will likely slow the pace of tightening to assess the impact on the economy. For the full 12 months, growth-oriented communication services (-29%) and consumer discretionary (-10%) stocks lagged most. In contrast, energy (+67%) rode a surge in commodity prices and led by a wide margin, followed by the defensive utilities (+16%) and consumer staples (+7%) sectors.
Comments from Co-Managers Jordan Michaels and Katherine Shaw: For the fiscal year ending July 31, 2022, the fund's share classes (excluding sales charges, if applicable) returned roughly -19% to -18%, underperforming the -13.77% return of the MSCI U.S. IMI Consumer Discretionary 25/50 Index, as well as the broad-based S&P 500
® index. Versus the sector index, the fund's industry positioning was the primary detractor to performance this period, especially an underweighting in the automobile manufacturers industry. Stock selection and an overweighting in apparel retail also hindered the fund's relative result, as did an overweighting in apparel, accessories & luxury goods segment. The biggest individual relative detractor was an underweight position in Tesla (+30%), which was among the fund's biggest holdings. Another notable relative detractor was an outsized stake in Burlington Stores (-58%). Another notable relative detractor was an underweighting in Mcdonalds (+11%). Conversely, the largest contributor to performance versus the sector index was our security selection in hotels, resorts & cruise lines. Security selection in automobile manufacturers and apparel, accessories & luxury goods also helped the fund's relative result. Not owning Peloton Interactive, an index component that returned -92%, was the fund's largest individual relative contributor. Also lifting performance was our overweighting in Marriott International, which gained approximately 9%. Marriott International was among the largest holdings as of July 31. Another notable relative contributor was an outsized stake in Dollar Tree (+66%). We reduced our stake this period. Notable changes in positioning include increased exposure to the automobile manufacturers industry and a lower allocation to apparel, accessories & luxury goods.
The views expressed above reflect those of the portfolio manager(s) only through the end of the period as stated on the cover of this report and do not necessarily represent the views of Fidelity or any other person in the Fidelity organization. Any such views are subject to change at any time based upon market or other conditions and Fidelity disclaims any responsibility to update such views. These views may not be relied on as investment advice and, because investment decisions for a Fidelity fund are based on numerous factors, may not be relied on as an indication of trading intent on behalf of any Fidelity fund.
Note to Shareholders: On July 11, 2022, Jordan Michaels assumed co-management responsibilities for the fund, joining Co-Manager Katherine Shaw.
Fidelity Advisor® Consumer Discretionary Fund
Investment Summary (Unaudited)
Top Ten Stocks as of July 31, 2022
| | % of fund's net assets |
| Amazon.com, Inc. | 24.4 |
| Tesla, Inc. | 14.0 |
| The Home Depot, Inc. | 5.0 |
| Lowe's Companies, Inc. | 4.5 |
| NIKE, Inc. Class B | 3.7 |
| TJX Companies, Inc. | 3.3 |
| Booking Holdings, Inc. | 2.6 |
| Hilton Worldwide Holdings, Inc. | 2.5 |
| Marriott International, Inc. Class A | 2.2 |
| Capri Holdings Ltd. | 2.0 |
| | 64.2 |
Industries (% of fund's net assets)
| As of July 31, 2022 |
| | Internet & Direct Marketing Retail | 25.3% |
| | Specialty Retail | 18.8% |
| | Hotels, Restaurants & Leisure | 17.8% |
| | Automobiles | 14.4% |
| | Textiles, Apparel & Luxury Goods | 12.3% |
| | Multiline Retail | 6.0% |
| | Household Durables | 1.7% |
| | Food & Staples Retailing | 0.9% |
| | Auto Components | 0.4% |
| | Commercial Services & Supplies | 0.4% |
| | Building Products | 0.3% |
| | Distributors | 0.1% |
* Includes Short-Term investments and Net Other Assets (Liabilities).
Fidelity Advisor® Consumer Discretionary Fund
Schedule of Investments July 31, 2022
Showing Percentage of Net Assets
| Common Stocks - 98.4% | | | |
| | | Shares | Value |
| Auto Components - 0.4% | | | |
| Auto Parts & Equipment - 0.4% | | | |
| Adient PLC (a) | | 48,131 | $1,625,865 |
| Automobiles - 14.4% | | | |
| Automobile Manufacturers - 14.4% | | | |
| Ferrari NV | | 8,503 | 1,796,089 |
| Tesla, Inc. (a) | | 68,980 | 61,492,221 |
| | | | 63,288,310 |
| Building Products - 0.3% | | | |
| Building Products - 0.3% | | | |
| The AZEK Co., Inc. (a) | | 64,711 | 1,338,223 |
| Commercial Services & Supplies - 0.4% | | | |
| Diversified Support Services - 0.4% | | | |
| Copart, Inc. (a) | | 13,926 | 1,783,921 |
| Distributors - 0.1% | | | |
| Distributors - 0.1% | | | |
| Pool Corp. | | 1,627 | 581,978 |
| Food & Staples Retailing - 0.9% | | | |
| Food Distributors - 0.9% | | | |
| Performance Food Group Co. (a) | | 77,642 | 3,859,584 |
| Hotels, Restaurants & Leisure - 17.8% | | | |
| Casinos & Gaming - 2.8% | | | |
| Caesars Entertainment, Inc. (a) | | 76,151 | 3,479,339 |
| Churchill Downs, Inc. | | 28,267 | 5,930,417 |
| Penn National Gaming, Inc. (a) | | 89,541 | 3,093,642 |
| | | | 12,503,398 |
| Hotels, Resorts & Cruise Lines - 7.8% | | | |
| Airbnb, Inc. Class A (a) | | 12,707 | 1,410,223 |
| Booking Holdings, Inc. (a) | | 6,020 | 11,652,854 |
| Hilton Worldwide Holdings, Inc. | | 85,355 | 10,931,415 |
| Lindblad Expeditions Holdings (a) | | 108,879 | 860,144 |
| Marriott International, Inc. Class A | | 60,644 | 9,631,480 |
| | | | 34,486,116 |
| Leisure Facilities - 1.0% | | | |
| Planet Fitness, Inc. (a) | | 37,427 | 2,949,622 |
| Vail Resorts, Inc. | | 5,341 | 1,266,511 |
| | | | 4,216,133 |
| Restaurants - 6.2% | | | |
| ARAMARK Holdings Corp. | | 157,019 | 5,244,435 |
| Brinker International, Inc. (a) | | 23,820 | 661,005 |
| Chipotle Mexican Grill, Inc. (a) | | 4,614 | 7,217,311 |
| Domino's Pizza, Inc. | | 11,999 | 4,704,928 |
| Dutch Bros, Inc. (b) | | 36,709 | 1,376,220 |
| McDonald's Corp. | | 20,991 | 5,528,400 |
| Noodles & Co. (a) | | 8,213 | 42,790 |
| Ruth's Hospitality Group, Inc. | | 4,778 | 83,854 |
| Wingstop, Inc. (b) | | 20,000 | 2,523,600 |
| | | | 27,382,543 |
|
| TOTAL HOTELS, RESTAURANTS & LEISURE | | | 78,588,190 |
|
| Household Durables - 1.7% | | | |
| Home Furnishings - 0.6% | | | |
| Tempur Sealy International, Inc. | | 91,285 | 2,508,512 |
| Homebuilding - 1.1% | | | |
| D.R. Horton, Inc. | | 32,207 | 2,513,112 |
| Lennar Corp. Class A | | 30,232 | 2,569,720 |
| | | | 5,082,832 |
|
| TOTAL HOUSEHOLD DURABLES | | | 7,591,344 |
|
| Internet & Direct Marketing Retail - 25.3% | | | |
| Internet & Direct Marketing Retail - 25.3% | | | |
| Amazon.com, Inc. (a) | | 798,229 | 107,721,003 |
| eBay, Inc. | | 79,024 | 3,842,937 |
| | | | 111,563,940 |
| Multiline Retail - 6.0% | | | |
| General Merchandise Stores - 6.0% | | | |
| Dollar General Corp. | | 34,173 | 8,489,598 |
| Dollar Tree, Inc. (a) | | 46,224 | 7,643,601 |
| Ollie's Bargain Outlet Holdings, Inc. (a) | | 63,043 | 3,716,385 |
| Target Corp. | | 41,424 | 6,767,853 |
| | | | 26,617,437 |
| Specialty Retail - 18.8% | | | |
| Apparel Retail - 5.1% | | | |
| Burlington Stores, Inc. (a) | | 45,063 | 6,359,741 |
| TJX Companies, Inc. | | 237,464 | 14,523,298 |
| Victoria's Secret & Co. (a) | | 39,709 | 1,467,645 |
| | | | 22,350,684 |
| Automotive Retail - 0.2% | | | |
| O'Reilly Automotive, Inc. (a) | | 1,200 | 844,308 |
| Home Improvement Retail - 10.9% | | | |
| Floor & Decor Holdings, Inc. Class A (a) | | 79,878 | 6,435,770 |
| Lowe's Companies, Inc. | | 103,477 | 19,818,950 |
| The Home Depot, Inc. | | 73,113 | 22,002,626 |
| | | | 48,257,346 |
| Specialty Stores - 2.6% | | | |
| Bath & Body Works, Inc. | | 38,518 | 1,368,930 |
| Dick's Sporting Goods, Inc. (b) | | 53,624 | 5,018,670 |
| Five Below, Inc. (a) | | 34,761 | 4,417,080 |
| Sally Beauty Holdings, Inc. (a) | | 50,990 | 651,652 |
| | | | 11,456,332 |
|
| TOTAL SPECIALTY RETAIL | | | 82,908,670 |
|
| Textiles, Apparel & Luxury Goods - 12.3% | | | |
| Apparel, Accessories & Luxury Goods - 6.2% | | | |
| Capri Holdings Ltd. (a) | | 183,030 | 8,909,900 |
| lululemon athletica, Inc. (a) | | 19,770 | 6,138,783 |
| LVMH Moet Hennessy Louis Vuitton SE | | 3,092 | 2,146,945 |
| PVH Corp. | | 53,219 | 3,295,320 |
| Tapestry, Inc. | | 208,804 | 7,022,079 |
| | | | 27,513,027 |
| Footwear - 6.1% | | | |
| Crocs, Inc. (a) | | 17,820 | 1,276,625 |
| Deckers Outdoor Corp. (a) | | 24,027 | 7,525,497 |
| NIKE, Inc. Class B | | 143,382 | 16,477,459 |
| On Holding AG | | 40,044 | 871,758 |
| Skechers U.S.A., Inc. Class A (sub. vtg.) (a) | | 18,900 | 717,444 |
| | | | 26,868,783 |
|
| TOTAL TEXTILES, APPAREL & LUXURY GOODS | | | 54,381,810 |
|
| TOTAL COMMON STOCKS | | | |
| (Cost $257,881,396) | | | 434,129,272 |
|
| Money Market Funds - 0.9% | | | |
| Fidelity Securities Lending Cash Central Fund 2.01% (c)(d) | | | |
| (Cost $3,926,447) | | 3,926,055 | 3,926,447 |
| TOTAL INVESTMENT IN SECURITIES - 99.3% | | | |
| (Cost $261,807,843) | | | 438,055,719 |
| NET OTHER ASSETS (LIABILITIES) - 0.7% | | | 2,935,578 |
| NET ASSETS - 100% | | | $440,991,297 |
Legend
(a) Non-income producing
(b) Security or a portion of the security is on loan at period end.
(c) Investment made with cash collateral received from securities on loan.
(d) Affiliated fund that is generally available only to investment companies and other accounts managed by Fidelity Investments. The rate quoted is the annualized seven-day yield of the fund at period end. A complete unaudited listing of the fund's holdings as of its most recent quarter end is available upon request. In addition, each Fidelity Central Fund's financial statements, which are not covered by the Fund's Report of Independent Registered Public Accounting Firm, are available on the SEC's website or upon request.
Affiliated Central Funds
Fiscal year to date information regarding the Fund's investments in Fidelity Central Funds, including the ownership percentage, is presented below.
| Fund | Value, beginning of period | Purchases | Sales Proceeds | Dividend Income | Realized Gain/Loss | Change in Unrealized appreciation (depreciation) | Value, end of period | % ownership, end of period |
| Fidelity Cash Central Fund 2.01% | $-- | $43,726,895 | $43,726,895 | $2,189 | $-- | $-- | $-- | 0.0% |
| Fidelity Securities Lending Cash Central Fund 2.01% | 13,937,765 | 81,228,507 | 91,239,825 | 175,525 | -- | -- | 3,926,447 | 0.0% |
| Total | $13,937,765 | $124,955,402 | $134,966,720 | $177,714 | $-- | $-- | $3,926,447 | |
Amounts in the income column in the above table include any capital gain distributions from underlying funds, which are presented in the corresponding line-item in the Statement of Operations, if applicable. Amount for Fidelity Securities Lending Cash Central Fund represents the income earned on investing cash collateral, less rebates paid to borrowers and any lending agent fees associated with the loan, plus any premium payments received for lending certain types of securities.
Investment Valuation
The following is a summary of the inputs used, as of July 31, 2022, involving the Fund's assets and liabilities carried at fair value. The inputs or methodology used for valuing securities may not be an indication of the risk associated with investing in those securities. For more information on valuation inputs, and their aggregation into the levels used below, please refer to the Investment Valuation section in the accompanying Notes to Financial Statements.
| | Valuation Inputs at Reporting Date: |
| Description | Total | Level 1 | Level 2 | Level 3 |
| Investments in Securities: | | | | |
| Common Stocks | $434,129,272 | $431,982,327 | $2,146,945 | $-- |
| Money Market Funds | 3,926,447 | 3,926,447 | -- | -- |
| Total Investments in Securities: | $438,055,719 | $435,908,774 | $2,146,945 | $-- |
See accompanying notes which are an integral part of the financial statements.
Fidelity Advisor® Consumer Discretionary Fund
Financial Statements
Statement of Assets and Liabilities
| | | July 31, 2022 |
| Assets | | |
Investment in securities, at value (including securities loaned of $3,957,052) — See accompanying schedule:
Unaffiliated issuers (cost $257,881,396) | $434,129,272 | |
| Fidelity Central Funds (cost $3,926,447) | 3,926,447 | |
| Total Investment in Securities (cost $261,807,843) | | $438,055,719 |
| Foreign currency held at value (cost $21,151) | | 18,944 |
| Receivable for investments sold | | 9,171,601 |
| Receivable for fund shares sold | | 125,067 |
| Dividends receivable | | 120,009 |
| Distributions receivable from Fidelity Central Funds | | 54,993 |
| Prepaid expenses | | 973 |
| Other receivables | | 2,423 |
| Total assets | | 447,549,729 |
| Liabilities | | |
| Payable to custodian bank | $1,024,948 | |
| Payable for investments purchased | 847,271 | |
| Payable for fund shares redeemed | 382,439 | |
| Accrued management fee | 177,291 | |
| Distribution and service plan fees payable | 90,266 | |
| Other affiliated payables | 70,408 | |
| Other payables and accrued expenses | 39,536 | |
| Collateral on securities loaned | 3,926,273 | |
| Total liabilities | | 6,558,432 |
| Net Assets | | $440,991,297 |
| Net Assets consist of: | | |
| Paid in capital | | $270,250,754 |
| Total accumulated earnings (loss) | | 170,740,543 |
| Net Assets | | $440,991,297 |
| Net Asset Value and Maximum Offering Price | | |
| Class A: | | |
| Net Asset Value and redemption price per share ($188,092,393 ÷ 5,366,874 shares)(a) | | $35.05 |
| Maximum offering price per share (100/94.25 of $35.05) | | $37.19 |
| Class M: | | |
| Net Asset Value and redemption price per share ($35,219,402 ÷ 1,093,670 shares)(a) | | $32.20 |
| Maximum offering price per share (100/96.50 of $32.20) | | $33.37 |
| Class C: | | |
| Net Asset Value and offering price per share ($54,035,194 ÷ 2,006,931 shares)(a) | | $26.92 |
| Class I: | | |
| Net Asset Value, offering price and redemption price per share ($118,859,232 ÷ 3,091,516 shares) | | $38.45 |
| Class Z: | | |
| Net Asset Value, offering price and redemption price per share ($44,785,076 ÷ 1,160,631 shares) | | $38.59 |
(a) Redemption price per share is equal to net asset value less any applicable contingent deferred sales charge.
See accompanying notes which are an integral part of the financial statements.
Statement of Operations
| | | Year ended July 31, 2022 |
| Investment Income | | |
| Dividends | | $3,617,332 |
| Income from Fidelity Central Funds (including $175,525 from security lending) | | 177,714 |
| Total income | | 3,795,046 |
| Expenses | | |
| Management fee | $3,143,932 | |
| Transfer agent fees | 961,457 | |
| Distribution and service plan fees | 1,516,808 | |
| Accounting fees | 216,918 | |
| Custodian fees and expenses | 6,867 | |
| Independent trustees' fees and expenses | 2,081 | |
| Registration fees | 81,632 | |
| Audit | 50,145 | |
| Legal | 2,436 | |
| Interest | 6,394 | |
| Miscellaneous | 2,800 | |
| Total expenses before reductions | 5,991,470 | |
| Expense reductions | (18,999) | |
| Total expenses after reductions | | 5,972,471 |
| Net investment income (loss) | | (2,177,425) |
| Realized and Unrealized Gain (Loss) | | |
| Net realized gain (loss) on: | | |
| Investment securities: | | |
| Unaffiliated issuers | 22,334,313 | |
| Foreign currency transactions | 8,890 | |
| Total net realized gain (loss) | | 22,343,203 |
| Change in net unrealized appreciation (depreciation) on: | | |
| Investment securities: | | |
| Unaffiliated issuers | (130,855,690) | |
| Assets and liabilities in foreign currencies | (4,089) | |
| Total change in net unrealized appreciation (depreciation) | | (130,859,779) |
| Net gain (loss) | | (108,516,576) |
| Net increase (decrease) in net assets resulting from operations | | $(110,694,001) |
See accompanying notes which are an integral part of the financial statements.
Statement of Changes in Net Assets
| | Year ended July 31, 2022 | Year ended July 31, 2021 |
| Increase (Decrease) in Net Assets | | |
| Operations | | |
| Net investment income (loss) | $(2,177,425) | $(2,823,328) |
| Net realized gain (loss) | 22,343,203 | 37,045,808 |
| Change in net unrealized appreciation (depreciation) | (130,859,779) | 139,568,170 |
| Net increase (decrease) in net assets resulting from operations | (110,694,001) | 173,790,650 |
| Distributions to shareholders | (44,840,619) | (7,826,027) |
| Share transactions - net increase (decrease) | (144,288,903) | 132,554,621 |
| Total increase (decrease) in net assets | (299,823,523) | 298,519,244 |
| Net Assets | | |
| Beginning of period | 740,814,820 | 442,295,576 |
| End of period | $440,991,297 | $740,814,820 |
See accompanying notes which are an integral part of the financial statements.
Financial Highlights
Fidelity Advisor Consumer Discretionary Fund Class A
| Years ended July 31, | 2022 | 2021 | 2020 | 2019 | 2018 |
| Selected Per–Share Data | | | | | |
| Net asset value, beginning of period | $45.74 | $33.70 | $29.83 | $28.22 | $22.92 |
| Income from Investment Operations | | | | | |
| Net investment income (loss)A,B | (.16) | (.20) | (.04) | (.02) | (.02) |
| Net realized and unrealized gain (loss) | (7.62) | 12.82 | 4.73 | 1.90 | 5.32 |
| Total from investment operations | (7.78) | 12.62 | 4.69 | 1.88 | 5.30 |
| Distributions from net investment income | – | – | – | – | – |
| Distributions from net realized gain | (2.91) | (.58) | (.82) | (.27) | – |
| Total distributions | (2.91) | (.58) | (.82) | (.27) | – |
| Net asset value, end of period | $35.05 | $45.74 | $33.70 | $29.83 | $28.22 |
| Total ReturnC,D | (18.26)% | 37.68% | 16.03% | 6.81% | 23.12% |
| Ratios to Average Net AssetsB,E,F | | | | | |
| Expenses before reductions | 1.01% | 1.03% | 1.07% | 1.08% | 1.12% |
| Expenses net of fee waivers, if any | 1.01% | 1.03% | 1.07% | 1.08% | 1.12% |
| Expenses net of all reductions | 1.01% | 1.03% | 1.06% | 1.07% | 1.11% |
| Net investment income (loss) | (.38)% | (.48)% | (.14)% | (.09)% | (.08)% |
| Supplemental Data | | | | | |
| Net assets, end of period (000 omitted) | $188,092 | $259,488 | $159,603 | $159,298 | $146,605 |
| Portfolio turnover rateG | 34% | 35% | 41%H | 60% | 60% |
A Calculated based on average shares outstanding during the period.
B Net investment income (loss) is affected by the timing of the declaration of dividends by any underlying mutual funds or exchange-traded funds (ETFs). Net investment income (loss) of any such underlying funds is not included in the Fund's net investment income (loss) ratio.
C Total returns would have been lower if certain expenses had not been reduced during the applicable periods shown.
D Total returns do not include the effect of the sales charges.
E Fees and expenses of any underlying mutual funds or exchange-traded funds (ETFs) are not included in the Fund's expense ratio. The Fund indirectly bears its proportionate share of these expenses. For additional expense information related to investments in Fidelity Central Funds, please refer to the "Investments in Fidelity Central Funds" note found in the Notes to Financial Statements section of the most recent Annual or Semi-Annual report.
F Expense ratios reflect operating expenses of the class. Expenses before reductions do not reflect amounts reimbursed, waived, or reduced through arrangements with the investment adviser, brokerage services, or other offset arrangements, if applicable, and do not represent the amount paid by the class during periods when reimbursements, waivers or reductions occur.
G Amount does not include the portfolio activity of any underlying mutual funds or exchange-traded funds (ETFs).
H Portfolio turnover rate excludes securities received or delivered in-kind.
See accompanying notes which are an integral part of the financial statements.
Fidelity Advisor Consumer Discretionary Fund Class M
| Years ended July 31, | 2022 | 2021 | 2020 | 2019 | 2018 |
| Selected Per–Share Data | | | | | |
| Net asset value, beginning of period | $42.23 | $31.23 | $27.78 | $26.36 | $21.47 |
| Income from Investment Operations | | | | | |
| Net investment income (loss)A,B | (.24) | (.29) | (.11) | (.09) | (.08) |
| Net realized and unrealized gain (loss) | (7.02) | 11.87 | 4.38 | 1.78 | 4.97 |
| Total from investment operations | (7.26) | 11.58 | 4.27 | 1.69 | 4.89 |
| Distributions from net investment income | – | – | – | – | – |
| Distributions from net realized gain | (2.77) | (.58) | (.82) | (.27) | – |
| Total distributions | (2.77) | (.58) | (.82) | (.27) | – |
| Net asset value, end of period | $32.20 | $42.23 | $31.23 | $27.78 | $26.36 |
| Total ReturnC,D | (18.49)% | 37.32% | 15.70% | 6.56% | 22.78% |
| Ratios to Average Net AssetsB,E,F | | | | | |
| Expenses before reductions | 1.28% | 1.30% | 1.34% | 1.34% | 1.38% |
| Expenses net of fee waivers, if any | 1.27% | 1.30% | 1.34% | 1.34% | 1.38% |
| Expenses net of all reductions | 1.27% | 1.29% | 1.33% | 1.34% | 1.38% |
| Net investment income (loss) | (.64)% | (.75)% | (.41)% | (.35)% | (.35)% |
| Supplemental Data | | | | | |
| Net assets, end of period (000 omitted) | $35,219 | $48,288 | $33,896 | $32,792 | $34,622 |
| Portfolio turnover rateG | 34% | 35% | 41%H | 60% | 60% |
A Calculated based on average shares outstanding during the period.
B Net investment income (loss) is affected by the timing of the declaration of dividends by any underlying mutual funds or exchange-traded funds (ETFs). Net investment income (loss) of any such underlying funds is not included in the Fund's net investment income (loss) ratio.
C Total returns would have been lower if certain expenses had not been reduced during the applicable periods shown.
D Total returns do not include the effect of the sales charges.
E Fees and expenses of any underlying mutual funds or exchange-traded funds (ETFs) are not included in the Fund's expense ratio. The Fund indirectly bears its proportionate share of these expenses. For additional expense information related to investments in Fidelity Central Funds, please refer to the "Investments in Fidelity Central Funds" note found in the Notes to Financial Statements section of the most recent Annual or Semi-Annual report.
F Expense ratios reflect operating expenses of the class. Expenses before reductions do not reflect amounts reimbursed, waived, or reduced through arrangements with the investment adviser, brokerage services, or other offset arrangements, if applicable, and do not represent the amount paid by the class during periods when reimbursements, waivers or reductions occur.
G Amount does not include the portfolio activity of any underlying mutual funds or exchange-traded funds (ETFs).
H Portfolio turnover rate excludes securities received or delivered in-kind.
See accompanying notes which are an integral part of the financial statements.
Fidelity Advisor Consumer Discretionary Fund Class C
| Years ended July 31, | 2022 | 2021 | 2020 | 2019 | 2018 |
| Selected Per–Share Data | | | | | |
| Net asset value, beginning of period | $35.82 | $26.69 | $23.97 | $22.90 | $18.74 |
| Income from Investment Operations | | | | | |
| Net investment income (loss)A,B | (.36) | (.40) | (.21) | (.19) | (.17) |
| Net realized and unrealized gain (loss) | (5.87) | 10.11 | 3.75 | 1.53 | 4.33 |
| Total from investment operations | (6.23) | 9.71 | 3.54 | 1.34 | 4.16 |
| Distributions from net investment income | – | – | – | – | – |
| Distributions from net realized gain | (2.67) | (.58) | (.82) | (.27) | – |
| Total distributions | (2.67) | (.58) | (.82) | (.27) | – |
| Net asset value, end of period | $26.92 | $35.82 | $26.69 | $23.97 | $22.90 |
| Total ReturnC,D | (18.88)% | 36.66% | 15.14% | 6.02% | 22.20% |
| Ratios to Average Net AssetsB,E,F | | | | | |
| Expenses before reductions | 1.77% | 1.79% | 1.82% | 1.83% | 1.87% |
| Expenses net of fee waivers, if any | 1.76% | 1.79% | 1.82% | 1.83% | 1.87% |
| Expenses net of all reductions | 1.76% | 1.79% | 1.82% | 1.82% | 1.86% |
| Net investment income (loss) | (1.13)% | (1.24)% | (.90)% | (.83)% | (.83)% |
| Supplemental Data | | | | | |
| Net assets, end of period (000 omitted) | $54,035 | $85,549 | $65,223 | $70,890 | $71,116 |
| Portfolio turnover rateG | 34% | 35% | 41%H | 60% | 60% |
A Calculated based on average shares outstanding during the period.
B Net investment income (loss) is affected by the timing of the declaration of dividends by any underlying mutual funds or exchange-traded funds (ETFs). Net investment income (loss) of any such underlying funds is not included in the Fund's net investment income (loss) ratio.
C Total returns would have been lower if certain expenses had not been reduced during the applicable periods shown.
D Total returns do not include the effect of the contingent deferred sales charge.
E Fees and expenses of any underlying mutual funds or exchange-traded funds (ETFs) are not included in the Fund's expense ratio. The Fund indirectly bears its proportionate share of these expenses. For additional expense information related to investments in Fidelity Central Funds, please refer to the "Investments in Fidelity Central Funds" note found in the Notes to Financial Statements section of the most recent Annual or Semi-Annual report.
F Expense ratios reflect operating expenses of the class. Expenses before reductions do not reflect amounts reimbursed, waived, or reduced through arrangements with the investment adviser, brokerage services, or other offset arrangements, if applicable, and do not represent the amount paid by the class during periods when reimbursements, waivers or reductions occur.
G Amount does not include the portfolio activity of any underlying mutual funds or exchange-traded funds (ETFs).
H Portfolio turnover rate excludes securities received or delivered in-kind.
See accompanying notes which are an integral part of the financial statements.
Fidelity Advisor Consumer Discretionary Fund Class I
| Years ended July 31, | 2022 | 2021 | 2020 | 2019 | 2018 |
| Selected Per–Share Data | | | | | |
| Net asset value, beginning of period | $49.91 | $36.63 | $32.27 | $30.42 | $24.64 |
| Income from Investment Operations | | | | | |
| Net investment income (loss)A,B | (.05) | (.10) | .04 | .06 | .06 |
| Net realized and unrealized gain (loss) | (8.36) | 13.96 | 5.14 | 2.06 | 5.72 |
| Total from investment operations | (8.41) | 13.86 | 5.18 | 2.12 | 5.78 |
| Distributions from net investment income | – | – | – | – | – |
| Distributions from net realized gain | (3.05) | (.58) | (.82) | (.27) | – |
| Total distributions | (3.05) | (.58) | (.82) | (.27) | – |
| Net asset value, end of period | $38.45 | $49.91 | $36.63 | $32.27 | $30.42 |
| Total ReturnC | (18.04)% | 38.05% | 16.34% | 7.10% | 23.46% |
| Ratios to Average Net AssetsB,D,E | | | | | |
| Expenses before reductions | .75% | .77% | .79% | .80% | .84% |
| Expenses net of fee waivers, if any | .74% | .76% | .79% | .80% | .83% |
| Expenses net of all reductions | .74% | .76% | .79% | .80% | .83% |
| Net investment income (loss) | (.11)% | (.22)% | .13% | .19% | .20% |
| Supplemental Data | | | | | |
| Net assets, end of period (000 omitted) | $118,859 | $259,846 | $134,907 | $159,613 | $152,711 |
| Portfolio turnover rateF | 34% | 35% | 41%G | 60% | 60% |
A Calculated based on average shares outstanding during the period.
B Net investment income (loss) is affected by the timing of the declaration of dividends by any underlying mutual funds or exchange-traded funds (ETFs). Net investment income (loss) of any such underlying funds is not included in the Fund's net investment income (loss) ratio.
C Total returns would have been lower if certain expenses had not been reduced during the applicable periods shown.
D Fees and expenses of any underlying mutual funds or exchange-traded funds (ETFs) are not included in the Fund's expense ratio. The Fund indirectly bears its proportionate share of these expenses. For additional expense information related to investments in Fidelity Central Funds, please refer to the "Investments in Fidelity Central Funds" note found in the Notes to Financial Statements section of the most recent Annual or Semi-Annual report.
E Expense ratios reflect operating expenses of the class. Expenses before reductions do not reflect amounts reimbursed, waived, or reduced through arrangements with the investment adviser, brokerage services, or other offset arrangements, if applicable, and do not represent the amount paid by the class during periods when reimbursements, waivers or reductions occur.
F Amount does not include the portfolio activity of any underlying mutual funds or exchange-traded funds (ETFs).
G Portfolio turnover rate excludes securities received or delivered in-kind.
See accompanying notes which are an integral part of the financial statements.
Fidelity Advisor Consumer Discretionary Fund Class Z
| Years ended July 31, | 2022 | 2021 | 2020 | 2019 A |
| Selected Per–Share Data | | | | |
| Net asset value, beginning of period | $50.10 | $36.72 | $32.31 | $31.56 |
| Income from Investment Operations | | | | |
| Net investment income (loss)B,C | –D | (.04) | .09 | .10 |
| Net realized and unrealized gain (loss) | (8.38) | 14.00 | 5.14 | .92 |
| Total from investment operations | (8.38) | 13.96 | 5.23 | 1.02 |
| Distributions from net investment income | – | – | – | – |
| Distributions from net realized gain | (3.13) | (.58) | (.82) | (.27) |
| Total distributions | (3.13) | (.58) | (.82) | (.27) |
| Net asset value, end of period | $38.59 | $50.10 | $36.72 | $32.31 |
| Total ReturnE,F | (17.93)% | 38.23% | 16.48% | 3.36% |
| Ratios to Average Net AssetsC,G,H | | | | |
| Expenses before reductions | .62% | .64% | .66% | .67%I |
| Expenses net of fee waivers, if any | .62% | .64% | .66% | .66%I |
| Expenses net of all reductions | .62% | .64% | .66% | .66%I |
| Net investment income (loss) | .01% | (.09)% | .26% | .39%I |
| Supplemental Data | | | | |
| Net assets, end of period (000 omitted) | $44,785 | $87,644 | $48,668 | $6,786 |
| Portfolio turnover rateJ | 34% | 35% | 41%K | 60% |
A For the period October 2, 2018 (commencement of sale of shares) through July 31, 2019.
B Calculated based on average shares outstanding during the period.
C Net investment income (loss) is affected by the timing of the declaration of dividends by any underlying mutual funds or exchange-traded funds (ETFs). Net investment income (loss) of any such underlying funds is not included in the Fund's net investment income (loss) ratio.
D Amount represents less than $.005 per share.
E Total returns for periods of less than one year are not annualized.
F Total returns would have been lower if certain expenses had not been reduced during the applicable periods shown.
G Fees and expenses of any underlying mutual funds or exchange-traded funds (ETFs) are not included in the Fund's expense ratio. The Fund indirectly bears its proportionate share of these expenses. For additional expense information related to investments in Fidelity Central Funds, please refer to the "Investments in Fidelity Central Funds" note found in the Notes to Financial Statements section of the most recent Annual or Semi-Annual report.
H Expense ratios reflect operating expenses of the class. Expenses before reductions do not reflect amounts reimbursed, waived, or reduced through arrangements with the investment adviser, brokerage services, or other offset arrangements, if applicable, and do not represent the amount paid by the class during periods when reimbursements, waivers or reductions occur.
I Annualized
J Amount does not include the portfolio activity of any underlying mutual funds or exchange-traded funds (ETFs).
K Portfolio turnover rate excludes securities received or delivered in-kind.
See accompanying notes which are an integral part of the financial statements.
Fidelity Advisor® Energy Fund
Performance: The Bottom Line
Average annual total return reflects the change in the value of an investment, assuming reinvestment of distributions from dividend income and capital gains (the profits earned upon the sale of securities that have grown in value, if any) and assuming a constant rate of performance each year. The hypothetical investment and the average annual total returns do not reflect the deduction of taxes that a shareholder would pay on fund distributions or the redemption of fund shares. During periods of reimbursement by Fidelity, a fund’s total return will be greater than it would be had the reimbursement not occurred. How a fund did yesterday is no guarantee of how it will do tomorrow.
Average Annual Total Returns
| For the periods ended July 31, 2022 | Past 1 year | Past 5 years | Past 10 years |
| Class A (incl. 5.75% sales charge) | 61.28% | 5.88% | 3.09% |
| Class M (incl. 3.50% sales charge) | 64.68% | 6.10% | 3.08% |
| Class C (incl. contingent deferred sales charge) | 68.86% | 6.36% | 3.11% |
| Class I | 71.63% | 7.47% | 4.01% |
| Class Z | 71.83% | 7.59% | 4.07% |
Class C shares' contingent deferred sales charges included in the past one year, past five years and past ten years total return figures are 1%, 0% and 0%, respectively.
The initial offering of Class Z shares took place on October 2, 2018. Returns prior to October 2, 2018, are those of Class I.
$10,000 Over 10 Years
Let's say hypothetically that $10,000 was invested in Fidelity Advisor® Energy Fund - Class A on July 31, 2012, and the current 5.75% sales charge was paid.
The chart shows how the value of your investment would have changed, and also shows how the S&P 500® Index performed over the same period.
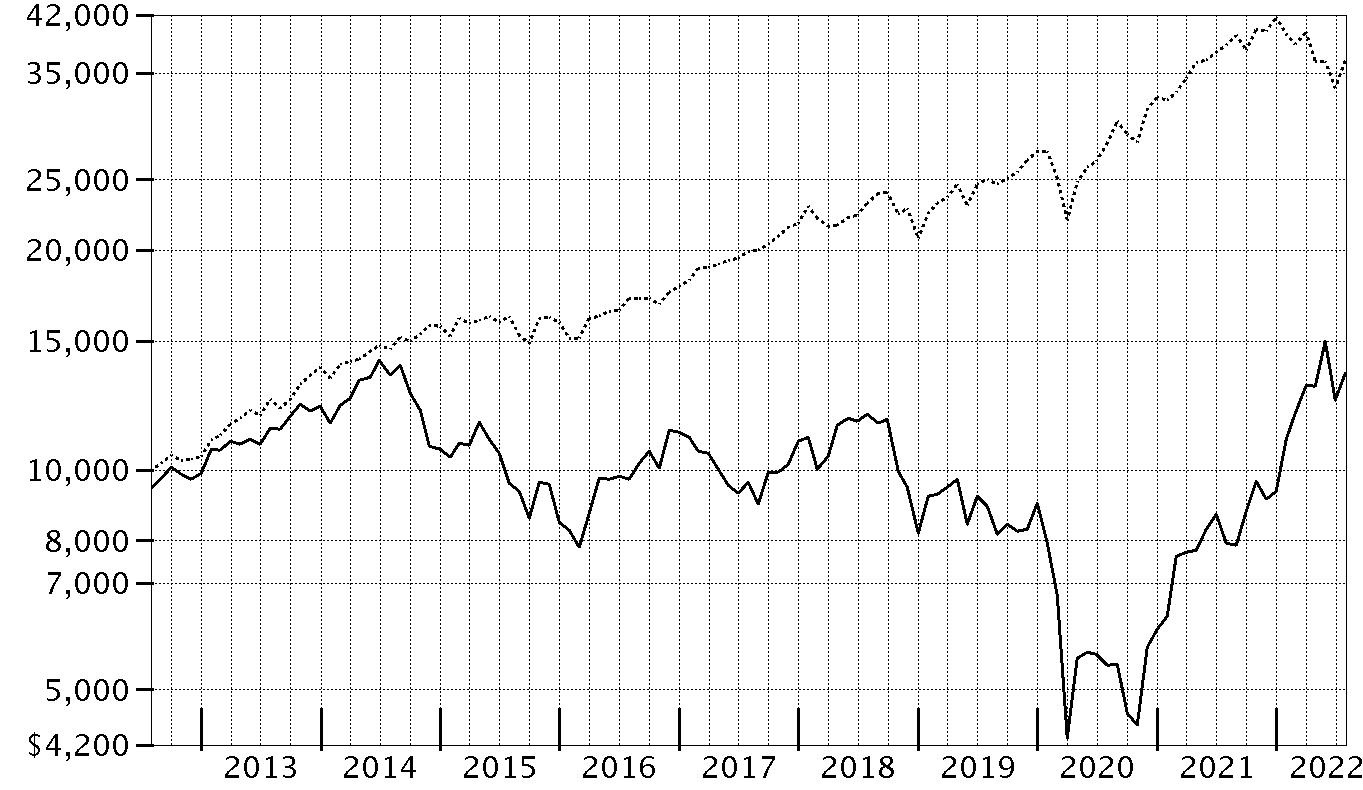
| Period Ending Values |
| $13,562 | Fidelity Advisor® Energy Fund - Class A |
| $36,428 | S&P 500® Index |
Fidelity Advisor® Energy Fund
Management's Discussion of Fund Performance
Market Recap: The S&P 500
® index returned -4.64% for the 12 months ending July 31, 2022, as a multitude of crosscurrents challenged the global economy and financial markets. Persistently high inflation, exacerbated by energy price shocks from the Russia–Ukraine conflict, spurred the U.S. Federal Reserve to hike interest rates more aggressively than anticipated, and concerns about the outlook for economic growth sent stocks into bear market territory. In early May, the Fed approved a rare half-percentage-point interest rate increase and announced plans to shrink its $9 trillion asset portfolio. June began with the Fed allowing up to billions in Treasuries and mortgage bonds to mature every month without investing the proceeds. Two weeks later, the central bank raised rates by 0.75 percentage points, its largest increase since 1994, and said it was becoming more difficult to achieve a soft landing, in which the economy slows enough to bring down inflation while avoiding a recession. Against this volatile backdrop, the S&P 500 posted its worst first-half result (-19.96%) to begin a year since 1970. Stocks sharply reversed course in July (+9.22%), as the Fed again raised its benchmark interest rate by 0.75% but signaled that, at some point, it will likely slow the pace of tightening to assess the impact on the economy. For the full 12 months, growth-oriented communication services (-29%) and consumer discretionary (-10%) stocks lagged most. In contrast, energy (+67%) rode a surge in commodity prices and led by a wide margin, followed by the defensive utilities (+16%) and consumer staples (+7%) sectors.
Comments from Portfolio Manager Maurice FitzMaurice: For the fiscal year ending July 31, 2022, the fund's share classes (excluding sales charges, if applicable) gained about 70% to 72%, outperforming the 65.71% advance of the MSCI U.S. IMI Energy 25/50 Index, as well as the broad-based S&P 500
® index. The top contributors to the fund's performance versus the sector index were security selection and an underweighting in the oil & gas storage & transportation industry. Stock picks and an overweighting in oil & gas exploration & production and security selection in integrated oil & gas also notably boosted the fund's relative result. Our top individual relative contributor was an out-of-index stake in Cenovus Energy (+160%), which was a position we added during the reporting period and among the fund's biggest holdings as of July 31. Our second-largest relative contributor this period was avoiding Kinder Morgan, an index component that gained 10%. Another notable relative contributor was an overweighting in Devon Energy (+159%), which was one of our largest holdings. Conversely, the largest detractor from performance versus the sector index were stock picks in the independent power producers & energy traders segment. Also detracting from the fund's relative result was stock selection and an underweighting in oil & gas equipment & services. Stock selection and an overweighting in coal & consumable fuels also modestly hurt. Our non-index stake in National Energy Services Reunited was the fund's biggest individual relative detractor, due to its roughly -46% result. Our position in the stock grew during the past 12 months. The fund's stake in Energy Transfer (+25%) notably detracted given its underperformance relative to the sector index. We added to our non-index position in the company this period. Also holding back performance was an underweighting in Halliburton, which gained 43%. This was a stake we established the past year. Notable changes in positioning include reduced exposure to the oil & gas storage & transportation industry.
The views expressed above reflect those of the portfolio manager(s) only through the end of the period as stated on the cover of this report and do not necessarily represent the views of Fidelity or any other person in the Fidelity organization. Any such views are subject to change at any time based upon market or other conditions and Fidelity disclaims any responsibility to update such views. These views may not be relied on as investment advice and, because investment decisions for a Fidelity fund are based on numerous factors, may not be relied on as an indication of trading intent on behalf of any Fidelity fund.
Fidelity Advisor® Energy Fund
Investment Summary (Unaudited)
Top Ten Stocks as of July 31, 2022
| | % of fund's net assets |
| Exxon Mobil Corp. | 21.9 |
| Chevron Corp. | 7.3 |
| Cenovus Energy, Inc. (Canada) | 4.8 |
| ConocoPhillips Co. | 4.7 |
| Hess Corp. | 4.1 |
| Canadian Natural Resources Ltd. | 3.8 |
| Valero Energy Corp. | 3.8 |
| Occidental Petroleum Corp. | 3.7 |
| Cheniere Energy, Inc. | 3.4 |
| Devon Energy Corp. | 3.4 |
| | 60.9 |
Industries (% of fund's net assets)
| As of July 31, 2022 |
| | Oil, Gas & Consumable Fuels | 89.4% |
| | Energy Equipment & Services | 9.3% |
| | Independent Power and Renewable Electricity Producers | 0.8% |
| | All Others* | 0.5% |

* Includes Short-Term investments and Net Other Assets (Liabilities).
Geographic Diversification (% of fund's net assets)
| As of July 31, 2022 |
| | United States of America* | 84.1% |
| | Canada | 11.0% |
| | Curacao | 2.7% |
| | United Kingdom | 1.1% |
| | Bermuda | 0.5% |
| | British Virgin Islands | 0.4% |
| | Netherlands | 0.1% |
| | Norway | 0.1% |

* Includes Short-Term investments and Net Other Assets (Liabilities).
Percentages are based on country or territory of incorporation and are adjusted for the effect of futures contracts, if applicable.
Fidelity Advisor® Energy Fund
Schedule of Investments July 31, 2022
Showing Percentage of Net Assets
| Common Stocks - 99.5% | | | |
| | | Shares | Value |
| Energy Equipment & Services - 9.3% | | | |
| Oil & Gas Drilling - 0.3% | | | |
| Nabors Industries Ltd. (a) | | 8,012 | $1,141,630 |
| Nabors Industries Ltd. warrants 6/11/26 (a) | | 6,604 | 217,932 |
| Odfjell Drilling Ltd. (a) | | 722,656 | 1,727,179 |
| Odfjell Technology Ltd. (a) | | 120,442 | 285,369 |
| Shelf Drilling Ltd. (a)(b) | | 609,128 | 787,793 |
| | | | 4,159,903 |
| Oil & Gas Equipment & Services - 9.0% | | | |
| Baker Hughes Co. Class A | | 172,500 | 4,431,525 |
| Cactus, Inc. | | 30,700 | 1,276,813 |
| Halliburton Co. | | 1,041,100 | 30,504,230 |
| Nextier Oilfield Solutions, Inc. (a) | | 1,821,100 | 18,156,367 |
| NOV, Inc. | | 131,135 | 2,440,422 |
| Oceaneering International, Inc.(a) | | 495,800 | 5,265,396 |
| ProPetro Holding Corp. (a) | | 711,800 | 7,488,136 |
| Schlumberger Ltd. | | 1,017,118 | 37,663,880 |
| Technip Energies NV | | 121,420 | 1,430,842 |
| TechnipFMC PLC (a) | | 1,941,400 | 15,705,926 |
| | | | 124,363,537 |
|
| TOTAL ENERGY EQUIPMENT & SERVICES | | | 128,523,440 |
|
| Independent Power and Renewable Electricity Producers - 0.8% | | | |
| Independent Power Producers & Energy Traders - 0.8% | | | |
| The AES Corp. | | 25,700 | 571,054 |
| Vistra Corp. | | 379,700 | 9,815,245 |
| | | | 10,386,299 |
| Oil, Gas & Consumable Fuels - 89.4% | | | |
| Coal & Consumable Fuels - 0.7% | | | |
| Arch Resources, Inc. | | 32,800 | 4,235,792 |
| Enviva, Inc. | | 11,400 | 793,782 |
| Peabody Energy Corp. (a)(c) | | 204,800 | 4,298,752 |
| | | | 9,328,326 |
| Integrated Oil & Gas - 40.2% | | | |
| Cenovus Energy, Inc. (Canada) | | 3,466,100 | 66,044,153 |
| Chevron Corp. | | 616,470 | 100,965,457 |
| Exxon Mobil Corp. | | 3,114,761 | 301,913,783 |
| Imperial Oil Ltd. | | 270,200 | 12,949,259 |
| Occidental Petroleum Corp. | | 766,800 | 50,417,100 |
| Occidental Petroleum Corp. warrants 8/3/27 (a) | | 36,987 | 1,625,579 |
| Suncor Energy, Inc. | | 598,900 | 20,325,793 |
| | | | 554,241,124 |
| Oil & Gas Exploration & Production - 34.9% | | | |
| Antero Resources Corp. (a) | | 729,600 | 28,921,344 |
| APA Corp. | | 533,000 | 19,811,610 |
| Callon Petroleum Co. (a) | | 71,040 | 3,270,682 |
| Canadian Natural Resources Ltd. (c) | | 944,100 | 52,131,749 |
| Chesapeake Energy Corp. (c) | | 73,100 | 6,883,827 |
| Civitas Resources, Inc. | | 118,544 | 6,989,354 |
| ConocoPhillips Co. | | 661,450 | 64,445,074 |
| Coterra Energy, Inc. | | 626,421 | 19,162,218 |
| Devon Energy Corp. | | 747,800 | 46,999,230 |
| Diamondback Energy, Inc. | | 91,200 | 11,675,424 |
| EOG Resources, Inc. | | 219,686 | 24,433,477 |
| Hess Corp. | | 500,600 | 56,302,482 |
| Magnolia Oil & Gas Corp. Class A | | 255,500 | 6,165,215 |
| National Energy Services Reunited Corp. (a) | | 845,300 | 5,959,365 |
| Northern Oil & Gas, Inc. | | 76,930 | 2,217,892 |
| Oasis Petroleum, Inc. | | 44,430 | 5,697,703 |
| Ovintiv, Inc. | | 389,400 | 19,894,446 |
| PDC Energy, Inc. | | 539,488 | 35,438,967 |
| Pioneer Natural Resources Co. | | 191,225 | 45,310,764 |
| Range Resources Corp. (a) | | 324,100 | 10,717,987 |
| SM Energy Co. | | 146,300 | 6,039,264 |
| Viper Energy Partners LP | | 54,800 | 1,684,552 |
| | | | 480,152,626 |
| Oil & Gas Refining & Marketing - 8.4% | | | |
| Marathon Petroleum Corp. | | 426,578 | 39,100,139 |
| Phillips 66 Co. | | 281,418 | 25,046,202 |
| Valero Energy Corp. | | 468,700 | 51,917,899 |
| | | | 116,064,240 |
| Oil & Gas Storage & Transport - 5.2% | | | |
| Cheniere Energy, Inc. | | 319,200 | 47,745,936 |
| Energy Transfer LP | | 1,589,900 | 17,981,769 |
| Golar LNG Ltd. (a) | | 174,000 | 3,892,380 |
| Targa Resources Corp. | | 38,500 | 2,660,735 |
| | | | 72,280,820 |
|
| TOTAL OIL, GAS & CONSUMABLE FUELS | | | 1,232,067,136 |
|
| TOTAL COMMON STOCKS | | | |
| (Cost $892,252,401) | | | 1,370,976,875 |
|
| Money Market Funds - 4.6% | | | |
| Fidelity Cash Central Fund 2.01% (d) | | 5,551,117 | 5,552,227 |
| Fidelity Securities Lending Cash Central Fund 2.01% (d)(e) | | 57,996,700 | 58,002,499 |
| TOTAL MONEY MARKET FUNDS | | | |
| (Cost $63,554,726) | | | 63,554,726 |
| TOTAL INVESTMENT IN SECURITIES - 104.1% | | | |
| (Cost $955,807,127) | | | 1,434,531,601 |
| NET OTHER ASSETS (LIABILITIES) - (4.1)% | | | (56,941,640) |
| NET ASSETS - 100% | | | $1,377,589,961 |
Legend
(a) Non-income producing
(b) Security exempt from registration under Rule 144A of the Securities Act of 1933. These securities may be resold in transactions exempt from registration, normally to qualified institutional buyers. At the end of the period, the value of these securities amounted to $787,793 or 0.1% of net assets.
(c) Security or a portion of the security is on loan at period end.
(d) Affiliated fund that is generally available only to investment companies and other accounts managed by Fidelity Investments. The rate quoted is the annualized seven-day yield of the fund at period end. A complete unaudited listing of the fund's holdings as of its most recent quarter end is available upon request. In addition, each Fidelity Central Fund's financial statements, which are not covered by the Fund's Report of Independent Registered Public Accounting Firm, are available on the SEC's website or upon request.
(e) Investment made with cash collateral received from securities on loan.
Affiliated Central Funds
Fiscal year to date information regarding the Fund's investments in Fidelity Central Funds, including the ownership percentage, is presented below.
| Fund | Value, beginning of period | Purchases | Sales Proceeds | Dividend Income | Realized Gain/Loss | Change in Unrealized appreciation (depreciation) | Value, end of period | % ownership, end of period |
| Fidelity Cash Central Fund 2.01% | $576,142 | $312,720,927 | $307,744,842 | $16,753 | $-- | $-- | $5,552,227 | 0.0% |
| Fidelity Securities Lending Cash Central Fund 2.01% | 1,345,124 | 333,189,929 | 276,532,554 | 40,517 | -- | -- | 58,002,499 | 0.2% |
| Total | $1,921,266 | $645,910,856 | $584,277,396 | $57,270 | $-- | $-- | $63,554,726 | |
Amounts in the income column in the above table include any capital gain distributions from underlying funds, which are presented in the corresponding line-item in the Statement of Operations, if applicable. Amount for Fidelity Securities Lending Cash Central Fund represents the income earned on investing cash collateral, less rebates paid to borrowers and any lending agent fees associated with the loan, plus any premium payments received for lending certain types of securities.
Investment Valuation
The following is a summary of the inputs used, as of July 31, 2022, involving the Fund's assets and liabilities carried at fair value. The inputs or methodology used for valuing securities may not be an indication of the risk associated with investing in those securities. For more information on valuation inputs, and their aggregation into the levels used below, please refer to the Investment Valuation section in the accompanying Notes to Financial Statements.
| | Valuation Inputs at Reporting Date: |
| Description | Total | Level 1 | Level 2 | Level 3 |
| Investments in Securities: | | | | |
| Common Stocks | $1,370,976,875 | $1,370,976,875 | $-- | $-- |
| Money Market Funds | 63,554,726 | 63,554,726 | -- | -- |
| Total Investments in Securities: | $1,434,531,601 | $1,434,531,601 | $-- | $-- |
See accompanying notes which are an integral part of the financial statements.
Fidelity Advisor® Energy Fund
Financial Statements
Statement of Assets and Liabilities
| | | July 31, 2022 |
| Assets | | |
Investment in securities, at value (including securities loaned of $56,915,015) — See accompanying schedule:
Unaffiliated issuers (cost $892,252,401) | $1,370,976,875 | |
| Fidelity Central Funds (cost $63,554,726) | 63,554,726 | |
| Total Investment in Securities (cost $955,807,127) | | $1,434,531,601 |
| Receivable for investments sold | | 4,511,683 |
| Receivable for fund shares sold | | 1,919,085 |
| Dividends receivable | | 102,182 |
| Distributions receivable from Fidelity Central Funds | | 8,883 |
| Prepaid expenses | | 2,585 |
| Other receivables | | 125,037 |
| Total assets | | 1,441,201,056 |
| Liabilities | | |
| Payable for investments purchased | $2,280,417 | |
| Payable for fund shares redeemed | 2,216,664 | |
| Accrued management fee | 550,674 | |
| Distribution and service plan fees payable | 192,209 | |
| Other affiliated payables | 220,092 | |
| Other payables and accrued expenses | 148,864 | |
| Collateral on securities loaned | 58,002,175 | |
| Total liabilities | | 63,611,095 |
| Net Assets | | $1,377,589,961 |
| Net Assets consist of: | | |
| Paid in capital | | $1,213,340,483 |
| Total accumulated earnings (loss) | | 164,249,478 |
| Net Assets | | $1,377,589,961 |
| Net Asset Value and Maximum Offering Price | | |
| Class A: | | |
| Net Asset Value and redemption price per share ($361,022,641 ÷ 9,142,073 shares)(a) | | $39.49 |
| Maximum offering price per share (100/94.25 of $39.49) | | $41.90 |
| Class M: | | |
| Net Asset Value and redemption price per share ($114,014,019 ÷ 2,813,262 shares)(a) | | $40.53 |
| Maximum offering price per share (100/96.50 of $40.53) | | $42.00 |
| Class C: | | |
| Net Asset Value and offering price per share ($105,746,699 ÷ 2,930,552 shares)(a) | | $36.08 |
| Class I: | | |
| Net Asset Value, offering price and redemption price per share ($533,004,863 ÷ 12,743,419 shares) | | $41.83 |
| Class Z: | | |
| Net Asset Value, offering price and redemption price per share ($263,801,739 ÷ 6,318,362 shares) | | $41.75 |
(a) Redemption price per share is equal to net asset value less any applicable contingent deferred sales charge.
See accompanying notes which are an integral part of the financial statements.
Statement of Operations
| | | Year ended July 31, 2022 |
| Investment Income | | |
| Dividends | | $33,587,731 |
| Income from Fidelity Central Funds (including $40,517 from security lending) | | 57,270 |
| Total income | | 33,645,001 |
| Expenses | | |
| Management fee | $5,106,689 | |
| Transfer agent fees | 1,599,082 | |
| Distribution and service plan fees | 1,911,637 | |
| Accounting fees | 316,202 | |
| Custodian fees and expenses | 24,302 | |
| Independent trustees' fees and expenses | 2,972 | |
| Registration fees | 156,631 | |
| Audit | 59,213 | |
| Legal | 1,926 | |
| Interest | 11,241 | |
| Miscellaneous | 3,253 | |
| Total expenses before reductions | 9,193,148 | |
| Expense reductions | (30,987) | |
| Total expenses after reductions | | 9,162,161 |
| Net investment income (loss) | | 24,482,840 |
| Realized and Unrealized Gain (Loss) | | |
| Net realized gain (loss) on: | | |
| Investment securities: | | |
| Unaffiliated issuers | 12,420,193 | |
| Foreign currency transactions | (8,861) | |
| Total net realized gain (loss) | | 12,411,332 |
| Change in net unrealized appreciation (depreciation) on: | | |
| Investment securities: | | |
| Unaffiliated issuers | 401,015,057 | |
| Assets and liabilities in foreign currencies | (3,146) | |
| Total change in net unrealized appreciation (depreciation) | | 401,011,911 |
| Net gain (loss) | | 413,423,243 |
| Net increase (decrease) in net assets resulting from operations | | $437,906,083 |
See accompanying notes which are an integral part of the financial statements.
Statement of Changes in Net Assets
| | Year ended July 31, 2022 | Year ended July 31, 2021 |
| Increase (Decrease) in Net Assets | | |
| Operations | | |
| Net investment income (loss) | $24,482,840 | $15,413,377 |
| Net realized gain (loss) | 12,411,332 | (53,594,387) |
| Change in net unrealized appreciation (depreciation) | 401,011,911 | 210,754,325 |
| Net increase (decrease) in net assets resulting from operations | 437,906,083 | 172,573,315 |
| Distributions to shareholders | (14,774,337) | (13,506,451) |
| Share transactions - net increase (decrease) | 401,499,038 | (4,727,059) |
| Total increase (decrease) in net assets | 824,630,784 | 154,339,805 |
| Net Assets | | |
| Beginning of period | 552,959,177 | 398,619,372 |
| End of period | $1,377,589,961 | $552,959,177 |
See accompanying notes which are an integral part of the financial statements.
Financial Highlights
Fidelity Advisor Energy Fund Class A
| Years ended July 31, | 2022 | 2021 | 2020 | 2019 | 2018 |
| Selected Per–Share Data | | | | | |
| Net asset value, beginning of period | $23.59 | $16.59 | $27.88 | $37.52 | $30.70 |
| Income from Investment Operations | | | | | |
| Net investment income (loss)A,B | .80 | .65C | .57 | .35 | .12 |
| Net realized and unrealized gain (loss) | 15.68 | 6.94 | (11.42) | (9.76) | 7.18 |
| Total from investment operations | 16.48 | 7.59 | (10.85) | (9.41) | 7.30 |
| Distributions from net investment income | (.58) | (.59) | (.44) | (.18)D | (.48) |
| Distributions from net realized gain | – | – | – | (.05)D | –E |
| Total distributions | (.58) | (.59) | (.44) | (.23) | (.48) |
| Net asset value, end of period | $39.49 | $23.59 | $16.59 | $27.88 | $37.52 |
| Total ReturnF,G | 71.12% | 46.78% | (39.54)% | (25.07)% | 24.07% |
| Ratios to Average Net AssetsB,H,I | | | | | |
| Expenses before reductions | 1.05% | 1.11% | 1.14% | 1.10% | 1.11% |
| Expenses net of fee waivers, if any | 1.04% | 1.11% | 1.14% | 1.10% | 1.11% |
| Expenses net of all reductions | 1.04% | 1.11% | 1.12% | 1.09% | 1.10% |
| Net investment income (loss) | 2.43% | 3.15%C | 2.62% | 1.14% | .36% |
| Supplemental Data | | | | | |
| Net assets, end of period (000 omitted) | $361,023 | $175,221 | $114,321 | $190,992 | $278,555 |
| Portfolio turnover rateJ | 37% | 45% | 84%K | 47% | 56% |
A Calculated based on average shares outstanding during the period.
B Net investment income (loss) is affected by the timing of the declaration of dividends by any underlying mutual funds or exchange-traded funds (ETFs). Net investment income (loss) of any such underlying funds is not included in the Fund's net investment income (loss) ratio.
C Net investment income per share reflects one or more large, non-recurring dividend(s) which amounted to $.11 per share. Excluding such non-recurring dividend(s), the ratio of net investment income (loss) to average net assets would have been 2.60%.
D The amount shown reflects reclassifications related to book to tax differences that were made in the year shown.
E Amount represents less than $.005 per share.
F Total returns would have been lower if certain expenses had not been reduced during the applicable periods shown.
G Total returns do not include the effect of the sales charges.
H Fees and expenses of any underlying mutual funds or exchange-traded funds (ETFs) are not included in the Fund's expense ratio. The Fund indirectly bears its proportionate share of these expenses. For additional expense information related to investments in Fidelity Central Funds, please refer to the "Investments in Fidelity Central Funds" note found in the Notes to Financial Statements section of the most recent Annual or Semi-Annual report.
I Expense ratios reflect operating expenses of the class. Expenses before reductions do not reflect amounts reimbursed, waived, or reduced through arrangements with the investment adviser, brokerage services, or other offset arrangements, if applicable, and do not represent the amount paid by the class during periods when reimbursements, waivers or reductions occur.
J Amount does not include the portfolio activity of any underlying mutual funds or exchange-traded funds (ETFs).
K Portfolio turnover rate excludes securities received or delivered in-kind.
See accompanying notes which are an integral part of the financial statements.
Fidelity Advisor Energy Fund Class M
| Years ended July 31, | 2022 | 2021 | 2020 | 2019 | 2018 |
| Selected Per–Share Data | | | | | |
| Net asset value, beginning of period | $24.20 | $17.00 | $28.53 | $38.36 | $31.37 |
| Income from Investment Operations | | | | | |
| Net investment income (loss)A,B | .73 | .60C | .53 | .27 | .03 |
| Net realized and unrealized gain (loss) | 16.11 | 7.13 | (11.71) | (9.97) | 7.35 |
| Total from investment operations | 16.84 | 7.73 | (11.18) | (9.70) | 7.38 |
| Distributions from net investment income | (.51) | (.53) | (.35) | (.08)D | (.39) |
| Distributions from net realized gain | – | – | – | (.05)D | –E |
| Total distributions | (.51) | (.53) | (.35) | (.13) | (.39) |
| Net asset value, end of period | $40.53 | $24.20 | $17.00 | $28.53 | $38.36 |
| Total ReturnF,G | 70.66% | 46.37% | (39.66)% | (25.28)% | 23.75% |
| Ratios to Average Net AssetsB,H,I | | | | | |
| Expenses before reductions | 1.31% | 1.38% | 1.40% | 1.37% | 1.38% |
| Expenses net of fee waivers, if any | 1.31% | 1.38% | 1.40% | 1.36% | 1.38% |
| Expenses net of all reductions | 1.31% | 1.38% | 1.38% | 1.36% | 1.37% |
| Net investment income (loss) | 2.16% | 2.88%C | 2.36% | .88% | .09% |
| Supplemental Data | | | | | |
| Net assets, end of period (000 omitted) | $114,014 | $62,519 | $43,768 | $87,147 | $136,828 |
| Portfolio turnover rateJ | 37% | 45% | 84%K | 47% | 56% |
A Calculated based on average shares outstanding during the period.
B Net investment income (loss) is affected by the timing of the declaration of dividends by any underlying mutual funds or exchange-traded funds (ETFs). Net investment income (loss) of any such underlying funds is not included in the Fund's net investment income (loss) ratio.
C Net investment income per share reflects one or more large, non-recurring dividend(s) which amounted to $.11 per share. Excluding such non-recurring dividend(s), the ratio of net investment income (loss) to average net assets would have been 2.34%.
D The amount shown reflects reclassifications related to book to tax differences that were made in the year shown.
E Amount represents less than $.005 per share.
F Total returns would have been lower if certain expenses had not been reduced during the applicable periods shown.
G Total returns do not include the effect of the sales charges.
H Fees and expenses of any underlying mutual funds or exchange-traded funds (ETFs) are not included in the Fund's expense ratio. The Fund indirectly bears its proportionate share of these expenses. For additional expense information related to investments in Fidelity Central Funds, please refer to the "Investments in Fidelity Central Funds" note found in the Notes to Financial Statements section of the most recent Annual or Semi-Annual report.
I Expense ratios reflect operating expenses of the class. Expenses before reductions do not reflect amounts reimbursed, waived, or reduced through arrangements with the investment adviser, brokerage services, or other offset arrangements, if applicable, and do not represent the amount paid by the class during periods when reimbursements, waivers or reductions occur.
J Amount does not include the portfolio activity of any underlying mutual funds or exchange-traded funds (ETFs).
K Portfolio turnover rate excludes securities received or delivered in-kind.
See accompanying notes which are an integral part of the financial statements.
Fidelity Advisor Energy Fund Class C
| Years ended July 31, | 2022 | 2021 | 2020 | 2019 | 2018 |
| Selected Per–Share Data | | | | | |
| Net asset value, beginning of period | $21.60 | $15.23 | $25.58 | $34.39 | $28.16 |
| Income from Investment Operations | | | | | |
| Net investment income (loss)A,B | .51 | .45C | .39 | .12 | (.11) |
| Net realized and unrealized gain (loss) | 14.38 | 6.38 | (10.52) | (8.93) | 6.59 |
| Total from investment operations | 14.89 | 6.83 | (10.13) | (8.81) | 6.48 |
| Distributions from net investment income | (.41) | (.46) | (.22) | – | (.24) |
| Distributions from net realized gain | – | – | – | – | –D |
| Total distributions | (.41) | (.46) | (.22) | – | (.25)E |
| Net asset value, end of period | $36.08 | $21.60 | $15.23 | $25.58 | $34.39 |
| Total ReturnF,G | 69.86% | 45.68% | (39.95)% | (25.62)% | 23.16% |
| Ratios to Average Net AssetsB,H,I | | | | | |
| Expenses before reductions | 1.79% | 1.84% | 1.86% | 1.82% | 1.84% |
| Expenses net of fee waivers, if any | 1.78% | 1.84% | 1.86% | 1.82% | 1.83% |
| Expenses net of all reductions | 1.78% | 1.84% | 1.84% | 1.81% | 1.83% |
| Net investment income (loss) | 1.69% | 2.42%C | 1.90% | .42% | (.37)% |
| Supplemental Data | | | | | |
| Net assets, end of period (000 omitted) | $105,747 | $56,068 | $45,212 | $90,437 | $179,521 |
| Portfolio turnover rateJ | 37% | 45% | 84%K | 47% | 56% |
A Calculated based on average shares outstanding during the period.
B Net investment income (loss) is affected by the timing of the declaration of dividends by any underlying mutual funds or exchange-traded funds (ETFs). Net investment income (loss) of any such underlying funds is not included in the Fund's net investment income (loss) ratio.
C Net investment income per share reflects one or more large, non-recurring dividend(s) which amounted to $.10 per share. Excluding such non-recurring dividend(s), the ratio of net investment income (loss) to average net assets would have been 1.88%.
D Amount represents less than $.005 per share.
E Total distributions per share do not sum due to rounding.
F Total returns would have been lower if certain expenses had not been reduced during the applicable periods shown.
G Total returns do not include the effect of the contingent deferred sales charge.
H Fees and expenses of any underlying mutual funds or exchange-traded funds (ETFs) are not included in the Fund's expense ratio. The Fund indirectly bears its proportionate share of these expenses. For additional expense information related to investments in Fidelity Central Funds, please refer to the "Investments in Fidelity Central Funds" note found in the Notes to Financial Statements section of the most recent Annual or Semi-Annual report.
I Expense ratios reflect operating expenses of the class. Expenses before reductions do not reflect amounts reimbursed, waived, or reduced through arrangements with the investment adviser, brokerage services, or other offset arrangements, if applicable, and do not represent the amount paid by the class during periods when reimbursements, waivers or reductions occur.
J Amount does not include the portfolio activity of any underlying mutual funds or exchange-traded funds (ETFs).
K Portfolio turnover rate excludes securities received or delivered in-kind.
See accompanying notes which are an integral part of the financial statements.
Fidelity Advisor Energy Fund Class I
| Years ended July 31, | 2022 | 2021 | 2020 | 2019 | 2018 |
| Selected Per–Share Data | | | | | |
| Net asset value, beginning of period | $24.95 | $17.51 | $29.39 | $39.57 | $32.36 |
| Income from Investment Operations | | | | | |
| Net investment income (loss)A,B | .97 | .74C | .67 | .47 | .23 |
| Net realized and unrealized gain (loss) | 16.57 | 7.35 | (12.02) | (10.31) | 7.57 |
| Total from investment operations | 17.54 | 8.09 | (11.35) | (9.84) | 7.80 |
| Distributions from net investment income | (.66) | (.65) | (.53) | (.30)D | (.58) |
| Distributions from net realized gain | – | – | – | (.05)D | –E |
| Total distributions | (.66) | (.65) | (.53) | (.34)F | (.59)F |
| Net asset value, end of period | $41.83 | $24.95 | $17.51 | $29.39 | $39.57 |
| Total ReturnG | 71.63% | 47.26% | (39.33)% | (24.85)% | 24.43% |
| Ratios to Average Net AssetsB,H,I | | | | | |
| Expenses before reductions | .76% | .79% | .82% | .80% | .83% |
| Expenses net of fee waivers, if any | .76% | .79% | .82% | .80% | .83% |
| Expenses net of all reductions | .76% | .79% | .80% | .79% | .82% |
| Net investment income (loss) | 2.71% | 3.47%C | 2.95% | 1.44% | .64% |
| Supplemental Data | | | | | |
| Net assets, end of period (000 omitted) | $533,005 | $177,248 | $154,575 | $224,599 | $373,714 |
| Portfolio turnover rateJ | 37% | 45% | 84%K | 47% | 56% |
A Calculated based on average shares outstanding during the period.
B Net investment income (loss) is affected by the timing of the declaration of dividends by any underlying mutual funds or exchange-traded funds (ETFs). Net investment income (loss) of any such underlying funds is not included in the Fund's net investment income (loss) ratio.
C Net investment income per share reflects one or more large, non-recurring dividend(s) which amounted to $.12 per share. Excluding such non-recurring dividend(s), the ratio of net investment income (loss) to average net assets would have been 2.93%.
D The amount shown reflects reclassifications related to book to tax differences that were made in the year shown.
E Amount represents less than $.005 per share.
F Total distributions per share do not sum due to rounding.
G Total returns would have been lower if certain expenses had not been reduced during the applicable periods shown.
H Fees and expenses of any underlying mutual funds or exchange-traded funds (ETFs) are not included in the Fund's expense ratio. The Fund indirectly bears its proportionate share of these expenses. For additional expense information related to investments in Fidelity Central Funds, please refer to the "Investments in Fidelity Central Funds" note found in the Notes to Financial Statements section of the most recent Annual or Semi-Annual report.
I Expense ratios reflect operating expenses of the class. Expenses before reductions do not reflect amounts reimbursed, waived, or reduced through arrangements with the investment adviser, brokerage services, or other offset arrangements, if applicable, and do not represent the amount paid by the class during periods when reimbursements, waivers or reductions occur.
J Amount does not include the portfolio activity of any underlying mutual funds or exchange-traded funds (ETFs).
K Portfolio turnover rate excludes securities received or delivered in-kind.
See accompanying notes which are an integral part of the financial statements.
Fidelity Advisor Energy Fund Class Z
| Years ended July 31, | 2022 | 2021 | 2020 | 2019 A |
| Selected Per–Share Data | | | | |
| Net asset value, beginning of period | $24.91 | $17.48 | $29.35 | $39.35 |
| Income from Investment Operations | | | | |
| Net investment income (loss)B,C | 1.02 | .80D | .69 | .45 |
| Net realized and unrealized gain (loss) | 16.52 | 7.30 | (11.97) | (10.03) |
| Total from investment operations | 17.54 | 8.10 | (11.28) | (9.58) |
| Distributions from net investment income | (.70) | (.67) | (.59) | (.37)E |
| Distributions from net realized gain | – | – | – | (.05)E |
| Total distributions | (.70) | (.67) | (.59) | (.42) |
| Net asset value, end of period | $41.75 | $24.91 | $17.48 | $29.35 |
| Total ReturnF,G | 71.83% | 47.47% | (39.22)% | (24.34)% |
| Ratios to Average Net AssetsC,H,I | | | | |
| Expenses before reductions | .63% | .65% | .66% | .65%J |
| Expenses net of fee waivers, if any | .62% | .64% | .66% | .64%J |
| Expenses net of all reductions | .62% | .64% | .64% | .64%J |
| Net investment income (loss) | 2.85% | 3.62%D | 3.10% | 1.82%J |
| Supplemental Data | | | | |
| Net assets, end of period (000 omitted) | $263,802 | $81,903 | $40,742 | $9,255 |
| Portfolio turnover rateK | 37% | 45% | 84%L | 47% |
A For the period October 2, 2018 (commencement of sale of shares) through July 31, 2019.
B Calculated based on average shares outstanding during the period.
C Net investment income (loss) is affected by the timing of the declaration of dividends by any underlying mutual funds or exchange-traded funds (ETFs). Net investment income (loss) of any such underlying funds is not included in the Fund's net investment income (loss) ratio.
D Net investment income per share reflects one or more large, non-recurring dividend(s) which amounted to $.12 per share. Excluding such non-recurring dividend(s), the ratio of net investment income (loss) to average net assets would have been 3.07%.
E The amount shown reflects reclassifications related to book to tax differences that were made in the year shown.
F Total returns for periods of less than one year are not annualized.
G Total returns would have been lower if certain expenses had not been reduced during the applicable periods shown.
H Fees and expenses of any underlying mutual funds or exchange-traded funds (ETFs) are not included in the Fund's expense ratio. The Fund indirectly bears its proportionate share of these expenses. For additional expense information related to investments in Fidelity Central Funds, please refer to the "Investments in Fidelity Central Funds" note found in the Notes to Financial Statements section of the most recent Annual or Semi-Annual report.
I Expense ratios reflect operating expenses of the class. Expenses before reductions do not reflect amounts reimbursed, waived, or reduced through arrangements with the investment adviser, brokerage services, or other offset arrangements, if applicable, and do not represent the amount paid by the class during periods when reimbursements, waivers or reductions occur.
J Annualized
K Amount does not include the portfolio activity of any underlying mutual funds or exchange-traded funds (ETFs).
L Portfolio turnover rate excludes securities received or delivered in-kind.
See accompanying notes which are an integral part of the financial statements.
Fidelity Advisor® Financial Services Fund
Performance: The Bottom Line
Average annual total return reflects the change in the value of an investment, assuming reinvestment of distributions from dividend income and capital gains (the profits earned upon the sale of securities that have grown in value, if any) and assuming a constant rate of performance each year. The hypothetical investment and the average annual total returns do not reflect the deduction of taxes that a shareholder would pay on fund distributions or the redemption of fund shares. During periods of reimbursement by Fidelity, a fund’s total return will be greater than it would be had the reimbursement not occurred. How a fund did yesterday is no guarantee of how it will do tomorrow.
Average Annual Total Returns
| For the periods ended July 31, 2022 | Past 1 year | Past 5 years | Past 10 years |
| Class A (incl. 5.75% sales charge) | (8.95)% | 7.42% | 10.98% |
| Class M (incl. 3.50% sales charge) | (7.01)% | 7.66% | 10.96% |
| Class C (incl. contingent deferred sales charge) | (5.05)% | 7.89% | 10.98% |
| Class I | (3.13)% | 9.02% | 11.99% |
| Class Z | (3.03)% | 9.13% | 12.04% |
Class C shares' contingent deferred sales charges included in the past one year, past five years and past ten years total return figures are 1%, 0% and 0%, respectively.
The initial offering of Class Z shares took place on October 2, 2018. Returns prior to October 2, 2018, are those of Class I.
$10,000 Over 10 Years
Let's say hypothetically that $10,000 was invested in Fidelity Advisor® Financial Services Fund - Class A on July 31, 2012, and the current 5.75% sales charge was paid.
The chart shows how the value of your investment would have changed, and also shows how the S&P 500® Index performed over the same period.
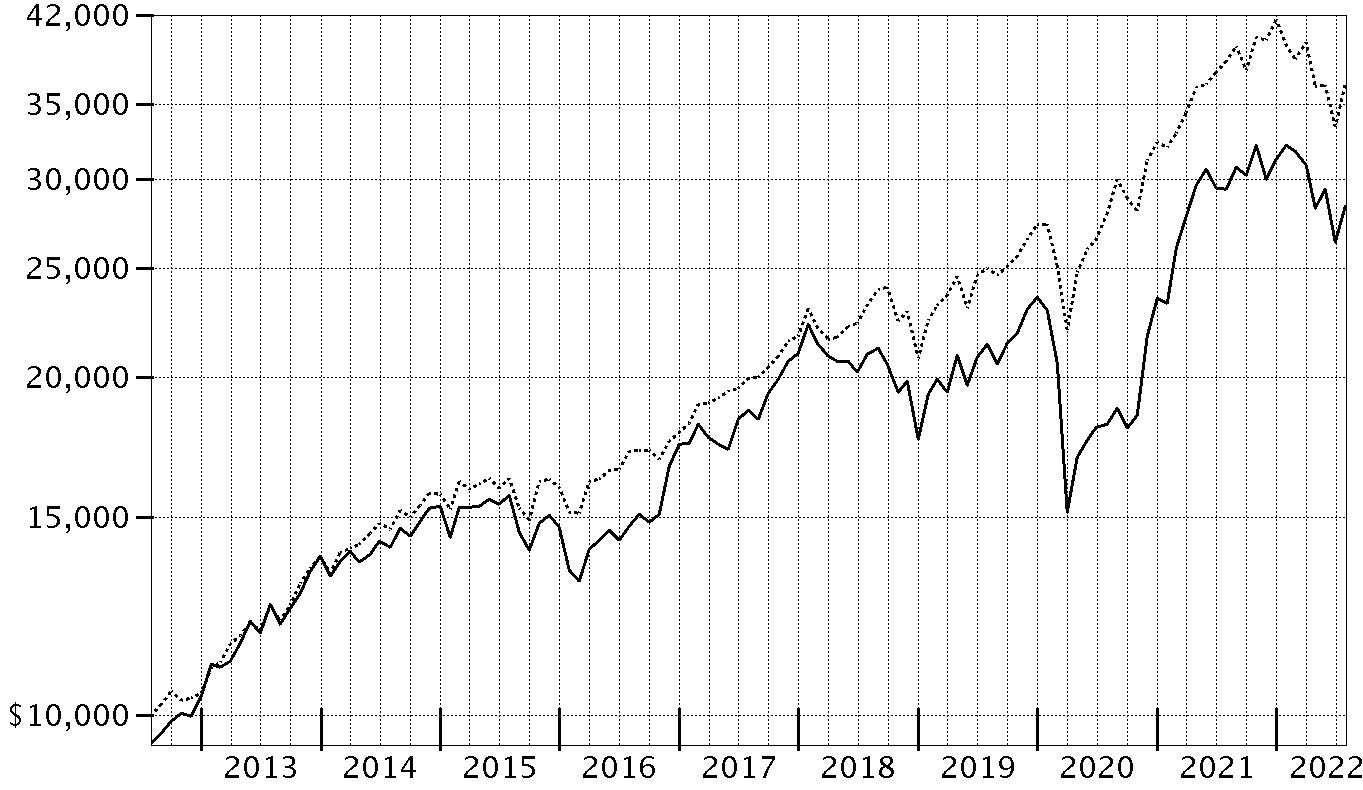
| Period Ending Values |
| $28,355 | Fidelity Advisor® Financial Services Fund - Class A |
| $36,428 | S&P 500® Index |
Fidelity Advisor® Financial Services Fund
Management's Discussion of Fund Performance
Market Recap: The S&P 500
® index returned -4.64% for the 12 months ending July 31, 2022, as a multitude of crosscurrents challenged the global economy and financial markets. Persistently high inflation, exacerbated by energy price shocks from the Russia–Ukraine conflict, spurred the U.S. Federal Reserve to hike interest rates more aggressively than anticipated, and concerns about the outlook for economic growth sent stocks into bear market territory. In early May, the Fed approved a rare half-percentage-point interest rate increase and announced plans to shrink its $9 trillion asset portfolio. June began with the Fed allowing up to billions in Treasuries and mortgage bonds to mature every month without investing the proceeds. Two weeks later, the central bank raised rates by 0.75 percentage points, its largest increase since 1994, and said it was becoming more difficult to achieve a soft landing, in which the economy slows enough to bring down inflation while avoiding a recession. Against this volatile backdrop, the S&P 500
® posted its worst first-half result (-19.96%) to begin a year since 1970. Stocks sharply reversed course in July (+9.22%), as the Fed again raised its benchmark interest rate by 0.75% but signaled that, at some point, it will likely slow the pace of tightening to assess the impact on the economy. For the full 12 months, growth-oriented communication services (-29%) and consumer discretionary (-10%) stocks lagged most. In contrast, energy (+67%) rode a surge in commodity prices and led by a wide margin, followed by the defensive utilities (+16%) and consumer staples (+7%) sectors.
Comments from Portfolio Manager Matthew Reed: For the fiscal year ending July 31, 2022, the fund's share classes (excluding sales charges, if applicable) returned about -4% to -3%, outperforming the -4.69% result of the MSCI U.S. IMI Financials 5% Capped Linked Index, as well as the broad-based S&P 500
® index. The top contributor to performance versus the sector index, by far, was stock selection in regional banks. An underweighting and picks within the financial exchanges & data group further lifted the fund's relative result, as did choices in insurance brokers. The portfolio's top individual relative contributor was an overweighting in M&T Bank, which gained roughly 36% the past year and was among our biggest holdings. The second-largest relative contributor this period was avoiding JPMorgan Chase, an index component that returned -22%. Another notable relative contributor was an outsized stake in Arthur J. Gallaghar & Co. (+30%), also one of our largest holdings at period end. In contrast, the primary detractors from performance versus the sector index were security selection and an underweighting in multi-sector holdings. Weak picks among thrifts & mortgage finance stocks, along with out-of-index exposure to the research & consulting services group, also hampered relative performance. Not owning Berkshire Hathaway, an index component that gained 8%, was the biggest individual relative detractor. Also hampering performance was our overweighting in Capital One Financial, which returned -31% and was one of the fund's largest positions. Further holding back performance was our outsized stake in Cannae Holdings (-37%). Notable changes in positioning include increased exposure to the insurance brokers segment and a lower allocation to consumer finance stocks.
The views expressed above reflect those of the portfolio manager(s) only through the end of the period as stated on the cover of this report and do not necessarily represent the views of Fidelity or any other person in the Fidelity organization. Any such views are subject to change at any time based upon market or other conditions and Fidelity disclaims any responsibility to update such views. These views may not be relied on as investment advice and, because investment decisions for a Fidelity fund are based on numerous factors, may not be relied on as an indication of trading intent on behalf of any Fidelity fund.
Fidelity Advisor® Financial Services Fund
Investment Summary (Unaudited)
Top Ten Stocks as of July 31, 2022
| | % of fund's net assets |
| Wells Fargo & Co. | 5.4 |
| Bank of America Corp. | 5.1 |
| M&T Bank Corp. | 4.1 |
| Morgan Stanley | 3.8 |
| Citigroup, Inc. | 3.6 |
| State Street Corp. | 3.1 |
| Arthur J. Gallagher & Co. | 3.0 |
| Marsh & McLennan Companies, Inc. | 3.0 |
| U.S. Bancorp | 2.9 |
| Capital One Financial Corp. | 2.7 |
| | 36.7 |
Industries (% of fund's net assets)
| As of July 31, 2022 |
| | Banks | 36.9% |
| | Insurance | 25.2% |
| | Capital Markets | 18.7% |
| | Consumer Finance | 5.0% |
| | Thrifts & Mortgage Finance | 5.0% |
| | IT Services | 3.7% |
| | Diversified Financial Services | 2.2% |
| | Professional Services | 1.9% |
| | Software | 1.1% |
| | All Other* | 0.3% |
* Includes Short-Term investments and Net Other Assets (Liabilities).
Fidelity Advisor® Financial Services Fund
Schedule of Investments July 31, 2022
Showing Percentage of Net Assets
| Common Stocks - 99.2% | | | |
| | | Shares | Value |
| Banks - 36.9% | | | |
| Diversified Banks - 17.1% | | | |
| Bank of America Corp. | | 771,556 | $26,086,308 |
| Citigroup, Inc. | | 354,105 | 18,378,050 |
| Piraeus Financial Holdings SA (a) | | 315,000 | 285,180 |
| U.S. Bancorp | | 318,200 | 15,019,040 |
| Wells Fargo & Co. | | 629,728 | 27,626,166 |
| | | | 87,394,744 |
| Regional Banks - 19.8% | | | |
| Associated Banc-Corp. | | 196,800 | 3,955,680 |
| Bank OZK | | 88,900 | 3,564,890 |
| BankUnited, Inc. | | 72,500 | 2,816,625 |
| BOK Financial Corp. | | 35,516 | 3,126,473 |
| Cadence Bank (b) | | 150,224 | 3,920,846 |
| Comerica, Inc. | | 50,800 | 3,950,716 |
| East West Bancorp, Inc. | | 83,000 | 5,957,740 |
| First Citizens Bancshares, Inc. | | 9,000 | 6,810,120 |
| First Interstate Bancsystem, Inc. | | 125,652 | 5,124,089 |
| Heartland Financial U.S.A., Inc. | | 77,300 | 3,470,770 |
| Huntington Bancshares, Inc. | | 770,120 | 10,234,895 |
| M&T Bank Corp. | | 118,966 | 21,110,517 |
| PacWest Bancorp | | 117,900 | 3,304,737 |
| Popular, Inc. | | 60,000 | 4,660,200 |
| Signature Bank (b) | | 22,800 | 4,230,996 |
| Truist Financial Corp. | | 217,600 | 10,982,272 |
| Wintrust Financial Corp. | | 46,400 | 3,992,256 |
| | | | 101,213,822 |
|
| TOTAL BANKS | | | 188,608,566 |
|
| Capital Markets - 18.7% | | | |
| Asset Management & Custody Banks - 9.2% | | | |
| Affiliated Managers Group, Inc. | | 24,500 | 3,096,310 |
| AllianceBernstein Holding LP | | 5 | 220 |
| Bank of New York Mellon Corp. | | 228,000 | 9,908,880 |
| Brookfield Asset Management, Inc. Class A | | 96,000 | 4,766,400 |
| Carlyle Group LP | | 150,700 | 5,863,737 |
| Northern Trust Corp. | | 37,500 | 3,741,750 |
| Patria Investments Ltd. | | 281,300 | 4,053,533 |
| Phoenix Vega Mezz PLC (a) | | 192,600 | 11,516 |
| State Street Corp. | | 219,500 | 15,593,280 |
| | | | 47,035,626 |
| Financial Exchanges & Data - 1.8% | | | |
| Bolsa Mexicana de Valores S.A.B. de CV | | 1,631,200 | 3,035,870 |
| Cboe Global Markets, Inc. | | 49,173 | 6,066,965 |
| | | | 9,102,835 |
| Investment Banking & Brokerage - 7.7% | | | |
| Lazard Ltd. Class A | | 191,452 | 7,211,997 |
| Morgan Stanley | | 233,200 | 19,658,760 |
| Raymond James Financial, Inc. | | 87,550 | 8,621,049 |
| Virtu Financial, Inc. Class A | | 169,000 | 3,942,770 |
| | | | 39,434,576 |
|
| TOTAL CAPITAL MARKETS | | | 95,573,037 |
|
| Consumer Finance - 5.0% | | | |
| Consumer Finance - 5.0% | | | |
| American Express Co. | | 14,100 | 2,171,682 |
| Capital One Financial Corp. | | 124,338 | 13,656,043 |
| FirstCash Holdings, Inc. | | 74,851 | 5,483,584 |
| OneMain Holdings, Inc. | | 117,600 | 4,374,720 |
| | | | 25,686,029 |
| Diversified Financial Services - 2.2% | | | |
| Multi-Sector Holdings - 0.8% | | | |
| Cannae Holdings, Inc. (a) | | 191,540 | 4,043,409 |
| Other Diversified Financial Services - 1.4% | | | |
| Apollo Global Management, Inc. | | 124,900 | 7,131,790 |
|
| TOTAL DIVERSIFIED FINANCIAL SERVICES | | | 11,175,199 |
|
| Insurance - 25.2% | | | |
| Insurance Brokers - 6.0% | | | |
| Arthur J. Gallagher & Co. | | 86,900 | 15,554,231 |
| Marsh & McLennan Companies, Inc. | | 92,900 | 15,231,884 |
| | | | 30,786,115 |
| Life & Health Insurance - 2.8% | | | |
| Globe Life, Inc. | | 90,300 | 9,095,919 |
| Primerica, Inc. | | 39,500 | 5,083,255 |
| | | | 14,179,174 |
| Multi-Line Insurance - 2.9% | | | |
| Assurant, Inc. | | 39,600 | 6,960,888 |
| Hartford Financial Services Group, Inc. | | 119,900 | 7,729,953 |
| | | | 14,690,841 |
| Property & Casualty Insurance - 11.7% | | | |
| American Financial Group, Inc. | | 36,000 | 4,812,480 |
| Beazley PLC | | 622,600 | 4,109,456 |
| Chubb Ltd. | | 66,300 | 12,506,832 |
| Fidelity National Financial, Inc. | | 170,900 | 6,829,164 |
| First American Financial Corp. | | 150,700 | 8,740,600 |
| Hiscox Ltd. | | 466,600 | 5,071,981 |
| Old Republic International Corp. | | 152,700 | 3,553,329 |
| Selective Insurance Group, Inc. | | 39,000 | 3,036,540 |
| The Travelers Companies, Inc. | | 70,700 | 11,220,090 |
| | | | 59,880,472 |
| Reinsurance - 1.8% | | | |
| Reinsurance Group of America, Inc. | | 79,900 | 9,250,822 |
|
| TOTAL INSURANCE | | | 128,787,424 |
|
| IT Services - 3.2% | | | |
| Data Processing & Outsourced Services - 3.2% | | | |
| Global Payments, Inc. | | 61,400 | 7,510,448 |
| MasterCard, Inc. Class A | | 25,200 | 8,915,508 |
| | | | 16,425,956 |
| Professional Services - 1.9% | | | |
| Research & Consulting Services - 1.9% | | | |
| Dun & Bradstreet Holdings, Inc. | | 265,100 | 4,177,976 |
| Equifax, Inc. | | 25,200 | 5,264,532 |
| | | | 9,442,508 |
| Software - 1.1% | | | |
| Application Software - 1.1% | | | |
| Black Knight, Inc. (a) | | 82,200 | 5,398,896 |
| Thrifts & Mortgage Finance - 5.0% | | | |
| Thrifts & Mortgage Finance - 5.0% | | | |
| Essent Group Ltd. | | 176,000 | 7,349,760 |
| MGIC Investment Corp. | | 441,500 | 6,242,810 |
| NMI Holdings, Inc. (a) | | 426,410 | 8,076,205 |
| Radian Group, Inc. | | 42,500 | 950,725 |
| Walker & Dunlop, Inc. | | 27,200 | 3,063,808 |
| | | | 25,683,308 |
| TOTAL COMMON STOCKS | | | |
| (Cost $455,022,533) | | | 506,780,923 |
| | | Principal Amount | Value |
|
| Convertible Bonds - 0.5% | | | |
| IT Services - 0.5% | | | |
| Data Processing & Outsourced Services - 0.5% | | | |
Affirm Holdings, Inc. 0% 11/15/26
(Cost $2,673,297)(c) | | 4,479,000 | 2,734,646 |
| | | Shares | Value |
|
| Money Market Funds - 1.2% | | | |
| Fidelity Cash Central Fund 2.01% (d) | | 1,162,336 | 1,162,568 |
| Fidelity Securities Lending Cash Central Fund 2.01% (d)(e) | | 4,927,556 | 4,928,049 |
| TOTAL MONEY MARKET FUNDS | | | |
| (Cost $6,090,617) | | | 6,090,617 |
| TOTAL INVESTMENT IN SECURITIES - 100.9% | | | |
| (Cost $463,786,447) | | | 515,606,186 |
| NET OTHER ASSETS (LIABILITIES) - (0.9)% | | | (4,713,195) |
| NET ASSETS - 100% | | | $510,892,991 |
Legend
(a) Non-income producing
(b) Security or a portion of the security is on loan at period end.
(c) Security exempt from registration under Rule 144A of the Securities Act of 1933. These securities may be resold in transactions exempt from registration, normally to qualified institutional buyers. At the end of the period, the value of these securities amounted to $2,734,646 or 0.5% of net assets.
(d) Affiliated fund that is generally available only to investment companies and other accounts managed by Fidelity Investments. The rate quoted is the annualized seven-day yield of the fund at period end. A complete unaudited listing of the fund's holdings as of its most recent quarter end is available upon request. In addition, each Fidelity Central Fund's financial statements, which are not covered by the Fund's Report of Independent Registered Public Accounting Firm, are available on the SEC's website or upon request.
(e) Investment made with cash collateral received from securities on loan.
Affiliated Central Funds
Fiscal year to date information regarding the Fund's investments in Fidelity Central Funds, including the ownership percentage, is presented below.
| Fund | Value, beginning of period | Purchases | Sales Proceeds | Dividend Income | Realized Gain/Loss | Change in Unrealized appreciation (depreciation) | Value, end of period | % ownership, end of period |
| Fidelity Cash Central Fund 2.01% | $2,916,314 | $148,930,537 | $150,684,283 | $7,479 | $-- | $-- | $1,162,568 | 0.0% |
| Fidelity Securities Lending Cash Central Fund 2.01% | 11,250 | 77,556,626 | 72,639,827 | 2,103 | -- | -- | 4,928,049 | 0.0% |
| Total | $2,927,564 | $226,487,163 | $223,324,110 | $9,582 | $-- | $-- | $6,090,617 | |
Amounts in the income column in the above table include any capital gain distributions from underlying funds, which are presented in the corresponding line-item in the Statement of Operations, if applicable. Amount for Fidelity Securities Lending Cash Central Fund represents the income earned on investing cash collateral, less rebates paid to borrowers and any lending agent fees associated with the loan, plus any premium payments received for lending certain types of securities.
Investment Valuation
The following is a summary of the inputs used, as of July 31, 2022, involving the Fund's assets and liabilities carried at fair value. The inputs or methodology used for valuing securities may not be an indication of the risk associated with investing in those securities. For more information on valuation inputs, and their aggregation into the levels used below, please refer to the Investment Valuation section in the accompanying Notes to Financial Statements.
| | Valuation Inputs at Reporting Date: |
| Description | Total | Level 1 | Level 2 | Level 3 |
| Investments in Securities: | | | | |
| Common Stocks | $506,780,923 | $506,780,923 | $-- | $-- |
| Convertible Bonds | 2,734,646 | -- | 2,734,646 | -- |
| Money Market Funds | 6,090,617 | 6,090,617 | -- | -- |
| Total Investments in Securities: | $515,606,186 | $512,871,540 | $2,734,646 | $-- |
See accompanying notes which are an integral part of the financial statements.
Fidelity Advisor® Financial Services Fund
Financial Statements
Statement of Assets and Liabilities
| | | July 31, 2022 |
| Assets | | |
Investment in securities, at value (including securities loaned of $4,840,901) — See accompanying schedule:
Unaffiliated issuers (cost $457,695,830) | $509,515,569 | |
| Fidelity Central Funds (cost $6,090,617) | 6,090,617 | |
| Total Investment in Securities (cost $463,786,447) | | $515,606,186 |
| Receivable for fund shares sold | | 508,631 |
| Dividends receivable | | 585,533 |
| Distributions receivable from Fidelity Central Funds | | 1,688 |
| Prepaid expenses | | 1,596 |
| Other receivables | | 8,399 |
| Total assets | | 516,712,033 |
| Liabilities | | |
| Payable for fund shares redeemed | $435,815 | |
| Accrued management fee | 214,954 | |
| Distribution and service plan fees payable | 111,570 | |
| Other affiliated payables | 84,812 | |
| Other payables and accrued expenses | 43,842 | |
| Collateral on securities loaned | 4,928,049 | |
| Total liabilities | | 5,819,042 |
| Net Assets | | $510,892,991 |
| Net Assets consist of: | | |
| Paid in capital | | $440,662,941 |
| Total accumulated earnings (loss) | | 70,230,050 |
| Net Assets | | $510,892,991 |
| Net Asset Value and Maximum Offering Price | | |
| Class A: | | |
| Net Asset Value and redemption price per share ($189,413,013 ÷ 7,198,088 shares)(a) | | $26.31 |
| Maximum offering price per share (100/94.25 of $26.31) | | $27.92 |
| Class M: | | |
| Net Asset Value and redemption price per share ($69,176,385 ÷ 2,662,965 shares)(a) | | $25.98 |
| Maximum offering price per share (100/96.50 of $25.98) | | $26.92 |
| Class C: | | |
| Net Asset Value and offering price per share ($58,176,670 ÷ 2,380,036 shares)(a) | | $24.44 |
| Class I: | | |
| Net Asset Value, offering price and redemption price per share ($131,118,415 ÷ 4,819,774 shares) | | $27.20 |
| Class Z: | | |
| Net Asset Value, offering price and redemption price per share ($63,008,508 ÷ 2,319,792 shares) | | $27.16 |
(a) Redemption price per share is equal to net asset value less any applicable contingent deferred sales charge.
See accompanying notes which are an integral part of the financial statements.
Statement of Operations
| | | Year ended July 31, 2022 |
| Investment Income | | |
| Dividends | | $13,693,502 |
| Interest | | 38,830 |
| Income from Fidelity Central Funds (including $2,103 from security lending) | | 9,582 |
| Total income | | 13,741,914 |
| Expenses | | |
| Management fee | $2,798,900 | |
| Transfer agent fees | 876,602 | |
| Distribution and service plan fees | 1,475,806 | |
| Accounting fees | 200,292 | |
| Custodian fees and expenses | 18,104 | |
| Independent trustees' fees and expenses | 1,734 | |
| Registration fees | 99,768 | |
| Audit | 51,054 | |
| Legal | 1,289 | |
| Interest | 240 | |
| Miscellaneous | 2,397 | |
| Total expenses before reductions | 5,526,186 | |
| Expense reductions | (16,316) | |
| Total expenses after reductions | | 5,509,870 |
| Net investment income (loss) | | 8,232,044 |
| Realized and Unrealized Gain (Loss) | | |
| Net realized gain (loss) on: | | |
| Investment securities: | | |
| Unaffiliated issuers | 30,551,177 | |
| Foreign currency transactions | (243) | |
| Total net realized gain (loss) | | 30,550,934 |
| Change in net unrealized appreciation (depreciation) on investment securities | | (69,481,639) |
| Net gain (loss) | | (38,930,705) |
| Net increase (decrease) in net assets resulting from operations | | $(30,698,661) |
See accompanying notes which are an integral part of the financial statements.
Statement of Changes in Net Assets
| | Year ended July 31, 2022 | Year ended July 31, 2021 |
| Increase (Decrease) in Net Assets | | |
| Operations | | |
| Net investment income (loss) | $8,232,044 | $6,261,269 |
| Net realized gain (loss) | 30,550,934 | 6,257,144 |
| Change in net unrealized appreciation (depreciation) | (69,481,639) | 138,800,055 |
| Net increase (decrease) in net assets resulting from operations | (30,698,661) | 151,318,468 |
| Distributions to shareholders | (21,010,596) | (7,232,777) |
| Share transactions - net increase (decrease) | 95,349,433 | 25,541,998 |
| Total increase (decrease) in net assets | 43,640,176 | 169,627,689 |
| Net Assets | | |
| Beginning of period | 467,252,815 | 297,625,126 |
| End of period | $510,892,991 | $467,252,815 |
See accompanying notes which are an integral part of the financial statements.
Financial Highlights
Fidelity Advisor Financial Services Fund Class A
| Years ended July 31, | 2022 | 2021 | 2020 | 2019 | 2018 |
| Selected Per–Share Data | | | | | |
| Net asset value, beginning of period | $28.41 | $18.00 | $21.47 | $21.84 | $19.55 |
| Income from Investment Operations | | | | | |
| Net investment income (loss)A,B | .44 | .42 | .40 | .27 | .12 |
| Net realized and unrealized gain (loss) | (1.32) | 10.55 | (3.59) | .07 | 2.25 |
| Total from investment operations | (.88) | 10.97 | (3.19) | .34 | 2.37 |
| Distributions from net investment income | (.43) | (.45) | (.28) | (.18) | (.07) |
| Distributions from net realized gain | (.80) | (.11) | – | (.53) | (.01) |
| Total distributions | (1.22)C | (.56) | (.28) | (.71) | (.08) |
| Net asset value, end of period | $26.31 | $28.41 | $18.00 | $21.47 | $21.84 |
| Total ReturnD,E | (3.40)% | 61.84% | (15.15)% | 2.05% | 12.13% |
| Ratios to Average Net AssetsB,F,G | | | | | |
| Expenses before reductions | 1.03% | 1.07% | 1.09% | 1.08% | 1.10% |
| Expenses net of fee waivers, if any | 1.03% | 1.07% | 1.09% | 1.07% | 1.10% |
| Expenses net of all reductions | 1.03% | 1.06% | 1.08% | 1.07% | 1.09% |
| Net investment income (loss) | 1.55% | 1.76% | 1.97% | 1.31% | .55% |
| Supplemental Data | | | | | |
| Net assets, end of period (000 omitted) | $189,413 | $181,251 | $104,761 | $145,799 | $174,786 |
| Portfolio turnover rateH | 40% | 51% | 88%I | 51% | 46% |
A Calculated based on average shares outstanding during the period.
B Net investment income (loss) is affected by the timing of the declaration of dividends by any underlying mutual funds or exchange-traded funds (ETFs). Net investment income (loss) of any such underlying funds is not included in the Fund's net investment income (loss) ratio.
C Total distributions per share do not sum due to rounding.
D Total returns would have been lower if certain expenses had not been reduced during the applicable periods shown.
E Total returns do not include the effect of the sales charges.
F Fees and expenses of any underlying mutual funds or exchange-traded funds (ETFs) are not included in the Fund's expense ratio. The Fund indirectly bears its proportionate share of these expenses. For additional expense information related to investments in Fidelity Central Funds, please refer to the "Investments in Fidelity Central Funds" note found in the Notes to Financial Statements section of the most recent Annual or Semi-Annual report.
G Expense ratios reflect operating expenses of the class. Expenses before reductions do not reflect amounts reimbursed, waived, or reduced through arrangements with the investment adviser, brokerage services, or other offset arrangements, if applicable, and do not represent the amount paid by the class during periods when reimbursements, waivers or reductions occur.
H Amount does not include the portfolio activity of any underlying mutual funds or exchange-traded funds (ETFs).
I Portfolio turnover rate excludes securities received or delivered in-kind.
See accompanying notes which are an integral part of the financial statements.
Fidelity Advisor Financial Services Fund Class M
| Years ended July 31, | 2022 | 2021 | 2020 | 2019 | 2018 |
| Selected Per–Share Data | | | | | |
| Net asset value, beginning of period | $28.08 | $17.79 | $21.23 | $21.60 | $19.34 |
| Income from Investment Operations | | | | | |
| Net investment income (loss)A,B | .37 | .36 | .34 | .21 | .06 |
| Net realized and unrealized gain (loss) | (1.31) | 10.44 | (3.55) | .07 | 2.23 |
| Total from investment operations | (.94) | 10.80 | (3.21) | .28 | 2.29 |
| Distributions from net investment income | (.37) | (.39) | (.23) | (.13) | (.02) |
| Distributions from net realized gain | (.80) | (.11) | – | (.53) | (.01) |
| Total distributions | (1.16)C | (.51)C | (.23) | (.65)C | (.03) |
| Net asset value, end of period | $25.98 | $28.08 | $17.79 | $21.23 | $21.60 |
| Total ReturnD,E | (3.63)% | 61.48% | (15.38)% | 1.77% | 11.84% |
| Ratios to Average Net AssetsB,F,G | | | | | |
| Expenses before reductions | 1.28% | 1.32% | 1.35% | 1.34% | 1.37% |
| Expenses net of fee waivers, if any | 1.28% | 1.32% | 1.35% | 1.34% | 1.37% |
| Expenses net of all reductions | 1.28% | 1.31% | 1.34% | 1.33% | 1.36% |
| Net investment income (loss) | 1.30% | 1.51% | 1.72% | 1.04% | .28% |
| Supplemental Data | | | | | |
| Net assets, end of period (000 omitted) | $69,176 | $60,508 | $34,828 | $48,210 | $53,178 |
| Portfolio turnover rateH | 40% | 51% | 88%I | 51% | 46% |
A Calculated based on average shares outstanding during the period.
B Net investment income (loss) is affected by the timing of the declaration of dividends by any underlying mutual funds or exchange-traded funds (ETFs). Net investment income (loss) of any such underlying funds is not included in the Fund's net investment income (loss) ratio.
C Total distributions per share do not sum due to rounding.
D Total returns would have been lower if certain expenses had not been reduced during the applicable periods shown.
E Total returns do not include the effect of the sales charges.
F Fees and expenses of any underlying mutual funds or exchange-traded funds (ETFs) are not included in the Fund's expense ratio. The Fund indirectly bears its proportionate share of these expenses. For additional expense information related to investments in Fidelity Central Funds, please refer to the "Investments in Fidelity Central Funds" note found in the Notes to Financial Statements section of the most recent Annual or Semi-Annual report.
G Expense ratios reflect operating expenses of the class. Expenses before reductions do not reflect amounts reimbursed, waived, or reduced through arrangements with the investment adviser, brokerage services, or other offset arrangements, if applicable, and do not represent the amount paid by the class during periods when reimbursements, waivers or reductions occur.
H Amount does not include the portfolio activity of any underlying mutual funds or exchange-traded funds (ETFs).
I Portfolio turnover rate excludes securities received or delivered in-kind.
See accompanying notes which are an integral part of the financial statements.
Fidelity Advisor Financial Services Fund Class C
| Years ended July 31, | 2022 | 2021 | 2020 | 2019 | 2018 |
| Selected Per–Share Data | | | | | |
| Net asset value, beginning of period | $26.48 | $16.80 | $20.04 | $20.41 | $18.34 |
| Income from Investment Operations | | | | | |
| Net investment income (loss)A,B | .21 | .22 | .23 | .11 | (.04) |
| Net realized and unrealized gain (loss) | (1.23) | 9.85 | (3.37) | .07 | 2.11 |
| Total from investment operations | (1.02) | 10.07 | (3.14) | .18 | 2.07 |
| Distributions from net investment income | (.23) | (.28) | (.10) | (.03) | – |
| Distributions from net realized gain | (.80) | (.11) | – | (.53) | – |
| Total distributions | (1.02)C | (.39) | (.10) | (.55)C | – |
| Net asset value, end of period | $24.44 | $26.48 | $16.80 | $20.04 | $20.41 |
| Total ReturnD,E | (4.13)% | 60.62% | (15.79)% | 1.29% | 11.29% |
| Ratios to Average Net AssetsB,F,G | | | | | |
| Expenses before reductions | 1.79% | 1.83% | 1.84% | 1.83% | 1.86% |
| Expenses net of fee waivers, if any | 1.78% | 1.82% | 1.84% | 1.82% | 1.85% |
| Expenses net of all reductions | 1.78% | 1.82% | 1.83% | 1.82% | 1.85% |
| Net investment income (loss) | .80% | 1.00% | 1.22% | .56% | (.20)% |
| Supplemental Data | | | | | |
| Net assets, end of period (000 omitted) | $58,177 | $57,856 | $41,947 | $71,609 | $120,947 |
| Portfolio turnover rateH | 40% | 51% | 88%I | 51% | 46% |
A Calculated based on average shares outstanding during the period.
B Net investment income (loss) is affected by the timing of the declaration of dividends by any underlying mutual funds or exchange-traded funds (ETFs). Net investment income (loss) of any such underlying funds is not included in the Fund's net investment income (loss) ratio.
C Total distributions per share do not sum due to rounding.
D Total returns would have been lower if certain expenses had not been reduced during the applicable periods shown.
E Total returns do not include the effect of the contingent deferred sales charge.
F Fees and expenses of any underlying mutual funds or exchange-traded funds (ETFs) are not included in the Fund's expense ratio. The Fund indirectly bears its proportionate share of these expenses. For additional expense information related to investments in Fidelity Central Funds, please refer to the "Investments in Fidelity Central Funds" note found in the Notes to Financial Statements section of the most recent Annual or Semi-Annual report.
G Expense ratios reflect operating expenses of the class. Expenses before reductions do not reflect amounts reimbursed, waived, or reduced through arrangements with the investment adviser, brokerage services, or other offset arrangements, if applicable, and do not represent the amount paid by the class during periods when reimbursements, waivers or reductions occur.
H Amount does not include the portfolio activity of any underlying mutual funds or exchange-traded funds (ETFs).
I Portfolio turnover rate excludes securities received or delivered in-kind.
See accompanying notes which are an integral part of the financial statements.
Fidelity Advisor Financial Services Fund Class I
| Years ended July 31, | 2022 | 2021 | 2020 | 2019 | 2018 |
| Selected Per–Share Data | | | | | |
| Net asset value, beginning of period | $29.32 | $18.55 | $22.11 | $22.47 | $20.11 |
| Income from Investment Operations | | | | | |
| Net investment income (loss)A,B | .54 | .52 | .47 | .33 | .18 |
| Net realized and unrealized gain (loss) | (1.37) | 10.86 | (3.69) | .08 | 2.32 |
| Total from investment operations | (.83) | 11.38 | (3.22) | .41 | 2.50 |
| Distributions from net investment income | (.50) | (.50) | (.34) | (.25) | (.13) |
| Distributions from net realized gain | (.80) | (.11) | – | (.53) | (.01) |
| Total distributions | (1.29)C | (.61) | (.34) | (.77)C | (.14) |
| Net asset value, end of period | $27.20 | $29.32 | $18.55 | $22.11 | $22.47 |
| Total ReturnD | (3.13)% | 62.31% | (14.91)% | 2.36% | 12.43% |
| Ratios to Average Net AssetsB,E,F | | | | | |
| Expenses before reductions | .76% | .79% | .80% | .80% | .83% |
| Expenses net of fee waivers, if any | .76% | .79% | .80% | .79% | .83% |
| Expenses net of all reductions | .76% | .78% | .78% | .79% | .82% |
| Net investment income (loss) | 1.82% | 2.04% | 2.27% | 1.59% | .83% |
| Supplemental Data | | | | | |
| Net assets, end of period (000 omitted) | $131,118 | $118,424 | $85,299 | $107,059 | $162,724 |
| Portfolio turnover rateG | 40% | 51% | 88%H | 51% | 46% |
A Calculated based on average shares outstanding during the period.
B Net investment income (loss) is affected by the timing of the declaration of dividends by any underlying mutual funds or exchange-traded funds (ETFs). Net investment income (loss) of any such underlying funds is not included in the Fund's net investment income (loss) ratio.
C Total distributions per share do not sum due to rounding.
D Total returns would have been lower if certain expenses had not been reduced during the applicable periods shown.
E Fees and expenses of any underlying mutual funds or exchange-traded funds (ETFs) are not included in the Fund's expense ratio. The Fund indirectly bears its proportionate share of these expenses. For additional expense information related to investments in Fidelity Central Funds, please refer to the "Investments in Fidelity Central Funds" note found in the Notes to Financial Statements section of the most recent Annual or Semi-Annual report.
F Expense ratios reflect operating expenses of the class. Expenses before reductions do not reflect amounts reimbursed, waived, or reduced through arrangements with the investment adviser, brokerage services, or other offset arrangements, if applicable, and do not represent the amount paid by the class during periods when reimbursements, waivers or reductions occur.
G Amount does not include the portfolio activity of any underlying mutual funds or exchange-traded funds (ETFs).
H Portfolio turnover rate excludes securities received or delivered in-kind.
See accompanying notes which are an integral part of the financial statements.
Fidelity Advisor Financial Services Fund Class Z
| Years ended July 31, | 2022 | 2021 | 2020 | 2019 A |
| Selected Per–Share Data | | | | |
| Net asset value, beginning of period | $29.28 | $18.53 | $22.09 | $21.99 |
| Income from Investment Operations | | | | |
| Net investment income (loss)B,C | .57 | .54 | .49 | .25 |
| Net realized and unrealized gain (loss) | (1.37) | 10.86 | (3.67) | .66 |
| Total from investment operations | (.80) | 11.40 | (3.18) | .91 |
| Distributions from net investment income | (.53) | (.54) | (.38) | (.29) |
| Distributions from net realized gain | (.80) | (.11) | – | (.53) |
| Total distributions | (1.32)D | (.65) | (.38) | (.81)D |
| Net asset value, end of period | $27.16 | $29.28 | $18.53 | $22.09 |
| Total ReturnE,F | (3.03)% | 62.53% | (14.79)% | 4.72% |
| Ratios to Average Net AssetsC,G,H | | | | |
| Expenses before reductions | .64% | .66% | .67% | .66%I |
| Expenses net of fee waivers, if any | .63% | .66% | .67% | .65%I |
| Expenses net of all reductions | .63% | .65% | .65% | .65%I |
| Net investment income (loss) | 1.95% | 2.17% | 2.40% | 1.44%I |
| Supplemental Data | | | | |
| Net assets, end of period (000 omitted) | $63,009 | $49,214 | $30,790 | $7,041 |
| Portfolio turnover rateJ | 40% | 51% | 88%K | 51% |
A For the period October 2, 2018 (commencement of sale of shares) through July 31, 2019.
B Calculated based on average shares outstanding during the period.
C Net investment income (loss) is affected by the timing of the declaration of dividends by any underlying mutual funds or exchange-traded funds (ETFs). Net investment income (loss) of any such underlying funds is not included in the Fund's net investment income (loss) ratio.
D Total distributions per share do not sum due to rounding.
E Total returns for periods of less than one year are not annualized.
F Total returns would have been lower if certain expenses had not been reduced during the applicable periods shown.
G Fees and expenses of any underlying mutual funds or exchange-traded funds (ETFs) are not included in the Fund's expense ratio. The Fund indirectly bears its proportionate share of these expenses. For additional expense information related to investments in Fidelity Central Funds, please refer to the "Investments in Fidelity Central Funds" note found in the Notes to Financial Statements section of the most recent Annual or Semi-Annual report.
H Expense ratios reflect operating expenses of the class. Expenses before reductions do not reflect amounts reimbursed, waived, or reduced through arrangements with the investment adviser, brokerage services, or other offset arrangements, if applicable, and do not represent the amount paid by the class during periods when reimbursements, waivers or reductions occur.
I Annualized
J Amount does not include the portfolio activity of any underlying mutual funds or exchange-traded funds (ETFs).
K Portfolio turnover rate excludes securities received or delivered in-kind.
See accompanying notes which are an integral part of the financial statements.
Fidelity Advisor® Health Care Fund
Performance: The Bottom Line
Average annual total return reflects the change in the value of an investment, assuming reinvestment of distributions from dividend income and capital gains (the profits earned upon the sale of securities that have grown in value, if any) and assuming a constant rate of performance each year. The hypothetical investment and the average annual total returns do not reflect the deduction of taxes that a shareholder would pay on fund distributions or the redemption of fund shares. During periods of reimbursement by Fidelity, a fund’s total return will be greater than it would be had the reimbursement not occurred. How a fund did yesterday is no guarantee of how it will do tomorrow.
Average Annual Total Returns
| For the periods ended July 31, 2022 | Past 1 year | Past 5 years | Past 10 years |
| Class A (incl. 5.75% sales charge) | (16.97)% | 8.99% | 14.63% |
| Class M (incl. 3.50% sales charge) | (15.20)% | 9.22% | 14.60% |
| Class C (incl. contingent deferred sales charge) | (13.37)% | 9.46% | 14.62% |
| Class I | (11.68)% | 10.57% | 15.61% |
| Class Z | (11.56)% | 10.68% | 15.67% |
Class C shares' contingent deferred sales charges included in the past one year, past five years and past ten years total return figures are 1%, 0% and 0%, respectively.
The initial offering of Class Z shares took place on October 2, 2018. Returns prior to October 2, 2018, are those of Class I.
$10,000 Over 10 Years
Let's say hypothetically that $10,000 was invested in Fidelity Advisor® Health Care Fund - Class A on July 31, 2012, and the current 5.75% sales charge was paid.
The chart shows how the value of your investment would have changed, and also shows how the S&P 500® Index performed over the same period.
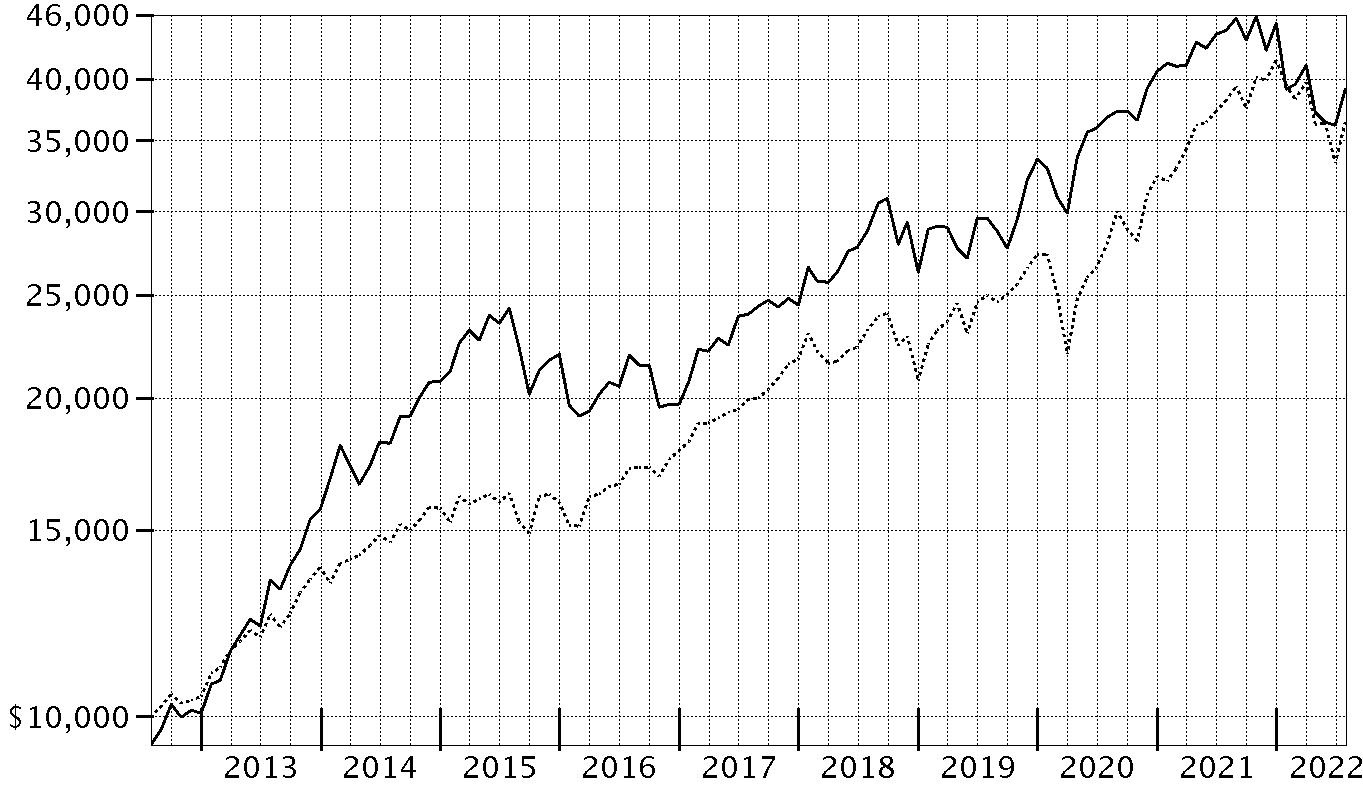
| Period Ending Values |
| $39,167 | Fidelity Advisor® Health Care Fund - Class A |
| $36,428 | S&P 500® Index |
Fidelity Advisor® Health Care Fund
Management's Discussion of Fund Performance
Market Recap: The S&P 500
® index returned -4.64% for the 12 months ending July 31, 2022, as a multitude of crosscurrents challenged the global economy and financial markets. Persistently high inflation, exacerbated by energy price shocks from the Russia–Ukraine conflict, spurred the U.S. Federal Reserve to hike interest rates more aggressively than anticipated, and concerns about the outlook for economic growth sent stocks into bear market territory. In early May, the Fed approved a rare half-percentage-point interest rate increase and announced plans to shrink its $9 trillion asset portfolio. June began with the Fed allowing up to billions in Treasuries and mortgage bonds to mature every month without investing the proceeds. Two weeks later, the central bank raised rates by 0.75 percentage points, its largest increase since 1994, and said it was becoming more difficult to achieve a soft landing, in which the economy slows enough to bring down inflation while avoiding a recession. Against this volatile backdrop, the S&P 500 posted its worst first-half result (-19.96%) to begin a year since 1970. Stocks sharply reversed course in July (+9.22%), as the Fed again raised its benchmark interest rate by 0.75% but signaled that, at some point, it will likely slow the pace of tightening to assess the impact on the economy. For the full 12 months, growth-oriented communication services (-29%) and consumer discretionary (-10%) stocks lagged most. In contrast, energy (+67%) rode a surge in commodity prices and led by a wide margin, followed by the defensive utilities (+16%) and consumer staples (+7%) sectors.
Comments from Portfolio Manager Eddie Yoon: For the fiscal year ending July 31, 2022, the fund's share classes (excluding sales charges, if applicable) returned roughly -13% to -12%, underperforming the -3.20% return of the MSCI U.S. IMI Health Care 25/50 Index, as well as the broad-based S&P 500
® index. Versus the sector index, security selection was the primary detractor, especially in the biotechnology industry. Stock selection and an overweighting in life sciences tools & services and an underweighting in pharmaceuticals also notably hurt. The biggest individual relative detractor was an overweight position in Penumbra (-48%). Penumbra was among our biggest holdings this period. Our second-largest relative detractor this period was avoiding AbbVie, an index component that gained roughly 29%. Avoiding Pfizer, an index component that gained 22%, also hurt the fund's relative performance. In contrast, the largest contributor to performance versus the sector index was an overweighting in managed health care. Also bolstering the fund's relative performance was an underweighting in health care supplies and health care equipment. Not owning Moderna, an index component that returned about -54%, was the fund's top individual relative contributor. Also boosting value was our overweighting in UnitedHealth Group, which gained roughly 33%. The company was the fund's largest holding. Avoiding Medtronic, an index component that returned -28%, also aided relative performance. Notable changes in positioning include increased exposure to the life sciences tools & services industry and a lower allocation to biotechnology.
The views expressed above reflect those of the portfolio manager(s) only through the end of the period as stated on the cover of this report and do not necessarily represent the views of Fidelity or any other person in the Fidelity organization. Any such views are subject to change at any time based upon market or other conditions and Fidelity disclaims any responsibility to update such views. These views may not be relied on as investment advice and, because investment decisions for a Fidelity fund are based on numerous factors, may not be relied on as an indication of trading intent on behalf of any Fidelity fund.
Fidelity Advisor® Health Care Fund
Investment Summary (Unaudited)
Top Ten Stocks as of July 31, 2022
| | % of fund's net assets |
| UnitedHealth Group, Inc. | 11.6 |
| Danaher Corp. | 6.0 |
| Eli Lilly & Co. | 5.8 |
| Thermo Fisher Scientific, Inc. | 5.2 |
| Humana, Inc. | 4.7 |
| Boston Scientific Corp. | 4.6 |
| Cigna Corp. | 3.5 |
| Insulet Corp. | 2.8 |
| Centene Corp. | 2.5 |
| Royalty Pharma PLC | 2.4 |
| | 49.1 |
Industries (% of fund's net assets)
| As of July 31, 2022 |
| | Health Care Providers & Services | 31.0% |
| | Life Sciences Tools & Services | 18.3% |
| | Biotechnology | 17.7% |
| | Health Care Equipment & Supplies | 15.0% |
| | Pharmaceuticals | 14.5% |
| | Health Care Technology | 2.0% |
| | Personal Products | 0.4% |
| | Diversified Financial Services | 0.2% |
| | Specialty Retail | 0.2% |
| | All Others* | 0.7% |

* Includes Short-Term investments and Net Other Assets (Liabilities).
Fidelity Advisor® Health Care Fund
Schedule of Investments July 31, 2022
Showing Percentage of Net Assets
| Common Stocks - 98.0% | | | |
| | | Shares | Value |
| Biotechnology - 17.1% | | | |
| Biotechnology - 17.1% | | | |
| ADC Therapeutics SA (a) | | 593,200 | $4,395,612 |
| Agios Pharmaceuticals, Inc. (a)(b) | | 500,000 | 10,785,000 |
| Alnylam Pharmaceuticals, Inc. (a) | | 420,000 | 59,656,800 |
| Ambrx Biopharma, Inc. ADR (a) | | 227,300 | 631,894 |
| Arcutis Biotherapeutics, Inc. (a) | | 424,711 | 10,303,489 |
| Argenx SE ADR (a) | | 340,000 | 123,831,400 |
| Ascendis Pharma A/S sponsored ADR (a) | | 565,607 | 48,376,367 |
| Avid Bioservices, Inc. (a) | | 700,000 | 13,755,000 |
| Beam Therapeutics, Inc. (a)(b) | | 280,000 | 17,634,400 |
| BeiGene Ltd. ADR (a) | | 35,228 | 5,921,122 |
| Blueprint Medicines Corp. (a) | | 560,000 | 28,593,600 |
| Celldex Therapeutics, Inc. (a) | | 443,429 | 13,622,139 |
| Century Therapeutics, Inc. (a) | | 600,000 | 6,342,000 |
| Cerevel Therapeutics Holdings (a) | | 950,000 | 24,975,500 |
| Cytokinetics, Inc. (a) | | 1,180,000 | 49,949,400 |
| Denali Therapeutics, Inc. (a) | | 350,000 | 11,907,000 |
| Erasca, Inc. | | 1,800,000 | 13,572,000 |
| Exelixis, Inc. (a) | | 1,120,000 | 23,430,400 |
| Fate Therapeutics, Inc. (a)(b) | | 250,000 | 7,632,500 |
| Generation Bio Co. (a) | | 297,443 | 1,897,686 |
| Graphite Bio, Inc. (a) | | 600,000 | 1,890,000 |
| Imago BioSciences, Inc. | | 200,000 | 3,220,000 |
| Innovent Biologics, Inc. (a)(c) | | 5,600,000 | 23,363,355 |
| Instil Bio, Inc. (a)(b) | | 1,080,000 | 6,091,200 |
| Intellia Therapeutics, Inc. (a) | | 320,000 | 20,723,200 |
| Janux Therapeutics, Inc. (a) | | 400,000 | 4,968,000 |
| Keros Therapeutics, Inc. (a) | | 280,000 | 8,982,400 |
| Legend Biotech Corp. ADR (a) | | 875,000 | 41,335,000 |
| Mirati Therapeutics, Inc. (a) | | 140,000 | 9,016,000 |
| Morphic Holding, Inc. (a) | | 191,000 | 5,055,770 |
| Nuvalent, Inc. Class A (a)(b) | | 234,487 | 3,484,477 |
| Poseida Therapeutics, Inc. (a) | | 1,025,220 | 2,552,798 |
| PTC Therapeutics, Inc. (a) | | 799,700 | 34,826,935 |
| Regeneron Pharmaceuticals, Inc. (a) | | 220,000 | 127,971,800 |
| Relay Therapeutics, Inc. (a)(b) | | 1,000,000 | 19,020,000 |
| Sarepta Therapeutics, Inc. (a) | | 420,000 | 39,039,000 |
| Scholar Rock Holding Corp. (a)(b) | | 93,003 | 638,001 |
| Shattuck Labs, Inc. (a) | | 668,725 | 2,547,842 |
| Stoke Therapeutics, Inc. (a) | | 320,000 | 4,732,800 |
| uniQure B.V. (a)(b) | | 440,000 | 11,154,000 |
| Vaxcyte, Inc. (a) | | 540,000 | 12,463,200 |
| Vertex Pharmaceuticals, Inc. (a) | | 235,000 | 65,896,350 |
| Verve Therapeutics, Inc. (a)(b) | | 180,000 | 4,431,600 |
| Xencor, Inc. (a) | | 1,000,000 | 28,690,000 |
| Xenon Pharmaceuticals, Inc. (a) | | 311,888 | 10,339,087 |
| Zai Lab Ltd. (a) | | 4,000,000 | 16,331,418 |
| Zentalis Pharmaceuticals, Inc. (a)(b) | | 616,288 | 17,995,610 |
| | | | 1,003,973,152 |
| Health Care Equipment & Supplies - 15.0% | | | |
| Health Care Equipment - 15.0% | | | |
| Boston Scientific Corp. (a) | | 6,648,758 | 272,931,516 |
| Envista Holdings Corp. (a) | | 1,120,000 | 45,528,000 |
| Hologic, Inc. (a) | | 300,000 | 21,414,000 |
| Insulet Corp. (a) | | 665,180 | 164,831,604 |
| Masimo Corp. (a) | | 280,000 | 40,482,400 |
| Nevro Corp. (a) | | 104,000 | 4,508,400 |
| Novocure Ltd. (a) | | 240,504 | 16,351,867 |
| Outset Medical, Inc. (a) | | 600,000 | 9,270,000 |
| Penumbra, Inc. (a) | | 970,000 | 135,198,600 |
| PROCEPT BioRobotics Corp. | | 400,000 | 15,320,000 |
| ResMed, Inc. | | 418,000 | 100,537,360 |
| Tandem Diabetes Care, Inc. (a) | | 820,000 | 54,292,200 |
| | | | 880,665,947 |
| Health Care Providers & Services - 31.0% | | | |
| Health Care Facilities - 3.3% | | | |
| Cano Health, Inc. (a)(b) | | 4,000,000 | 24,360,000 |
| HCA Holdings, Inc. | | 485,000 | 103,023,700 |
| Surgery Partners, Inc. (a) | | 1,400,000 | 55,132,000 |
| The Oncology Institute, Inc. (a)(d) | | 1,472,782 | 9,514,172 |
| | | | 192,029,872 |
| Health Care Services - 7.5% | | | |
| agilon health, Inc. (a)(b) | | 3,500,000 | 87,605,000 |
| Cigna Corp. | | 745,000 | 205,143,200 |
| Guardant Health, Inc. (a) | | 409,800 | 20,559,666 |
| LifeStance Health Group, Inc. (a) | | 3,000,000 | 17,880,000 |
| Oak Street Health, Inc. (a)(b) | | 3,810,747 | 110,321,126 |
| | | | 441,508,992 |
| Managed Health Care - 20.2% | | | |
| Alignment Healthcare, Inc. (a) | | 2,281,500 | 33,492,420 |
| Centene Corp. (a) | | 1,600,000 | 148,752,000 |
| Humana, Inc. | | 570,000 | 274,740,000 |
| Molina Healthcare, Inc. (a) | | 145,000 | 47,519,400 |
| UnitedHealth Group, Inc. | | 1,265,000 | 686,060,098 |
| | | | 1,190,563,918 |
|
| TOTAL HEALTH CARE PROVIDERS & SERVICES | | | 1,824,102,782 |
|
| Health Care Technology - 1.7% | | | |
| Health Care Technology - 1.7% | | | |
| Definitive Healthcare Corp. (b) | | 330,000 | 8,573,400 |
| Doximity, Inc. (a)(b) | | 750,000 | 31,740,000 |
| Inspire Medical Systems, Inc. (a) | | 228,000 | 47,649,720 |
| Medlive Technology Co. Ltd. (c) | | 2,180,000 | 2,771,551 |
| Phreesia, Inc. (a) | | 504,577 | 11,852,514 |
| | | | 102,587,185 |
| Life Sciences Tools & Services - 18.3% | | | |
| Life Sciences Tools & Services - 18.3% | | | |
| 10X Genomics, Inc. (a)(b) | | 330,000 | 13,249,500 |
| Agilent Technologies, Inc. | | 320,000 | 42,912,000 |
| Avantor, Inc. (a) | | 1,240,000 | 35,984,800 |
| Bio-Rad Laboratories, Inc. Class A (a) | | 74,000 | 41,681,240 |
| Bruker Corp. | | 1,000,000 | 68,550,000 |
| Charles River Laboratories International, Inc. (a) | | 115,000 | 28,812,100 |
| Danaher Corp. | | 1,220,000 | 355,593,400 |
| Lonza Group AG | | 75,000 | 45,581,371 |
| Olink Holding AB ADR (a)(b) | | 800,000 | 10,760,000 |
| Quanterix Corp. (a) | | 260,000 | 4,157,400 |
| Sartorius Stedim Biotech | | 64,000 | 25,484,204 |
| Seer, Inc. (a) | | 713,000 | 6,417,000 |
| Stevanato Group SpA | | 850,000 | 14,543,500 |
| Thermo Fisher Scientific, Inc. | | 510,000 | 305,189,100 |
| West Pharmaceutical Services, Inc. | | 228,000 | 78,331,680 |
| | | | 1,077,247,295 |
| Personal Products - 0.4% | | | |
| Personal Products - 0.4% | | | |
| The Beauty Health Co. (a)(d) | | 1,000,000 | 13,320,000 |
| The Beauty Health Co. (a)(b) | | 737,177 | 9,819,198 |
| | | | 23,139,198 |
| Pharmaceuticals - 14.3% | | | |
| Pharmaceuticals - 14.3% | | | |
| Arvinas Holding Co. LLC (a) | | 381,600 | 20,266,776 |
| AstraZeneca PLC (United Kingdom) | | 880,000 | 115,756,335 |
| Bristol-Myers Squibb Co. | | 1,140,000 | 84,109,200 |
| Eli Lilly & Co. | | 1,030,000 | 339,580,700 |
| Merck & Co., Inc. | | 400,000 | 35,736,000 |
| Pharvaris BV (a) | | 400,000 | 8,440,000 |
| Roche Holding AG (participation certificate) | | 235,000 | 78,021,061 |
| Royalty Pharma PLC (b) | | 3,271,104 | 142,260,313 |
| Theseus Pharmaceuticals, Inc. | | 400,000 | 2,884,000 |
| UCB SA | | 180,000 | 14,036,835 |
| | | | 841,091,220 |
| Specialty Retail - 0.2% | | | |
| Specialty Stores - 0.2% | | | |
| Warby Parker, Inc. (a)(b) | | 870,000 | 10,779,300 |
| TOTAL COMMON STOCKS | | | |
| (Cost $4,180,248,626) | | | 5,763,586,079 |
|
| Preferred Stocks - 1.3% | | | |
| Convertible Preferred Stocks - 1.1% | | | |
| Biotechnology - 0.6% | | | |
| Biotechnology - 0.6% | | | |
| Asimov, Inc. Series B (d)(e) | | 67,547 | 4,646,558 |
| Caris Life Sciences, Inc. Series D (a)(d)(e) | | 2,082,481 | 11,536,945 |
| Cleerly, Inc. Series C (d)(e) | | 882,089 | 10,391,538 |
| Element Biosciences, Inc. Series C (a)(d)(e) | | 376,690 | 5,145,585 |
| ElevateBio LLC Series C (a)(d)(e) | | 163,300 | 746,771 |
| Inscripta, Inc. Series E (a)(d)(e) | | 826,424 | 5,024,658 |
| | | | 37,492,055 |
| Health Care Providers & Services - 0.0% | | | |
| Health Care Services - 0.0% | | | |
| dMed Biopharmaceutical Co. Ltd. Series C (a)(d)(e) | | 236,142 | 2,118,194 |
| Health Care Technology - 0.3% | | | |
| Health Care Technology - 0.3% | | | |
| Aledade, Inc.: | | | |
| Series B1 (a)(d)(e) | | 130,618 | 6,506,083 |
| Series E1 (d)(e) | | 46,526 | 2,317,460 |
| Omada Health, Inc. Series E (d)(e) | | 1,456,953 | 4,021,190 |
| Wugen, Inc. Series B (a)(d)(e) | | 300,054 | 1,299,234 |
| | | | 14,143,967 |
| Pharmaceuticals - 0.2% | | | |
| Pharmaceuticals - 0.2% | | | |
| Aristea Therapeutics, Inc. Series B (a)(d)(e) | | 638,900 | 6,012,049 |
| Galvanize Therapeutics Series B (d)(e) | | 2,552,870 | 4,419,748 |
| | | | 10,431,797 |
|
| TOTAL CONVERTIBLE PREFERRED STOCKS | | | 64,186,013 |
|
| Nonconvertible Preferred Stocks - 0.2% | | | |
| Diversified Financial Services - 0.2% | | | |
| Other Diversified Financial Services - 0.2% | | | |
| Thriveworks TopCo LLC Series B (d)(e)(f) | | 327,591 | 9,402,913 |
| TOTAL PREFERRED STOCKS | | | |
| (Cost $88,347,897) | | | 73,588,926 |
|
| Money Market Funds - 6.5% | | | |
| Fidelity Cash Central Fund 2.01% (g) | | 37,771,369 | 37,778,923 |
| Fidelity Securities Lending Cash Central Fund 2.01% (g)(h) | | 346,034,024 | 346,068,627 |
| TOTAL MONEY MARKET FUNDS | | | |
| (Cost $383,847,550) | | | 383,847,550 |
| TOTAL INVESTMENT IN SECURITIES - 105.8% | | | |
| (Cost $4,652,444,073) | | | 6,221,022,555 |
| NET OTHER ASSETS (LIABILITIES) - (5.8)% | | | (339,529,038) |
| NET ASSETS - 100% | | | $5,881,493,517 |
Legend
(a) Non-income producing
(b) Security or a portion of the security is on loan at period end.
(c) Security exempt from registration under Rule 144A of the Securities Act of 1933. These securities may be resold in transactions exempt from registration, normally to qualified institutional buyers. At the end of the period, the value of these securities amounted to $26,134,906 or 0.4% of net assets.
(d) Restricted securities (including private placements) - Investment in securities not registered under the Securities Act of 1933 (excluding 144A issues). At the end of the period, the value of restricted securities (excluding 144A issues) amounted to $96,423,098 or 1.6% of net assets.
(e) Level 3 security
(f) Investment is owned by a wholly-owned subsidiary (Subsidiary) that is treated as a corporation for U.S. tax purposes.
(g) Affiliated fund that is generally available only to investment companies and other accounts managed by Fidelity Investments. The rate quoted is the annualized seven-day yield of the fund at period end. A complete unaudited listing of the fund's holdings as of its most recent quarter end is available upon request. In addition, each Fidelity Central Fund's financial statements, which are not covered by the Fund's Report of Independent Registered Public Accounting Firm, are available on the SEC's website or upon request.
(h) Investment made with cash collateral received from securities on loan.
Additional information on each restricted holding is as follows:
| Security | Acquisition Date | Acquisition Cost |
| Aledade, Inc. Series B1 | 5/7/21 | $5,001,455 |
| Aledade, Inc. Series E1 | 5/20/22 | $2,317,665 |
| Aristea Therapeutics, Inc. Series B | 10/6/20 | $3,522,703 |
| Asimov, Inc. Series B | 10/29/21 | $6,260,303 |
| Caris Life Sciences, Inc. Series D | 5/11/21 | $16,868,096 |
| Cleerly, Inc. Series C | 7/8/22 | $10,391,538 |
| dMed Biopharmaceutical Co. Ltd. Series C | 12/1/20 | $3,353,960 |
| Element Biosciences, Inc. Series C | 6/21/21 | $7,743,503 |
| ElevateBio LLC Series C | 3/9/21 | $685,044 |
| Galvanize Therapeutics Series B | 3/29/22 | $4,419,746 |
| Inscripta, Inc. Series E | 3/30/21 | $7,297,324 |
| Omada Health, Inc. Series E | 12/22/21 | $8,734,725 |
| The Beauty Health Co. | 12/8/20 | $10,000,000 |
| The Oncology Institute, Inc. | 6/28/21 | $14,727,820 |
| Thriveworks TopCo LLC Series B | 7/23/21 - 2/25/22 | $9,402,913 |
| Wugen, Inc. Series B | 7/9/21 | $2,326,889 |
Affiliated Central Funds
Fiscal year to date information regarding the Fund's investments in Fidelity Central Funds, including the ownership percentage, is presented below.
| Fund | Value, beginning of period | Purchases | Sales Proceeds | Dividend Income | Realized Gain/Loss | Change in Unrealized appreciation (depreciation) | Value, end of period | % ownership, end of period |
| Fidelity Cash Central Fund 2.01% | $26,773,635 | $927,993,860 | $916,988,572 | $110,739 | $-- | $-- | $37,778,923 | 0.1% |
| Fidelity Securities Lending Cash Central Fund 2.01% | 90,896,753 | 1,222,450,505 | 967,278,631 | 1,015,901 | -- | -- | 346,068,627 | 1.0% |
| Total | $117,670,388 | $2,150,444,365 | $1,884,267,203 | $1,126,640 | $-- | $-- | $383,847,550 | |
Amounts in the income column in the above table include any capital gain distributions from underlying funds, which are presented in the corresponding line-item in the Statement of Operations, if applicable. Amount for Fidelity Securities Lending Cash Central Fund represents the income earned on investing cash collateral, less rebates paid to borrowers and any lending agent fees associated with the loan, plus any premium payments received for lending certain types of securities.
Investment Valuation
The following is a summary of the inputs used, as of July 31, 2022, involving the Fund's assets and liabilities carried at fair value. The inputs or methodology used for valuing securities may not be an indication of the risk associated with investing in those securities. For more information on valuation inputs, and their aggregation into the levels used below, please refer to the Investment Valuation section in the accompanying Notes to Financial Statements.
| | Valuation Inputs at Reporting Date: |
| Description | Total | Level 1 | Level 2 | Level 3 |
| Investments in Securities: | | | | |
| Common Stocks | $5,763,586,079 | $5,524,227,312 | $239,358,767 | $-- |
| Preferred Stocks | 73,588,926 | -- | -- | 73,588,926 |
| Money Market Funds | 383,847,550 | 383,847,550 | -- | -- |
| Total Investments in Securities: | $6,221,022,555 | $5,908,074,862 | $239,358,767 | $73,588,926 |
The following is a reconciliation of Investments in Securities for which Level 3 inputs were used in determining value:
| Investments in Securities: | |
| Preferred Stocks | |
| Beginning Balance | $54,676,052 |
| Total Realized Gain (Loss) | -- |
| Total Unrealized Gain (Loss) | (17,038,922) |
| Cost of Purchases | 35,951,796 |
| Proceeds of Sales | -- |
| Amortization/Accretion | -- |
| Transfers in to Level 3 | -- |
| Transfers out of Level 3 | -- |
| Ending Balance | $73,588,926 |
| The change in unrealized gain (loss) for the period attributable to Level 3 securities held at July 31, 2022 | $(17,038,922) |
The information used in the above reconciliation represents fiscal year to date activity for any Investments in Securities identified as using Level 3 inputs at either the beginning or the end of the current fiscal period. Transfers into Level 3 were attributable to a lack of observable market data resulting from decreases in market activity, decreases in liquidity, security restructurings or corporate actions. Transfers out of Level 3 were attributable to observable market data becoming available for those securities. Cost of purchases and proceeds of sales may include securities received and/or delivered through in-kind transactions. Transfers in or out of Level 3 represent the beginning value of any Security or Instrument where a change in the pricing level occurred from the beginning to the end of the period. The cost of purchases and the proceeds of sales may include securities received or delivered through corporate actions or exchanges. Realized and unrealized gains (losses) disclosed in the reconciliation are included in Net Gain (Loss) on the Fund's Statement of Operations.
See accompanying notes which are an integral part of the financial statements.
Fidelity Advisor® Health Care Fund
Financial Statements
Statement of Assets and Liabilities
| | | July 31, 2022 |
| Assets | | |
Investment in securities, at value (including securities loaned of $334,557,882) — See accompanying schedule:
Unaffiliated issuers (cost $4,268,596,523) | $5,837,175,005 | |
| Fidelity Central Funds (cost $383,847,550) | 383,847,550 | |
| Total Investment in Securities (cost $4,652,444,073) | | $6,221,022,555 |
| Cash | | 1,150,839 |
| Receivable for investments sold | | 30,965,502 |
| Receivable for fund shares sold | | 4,649,559 |
| Dividends receivable | | 2,533,726 |
| Distributions receivable from Fidelity Central Funds | | 135,197 |
| Prepaid expenses | | 7,836 |
| Other receivables | | 16,078 |
| Total assets | | 6,260,481,292 |
| Liabilities | | |
| Payable for investments purchased | $25,360,088 | |
| Payable for fund shares redeemed | 3,339,614 | |
| Accrued management fee | 2,493,910 | |
| Distribution and service plan fees payable | 839,261 | |
| Other affiliated payables | 780,003 | |
| Other payables and accrued expenses | 108,149 | |
| Collateral on securities loaned | 346,066,750 | |
| Total liabilities | | 378,987,775 |
| Net Assets | | $5,881,493,517 |
| Net Assets consist of: | | |
| Paid in capital | | $4,415,231,505 |
| Total accumulated earnings (loss) | | 1,466,262,012 |
| Net Assets | | $5,881,493,517 |
| Net Asset Value and Maximum Offering Price | | |
| Class A: | | |
| Net Asset Value and redemption price per share ($1,488,238,067 ÷ 25,843,522 shares)(a) | | $57.59 |
| Maximum offering price per share (100/94.25 of $57.59) | | $61.10 |
| Class M: | | |
| Net Asset Value and redemption price per share ($330,452,146 ÷ 6,263,689 shares)(a) | | $52.76 |
| Maximum offering price per share (100/96.50 of $52.76) | | $54.67 |
| Class C: | | |
| Net Asset Value and offering price per share ($501,742,061 ÷ 11,668,425 shares)(a) | | $43.00 |
| Class I: | | |
| Net Asset Value, offering price and redemption price per share ($2,743,740,418 ÷ 42,984,805 shares) | | $63.83 |
| Class Z: | | |
| Net Asset Value, offering price and redemption price per share ($817,320,825 ÷ 12,784,386 shares) | | $63.93 |
(a) Redemption price per share is equal to net asset value less any applicable contingent deferred sales charge.
See accompanying notes which are an integral part of the financial statements.
Statement of Operations
| | | Year ended July 31, 2022 |
| Investment Income | | |
| Dividends | | $34,421,935 |
| Income from Fidelity Central Funds (including $1,015,901 from security lending) | | 1,126,640 |
| Total income | | 35,548,575 |
| Expenses | | |
| Management fee | $34,059,743 | |
| Transfer agent fees | 9,795,872 | |
| Distribution and service plan fees | 11,718,614 | |
| Accounting fees | 1,121,607 | |
| Custodian fees and expenses | 121,580 | |
| Independent trustees' fees and expenses | 21,867 | |
| Registration fees | 211,342 | |
| Audit | 52,883 | |
| Legal | 11,382 | |
| Interest | 2,915 | |
| Miscellaneous | 25,965 | |
| Total expenses before reductions | 57,143,770 | |
| Expense reductions | (204,580) | |
| Total expenses after reductions | | 56,939,190 |
| Net investment income (loss) | | (21,390,615) |
| Realized and Unrealized Gain (Loss) | | |
| Net realized gain (loss) on: | | |
| Investment securities: | | |
| Unaffiliated issuers | 27,437,004 | |
| Foreign currency transactions | 96,488 | |
| Total net realized gain (loss) | | 27,533,492 |
| Change in net unrealized appreciation (depreciation) on: | | |
| Investment securities: | | |
| Unaffiliated issuers | (867,833,493) | |
| Unfunded commitments | 1,565,567 | |
| Assets and liabilities in foreign currencies | (363,754) | |
| Total change in net unrealized appreciation (depreciation) | | (866,631,680) |
| Net gain (loss) | | (839,098,188) |
| Net increase (decrease) in net assets resulting from operations | | $(860,488,803) |
See accompanying notes which are an integral part of the financial statements.
Statement of Changes in Net Assets
| | Year ended July 31, 2022 | Year ended July 31, 2021 |
| Increase (Decrease) in Net Assets | | |
| Operations | | |
| Net investment income (loss) | $(21,390,615) | $(20,662,802) |
| Net realized gain (loss) | 27,533,492 | 545,420,950 |
| Change in net unrealized appreciation (depreciation) | (866,631,680) | 673,250,658 |
| Net increase (decrease) in net assets resulting from operations | (860,488,803) | 1,198,008,806 |
| Distributions to shareholders | (421,462,568) | (356,031,852) |
| Share transactions - net increase (decrease) | (34,838,590) | 823,653,502 |
| Total increase (decrease) in net assets | (1,316,789,961) | 1,665,630,456 |
| Net Assets | | |
| Beginning of period | 7,198,283,478 | 5,532,653,022 |
| End of period | $5,881,493,517 | $7,198,283,478 |
See accompanying notes which are an integral part of the financial statements.
Financial Highlights
Fidelity Advisor Health Care Fund Class A
| Years ended July 31, | 2022 | 2021 | 2020 | 2019 | 2018 |
| Selected Per–Share Data | | | | | |
| Net asset value, beginning of period | $69.58 | $61.07 | $49.21 | $50.14 | $41.85 |
| Income from Investment Operations | | | | | |
| Net investment income (loss)A,B | (.26) | (.26) | (.04) | (.07) | (.07) |
| Net realized and unrealized gain (loss) | (7.58) | 12.55 | 12.08 | 1.36 | 8.36 |
| Total from investment operations | (7.84) | 12.29 | 12.04 | 1.29 | 8.29 |
| Distributions from net investment income | – | (.16) | – | – | – |
| Distributions from net realized gain | (4.15) | (3.62) | (.18) | (2.22) | – |
| Total distributions | (4.15) | (3.78) | (.18) | (2.22) | – |
| Net asset value, end of period | $57.59 | $69.58 | $61.07 | $49.21 | $50.14 |
| Total ReturnC,D | (11.90)% | 20.70% | 24.50% | 2.87% | 19.81% |
| Ratios to Average Net AssetsB,E,F | | | | | |
| Expenses before reductions | .97% | .98% | 1.01% | 1.02% | 1.05% |
| Expenses net of fee waivers, if any | .97% | .98% | 1.00% | 1.02% | 1.05% |
| Expenses net of all reductions | .97% | .98% | 1.00% | 1.02% | 1.04% |
| Net investment income (loss) | (.42)% | (.39)% | (.07)% | (.14)% | (.16)% |
| Supplemental Data | | | | | |
| Net assets, end of period (000 omitted) | $1,488,238 | $1,735,235 | $1,372,082 | $1,121,411 | $1,003,430 |
| Portfolio turnover rateG | 33% | 38% | 53%H | 45% | 81% |
A Calculated based on average shares outstanding during the period.
B Net investment income (loss) is affected by the timing of the declaration of dividends by any underlying mutual funds or exchange-traded funds (ETFs). Net investment income (loss) of any such underlying funds is not included in the Fund's net investment income (loss) ratio.
C Total returns would have been lower if certain expenses had not been reduced during the applicable periods shown.
D Total returns do not include the effect of the sales charges.
E Fees and expenses of any underlying mutual funds or exchange-traded funds (ETFs) are not included in the Fund's expense ratio. The Fund indirectly bears its proportionate share of these expenses. For additional expense information related to investments in Fidelity Central Funds, please refer to the "Investments in Fidelity Central Funds" note found in the Notes to Financial Statements section of the most recent Annual or Semi-Annual report.
F Expense ratios reflect operating expenses of the class. Expenses before reductions do not reflect amounts reimbursed, waived, or reduced through arrangements with the investment adviser, brokerage services, or other offset arrangements, if applicable, and do not represent the amount paid by the class during periods when reimbursements, waivers or reductions occur.
G Amount does not include the portfolio activity of any underlying mutual funds or exchange-traded funds (ETFs).
H Portfolio turnover rate excludes securities received or delivered in-kind.
See accompanying notes which are an integral part of the financial statements.
Fidelity Advisor Health Care Fund Class M
| Years ended July 31, | 2022 | 2021 | 2020 | 2019 | 2018 |
| Selected Per–Share Data | | | | | |
| Net asset value, beginning of period | $64.25 | $56.62 | $45.75 | $46.89 | $39.25 |
| Income from Investment Operations | | | | | |
| Net investment income (loss)A,B | (.38) | (.39) | (.16) | (.18) | (.18) |
| Net realized and unrealized gain (loss) | (6.96) | 11.61 | 11.21 | 1.26 | 7.82 |
| Total from investment operations | (7.34) | 11.22 | 11.05 | 1.08 | 7.64 |
| Distributions from net investment income | – | (.02) | – | – | – |
| Distributions from net realized gain | (4.15) | (3.57) | (.18) | (2.22) | – |
| Total distributions | (4.15) | (3.59) | (.18) | (2.22) | – |
| Net asset value, end of period | $52.76 | $64.25 | $56.62 | $45.75 | $46.89 |
| Total ReturnC,D | (12.12)% | 20.39% | 24.19% | 2.61% | 19.46% |
| Ratios to Average Net AssetsB,E,F | | | | | |
| Expenses before reductions | 1.22% | 1.23% | 1.26% | 1.28% | 1.32% |
| Expenses net of fee waivers, if any | 1.22% | 1.23% | 1.26% | 1.28% | 1.32% |
| Expenses net of all reductions | 1.22% | 1.23% | 1.26% | 1.28% | 1.31% |
| Net investment income (loss) | (.67)% | (.65)% | (.33)% | (.40)% | (.43)% |
| Supplemental Data | | | | | |
| Net assets, end of period (000 omitted) | $330,452 | $402,175 | $349,280 | $306,758 | $298,061 |
| Portfolio turnover rateG | 33% | 38% | 53%H | 45% | 81% |
A Calculated based on average shares outstanding during the period.
B Net investment income (loss) is affected by the timing of the declaration of dividends by any underlying mutual funds or exchange-traded funds (ETFs). Net investment income (loss) of any such underlying funds is not included in the Fund's net investment income (loss) ratio.
C Total returns would have been lower if certain expenses had not been reduced during the applicable periods shown.
D Total returns do not include the effect of the sales charges.
E Fees and expenses of any underlying mutual funds or exchange-traded funds (ETFs) are not included in the Fund's expense ratio. The Fund indirectly bears its proportionate share of these expenses. For additional expense information related to investments in Fidelity Central Funds, please refer to the "Investments in Fidelity Central Funds" note found in the Notes to Financial Statements section of the most recent Annual or Semi-Annual report.
F Expense ratios reflect operating expenses of the class. Expenses before reductions do not reflect amounts reimbursed, waived, or reduced through arrangements with the investment adviser, brokerage services, or other offset arrangements, if applicable, and do not represent the amount paid by the class during periods when reimbursements, waivers or reductions occur.
G Amount does not include the portfolio activity of any underlying mutual funds or exchange-traded funds (ETFs).
H Portfolio turnover rate excludes securities received or delivered in-kind.
See accompanying notes which are an integral part of the financial statements.
Fidelity Advisor Health Care Fund Class C
| Years ended July 31, | 2022 | 2021 | 2020 | 2019 | 2018 |
| Selected Per–Share Data | | | | | |
| Net asset value, beginning of period | $53.40 | $47.63 | $38.70 | $40.21 | $33.82 |
| Income from Investment Operations | | | | | |
| Net investment income (loss)A,B | (.55) | (.58) | (.34) | (.34) | (.33) |
| Net realized and unrealized gain (loss) | (5.70) | 9.71 | 9.45 | 1.05 | 6.72 |
| Total from investment operations | (6.25) | 9.13 | 9.11 | .71 | 6.39 |
| Distributions from net investment income | – | – | – | – | – |
| Distributions from net realized gain | (4.15) | (3.36) | (.18) | (2.22) | – |
| Total distributions | (4.15) | (3.36) | (.18) | (2.22) | – |
| Net asset value, end of period | $43.00 | $53.40 | $47.63 | $38.70 | $40.21 |
| Total ReturnC,D | (12.56)% | 19.78% | 23.58% | 2.10% | 18.89% |
| Ratios to Average Net AssetsB,E,F | | | | | |
| Expenses before reductions | 1.72% | 1.73% | 1.76% | 1.77% | 1.80% |
| Expenses net of fee waivers, if any | 1.72% | 1.73% | 1.76% | 1.77% | 1.80% |
| Expenses net of all reductions | 1.72% | 1.73% | 1.75% | 1.77% | 1.79% |
| Net investment income (loss) | (1.17)% | (1.15)% | (.82)% | (.88)% | (.91)% |
| Supplemental Data | | | | | |
| Net assets, end of period (000 omitted) | $501,742 | $697,626 | $654,487 | $585,093 | $669,639 |
| Portfolio turnover rateG | 33% | 38% | 53%H | 45% | 81% |
A Calculated based on average shares outstanding during the period.
B Net investment income (loss) is affected by the timing of the declaration of dividends by any underlying mutual funds or exchange-traded funds (ETFs). Net investment income (loss) of any such underlying funds is not included in the Fund's net investment income (loss) ratio.
C Total returns would have been lower if certain expenses had not been reduced during the applicable periods shown.
D Total returns do not include the effect of the contingent deferred sales charge.
E Fees and expenses of any underlying mutual funds or exchange-traded funds (ETFs) are not included in the Fund's expense ratio. The Fund indirectly bears its proportionate share of these expenses. For additional expense information related to investments in Fidelity Central Funds, please refer to the "Investments in Fidelity Central Funds" note found in the Notes to Financial Statements section of the most recent Annual or Semi-Annual report.
F Expense ratios reflect operating expenses of the class. Expenses before reductions do not reflect amounts reimbursed, waived, or reduced through arrangements with the investment adviser, brokerage services, or other offset arrangements, if applicable, and do not represent the amount paid by the class during periods when reimbursements, waivers or reductions occur.
G Amount does not include the portfolio activity of any underlying mutual funds or exchange-traded funds (ETFs).
H Portfolio turnover rate excludes securities received or delivered in-kind.
See accompanying notes which are an integral part of the financial statements.
Fidelity Advisor Health Care Fund Class I
| Years ended July 31, | 2022 | 2021 | 2020 | 2019 | 2018 |
| Selected Per–Share Data | | | | | |
| Net asset value, beginning of period | $76.48 | $66.81 | $53.77 | $54.43 | $45.35 |
| Income from Investment Operations | | | | | |
| Net investment income (loss)A,B | (.11) | (.10) | .11 | .07 | .05 |
| Net realized and unrealized gain (loss) | (8.39) | 13.76 | 13.22 | 1.49 | 9.06 |
| Total from investment operations | (8.50) | 13.66 | 13.33 | 1.56 | 9.11 |
| Distributions from net investment income | – | (.30) | – | – | – |
| Distributions from net realized gain | (4.15) | (3.69) | (.29) | (2.22) | (.03) |
| Total distributions | (4.15) | (3.99) | (.29) | (2.22) | (.03) |
| Net asset value, end of period | $63.83 | $76.48 | $66.81 | $53.77 | $54.43 |
| Total ReturnC | (11.68)% | 21.01% | 24.84% | 3.14% | 20.09% |
| Ratios to Average Net AssetsB,D,E | | | | | |
| Expenses before reductions | .71% | .72% | .74% | .76% | .79% |
| Expenses net of fee waivers, if any | .71% | .72% | .74% | .76% | .79% |
| Expenses net of all reductions | .71% | .72% | .74% | .76% | .78% |
| Net investment income (loss) | (.16)% | (.13)% | .19% | .13% | .10% |
| Supplemental Data | | | | | |
| Net assets, end of period (000 omitted) | $2,743,740 | $3,410,787 | $2,546,323 | $1,783,417 | $1,316,804 |
| Portfolio turnover rateF | 33% | 38% | 53%G | 45% | 81% |
A Calculated based on average shares outstanding during the period.
B Net investment income (loss) is affected by the timing of the declaration of dividends by any underlying mutual funds or exchange-traded funds (ETFs). Net investment income (loss) of any such underlying funds is not included in the Fund's net investment income (loss) ratio.
C Total returns would have been lower if certain expenses had not been reduced during the applicable periods shown.
D Fees and expenses of any underlying mutual funds or exchange-traded funds (ETFs) are not included in the Fund's expense ratio. The Fund indirectly bears its proportionate share of these expenses. For additional expense information related to investments in Fidelity Central Funds, please refer to the "Investments in Fidelity Central Funds" note found in the Notes to Financial Statements section of the most recent Annual or Semi-Annual report.
E Expense ratios reflect operating expenses of the class. Expenses before reductions do not reflect amounts reimbursed, waived, or reduced through arrangements with the investment adviser, brokerage services, or other offset arrangements, if applicable, and do not represent the amount paid by the class during periods when reimbursements, waivers or reductions occur.
F Amount does not include the portfolio activity of any underlying mutual funds or exchange-traded funds (ETFs).
G Portfolio turnover rate excludes securities received or delivered in-kind.
See accompanying notes which are an integral part of the financial statements.
Fidelity Advisor Health Care Fund Class Z
| Years ended July 31, | 2022 | 2021 | 2020 | 2019 A |
| Selected Per–Share Data | | | | |
| Net asset value, beginning of period | $76.55 | $66.88 | $53.84 | $57.87 |
| Income from Investment Operations | | | | |
| Net investment income (loss)B,C | (.03) | (.01) | .19 | .13 |
| Net realized and unrealized gain (loss) | (8.38) | 13.77 | 13.22 | (1.94) |
| Total from investment operations | (8.41) | 13.76 | 13.41 | (1.81) |
| Distributions from net investment income | – | (.37) | – | – |
| Distributions from net realized gain | (4.21) | (3.73) | (.37) | (2.22) |
| Total distributions | (4.21) | (4.09)D | (.37) | (2.22) |
| Net asset value, end of period | $63.93 | $76.55 | $66.88 | $53.84 |
| Total ReturnE,F | (11.56)% | 21.15% | 24.98% | (2.86)% |
| Ratios to Average Net AssetsC,G,H | | | | |
| Expenses before reductions | .59% | .60% | .61% | .62%I |
| Expenses net of fee waivers, if any | .59% | .60% | .61% | .62%I |
| Expenses net of all reductions | .59% | .59% | .61% | .62%I |
| Net investment income (loss) | (.04)% | (.01)% | .32% | .30%I |
| Supplemental Data | | | | |
| Net assets, end of period (000 omitted) | $817,321 | $952,460 | $610,481 | $238,873 |
| Portfolio turnover rateJ | 33% | 38% | 53%K | 45% |
A For the period October 2, 2018 (commencement of sale of shares) through July 31, 2019.
B Calculated based on average shares outstanding during the period.
C Net investment income (loss) is affected by the timing of the declaration of dividends by any underlying mutual funds or exchange-traded funds (ETFs). Net investment income (loss) of any such underlying funds is not included in the Fund's net investment income (loss) ratio.
D Total distributions per share do not sum due to rounding.
E Total returns for periods of less than one year are not annualized.
F Total returns would have been lower if certain expenses had not been reduced during the applicable periods shown.
G Fees and expenses of any underlying mutual funds or exchange-traded funds (ETFs) are not included in the Fund's expense ratio. The Fund indirectly bears its proportionate share of these expenses. For additional expense information related to investments in Fidelity Central Funds, please refer to the "Investments in Fidelity Central Funds" note found in the Notes to Financial Statements section of the most recent Annual or Semi-Annual report.
H Expense ratios reflect operating expenses of the class. Expenses before reductions do not reflect amounts reimbursed, waived, or reduced through arrangements with the investment adviser, brokerage services, or other offset arrangements, if applicable, and do not represent the amount paid by the class during periods when reimbursements, waivers or reductions occur.
I Annualized
J Amount does not include the portfolio activity of any underlying mutual funds or exchange-traded funds (ETFs).
K Portfolio turnover rate excludes securities received or delivered in-kind.
See accompanying notes which are an integral part of the financial statements.
Fidelity Advisor® Industrials Fund
Performance: The Bottom Line
Average annual total return reflects the change in the value of an investment, assuming reinvestment of distributions from dividend income and capital gains (the profits earned upon the sale of securities that have grown in value, if any) and assuming a constant rate of performance each year. The hypothetical investment and the average annual total returns do not reflect the deduction of taxes that a shareholder would pay on fund distributions or the redemption of fund shares. During periods of reimbursement by Fidelity, a fund’s total return will be greater than it would be had the reimbursement not occurred. How a fund did yesterday is no guarantee of how it will do tomorrow.
Average Annual Total Returns
| For the periods ended July 31, 2022 | Past 1 year | Past 5 years | Past 10 years |
| Class A (incl. 5.75% sales charge) | (13.09)% | 5.44% | 9.57% |
| Class M (incl. 3.50% sales charge) | (11.25)% | 5.67% | 9.55% |
| Class C (incl. contingent deferred sales charge) | (9.21)% | 5.90% | 9.56% |
| Class I | (7.55)% | 6.98% | 10.52% |
| Class Z | (7.42)% | 7.09% | 10.57% |
Class C shares' contingent deferred sales charges included in the past one year, past five years and past ten years total return figures are 1%, 0% and 0%, respectively.
The initial offering of Class Z shares took place on October 2, 2018. Returns prior to October 2, 2018, are those of Class I.
$10,000 Over 10 Years
Let's say hypothetically that $10,000 was invested in Fidelity Advisor® Industrials Fund - Class A on July 31, 2012, and the current 5.75% sales charge was paid.
The chart shows how the value of your investment would have changed, and also shows how the S&P 500® Index performed over the same period.
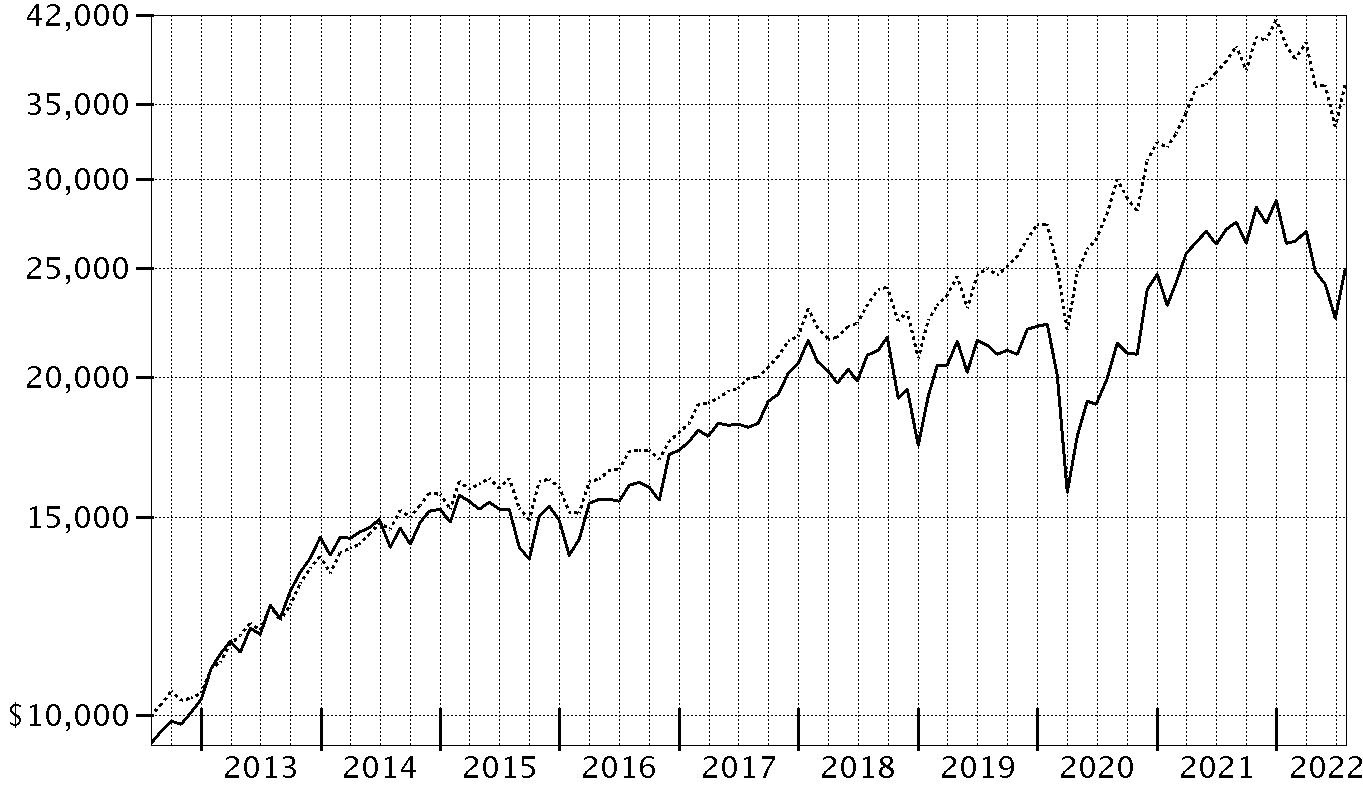
| Period Ending Values |
| $24,943 | Fidelity Advisor® Industrials Fund - Class A |
| $36,428 | S&P 500® Index |
Fidelity Advisor® Industrials Fund
Management's Discussion of Fund Performance
Market Recap: The S&P 500
® index returned -4.64% for the 12 months ending July 31, 2022, as a multitude of crosscurrents challenged the global economy and financial markets. Persistently high inflation, exacerbated by energy price shocks from the Russia–Ukraine conflict, spurred the U.S. Federal Reserve to hike interest rates more aggressively than anticipated, and concerns about the outlook for economic growth sent stocks into bear market territory. In early May, the Fed approved a rare half-percentage-point interest rate increase and announced plans to shrink its $9 trillion asset portfolio. June began with the Fed allowing up to billions in Treasuries and mortgage bonds to mature every month without investing the proceeds. Two weeks later, the central bank raised rates by 0.75 percentage points, its largest increase since 1994, and said it was becoming more difficult to achieve a soft landing, in which the economy slows enough to bring down inflation while avoiding a recession. Against this volatile backdrop, the S&P 500
® posted its worst first-half result (-19.96%) to begin a year since 1970. Stocks sharply reversed course in July (+9.22%), as the Fed again raised its benchmark interest rate by 0.75% but signaled that, at some point, it will likely slow the pace of tightening to assess the impact on the economy. For the full 12 months, growth-oriented communication services (-29%) and consumer discretionary (-10%) stocks lagged most. In contrast, energy (+67%) rode a surge in commodity prices and led by a wide margin, followed by the defensive utilities (+16%) and consumer staples (+7%) sectors.
Comments from Portfolio Manager Janet Glazer: For the fiscal year ending July 31, 2022, the fund's share classes (excluding sales charges, if applicable) returned about -8% to -7%, roughly in line with the -7.21% result of the MSCI US IMI Industrials 25/50 Linked Index, but underperforming the broad-based S&P 500
® index. Versus the sector index, market selection was the primary contributor. Security selection in industrial machinery and an overweighting in aerospace & defense also helped. The biggest individual relative contributor was our outsized stake in WillScot Mobile Mini (+20%), which was a stake we established the past 12 months. Also lifting performance was our overweighting in Howmet Aerospace, which gained 13%. Howmet Aerospace was among our largest holdings. Another notable relative contributor was our overweighting in Regal Rexnord (+171%), a position not held at period end. Conversely, the biggest detractor from performance versus the sector index were stock picks in aerospace & defense. Weak stock selection in research & consulting services and electronic equipment & instruments also hampered the fund's relative result. The fund's biggest individual relative detractor was an outsized stake in Teledyne Technologies, which returned -14% the past year. The company was among the fund’s largest holdings as of July 31. Also hindering performance was an underweighting in Lockheed Martin, which gained about 15%. This was a position we established the past 12 months. Avoiding Northrop Grumman, an index component that gained 34%, also hurt relative performance. Notable changes in positioning include increased exposure to the aerospace & defense subindustry and a lower allocation to industrial conglomerates.
The views expressed above reflect those of the portfolio manager(s) only through the end of the period as stated on the cover of this report and do not necessarily represent the views of Fidelity or any other person in the Fidelity organization. Any such views are subject to change at any time based upon market or other conditions and Fidelity disclaims any responsibility to update such views. These views may not be relied on as investment advice and, because investment decisions for a Fidelity fund are based on numerous factors, may not be relied on as an indication of trading intent on behalf of any Fidelity fund.
Fidelity Advisor® Industrials Fund
Investment Summary (Unaudited)
Top Ten Stocks as of July 31, 2022
| | % of fund's net assets |
| Roper Technologies, Inc. | 12.6 |
| Willscot Mobile Mini Holdings | 6.5 |
| FTI Consulting, Inc. | 5.7 |
| Fortive Corp. | 5.7 |
| AMETEK, Inc. | 5.4 |
| Teledyne Technologies, Inc. | 5.3 |
| Crane Holdings Co. | 4.9 |
| Howmet Aerospace, Inc. | 4.8 |
| Raytheon Technologies Corp. | 4.5 |
| TransDigm Group, Inc. | 4.5 |
| | 59.9 |
Industries (% of fund's net assets)
| As of July 31, 2022 |
| | Aerospace & Defense | 28.8% |
| | Machinery | 19.2% |
| | Software | 12.6% |
| | Construction & Engineering | 9.9% |
| | Electrical Equipment | 6.0% |
| | Professional Services | 5.8% |
| | Electronic Equipment & Components | 5.3% |
| | Road & Rail | 5.2% |
| | Industrial Conglomerates | 4.3% |
| | Commercial Services & Supplies | 2.7% |
| | Building Products | 0.2% |

Fidelity Advisor® Industrials Fund
Schedule of Investments July 31, 2022
Showing Percentage of Net Assets
| Common Stocks - 100.0% | | | |
| | | Shares | Value |
| Aerospace & Defense - 28.8% | | | |
| Aerospace & Defense - 28.8% | | | |
| General Dynamics Corp. | | 16,300 | $3,694,721 |
| HEICO Corp. (a) | | 68,400 | 10,787,364 |
| HEICO Corp. Class A | | 105,300 | 13,444,704 |
| Hexcel Corp. | | 28,600 | 1,730,586 |
| Howmet Aerospace, Inc. | | 613,300 | 22,771,829 |
| Lockheed Martin Corp. | | 31,700 | 13,117,777 |
| Raytheon Technologies Corp. (a) | | 225,900 | 21,056,139 |
| Spirit AeroSystems Holdings, Inc. Class A | | 140,800 | 4,621,056 |
| The Boeing Co. (b) | | 113,900 | 18,145,409 |
| TransDigm Group, Inc. (b) | | 33,814 | 21,043,805 |
| Triumph Group, Inc. (b) | | 334,547 | 5,198,860 |
| | | | 135,612,250 |
| Building Products - 0.2% | | | |
| Building Products - 0.2% | | | |
| Builders FirstSource, Inc. (b) | | 11,500 | 782,000 |
| Commercial Services & Supplies - 2.7% | | | |
| Diversified Support Services - 0.1% | | | |
| Copart, Inc. (b) | | 5,200 | 666,120 |
| Environmental & Facility Services - 2.6% | | | |
| Tetra Tech, Inc. | | 800 | 122,616 |
| Waste Connections, Inc. (United States) | | 90,000 | 12,003,300 |
| | | | 12,125,916 |
|
| TOTAL COMMERCIAL SERVICES & SUPPLIES | | | 12,792,036 |
|
| Construction & Engineering - 9.9% | | | |
| Construction & Engineering - 9.9% | | | |
| AECOM | | 11,700 | 842,400 |
| Quanta Services, Inc. | | 109,000 | 15,121,570 |
| Willscot Mobile Mini Holdings (b) | | 793,400 | 30,633,174 |
| | | | 46,597,144 |
| Electrical Equipment - 6.0% | | | |
| Electrical Components & Equipment - 6.0% | | | |
| Acuity Brands, Inc. | | 4,538 | 827,731 |
| AMETEK, Inc. | | 208,334 | 25,729,249 |
| nVent Electric PLC | | 52,700 | 1,860,837 |
| | | | 28,417,817 |
| Electronic Equipment & Components - 5.3% | | | |
| Electronic Equipment & Instruments - 5.3% | | | |
| Teledyne Technologies, Inc. (b) | | 64,300 | 25,167,020 |
| Industrial Conglomerates - 4.3% | | | |
| Industrial Conglomerates - 4.3% | | | |
| Honeywell International, Inc. | | 104,894 | 20,187,899 |
| Machinery - 19.2% | | | |
| Industrial Machinery - 19.2% | | | |
| Chart Industries, Inc. (a)(b) | | 88,600 | 17,284,974 |
| Crane Holdings Co. | | 230,800 | 22,833,044 |
| Flowserve Corp. (a) | | 450,181 | 15,234,125 |
| Fortive Corp. | | 416,575 | 26,848,259 |
| Ingersoll Rand, Inc. | | 162,300 | 8,082,540 |
| | | | 90,282,942 |
| Professional Services - 5.8% | | | |
| Research & Consulting Services - 5.8% | | | |
| Clarivate Analytics PLC (b) | | 21,800 | 315,882 |
| FTI Consulting, Inc. (a)(b) | | 164,733 | 26,943,729 |
| | | | 27,259,611 |
| Road & Rail - 5.2% | | | |
| Railroads - 4.5% | | | |
| CSX Corp. | | 330,700 | 10,691,531 |
| Norfolk Southern Corp. | | 17,591 | 4,418,331 |
| Union Pacific Corp. | | 26,279 | 5,973,217 |
| | | | 21,083,079 |
| Trucking - 0.7% | | | |
| J.B. Hunt Transport Services, Inc. | | 17,753 | 3,253,592 |
| Old Dominion Freight Lines, Inc. | | 400 | 121,404 |
| | | | 3,374,996 |
|
| TOTAL ROAD & RAIL | | | 24,458,075 |
|
| Software - 12.6% | | | |
| Application Software - 12.6% | | | |
| Roper Technologies, Inc. | | 136,232 | 59,488,429 |
| TOTAL COMMON STOCKS | | | |
| (Cost $426,303,556) | | | 471,045,223 |
|
| Money Market Funds - 13.3% | | | |
| Fidelity Cash Central Fund 2.01% (c) | | 1,335,205 | 1,335,472 |
| Fidelity Securities Lending Cash Central Fund 2.01% (c)(d) | | 61,448,930 | 61,455,075 |
| TOTAL MONEY MARKET FUNDS | | | |
| (Cost $62,790,547) | | | 62,790,547 |
| TOTAL INVESTMENT IN SECURITIES - 113.3% | | | |
| (Cost $489,094,103) | | | 533,835,770 |
| NET OTHER ASSETS (LIABILITIES) - (13.3)% | | | (62,519,100) |
| NET ASSETS - 100% | | | $471,316,670 |
Legend
(a) Security or a portion of the security is on loan at period end.
(b) Non-income producing
(c) Affiliated fund that is generally available only to investment companies and other accounts managed by Fidelity Investments. The rate quoted is the annualized seven-day yield of the fund at period end. A complete unaudited listing of the fund's holdings as of its most recent quarter end is available upon request. In addition, each Fidelity Central Fund's financial statements, which are not covered by the Fund's Report of Independent Registered Public Accounting Firm, are available on the SEC's website or upon request.
(d) Investment made with cash collateral received from securities on loan.
Affiliated Central Funds
Fiscal year to date information regarding the Fund's investments in Fidelity Central Funds, including the ownership percentage, is presented below.
| Fund | Value, beginning of period | Purchases | Sales Proceeds | Dividend Income | Realized Gain/Loss | Change in Unrealized appreciation (depreciation) | Value, end of period | % ownership, end of period |
| Fidelity Cash Central Fund 2.01% | $7,140,324 | $127,201,950 | $133,006,802 | $4,253 | $-- | $-- | $1,335,472 | 0.0% |
| Fidelity Securities Lending Cash Central Fund 2.01% | -- | 196,062,895 | 134,607,820 | 12,308 | -- | -- | 61,455,075 | 0.2% |
| Total | $7,140,324 | $323,264,845 | $267,614,622 | $16,561 | $-- | $-- | $62,790,547 | |
Amounts in the income column in the above table include any capital gain distributions from underlying funds, which are presented in the corresponding line-item in the Statement of Operations, if applicable. Amount for Fidelity Securities Lending Cash Central Fund represents the income earned on investing cash collateral, less rebates paid to borrowers and any lending agent fees associated with the loan, plus any premium payments received for lending certain types of securities.
Investment Valuation
The following is a summary of the inputs used, as of July 31, 2022, involving the Fund's assets and liabilities carried at fair value. The inputs or methodology used for valuing securities may not be an indication of the risk associated with investing in those securities. For more information on valuation inputs, and their aggregation into the levels used below, please refer to the Investment Valuation section in the accompanying Notes to Financial Statements.
| | Valuation Inputs at Reporting Date: |
| Description | Total | Level 1 | Level 2 | Level 3 |
| Investments in Securities: | | | | |
| Common Stocks | $471,045,223 | $471,045,223 | $-- | $-- |
| Money Market Funds | 62,790,547 | 62,790,547 | -- | -- |
| Total Investments in Securities: | $533,835,770 | $533,835,770 | $-- | $-- |
See accompanying notes which are an integral part of the financial statements.
Fidelity Advisor® Industrials Fund
Financial Statements
Statement of Assets and Liabilities
| | | July 31, 2022 |
| Assets | | |
Investment in securities, at value (including securities loaned of $61,963,803) — See accompanying schedule:
Unaffiliated issuers (cost $426,303,556) | $471,045,223 | |
| Fidelity Central Funds (cost $62,790,547) | 62,790,547 | |
| Total Investment in Securities (cost $489,094,103) | | $533,835,770 |
| Receivable for fund shares sold | | 106,753 |
| Dividends receivable | | 30,729 |
| Distributions receivable from Fidelity Central Funds | | 4,361 |
| Prepaid expenses | | 2,757 |
| Total assets | | 533,980,370 |
| Liabilities | | |
| Payable for fund shares redeemed | $802,176 | |
| Accrued management fee | 194,809 | |
| Distribution and service plan fees payable | 90,373 | |
| Other affiliated payables | 79,413 | |
| Other payables and accrued expenses | 41,854 | |
| Collateral on securities loaned | 61,455,075 | |
| Total liabilities | | 62,663,700 |
| Net Assets | | $471,316,670 |
| Net Assets consist of: | | |
| Paid in capital | | $416,914,113 |
| Total accumulated earnings (loss) | | 54,402,557 |
| Net Assets | | $471,316,670 |
| Net Asset Value and Maximum Offering Price | | |
| Class A: | | |
| Net Asset Value and redemption price per share ($214,575,919 ÷ 6,268,715 shares)(a) | | $34.23 |
| Maximum offering price per share (100/94.25 of $34.23) | | $36.32 |
| Class M: | | |
| Net Asset Value and redemption price per share ($49,500,836 ÷ 1,497,657 shares)(a) | | $33.05 |
| Maximum offering price per share (100/96.50 of $33.05) | | $34.25 |
| Class C: | | |
| Net Asset Value and offering price per share ($37,417,299 ÷ 1,302,659 shares)(a) | | $28.72 |
| Class I: | | |
| Net Asset Value, offering price and redemption price per share ($145,848,818 ÷ 3,946,716 shares) | | $36.95 |
| Class Z: | | |
| Net Asset Value, offering price and redemption price per share ($23,973,798 ÷ 649,595 shares) | | $36.91 |
(a) Redemption price per share is equal to net asset value less any applicable contingent deferred sales charge.
See accompanying notes which are an integral part of the financial statements.
Statement of Operations
| | | Year ended July 31, 2022 |
| Investment Income | | |
| Dividends | | $3,907,857 |
| Income from Fidelity Central Funds (including $12,308 from security lending) | | 16,561 |
| Total income | | 3,924,418 |
| Expenses | | |
| Management fee | $3,086,133 | |
| Transfer agent fees | 984,663 | |
| Distribution and service plan fees | 1,341,055 | |
| Accounting fees | 214,882 | |
| Custodian fees and expenses | 17,263 | |
| Independent trustees' fees and expenses | 2,005 | |
| Registration fees | 79,345 | |
| Audit | 48,814 | |
| Legal | 3,749 | |
| Interest | 1,063 | |
| Miscellaneous | 3,307 | |
| Total expenses before reductions | 5,782,279 | |
| Expense reductions | (18,417) | |
| Total expenses after reductions | | 5,763,862 |
| Net investment income (loss) | | (1,839,444) |
| Realized and Unrealized Gain (Loss) | | |
| Net realized gain (loss) on: | | |
| Investment securities: | | |
| Unaffiliated issuers | 43,053,217 | |
| Foreign currency transactions | (4,899) | |
| Total net realized gain (loss) | | 43,048,318 |
| Change in net unrealized appreciation (depreciation) on: | | |
| Investment securities: | | |
| Unaffiliated issuers | (88,564,507) | |
| Assets and liabilities in foreign currencies | (6) | |
| Total change in net unrealized appreciation (depreciation) | | (88,564,513) |
| Net gain (loss) | | (45,516,195) |
| Net increase (decrease) in net assets resulting from operations | | $(47,355,639) |
See accompanying notes which are an integral part of the financial statements.
Statement of Changes in Net Assets
| | Year ended July 31, 2022 | Year ended July 31, 2021 |
| Increase (Decrease) in Net Assets | | |
| Operations | | |
| Net investment income (loss) | $(1,839,444) | $(2,253,821) |
| Net realized gain (loss) | 43,048,318 | 131,391,098 |
| Change in net unrealized appreciation (depreciation) | (88,564,513) | 39,130,944 |
| Net increase (decrease) in net assets resulting from operations | (47,355,639) | 168,268,221 |
| Distributions to shareholders | (121,901,185) | (3,415,748) |
| Share transactions - net increase (decrease) | (34,069,737) | 58,057,679 |
| Total increase (decrease) in net assets | (203,326,561) | 222,910,152 |
| Net Assets | | |
| Beginning of period | 674,643,231 | 451,733,079 |
| End of period | $471,316,670 | $674,643,231 |
See accompanying notes which are an integral part of the financial statements.
Financial Highlights
Fidelity Advisor Industrials Fund Class A
| Years ended July 31, | 2022 | 2021 | 2020 | 2019 | 2018 |
| Selected Per–Share Data | | | | | |
| Net asset value, beginning of period | $45.64 | $33.85 | $38.95 | $42.62 | $37.89 |
| Income from Investment Operations | | | | | |
| Net investment income (loss)A,B | (.14) | (.17) | .18C | .24 | .13 |
| Net realized and unrealized gain (loss) | (2.62) | 12.20 | (2.46) | (.02) | 5.87 |
| Total from investment operations | (2.76) | 12.03 | (2.28) | .22 | 6.00 |
| Distributions from net investment income | – | – | (.25) | (.19) | (.10) |
| Distributions from net realized gain | (8.65) | (.24) | (2.57) | (3.70) | (1.17) |
| Total distributions | (8.65) | (.24) | (2.82) | (3.89) | (1.27) |
| Net asset value, end of period | $34.23 | $45.64 | $33.85 | $38.95 | $42.62 |
| Total ReturnD,E | (7.79)% | 35.63% | (6.58)% | 2.06% | 15.97% |
| Ratios to Average Net AssetsB,F,G | | | | | |
| Expenses before reductions | 1.02% | 1.03% | 1.05% | 1.04% | 1.06% |
| Expenses net of fee waivers, if any | 1.01% | 1.03% | 1.05% | 1.04% | 1.06% |
| Expenses net of all reductions | 1.01% | 1.01% | 1.03% | 1.03% | 1.05% |
| Net investment income (loss) | (.35)% | (.40)% | .49%C | .63% | .32% |
| Supplemental Data | | | | | |
| Net assets, end of period (000 omitted) | $214,576 | $264,130 | $199,835 | $268,483 | $303,201 |
| Portfolio turnover rateH | 106% | 205% | 219%I | 125% | 61% |
A Calculated based on average shares outstanding during the period.
B Net investment income (loss) is affected by the timing of the declaration of dividends by any underlying mutual funds or exchange-traded funds (ETFs). Net investment income (loss) of any such underlying funds is not included in the Fund's net investment income (loss) ratio.
C Net investment income per share reflects one or more large, non-recurring dividend(s) which amounted to $.07 per share. Excluding such non-recurring dividend(s), the ratio of net investment income (loss) to average net assets would have been .29%.
D Total returns would have been lower if certain expenses had not been reduced during the applicable periods shown.
E Total returns do not include the effect of the sales charges.
F Fees and expenses of any underlying mutual funds or exchange-traded funds (ETFs) are not included in the Fund's expense ratio. The Fund indirectly bears its proportionate share of these expenses. For additional expense information related to investments in Fidelity Central Funds, please refer to the "Investments in Fidelity Central Funds" note found in the Notes to Financial Statements section of the most recent Annual or Semi-Annual report.
G Expense ratios reflect operating expenses of the class. Expenses before reductions do not reflect amounts reimbursed, waived, or reduced through arrangements with the investment adviser, brokerage services, or other offset arrangements, if applicable, and do not represent the amount paid by the class during periods when reimbursements, waivers or reductions occur.
H Amount does not include the portfolio activity of any underlying mutual funds or exchange-traded funds (ETFs).
I Portfolio turnover rate excludes securities received or delivered in-kind.
See accompanying notes which are an integral part of the financial statements.
Fidelity Advisor Industrials Fund Class M
| Years ended July 31, | 2022 | 2021 | 2020 | 2019 | 2018 |
| Selected Per–Share Data | | | | | |
| Net asset value, beginning of period | $44.31 | $32.96 | $37.99 | $41.65 | $37.03 |
| Income from Investment Operations | | | | | |
| Net investment income (loss)A,B | (.23) | (.27) | .08C | .14 | .03 |
| Net realized and unrealized gain (loss) | (2.53) | 11.86 | (2.39) | (.03) | 5.74 |
| Total from investment operations | (2.76) | 11.59 | (2.31) | .11 | 5.77 |
| Distributions from net investment income | – | – | (.15) | (.07) | – |
| Distributions from net realized gain | (8.50) | (.24) | (2.57) | (3.70) | (1.15) |
| Total distributions | (8.50) | (.24) | (2.72) | (3.77) | (1.15) |
| Net asset value, end of period | $33.05 | $44.31 | $32.96 | $37.99 | $41.65 |
| Total ReturnD,E | (8.03)% | 35.25% | (6.82)% | 1.78% | 15.70% |
| Ratios to Average Net AssetsB,F,G | | | | | |
| Expenses before reductions | 1.27% | 1.29% | 1.31% | 1.31% | 1.32% |
| Expenses net of fee waivers, if any | 1.27% | 1.29% | 1.31% | 1.30% | 1.32% |
| Expenses net of all reductions | 1.27% | 1.27% | 1.30% | 1.30% | 1.31% |
| Net investment income (loss) | (.60)% | (.66)% | .23%C | .37% | .07% |
| Supplemental Data | | | | | |
| Net assets, end of period (000 omitted) | $49,501 | $56,680 | $45,157 | $61,570 | $72,143 |
| Portfolio turnover rateH | 106% | 205% | 219%I | 125% | 61% |
A Calculated based on average shares outstanding during the period.
B Net investment income (loss) is affected by the timing of the declaration of dividends by any underlying mutual funds or exchange-traded funds (ETFs). Net investment income (loss) of any such underlying funds is not included in the Fund's net investment income (loss) ratio.
C Net investment income per share reflects one or more large, non-recurring dividend(s) which amounted to $.07 per share. Excluding such non-recurring dividend(s), the ratio of net investment income (loss) to average net assets would have been .03%.
D Total returns would have been lower if certain expenses had not been reduced during the applicable periods shown.
E Total returns do not include the effect of the sales charges.
F Fees and expenses of any underlying mutual funds or exchange-traded funds (ETFs) are not included in the Fund's expense ratio. The Fund indirectly bears its proportionate share of these expenses. For additional expense information related to investments in Fidelity Central Funds, please refer to the "Investments in Fidelity Central Funds" note found in the Notes to Financial Statements section of the most recent Annual or Semi-Annual report.
G Expense ratios reflect operating expenses of the class. Expenses before reductions do not reflect amounts reimbursed, waived, or reduced through arrangements with the investment adviser, brokerage services, or other offset arrangements, if applicable, and do not represent the amount paid by the class during periods when reimbursements, waivers or reductions occur.
H Amount does not include the portfolio activity of any underlying mutual funds or exchange-traded funds (ETFs).
I Portfolio turnover rate excludes securities received or delivered in-kind.
See accompanying notes which are an integral part of the financial statements.
Fidelity Advisor Industrials Fund Class C
| Years ended July 31, | 2022 | 2021 | 2020 | 2019 | 2018 |
| Selected Per–Share Data | | | | | |
| Net asset value, beginning of period | $39.46 | $29.52 | $34.27 | $38.09 | $34.09 |
| Income from Investment Operations | | | | | |
| Net investment income (loss)A,B | (.37) | (.41) | (.08)C | (.04) | (.16) |
| Net realized and unrealized gain (loss) | (2.19) | 10.59 | (2.15) | (.08) | 5.28 |
| Total from investment operations | (2.56) | 10.18 | (2.23) | (.12) | 5.12 |
| Distributions from net investment income | – | – | (.03) | – | – |
| Distributions from net realized gain | (8.18) | (.24) | (2.49) | (3.70) | (1.12) |
| Total distributions | (8.18) | (.24) | (2.52) | (3.70) | (1.12) |
| Net asset value, end of period | $28.72 | $39.46 | $29.52 | $34.27 | $38.09 |
| Total ReturnD,E | (8.48)% | 34.58% | (7.27)% | 1.28% | 15.13% |
| Ratios to Average Net AssetsB,F,G | | | | | |
| Expenses before reductions | 1.77% | 1.79% | 1.81% | 1.80% | 1.82% |
| Expenses net of fee waivers, if any | 1.77% | 1.79% | 1.81% | 1.80% | 1.82% |
| Expenses net of all reductions | 1.77% | 1.77% | 1.79% | 1.79% | 1.81% |
| Net investment income (loss) | (1.10)% | (1.16)% | (.26)%C | (.12)% | (.43)% |
| Supplemental Data | | | | | |
| Net assets, end of period (000 omitted) | $37,417 | $55,576 | $53,969 | $90,512 | $138,249 |
| Portfolio turnover rateH | 106% | 205% | 219%I | 125% | 61% |
A Calculated based on average shares outstanding during the period.
B Net investment income (loss) is affected by the timing of the declaration of dividends by any underlying mutual funds or exchange-traded funds (ETFs). Net investment income (loss) of any such underlying funds is not included in the Fund's net investment income (loss) ratio.
C Net investment income per share reflects one or more large, non-recurring dividend(s) which amounted to $.06 per share. Excluding such non-recurring dividend(s), the ratio of net investment income (loss) to average net assets would have been (.46) %.
D Total returns would have been lower if certain expenses had not been reduced during the applicable periods shown.
E Total returns do not include the effect of the contingent deferred sales charge.
F Fees and expenses of any underlying mutual funds or exchange-traded funds (ETFs) are not included in the Fund's expense ratio. The Fund indirectly bears its proportionate share of these expenses. For additional expense information related to investments in Fidelity Central Funds, please refer to the "Investments in Fidelity Central Funds" note found in the Notes to Financial Statements section of the most recent Annual or Semi-Annual report.
G Expense ratios reflect operating expenses of the class. Expenses before reductions do not reflect amounts reimbursed, waived, or reduced through arrangements with the investment adviser, brokerage services, or other offset arrangements, if applicable, and do not represent the amount paid by the class during periods when reimbursements, waivers or reductions occur.
H Amount does not include the portfolio activity of any underlying mutual funds or exchange-traded funds (ETFs).
I Portfolio turnover rate excludes securities received or delivered in-kind.
See accompanying notes which are an integral part of the financial statements.
Fidelity Advisor Industrials Fund Class I
| Years ended July 31, | 2022 | 2021 | 2020 | 2019 | 2018 |
| Selected Per–Share Data | | | | | |
| Net asset value, beginning of period | $48.64 | $35.97 | $41.20 | $44.85 | $39.80 |
| Income from Investment Operations | | | | | |
| Net investment income (loss)A,B | (.03) | (.06) | .29C | .37 | .25 |
| Net realized and unrealized gain (loss) | (2.84) | 12.97 | (2.60) | (.02) | 6.18 |
| Total from investment operations | (2.87) | 12.91 | (2.31) | .35 | 6.43 |
| Distributions from net investment income | – | – | (.35) | (.30) | (.21) |
| Distributions from net realized gain | (8.82) | (.24) | (2.57) | (3.70) | (1.17) |
| Total distributions | (8.82) | (.24) | (2.92) | (4.00) | (1.38) |
| Net asset value, end of period | $36.95 | $48.64 | $35.97 | $41.20 | $44.85 |
| Total ReturnD | (7.55)% | 35.98% | (6.32)% | 2.31% | 16.30% |
| Ratios to Average Net AssetsB,E,F | | | | | |
| Expenses before reductions | .75% | .76% | .78% | .78% | .80% |
| Expenses net of fee waivers, if any | .75% | .76% | .78% | .77% | .80% |
| Expenses net of all reductions | .75% | .74% | .76% | .77% | .79% |
| Net investment income (loss) | (.08)% | (.14)% | .76%C | .90% | .59% |
| Supplemental Data | | | | | |
| Net assets, end of period (000 omitted) | $145,849 | $248,090 | $123,603 | $219,218 | $320,902 |
| Portfolio turnover rateG | 106% | 205% | 219%H | 125% | 61% |
A Calculated based on average shares outstanding during the period.
B Net investment income (loss) is affected by the timing of the declaration of dividends by any underlying mutual funds or exchange-traded funds (ETFs). Net investment income (loss) of any such underlying funds is not included in the Fund's net investment income (loss) ratio.
C Net investment income per share reflects one or more large, non-recurring dividend(s) which amounted to $.08 per share. Excluding such non-recurring dividend(s), the ratio of net investment income (loss) to average net assets would have been .56%.
D Total returns would have been lower if certain expenses had not been reduced during the applicable periods shown.
E Fees and expenses of any underlying mutual funds or exchange-traded funds (ETFs) are not included in the Fund's expense ratio. The Fund indirectly bears its proportionate share of these expenses. For additional expense information related to investments in Fidelity Central Funds, please refer to the "Investments in Fidelity Central Funds" note found in the Notes to Financial Statements section of the most recent Annual or Semi-Annual report.
F Expense ratios reflect operating expenses of the class. Expenses before reductions do not reflect amounts reimbursed, waived, or reduced through arrangements with the investment adviser, brokerage services, or other offset arrangements, if applicable, and do not represent the amount paid by the class during periods when reimbursements, waivers or reductions occur.
G Amount does not include the portfolio activity of any underlying mutual funds or exchange-traded funds (ETFs).
H Portfolio turnover rate excludes securities received or delivered in-kind.
See accompanying notes which are an integral part of the financial statements.
Fidelity Advisor Industrials Fund Class Z
| Years ended July 31, | 2022 | 2021 | 2020 | 2019 A |
| Selected Per–Share Data | | | | |
| Net asset value, beginning of period | $48.61 | $35.90 | $41.15 | $46.84 |
| Income from Investment Operations | | | | |
| Net investment income (loss)B,C | .02 | –D | .34E | .34 |
| Net realized and unrealized gain (loss) | (2.83) | 12.95 | (2.60) | (1.94) |
| Total from investment operations | (2.81) | 12.95 | (2.26) | (1.60) |
| Distributions from net investment income | – | – | (.42) | (.39) |
| Distributions from net realized gain | (8.89) | (.24) | (2.57) | (3.70) |
| Total distributions | (8.89) | (.24) | (2.99) | (4.09) |
| Net asset value, end of period | $36.91 | $48.61 | $35.90 | $41.15 |
| Total ReturnF,G | (7.42)% | 36.16% | (6.21)% | (1.92)% |
| Ratios to Average Net AssetsC,H,I | | | | |
| Expenses before reductions | .63% | .64% | .65% | .64%J |
| Expenses net of fee waivers, if any | .62% | .64% | .65% | .64%J |
| Expenses net of all reductions | .62% | .62% | .63% | .64%J |
| Net investment income (loss) | .04% | (.01)% | .89%E | 1.04%J |
| Supplemental Data | | | | |
| Net assets, end of period (000 omitted) | $23,974 | $50,167 | $29,168 | $11,077 |
| Portfolio turnover rateK | 106% | 205% | 219%L | 125% |
A For the period October 2, 2018 (commencement of sale of shares) through July 31, 2019.
B Calculated based on average shares outstanding during the period.
C Net investment income (loss) is affected by the timing of the declaration of dividends by any underlying mutual funds or exchange-traded funds (ETFs). Net investment income (loss) of any such underlying funds is not included in the Fund's net investment income (loss) ratio.
D Amount represents less than $.005 per share.
E Net investment income per share reflects one or more large, non-recurring dividend(s) which amounted to $.08 per share. Excluding such non-recurring dividend(s), the ratio of net investment income (loss) to average net assets would have been .69%.
F Total returns for periods of less than one year are not annualized.
G Total returns would have been lower if certain expenses had not been reduced during the applicable periods shown.
H Fees and expenses of any underlying mutual funds or exchange-traded funds (ETFs) are not included in the Fund's expense ratio. The Fund indirectly bears its proportionate share of these expenses. For additional expense information related to investments in Fidelity Central Funds, please refer to the "Investments in Fidelity Central Funds" note found in the Notes to Financial Statements section of the most recent Annual or Semi-Annual report.
I Expense ratios reflect operating expenses of the class. Expenses before reductions do not reflect amounts reimbursed, waived, or reduced through arrangements with the investment adviser, brokerage services, or other offset arrangements, if applicable, and do not represent the amount paid by the class during periods when reimbursements, waivers or reductions occur.
J Annualized
K Amount does not include the portfolio activity of any underlying mutual funds or exchange-traded funds (ETFs).
L Portfolio turnover rate excludes securities received or delivered in-kind.
See accompanying notes which are an integral part of the financial statements.
Fidelity Advisor® Semiconductors Fund
Performance: The Bottom Line
Average annual total return reflects the change in the value of an investment, assuming reinvestment of distributions from dividend income and capital gains (the profits earned upon the sale of securities that have grown in value, if any) and assuming a constant rate of performance each year. The hypothetical investment and the average annual total returns do not reflect the deduction of taxes that a shareholder would pay on fund distributions or the redemption of fund shares. During periods of reimbursement by Fidelity, a fund’s total return will be greater than it would be had the reimbursement not occurred. How a fund did yesterday is no guarantee of how it will do tomorrow.
Average Annual Total Returns
| For the periods ended July 31, 2022 | Past 1 year | Past 5 years | Past 10 years |
| Class A (incl. 5.75% sales charge) | (8.77)% | 22.13% | 22.82% |
| Class M (incl. 3.50% sales charge) | (6.81)% | 22.36% | 22.74% |
| Class C (incl. contingent deferred sales charge) | (4.84)% | 22.65% | 22.81% |
| Class I | (2.96)% | 23.93% | 23.89% |
| Class Z | (2.83)% | 24.05% | 23.95% |
Class C shares' contingent deferred sales charges included in the past one year, past five years and past ten years total return figures are 1%, 0% and 0%, respectively.
The initial offering of Class Z shares took place on October 2, 2018. Returns prior to October 2, 2018, are those of Class I.
$10,000 Over 10 Years
Let's say hypothetically that $10,000 was invested in Fidelity Advisor® Semiconductors Fund - Class A on July 31, 2012, and the current 5.75% sales charge was paid.
The chart shows how the value of your investment would have changed, and also shows how the S&P 500® Index performed over the same period.
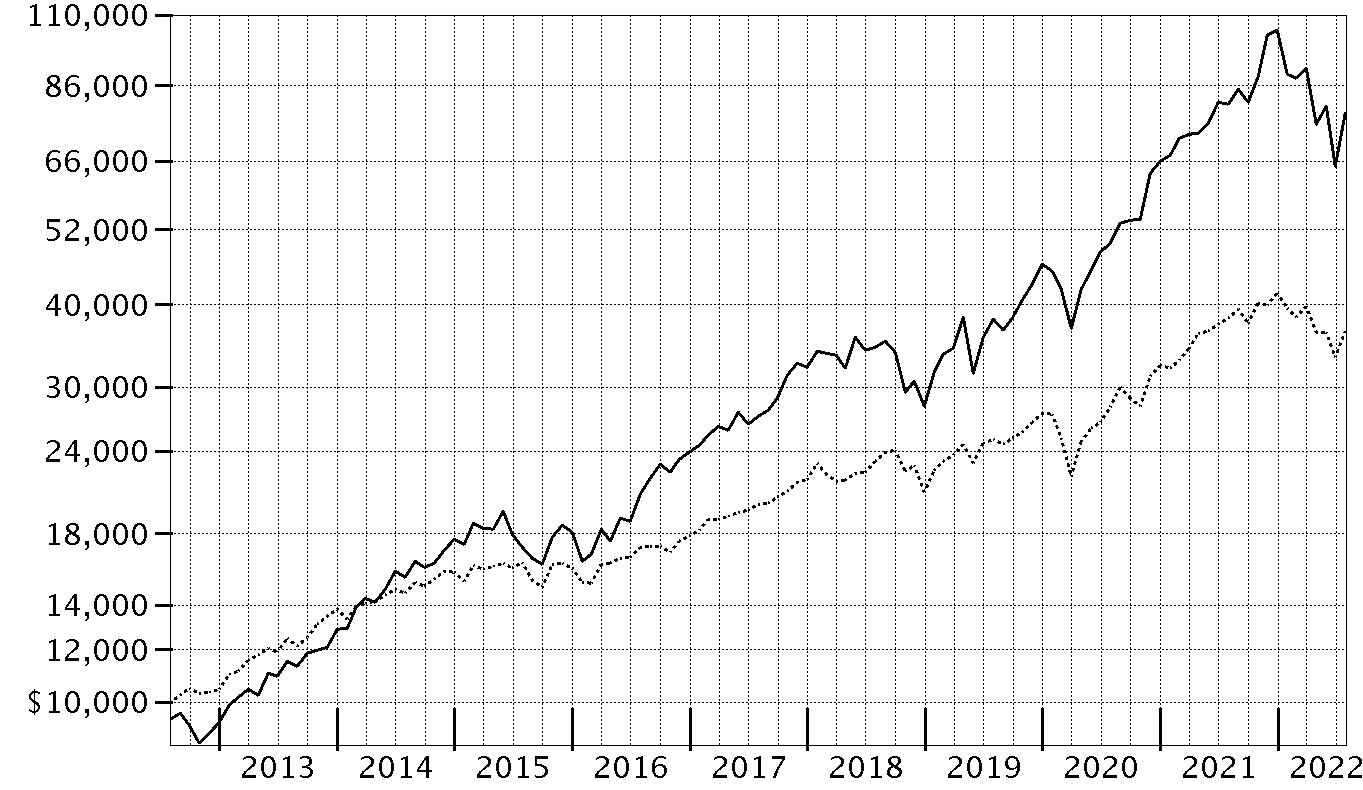
| Period Ending Values |
| $78,079 | Fidelity Advisor® Semiconductors Fund - Class A |
| $36,428 | S&P 500® Index |
Fidelity Advisor® Semiconductors Fund
Management's Discussion of Fund Performance
Market Recap: The S&P 500
® index returned -4.64% for the 12 months ending July 31, 2022, as a multitude of crosscurrents challenged the global economy and financial markets. Persistently high inflation, exacerbated by energy price shocks from the Russia–Ukraine conflict, spurred the U.S. Federal Reserve to hike interest rates more aggressively than anticipated, and concerns about the outlook for economic growth sent stocks into bear market territory. In early May, the Fed approved a rare half-percentage-point interest rate increase and announced plans to shrink its $9 trillion asset portfolio. June began with the Fed allowing up to billions in Treasuries and mortgage bonds to mature every month without investing the proceeds. Two weeks later, the central bank raised rates by 0.75 percentage points, its largest increase since 1994, and said it was becoming more difficult to achieve a soft landing, in which the economy slows enough to bring down inflation while avoiding a recession. Against this volatile backdrop, the S&P 500
® posted its worst first-half result (-19.96%) to begin a year since 1970. Stocks sharply reversed course in July (+9.22%), as the Fed again raised its benchmark interest rate by 0.75% but signaled that, at some point, it will likely slow the pace of tightening to assess the impact on the economy. For the full 12 months, growth-oriented communication services (-29%) and consumer discretionary (-10%) stocks lagged most. In contrast, energy (+67%) rode a surge in commodity prices and led by a wide margin, followed by the defensive utilities (+16%) and consumer staples (+7%) sectors.
Comments from Portfolio Manager Adam Benjamin: For the fiscal year ending July 31, 2022, the fund's share classes (excluding sales charges, if applicable) returned about -4% to -3%, outperforming the -5.06% result of the MSCI U.S. IMI Semiconductors & Semiconductor Equipment 25/50 Index, as well as the broad-based S&P 500
® index. Versus the industry index, security selection was the fund's primary contributor to performance, especially in the semiconductors industry. Out-of-benchmark exposure to the application software segment also helped. The fund's top individual relative contributor was an outsized stake in ON Semiconductor, which gained 70% the past year. The company was among our largest holdings. Also adding value was our lighter-than-index stake in index heavyweight Intel, which returned approximately -30%. Intel was not held at period end. The fund's non-index stake in Cadence Design Systems, one of our biggest holdings at period end, gained roughly 26%. Conversely, the largest detractors from performance versus the industry index were stock selection and an underweighting in semiconductor equipment. Modest non-index stakes in technology hardware, storage & peripherals and electronic equipment & instruments also hampered the fund's relative performance. The fund's largest individual relative detractor was an underweighting in Enphase Energy, which gained 50% the past 12 months. We decreased our position this period. Also hindering performance was our lighter-than-index stake in Broadcom, which gained about 14%. Still, the company was among our biggest holdings. Also hurting performance was an underweighting in First Solar, which gained roughly 15%. First Solar was not held at period end. Notable changes in positioning include reduced exposure to the semiconductor equipment industry.
The views expressed above reflect those of the portfolio manager(s) only through the end of the period as stated on the cover of this report and do not necessarily represent the views of Fidelity or any other person in the Fidelity organization. Any such views are subject to change at any time based upon market or other conditions and Fidelity disclaims any responsibility to update such views. These views may not be relied on as investment advice and, because investment decisions for a Fidelity fund are based on numerous factors, may not be relied on as an indication of trading intent on behalf of any Fidelity fund.
Fidelity Advisor® Semiconductors Fund
Investment Summary (Unaudited)
Top Ten Stocks as of July 31, 2022
| | % of fund's net assets |
| NVIDIA Corp. | 21.1 |
| NXP Semiconductors NV | 9.2 |
| Marvell Technology, Inc. | 8.7 |
| onsemi | 6.2 |
| Advanced Micro Devices, Inc. | 5.3 |
| Microchip Technology, Inc. | 4.6 |
| Broadcom, Inc. | 4.2 |
| GlobalFoundries, Inc. | 4.0 |
| Teradyne, Inc. | 3.7 |
| Cadence Design Systems, Inc. | 3.5 |
| | 70.5 |
Industries (% of fund's net assets)
| As of July 31, 2022 |
| | Semiconductors & Semiconductor Equipment | 91.1% |
| | Software | 3.5% |
| | Electronic Equipment & Components | 1.4% |
| | Technology Hardware, Storage & Peripherals | 0.3% |
| | Electrical Equipment | 0.2% |
| | Metals & Mining | 0.1% |
| | All Others* | 3.4% |

* Includes Short-Term investments and Net Other Assets (Liabilities).
Geographic Diversification (% of fund's net assets)
| As of July 31, 2022 |
| | United States of America* | 81.2% |
| | Netherlands | 9.2% |
| | Cayman Islands | 4.0% |
| | Taiwan | 2.8% |
| | Israel | 1.6% |
| | Singapore | 0.4% |
| | Korea (South) | 0.3% |
| | Canada | 0.3% |
| | Bermuda | 0.2% |

* Includes Short-Term investments and Net Other Assets (Liabilities).
Percentages are based on country or territory of incorporation and are adjusted for the effect of futures contracts, if applicable.
Fidelity Advisor® Semiconductors Fund
Schedule of Investments July 31, 2022
Showing Percentage of Net Assets
| Common Stocks - 95.9% | | | |
| | | Shares | Value |
| Electrical Equipment - 0.2% | | | |
| Electrical Components & Equipment - 0.2% | | | |
| Array Technologies, Inc. (a) | | 94,900 | $1,599,065 |
| Electronic Equipment & Components - 1.4% | | | |
| Electronic Equipment & Instruments - 0.0% | | | |
| Aeva Technologies, Inc. (a)(b) | | 118,100 | 416,893 |
| Electronic Manufacturing Services - 1.4% | | | |
| Flex Ltd. (a) | | 169,827 | 2,853,094 |
| Jabil, Inc. | | 140,276 | 8,323,978 |
| | | | 11,177,072 |
|
| TOTAL ELECTRONIC EQUIPMENT & COMPONENTS | | | 11,593,965 |
|
| Semiconductors & Semiconductor Equipment - 90.5% | | | |
| Semiconductor Equipment - 9.2% | | | |
| Applied Materials, Inc. | | 21,400 | 2,267,972 |
| Enphase Energy, Inc. (a) | | 3,500 | 994,630 |
| KLA Corp. | | 24,300 | 9,320,022 |
| Lam Research Corp. | | 39,346 | 19,693,066 |
| Nova Ltd. (a)(b) | | 122,932 | 12,950,886 |
| Teradyne, Inc. | | 297,700 | 30,034,953 |
| | | | 75,261,529 |
| Semiconductors - 81.3% | | | |
| Advanced Micro Devices, Inc. (a) | | 454,774 | 42,962,500 |
| Allegro MicroSystems LLC (a) | | 276,200 | 6,858,046 |
| Alpha & Omega Semiconductor Ltd. (a) | | 44,500 | 1,869,445 |
| Analog Devices, Inc. | | 160,306 | 27,566,220 |
| ASE Technology Holding Co. Ltd. ADR (b) | | 119,500 | 703,855 |
| Broadcom, Inc. | | 63,225 | 33,855,723 |
| Cirrus Logic, Inc. (a) | | 118,028 | 10,086,673 |
| Diodes, Inc. (a) | | 87,100 | 7,087,327 |
| GlobalFoundries, Inc. (b) | | 634,600 | 32,669,208 |
| Lattice Semiconductor Corp. (a) | | 27,500 | 1,691,250 |
| MACOM Technology Solutions Holdings, Inc. (a) | | 176,800 | 10,243,792 |
| Marvell Technology, Inc. | | 1,276,633 | 71,082,925 |
| MaxLinear, Inc. Class A (a) | | 189,449 | 7,655,634 |
| Microchip Technology, Inc. | | 540,809 | 37,240,108 |
| Monolithic Power Systems, Inc. | | 22,600 | 10,502,672 |
| NVIDIA Corp. | | 943,927 | 171,445,457 |
| NXP Semiconductors NV | | 408,012 | 75,025,247 |
| onsemi (a) | | 758,836 | 50,675,068 |
| Qualcomm, Inc. | | 101,926 | 14,785,386 |
| Skyworks Solutions, Inc. | | 22,000 | 2,395,360 |
| SMART Global Holdings, Inc. (a) | | 86,800 | 1,703,016 |
| Synaptics, Inc. (a) | | 63,900 | 9,262,305 |
| Taiwan Semiconductor Manufacturing Co. Ltd. sponsored ADR | | 247,500 | 21,898,800 |
| Texas Instruments, Inc. | | 44,422 | 7,946,652 |
| Wolfspeed, Inc. (a)(b) | | 51,800 | 4,314,940 |
| | | | 661,527,609 |
|
| TOTAL SEMICONDUCTORS & SEMICONDUCTOR EQUIPMENT | | | 736,789,138 |
|
| Software - 3.5% | | | |
| Application Software - 3.5% | | | |
| Cadence Design Systems, Inc. (a) | | 150,700 | 28,042,256 |
| Technology Hardware, Storage & Peripherals - 0.3% | | | |
| Technology Hardware, Storage & Peripherals - 0.3% | | | |
| IonQ, Inc. (a)(c) | | 15,000 | 81,000 |
| Samsung Electronics Co. Ltd. | | 57,100 | 2,692,723 |
| | | | 2,773,723 |
| TOTAL COMMON STOCKS | | | |
| (Cost $572,913,248) | | | 780,798,147 |
|
| Convertible Preferred Stocks - 0.5% | | | |
| Electronic Equipment & Components - 0.0% | | | |
| Electronic Components - 0.0% | | | |
| Menlo Micro, Inc. Series C (c)(d) | | 79,800 | 83,990 |
| Metals & Mining - 0.1% | | | |
| Precious Metals & Minerals - 0.1% | | | |
| Diamond Foundry, Inc. Series C (a)(c)(d) | | 18,335 | 570,952 |
| Semiconductors & Semiconductor Equipment - 0.4% | | | |
| Semiconductor Equipment - 0.2% | | | |
| Astera Labs, Inc.: | | | |
| Series A (c)(d) | | 30,452 | 309,682 |
| Series B (c)(d) | | 5,185 | 52,729 |
| Series C (c)(d) | | 19,433 | 197,624 |
| Series D (c)(d) | | 123,852 | 1,259,513 |
| | | | 1,819,548 |
| Semiconductors - 0.2% | | | |
| Alif Semiconductor Series C (c)(d) | | 48,363 | 981,698 |
| GaN Systems, Inc.: | | | |
| Series F1 (c)(d) | | 52,877 | 354,805 |
| Series F2 (c)(d) | | 27,921 | 187,350 |
| SiMa.ai: | | | |
| Series B (a)(c)(d) | | 30,638 | 217,251 |
| Series B1 (c)(d) | | 2,052 | 14,551 |
| | | | 1,755,655 |
|
| TOTAL SEMICONDUCTORS & SEMICONDUCTOR EQUIPMENT | | | 3,575,203 |
|
| Software - 0.0% | | | |
| Systems Software - 0.0% | | | |
| Tenstorrent, Inc. Series C1 (a)(c)(d) | | 900 | 50,652 |
| TOTAL CONVERTIBLE PREFERRED STOCKS | | | |
| (Cost $4,125,087) | | | 4,280,797 |
|
| Preferred Securities - 0.2% | | | |
| Semiconductors & Semiconductor Equipment - 0.2% | | | |
| Semiconductors - 0.2% | | | |
| GaN Systems, Inc. 0% (c)(d)(e) | | 1,239,360 | 1,239,360 |
| Software - 0.0% | | | |
| Systems Software - 0.0% | | | |
| Tenstorrent, Inc. 0% (c)(d)(e) | | 50,000 | 50,000 |
| TOTAL PREFERRED SECURITIES | | | |
| (Cost $1,289,360) | | | 1,289,360 |
|
| Money Market Funds - 8.3% | | | |
| Fidelity Cash Central Fund 2.01% (f) | | 23,989,288 | 23,994,086 |
| Fidelity Securities Lending Cash Central Fund 2.01% (f)(g) | | 43,549,970 | 43,554,325 |
| TOTAL MONEY MARKET FUNDS | | | |
| (Cost $67,548,411) | | | 67,548,411 |
| TOTAL INVESTMENT IN SECURITIES - 104.9% | | | |
| (Cost $645,876,106) | | | 853,916,715 |
| NET OTHER ASSETS (LIABILITIES) - (4.9)% | | | (39,767,884) |
| NET ASSETS - 100% | | | $814,148,831 |
Legend
(a) Non-income producing
(b) Security or a portion of the security is on loan at period end.
(c) Restricted securities (including private placements) - Investment in securities not registered under the Securities Act of 1933 (excluding 144A issues). At the end of the period, the value of restricted securities (excluding 144A issues) amounted to $5,651,157 or 0.7% of net assets.
(d) Level 3 security
(e) Security is perpetual in nature with no stated maturity date.
(f) Affiliated fund that is generally available only to investment companies and other accounts managed by Fidelity Investments. The rate quoted is the annualized seven-day yield of the fund at period end. A complete unaudited listing of the fund's holdings as of its most recent quarter end is available upon request. In addition, each Fidelity Central Fund's financial statements, which are not covered by the Fund's Report of Independent Registered Public Accounting Firm, are available on the SEC's website or upon request.
(g) Investment made with cash collateral received from securities on loan.
Additional information on each restricted holding is as follows:
| Security | Acquisition Date | Acquisition Cost |
| Alif Semiconductor Series C | 3/8/22 | $981,698 |
| Astera Labs, Inc. Series A | 5/17/22 | $309,682 |
| Astera Labs, Inc. Series B | 5/17/22 | $52,729 |
| Astera Labs, Inc. Series C | 8/24/21 | $65,330 |
| Astera Labs, Inc. Series D | 5/17/22 - 5/27/22 | $1,259,513 |
| Diamond Foundry, Inc. Series C | 3/15/21 | $440,040 |
| GaN Systems, Inc. Series F1 | 11/30/21 | $448,397 |
| GaN Systems, Inc. Series F2 | 11/30/21 | $236,770 |
| GaN Systems, Inc. 0% | 11/30/21 | $1,239,360 |
| IonQ, Inc. | 3/7/21 | $150,000 |
| Menlo Micro, Inc. Series C | 2/9/22 | $105,775 |
| SiMa.ai Series B | 5/10/21 | $157,093 |
| SiMa.ai Series B1 | 4/25/22 | $14,551 |
| Tenstorrent, Inc. Series C1 | 4/23/21 | $53,509 |
| Tenstorrent, Inc. 0% | 4/23/21 | $50,000 |
Affiliated Central Funds
Fiscal year to date information regarding the Fund's investments in Fidelity Central Funds, including the ownership percentage, is presented below.
| Fund | Value, beginning of period | Purchases | Sales Proceeds | Dividend Income | Realized Gain/Loss | Change in Unrealized appreciation (depreciation) | Value, end of period | % ownership, end of period |
| Fidelity Cash Central Fund 2.01% | $17,931,298 | $252,744,967 | $246,682,179 | $44,613 | $-- | $-- | $23,994,086 | 0.0% |
| Fidelity Securities Lending Cash Central Fund 2.01% | 159,300 | 217,024,752 | 173,629,727 | 53,867 | -- | -- | 43,554,325 | 0.1% |
| Total | $18,090,598 | $469,769,719 | $420,311,906 | $98,480 | $-- | $-- | $67,548,411 | |
Amounts in the income column in the above table include any capital gain distributions from underlying funds, which are presented in the corresponding line-item in the Statement of Operations, if applicable. Amount for Fidelity Securities Lending Cash Central Fund represents the income earned on investing cash collateral, less rebates paid to borrowers and any lending agent fees associated with the loan, plus any premium payments received for lending certain types of securities.
Investment Valuation
The following is a summary of the inputs used, as of July 31, 2022, involving the Fund's assets and liabilities carried at fair value. The inputs or methodology used for valuing securities may not be an indication of the risk associated with investing in those securities. For more information on valuation inputs, and their aggregation into the levels used below, please refer to the Investment Valuation section in the accompanying Notes to Financial Statements.
| | Valuation Inputs at Reporting Date: |
| Description | Total | Level 1 | Level 2 | Level 3 |
| Investments in Securities: | | | | |
| Common Stocks | $780,798,147 | $778,105,424 | $2,692,723 | $-- |
| Convertible Preferred Stocks | 4,280,797 | -- | -- | 4,280,797 |
| Preferred Securities | 1,289,360 | -- | -- | 1,289,360 |
| Money Market Funds | 67,548,411 | 67,548,411 | -- | -- |
| Total Investments in Securities: | $853,916,715 | $845,653,835 | $2,692,723 | $5,570,157 |
See accompanying notes which are an integral part of the financial statements.
Fidelity Advisor® Semiconductors Fund
Financial Statements
Statement of Assets and Liabilities
| | | July 31, 2022 |
| Assets | | |
Investment in securities, at value (including securities loaned of $45,051,087) — See accompanying schedule:
Unaffiliated issuers (cost $578,327,695) | $786,368,304 | |
| Fidelity Central Funds (cost $67,548,411) | 67,548,411 | |
| Total Investment in Securities (cost $645,876,106) | | $853,916,715 |
| Foreign currency held at value (cost $36,573) | | 34,693 |
| Receivable for investments sold | | 3,180,308 |
| Receivable for fund shares sold | | 1,828,515 |
| Dividends receivable | | 108,964 |
| Distributions receivable from Fidelity Central Funds | | 32,233 |
| Prepaid expenses | | 845 |
| Other receivables | | 36 |
| Total assets | | 859,102,309 |
| Liabilities | | |
| Payable for fund shares redeemed | $764,146 | |
| Accrued management fee | 314,835 | |
| Distribution and service plan fees payable | 142,435 | |
| Other affiliated payables | 123,753 | |
| Other payables and accrued expenses | 53,984 | |
| Collateral on securities loaned | 43,554,325 | |
| Total liabilities | | 44,953,478 |
| Net Assets | | $814,148,831 |
| Net Assets consist of: | | |
| Paid in capital | | $587,283,935 |
| Total accumulated earnings (loss) | | 226,864,896 |
| Net Assets | | $814,148,831 |
| Net Asset Value and Maximum Offering Price | | |
| Class A: | | |
| Net Asset Value and redemption price per share ($319,402,311 ÷ 7,453,968 shares)(a) | | $42.85 |
| Maximum offering price per share (100/94.25 of $42.85) | | $45.46 |
| Class M: | | |
| Net Asset Value and redemption price per share ($48,499,251 ÷ 1,202,222 shares)(a) | | $40.34 |
| Maximum offering price per share (100/96.50 of $40.34) | | $41.80 |
| Class C: | | |
| Net Asset Value and offering price per share ($88,591,840 ÷ 2,513,999 shares)(a) | | $35.24 |
| Class I: | | |
| Net Asset Value, offering price and redemption price per share ($309,873,066 ÷ 6,746,280 shares) | | $45.93 |
| Class Z: | | |
| Net Asset Value, offering price and redemption price per share ($47,782,363 ÷ 1,040,345 shares) | | $45.93 |
(a) Redemption price per share is equal to net asset value less any applicable contingent deferred sales charge.
See accompanying notes which are an integral part of the financial statements.
Statement of Operations
| | | Year ended July 31, 2022 |
| Investment Income | | |
| Dividends | | $6,091,733 |
| Interest | | 4,074 |
| Income from Fidelity Central Funds (including $53,867 from security lending) | | 98,480 |
| Total income | | 6,194,287 |
| Expenses | | |
| Management fee | $4,445,895 | |
| Transfer agent fees | 1,392,031 | |
| Distribution and service plan fees | 2,068,002 | |
| Accounting fees | 285,636 | |
| Custodian fees and expenses | 15,381 | |
| Independent trustees' fees and expenses | 2,720 | |
| Registration fees | 137,824 | |
| Audit | 48,075 | |
| Legal | 1,698 | |
| Miscellaneous | 2,777 | |
| Total expenses before reductions | 8,400,039 | |
| Expense reductions | (27,537) | |
| Total expenses after reductions | | 8,372,502 |
| Net investment income (loss) | | (2,178,215) |
| Realized and Unrealized Gain (Loss) | | |
| Net realized gain (loss) on: | | |
| Investment securities: | | |
| Unaffiliated issuers | 35,716,363 | |
| Foreign currency transactions | (13,146) | |
| Total net realized gain (loss) | | 35,703,217 |
| Change in net unrealized appreciation (depreciation) on: | | |
| Investment securities: | | |
| Unaffiliated issuers | (87,740,274) | |
| Unfunded commitments | 16,080 | |
| Assets and liabilities in foreign currencies | (430) | |
| Total change in net unrealized appreciation (depreciation) | | (87,724,624) |
| Net gain (loss) | | (52,021,407) |
| Net increase (decrease) in net assets resulting from operations | | $(54,199,622) |
See accompanying notes which are an integral part of the financial statements.
Statement of Changes in Net Assets
| | Year ended July 31, 2022 | Year ended July 31, 2021 |
| Increase (Decrease) in Net Assets | | |
| Operations | | |
| Net investment income (loss) | $(2,178,215) | $(1,163,580) |
| Net realized gain (loss) | 35,703,217 | 48,436,327 |
| Change in net unrealized appreciation (depreciation) | (87,724,624) | 185,045,770 |
| Net increase (decrease) in net assets resulting from operations | (54,199,622) | 232,318,517 |
| Distributions to shareholders | (43,908,446) | (20,932,303) |
| Share transactions - net increase (decrease) | 211,964,262 | 127,672,949 |
| Total increase (decrease) in net assets | 113,856,194 | 339,059,163 |
| Net Assets | | |
| Beginning of period | 700,292,637 | 361,233,474 |
| End of period | $814,148,831 | $700,292,637 |
See accompanying notes which are an integral part of the financial statements.
Financial Highlights
Fidelity Advisor Semiconductors Fund Class A
| Years ended July 31, | 2022 | 2021 | 2020 | 2019 | 2018 |
| Selected Per–Share Data | | | | | |
| Net asset value, beginning of period | $46.29 | $29.79 | $23.03 | $25.06 | $21.57 |
| Income from Investment Operations | | | | | |
| Net investment income (loss)A,B | (.13) | (.08) | .14 | .15 | .02 |
| Net realized and unrealized gain (loss) | (.83) | 18.29 | 6.90 | 1.25 | 5.73 |
| Total from investment operations | (.96) | 18.21 | 7.04 | 1.40 | 5.75 |
| Distributions from net investment income | – | (.04) | (.07) | (.10) | (.05)C |
| Distributions from net realized gain | (2.48) | (1.67) | (.20) | (3.33) | (2.21)C |
| Total distributions | (2.48) | (1.71) | (.28)D | (3.43) | (2.26) |
| Redemption fees added to paid in capitalA | – | – | – | – | –E |
| Net asset value, end of period | $42.85 | $46.29 | $29.79 | $23.03 | $25.06 |
| Total ReturnF,G | (3.21)% | 62.45% | 30.65% | 10.18% | 27.35% |
| Ratios to Average Net AssetsB,H,I | | | | | |
| Expenses before reductions | 1.01% | 1.04% | 1.10% | 1.12% | 1.15% |
| Expenses net of fee waivers, if any | 1.01% | 1.04% | 1.09% | 1.11% | 1.15% |
| Expenses net of all reductions | 1.01% | 1.03% | 1.08% | 1.11% | 1.13% |
| Net investment income (loss) | (.27)% | (.21)% | .53% | .70% | .09% |
| Supplemental Data | | | | | |
| Net assets, end of period (000 omitted) | $319,402 | $279,755 | $140,072 | $98,459 | $97,883 |
| Portfolio turnover rateJ | 32% | 41% | 136% | 110% | 133% |
A Calculated based on average shares outstanding during the period.
B Net investment income (loss) is affected by the timing of the declaration of dividends by any underlying mutual funds or exchange-traded funds (ETFs). Net investment income (loss) of any such underlying funds is not included in the Fund's net investment income (loss) ratio.
C The amount shown reflects reclassifications related to book to tax differences that were made in the year shown.
D Total distributions per share do not sum due to rounding.
E Amount represents less than $.005 per share.
F Total returns would have been lower if certain expenses had not been reduced during the applicable periods shown.
G Total returns do not include the effect of the sales charges.
H Fees and expenses of any underlying mutual funds or exchange-traded funds (ETFs) are not included in the Fund's expense ratio. The Fund indirectly bears its proportionate share of these expenses. For additional expense information related to investments in Fidelity Central Funds, please refer to the "Investments in Fidelity Central Funds" note found in the Notes to Financial Statements section of the most recent Annual or Semi-Annual report.
I Expense ratios reflect operating expenses of the class. Expenses before reductions do not reflect amounts reimbursed, waived, or reduced through arrangements with the investment adviser, brokerage services, or other offset arrangements, if applicable, and do not represent the amount paid by the class during periods when reimbursements, waivers or reductions occur.
J Amount does not include the portfolio activity of any underlying mutual funds or exchange-traded funds (ETFs).
See accompanying notes which are an integral part of the financial statements.
Fidelity Advisor Semiconductors Fund Class M
| Years ended July 31, | 2022 | 2021 | 2020 | 2019 | 2018 |
| Selected Per–Share Data | | | | | |
| Net asset value, beginning of period | $43.75 | $28.25 | $21.89 | $24.04 | $20.77 |
| Income from Investment Operations | | | | | |
| Net investment income (loss)A,B | (.23) | (.17) | .06 | .08 | (.05) |
| Net realized and unrealized gain (loss) | (.76) | 17.31 | 6.55 | 1.16 | 5.50 |
| Total from investment operations | (.99) | 17.14 | 6.61 | 1.24 | 5.45 |
| Distributions from net investment income | – | – | (.05) | (.06) | –C |
| Distributions from net realized gain | (2.42) | (1.64) | (.20) | (3.33) | (2.18)C |
| Total distributions | (2.42) | (1.64) | (.25) | (3.39) | (2.18) |
| Redemption fees added to paid in capitalA | – | – | – | – | –D |
| Net asset value, end of period | $40.34 | $43.75 | $28.25 | $21.89 | $24.04 |
| Total ReturnE,F | (3.43)% | 61.98% | 30.28% | 9.84% | 26.95% |
| Ratios to Average Net AssetsB,G,H | | | | | |
| Expenses before reductions | 1.26% | 1.30% | 1.38% | 1.44% | 1.48% |
| Expenses net of fee waivers, if any | 1.25% | 1.30% | 1.38% | 1.43% | 1.47% |
| Expenses net of all reductions | 1.25% | 1.29% | 1.37% | 1.43% | 1.46% |
| Net investment income (loss) | (.52)% | (.47)% | .24% | .38% | (.23)% |
| Supplemental Data | | | | | |
| Net assets, end of period (000 omitted) | $48,499 | $49,963 | $29,262 | $22,587 | $21,830 |
| Portfolio turnover rateI | 32% | 41% | 136% | 110% | 133% |
A Calculated based on average shares outstanding during the period.
B Net investment income (loss) is affected by the timing of the declaration of dividends by any underlying mutual funds or exchange-traded funds (ETFs). Net investment income (loss) of any such underlying funds is not included in the Fund's net investment income (loss) ratio.
C The amount shown reflects reclassifications related to book to tax differences that were made in the year shown.
D Amount represents less than $.005 per share.
E Total returns would have been lower if certain expenses had not been reduced during the applicable periods shown.
F Total returns do not include the effect of the sales charges.
G Fees and expenses of any underlying mutual funds or exchange-traded funds (ETFs) are not included in the Fund's expense ratio. The Fund indirectly bears its proportionate share of these expenses. For additional expense information related to investments in Fidelity Central Funds, please refer to the "Investments in Fidelity Central Funds" note found in the Notes to Financial Statements section of the most recent Annual or Semi-Annual report.
H Expense ratios reflect operating expenses of the class. Expenses before reductions do not reflect amounts reimbursed, waived, or reduced through arrangements with the investment adviser, brokerage services, or other offset arrangements, if applicable, and do not represent the amount paid by the class during periods when reimbursements, waivers or reductions occur.
I Amount does not include the portfolio activity of any underlying mutual funds or exchange-traded funds (ETFs).
See accompanying notes which are an integral part of the financial statements.
Fidelity Advisor Semiconductors Fund Class C
| Years ended July 31, | 2022 | 2021 | 2020 | 2019 | 2018 |
| Selected Per–Share Data | | | | | |
| Net asset value, beginning of period | $38.59 | $25.18 | $19.59 | $21.88 | $19.10 |
| Income from Investment Operations | | | | | |
| Net investment income (loss)A,B | (.40) | (.31) | (.05) | (.01) | (.14) |
| Net realized and unrealized gain (loss) | (.61) | 15.35 | 5.86 | .98 | 5.05 |
| Total from investment operations | (1.01) | 15.04 | 5.81 | .97 | 4.91 |
| Distributions from net investment income | – | – | (.01) | – | – |
| Distributions from net realized gain | (2.34) | (1.63) | (.20) | (3.26) | (2.13) |
| Total distributions | (2.34) | (1.63) | (.22)C | (3.26) | (2.13) |
| Redemption fees added to paid in capitalA | – | – | – | – | –D |
| Net asset value, end of period | $35.24 | $38.59 | $25.18 | $19.59 | $21.88 |
| Total ReturnE,F | (3.93)% | 61.17% | 29.73% | 9.33% | 26.38% |
| Ratios to Average Net AssetsB,G,H | | | | | |
| Expenses before reductions | 1.76% | 1.79% | 1.85% | 1.87% | 1.91% |
| Expenses net of fee waivers, if any | 1.76% | 1.79% | 1.85% | 1.87% | 1.91% |
| Expenses net of all reductions | 1.76% | 1.79% | 1.83% | 1.87% | 1.89% |
| Net investment income (loss) | (1.03)% | (.97)% | (.23)% | (.06)% | (.67)% |
| Supplemental Data | | | | | |
| Net assets, end of period (000 omitted) | $88,592 | $86,217 | $57,320 | $45,659 | $57,915 |
| Portfolio turnover rateI | 32% | 41% | 136% | 110% | 133% |
A Calculated based on average shares outstanding during the period.
B Net investment income (loss) is affected by the timing of the declaration of dividends by any underlying mutual funds or exchange-traded funds (ETFs). Net investment income (loss) of any such underlying funds is not included in the Fund's net investment income (loss) ratio.
C Total distributions per share do not sum due to rounding.
D Amount represents less than $.005 per share.
E Total returns would have been lower if certain expenses had not been reduced during the applicable periods shown.
F Total returns do not include the effect of the contingent deferred sales charge.
G Fees and expenses of any underlying mutual funds or exchange-traded funds (ETFs) are not included in the Fund's expense ratio. The Fund indirectly bears its proportionate share of these expenses. For additional expense information related to investments in Fidelity Central Funds, please refer to the "Investments in Fidelity Central Funds" note found in the Notes to Financial Statements section of the most recent Annual or Semi-Annual report.
H Expense ratios reflect operating expenses of the class. Expenses before reductions do not reflect amounts reimbursed, waived, or reduced through arrangements with the investment adviser, brokerage services, or other offset arrangements, if applicable, and do not represent the amount paid by the class during periods when reimbursements, waivers or reductions occur.
I Amount does not include the portfolio activity of any underlying mutual funds or exchange-traded funds (ETFs).
See accompanying notes which are an integral part of the financial statements.
Fidelity Advisor Semiconductors Fund Class I
| Years ended July 31, | 2022 | 2021 | 2020 | 2019 | 2018 |
| Selected Per–Share Data | | | | | |
| Net asset value, beginning of period | $49.39 | $31.68 | $24.42 | $26.33 | $22.56 |
| Income from Investment Operations | | | | | |
| Net investment income (loss)A,B | (.01) | .03 | .22 | .23 | .10 |
| Net realized and unrealized gain (loss) | (.92) | 19.47 | 7.34 | 1.35 | 5.99 |
| Total from investment operations | (.93) | 19.50 | 7.56 | 1.58 | 6.09 |
| Distributions from net investment income | – | (.12) | (.10) | (.16) | (.11)C |
| Distributions from net realized gain | (2.53) | (1.67) | (.20) | (3.33) | (2.21)C |
| Total distributions | (2.53) | (1.79) | (.30) | (3.49) | (2.32) |
| Redemption fees added to paid in capitalA | – | – | – | – | –D |
| Net asset value, end of period | $45.93 | $49.39 | $31.68 | $24.42 | $26.33 |
| Total ReturnE | (2.96)% | 62.86% | 31.08% | 10.46% | 27.74% |
| Ratios to Average Net AssetsB,F,G | | | | | |
| Expenses before reductions | .75% | .77% | .81% | .83% | .86% |
| Expenses net of fee waivers, if any | .74% | .77% | .81% | .82% | .86% |
| Expenses net of all reductions | .74% | .76% | .79% | .82% | .84% |
| Net investment income (loss) | (.01)% | .06% | .81% | .98% | .38% |
| Supplemental Data | | | | | |
| Net assets, end of period (000 omitted) | $309,873 | $257,502 | $126,660 | $98,451 | $140,362 |
| Portfolio turnover rateH | 32% | 41% | 136% | 110% | 133% |
A Calculated based on average shares outstanding during the period.
B Net investment income (loss) is affected by the timing of the declaration of dividends by any underlying mutual funds or exchange-traded funds (ETFs). Net investment income (loss) of any such underlying funds is not included in the Fund's net investment income (loss) ratio.
C The amount shown reflects reclassifications related to book to tax differences that were made in the year shown.
D Amount represents less than $.005 per share.
E Total returns would have been lower if certain expenses had not been reduced during the applicable periods shown.
F Fees and expenses of any underlying mutual funds or exchange-traded funds (ETFs) are not included in the Fund's expense ratio. The Fund indirectly bears its proportionate share of these expenses. For additional expense information related to investments in Fidelity Central Funds, please refer to the "Investments in Fidelity Central Funds" note found in the Notes to Financial Statements section of the most recent Annual or Semi-Annual report.
G Expense ratios reflect operating expenses of the class. Expenses before reductions do not reflect amounts reimbursed, waived, or reduced through arrangements with the investment adviser, brokerage services, or other offset arrangements, if applicable, and do not represent the amount paid by the class during periods when reimbursements, waivers or reductions occur.
H Amount does not include the portfolio activity of any underlying mutual funds or exchange-traded funds (ETFs).
See accompanying notes which are an integral part of the financial statements.
Fidelity Advisor Semiconductors Fund Class Z
| Years ended July 31, | 2022 | 2021 | 2020 | 2019 A |
| Selected Per–Share Data | | | | |
| Net asset value, beginning of period | $49.35 | $31.65 | $24.38 | $26.00 |
| Income from Investment Operations | | | | |
| Net investment income (loss)B,C | .06 | .08 | .26 | .17 |
| Net realized and unrealized gain (loss) | (.92) | 19.45 | 7.33 | 1.76 |
| Total from investment operations | (.86) | 19.53 | 7.59 | 1.93 |
| Distributions from net investment income | – | (.16) | (.11) | (.22) |
| Distributions from net realized gain | (2.56) | (1.67) | (.20) | (3.33) |
| Total distributions | (2.56) | (1.83) | (.32)D | (3.55) |
| Net asset value, end of period | $45.93 | $49.35 | $31.65 | $24.38 |
| Total ReturnE,F | (2.83)% | 63.06% | 31.22% | 12.03% |
| Ratios to Average Net AssetsC,G,H | | | | |
| Expenses before reductions | .62% | .64% | .68% | .69%I |
| Expenses net of fee waivers, if any | .62% | .64% | .68% | .69%I |
| Expenses net of all reductions | .62% | .64% | .66% | .68%I |
| Net investment income (loss) | .11% | .18% | .94% | .91%I |
| Supplemental Data | | | | |
| Net assets, end of period (000 omitted) | $47,782 | $26,856 | $7,920 | $2,629 |
| Portfolio turnover rateJ | 32% | 41% | 136% | 110% |
A For the period October 2, 2018 (commencement of sale of shares) through July 31, 2019.
B Calculated based on average shares outstanding during the period.
C Net investment income (loss) is affected by the timing of the declaration of dividends by any underlying mutual funds or exchange-traded funds (ETFs). Net investment income (loss) of any such underlying funds is not included in the Fund's net investment income (loss) ratio.
D Total distributions per share do not sum due to rounding.
E Total returns for periods of less than one year are not annualized.
F Total returns would have been lower if certain expenses had not been reduced during the applicable periods shown.
G Fees and expenses of any underlying mutual funds or exchange-traded funds (ETFs) are not included in the Fund's expense ratio. The Fund indirectly bears its proportionate share of these expenses. For additional expense information related to investments in Fidelity Central Funds, please refer to the "Investments in Fidelity Central Funds" note found in the Notes to Financial Statements section of the most recent Annual or Semi-Annual report.
H Expense ratios reflect operating expenses of the class. Expenses before reductions do not reflect amounts reimbursed, waived, or reduced through arrangements with the investment adviser, brokerage services, or other offset arrangements, if applicable, and do not represent the amount paid by the class during periods when reimbursements, waivers or reductions occur.
I Annualized
J Amount does not include the portfolio activity of any underlying mutual funds or exchange-traded funds (ETFs).
See accompanying notes which are an integral part of the financial statements.
Fidelity Advisor® Technology Fund
Performance: The Bottom Line
Average annual total return reflects the change in the value of an investment, assuming reinvestment of distributions from dividend income and capital gains (the profits earned upon the sale of securities that have grown in value, if any) and assuming a constant rate of performance each year. The hypothetical investment and the average annual total returns do not reflect the deduction of taxes that a shareholder would pay on fund distributions or the redemption of fund shares. During periods of reimbursement by Fidelity, a fund’s total return will be greater than it would be had the reimbursement not occurred. How a fund did yesterday is no guarantee of how it will do tomorrow.
Average Annual Total Returns
| For the periods ended July 31, 2022 | Past 1 year | Past 5 years | Past 10 years |
| Class A (incl. 5.75% sales charge) | (21.56)% | 17.86% | 18.60% |
| Class M (incl. 3.50% sales charge) | (19.90)% | 18.12% | 18.58% |
| Class C (incl. contingent deferred sales charge) | (18.12)% | 18.36% | 18.59% |
| Class I | (16.56)% | 19.58% | 19.65% |
| Class Z | (16.46)% | 19.69% | 19.70% |
Class C shares' contingent deferred sales charges included in the past one year, past five years and past ten years total return figures are 1%, 0% and 0%, respectively.
The initial offering of Class Z shares took place on October 2, 2018. Returns prior to October 2, 2018, are those of Class I.
$10,000 Over 10 Years
Let's say hypothetically that $10,000 was invested in Fidelity Advisor® Technology Fund - Class A on July 31, 2012, and the current 5.75% sales charge was paid.
The chart shows how the value of your investment would have changed, and also shows how the S&P 500® Index performed over the same period.
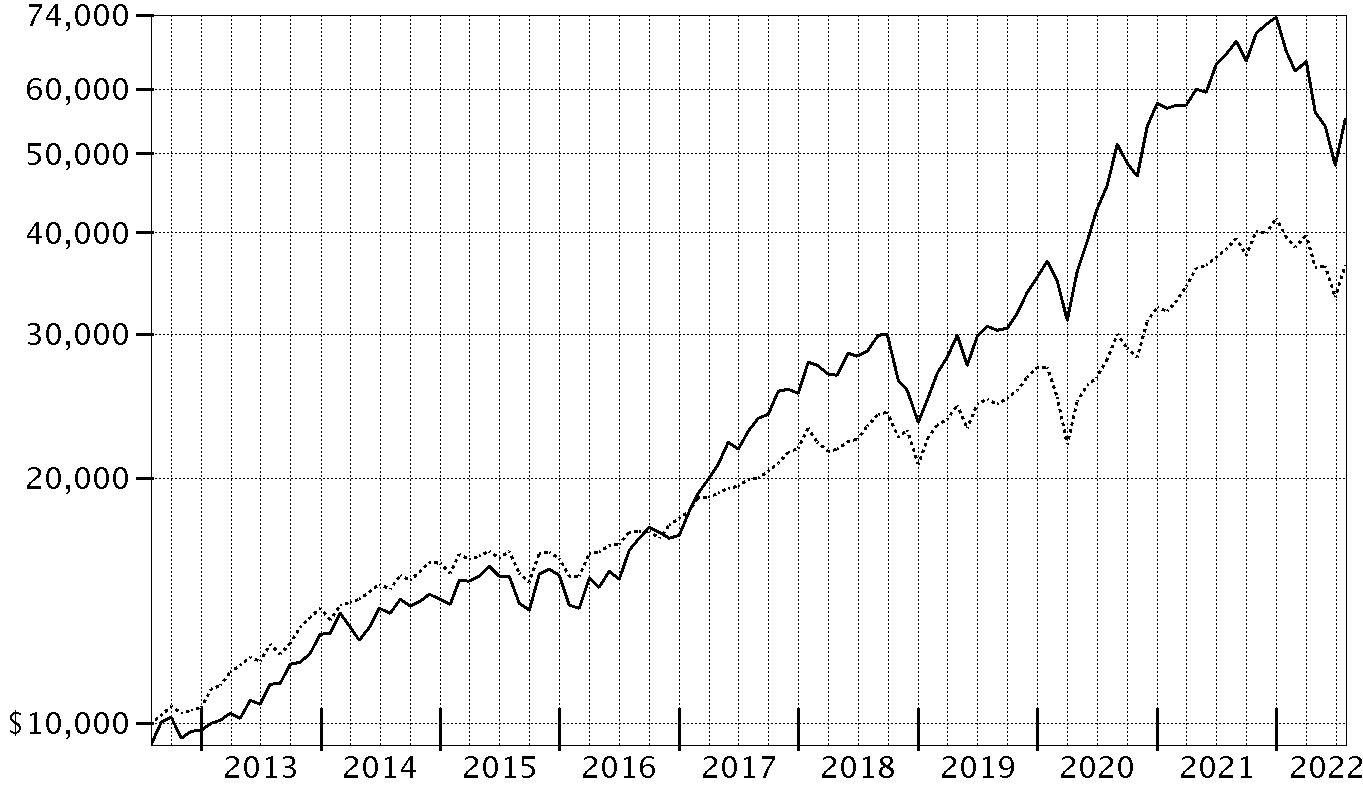
| Period Ending Values |
| $55,049 | Fidelity Advisor® Technology Fund - Class A |
| $36,428 | S&P 500® Index |
Fidelity Advisor® Technology Fund
Management's Discussion of Fund Performance
Market Recap: The S&P 500
® index returned -4.64% for the 12 months ending July 31, 2022, as a multitude of crosscurrents challenged the global economy and financial markets. Persistently high inflation, exacerbated by energy price shocks from the Russia–Ukraine conflict, spurred the U.S. Federal Reserve to hike interest rates more aggressively than anticipated, and concerns about the outlook for economic growth sent stocks into bear market territory. In early May, the Fed approved a rare half-percentage-point interest rate increase and announced plans to shrink its $9 trillion asset portfolio. June began with the Fed allowing up to billions in Treasuries and mortgage bonds to mature every month without investing the proceeds. Two weeks later, the central bank raised rates by 0.75 percentage points, its largest increase since 1994, and said it was becoming more difficult to achieve a soft landing, in which the economy slows enough to bring down inflation while avoiding a recession. Against this volatile backdrop, the S&P 500
® posted its worst first-half result (-19.96%) to begin a year since 1970. Stocks sharply reversed course in July (+9.22%), as the Fed again raised its benchmark interest rate by 0.75% but signaled that, at some point, it will likely slow the pace of tightening to assess the impact on the economy. For the full 12 months, growth-oriented communication services (-29%) and consumer discretionary (-10%) stocks lagged most. In contrast, energy (+67%) rode a surge in commodity prices and led by a wide margin, followed by the defensive utilities (+16%) and consumer staples (+7%) sectors.
Comments from Portfolio Manager Adam Benjamin: For the fiscal year ending July 31, 2022, the fund's share classes (excluding sales charges, if applicable) returned about -17% to -16%, trailing the -9.41% result of the MSCI U.S. IMI Information Technology 25/50 Index, as well as the broad-based S&P 500
® index. The largest detractors from performance versus the sector index were stock picks and an overweighting in internet services & infrastructure. Weak stock selection in interactive media & services and application software also hurt. The fund's biggest individual relative detractor was an outsized stake in Twilio, which returned -77% the past year. The company was among the fund's largest holdings this period. Also hindering performance was our overweighting in Zoom Video Communications, which returned -72%. The fund's non-index stake in Snap returned -87% and detracted. Conversely, the biggest contributor to performance versus the sector index were stock picks in the semiconductors group. An underweighting in data processing & outsourced services and a non-index allocation to the oil & gas refining & marketing group also helped the fund's relative performance. The fund's biggest individual relative contributor was an outsized stake in ON Semiconductor, which gained 71% the past 12 months. The company was among the biggest holdings as of July 31. Our second-largest relative contributor this period was avoiding Intel, an index component that returned approximately -30%. Another notable relative contributor was an overweighting in Hubspot (+36%). Notable changes in positioning include increased exposure to the internet services & infrastructure industry and a lower allocation to application software.
The views expressed above reflect those of the portfolio manager(s) only through the end of the period as stated on the cover of this report and do not necessarily represent the views of Fidelity or any other person in the Fidelity organization. Any such views are subject to change at any time based upon market or other conditions and Fidelity disclaims any responsibility to update such views. These views may not be relied on as investment advice and, because investment decisions for a Fidelity fund are based on numerous factors, may not be relied on as an indication of trading intent on behalf of any Fidelity fund.
Fidelity Advisor® Technology Fund
Investment Summary (Unaudited)
Top Ten Stocks as of July 31, 2022
| | % of fund's net assets |
| Apple, Inc. | 24.8 |
| Microsoft Corp. | 19.0 |
| NVIDIA Corp. | 6.1 |
| Marvell Technology, Inc. | 5.0 |
| MasterCard, Inc. Class A | 4.7 |
| NXP Semiconductors NV | 3.4 |
| Cisco Systems, Inc. | 3.0 |
| Salesforce.com, Inc. | 2.9 |
| onsemi | 2.3 |
| Intuit, Inc. | 1.8 |
| | 73.0 |
Industries (% of fund's net assets)
| As of July 31, 2022 |
| | Software | 28.4% |
| | Technology Hardware, Storage & Peripherals | 24.8% |
| | Semiconductors & Semiconductor Equipment | 22.3% |
| | IT Services | 14.1% |
| | Communications Equipment | 3.1% |
| | Electronic Equipment & Components | 1.4% |
| | Hotels, Restaurants & Leisure | 1.0% |
| | Internet & Direct Marketing Retail | 1.0% |
| | Interactive Media & Services | 0.6% |
| | Entertainment | 0.5% |
| | Oil, Gas & Consumable Fuels | 0.4% |
| | Aerospace & Defense | 0.3% |
| | Chemicals | 0.2% |
| | Diversified Financial Services | 0.1% |
| | Metals & Mining | 0.1% |
| | All Others* | 1.7% |
* Includes Short-Term investments and Net Other Assets (Liabilities).
Geographic Diversification (% of fund's net assets)
| As of July 31, 2022 |
| | United States of America* | 89.9% |
| | Netherlands | 3.9% |
| | Cayman Islands | 1.5% |
| | Singapore | 1.0% |
| | Bermuda | 1.0% |
| | India | 0.9% |
| | France | 0.7% |
| | Taiwan | 0.5% |
| | Canada | 0.3% |
| | Other | 0.3% |

* Includes Short-Term investments and Net Other Assets (Liabilities).
Percentages are based on country or territory of incorporation and are adjusted for the effect of futures contracts, if applicable.
Fidelity Advisor® Technology Fund
Schedule of Investments July 31, 2022
Showing Percentage of Net Assets
| Common Stocks - 96.1% | | | |
| | | Shares | Value |
| Capital Markets - 0.0% | | | |
| Financial Exchanges & Data - 0.0% | | | |
| Coinbase Global, Inc. (a)(b) | | 3,600 | $226,656 |
| Chemicals - 0.2% | | | |
| Commodity Chemicals - 0.2% | | | |
| LG Chemical Ltd. | | 16,570 | 7,688,674 |
| Communications Equipment - 3.0% | | | |
| Communications Equipment - 3.0% | | | |
| Cisco Systems, Inc. | | 2,554,700 | 115,906,739 |
| Diversified Financial Services - 0.1% | | | |
| Other Diversified Financial Services - 0.1% | | | |
| Ant International Co. Ltd. Class C (a)(c)(d) | | 2,163,455 | 4,088,930 |
| Electronic Equipment & Components - 1.0% | | | |
| Electronic Manufacturing Services - 1.0% | | | |
| Flex Ltd. (a) | | 2,322,803 | 39,023,090 |
| Entertainment - 0.5% | | | |
| Movies & Entertainment - 0.5% | | | |
| Netflix, Inc. (a) | | 92,066 | 20,705,643 |
| Hotels, Restaurants & Leisure - 1.0% | | | |
| Hotels, Resorts & Cruise Lines - 1.0% | | | |
| Airbnb, Inc. Class A (a) | | 333,900 | 37,056,222 |
| Interactive Media & Services - 0.3% | | | |
| Interactive Media & Services - 0.3% | | | |
| Kuaishou Technology Class B (a)(e) | | 40,900 | 411,610 |
| Snap, Inc. Class A (a) | | 1,240,500 | 12,256,140 |
| | | | 12,667,750 |
| Internet & Direct Marketing Retail - 0.9% | | | |
| Internet & Direct Marketing Retail - 0.9% | | | |
| Deliveroo PLC Class A (a)(e) | | 307,100 | 338,981 |
| Lyft, Inc. (a) | | 713,642 | 9,891,078 |
| Uber Technologies, Inc. (a) | | 967,864 | 22,696,411 |
| | | | 32,926,470 |
| IT Services - 14.0% | | | |
| Data Processing & Outsourced Services - 7.7% | | | |
| Genpact Ltd. | | 795,100 | 38,228,408 |
| MasterCard, Inc. Class A | | 503,000 | 177,956,370 |
| PayPal Holdings, Inc. (a) | | 146,100 | 12,642,033 |
| Visa, Inc. Class A | | 305,916 | 64,887,843 |
| | | | 293,714,654 |
| Internet Services & Infrastructure - 5.6% | | | |
| Cloudflare, Inc. (a) | | 630,200 | 31,711,664 |
| MongoDB, Inc. Class A (a) | | 88,500 | 27,653,595 |
| Okta, Inc. (a) | | 618,100 | 60,851,945 |
| Shopify, Inc. Class A (a)(b) | | 367,000 | 12,782,610 |
| Snowflake, Inc. (a) | | 292,600 | 43,863,666 |
| Twilio, Inc. Class A (a) | | 462,800 | 39,245,440 |
| | | | 216,108,920 |
| IT Consulting & Other Services - 0.7% | | | |
| Capgemini SA | | 143,500 | 27,184,205 |
|
| TOTAL IT SERVICES | | | 537,007,779 |
|
| Life Sciences Tools & Services - 0.0% | | | |
| Life Sciences Tools & Services - 0.0% | | | |
| Eden Biologics, Inc. (a)(c) | | 387,462 | 0 |
| Oil, Gas & Consumable Fuels - 0.4% | | | |
| Oil & Gas Refining & Marketing - 0.4% | | | |
| Reliance Industries Ltd. | | 461,146 | 14,649,854 |
| Pharmaceuticals - 0.0% | | | |
| Pharmaceuticals - 0.0% | | | |
| Chime Biologics Wuhan Co. Ltd. (a)(c) | | 387,462 | 201,802 |
| Road & Rail - 0.0% | | | |
| Trucking - 0.0% | | | |
| DiDi Global, Inc. ADR (b) | | 113,900 | 325,754 |
| TuSimple Holdings, Inc. (a)(b) | | 86,300 | 859,548 |
| | | | 1,185,302 |
| Semiconductors & Semiconductor Equipment - 22.0% | | | |
| Semiconductor Equipment - 1.9% | | | |
| ASML Holding NV (Netherlands) | | 34,600 | 19,886,640 |
| Teradyne, Inc. | | 536,000 | 54,077,040 |
| | | | 73,963,680 |
| Semiconductors - 20.1% | | | |
| GlobalFoundries, Inc. | | 1,075,700 | 55,377,036 |
| Marvell Technology, Inc. | | 3,471,260 | 193,279,757 |
| Microchip Technology, Inc. | | 763,200 | 52,553,952 |
| NVIDIA Corp. | | 1,275,500 | 231,669,065 |
| NXP Semiconductors NV | | 703,000 | 129,267,640 |
| onsemi (a) | | 1,302,900 | 87,007,662 |
| Taiwan Semiconductor Manufacturing Co. Ltd. | | 1,145,000 | 19,572,844 |
| | | | 768,727,956 |
|
| TOTAL SEMICONDUCTORS & SEMICONDUCTOR EQUIPMENT | | | 842,691,636 |
|
| Software - 27.9% | | | |
| Application Software - 7.4% | | | |
| Confluent, Inc. (a) | | 11,500 | 292,675 |
| HubSpot, Inc. (a) | | 87,600 | 26,980,800 |
| Intuit, Inc. | | 151,700 | 69,200,989 |
| Pine Labs Private Ltd. (a)(c)(d) | | 3,660 | 2,048,136 |
| Procore Technologies, Inc. (a) | | 4,400 | 227,480 |
| Qualtrics International, Inc. (a) | | 614,000 | 7,828,500 |
| Salesforce.com, Inc. (a) | | 595,739 | 109,627,891 |
| Splunk, Inc. (a) | | 162,400 | 16,874,984 |
| Workday, Inc. Class A (a) | | 145,800 | 22,613,580 |
| Zoom Video Communications, Inc. Class A (a) | | 263,564 | 27,373,757 |
| | | | 283,068,792 |
| Systems Software - 20.5% | | | |
| Microsoft Corp. | | 2,589,500 | 726,976,230 |
| Rapid7, Inc. (a) | | 275,900 | 17,649,323 |
| ServiceNow, Inc. (a) | | 40,900 | 18,268,394 |
| Tenable Holdings, Inc. (a) | | 565,900 | 21,872,035 |
| UiPath, Inc. Class A (a) | | 46,100 | 845,013 |
| | | | 785,610,995 |
|
| TOTAL SOFTWARE | | | 1,068,679,787 |
|
| Technology Hardware, Storage & Peripherals - 24.8% | | | |
| Technology Hardware, Storage & Peripherals - 24.8% | | | |
| Apple, Inc. | | 5,833,516 | 948,004,685 |
| IonQ, Inc. (a)(d) | | 119,300 | 644,220 |
| | | | 948,648,905 |
| TOTAL COMMON STOCKS | | | |
| (Cost $2,295,842,640) | | | 3,683,355,239 |
|
| Preferred Stocks - 2.1% | | | |
| Convertible Preferred Stocks - 1.8% | | | |
| Aerospace & Defense - 0.3% | | | |
| Aerospace & Defense - 0.3% | | | |
| Relativity Space, Inc. Series E (a)(c)(d) | | 482,616 | 9,579,928 |
| Communications Equipment - 0.1% | | | |
| Communications Equipment - 0.1% | | | |
| Meesho Series F (c)(d) | | 46,600 | 3,174,858 |
| Xsight Labs Ltd. Series D (a)(c)(d) | | 101,300 | 757,724 |
| | | | 3,932,582 |
| Electronic Equipment & Components - 0.3% | | | |
| Electronic Equipment & Instruments - 0.3% | | | |
| Enevate Corp. Series E (a)(c)(d) | | 9,477,386 | 10,507,426 |
| Hotels, Restaurants & Leisure - 0.0% | | | |
| Casinos & Gaming - 0.0% | | | |
| Discord, Inc. Series I (c)(d) | | 500 | 191,495 |
| Interactive Media & Services - 0.3% | | | |
| Interactive Media & Services - 0.3% | | | |
| Reddit, Inc.: | | | |
| Series D (a)(c)(d) | | 94,300 | 3,709,762 |
| Series E (a)(c)(d) | | 5,300 | 208,502 |
| Series F (c)(d) | | 154,614 | 6,082,515 |
| | | | 10,000,779 |
| Internet & Direct Marketing Retail - 0.1% | | | |
| Internet & Direct Marketing Retail - 0.1% | | | |
| GoBrands, Inc. Series G (a)(c)(d) | | 14,100 | 3,216,633 |
| Instacart, Inc. Series I (a)(c)(d) | | 29,110 | 1,529,148 |
| | | | 4,745,781 |
| IT Services - 0.1% | | | |
| Internet Services & Infrastructure - 0.1% | | | |
| ByteDance Ltd. Series E1 (a)(c)(d) | | 26,036 | 3,737,207 |
| Metals & Mining - 0.1% | | | |
| Precious Metals & Minerals - 0.1% | | | |
| Diamond Foundry, Inc. Series C (a)(c)(d) | | 151,757 | 4,725,713 |
| Road & Rail - 0.0% | | | |
| Trucking - 0.0% | | | |
| Convoy, Inc. Series D (a)(c)(d) | | 81,762 | 886,300 |
| Semiconductors & Semiconductor Equipment - 0.3% | | | |
| Semiconductor Equipment - 0.2% | | | |
| Astera Labs, Inc.: | | | |
| Series A (c)(d) | | 144,502 | 1,469,513 |
| Series B (c)(d) | | 24,603 | 250,200 |
| Series C (c)(d) | | 135,400 | 1,376,950 |
| Series D (c)(d) | | 590,802 | 6,008,161 |
| | | | 9,104,824 |
| Semiconductors - 0.1% | | | |
| SiMa.ai: | | | |
| Series B (a)(c)(d) | | 231,000 | 1,637,998 |
| Series B1 (c)(d) | | 15,473 | 109,718 |
| | | | 1,747,716 |
| TOTAL SEMICONDUCTORS & SEMICONDUCTOR EQUIPMENT | | | 10,852,540 |
| Software - 0.2% | | | |
| Application Software - 0.2% | | | |
| Databricks, Inc.: | | | |
| Series G (a)(c)(d) | | 12,600 | 1,993,572 |
| Series H (c)(d) | | 33,262 | 5,262,714 |
| | | | 7,256,286 |
| Systems Software - 0.0% | | | |
| Nuvia, Inc. Series B (a)(d) | | 678,052 | 554,118 |
| Tenstorrent, Inc. Series C1 (a)(c)(d) | | 6,600 | 371,448 |
| | | | 925,566 |
| TOTAL SOFTWARE | | | 8,181,852 |
|
| TOTAL CONVERTIBLE PREFERRED STOCKS | | | 67,341,603 |
|
| Nonconvertible Preferred Stocks - 0.3% | | | |
| Software - 0.3% | | | |
| Application Software - 0.3% | | | |
| Pine Labs Private Ltd.: | | | |
| Series 1 (a)(c)(d) | | 8,747 | 4,894,821 |
| Series A (a)(c)(d) | | 2,186 | 1,223,286 |
| Series B (a)(c)(d) | | 2,378 | 1,330,729 |
| Series B2 (a)(c)(d) | | 1,923 | 1,076,111 |
| Series C (a)(c)(d) | | 3,578 | 2,002,249 |
| Series C1 (a)(c)(d) | | 754 | 421,938 |
| Series D (a)(c)(d) | | 806 | 451,038 |
| | | | 11,400,172 |
| TOTAL PREFERRED STOCKS | | | |
| (Cost $80,359,678) | | | 78,741,775 |
|
| Preferred Securities - 0.1% | | | |
| Electronic Equipment & Components - 0.1% | | | |
| Electronic Equipment & Instruments - 0.1% | | | |
| Enevate Corp. 0% 1/29/23 (c)(d) | | 4,035,056 | 4,035,056 |
| Software - 0.0% | | | |
| Systems Software - 0.0% | | | |
| Tenstorrent, Inc. 0% (c)(d)(f) | | 370,000 | 370,000 |
| TOTAL PREFERRED SECURITIES | | | |
| (Cost $4,405,056) | | | 4,405,056 |
|
| Money Market Funds - 1.8% | | | |
| Fidelity Cash Central Fund 2.01% (g) | | 66,669,479 | 66,682,813 |
| Fidelity Securities Lending Cash Central Fund 2.01% (g)(h) | | 3,261,958 | 3,262,284 |
| TOTAL MONEY MARKET FUNDS | | | |
| (Cost $69,945,097) | | | 69,945,097 |
| TOTAL INVESTMENT IN SECURITIES - 100.1% | | | |
| (Cost $2,450,552,471) | | | 3,836,447,167 |
| NET OTHER ASSETS (LIABILITIES) - (0.1)% | | | (4,658,451) |
| NET ASSETS - 100% | | | $3,831,788,716 |
Legend
(a) Non-income producing
(b) Security or a portion of the security is on loan at period end.
(c) Level 3 security
(d) Restricted securities (including private placements) - Investment in securities not registered under the Securities Act of 1933 (excluding 144A issues). At the end of the period, the value of restricted securities (excluding 144A issues) amounted to $89,928,117 or 2.3% of net assets.
(e) Security exempt from registration under Rule 144A of the Securities Act of 1933. These securities may be resold in transactions exempt from registration, normally to qualified institutional buyers. At the end of the period, the value of these securities amounted to $750,591 or 0.0% of net assets.
(f) Security is perpetual in nature with no stated maturity date.
(g) Affiliated fund that is generally available only to investment companies and other accounts managed by Fidelity Investments. The rate quoted is the annualized seven-day yield of the fund at period end. A complete unaudited listing of the fund's holdings as of its most recent quarter end is available upon request. In addition, each Fidelity Central Fund's financial statements, which are not covered by the Fund's Report of Independent Registered Public Accounting Firm, are available on the SEC's website or upon request.
(h) Investment made with cash collateral received from securities on loan.
Additional information on each restricted holding is as follows:
| Security | Acquisition Date | Acquisition Cost |
| Ant International Co. Ltd. Class C | 5/16/18 | $8,245,741 |
| Astera Labs, Inc. Series A | 5/17/22 | $1,469,513 |
| Astera Labs, Inc. Series B | 5/17/22 | $250,200 |
| Astera Labs, Inc. Series C | 8/24/21 | $455,188 |
| Astera Labs, Inc. Series D | 5/17/22 - 5/27/22 | $6,008,161 |
| ByteDance Ltd. Series E1 | 11/18/20 | $2,852,873 |
| Convoy, Inc. Series D | 10/30/19 | $1,107,057 |
| Databricks, Inc. Series G | 2/1/21 | $2,234,836 |
| Databricks, Inc. Series H | 8/31/21 | $7,332,688 |
| Diamond Foundry, Inc. Series C | 3/15/21 | $3,642,168 |
| Discord, Inc. Series I | 9/15/21 | $275,312 |
| Enevate Corp. Series E | 1/29/21 | $10,507,436 |
| Enevate Corp. 0% 1/29/23 | 1/29/21 | $4,035,056 |
| GoBrands, Inc. Series G | 3/2/21 | $3,521,014 |
| Instacart, Inc. Series I | 2/26/21 | $3,638,750 |
| IonQ, Inc. | 3/7/21 | $1,193,000 |
| Meesho Series F | 9/21/21 | $3,572,929 |
| Nuvia, Inc. Series B | 3/16/21 | $554,115 |
| Pine Labs Private Ltd. | 6/30/21 | $1,364,668 |
| Pine Labs Private Ltd. Series 1 | 6/30/21 | $3,261,406 |
| Pine Labs Private Ltd. Series A | 6/30/21 | $815,072 |
| Pine Labs Private Ltd. Series B | 6/30/21 | $886,661 |
| Pine Labs Private Ltd. Series B2 | 6/30/21 | $717,010 |
| Pine Labs Private Ltd. Series C | 6/30/21 | $1,334,093 |
| Pine Labs Private Ltd. Series C1 | 6/30/21 | $281,136 |
| Pine Labs Private Ltd. Series D | 6/30/21 | $300,525 |
| Reddit, Inc. Series D | 2/4/19 | $2,045,018 |
| Reddit, Inc. Series E | 5/18/21 | $225,113 |
| Reddit, Inc. Series F | 8/11/21 | $9,554,279 |
| Relativity Space, Inc. Series E | 5/27/21 | $11,020,585 |
| SiMa.ai Series B | 5/10/21 | $1,184,429 |
| SiMa.ai Series B1 | 4/25/22 | $109,718 |
| Tenstorrent, Inc. Series C1 | 4/23/21 | $392,398 |
| Tenstorrent, Inc. 0% | 4/23/21 | $370,000 |
| Xsight Labs Ltd. Series D | 2/16/21 | $809,995 |
Affiliated Central Funds
Fiscal year to date information regarding the Fund's investments in Fidelity Central Funds, including the ownership percentage, is presented below.
| Fund | Value, beginning of period | Purchases | Sales Proceeds | Dividend Income | Realized Gain/Loss | Change in Unrealized appreciation (depreciation) | Value, end of period | % ownership, end of period |
| Fidelity Cash Central Fund 2.01% | $24,905,035 | $770,955,789 | $729,178,011 | $248,446 | $-- | $-- | $66,682,813 | 0.1% |
| Fidelity Securities Lending Cash Central Fund 2.01% | 3,619,384 | 270,744,272 | 271,101,372 | 53,125 | -- | -- | 3,262,284 | 0.0% |
| Total | $28,524,419 | $1,041,700,061 | $1,000,279,383 | $301,571 | $-- | $-- | $69,945,097 | |
Amounts in the income column in the above table include any capital gain distributions from underlying funds, which are presented in the corresponding line-item in the Statement of Operations, if applicable. Amount for Fidelity Securities Lending Cash Central Fund represents the income earned on investing cash collateral, less rebates paid to borrowers and any lending agent fees associated with the loan, plus any premium payments received for lending certain types of securities.
Investment Valuation
The following is a summary of the inputs used, as of July 31, 2022, involving the Fund's assets and liabilities carried at fair value. The inputs or methodology used for valuing securities may not be an indication of the risk associated with investing in those securities. For more information on valuation inputs, and their aggregation into the levels used below, please refer to the Investment Valuation section in the accompanying Notes to Financial Statements.
| | Valuation Inputs at Reporting Date: |
| Description | Total | Level 1 | Level 2 | Level 3 |
| Investments in Securities: | | | | |
| Common Stocks | $3,683,355,239 | $3,615,218,359 | $61,798,012 | $6,338,868 |
| Preferred Stocks | 78,741,775 | 554,118 | -- | 78,187,657 |
| Preferred Securities | 4,405,056 | -- | -- | 4,405,056 |
| Money Market Funds | 69,945,097 | 69,945,097 | -- | -- |
| Total Investments in Securities: | $3,836,447,167 | $3,685,717,574 | $61,798,012 | $88,931,581 |
The following is a reconciliation of Investments in Securities for which Level 3 inputs were used in determining value:
| Investments in Securities: | |
| Preferred Stocks | |
| Beginning Balance | $56,779,615 |
| Total Realized Gain (Loss) | -- |
| Total Unrealized Gain (Loss) | (7,619,946) |
| Cost of Purchases | 29,027,988 |
| Proceeds of Sales | -- |
| Amortization/Accretion | -- |
| Transfers in to Level 3 | -- |
| Transfers out of Level 3 | -- |
| Ending Balance | $78,187,657 |
| The change in unrealized gain (loss) for the period attributable to Level 3 securities held at July 31, 2022 | $(7,619,946) |
| Other Investments in Securities | |
| Beginning Balance | $9,646,099 |
| Total Realized Gain (Loss) | -- |
| Total Unrealized Gain (Loss) | 1,097,825 |
| Cost of Purchases | -- |
| Proceeds of Sales | -- |
| Amortization/Accretion | -- |
| Transfers in to Level 3 | -- |
| Transfers out of Level 3 | -- |
| Ending Balance | $10,743,924 |
| The change in unrealized gain (loss) for the period attributable to Level 3 securities held at July 31, 2022 | $1,097,825 |
The information used in the above reconciliations represents fiscal year to date activity for any Investments in Securities identified as using Level 3 inputs at either the beginning or the end of the current fiscal period. Transfers into Level 3 were attributable to a lack of observable market data resulting from decreases in market activity, decreases in liquidity, security restructurings or corporate actions. Transfers out of Level 3 were attributable to observable market data becoming available for those securities. Cost of purchases and proceeds of sales may include securities received and/or delivered through in-kind transactions. Transfers in or out of Level 3 represent the beginning value of any Security or Instrument where a change in the pricing level occurred from the beginning to the end of the period. The cost of purchases and the proceeds of sales may include securities received or delivered through corporate actions or exchanges. Realized and unrealized gains (losses) disclosed in the reconciliations are included in Net Gain (Loss) on the Fund's Statement of Operations.
See accompanying notes which are an integral part of the financial statements.
Fidelity Advisor® Technology Fund
Financial Statements
Statement of Assets and Liabilities
| | | July 31, 2022 |
| Assets | | |
Investment in securities, at value (including securities loaned of $3,067,307) — See accompanying schedule:
Unaffiliated issuers (cost $2,380,607,374) | $3,766,502,070 | |
| Fidelity Central Funds (cost $69,945,097) | 69,945,097 | |
| Total Investment in Securities (cost $2,450,552,471) | | $3,836,447,167 |
| Receivable for fund shares sold | | 4,447,242 |
| Dividends receivable | | 269,465 |
| Distributions receivable from Fidelity Central Funds | | 101,109 |
| Prepaid expenses | | 5,642 |
| Other receivables | | 120,228 |
| Total assets | | 3,841,390,853 |
| Liabilities | | |
| Payable for fund shares redeemed | $2,498,916 | |
| Accrued management fee | 1,562,550 | |
| Distribution and service plan fees payable | 695,394 | |
| Other affiliated payables | 538,076 | |
| Other payables and accrued expenses | 1,060,751 | |
| Collateral on securities loaned | 3,246,450 | |
| Total liabilities | | 9,602,137 |
| Net Assets | | $3,831,788,716 |
| Net Assets consist of: | | |
| Paid in capital | | $2,379,531,085 |
| Total accumulated earnings (loss) | | 1,452,257,631 |
| Net Assets | | $3,831,788,716 |
| Net Asset Value and Maximum Offering Price | | |
| Class A: | | |
| Net Asset Value and redemption price per share ($1,467,791,954 ÷ 19,464,658 shares)(a) | | $75.41 |
| Maximum offering price per share (100/94.25 of $75.41) | | $80.01 |
| Class M: | | |
| Net Asset Value and redemption price per share ($484,292,647 ÷ 6,992,945 shares)(a) | | $69.25 |
| Maximum offering price per share (100/96.50 of $69.25) | | $71.76 |
| Class C: | | |
| Net Asset Value and offering price per share ($288,007,764 ÷ 5,022,065 shares)(a) | | $57.35 |
| Class I: | | |
| Net Asset Value, offering price and redemption price per share ($1,129,418,487 ÷ 13,399,843 shares) | | $84.29 |
| Class Z: | | |
| Net Asset Value, offering price and redemption price per share ($462,277,864 ÷ 5,489,208 shares) | | $84.22 |
(a) Redemption price per share is equal to net asset value less any applicable contingent deferred sales charge.
See accompanying notes which are an integral part of the financial statements.
Statement of Operations
| | | Year ended July 31, 2022 |
| Investment Income | | |
| Dividends | | $24,940,187 |
| Income from Fidelity Central Funds (including $53,125 from security lending) | | 301,571 |
| Total income | | 25,241,758 |
| Expenses | | |
| Management fee | $23,835,154 | |
| Transfer agent fees | 6,796,951 | |
| Distribution and service plan fees | 10,907,463 | |
| Accounting fees | 1,041,765 | |
| Custodian fees and expenses | 51,292 | |
| Independent trustees' fees and expenses | 15,247 | |
| Registration fees | 169,649 | |
| Audit | 53,611 | |
| Legal | 9,731 | |
| Interest | 1,089 | |
| Miscellaneous | 17,557 | |
| Total expenses before reductions | 42,899,509 | |
| Expense reductions | (144,232) | |
| Total expenses after reductions | | 42,755,277 |
| Net investment income (loss) | | (17,513,519) |
| Realized and Unrealized Gain (Loss) | | |
| Net realized gain (loss) on: | | |
| Investment securities: | | |
| Unaffiliated issuers (net of foreign taxes of $1,609,840) | 197,750,164 | |
| Foreign currency transactions | (85,084) | |
| Total net realized gain (loss) | | 197,665,080 |
| Change in net unrealized appreciation (depreciation) on: | | |
| Investment securities: | | |
| Unaffiliated issuers (net of decrease in deferred foreign taxes of $949,498) | (964,519,687) | |
| Unfunded commitments | 127,890 | |
| Assets and liabilities in foreign currencies | (4,609) | |
| Total change in net unrealized appreciation (depreciation) | | (964,396,406) |
| Net gain (loss) | | (766,731,326) |
| Net increase (decrease) in net assets resulting from operations | | $(784,244,845) |
See accompanying notes which are an integral part of the financial statements.
Statement of Changes in Net Assets
| | Year ended July 31, 2022 | Year ended July 31, 2021 |
| Increase (Decrease) in Net Assets | | |
| Operations | | |
| Net investment income (loss) | $(17,513,519) | $(17,925,221) |
| Net realized gain (loss) | 197,665,080 | 676,770,788 |
| Change in net unrealized appreciation (depreciation) | (964,396,406) | 874,752,198 |
| Net increase (decrease) in net assets resulting from operations | (784,244,845) | 1,533,597,765 |
| Distributions to shareholders | (600,971,502) | (319,176,570) |
| Share transactions - net increase (decrease) | 337,954,182 | 184,546,176 |
| Total increase (decrease) in net assets | (1,047,262,165) | 1,398,967,371 |
| Net Assets | | |
| Beginning of period | 4,879,050,881 | 3,480,083,510 |
| End of period | $3,831,788,716 | $4,879,050,881 |
See accompanying notes which are an integral part of the financial statements.
Financial Highlights
Fidelity Advisor Technology Fund Class A
| Years ended July 31, | 2022 | 2021 | 2020 | 2019 | 2018 |
| Selected Per–Share Data | | | | | |
| Net asset value, beginning of period | $102.43 | $76.36 | $52.61 | $60.37 | $52.11 |
| Income from Investment Operations | | | | | |
| Net investment income (loss)A,B | (.37) | (.39) | (.12) | .02 | (.13) |
| Net realized and unrealized gain (loss) | (13.94) | 33.48 | 25.35 | 1.84 | 12.80 |
| Total from investment operations | (14.31) | 33.09 | 25.23 | 1.86 | 12.67 |
| Distributions from net investment income | – | – | – | – | – |
| Distributions from net realized gain | (12.71) | (7.02) | (1.48) | (9.62) | (4.41) |
| Total distributions | (12.71) | (7.02) | (1.48) | (9.62) | (4.41) |
| Net asset value, end of period | $75.41 | $102.43 | $76.36 | $52.61 | $60.37 |
| Total ReturnC,D | (16.78)% | 44.80% | 48.83% | 7.26% | 25.43% |
| Ratios to Average Net AssetsB,E,F | | | | | |
| Expenses before reductions | .97% | .98% | 1.01% | 1.03% | 1.05% |
| Expenses net of fee waivers, if any | .97% | .98% | 1.01% | 1.03% | 1.05% |
| Expenses net of all reductions | .97% | .98% | 1.01% | 1.02% | 1.04% |
| Net investment income (loss) | (.41)% | (.43)% | (.20)% | .04% | (.23)% |
| Supplemental Data | | | | | |
| Net assets, end of period (000 omitted) | $1,467,792 | $1,848,643 | $1,339,059 | $884,749 | $825,118 |
| Portfolio turnover rateG | 20% | 44% | 40%H | 88% | 84% |
A Calculated based on average shares outstanding during the period.
B Net investment income (loss) is affected by the timing of the declaration of dividends by any underlying mutual funds or exchange-traded funds (ETFs). Net investment income (loss) of any such underlying funds is not included in the Fund's net investment income (loss) ratio.
C Total returns would have been lower if certain expenses had not been reduced during the applicable periods shown.
D Total returns do not include the effect of the sales charges.
E Fees and expenses of any underlying mutual funds or exchange-traded funds (ETFs) are not included in the Fund's expense ratio. The Fund indirectly bears its proportionate share of these expenses. For additional expense information related to investments in Fidelity Central Funds, please refer to the "Investments in Fidelity Central Funds" note found in the Notes to Financial Statements section of the most recent Annual or Semi-Annual report.
F Expense ratios reflect operating expenses of the class. Expenses before reductions do not reflect amounts reimbursed, waived, or reduced through arrangements with the investment adviser, brokerage services, or other offset arrangements, if applicable, and do not represent the amount paid by the class during periods when reimbursements, waivers or reductions occur.
G Amount does not include the portfolio activity of any underlying mutual funds or exchange-traded funds (ETFs).
H Portfolio turnover rate excludes securities received or delivered in-kind.
See accompanying notes which are an integral part of the financial statements.
Fidelity Advisor Technology Fund Class M
| Years ended July 31, | 2022 | 2021 | 2020 | 2019 | 2018 |
| Selected Per–Share Data | | | | | |
| Net asset value, beginning of period | $95.15 | $71.37 | $49.28 | $57.23 | $49.63 |
| Income from Investment Operations | | | | | |
| Net investment income (loss)A,B | (.55) | (.57) | (.25) | (.10) | (.27) |
| Net realized and unrealized gain (loss) | (12.76) | 31.22 | 23.71 | 1.63 | 12.16 |
| Total from investment operations | (13.31) | 30.65 | 23.46 | 1.53 | 11.89 |
| Distributions from net investment income | – | – | – | – | – |
| Distributions from net realized gain | (12.59) | (6.87) | (1.37) | (9.48) | (4.29) |
| Total distributions | (12.59) | (6.87) | (1.37) | (9.48) | (4.29) |
| Net asset value, end of period | $69.25 | $95.15 | $71.37 | $49.28 | $57.23 |
| Total ReturnC,D | (16.99)% | 44.47% | 48.44% | 7.00% | 25.09% |
| Ratios to Average Net AssetsB,E,F | | | | | |
| Expenses before reductions | 1.21% | 1.23% | 1.26% | 1.28% | 1.31% |
| Expenses net of fee waivers, if any | 1.21% | 1.23% | 1.26% | 1.28% | 1.31% |
| Expenses net of all reductions | 1.21% | 1.22% | 1.26% | 1.28% | 1.30% |
| Net investment income (loss) | (.65)% | (.68)% | (.45)% | (.22)% | (.49)% |
| Supplemental Data | | | | | |
| Net assets, end of period (000 omitted) | $484,293 | $624,534 | $464,093 | $321,915 | $328,709 |
| Portfolio turnover rateG | 20% | 44% | 40%H | 88% | 84% |
A Calculated based on average shares outstanding during the period.
B Net investment income (loss) is affected by the timing of the declaration of dividends by any underlying mutual funds or exchange-traded funds (ETFs). Net investment income (loss) of any such underlying funds is not included in the Fund's net investment income (loss) ratio.
C Total returns would have been lower if certain expenses had not been reduced during the applicable periods shown.
D Total returns do not include the effect of the sales charges.
E Fees and expenses of any underlying mutual funds or exchange-traded funds (ETFs) are not included in the Fund's expense ratio. The Fund indirectly bears its proportionate share of these expenses. For additional expense information related to investments in Fidelity Central Funds, please refer to the "Investments in Fidelity Central Funds" note found in the Notes to Financial Statements section of the most recent Annual or Semi-Annual report.
F Expense ratios reflect operating expenses of the class. Expenses before reductions do not reflect amounts reimbursed, waived, or reduced through arrangements with the investment adviser, brokerage services, or other offset arrangements, if applicable, and do not represent the amount paid by the class during periods when reimbursements, waivers or reductions occur.
G Amount does not include the portfolio activity of any underlying mutual funds or exchange-traded funds (ETFs).
H Portfolio turnover rate excludes securities received or delivered in-kind.
See accompanying notes which are an integral part of the financial statements.
Fidelity Advisor Technology Fund Class C
| Years ended July 31, | 2022 | 2021 | 2020 | 2019 | 2018 |
| Selected Per–Share Data | | | | | |
| Net asset value, beginning of period | $80.98 | $61.67 | $42.81 | $51.18 | $44.86 |
| Income from Investment Operations | | | | | |
| Net investment income (loss)A,B | (.83) | (.85) | (.46) | (.30) | (.49) |
| Net realized and unrealized gain (loss) | (10.43) | 26.79 | 20.52 | 1.22 | 10.95 |
| Total from investment operations | (11.26) | 25.94 | 20.06 | .92 | 10.46 |
| Distributions from net investment income | – | – | – | – | – |
| Distributions from net realized gain | (12.37) | (6.63) | (1.20) | (9.29) | (4.14) |
| Total distributions | (12.37) | (6.63) | (1.20) | (9.29) | (4.14) |
| Net asset value, end of period | $57.35 | $80.98 | $61.67 | $42.81 | $51.18 |
| Total ReturnC,D | (17.41)% | 43.73% | 47.69% | 6.44% | 24.48% |
| Ratios to Average Net AssetsB,E,F | | | | | |
| Expenses before reductions | 1.73% | 1.75% | 1.77% | 1.79% | 1.81% |
| Expenses net of fee waivers, if any | 1.73% | 1.74% | 1.77% | 1.79% | 1.81% |
| Expenses net of all reductions | 1.73% | 1.74% | 1.77% | 1.78% | 1.80% |
| Net investment income (loss) | (1.17)% | (1.20)% | (.96)% | (.72)% | (.99)% |
| Supplemental Data | | | | | |
| Net assets, end of period (000 omitted) | $288,008 | $410,661 | $343,585 | $240,358 | $321,616 |
| Portfolio turnover rateG | 20% | 44% | 40%H | 88% | 84% |
A Calculated based on average shares outstanding during the period.
B Net investment income (loss) is affected by the timing of the declaration of dividends by any underlying mutual funds or exchange-traded funds (ETFs). Net investment income (loss) of any such underlying funds is not included in the Fund's net investment income (loss) ratio.
C Total returns would have been lower if certain expenses had not been reduced during the applicable periods shown.
D Total returns do not include the effect of the contingent deferred sales charge.
E Fees and expenses of any underlying mutual funds or exchange-traded funds (ETFs) are not included in the Fund's expense ratio. The Fund indirectly bears its proportionate share of these expenses. For additional expense information related to investments in Fidelity Central Funds, please refer to the "Investments in Fidelity Central Funds" note found in the Notes to Financial Statements section of the most recent Annual or Semi-Annual report.
F Expense ratios reflect operating expenses of the class. Expenses before reductions do not reflect amounts reimbursed, waived, or reduced through arrangements with the investment adviser, brokerage services, or other offset arrangements, if applicable, and do not represent the amount paid by the class during periods when reimbursements, waivers or reductions occur.
G Amount does not include the portfolio activity of any underlying mutual funds or exchange-traded funds (ETFs).
H Portfolio turnover rate excludes securities received or delivered in-kind.
See accompanying notes which are an integral part of the financial statements.
Fidelity Advisor Technology Fund Class I
| Years ended July 31, | 2022 | 2021 | 2020 | 2019 | 2018 |
| Selected Per–Share Data | | | | | |
| Net asset value, beginning of period | $112.95 | $83.56 | $57.41 | $64.86 | $55.69 |
| Income from Investment Operations | | | | | |
| Net investment income (loss)A,B | (.15) | (.17) | .04 | .17 | .02 |
| Net realized and unrealized gain (loss) | (15.67) | 36.76 | 27.72 | 2.15 | 13.71 |
| Total from investment operations | (15.82) | 36.59 | 27.76 | 2.32 | 13.73 |
| Distributions from net investment income | – | – | – | (.01) | – |
| Distributions from net realized gain | (12.84) | (7.20) | (1.61) | (9.76) | (4.56) |
| Total distributions | (12.84) | (7.20) | (1.61) | (9.77) | (4.56) |
| Net asset value, end of period | $84.29 | $112.95 | $83.56 | $57.41 | $64.86 |
| Total ReturnC | (16.56)% | 45.18% | 49.22% | 7.56% | 25.75% |
| Ratios to Average Net AssetsB,D,E | | | | | |
| Expenses before reductions | .71% | .72% | .74% | .76% | .78% |
| Expenses net of fee waivers, if any | .71% | .72% | .74% | .76% | .78% |
| Expenses net of all reductions | .71% | .72% | .74% | .76% | .77% |
| Net investment income (loss) | (.15)% | (.18)% | .07% | .30% | .03% |
| Supplemental Data | | | | | |
| Net assets, end of period (000 omitted) | $1,129,418 | $1,470,830 | $1,035,091 | $674,914 | $734,661 |
| Portfolio turnover rateF | 20% | 44% | 40%G | 88% | 84% |
A Calculated based on average shares outstanding during the period.
B Net investment income (loss) is affected by the timing of the declaration of dividends by any underlying mutual funds or exchange-traded funds (ETFs). Net investment income (loss) of any such underlying funds is not included in the Fund's net investment income (loss) ratio.
C Total returns would have been lower if certain expenses had not been reduced during the applicable periods shown.
D Fees and expenses of any underlying mutual funds or exchange-traded funds (ETFs) are not included in the Fund's expense ratio. The Fund indirectly bears its proportionate share of these expenses. For additional expense information related to investments in Fidelity Central Funds, please refer to the "Investments in Fidelity Central Funds" note found in the Notes to Financial Statements section of the most recent Annual or Semi-Annual report.
E Expense ratios reflect operating expenses of the class. Expenses before reductions do not reflect amounts reimbursed, waived, or reduced through arrangements with the investment adviser, brokerage services, or other offset arrangements, if applicable, and do not represent the amount paid by the class during periods when reimbursements, waivers or reductions occur.
F Amount does not include the portfolio activity of any underlying mutual funds or exchange-traded funds (ETFs).
G Portfolio turnover rate excludes securities received or delivered in-kind.
See accompanying notes which are an integral part of the financial statements.
Fidelity Advisor Technology Fund Class Z
| Years ended July 31, | 2022 | 2021 | 2020 | 2019 A |
| Selected Per–Share Data | | | | |
| Net asset value, beginning of period | $112.81 | $83.44 | $57.34 | $67.88 |
| Income from Investment Operations | | | | |
| Net investment income (loss)B,C | (.04) | (.06) | .12 | .23 |
| Net realized and unrealized gain (loss) | (15.63) | 36.72 | 27.68 | (.90) |
| Total from investment operations | (15.67) | 36.66 | 27.80 | (.67) |
| Distributions from net investment income | – | – | – | (.11) |
| Distributions from net realized gain | (12.92) | (7.29) | (1.70) | (9.76) |
| Total distributions | (12.92) | (7.29) | (1.70) | (9.87) |
| Net asset value, end of period | $84.22 | $112.81 | $83.44 | $57.34 |
| Total ReturnD,E | (16.46)% | 45.37% | 49.39% | 2.88% |
| Ratios to Average Net AssetsC,F,G | | | | |
| Expenses before reductions | .59% | .60% | .62% | .63%H |
| Expenses net of fee waivers, if any | .59% | .60% | .62% | .63%H |
| Expenses net of all reductions | .59% | .60% | .62% | .62%H |
| Net investment income (loss) | (.04)% | (.06)% | .19% | .53%H |
| Supplemental Data | | | | |
| Net assets, end of period (000 omitted) | $462,278 | $524,383 | $298,255 | $31,619 |
| Portfolio turnover rateI | 20% | 44% | 40%J | 88% |
A For the period October 2, 2018 (commencement of sale of shares) through July 31, 2019.
B Calculated based on average shares outstanding during the period.
C Net investment income (loss) is affected by the timing of the declaration of dividends by any underlying mutual funds or exchange-traded funds (ETFs). Net investment income (loss) of any such underlying funds is not included in the Fund's net investment income (loss) ratio.
D Total returns for periods of less than one year are not annualized.
E Total returns would have been lower if certain expenses had not been reduced during the applicable periods shown.
F Fees and expenses of any underlying mutual funds or exchange-traded funds (ETFs) are not included in the Fund's expense ratio. The Fund indirectly bears its proportionate share of these expenses. For additional expense information related to investments in Fidelity Central Funds, please refer to the "Investments in Fidelity Central Funds" note found in the Notes to Financial Statements section of the most recent Annual or Semi-Annual report.
G Expense ratios reflect operating expenses of the class. Expenses before reductions do not reflect amounts reimbursed, waived, or reduced through arrangements with the investment adviser, brokerage services, or other offset arrangements, if applicable, and do not represent the amount paid by the class during periods when reimbursements, waivers or reductions occur.
H Annualized
I Amount does not include the portfolio activity of any underlying mutual funds or exchange-traded funds (ETFs).
J Portfolio turnover rate excludes securities received or delivered in-kind.
See accompanying notes which are an integral part of the financial statements.
Fidelity Advisor® Utilities Fund
Performance: The Bottom Line
Average annual total return reflects the change in the value of an investment, assuming reinvestment of distributions from dividend income and capital gains (the profits earned upon the sale of securities that have grown in value, if any) and assuming a constant rate of performance each year. The hypothetical investment and the average annual total returns do not reflect the deduction of taxes that a shareholder would pay on fund distributions or the redemption of fund shares. During periods of reimbursement by Fidelity, a fund’s total return will be greater than it would be had the reimbursement not occurred. How a fund did yesterday is no guarantee of how it will do tomorrow.
Average Annual Total Returns
| For the periods ended July 31, 2022 | Past 1 year | Past 5 years | Past 10 years |
| Class A (incl. 5.75% sales charge) | 11.87% | 9.21% | 10.03% |
| Class M (incl. 3.50% sales charge) | 14.23% | 9.42% | 9.97% |
| Class C (incl. contingent deferred sales charge) | 16.78% | 9.69% | 10.03% |
| Class I | 19.00% | 10.81% | 11.00% |
| Class Z | 19.17% | 10.93% | 11.06% |
Class C shares' contingent deferred sales charges included in the past one year, past five years and past ten years total return figures are 1%, 0% and 0%, respectively.
The initial offering of Class Z shares took place on October 2, 2018. Returns prior to October 2, 2018, are those of Class I.
$10,000 Over 10 Years
Let's say hypothetically that $10,000 was invested in Fidelity Advisor® Utilities Fund - Class A on July 31, 2012, and the current 5.75% sales charge was paid.
The chart shows how the value of your investment would have changed, and also shows how the S&P 500® Index performed over the same period.
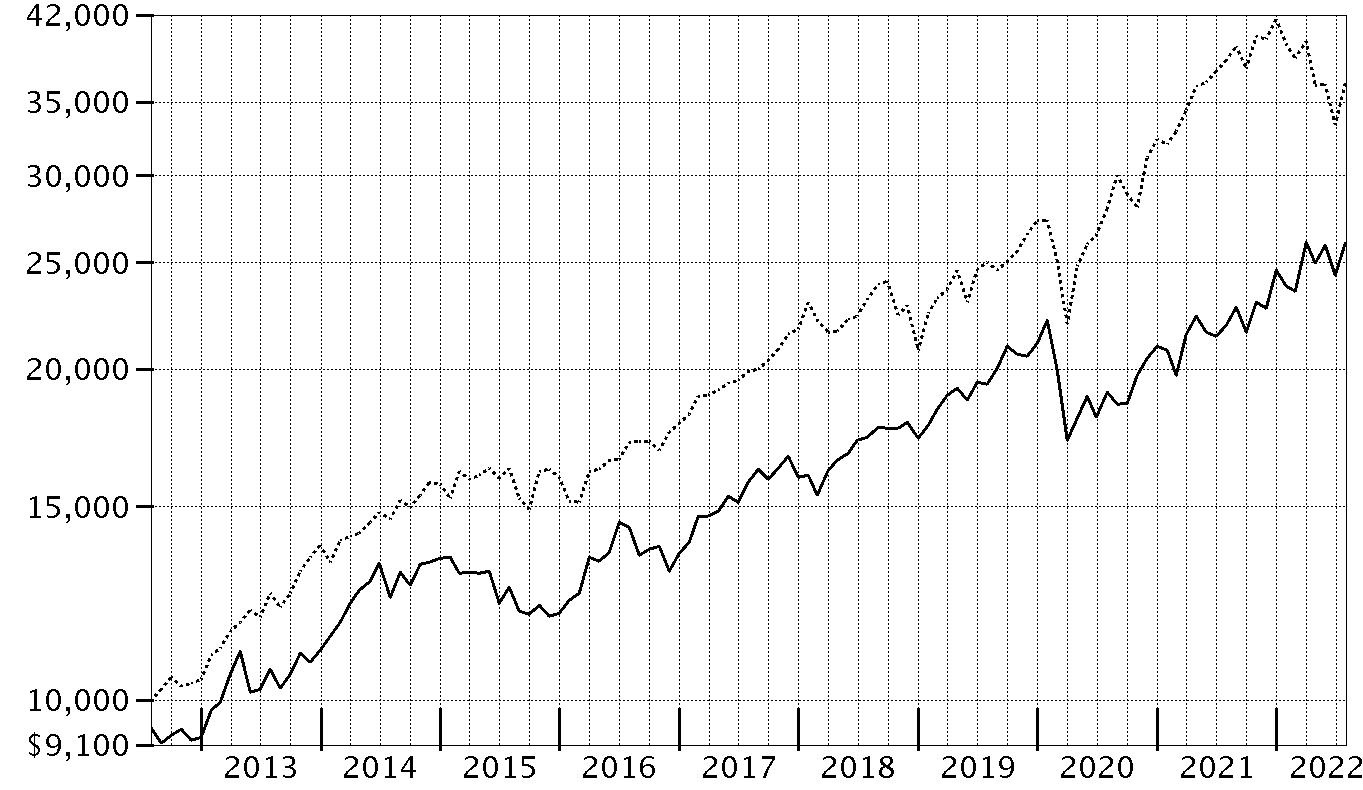
| Period Ending Values |
| $26,012 | Fidelity Advisor® Utilities Fund - Class A |
| $36,428 | S&P 500® Index |
Fidelity Advisor® Utilities Fund
Management's Discussion of Fund Performance
Market Recap: The S&P 500
® index returned -4.64% for the 12 months ending July 31, 2022, as a multitude of crosscurrents challenged the global economy and financial markets. Persistently high inflation, exacerbated by energy price shocks from the Russia–Ukraine conflict, spurred the U.S. Federal Reserve to hike interest rates more aggressively than anticipated, and concerns about the outlook for economic growth sent stocks into bear market territory. In early May, the Fed approved a rare half-percentage-point interest rate increase and announced plans to shrink its $9 trillion asset portfolio. June began with the Fed allowing up to billions in Treasuries and mortgage bonds to mature every month without investing the proceeds. Two weeks later, the central bank raised rates by 0.75 percentage points, its largest increase since 1994, and said it was becoming more difficult to achieve a soft landing, in which the economy slows enough to bring down inflation while avoiding a recession. Against this volatile backdrop, the S&P 500 posted its worst first-half result (-19.96%) to begin a year since 1970. Stocks sharply reversed course in July (+9.22%), as the Fed again raised its benchmark interest rate by 0.75% but signaled that, at some point, it will likely slow the pace of tightening to assess the impact on the economy. For the full 12 months, growth-oriented communication services (-29%) and consumer discretionary (-10%) stocks lagged most. In contrast, energy (+67%) rode a surge in commodity prices and led by a wide margin, followed by the defensive utilities (+16%) and consumer staples (+7%) sectors.
Comments from Portfolio Manager Douglas Simmons: For the fiscal year ending July 31, 2022, the fund's share classes (excluding sales charges, if applicable) gained roughly 18% to 19%, outperforming the 15.15% gain of the MSCI US IMI Utilities 25/50 Index, as well as the broad-based S&P 500
® index. Versus the sector index, security selection was the primary contributor. Security selection in electric utilities and an underweighting in water utilities helped the most. The biggest individual relative contributor was an overweight position in Exelon (+45%). Exelon was among the fund's biggest holdings. Our second-largest relative contributor this period was avoiding American Water Works, an index component that returned -7%. Another notable relative contributor was an overweighting in Constellation Energy (+25%), which was one of our largest holdings as of July 31. In contrast, the largest detractors from performance versus the sector index were stock picks and an overweighting in renewable electricity. Stock selection and an overweighting in independent power producers & energy traders and an underweighting in gas utilities also hurt the fund's relative result. The biggest individual relative detractor was an overweight position in AES (-4%). Also hurting performance was our lighter-than-index stake in Consolidated Edison, which gained 40%. This was a position we established the past year. Another notable relative detractor was an outsized stake in Sunnova Energy Intl (-33%). Notable changes in positioning include decreased exposure to the multi-utilities subindustry.
The views expressed above reflect those of the portfolio manager(s) only through the end of the period as stated on the cover of this report and do not necessarily represent the views of Fidelity or any other person in the Fidelity organization. Any such views are subject to change at any time based upon market or other conditions and Fidelity disclaims any responsibility to update such views. These views may not be relied on as investment advice and, because investment decisions for a Fidelity fund are based on numerous factors, may not be relied on as an indication of trading intent on behalf of any Fidelity fund.
Note to Shareholders: On October 1, 2021, Fidelity increased dividend distribution frequency for the fund because of its focus on industries that are associated with dividend-paying companies. Dividend distributions will be paid four times a year: April, July, October, and December. Quarterly dividend distributions will commence in April 2022. Please note that there are no changes to the frequency of capital gain distributions.
Fidelity Advisor® Utilities Fund
Investment Summary (Unaudited)
Top Ten Stocks as of July 31, 2022
| | % of fund's net assets |
| NextEra Energy, Inc. | 15.6 |
| Southern Co. | 11.4 |
| Sempra Energy | 6.1 |
| Exelon Corp. | 5.0 |
| American Electric Power Co., Inc. | 4.4 |
| Constellation Energy Corp. | 4.4 |
| Entergy Corp. | 4.0 |
| Duke Energy Corp. | 3.8 |
| PG&E Corp. | 3.7 |
| PPL Corp. | 3.6 |
| | 62.0 |
Industries (% of fund's net assets)
| As of July 31, 2022 |
| | Electric Utilities | 68.3% |
| | Multi-Utilities | 19.4% |
| | Independent Power and Renewable Electricity Producers | 8.1% |
| | Gas Utilities | 0.8% |
| | All Others* | 3.4% |

* Includes Short-Term investments and Net Other Assets (Liabilities).
Fidelity Advisor® Utilities Fund
Schedule of Investments July 31, 2022
Showing Percentage of Net Assets
| Common Stocks - 96.6% | | | |
| | | Shares | Value |
| Electric Utilities - 68.3% | | | |
| Electric Utilities - 68.3% | | | |
| American Electric Power Co., Inc. | | 369,917 | $36,459,020 |
| Avangrid, Inc. (a) | | 118,062 | 5,753,161 |
| Constellation Energy Corp. | | 548,958 | 36,286,124 |
| Duke Energy Corp. | | 287,785 | 31,636,205 |
| Edison International | | 381,790 | 25,873,908 |
| Entergy Corp. | | 292,194 | 33,640,295 |
| Evergy, Inc. | | 24,879 | 1,698,241 |
| Eversource Energy | | 282,058 | 24,883,157 |
| Exelon Corp. | | 897,372 | 41,718,824 |
| FirstEnergy Corp. | | 621,049 | 25,525,114 |
| NextEra Energy, Inc. | | 1,536,548 | 129,822,939 |
| OGE Energy Corp. | | 240,247 | 9,869,347 |
| PG&E Corp. (b) | | 2,804,789 | 30,460,009 |
| PNM Resources, Inc. | | 37,400 | 1,805,298 |
| Portland General Electric Co. | | 36,097 | 1,853,220 |
| PPL Corp. | | 1,026,700 | 29,856,436 |
| Southern Co. | | 1,229,672 | 94,549,480 |
| Xcel Energy, Inc. | | 74,000 | 5,415,320 |
| | | | 567,106,098 |
| Gas Utilities - 0.8% | | | |
| Gas Utilities - 0.8% | | | |
| Southwest Gas Corp. | | 81,300 | 7,069,848 |
| Independent Power and Renewable Electricity Producers - 8.1% | | | |
| Independent Power Producers & Energy Traders - 5.9% | | | |
| Clearway Energy, Inc.: | | | |
| Class A | | 93,226 | 3,219,094 |
| Class C | | 37,964 | 1,425,169 |
| The AES Corp. | | 836,820 | 18,594,140 |
| Vistra Corp. | | 994,052 | 25,696,244 |
| | | | 48,934,647 |
| Renewable Electricity - 2.2% | | | |
| NextEra Energy Partners LP (a) | | 182,590 | 15,107,497 |
| Sunnova Energy International, Inc. (a)(b) | | 121,595 | 3,163,902 |
| | | | 18,271,399 |
|
| TOTAL INDEPENDENT POWER AND RENEWABLE ELECTRICITY PRODUCERS | | | 67,206,046 |
|
| Multi-Utilities - 19.4% | | | |
| Multi-Utilities - 19.4% | | | |
| CenterPoint Energy, Inc.�� | | 688,369 | 21,814,414 |
| Consolidated Edison, Inc. | | 73,209 | 7,267,457 |
| Dominion Energy, Inc. | | 355,376 | 29,133,724 |
| NiSource, Inc. | | 827,952 | 25,169,741 |
| Public Service Enterprise Group, Inc. | | 406,205 | 26,675,482 |
| Sempra Energy | | 306,500 | 50,817,700 |
| | | | 160,878,518 |
| TOTAL COMMON STOCKS | | | |
| (Cost $609,959,666) | | | 802,260,510 |
|
| Money Market Funds - 4.4% | | | |
| Fidelity Cash Central Fund 2.01% (c) | | 19,540,570 | 19,544,478 |
| Fidelity Securities Lending Cash Central Fund 2.01% (c)(d) | | 16,916,648 | 16,918,340 |
| TOTAL MONEY MARKET FUNDS | | | |
| (Cost $36,462,818) | | | 36,462,818 |
| TOTAL INVESTMENT IN SECURITIES - 101.0% | | | |
| (Cost $646,422,484) | | | 838,723,328 |
| NET OTHER ASSETS (LIABILITIES) - (1.0)% | | | (7,951,898) |
| NET ASSETS - 100% | | | $830,771,430 |
Legend
(a) Security or a portion of the security is on loan at period end.
(b) Non-income producing
(c) Affiliated fund that is generally available only to investment companies and other accounts managed by Fidelity Investments. The rate quoted is the annualized seven-day yield of the fund at period end. A complete unaudited listing of the fund's holdings as of its most recent quarter end is available upon request. In addition, each Fidelity Central Fund's financial statements, which are not covered by the Fund's Report of Independent Registered Public Accounting Firm, are available on the SEC's website or upon request.
(d) Investment made with cash collateral received from securities on loan.
Affiliated Central Funds
Fiscal year to date information regarding the Fund's investments in Fidelity Central Funds, including the ownership percentage, is presented below.
| Fund | Value, beginning of period | Purchases | Sales Proceeds | Dividend Income | Realized Gain/Loss | Change in Unrealized appreciation (depreciation) | Value, end of period | % ownership, end of period |
| Fidelity Cash Central Fund 2.01% | $9,596,579 | $254,324,281 | $244,376,382 | $83,400 | $-- | $-- | $19,544,478 | 0.0% |
| Fidelity Securities Lending Cash Central Fund 2.01% | 21,565,325 | 80,696,556 | 85,343,541 | 10,504 | -- | -- | 16,918,340 | 0.0% |
| Total | $31,161,904 | $335,020,837 | $329,719,923 | $93,904 | $-- | $-- | $36,462,818 | |
Amounts in the income column in the above table include any capital gain distributions from underlying funds, which are presented in the corresponding line-item in the Statement of Operations, if applicable. Amount for Fidelity Securities Lending Cash Central Fund represents the income earned on investing cash collateral, less rebates paid to borrowers and any lending agent fees associated with the loan, plus any premium payments received for lending certain types of securities.
Investment Valuation
The following is a summary of the inputs used, as of July 31, 2022, involving the Fund's assets and liabilities carried at fair value. The inputs or methodology used for valuing securities may not be an indication of the risk associated with investing in those securities. For more information on valuation inputs, and their aggregation into the levels used below, please refer to the Investment Valuation section in the accompanying Notes to Financial Statements.
| | Valuation Inputs at Reporting Date: |
| Description | Total | Level 1 | Level 2 | Level 3 |
| Investments in Securities: | | | | |
| Common Stocks | $802,260,510 | $802,260,510 | $-- | $-- |
| Money Market Funds | 36,462,818 | 36,462,818 | -- | -- |
| Total Investments in Securities: | $838,723,328 | $838,723,328 | $-- | $-- |
See accompanying notes which are an integral part of the financial statements.
Fidelity Advisor® Utilities Fund
Financial Statements
Statement of Assets and Liabilities
| | | July 31, 2022 |
| Assets | | |
Investment in securities, at value (including securities loaned of $16,654,725) — See accompanying schedule:
Unaffiliated issuers (cost $609,959,666) | $802,260,510 | |
| Fidelity Central Funds (cost $36,462,818) | 36,462,818 | |
| Total Investment in Securities (cost $646,422,484) | | $838,723,328 |
| Receivable for investments sold | | 7,480,989 |
| Receivable for fund shares sold | | 2,146,360 |
| Dividends receivable | | 601,729 |
| Distributions receivable from Fidelity Central Funds | | 30,674 |
| Prepaid expenses | | 814 |
| Total assets | | 848,983,894 |
| Liabilities | | |
| Payable for fund shares redeemed | $649,370 | |
| Distributions payable | 12 | |
| Accrued management fee | 339,050 | |
| Distribution and service plan fees payable | 137,948 | |
| Other affiliated payables | 124,008 | |
| Other payables and accrued expenses | 43,736 | |
| Collateral on securities loaned | 16,918,340 | |
| Total liabilities | | 18,212,464 |
| Net Assets | | $830,771,430 |
| Net Assets consist of: | | |
| Paid in capital | | $621,277,679 |
| Total accumulated earnings (loss) | | 209,493,751 |
| Net Assets | | $830,771,430 |
| Net Asset Value and Maximum Offering Price | | |
| Class A: | | |
| Net Asset Value and redemption price per share ($322,060,053 ÷ 8,109,796 shares)(a) | | $39.71 |
| Maximum offering price per share (100/94.25 of $39.71) | | $42.13 |
| Class M: | | |
| Net Asset Value and redemption price per share ($71,690,336 ÷ 1,800,670 shares)(a) | | $39.81 |
| Maximum offering price per share (100/96.50 of $39.81) | | $41.25 |
| Class C: | | |
| Net Asset Value and offering price per share ($61,087,347 ÷ 1,577,294 shares)(a) | | $38.73 |
| Class I: | | |
| Net Asset Value, offering price and redemption price per share ($269,667,337 ÷ 6,629,070 shares) | | $40.68 |
| Class Z: | | |
| Net Asset Value, offering price and redemption price per share ($106,266,357 ÷ 2,613,681 shares) | | $40.66 |
(a) Redemption price per share is equal to net asset value less any applicable contingent deferred sales charge.
See accompanying notes which are an integral part of the financial statements.
Statement of Operations
| | | Year ended July 31, 2022 |
| Investment Income | | |
| Dividends | | $15,674,166 |
| Income from Fidelity Central Funds (including $10,504 from security lending) | | 93,904 |
| Total income | | 15,768,070 |
| Expenses | | |
| Management fee | $3,408,211 | |
| Transfer agent fees | 1,084,485 | |
| Distribution and service plan fees | 1,541,093 | |
| Accounting fees | 231,001 | |
| Custodian fees and expenses | 5,569 | |
| Independent trustees' fees and expenses | 2,076 | |
| Registration fees | 112,475 | |
| Audit | 47,583 | |
| Legal | 1,127 | |
| Interest | 349 | |
| Miscellaneous | 2,232 | |
| Total expenses before reductions | 6,436,201 | |
| Expense reductions | (20,366) | |
| Total expenses after reductions | | 6,415,835 |
| Net investment income (loss) | | 9,352,235 |
| Realized and Unrealized Gain (Loss) | | |
| Net realized gain (loss) on: | | |
| Investment securities: | | |
| Unaffiliated issuers | 20,793,548 | |
| Total net realized gain (loss) | | 20,793,548 |
| Change in net unrealized appreciation (depreciation) on: | | |
| Investment securities: | | |
| Unaffiliated issuers | 75,437,981 | |
| Assets and liabilities in foreign currencies | (1,235) | |
| Total change in net unrealized appreciation (depreciation) | | 75,436,746 |
| Net gain (loss) | | 96,230,294 |
| Net increase (decrease) in net assets resulting from operations | | $105,582,529 |
See accompanying notes which are an integral part of the financial statements.
Statement of Changes in Net Assets
| | Year ended July 31, 2022 | Year ended July 31, 2021 |
| Increase (Decrease) in Net Assets | | |
| Operations | | |
| Net investment income (loss) | $9,352,235 | $9,817,556 |
| Net realized gain (loss) | 20,793,548 | 25,296,008 |
| Change in net unrealized appreciation (depreciation) | 75,436,746 | 44,043,923 |
| Net increase (decrease) in net assets resulting from operations | 105,582,529 | 79,157,487 |
| Distributions to shareholders | (19,701,144) | (12,048,409) |
| Share transactions - net increase (decrease) | 184,796,381 | (118,271,345) |
| Total increase (decrease) in net assets | 270,677,766 | (51,162,267) |
| Net Assets | | |
| Beginning of period | 560,093,664 | 611,255,931 |
| End of period | $830,771,430 | $560,093,664 |
See accompanying notes which are an integral part of the financial statements.
Financial Highlights
Fidelity Advisor Utilities Fund Class A
| Years ended July 31, | 2022 | 2021 | 2020 | 2019 | 2018 |
| Selected Per–Share Data | | | | | |
| Net asset value, beginning of period | $34.53 | $30.67 | $31.73 | $31.54 | $29.74 |
| Income from Investment Operations | | | | | |
| Net investment income (loss)A,B | .52 | .56 | .60 | .67 | .49 |
| Net realized and unrealized gain (loss) | 5.84 | 3.98 | (1.03) | 2.81 | 2.38 |
| Total from investment operations | 6.36 | 4.54 | (.43) | 3.48 | 2.87 |
| Distributions from net investment income | (.67) | (.68) | (.62) | (.48) | (.49) |
| Distributions from net realized gain | (.51) | – | –C | (2.81) | (.58) |
| Total distributions | (1.18) | (.68) | (.63)D | (3.29) | (1.07) |
| Net asset value, end of period | $39.71 | $34.53 | $30.67 | $31.73 | $31.54 |
| Total ReturnE,F | 18.70% | 14.95% | (1.56)% | 11.73% | 9.84% |
| Ratios to Average Net AssetsB,G,H | | | | | |
| Expenses before reductions | 1.02% | 1.05% | 1.06% | 1.08% | 1.12% |
| Expenses net of fee waivers, if any | 1.02% | 1.04% | 1.06% | 1.07% | 1.11% |
| Expenses net of all reductions | 1.02% | 1.03% | 1.05% | 1.06% | 1.09% |
| Net investment income (loss) | 1.41% | 1.70% | 1.88% | 2.14% | 1.66% |
| Supplemental Data | | | | | |
| Net assets, end of period (000 omitted) | $322,060 | $254,388 | $249,158 | $268,246 | $173,999 |
| Portfolio turnover rateI | 36% | 45% | 80%J | 56% | 106% |
A Calculated based on average shares outstanding during the period.
B Net investment income (loss) is affected by the timing of the declaration of dividends by any underlying mutual funds or exchange-traded funds (ETFs). Net investment income (loss) of any such underlying funds is not included in the Fund's net investment income (loss) ratio.
C Amount represents less than $.005 per share.
D Total distributions per share do not sum due to rounding.
E Total returns would have been lower if certain expenses had not been reduced during the applicable periods shown.
F Total returns do not include the effect of the sales charges.
G Fees and expenses of any underlying mutual funds or exchange-traded funds (ETFs) are not included in the Fund's expense ratio. The Fund indirectly bears its proportionate share of these expenses. For additional expense information related to investments in Fidelity Central Funds, please refer to the "Investments in Fidelity Central Funds" note found in the Notes to Financial Statements section of the most recent Annual or Semi-Annual report.
H Expense ratios reflect operating expenses of the class. Expenses before reductions do not reflect amounts reimbursed, waived, or reduced through arrangements with the investment adviser, brokerage services, or other offset arrangements, if applicable, and do not represent the amount paid by the class during periods when reimbursements, waivers or reductions occur.
I Amount does not include the portfolio activity of any underlying mutual funds or exchange-traded funds (ETFs).
J Portfolio turnover rate excludes securities received or delivered in-kind.
See accompanying notes which are an integral part of the financial statements.
Fidelity Advisor Utilities Fund Class M
| Years ended July 31, | 2022 | 2021 | 2020 | 2019 | 2018 |
| Selected Per–Share Data | | | | | |
| Net asset value, beginning of period | $34.57 | $30.71 | $31.77 | $31.58 | $29.77 |
| Income from Investment Operations | | | | | |
| Net investment income (loss)A,B | .42 | .47 | .51 | .58 | .41 |
| Net realized and unrealized gain (loss) | 5.85 | 3.99 | (1.03) | 2.81 | 2.38 |
| Total from investment operations | 6.27 | 4.46 | (.52) | 3.39 | 2.79 |
| Distributions from net investment income | (.51) | (.60) | (.53) | (.39) | (.40) |
| Distributions from net realized gain | (.51) | – | –C | (2.81) | (.58) |
| Total distributions | (1.03)D | (.60) | (.54)D | (3.20) | (.98) |
| Net asset value, end of period | $39.81 | $34.57 | $30.71 | $31.77 | $31.58 |
| Total ReturnE,F | 18.37% | 14.63% | (1.82)% | 11.38% | 9.53% |
| Ratios to Average Net AssetsB,G,H | | | | | |
| Expenses before reductions | 1.30% | 1.32% | 1.33% | 1.36% | 1.41% |
| Expenses net of fee waivers, if any | 1.29% | 1.32% | 1.33% | 1.36% | 1.41% |
| Expenses net of all reductions | 1.29% | 1.31% | 1.33% | 1.35% | 1.39% |
| Net investment income (loss) | 1.14% | 1.42% | 1.60% | 1.86% | 1.36% |
| Supplemental Data | | | | | |
| Net assets, end of period (000 omitted) | $71,690 | $58,065 | $58,773 | $61,741 | $46,669 |
| Portfolio turnover rateI | 36% | 45% | 80%J | 56% | 106% |
A Calculated based on average shares outstanding during the period.
B Net investment income (loss) is affected by the timing of the declaration of dividends by any underlying mutual funds or exchange-traded funds (ETFs). Net investment income (loss) of any such underlying funds is not included in the Fund's net investment income (loss) ratio.
C Amount represents less than $.005 per share.
D Total distributions per share do not sum due to rounding.
E Total returns would have been lower if certain expenses had not been reduced during the applicable periods shown.
F Total returns do not include the effect of the sales charges.
G Fees and expenses of any underlying mutual funds or exchange-traded funds (ETFs) are not included in the Fund's expense ratio. The Fund indirectly bears its proportionate share of these expenses. For additional expense information related to investments in Fidelity Central Funds, please refer to the "Investments in Fidelity Central Funds" note found in the Notes to Financial Statements section of the most recent Annual or Semi-Annual report.
H Expense ratios reflect operating expenses of the class. Expenses before reductions do not reflect amounts reimbursed, waived, or reduced through arrangements with the investment adviser, brokerage services, or other offset arrangements, if applicable, and do not represent the amount paid by the class during periods when reimbursements, waivers or reductions occur.
I Amount does not include the portfolio activity of any underlying mutual funds or exchange-traded funds (ETFs).
J Portfolio turnover rate excludes securities received or delivered in-kind.
See accompanying notes which are an integral part of the financial statements.
Fidelity Advisor Utilities Fund Class C
| Years ended July 31, | 2022 | 2021 | 2020 | 2019 | 2018 |
| Selected Per–Share Data | | | | | |
| Net asset value, beginning of period | $33.60 | $29.83 | $30.90 | $30.81 | $29.07 |
| Income from Investment Operations | | | | | |
| Net investment income (loss)A,B | .24 | .30 | .35 | .42 | .26 |
| Net realized and unrealized gain (loss) | 5.67 | 3.88 | (1.01) | 2.74 | 2.33 |
| Total from investment operations | 5.91 | 4.18 | (.66) | 3.16 | 2.59 |
| Distributions from net investment income | (.27) | (.41) | (.40) | (.26) | (.27) |
| Distributions from net realized gain | (.51) | – | –C | (2.81) | (.58) |
| Total distributions | (.78) | (.41) | (.41)D | (3.07) | (.85) |
| Net asset value, end of period | $38.73 | $33.60 | $29.83 | $30.90 | $30.81 |
| Total ReturnE,F | 17.78% | 14.10% | (2.28)% | 10.87% | 9.04% |
| Ratios to Average Net AssetsB,G,H | | | | | |
| Expenses before reductions | 1.78% | 1.80% | 1.81% | 1.83% | 1.87% |
| Expenses net of fee waivers, if any | 1.78% | 1.80% | 1.81% | 1.83% | 1.87% |
| Expenses net of all reductions | 1.78% | 1.79% | 1.80% | 1.82% | 1.85% |
| Net investment income (loss) | .65% | .94% | 1.12% | 1.39% | .90% |
| Supplemental Data | | | | | |
| Net assets, end of period (000 omitted) | $61,087 | $49,312 | $63,458 | $66,525 | $53,099 |
| Portfolio turnover rateI | 36% | 45% | 80%J | 56% | 106% |
A Calculated based on average shares outstanding during the period.
B Net investment income (loss) is affected by the timing of the declaration of dividends by any underlying mutual funds or exchange-traded funds (ETFs). Net investment income (loss) of any such underlying funds is not included in the Fund's net investment income (loss) ratio.
C Amount represents less than $.005 per share.
D Total distributions per share do not sum due to rounding.
E Total returns would have been lower if certain expenses had not been reduced during the applicable periods shown.
F Total returns do not include the effect of the contingent deferred sales charge.
G Fees and expenses of any underlying mutual funds or exchange-traded funds (ETFs) are not included in the Fund's expense ratio. The Fund indirectly bears its proportionate share of these expenses. For additional expense information related to investments in Fidelity Central Funds, please refer to the "Investments in Fidelity Central Funds" note found in the Notes to Financial Statements section of the most recent Annual or Semi-Annual report.
H Expense ratios reflect operating expenses of the class. Expenses before reductions do not reflect amounts reimbursed, waived, or reduced through arrangements with the investment adviser, brokerage services, or other offset arrangements, if applicable, and do not represent the amount paid by the class during periods when reimbursements, waivers or reductions occur.
I Amount does not include the portfolio activity of any underlying mutual funds or exchange-traded funds (ETFs).
J Portfolio turnover rate excludes securities received or delivered in-kind.
See accompanying notes which are an integral part of the financial statements.
Fidelity Advisor Utilities Fund Class I
| Years ended July 31, | 2022 | 2021 | 2020 | 2019 | 2018 |
| Selected Per–Share Data | | | | | |
| Net asset value, beginning of period | $35.39 | $31.40 | $32.47 | $32.21 | $30.35 |
| Income from Investment Operations | | | | | |
| Net investment income (loss)A,B | .64 | .66 | .71 | .76 | .59 |
| Net realized and unrealized gain (loss) | 5.98 | 4.10 | (1.07) | 2.88 | 2.43 |
| Total from investment operations | 6.62 | 4.76 | (.36) | 3.64 | 3.02 |
| Distributions from net investment income | (.81) | (.77) | (.71) | (.58) | (.58) |
| Distributions from net realized gain | (.51) | – | –C | (2.81) | (.58) |
| Total distributions | (1.33)D | (.77) | (.71) | (3.38)D | (1.16) |
| Net asset value, end of period | $40.68 | $35.39 | $31.40 | $32.47 | $32.21 |
| Total ReturnE | 19.00% | 15.30% | (1.30)% | 12.04% | 10.14% |
| Ratios to Average Net AssetsB,F,G | | | | | |
| Expenses before reductions | .76% | .77% | .79% | .81% | .84% |
| Expenses net of fee waivers, if any | .75% | .77% | .78% | .80% | .84% |
| Expenses net of all reductions | .75% | .76% | .78% | .79% | .82% |
| Net investment income (loss) | 1.68% | 1.97% | 2.15% | 2.41% | 1.93% |
| Supplemental Data | | | | | |
| Net assets, end of period (000 omitted) | $269,667 | $143,582 | $187,833 | $229,777 | $55,462 |
| Portfolio turnover rateH | 36% | 45% | 80%I | 56% | 106% |
A Calculated based on average shares outstanding during the period.
B Net investment income (loss) is affected by the timing of the declaration of dividends by any underlying mutual funds or exchange-traded funds (ETFs). Net investment income (loss) of any such underlying funds is not included in the Fund's net investment income (loss) ratio.
C Amount represents less than $.005 per share.
D Total distributions per share do not sum due to rounding.
E Total returns would have been lower if certain expenses had not been reduced during the applicable periods shown.
F Fees and expenses of any underlying mutual funds or exchange-traded funds (ETFs) are not included in the Fund's expense ratio. The Fund indirectly bears its proportionate share of these expenses. For additional expense information related to investments in Fidelity Central Funds, please refer to the "Investments in Fidelity Central Funds" note found in the Notes to Financial Statements section of the most recent Annual or Semi-Annual report.
G Expense ratios reflect operating expenses of the class. Expenses before reductions do not reflect amounts reimbursed, waived, or reduced through arrangements with the investment adviser, brokerage services, or other offset arrangements, if applicable, and do not represent the amount paid by the class during periods when reimbursements, waivers or reductions occur.
H Amount does not include the portfolio activity of any underlying mutual funds or exchange-traded funds (ETFs).
I Portfolio turnover rate excludes securities received or delivered in-kind.
See accompanying notes which are an integral part of the financial statements.
Fidelity Advisor Utilities Fund Class Z
| Years ended July 31, | 2022 | 2021 | 2020 | 2019 A |
| Selected Per–Share Data | | | | |
| Net asset value, beginning of period | $35.38 | $31.42 | $32.48 | $33.14 |
| Income from Investment Operations | | | | |
| Net investment income (loss)B,C | .69 | .71 | .74 | .63 |
| Net realized and unrealized gain (loss) | 5.98 | 4.08 | (1.04) | 2.13 |
| Total from investment operations | 6.67 | 4.79 | (.30) | 2.76 |
| Distributions from net investment income | (.88) | (.83) | (.75) | (.61) |
| Distributions from net realized gain | (.51) | – | –D | (2.81) |
| Total distributions | (1.39) | (.83) | (.76)E | (3.42) |
| Net asset value, end of period | $40.66 | $35.38 | $31.42 | $32.48 |
| Total ReturnF,G | 19.17% | 15.41% | (1.15)% | 9.04% |
| Ratios to Average Net AssetsC,H,I | | | | |
| Expenses before reductions | .63% | .64% | .65% | .66%J |
| Expenses net of fee waivers, if any | .63% | .64% | .65% | .66%J |
| Expenses net of all reductions | .63% | .63% | .64% | .64%J |
| Net investment income (loss) | 1.81% | 2.10% | 2.29% | 2.41%J |
| Supplemental Data | | | | |
| Net assets, end of period (000 omitted) | $106,266 | $54,746 | $52,034 | $17,071 |
| Portfolio turnover rateK | 36% | 45% | 80%L | 56% |
A For the period October 2, 2018 (commencement of sale of shares) through July 31, 2019.
B Calculated based on average shares outstanding during the period.
C Net investment income (loss) is affected by the timing of the declaration of dividends by any underlying mutual funds or exchange-traded funds (ETFs). Net investment income (loss) of any such underlying funds is not included in the Fund's net investment income (loss) ratio.
D Amount represents less than $.005 per share.
E Total distributions per share do not sum due to rounding.
F Total returns for periods of less than one year are not annualized.
G Total returns would have been lower if certain expenses had not been reduced during the applicable periods shown.
H Fees and expenses of any underlying mutual funds or exchange-traded funds (ETFs) are not included in the Fund's expense ratio. The Fund indirectly bears its proportionate share of these expenses. For additional expense information related to investments in Fidelity Central Funds, please refer to the "Investments in Fidelity Central Funds" note found in the Notes to Financial Statements section of the most recent Annual or Semi-Annual report.
I Expense ratios reflect operating expenses of the class. Expenses before reductions do not reflect amounts reimbursed, waived, or reduced through arrangements with the investment adviser, brokerage services, or other offset arrangements, if applicable, and do not represent the amount paid by the class during periods when reimbursements, waivers or reductions occur.
J Annualized
K Amount does not include the portfolio activity of any underlying mutual funds or exchange-traded funds (ETFs).
L Portfolio turnover rate excludes securities received or delivered in-kind.
See accompanying notes which are an integral part of the financial statements.
Notes to Financial Statements
For the period ended July 31, 2022
1. Organization.
Fidelity Advisor Biotechnology Fund, Fidelity Advisor Consumer Discretionary Fund, Fidelity Advisor Energy Fund, Fidelity Advisor Financial Services Fund, Fidelity Advisor Health Care Fund, Fidelity Advisor Industrials Fund, Fidelity Advisor Semiconductors Fund, Fidelity Advisor Technology Fund and Fidelity Advisor Utilities Fund (the Funds) are funds of Fidelity Advisor Series VII (the Trust) and are authorized to issue an unlimited number of shares. The Trust is registered under the Investment Company Act of 1940, as amended (the 1940 Act), as an open-end management investment company organized as a Massachusetts business trust. The Funds are non-diversified with the exception of Fidelity Advisor Financial Services Fund and Fidelity Adviser Health Care Fund. Each Fund offers Class A, Class M, Class C, Class I and Class Z shares, each of which has equal rights as to assets and voting privileges. Each class has exclusive voting rights with respect to matters that affect that class. Class C shares will automatically convert to Class A shares after a holding period of eight years from the initial date of purchase, with certain exceptions.
2. Investments in Fidelity Central Funds.
Funds may invest in Fidelity Central Funds, which are open-end investment companies generally available only to other investment companies and accounts managed by the investment adviser and its affiliates. The Schedule of Investments lists any Fidelity Central Funds held as an investment as of period end, but does not include the underlying holdings of each Fidelity Central Fund. An investing fund indirectly bears its proportionate share of the expenses of the underlying Fidelity Central Funds.
Based on its investment objective, each Fidelity Central Fund may invest or participate in various investment vehicles or strategies that are similar to those of the investing fund. These strategies are consistent with the investment objectives of the investing fund and may involve certain economic risks which may cause a decline in value of each of the Fidelity Central Funds and thus a decline in the value of the investing fund.
| Fidelity Central Fund | Investment Manager | Investment Objective | Investment Practices | Expense Ratio(a) |
| Fidelity Money Market Central Funds | Fidelity Management & Research Company LLC (FMR) | Each fund seeks to obtain a high level of current income consistent with the preservation of capital and liquidity. | Short-term Investments | Less than .005% |
(a) Expenses expressed as a percentage of average net assets and are as of each underlying Central Fund's most recent annual or semi-annual shareholder report.
A complete unaudited list of holdings for each Fidelity Central Fund is available upon request or at the Securities and Exchange Commission website at www.sec.gov. In addition, the financial statements of the Fidelity Central Funds which contain the significant accounting policies (including investment valuation policies) of those funds, and are not covered by the Report of Independent Registered Public Accounting Firm, are available on the Securities and Exchange Commission website or upon request.
3. Significant Accounting Policies.
Each Fund is an investment company and applies the accounting and reporting guidance of the Financial Accounting Standards Board (FASB) Accounting Standards Codification Topic 946 Financial Services - Investment Companies. The financial statements have been prepared in conformity with accounting principles generally accepted in the United States of America (GAAP), which require management to make certain estimates and assumptions at the date of the financial statements. Actual results could differ from those estimates. Subsequent events, if any, through the date that the financial statements were issued have been evaluated in the preparation of the financial statements. Each Fund's Schedule of Investments lists any underlying mutual funds or exchange-traded funds (ETFs) but does not include the underlying holdings of these funds. The following summarizes the significant accounting policies of each Fund:
Investment Valuation. Investments are valued as of 4:00 p.m. Eastern time on the last calendar day of the period. The Board of Trustees (the Board) has delegated the day to day responsibility for the valuation of each Fund's investments to the Fair Value Committee (the Committee) established by each Fund's investment adviser. In accordance with valuation policies and procedures approved by the Board, each Fund attempts to obtain prices from one or more third party pricing vendors or brokers to value its investments. When current market prices, quotations or currency exchange rates are not readily available or reliable, investments will be fair valued in good faith by the Committee, in accordance with procedures adopted by the Board. Factors used in determining fair value vary by investment type and may include market or investment specific events, changes in interest rates and credit quality. The frequency with which these procedures are used cannot be predicted and they may be utilized to a significant extent. The Committee oversees each Fund's valuation policies and procedures and reports to the Board on the Committee's activities and fair value determinations. The Board monitors the appropriateness of the procedures used in valuing each Fund's investments and ratifies the fair value determinations of the Committee.
Each Fund categorizes the inputs to valuation techniques used to value its investments into a disclosure hierarchy consisting of three levels as shown below:
- Level 1 – unadjusted quoted prices in active markets for identical investments
- Level 2 – other significant observable inputs (including quoted prices for similar investments, interest rates, prepayment speeds, etc.)
- Level 3 – unobservable inputs (including the Fund's own assumptions based on the best information available)
Valuation techniques used to value each Fund's investments by major category are as follows:
Equity securities, including restricted securities, for which market quotations are readily available, are valued at the last reported sale price or official closing price as reported by a third party pricing vendor on the primary market or exchange on which they are traded and are categorized as Level 1 in the hierarchy. In the event there were no sales during the day or closing prices are not available, securities are valued at the last quoted bid price or may be valued using the last available price and are generally categorized as Level 2 in the hierarchy. For foreign equity securities, when market or security specific events arise, comparisons to the valuation of American Depositary Receipts (ADRs), futures contracts, ETFs and certain indexes as well as quoted prices for similar securities may be used and would be categorized as Level 2 in the hierarchy. For equity securities, including restricted securities, where observable inputs are limited, assumptions about market activity and risk are used and these securities may be categorized as Level 3 in the hierarchy. Securities, including private placements or other restricted securities, for which observable inputs are not available are valued using alternate valuation approaches, including the market approach, the income approach and cost approach, and are categorized as Level 3 in the hierarchy. The market approach considers factors including the price of recent investments in the same or a similar security or financial metrics of comparable securities. The income approach considers factors including expected future cash flows, security specific risks and corresponding discount rates. The cost approach considers factors including the value of the security's underlying assets and liabilities.
Debt securities, including restricted securities, are valued based on evaluated prices received from third party pricing vendors or from brokers who make markets in such securities. Corporate bonds and preferred securities are valued by pricing vendors who utilize matrix pricing which considers yield or price of bonds of comparable quality, coupon, maturity and type or by broker-supplied prices. When independent prices are unavailable or unreliable, debt securities may be valued utilizing pricing methodologies which consider similar factors that would be used by third party pricing vendors. Debt securities are generally categorized as Level 2 in the hierarchy but may be Level 3 depending on the circumstances.
Investments in open-end mutual funds, including the Fidelity Central Funds, are valued at their closing net asset value (NAV) each business day and are categorized as Level 1 in the hierarchy.
The following provides information on Level 3 securities held by the Fund that were valued at period end based on unobservable inputs. These amounts exclude valuations provided by a broker.
Fidelity Advisor Biotechnology
| Asset Type | Fair Value | Valuation Technique(s) | Unobservable Input | Amount or Range/Weighted Average | Impact to Valuation from an Increase in Input(a) |
| Equities | $37,867,811 | Market Approach | Discount rate | 14.1% - 44.9% / 36.7% | Decrease |
| | | | Transaction price | $1.35 - $8.90 / $4.68 | Increase |
| | | Recovery value | Recovery value | $0.00 | Increase |
| | | Discounted cash flow | Discount rate | 8.0% - 10.0% / 9.6% | Decrease |
| | | | Discount for lack of marketability | 10.0% | Decrease |
| | | | Probability rate | 0.6% - 50.0% / 17.9% | Increase |
(a) Represents the directional change in the fair value of the Level 3 investments that could have resulted from an increase in the corresponding input as of period end. A decrease to the unobservable input would have had the opposite effect. Significant changes in these inputs may have resulted in a significantly higher or lower fair value measurement at period end.
Fidelity Advisor Health Care
| Asset Type | Fair Value | Valuation Technique(s) | Unobservable Input | Amount or Range/Weighted Average | Impact to Valuation from an Increase in Input(a) |
| Equities | $73,588,926 | Market Approach | Discount rate | 31.1% - 49.5% / 34.1% | Decrease |
| | | | Transaction price | $1.73 - $28.70 / $13.87 | Increase |
| | | Market comparable | Enterprise value/Revenue multiple (EV/R) | 5.0 – 6.8 / 6.3 | Increase |
| | | Discounted cash flow | Discount rate | 10.0% | Decrease |
| | | | Probability rate | 0.6% - 37.3% / 16.3% | Increase |
(a) Represents the directional change in the fair value of the Level 3 investments that could have resulted from an increase in the corresponding input as of period end. A decrease to the unobservable input would have had the opposite effect. Significant changes in these inputs may have resulted in a significantly higher or lower fair value measurement at period end.
Fidelity Advisor Technology
| Asset Type | Fair Value | Valuation Technique(s) | Unobservable Input | Amount or Range/Weighted Average | Impact to Valuation from an Increase in Input(a) |
| Equities | $84,526,525 | Market Approach | Discount rate | 5.3% - 75.0% / 16.5% | Decrease |
| | | | Transaction price | $1.10 - $559.60 / $213.44 | Increase |
| | | Recovery value | Recovery value | $0.00 | Increase |
| | | Book value | Book value multiple | 1.7 | Increase |
| | | Market comparable | Enterprise value/Revenue multiple (EV/R) | 2.1 – 26.0 / 11.7 | Increase |
| | | | Enterprise value/Gross profit multiple (EV/GP) | 8.8 | Increase |
| | | Discounted cash flow | Weighted average cost of capital (WACC) | 30.0% | Decrease |
| | | | Exit multiple | 2.8 | Increase |
| | | Black scholes | Term | 5.0 | Increase |
| | | | Volatility | 80.0% | Increase |
| Preferred Securities | $4,405,056 | Market Approach | Transaction price | $100.00 | Increase |
(a) Represents the directional change in the fair value of the Level 3 investments that could have resulted from an increase in the corresponding input as of period end. A decrease to the unobservable input would have had the opposite effect. Significant changes in these inputs may have resulted in a significantly higher or lower fair value measurement at period end.
Changes in valuation techniques may result in transfers in or out of an assigned level within the disclosure hierarchy. The aggregate value of investments by input level as of July 31, 2022, as well as a roll forward of Level 3 investments, is included at the end of each Fund's Schedule of Investments.
Foreign Currency. Certain Funds may use foreign currency contracts to facilitate transactions in foreign-denominated securities. Gains and losses from these transactions may arise from changes in the value of the foreign currency or if the counterparties do not perform under the contracts' terms.
Foreign-denominated assets, including investment securities, and liabilities are translated into U.S. dollars at the exchange rates at period end. Purchases and sales of investment securities, income and dividends received, and expenses denominated in foreign currencies are translated into U.S. dollars at the exchange rate in effect on the transaction date.
The effects of exchange rate fluctuations on investments are included with the net realized and unrealized gain (loss) on investment securities. Other foreign currency transactions resulting in realized and unrealized gain (loss) are disclosed separately.
Investment Transactions and Income. For financial reporting purposes, the Funds' investment holdings and NAV include trades executed through the end of the last business day of the period. The NAV per share for processing shareholder transactions is calculated as of the close of business of the New York Stock Exchange (NYSE), normally 4:00 p.m. Eastern time and includes trades executed through the end of the prior business day. Gains and losses on securities sold are determined on the basis of identified cost and for certain Funds include proceeds received from litigation. Commissions paid to certain brokers with whom the investment adviser, or its affiliates, places trades on behalf of a fund include an amount in addition to trade execution, which may be rebated back to a fund. Any such rebates are included in net realized gain (loss) on investments in the Statement of Operations. Dividend income is recorded on the ex-dividend date, except for certain dividends from foreign securities where the ex-dividend date may have passed, which are recorded as soon as the Funds are informed of the ex-dividend date. Non-cash dividends included in dividend income, if any, are recorded at the fair market value of the securities received. Income and capital gain distributions from Fidelity Central Funds, if any, are recorded on the ex-dividend date. Certain distributions received by the Funds represent a return of capital or capital gain. The Funds determine the components of these distributions subsequent to the ex-dividend date, based upon receipt of tax filings or other correspondence relating to the underlying investment. These distributions are recorded as a reduction of cost of investments and/or as a realized gain. Interest income is accrued as earned and includes coupon interest and amortization of premium and accretion of discount on debt securities as applicable. Investment income is recorded net of foreign taxes withheld where recovery of such taxes is uncertain. Funds may file withholding tax reclaims in certain jurisdictions to recover a portion of amounts previously withheld. Any withholding tax reclaims income is included in the Statement of Operations in dividends. Any receivables for withholding tax reclaims are included in the Statement of Assets and Liabilities in dividends receivable.
Class Allocations and Expenses. Investment income, realized and unrealized capital gains and losses, common expenses of a fund, and certain fund-level expense reductions, if any, are allocated daily on a pro-rata basis to each class based on the relative net assets of each class to the total net assets of a fund. Each class differs with respect to transfer agent and distribution and service plan fees incurred, as applicable. Certain expense reductions may also differ by class, if applicable. For the reporting period, the allocated portion of income and expenses to each class as a percent of its average net assets may vary due to the timing of recording these transactions in relation to fluctuating net assets of the classes. Expenses directly attributable to a fund are charged to that fund. Expenses attributable to more than one fund are allocated among the respective funds on the basis of relative net assets or other appropriate methods. Expenses included in the accompanying financial statements reflect the expenses of that fund and do not include any expenses associated with any underlying mutual funds or exchange-traded funds. Although not included in a fund's expenses, a fund indirectly bears its proportionate share of these expenses through the net asset value of each underlying mutual fund or exchange-traded fund. Expense estimates are accrued in the period to which they relate and adjustments are made when actual amounts are known.
Deferred Trustee Compensation. Under a Deferred Compensation Plan (the Plan) for certain Funds, certain independent Trustees have elected to defer receipt of a portion of their annual compensation. Deferred amounts are invested in affiliated mutual funds, are marked-to-market and remain in a fund until distributed in accordance with the Plan. The investment of deferred amounts and the offsetting payable to the Trustees presented below are included in the accompanying Statement of Assets and Liabilities in other receivables and other payables and accrued expenses, as applicable.
| Fidelity Advisor Energy Fund | $74,784 |
| Fidelity Advisor Technology Fund | 119,853 |
Income Tax Information and Distributions to Shareholders. Each year, each Fund intends to qualify as a regulated investment company under Subchapter M of the Internal Revenue Code, including distributing substantially all of its taxable income and realized gains. As a result, no provision for U.S. Federal income taxes is required. As of July 31, 2022, each Fund did not have any unrecognized tax benefits in the financial statements; nor is each Fund aware of any tax positions for which it is reasonably possible that the total amounts of unrecognized tax benefits will significantly change in the next twelve months. Each Fund files a U.S. federal tax return, in addition to state and local tax returns as required. Each Fund's federal income tax returns are subject to examination by the Internal Revenue Service (IRS) for a period of three fiscal years after they are filed. State and local tax returns may be subject to examination for an additional fiscal year depending on the jurisdiction. Foreign taxes are provided for based on each Fund's understanding of the tax rules and rates that exist in the foreign markets in which it invests. Fidelity Advisor Technology Fund is subject to a tax imposed on capital gains by certain countries in which it invests. An estimated deferred tax liability for net unrealized appreciation on the applicable securities is included in Other payables and accrued expenses on each applicable Fund's Statement of Assets & Liabilities.
Distributions are declared and recorded on the ex-dividend date. Income and capital gain distributions are declared separately for each class. Income and capital gain distributions are determined in accordance with income tax regulations, which may differ from GAAP. In addition, the Funds claimed a portion of the payment made to redeeming shareholders as a distribution for income tax purposes.
Capital accounts within the financial statements are adjusted for permanent book-tax differences. These adjustments have no impact on net assets or the results of operations. Capital accounts are not adjusted for temporary book-tax differences which will reverse in a subsequent period.
Book-tax differences are primarily due to foreign currency transactions, partnerships, certain foreign taxes, passive foreign investment companies (PFIC), deferred Trustee compensation, net operating losses, capital loss carryforwards and losses deferred due to wash sales and excise tax regulations.
As of period end, the cost and unrealized appreciation (depreciation) in securities, and derivatives if applicable, for federal income tax purposes were as follows for each Fund:
| | Tax cost | Gross unrealized appreciation | Gross unrealized depreciation | Net unrealized appreciation (depreciation) |
| Fidelity Advisor Biotechnology Fund | $1,631,369,733 | $526,023,028 | $(328,558,819) | $197,464,209 |
| Fidelity Advisor Consumer Discretionary Fund | 266,298,774 | 186,420,661 | (14,663,716) | 171,756,945 |
| Fidelity Advisor Energy Fund | 966,156,099 | 493,689,740 | (25,314,238) | 468,375,502 |
| Fidelity Advisor Financial Services Fund | 466,457,889 | 83,908,606 | (34,760,309) | 49,148,297 |
| Fidelity Advisor Health Care Fund | 4,673,831,205 | 2,072,649,555 | (525,458,205) | 1,547,191,350 |
| Fidelity Advisor Industrials Fund | 490,456,127 | 64,770,458 | (21,390,815) | 43,379,643 |
| Fidelity Advisor Semiconductors Fund | 647,786,817 | 254,110,754 | (47,980,856) | 206,129,898 |
| Fidelity Advisor Technology Fund | 2,450,877,036 | 1,750,980,340 | (365,410,209) | 1,385,570,131 |
| Fidelity Advisor Utilities Fund | 649,104,627 | 193,455,883 | (3,837,182) | 189,618,701 |
The tax-based components of distributable earnings as of period end were as follows for each Fund:
| | Undistributed tax-exempt income | Undistributed ordinary income | Undistributed long-term capital gain | Capital loss carryforward | Net unrealized appreciation (depreciation) on securities and other investments |
| Fidelity Advisor Biotechnology Fund | $– | $– | $– | $– | $197,464,209 |
| Fidelity Advisor Consumer Discretionary Fund | – | – | 17,146,277 | – | 171,752,852 |
| Fidelity Advisor Energy Fund | – | 13,046,189 | – | (316,843,870) | 468,115,182 |
| Fidelity Advisor Financial Services Fund | – | 4,508,617 | 21,145,252 | – | 49,148,297 |
| Fidelity Advisor Health Care Fund | – | – | – | – | 1,547,133,887 |
| Fidelity Advisor Industrials Fund | – | – | 17,016,229 | – | 43,379,643 |
| Fidelity Advisor Semiconductors Fund | – | – | 22,137,283 | – | 206,127,997 |
| Fidelity Advisor Technology Fund | – | – | 77,293,066 | – | 1,385,563,807 |
| Fidelity Advisor Utilities Fund | – | 306,482 | 19,569,298 | – | 189,617,970 |
Capital loss carryforwards are only available to offset future capital gains of the Funds to the extent provided by regulations and may be limited. The capital loss carryforward information presented below, including any applicable limitation, is estimated as of fiscal period end and is subject to adjustment.
| | Short-term | Long-term | Total capital loss carryforward |
| Fidelity Advisor Energy Fund | (176,483,466) | (140,360,404) | (316,843,870) |
Certain of the Funds intend to elect to defer to the next fiscal year capital losses recognized during the period November 1, 2021 to July 31, 2022, and ordinary losses recognized during the period January 1, 2022 to July 31, 2022. Loss deferrals were as follows:
| | Capital losses | Ordinary losses |
| Fidelity Advisor Biotechnology Fund | $(112,199,146) | $– |
| Fidelity Advisor Consumer Discretionary Fund | (17,015,738) | (1,142,847) |
| Fidelity Advisor Financial Services Fund | (4,572,117) | – |
| Fidelity Advisor Health Care Fund | (69,569,948) | (11,301,927) |
| Fidelity Advisor Industrials Fund | (5,993,316) | – |
| Fidelity Advisor Semiconductors Fund | – | (1,400,384) |
| Fidelity Advisor Technology Fund | – | (9,615,782) |
The tax character of distributions paid was as follows:
| July 31, 2022 | | | |
| | Ordinary Income | Long-term Capital Gains | Total |
| Fidelity Advisor Biotechnology Fund | $114,816,987 | $274,425,826 | $389,242,813 |
| Fidelity Advisor Consumer Discretionary Fund | 4,008,843 | 40,831,776 | 44,840,619 |
| Fidelity Advisor Energy Fund | 14,774,337 | – | 14,774,337 |
| Fidelity Advisor Financial Services Fund | 8,808,931 | 12,201,665 | 21,010,596 |
| Fidelity Advisor Health Care Fund | 876,414 | 420,586,154 | 421,462,568 |
| Fidelity Advisor Industrials Fund | 20,972,599 | 100,928,586 | 121,901,185 |
| Fidelity Advisor Semiconductors Fund | 16,705,837 | 27,202,609 | 43,908,446 |
| Fidelity Advisor Technology Fund | 224,707,897 | 376,263,605 | 600,971,502 |
| Fidelity Advisor Utilities Fund | 11,491,678 | 8,209,466 | 19,701,144 |
| July 31, 2021 | | | |
| | Ordinary Income | Long-term Capital Gains | Total |
| Fidelity Advisor Biotechnology Fund | $145,927,671 | $82,262,615 | $228,190,286 |
| Fidelity Advisor Consumer Discretionary Fund | – | 7,826,027 | 7,826,027 |
| Fidelity Advisor Energy Fund | 13,506,451 | – | 13,506,451 |
| Fidelity Advisor Financial Services Fund | 5,718,993 | 1,513,784 | 7,232,777 |
| Fidelity Advisor Health Care Fund | 69,368,556 | 286,663,296 | 356,031,852 |
| Fidelity Advisor Industrials Fund | – | 3,415,748 | 3,415,748 |
| Fidelity Advisor Semiconductors Fund | 1,098,272 | 19,834,031 | 20,932,303 |
| Fidelity Advisor Technology Fund | 79,550,664 | 239,625,906 | 319,176,570 |
| Fidelity Advisor Utilities Fund | 12,048,409 | – | 12,048,409 |
Restricted Securities (including Private Placements). Funds may invest in securities that are subject to legal or contractual restrictions on resale. These securities generally may be resold in transactions exempt from registration or to the public if the securities are registered. Disposal of these securities may involve time-consuming negotiations and expense, and prompt sale at an acceptable price may be difficult. Information regarding restricted securities held at period end is included at the end of the Schedule of Investments, if applicable.
Special Purpose Acquisition Companies. Funds may invest in stock, warrants, and other securities of special purpose acquisition companies (SPACs) or similar special purpose entities. A SPAC is a publicly traded company that raises investment capital via an initial public offering (IPO) for the purpose of acquiring the equity securities of one or more existing companies via merger, business combination, acquisition or other similar transactions within a designated time frame.
Private Investment in Public Equity. Funds may acquire equity securities of an issuer through a private investment in a public equity (PIPE) transaction, including through commitments to purchase securities on a when-issued basis. A PIPE typically involves the purchase of securities directly from a publicly traded company in a private placement transaction. Securities purchased through PIPE transactions will be restricted from trading and considered illiquid until a resale registration statement for the shares is filed and declared effective.
At the current and/or prior period end, Fidelity Advisor Biotechnology Fund, Fidelity Advisor Health Care Fund, Fidelity Advisor Semiconductors Fund, and Fidelity Advisor Technology Fund had commitments to purchase when-issued securities through PIPE transactions with SPACs. The commitments are contingent upon the SPACs acquiring the securities of target companies. Unrealized appreciation (depreciation) on any commitments outstanding at period end is separately presented in the Statements of Assets and Liabilities as Unrealized appreciation (depreciation) on unfunded commitments, and any change in unrealized appreciation (depreciation) on unfunded commitments during the period is separately presented in the Statement of Operations, as applicable.
Consolidated Subsidiary. The Funds included in the table below hold certain investments through a wholly-owned subsidiary ("Subsidiary"), which may be subject to federal and state taxes upon disposition.
As of period end, investments in Subsidiaries were as follows:
| | $ Amount | % of Net Assets |
| Fidelity Advisor Health Care Fund | 9,402,913 | .16 |
The financial statements have been consolidated to include the Subsidiary accounts where applicable. Accordingly, all inter-company transactions and balances have been eliminated.
At period end, any estimated tax liability for these investments is presented as "Deferred taxes" in the Statement of Assets and Liabilities and included in "Change in net unrealized appreciation (depreciation) on investment securities" in the Statement of Operations. The tax liability incurred may differ materially depending on conditions when these investments are disposed. Any cash held by a Subsidiary is restricted as to its use and is presented as "Restricted cash" in the Statement of Assets and Liabilities, if applicable.
4. Purchases and Sales of Investments.
Purchases and sales of securities, other than short-term securities and in-kind transactions, as applicable, are noted in the table below.
| | Purchases ($) | Sales ($) |
| Fidelity Advisor Biotechnology Fund | 895,606,276 | 1,366,479,642 |
| Fidelity Advisor Consumer Discretionary Fund | 206,407,662 | 404,673,742 |
| Fidelity Advisor Energy Fund | 766,045,728 | 358,632,453 |
| Fidelity Advisor Financial Services Fund | 295,589,144 | 210,919,854 |
| Fidelity Advisor Health Care Fund | 2,115,582,511 | 2,606,248,073 |
| Fidelity Advisor Industrials Fund | 620,114,366 | 771,910,058 |
| Fidelity Advisor Semiconductors Fund | 425,624,816 | 264,731,373 |
| Fidelity Advisor Technology Fund | 901,046,233 | 1,247,835,254 |
| Fidelity Advisor Utilities Fund | 392,220,000 | 230,206,435 |
5. Fees and Other Transactions with Affiliates.
Management Fee. Fidelity Management & Research Company LLC (the investment adviser) and its affiliates provide the Funds with investment management related services for which the Funds pay a monthly management fee. The management fee is the sum of an individual fund fee rate and an annualized group fee rate. The individual fund fee rate is applied to each Fund's average net assets. The group fee rate is based upon the monthly average net assets of a group of registered investment companies with which the investment adviser has management contracts. The group fee rate decreases as assets under management increase and increases as assets under management decrease. For the reporting period, each Fund's annual management fee rate expressed as a percentage of each Fund's average net assets was as follows:
| | Individual Rate | Group Rate | Total |
| Fidelity Advisor Biotechnology Fund | .30% | .22% | .52% |
| Fidelity Advisor Consumer Discretionary Fund | .30% | .22% | .52% |
| Fidelity Advisor Energy Fund | .30% | .22% | .53% |
| Fidelity Advisor Financial Services Fund | .30% | .22% | .53% |
| Fidelity Advisor Health Care Fund | .30% | .22% | .52% |
| Fidelity Advisor Industrials Fund | .30% | .22% | .52% |
| Fidelity Advisor Semiconductors Fund | .30% | .22% | .52% |
| Fidelity Advisor Technology Fund | .30% | .22% | .52% |
| Fidelity Advisor Utilities Fund | .30% | .22% | .53% |
Distribution and Service Plan Fees. In accordance with Rule 12b-1 of the 1940 Act, each Fund has adopted separate Distribution and Service Plans for each class of shares. Certain classes pay Fidelity Distributors Company LLC (FDC), an affiliate of the investment adviser, separate Distribution and Service Fees, each of which is based on an annual percentage of each class' average net assets. In addition, FDC may pay financial intermediaries for selling shares of each Fund and providing shareholder support services. For the period, the Distribution and Service Fee rates, total fees and amounts retained by FDC were as follows:
| | Distribution Fee | Service Fee | Total Fees | Retained by FDC |
| Fidelity Advisor Biotechnology Fund | | | | |
| Class A | -% | .25% | $1,788,026 | $22,818 |
| Class M | .25% | .25% | 695,082 | 422 |
| Class C | .75% | .25% | 2,496,781 | 148,117 |
| | | | $4,979,889 | $171,357 |
| Fidelity Advisor Consumer Discretionary Fund | | | | |
| Class A | -% | .25% | $575,749 | $22,948 |
| Class M | .25% | .25% | 215,932 | 1,008 |
| Class C | .75% | .25% | 725,127 | 100,798 |
| | | | $1,516,808 | $124,754 |
| Fidelity Advisor Energy Fund | | | | |
| Class A | -% | .25% | $663,412 | $33,753 |
| Class M | .25% | .25% | 447,856 | – |
| Class C | .75% | .25% | 800,369 | 153,108 |
| | | | $1,911,637 | $186,861 |
| Fidelity Advisor Financial Services Fund | | | | |
| Class A | -% | .25% | $501,806 | $16,353 |
| Class M | .25% | .25% | 352,208 | 178 |
| Class C | .75% | .25% | 621,792 | 115,226 |
| | | | $1,475,806 | $131,757 |
| Fidelity Advisor Health Care Fund | | | | |
| Class A | -% | .25% | $3,977,234 | $109,498 |
| Class M | .25% | .25% | 1,800,480 | – |
| Class C | .75% | .25% | 5,940,900 | 583,282 |
| | | | $11,718,614 | $692,780 |
| Fidelity Advisor Industrials Fund | | | | |
| Class A | -% | .25% | $604,008 | $5,556 |
| Class M | .25% | .25% | 270,016 | 554 |
| Class C | .75% | .25% | 467,031 | 39,779 |
| | | | $1,341,055 | $45,889 |
| Fidelity Advisor Semiconductors Fund | | | | |
| Class A | -% | .25% | $830,762 | $32,887 |
| Class M | .25% | .25% | 272,072 | – |
| Class C | .75% | .25% | 965,168 | 195,347 |
| | | | $2,068,002 | $228,234 |
| Fidelity Advisor Technology Fund | | | | |
| Class A | -% | .25% | $4,337,076 | $68,004 |
| Class M | .25% | .25% | 2,903,756 | – |
| Class C | .75% | .25% | 3,666,631 | 356,316 |
| | | | $10,907,463 | $424,320 |
| Fidelity Advisor Utilities Fund | | | | |
| Class A | -% | .25% | $697,130 | $14,977 |
| Class M | .25% | .25% | 314,688 | 192 |
| Class C | .75% | .25% | 529,275 | 66,283 |
| | | | $1,541,093 | $81,452 |
Sales Load. FDC may receive a front-end sales charge of up to 5.75% for selling Class A shares and 3.50% for selling Class M shares, some of which is paid to financial intermediaries for selling shares of each Fund. Depending on the holding period, FDC may receive contingent deferred sales charges levied on Class A, Class M and Class C redemptions. The deferred sales charges are 1.00% for Class C shares, 1.00% for certain purchases of Class A shares and .25% for certain purchases of Class M shares.
For the period, sales charge amounts retained by FDC were as follows:
| | Retained by FDC |
| Fidelity Advisor Biotechnology Fund | |
| Class A | $126,126 |
| Class M | 11,745 |
| Class C(a) | 1,826 |
| | $139,697 |
| Fidelity Advisor Consumer Discretionary Fund | |
| Class A | $73,959 |
| Class M | 7,472 |
| Class C(a) | 1,734 |
| | $83,165 |
| Fidelity Advisor Energy Fund | |
| Class A | $264,165 |
| Class M | 14,236 |
| Class C(a) | 1,479 |
| | $279,880 |
| Fidelity Advisor Financial Services Fund | |
| Class A | $109,565 |
| Class M | 10,491 |
| Class C(a) | 1,612 |
| | $121,668 |
| Fidelity Advisor Health Care Fund | |
| Class A | $362,407 |
| Class M | 40,647 |
| Class C(a) | 4,740 |
| | $407,794 |
| Fidelity Advisor Industrials Fund | |
| Class A | $31,325 |
| Class M | 4,123 |
| Class C(a) | 523 |
| | $35,971 |
| Fidelity Advisor Semiconductors Fund | |
| Class A | $394,835 |
| Class M | 12,376 |
| Class C(a) | 2,494 |
| | $409,705 |
| Fidelity Advisor Technology Fund | |
| Class A | $506,634 |
| Class M | 36,172 |
| Class C(a) | 6,739 |
| | $549,545 |
| Fidelity Advisor Utilities Fund | |
| Class A | $120,616 |
| Class M | 14,186 |
| Class C(a) | 1,260 |
| | $136,062 |
(a) When Class C shares are initially sold, FDC pays commissions from its own resources to financial intermediaries through which the sales are made.
Transfer Agent Fees. Fidelity Investments Institutional Operations Company LLC (FIIOC), an affiliate of the investment adviser, is the transfer, dividend disbursing and shareholder servicing agent for each class of the Funds. FIIOC receives account fees and asset-based fees that vary according to the account size and type of account of the shareholders of the respective classes of each Fund, except for Class Z. FIIOC receives an asset-based fee of Class Z's average net assets. FIIOC pays for typesetting, printing and mailing of shareholder reports, except proxy statements. For the period, transfer agent fees for each class were as follows:
| | Amount | % of Class-Level Average Net Assets |
| Fidelity Advisor Biotechnology Fund | | |
| Class A | $1,317,903 | .18 |
| Class M | 295,487 | .21 |
| Class C | 459,849 | .18 |
| Class I | 1,539,821 | .17 |
| Class Z | 31,692 | .04 |
| | $3,644,752 | |
| Fidelity Advisor Consumer Discretionary Fund | | |
| Class A | $414,555 | .18 |
| Class M | 83,139 | .19 |
| Class C | 133,153 | .18 |
| Class I | 304,396 | .16 |
| Class Z | 26,214 | .04 |
| | $961,457 | |
| Fidelity Advisor Energy Fund | | |
| Class A | $556,097 | .21 |
| Class M | 202,376 | .23 |
| Class C | 158,734 | .20 |
| Class I | 603,073 | .18 |
| Class Z | 78,802 | .04 |
| | $1,599,082 | |
| Fidelity Advisor Financial Services Fund | | |
| Class A | $376,775 | .19 |
| Class M | 129,410 | .18 |
| Class C | 118,943 | .19 |
| Class I | 225,995 | .17 |
| Class Z | 25,479 | .04 |
| | $876,602 | |
| Fidelity Advisor Health Care Fund | | |
| Class A | $2,758,318 | .17 |
| Class M | 629,728 | .17 |
| Class C | 1,039,633 | .17 |
| Class I | 5,011,278 | .16 |
| Class Z | 356,915 | .04 |
| | $9,795,872 | |
| Fidelity Advisor Industrials Fund | | |
| Class A | $438,434 | .18 |
| Class M | 101,371 | .19 |
| Class C | 87,329 | .19 |
| Class I | 342,155 | .16 |
| Class Z | 15,374 | .04 |
| | $984,663 | |
| Fidelity Advisor Semiconductors Fund | | |
| Class A | $586,213 | .18 |
| Class M | 94,321 | .17 |
| Class C | 174,725 | .18 |
| Class I | 518,514 | .16 |
| Class Z | 18,258 | .04 |
| | $1,392,031 | |
| Fidelity Advisor Technology Fund | | |
| Class A | $2,877,329 | .17 |
| Class M | 925,318 | .16 |
| Class C | 654,691 | .18 |
| Class I | 2,136,086 | .16 |
| Class Z | 203,527 | .04 |
| | $6,796,951 | |
| Fidelity Advisor Utilities Fund | | |
| Class A | $513,616 | .18 |
| Class M | 130,986 | .21 |
| Class C | 102,305 | .19 |
| Class I | 309,417 | .17 |
| Class Z | 28,161 | .04 |
| | $1,084,485 | |
Accounting Fees. Fidelity Service Company, Inc. (FSC), an affiliate of the investment adviser, maintains each Fund's accounting records. The accounting fee is based on the level of average net assets for each month. For the period, the fees were equivalent to the following annual rates:
| | % of Average Net Assets |
| Fidelity Advisor Biotechnology Fund | .03 |
| Fidelity Advisor Consumer Discretionary Fund | .04 |
| Fidelity Advisor Energy Fund | .03 |
| Fidelity Advisor Financial Services Fund | .04 |
| Fidelity Advisor Health Care Fund | .02 |
| Fidelity Advisor Industrials Fund | .04 |
| Fidelity Advisor Semiconductors Fund | .03 |
| Fidelity Advisor Technology Fund | .02 |
| Fidelity Advisor Utilities Fund | .04 |
Brokerage Commissions. A portion of portfolio transactions were placed with brokerage firms which are affiliates of the investment adviser. Brokerage commissions are included in net realized gain (loss) and change in net unrealized appreciation (depreciation) in the Statement of Operations. The commissions paid to these affiliated firms were as follows:
| | Amount |
| Fidelity Advisor Biotechnology Fund | $45,633 |
| Fidelity Advisor Consumer Discretionary Fund | 2,746 |
| Fidelity Advisor Energy Fund | 19,309 |
| Fidelity Advisor Financial Services Fund | 3,808 |
| Fidelity Advisor Health Care Fund | 49,967 |
| Fidelity Advisor Industrials Fund | 10,946 |
| Fidelity Advisor Semiconductors Fund | 5,334 |
| Fidelity Advisor Technology Fund | 12,843 |
| Fidelity Advisor Utilities Fund | 5,890 |
Interfund Lending Program. Pursuant to an Exemptive Order issued by the Securities and Exchange Commission (the SEC), each Fund, along with other registered investment companies having management contracts with Fidelity Management & Research Company LLC (FMR), or other affiliated entities of FMR, may participate in an interfund lending program. This program provides an alternative credit facility allowing each Fund to borrow from, or lend money to, other participating affiliated funds. At period end, there were no interfund loans outstanding. Activity in this program during the period for which loans were outstanding was as follows:
| | Borrower or Lender | Average Loan Balance | Weighted Average Interest Rate | Interest Expense |
| Fidelity Advisor Biotechnology Fund | Borrower | $42,699,000 | .32% | $747 |
| Fidelity Advisor Consumer Discretionary Fund | Borrower | $5,665,012 | .39% | $4,942 |
| Fidelity Advisor Energy Fund | Borrower | $6,426,057 | 1.61% | $10,085 |
| Fidelity Advisor Financial Services Fund | Borrower | $6,853,000 | .32% | $240 |
| Fidelity Advisor Health Care Fund | Borrower | $13,649,917 | .32% | $2,907 |
| Fidelity Advisor Industrials Fund | Borrower | $14,029,125 | .34% | $1,063 |
| Fidelity Advisor Technology Fund | Borrower | $10,375,750 | .32% | $1,089 |
| Fidelity Advisor Utilities Fund | Borrower | $13,289,667 | .32% | $349 |
Interfund Trades. Funds may purchase from or sell securities to other Fidelity Funds under procedures adopted by the Board. The procedures have been designed to ensure these interfund trades are executed in accordance with Rule 17a-7 of the 1940 Act. Any interfund trades are included within the respective purchases and sales amounts shown in the Purchases and Sales of Investments note. Interfund trades during the period are noted in the table below.
| | Purchases ($) | Sales ($) | Realized Gain (Loss) ($) |
| Fidelity Advisor Biotechnology Fund | 59,199,842 | 176,418,790 | 18,515,967 |
| Fidelity Advisor Consumer Discretionary Fund | 20,794,764 | 28,219,945 | (5,509,688) |
| Fidelity Advisor Energy Fund | 68,713,800 | 32,857,775 | (1,088,155) |
| Fidelity Advisor Financial Services Fund | 15,746,640 | 13,333,550 | 2,789,677 |
| Fidelity Advisor Health Care Fund | 192,924,670 | 176,994,042 | 25,972,884 |
| Fidelity Advisor Industrials Fund | 26,791,763 | 28,503,343 | 3,045,860 |
| Fidelity Advisor Semiconductors Fund | 31,192,650 | 9,799,155 | 2,409,421 |
| Fidelity Advisor Technology Fund | 83,982,723 | 70,879,381 | 3,617,813 |
| Fidelity Advisor Utilities Fund | 12,377,753 | 2,343,549 | (376,060) |
Other. During the period, the investment adviser reimbursed the Funds for certain losses as follows:
| | Amount ($) |
| Fidelity Advisor Health Care Fund | 1,437 |
| Fidelity Advisor Technology Fund | 1,212 |
6. Committed Line of Credit.
Certain Funds participate with other funds managed by the investment adviser or an affiliate in a $4.25 billion credit facility (the "line of credit") to be utilized for temporary or emergency purposes to fund shareholder redemptions or for other short-term liquidity purposes. The participating funds have agreed to pay commitment fees on their pro-rata portion of the line of credit, which are reflected in Miscellaneous expenses on the Statement of Operations, and are listed below. During the period, there were no borrowings on this line of credit.
| | Amount |
| Fidelity Advisor Biotechnology Fund | $2,907 |
| Fidelity Advisor Consumer Discretionary Fund | 839 |
| Fidelity Advisor Energy Fund | 925 |
| Fidelity Advisor Financial Services Fund | 656 |
| Fidelity Advisor Health Care Fund | 8,508 |
| Fidelity Advisor Industrials Fund | 794 |
| Fidelity Advisor Semiconductors Fund | 1,027 |
| Fidelity Advisor Technology Fund | 6,005 |
| Fidelity Advisor Utilities Fund | 732 |
7. Security Lending.
Funds lend portfolio securities from time to time in order to earn additional income. Lending agents are used, including National Financial Services (NFS), an affiliate of the investment adviser. Pursuant to a securities lending agreement, NFS will receive a fee, which is capped at 9.9% of a fund's daily lending revenue, for its services as lending agent. A fund may lend securities to certain qualified borrowers, including NFS. On the settlement date of the loan, a fund receives collateral (in the form of U.S. Treasury obligations, letters of credit and/or cash) against the loaned securities and maintains collateral in an amount not less than 100% of the market value of the loaned securities during the period of the loan. The market value of the loaned securities is determined at the close of business of a fund and any additional required collateral is delivered to a fund on the next business day. A fund or borrower may terminate the loan at any time, and if the borrower defaults on its obligation to return the securities loaned because of insolvency or other reasons, a fund may apply collateral received from the borrower against the obligation. A fund may experience delays and costs in recovering the securities loaned. Any cash collateral received is invested in the Fidelity Securities Lending Cash Central Fund. Any loaned securities are identified as such in the Schedule of Investments, and the value of loaned securities and cash collateral at period end, as applicable, are presented in the Statement of Assets and Liabilities. Security lending income represents the income earned on investing cash collateral, less rebates paid to borrowers and any lending agent fees associated with the loan, plus any premium payments received for lending certain types of securities. Security lending income is presented in the Statement of Operations as a component of income from Fidelity Central Funds. Affiliated security lending activity, if any, was as follows:
| | Total Security Lending Fees Paid to NFS | Security Lending Income From Securities Loaned to NFS | Value of Securities Loaned to NFS at Period End |
| Fidelity Advisor Biotechnology Fund | $282,688 | $84,677 | $97,300 |
| Fidelity Advisor Consumer Discretionary Fund | $18,836 | $20,874 | $236,187 |
| Fidelity Advisor Energy Fund | $4,058 | $– | $– |
| Fidelity Advisor Financial Services Fund | $221 | $– | $– |
| Fidelity Advisor Health Care Fund | $105,269 | $91,978 | $– |
| Fidelity Advisor Industrials Fund | $1,327 | $– | $– |
| Fidelity Advisor Semiconductors Fund | $6,462 | $10,338 | $7,145,424 |
| Fidelity Advisor Technology Fund | $5,497 | $119 | $– |
| Fidelity Advisor Utilities Fund | $1,034 | $– | $– |
8. Bank Borrowings.
Each Fund is permitted to have bank borrowings for temporary or emergency purposes to fund shareholder redemptions or for other short-term liquidity requirements. Each Fund has established borrowing arrangements with certain banks. The interest rate on the borrowings is the bank's base rate, as revised from time to time. Any open loans, including accrued interest, at period end are presented under the caption "Notes payable" in the Statement of Assets and Liabilities, if applicable. Activity in this program during the period for which loans were outstanding was as follows:
| | Average Loan Balance | Weighted Average Interest Rate | Interest Expense |
| Fidelity Advisor Consumer Discretionary Fund | $1,365,860 | .77% | $1,452 |
| Fidelity Advisor Energy Fund | $2,298,700 | 1.81% | $1,156 |
| Fidelity Advisor Health Care Fund | $501,000 | .58% | $8 |
9. Expense Reductions.
Through arrangements with each applicable Fund's custodian, credits realized as a result of certain uninvested cash balances were used to reduce each applicable Fund's or class' expenses. All of the applicable expense reductions are noted in the table below.
| | Custodian credits |
| Fidelity Advisor Technology Fund | $1 |
In addition, during the period the investment adviser or an affiliate reimbursed and/or waived a portion of fund-level operating expenses as follows:
| | Fund-Level Amount |
| Fidelity Advisor Biotechnology Fund | $65,994 |
| Fidelity Advisor Consumer Discretionary Fund | 18,999 |
| Fidelity Advisor Energy Fund | 30,987 |
| Fidelity Advisor Financial Services Fund | 16,316 |
| Fidelity Advisor Health Care Fund | 204,580 |
| Fidelity Advisor Industrials Fund | 18,417 |
| Fidelity Advisor Semiconductors Fund | 27,537 |
| Fidelity Advisor Technology Fund | 144,231 |
| Fidelity Advisor Utilities Fund | 20,366 |
10. Distributions to Shareholders.
Distributions to shareholders of each class were as follows:
| | Year ended
July 31, 2022 | Year ended
July 31, 2021 |
| Fidelity Advisor Biotechnology Fund | | |
| Distributions to shareholders | | |
| Class A | $130,319,328 | $67,637,073 |
| Class M | 27,259,940 | 14,175,139 |
| Class C | 56,696,827 | 38,418,019 |
| Class I | 161,275,417 | 101,042,657 |
| Class Z | 13,691,301 | 6,917,398 |
| Total | $389,242,813 | $228,190,286 |
| Fidelity Advisor Consumer Discretionary Fund | | |
| Distributions to shareholders | | |
| Class A | $16,168,980 | $2,799,807 |
| Class M | 3,125,065 | 644,893 |
| Class C | 6,086,253 | 1,412,829 |
| Class I | 13,848,199 | 2,190,120 |
| Class Z | 5,612,122 | 778,378 |
| Total | $44,840,619 | $7,826,027 |
| Fidelity Advisor Energy Fund | | |
| Distributions to shareholders | | |
| Class A | $4,229,952 | $3,957,441 |
| Class M | 1,304,332 | 1,322,704 |
| Class C | 978,471 | 1,232,239 |
| Class I | 4,763,295 | 5,542,085 |
| Class Z | 3,498,287 | 1,451,982 |
| Total | $14,774,337 | $13,506,451 |
| Fidelity Advisor Financial Services Fund | | |
| Distributions to shareholders | | |
| Class A | $8,215,386 | $3,032,802 |
| Class M | 2,766,606 | 897,549 |
| Class C | 2,294,171 | 858,669 |
| Class I | 5,648,531 | 1,637,605 |
| Class Z | 2,085,902 | 806,152 |
| Total | $21,010,596 | $7,232,777 |
| Fidelity Advisor Health Care Fund | | |
| Distributions to shareholders | | |
| Class A | $103,562,390 | $85,254,822 |
| Class M | 25,573,033 | 21,586,340 |
| Class C | 52,054,574 | 45,636,281 |
| Class I | 186,427,506 | 163,297,556 |
| Class Z | 53,845,065 | 40,256,853 |
| Total | $421,462,568 | $356,031,852 |
| Fidelity Advisor Industrials Fund | | |
| Distributions to shareholders | | |
| Class A | $48,588,464 | $1,360,586 |
| Class M | 10,790,903 | 326,687 |
| Class C | 10,633,855 | 410,014 |
| Class I | 43,185,214 | 1,091,334 |
| Class Z | 8,702,749 | 227,127 |
| Total | $121,901,185 | $3,415,748 |
| Fidelity Advisor Semiconductors Fund | | |
| Distributions to shareholders | | |
| Class A | $16,894,260 | $8,071,050 |
| Class M | 3,024,406 | 1,689,234 |
| Class C | 5,665,807 | 3,556,245 |
| Class I | 15,905,080 | 7,098,112 |
| Class Z | 2,418,893 | 517,662 |
| Total | $43,908,446 | $20,932,303 |
| Fidelity Advisor Technology Fund | | |
| Distributions to shareholders | | |
| Class A | $228,756,732 | $121,011,582 |
| Class M | 82,459,541 | 44,308,653 |
| Class C | 60,838,976 | 36,326,601 |
| Class I | 166,955,477 | 89,512,609 |
| Class Z | 61,960,776 | 28,017,125 |
| Total | $600,971,502 | $319,176,570 |
| Fidelity Advisor Utilities Fund | | |
| Distributions to shareholders | | |
| Class A | $8,686,807 | $5,044,520 |
| Class M | 1,704,212 | 1,092,413 |
| Class C | 1,133,319 | 758,565 |
| Class I | 5,976,790 | 3,725,913 |
| Class Z | 2,200,016 | 1,426,998 |
| Total | $19,701,144 | $12,048,409 |
11. Share Transactions.
Share transactions for each class were as follows and may contain in-kind transactions, automatic conversions between classes or exchanges between affiliated funds:
| | Shares | Shares | Dollars | Dollars |
| | Year ended July 31, 2022 | Year ended July 31, 2021 | Year ended July 31, 2022 | Year ended July 31, 2021 |
| Fidelity Advisor Biotechnology Fund | | | | |
| Class A | | | | |
| Shares sold | 4,418,691 | 4,988,031 | $117,800,031 | $167,392,479 |
| Reinvestment of distributions | 4,440,754 | 1,799,881 | 118,923,402 | 61,715,324 |
| Shares redeemed | (6,636,216) | (5,261,146) | (173,909,401) | (174,179,391) |
| Net increase (decrease) | 2,223,229 | 1,526,766 | $62,814,032 | $54,928,412 |
| Class M | | | | |
| Shares sold | 525,275 | 995,337 | $13,292,225 | $30,881,501 |
| Reinvestment of distributions | 1,096,046 | 439,075 | 26,962,677 | 14,041,249 |
| Shares redeemed | (1,501,866) | (1,081,193) | (35,974,200) | (33,432,255) |
| Net increase (decrease) | 119,455 | 353,219 | $4,280,702 | $11,490,495 |
| Class C | | | | |
| Shares sold | 766,454 | 1,153,351 | $16,982,361 | $31,874,274 |
| Reinvestment of distributions | 2,615,104 | 1,317,196 | 55,231,000 | 37,235,282 |
| Shares redeemed | (5,864,679) | (5,015,655) | (124,192,429) | (138,031,651) |
| Net increase (decrease) | (2,483,121) | (2,545,108) | $(51,979,068) | $(68,922,095) |
| Class I | | | | |
| Shares sold | 6,204,658 | 7,356,978 | $172,889,033 | $261,275,855 |
| Reinvestment of distributions | 4,712,583 | 2,327,200 | 137,418,918 | 85,623,933 |
| Shares redeemed | (14,133,354) | (10,342,724) | (400,482,702) | (368,212,581) |
| Net increase (decrease) | (3,216,113) | (658,546) | $(90,174,751) | $(21,312,793) |
| Class Z | | | | |
| Shares sold | 880,421 | 1,700,116 | $25,302,163 | $60,995,095 |
| Reinvestment of distributions | 396,056 | 154,329 | 11,564,840 | 5,683,821 |
| Shares redeemed | (1,224,670) | (1,185,293) | (34,702,053) | (41,706,292) |
| Net increase (decrease) | 51,807 | 669,152 | $2,164,950 | $24,972,624 |
| Fidelity Advisor Consumer Discretionary Fund | | | | |
| Class A | | | | |
| Shares sold | 723,542 | 1,888,408 | $30,840,312 | $80,090,408 |
| Reinvestment of distributions | 360,797 | 66,769 | 15,705,493 | 2,706,144 |
| Shares redeemed | (1,390,561) | (1,018,441) | (56,239,450) | (42,259,203) |
| Net increase (decrease) | (306,222) | 936,736 | $(9,693,645) | $40,537,349 |
| Class M | | | | |
| Shares sold | 86,533 | 259,712 | $3,353,263 | $9,990,943 |
| Reinvestment of distributions | 76,937 | 17,054 | 3,082,116 | 639,182 |
| Shares redeemed | (213,236) | (218,708) | (7,704,372) | (8,336,487) |
| Net increase (decrease) | (49,766) | 58,058 | $(1,268,993) | $2,293,638 |
| Class C | | | | |
| Shares sold | 194,917 | 655,073 | $6,446,705 | $21,563,514 |
| Reinvestment of distributions | 180,010 | 43,840 | 6,046,548 | 1,398,073 |
| Shares redeemed | (756,125) | (754,233) | (23,161,684) | (24,941,149) |
| Net increase (decrease) | (381,198) | (55,320) | $(10,668,431) | $(1,979,562) |
| Class I | | | | |
| Shares sold | 957,939 | 3,455,093 | $43,970,719 | $157,028,268 |
| Reinvestment of distributions | 261,935 | 44,468 | 12,486,421 | 1,963,243 |
| Shares redeemed | (3,334,868) | (1,976,394) | (149,620,424) | (87,428,646) |
| Net increase (decrease) | (2,114,994) | 1,523,167 | $(93,163,284) | $71,562,865 |
| Class Z | | | | |
| Shares sold | 921,806 | 1,465,692 | $38,859,222 | $66,408,699 |
| Reinvestment of distributions | 92,881 | 14,813 | 4,440,626 | 656,091 |
| Shares redeemed | (1,603,367) | (1,056,481) | (72,794,398) | (46,924,459) |
| Net increase (decrease) | (588,680) | 424,024 | $(29,494,550) | $20,140,331 |
| Fidelity Advisor Energy Fund | | | | |
| Class A | | | | |
| Shares sold | 5,586,497 | 2,907,447 | $197,644,201 | $61,561,652 |
| Reinvestment of distributions | 154,393 | 210,429 | 4,035,842 | 3,850,848 |
| Shares redeemed | (4,025,817) | (2,580,719) | (132,157,901) | (51,778,100) |
| Net increase (decrease) | 1,715,073 | 537,157 | $69,522,142 | $13,634,400 |
| Class M | | | | |
| Shares sold | 1,108,281 | 839,687 | $38,124,228 | $18,722,946 |
| Reinvestment of distributions | 47,378 | 68,479 | 1,273,515 | 1,287,399 |
| Shares redeemed | (925,853) | (899,666) | (30,500,389) | (19,016,017) |
| Net increase (decrease) | 229,806 | 8,500 | $8,897,354 | $994,328 |
| Class C | | | | |
| Shares sold | 1,487,293 | 660,725 | $49,538,922 | $13,081,023 |
| Reinvestment of distributions | 39,776 | 71,624 | 954,633 | 1,205,425 |
| Shares redeemed | (1,191,755) | (1,105,766) | (35,900,925) | (20,525,961) |
| Net increase (decrease) | 335,314 | (373,417) | $14,592,630 | $(6,239,513) |
| Class I | | | | |
| Shares sold | 11,878,651 | 5,149,259 | $442,734,533 | $116,152,508 |
| Reinvestment of distributions | 152,645 | 263,571 | 4,219,114 | 5,089,551 |
| Shares redeemed | (6,391,600) | (7,136,273) | (232,390,112) | (156,749,306) |
| Net increase (decrease) | 5,639,696 | (1,723,443) | $214,563,535 | $(35,507,247) |
| Class Z | | | | |
| Shares sold | 8,049,496 | 2,898,214 | $277,617,915 | $64,509,553 |
| Reinvestment of distributions | 121,637 | 73,062 | 3,353,536 | 1,407,175 |
| Shares redeemed | (5,140,446) | (2,014,101) | (187,048,074) | (43,525,755) |
| Net increase (decrease) | 3,030,687 | 957,175 | $93,923,377 | $22,390,973 |
| Fidelity Advisor Financial Services Fund | | | | |
| Class A | | | | |
| Shares sold | 2,078,376 | 1,796,629 | $61,073,336 | $47,892,115 |
| Reinvestment of distributions | 277,980 | 129,951 | 7,866,833 | 2,873,224 |
| Shares redeemed | (1,537,466) | (1,368,007) | (43,023,094) | (31,660,283) |
| Net increase (decrease) | 818,890 | 558,573 | $25,917,075 | $19,105,056 |
| Class M | | | | |
| Shares sold | 1,004,137 | 723,923 | $29,329,128 | $18,609,730 |
| Reinvestment of distributions | 97,289 | 40,416 | 2,722,139 | 884,297 |
| Shares redeemed | (593,594) | (566,967) | (16,539,094) | (12,817,995) |
| Net increase (decrease) | 507,832 | 197,372 | $15,512,173 | $6,676,032 |
| Class C | | | | |
| Shares sold | 727,321 | 492,379 | $19,854,552 | $11,952,885 |
| Reinvestment of distributions | 86,295 | 41,102 | 2,279,042 | 850,822 |
| Shares redeemed | (618,443) | (845,925) | (16,237,901) | (18,090,556) |
| Net increase (decrease) | 195,173 | (312,444) | $5,895,693 | $(5,286,849) |
| Class I | | | | |
| Shares sold | 3,616,649 | 3,715,913 | $109,262,113 | $99,892,222 |
| Reinvestment of distributions | 187,755 | 67,057 | 5,484,338 | 1,527,568 |
| Shares redeemed | (3,023,204) | (4,342,939) | (87,083,084) | (100,735,420) |
| Net increase (decrease) | 781,200 | (559,969) | $27,663,367 | $684,370 |
| Class Z | | | | |
| Shares sold | 2,119,564 | 1,013,230 | $63,792,422 | $26,606,909 |
| Reinvestment of distributions | 66,623 | 34,717 | 1,941,402 | 789,123 |
| Shares redeemed | (1,547,460) | (1,028,965) | (45,372,699) | (23,032,643) |
| Net increase (decrease) | 638,727 | 18,982 | $20,361,125 | $4,363,389 |
| Fidelity Advisor Health Care Fund | | | | |
| Class A | | | | |
| Shares sold | 3,747,789 | 5,308,631 | $233,179,014 | $348,242,413 |
| Reinvestment of distributions | 1,495,405 | 1,258,713 | 96,348,946 | 80,205,218 |
| Shares redeemed | (4,339,266) | (4,096,600) | (264,349,157) | (266,221,815) |
| Net increase (decrease) | 903,928 | 2,470,744 | $65,178,803 | $162,225,816 |
| Class M | | | | |
| Shares sold | 435,333 | 673,573 | $25,121,427 | $40,682,436 |
| Reinvestment of distributions | 424,487 | 359,459 | 25,095,629 | 21,182,904 |
| Shares redeemed | (855,683) | (942,777) | (48,110,063) | (56,902,516) |
| Net increase (decrease) | 4,137 | 90,255 | $2,106,993 | $4,962,824 |
| Class C | | | | |
| Shares sold | 1,035,114 | 2,054,175 | $49,790,284 | $103,378,959 |
| Reinvestment of distributions | 1,046,899 | 903,363 | 50,596,635 | 44,382,226 |
| Shares redeemed | (3,477,708) | (3,635,928) | (158,966,919) | (184,781,965) |
| Net increase (decrease) | (1,395,695) | (678,390) | $(58,580,000) | $(37,020,780) |
| Class I | | | | |
| Shares sold | 10,728,410 | 16,464,289 | $730,079,020 | $1,172,808,851 |
| Reinvestment of distributions | 2,309,604 | 2,063,590 | 164,674,774 | 144,306,867 |
| Shares redeemed | (14,652,690) | (12,044,029) | (969,895,308) | (860,852,926) |
| Net increase (decrease) | (1,614,676) | 6,483,850 | $(75,141,514) | $456,262,792 |
| Class Z | | | | |
| Shares sold | 4,032,990 | 5,525,911 | $272,822,935 | $396,687,588 |
| Reinvestment of distributions | 589,521 | 465,787 | 42,068,205 | 32,581,809 |
| Shares redeemed | (4,279,711) | (2,678,428) | (283,294,012) | (192,046,547) |
| Net increase (decrease) | 342,800 | 3,313,270 | $31,597,128 | $237,222,850 |
| Fidelity Advisor Industrials Fund | | | | |
| Class A | | | | |
| Shares sold | 603,316 | 1,076,584 | $23,516,059 | $45,468,071 |
| Reinvestment of distributions | 1,213,535 | 31,089 | 45,750,285 | 1,282,422 |
| Shares redeemed | (1,335,197) | (1,224,035) | (50,895,928) | (49,828,306) |
| Net increase (decrease) | 481,654 | (116,362) | $18,370,416 | $(3,077,813) |
| Class M | | | | |
| Shares sold | 174,759 | 206,166 | $6,661,118 | $8,359,636 |
| Reinvestment of distributions | 291,480 | 8,025 | 10,627,377 | 321,903 |
| Shares redeemed | (247,645) | (305,322) | (9,084,966) | (12,251,726) |
| Net increase (decrease) | 218,594 | (91,131) | $8,203,529 | $(3,570,187) |
| Class C | | �� | | |
| Shares sold | 111,395 | 294,036 | $3,612,202 | $10,618,840 |
| Reinvestment of distributions | 331,819 | 11,359 | 10,545,204 | 407,004 |
| Shares redeemed | (548,802) | (725,513) | (17,779,500) | (25,842,698) |
| Net increase (decrease) | (105,588) | (420,118) | $(3,622,094) | $(14,816,854) |
| Class I | | | | |
| Shares sold | 1,309,576 | 3,168,353 | $56,025,544 | $136,049,117 |
| Reinvestment of distributions | 874,167 | 19,975 | 35,517,393 | 876,709 |
| Shares redeemed | (3,337,326) | (1,524,607) | (133,702,575) | (66,684,423) |
| Net increase (decrease) | (1,153,583) | 1,663,721 | $(42,159,638) | $70,241,403 |
| Class Z | | | | |
| Shares sold | 414,017 | 750,481 | $17,587,181 | $33,098,948 |
| Reinvestment of distributions | 127,360 | 3,549 | 5,164,450 | 155,552 |
| Shares redeemed | (923,868) | (534,468) | (37,613,581) | (23,973,370) |
| Net increase (decrease) | (382,491) | 219,562 | $(14,861,950) | $9,281,130 |
| Fidelity Advisor Semiconductors Fund | | | | |
| Class A | | | | |
| Shares sold | 2,860,692 | 2,272,508 | $141,379,185 | $92,361,798 |
| Reinvestment of distributions | 305,160 | 209,688 | 16,570,155 | 7,894,748 |
| Shares redeemed | (1,755,975) | (1,139,468) | (81,055,946) | (44,250,742) |
| Net increase (decrease) | 1,409,877 | 1,342,728 | $76,893,394 | $56,005,804 |
| Class M | | | | |
| Shares sold | 274,328 | 264,285 | $13,314,173 | $10,045,601 |
| Reinvestment of distributions | 58,420 | 46,894 | 2,991,086 | 1,671,302 |
| Shares redeemed | (272,402) | (205,061) | (12,460,105) | (7,535,130) |
| Net increase (decrease) | 60,346 | 106,118 | $3,845,154 | $4,181,773 |
| Class C | | | | |
| Shares sold | 848,794 | 603,785 | $34,916,166 | $20,475,892 |
| Reinvestment of distributions | 126,023 | 112,361 | 5,653,413 | 3,542,734 |
| Shares redeemed | (694,995) | (758,704) | (26,741,267) | (24,960,249) |
| Net increase (decrease) | 279,822 | (42,558) | $13,828,312 | $(941,623) |
| Class I | | | | |
| Shares sold | 4,659,880 | 3,218,643 | $244,049,201 | $138,779,272 |
| Reinvestment of distributions | 250,734 | 170,390 | 14,570,164 | 6,832,623 |
| Shares redeemed | (3,378,308) | (2,173,312) | (169,937,377) | (89,960,875) |
| Net increase (decrease) | 1,532,306 | 1,215,721 | $88,681,988 | $55,651,020 |
| Class Z | | | | |
| Shares sold | 955,357 | 440,987 | $50,804,090 | $19,153,328 |
| Reinvestment of distributions | 35,604 | 11,859 | 2,067,182 | 474,851 |
| Shares redeemed | (494,861) | (158,845) | (24,155,858) | (6,852,204) |
| Net increase (decrease) | 496,100 | 294,001 | $28,715,414 | $12,775,975 |
| Fidelity Advisor Technology Fund | | | | |
| Class A | | | | |
| Shares sold | 2,519,136 | 3,227,692 | $232,706,169 | $287,807,384 |
| Reinvestment of distributions | 2,240,274 | 1,308,684 | 218,314,727 | 115,478,310 |
| Shares redeemed | (3,342,272) | (4,026,118) | (298,760,229) | (359,897,290) |
| Net increase (decrease) | 1,417,138 | 510,258 | $152,260,667 | $43,388,404 |
| Class M | | | | |
| Shares sold | 697,044 | 1,097,418 | $59,786,363 | $90,166,670 |
| Reinvestment of distributions | 907,716 | 530,803 | 81,358,575 | 43,573,593 |
| Shares redeemed | (1,175,809) | (1,566,784) | (96,678,322) | (129,813,793) |
| Net increase (decrease) | 428,951 | 61,437 | $44,466,616 | $3,926,470 |
| Class C | | | | |
| Shares sold | 583,339 | 926,376 | $41,708,463 | $65,390,790 |
| Reinvestment of distributions | 804,256 | 509,178 | 59,884,931 | 35,688,322 |
| Shares redeemed | (1,436,860) | (1,935,386) | (98,189,544) | (138,574,238) |
| Net increase (decrease) | (49,265) | (499,832) | $3,403,850 | $(37,495,126) |
| Class I | | | | |
| Shares sold | 3,867,129 | 4,485,105 | $384,870,571 | $437,609,448 |
| Reinvestment of distributions | 1,447,115 | 859,806 | 157,373,714 | 83,530,124 |
| Shares redeemed | (4,936,086) | (4,711,105) | (483,932,095) | (453,488,874) |
| Net increase (decrease) | 378,158 | 633,806 | $58,312,190 | $67,650,698 |
| Class Z | | | | |
| Shares sold | 2,088,418 | 2,665,827 | $199,301,687 | $261,760,082 |
| Reinvestment of distributions | 520,545 | 257,979 | 56,520,804 | 25,013,683 |
| Shares redeemed | (1,767,962) | (1,849,927) | (176,311,632) | (179,698,035) |
| Net increase (decrease) | 841,001 | 1,073,879 | $79,510,859 | $107,075,730 |
| Fidelity Advisor Utilities Fund | | | | |
| Class A | | | | |
| Shares sold | 2,038,098 | 1,125,170 | $76,451,481 | $37,451,800 |
| Reinvestment of distributions | 227,863 | 150,513 | 8,404,572 | 4,887,151 |
| Shares redeemed | (1,522,462) | (2,032,740) | (55,946,312) | (65,836,825) |
| Net increase (decrease) | 743,499 | (757,057) | $28,909,741 | $(23,497,874) |
| Class M | | | | |
| Shares sold | 280,727 | 192,689 | $10,659,633 | $6,319,115 |
| Reinvestment of distributions | 45,465 | 33,030 | 1,678,440 | 1,075,800 |
| Shares redeemed | (204,995) | (460,032) | (7,562,685) | (15,128,321) |
| Net increase (decrease) | 121,197 | (234,313) | $4,775,388 | $(7,733,406) |
| Class C | | | | |
| Shares sold | 455,467 | 244,717 | $16,708,391 | $7,862,719 |
| Reinvestment of distributions | 31,528 | 23,775 | 1,129,916 | 754,630 |
| Shares redeemed | (377,473) | (928,065) | (13,548,566) | (29,528,468) |
| Net increase (decrease) | 109,522 | (659,573) | $4,289,741 | $(20,911,119) |
| Class I | | | | |
| Shares sold | 4,333,877 | 1,291,889 | $167,495,499 | $43,574,208 |
| Reinvestment of distributions | 154,482 | 110,504 | 5,854,917 | 3,670,947 |
| Shares redeemed | (1,916,822) | (3,326,028) | (71,914,451) | (109,800,472) |
| Net increase (decrease) | 2,571,537 | (1,923,635) | $101,435,965 | $(62,555,317) |
| Class Z | | | | |
| Shares sold | 2,215,889 | 776,806 | $87,714,810 | $25,983,383 |
| Reinvestment of distributions | 46,255 | 32,015 | 1,754,820 | 1,062,593 |
| Shares redeemed | (1,195,749) | (917,828) | (44,084,084) | (30,619,605) |
| Net increase (decrease) | 1,066,395 | (109,007) | $45,385,546 | $(3,573,629) |
12. Other.
A fund's organizational documents provide former and current trustees and officers with a limited indemnification against liabilities arising in connection with the performance of their duties to the fund. In the normal course of business, a fund may also enter into contracts that provide general indemnifications. A fund's maximum exposure under these arrangements is unknown as this would be dependent on future claims that may be made against a fund. The risk of material loss from such claims is considered remote.
13. Coronavirus (COVID-19) Pandemic.
An outbreak of COVID-19 first detected in China during December 2019 has since spread globally and was declared a pandemic by the World Health Organization during March 2020. Developments that disrupt global economies and financial markets, such as the COVID-19 pandemic, may magnify factors that affect the Funds' performance.
Report of Independent Registered Public Accounting Firm
To the Board of Trustees of Fidelity Advisor Series VII and the Shareholders of Fidelity Advisor Biotechnology Fund, Fidelity Advisor Consumer Discretionary Fund, Fidelity Advisor Energy Fund, Fidelity Advisor Financial Services Fund, Fidelity Advisor Health Care Fund, Fidelity Advisor Industrials Fund, Fidelity Advisor Semiconductors Fund, Fidelity Advisor Technology Fund and Fidelity Advisor Utilities Fund
Opinion on the Financial Statements and Financial Highlights
We have audited the accompanying statements of assets and liabilities of Fidelity Advisor Biotechnology Fund, Fidelity Advisor Consumer Discretionary Fund, Fidelity Advisor Energy Fund, Fidelity Advisor Financial Services Fund, Fidelity Advisor Health Care Fund, Fidelity Advisor Industrials Fund, Fidelity Advisor Semiconductors Fund, Fidelity Advisor Technology Fund and Fidelity Advisor Utilities Fund (the "Funds"), each a fund of Fidelity Advisor Series VII, including the schedules of investments, as of July 31, 2022, the related statements of operations for the year then ended, the statements of changes in net assets for each of the two years in the period then ended, the financial highlights for each of the five years in the period then ended, and the related notes. In our opinion, the financial statements and financial highlights present fairly, in all material respects, the financial position of the Funds as of July 31, 2022, and the results of their operations for the year then ended, the changes in their net assets for each of the two years in the period then ended, and the financial highlights for each of the five years in the period then ended in conformity with accounting principles generally accepted in the United States of America.
Basis for Opinion
These financial statements and financial highlights are the responsibility of the Funds’ management. Our responsibility is to express an opinion on the Funds’ financial statements and financial highlights based on our audits. We are a public accounting firm registered with the Public Company Accounting Oversight Board (United States) (PCAOB) and are required to be independent with respect to the Funds in accordance with the U.S. federal securities laws and the applicable rules and regulations of the Securities and Exchange Commission and the PCAOB.
We conducted our audits in accordance with the standards of the PCAOB. Those standards require that we plan and perform the audit to obtain reasonable assurance about whether the financial statements and financial highlights are free of material misstatement, whether due to error or fraud. The Funds are not required to have, nor were we engaged to perform, an audit of their internal control over financial reporting. As part of our audits we are required to obtain an understanding of internal control over financial reporting but not for the purpose of expressing an opinion on the effectiveness of the Funds’ internal control over financial reporting. Accordingly, we express no such opinion.
Our audits included performing procedures to assess the risks of material misstatement of the financial statements and financial highlights, whether due to error or fraud, and performing procedures that respond to those risks. Such procedures included examining, on a test basis, evidence regarding the amounts and disclosures in the financial statements and financial highlights. Our audits also included evaluating the accounting principles used and significant estimates made by management, as well as evaluating the overall presentation of the financial statements and financial highlights. Our procedures included confirmation of securities owned as of July 31, 2022, by correspondence with the custodian and brokers; when replies were not received from brokers, we performed other auditing procedures. We believe that our audits provide a reasonable basis for our opinion.
/s/ Deloitte & Touche LLP
Boston, Massachusetts
September 14, 2022
We have served as the auditor of one or more of the Fidelity investment companies since 1999.
Trustees and Officers
The Trustees, Members of the Advisory Board (if any), and officers of the trust and funds, as applicable, are listed below. The Board of Trustees governs each fund and is responsible for protecting the interests of shareholders. The Trustees are experienced executives who meet periodically throughout the year to oversee each fund's activities, review contractual arrangements with companies that provide services to each fund, oversee management of the risks associated with such activities and contractual arrangements, and review each fund's performance. Each of the Trustees oversees 316 funds.
The Trustees hold office without limit in time except that (a) any Trustee may resign; (b) any Trustee may be removed by written instrument, signed by at least two-thirds of the number of Trustees prior to such removal; (c) any Trustee who requests to be retired or who has become incapacitated by illness or injury may be retired by written instrument signed by a majority of the other Trustees; and (d) any Trustee may be removed at any special meeting of shareholders by a two-thirds vote of the outstanding voting securities of the trust. Each Trustee who is not an interested person (as defined in the 1940 Act) of the trust and the funds is referred to herein as an Independent Trustee. Each Independent Trustee shall retire not later than the last day of the calendar year in which his or her 75th birthday occurs. The Independent Trustees may waive this mandatory retirement age policy with respect to individual Trustees. Officers and Advisory Board Members hold office without limit in time, except that any officer or Advisory Board Member may resign or may be removed by a vote of a majority of the Trustees at any regular meeting or any special meeting of the Trustees. Except as indicated, each individual has held the office shown or other offices in the same company for the past five years.
Each fund’s Statement of Additional Information (SAI) includes more information about the Trustees. To request a free copy, call Fidelity at 1-877-208-0098.
Experience, Skills, Attributes, and Qualifications of the Trustees. The Governance and Nominating Committee has adopted a statement of policy that describes the experience, qualifications, attributes, and skills that are necessary and desirable for potential Independent Trustee candidates (Statement of Policy). The Board believes that each Trustee satisfied at the time he or she was initially elected or appointed a Trustee, and continues to satisfy, the standards contemplated by the Statement of Policy. The Governance and Nominating Committee also engages professional search firms to help identify potential Independent Trustee candidates who have the experience, qualifications, attributes, and skills consistent with the Statement of Policy. From time to time, additional criteria based on the composition and skills of the current Independent Trustees, as well as experience or skills that may be appropriate in light of future changes to board composition, business conditions, and regulatory or other developments, have also been considered by the professional search firms and the Governance and Nominating Committee. In addition, the Board takes into account the Trustees' commitment and participation in Board and committee meetings, as well as their leadership of standing and ad hoc committees throughout their tenure.
In determining that a particular Trustee was and continues to be qualified to serve as a Trustee, the Board has considered a variety of criteria, none of which, in isolation, was controlling. The Board believes that, collectively, the Trustees have balanced and diverse experience, qualifications, attributes, and skills, which allow the Board to operate effectively in governing each fund and protecting the interests of shareholders. Information about the specific experience, skills, attributes, and qualifications of each Trustee, which in each case led to the Board's conclusion that the Trustee should serve (or continue to serve) as a trustee of the funds, is provided below.
Board Structure and Oversight Function. Robert A. Lawrence is an interested person and currently serves as Chair. The Trustees have determined that an interested Chair is appropriate and benefits shareholders because an interested Chair has a personal and professional stake in the quality and continuity of services provided to the funds. Independent Trustees exercise their informed business judgment to appoint an individual of their choosing to serve as Chair, regardless of whether the Trustee happens to be independent or a member of management. The Independent Trustees have determined that they can act independently and effectively without having an Independent Trustee serve as Chair and that a key structural component for assuring that they are in a position to do so is for the Independent Trustees to constitute a substantial majority for the Board. The Independent Trustees also regularly meet in executive session. David M. Thomas serves as Lead Independent Trustee and as such (i) acts as a liaison between the Independent Trustees and management with respect to matters important to the Independent Trustees and (ii) with management prepares agendas for Board meetings.
Fidelity® funds are overseen by different Boards of Trustees. The funds' Board oversees Fidelity's high income and certain equity funds, and other Boards oversee Fidelity's investment-grade bond, money market, asset allocation, and other equity funds. The asset allocation funds may invest in Fidelity® funds overseen by the funds' Board. The use of separate Boards, each with its own committee structure, allows the Trustees of each group of Fidelity® funds to focus on the unique issues of the funds they oversee, including common research, investment, and operational issues. On occasion, the separate Boards establish joint committees to address issues of overlapping consequences for the Fidelity® funds overseen by each Board.
The Trustees operate using a system of committees to facilitate the timely and efficient consideration of all matters of importance to the Trustees, each fund, and fund shareholders and to facilitate compliance with legal and regulatory requirements and oversight of the funds' activities and associated risks. The Board, acting through its committees, has charged FMR and its affiliates with (i) identifying events or circumstances the occurrence of which could have demonstrably adverse effects on the funds' business and/or reputation; (ii) implementing processes and controls to lessen the possibility that such events or circumstances occur or to mitigate the effects of such events or circumstances if they do occur; and (iii) creating and maintaining a system designed to evaluate continuously business and market conditions in order to facilitate the identification and implementation processes described in (i) and (ii) above. Because the day-to-day operations and activities of the funds are carried out by or through FMR, its affiliates, and other service providers, the funds' exposure to risks is mitigated but not eliminated by the processes overseen by the Trustees. While each of the Board's committees has responsibility for overseeing different aspects of the funds' activities, oversight is exercised primarily through the Operations, Audit, and Compliance Committees. Appropriate personnel, including but not limited to the funds' Chief Compliance Officer (CCO), FMR's internal auditor, the independent accountants, the funds' Treasurer and portfolio management personnel, make periodic reports to the Board's committees, as appropriate, including an annual review of Fidelity's risk management program for the Fidelity® funds. The responsibilities of each standing committee, including their oversight responsibilities, are described further under "Standing Committees of the Trustees."
Interested Trustees*:
Correspondence intended for a Trustee who is an interested person may be sent to Fidelity Investments, 245 Summer Street, Boston, Massachusetts 02210.
Name, Year of Birth; Principal Occupations and Other Relevant Experience+
Bettina Doulton (1964)
Year of Election or Appointment: 2020
Trustee
Ms. Doulton also serves as Trustee of other Fidelity® funds. Prior to her retirement, Ms. Doulton served in a variety of positions at Fidelity Investments, including as a managing director of research (2006-2007), portfolio manager to certain Fidelity® funds (1993-2005), equity analyst and portfolio assistant (1990-1993), and research assistant (1987-1990). Ms. Doulton currently owns and operates Phi Builders + Architects and Cellardoor Winery. Previously, Ms. Doulton served as a member of the Board of Brown Capital Management, LLC (2014-2018).
Robert A. Lawrence (1952)
Year of Election or Appointment: 2020
Trustee
Chair of the Board of Trustees
Mr. Lawrence also serves as Trustee of other funds. Previously, Mr. Lawrence served as a Trustee and Member of the Advisory Board of certain funds. Prior to his retirement in 2008, Mr. Lawrence served as Vice President of certain Fidelity® funds (2006-2008), Senior Vice President, Head of High Income Division of Fidelity Management & Research Company (investment adviser firm, 2006-2008), and President of Fidelity Strategic Investments (investment adviser firm, 2002-2005).
* Determined to be an “Interested Trustee” by virtue of, among other things, his or her affiliation with the trust or various entities under common control with FMR.
+ The information includes the Trustee's principal occupation during the last five years and other information relating to the experience, attributes, and skills relevant to the Trustee's qualifications to serve as a Trustee, which led to the conclusion that the Trustee should serve as a Trustee for each fund.
Independent Trustees:
Correspondence intended for an Independent Trustee may be sent to Fidelity Investments, P.O. Box 55235, Boston, Massachusetts 02205-5235.
Name, Year of Birth; Principal Occupations and Other Relevant Experience+
Thomas P. Bostick (1956)
Year of Election or Appointment: 2021
Trustee
Lieutenant General Bostick also serves as Trustee of other Fidelity® funds. Prior to his retirement, General Bostick (United States Army, Retired) held a variety of positions within the U.S. Army, including Commanding General and Chief of Engineers, U.S. Army Corps of Engineers (2012-2016) and Deputy Chief of Staff and Director of Human Resources, U.S. Army (2009-2012). General Bostick currently serves as a member of the Board and Finance and Governance Committees of CSX Corporation (transportation, 2020-present) and a member of the Board and Corporate Governance and Nominating Committee of Perma-Fix Environmental Services, Inc. (nuclear waste management, 2020-present). General Bostick serves as Chief Executive Officer of Bostick Global Strategies, LLC (consulting, 2016-present) and as a member of the Board of HireVue, Inc. (video interview and assessment, 2020-present). Previously, General Bostick served as a Member of the Advisory Board of certain Fidelity® funds (2021), President, Intrexon Bioengineering (2018-2020) and Chief Operating Officer (2017-2020) and Senior Vice President of the Environment Sector (2016-2017) of Intrexon Corporation (biopharmaceutical company).
Dennis J. Dirks (1948)
Year of Election or Appointment: 2018
Trustee
Mr. Dirks also serves as Trustee of other Fidelity® funds. Prior to his retirement in May 2003, Mr. Dirks served as Chief Operating Officer and as a member of the Board of The Depository Trust & Clearing Corporation (financial markets infrastructure), President, Chief Operating Officer and a member of the Board of The Depository Trust Company (DTC), President and a member of the Board of the National Securities Clearing Corporation (NSCC), Chief Executive Officer and a member of the Board of the Government Securities Clearing Corporation and Chief Executive Officer and a member of the Board of the Mortgage-Backed Securities Clearing Corporation. Mr. Dirks currently serves as a member of the Finance Committee (2016-present) and Board (2017-present) and is Treasurer (2018-present) of the Asolo Repertory Theatre.
Donald F. Donahue (1950)
Year of Election or Appointment: 2018
Trustee
Mr. Donahue also serves as Trustee of other Fidelity® funds. Mr. Donahue serves as President and Chief Executive Officer of Miranda Partners, LLC (risk consulting for the financial services industry, 2012-present). Previously, Mr. Donahue served as Chief Executive Officer (2006-2012), Chief Operating Officer (2003-2006) and Managing Director, Customer Marketing and Development (1999-2003) of The Depository Trust & Clearing Corporation (financial markets infrastructure). Mr. Donahue currently serves as a member (2007-present) and Co-Chairman (2016-present) of the Board of United Way of New York and a member of the Board of The Leadership Academy (previously NYC Leadership Academy) (2012-present). Mr. Donahue previously served as a member of the Advisory Board of certain Fidelity® funds (2015-2018).
Vicki L. Fuller (1957)
Year of Election or Appointment: 2020
Trustee
Ms. Fuller also serves as Trustee of other Fidelity® funds. Previously, Ms. Fuller served as a member of the Advisory Board of certain Fidelity® funds (2018-2020), Chief Investment Officer of the New York State Common Retirement Fund (2012-2018) and held a variety of positions at AllianceBernstein L.P. (global asset management, 1985-2012), including Managing Director (2006-2012) and Senior Vice President and Senior Portfolio Manager (2001-2006). Ms. Fuller currently serves as a member of the Board, Audit Committee and Nominating and Governance Committee of two Blackstone business development companies (2020-present), as a member of the Board of Treliant, LLC (consulting, 2019-present), as a member of the Advisory Board of Ariel Alternatives, LLC (private equity, 2021-present) and as a member of the Board and Chair of the Audit Committee of Gusto, Inc. (software, 2021-present). In addition, Ms. Fuller currently serves as a member of the Board of Roosevelt University (2019-present) and as a member of the Executive Board of New York University’s Stern School of Business. Ms. Fuller previously served as a member of the Board, Audit Committee and Nominating and Governance Committee of The Williams Companies, Inc. (natural gas infrastructure, 2018-2021).
Patricia L. Kampling (1959)
Year of Election or Appointment: 2020
Trustee
Ms. Kampling also serves as Trustee of other Fidelity® funds. Prior to her retirement, Ms. Kampling served as Chairman of the Board and Chief Executive Officer (2012-2019), President and Chief Operating Officer (2011-2012) and Executive Vice President and Chief Financial Officer (2010-2011) of Alliant Energy Corporation. Ms. Kampling currently serves as a member of the Board, Finance Committee and Governance, Compensation and Nominating Committee of Xcel Energy Inc. (utilities company, 2020-present) and as a member of the Board, Audit, Finance and Risk Committee and Safety, Environmental, Technology and Operations Committee and Chair of the Executive Development and Compensation Committee of American Water Works Company, Inc. (utilities company, 2019-present). In addition, Ms. Kampling currently serves as a member of the Board of the Nature Conservancy, Wisconsin Chapter (2019-present). Previously, Ms. Kampling served as a Member of the Advisory Board of certain Fidelity® funds (2020), a member of the Board, Compensation Committee and Executive Committee and Chair of the Audit Committee of Briggs & Stratton Corporation (manufacturing, 2011-2021), a member of the Board of Interstate Power and Light Company (2012-2019) and Wisconsin Power and Light Company (2012-2019) (each a subsidiary of Alliant Energy Corporation) and as a member of the Board and Workforce Development Committee of the Business Roundtable (2018-2019).
Thomas A. Kennedy (1955)
Year of Election or Appointment: 2021
Trustee
Mr. Kennedy also serves as Trustee of other Fidelity® funds. Previously, Mr. Kennedy served as a Member of the Advisory Board of certain Fidelity® funds (2020) and held a variety of positions at Raytheon Company (aerospace and defense, 1983-2020), including Chairman and Chief Executive Officer (2014-2020) and Executive Vice President and Chief Operating Officer (2013-2014). Mr. Kennedy currently serves as Executive Chairman of the Board of Directors of Raytheon Technologies Corporation (aerospace and defense, 2020-present). He is also a member of the Rutgers School of Engineering Industry Advisory Board (2011-present) and a member of the UCLA Engineering Dean’s Executive Board (2016-present).
Oscar Munoz (1959)
Year of Election or Appointment: 2021
Trustee
Mr. Munoz also serves as Trustee of other Fidelity® funds. Prior to his retirement, Mr. Munoz served as Executive Chairman (2020-2021), Chief Executive Officer (2015-2020), President (2015-2016) and a member of the Board (2010-2021) of United Airlines Holdings, Inc. Mr. Munoz currently serves as a member of the Board of CBRE Group, Inc. (commercial real estate, 2020-present), a member of the Board of Univision Communications, Inc. (Hispanic media, 2020-present) and a member of the Advisory Board of Salesforce.com, Inc. (cloud-based software, 2020-present). Previously, Mr. Munoz served as a Member of the Advisory Board of certain Fidelity® funds (2021).
Garnett A. Smith (1947)
Year of Election or Appointment: 2013
Trustee
Mr. Smith also serves as Trustee of other Fidelity® funds. Prior to his retirement, Mr. Smith served as Chairman and Chief Executive Officer (1990-1997) and President (1986-1990) of Inbrand Corp. (manufacturer of personal absorbent products). Prior to his employment with Inbrand Corp., he was employed by a retail fabric chain and North Carolina National Bank (now Bank of America). Mr. Smith previously served as a member of the Advisory Board of certain Fidelity® funds (2012-2013).
David M. Thomas (1949)
Year of Election or Appointment: 2018
Trustee
Lead Independent Trustee
Mr. Thomas also serves as Trustee of other Fidelity® funds. Previously, Mr. Thomas served as Executive Chairman (2005-2006) and Chairman and Chief Executive Officer (2000-2005) of IMS Health, Inc. (pharmaceutical and healthcare information solutions). Mr. Thomas currently serves as a member of the Board of Fortune Brands Home and Security (home and security products, 2004-present) and as Director (2013-present) and Non-Executive Chairman of the Board (2022-present) of Interpublic Group of Companies, Inc. (marketing communication).
Susan Tomasky (1953)
Year of Election or Appointment: 2020
Trustee
Ms. Tomasky also serves as Trustee of other Fidelity® funds. Prior to her retirement, Ms. Tomasky served in various executive officer positions at American Electric Power Company, Inc. (1998-2011), including most recently as President of AEP Transmission (2007-2011). Ms. Tomasky currently serves as a member of the Board and Sustainability Committee and as Chair of the Audit Committee of Marathon Petroleum Corporation (2018-present) and as a member of the Board, Executive Committee, Corporate Governance Committee and Organization and Compensation Committee and as Chair of the Audit Committee of Public Service Enterprise Group, Inc. (utilities company, 2012-present) and as a member of the Board of its subsidiary company, Public Service Electric and Gas Co. (2021-present). In addition, Ms. Tomasky currently serves as a member (2009-present) and President (2020-present) of the Board of the Royal Shakespeare Company – America (2009-present), as a member of the Board of the Columbus Association for the Performing Arts (2011-present) and as a member of the Board and Kenyon in the World Committee of Kenyon College (2016-present). Previously, Ms. Tomasky served as a Member of the Advisory Board of certain Fidelity® funds (2020), as a member of the Board of the Columbus Regional Airport Authority (2007-2020), as a member of the Board (2011-2018) and Lead Independent Director (2015-2018) of Andeavor Corporation (previously Tesoro Corporation) (independent oil refiner and marketer) and as a member of the Board of Summit Midstream Partners LP (energy, 2012-2018).
Michael E. Wiley (1950)
Year of Election or Appointment: 2008
Trustee
Mr. Wiley also serves as Trustee of other Fidelity® funds. Previously, Mr. Wiley served as a member of the Advisory Board of certain Fidelity® funds (2018-2020), Chairman, President and CEO of Baker Hughes, Inc. (oilfield services, 2000-2004). Mr. Wiley also previously served as a member of the Board of Andeavor Corporation (independent oil refiner and marketer, 2005-2018), a member of the Board of Andeavor Logistics LP (natural resources logistics, 2015-2018) and a member of the Board of High Point Resources (exploration and production, 2005-2020).
+ The information includes the Trustee's principal occupation during the last five years and other information relating to the experience, attributes, and skills relevant to the Trustee's qualifications to serve as a Trustee, which led to the conclusion that the Trustee should serve as a Trustee for each fund.
Advisory Board Members and Officers:
Correspondence intended for a Member of the Advisory Board (if any) may be sent to Fidelity Investments, P.O. Box 55235, Boston, Massachusetts 02205-5235. Correspondence intended for an officer or Peter S. Lynch may be sent to Fidelity Investments, 245 Summer Street, Boston, Massachusetts 02210. Officers appear below in alphabetical order.
Name, Year of Birth; Principal Occupation
Peter S. Lynch (1944)
Year of Election or Appointment: 2018
Member of the Advisory Board
Mr. Lynch also serves as a Member of the Advisory Board of other Fidelity® funds. Mr. Lynch is Vice Chairman and a Director of Fidelity Management & Research Company LLC (investment adviser firm). In addition, Mr. Lynch serves as a Trustee of Boston College and as the Chairman of the Inner-City Scholarship Fund. Previously, Mr. Lynch served as Vice Chairman and a Director of FMR Co., Inc. (investment adviser firm) and on the Special Olympics International Board of Directors (1997-2006).
Craig S. Brown (1977)
Year of Election or Appointment: 2019
Assistant Treasurer
Mr. Brown also serves as an officer of other funds. Mr. Brown serves as Assistant Treasurer of FIMM, LLC (2021-present) and is an employee of Fidelity Investments (2013-present).
John J. Burke III (1964)
Year of Election or Appointment: 2018
Chief Financial Officer
Mr. Burke also serves as Chief Financial Officer of other funds. Mr. Burke serves as Head of Investment Operations for Fidelity Fund and Investment Operations (2018-present) and is an employee of Fidelity Investments (1998-present). Previously Mr. Burke served as head of Asset Management Investment Operations (2012-2018).
William C. Coffey (1969)
Year of Election or Appointment: 2019
Assistant Secretary
Mr. Coffey also serves as Assistant Secretary of other funds. He is Senior Vice President and Deputy General Counsel of FMR LLC (diversified financial services company, 2010-present), and is an employee of Fidelity Investments. Previously, Mr. Coffey served as Secretary and CLO of certain funds (2018-2019); CLO, Secretary, and Senior Vice President of Fidelity Management & Research Company and FMR Co., Inc. (investment adviser firms, 2018-2019); Secretary of Fidelity SelectCo, LLC and Fidelity Investments Money Management, Inc. (investment adviser firms, 2018-2019); CLO of Fidelity Management & Research (Hong Kong) Limited, FMR Investment Management (UK) Limited, and Fidelity Management & Research (Japan) Limited (investment adviser firms, 2018-2019); and Assistant Secretary of certain funds (2009-2018).
Timothy M. Cohen (1969)
Year of Election or Appointment: 2018
Vice President
Mr. Cohen also serves as Vice President of other funds. Mr. Cohen serves as Co-Head of Equity (2018-present), a Director of Fidelity Management & Research (Japan) Limited (investment adviser firm, 2016-present), and is an employee of Fidelity Investments. Previously, Mr. Cohen served as Executive Vice President of Fidelity SelectCo, LLC (2019), Head of Global Equity Research (2016-2018), Chief Investment Officer - Equity and a Director of Fidelity Management & Research (U.K.) Inc. (investment adviser firm, 2013-2015) and as a Director of Fidelity Management & Research (Hong Kong) Limited (investment adviser firm, 2017).
Jonathan Davis (1968)
Year of Election or Appointment: 2010
Assistant Treasurer
Mr. Davis also serves as an officer of other funds. Mr. Davis serves as Assistant Treasurer of FIMM, LLC (2021-present), FMR Capital, Inc. (2017-present), FD Funds GP LLC (2021-present), FD Funds Holding LLC (2021-present), and FD Funds Management LLC (2021-present); and is an employee of Fidelity Investments. Previously, Mr. Davis served as Vice President and Associate General Counsel of FMR LLC (diversified financial services company, 2003-2010).
Laura M. Del Prato (1964)
Year of Election or Appointment: 2018
Assistant Treasurer
Ms. Del Prato also serves as an officer of other funds. Ms. Del Prato serves as Assistant Treasurer of FIMM, LLC (2021-present) and is an employee of Fidelity Investments (2017-present). Previously, Ms. Del Prato served as President and Treasurer of The North Carolina Capital Management Trust: Cash Portfolio and Term Portfolio (2018-2020). Prior to joining Fidelity Investments, Ms. Del Prato served as a Managing Director and Treasurer of the JPMorgan Mutual Funds (2014-2017). Prior to JPMorgan, Ms. Del Prato served as a partner at Cohen Fund Audit Services (accounting firm, 2012-2013) and KPMG LLP (accounting firm, 2004-2012).
Colm A. Hogan (1973)
Year of Election or Appointment: 2020
Assistant Treasurer
Mr. Hogan also serves as an officer of other funds. Mr. Hogan serves as Assistant Treasurer of FIMM, LLC (2021-present) and FMR Capital, Inc. (2017-present) and is an employee of Fidelity Investments (2005-present). Previously, Mr. Hogan served as Deputy Treasurer of certain Fidelity® funds (2016-2020) and Assistant Treasurer of certain Fidelity® funds (2016-2018).
Pamela R. Holding (1964)
Year of Election or Appointment: 2018
Vice President
Ms. Holding also serves as Vice President of other funds. Ms. Holding serves as Co-Head of Equity (2018-present) and is an employee of Fidelity Investments (2013-present). Previously, Ms. Holding served as Executive Vice President of Fidelity SelectCo, LLC (2019) and as Chief Investment Officer of Fidelity Institutional Asset Management (2013-2018).
Cynthia Lo Bessette (1969)
Year of Election or Appointment: 2019
Secretary and Chief Legal Officer (CLO)
Ms. Lo Bessette also serves as an officer of other funds. Ms. Lo Bessette serves as CLO, Secretary, and Senior Vice President of Fidelity Management & Research Company LLC (investment adviser firm, 2019-present); CLO of Fidelity Management & Research (Hong Kong) Limited, FMR Investment Management (UK) Limited, and Fidelity Management & Research (Japan) Limited (investment adviser firms, 2019-present); Secretary of FD Funds GP LLC (2021-present), FD Funds Holding LLC (2021-present), and FD Funds Management LLC (2021-present); and Assistant Secretary of FIMM, LLC (2019-present). She is a Senior Vice President and Deputy General Counsel of FMR LLC (diversified financial services company, 2019-present), and is an employee of Fidelity Investments. Previously, Ms. Lo Bessette served as CLO, Secretary, and Senior Vice President of FMR Co., Inc. (investment adviser firm, 2019); Secretary of Fidelity SelectCo, LLC and Fidelity Investments Money Management, Inc. (investment adviser firms, 2019). Prior to joining Fidelity Investments, Ms. Lo Bessette was Executive Vice President, General Counsel (2016-2019) and Senior Vice President, Deputy General Counsel (2015-2016) of OppenheimerFunds (investment management company) and Deputy Chief Legal Officer (2013-2015) of Jennison Associates LLC (investment adviser firm).
Chris Maher (1972)
Year of Election or Appointment: 2020
Deputy Treasurer
Mr. Maher also serves as an officer of other funds. Mr. Maher serves as Assistant Treasurer of FIMM, LLC (2021-present) and FMR Capital, Inc. (2017-present), and is an employee of Fidelity Investments (2008-present). Previously, Mr. Maher served as Assistant Treasurer of certain funds (2013-2020); Vice President of Asset Management Compliance (2013), Vice President of the Program Management Group of FMR (investment adviser firm, 2010-2013), and Vice President of Valuation Oversight (2008-2010).
Jason P. Pogorelec (1975)
Year of Election or Appointment: 2020
Chief Compliance Officer
Mr. Pogorelec also serves as Chief Compliance Officer of other funds. Mr. Pogorelec is a senior Vice President of Asset Management Compliance for Fidelity Investments and is an employee of Fidelity Investments (2006-present). Previously, Mr. Pogorelec served as Vice President, Associate General Counsel for Fidelity Investments (2010-2020) and Assistant Secretary of certain Fidelity funds (2015-2020).
Brett Segaloff (1972)
Year of Election or Appointment: 2021
Anti-Money Laundering (AML) Officer
Mr. Segaloff also serves as an AML Officer of other funds and other related entities. He is Director, Anti-Money Laundering (2007-present) of FMR LLC (diversified financial services company) and is an employee of Fidelity Investments (1996-present).
Stacie M. Smith (1974)
Year of Election or Appointment: 2018
President and Treasurer
Ms. Smith also serves as an officer of other funds. Ms. Smith serves as Assistant Treasurer of FIMM, LLC (2021-present) and FMR Capital, Inc. (2017-present), is an employee of Fidelity Investments (2009-present), and has served in other fund officer roles. Prior to joining Fidelity Investments, Ms. Smith served as Senior Audit Manager of Ernst & Young LLP (accounting firm, 1996-2009). Previously, Ms. Smith served as Assistant Treasurer (2013-2019) and Deputy Treasurer (2013-2016) of certain Fidelity® funds.
Jim Wegmann (1979)
Year of Election or Appointment: 2019
Assistant Treasurer
Mr. Wegmann also serves as an officer of other funds. Mr. Wegmann serves as Assistant Treasurer of FIMM, LLC (2021-present) and is an employee of Fidelity Investments (2011-present). Previously, Mr. Wegmann served as Assistant Treasurer of certain Fidelity® funds (2019-2021).
Shareholder Expense Example
As a shareholder, you incur two types of costs: (1) transaction costs, which may include sales charges (loads) on purchase payments or redemption proceeds, as applicable and (2) ongoing costs, which generally include management fees, distribution and/or service (12b-1) fees and other Fund expenses. This Example is intended to help you understand your ongoing costs (in dollars) of investing in a fund and to compare these costs with the ongoing costs of investing in other mutual funds.
The Example is based on an investment of $1,000 invested at the beginning of the period and held for the entire period (February 1, 2022 to July 31, 2022).
Actual Expenses
The first line of the accompanying table provides information about actual account values and actual expenses. You may use the information in this line, together with the amount you invested, to estimate the expenses that you paid over the period. Simply divide your account value by $1,000.00 (for example, an $8,600 account value divided by $1,000.00 = 8.6), then multiply the result by the number in the first line for a class/Fund under the heading entitled "Expenses Paid During Period" to estimate the expenses you paid on your account during this period. If any fund is a shareholder of any underlying mutual funds or exchange-traded funds (ETFs) (the Underlying Funds), such fund indirectly bears its proportional share of the expenses of the Underlying Funds in addition to the direct expenses incurred presented in the table. These fees and expenses are not included in the annualized expense ratio used to calculate the expense estimate in the table below.
Hypothetical Example for Comparison Purposes
The second line of the accompanying table provides information about hypothetical account values and hypothetical expenses based on the actual expense ratio and an assumed rate of return of 5% per year before expenses, which is not the actual return. The hypothetical account values and expenses may not be used to estimate the actual ending account balance or expenses you paid for the period. You may use this information to compare the ongoing costs of investing in the Fund and other funds. To do so, compare this 5% hypothetical example with the 5% hypothetical examples that appear in the shareholder reports of the other funds. If any fund is a shareholder of any Underlying Funds, such fund indirectly bears its proportional share of the expenses of the Underlying Funds in addition to the direct expenses as presented in the table. These fees and expenses are not included in the annualized expense ratio used to calculate the expense estimate in the table below.
Please note that the expenses shown in the table are meant to highlight your ongoing costs only and do not reflect any transaction costs. Therefore, the second line of the table is useful in comparing ongoing costs only, and will not help you determine the relative total costs of owning different funds. In addition, if these transactional costs were included, your costs would have been higher.
| | Annualized Expense Ratio-A | Beginning
Account Value
February 1, 2022 | Ending
Account Value
July 31, 2022 | Expenses Paid
During Period-B
February 1, 2022
to July 31, 2022 |
| Fidelity Advisor Biotechnology Fund | | | | |
| Class A | 1.00% | | | |
| Actual | | $1,000.00 | $928.30 | $4.78 |
| Hypothetical-C | | $1,000.00 | $1,019.84 | $5.01 |
| Class M | 1.29% | | | |
| Actual | | $1,000.00 | $926.90 | $6.16 |
| Hypothetical-C | | $1,000.00 | $1,018.40 | $6.46 |
| Class C | 1.76% | | | |
| Actual | | $1,000.00 | $924.50 | $8.40 |
| Hypothetical-C | | $1,000.00 | $1,016.07 | $8.80 |
| Class I | .73% | | | |
| Actual | | $1,000.00 | $929.10 | $3.49 |
| Hypothetical-C | | $1,000.00 | $1,021.17 | $3.66 |
| Class Z | .61% | | | |
| Actual | | $1,000.00 | $930.00 | $2.92 |
| Hypothetical-C | | $1,000.00 | $1,021.77 | $3.06 |
| Fidelity Advisor Consumer Discretionary Fund | | | | |
| Class A | 1.01% | | | |
| Actual | | $1,000.00 | $859.30 | $4.66 |
| Hypothetical-C | | $1,000.00 | $1,019.79 | $5.06 |
| Class M | 1.28% | | | |
| Actual | | $1,000.00 | $858.00 | $5.90 |
| Hypothetical-C | | $1,000.00 | $1,018.45 | $6.41 |
| Class C | 1.77% | | | |
| Actual | | $1,000.00 | $855.70 | $8.14 |
| Hypothetical-C | | $1,000.00 | $1,016.02 | $8.85 |
| Class I | .74% | | | |
| Actual | | $1,000.00 | $860.40 | $3.41 |
| Hypothetical-C | | $1,000.00 | $1,021.12 | $3.71 |
| Class Z | .62% | | | |
| Actual | | $1,000.00 | $860.80 | $2.86 |
| Hypothetical-C | | $1,000.00 | $1,021.72 | $3.11 |
| Fidelity Advisor Energy Fund | | | | |
| Class A | 1.02% | | | |
| Actual | | $1,000.00 | $1,229.10 | $5.64 |
| Hypothetical-C | | $1,000.00 | $1,019.74 | $5.11 |
| Class M | 1.29% | | | |
| Actual | | $1,000.00 | $1,227.40 | $7.12 |
| Hypothetical-C | | $1,000.00 | $1,018.40 | $6.46 |
| Class C | 1.77% | | | |
| Actual | | $1,000.00 | $1,224.30 | $9.76 |
| Hypothetical-C | | $1,000.00 | $1,016.02 | $8.85 |
| Class I | .75% | | | |
| Actual | | $1,000.00 | $1,230.70 | $4.15 |
| Hypothetical-C | | $1,000.00 | $1,021.08 | $3.76 |
| Class Z | .62% | | | |
| Actual | | $1,000.00 | $1,231.20 | $3.43 |
| Hypothetical-C | | $1,000.00 | $1,021.72 | $3.11 |
| Fidelity Advisor Financial Services Fund | | | | |
| Class A | 1.03% | | | |
| Actual | | $1,000.00 | $881.40 | $4.80 |
| Hypothetical-C | | $1,000.00 | $1,019.69 | $5.16 |
| Class M | 1.27% | | | |
| Actual | | $1,000.00 | $880.40 | $5.92 |
| Hypothetical-C | | $1,000.00 | $1,018.50 | $6.36 |
| Class C | 1.78% | | | |
| Actual | | $1,000.00 | $877.90 | $8.29 |
| Hypothetical-C | | $1,000.00 | $1,015.97 | $8.90 |
| Class I | .76% | | | |
| Actual | | $1,000.00 | $882.50 | $3.55 |
| Hypothetical-C | | $1,000.00 | $1,021.03 | $3.81 |
| Class Z | .63% | | | |
| Actual | | $1,000.00 | $883.30 | $2.94 |
| Hypothetical-C | | $1,000.00 | $1,021.67 | $3.16 |
| Fidelity Advisor Health Care Fund | | | | |
| Class A | .97% | | | |
| Actual | | $1,000.00 | $1,001.00 | $4.81 |
| Hypothetical-C | | $1,000.00 | $1,019.98 | $4.86 |
| Class M | 1.22% | | | |
| Actual | | $1,000.00 | $999.60 | $6.05 |
| Hypothetical-C | | $1,000.00 | $1,018.74 | $6.11 |
| Class C | 1.72% | | | |
| Actual | | $1,000.00 | $997.20 | $8.52 |
| Hypothetical-C | | $1,000.00 | $1,016.27 | $8.60 |
| Class I | .71% | | | |
| Actual | | $1,000.00 | $1,002.20 | $3.52 |
| Hypothetical-C | | $1,000.00 | $1,021.27 | $3.56 |
| Class Z | .59% | | | |
| Actual | | $1,000.00 | $1,002.80 | $2.93 |
| Hypothetical-C | | $1,000.00 | $1,021.87 | $2.96 |
| Fidelity Advisor Industrials Fund | | | | |
| Class A | 1.02% | | | |
| Actual | | $1,000.00 | $948.50 | $4.93 |
| Hypothetical-C | | $1,000.00 | $1,019.74 | $5.11 |
| Class M | 1.27% | | | |
| Actual | | $1,000.00 | $947.30 | $6.13 |
| Hypothetical-C | | $1,000.00 | $1,018.50 | $6.36 |
| Class C | 1.77% | | | |
| Actual | | $1,000.00 | $944.70 | $8.53 |
| Hypothetical-C | | $1,000.00 | $1,016.02 | $8.85 |
| Class I | .75% | | | |
| Actual | | $1,000.00 | $949.60 | $3.63 |
| Hypothetical-C | | $1,000.00 | $1,021.08 | $3.76 |
| Class Z | .62% | | | |
| Actual | | $1,000.00 | $950.60 | $3.00 |
| Hypothetical-C | | $1,000.00 | $1,021.72 | $3.11 |
| Fidelity Advisor Semiconductors Fund | | | | |
| Class A | 1.00% | | | |
| Actual | | $1,000.00 | $873.80 | $4.65 |
| Hypothetical-C | | $1,000.00 | $1,019.84 | $5.01 |
| Class M | 1.25% | | | |
| Actual | | $1,000.00 | $872.80 | $5.80 |
| Hypothetical-C | | $1,000.00 | $1,018.60 | $6.26 |
| Class C | 1.75% | | | |
| Actual | | $1,000.00 | $870.60 | $8.12 |
| Hypothetical-C | | $1,000.00 | $1,016.12 | $8.75 |
| Class I | .73% | | | |
| Actual | | $1,000.00 | $875.00 | $3.39 |
| Hypothetical-C | | $1,000.00 | $1,021.17 | $3.66 |
| Class Z | .61% | | | |
| Actual | | $1,000.00 | $875.50 | $2.84 |
| Hypothetical-C | | $1,000.00 | $1,021.77 | $3.06 |
| Fidelity Advisor Technology Fund | | | | |
| Class A | .97% | | | |
| Actual | | $1,000.00 | $824.10 | $4.39 |
| Hypothetical-C | | $1,000.00 | $1,019.98 | $4.86 |
| Class M | 1.22% | | | |
| Actual | | $1,000.00 | $823.00 | $5.51 |
| Hypothetical-C | | $1,000.00 | $1,018.74 | $6.11 |
| Class C | 1.73% | | | |
| Actual | | $1,000.00 | $820.90 | $7.81 |
| Hypothetical-C | | $1,000.00 | $1,016.22 | $8.65 |
| Class I | .71% | | | |
| Actual | | $1,000.00 | $825.20 | $3.21 |
| Hypothetical-C | | $1,000.00 | $1,021.27 | $3.56 |
| Class Z | .59% | | | |
| Actual | | $1,000.00 | $825.70 | $2.67 |
| Hypothetical-C | | $1,000.00 | $1,021.87 | $2.96 |
| Fidelity Advisor Utilities Fund | | | | |
| Class A | 1.02% | | | |
| Actual | | $1,000.00 | $1,093.90 | $5.30 |
| Hypothetical-C | | $1,000.00 | $1,019.74 | $5.11 |
| Class M | 1.29% | | | |
| Actual | | $1,000.00 | $1,092.60 | $6.69 |
| Hypothetical-C | | $1,000.00 | $1,018.40 | $6.46 |
| Class C | 1.77% | | | |
| Actual | | $1,000.00 | $1,090.20 | $9.17 |
| Hypothetical-C | | $1,000.00 | $1,016.02 | $8.85 |
| Class I | .75% | | | |
| Actual | | $1,000.00 | $1,095.50 | $3.90 |
| Hypothetical-C | | $1,000.00 | $1,021.08 | $3.76 |
| Class Z | .62% | | | |
| Actual | | $1,000.00 | $1,096.40 | $3.22 |
| Hypothetical-C | | $1,000.00 | $1,021.72 | $3.11 |
A Annualized expense ratio reflects expenses net of applicable fee waivers.
B Expenses are equal to the annualized expense ratio, multiplied by the average account value over the period, multiplied by 181/ 365 (to reflect the one-half year period). The fees and expenses of any Underlying Funds are not included in each annualized expense ratio.
C 5% return per year before expenses
Distributions (Unaudited)
The dividend and capital gains distributions for the fund(s) are available on Fidelity.com or Institutional.Fidelity.com.
The funds hereby designate as capital gain dividend the amounts noted below for the taxable year ended July 31, 2022, or, if subsequently determined to be different, the net capital gain of such year.
| Fidelity Advisor Biotechnology Fund | $31,321,364 |
| Fidelity Advisor Consumer Discretionary Fund | $39,700,389 |
| Fidelity Advisor Financial Services Fund | $33,421,729 |
| Fidelity Advisor Health Care Fund | $97,467,934 |
| Fidelity Advisor Industrials Fund | $41,206,621 |
| Fidelity Advisor Semiconductors Fund | $36,223,317 |
| Fidelity Advisor Technology Fund | $197,655,821 |
| Fidelity Advisor Utilities Fund | $22,436,470 |
|
The funds hereby designate the percentages noted below of the short-term capital gain dividends distributed during the fiscal year as qualifying to be taxed as short-term capital gain dividends for nonresident alien shareholders:
| | December, 2021 |
| Fidelity Advisor Biotechnology Fund | 100% |
| Fidelity Advisor Consumer Discretionary Fund | 100% |
| Fidelity Advisor Financial Services Fund | 100% |
| Fidelity Advisor Health Care Fund | 95.28% |
| Fidelity Advisor Industrials Fund | 100% |
| Fidelity Advisor Semiconductors Fund | 99.92% |
| Fidelity Advisor Technology Fund | 99.99% |
|
A percentage of the dividends distributed during the fiscal year for the following funds qualify for the dividends–received deduction for corporate shareholders:
| | Class A | Class M | Class C | Class I | Class Z |
| Fidelity Advisor Biotechnology Fund | | | | | |
| December 2021 | 15% | 16% | 17% | 15% | 15% |
| Fidelity Advisor Consumer Discretionary Fund | | | | | |
| December 2021 | 100% | 100% | – | 100% | 100% |
| Fidelity Advisor Energy Fund | | | | | |
| December 2021 | 100% | 100% | 100% | 100% | 100% |
| Fidelity Advisor Financial Services Fund | | | | | |
| December 2021 | 100% | 100% | 100% | 100% | 100% |
| Fidelity Advisor Health Care Fund | | | | | |
| December 2021 | – | – | – | 100% | 100% |
| Fidelity Advisor Industrials Fund | | | | | |
| December 2021 | 22% | 25% | 32% | 20% | 19% |
| Fidelity Advisor Semiconductors Fund | | | | | |
| December 2021 | 19% | 21% | 23% | 18% | 18% |
| Fidelity Advisor Technology Fund | | | | | |
| December 2021 | 5% | 5% | 5% | 5% | 5% |
| Fidelity Advisor Utilities Fund | | | | | |
| December 2021 | 100% | 100% | 100% | 100% | 100% |
| April 2022 | 100% | 100% | – | 100% | 100% |
| July 2022 | 100% | 100% | 100% | 100% | 100% |
|
A percentage of the dividends distributed during the fiscal year for the following funds may be taken into account as a dividend for purposes of the maximum rate under section 1(h)(11) of the Internal Revenue Code.
| | Class A | Class M | Class C | Class I | Class Z |
| Fidelity Advisor Biotechnology Fund | | | | | |
| December 2021 | 16% | 16% | 17% | 15% | 15% |
| Fidelity Advisor Consumer Discretionary Fund | | | | | |
| December 2021 | 100% | 100% | – | 100% | 100% |
| Fidelity Advisor Energy Fund | | | | | |
| December 2021 | 100% | 100% | 100% | 100% | 100% |
| Fidelity Advisor Financial Services Fund | | | | | |
| December 2021 | 100% | 100% | 100% | 100% | 100% |
| Fidelity Advisor Health Care Fund | | | | | |
| December 2021 | – | – | – | 100% | 100% |
| Fidelity Advisor Industrials Fund | | | | | |
| December 2021 | 25% | 28% | 37% | 23% | 22% |
| Fidelity Advisor Semiconductors Fund | | | | | |
| December 2021 | 23% | 24% | 27% | 22% | 21% |
| Fidelity Advisor Technology Fund | | | | | |
| December 2021 | 6% | 6% | 7% | 6% | 6% |
| Fidelity Advisor Utilities Fund | | | | | |
| December 2021 | 100% | 100% | 100% | 100% | 100% |
| April 2022 | 100% | 100% | – | 100% | 100% |
| July 2022 | 100% | 100% | 100% | 100% | 100% |
|
The funds will notify shareholders in January 2023 of amounts for use in preparing 2022 income tax returns.
Board Approval of Investment Advisory Contracts and Management Fees
Fidelity Advisor Focus Funds
Each year, the Board of Trustees, including the Independent Trustees (together, the Board), votes on the renewal of the management contract with Fidelity Management & Research Company LLC (FMR) and the sub-advisory agreements (together, the Advisory Contracts) for each fund. FMR and the sub-advisers are referred to herein as the Investment Advisers. The Board, assisted by the advice of fund counsel and Independent Trustees' counsel, requests and considers a broad range of information relevant to the renewal of the Advisory Contracts throughout the year.
The Board meets regularly and, at each of its meetings, covers an extensive agenda of topics and materials and considers factors that are relevant to its annual consideration of the renewal of each fund's Advisory Contracts, including the services and support provided to each fund and its shareholders. The Board has established various standing committees (Committees), each composed of and chaired by Independent Trustees with varying backgrounds, to which the Board has assigned specific subject matter responsibilities in order to enhance effective decision-making by the Board. The Board, acting directly and through its Committees, requests and receives information concerning the annual consideration of the renewal of each fund's Advisory Contracts. The Board also meets as needed to review matters specifically related to the Board's annual consideration of the renewal of the Advisory Contracts. Members of the Board may also meet with trustees of other Fidelity funds through joint ad hoc committees to discuss certain matters relevant to all of the Fidelity funds.
At its May 2022 meeting, the Board unanimously determined to renew each fund's Advisory Contracts. In reaching its determination, the Board considered all factors it believed relevant, including (i) the nature, extent, and quality of the services provided to each fund and its shareholders (including the investment performance of each fund); (ii) the competitiveness relative to peer funds of each fund's management fee and the total expense ratio of a representative class (Class I) of each fund; (iii) the total costs of the services provided by and the profits realized by Fidelity from its relationships with each fund; and (iv) the extent to which, if any, economies of scale exist and are realized as each fund grows, and whether any economies of scale are appropriately shared with fund shareholders.
In considering whether to renew the Advisory Contracts for each fund, the Board reached a determination, with the assistance of fund counsel and Independent Trustees' counsel and through the exercise of its business judgment, that the renewal of the Advisory Contracts was in the best interests of each fund and its shareholders and that the compensation payable under the Advisory Contracts was fair and reasonable. The Board's decision to renew the Advisory Contracts was not based on any single factor, but rather was based on a comprehensive consideration of all the information provided to the Board at its meetings throughout the year. The Board, in reaching its determination to renew the Advisory Contracts, was aware that shareholders of each fund have a broad range of investment choices available to them, including a wide choice among funds offered by Fidelity's competitors, and that each fund's shareholders, who have the opportunity to review and weigh the disclosure provided by the fund in its prospectus and other public disclosures, have chosen to invest in that fund, which is part of the Fidelity family of funds.
Nature, Extent, and Quality of Services Provided. The Board considered Fidelity's staffing as it relates to the funds, including the backgrounds of investment personnel of Fidelity, and also considered the funds' investment objectives, strategies, and related investment philosophies. The Independent Trustees also had discussions with senior management of Fidelity's investment operations and investment groups. The Board considered the structure of the investment personnel compensation program and whether this structure provides appropriate incentives to act in the best interests of each fund. Additionally, the Board considered the portfolio managers' investments, if any, in the funds that they manage. The Board also considered the steps Fidelity had taken to ensure the continued provision of high quality services to the Fidelity funds during the COVID-19 pandemic, including the expansion of staff in client facing positions to maintain service levels in periods of high volumes and volatility.
Resources Dedicated to Investment Management and Support Services. The Board and the Fund Oversight and Research Committees reviewed the general qualifications and capabilities of Fidelity's investment staff, including its size, education, experience, and resources, as well as Fidelity's approach to recruiting, training, managing, and compensating investment personnel. The Board noted the resources devoted to Fidelity's global investment organization, and that Fidelity's analysts have extensive resources, tools and capabilities that allow them to conduct sophisticated quantitative and fundamental analysis, as well as credit analysis of issuers, counterparties and guarantors. Further, the Board considered that Fidelity's investment professionals have sufficient access to global information and data so as to provide competitive investment results over time, and that those professionals also have access to sophisticated tools that permit them to assess portfolio construction and risk and performance attribution characteristics continuously, as well as to transmit new information and research conclusions rapidly around the world. Additionally, in its deliberations, the Board considered Fidelity's trading, risk management, compliance, and technology and operations capabilities and resources, which are integral parts of the investment management process.
Shareholder and Administrative Services. The Board considered (i) the nature, extent, quality, and cost of advisory, administrative, and shareholder services performed by the Investment Advisers and their affiliates under the Advisory Contracts and under separate agreements covering transfer agency, pricing and bookkeeping, and securities lending services for each fund; (ii) the nature and extent of the supervision of third party service providers, principally custodians, subcustodians, and pricing vendors; and (iii) the resources devoted to, and the record of compliance with, each fund's compliance policies and procedures. The Board also reviewed the allocation of fund brokerage, including allocations to brokers affiliated with the Investment Advisers, the use of brokerage commissions to pay fund expenses, and the use of "soft" commission dollars to pay for research services.
The Board noted that the growth of fund assets over time across the complex allows Fidelity to reinvest in the development of services designed to enhance the value and convenience of the Fidelity funds as investment vehicles. These services include 24-hour access to account information and market information over the Internet and through telephone representatives, investor education materials and asset allocation tools. The Board also considered that it reviews customer service metrics such as telephone response times, continuity of services on the website and metrics addressing services at Fidelity Investor Centers.
Investment in a Large Fund Family. The Board considered the benefits to shareholders of investing in a Fidelity fund, including the benefits of investing in a fund that is part of a large family of funds offering a variety of investment disciplines and providing a large variety of mutual fund investor services. The Board noted that Fidelity had taken, or had made recommendations that resulted in the Fidelity funds taking, a number of actions over the previous year that benefited particular funds, including: (i) continuing to dedicate additional resources to Fidelity's investment research process, which includes meetings with management of issuers of securities in which the funds invest; (ii) continuing efforts to enhance Fidelity's global research capabilities; (iii) launching new funds and ETFs with innovative structures, strategies and pricing and making other enhancements to meet client needs; (iv) launching new share classes of existing funds; (v) eliminating purchase minimums and broadening eligibility requirements for certain funds and share classes; (vi) reducing management fees and total expenses for certain target date funds and classes and index funds; (vii) lowering expenses for certain existing funds and classes by implementing or lowering expense caps; (viii) rationalizing product lines and gaining increased efficiencies from fund mergers and liquidations; (ix) continuing to develop, acquire and implement systems and technology to improve services to the funds and shareholders, strengthen information security, and increase efficiency; and (x) continuing to implement enhancements to further strengthen Fidelity's product line to increase investors' probability of success in achieving their investment goals, including retirement income goals.
Investment Performance. The Board considered whether each fund has operated in accordance with its investment objective, as well as its record of compliance with its investment restrictions and its performance history. The Board noted that the fund had portfolio manager changes as follows: (i) Fidelity Advisor Communications Equipment Fund in January 2019; (ii) Fidelity Advisor Energy Fund in January 2020; (iii) Fidelity Advisor Financial Services Fund in May 2019 and October 2019; (iv) Fidelity Advisor Semi-Conductors Fund in July 2020; and (v) Fidelity Advisor Technology Fund in July 2020 and January 2021. The Board will continue to monitor closely each applicable fund's performance, taking into account the portfolio management changes.
The Board took into account discussions that occur at Board meetings throughout the year with representatives of the Investment Advisers about fund investment performance. In this regard the Board noted that as part of regularly scheduled fund reviews and other reports to the Board on fund performance, the Board considers annualized return information for each fund for different time periods, measured against an appropriate securities market index (benchmark index). The Board also reviews and considers information about performance attribution. In its evaluation of fund investment performance, the Board gave particular attention to information indicating changes in performance of certain Fidelity funds for specific time periods and discussed with the Investment Advisers the reasons for any overperformance or underperformance.
In addition to reviewing absolute and relative fund performance, the Independent Trustees periodically consider the appropriateness of fund performance metrics in evaluating the results achieved. In general, the Independent Trustees believe that fund performance should be evaluated based on net performance (after fees and expenses) of the representative class, compared to appropriate benchmark indices, over appropriate time periods that may include full market cycles, taking into account relevant factors including the following: general market conditions; issuer-specific information; and fund cash flows and other factors.
The Independent Trustees recognize that shareholders evaluate performance on a net basis over their own holding periods, for which one-, three-, and five-year periods are often used as a proxy. For this reason, the performance information reviewed by the Board also included net cumulative total return information for each fund and an appropriate benchmark index for the most recent one-, three-, and five-year periods ended September 30, 2021, as shown below. Peer groups are not shown below because each fund does not generally utilize a peer group for performance comparison purposes.
Fidelity Advisor Biotechnology Fund
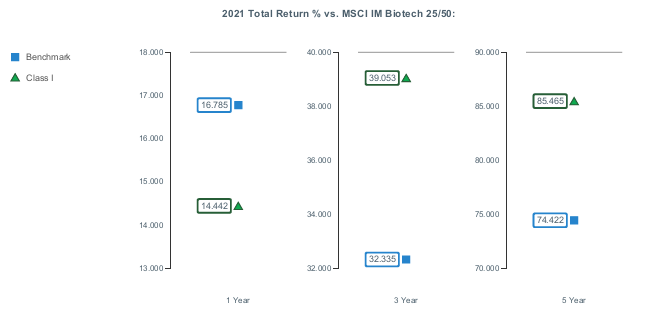
Fidelity Advisor Consumer Discretionary Fund
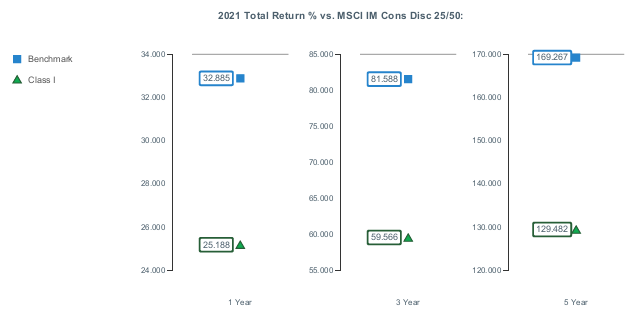
The Board considered the fund's underperformance for different time periods ended September 30, 2021 and for different time periods ended December 31, 2021 (which periods are not reflected in the charts above). The Board noted that the fund's underperformance has continued since the Board approved the management contract in January 2020 and May 2021. The Board's discussions with FMR regarding underperformance cover topics including, but not limited to: the longer-term track record of a fund's portfolio manager(s); broader trends in the market that may adversely impact a fund's performance; and attribution reports on contributors to the fund's underperformance. The Board engages with FMR on steps that might be taken to address a fund's underperformance. For a fund with underperformance over longer periods of time, the Board typically monitors the fund's performance more closely.
Fidelity Advisor Energy Fund
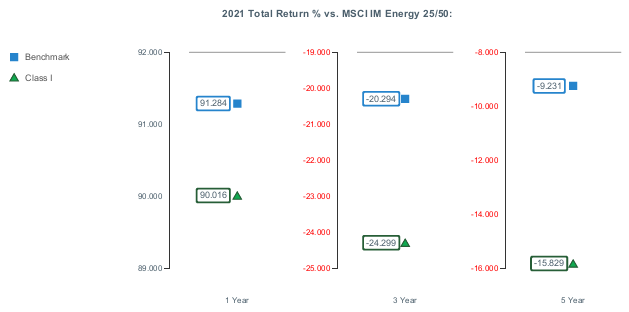
The Board considered the fund's underperformance for different time periods ended September 30, 2021 and for different time periods ended December 31, 2021 (which periods are not reflected in the charts above). The Board's discussions with FMR regarding underperformance cover topics including, but not limited to: the longer-term track record of a fund's portfolio manager(s); broader trends in the market that may adversely impact a fund's performance; and attribution reports on contributors to the fund's underperformance. The Board engages with FMR on steps that might be taken to address a fund's underperformance.
Fidelity Advisor Financial Services Fund
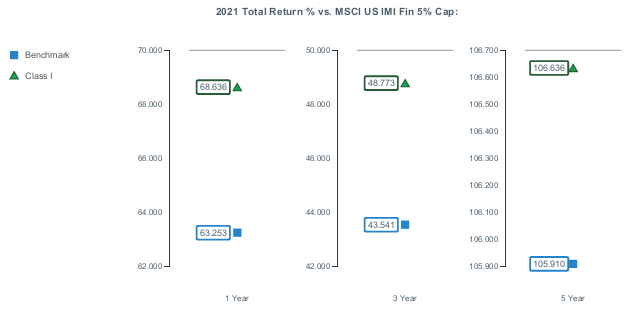
Fidelity Advisor Health Care Fund
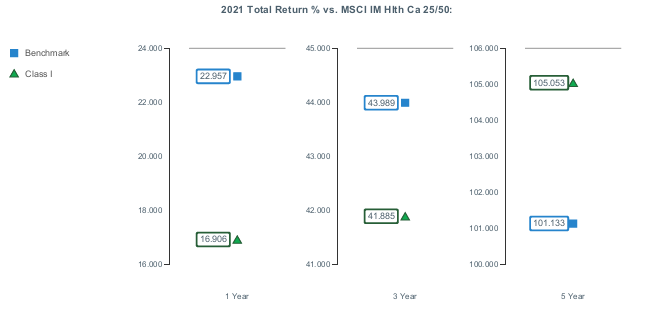
Fidelity Advisor Industrials Fund
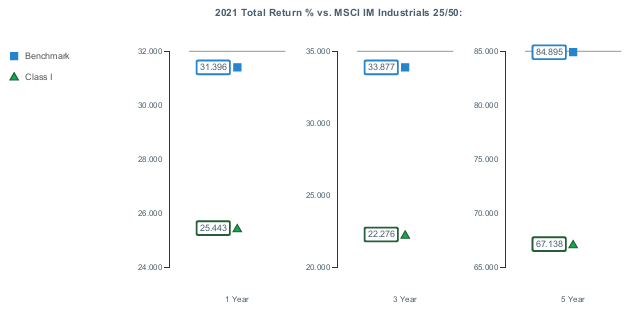
The Board considered the fund's underperformance for different time periods ended September 30, 2021 and for different time periods ended December 31, 2021 (which periods are not reflected in the charts above). The Board noted that the fund's underperformance has continued since the Board approved the management contract in January 2020 and May 2021. The Board's discussions with FMR regarding underperformance cover topics including, but not limited to: the longer-term track record of a fund's portfolio manager(s); broader trends in the market that may adversely impact a fund's performance; and attribution reports on contributors to the fund's underperformance. The Board engages with FMR on steps that might be taken to address a fund's underperformance. For a fund with underperformance over longer periods of time, the Board typically monitors the fund's performance more closely.
Fidelity Advisor Semiconductors Fund
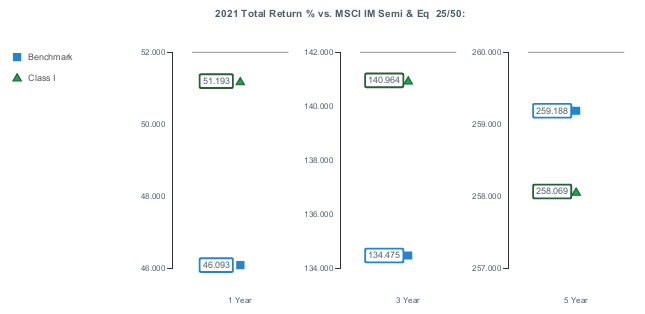
Fidelity Advisor Technology Fund
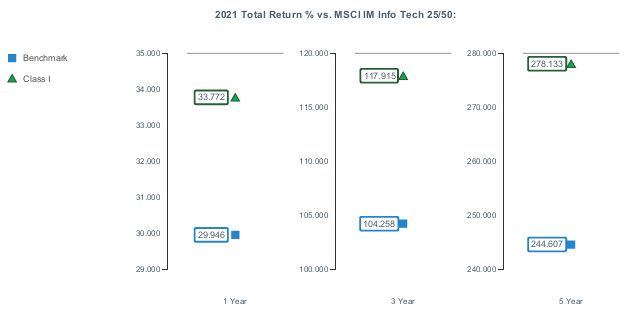
Fidelity Advisor Utilities Fund
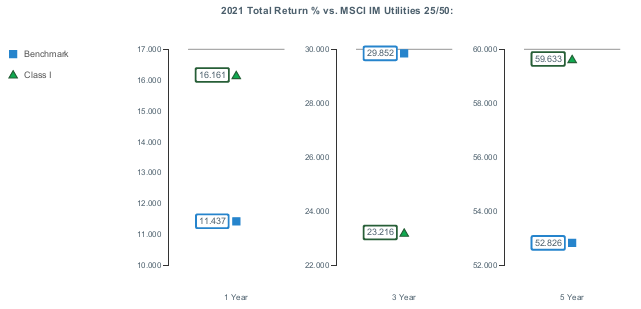
Based on its review, the Board concluded that the nature, extent, and quality of services provided to each fund under the Advisory Contracts should continue to benefit the shareholders of each fund.
Competitiveness of Management Fee and Total Expense Ratio. The Board considered each fund's management fee and total expense ratio compared to "mapped groups" of competitive funds and classes created for the purpose of facilitating the Trustees' competitive analysis of management fees and total expenses. Fidelity creates "mapped groups" by combining similar Lipper investment objective categories that have comparable investment mandates. For this purpose, all sector focused equity funds are grouped in the same mapped group. Combining Lipper investment objective categories aids the Board's management fee and total expense ratio comparisons by broadening the competitive group used for comparison.
Management Fee. The Board considered two proprietary management fee comparisons for the 12-month periods ended September 30 (June 30 for periods ended 2019 and 2018 and December 31 for periods prior to 2018) shown in basis points (BP) in the charts below. The group of Lipper funds used by the Board for management fee comparisons is referred to below as the "Total Mapped Group." The Total Mapped Group comparison focuses on a fund's standing in terms of gross management fees before expense reimbursements or caps relative to the total universe of funds with comparable investment mandates (i.e., sector equities), regardless of whether their management fee structures also are comparable. Funds with comparable management fee structures have similar management fee contractual arrangements (
e.g., flat rate charged for advisory services, all-inclusive fee rate,
etc.). "TMG %" represents the percentage of funds in the Total Mapped Group that had management fees that were lower than a fund's. For example, a hypothetical TMG % of 20% would mean that 80% of the funds in the Total Mapped Group had higher, and 20% had lower, management fees than a fund. The funds' actual TMG %s and the number of funds in the Total Mapped Group are in the charts below. The "Asset-Sized Peer Group" (ASPG) comparison focuses on a fund's standing relative to a subset of non-Fidelity funds within the Total Mapped Group that are similar in size and management fee structure. For example, if a fund is in the first quartile of the ASPG, the fund's management fee ranks in the least expensive or lowest 25% of funds in the ASPG. The ASPG represents at least 15% of the funds in the Total Mapped Group with comparable asset size and management fee structures, subject to a minimum of 50 funds (or all funds in the Total Mapped Group if fewer than 50). Additional information, such as the ASPG quartile in which a fund's management fee rate ranked, is also included in the charts and was considered by the Board.
Fidelity Advisor Biotechnology Fund
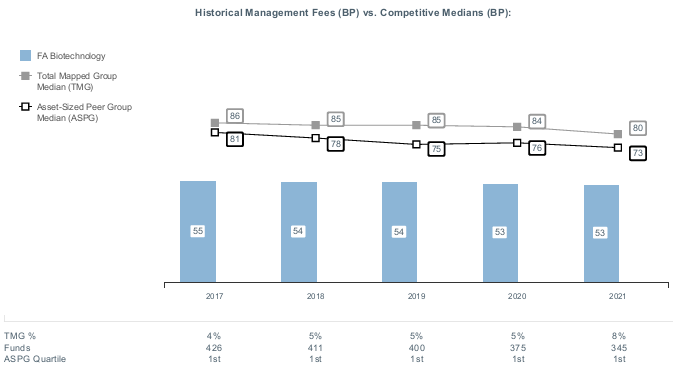
Fidelity Advisor Consumer Discretionary Fund
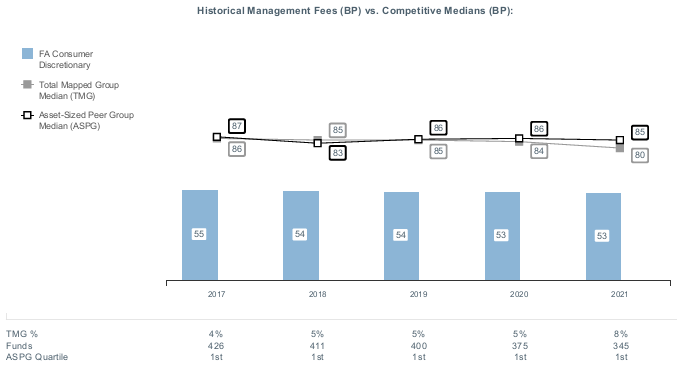
Fidelity Advisor Energy Fund
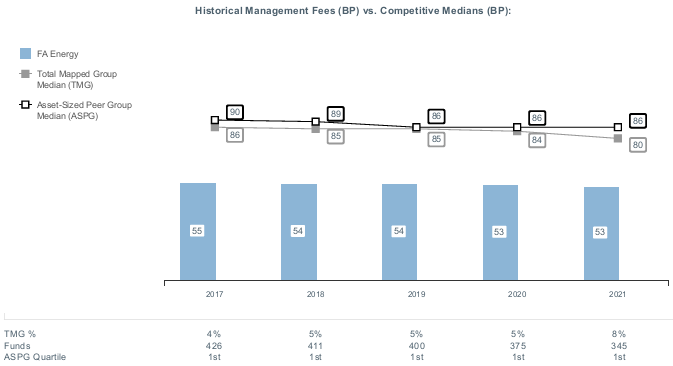
Fidelity Advisor Financial Services Fund
Fidelity Advisor Health Care Fund
Fidelity Advisor Industrials Fund
Fidelity Advisor Semiconductors Fund
Fidelity Advisor Technology Fund
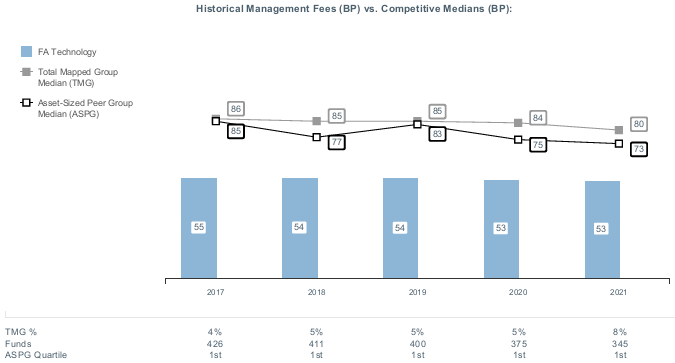
Fidelity Advisor Utilities Fund
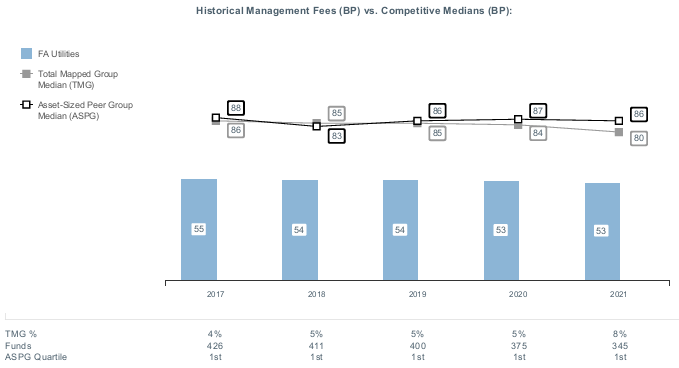
The Board noted that each fund's management fee rate ranked below the median of its Total Mapped Group and below the median of its ASPG for the 12-month period ended September 30, 2021.
The Board also considered that, for funds subject to the group fee, FMR agreed to voluntarily waive fees over a specified period of time in amounts designed to account for assets converted from certain funds to certain collective investment trusts.
Based on its review, the Board concluded that each fund's management fee is fair and reasonable in light of the services that the fund receives and the other factors considered.
Total Expense Ratio. In its review of the total expense ratio of the representative class (Class I) of each fund, the Board considered the fund's management fee rate as well as other fund or class expenses, as applicable, such as transfer agent fees, pricing and bookkeeping fees, fund-paid 12b-1 fees, and custodial, legal, and audit fees. The Board also noted that Fidelity may agree to waive fees or reimburse expenses from time to time, and the extent to which, if any, it has done so for each fund. Each fund's representative class is compared to those funds and classes in the Total Mapped Group (used by the Board for management fee comparisons) that have a similar sales load structure. The Board also considered a total expense ASPG comparison, which focuses on the total expenses of the representative class relative to a subset of non-Fidelity funds within the total expense similar sales load structure group. The total expense ASPG is limited to 15 larger and 15 smaller classes in fund average assets for a total of 30 classes, where possible. The total expense ASPG comparison excludes performance adjustments and fund-paid 12b-1 fees to eliminate variability in fee structures.
For each fund, the Board noted that the total net expense ratio of Class I ranked below the similar sales load structure group competitive median and below the ASPG competitive median for the 12-month period ended September 30, 2021.
Fees Charged to Other Fidelity Clients. The Board also considered Fidelity fee structures and other information with respect to clients of Fidelity, such as other funds advised or subadvised by Fidelity, pension plan clients, and other institutional clients with similar mandates. The Board noted that a joint ad hoc committee created by it and the boards of other Fidelity funds periodically reviews and compares Fidelity's institutional investment advisory business with its business of providing services to the Fidelity funds and also noted the most recent findings of the committee. The Board noted that the committee's review included a consideration of the differences in services provided, fees charged, and costs incurred, as well as competition in the markets serving the different categories of clients.
Based on its review of total expense ratios and fees charged to other Fidelity clients, the Board concluded that the total expense ratio of each class of each fund was reasonable in light of the services that the fund and its shareholders receive and the other factors considered.
Costs of the Services and Profitability. The Board considered the revenues earned and the expenses incurred by Fidelity in conducting the business of developing, marketing, distributing, managing, administering and servicing each fund and servicing each fund's shareholders. The Board also considered the level of Fidelity's profits in respect of all the Fidelity funds.
On an annual basis, Fidelity presents to the Board information about the profitability of its relationships with each fund. Fidelity calculates profitability information for each fund, as well as aggregate profitability information for groups of Fidelity funds and all Fidelity funds, using a series of detailed revenue and cost allocation methodologies which originate with the books and records of Fidelity on which Fidelity's audited financial statements are based. The Audit Committee of the Board reviews any significant changes from the prior year's methodologies and the full Board approves such changes.
A public accounting firm has been engaged annually by the Board as part of the Board's assessment of Fidelity's profitability analysis. The engagement includes the review and assessment of the methodologies used by Fidelity in determining the revenues and expenses attributable to Fidelity's mutual fund business, and completion of agreed-upon procedures in respect of the mathematical accuracy of certain fund profitability information and its conformity to established allocation methodologies. After considering the reports issued under the engagement and information provided by Fidelity, the Board concluded that while other allocation methods may also be reasonable, Fidelity's profitability methodologies are reasonable in all material respects.
The Board also reviewed Fidelity's non-fund businesses and potential indirect benefits such businesses may have received as a result of their association with Fidelity's mutual fund business (i.e., fall-out benefits) as well as cases where Fidelity's affiliates may benefit from the funds' business. The Board considered areas where potential indirect benefits to the Fidelity funds from their relationships with Fidelity may exist. The Board's consideration of these matters was informed by the findings of a joint ad hoc committee created by it and the boards of other Fidelity funds to evaluate potential fall-out benefits.
The Board considered the costs of the services provided by and the profits realized by Fidelity in connection with the operation of each fund and was satisfied that the profitability was not excessive.
Economies of Scale. The Board considered whether there have been economies of scale in respect of the management of the Fidelity funds, whether the Fidelity funds (including each fund) have appropriately benefited from any such economies of scale, and whether there is potential for realization of any further economies of scale. The Board considered the extent to which each fund will benefit from economies of scale as assets grow through increased services to the fund, through waivers or reimbursements, or through fee or expense ratio reductions. The Board also noted that a committee (the Economies of Scale Committee) created by it and the boards of other Fidelity funds periodically analyzes whether Fidelity attains economies of scale in respect of the management and servicing of the Fidelity funds, whether the Fidelity funds have appropriately benefited from such economies of scale, and whether there is potential for realization of any further economies of scale.
The Board recognized that each fund's management contract incorporates a "group fee" structure, which provides for lower group fee rates as total "group assets" increase, and for higher group fee rates as total "group assets" decrease ("group assets" as defined in the management contracts). FMR calculates the group fee rates based on a tiered asset "breakpoint" schedule that varies based on asset class. The Board considered that the group fee is designed to deliver the benefits of economies of scale to fund shareholders when total Fidelity fund assets increase, even if assets of any particular fund are unchanged or have declined, because some portion of Fidelity's costs are attributable to services provided to all Fidelity funds, and all funds benefit if those costs can be allocated among more assets. The Board further considered that Fidelity agreed to impose a temporary fee waiver in the form of additional breakpoints to the current breakpoint schedule. The Board concluded that, given the group fee structure, fund shareholders will benefit from lower management fees as "group assets" increase at the fund complex level, regardless of whether Fidelity achieves any such economies of scale.
The Board concluded, taking into account the analysis of the Economies of Scale Committee, that economies of scale, if any, are being appropriately shared between fund shareholders and Fidelity.
Additional Information Requested by the Board. In order to develop fully the factual basis for consideration of the Fidelity funds' advisory contracts, the Board requested and received additional information on certain topics, including: (i) fund flow and performance trends, in particular the underperformance of certain funds and strategies, and Fidelity's long-term strategies for certain funds, including any consideration of fund liquidations or mergers; (ii) the operation of performance fees, competitor use of performance fees, and consideration of the expansion of performance fees to additional funds; (iii) Fidelity's pricing philosophy compared to competitors; (iv) fund profitability methodology and data; (v) evaluation of competitive fund data and peer group classifications and fee and expense comparisons; (vi) the management fee and expense structures for different funds and classes and information about the differences between various fee and expense structures; (vii) group fee breakpoints and related voluntary fee waivers; and (viii) information regarding other accounts managed by Fidelity and the funds' sub-advisory arrangements.
Based on its evaluation of all of the conclusions noted above, and after considering all factors it believed relevant, the Board concluded that the advisory fee arrangements are fair and reasonable and that each fund's Advisory Contracts should be renewed.
Liquidity Risk Management Program
The Securities and Exchange Commission adopted Rule 22e-4 under the Investment Company Act of 1940 (the Liquidity Rule) to promote effective liquidity risk management throughout the open-end investment company industry, thereby reducing the risk that funds will be unable to meet their redemption obligations and mitigating dilution of the interests of fund shareholders.
The Funds have adopted and implemented a liquidity risk management program pursuant to the Liquidity Rule (the Program) effective December 1, 2018. The Program is reasonably designed to assess and manage each Fund’s liquidity risk and to comply with the requirements of the Liquidity Rule. Each Fund’s Board of Trustees (the Board) has designated each Fund’s investment adviser as administrator of the Program. The Fidelity advisers have established a Liquidity Risk Management Committee (the LRM Committee) to manage the Program for each of the Fidelity Funds. The LRM Committee monitors the adequacy and effectiveness of implementation of the Program and on a periodic basis assesses each Fund’s liquidity risk based on a variety of factors including (1) the Fund’s investment strategy, (2) portfolio liquidity and cash flow projections during normal and reasonably foreseeable stressed conditions, (3) shareholder redemptions, (4) borrowings and other funding sources and (5) in the case of exchange-traded funds, certain additional factors including the effect of the Fund’s prices and spreads, market participants, and basket compositions on the overall liquidity of the Fund’s portfolio, as applicable.
In accordance with the Program, each of the Fund’s portfolio investments is classified into one of four liquidity categories described below based on a determination of a reasonable expectation for how long it would take to convert the investment to cash (or sell or dispose of the investment) without significantly changing its market value.
- Highly liquid investments – cash or convertible to cash within three business days or less
- Moderately liquid investments – convertible to cash in three to seven calendar days
- Less liquid investments – can be sold or disposed of, but not settled, within seven calendar days
- Illiquid investments – cannot be sold or disposed of within seven calendar days
Liquidity classification determinations take into account a variety of factors including various market, trading and investment-specific considerations, as well as market depth, and generally utilize analysis from a third-party liquidity metrics service.
The Liquidity Rule places a 15% limit on a fund’s illiquid investments and requires funds that do not primarily hold assets that are highly liquid investments to determine and maintain a minimum percentage of the fund’s net assets to be invested in highly liquid investments (highly liquid investment minimum or HLIM). The Program includes provisions reasonably designed to comply with the 15% limit on illiquid investments and for determining, periodically reviewing and complying with the HLIM requirement as applicable.
At a recent meeting of the Fund’s Board of Trustees, the LRM Committee provided a written report to the Board pertaining to the operation, adequacy, and effectiveness of implementation of the Program for the annual period from December 1, 2020 through November 30, 2021. The report concluded that the Program has been implemented and is operating effectively and is reasonably designed to assess and manage the Fund’s liquidity risk.

AFOC-ANN-0922
1.762411.121
Fidelity Advisor® Global Real Estate Fund
Annual Report
July 31, 2022
Contents
To view a fund's proxy voting guidelines and proxy voting record for the 12-month period ended June 30, visit http://www.fidelity.com/proxyvotingresults or visit the Securities and Exchange Commission's (SEC) web site at http://www.sec.gov.
You may also call 1-877-208-0098 to request a free copy of the proxy voting guidelines.
Standard & Poor's, S&P and S&P 500 are registered service marks of The McGraw-Hill Companies, Inc. and have been licensed for use by Fidelity Distributors Corporation.
Other third-party marks appearing herein are the property of their respective owners.
All other marks appearing herein are registered or unregistered trademarks or service marks of FMR LLC or an affiliated company. © 2022 FMR LLC. All rights reserved.
This report and the financial statements contained herein are submitted for the general information of the shareholders of the Fund. This report is not authorized for distribution to prospective investors in the Fund unless preceded or accompanied by an effective prospectus.
A fund files its complete schedule of portfolio holdings with the SEC for the first and third quarters of each fiscal year on Form N-PORT. Forms N-PORT are available on the SEC’s web site at http://www.sec.gov. A fund's Forms N-PORT may be reviewed and copied at the SEC’s Public Reference Room in Washington, DC. Information regarding the operation of the SEC's Public Reference Room may be obtained by calling 1-800-SEC-0330.
For a complete list of a fund's portfolio holdings, view the most recent holdings listing, semiannual report, or annual report on Fidelity's web site at http://www.fidelity.com, http://www.institutional.fidelity.com, or http://www.401k.com, as applicable.
NOT FDIC INSURED •MAY LOSE VALUE •NO BANK GUARANTEE
Neither the Fund nor Fidelity Distributors Corporation is a bank.
Note to Shareholders:
Early in 2020, the outbreak and spread of COVID-19 emerged as a public health emergency that had a major influence on financial markets, primarily based on its impact on the global economy and corporate earnings. On March 11, 2020, the World Health Organization declared the COVID-19 outbreak a pandemic, citing sustained risk of further global spread. The pandemic prompted a number of measures to limit the spread of COVID-19, including travel and border restrictions, quarantines, and restrictions on large gatherings. In turn, these resulted in lower consumer activity, diminished demand for a wide range of products and services, disruption in manufacturing and supply chains, and – given the wide variability in outcomes regarding the outbreak – significant market uncertainty and volatility. To help stem the turmoil, the U.S. government took unprecedented action – in concert with the U.S. Federal Reserve and central banks around the world – to help support consumers, businesses, and the broader economy, and to limit disruption to the financial system.
In general, the overall impact of the pandemic lessened in 2021, amid a resilient economy and widespread distribution of three COVID-19 vaccines granted emergency use authorization from the U.S. Food and Drug Administration (FDA) early in the year. Still, the situation remains dynamic, and the extent and duration of its influence on financial markets and the economy is highly uncertain, due in part to a recent spike in cases based on highly contagious variants of the coronavirus.
Extreme events such as the COVID-19 crisis are exogenous shocks that can have significant adverse effects on mutual funds and their investments. Although multiple asset classes may be affected by market disruption, the duration and impact may not be the same for all types of assets. Fidelity is committed to helping you stay informed amid news about COVID-19 and during increased market volatility, and we continue to take extra steps to be responsive to customer needs. We encourage you to visit us online, where we offer ongoing updates, commentary, and analysis on the markets and our funds.
Performance: The Bottom Line
Average annual total return reflects the change in the value of an investment, assuming reinvestment of distributions from dividend income and capital gains (the profits earned upon the sale of securities that have grown in value, if any) and assuming a constant rate of performance each year. The hypothetical investment and the average annual total returns do not reflect the deduction of taxes that a shareholder would pay on fund distributions or the redemption of fund shares. During periods of reimbursement by Fidelity, a fund’s total return will be greater than it would be had the reimbursement not occurred. How a fund did yesterday is no guarantee of how it will do tomorrow.
Average Annual Total Returns
| For the periods ended July 31, 2022 | Past 1 year | Past 5 years | Life of fundA |
| Class A (incl. 5.75% sales charge) | (14.61)% | 4.10% | 3.24% |
| Class M (incl. 3.50% sales charge) | (12.68)% | 4.36% | 3.41% |
| Class C (incl. contingent deferred sales charge) | (10.86)% | 4.58% | 3.51% |
| Class I | (9.12)% | 5.61% | 4.53% |
| Class Z | (8.93)% | 5.74% | 4.64% |
A From August 11, 2016
Class C shares' contingent deferred sales charges included in the past one year and life of fund total return figures are 1% and 0%, respectively.
The initial offering of Class Z shares took place on October 2, 2018. Returns prior to October 2, 2018, are those of Class I.
$10,000 Over Life of Fund
Let's say hypothetically that $10,000 was invested in Fidelity Advisor® Global Real Estate Fund - Class A on August 11, 2016, when the fund started, and the current 5.75% sales charge was paid.
The chart shows how the value of your investment would have changed, and also shows how the FTSE EPRA/NAREIT Developed Index performed over the same period.
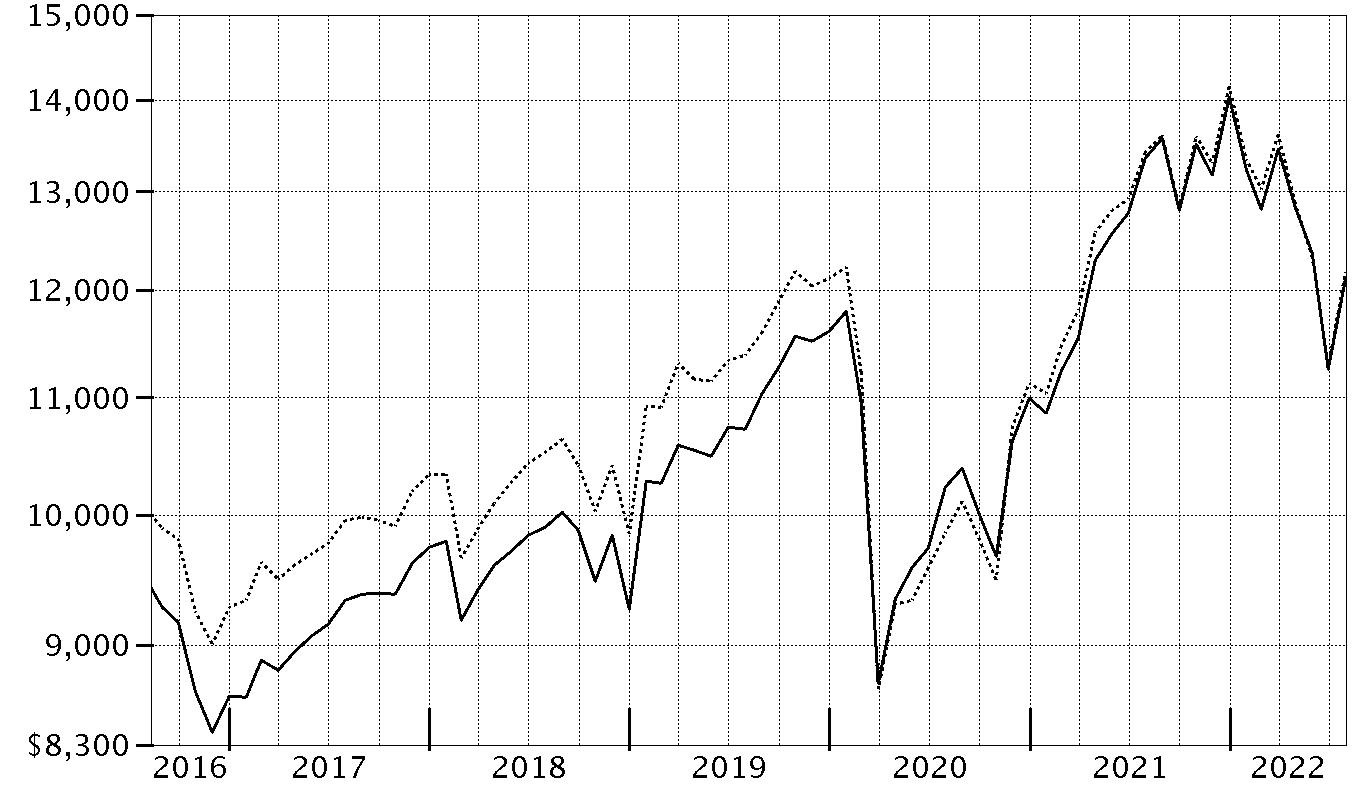
| Period Ending Values |
| $12,101 | Fidelity Advisor® Global Real Estate Fund - Class A |
| $12,176 | FTSE EPRA/NAREIT Developed Index |
Management's Discussion of Fund Performance
Market Recap: For the 12 months ending July 31, 2022, a multitude of crosscurrents challenged the global economy and financial markets. Persistently high inflation, exacerbated by energy price shocks from the Russia–Ukraine conflict, spurred the U.S. Federal Reserve to hike interest rates more aggressively than anticipated, and concerns about the outlook for economic growth sent global financial assets lower. For the 12 months ending July 31, 2022, global real estate stocks returned -9.27%, as measured by the FTSE
® EPRA/NAREIT
® Developed Index, hampered by the impact of a broadly stronger U.S. dollar. Across most commercial property types, the fundamental supply and demand backdrop for global real estate remained generally favorable. Higher global interest rates and sluggish equity prices, however, meant a rising cost of capital for real estate owners – a negative factor in this capital-intensive asset class. Against this challenging market backdrop for REITs, nearly every country within the index produced a negative return, with many declining by double digits. The U.S., which on average made up 60% of the index, returned -4%. Japan, at roughly 10% and the index’s second-largest weighting, returned roughly -16%. Meanwhile, the German property market (-46%) was a particularly weak performer, reflecting investors’ concern about how the country’s economy would fare given restrictions on Russian oil imports, on which Germany is particularly dependent. Elsewhere, Hong Kong and the U.K. returned about -9% and 17%, respectively, while Australia, one of the better performers this period, returned -2%.
Comments from Portfolio Manager Steve Buller: For the fiscal year ending July 31, 2022, the fund's share classes (excluding sales charges, if applicable) returned roughly -10% to -9%, roughly in line with the -9.27% result of the benchmark FTSE EPRA/NAREIT Developed Index. By region, stock picks in the U.S. and Australia contributed most to the fund's relative result. By industry, the primary contributors to performance versus the benchmark were an underweighting and security selection among office REITs. An overweighting and investment choices in the specialized REITs category, in addition to picks in retail REITs, also helped, while the fund’s foreign holdings modestly contributed overall, despite continued U.S. dollar strength. The biggest individual relative contributor was an overweight position in Duke Realty (+25%), one of the fund's largest holdings the past 12 months. Also propelling performance was our outsized stake in Arena, which gained about 33%. Another notable relative contributor was an overweighting in Gaming and Leisure Properties (+17%). Conversely, security selection in Europe ex U.K., specifically Germany, hindered the fund's relative result, as did the fund’s overweight in Germany. Security selection in Hong Kong also hampered results. By industry, the primary detractors from performance versus the benchmark were stock selection and an overweighting in real estate development firms. Picks among real estate operating companies and diversified REITs also hindered the portfolio's relative result this period. Our biggest individual relative detractor was an out-of-benchmark position in Instone Real Estate (-63%). An outsized stake in Aroundtown (-56%), a position that was sold the past year, also notably hurt. Avoiding Public Storage, a benchmark component that gained roughly 11%, weighed on relative performance as well.
The views expressed above reflect those of the portfolio manager(s) only through the end of the period as stated on the cover of this report and do not necessarily represent the views of Fidelity or any other person in the Fidelity organization. Any such views are subject to change at any time based upon market or other conditions and Fidelity disclaims any responsibility to update such views. These views may not be relied on as investment advice and, because investment decisions for a Fidelity fund are based on numerous factors, may not be relied on as an indication of trading intent on behalf of any Fidelity fund.
Investment Summary (Unaudited)
Top Ten Stocks as of July 31, 2022
| | % of fund's net assets |
| Prologis (REIT), Inc. | 6.2 |
| Equinix, Inc. | 3.9 |
| Welltower, Inc. | 3.7 |
| Mitsui Fudosan Co. Ltd. | 3.4 |
| Ventas, Inc. | 3.1 |
| Digital Realty Trust, Inc. | 2.9 |
| UDR, Inc. | 2.6 |
| Equity Lifestyle Properties, Inc. | 2.6 |
| Extra Space Storage, Inc. | 2.6 |
| Vonovia SE | 2.5 |
| | 33.5 |
Geographic Diversification (% of fund's net assets)
| As of July 31, 2022 |
| | United States of America* | 61.5% |
| | Japan | 9.5% |
| | United Kingdom | 4.9% |
| | Australia | 4.6% |
| | Canada | 4.3% |
| | Singapore | 4.0% |
| | Germany | 2.9% |
| | France | 2.4% |
| | Hong Kong | 1.9% |
| | Other | 4.0% |

* Includes Short-Term investments and Net Other Assets (Liabilities).
Top Five REIT Sectors as of July 31, 2022
| | % of fund's net assets |
| REITs - Diversified | 22.4 |
| REITs - Apartments | 11.8 |
| REITs - Health Care | 7.8 |
| REITs - Shopping Centers | 7.4 |
| REITs - Warehouse/Industrial | 7.2 |
Asset Allocation (% of fund's net assets)
| As of July 31, 2022* |
| | Stocks | 98.3% |
| | Short-Term Investments and Net Other Assets (Liabilities) | 1.7% |

* Foreign investments - 38.5%
Schedule of Investments July 31, 2022
Showing Percentage of Net Assets
| Common Stocks - 98.3% | | | |
| | | Shares | Value |
| Australia - 4.6% | | | |
| Abacus Property Group unit | | 42,188 | $87,149 |
| Arena (REIT) unit | | 24,600 | 83,509 |
| Charter Hall Retail REIT | | 23,875 | 70,671 |
| National Storage REIT unit | | 53,746 | 93,981 |
|
| TOTAL AUSTRALIA | | | 335,310 |
|
| Bailiwick of Guernsey - 1.1% | | | |
| Sirius Real Estate Ltd. | | 69,045 | 80,299 |
| Canada - 4.3% | | | |
| Boardwalk (REIT) | | 3,774 | 143,940 |
| Dream Industrial (REIT) | | 10,620 | 104,662 |
| Flagship Communities (REIT) | | 4,176 | 66,983 |
|
| TOTAL CANADA | | | 315,585 |
|
| Cayman Islands - 0.7% | | | |
| ESR Cayman Ltd. (a)(b) | | 18,291 | 47,417 |
| France - 2.4% | | | |
| ARGAN SA | | 836 | 85,102 |
| Covivio | | 819 | 51,605 |
| Gecina SA | | 416 | 42,517 |
|
| TOTAL FRANCE | | | 179,224 |
|
| Germany - 2.9% | | | |
| Instone Real Estate Group BV (b) | | 3,107 | 33,914 |
| Vonovia SE | | 5,450 | 181,593 |
|
| TOTAL GERMANY | | | 215,507 |
|
| Hong Kong - 1.9% | | | |
| Hysan Development Co. Ltd. | | 18,291 | 56,039 |
| Link (REIT) | | 10,141 | 84,875 |
|
| TOTAL HONG KONG | | | 140,914 |
|
| Ireland - 0.4% | | | |
| Dalata Hotel Group PLC (a) | | 6,944 | 25,514 |
| Japan - 9.5% | | | |
| Activia Properties, Inc. | | 9 | 28,219 |
| Advance Residence Investment Corp. | | 17 | 46,842 |
| Kenedix Residential Investment Corp. | | 45 | 75,649 |
| LaSalle Logiport REIT | | 64 | 84,347 |
| Mitsubishi Estate Co. Ltd. | | 10,790 | 160,249 |
| Mitsui Fudosan Co. Ltd. | | 11,196 | 250,224 |
| Mitsui Fudosan Logistics Park, Inc. | | 14 | 54,986 |
|
| TOTAL JAPAN | | | 700,516 |
|
| Netherlands - 0.4% | | | |
| NSI NV | | 850 | 27,539 |
| NSI NV (c) | | 872 | 927 |
|
| TOTAL NETHERLANDS | | | 28,466 |
|
| Singapore - 4.0% | | | |
| CapitaMall Trust | | 72,757 | 114,936 |
| Mapletree Commercial Trust | | 37,078 | 51,074 |
| UOL Group Ltd. | | 24,141 | 130,431 |
|
| TOTAL SINGAPORE | | | 296,441 |
|
| Spain - 0.7% | | | |
| Merlin Properties Socimi SA | | 5,062 | 54,168 |
| Sweden - 0.7% | | | |
| Catena AB | | 1,120 | 51,227 |
| United Kingdom - 4.9% | | | |
| Assura PLC | | 84,294 | 70,523 |
| Grainger Trust PLC | | 34,993 | 126,224 |
| Helical PLC | | 3,472 | 16,490 |
| Life Science (REIT) PLC | | 23,612 | 26,339 |
| Segro PLC | | 5,790 | 77,209 |
| Shaftesbury PLC | | 7,532 | 46,046 |
|
| TOTAL UNITED KINGDOM | | | 362,831 |
|
| United States of America - 59.8% | | | |
| American Assets Trust, Inc. | | 1,410 | 42,624 |
| American Homes 4 Rent Class A | | 2,892 | 109,549 |
| Apartment Income (REIT) Corp. | | 1,843 | 83,562 |
| Crown Castle International Corp. | | 874 | 157,897 |
| CubeSmart | | 3,146 | 144,307 |
| DiamondRock Hospitality Co. | | 6,329 | 58,733 |
| Digital Realty Trust, Inc. | | 1,627 | 215,496 |
| Duke Realty Corp. | | 2,539 | 158,840 |
| Equinix, Inc. | | 406 | 285,718 |
| Equity Lifestyle Properties, Inc. | | 2,598 | 191,005 |
| Extra Space Storage, Inc. | | 999 | 189,330 |
| Gaming & Leisure Properties | | 2,928 | 152,227 |
| Highwoods Properties, Inc. (SBI) | | 1,082 | 38,487 |
| Host Hotels & Resorts, Inc. | | 6,549 | 116,638 |
| Invitation Homes, Inc. | | 3,266 | 127,472 |
| Kimco Realty Corp. | | 4,952 | 109,489 |
| LXP Industrial Trust (REIT) | | 4,143 | 45,449 |
| Mid-America Apartment Communities, Inc. | | 931 | 172,915 |
| National Retail Properties, Inc. | | 2,648 | 126,071 |
| Phillips Edison & Co., Inc. | | 1,341 | 45,648 |
| Piedmont Office Realty Trust, Inc. Class A | | 1,756 | 24,163 |
| Prologis (REIT), Inc. | | 3,449 | 457,195 |
| Regency Centers Corp. | | 1,483 | 95,550 |
| RLJ Lodging Trust | | 3,933 | 49,123 |
| Ryman Hospitality Properties, Inc. (a) | | 440 | 38,958 |
| Spirit Realty Capital, Inc. | | 2,002 | 88,769 |
| Sun Communities, Inc. | | 861 | 141,170 |
| UDR, Inc. | | 3,994 | 193,310 |
| Urban Edge Properties | | 1,997 | 32,811 |
| Ventas, Inc. | | 4,178 | 224,693 |
| Veris Residential, Inc. (a) | | 2,350 | 32,783 |
| VICI Properties, Inc. | | 3,872 | 132,384 |
| Washington REIT (SBI) | | 2,244 | 49,749 |
| Welltower, Inc. | | 3,173 | 273,957 |
|
| TOTAL UNITED STATES OF AMERICA | | | 4,406,072 |
|
| TOTAL COMMON STOCKS | | | |
| (Cost $6,583,826) | | | 7,239,491 |
|
| Money Market Funds - 1.1% | | | |
| Fidelity Cash Central Fund 2.01% (d) | | | |
| (Cost $80,792) | | 80,776 | 80,792 |
| TOTAL INVESTMENT IN SECURITIES - 99.4% | | | |
| (Cost $6,664,618) | | | 7,320,283 |
| NET OTHER ASSETS (LIABILITIES) - 0.6% | | | 43,554 |
| NET ASSETS - 100% | | | $7,363,837 |
Categorizations in the Schedule of Investments are based on country or territory of incorporation.
Legend
(a) Non-income producing
(b) Security exempt from registration under Rule 144A of the Securities Act of 1933. These securities may be resold in transactions exempt from registration, normally to qualified institutional buyers. At the end of the period, the value of these securities amounted to $81,331 or 1.1% of net assets.
(c) Security or a portion of the security purchased on a delayed delivery or when-issued basis.
(d) Affiliated fund that is generally available only to investment companies and other accounts managed by Fidelity Investments. The rate quoted is the annualized seven-day yield of the fund at period end. A complete unaudited listing of the fund's holdings as of its most recent quarter end is available upon request. In addition, each Fidelity Central Fund's financial statements, which are not covered by the Fund's Report of Independent Registered Public Accounting Firm, are available on the SEC's website or upon request.
Affiliated Central Funds
Fiscal year to date information regarding the Fund's investments in Fidelity Central Funds, including the ownership percentage, is presented below.
| Fund | Value, beginning of period | Purchases | Sales Proceeds | Dividend Income | Realized Gain/Loss | Change in Unrealized appreciation (depreciation) | Value, end of period | % ownership, end of period |
| Fidelity Cash Central Fund 2.01% | $64,844 | $2,352,693 | $2,336,745 | $195 | $-- | $-- | $80,792 | 0.0% |
| Total | $64,844 | $2,352,693 | $2,336,745 | $195 | $-- | $-- | $80,792 | |
Amounts in the income column in the above table include any capital gain distributions from underlying funds, which are presented in the corresponding line-item in the Statement of Operations, if applicable.
Investment Valuation
The following is a summary of the inputs used, as of July 31, 2022, involving the Fund's assets and liabilities carried at fair value. The inputs or methodology used for valuing securities may not be an indication of the risk associated with investing in those securities. For more information on valuation inputs, and their aggregation into the levels used below, please refer to the Investment Valuation section in the accompanying Notes to Financial Statements.
| | Valuation Inputs at Reporting Date: |
| Description | Total | Level 1 | Level 2 | Level 3 |
| Investments in Securities: | | | | |
| Equities: | | | | |
| Consumer Discretionary | $25,514 | $25,514 | $-- | $-- |
| Real Estate | 7,213,977 | 5,699,190 | 1,514,787 | -- |
| Money Market Funds | 80,792 | 80,792 | -- | -- |
| Total Investments in Securities: | $7,320,283 | $5,805,496 | $1,514,787 | $-- |
See accompanying notes which are an integral part of the financial statements.
Financial Statements
Statement of Assets and Liabilities
| | | July 31, 2022 |
| Assets | | |
Investment in securities, at value — See accompanying schedule:
Unaffiliated issuers (cost $6,583,826) | $7,239,491 | |
| Fidelity Central Funds (cost $80,792) | 80,792 | |
| Total Investment in Securities (cost $6,664,618) | | $7,320,283 |
| Cash | | 42,598 |
| Receivable for investments sold | | 3,120 |
| Receivable for fund shares sold | | 249 |
| Dividends receivable | | 21,077 |
| Distributions receivable from Fidelity Central Funds | | 86 |
| Prepaid expenses | | 8 |
| Receivable from investment adviser for expense reductions | | 37,319 |
| Other receivables | | 8 |
| Total assets | | 7,424,748 |
| Liabilities | | |
| Payable for investments purchased on a delayed delivery basis | $927 | |
| Payable for fund shares redeemed | 1,206 | |
| Accrued management fee | 3,948 | |
| Distribution and service plan fees payable | 1,178 | |
| Audit fee payable | 46,838 | |
| Other affiliated payables | 1,326 | |
| Other payables and accrued expenses | 5,488 | |
| Total liabilities | | 60,911 |
| Net Assets | | $7,363,837 |
| Net Assets consist of: | | |
| Paid in capital | | $6,912,200 |
| Total accumulated earnings (loss) | | 451,637 |
| Net Assets | | $7,363,837 |
| Net Asset Value and Maximum Offering Price | | |
| Class A: | | |
| Net Asset Value and redemption price per share ($3,021,217 ÷ 270,126 shares)(a) | | $11.18 |
| Maximum offering price per share (100/94.25 of $11.18) | | $11.86 |
| Class M: | | |
| Net Asset Value and redemption price per share ($1,070,096 ÷ 95,926 shares)(a) | | $11.16 |
| Maximum offering price per share (100/96.50 of $11.16) | | $11.56 |
| Class C: | | |
| Net Asset Value and offering price per share ($203,302 ÷ 18,205 shares)(a) | | $11.17 |
| Class I: | | |
| Net Asset Value, offering price and redemption price per share ($1,765,889 ÷ 157,475 shares) | | $11.21 |
| Class Z: | | |
| Net Asset Value, offering price and redemption price per share ($1,303,333 ÷ 115,578 shares) | | $11.28 |
(a) Redemption price per share is equal to net asset value less any applicable contingent deferred sales charge.
See accompanying notes which are an integral part of the financial statements.
Statement of Operations
| | | Year ended July 31, 2022 |
| Investment Income | | |
| Dividends | | $212,943 |
| Income from Fidelity Central Funds | | 195 |
| Income before foreign taxes withheld | | 213,138 |
| Less foreign taxes withheld | | (9,235) |
| Total income | | 203,903 |
| Expenses | | |
| Management fee | $50,403 | |
| Transfer agent fees | 13,252 | |
| Distribution and service plan fees | 15,609 | |
| Accounting fees and expenses | 2,863 | |
| Custodian fees and expenses | 22,022 | |
| Independent trustees' fees and expenses | 24 | |
| Registration fees | 64,476 | |
| Audit | 62,364 | |
| Legal | 6 | |
| Miscellaneous | 116 | |
| Total expenses before reductions | 231,135 | |
| Expense reductions | (140,975) | |
| Total expenses after reductions | | 90,160 |
| Net investment income (loss) | | 113,743 |
| Realized and Unrealized Gain (Loss) | | |
| Net realized gain (loss) on: | | |
| Investment securities: | | |
| Unaffiliated issuers | (58,451) | |
| Foreign currency transactions | (1,989) | |
| Total net realized gain (loss) | | (60,440) |
| Change in net unrealized appreciation (depreciation) on: | | |
| Investment securities: | | |
| Unaffiliated issuers | (838,410) | |
| Assets and liabilities in foreign currencies | 112 | |
| Total change in net unrealized appreciation (depreciation) | | (838,298) |
| Net gain (loss) | | (898,738) |
| Net increase (decrease) in net assets resulting from operations | | $(784,995) |
See accompanying notes which are an integral part of the financial statements.
Statement of Changes in Net Assets
| | Year ended July 31, 2022 | Year ended July 31, 2021 |
| Increase (Decrease) in Net Assets | | |
| Operations | | |
| Net investment income (loss) | $113,743 | $81,471 |
| Net realized gain (loss) | (60,440) | 134,898 |
| Change in net unrealized appreciation (depreciation) | (838,298) | 1,192,884 |
| Net increase (decrease) in net assets resulting from operations | (784,995) | 1,409,253 |
| Distributions to shareholders | (92,097) | (55,566) |
| Share transactions - net increase (decrease) | 1,732,182 | 1,280,270 |
| Total increase (decrease) in net assets | 855,090 | 2,633,957 |
| Net Assets | | |
| Beginning of period | 6,508,747 | 3,874,790 |
| End of period | $7,363,837 | $6,508,747 |
See accompanying notes which are an integral part of the financial statements.
Financial Highlights
Fidelity Advisor Global Real Estate Fund Class A
| Years ended July 31, | 2022 | 2021 | 2020 | 2019 | 2018 |
| Selected Per–Share Data | | | | | |
| Net asset value, beginning of period | $12.49 | $9.69 | $10.72 | $10.13 | $9.81 |
| Income from Investment Operations | | | | | |
| Net investment income (loss)A,B | .17 | .17 | .15 | .22 | .18 |
| Net realized and unrealized gain (loss) | (1.33) | 2.76 | (.58) | .58 | .42 |
| Total from investment operations | (1.16) | 2.93 | (.43) | .80 | .60 |
| Distributions from net investment income | (.15) | (.13) | (.23) | (.15) | (.13) |
| Distributions from net realized gain | – | – | (.37) | (.06) | (.14) |
| Total distributions | (.15) | (.13) | (.60) | (.21) | (.28)C |
| Net asset value, end of period | $11.18 | $12.49 | $9.69 | $10.72 | $10.13 |
| Total ReturnD,E | (9.40)% | 30.59% | (4.61)% | 8.25% | 6.16% |
| Ratios to Average Net AssetsB,F,G | | | | | |
| Expenses before reductions | 3.19% | 4.19% | 4.22% | 4.56% | 5.86% |
| Expenses net of fee waivers, if any | 1.28% | 1.38% | 1.40% | 1.40% | 1.40% |
| Expenses net of all reductions | 1.28% | 1.37% | 1.39% | 1.39% | 1.38% |
| Net investment income (loss) | 1.45% | 1.60% | 1.47% | 2.09% | 1.80% |
| Supplemental Data | | | | | |
| Net assets, end of period (000 omitted) | $3,021 | $2,747 | $1,732 | $3,290 | $1,001 |
| Portfolio turnover rateH | 33% | 32% | 52% | 60% | 46% |
A Calculated based on average shares outstanding during the period.
B Net investment income (loss) is affected by the timing of the declaration of dividends by any underlying mutual funds or exchange-traded funds (ETFs). Net investment income (loss) of any such underlying funds is not included in the Fund's net investment income (loss) ratio.
C Total distributions per share do not sum due to rounding.
D Total returns would have been lower if certain expenses had not been reduced during the applicable periods shown.
E Total returns do not include the effect of the sales charges.
F Fees and expenses of any underlying mutual funds or exchange-traded funds (ETFs) are not included in the Fund's expense ratio. The Fund indirectly bears its proportionate share of these expenses. For additional expense information related to investments in Fidelity Central Funds, please refer to the "Investments in Fidelity Central Funds" note found in the Notes to Financial Statements section of the most recent Annual or Semi-Annual report.
G Expense ratios reflect operating expenses of the class. Expenses before reductions do not reflect amounts reimbursed, waived, or reduced through arrangements with the investment adviser, brokerage services, or other offset arrangements, if applicable, and do not represent the amount paid by the class during periods when reimbursements, waivers or reductions occur.
H Amount does not include the portfolio activity of any underlying mutual funds or exchange-traded funds (ETFs).
See accompanying notes which are an integral part of the financial statements.
Fidelity Advisor Global Real Estate Fund Class M
| Years ended July 31, | 2022 | 2021 | 2020 | 2019 | 2018 |
| Selected Per–Share Data | | | | | |
| Net asset value, beginning of period | $12.46 | $9.67 | $10.71 | $10.11 | $9.79 |
| Income from Investment Operations | | | | | |
| Net investment income (loss)A,B | .14 | .14 | .12 | .19 | .15 |
| Net realized and unrealized gain (loss) | (1.31) | 2.76 | (.58) | .60 | .42 |
| Total from investment operations | (1.17) | 2.90 | (.46) | .79 | .57 |
| Distributions from net investment income | (.13) | (.11) | (.21) | (.13) | (.11) |
| Distributions from net realized gain | – | – | (.37) | (.06) | (.14) |
| Total distributions | (.13) | (.11) | (.58) | (.19) | (.25) |
| Net asset value, end of period | $11.16 | $12.46 | $9.67 | $10.71 | $10.11 |
| Total ReturnC,D | (9.51)% | 30.20% | (4.87)% | 8.06% | 5.90% |
| Ratios to Average Net AssetsB,E,F | | | | | |
| Expenses before reductions | 3.39% | 4.41% | 4.46% | 4.79% | 5.90% |
| Expenses net of fee waivers, if any | 1.52% | 1.63% | 1.66% | 1.65% | 1.65% |
| Expenses net of all reductions | 1.52% | 1.62% | 1.64% | 1.64% | 1.63% |
| Net investment income (loss) | 1.21% | 1.35% | 1.22% | 1.84% | 1.54% |
| Supplemental Data | | | | | |
| Net assets, end of period (000 omitted) | $1,070 | $876 | $658 | $810 | $570 |
| Portfolio turnover rateG | 33% | 32% | 52% | 60% | 46% |
A Calculated based on average shares outstanding during the period.
B Net investment income (loss) is affected by the timing of the declaration of dividends by any underlying mutual funds or exchange-traded funds (ETFs). Net investment income (loss) of any such underlying funds is not included in the Fund's net investment income (loss) ratio.
C Total returns would have been lower if certain expenses had not been reduced during the applicable periods shown.
D Total returns do not include the effect of the sales charges.
E Fees and expenses of any underlying mutual funds or exchange-traded funds (ETFs) are not included in the Fund's expense ratio. The Fund indirectly bears its proportionate share of these expenses. For additional expense information related to investments in Fidelity Central Funds, please refer to the "Investments in Fidelity Central Funds" note found in the Notes to Financial Statements section of the most recent Annual or Semi-Annual report.
F Expense ratios reflect operating expenses of the class. Expenses before reductions do not reflect amounts reimbursed, waived, or reduced through arrangements with the investment adviser, brokerage services, or other offset arrangements, if applicable, and do not represent the amount paid by the class during periods when reimbursements, waivers or reductions occur.
G Amount does not include the portfolio activity of any underlying mutual funds or exchange-traded funds (ETFs).
See accompanying notes which are an integral part of the financial statements.
Fidelity Advisor Global Real Estate Fund Class C
| Years ended July 31, | 2022 | 2021 | 2020 | 2019 | 2018 |
| Selected Per–Share Data | | | | | |
| Net asset value, beginning of period | $12.47 | $9.63 | $10.63 | $10.08 | $9.76 |
| Income from Investment Operations | | | | | |
| Net investment income (loss)A,B | .09 | .09 | .07 | .14 | .10 |
| Net realized and unrealized gain (loss) | (1.33) | 2.75 | (.58) | .59 | .42 |
| Total from investment operations | (1.24) | 2.84 | (.51) | .73 | .52 |
| Distributions from net investment income | (.06) | – | (.12) | (.12) | (.06) |
| Distributions from net realized gain | – | – | (.37) | (.06) | (.14) |
| Total distributions | (.06) | – | (.49) | (.18) | (.20) |
| Net asset value, end of period | $11.17 | $12.47 | $9.63 | $10.63 | $10.08 |
| Total ReturnC,D | (9.97)% | 29.49% | (5.31)% | 7.52% | 5.38% |
| Ratios to Average Net AssetsB,E,F | | | | | |
| Expenses before reductions | 3.93% | 5.02% | 4.46% | 5.04% | 6.26% |
| Expenses net of fee waivers, if any | 2.02% | 2.14% | 2.16% | 2.15% | 2.15% |
| Expenses net of all reductions | 2.02% | 2.13% | 2.15% | 2.14% | 2.13% |
| Net investment income (loss) | .72% | .85% | .71% | 1.34% | 1.04% |
| Supplemental Data | | | | | |
| Net assets, end of period (000 omitted) | $203 | $223 | $185 | $1,060 | $614 |
| Portfolio turnover rateG | 33% | 32% | 52% | 60% | 46% |
A Calculated based on average shares outstanding during the period.
B Net investment income (loss) is affected by the timing of the declaration of dividends by any underlying mutual funds or exchange-traded funds (ETFs). Net investment income (loss) of any such underlying funds is not included in the Fund's net investment income (loss) ratio.
C Total returns would have been lower if certain expenses had not been reduced during the applicable periods shown.
D Total returns do not include the effect of the contingent deferred sales charge.
E Fees and expenses of any underlying mutual funds or exchange-traded funds (ETFs) are not included in the Fund's expense ratio. The Fund indirectly bears its proportionate share of these expenses. For additional expense information related to investments in Fidelity Central Funds, please refer to the "Investments in Fidelity Central Funds" note found in the Notes to Financial Statements section of the most recent Annual or Semi-Annual report.
F Expense ratios reflect operating expenses of the class. Expenses before reductions do not reflect amounts reimbursed, waived, or reduced through arrangements with the investment adviser, brokerage services, or other offset arrangements, if applicable, and do not represent the amount paid by the class during periods when reimbursements, waivers or reductions occur.
G Amount does not include the portfolio activity of any underlying mutual funds or exchange-traded funds (ETFs).
See accompanying notes which are an integral part of the financial statements.
Fidelity Advisor Global Real Estate Fund Class I
| Years ended July 31, | 2022 | 2021 | 2020 | 2019 | 2018 |
| Selected Per–Share Data | | | | | |
| Net asset value, beginning of period | $12.51 | $9.71 | $10.75 | $10.15 | $9.82 |
| Income from Investment Operations | | | | | |
| Net investment income (loss)A,B | .20 | .20 | .17 | .24 | .20 |
| Net realized and unrealized gain (loss) | (1.32) | 2.76 | (.58) | .59 | .43 |
| Total from investment operations | (1.12) | 2.96 | (.41) | .83 | .63 |
| Distributions from net investment income | (.18) | (.16) | (.26) | (.17) | (.16) |
| Distributions from net realized gain | – | – | (.37) | (.06) | (.14) |
| Total distributions | (.18) | (.16) | (.63) | (.23) | (.30) |
| Net asset value, end of period | $11.21 | $12.51 | $9.71 | $10.75 | $10.15 |
| Total ReturnC | (9.12)% | 30.82% | (4.40)% | 8.55% | 6.48% |
| Ratios to Average Net AssetsB,D,E | | | | | |
| Expenses before reductions | 2.94% | 3.81% | 3.97% | 4.20% | 5.41% |
| Expenses net of fee waivers, if any | 1.02% | 1.13% | 1.16% | 1.15% | 1.15% |
| Expenses net of all reductions | 1.02% | 1.12% | 1.14% | 1.14% | 1.13% |
| Net investment income (loss) | 1.71% | 1.85% | 1.71% | 2.34% | 2.04% |
| Supplemental Data | | | | | |
| Net assets, end of period (000 omitted) | $1,766 | $1,483 | $1,066 | $1,056 | $986 |
| Portfolio turnover rateF | 33% | 32% | 52% | 60% | 46% |
A Calculated based on average shares outstanding during the period.
B Net investment income (loss) is affected by the timing of the declaration of dividends by any underlying mutual funds or exchange-traded funds (ETFs). Net investment income (loss) of any such underlying funds is not included in the Fund's net investment income (loss) ratio.
C Total returns would have been lower if certain expenses had not been reduced during the applicable periods shown.
D Fees and expenses of any underlying mutual funds or exchange-traded funds (ETFs) are not included in the Fund's expense ratio. The Fund indirectly bears its proportionate share of these expenses. For additional expense information related to investments in Fidelity Central Funds, please refer to the "Investments in Fidelity Central Funds" note found in the Notes to Financial Statements section of the most recent Annual or Semi-Annual report.
E Expense ratios reflect operating expenses of the class. Expenses before reductions do not reflect amounts reimbursed, waived, or reduced through arrangements with the investment adviser, brokerage services, or other offset arrangements, if applicable, and do not represent the amount paid by the class during periods when reimbursements, waivers or reductions occur.
F Amount does not include the portfolio activity of any underlying mutual funds or exchange-traded funds (ETFs).
See accompanying notes which are an integral part of the financial statements.
Fidelity Advisor Global Real Estate Fund Class Z
| Years ended July 31, | 2022 | 2021 | 2020 | 2019 A |
| Selected Per–Share Data | | | | |
| Net asset value, beginning of period | $12.56 | $9.73 | $10.76 | $10.01 |
| Income from Investment Operations | | | | |
| Net investment income (loss)B,C | .22 | .22 | .19 | .22 |
| Net realized and unrealized gain (loss) | (1.32) | 2.77 | (.59) | .76 |
| Total from investment operations | (1.10) | 2.99 | (.40) | .98 |
| Distributions from net investment income | (.18) | (.16) | (.26) | (.17) |
| Distributions from net realized gain | – | – | (.37) | (.06) |
| Total distributions | (.18) | (.16) | (.63) | (.23) |
| Net asset value, end of period | $11.28 | $12.56 | $9.73 | $10.76 |
| Total ReturnD,E | (8.93)% | 31.07% | (4.29)% | 10.17% |
| Ratios to Average Net AssetsC,F,G | | | | |
| Expenses before reductions | 2.71% | 3.72% | 3.54% | 3.87%H |
| Expenses net of fee waivers, if any | .89% | .97% | 1.02% | 1.00%H |
| Expenses net of all reductions | .89% | .96% | 1.00% | 1.00%H |
| Net investment income (loss) | 1.84% | 2.01% | 1.86% | 2.50%H |
| Supplemental Data | | | | |
| Net assets, end of period (000 omitted) | $1,303 | $1,180 | $233 | $306 |
| Portfolio turnover rateI | 33% | 32% | 52% | 60% |
A For the period October 2, 2018 (commencement of sale of shares) through July 31, 2019.
B Calculated based on average shares outstanding during the period.
C Net investment income (loss) is affected by the timing of the declaration of dividends by any underlying mutual funds or exchange-traded funds (ETFs). Net investment income (loss) of any such underlying funds is not included in the Fund's net investment income (loss) ratio.
D Total returns for periods of less than one year are not annualized.
E Total returns would have been lower if certain expenses had not been reduced during the applicable periods shown.
F Fees and expenses of any underlying mutual funds or exchange-traded funds (ETFs) are not included in the Fund's expense ratio. The Fund indirectly bears its proportionate share of these expenses. For additional expense information related to investments in Fidelity Central Funds, please refer to the "Investments in Fidelity Central Funds" note found in the Notes to Financial Statements section of the most recent Annual or Semi-Annual report.
G Expense ratios reflect operating expenses of the class. Expenses before reductions do not reflect amounts reimbursed, waived, or reduced through arrangements with the investment adviser, brokerage services, or other offset arrangements, if applicable, and do not represent the amount paid by the class during periods when reimbursements, waivers or reductions occur.
H Annualized
I Amount does not include the portfolio activity of any underlying mutual funds or exchange-traded funds (ETFs).
See accompanying notes which are an integral part of the financial statements.
Notes to Financial Statements
For the period ended July 31, 2022
1. Organization.
Fidelity Advisor Global Real Estate Fund (the Fund) is a fund of Fidelity Advisor Series VII (the Trust) and is authorized to issue an unlimited number of shares. The Trust is registered under the Investment Company Act of 1940, as amended (the 1940 Act), as an open-end management investment company organized as a Massachusetts business trust. The Fund offers Class A, Class M, Class C, Class I and Class Z shares, each of which has equal rights as to assets and voting privileges. Each class has exclusive voting rights with respect to matters that affect that class. Class C shares will automatically convert to Class A shares after a holding period of eight years from the initial date of purchase, with certain exceptions.
2. Investments in Fidelity Central Funds.
Funds may invest in Fidelity Central Funds, which are open-end investment companies generally available only to other investment companies and accounts managed by the investment adviser and its affiliates. The Schedule of Investments lists any Fidelity Central Funds held as an investment as of period end, but does not include the underlying holdings of each Fidelity Central Fund. An investing fund indirectly bears its proportionate share of the expenses of the underlying Fidelity Central Funds.
Based on its investment objective, each Fidelity Central Fund may invest or participate in various investment vehicles or strategies that are similar to those of the investing fund. These strategies are consistent with the investment objectives of the investing fund and may involve certain economic risks which may cause a decline in value of each of the Fidelity Central Funds and thus a decline in the value of the investing fund.
| Fidelity Central Fund | Investment Manager | Investment Objective | Investment Practices | Expense Ratio(a) |
| Fidelity Money Market Central Funds | Fidelity Management & Research Company LLC (FMR) | Each fund seeks to obtain a high level of current income consistent with the preservation of capital and liquidity. | Short-term Investments | Less than .005% |
(a) Expenses expressed as a percentage of average net assets and are as of each underlying Central Fund's most recent annual or semi-annual shareholder report.
A complete unaudited list of holdings for each Fidelity Central Fund is available upon request or at the Securities and Exchange Commission website at www.sec.gov. In addition, the financial statements of the Fidelity Central Funds which contain the significant accounting policies (including investment valuation policies) of those funds, and are not covered by the Report of Independent Registered Public Accounting Firm, are available on the Securities and Exchange Commission website or upon request.
3. Significant Accounting Policies.
The Fund is an investment company and applies the accounting and reporting guidance of the Financial Accounting Standards Board (FASB) Accounting Standards Codification Topic 946 Financial Services - Investment Companies. The financial statements have been prepared in conformity with accounting principles generally accepted in the United States of America (GAAP), which require management to make certain estimates and assumptions at the date of the financial statements. Actual results could differ from those estimates. Subsequent events, if any, through the date that the financial statements were issued have been evaluated in the preparation of the financial statements. The Fund's Schedule of Investments lists any underlying mutual funds or exchange-traded funds (ETFs) but does not include the underlying holdings of these funds. The following summarizes the significant accounting policies of the Fund:
Investment Valuation. Investments are valued as of 4:00 p.m. Eastern time on the last calendar day of the period. The Board of Trustees (the Board) has delegated the day to day responsibility for the valuation of the Fund's investments to the Fair Value Committee (the Committee) established by the Fund's investment adviser. In accordance with valuation policies and procedures approved by the Board, the Fund attempts to obtain prices from one or more third party pricing vendors or brokers to value its investments. When current market prices, quotations or currency exchange rates are not readily available or reliable, investments will be fair valued in good faith by the Committee, in accordance with procedures adopted by the Board. Factors used in determining fair value vary by investment type and may include market or investment specific events. The frequency with which these procedures are used cannot be predicted and they may be utilized to a significant extent. The Committee oversees the Fund's valuation policies and procedures and reports to the Board on the Committee's activities and fair value determinations. The Board monitors the appropriateness of the procedures used in valuing the Fund's investments and ratifies the fair value determinations of the Committee.
The Fund categorizes the inputs to valuation techniques used to value its investments into a disclosure hierarchy consisting of three levels as shown below:
- Level 1 – unadjusted quoted prices in active markets for identical investments
- Level 2 – other significant observable inputs (including quoted prices for similar investments, interest rates, prepayment speeds, etc.)
- Level 3 – unobservable inputs (including the Fund's own assumptions based on the best information available)
Valuation techniques used to value the Fund's investments by major category are as follows:
Equity securities, including restricted securities, for which market quotations are readily available, are valued at the last reported sale price or official closing price as reported by a third party pricing vendor on the primary market or exchange on which they are traded and are categorized as Level 1 in the hierarchy. In the event there were no sales during the day or closing prices are not available, securities are valued at the last quoted bid price or may be valued using the last available price and are generally categorized as Level 2 in the hierarchy. For foreign equity securities, when market or security specific events arise, comparisons to the valuation of American Depositary Receipts (ADRs), futures contracts, ETFs and certain indexes as well as quoted prices for similar securities may be used and would be categorized as Level 2 in the hierarchy. For equity securities, including restricted securities, where observable inputs are limited, assumptions about market activity and risk are used and these securities may be categorized as Level 3 in the hierarchy.
Investments in open-end mutual funds, including the Fidelity Central Funds, are valued at their closing net asset value (NAV) each business day and are categorized as Level 1 in the hierarchy.
Changes in valuation techniques may result in transfers in or out of an assigned level within the disclosure hierarchy. The aggregate value of investments by input level as of July 31, 2022 is included at the end of the Fund's Schedule of Investments.
Foreign Currency. Certain Funds may use foreign currency contracts to facilitate transactions in foreign-denominated securities. Gains and losses from these transactions may arise from changes in the value of the foreign currency or if the counterparties do not perform under the contracts' terms.
Foreign-denominated assets, including investment securities, and liabilities are translated into U.S. dollars at the exchange rates at period end. Purchases and sales of investment securities, income and dividends received, and expenses denominated in foreign currencies are translated into U.S. dollars at the exchange rate in effect on the transaction date.
The effects of exchange rate fluctuations on investments are included with the net realized and unrealized gain (loss) on investment securities. Other foreign currency transactions resulting in realized and unrealized gain (loss) are disclosed separately.
Investment Transactions and Income. For financial reporting purposes, the Fund's investment holdings and NAV include trades executed through the end of the last business day of the period. The NAV per share for processing shareholder transactions is calculated as of the close of business of the New York Stock Exchange (NYSE), normally 4:00 p.m. Eastern time and includes trades executed through the end of the prior business day. Gains and losses on securities sold are determined on the basis of identified cost. Commissions paid to certain brokers with whom the investment adviser, or its affiliates, places trades on behalf of a fund include an amount in addition to trade execution, which may be rebated back to a fund. Any such rebates are included in net realized gain (loss) on investments in the Statement of Operations. Dividend income is recorded on the ex-dividend date, except for certain dividends from foreign securities where the ex-dividend date may have passed, which are recorded as soon as the Fund is informed of the ex-dividend date. Non-cash dividends included in dividend income, if any, are recorded at the fair market value of the securities received. Income and capital gain distributions from Fidelity Central Funds, if any, are recorded on the ex-dividend date. Certain distributions received by the Fund represent a return of capital or capital gain. The Fund determines the components of these distributions subsequent to the ex-dividend date, based upon receipt of tax filings or other correspondence relating to the underlying investment. These distributions are recorded as a reduction of cost of investments and/or as a realized gain. Investment income is recorded net of foreign taxes withheld where recovery of such taxes is uncertain. Funds may file withholding tax reclaims in certain jurisdictions to recover a portion of amounts previously withheld. Any withholding tax reclaims income is included in the Statement of Operations in foreign taxes withheld. Any receivables for withholding tax reclaims are included in the Statement of Assets and Liabilities in dividends receivable.
Class Allocations and Expenses. Investment income, realized and unrealized capital gains and losses, common expenses of a fund, and certain fund-level expense reductions, if any, are allocated daily on a pro-rata basis to each class based on the relative net assets of each class to the total net assets of a fund. Each class differs with respect to transfer agent and distribution and service plan fees incurred, as applicable. Certain expense reductions may also differ by class, if applicable. For the reporting period, the allocated portion of income and expenses to each class as a percent of its average net assets may vary due to the timing of recording these transactions in relation to fluctuating net assets of the classes. Expenses directly attributable to a fund are charged to that fund. Expenses attributable to more than one fund are allocated among the respective funds on the basis of relative net assets or other appropriate methods. Expenses included in the accompanying financial statements reflect the expenses of that fund and do not include any expenses associated with any underlying mutual funds or exchange-traded funds. Although not included in a fund's expenses, a fund indirectly bears its proportionate share of these expenses through the net asset value of each underlying mutual fund or exchange-traded fund. Expense estimates are accrued in the period to which they relate and adjustments are made when actual amounts are known.
Income Tax Information and Distributions to Shareholders. Each year, the Fund intends to qualify as a regulated investment company under Subchapter M of the Internal Revenue Code, including distributing substantially all of its taxable income and realized gains. As a result, no provision for U.S. Federal income taxes is required. As of July 31, 2022, the Fund did not have any unrecognized tax benefits in the financial statements; nor is the Fund aware of any tax positions for which it is reasonably possible that the total amounts of unrecognized tax benefits will significantly change in the next twelve months. The Fund files a U.S. federal tax return, in addition to state and local tax returns as required. The Fund's federal income tax returns are subject to examination by the Internal Revenue Service (IRS) for a period of three fiscal years after they are filed. State and local tax returns may be subject to examination for an additional fiscal year depending on the jurisdiction. Foreign taxes are provided for based on the Fund's understanding of the tax rules and rates that exist in the foreign markets in which it invests.
Distributions are declared and recorded on the ex-dividend date. Income and capital gain distributions are declared separately for each class. Income and capital gain distributions are determined in accordance with income tax regulations, which may differ from GAAP.
Capital accounts within the financial statements are adjusted for permanent book-tax differences. These adjustments have no impact on net assets or the results of operations. Capital accounts are not adjusted for temporary book-tax differences which will reverse in a subsequent period.
Book-tax differences are primarily due to foreign currency transactions, passive foreign investment companies (PFIC), capital loss carryforwards and losses deferred due to wash sales.
As of period end, the cost and unrealized appreciation (depreciation) in securities, and derivatives if applicable, for federal income tax purposes were as follows:
| Gross unrealized appreciation | $1,094,010 |
| Gross unrealized depreciation | (501,598) |
| Net unrealized appreciation (depreciation) | $592,412 |
| Tax Cost | $6,727,871 |
The tax-based components of distributable earnings as of period end were as follows:
| Undistributed ordinary income | $29,374 |
| Capital loss carryforward | $(170,101) |
| Net unrealized appreciation (depreciation) on securities and other investments | $592,363 |
Capital loss carryforwards are only available to offset future capital gains of the Fund to the extent provided by regulations and may be limited. The capital loss carryforward information presented below, including any applicable limitation, is estimated as of fiscal period end and is subject to adjustment.
The tax character of distributions paid was as follows:
| | July 31, 2022 | July 31, 2021 |
| Ordinary Income | $92,097 | $ 55,566 |
Delayed Delivery Transactions and When-Issued Securities. During the period, certain Funds transacted in securities on a delayed delivery or when-issued basis. Payment and delivery may take place after the customary settlement period for that security. The price of the underlying securities and the date when the securities will be delivered and paid for are fixed at the time the transaction is negotiated. Securities purchased on a delayed delivery or when-issued basis are identified as such in the Schedule of Investments. Compensation for interest forgone in the purchase of a delayed delivery or when-issued debt security may be received. With respect to purchase commitments, each applicable Fund identifies securities as segregated in its records with a value at least equal to the amount of the commitment. Payables and receivables associated with the purchases and sales of delayed delivery securities having the same coupon, settlement date and broker are offset. Delayed delivery or when-issued securities that have been purchased from and sold to different brokers are reflected as both payables and receivables in the Statement of Assets and Liabilities under the caption "Delayed delivery", as applicable. Losses may arise due to changes in the value of the underlying securities or if the counterparty does not perform under the contract's terms, or if the issuer does not issue the securities due to political, economic, or other factors.
Restricted Securities (including Private Placements). Funds may invest in securities that are subject to legal or contractual restrictions on resale. These securities generally may be resold in transactions exempt from registration or to the public if the securities are registered. Disposal of these securities may involve time-consuming negotiations and expense, and prompt sale at an acceptable price may be difficult. Information regarding restricted securities held at period end is included at the end of the Schedule of Investments, if applicable.
4. Purchases and Sales of Investments.
Purchases and sales of securities, other than short-term securities and in-kind transactions, as applicable, are noted in the table below.
| | Purchases ($) | Sales ($) |
| Fidelity Advisor Global Real Estate Fund | 4,127,978 | 2,422,296 |
5. Fees and Other Transactions with Affiliates.
Management Fee. Fidelity Management & Research Company LLC (the investment adviser) and its affiliates provide the Fund with investment management related services for which the Fund pays a monthly management fee. The management fee is the sum of an individual fund fee rate that is based on an annual rate of .45% of the Fund's average net assets and an annualized group fee rate that averaged .22% during the period. The group fee rate is based upon the monthly average net assets of a group of registered investment companies with which the investment adviser has management contracts. The group fee rate decreases as assets under management increase and increases as assets under management decrease. For the reporting period, the total annual management fee rate was .68% of the Fund's average net assets.
Distribution and Service Plan Fees. In accordance with Rule 12b-1 of the 1940 Act, the Fund has adopted separate Distribution and Service Plans for each class of shares. Certain classes pay Fidelity Distributors Company LLC (FDC), an affiliate of the investment adviser, separate Distribution and Service Fees, each of which is based on an annual percentage of each class' average net assets. In addition, FDC may pay financial intermediaries for selling shares of the Fund and providing shareholder support services. For the period, the Distribution and Service Fee rates, total fees and amounts retained by FDC were as follows:
| | Distribution Fee | Service Fee | Total Fees | Retained by FDC |
| Class A | -% | .25% | $8,007 | $3,480 |
| Class M | .25% | .25% | 5,238 | 3,184 |
| Class C | .75% | .25% | 2,364 | 473 |
| | | | $15,609 | $7,137 |
Sales Load. FDC may receive a front-end sales charge of up to 5.75% for selling Class A shares and 3.50% for selling Class M shares, some of which is paid to financial intermediaries for selling shares of the Fund. Depending on the holding period, FDC may receive contingent deferred sales charges levied on Class A, Class M and Class C redemptions. The deferred sales charges are 1.00% for Class C shares, 1.00% for certain purchases of Class A shares and .25% for certain purchases of Class M shares.
For the period, sales charge amounts retained by FDC were as follows:
| | Retained by FDC |
| Class A | $2,299 |
| Class M | 174 |
| Class C(a) | 36 |
| | $2,509 |
(a) When Class C shares are initially sold, FDC pays commissions from its own resources to financial intermediaries through which the sales are made.
Transfer Agent Fees. Fidelity Investments Institutional Operations Company LLC (FIIOC), an affiliate of the investment adviser, is the transfer, dividend disbursing and shareholder servicing agent for each class of the Fund. FIIOC receives account fees and asset-based fees that vary according to the account size and type of account of the shareholders of the respective classes of the Fund, except for Class Z. FIIOC receives an asset-based fee of Class Z's average net assets. FIIOC pays for typesetting, printing and mailing of shareholder reports, except proxy statements.
For the period, transfer agent fees for each class were as follows:
| | Amount | % of Class-Level Average Net Assets |
| Class A | $7,501 | .23 |
| Class M | 1,940 | .19 |
| Class C | 672 | .28 |
| Class I | 2,572 | .16 |
| Class Z | 567 | .04 |
| | $13,252 | |
Accounting Fees. Fidelity Service Company, Inc. (FSC), an affiliate of the investment adviser, maintains the Fund's accounting records. The accounting fee is based on the level of average net assets for each month. For the period, the fees were equivalent to the following annual rates:
| | % of Average Net Assets |
| Fidelity Advisor Global Real Estate Fund | .04 |
Brokerage Commissions. A portion of portfolio transactions were placed with brokerage firms which are affiliates of the investment adviser. Brokerage commissions are included in net realized gain (loss) and change in net unrealized appreciation (depreciation) in the Statement of Operations. The commissions paid to these affiliated firms were as follows:
| | Amount |
| Fidelity Advisor Global Real Estate Fund | $53 |
Interfund Trades. Funds may purchase from or sell securities to other Fidelity Funds under procedures adopted by the Board. The procedures have been designed to ensure these interfund trades are executed in accordance with Rule 17a-7 of the 1940 Act. Any interfund trades are included within the respective purchases and sales amounts shown in the Purchases and Sales of Investments note. Interfund trades during the period are noted in the table below.
| | Purchases ($) | Sales ($) | Realized Gain (Loss) ($) |
| Fidelity Advisor Global Real Estate Fund | 38,697 | 74,770 | 4,474 |
6. Committed Line of Credit.
Certain Funds participate with other funds managed by the investment adviser or an affiliate in a $4.25 billion credit facility (the "line of credit") to be utilized for temporary or emergency purposes to fund shareholder redemptions or for other short-term liquidity purposes. The participating funds have agreed to pay commitment fees on their pro-rata portion of the line of credit, which are reflected in Miscellaneous expenses on the Statement of Operations, and are listed below. During the period, there were no borrowings on this line of credit.
| | Amount |
| Fidelity Advisor Global Real Estate Fund | $9 |
7. Expense Reductions.
The investment adviser contractually agreed to reimburse expenses of each class to the extent annual operating expenses exceeded certain levels of class-level average net assets as noted in the table below. This reimbursement will remain in place through November 30, 2023. Some expenses, for example the compensation of the independent Trustees, and certain miscellaneous expenses such as proxy and shareholder meeting expenses, are excluded from this reimbursement.
The following classes were in reimbursement during the period:
| | Expense Limitations | Reimbursement |
| Class A | 1.30%/1.20%(a) | $61,020 |
| Class M | 1.55%/1.45%(a) | 19,522 |
| Class C | 2.05%/1.95%(a) | 4,523 |
| Class I | 1.05%/.95%(a) | 30,273 |
| Class Z | .90%/.80%(a) | 25,392 |
| | | $140,730 |
(a) Expense limitation effective June 1, 2022.
Through arrangements with the Fund's custodian, credits realized as a result of certain uninvested cash balances were used to reduce the Fund's expenses. During the period, custodian credits reduced the Fund's expenses by $11.
In addition, during the period the investment adviser or an affiliate reimbursed and/or waived a portion of fund-level operating expenses in the amount of $234.
8. Distributions to Shareholders.
Distributions to shareholders of each class were as follows:
| | Year ended
July 31, 2022 | Year ended
July 31, 2021 |
| Fidelity Advisor Global Real Estate Fund | | |
| Distributions to shareholders | | |
| Class A | $40,544 | $26,351 |
| Class M | 10,997 | 7,125 |
| Class C | 1,175 | – |
| Class I | 21,272 | 19,213 |
| Class Z | 18,109 | 2,877 |
| Total | $92,097 | $55,566 |
9. Share Transactions.
Share transactions for each class were as follows and may contain in-kind transactions, automatic conversions between classes or exchanges between affiliated funds:
| | Shares | Shares | Dollars | Dollars |
| | Year ended July 31, 2022 | Year ended July 31, 2021 | Year ended July 31, 2022 | Year ended July 31, 2021 |
| Fidelity Advisor Global Real Estate Fund | | | | |
| Class A | | | | |
| Shares sold | 92,564 | 56,801 | $1,135,946 | $613,618 |
| Reinvestment of distributions | 3,246 | 2,601 | 40,544 | 26,348 |
| Shares redeemed | (45,679) | (18,190) | (547,402) | (206,199) |
| Net increase (decrease) | 50,131 | 41,212 | $629,088 | $433,767 |
| Class M | | | | |
| Shares sold | 31,478 | 9,736 | $387,783 | $100,374 |
| Reinvestment of distributions | 881 | 704 | 10,997 | 7,125 |
| Shares redeemed | (6,761) | (8,197) | (71,550) | (82,487) |
| Net increase (decrease) | 25,598 | 2,243 | $327,230 | $25,012 |
| Class C | | | | |
| Shares sold | 7,240 | 6,163 | $88,337 | $63,461 |
| Reinvestment of distributions | 94 | – | 1,175 | – |
| Shares redeemed | (7,027) | (7,478) | (75,141) | (76,707) |
| Net increase (decrease) | 307 | (1,315) | $14,371 | $(13,246) |
| Class I | | | | |
| Shares sold | 45,989 | 25,794 | $534,191 | $266,297 |
| Reinvestment of distributions | 1,446 | 1,513 | 18,078 | 15,327 |
| Shares redeemed | (8,457) | (18,638) | (90,325) | (203,528) |
| Net increase (decrease) | 38,978 | 8,669 | $461,944 | $78,096 |
| Class Z | | | | |
| Shares sold | 127,231 | 80,366 | $1,565,852 | $868,084 |
| Reinvestment of distributions | 1,442 | 281 | 18,109 | 2,850 |
| Shares redeemed | (106,982) | (10,753) | (1,284,412) | (114,293) |
| Net increase (decrease) | 21,691 | 69,894 | $299,549 | $756,641 |
10. Other.
A fund's organizational documents provide former and current trustees and officers with a limited indemnification against liabilities arising in connection with the performance of their duties to the fund. In the normal course of business, a fund may also enter into contracts that provide general indemnifications. A fund's maximum exposure under these arrangements is unknown as this would be dependent on future claims that may be made against a fund. The risk of material loss from such claims is considered remote.
At the end of the period, the investment adviser or its affiliates were owners of record of more than 10% of the outstanding shares as follows:
| Fund | Affiliated % |
| Fidelity Advisor Global Real Estate Fund | 36% |
11. Coronavirus (COVID-19) Pandemic.
An outbreak of COVID-19 first detected in China during December 2019 has since spread globally and was declared a pandemic by the World Health Organization during March 2020. Developments that disrupt global economies and financial markets, such as the COVID-19 pandemic, may magnify factors that affect the Fund's performance.
Report of Independent Registered Public Accounting Firm
To the Board of Trustees of Fidelity Advisor Series VII and Shareholders of Fidelity Advisor Global Real Estate Fund
Opinion on the Financial Statements and Financial Highlights
We have audited the accompanying statement of assets and liabilities of Fidelity Advisor Global Real Estate Fund (the "Fund"), a fund of Fidelity Advisor Series VII, including the schedule of investments, as of July 31, 2022, the related statement of operations for the year then ended, the statement of changes in net assets for each of the two years in the period then ended, the financial highlights for each of the five years in the period then, and the related notes. In our opinion, the financial statements and financial highlights present fairly, in all material respects, the financial position of the Fund as of July 31, 2022, and the results of its operations for the year then ended, the changes in its net assets for each of the two years in the period then ended, and the financial highlights for each of the five years in the period then ended in conformity with accounting principles generally accepted in the United States of America.
Basis for Opinion
These financial statements and financial highlights are the responsibility of the Fund's management. Our responsibility is to express an opinion on the Fund's financial statements and financial highlights based on our audits. We are a public accounting firm registered with the Public Company Accounting Oversight Board (United States) (PCAOB) and are required to be independent with respect to the Fund in accordance with the U.S. federal securities laws and the applicable rules and regulations of the Securities and Exchange Commission and the PCAOB.
We conducted our audits in accordance with the standards of the PCAOB. Those standards require that we plan and perform the audit to obtain reasonable assurance about whether the financial statements and financial highlights are free of material misstatement, whether due to error or fraud. The Fund is not required to have, nor were we engaged to perform, an audit of its internal control over financial reporting. As part of our audits we are required to obtain an understanding of internal control over financial reporting but not for the purpose of expressing an opinion on the effectiveness of the Fund’s internal control over financial reporting. Accordingly, we express no such opinion.
Our audits included performing procedures to assess the risks of material misstatement of the financial statements and financial highlights, whether due to error or fraud, and performing procedures that respond to those risks. Such procedures included examining, on a test basis, evidence regarding the amounts and disclosures in the financial statements and financial highlights. Our audits also included evaluating the accounting principles used and significant estimates made by management, as well as evaluating the overall presentation of the financial statements and financial highlights. Our procedures included confirmation of securities owned as of July 31, 2022, by correspondence with the custodian and brokers; when replies were not received from brokers, we performed other auditing procedures. We believe that our audits provide a reasonable basis for our opinion.
/s/ Deloitte & Touche LLP
Boston, Massachusetts
September 14, 2022
We have served as the auditor of one or more of the Fidelity investment companies since 1999.
Trustees and Officers
The Trustees, Members of the Advisory Board (if any), and officers of the trust and fund, as applicable, are listed below. The Board of Trustees governs the fund and is responsible for protecting the interests of shareholders. The Trustees are experienced executives who meet periodically throughout the year to oversee the fund's activities, review contractual arrangements with companies that provide services to the fund, oversee management of the risks associated with such activities and contractual arrangements, and review the fund's performance. Each of the Trustees oversees 316 funds.
The Trustees hold office without limit in time except that (a) any Trustee may resign; (b) any Trustee may be removed by written instrument, signed by at least two-thirds of the number of Trustees prior to such removal; (c) any Trustee who requests to be retired or who has become incapacitated by illness or injury may be retired by written instrument signed by a majority of the other Trustees; and (d) any Trustee may be removed at any special meeting of shareholders by a two-thirds vote of the outstanding voting securities of the trust. Each Trustee who is not an interested person (as defined in the 1940 Act) of the trust and the fund is referred to herein as an Independent Trustee. Each Independent Trustee shall retire not later than the last day of the calendar year in which his or her 75th birthday occurs. The Independent Trustees may waive this mandatory retirement age policy with respect to individual Trustees. Officers and Advisory Board Members hold office without limit in time, except that any officer or Advisory Board Member may resign or may be removed by a vote of a majority of the Trustees at any regular meeting or any special meeting of the Trustees. Except as indicated, each individual has held the office shown or other offices in the same company for the past five years.
The fund’s Statement of Additional Information (SAI) includes more information about the Trustees. To request a free copy, call Fidelity at 1-877-208-0098.
Experience, Skills, Attributes, and Qualifications of the Trustees. The Governance and Nominating Committee has adopted a statement of policy that describes the experience, qualifications, attributes, and skills that are necessary and desirable for potential Independent Trustee candidates (Statement of Policy). The Board believes that each Trustee satisfied at the time he or she was initially elected or appointed a Trustee, and continues to satisfy, the standards contemplated by the Statement of Policy. The Governance and Nominating Committee also engages professional search firms to help identify potential Independent Trustee candidates who have the experience, qualifications, attributes, and skills consistent with the Statement of Policy. From time to time, additional criteria based on the composition and skills of the current Independent Trustees, as well as experience or skills that may be appropriate in light of future changes to board composition, business conditions, and regulatory or other developments, have also been considered by the professional search firms and the Governance and Nominating Committee. In addition, the Board takes into account the Trustees' commitment and participation in Board and committee meetings, as well as their leadership of standing and ad hoc committees throughout their tenure.
In determining that a particular Trustee was and continues to be qualified to serve as a Trustee, the Board has considered a variety of criteria, none of which, in isolation, was controlling. The Board believes that, collectively, the Trustees have balanced and diverse experience, qualifications, attributes, and skills, which allow the Board to operate effectively in governing the fund and protecting the interests of shareholders. Information about the specific experience, skills, attributes, and qualifications of each Trustee, which in each case led to the Board's conclusion that the Trustee should serve (or continue to serve) as a trustee of the fund, is provided below.
Board Structure and Oversight Function. Robert A. Lawrence is an interested person and currently serves as Chair. The Trustees have determined that an interested Chair is appropriate and benefits shareholders because an interested Chair has a personal and professional stake in the quality and continuity of services provided to the fund. Independent Trustees exercise their informed business judgment to appoint an individual of their choosing to serve as Chair, regardless of whether the Trustee happens to be independent or a member of management. The Independent Trustees have determined that they can act independently and effectively without having an Independent Trustee serve as Chair and that a key structural component for assuring that they are in a position to do so is for the Independent Trustees to constitute a substantial majority for the Board. The Independent Trustees also regularly meet in executive session. David M. Thomas serves as Lead Independent Trustee and as such (i) acts as a liaison between the Independent Trustees and management with respect to matters important to the Independent Trustees and (ii) with management prepares agendas for Board meetings.
Fidelity® funds are overseen by different Boards of Trustees. The fund's Board oversees Fidelity's high income and certain equity funds, and other Boards oversee Fidelity's investment-grade bond, money market, asset allocation, and other equity funds. The asset allocation funds may invest in Fidelity® funds overseen by the fund's Board. The use of separate Boards, each with its own committee structure, allows the Trustees of each group of Fidelity® funds to focus on the unique issues of the funds they oversee, including common research, investment, and operational issues. On occasion, the separate Boards establish joint committees to address issues of overlapping consequences for the Fidelity® funds overseen by each Board.
The Trustees operate using a system of committees to facilitate the timely and efficient consideration of all matters of importance to the Trustees, the fund, and fund shareholders and to facilitate compliance with legal and regulatory requirements and oversight of the fund's activities and associated risks. The Board, acting through its committees, has charged FMR and its affiliates with (i) identifying events or circumstances the occurrence of which could have demonstrably adverse effects on the fund's business and/or reputation; (ii) implementing processes and controls to lessen the possibility that such events or circumstances occur or to mitigate the effects of such events or circumstances if they do occur; and (iii) creating and maintaining a system designed to evaluate continuously business and market conditions in order to facilitate the identification and implementation processes described in (i) and (ii) above. Because the day-to-day operations and activities of the fund are carried out by or through FMR, its affiliates, and other service providers, the fund's exposure to risks is mitigated but not eliminated by the processes overseen by the Trustees. While each of the Board's committees has responsibility for overseeing different aspects of the fund's activities, oversight is exercised primarily through the Operations, Audit, and Compliance Committees. Appropriate personnel, including but not limited to the fund's Chief Compliance Officer (CCO), FMR's internal auditor, the independent accountants, the fund's Treasurer and portfolio management personnel, make periodic reports to the Board's committees, as appropriate, including an annual review of Fidelity's risk management program for the Fidelity® funds. The responsibilities of each standing committee, including their oversight responsibilities, are described further under "Standing Committees of the Trustees."
Interested Trustees*:
Correspondence intended for a Trustee who is an interested person may be sent to Fidelity Investments, 245 Summer Street, Boston, Massachusetts 02210.
Name, Year of Birth; Principal Occupations and Other Relevant Experience+
Bettina Doulton (1964)
Year of Election or Appointment: 2020
Trustee
Ms. Doulton also serves as Trustee of other Fidelity® funds. Prior to her retirement, Ms. Doulton served in a variety of positions at Fidelity Investments, including as a managing director of research (2006-2007), portfolio manager to certain Fidelity® funds (1993-2005), equity analyst and portfolio assistant (1990-1993), and research assistant (1987-1990). Ms. Doulton currently owns and operates Phi Builders + Architects and Cellardoor Winery. Previously, Ms. Doulton served as a member of the Board of Brown Capital Management, LLC (2014-2018).
Robert A. Lawrence (1952)
Year of Election or Appointment: 2020
Trustee
Chair of the Board of Trustees
Mr. Lawrence also serves as Trustee of other funds. Previously, Mr. Lawrence served as a Trustee and Member of the Advisory Board of certain funds. Prior to his retirement in 2008, Mr. Lawrence served as Vice President of certain Fidelity® funds (2006-2008), Senior Vice President, Head of High Income Division of Fidelity Management & Research Company (investment adviser firm, 2006-2008), and President of Fidelity Strategic Investments (investment adviser firm, 2002-2005).
* Determined to be an “Interested Trustee” by virtue of, among other things, his or her affiliation with the trust or various entities under common control with FMR.
+ The information includes the Trustee's principal occupation during the last five years and other information relating to the experience, attributes, and skills relevant to the Trustee's qualifications to serve as a Trustee, which led to the conclusion that the Trustee should serve as a Trustee for the fund.
Independent Trustees:
Correspondence intended for an Independent Trustee may be sent to Fidelity Investments, P.O. Box 55235, Boston, Massachusetts 02205-5235.
Name, Year of Birth; Principal Occupations and Other Relevant Experience+
Thomas P. Bostick (1956)
Year of Election or Appointment: 2021
Trustee
Lieutenant General Bostick also serves as Trustee of other Fidelity® funds. Prior to his retirement, General Bostick (United States Army, Retired) held a variety of positions within the U.S. Army, including Commanding General and Chief of Engineers, U.S. Army Corps of Engineers (2012-2016) and Deputy Chief of Staff and Director of Human Resources, U.S. Army (2009-2012). General Bostick currently serves as a member of the Board and Finance and Governance Committees of CSX Corporation (transportation, 2020-present) and a member of the Board and Corporate Governance and Nominating Committee of Perma-Fix Environmental Services, Inc. (nuclear waste management, 2020-present). General Bostick serves as Chief Executive Officer of Bostick Global Strategies, LLC (consulting, 2016-present) and as a member of the Board of HireVue, Inc. (video interview and assessment, 2020-present). Previously, General Bostick served as a Member of the Advisory Board of certain Fidelity® funds (2021), President, Intrexon Bioengineering (2018-2020) and Chief Operating Officer (2017-2020) and Senior Vice President of the Environment Sector (2016-2017) of Intrexon Corporation (biopharmaceutical company).
Dennis J. Dirks (1948)
Year of Election or Appointment: 2018
Trustee
Mr. Dirks also serves as Trustee of other Fidelity® funds. Prior to his retirement in May 2003, Mr. Dirks served as Chief Operating Officer and as a member of the Board of The Depository Trust & Clearing Corporation (financial markets infrastructure), President, Chief Operating Officer and a member of the Board of The Depository Trust Company (DTC), President and a member of the Board of the National Securities Clearing Corporation (NSCC), Chief Executive Officer and a member of the Board of the Government Securities Clearing Corporation and Chief Executive Officer and a member of the Board of the Mortgage-Backed Securities Clearing Corporation. Mr. Dirks currently serves as a member of the Finance Committee (2016-present) and Board (2017-present) and is Treasurer (2018-present) of the Asolo Repertory Theatre.
Donald F. Donahue (1950)
Year of Election or Appointment: 2018
Trustee
Mr. Donahue also serves as Trustee of other Fidelity® funds. Mr. Donahue serves as President and Chief Executive Officer of Miranda Partners, LLC (risk consulting for the financial services industry, 2012-present). Previously, Mr. Donahue served as Chief Executive Officer (2006-2012), Chief Operating Officer (2003-2006) and Managing Director, Customer Marketing and Development (1999-2003) of The Depository Trust & Clearing Corporation (financial markets infrastructure). Mr. Donahue currently serves as a member (2007-present) and Co-Chairman (2016-present) of the Board of United Way of New York and a member of the Board of The Leadership Academy (previously NYC Leadership Academy) (2012-present). Mr. Donahue previously served as a member of the Advisory Board of certain Fidelity® funds (2015-2018).
Vicki L. Fuller (1957)
Year of Election or Appointment: 2020
Trustee
Ms. Fuller also serves as Trustee of other Fidelity® funds. Previously, Ms. Fuller served as a member of the Advisory Board of certain Fidelity® funds (2018-2020), Chief Investment Officer of the New York State Common Retirement Fund (2012-2018) and held a variety of positions at AllianceBernstein L.P. (global asset management, 1985-2012), including Managing Director (2006-2012) and Senior Vice President and Senior Portfolio Manager (2001-2006). Ms. Fuller currently serves as a member of the Board, Audit Committee and Nominating and Governance Committee of two Blackstone business development companies (2020-present), as a member of the Board of Treliant, LLC (consulting, 2019-present), as a member of the Advisory Board of Ariel Alternatives, LLC (private equity, 2021-present) and as a member of the Board and Chair of the Audit Committee of Gusto, Inc. (software, 2021-present). In addition, Ms. Fuller currently serves as a member of the Board of Roosevelt University (2019-present) and as a member of the Executive Board of New York University’s Stern School of Business. Ms. Fuller previously served as a member of the Board, Audit Committee and Nominating and Governance Committee of The Williams Companies, Inc. (natural gas infrastructure, 2018-2021).
Patricia L. Kampling (1959)
Year of Election or Appointment: 2020
Trustee
Ms. Kampling also serves as Trustee of other Fidelity® funds. Prior to her retirement, Ms. Kampling served as Chairman of the Board and Chief Executive Officer (2012-2019), President and Chief Operating Officer (2011-2012) and Executive Vice President and Chief Financial Officer (2010-2011) of Alliant Energy Corporation. Ms. Kampling currently serves as a member of the Board, Finance Committee and Governance, Compensation and Nominating Committee of Xcel Energy Inc. (utilities company, 2020-present) and as a member of the Board, Audit, Finance and Risk Committee and Safety, Environmental, Technology and Operations Committee and Chair of the Executive Development and Compensation Committee of American Water Works Company, Inc. (utilities company, 2019-present). In addition, Ms. Kampling currently serves as a member of the Board of the Nature Conservancy, Wisconsin Chapter (2019-present). Previously, Ms. Kampling served as a Member of the Advisory Board of certain Fidelity® funds (2020), a member of the Board, Compensation Committee and Executive Committee and Chair of the Audit Committee of Briggs & Stratton Corporation (manufacturing, 2011-2021), a member of the Board of Interstate Power and Light Company (2012-2019) and Wisconsin Power and Light Company (2012-2019) (each a subsidiary of Alliant Energy Corporation) and as a member of the Board and Workforce Development Committee of the Business Roundtable (2018-2019).
Thomas A. Kennedy (1955)
Year of Election or Appointment: 2021
Trustee
Mr. Kennedy also serves as Trustee of other Fidelity® funds. Previously, Mr. Kennedy served as a Member of the Advisory Board of certain Fidelity® funds (2020) and held a variety of positions at Raytheon Company (aerospace and defense, 1983-2020), including Chairman and Chief Executive Officer (2014-2020) and Executive Vice President and Chief Operating Officer (2013-2014). Mr. Kennedy currently serves as Executive Chairman of the Board of Directors of Raytheon Technologies Corporation (aerospace and defense, 2020-present). He is also a member of the Rutgers School of Engineering Industry Advisory Board (2011-present) and a member of the UCLA Engineering Dean’s Executive Board (2016-present).
Oscar Munoz (1959)
Year of Election or Appointment: 2021
Trustee
Mr. Munoz also serves as Trustee of other Fidelity® funds. Prior to his retirement, Mr. Munoz served as Executive Chairman (2020-2021), Chief Executive Officer (2015-2020), President (2015-2016) and a member of the Board (2010-2021) of United Airlines Holdings, Inc. Mr. Munoz currently serves as a member of the Board of CBRE Group, Inc. (commercial real estate, 2020-present), a member of the Board of Univision Communications, Inc. (Hispanic media, 2020-present) and a member of the Advisory Board of Salesforce.com, Inc. (cloud-based software, 2020-present). Previously, Mr. Munoz served as a Member of the Advisory Board of certain Fidelity® funds (2021).
Garnett A. Smith (1947)
Year of Election or Appointment: 2013
Trustee
Mr. Smith also serves as Trustee of other Fidelity® funds. Prior to his retirement, Mr. Smith served as Chairman and Chief Executive Officer (1990-1997) and President (1986-1990) of Inbrand Corp. (manufacturer of personal absorbent products). Prior to his employment with Inbrand Corp., he was employed by a retail fabric chain and North Carolina National Bank (now Bank of America). Mr. Smith previously served as a member of the Advisory Board of certain Fidelity® funds (2012-2013).
David M. Thomas (1949)
Year of Election or Appointment: 2018
Trustee
Lead Independent Trustee
Mr. Thomas also serves as Trustee of other Fidelity® funds. Previously, Mr. Thomas served as Executive Chairman (2005-2006) and Chairman and Chief Executive Officer (2000-2005) of IMS Health, Inc. (pharmaceutical and healthcare information solutions). Mr. Thomas currently serves as a member of the Board of Fortune Brands Home and Security (home and security products, 2004-present) and as Director (2013-present) and Non-Executive Chairman of the Board (2022-present) of Interpublic Group of Companies, Inc. (marketing communication).
Susan Tomasky (1953)
Year of Election or Appointment: 2020
Trustee
Ms. Tomasky also serves as Trustee of other Fidelity® funds. Prior to her retirement, Ms. Tomasky served in various executive officer positions at American Electric Power Company, Inc. (1998-2011), including most recently as President of AEP Transmission (2007-2011). Ms. Tomasky currently serves as a member of the Board and Sustainability Committee and as Chair of the Audit Committee of Marathon Petroleum Corporation (2018-present) and as a member of the Board, Executive Committee, Corporate Governance Committee and Organization and Compensation Committee and as Chair of the Audit Committee of Public Service Enterprise Group, Inc. (utilities company, 2012-present) and as a member of the Board of its subsidiary company, Public Service Electric and Gas Co. (2021-present). In addition, Ms. Tomasky currently serves as a member (2009-present) and President (2020-present) of the Board of the Royal Shakespeare Company – America (2009-present), as a member of the Board of the Columbus Association for the Performing Arts (2011-present) and as a member of the Board and Kenyon in the World Committee of Kenyon College (2016-present). Previously, Ms. Tomasky served as a Member of the Advisory Board of certain Fidelity® funds (2020), as a member of the Board of the Columbus Regional Airport Authority (2007-2020), as a member of the Board (2011-2018) and Lead Independent Director (2015-2018) of Andeavor Corporation (previously Tesoro Corporation) (independent oil refiner and marketer) and as a member of the Board of Summit Midstream Partners LP (energy, 2012-2018).
Michael E. Wiley (1950)
Year of Election or Appointment: 2008
Trustee
Mr. Wiley also serves as Trustee of other Fidelity® funds. Previously, Mr. Wiley served as a member of the Advisory Board of certain Fidelity® funds (2018-2020), Chairman, President and CEO of Baker Hughes, Inc. (oilfield services, 2000-2004). Mr. Wiley also previously served as a member of the Board of Andeavor Corporation (independent oil refiner and marketer, 2005-2018), a member of the Board of Andeavor Logistics LP (natural resources logistics, 2015-2018) and a member of the Board of High Point Resources (exploration and production, 2005-2020).
+ The information includes the Trustee's principal occupation during the last five years and other information relating to the experience, attributes, and skills relevant to the Trustee's qualifications to serve as a Trustee, which led to the conclusion that the Trustee should serve as a Trustee for the fund.
Advisory Board Members and Officers:
Correspondence intended for a Member of the Advisory Board (if any) may be sent to Fidelity Investments, P.O. Box 55235, Boston, Massachusetts 02205-5235. Correspondence intended for an officer or Peter S. Lynch may be sent to Fidelity Investments, 245 Summer Street, Boston, Massachusetts 02210. Officers appear below in alphabetical order.
Name, Year of Birth; Principal Occupation
Peter S. Lynch (1944)
Year of Election or Appointment: 2018
Member of the Advisory Board
Mr. Lynch also serves as a Member of the Advisory Board of other Fidelity® funds. Mr. Lynch is Vice Chairman and a Director of Fidelity Management & Research Company LLC (investment adviser firm). In addition, Mr. Lynch serves as a Trustee of Boston College and as the Chairman of the Inner-City Scholarship Fund. Previously, Mr. Lynch served as Vice Chairman and a Director of FMR Co., Inc. (investment adviser firm) and on the Special Olympics International Board of Directors (1997-2006).
Craig S. Brown (1977)
Year of Election or Appointment: 2019
Assistant Treasurer
Mr. Brown also serves as an officer of other funds. Mr. Brown serves as Assistant Treasurer of FIMM, LLC (2021-present) and is an employee of Fidelity Investments (2013-present).
John J. Burke III (1964)
Year of Election or Appointment: 2018
Chief Financial Officer
Mr. Burke also serves as Chief Financial Officer of other funds. Mr. Burke serves as Head of Investment Operations for Fidelity Fund and Investment Operations (2018-present) and is an employee of Fidelity Investments (1998-present). Previously Mr. Burke served as head of Asset Management Investment Operations (2012-2018).
William C. Coffey (1969)
Year of Election or Appointment: 2019
Assistant Secretary
Mr. Coffey also serves as Assistant Secretary of other funds. He is Senior Vice President and Deputy General Counsel of FMR LLC (diversified financial services company, 2010-present), and is an employee of Fidelity Investments. Previously, Mr. Coffey served as Secretary and CLO of certain funds (2018-2019); CLO, Secretary, and Senior Vice President of Fidelity Management & Research Company and FMR Co., Inc. (investment adviser firms, 2018-2019); Secretary of Fidelity SelectCo, LLC and Fidelity Investments Money Management, Inc. (investment adviser firms, 2018-2019); CLO of Fidelity Management & Research (Hong Kong) Limited, FMR Investment Management (UK) Limited, and Fidelity Management & Research (Japan) Limited (investment adviser firms, 2018-2019); and Assistant Secretary of certain funds (2009-2018).
Timothy M. Cohen (1969)
Year of Election or Appointment: 2018
Vice President
Mr. Cohen also serves as Vice President of other funds. Mr. Cohen serves as Co-Head of Equity (2018-present), a Director of Fidelity Management & Research (Japan) Limited (investment adviser firm, 2016-present), and is an employee of Fidelity Investments. Previously, Mr. Cohen served as Executive Vice President of Fidelity SelectCo, LLC (2019), Head of Global Equity Research (2016-2018), Chief Investment Officer - Equity and a Director of Fidelity Management & Research (U.K.) Inc. (investment adviser firm, 2013-2015) and as a Director of Fidelity Management & Research (Hong Kong) Limited (investment adviser firm, 2017).
Jonathan Davis (1968)
Year of Election or Appointment: 2010
Assistant Treasurer
Mr. Davis also serves as an officer of other funds. Mr. Davis serves as Assistant Treasurer of FIMM, LLC (2021-present), FMR Capital, Inc. (2017-present), FD Funds GP LLC (2021-present), FD Funds Holding LLC (2021-present), and FD Funds Management LLC (2021-present); and is an employee of Fidelity Investments. Previously, Mr. Davis served as Vice President and Associate General Counsel of FMR LLC (diversified financial services company, 2003-2010).
Laura M. Del Prato (1964)
Year of Election or Appointment: 2018
Assistant Treasurer
Ms. Del Prato also serves as an officer of other funds. Ms. Del Prato serves as Assistant Treasurer of FIMM, LLC (2021-present) and is an employee of Fidelity Investments (2017-present). Previously, Ms. Del Prato served as President and Treasurer of The North Carolina Capital Management Trust: Cash Portfolio and Term Portfolio (2018-2020). Prior to joining Fidelity Investments, Ms. Del Prato served as a Managing Director and Treasurer of the JPMorgan Mutual Funds (2014-2017). Prior to JPMorgan, Ms. Del Prato served as a partner at Cohen Fund Audit Services (accounting firm, 2012-2013) and KPMG LLP (accounting firm, 2004-2012).
Colm A. Hogan (1973)
Year of Election or Appointment: 2020
Assistant Treasurer
Mr. Hogan also serves as an officer of other funds. Mr. Hogan serves as Assistant Treasurer of FIMM, LLC (2021-present) and FMR Capital, Inc. (2017-present) and is an employee of Fidelity Investments (2005-present). Previously, Mr. Hogan served as Deputy Treasurer of certain Fidelity® funds (2016-2020) and Assistant Treasurer of certain Fidelity® funds (2016-2018).
Pamela R. Holding (1964)
Year of Election or Appointment: 2018
Vice President
Ms. Holding also serves as Vice President of other funds. Ms. Holding serves as Co-Head of Equity (2018-present) and is an employee of Fidelity Investments (2013-present). Previously, Ms. Holding served as Executive Vice President of Fidelity SelectCo, LLC (2019) and as Chief Investment Officer of Fidelity Institutional Asset Management (2013-2018).
Cynthia Lo Bessette (1969)
Year of Election or Appointment: 2019
Secretary and Chief Legal Officer (CLO)
Ms. Lo Bessette also serves as an officer of other funds. Ms. Lo Bessette serves as CLO, Secretary, and Senior Vice President of Fidelity Management & Research Company LLC (investment adviser firm, 2019-present); CLO of Fidelity Management & Research (Hong Kong) Limited, FMR Investment Management (UK) Limited, and Fidelity Management & Research (Japan) Limited (investment adviser firms, 2019-present); Secretary of FD Funds GP LLC (2021-present), FD Funds Holding LLC (2021-present), and FD Funds Management LLC (2021-present); and Assistant Secretary of FIMM, LLC (2019-present). She is a Senior Vice President and Deputy General Counsel of FMR LLC (diversified financial services company, 2019-present), and is an employee of Fidelity Investments. Previously, Ms. Lo Bessette served as CLO, Secretary, and Senior Vice President of FMR Co., Inc. (investment adviser firm, 2019); Secretary of Fidelity SelectCo, LLC and Fidelity Investments Money Management, Inc. (investment adviser firms, 2019). Prior to joining Fidelity Investments, Ms. Lo Bessette was Executive Vice President, General Counsel (2016-2019) and Senior Vice President, Deputy General Counsel (2015-2016) of OppenheimerFunds (investment management company) and Deputy Chief Legal Officer (2013-2015) of Jennison Associates LLC (investment adviser firm).
Chris Maher (1972)
Year of Election or Appointment: 2020
Deputy Treasurer
Mr. Maher also serves as an officer of other funds. Mr. Maher serves as Assistant Treasurer of FIMM, LLC (2021-present) and FMR Capital, Inc. (2017-present), and is an employee of Fidelity Investments (2008-present). Previously, Mr. Maher served as Assistant Treasurer of certain funds (2013-2020); Vice President of Asset Management Compliance (2013), Vice President of the Program Management Group of FMR (investment adviser firm, 2010-2013), and Vice President of Valuation Oversight (2008-2010).
Jason P. Pogorelec (1975)
Year of Election or Appointment: 2020
Chief Compliance Officer
Mr. Pogorelec also serves as Chief Compliance Officer of other funds. Mr. Pogorelec is a senior Vice President of Asset Management Compliance for Fidelity Investments and is an employee of Fidelity Investments (2006-present). Previously, Mr. Pogorelec served as Vice President, Associate General Counsel for Fidelity Investments (2010-2020) and Assistant Secretary of certain Fidelity funds (2015-2020).
Brett Segaloff (1972)
Year of Election or Appointment: 2021
Anti-Money Laundering (AML) Officer
Mr. Segaloff also serves as an AML Officer of other funds and other related entities. He is Director, Anti-Money Laundering (2007-present) of FMR LLC (diversified financial services company) and is an employee of Fidelity Investments (1996-present).
Stacie M. Smith (1974)
Year of Election or Appointment: 2018
President and Treasurer
Ms. Smith also serves as an officer of other funds. Ms. Smith serves as Assistant Treasurer of FIMM, LLC (2021-present) and FMR Capital, Inc. (2017-present), is an employee of Fidelity Investments (2009-present), and has served in other fund officer roles. Prior to joining Fidelity Investments, Ms. Smith served as Senior Audit Manager of Ernst & Young LLP (accounting firm, 1996-2009). Previously, Ms. Smith served as Assistant Treasurer (2013-2019) and Deputy Treasurer (2013-2016) of certain Fidelity® funds.
Jim Wegmann (1979)
Year of Election or Appointment: 2019
Assistant Treasurer
Mr. Wegmann also serves as an officer of other funds. Mr. Wegmann serves as Assistant Treasurer of FIMM, LLC (2021-present) and is an employee of Fidelity Investments (2011-present). Previously, Mr. Wegmann served as Assistant Treasurer of certain Fidelity® funds (2019-2021).
Shareholder Expense Example
As a shareholder, you incur two types of costs: (1) transaction costs, which may include sales charges (loads) on purchase payments or redemption proceeds, as applicable and (2) ongoing costs, which generally include management fees, distribution and/or service (12b-1) fees and other Fund expenses. This Example is intended to help you understand your ongoing costs (in dollars) of investing in a fund and to compare these costs with the ongoing costs of investing in other mutual funds.
The Example is based on an investment of $1,000 invested at the beginning of the period and held for the entire period (February 1, 2022 to July 31, 2022).
Actual Expenses
The first line of the accompanying table provides information about actual account values and actual expenses. You may use the information in this line, together with the amount you invested, to estimate the expenses that you paid over the period. Simply divide your account value by $1,000.00 (for example, an $8,600 account value divided by $1,000.00 = 8.6), then multiply the result by the number in the first line for a class/Fund under the heading entitled "Expenses Paid During Period" to estimate the expenses you paid on your account during this period. If any fund is a shareholder of any underlying mutual funds or exchange-traded funds (ETFs) (the Underlying Funds), such fund indirectly bears its proportional share of the expenses of the Underlying Funds in addition to the direct expenses incurred presented in the table. These fees and expenses are not included in the annualized expense ratio used to calculate the expense estimate in the table below.
Hypothetical Example for Comparison Purposes
The second line of the accompanying table provides information about hypothetical account values and hypothetical expenses based on the actual expense ratio and an assumed rate of return of 5% per year before expenses, which is not the actual return. The hypothetical account values and expenses may not be used to estimate the actual ending account balance or expenses you paid for the period. You may use this information to compare the ongoing costs of investing in the Fund and other funds. To do so, compare this 5% hypothetical example with the 5% hypothetical examples that appear in the shareholder reports of the other funds. If any fund is a shareholder of any Underlying Funds, such fund indirectly bears its proportional share of the expenses of the Underlying Funds in addition to the direct expenses as presented in the table. These fees and expenses are not included in the annualized expense ratio used to calculate the expense estimate in the table below.
Please note that the expenses shown in the table are meant to highlight your ongoing costs only and do not reflect any transaction costs. Therefore, the second line of the table is useful in comparing ongoing costs only, and will not help you determine the relative total costs of owning different funds. In addition, if these transactional costs were included, your costs would have been higher.
| | Annualized Expense Ratio-A | Beginning
Account Value
February 1, 2022 | Ending
Account Value
July 31, 2022 | Expenses Paid
During Period-B
February 1, 2022
to July 31, 2022 |
| Fidelity Advisor Global Real Estate Fund | | | | |
| Class A | 1.26% | | | |
| Actual | | $1,000.00 | $914.10 | $5.98 |
| Hypothetical-C | | $1,000.00 | $1,018.55 | $6.31 |
| Class M | 1.50% | | | |
| Actual | | $1,000.00 | $914.00 | $7.12 |
| Hypothetical-C | | $1,000.00 | $1,017.36 | $7.50 |
| Class C | 1.99% | | | |
| Actual | | $1,000.00 | $911.80 | $9.43 |
| Hypothetical-C | | $1,000.00 | $1,014.93 | $9.94 |
| Class I | .99% | | | |
| Actual | | $1,000.00 | $915.80 | $4.70 |
| Hypothetical-C | | $1,000.00 | $1,019.89 | $4.96 |
| Class Z | .89% | | | |
| Actual | | $1,000.00 | $917.10 | $4.23** |
| Hypothetical-C | | $1,000.00 | $1,020.38 | $4.46** |
A Annualized expense ratio reflects expenses net of applicable fee waivers.
B Expenses are equal to the annualized expense ratio, multiplied by the average account value over the period, multiplied by 181/ 365 (to reflect the one-half year period). The fees and expenses of any Underlying Funds are not included in each annualized expense ratio.
C 5% return per year before expenses
** If fees and changes to the expense contract and/ or expense cap, effective June 1, 2022, had been in effect during the entire current period, the restated annualized expense ratio and the expenses paid in the actual and hypothetical examples above would be as shown in table below:
| | Annualized Expense Ratio-(a)
| Expenses Paid
|
| Fidelity Advisor Global Real Estate Fund | | |
| Class Z | .80% | |
| Actual | | $3.80 |
| Hypothetical-(b) | | $4.01 |
(a) Annualized expense ratio reflects expenses net of applicable fee waivers.
(b) 5% return per year before expenses
Distributions (Unaudited)
The dividend and capital gains distributions for the fund are available on Fidelity.com or Institutional.Fidelity.com.
Class A designates 1%; Class M designates 1%; Class C designates 3%; Class I designates 1%; and Class Z designates 1% of the dividend distributed in December, during the fiscal year as qualifying for the dividends–received deduction for corporate shareholders.
Class A designates 46%; Class M designates 54%; Class C designates 100%; Class I designates 39%; and Class Z designates 39% of the dividend distributed in December, during the fiscal year as amounts which may be taken into account as a dividend for purposes of the maximum rate under section 1(h)(11) of the Internal Revenue Code.
Class A designates 55%; Class M designates 47%; and Class I designates 55%; Class Z designates 55% of the dividend distributed in December, during the fiscal year as a section 199A dividend.
The fund will notify shareholders in January 2023 of amounts for use in preparing 2022 income tax returns.
Board Approval of Investment Advisory Contracts and Management Fees
Fidelity Advisor Global Real Estate Fund
Each year, the Board of Trustees, including the Independent Trustees (together, the Board), votes on the renewal of the management contract with Fidelity Management & Research Company LLC (FMR) and the sub-advisory agreements (together, the Advisory Contracts) for the fund. FMR and the sub-advisers are referred to herein as the Investment Advisers. The Board, assisted by the advice of fund counsel and Independent Trustees' counsel, requests and considers a broad range of information relevant to the renewal of the Advisory Contracts throughout the year.
The Board meets regularly and, at each of its meetings, covers an extensive agenda of topics and materials and considers factors that are relevant to its annual consideration of the renewal of the fund's Advisory Contracts, including the services and support provided to the fund and its shareholders. The Board has established various standing committees (Committees), each composed of and chaired by Independent Trustees with varying backgrounds, to which the Board has assigned specific subject matter responsibilities in order to enhance effective decision-making by the Board. The Board, acting directly and through its Committees, requests and receives information concerning the annual consideration of the renewal of the fund's Advisory Contracts. The Board also meets as needed to review matters specifically related to the Board's annual consideration of the renewal of the Advisory Contracts. Members of the Board may also meet with trustees of other Fidelity funds through joint ad hoc committees to discuss certain matters relevant to all of the Fidelity funds.
At its May 2022 meeting, the Board unanimously determined to renew the fund's Advisory Contracts. In reaching its determination, the Board considered all factors it believed relevant, including (i) the nature, extent, and quality of the services provided to the fund and its shareholders (including the investment performance of the fund); (ii) the competitiveness relative to peer funds of the fund's management fee and the total expense ratio of a representative class (Class I); (iii) the total costs of the services provided by and the profits realized by Fidelity from its relationships with the fund; and (iv) the extent to which, if any, economies of scale exist and are realized as the fund grows, and whether any economies of scale are appropriately shared with fund shareholders.
In considering whether to renew the Advisory Contracts for the fund, the Board reached a determination, with the assistance of fund counsel and Independent Trustees' counsel and through the exercise of its business judgment, that the renewal of the Advisory Contracts was in the best interests of the fund and its shareholders and that the compensation payable under the Advisory Contracts was fair and reasonable. The Board's decision to renew the Advisory Contracts was not based on any single factor, but rather was based on a comprehensive consideration of all the information provided to the Board at its meetings throughout the year. The Board, in reaching its determination to renew the Advisory Contracts, was aware that shareholders of the fund have a broad range of investment choices available to them, including a wide choice among funds offered by Fidelity's competitors, and that the fund's shareholders, who have the opportunity to review and weigh the disclosure provided by the fund in its prospectus and other public disclosures, have chosen to invest in this fund, which is part of the Fidelity family of funds.
Nature, Extent, and Quality of Services Provided. The Board considered Fidelity's staffing as it relates to the fund, including the backgrounds of investment personnel of Fidelity, and also considered the fund's investment objective, strategies, and related investment philosophy. The Independent Trustees also had discussions with senior management of Fidelity's investment operations and investment groups. The Board considered the structure of the investment personnel compensation program and whether this structure provides appropriate incentives to act in the best interests of the fund. Additionally, the Board considered the portfolio managers' investments, if any, in the funds that they manage. The Board also considered the steps Fidelity had taken to ensure the continued provision of high quality services to the Fidelity funds during the COVID-19 pandemic, including the expansion of staff in client facing positions to maintain service levels in periods of high volumes and volatility.
Resources Dedicated to Investment Management and Support Services. The Board and the Fund Oversight and Research Committees reviewed the general qualifications and capabilities of Fidelity's investment staff, including its size, education, experience, and resources, as well as Fidelity's approach to recruiting, training, managing, and compensating investment personnel. The Board noted the resources devoted to expansion of Fidelity's global investment organization, and that Fidelity's analysts have extensive resources, tools and capabilities that allow them to conduct sophisticated quantitative and fundamental analysis, as well as credit analysis of issuers, counterparties and guarantors. Further, the Board considered that Fidelity's investment professionals have sufficient access to global information and data so as to provide competitive investment results over time, and that those professionals also have access to sophisticated tools that permit them to assess portfolio construction and risk and performance attribution characteristics continuously, as well as to transmit new information and research conclusions rapidly around the world. Additionally, in its deliberations, the Board considered Fidelity's trading, risk management, compliance, and technology and operations capabilities and resources, which are integral parts of the investment management process.
Shareholder and Administrative Services. The Board considered (i) the nature, extent, quality, and cost of advisory, administrative, and shareholder services performed by the Investment Advisers and their affiliates under the Advisory Contracts and under separate agreements covering transfer agency, pricing and bookkeeping, and securities lending services for the fund; (ii) the nature and extent of the supervision of third party service providers, principally custodians, subcustodians, and pricing vendors; and (iii) the resources devoted to, and the record of compliance with, the fund's compliance policies and procedures. The Board also reviewed the allocation of fund brokerage, including allocations to brokers affiliated with the Investment Advisers, the use of brokerage commissions to pay fund expenses, and the use of "soft" commission dollars to pay for research services.
The Board noted that the growth of fund assets over time across the complex allows Fidelity to reinvest in the development of services designed to enhance the value and convenience of the Fidelity funds as investment vehicles. These services include 24-hour access to account information and market information over the Internet and through telephone representatives, investor education materials and asset allocation tools. The Board also considered that it reviews customer service metrics such as telephone response times, continuity of services on the website and metrics addressing services at Fidelity Investor Centers.
Investment in a Large Fund Family. The Board considered the benefits to shareholders of investing in a Fidelity fund, including the benefits of investing in a fund that is part of a large family of funds offering a variety of investment disciplines and providing a large variety of mutual fund investor services. The Board noted that Fidelity had taken, or had made recommendations that resulted in the Fidelity funds taking, a number of actions over the previous year that benefited particular funds, including: (i) continuing to dedicate additional resources to Fidelity's investment research process, which includes meetings with management of issuers of securities in which the funds invest; (ii) continuing efforts to enhance Fidelity's global research capabilities; (iii) launching new funds and ETFs with innovative structures, strategies and pricing and making other enhancements to meet client needs; (iv) launching new share classes of existing funds; (v) eliminating purchase minimums and broadening eligibility requirements for certain funds and share classes; (vi) reducing management fees and total expenses for certain target date funds and classes and index funds; (vii) lowering expenses for certain existing funds and classes by implementing or lowering expense caps; (viii) rationalizing product lines and gaining increased efficiencies from fund mergers and liquidations; (ix) continuing to develop, acquire and implement systems and technology to improve services to the funds and shareholders, strengthen information security, and increase efficiency; and (x) continuing to implement enhancements to further strengthen Fidelity's product line to increase investors' probability of success in achieving their investment goals, including retirement income goals.
Investment Performance. The Board considered whether the fund has operated in accordance with its investment objective, as well as its record of compliance with its investment restrictions and its performance history.
The Board took into account discussions that occur at Board meetings throughout the year with representatives of the Investment Advisers about fund investment performance. In this regard the Board noted that as part of regularly scheduled fund reviews and other reports to the Board on fund performance, the Board considers annualized return information for the fund for different time periods, measured against an appropriate securities market index (benchmark index) and an appropriate peer group of funds with similar objectives (peer group).The Board also reviews and considers information about performance attribution. In its evaluation of fund investment performance, the Board gave particular attention to information indicating changes in performance of certain Fidelity funds for specific time periods and discussed with the Investment Advisers the reasons for any overperformance or underperformance.
In addition to reviewing absolute and relative fund performance, the Independent Trustees periodically consider the appropriateness of fund performance metrics in evaluating the results achieved. In general, the Independent Trustees believe that fund performance should be evaluated based on net performance (after fees and expenses) of the representative class, compared to appropriate benchmark indices, over appropriate time periods that may include full market cycles, and compared to peer groups, as applicable, over the same periods, taking into account relevant factors including the following: general market conditions; issuer-specific information; and fund cash flows and other factors.
The Independent Trustees recognize that shareholders evaluate performance on a net basis over their own holding periods, for which one-, three-, and five-year periods are often used as a proxy. For this reason, the performance information reviewed by the Board also included net cumulative total return information for the fund and an appropriate benchmark index and peer group for the most recent one- and three-year periods ended September 30, 2021, as shown below. Returns are shown compared to the 25th percentile (top of box, 75% beaten) and 75th percentile (bottom of box, 25% beaten) of the peer universe.
Fidelity Advisor Global Real Estate Fund
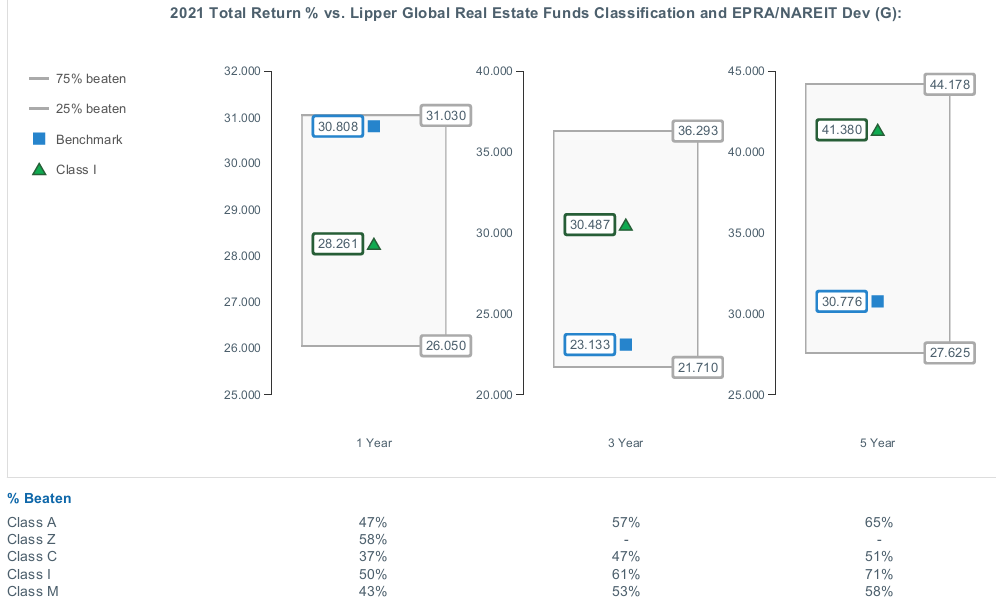
Based on its review, the Board concluded that the nature, extent, and quality of services provided to the fund under the Advisory Contracts should continue to benefit the shareholders of the fund.
Competitiveness of Management Fee and Total Expense Ratio. The Board considered the fund's management fee and total expense ratio compared to "mapped groups" of competitive funds and classes created for the purpose of facilitating the Trustees' competitive analysis of management fees and total expenses. Fidelity creates "mapped groups" by combining similar Lipper investment objective categories that have comparable investment mandates. For this purpose, all sector focused equity funds are grouped in the same mapped group. Combining Lipper investment objective categories aids the Board's management fee and total expense ratio comparisons by broadening the competitive group used for comparison.
Management Fee. The Board considered two proprietary management fee comparisons for the 12-month (or shorter) periods ended September 30 (June 30 for periods ended 2019 and 2018 and December 31 for periods prior to 2018) shown in basis points (BP) in the chart below. The group of Lipper funds used by the Board for management fee comparisons is referred to below as the "Total Mapped Group." The Total Mapped Group is broader than the Lipper peer group used by the Board for performance comparisons because the Total Mapped Group combines several Lipper investment objective categories while the Lipper peer group does not. The Total Mapped Group comparison focuses on a fund's standing in terms of gross management fees before expense reimbursements or caps relative to the total universe of funds with comparable investment mandates (
i.e., sector equities), regardless of whether their management fee structures also are comparable. Funds with comparable management fee structures have similar management fee contractual arrangements (
e.g., flat rate charged for advisory services, all-inclusive fee rate,
etc.). "TMG %" represents the percentage of funds in the Total Mapped Group that had management fees that were lower than the fund's. For example, a hypothetical TMG % of 20% would mean that 80% of the funds in the Total Mapped Group had higher, and 20% had lower, management fees than the fund. The fund's actual TMG %s and the number of funds in the Total Mapped Group are in the chart below. The "Asset-Sized Peer Group" (ASPG) comparison focuses on a fund's standing relative to a subset of non-Fidelity funds within the Total Mapped Group that are similar in size and management fee structure. For example, if a fund is in the first quartile of the ASPG, the fund's management fee ranks in the least expensive or lowest 25% of funds in the ASPG. The ASPG represents at least 15% of the funds in the Total Mapped Group with comparable asset size and management fee structures, subject to a minimum of 50 funds (or all funds in the Total Mapped Group if fewer than 50). Additional information, such as the ASPG quartile in which the fund's management fee rate ranked, is also included in the chart and was considered by the Board.
Fidelity Advisor Global Real Estate Fund
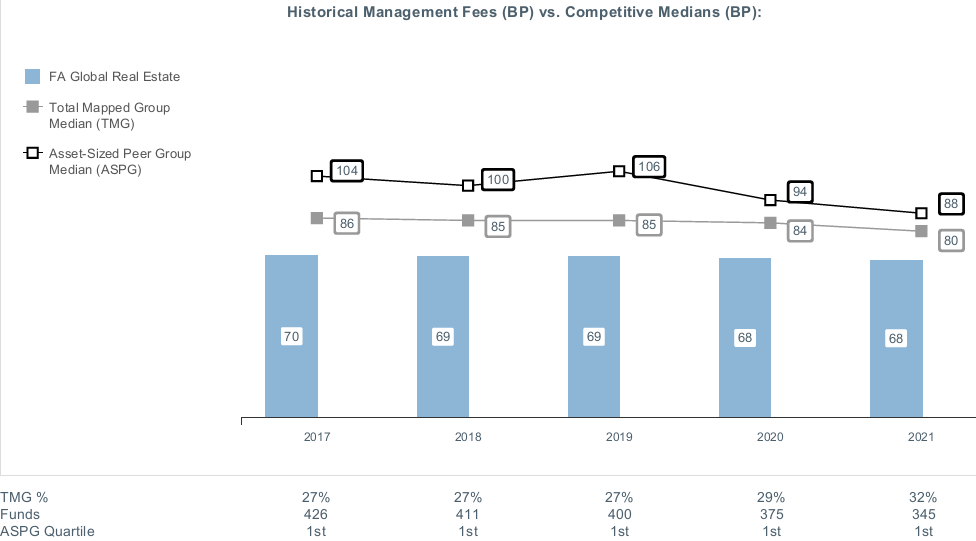
The Board noted that the fund's management fee rate ranked below the median of its Total Mapped Group and below the median of its ASPG for the 12-month period ended September 30, 2021.
The Board also considered that, for funds subject to the group fee, FMR agreed to voluntarily waive fees over a specified period of time in amounts designed to account for assets converted from certain funds to certain collective investment trusts.
Based on its review, the Board concluded that the fund's management fee is fair and reasonable in light of the services that the fund receives and the other factors considered.
Total Expense Ratio. In its review of the total expense ratio of the representative class (Class I), the Board considered the fund's management fee rate as well as other fund or class expenses, as applicable, such as transfer agent fees, pricing and bookkeeping fees, fund-paid 12b-1 fees, and custodial, legal, and audit fees. The Board also noted that Fidelity may agree to waive fees or reimburse expenses from time to time, and the extent to which, if any, it has done so for the fund. The fund's representative class is compared to those funds and classes in the Total Mapped Group (used by the Board for management fee comparisons) that have a similar sales load structure. The Board also considered a total expense ASPG comparison, which focuses on the total expenses of the representative class relative to a subset of non-Fidelity funds within the total expense similar sales load structure group. The total expense ASPG is limited to 15 larger and 15 smaller classes in fund average assets for a total of 30 classes, where possible. The total expense ASPG comparison excludes performance adjustments and fund-paid 12b-1 fees to eliminate variability in fee structures.
The Board noted that the total net expense ratio of Class I ranked above the similar sales load structure group competitive median and below the ASPG competitive median for the 12-month period ended September 30, 2021. The Board considered that, in general, various factors can affect total expense ratios. The Board noted that Class I was above the similar sales load structure group competitive median due to higher other expenses as a result of low asset levels. The Board noted that the fund offers multiple classes, each of which has a different sales load and 12b-1 fee structure, and that the multiple structures are intended to offer a range of pricing options for the intermediary market. The Board also noted that the total expense ratios of the classes vary primarily by the level of their 12b-1 fees, although differences in transfer agent fees may also cause expenses to vary from class to class.
The Board further considered that the investment adviser has contractually agreed to reimburse Class A, Class M, Class C, Class I, and Class Z of the fund to the extent that total operating expenses, with certain exceptions, as a percentage of their respective average net assets, exceed 1.30%, 1.55%, 2.05%,1.05%, and 0.90% through November 30, 2022.
Fees Charged to Other Fidelity Clients. The Board also considered Fidelity fee structures and other information with respect to clients of Fidelity, such as other funds advised or subadvised by Fidelity, pension plan clients, and other institutional clients with similar mandates. The Board noted that a joint ad hoc committee created by it and the boards of other Fidelity funds periodically reviews and compares Fidelity's institutional investment advisory business with its business of providing services to the Fidelity funds and also noted the most recent findings of the committee. The Board noted that the committee's review included a consideration of the differences in services provided, fees charged, and costs incurred, as well as competition in the markets serving the different categories of clients.
Based on its review of total expense ratios and fees charged to other Fidelity clients, the Board concluded that the total expense ratio of each class of the fund was reasonable in light of the services that the fund and its shareholders receive and the other factors considered.
Costs of the Services and Profitability. The Board considered the revenues earned and the expenses incurred by Fidelity in conducting the business of developing, marketing, distributing, managing, administering and servicing the fund and servicing the fund's shareholders. The Board also considered the level of Fidelity's profits in respect of all the Fidelity funds.
On an annual basis, Fidelity presents to the Board information about the profitability of its relationships with the fund. Fidelity calculates profitability information for each fund, as well as aggregate profitability information for groups of Fidelity funds and all Fidelity funds, using a series of detailed revenue and cost allocation methodologies which originate with the books and records of Fidelity on which Fidelity's audited financial statements are based. The Audit Committee of the Board reviews any significant changes from the prior year's methodologies and the full Board approves such changes.
A public accounting firm has been engaged annually by the Board as part of the Board's assessment of Fidelity's profitability analysis. The engagement includes the review and assessment of the methodologies used by Fidelity in determining the revenues and expenses attributable to Fidelity's mutual fund business, and completion of agreed-upon procedures in respect of the mathematical accuracy of certain fund profitability information and its conformity to established allocation methodologies. After considering the reports issued under the engagement and information provided by Fidelity, the Board concluded that while other allocation methods may also be reasonable, Fidelity's profitability methodologies are reasonable in all material respects.
The Board also reviewed Fidelity's non-fund businesses and potential indirect benefits such businesses may have received as a result of their association with Fidelity's mutual fund business (i.e., fall-out benefits) as well as cases where Fidelity's affiliates may benefit from the funds' business. The Board considered areas where potential indirect benefits to the Fidelity funds from their relationships with Fidelity may exist. The Board's consideration of these matters was informed by the findings of a joint ad hoc committee created by it and the boards of other Fidelity funds to evaluate potential fall-out benefits.
The Board considered the costs of the services provided by and the profits realized by Fidelity in connection with the operation of the fund and was satisfied that the profitability was not excessive.
Economies of Scale. The Board considered whether there have been economies of scale in respect of the management of the Fidelity funds, whether the Fidelity funds (including the fund) have appropriately benefited from any such economies of scale, and whether there is potential for realization of any further economies of scale. The Board considered the extent to which the fund will benefit from economies of scale as assets grow through increased services to the fund, through waivers or reimbursements, or through fee or expense ratio reductions. The Board also noted that a committee (the Economies of Scale Committee) created by it and the boards of other Fidelity funds periodically analyzes whether Fidelity attains economies of scale in respect of the management and servicing of the Fidelity funds, whether the Fidelity funds have appropriately benefited from such economies of scale, and whether there is potential for realization of any further economies of scale.
The Board recognized that the fund's management contract incorporates a "group fee" structure, which provides for lower group fee rates as total "group assets" increase, and for higher group fee rates as total "group assets" decrease ("group assets" as defined in the management contract). FMR calculates the group fee rates based on a tiered asset "breakpoint" schedule that varies based on asset class. The Board considered that the group fee is designed to deliver the benefits of economies of scale to fund shareholders when total Fidelity fund assets increase, even if assets of any particular fund are unchanged or have declined, because some portion of Fidelity's costs are attributable to services provided to all Fidelity funds, and all funds benefit if those costs can be allocated among more assets. The Board further considered that Fidelity agreed to impose a temporary fee waiver in the form of additional breakpoints to the current breakpoint schedule. The Board concluded that, given the group fee structure, fund shareholders will benefit from lower management fees as "group assets" increase at the fund complex level, regardless of whether Fidelity achieves any such economies of scale.
The Board concluded, taking into account the analysis of the Economies of Scale Committee, that economies of scale, if any, are being appropriately shared between fund shareholders and Fidelity.
Additional Information Requested by the Board. In order to develop fully the factual basis for consideration of the Fidelity funds' advisory contracts, the Board requested and received additional information on certain topics, including: (i) fund flow and performance trends, in particular the underperformance of certain funds and strategies, and Fidelity's long-term strategies for certain funds, including any consideration of fund liquidations or mergers; (ii) the operation of performance fees, competitor use of performance fees, and consideration of the expansion of performance fees to additional funds; (iii) Fidelity's pricing philosophy compared to competitors; (iv) fund profitability methodology and data; (v) evaluation of competitive fund data and peer group classifications and fee and expense comparisons; (vi) the management fee and expense structures for different funds and classes and information about the differences between various fee and expense structures; (vii) group fee breakpoints and related voluntary fee waivers; and (viii) information regarding other accounts managed by Fidelity and the funds' sub-advisory arrangements.
Based on its evaluation of all of the conclusions noted above, and after considering all factors it believed relevant, the Board concluded that the advisory fee arrangements are fair and reasonable and that the fund's Advisory Contracts should be renewed.
Liquidity Risk Management Program
The Securities and Exchange Commission adopted Rule 22e-4 under the Investment Company Act of 1940 (the Liquidity Rule) to promote effective liquidity risk management throughout the open-end investment company industry, thereby reducing the risk that funds will be unable to meet their redemption obligations and mitigating dilution of the interests of fund shareholders.
The Fund has adopted and implemented a liquidity risk management program pursuant to the Liquidity Rule (the Program) effective December 1, 2018. The Program is reasonably designed to assess and manage the Fund’s liquidity risk and to comply with the requirements of the Liquidity Rule. The Fund’s Board of Trustees (the Board) has designated the Fund’s investment adviser as administrator of the Program. The Fidelity advisers have established a Liquidity Risk Management Committee (the LRM Committee) to manage the Program for each of the Fidelity Funds. The LRM Committee monitors the adequacy and effectiveness of implementation of the Program and on a periodic basis assesses each Fund’s liquidity risk based on a variety of factors including (1) the Fund’s investment strategy, (2) portfolio liquidity and cash flow projections during normal and reasonably foreseeable stressed conditions, (3) shareholder redemptions, (4) borrowings and other funding sources and (5) in the case of exchange-traded funds, certain additional factors including the effect of the Fund’s prices and spreads, market participants, and basket compositions on the overall liquidity of the Fund’s portfolio, as applicable.
In accordance with the Program, each of the Fund’s portfolio investments is classified into one of four liquidity categories described below based on a determination of a reasonable expectation for how long it would take to convert the investment to cash (or sell or dispose of the investment) without significantly changing its market value.
- Highly liquid investments – cash or convertible to cash within three business days or less
- Moderately liquid investments – convertible to cash in three to seven calendar days
- Less liquid investments – can be sold or disposed of, but not settled, within seven calendar days
- Illiquid investments – cannot be sold or disposed of within seven calendar days
Liquidity classification determinations take into account a variety of factors including various market, trading and investment-specific considerations, as well as market depth, and generally utilize analysis from a third-party liquidity metrics service.
The Liquidity Rule places a 15% limit on a fund’s illiquid investments and requires funds that do not primarily hold assets that are highly liquid investments to determine and maintain a minimum percentage of the fund’s net assets to be invested in highly liquid investments (highly liquid investment minimum or HLIM). The Program includes provisions reasonably designed to comply with the 15% limit on illiquid investments and for determining, periodically reviewing and complying with the HLIM requirement as applicable.
At a recent meeting of the Fund’s Board of Trustees, the LRM Committee provided a written report to the Board pertaining to the operation, adequacy, and effectiveness of implementation of the Program for the annual period from December 1, 2020 through November 30, 2021. The report concluded that the Program has been implemented and is operating effectively and is reasonably designed to assess and manage the Fund’s liquidity risk.
AGRE-ANN-0922
1.9881280.105
Fidelity Advisor® Real Estate Fund
Annual Report
July 31, 2022
Contents
To view a fund's proxy voting guidelines and proxy voting record for the 12-month period ended June 30, visit http://www.fidelity.com/proxyvotingresults or visit the Securities and Exchange Commission's (SEC) web site at http://www.sec.gov.
You may also call 1-877-208-0098 to request a free copy of the proxy voting guidelines.
Standard & Poor's, S&P and S&P 500 are registered service marks of The McGraw-Hill Companies, Inc. and have been licensed for use by Fidelity Distributors Corporation.
Other third-party marks appearing herein are the property of their respective owners.
All other marks appearing herein are registered or unregistered trademarks or service marks of FMR LLC or an affiliated company. © 2022 FMR LLC. All rights reserved.
This report and the financial statements contained herein are submitted for the general information of the shareholders of the Fund. This report is not authorized for distribution to prospective investors in the Fund unless preceded or accompanied by an effective prospectus.
A fund files its complete schedule of portfolio holdings with the SEC for the first and third quarters of each fiscal year on Form N-PORT. Forms N-PORT are available on the SEC’s web site at http://www.sec.gov. A fund's Forms N-PORT may be reviewed and copied at the SEC’s Public Reference Room in Washington, DC. Information regarding the operation of the SEC's Public Reference Room may be obtained by calling 1-800-SEC-0330.
For a complete list of a fund's portfolio holdings, view the most recent holdings listing, semiannual report, or annual report on Fidelity's web site at http://www.fidelity.com, http://www.institutional.fidelity.com, or http://www.401k.com, as applicable.
NOT FDIC INSURED •MAY LOSE VALUE •NO BANK GUARANTEE
Neither the Fund nor Fidelity Distributors Corporation is a bank.
Note to Shareholders:
Early in 2020, the outbreak and spread of COVID-19 emerged as a public health emergency that had a major influence on financial markets, primarily based on its impact on the global economy and corporate earnings. On March 11, 2020, the World Health Organization declared the COVID-19 outbreak a pandemic, citing sustained risk of further global spread. The pandemic prompted a number of measures to limit the spread of COVID-19, including travel and border restrictions, quarantines, and restrictions on large gatherings. In turn, these resulted in lower consumer activity, diminished demand for a wide range of products and services, disruption in manufacturing and supply chains, and – given the wide variability in outcomes regarding the outbreak – significant market uncertainty and volatility. To help stem the turmoil, the U.S. government took unprecedented action – in concert with the U.S. Federal Reserve and central banks around the world – to help support consumers, businesses, and the broader economy, and to limit disruption to the financial system.
In general, the overall impact of the pandemic lessened in 2021, amid a resilient economy and widespread distribution of three COVID-19 vaccines granted emergency use authorization from the U.S. Food and Drug Administration (FDA) early in the year. Still, the situation remains dynamic, and the extent and duration of its influence on financial markets and the economy is highly uncertain, due in part to a recent spike in cases based on highly contagious variants of the coronavirus.
Extreme events such as the COVID-19 crisis are exogenous shocks that can have significant adverse effects on mutual funds and their investments. Although multiple asset classes may be affected by market disruption, the duration and impact may not be the same for all types of assets. Fidelity is committed to helping you stay informed amid news about COVID-19 and during increased market volatility, and we continue to take extra steps to be responsive to customer needs. We encourage you to visit us online, where we offer ongoing updates, commentary, and analysis on the markets and our funds.
Performance: The Bottom Line
Average annual total return reflects the change in the value of an investment, assuming reinvestment of distributions from dividend income and capital gains (the profits earned upon the sale of securities that have grown in value, if any) and assuming a constant rate of performance each year. The hypothetical investment and the average annual total returns do not reflect the deduction of taxes that a shareholder would pay on fund distributions or the redemption of fund shares. During periods of reimbursement by Fidelity, a fund’s total return will be greater than it would be had the reimbursement not occurred. How a fund did yesterday is no guarantee of how it will do tomorrow.
Average Annual Total Returns
| For the periods ended July 31, 2022 | Past 1 year | Past 5 years | Past 10 years |
| Class A (incl. 5.75% sales charge) | (11.07)% | 3.88% | 6.01% |
| Class M (incl. 3.50% sales charge) | (9.12)% | 4.15% | 6.02% |
| Class C (incl. contingent deferred sales charge) | (7.23)% | 4.29% | 5.98% |
| Class I | (5.43)% | 5.37% | 6.91% |
| Class Z | (5.21)% | 5.54% | 6.99% |
Class C shares' contingent deferred sales charges included in the past one year, past five years and past ten years total return figures are 1%, 0% and 0%, respectively.
The initial offering of Class Z shares took place on October 2, 2018. Returns prior to October 2, 2018, are those of Class I.
$10,000 Over 10 Years
Let's say hypothetically that $10,000 was invested in Fidelity Advisor® Real Estate Fund - Class A on July 31, 2012, and the current 5.75% sales charge was paid.
The chart shows how the value of your investment would have changed, and also shows how the S&P 500® Index performed over the same period.
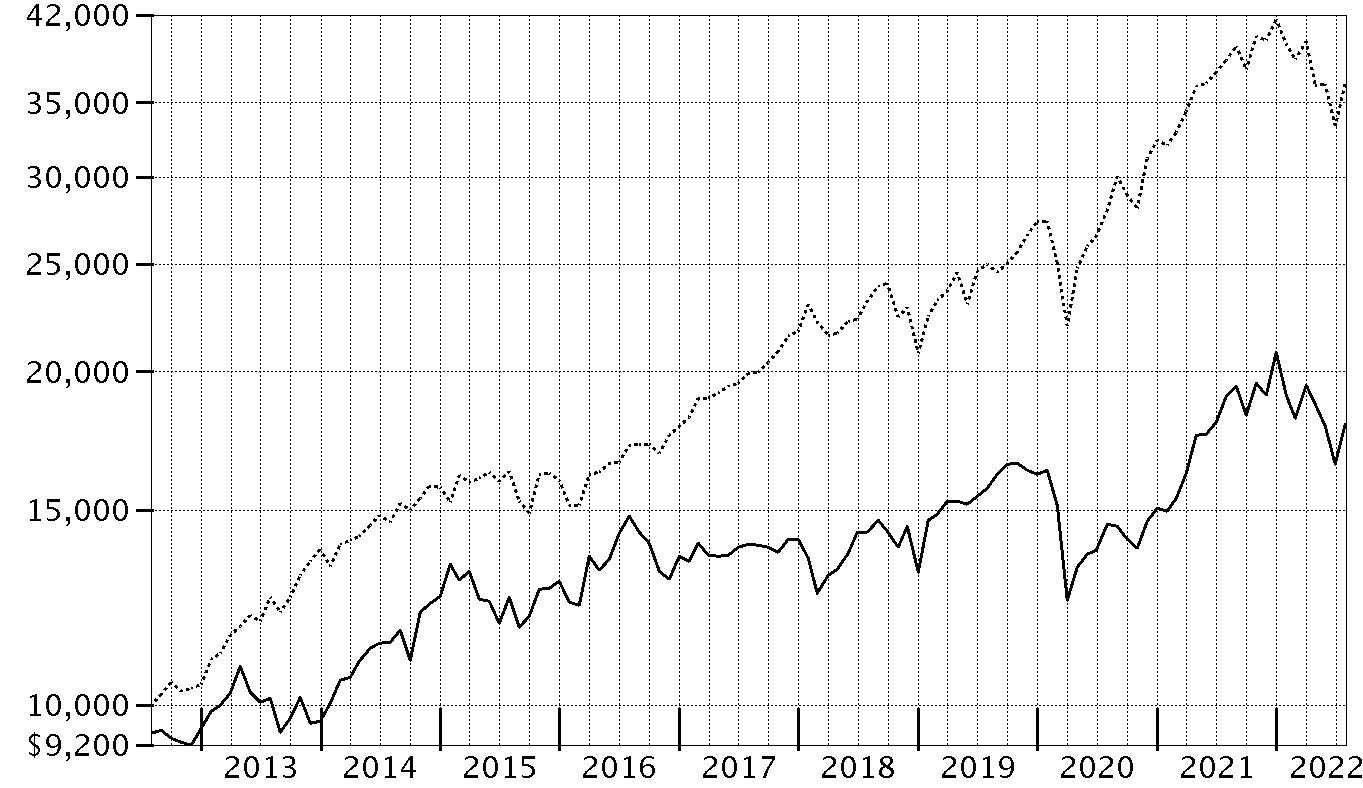
| Period Ending Values |
| $17,920 | Fidelity Advisor® Real Estate Fund - Class A |
| $36,428 | S&P 500® Index |
Management's Discussion of Fund Performance
Market Recap: The S&P 500
® index returned -4.64% for the 12 months ending July 31, 2022, as a multitude of crosscurrents challenged the global economy and financial markets. Persistently high inflation, exacerbated by energy price shocks from the Russia–Ukraine conflict, spurred the U.S. Federal Reserve to hike interest rates more aggressively than anticipated, and concerns about the outlook for economic growth sent stocks into bear market territory. In early May, the Fed approved a rare half-percentage-point interest rate increase and announced plans to shrink its $9 trillion asset portfolio. June began with the Fed allowing up to billions in Treasuries and mortgage bonds to mature every month without investing the proceeds. Two weeks later, the central bank raised rates by 0.75 percentage points, its largest increase since 1994, and said it was becoming more difficult to achieve a soft landing, in which the economy slows enough to bring down inflation while avoiding a recession. Against this volatile backdrop, the S&P 500 posted its worst first-half result (-19.96%) to begin a year since 1970. Stocks sharply reversed course in July (+9.22%), as the Fed again raised its benchmark interest rate by 0.75% but signaled that, at some point, it will likely slow the pace of tightening to assess the impact on the economy. For the full 12 months, growth-oriented communication services (-29%) and consumer discretionary (-10%) stocks lagged most. In contrast, energy (+67%) rode a surge in commodity prices and led by a wide margin, followed by the defensive utilities (+16%) and consumer staples (+7%) sectors.
Comments from Portfolio Manager Samuel Wald: For the fiscal year ending July 31, 2022, the fund's share classes (excluding sales charges, if applicable) returned roughly -6% to -5%, underperforming the -4.24% result of the MSCI US IMI Real Estate 25/50 Linked Index, as well as the broad-based S&P 500
® index. The primary detractor from performance versus the sector index was our security selection among specialized REITs. Subpar picks in the casinos & gaming and hotel & resort REIT categories also hurt, as did a combination of weak picks and an unhelpful overweighting in the lagging real estate operating companies category. Smaller-than-index exposure to Public Storage (+11%), a position we established this period, was the fund's largest individual relative detractor the past year. An outsized stake in WeWork (-60%), also a position we established during the period, hampered performance on a relative basis, as well. Avoiding Realty Income, an index component that gained 13%, further pressured the portfolio’s relative result. In contrast, by far the biggest contributor to performance versus the sector index proved to be investment choices among real estate services firms. An underweight in office REITs and security selection among health care REITs also bolstered the fund's relative performance. Not owning Zillow, an index component that returned roughly -66%, was the biggest individual relative contributor. Further aiding relative performance was our underweight stake in Equinix, which returned -13% and was among the biggest holdings as of July 31. Another notable relative contributor was a smaller-than-index position in Crown Castle (-3%), though it was still among the fund's largest holdings.
The views expressed above reflect those of the portfolio manager(s) only through the end of the period as stated on the cover of this report and do not necessarily represent the views of Fidelity or any other person in the Fidelity organization. Any such views are subject to change at any time based upon market or other conditions and Fidelity disclaims any responsibility to update such views. These views may not be relied on as investment advice and, because investment decisions for a Fidelity fund are based on numerous factors, may not be relied on as an indication of trading intent on behalf of any Fidelity fund.
Investment Summary (Unaudited)
Top Ten Stocks as of July 31, 2022
| | % of fund's net assets |
| American Tower Corp. | 9.5 |
| Crown Castle International Corp. | 8.3 |
| Prologis (REIT), Inc. | 7.3 |
| CubeSmart | 6.9 |
| Equinix, Inc. | 6.1 |
| Ventas, Inc. | 5.1 |
| Mid-America Apartment Communities, Inc. | 4.8 |
| Essex Property Trust, Inc. | 4.2 |
| CBRE Group, Inc. | 4.2 |
| Equity Lifestyle Properties, Inc. | 3.4 |
| | 59.8 |
Top Five REIT Sectors as of July 31, 2022
| | % of fund's net assets |
| REITs - Diversified | 21.0 |
| REITs - Apartments | 13.1 |
| REITs - Warehouse/Industrial | 10.6 |
| REITs - Management/Investment | 9.5 |
| REITs - Health Care | 8.3 |
Asset Allocation (% of fund's net assets)
| As of July 31, 2022 |
| | Stocks | 99.7% |
| | Short-Term Investments and Net Other Assets (Liabilities) | 0.3% |

Schedule of Investments July 31, 2022
Showing Percentage of Net Assets
| Common Stocks - 99.7% | | | |
| | | Shares | Value |
| Commercial Services & Supplies - 0.5% | | | |
| REITs - Diversified - 0.5% | | | |
| CoreCivic, Inc. (a) | | 190,400 | $2,050,608 |
| Equity Real Estate Investment Trusts (REITs) - 89.6% | | | |
| REITs - Apartments - 13.1% | | | |
| Essex Property Trust, Inc. | | 60,547 | 17,348,532 |
| Invitation Homes, Inc. | | 356,400 | 13,910,292 |
| Mid-America Apartment Communities, Inc. | | 106,000 | 19,687,380 |
| UDR, Inc. | | 58,000 | 2,807,200 |
| | | | 53,753,404 |
| REITs - Diversified - 21.0% | | | |
| Crown Castle International Corp. | | 188,100 | 33,982,146 |
| Duke Realty Corp. | | 192,900 | 12,067,824 |
| Equinix, Inc. | | 35,500 | 24,982,770 |
| VICI Properties, Inc. | | 375,300 | 12,831,507 |
| Washington REIT (SBI) | | 102,500 | 2,272,425 |
| | | | 86,136,672 |
| REITs - Health Care - 8.3% | | | |
| Healthcare Trust of America, Inc. | | 57,000 | 1,496,250 |
| Ventas, Inc. | | 389,205 | 20,931,445 |
| Welltower, Inc. | | 135,600 | 11,707,704 |
| | | | 34,135,399 |
| REITs - Hotels - 3.8% | | | |
| RLJ Lodging Trust | | 498,926 | 6,231,586 |
| Ryman Hospitality Properties, Inc. (a) | | 107,400 | 9,509,196 |
| | | | 15,740,782 |
| REITs - Management/Investment - 9.5% | | | |
| American Tower Corp. | | 143,400 | 38,837,022 |
| REITs - Manufactured Homes - 3.4% | | | |
| Equity Lifestyle Properties, Inc. | | 192,206 | 14,130,985 |
| REITs - Office Property - 3.4% | | | |
| Alexandria Real Estate Equities, Inc. | | 56,900 | 9,432,882 |
| Douglas Emmett, Inc. | | 191,400 | 4,524,696 |
| | | | 13,957,578 |
| REITs - Shopping Centers - 4.2% | | | |
| Phillips Edison & Co., Inc. (b) | | 122,000 | 4,152,880 |
| SITE Centers Corp. | | 531,100 | 7,759,371 |
| Urban Edge Properties | | 321,700 | 5,285,531 |
| | | | 17,197,782 |
| REITs - Single Tenant - 4.3% | | | |
| Four Corners Property Trust, Inc. | | 398,500 | 11,648,155 |
| Spirit Realty Capital, Inc. | | 133,100 | 5,901,654 |
| | | | 17,549,809 |
| REITs - Storage - 8.0% | | | |
| CubeSmart | | 620,900 | 28,480,683 |
| Public Storage | | 13,500 | 4,406,535 |
| | | | 32,887,218 |
| REITs - Warehouse/Industrial - 10.6% | | | |
| EastGroup Properties, Inc. | | 55,300 | 9,430,862 |
| Prologis (REIT), Inc. | | 226,554 | 30,031,998 |
| Terreno Realty Corp. | | 63,600 | 3,984,540 |
| | | | 43,447,400 |
|
| TOTAL EQUITY REAL ESTATE INVESTMENT TRUSTS (REITS) | | | 367,774,051 |
|
| Hotels, Restaurants & Leisure - 0.7% | | | |
| Casinos & Gaming - 0.7% | | | |
| Caesars Entertainment, Inc. (a) | | 62,990 | 2,878,013 |
| IT Services - 1.5% | | | |
| Internet Services & Infrastructure - 1.5% | | | |
| Cyxtera Technologies, Inc. (a)(c) | | 180,025 | 2,194,505 |
| Cyxtera Technologies, Inc. Class A (a) | | 324,800 | 3,959,312 |
| | | | 6,153,817 |
| Real Estate Management & Development - 7.4% | | | |
| Real Estate Operating Companies - 2.0% | | | |
| Digitalbridge Group, Inc. (a) | | 782,900 | 4,290,292 |
| WeWork, Inc. (a)(b) | | 778,600 | 3,713,922 |
| | | | 8,004,214 |
| Real Estate Services - 5.4% | | | |
| CBRE Group, Inc. (a) | | 201,700 | 17,269,554 |
| Jones Lang LaSalle, Inc. (a) | | 26,500 | 5,052,755 |
| | | | 22,322,309 |
|
| TOTAL REAL ESTATE MANAGEMENT & DEVELOPMENT | | | 30,326,523 |
|
| TOTAL COMMON STOCKS | | | |
| (Cost $310,636,251) | | | 409,183,012 |
|
| Money Market Funds - 1.7% | | | |
| Fidelity Cash Central Fund 2.01% (d) | | 1,565,406 | 1,565,719 |
| Fidelity Securities Lending Cash Central Fund 2.01% (d)(e) | | 5,186,481 | 5,187,000 |
| TOTAL MONEY MARKET FUNDS | | | |
| (Cost $6,752,719) | | | 6,752,719 |
| TOTAL INVESTMENT IN SECURITIES - 101.4% | | | |
| (Cost $317,388,970) | | | 415,935,731 |
| NET OTHER ASSETS (LIABILITIES) - (1.4)% | | | (5,616,448) |
| NET ASSETS - 100% | | | $410,319,283 |
Legend
(a) Non-income producing
(b) Security or a portion of the security is on loan at period end.
(c) Restricted securities (including private placements) - Investment in securities not registered under the Securities Act of 1933 (excluding 144A issues). At the end of the period, the value of restricted securities (excluding 144A issues) amounted to $2,194,505 or 0.5% of net assets.
(d) Affiliated fund that is generally available only to investment companies and other accounts managed by Fidelity Investments. The rate quoted is the annualized seven-day yield of the fund at period end. A complete unaudited listing of the fund's holdings as of its most recent quarter end is available upon request. In addition, each Fidelity Central Fund's financial statements, which are not covered by the Fund's Report of Independent Registered Public Accounting Firm, are available on the SEC's website or upon request.
(e) Investment made with cash collateral received from securities on loan.
Additional information on each restricted holding is as follows:
| Security | Acquisition Date | Acquisition Cost |
| Cyxtera Technologies, Inc. | 2/21/21 | $1,800,250 |
Affiliated Central Funds
Fiscal year to date information regarding the Fund's investments in Fidelity Central Funds, including the ownership percentage, is presented below.
| Fund | Value, beginning of period | Purchases | Sales Proceeds | Dividend Income | Realized Gain/Loss | Change in Unrealized appreciation (depreciation) | Value, end of period | % ownership, end of period |
| Fidelity Cash Central Fund 2.01% | $-- | $97,978,751 | $96,413,032 | $5,629 | $-- | $-- | $1,565,719 | 0.0% |
| Fidelity Securities Lending Cash Central Fund 2.01% | 1,593,150 | 45,062,028 | 41,468,178 | 117,807 | -- | -- | 5,187,000 | 0.0% |
| Total | $1,593,150 | $143,040,779 | $137,881,210 | $123,436 | $-- | $-- | $6,752,719 | |
Amounts in the income column in the above table include any capital gain distributions from underlying funds, which are presented in the corresponding line-item in the Statement of Operations, if applicable. Amount for Fidelity Securities Lending Cash Central Fund represents the income earned on investing cash collateral, less rebates paid to borrowers and any lending agent fees associated with the loan, plus any premium payments received for lending certain types of securities.
Investment Valuation
The following is a summary of the inputs used, as of July 31, 2022, involving the Fund's assets and liabilities carried at fair value. The inputs or methodology used for valuing securities may not be an indication of the risk associated with investing in those securities. For more information on valuation inputs, and their aggregation into the levels used below, please refer to the Investment Valuation section in the accompanying Notes to Financial Statements.
| | Valuation Inputs at Reporting Date: |
| Description | Total | Level 1 | Level 2 | Level 3 |
| Investments in Securities: | | | | |
| Common Stocks | $409,183,012 | $409,183,012 | $-- | $-- |
| Money Market Funds | 6,752,719 | 6,752,719 | -- | -- |
| Total Investments in Securities: | $415,935,731 | $415,935,731 | $-- | $-- |
See accompanying notes which are an integral part of the financial statements.
Financial Statements
Statement of Assets and Liabilities
| | | July 31, 2022 |
| Assets | | |
Investment in securities, at value (including securities loaned of $4,988,970) — See accompanying schedule:
Unaffiliated issuers (cost $310,636,251) | $409,183,012 | |
| Fidelity Central Funds (cost $6,752,719) | 6,752,719 | |
| Total Investment in Securities (cost $317,388,970) | | $415,935,731 |
| Cash | | 530,325 |
| Receivable for investments sold | | 592,868 |
| Receivable for fund shares sold | | 101,893 |
| Dividends receivable | | 210,545 |
| Distributions receivable from Fidelity Central Funds | | 39,955 |
| Prepaid expenses | | 2,095 |
| Other receivables | | 76,253 |
| Total assets | | 417,489,665 |
| Liabilities | | |
| Payable for investments purchased | $848,945 | |
| Payable for fund shares redeemed | 681,521 | |
| Accrued management fee | 170,857 | |
| Distribution and service plan fees payable | 73,744 | |
| Other affiliated payables | 86,135 | |
| Other payables and accrued expenses | 122,180 | |
| Collateral on securities loaned | 5,187,000 | |
| Total liabilities | | 7,170,382 |
| Net Assets | | $410,319,283 |
| Net Assets consist of: | | |
| Paid in capital | | $276,805,582 |
| Total accumulated earnings (loss) | | 133,513,701 |
| Net Assets | | $410,319,283 |
| Net Asset Value and Maximum Offering Price | | |
| Class A: | | |
| Net Asset Value and redemption price per share ($122,949,078 ÷ 5,600,274 shares)(a) | | $21.95 |
| Maximum offering price per share (100/94.25 of $21.95) | | $23.29 |
| Class M: | | |
| Net Asset Value and redemption price per share ($100,891,759 ÷ 4,613,429 shares)(a) | | $21.87 |
| Maximum offering price per share (100/96.50 of $21.87) | | $22.66 |
| Class C: | | |
| Net Asset Value and offering price per share ($12,374,688 ÷ 589,287 shares)(a) | | $21.00 |
| Class I: | | |
| Net Asset Value, offering price and redemption price per share ($160,564,877 ÷ 7,212,549 shares) | | $22.26 |
| Class Z: | | |
| Net Asset Value, offering price and redemption price per share ($13,538,881 ÷ 607,381 shares) | | $22.29 |
(a) Redemption price per share is equal to net asset value less any applicable contingent deferred sales charge.
See accompanying notes which are an integral part of the financial statements.
Statement of Operations
| | | Year ended July 31, 2022 |
| Investment Income | | |
| Dividends | | $9,164,450 |
| Income from Fidelity Central Funds (including $117,807 from security lending) | | 123,436 |
| Total income | | 9,287,886 |
| Expenses | | |
| Management fee | $2,421,227 | |
| Transfer agent fees | 1,058,912 | |
| Distribution and service plan fees | 1,034,996 | |
| Accounting fees | 177,148 | |
| Custodian fees and expenses | 17,516 | |
| Independent trustees' fees and expenses | 1,542 | |
| Registration fees | 77,266 | |
| Audit | 52,184 | |
| Legal | 868 | |
| Interest | 1,003 | |
| Miscellaneous | 2,442 | |
| Total expenses before reductions | 4,845,104 | |
| Expense reductions | (14,437) | |
| Total expenses after reductions | | 4,830,667 |
| Net investment income (loss) | | 4,457,219 |
| Realized and Unrealized Gain (Loss) | | |
| Net realized gain (loss) on: | | |
| Investment securities: | | |
| Unaffiliated issuers | 46,296,510 | |
| Total net realized gain (loss) | | 46,296,510 |
| Change in net unrealized appreciation (depreciation) on investment securities | | (77,776,668) |
| Net gain (loss) | | (31,480,158) |
| Net increase (decrease) in net assets resulting from operations | | $(27,022,939) |
See accompanying notes which are an integral part of the financial statements.
Statement of Changes in Net Assets
| | Year ended July 31, 2022 | Year ended July 31, 2021 |
| Increase (Decrease) in Net Assets | | |
| Operations | | |
| Net investment income (loss) | $4,457,219 | $5,417,710 |
| Net realized gain (loss) | 46,296,510 | 17,595,635 |
| Change in net unrealized appreciation (depreciation) | (77,776,668) | 93,330,329 |
| Net increase (decrease) in net assets resulting from operations | (27,022,939) | 116,343,674 |
| Distributions to shareholders | (28,289,351) | (14,644,950) |
| Share transactions - net increase (decrease) | (21,794,093) | (39,011,402) |
| Total increase (decrease) in net assets | (77,106,383) | 62,687,322 |
| Net Assets | | |
| Beginning of period | 487,425,666 | 424,738,344 |
| End of period | $410,319,283 | $487,425,666 |
See accompanying notes which are an integral part of the financial statements.
Financial Highlights
Fidelity Advisor Real Estate Fund Class A
| Years ended July 31, | 2022 | 2021 | 2020 | 2019 | 2018 |
| Selected Per–Share Data | | | | | |
| Net asset value, beginning of period | $24.66 | $19.62 | $22.91 | $22.07 | $22.96 |
| Income from Investment Operations | | | | | |
| Net investment income (loss)A,B | .22 | .26 | .41 | .37 | .37 |
| Net realized and unrealized gain (loss) | (1.47) | 5.50 | (1.91) | 1.63 | .21 |
| Total from investment operations | (1.25) | 5.76 | (1.50) | 2.00 | .58 |
| Distributions from net investment income | (.17) | (.24) | (.38) | (.43) | (.36) |
| Distributions from net realized gain | (1.30) | (.48) | (1.41) | (.73) | (1.11) |
| Total distributions | (1.46)C | (.72) | (1.79) | (1.16) | (1.47) |
| Net asset value, end of period | $21.95 | $24.66 | $19.62 | $22.91 | $22.07 |
| Total ReturnD,E | (5.65)% | 30.38% | (7.21)% | 9.62% | 2.55% |
| Ratios to Average Net AssetsB,F,G | | | | | |
| Expenses before reductions | 1.07% | 1.09% | 1.10% | 1.10% | 1.10% |
| Expenses net of fee waivers, if any | 1.07% | 1.09% | 1.10% | 1.09% | 1.10% |
| Expenses net of all reductions | 1.07% | 1.08% | 1.09% | 1.09% | 1.10% |
| Net investment income (loss) | .95% | 1.24% | 1.93% | 1.68% | 1.70% |
| Supplemental Data | | | | | |
| Net assets, end of period (000 omitted) | $122,949 | $138,134 | $115,736 | $151,536 | $161,570 |
| Portfolio turnover rateH | 48% | 53% | 56% | 49% | 41% |
A Calculated based on average shares outstanding during the period.
B Net investment income (loss) is affected by the timing of the declaration of dividends by any underlying mutual funds or exchange-traded funds (ETFs). Net investment income (loss) of any such underlying funds is not included in the Fund's net investment income (loss) ratio.
C Total distributions per share do not sum due to rounding.
D Total returns would have been lower if certain expenses had not been reduced during the applicable periods shown.
E Total returns do not include the effect of the sales charges.
F Fees and expenses of any underlying mutual funds or exchange-traded funds (ETFs) are not included in the Fund's expense ratio. The Fund indirectly bears its proportionate share of these expenses. For additional expense information related to investments in Fidelity Central Funds, please refer to the "Investments in Fidelity Central Funds" note found in the Notes to Financial Statements section of the most recent Annual or Semi-Annual report.
G Expense ratios reflect operating expenses of the class. Expenses before reductions do not reflect amounts reimbursed, waived, or reduced through arrangements with the investment adviser, brokerage services, or other offset arrangements, if applicable, and do not represent the amount paid by the class during periods when reimbursements, waivers or reductions occur.
H Amount does not include the portfolio activity of any underlying mutual funds or exchange-traded funds (ETFs).
See accompanying notes which are an integral part of the financial statements.
Fidelity Advisor Real Estate Fund Class M
| Years ended July 31, | 2022 | 2021 | 2020 | 2019 | 2018 |
| Selected Per–Share Data | | | | | |
| Net asset value, beginning of period | $24.59 | $19.58 | $22.87 | $22.05 | $22.94 |
| Income from Investment Operations | | | | | |
| Net investment income (loss)A,B | .17 | .21 | .36 | .32 | .32 |
| Net realized and unrealized gain (loss) | (1.46) | 5.49 | (1.90) | 1.62 | .21 |
| Total from investment operations | (1.29) | 5.70 | (1.54) | 1.94 | .53 |
| Distributions from net investment income | (.13) | (.22) | (.34) | (.39) | (.31) |
| Distributions from net realized gain | (1.30) | (.48) | (1.41) | (.73) | (1.11) |
| Total distributions | (1.43) | (.69)C | (1.75) | (1.12) | (1.42) |
| Net asset value, end of period | $21.87 | $24.59 | $19.58 | $22.87 | $22.05 |
| Total ReturnD,E | (5.83)% | 30.14% | (7.42)% | 9.35% | 2.34% |
| Ratios to Average Net AssetsB,F,G | | | | | |
| Expenses before reductions | 1.29% | 1.31% | 1.31% | 1.32% | 1.33% |
| Expenses net of fee waivers, if any | 1.28% | 1.31% | 1.31% | 1.31% | 1.33% |
| Expenses net of all reductions | 1.28% | 1.30% | 1.30% | 1.31% | 1.32% |
| Net investment income (loss) | .73% | 1.03% | 1.71% | 1.46% | 1.47% |
| Supplemental Data | | | | | |
| Net assets, end of period (000 omitted) | $100,892 | $118,778 | $98,724 | $128,754 | $127,038 |
| Portfolio turnover rateH | 48% | 53% | 56% | 49% | 41% |
A Calculated based on average shares outstanding during the period.
B Net investment income (loss) is affected by the timing of the declaration of dividends by any underlying mutual funds or exchange-traded funds (ETFs). Net investment income (loss) of any such underlying funds is not included in the Fund's net investment income (loss) ratio.
C Total distributions per share do not sum due to rounding.
D Total returns would have been lower if certain expenses had not been reduced during the applicable periods shown.
E Total returns do not include the effect of the sales charges.
F Fees and expenses of any underlying mutual funds or exchange-traded funds (ETFs) are not included in the Fund's expense ratio. The Fund indirectly bears its proportionate share of these expenses. For additional expense information related to investments in Fidelity Central Funds, please refer to the "Investments in Fidelity Central Funds" note found in the Notes to Financial Statements section of the most recent Annual or Semi-Annual report.
G Expense ratios reflect operating expenses of the class. Expenses before reductions do not reflect amounts reimbursed, waived, or reduced through arrangements with the investment adviser, brokerage services, or other offset arrangements, if applicable, and do not represent the amount paid by the class during periods when reimbursements, waivers or reductions occur.
H Amount does not include the portfolio activity of any underlying mutual funds or exchange-traded funds (ETFs).
See accompanying notes which are an integral part of the financial statements.
Fidelity Advisor Real Estate Fund Class C
| Years ended July 31, | 2022 | 2021 | 2020 | 2019 | 2018 |
| Selected Per–Share Data | | | | | |
| Net asset value, beginning of period | $23.74 | $18.97 | $22.26 | $21.54 | $22.46 |
| Income from Investment Operations | | | | | |
| Net investment income (loss)A,B | .03 | .09 | .23 | .19 | .20 |
| Net realized and unrealized gain (loss) | (1.39) | 5.30 | (1.85) | 1.58 | .20 |
| Total from investment operations | (1.36) | 5.39 | (1.62) | 1.77 | .40 |
| Distributions from net investment income | (.08) | (.15) | (.26) | (.32) | (.21) |
| Distributions from net realized gain | (1.30) | (.48) | (1.41) | (.73) | (1.11) |
| Total distributions | (1.38) | (.62)C | (1.67) | (1.05) | (1.32) |
| Net asset value, end of period | $21.00 | $23.74 | $18.97 | $22.26 | $21.54 |
| Total ReturnD,E | (6.35)% | 29.36% | (7.95)% | 8.72% | 1.77% |
| Ratios to Average Net AssetsB,F,G | | | | | |
| Expenses before reductions | 1.86% | 1.88% | 1.89% | 1.88% | 1.88% |
| Expenses net of fee waivers, if any | 1.86% | 1.88% | 1.89% | 1.88% | 1.88% |
| Expenses net of all reductions | 1.86% | 1.87% | 1.88% | 1.88% | 1.87% |
| Net investment income (loss) | .15% | .46% | 1.14% | .89% | .92% |
| Supplemental Data | | | | | |
| Net assets, end of period (000 omitted) | $12,375 | $16,069 | $20,774 | $28,982 | $43,690 |
| Portfolio turnover rateH | 48% | 53% | 56% | 49% | 41% |
A Calculated based on average shares outstanding during the period.
B Net investment income (loss) is affected by the timing of the declaration of dividends by any underlying mutual funds or exchange-traded funds (ETFs). Net investment income (loss) of any such underlying funds is not included in the Fund's net investment income (loss) ratio.
C Total distributions per share do not sum due to rounding.
D Total returns would have been lower if certain expenses had not been reduced during the applicable periods shown.
E Total returns do not include the effect of the contingent deferred sales charge.
F Fees and expenses of any underlying mutual funds or exchange-traded funds (ETFs) are not included in the Fund's expense ratio. The Fund indirectly bears its proportionate share of these expenses. For additional expense information related to investments in Fidelity Central Funds, please refer to the "Investments in Fidelity Central Funds" note found in the Notes to Financial Statements section of the most recent Annual or Semi-Annual report.
G Expense ratios reflect operating expenses of the class. Expenses before reductions do not reflect amounts reimbursed, waived, or reduced through arrangements with the investment adviser, brokerage services, or other offset arrangements, if applicable, and do not represent the amount paid by the class during periods when reimbursements, waivers or reductions occur.
H Amount does not include the portfolio activity of any underlying mutual funds or exchange-traded funds (ETFs).
See accompanying notes which are an integral part of the financial statements.
Fidelity Advisor Real Estate Fund Class I
| Years ended July 31, | 2022 | 2021 | 2020 | 2019 | 2018 |
| Selected Per–Share Data | | | | | |
| Net asset value, beginning of period | $24.96 | $19.84 | $23.15 | $22.28 | $23.17 |
| Income from Investment Operations | | | | | |
| Net investment income (loss)A,B | .27 | .31 | .46 | .43 | .43 |
| Net realized and unrealized gain (loss) | (1.48) | 5.56 | (1.92) | 1.65 | .21 |
| Total from investment operations | (1.21) | 5.87 | (1.46) | 2.08 | .64 |
| Distributions from net investment income | (.19) | (.27) | (.44) | (.48) | (.42) |
| Distributions from net realized gain | (1.30) | (.48) | (1.41) | (.73) | (1.11) |
| Total distributions | (1.49) | (.75) | (1.85) | (1.21) | (1.53) |
| Net asset value, end of period | $22.26 | $24.96 | $19.84 | $23.15 | $22.28 |
| Total ReturnC | (5.43)% | 30.65% | (6.99)% | 9.93% | 2.84% |
| Ratios to Average Net AssetsB,D,E | | | | | |
| Expenses before reductions | .86% | .88% | .86% | .81% | .82% |
| Expenses net of fee waivers, if any | .86% | .87% | .86% | .81% | .82% |
| Expenses net of all reductions | .86% | .87% | .85% | .81% | .81% |
| Net investment income (loss) | 1.15% | 1.46% | 2.17% | 1.96% | 1.98% |
| Supplemental Data | | | | | |
| Net assets, end of period (000 omitted) | $160,565 | $197,873 | $180,346 | $225,407 | $284,857 |
| Portfolio turnover rateF | 48% | 53% | 56% | 49% | 41% |
A Calculated based on average shares outstanding during the period.
B Net investment income (loss) is affected by the timing of the declaration of dividends by any underlying mutual funds or exchange-traded funds (ETFs). Net investment income (loss) of any such underlying funds is not included in the Fund's net investment income (loss) ratio.
C Total returns would have been lower if certain expenses had not been reduced during the applicable periods shown.
D Fees and expenses of any underlying mutual funds or exchange-traded funds (ETFs) are not included in the Fund's expense ratio. The Fund indirectly bears its proportionate share of these expenses. For additional expense information related to investments in Fidelity Central Funds, please refer to the "Investments in Fidelity Central Funds" note found in the Notes to Financial Statements section of the most recent Annual or Semi-Annual report.
E Expense ratios reflect operating expenses of the class. Expenses before reductions do not reflect amounts reimbursed, waived, or reduced through arrangements with the investment adviser, brokerage services, or other offset arrangements, if applicable, and do not represent the amount paid by the class during periods when reimbursements, waivers or reductions occur.
F Amount does not include the portfolio activity of any underlying mutual funds or exchange-traded funds (ETFs).
See accompanying notes which are an integral part of the financial statements.
Fidelity Advisor Real Estate Fund Class Z
| Years ended July 31, | 2022 | 2021 | 2020 | 2019 A |
| Selected Per–Share Data | | | | |
| Net asset value, beginning of period | $24.97 | $19.85 | $23.16 | $21.91 |
| Income from Investment Operations | | | | |
| Net investment income (loss)B,C | .33 | .36 | .50 | .40 |
| Net realized and unrealized gain (loss) | (1.48) | 5.56 | (1.92) | 1.94 |
| Total from investment operations | (1.15) | 5.92 | (1.42) | 2.34 |
| Distributions from net investment income | (.23) | (.32) | (.48) | (.36) |
| Distributions from net realized gain | (1.30) | (.48) | (1.41) | (.73) |
| Total distributions | (1.53) | (.80) | (1.89) | (1.09) |
| Net asset value, end of period | $22.29 | $24.97 | $19.85 | $23.16 |
| Total ReturnD,E | (5.21)% | 30.95% | (6.80)% | 11.22% |
| Ratios to Average Net AssetsC,F,G | | | | |
| Expenses before reductions | .64% | .64% | .65% | .65%H |
| Expenses net of fee waivers, if any | .63% | .64% | .65% | .64%H |
| Expenses net of all reductions | .63% | .64% | .64% | .64%H |
| Net investment income (loss) | 1.38% | 1.69% | 2.38% | 2.20%H |
| Supplemental Data | | | | |
| Net assets, end of period (000 omitted) | $13,539 | $16,573 | $9,157 | $6,634 |
| Portfolio turnover rateI | 48% | 53% | 56% | 49% |
A For the period October 2, 2018 (commencement of sale of shares) through July 31, 2019.
B Calculated based on average shares outstanding during the period.
C Net investment income (loss) is affected by the timing of the declaration of dividends by any underlying mutual funds or exchange-traded funds (ETFs). Net investment income (loss) of any such underlying funds is not included in the Fund's net investment income (loss) ratio.
D Total returns for periods of less than one year are not annualized.
E Total returns would have been lower if certain expenses had not been reduced during the applicable periods shown.
F Fees and expenses of any underlying mutual funds or exchange-traded funds (ETFs) are not included in the Fund's expense ratio. The Fund indirectly bears its proportionate share of these expenses. For additional expense information related to investments in Fidelity Central Funds, please refer to the "Investments in Fidelity Central Funds" note found in the Notes to Financial Statements section of the most recent Annual or Semi-Annual report.
G Expense ratios reflect operating expenses of the class. Expenses before reductions do not reflect amounts reimbursed, waived, or reduced through arrangements with the investment adviser, brokerage services, or other offset arrangements, if applicable, and do not represent the amount paid by the class during periods when reimbursements, waivers or reductions occur.
H Annualized
I Amount does not include the portfolio activity of any underlying mutual funds or exchange-traded funds (ETFs).
See accompanying notes which are an integral part of the financial statements.
Notes to Financial Statements
For the period ended July 31, 2022
1. Organization.
Fidelity Advisor Real Estate Fund (the Fund) is a non-diversified fund of Fidelity Advisor Series VII (the Trust) and is authorized to issue an unlimited number of shares. The Trust is registered under the Investment Company Act of 1940, as amended (the 1940 Act), as an open-end management investment company organized as a Massachusetts business trust. The Fund offers Class A, Class M, Class C, Class I and Class Z shares, each of which has equal rights as to assets and voting privileges. Each class has exclusive voting rights with respect to matters that affect that class. Class C shares will automatically convert to Class A shares after a holding period of eight years from the initial date of purchase, with certain exceptions.
2. Investments in Fidelity Central Funds.
Funds may invest in Fidelity Central Funds, which are open-end investment companies generally available only to other investment companies and accounts managed by the investment adviser and its affiliates. The Schedule of Investments lists any Fidelity Central Funds held as an investment as of period end, but does not include the underlying holdings of each Fidelity Central Fund. An investing fund indirectly bears its proportionate share of the expenses of the underlying Fidelity Central Funds.
Based on its investment objective, each Fidelity Central Fund may invest or participate in various investment vehicles or strategies that are similar to those of the investing fund. These strategies are consistent with the investment objectives of the investing fund and may involve certain economic risks which may cause a decline in value of each of the Fidelity Central Funds and thus a decline in the value of the investing fund.
| Fidelity Central Fund | Investment Manager | Investment Objective | Investment Practices | Expense Ratio(a) |
| Fidelity Money Market Central Funds | Fidelity Management & Research Company LLC (FMR) | Each fund seeks to obtain a high level of current income consistent with the preservation of capital and liquidity. | Short-term Investments | Less than .005% |
(a) Expenses expressed as a percentage of average net assets and are as of each underlying Central Fund's most recent annual or semi-annual shareholder report.
A complete unaudited list of holdings for each Fidelity Central Fund is available upon request or at the Securities and Exchange Commission website at www.sec.gov. In addition, the financial statements of the Fidelity Central Funds which contain the significant accounting policies (including investment valuation policies) of those funds, and are not covered by the Report of Independent Registered Public Accounting Firm, are available on the Securities and Exchange Commission website or upon request.
3. Significant Accounting Policies.
The Fund is an investment company and applies the accounting and reporting guidance of the Financial Accounting Standards Board (FASB) Accounting Standards Codification Topic 946 Financial Services - Investment Companies. The financial statements have been prepared in conformity with accounting principles generally accepted in the United States of America (GAAP), which require management to make certain estimates and assumptions at the date of the financial statements. Actual results could differ from those estimates. Subsequent events, if any, through the date that the financial statements were issued have been evaluated in the preparation of the financial statements. The Fund's Schedule of Investments lists any underlying mutual funds or exchange-traded funds (ETFs) but does not include the underlying holdings of these funds. The following summarizes the significant accounting policies of the Fund:
Investment Valuation. Investments are valued as of 4:00 p.m. Eastern time on the last calendar day of the period. The Board of Trustees (the Board) has delegated the day to day responsibility for the valuation of the Fund's investments to the Fair Value Committee (the Committee) established by the Fund's investment adviser. In accordance with valuation policies and procedures approved by the Board, the Fund attempts to obtain prices from one or more third party pricing vendors or brokers to value its investments. When current market prices, quotations or currency exchange rates are not readily available or reliable, investments will be fair valued in good faith by the Committee, in accordance with procedures adopted by the Board. Factors used in determining fair value vary by investment type and may include market or investment specific events. The frequency with which these procedures are used cannot be predicted and they may be utilized to a significant extent. The Committee oversees the Fund's valuation policies and procedures and reports to the Board on the Committee's activities and fair value determinations. The Board monitors the appropriateness of the procedures used in valuing the Fund's investments and ratifies the fair value determinations of the Committee.
The Fund categorizes the inputs to valuation techniques used to value its investments into a disclosure hierarchy consisting of three levels as shown below:
- Level 1 – unadjusted quoted prices in active markets for identical investments
- Level 2 – other significant observable inputs (including quoted prices for similar investments, interest rates, prepayment speeds, etc.)
- Level 3 – unobservable inputs (including the Fund's own assumptions based on the best information available)
Valuation techniques used to value the Fund's investments by major category are as follows:
Equity securities, including restricted securities, for which market quotations are readily available, are valued at the last reported sale price or official closing price as reported by a third party pricing vendor on the primary market or exchange on which they are traded and are categorized as Level 1 in the hierarchy. In the event there were no sales during the day or closing prices are not available, securities are valued at the last quoted bid price or may be valued using the last available price and are generally categorized as Level 2 in the hierarchy. For foreign equity securities, when market or security specific events arise, comparisons to the valuation of American Depositary Receipts (ADRs), futures contracts, ETFs and certain indexes as well as quoted prices for similar securities may be used and would be categorized as Level 2 in the hierarchy. For equity securities, including restricted securities, where observable inputs are limited, assumptions about market activity and risk are used and these securities may be categorized as Level 3 in the hierarchy.
Investments in open-end mutual funds, including the Fidelity Central Funds, are valued at their closing net asset value (NAV) each business day and are categorized as Level 1 in the hierarchy.
Changes in valuation techniques may result in transfers in or out of an assigned level within the disclosure hierarchy. The aggregate value of investments by input level as of July 31, 2022 is included at the end of the Fund's Schedule of Investments.
Investment Transactions and Income. For financial reporting purposes, the Fund's investment holdings and NAV include trades executed through the end of the last business day of the period. The NAV per share for processing shareholder transactions is calculated as of the close of business of the New York Stock Exchange (NYSE), normally 4:00 p.m. Eastern time and includes trades executed through the end of the prior business day. Gains and losses on securities sold are determined on the basis of identified cost. Commissions paid to certain brokers with whom the investment adviser, or its affiliates, places trades on behalf of a fund include an amount in addition to trade execution, which may be rebated back to a fund. Any such rebates are included in net realized gain (loss) on investments in the Statement of Operations. Dividend income is recorded on the ex-dividend date, except for certain dividends from foreign securities where the ex-dividend date may have passed, which are recorded as soon as the Fund is informed of the ex-dividend date. Non-cash dividends included in dividend income, if any, are recorded at the fair market value of the securities received. Income and capital gain distributions from Fidelity Central Funds, if any, are recorded on the ex-dividend date. Certain distributions received by the Fund represent a return of capital or capital gain. The Fund determines the components of these distributions subsequent to the ex-dividend date, based upon receipt of tax filings or other correspondence relating to the underlying investment. These distributions are recorded as a reduction of cost of investments and/or as a realized gain.
Class Allocations and Expenses. Investment income, realized and unrealized capital gains and losses, common expenses of a fund, and certain fund-level expense reductions, if any, are allocated daily on a pro-rata basis to each class based on the relative net assets of each class to the total net assets of a fund. Each class differs with respect to transfer agent and distribution and service plan fees incurred, as applicable. Certain expense reductions may also differ by class, if applicable. For the reporting period, the allocated portion of income and expenses to each class as a percent of its average net assets may vary due to the timing of recording these transactions in relation to fluctuating net assets of the classes. Expenses directly attributable to a fund are charged to that fund. Expenses attributable to more than one fund are allocated among the respective funds on the basis of relative net assets or other appropriate methods. Expenses included in the accompanying financial statements reflect the expenses of that fund and do not include any expenses associated with any underlying mutual funds or exchange-traded funds. Although not included in a fund's expenses, a fund indirectly bears its proportionate share of these expenses through the net asset value of each underlying mutual fund or exchange-traded fund. Expense estimates are accrued in the period to which they relate and adjustments are made when actual amounts are known.
Deferred Trustee Compensation. Under a Deferred Compensation Plan (the Plan) for certain Funds, certain independent Trustees have elected to defer receipt of a portion of their annual compensation. Deferred amounts are invested in affiliated mutual funds, are marked-to-market and remain in a fund until distributed in accordance with the Plan. The investment of deferred amounts and the offsetting payable to the Trustees presented below are included in the accompanying Statement of Assets and Liabilities in other receivables and other payables and accrued expenses, as applicable.
| Fidelity Advisor Real Estate Fund | $76,253 |
Income Tax Information and Distributions to Shareholders. Each year, the Fund intends to qualify as a regulated investment company under Subchapter M of the Internal Revenue Code, including distributing substantially all of its taxable income and realized gains. As a result, no provision for U.S. Federal income taxes is required. As of July 31, 2022, the Fund did not have any unrecognized tax benefits in the financial statements; nor is the Fund aware of any tax positions for which it is reasonably possible that the total amounts of unrecognized tax benefits will significantly change in the next twelve months. The Fund files a U.S. federal tax return, in addition to state and local tax returns as required. The Fund's federal income tax returns are subject to examination by the Internal Revenue Service (IRS) for a period of three fiscal years after they are filed. State and local tax returns may be subject to examination for an additional fiscal year depending on the jurisdiction.
Distributions are declared and recorded on the ex-dividend date. Income and capital gain distributions are declared separately for each class. Income and capital gain distributions are determined in accordance with income tax regulations, which may differ from GAAP. In addition, the Fund claimed a portion of the payment made to redeeming shareholders as a distribution for income tax purposes.
Capital accounts within the financial statements are adjusted for permanent book-tax differences. These adjustments have no impact on net assets or the results of operations. Capital accounts are not adjusted for temporary book-tax differences which will reverse in a subsequent period.
Book-tax differences are primarily due to deferred Trustee compensation and losses deferred due to wash sales and excise tax regulations.
As of period end, the cost and unrealized appreciation (depreciation) in securities, and derivatives if applicable, for federal income tax purposes were as follows:
| Gross unrealized appreciation | $108,490,030 |
| Gross unrealized depreciation | (11,166,386) |
| Net unrealized appreciation (depreciation) | $97,323,644 |
| Tax Cost | $318,612,087 |
The tax-based components of distributable earnings as of period end were as follows:
| Undistributed long-term capital gain | $36,330,350 |
| Net unrealized appreciation (depreciation) on securities and other investments | $97,323,644 |
The Fund intends to elect to defer to its next fiscal year $70,890 of capital losses recognized during the period November 1, 2021 to July 31, 2022.
The tax character of distributions paid was as follows:
| | July 31, 2022 | July 31, 2021 |
| Ordinary Income | $4,114,116 | $ 5,035,427 |
| Long-term Capital Gains | 24,175,235 | 9,609,523 |
| Total | $28,289,351 | $ 14,644,950 |
Restricted Securities (including Private Placements). Funds may invest in securities that are subject to legal or contractual restrictions on resale. These securities generally may be resold in transactions exempt from registration or to the public if the securities are registered. Disposal of these securities may involve time-consuming negotiations and expense, and prompt sale at an acceptable price may be difficult. Information regarding restricted securities held at period end is included at the end of the Schedule of Investments, if applicable.
4. Purchases and Sales of Investments.
Purchases and sales of securities, other than short-term securities and in-kind transactions, as applicable, are noted in the table below.
| | Purchases ($) | Sales ($) |
| Fidelity Advisor Real Estate Fund | 222,171,243 | 264,451,685 |
5. Fees and Other Transactions with Affiliates.
Management Fee. Fidelity Management & Research Company LLC (the investment adviser) and its affiliates provide the Fund with investment management related services for which the Fund pays a monthly management fee. The management fee is the sum of an individual fund fee rate that is based on an annual rate of .30% of the Fund's average net assets and an annualized group fee rate that averaged .22% during the period. The group fee rate is based upon the monthly average net assets of a group of registered investment companies with which the investment adviser has management contracts. The group fee rate decreases as assets under management increase and increases as assets under management decrease. For the reporting period, the total annual management fee rate was .52% of the Fund's average net assets.
Distribution and Service Plan Fees. In accordance with Rule 12b-1 of the 1940 Act, the Fund has adopted separate Distribution and Service Plans for each class of shares. Certain classes pay Fidelity Distributors Company LLC (FDC), an affiliate of the investment adviser, separate Distribution and Service Fees, each of which is based on an annual percentage of each class' average net assets. In addition, FDC may pay financial intermediaries for selling shares of the Fund and providing shareholder support services. For the period, the Distribution and Service Fee rates, total fees and amounts retained by FDC were as follows:
| | Distribution Fee | Service Fee | Total Fees | Retained by FDC |
| Class A | -% | .25% | $331,107 | $5,000 |
| Class M | .25% | .25% | 555,424 | – |
| Class C | .75% | .25% | 148,465 | 17,160 |
| | | | $1,034,996 | $22,160 |
Sales Load. FDC may receive a front-end sales charge of up to 5.75% for selling Class A shares and 3.50% for selling Class M shares, some of which is paid to financial intermediaries for selling shares of the Fund. Depending on the holding period, FDC may receive contingent deferred sales charges levied on Class A, Class M and Class C redemptions. The deferred sales charges are 1.00% for Class C shares, 1.00% for certain purchases of Class A shares and .25% for certain purchases of Class M shares.
For the period, sales charge amounts retained by FDC were as follows:
| | Retained by FDC |
| Class A | $26,231 |
| Class M | 3,119 |
| Class C(a) | 381 |
| | $29,731 |
(a) When Class C shares are initially sold, FDC pays commissions from its own resources to financial intermediaries through which the sales are made.
Transfer Agent Fees. Fidelity Investments Institutional Operations Company LLC (FIIOC), an affiliate of the investment adviser, is the transfer, dividend disbursing and shareholder servicing agent for each class of the Fund. FIIOC receives account fees and asset-based fees that vary according to the account size and type of account of the shareholders of the respective classes of the Fund, except for Class Z. FIIOC receives an asset-based fee of Class Z's average net assets. FIIOC pays for typesetting, printing and mailing of shareholder reports, except proxy statements.
For the period, transfer agent fees for each class were as follows:
| | Amount | % of Class-Level Average Net Assets |
| Class A | $296,414 | .22 |
| Class M | 212,606 | .19 |
| Class C | 39,860 | .27 |
| Class I | 503,669 | .27 |
| Class Z | 6,363 | .04 |
| | $1,058,912 | |
Accounting Fees. Fidelity Service Company, Inc. (FSC), an affiliate of the investment adviser, maintains the Fund's accounting records. The accounting fee is based on the level of average net assets for each month. For the period, the fees were equivalent to the following annual rates:
| | % of Average Net Assets |
| Fidelity Advisor Real Estate Fund | .04 |
Brokerage Commissions. A portion of portfolio transactions were placed with brokerage firms which are affiliates of the investment adviser. Brokerage commissions are included in net realized gain (loss) and change in net unrealized appreciation (depreciation) in the Statement of Operations. The commissions paid to these affiliated firms were as follows:
| | Amount |
| Fidelity Advisor Real Estate Fund | $2,501 |
Interfund Lending Program. Pursuant to an Exemptive Order issued by the Securities and Exchange Commission (the SEC), the Fund, along with other registered investment companies having management contracts with Fidelity Management & Research Company LLC (FMR), or other affiliated entities of FMR, may participate in an interfund lending program. This program provides an alternative credit facility allowing the Fund to borrow from, or lend money to, other participating affiliated funds. At period end, there were no interfund loans outstanding. Activity in this program during the period for which loans were outstanding was as follows:
| | Borrower or Lender | Average Loan Balance | Weighted Average Interest Rate | Interest Expense |
| Fidelity Advisor Real Estate Fund | Borrower | $12,408,333 | .48% | $1,003 |
Interfund Trades. Funds may purchase from or sell securities to other Fidelity Funds under procedures adopted by the Board. The procedures have been designed to ensure these interfund trades are executed in accordance with Rule 17a-7 of the 1940 Act. Any interfund trades are included within the respective purchases and sales amounts shown in the Purchases and Sales of Investments note. Interfund trades during the period are noted in the table below.
| | Purchases ($) | Sales ($) | Realized Gain (Loss) ($) |
| Fidelity Advisor Real Estate Fund | 13,809,570 | 19,437,768 | 1,090,205 |
6. Committed Line of Credit.
Certain Funds participate with other funds managed by the investment adviser or an affiliate in a $4.25 billion credit facility (the "line of credit") to be utilized for temporary or emergency purposes to fund shareholder redemptions or for other short-term liquidity purposes. The participating funds have agreed to pay commitment fees on their pro-rata portion of the line of credit, which are reflected in Miscellaneous expenses on the Statement of Operations, and are listed below. During the period, there were no borrowings on this line of credit.
| | Amount |
| Fidelity Advisor Real Estate Fund | $594 |
7. Security Lending.
Funds lend portfolio securities from time to time in order to earn additional income. Lending agents are used, including National Financial Services (NFS), an affiliate of the investment adviser. Pursuant to a securities lending agreement, NFS will receive a fee, which is capped at 9.9% of a fund's daily lending revenue, for its services as lending agent. A fund may lend securities to certain qualified borrowers, including NFS. On the settlement date of the loan, a fund receives collateral (in the form of U.S. Treasury obligations, letters of credit and/or cash) against the loaned securities and maintains collateral in an amount not less than 100% of the market value of the loaned securities during the period of the loan. The market value of the loaned securities is determined at the close of business of a fund and any additional required collateral is delivered to a fund on the next business day. A fund or borrower may terminate the loan at any time, and if the borrower defaults on its obligation to return the securities loaned because of insolvency or other reasons, a fund may apply collateral received from the borrower against the obligation. A fund may experience delays and costs in recovering the securities loaned. Any cash collateral received is invested in the Fidelity Securities Lending Cash Central Fund. Any loaned securities are identified as such in the Schedule of Investments, and the value of loaned securities and cash collateral at period end, as applicable, are presented in the Statement of Assets and Liabilities. Security lending income represents the income earned on investing cash collateral, less rebates paid to borrowers and any lending agent fees associated with the loan, plus any premium payments received for lending certain types of securities. Security lending income is presented in the Statement of Operations as a component of income from Fidelity Central Funds. Affiliated security lending activity, if any, was as follows:
| | Total Security Lending Fees Paid to NFS | Security Lending Income From Securities Loaned to NFS | Value of Securities Loaned to NFS at Period End |
| Fidelity Advisor Real Estate Fund | $12,990 | $5,320 | $– |
8. Expense Reductions.
During the period the investment adviser or an affiliate reimbursed and/or waived a portion of fund-level operating expenses in the amount of $14,437.
9. Distributions to Shareholders.
Distributions to shareholders of each class were as follows:
| | Year ended
July 31, 2022 | Year ended
July 31, 2021 |
| Fidelity Advisor Real Estate Fund | | |
| Distributions to shareholders | | |
| Class A | $7,993,209 | $3,943,668 |
| Class M | 6,745,913 | 3,401,100 |
| Class C | 908,708 | 608,843 |
| Class I | 11,703,981 | 6,121,163 |
| Class Z | 937,540 | 570,176 |
| Total | $28,289,351 | $14,644,950 |
10. Share Transactions.
Share transactions for each class were as follows and may contain in-kind transactions, automatic conversions between classes or exchanges between affiliated funds:
| | Shares | Shares | Dollars | Dollars |
| | Year ended July 31, 2022 | Year ended July 31, 2021 | Year ended July 31, 2022 | Year ended July 31, 2021 |
| Fidelity Advisor Real Estate Fund | | | | |
| Class A | | | | |
| Shares sold | 994,036 | 1,114,030 | $23,589,069 | $23,635,557 |
| Reinvestment of distributions | 322,393 | 201,989 | 7,866,495 | 3,878,210 |
| Shares redeemed | (1,318,681) | (1,613,289) | (30,889,788) | (33,263,379) |
| Net increase (decrease) | (2,252) | (297,270) | $565,776 | $(5,749,612) |
| Class M | | | | |
| Shares sold | 392,434 | 567,797 | $9,212,673 | $11,739,646 |
| Reinvestment of distributions | 276,620 | 176,839 | 6,729,626 | 3,389,165 |
| Shares redeemed | (886,642) | (955,077) | (20,661,409) | (19,872,105) |
| Net increase (decrease) | (217,588) | (210,441) | $(4,719,110) | $(4,743,294) |
| Class C | | | | |
| Shares sold | 106,372 | 105,065 | $2,458,841 | $2,128,502 |
| Reinvestment of distributions | 38,746 | 32,588 | 908,210 | 604,904 |
| Shares redeemed | (232,612) | (555,809) | (5,110,047) | (11,351,257) |
| Net increase (decrease) | (87,494) | (418,156) | $(1,742,996) | $(8,617,851) |
| Class I | | | | |
| Shares sold | 2,116,894 | 2,357,850 | $52,046,309 | $48,485,384 |
| Reinvestment of distributions | 440,622 | 299,336 | 10,890,582 | 5,816,838 |
| Shares redeemed | (3,272,627) | (3,820,307) | (77,697,577) | (78,503,211) |
| Net increase (decrease) | (715,111) | (1,163,121) | $(14,760,686) | $(24,200,989) |
| Class Z | | | | |
| Shares sold | 345,140 | 717,966 | $8,205,866 | $14,541,293 |
| Reinvestment of distributions | 31,131 | 15,167 | 769,941 | 296,100 |
| Shares redeemed | (432,603) | (530,812) | (10,112,884) | (10,537,049) |
| Net increase (decrease) | (56,332) | 202,321 | $(1,137,077) | $4,300,344 |
11. Other.
A fund's organizational documents provide former and current trustees and officers with a limited indemnification against liabilities arising in connection with the performance of their duties to the fund. In the normal course of business, a fund may also enter into contracts that provide general indemnifications. A fund's maximum exposure under these arrangements is unknown as this would be dependent on future claims that may be made against a fund. The risk of material loss from such claims is considered remote.
12. Coronavirus (COVID-19) Pandemic.
An outbreak of COVID-19 first detected in China during December 2019 has since spread globally and was declared a pandemic by the World Health Organization during March 2020. Developments that disrupt global economies and financial markets, such as the COVID-19 pandemic, may magnify factors that affect the Fund's performance.
Report of Independent Registered Public Accounting Firm
To the Board of Trustees of Fidelity Advisor Series VII and Shareholders of Fidelity Advisor Real Estate Fund
Opinion on the Financial Statements and Financial Highlights
We have audited the accompanying statement of assets and liabilities of Fidelity Advisor Real Estate Fund (the "Fund"), a fund of Fidelity Advisor Series VII, including the schedule of investments, as of July 31, 2022, the related statement of operations for the year then ended, the statement of changes in net assets for each of the two years in the period then ended, the financial highlights for each of the five years in the period then ended, and the related notes. In our opinion, the financial statements and financial highlights present fairly, in all material respects, the financial position of the Fund as of July 31, 2022, and the results of its operations for the year then ended, the changes in its net assets for each of the two years in the period then ended, and the financial highlights for each of the five years in the period then ended in conformity with accounting principles generally accepted in the United States of America.
Basis for Opinion
These financial statements and financial highlights are the responsibility of the Fund's management. Our responsibility is to express an opinion on the Fund's financial statements and financial highlights based on our audits. We are a public accounting firm registered with the Public Company Accounting Oversight Board (United States) (PCAOB) and are required to be independent with respect to the Fund in accordance with the U.S. federal securities laws and the applicable rules and regulations of the Securities and Exchange Commission and the PCAOB.
We conducted our audits in accordance with the standards of the PCAOB. Those standards require that we plan and perform the audit to obtain reasonable assurance about whether the financial statements and financial highlights are free of material misstatement, whether due to error or fraud. The Fund is not required to have, nor were we engaged to perform, an audit of its internal control over financial reporting. As part of our audits we are required to obtain an understanding of internal control over financial reporting but not for the purpose of expressing an opinion on the effectiveness of the Fund’s internal control over financial reporting. Accordingly, we express no such opinion.
Our audits included performing procedures to assess the risks of material misstatement of the financial statements and financial highlights, whether due to error or fraud, and performing procedures that respond to those risks. Such procedures included examining, on a test basis, evidence regarding the amounts and disclosures in the financial statements and financial highlights. Our audits also included evaluating the accounting principles used and significant estimates made by management, as well as evaluating the overall presentation of the financial statements and financial highlights. Our procedures included confirmation of securities owned as of July 31, 2022, by correspondence with the custodian and brokers; when replies were not received from brokers, we performed other auditing procedures. We believe that our audits provide a reasonable basis for our opinion.
/s/ Deloitte & Touche LLP
Boston, Massachusetts
September 14, 2022
We have served as the auditor of one or more of the Fidelity investment companies since 1999.
Trustees and Officers
The Trustees, Members of the Advisory Board (if any), and officers of the trust and fund, as applicable, are listed below. The Board of Trustees governs the fund and is responsible for protecting the interests of shareholders. The Trustees are experienced executives who meet periodically throughout the year to oversee the fund's activities, review contractual arrangements with companies that provide services to the fund, oversee management of the risks associated with such activities and contractual arrangements, and review the fund's performance. Each of the Trustees oversees 316 funds.
The Trustees hold office without limit in time except that (a) any Trustee may resign; (b) any Trustee may be removed by written instrument, signed by at least two-thirds of the number of Trustees prior to such removal; (c) any Trustee who requests to be retired or who has become incapacitated by illness or injury may be retired by written instrument signed by a majority of the other Trustees; and (d) any Trustee may be removed at any special meeting of shareholders by a two-thirds vote of the outstanding voting securities of the trust. Each Trustee who is not an interested person (as defined in the 1940 Act) of the trust and the fund is referred to herein as an Independent Trustee. Each Independent Trustee shall retire not later than the last day of the calendar year in which his or her 75th birthday occurs. The Independent Trustees may waive this mandatory retirement age policy with respect to individual Trustees. Officers and Advisory Board Members hold office without limit in time, except that any officer or Advisory Board Member may resign or may be removed by a vote of a majority of the Trustees at any regular meeting or any special meeting of the Trustees. Except as indicated, each individual has held the office shown or other offices in the same company for the past five years.
The fund’s Statement of Additional Information (SAI) includes more information about the Trustees. To request a free copy, call Fidelity at 1-877-208-0098.
Experience, Skills, Attributes, and Qualifications of the Trustees. The Governance and Nominating Committee has adopted a statement of policy that describes the experience, qualifications, attributes, and skills that are necessary and desirable for potential Independent Trustee candidates (Statement of Policy). The Board believes that each Trustee satisfied at the time he or she was initially elected or appointed a Trustee, and continues to satisfy, the standards contemplated by the Statement of Policy. The Governance and Nominating Committee also engages professional search firms to help identify potential Independent Trustee candidates who have the experience, qualifications, attributes, and skills consistent with the Statement of Policy. From time to time, additional criteria based on the composition and skills of the current Independent Trustees, as well as experience or skills that may be appropriate in light of future changes to board composition, business conditions, and regulatory or other developments, have also been considered by the professional search firms and the Governance and Nominating Committee. In addition, the Board takes into account the Trustees' commitment and participation in Board and committee meetings, as well as their leadership of standing and ad hoc committees throughout their tenure.
In determining that a particular Trustee was and continues to be qualified to serve as a Trustee, the Board has considered a variety of criteria, none of which, in isolation, was controlling. The Board believes that, collectively, the Trustees have balanced and diverse experience, qualifications, attributes, and skills, which allow the Board to operate effectively in governing the fund and protecting the interests of shareholders. Information about the specific experience, skills, attributes, and qualifications of each Trustee, which in each case led to the Board's conclusion that the Trustee should serve (or continue to serve) as a trustee of the fund, is provided below.
Board Structure and Oversight Function. Robert A. Lawrence is an interested person and currently serves as Chair. The Trustees have determined that an interested Chair is appropriate and benefits shareholders because an interested Chair has a personal and professional stake in the quality and continuity of services provided to the fund. Independent Trustees exercise their informed business judgment to appoint an individual of their choosing to serve as Chair, regardless of whether the Trustee happens to be independent or a member of management. The Independent Trustees have determined that they can act independently and effectively without having an Independent Trustee serve as Chair and that a key structural component for assuring that they are in a position to do so is for the Independent Trustees to constitute a substantial majority for the Board. The Independent Trustees also regularly meet in executive session. David M. Thomas serves as Lead Independent Trustee and as such (i) acts as a liaison between the Independent Trustees and management with respect to matters important to the Independent Trustees and (ii) with management prepares agendas for Board meetings.
Fidelity® funds are overseen by different Boards of Trustees. The fund's Board oversees Fidelity's high income and certain equity funds, and other Boards oversee Fidelity's investment-grade bond, money market, asset allocation, and other equity funds. The asset allocation funds may invest in Fidelity® funds overseen by the fund's Board. The use of separate Boards, each with its own committee structure, allows the Trustees of each group of Fidelity® funds to focus on the unique issues of the funds they oversee, including common research, investment, and operational issues. On occasion, the separate Boards establish joint committees to address issues of overlapping consequences for the Fidelity® funds overseen by each Board.
The Trustees operate using a system of committees to facilitate the timely and efficient consideration of all matters of importance to the Trustees, the fund, and fund shareholders and to facilitate compliance with legal and regulatory requirements and oversight of the fund's activities and associated risks. The Board, acting through its committees, has charged FMR and its affiliates with (i) identifying events or circumstances the occurrence of which could have demonstrably adverse effects on the fund's business and/or reputation; (ii) implementing processes and controls to lessen the possibility that such events or circumstances occur or to mitigate the effects of such events or circumstances if they do occur; and (iii) creating and maintaining a system designed to evaluate continuously business and market conditions in order to facilitate the identification and implementation processes described in (i) and (ii) above. Because the day-to-day operations and activities of the fund are carried out by or through FMR, its affiliates, and other service providers, the fund's exposure to risks is mitigated but not eliminated by the processes overseen by the Trustees. While each of the Board's committees has responsibility for overseeing different aspects of the fund's activities, oversight is exercised primarily through the Operations, Audit, and Compliance Committees. Appropriate personnel, including but not limited to the fund's Chief Compliance Officer (CCO), FMR's internal auditor, the independent accountants, the fund's Treasurer and portfolio management personnel, make periodic reports to the Board's committees, as appropriate, including an annual review of Fidelity's risk management program for the Fidelity® funds. The responsibilities of each standing committee, including their oversight responsibilities, are described further under "Standing Committees of the Trustees."
Interested Trustees*:
Correspondence intended for a Trustee who is an interested person may be sent to Fidelity Investments, 245 Summer Street, Boston, Massachusetts 02210.
Name, Year of Birth; Principal Occupations and Other Relevant Experience+
Bettina Doulton (1964)
Year of Election or Appointment: 2020
Trustee
Ms. Doulton also serves as Trustee of other Fidelity® funds. Prior to her retirement, Ms. Doulton served in a variety of positions at Fidelity Investments, including as a managing director of research (2006-2007), portfolio manager to certain Fidelity® funds (1993-2005), equity analyst and portfolio assistant (1990-1993), and research assistant (1987-1990). Ms. Doulton currently owns and operates Phi Builders + Architects and Cellardoor Winery. Previously, Ms. Doulton served as a member of the Board of Brown Capital Management, LLC (2014-2018).
Robert A. Lawrence (1952)
Year of Election or Appointment: 2020
Trustee
Chair of the Board of Trustees
Mr. Lawrence also serves as Trustee of other funds. Previously, Mr. Lawrence served as a Trustee and Member of the Advisory Board of certain funds. Prior to his retirement in 2008, Mr. Lawrence served as Vice President of certain Fidelity® funds (2006-2008), Senior Vice President, Head of High Income Division of Fidelity Management & Research Company (investment adviser firm, 2006-2008), and President of Fidelity Strategic Investments (investment adviser firm, 2002-2005).
* Determined to be an “Interested Trustee” by virtue of, among other things, his or her affiliation with the trust or various entities under common control with FMR.
+ The information includes the Trustee's principal occupation during the last five years and other information relating to the experience, attributes, and skills relevant to the Trustee's qualifications to serve as a Trustee, which led to the conclusion that the Trustee should serve as a Trustee for the fund.
Independent Trustees:
Correspondence intended for an Independent Trustee may be sent to Fidelity Investments, P.O. Box 55235, Boston, Massachusetts 02205-5235.
Name, Year of Birth; Principal Occupations and Other Relevant Experience+
Thomas P. Bostick (1956)
Year of Election or Appointment: 2021
Trustee
Lieutenant General Bostick also serves as Trustee of other Fidelity® funds. Prior to his retirement, General Bostick (United States Army, Retired) held a variety of positions within the U.S. Army, including Commanding General and Chief of Engineers, U.S. Army Corps of Engineers (2012-2016) and Deputy Chief of Staff and Director of Human Resources, U.S. Army (2009-2012). General Bostick currently serves as a member of the Board and Finance and Governance Committees of CSX Corporation (transportation, 2020-present) and a member of the Board and Corporate Governance and Nominating Committee of Perma-Fix Environmental Services, Inc. (nuclear waste management, 2020-present). General Bostick serves as Chief Executive Officer of Bostick Global Strategies, LLC (consulting, 2016-present) and as a member of the Board of HireVue, Inc. (video interview and assessment, 2020-present). Previously, General Bostick served as a Member of the Advisory Board of certain Fidelity® funds (2021), President, Intrexon Bioengineering (2018-2020) and Chief Operating Officer (2017-2020) and Senior Vice President of the Environment Sector (2016-2017) of Intrexon Corporation (biopharmaceutical company).
Dennis J. Dirks (1948)
Year of Election or Appointment: 2018
Trustee
Mr. Dirks also serves as Trustee of other Fidelity® funds. Prior to his retirement in May 2003, Mr. Dirks served as Chief Operating Officer and as a member of the Board of The Depository Trust & Clearing Corporation (financial markets infrastructure), President, Chief Operating Officer and a member of the Board of The Depository Trust Company (DTC), President and a member of the Board of the National Securities Clearing Corporation (NSCC), Chief Executive Officer and a member of the Board of the Government Securities Clearing Corporation and Chief Executive Officer and a member of the Board of the Mortgage-Backed Securities Clearing Corporation. Mr. Dirks currently serves as a member of the Finance Committee (2016-present) and Board (2017-present) and is Treasurer (2018-present) of the Asolo Repertory Theatre.
Donald F. Donahue (1950)
Year of Election or Appointment: 2018
Trustee
Mr. Donahue also serves as Trustee of other Fidelity® funds. Mr. Donahue serves as President and Chief Executive Officer of Miranda Partners, LLC (risk consulting for the financial services industry, 2012-present). Previously, Mr. Donahue served as Chief Executive Officer (2006-2012), Chief Operating Officer (2003-2006) and Managing Director, Customer Marketing and Development (1999-2003) of The Depository Trust & Clearing Corporation (financial markets infrastructure). Mr. Donahue currently serves as a member (2007-present) and Co-Chairman (2016-present) of the Board of United Way of New York and a member of the Board of The Leadership Academy (previously NYC Leadership Academy) (2012-present). Mr. Donahue previously served as a member of the Advisory Board of certain Fidelity® funds (2015-2018).
Vicki L. Fuller (1957)
Year of Election or Appointment: 2020
Trustee
Ms. Fuller also serves as Trustee of other Fidelity® funds. Previously, Ms. Fuller served as a member of the Advisory Board of certain Fidelity® funds (2018-2020), Chief Investment Officer of the New York State Common Retirement Fund (2012-2018) and held a variety of positions at AllianceBernstein L.P. (global asset management, 1985-2012), including Managing Director (2006-2012) and Senior Vice President and Senior Portfolio Manager (2001-2006). Ms. Fuller currently serves as a member of the Board, Audit Committee and Nominating and Governance Committee of two Blackstone business development companies (2020-present), as a member of the Board of Treliant, LLC (consulting, 2019-present), as a member of the Advisory Board of Ariel Alternatives, LLC (private equity, 2021-present) and as a member of the Board and Chair of the Audit Committee of Gusto, Inc. (software, 2021-present). In addition, Ms. Fuller currently serves as a member of the Board of Roosevelt University (2019-present) and as a member of the Executive Board of New York University’s Stern School of Business. Ms. Fuller previously served as a member of the Board, Audit Committee and Nominating and Governance Committee of The Williams Companies, Inc. (natural gas infrastructure, 2018-2021).
Patricia L. Kampling (1959)
Year of Election or Appointment: 2020
Trustee
Ms. Kampling also serves as Trustee of other Fidelity® funds. Prior to her retirement, Ms. Kampling served as Chairman of the Board and Chief Executive Officer (2012-2019), President and Chief Operating Officer (2011-2012) and Executive Vice President and Chief Financial Officer (2010-2011) of Alliant Energy Corporation. Ms. Kampling currently serves as a member of the Board, Finance Committee and Governance, Compensation and Nominating Committee of Xcel Energy Inc. (utilities company, 2020-present) and as a member of the Board, Audit, Finance and Risk Committee and Safety, Environmental, Technology and Operations Committee and Chair of the Executive Development and Compensation Committee of American Water Works Company, Inc. (utilities company, 2019-present). In addition, Ms. Kampling currently serves as a member of the Board of the Nature Conservancy, Wisconsin Chapter (2019-present). Previously, Ms. Kampling served as a Member of the Advisory Board of certain Fidelity® funds (2020), a member of the Board, Compensation Committee and Executive Committee and Chair of the Audit Committee of Briggs & Stratton Corporation (manufacturing, 2011-2021), a member of the Board of Interstate Power and Light Company (2012-2019) and Wisconsin Power and Light Company (2012-2019) (each a subsidiary of Alliant Energy Corporation) and as a member of the Board and Workforce Development Committee of the Business Roundtable (2018-2019).
Thomas A. Kennedy (1955)
Year of Election or Appointment: 2021
Trustee
Mr. Kennedy also serves as Trustee of other Fidelity® funds. Previously, Mr. Kennedy served as a Member of the Advisory Board of certain Fidelity® funds (2020) and held a variety of positions at Raytheon Company (aerospace and defense, 1983-2020), including Chairman and Chief Executive Officer (2014-2020) and Executive Vice President and Chief Operating Officer (2013-2014). Mr. Kennedy currently serves as Executive Chairman of the Board of Directors of Raytheon Technologies Corporation (aerospace and defense, 2020-present). He is also a member of the Rutgers School of Engineering Industry Advisory Board (2011-present) and a member of the UCLA Engineering Dean’s Executive Board (2016-present).
Oscar Munoz (1959)
Year of Election or Appointment: 2021
Trustee
Mr. Munoz also serves as Trustee of other Fidelity® funds. Prior to his retirement, Mr. Munoz served as Executive Chairman (2020-2021), Chief Executive Officer (2015-2020), President (2015-2016) and a member of the Board (2010-2021) of United Airlines Holdings, Inc. Mr. Munoz currently serves as a member of the Board of CBRE Group, Inc. (commercial real estate, 2020-present), a member of the Board of Univision Communications, Inc. (Hispanic media, 2020-present) and a member of the Advisory Board of Salesforce.com, Inc. (cloud-based software, 2020-present). Previously, Mr. Munoz served as a Member of the Advisory Board of certain Fidelity® funds (2021).
Garnett A. Smith (1947)
Year of Election or Appointment: 2013
Trustee
Mr. Smith also serves as Trustee of other Fidelity® funds. Prior to his retirement, Mr. Smith served as Chairman and Chief Executive Officer (1990-1997) and President (1986-1990) of Inbrand Corp. (manufacturer of personal absorbent products). Prior to his employment with Inbrand Corp., he was employed by a retail fabric chain and North Carolina National Bank (now Bank of America). Mr. Smith previously served as a member of the Advisory Board of certain Fidelity® funds (2012-2013).
David M. Thomas (1949)
Year of Election or Appointment: 2018
Trustee
Lead Independent Trustee
Mr. Thomas also serves as Trustee of other Fidelity® funds. Previously, Mr. Thomas served as Executive Chairman (2005-2006) and Chairman and Chief Executive Officer (2000-2005) of IMS Health, Inc. (pharmaceutical and healthcare information solutions). Mr. Thomas currently serves as a member of the Board of Fortune Brands Home and Security (home and security products, 2004-present) and as Director (2013-present) and Non-Executive Chairman of the Board (2022-present) of Interpublic Group of Companies, Inc. (marketing communication).
Susan Tomasky (1953)
Year of Election or Appointment: 2020
Trustee
Ms. Tomasky also serves as Trustee of other Fidelity® funds. Prior to her retirement, Ms. Tomasky served in various executive officer positions at American Electric Power Company, Inc. (1998-2011), including most recently as President of AEP Transmission (2007-2011). Ms. Tomasky currently serves as a member of the Board and Sustainability Committee and as Chair of the Audit Committee of Marathon Petroleum Corporation (2018-present) and as a member of the Board, Executive Committee, Corporate Governance Committee and Organization and Compensation Committee and as Chair of the Audit Committee of Public Service Enterprise Group, Inc. (utilities company, 2012-present) and as a member of the Board of its subsidiary company, Public Service Electric and Gas Co. (2021-present). In addition, Ms. Tomasky currently serves as a member (2009-present) and President (2020-present) of the Board of the Royal Shakespeare Company – America (2009-present), as a member of the Board of the Columbus Association for the Performing Arts (2011-present) and as a member of the Board and Kenyon in the World Committee of Kenyon College (2016-present). Previously, Ms. Tomasky served as a Member of the Advisory Board of certain Fidelity® funds (2020), as a member of the Board of the Columbus Regional Airport Authority (2007-2020), as a member of the Board (2011-2018) and Lead Independent Director (2015-2018) of Andeavor Corporation (previously Tesoro Corporation) (independent oil refiner and marketer) and as a member of the Board of Summit Midstream Partners LP (energy, 2012-2018).
Michael E. Wiley (1950)
Year of Election or Appointment: 2008
Trustee
Mr. Wiley also serves as Trustee of other Fidelity® funds. Previously, Mr. Wiley served as a member of the Advisory Board of certain Fidelity® funds (2018-2020), Chairman, President and CEO of Baker Hughes, Inc. (oilfield services, 2000-2004). Mr. Wiley also previously served as a member of the Board of Andeavor Corporation (independent oil refiner and marketer, 2005-2018), a member of the Board of Andeavor Logistics LP (natural resources logistics, 2015-2018) and a member of the Board of High Point Resources (exploration and production, 2005-2020).
+ The information includes the Trustee's principal occupation during the last five years and other information relating to the experience, attributes, and skills relevant to the Trustee's qualifications to serve as a Trustee, which led to the conclusion that the Trustee should serve as a Trustee for the fund.
Advisory Board Members and Officers:
Correspondence intended for a Member of the Advisory Board (if any) may be sent to Fidelity Investments, P.O. Box 55235, Boston, Massachusetts 02205-5235. Correspondence intended for an officer or Peter S. Lynch may be sent to Fidelity Investments, 245 Summer Street, Boston, Massachusetts 02210. Officers appear below in alphabetical order.
Name, Year of Birth; Principal Occupation
Peter S. Lynch (1944)
Year of Election or Appointment: 2018
Member of the Advisory Board
Mr. Lynch also serves as a Member of the Advisory Board of other Fidelity® funds. Mr. Lynch is Vice Chairman and a Director of Fidelity Management & Research Company LLC (investment adviser firm). In addition, Mr. Lynch serves as a Trustee of Boston College and as the Chairman of the Inner-City Scholarship Fund. Previously, Mr. Lynch served as Vice Chairman and a Director of FMR Co., Inc. (investment adviser firm) and on the Special Olympics International Board of Directors (1997-2006).
Craig S. Brown (1977)
Year of Election or Appointment: 2019
Assistant Treasurer
Mr. Brown also serves as an officer of other funds. Mr. Brown serves as Assistant Treasurer of FIMM, LLC (2021-present) and is an employee of Fidelity Investments (2013-present).
John J. Burke III (1964)
Year of Election or Appointment: 2018
Chief Financial Officer
Mr. Burke also serves as Chief Financial Officer of other funds. Mr. Burke serves as Head of Investment Operations for Fidelity Fund and Investment Operations (2018-present) and is an employee of Fidelity Investments (1998-present). Previously Mr. Burke served as head of Asset Management Investment Operations (2012-2018).
William C. Coffey (1969)
Year of Election or Appointment: 2019
Assistant Secretary
Mr. Coffey also serves as Assistant Secretary of other funds. He is Senior Vice President and Deputy General Counsel of FMR LLC (diversified financial services company, 2010-present), and is an employee of Fidelity Investments. Previously, Mr. Coffey served as Secretary and CLO of certain funds (2018-2019); CLO, Secretary, and Senior Vice President of Fidelity Management & Research Company and FMR Co., Inc. (investment adviser firms, 2018-2019); Secretary of Fidelity SelectCo, LLC and Fidelity Investments Money Management, Inc. (investment adviser firms, 2018-2019); CLO of Fidelity Management & Research (Hong Kong) Limited, FMR Investment Management (UK) Limited, and Fidelity Management & Research (Japan) Limited (investment adviser firms, 2018-2019); and Assistant Secretary of certain funds (2009-2018).
Timothy M. Cohen (1969)
Year of Election or Appointment: 2018
Vice President
Mr. Cohen also serves as Vice President of other funds. Mr. Cohen serves as Co-Head of Equity (2018-present), a Director of Fidelity Management & Research (Japan) Limited (investment adviser firm, 2016-present), and is an employee of Fidelity Investments. Previously, Mr. Cohen served as Executive Vice President of Fidelity SelectCo, LLC (2019), Head of Global Equity Research (2016-2018), Chief Investment Officer - Equity and a Director of Fidelity Management & Research (U.K.) Inc. (investment adviser firm, 2013-2015) and as a Director of Fidelity Management & Research (Hong Kong) Limited (investment adviser firm, 2017).
Jonathan Davis (1968)
Year of Election or Appointment: 2010
Assistant Treasurer
Mr. Davis also serves as an officer of other funds. Mr. Davis serves as Assistant Treasurer of FIMM, LLC (2021-present), FMR Capital, Inc. (2017-present), FD Funds GP LLC (2021-present), FD Funds Holding LLC (2021-present), and FD Funds Management LLC (2021-present); and is an employee of Fidelity Investments. Previously, Mr. Davis served as Vice President and Associate General Counsel of FMR LLC (diversified financial services company, 2003-2010).
Laura M. Del Prato (1964)
Year of Election or Appointment: 2018
Assistant Treasurer
Ms. Del Prato also serves as an officer of other funds. Ms. Del Prato serves as Assistant Treasurer of FIMM, LLC (2021-present) and is an employee of Fidelity Investments (2017-present). Previously, Ms. Del Prato served as President and Treasurer of The North Carolina Capital Management Trust: Cash Portfolio and Term Portfolio (2018-2020). Prior to joining Fidelity Investments, Ms. Del Prato served as a Managing Director and Treasurer of the JPMorgan Mutual Funds (2014-2017). Prior to JPMorgan, Ms. Del Prato served as a partner at Cohen Fund Audit Services (accounting firm, 2012-2013) and KPMG LLP (accounting firm, 2004-2012).
Colm A. Hogan (1973)
Year of Election or Appointment: 2020
Assistant Treasurer
Mr. Hogan also serves as an officer of other funds. Mr. Hogan serves as Assistant Treasurer of FIMM, LLC (2021-present) and FMR Capital, Inc. (2017-present) and is an employee of Fidelity Investments (2005-present). Previously, Mr. Hogan served as Deputy Treasurer of certain Fidelity® funds (2016-2020) and Assistant Treasurer of certain Fidelity® funds (2016-2018).
Pamela R. Holding (1964)
Year of Election or Appointment: 2018
Vice President
Ms. Holding also serves as Vice President of other funds. Ms. Holding serves as Co-Head of Equity (2018-present) and is an employee of Fidelity Investments (2013-present). Previously, Ms. Holding served as Executive Vice President of Fidelity SelectCo, LLC (2019) and as Chief Investment Officer of Fidelity Institutional Asset Management (2013-2018).
Cynthia Lo Bessette (1969)
Year of Election or Appointment: 2019
Secretary and Chief Legal Officer (CLO)
Ms. Lo Bessette also serves as an officer of other funds. Ms. Lo Bessette serves as CLO, Secretary, and Senior Vice President of Fidelity Management & Research Company LLC (investment adviser firm, 2019-present); CLO of Fidelity Management & Research (Hong Kong) Limited, FMR Investment Management (UK) Limited, and Fidelity Management & Research (Japan) Limited (investment adviser firms, 2019-present); Secretary of FD Funds GP LLC (2021-present), FD Funds Holding LLC (2021-present), and FD Funds Management LLC (2021-present); and Assistant Secretary of FIMM, LLC (2019-present). She is a Senior Vice President and Deputy General Counsel of FMR LLC (diversified financial services company, 2019-present), and is an employee of Fidelity Investments. Previously, Ms. Lo Bessette served as CLO, Secretary, and Senior Vice President of FMR Co., Inc. (investment adviser firm, 2019); Secretary of Fidelity SelectCo, LLC and Fidelity Investments Money Management, Inc. (investment adviser firms, 2019). Prior to joining Fidelity Investments, Ms. Lo Bessette was Executive Vice President, General Counsel (2016-2019) and Senior Vice President, Deputy General Counsel (2015-2016) of OppenheimerFunds (investment management company) and Deputy Chief Legal Officer (2013-2015) of Jennison Associates LLC (investment adviser firm).
Chris Maher (1972)
Year of Election or Appointment: 2020
Deputy Treasurer
Mr. Maher also serves as an officer of other funds. Mr. Maher serves as Assistant Treasurer of FIMM, LLC (2021-present) and FMR Capital, Inc. (2017-present), and is an employee of Fidelity Investments (2008-present). Previously, Mr. Maher served as Assistant Treasurer of certain funds (2013-2020); Vice President of Asset Management Compliance (2013), Vice President of the Program Management Group of FMR (investment adviser firm, 2010-2013), and Vice President of Valuation Oversight (2008-2010).
Jason P. Pogorelec (1975)
Year of Election or Appointment: 2020
Chief Compliance Officer
Mr. Pogorelec also serves as Chief Compliance Officer of other funds. Mr. Pogorelec is a senior Vice President of Asset Management Compliance for Fidelity Investments and is an employee of Fidelity Investments (2006-present). Previously, Mr. Pogorelec served as Vice President, Associate General Counsel for Fidelity Investments (2010-2020) and Assistant Secretary of certain Fidelity funds (2015-2020).
Brett Segaloff (1972)
Year of Election or Appointment: 2021
Anti-Money Laundering (AML) Officer
Mr. Segaloff also serves as an AML Officer of other funds and other related entities. He is Director, Anti-Money Laundering (2007-present) of FMR LLC (diversified financial services company) and is an employee of Fidelity Investments (1996-present).
Stacie M. Smith (1974)
Year of Election or Appointment: 2018
President and Treasurer
Ms. Smith also serves as an officer of other funds. Ms. Smith serves as Assistant Treasurer of FIMM, LLC (2021-present) and FMR Capital, Inc. (2017-present), is an employee of Fidelity Investments (2009-present), and has served in other fund officer roles. Prior to joining Fidelity Investments, Ms. Smith served as Senior Audit Manager of Ernst & Young LLP (accounting firm, 1996-2009). Previously, Ms. Smith served as Assistant Treasurer (2013-2019) and Deputy Treasurer (2013-2016) of certain Fidelity® funds.
Jim Wegmann (1979)
Year of Election or Appointment: 2019
Assistant Treasurer
Mr. Wegmann also serves as an officer of other funds. Mr. Wegmann serves as Assistant Treasurer of FIMM, LLC (2021-present) and is an employee of Fidelity Investments (2011-present). Previously, Mr. Wegmann served as Assistant Treasurer of certain Fidelity® funds (2019-2021).
Shareholder Expense Example
As a shareholder, you incur two types of costs: (1) transaction costs, which may include sales charges (loads) on purchase payments or redemption proceeds, as applicable and (2) ongoing costs, which generally include management fees, distribution and/or service (12b-1) fees and other Fund expenses. This Example is intended to help you understand your ongoing costs (in dollars) of investing in a fund and to compare these costs with the ongoing costs of investing in other mutual funds.
The Example is based on an investment of $1,000 invested at the beginning of the period and held for the entire period (February 1, 2022 to July 31, 2022).
Actual Expenses
The first line of the accompanying table provides information about actual account values and actual expenses. You may use the information in this line, together with the amount you invested, to estimate the expenses that you paid over the period. Simply divide your account value by $1,000.00 (for example, an $8,600 account value divided by $1,000.00 = 8.6), then multiply the result by the number in the first line for a class/Fund under the heading entitled "Expenses Paid During Period" to estimate the expenses you paid on your account during this period. If any fund is a shareholder of any underlying mutual funds or exchange-traded funds (ETFs) (the Underlying Funds), such fund indirectly bears its proportional share of the expenses of the Underlying Funds in addition to the direct expenses incurred presented in the table. These fees and expenses are not included in the annualized expense ratio used to calculate the expense estimate in the table below.
Hypothetical Example for Comparison Purposes
The second line of the accompanying table provides information about hypothetical account values and hypothetical expenses based on the actual expense ratio and an assumed rate of return of 5% per year before expenses, which is not the actual return. The hypothetical account values and expenses may not be used to estimate the actual ending account balance or expenses you paid for the period. You may use this information to compare the ongoing costs of investing in the Fund and other funds. To do so, compare this 5% hypothetical example with the 5% hypothetical examples that appear in the shareholder reports of the other funds. If any fund is a shareholder of any Underlying Funds, such fund indirectly bears its proportional share of the expenses of the Underlying Funds in addition to the direct expenses as presented in the table. These fees and expenses are not included in the annualized expense ratio used to calculate the expense estimate in the table below.
Please note that the expenses shown in the table are meant to highlight your ongoing costs only and do not reflect any transaction costs. Therefore, the second line of the table is useful in comparing ongoing costs only, and will not help you determine the relative total costs of owning different funds. In addition, if these transactional costs were included, your costs would have been higher.
| | Annualized Expense Ratio-A | Beginning
Account Value
February 1, 2022 | Ending
Account Value
July 31, 2022 | Expenses Paid
During Period-B
February 1, 2022
to July 31, 2022 |
| Fidelity Advisor Real Estate Fund | | | | |
| Class A | 1.07% | | | |
| Actual | | $1,000.00 | $941.30 | $5.15 |
| Hypothetical-C | | $1,000.00 | $1,019.49 | $5.36 |
| Class M | 1.28% | | | |
| Actual | | $1,000.00 | $940.20 | $6.16 |
| Hypothetical-C | | $1,000.00 | $1,018.45 | $6.41 |
| Class C | 1.86% | | | |
| Actual | | $1,000.00 | $937.50 | $8.94 |
| Hypothetical-C | | $1,000.00 | $1,015.57 | $9.30 |
| Class I | .86% | | | |
| Actual | | $1,000.00 | $942.00 | $4.14 |
| Hypothetical-C | | $1,000.00 | $1,020.53 | $4.31 |
| Class Z | .63% | | | |
| Actual | | $1,000.00 | $943.30 | $3.04 |
| Hypothetical-C | | $1,000.00 | $1,021.67 | $3.16 |
A Annualized expense ratio reflects expenses net of applicable fee waivers.
B Expenses are equal to the annualized expense ratio, multiplied by the average account value over the period, multiplied by 181/ 365 (to reflect the one-half year period). The fees and expenses of any Underlying Funds are not included in each annualized expense ratio.
C 5% return per year before expenses
Distributions (Unaudited)
The dividend and capital gains distributions for the fund(s) are available on Fidelity.com or Institutional.Fidelity.com.
The fund hereby designates as a capital gain dividend with respect to the taxable year ended July 31, 2022, $47,668,234, or, if subsequently determined to be different, the net capital gain of such year.
The fund designates 100% of the short-term capital gain dividend distributed in December during the fiscal year as qualifying to be taxed as short-term capital gain dividends for nonresident alien shareholders.
Fidelity Advisor Real Estate Fund Class A, Class M, Class C, Class I, and Class Z designate 1% of the dividends distributed in December during the fiscal year as qualifying for the dividends–received deduction for corporate shareholders.
Fidelity Advisor Real Estate Fund Class A, Class M, Class C, Class I, and Class Z designate 1%, 1%, 2%, 1%, and 1%, respectively of the dividends distributed in December during the fiscal year as amounts which may be taken into account as a dividend for purposes of the maximum rate under section 1(h)(11) of the Internal Revenue Code.
A percentage of the dividends distributed during the fiscal year qualify as a section 199A dividend:
| | Class A | Class M | Class C | Class I | Class Z |
| Fidelity Advisor Real Estate Fund | | | | | |
| September 2021 | 96% | 100% | – | 65% | 43% |
| December 2021 | 100% | 100% | 99% | 100% | 98% |
|
The fund will notify shareholders in January 2023 of amounts for use in preparing 2022 income tax returns.
Board Approval of Investment Advisory Contracts and Management Fees
Fidelity Advisor Real Estate Fund
Each year, the Board of Trustees, including the Independent Trustees (together, the Board), votes on the renewal of the management contract with Fidelity Management & Research Company LLC (FMR) and the sub-advisory agreements (together, the Advisory Contracts) for the fund. FMR and the sub-advisers are referred to herein as the Investment Advisers. The Board, assisted by the advice of fund counsel and Independent Trustees' counsel, requests and considers a broad range of information relevant to the renewal of the Advisory Contracts throughout the year.
The Board meets regularly and, at each of its meetings, covers an extensive agenda of topics and materials and considers factors that are relevant to its annual consideration of the renewal of the fund's Advisory Contracts, including the services and support provided to the fund and its shareholders. The Board has established various standing committees (Committees), each composed of and chaired by Independent Trustees with varying backgrounds, to which the Board has assigned specific subject matter responsibilities in order to enhance effective decision-making by the Board. The Board, acting directly and through its Committees, requests and receives information concerning the annual consideration of the renewal of the fund's Advisory Contracts. The Board also meets as needed to review matters specifically related to the Board's annual consideration of the renewal of the Advisory Contracts. Members of the Board may also meet with trustees of other Fidelity funds through joint ad hoc committees to discuss certain matters relevant to all of the Fidelity funds.
At its May 2022 meeting, the Board unanimously determined to renew the fund's Advisory Contracts. In reaching its determination, the Board considered all factors it believed relevant, including (i) the nature, extent, and quality of the services provided to the fund and its shareholders (including the investment performance of the fund); (ii) the competitiveness relative to peer funds of the fund's management fee and the total expense ratio of a representative class (Class I); (iii) the total costs of the services provided by and the profits realized by Fidelity from its relationships with the fund; and (iv) the extent to which, if any, economies of scale exist and are realized as the fund grows, and whether any economies of scale are appropriately shared with fund shareholders.
In considering whether to renew the Advisory Contracts for the fund, the Board reached a determination, with the assistance of fund counsel and Independent Trustees' counsel and through the exercise of its business judgment, that the renewal of the Advisory Contracts was in the best interests of the fund and its shareholders and that the compensation payable under the Advisory Contracts was fair and reasonable. The Board's decision to renew the Advisory Contracts was not based on any single factor, but rather was based on a comprehensive consideration of all the information provided to the Board at its meetings throughout the year. The Board, in reaching its determination to renew the Advisory Contracts, was aware that shareholders of the fund have a broad range of investment choices available to them, including a wide choice among funds offered by Fidelity's competitors, and that the fund's shareholders, who have the opportunity to review and weigh the disclosure provided by the fund in its prospectus and other public disclosures, have chosen to invest in this fund, which is part of the Fidelity family of funds.
Nature, Extent, and Quality of Services Provided. The Board considered Fidelity's staffing as it relates to the fund, including the backgrounds of investment personnel of Fidelity, and also considered the fund's investment objective, strategies, and related investment philosophy. The Independent Trustees also had discussions with senior management of Fidelity's investment operations and investment groups. The Board considered the structure of the investment personnel compensation program and whether this structure provides appropriate incentives to act in the best interests of the fund. Additionally, the Board considered the portfolio managers' investments, if any, in the funds that they manage. The Board also considered the steps Fidelity had taken to ensure the continued provision of high quality services to the Fidelity funds during the COVID-19 pandemic, including the expansion of staff in client facing positions to maintain service levels in periods of high volumes and volatility.
Resources Dedicated to Investment Management and Support Services. The Board and the Fund Oversight and Research Committees reviewed the general qualifications and capabilities of Fidelity's investment staff, including its size, education, experience, and resources, as well as Fidelity's approach to recruiting, training, managing, and compensating investment personnel. The Board noted the resources devoted to expansion of Fidelity's global investment organization, and that Fidelity's analysts have extensive resources, tools, and capabilities that allow them to conduct sophisticated quantitative and fundamental analysis, as well as credit analysis of issuers, counterparties, and guarantors. Further, the Board considered that Fidelity's investment professionals have sufficient access to global information and data so as to provide competitive investment results over time, and that those professionals also have access to sophisticated tools that permit them to assess portfolio construction and risk and performance attribution characteristics continuously, as well as to transmit new information and research conclusions rapidly around the world. Additionally, in its deliberations, the Board considered Fidelity's trading, risk management, compliance, and technology and operations capabilities and resources, which are integral parts of the investment management process.
Shareholder and Administrative Services. The Board considered (i) the nature, extent, quality, and cost of advisory, administrative, and shareholder services performed by the Investment Advisers and their affiliates under the Advisory Contracts and under separate agreements covering transfer agency, pricing and bookkeeping, and securities lending services for the fund; (ii) the nature and extent of the supervision of third party service providers, principally custodians, subcustodians, and pricing vendors; and (iii) the resources devoted to, and the record of compliance with, the fund's compliance policies and procedures. The Board also reviewed the allocation of fund brokerage, including allocations to brokers affiliated with the Investment Advisers, the use of brokerage commissions to pay fund expenses, and the use of "soft" commission dollars to pay for research services.
The Board noted that the growth of fund assets over time across the complex allows Fidelity to reinvest in the development of services designed to enhance the value and convenience of the Fidelity funds as investment vehicles. These services include 24-hour access to account information and market information over the Internet and through telephone representatives, investor education materials, and asset allocation tools. The Board also considered that it reviews customer service metrics such as telephone response times, continuity of services on the website and metrics addressing services at Fidelity Investor Centers.
Investment in a Large Fund Family. The Board considered the benefits to shareholders of investing in a Fidelity fund, including the benefits of investing in a fund that is part of a large family of funds offering a variety of investment disciplines and providing a large variety of mutual fund investor services. The Board noted that Fidelity had taken, or had made recommendations that resulted in the Fidelity funds taking, a number of actions over the previous year that benefited particular funds, including: (i) continuing to dedicate additional resources to Fidelity's investment research process, which includes meetings with management of issuers of securities in which the funds invest; (ii) continuing efforts to enhance Fidelity's global research capabilities; (iii) launching new funds and ETFs with innovative structures, strategies and pricing and making other enhancements to meet client needs; (iv) launching new share classes of existing funds; (v) eliminating purchase minimums and broadening eligibility requirements for certain funds and share classes; (vi) reducing management fees and total expenses for certain target date funds and classes and index funds; (vii) lowering expenses for certain existing funds and classes by implementing or lowering expense caps; (viii) rationalizing product lines and gaining increased efficiencies from fund mergers and liquidations; (ix) continuing to develop, acquire and implement systems and technology to improve services to the funds and shareholders, strengthen information security, and increase efficiency; and (x) continuing to implement enhancements to further strengthen Fidelity's product line to increase investors' probability of success in achieving their investment goals, including retirement income goals.
Investment Performance. The Board considered whether the fund has operated in accordance with its investment objective, as well as its record of compliance with its investment restrictions and its performance history.
The Board took into account discussions that occur at Board meetings throughout the year with representatives of the Investment Advisers about fund investment performance. In this regard the Board noted that as part of regularly scheduled fund reviews and other reports to the Board on fund performance, the Board considers annualized return information for the fund for different time periods, measured against an appropriate securities market index (benchmark index). The Board also reviews and considers information about performance attribution. In its evaluation of fund investment performance, the Board gave particular attention to information indicating changes in performance of certain Fidelity funds for specific time periods and discussed with the Investment Advisers the reasons for any overperformance or underperformance.
In addition to reviewing absolute and relative fund performance, the Independent Trustees periodically consider the appropriateness of fund performance metrics in evaluating the results achieved. In general, the Independent Trustees believe that fund performance should be evaluated based on net performance (after fees and expenses) of the representative class, compared to appropriate benchmark indices, over appropriate time periods that may include full market cycles, taking into account relevant factors including the following: general market conditions; issuer-specific information; and fund cash flows and other factors.
The Independent Trustees recognize that shareholders evaluate performance on a net basis over their own holding periods, for which one-, three-, and five-year periods are often used as a proxy. For this reason, the performance information reviewed by the Board also included net cumulative total return information for the fund and an appropriate benchmark index for the most recent one-, three-, and five-year periods ended September 30, 2021, as shown below.
Fidelity Advisor Real Estate Fund
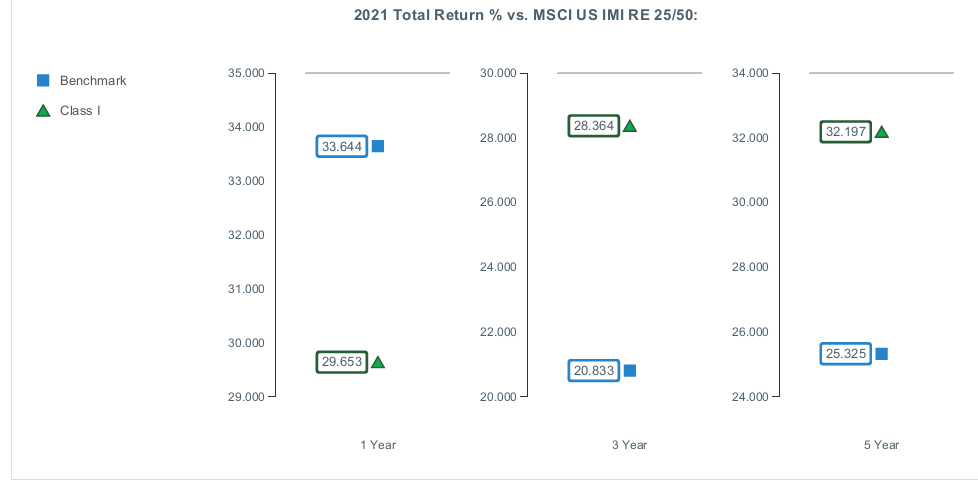
Based on its review, the Board concluded that the nature, extent, and quality of services provided to the fund under the Advisory Contracts should continue to benefit the shareholders of the fund.
Competitiveness of Management Fee and Total Expense Ratio. The Board considered the fund's management fee and total expense ratio compared to "mapped groups" of competitive funds and classes created for the purpose of facilitating the Trustees' competitive analysis of management fees and total expenses. Fidelity creates "mapped groups" by combining similar Lipper investment objective categories that have comparable investment mandates. For this purpose, all sector focused equity funds are grouped in the same mapped group. Combining Lipper investment objective categories aids the Board's management fee and total expense ratio comparisons by broadening the competitive group used for comparison.
Management Fee. The Board considered two proprietary management fee comparisons for the 12-month periods ended September 30 (June 30 for periods ended 2019 and 2018 and December 31 for periods prior to 2018) shown in basis points (BP) in the chart below. The group of Lipper funds used by the Board for management fee comparisons is referred to below as the "Total Mapped Group." The Total Mapped Group comparison focuses on a fund's standing in terms of gross management fees before expense reimbursements or caps relative to the total universe of funds with comparable investment mandates (i.e., sector equities), regardless of whether their management fee structures also are comparable. Funds with comparable management fee structures have similar management fee contractual arrangements (
e.g., flat rate charged for advisory services, all-inclusive fee rate,
etc.). "TMG %" represents the percentage of funds in the Total Mapped Group that had management fees that were lower than the fund's. For example, a hypothetical TMG % of 20% would mean that 80% of the funds in the Total Mapped Group had higher, and 20% had lower, management fees than the fund. The fund's actual TMG %s and the number of funds in the Total Mapped Group are in the chart below. The "Asset-Sized Peer Group" (ASPG) comparison focuses on a fund's standing relative to a subset of non-Fidelity funds within the Total Mapped Group that are similar in size and management fee structure. For example, if a fund is in the first quartile of the ASPG, the fund's management fee ranks in the least expensive or lowest 25% of funds in the ASPG. The ASPG represents at least 15% of the funds in the Total Mapped Group with comparable asset size and management fee structures, subject to a minimum of 50 funds (or all funds in the Total Mapped Group if fewer than 50). Additional information, such as the ASPG quartile in which the fund's management fee rate ranked, is also included in the chart and was considered by the Board.
Fidelity Advisor Real Estate Fund
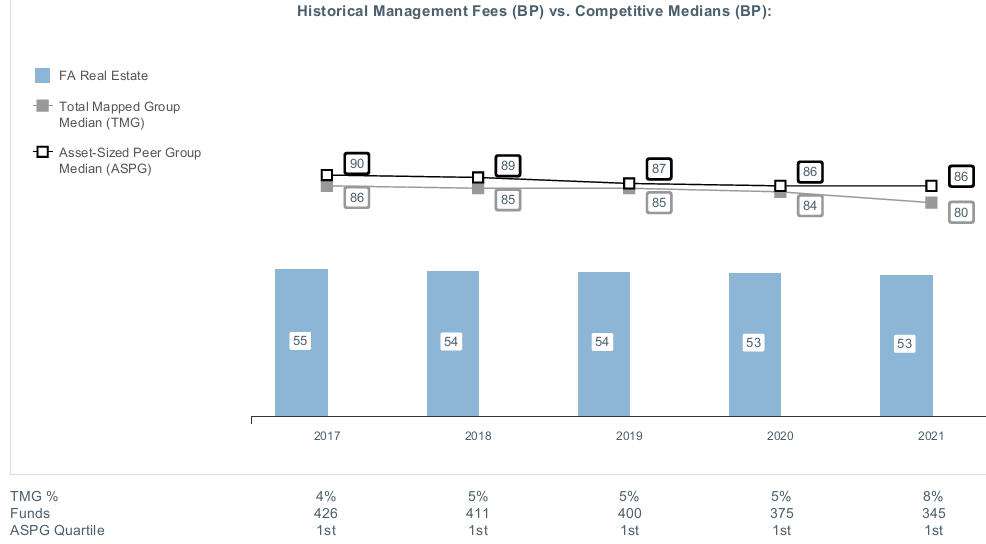
The Board noted that the fund's management fee rate ranked below the median of its Total Mapped Group and below the median of its ASPG for the 12-month period ended September 30, 2021.
The Board also considered that, for funds subject to the group fee, FMR agreed to voluntarily waive fees over a specified period of time in amounts designed to account for assets converted from certain funds to certain collective investment trusts.
Based on its review, the Board concluded that the fund's management fee is fair and reasonable in light of the services that the fund receives and the other factors considered.
Total Expense Ratio. In its review of the total expense ratio of the representative class (Class I), the Board considered the fund's management fee rate as well as other fund or class expenses, as applicable, such as transfer agent fees, pricing and bookkeeping fees, fund-paid 12b-1 fees, and custodial, legal, and audit fees. The Board also noted that Fidelity may agree to waive fees or reimburse expenses from time to time, and the extent to which, if any, it has done so for the fund. The fund's representative class is compared to those funds and classes in the Total Mapped Group (used by the Board for management fee comparisons) that have a similar sales load structure. The Board also considered a total expense ASPG comparison, which focuses on the total expenses of the representative class relative to a subset of non-Fidelity funds within the total expense similar sales load structure group. The total expense ASPG is limited to 15 larger and 15 smaller classes in fund average assets for a total of 30 classes, where possible. The total expense ASPG comparison excludes performance adjustments and fund-paid 12b-1 fees to eliminate variability in fee structures.
The Board noted that the total net expense ratio of Class I ranked below the similar sales load structure group competitive median and below the ASPG competitive median for the 12-month period ended September 30, 2021.
Fees Charged to Other Fidelity Clients. The Board also considered Fidelity fee structures and other information with respect to clients of Fidelity, such as other funds advised or subadvised by Fidelity, pension plan clients, and other institutional clients with similar mandates. The Board noted that a joint ad hoc committee created by it and the boards of other Fidelity funds periodically reviews and compares Fidelity's institutional investment advisory business with its business of providing services to the Fidelity funds and also noted the most recent findings of the committee. The Board noted that the committee's review included a consideration of the differences in services provided, fees charged, and costs incurred, as well as competition in the markets serving the different categories of clients.
Based on its review of total expense ratios and fees charged to other Fidelity clients, the Board concluded that the total expense ratio of each class of the fund was reasonable in light of the services that the fund and its shareholders receive and the other factors considered.
Costs of the Services and Profitability. The Board considered the revenues earned and the expenses incurred by Fidelity in conducting the business of developing, marketing, distributing, managing, administering and servicing the fund and servicing the fund's shareholders. The Board also considered the level of Fidelity's profits in respect of all the Fidelity funds.
On an annual basis, Fidelity presents to the Board information about the profitability of its relationships with the fund. Fidelity calculates profitability information for each fund, as well as aggregate profitability information for groups of Fidelity funds and all Fidelity funds, using a series of detailed revenue and cost allocation methodologies which originate with the books and records of Fidelity on which Fidelity's audited financial statements are based. The Audit Committee of the Board reviews any significant changes from the prior year's methodologies and the full Board approves such changes.
A public accounting firm has been engaged annually by the Board as part of the Board's assessment of Fidelity's profitability analysis. The engagement includes the review and assessment of the methodologies used by Fidelity in determining the revenues and expenses attributable to Fidelity's mutual fund business, and completion of agreed-upon procedures in respect of the mathematical accuracy of certain fund profitability information and its conformity to established allocation methodologies. After considering the reports issued under the engagement and information provided by Fidelity, the Board concluded that while other allocation methods may also be reasonable, Fidelity's profitability methodologies are reasonable in all material respects.
The Board also reviewed Fidelity's non-fund businesses and potential indirect benefits such businesses may have received as a result of their association with Fidelity's mutual fund business (i.e., fall-out benefits) as well as cases where Fidelity's affiliates may benefit from the funds' business. The Board considered areas where potential indirect benefits to the Fidelity funds from their relationships with Fidelity may exist. The Board's consideration of these matters was informed by the findings of a joint ad hoc committee created by it and the boards of other Fidelity funds to evaluate potential fall-out benefits.
The Board considered the costs of the services provided by and the profits realized by Fidelity in connection with the operation of the fund and was satisfied that the profitability was not excessive.
Economies of Scale. The Board considered whether there have been economies of scale in respect of the management of the Fidelity funds, whether the Fidelity funds (including the fund) have appropriately benefited from any such economies of scale, and whether there is potential for realization of any further economies of scale. The Board considered the extent to which the fund will benefit from economies of scale as assets grow through increased services to the fund, through waivers or reimbursements, or through fee or expense ratio reductions. The Board also noted that a committee (the Economies of Scale Committee) created by it and the boards of other Fidelity funds periodically analyzes whether Fidelity attains economies of scale in respect of the management and servicing of the Fidelity funds, whether the Fidelity funds have appropriately benefited from such economies of scale, and whether there is potential for realization of any further economies of scale.
The Board recognized that the fund's management contract incorporates a "group fee" structure, which provides for lower group fee rates as total "group assets" increase, and for higher group fee rates as total "group assets" decrease ("group assets" as defined in the management contract). FMR calculates the group fee rates based on a tiered asset "breakpoint" schedule that varies based on asset class. The Board considered that the group fee is designed to deliver the benefits of economies of scale to fund shareholders when total Fidelity fund assets increase, even if assets of any particular fund are unchanged or have declined, because some portion of Fidelity's costs are attributable to services provided to all Fidelity funds, and all funds benefit if those costs can be allocated among more assets. The Board further considered that Fidelity agreed to impose a temporary fee waiver in the form of additional breakpoints to the current breakpoint schedule. The Board concluded that, given the group fee structure, fund shareholders will benefit from lower management fees as "group assets" increase at the fund complex level, regardless of whether Fidelity achieves any such economies of scale.
The Board concluded, taking into account the analysis of the Economies of Scale Committee, that economies of scale, if any, are being appropriately shared between fund shareholders and Fidelity.
Additional Information Requested by the Board. In order to develop fully the factual basis for consideration of the Fidelity funds' advisory contracts, the Board requested and received additional information on certain topics, including: (i) fund flow and performance trends, in particular the underperformance of certain funds and strategies, and Fidelity's long-term strategies for certain funds, including any consideration of fund liquidations or mergers; (ii) the operation of performance fees, competitor use of performance fees, and consideration of the expansion of performance fees to additional funds; (iii) Fidelity's pricing philosophy compared to competitors; (iv) fund profitability methodology and data; (v) evaluation of competitive fund data and peer group classifications and fee and expense comparisons; (vi) the management fee and expense structures for different funds and classes and information about the differences between various fee and expense structures; (vii) group fee breakpoints and related voluntary fee waivers; and (viii) information regarding other accounts managed by Fidelity and the funds' sub-advisory arrangements.
Based on its evaluation of all of the conclusions noted above, and after considering all factors it believed relevant, the Board concluded that the advisory fee arrangements are fair and reasonable and that the fund's Advisory Contracts should be renewed.
Liquidity Risk Management Program
The Securities and Exchange Commission adopted Rule 22e-4 under the Investment Company Act of 1940 (the Liquidity Rule) to promote effective liquidity risk management throughout the open-end investment company industry, thereby reducing the risk that funds will be unable to meet their redemption obligations and mitigating dilution of the interests of fund shareholders.
The Fund has adopted and implemented a liquidity risk management program pursuant to the Liquidity Rule (the Program) effective December 1, 2018. The Program is reasonably designed to assess and manage the Fund’s liquidity risk and to comply with the requirements of the Liquidity Rule. The Fund’s Board of Trustees (the Board) has designated the Fund’s investment adviser as administrator of the Program. The Fidelity advisers have established a Liquidity Risk Management Committee (the LRM Committee) to manage the Program for each of the Fidelity Funds. The LRM Committee monitors the adequacy and effectiveness of implementation of the Program and on a periodic basis assesses each Fund’s liquidity risk based on a variety of factors including (1) the Fund’s investment strategy, (2) portfolio liquidity and cash flow projections during normal and reasonably foreseeable stressed conditions, (3) shareholder redemptions, (4) borrowings and other funding sources and (5) in the case of exchange-traded funds, certain additional factors including the effect of the Fund’s prices and spreads, market participants, and basket compositions on the overall liquidity of the Fund’s portfolio, as applicable.
In accordance with the Program, each of the Fund’s portfolio investments is classified into one of four liquidity categories described below based on a determination of a reasonable expectation for how long it would take to convert the investment to cash (or sell or dispose of the investment) without significantly changing its market value.
- Highly liquid investments – cash or convertible to cash within three business days or less
- Moderately liquid investments – convertible to cash in three to seven calendar days
- Less liquid investments – can be sold or disposed of, but not settled, within seven calendar days
- Illiquid investments – cannot be sold or disposed of within seven calendar days
Liquidity classification determinations take into account a variety of factors including various market, trading and investment-specific considerations, as well as market depth, and generally utilize analysis from a third-party liquidity metrics service.
The Liquidity Rule places a 15% limit on a fund’s illiquid investments and requires funds that do not primarily hold assets that are highly liquid investments to determine and maintain a minimum percentage of the fund’s net assets to be invested in highly liquid investments (highly liquid investment minimum or HLIM). The Program includes provisions reasonably designed to comply with the 15% limit on illiquid investments and for determining, periodically reviewing and complying with the HLIM requirement as applicable.
At a recent meeting of the Fund’s Board of Trustees, the LRM Committee provided a written report to the Board pertaining to the operation, adequacy, and effectiveness of implementation of the Program for the annual period from December 1, 2020 through November 30, 2021. The report concluded that the Program has been implemented and is operating effectively and is reasonably designed to assess and manage the Fund’s liquidity risk.
ARE-ANN-0922
1.789690.119