0000315700fmr:C000014551_2_AdditionalIndexMember_AsOf_2023Member2023-07-310000315700fmr:C000014563_2_AdditionalIndexMember_AsOf_2019Member2019-07-310000315700fmr:C000014541_1_AdditionalIndexMember_AsOf_2021Member2021-07-31
UNITED STATES
SECURITIES AND EXCHANGE COMMISSION
Washington, D.C. 20549
FORM N-CSR
CERTIFIED SHAREHOLDER REPORT OF REGISTERED
MANAGEMENT INVESTMENT COMPANIES
Investment Company Act file number 811-03010
Fidelity Advisor Series VII
(Exact name of registrant as specified in charter)
245 Summer St., Boston, Massachusetts 02210
(Address of principal executive offices) (Zip code)
Margaret Carey, Secretary
245 Summer St.
Boston, Massachusetts 02210
(Name and address of agent for service)
Registrant's telephone number, including area code:
617-563-7000
| |
Date of fiscal year end: | July 31 |
|
|
Date of reporting period: | July 31, 2024 |
Item 1.
Reports to Stockholders
| |
| | ANNUAL SHAREHOLDER REPORT | AS OF JULY 31, 2024 | This report describes changes to the Fund that occurred during the reporting period. |
| | Fidelity Advisor® Global Real Estate Fund Fidelity Advisor® Global Real Estate Fund Class I : FWRIX |
| | | |
This annual shareholder report contains information about Fidelity Advisor® Global Real Estate Fund for the period August 1, 2023 to July 31, 2024. You can find additional information about the Fund at fundresearch.fidelity.com/prospectus/sec. You can also request this information by contacting us at 1-877-208-0098 or by sending an e-mail to fidfunddocuments@fidelity.com.
What were your Fund costs for the last year?(based on hypothetical $10,000 investment)
FUND COST (PREVIOUS YEAR)
| | Costs of a $10,000 investment | Costs paid as a percentage of a $10,000 investment | |
| Class I | $ 99 | 0.95% | |
What affected the Fund's performance this period?
•Investors in global real estate securities experienced fluctuating market conditions throughout the 12 months ending July 31, 2024, initially declining due to rate hike concerns but later rallying as hopes for rate cuts in 2024 grew. Market returns were weakened by a broadly stronger U.S. dollar.
•Against this backdrop, an underweight in Asia Pacific ex Japan - primarily Hong Kong - along with security selection in Japan, contributed to the fund's performance versus the FTSE® EPRASM/NAREIT® Developed Index for the fiscal year.
•By industry, security selection was the primary contributor, especially among diversified real estate activities stocks. Favorable picks in health care also boosted the fund's relative performance. Investment choices and an underweight in the diversified real estate segment helped as well.
•The top individual relative contributor was an overweight in Mitsui Fudosan (+57%). The company was one of the fund's biggest holdings. Outsized exposure to Mitsubishi Estate (+42%) was another plus. Not owning Wharf Real Estate Investment, an index component that returned -52%, also helped.
•In contrast, from a regional standpoint, stock picks in the U.K. and U.S. detracted from the fund's performance versus the real estate index.
•The biggest relative detractors were stock picks and an overweight in the single-family residential industry. Subpar investment choices and outsized exposure to industrial and multi-family residential stocks also were detrimental to performance.
•Not owning Simon Property Group, an index component that gained about 30%, was the largest individual relative detractor. An overweight stake in UOL Group (-22%) pressured performance as well. This period we decreased our stake in the company. Outsized exposure to Mitsui Fudosan Logistics Park (-18%) also hurt.
•Notable changes in positioning include decreased exposure to real estate stocks in Singapore and a higher allocation to the U.K. By industry, meaningful allocation shifts include increased exposure to the self storage industry and a reduction in hotel & resort holdings.
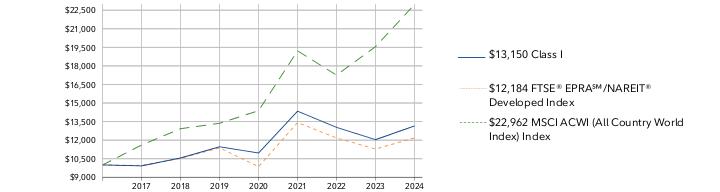
How did the Fund perform over the life of Fund?
CUMULATIVE PERFORMANCE
August 11, 2016 through July 31, 2024.
Initial investment of $10,000.
Class I | $10,000 | $9,920 | $10,563 | $11,466 | $10,962 | $14,341 | $13,033 | $12,040 | $13,150 |
FTSE® EPRA℠/NAREIT® Developed Index | $10,000 | $9,960 | $10,524 | $11,380 | $9,855 | $13,420 | $12,176 | $11,285 | $12,184 |
MSCI ACWI (All Country World Index) Index | $10,000 | $11,606 | $12,928 | $13,363 | $14,382 | $19,214 | $17,256 | $19,556 | $22,962 |
| | 2016 | 2017 | 2018 | 2019 | 2020 | 2021 | 2022 | 2023 | 2024 |
AVERAGE ANNUAL TOTAL RETURNS: | | 1 Year | 5 Year | Life of Fund A |
| Class I | 9.22% | 2.78% | 3.49% |
| FTSE® EPRA℠/NAREIT® Developed Index | 7.97% | 1.38% | 2.51% |
| MSCI ACWI (All Country World Index) Index | 17.42% | 11.43% | 10.99% |
A From August 11, 2016
Visit institutional.fidelity.com for more recent performance information. |
The Fund's past performance is not a good predictor of the Fund's future performance. The graph and table do not reflect the deduction of taxes that a shareholder would pay on fund distributions or redemption of fund shares. |
Key Fund Statistics (as of July 31, 2024)
KEY FACTS | | |
| Fund Size | $6,027,346 | |
| Number of Holdings | 73 | |
| Total Advisory Fee | $39,394 | |
| Portfolio Turnover | 32% | |
What did the Fund invest in?
(as of July 31, 2024)
TOP INDUSTRIES (% of Fund's net assets) |
| Residential REITs | 19.8 | |
| Specialized REITs | 19.1 | |
| Industrial REITs | 18.3 | |
| Retail REITs | 18.0 | |
| Real Estate Management & Development | 11.9 | |
| Health Care REITs | 7.1 | |
| Diversified REITs | 2.8 | |
| Hotel & Resort REITs | 1.3 | |
| Office REITs | 0.6 | |
| |
| Common Stocks | 98.9 |
| Short-Term Investments and Net Other Assets (Liabilities) | 1.1 |
ASSET ALLOCATION (% of Fund's net assets) |
|
|
| United States | 61.9 |
| United Kingdom | 8.3 |
| Japan | 8.2 |
| Australia | 4.9 |
| Canada | 3.7 |
| Singapore | 3.0 |
| France | 2.3 |
| Sweden | 1.9 |
| Germany | 1.8 |
| Others | 4.0 |
GEOGRAPHIC DIVERSIFICATION (% of Fund's net assets) |
|
| |
|
TOP HOLDINGS (% of Fund's net assets) | | |
| Prologis Inc | 9.1 | |
| Equinix Inc | 5.2 | |
| Public Storage Operating Co | 3.9 | |
| Ventas Inc | 3.6 | |
| Digital Realty Trust Inc | 3.0 | |
| Kimco Realty Corp | 2.8 | |
| Grainger PLC | 2.6 | |
| NNN REIT Inc | 2.5 | |
| UDR Inc | 2.4 | |
| Welltower Inc | 2.4 | |
| | 37.5 | |
| |
How has the Fund changed?
This is a summary of certain changes to the Fund since August 1, 2023. For more complete information, you may review the Fund's next prospectus, which we expect to be available by September 28, 2024 at fundresearch.fidelity.com/prospectus/sec or upon request at 1-877-208-0098 or by sending an e-mail to fidfunddocuments@fidelity.com.
The fund's transfer agent and pricing & bookkeeping fees were changed to a fixed rate effective December 1, 2023, through February 29, 2024, in anticipation of the transition to a new management fee structure. Effective March 1, 2024, the fund's management contract was amended to incorporate administrative services previously covered under separate services agreements (transfer agent and pricing & bookkeeping). The amended contract incorporates a management fee rate that may vary by class. The Adviser or an affiliate pays certain expenses of managing and operating the fund out of each class's management fee. | |
| Fidelity, the Fidelity Investments Logo and all other Fidelity trademarks or service marks used herein are trademarks or service marks of FMR LLC. Any third-party marks that are used herein are trademarks or service marks of their respective owners. © 2024 FMR LLC. All rights reserved. |
| | For additional information about the Fund; including its prospectus, financial information, holdings and proxy information, scan the QR code or visit fundresearch.fidelity.com/prospectus/sec 1.9913537.100 2852-TSRA-0924 |
| |
| | ANNUAL SHAREHOLDER REPORT | AS OF JULY 31, 2024 | This report describes changes to the Fund that occurred during the reporting period. |
| | Fidelity Advisor® Consumer Discretionary Fund Fidelity Advisor® Consumer Discretionary Fund Class Z : FIJZX |
| | | |
This annual shareholder report contains information about Fidelity Advisor® Consumer Discretionary Fund for the period August 1, 2023 to July 31, 2024. You can find additional information about the Fund at fundresearch.fidelity.com/prospectus/sec. You can also request this information by contacting us at 1-877-208-0098 or by sending an e-mail to fidfunddocuments@fidelity.com.
What were your Fund costs for the last year?(based on hypothetical $10,000 investment)
FUND COST (PREVIOUS YEAR)
| | Costs of a $10,000 investment | Costs paid as a percentage of a $10,000 investment | |
| Class Z | $ 66 | 0.62% | |
What affected the Fund's performance this period?
•U.S. equities gained for the 12 months ending July 31, 2024, driven by resilient corporate profits, a frenzy over generative artificial intelligence and the Federal Reserve's likely pivot to cutting interest rates later this year.
•Against this backdrop, security selection was the primary contributor to the fund's performance versus the benchmark for the fiscal year, led by hotels, resorts & cruise lines. Stock picking in footwear also boosted the fund's relative performance.
•The top individual relative contributor was an overweight in Dick's Sporting Goods (+56%). The stock was among the fund's largest holdings, though we decreased our stake this period. The second-largest relative contributor was an overweight in Williams-Sonoma (+129%). Another notable relative contributor was an overweight in Deckers Outdoor (+67%), and we decreased our holdings in the company.
•In contrast, the biggest detractors from performance versus the sector index were stock picks and an overweight in automotive parts & equipment. Stock selection in consumer staples merchandise retail also hampered the fund's relative result.
•The largest individual relative detractor was an overweight in Aptiv (-37%). The company was one of our biggest holdings at period end. A stake in Dollar Tree returned approximately -34% and was a second notable relative detractor. This period we decreased our position in Dollar Tree. An overweight in Five Below (-62%) also detracted. This was a position we established this period.
•Notable changes in positioning include increased exposure to the other specialty retail industry and a lower allocation to footwear.
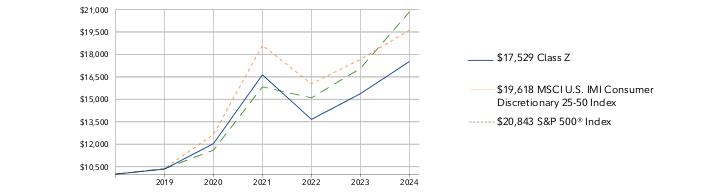
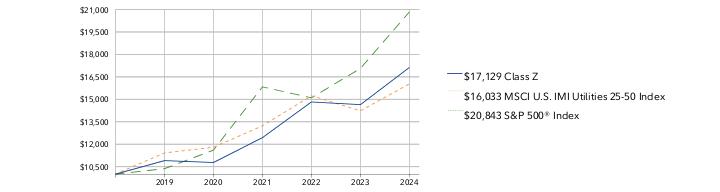
How did the Fund perform over the life of Fund?
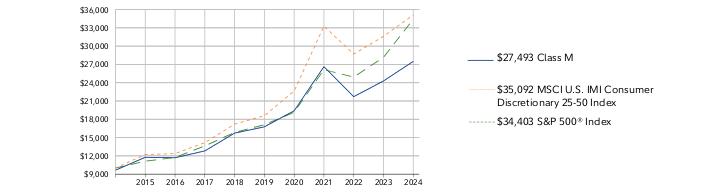
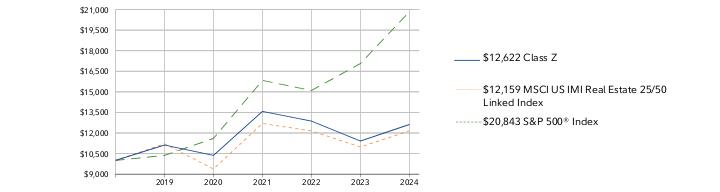
CUMULATIVE PERFORMANCE
October 2, 2018 through July 31, 2024.
Initial investment of $10,000.
Class Z | $10,000 | $10,336 | $12,040 | $16,643 | $13,658 | $15,377 | $17,529 |
MSCI U.S. IMI Consumer Discretionary 25-50 Index | $10,000 | $10,388 | $12,652 | $18,604 | $16,041 | $17,671 | $19,618 |
S&P 500® Index | $10,000 | $10,365 | $11,604 | $15,833 | $15,098 | $17,064 | $20,843 |
| | 2018 | 2019 | 2020 | 2021 | 2022 | 2023 | 2024 |
AVERAGE ANNUAL TOTAL RETURNS: | | 1 Year | 5 Year | Life of Fund A |
| Class Z | 13.99% | 11.14% | 10.10% |
| MSCI U.S. IMI Consumer Discretionary 25-50 Index | 11.02% | 13.56% | 12.25% |
| S&P 500® Index | 22.15% | 15.00% | 13.42% |
A From October 2, 2018
Visit institutional.fidelity.com for more recent performance information. |
The Fund's past performance is not a good predictor of the Fund's future performance. The graph and table do not reflect the deduction of taxes that a shareholder would pay on fund distributions or redemption of fund shares. |
Key Fund Statistics (as of July 31, 2024)
KEY FACTS | | |
| Fund Size | $475,554,258 | |
| Number of Holdings | 60 | |
| Total Advisory Fee | $2,742,271 | |
| Portfolio Turnover | 25% | |
What did the Fund invest in?
(as of July 31, 2024)
TOP INDUSTRIES (% of Fund's net assets) |
| Broadline Retail | 25.9 | |
| Specialty Retail | 23.6 | |
| Hotels, Restaurants & Leisure | 18.7 | |
| Automobiles | 12.5 | |
| Textiles, Apparel & Luxury Goods | 8.0 | |
| Household Durables | 5.7 | |
| Automobile Components | 3.1 | |
| Consumer Staples Distribution & Retail | 1.1 | |
| Building Products | 0.8 | |
| Others | 0.7 | |
| |
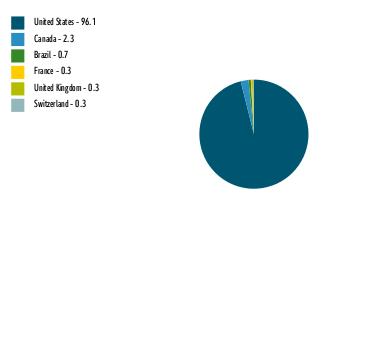
ASSET ALLOCATION (% of Fund's net assets) |
|
| Short-Term Investments and Net Other Assets (Liabilities) - (0.1)% |
|
| United States | 96.1 |
| Canada | 2.3 |
| Brazil | 0.7 |
| France | 0.3 |
| United Kingdom | 0.3 |
| Switzerland | 0.3 |
GEOGRAPHIC DIVERSIFICATION (% of Fund's net assets) |
|
| |
|
TOP HOLDINGS (% of Fund's net assets) | | |
| Amazon.com Inc | 23.9 | |
| Tesla Inc | 10.8 | |
| Home Depot Inc/The | 5.0 | |
| Lowe's Cos Inc | 4.8 | |
| TJX Cos Inc/The | 3.8 | |
| Hilton Worldwide Holdings Inc | 3.2 | |
| Dick's Sporting Goods Inc | 2.4 | |
| McDonald's Corp | 2.4 | |
| Booking Holdings Inc | 2.1 | |
| Aptiv PLC | 2.1 | |
| | 60.5 | |
| |
How has the Fund changed?
This is a summary of certain changes to the Fund since August 1, 2023. For more complete information, you may review the Fund's next prospectus, which we expect to be available by September 28, 2024 at fundresearch.fidelity.com/prospectus/sec or upon request at 1-877-208-0098 or by sending an e-mail to fidfunddocuments@fidelity.com.
| The fund's transfer agent and pricing & bookkeeping fees were changed to a fixed rate effective December 1, 2023, through February 29, 2024, in anticipation of the transition to a new management fee structure. Effective March 1, 2024, the fund's management contract was amended to incorporate administrative services previously covered under separate services agreements (transfer agent and pricing & bookkeeping). The amended contract incorporates a management fee rate that may vary by class. The Adviser or an affiliate pays certain expenses of managing and operating the fund out of each class's management fee. |
| Fidelity, the Fidelity Investments Logo and all other Fidelity trademarks or service marks used herein are trademarks or service marks of FMR LLC. Any third-party marks that are used herein are trademarks or service marks of their respective owners. © 2024 FMR LLC. All rights reserved. |
| | For additional information about the Fund; including its prospectus, financial information, holdings and proxy information, scan the QR code or visit fundresearch.fidelity.com/prospectus/sec 1.9913406.100 3291-TSRA-0924 |
| |
| | ANNUAL SHAREHOLDER REPORT | AS OF JULY 31, 2024 | This report describes changes to the Fund that occurred during the reporting period. |
| | Fidelity Advisor® Global Real Estate Fund Fidelity Advisor® Global Real Estate Fund Class M : FWRTX |
| | | |
This annual shareholder report contains information about Fidelity Advisor® Global Real Estate Fund for the period August 1, 2023 to July 31, 2024. You can find additional information about the Fund at fundresearch.fidelity.com/prospectus/sec. You can also request this information by contacting us at 1-877-208-0098 or by sending an e-mail to fidfunddocuments@fidelity.com.
What were your Fund costs for the last year?(based on hypothetical $10,000 investment)
FUND COST (PREVIOUS YEAR)
| | Costs of a $10,000 investment | Costs paid as a percentage of a $10,000 investment | |
| Class M | $ 151 | 1.45% | |
What affected the Fund's performance this period?
•Investors in global real estate securities experienced fluctuating market conditions throughout the 12 months ending July 31, 2024, initially declining due to rate hike concerns but later rallying as hopes for rate cuts in 2024 grew. Market returns were weakened by a broadly stronger U.S. dollar.
•Against this backdrop, an underweight in Asia Pacific ex Japan - primarily Hong Kong - along with security selection in Japan, contributed to the fund's performance versus the FTSE® EPRASM/NAREIT® Developed Index for the fiscal year.
•By industry, security selection was the primary contributor, especially among diversified real estate activities stocks. Favorable picks in health care also boosted the fund's relative performance. Investment choices and an underweight in the diversified real estate segment helped as well.
•The top individual relative contributor was an overweight in Mitsui Fudosan (+57%). The company was one of the fund's biggest holdings. Outsized exposure to Mitsubishi Estate (+42%) was another plus. Not owning Wharf Real Estate Investment, an index component that returned -52%, also helped.
•In contrast, from a regional standpoint, stock picks in the U.K. and U.S. detracted from the fund's performance versus the real estate index.
•The biggest relative detractors were stock picks and an overweight in the single-family residential industry. Subpar investment choices and outsized exposure to industrial and multi-family residential stocks also were detrimental to performance.
•Not owning Simon Property Group, an index component that gained about 30%, was the largest individual relative detractor. An overweight stake in UOL Group (-22%) pressured performance as well. This period we decreased our stake in the company. Outsized exposure to Mitsui Fudosan Logistics Park (-18%) also hurt.
•Notable changes in positioning include decreased exposure to real estate stocks in Singapore and a higher allocation to the U.K. By industry, meaningful allocation shifts include increased exposure to the self storage industry and a reduction in hotel & resort holdings.
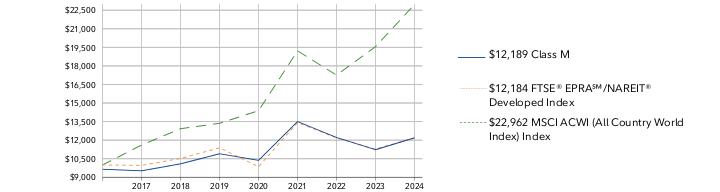
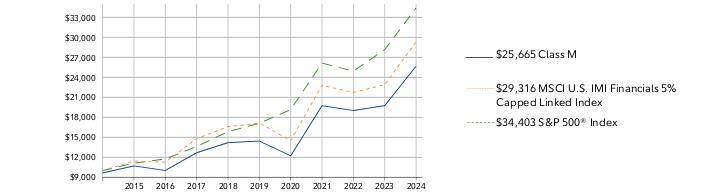
How did the Fund perform over the life of Fund?
CUMULATIVE PERFORMANCE
August 11, 2016 through July 31, 2024.
Initial investment of $10,000 and the current sales charge was paid.
Class M | $9,650 | $9,525 | $10,087 | $10,900 | $10,369 | $13,501 | $12,216 | $11,228 | $12,189 |
FTSE® EPRA℠/NAREIT® Developed Index | $10,000 | $9,960 | $10,524 | $11,380 | $9,855 | $13,420 | $12,176 | $11,285 | $12,184 |
MSCI ACWI (All Country World Index) Index | $10,000 | $11,606 | $12,928 | $13,363 | $14,382 | $19,214 | $17,256 | $19,556 | $22,962 |
| | 2016 | 2017 | 2018 | 2019 | 2020 | 2021 | 2022 | 2023 | 2024 |
AVERAGE ANNUAL TOTAL RETURNS: | | 1 Year | 5 Year | Life of Fund A |
| Class M (incl. 3.50% sales charge) | 4.76% | 1.53% | 2.51% |
| Class M (without 3.50% sales charge) | 8.56% | 2.26% | 2.97% |
| FTSE® EPRA℠/NAREIT® Developed Index | 7.97% | 1.38% | 2.51% |
| MSCI ACWI (All Country World Index) Index | 17.42% | 11.43% | 10.99% |
A From August 11, 2016
Visit institutional.fidelity.com for more recent performance information. |
The Fund's past performance is not a good predictor of the Fund's future performance. The graph and table do not reflect the deduction of taxes that a shareholder would pay on fund distributions or redemption of fund shares. |
Key Fund Statistics (as of July 31, 2024)
KEY FACTS | | |
| Fund Size | $6,027,346 | |
| Number of Holdings | 73 | |
| Total Advisory Fee | $39,394 | |
| Portfolio Turnover | 32% | |
What did the Fund invest in?
(as of July 31, 2024)
TOP INDUSTRIES (% of Fund's net assets) |
| Residential REITs | 19.8 | |
| Specialized REITs | 19.1 | |
| Industrial REITs | 18.3 | |
| Retail REITs | 18.0 | |
| Real Estate Management & Development | 11.9 | |
| Health Care REITs | 7.1 | |
| Diversified REITs | 2.8 | |
| Hotel & Resort REITs | 1.3 | |
| Office REITs | 0.6 | |
| |
| Common Stocks | 98.9 |
| Short-Term Investments and Net Other Assets (Liabilities) | 1.1 |
ASSET ALLOCATION (% of Fund's net assets) |
|
|
| United States | 61.9 |
| United Kingdom | 8.3 |
| Japan | 8.2 |
| Australia | 4.9 |
| Canada | 3.7 |
| Singapore | 3.0 |
| France | 2.3 |
| Sweden | 1.9 |
| Germany | 1.8 |
| Others | 4.0 |
GEOGRAPHIC DIVERSIFICATION (% of Fund's net assets) |
|
| |
|
TOP HOLDINGS (% of Fund's net assets) | | |
| Prologis Inc | 9.1 | |
| Equinix Inc | 5.2 | |
| Public Storage Operating Co | 3.9 | |
| Ventas Inc | 3.6 | |
| Digital Realty Trust Inc | 3.0 | |
| Kimco Realty Corp | 2.8 | |
| Grainger PLC | 2.6 | |
| NNN REIT Inc | 2.5 | |
| UDR Inc | 2.4 | |
| Welltower Inc | 2.4 | |
| | 37.5 | |
| |
How has the Fund changed?
This is a summary of certain changes to the Fund since August 1, 2023. For more complete information, you may review the Fund's next prospectus, which we expect to be available by September 28, 2024 at fundresearch.fidelity.com/prospectus/sec or upon request at 1-877-208-0098 or by sending an e-mail to fidfunddocuments@fidelity.com.
The fund's transfer agent and pricing & bookkeeping fees were changed to a fixed rate effective December 1, 2023, through February 29, 2024, in anticipation of the transition to a new management fee structure. Effective March 1, 2024, the fund's management contract was amended to incorporate administrative services previously covered under separate services agreements (transfer agent and pricing & bookkeeping). The amended contract incorporates a management fee rate that may vary by class. The Adviser or an affiliate pays certain expenses of managing and operating the fund out of each class's management fee. | |
| Fidelity, the Fidelity Investments Logo and all other Fidelity trademarks or service marks used herein are trademarks or service marks of FMR LLC. Any third-party marks that are used herein are trademarks or service marks of their respective owners. © 2024 FMR LLC. All rights reserved. |
| | For additional information about the Fund; including its prospectus, financial information, holdings and proxy information, scan the QR code or visit fundresearch.fidelity.com/prospectus/sec 1.9913536.100 2851-TSRA-0924 |
| |
| | ANNUAL SHAREHOLDER REPORT | AS OF JULY 31, 2024 | This report describes changes to the Fund that occurred during the reporting period. |
| | Fidelity Advisor® Industrials Fund Fidelity Advisor® Industrials Fund Class I : FCLIX |
| | | |
This annual shareholder report contains information about Fidelity Advisor® Industrials Fund for the period August 1, 2023 to July 31, 2024. You can find additional information about the Fund at fundresearch.fidelity.com/prospectus/sec. You can also request this information by contacting us at 1-877-208-0098 or by sending an e-mail to fidfunddocuments@fidelity.com.
What were your Fund costs for the last year?(based on hypothetical $10,000 investment)
FUND COST (PREVIOUS YEAR)
| | Costs of a $10,000 investment | Costs paid as a percentage of a $10,000 investment | |
| Class I | $ 83 | 0.73% | |
What affected the Fund's performance this period?
•U.S. equities gained for the 12 months ending July 31, 2024, driven by resilient corporate profits, a frenzy over generative artificial intelligence and the Federal Reserve's likely pivot to cutting interest rates later this year.
•Against this backdrop, security selection was the primary contributor to the fund's performance versus the benchmark for the fiscal year, led by industrial machinery & supplies & components. Stock picks and an overweight in aerospace & defense also boosted the fund's relative performance.
•The top individual relative contributor was an overweight in Howmet Aerospace (+88%). The second-largest relative contributor was an overweight in General Electric (+88%), the fund's largest holding. Not owning United Parcel Service, an index component that returned roughly -27%, also contributed.
•In contrast, the primary detractor from performance versus the sector index was security selection in construction & engineering. The largest individual relative detractor was an overweight in Boeing (-20%), one of the fund's biggest holdings. A second notable relative detractor was an overweight in Knight-Swift Transportation (-9%). Another notable relative detractor was an overweight in Chart Industries (-12%).
•Notable changes in positioning include increased exposure to the trading companies & distributors industry and a lower allocation to environmental & facilities services.
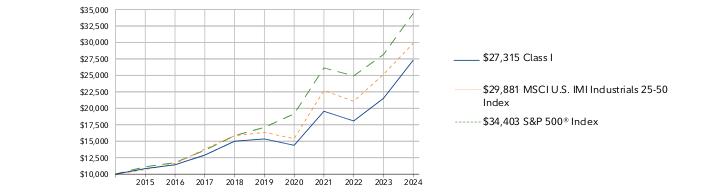
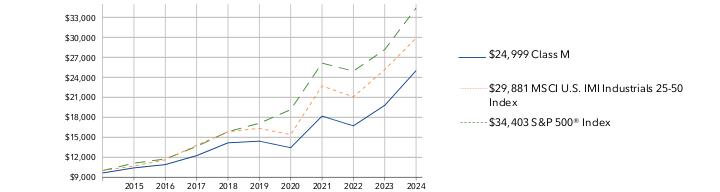
How did the Fund perform over the past 10 years?
CUMULATIVE PERFORMANCE
July 31, 2014 through July 31, 2024.
Initial investment of $10,000.
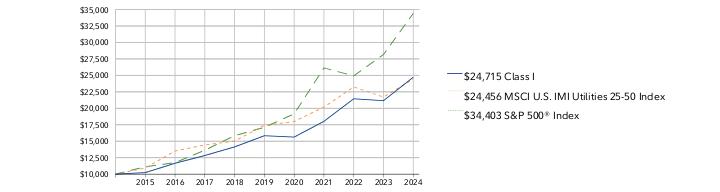
Class I | $10,000 | $10,845 | $11,423 | $12,898 | $15,001 | $15,348 | $14,379 | $19,552 | $18,076 | $21,514 | $27,315 |
MSCI U.S. IMI Industrials 25-50 Index | $10,000 | $10,697 | $11,622 | $13,810 | $15,836 | $16,344 | $15,397 | $22,708 | $21,070 | $25,150 | $29,881 |
S&P 500® Index | $10,000 | $11,121 | $11,745 | $13,629 | $15,843 | $17,108 | $19,153 | $26,134 | $24,921 | $28,165 | $34,403 |
| | 2014 | 2015 | 2016 | 2017 | 2018 | 2019 | 2020 | 2021 | 2022 | 2023 | 2024 |
AVERAGE ANNUAL TOTAL RETURNS: | | 1 Year | 5 Year | 10 Year |
| Class I | 26.97% | 12.22% | 10.57% |
| MSCI U.S. IMI Industrials 25-50 Index | 18.81% | 12.83% | 11.57% |
| S&P 500® Index | 22.15% | 15.00% | 13.15% |
Visit institutional.fidelity.com for more recent performance information. |
The Fund's past performance is not a good predictor of the Fund's future performance. The graph and table do not reflect the deduction of taxes that a shareholder would pay on fund distributions or redemption of fund shares. |
Key Fund Statistics (as of July 31, 2024)
KEY FACTS | | |
| Fund Size | $582,010,248 | |
| Number of Holdings | 51 | |
| Total Advisory Fee | $3,019,014 | |
| Portfolio Turnover | 29% | |
What did the Fund invest in?
(as of July 31, 2024)
TOP INDUSTRIES (% of Fund's net assets) |
| Aerospace & Defense | 22.7 | |
| Machinery | 20.2 | |
| Ground Transportation | 13.1 | |
| Electrical Equipment | 11.1 | |
| Building Products | 10.2 | |
| Trading Companies & Distributors | 5.6 | |
| Construction & Engineering | 3.8 | |
| Air Freight & Logistics | 3.6 | |
| Professional Services | 3.2 | |
| Others | 5.5 | |
| |
| Common Stocks | 99.0 |
| Short-Term Investments and Net Other Assets (Liabilities) | 1.0 |
ASSET ALLOCATION (% of Fund's net assets) |
|
|
GEOGRAPHIC DIVERSIFICATION (% of Fund's net assets) |
|
| |
|
TOP HOLDINGS (% of Fund's net assets) | | |
| General Electric Co | 6.3 | |
| Union Pacific Corp | 4.9 | |
| Ingersoll Rand Inc | 4.9 | |
| Howmet Aerospace Inc | 4.7 | |
| Boeing Co | 4.2 | |
| Parker-Hannifin Corp | 4.1 | |
| Trane Technologies PLC | 3.9 | |
| TransDigm Group Inc | 3.7 | |
| FedEx Corp | 3.4 | |
| Eaton Corp PLC | 3.3 | |
| | 43.4 | |
| |
How has the Fund changed?
This is a summary of certain changes to the Fund since August 1, 2023. For more complete information, you may review the Fund's next prospectus, which we expect to be available by September 28, 2024 at fundresearch.fidelity.com/prospectus/sec or upon request at 1-877-208-0098 or by sending an e-mail to fidfunddocuments@fidelity.com.
The fund's transfer agent and pricing and bookkeeping fees were changed to a fixed rate effective December 1, 2023, through February 29, 2024, in anticipation of the transition to a new management fee structure. Effective March 1, 2024, the fund's management contract was amended to incorporate administrative services previously covered under separate services agreements (transfer agent and pricing and bookkeeping).The amended contract incorporates a management fee rate that may vary by class. The Adviser or an affiliate pays certain expenses of managing and operating the fund out of each class's management fee. | |
| Fidelity, the Fidelity Investments Logo and all other Fidelity trademarks or service marks used herein are trademarks or service marks of FMR LLC. Any third-party marks that are used herein are trademarks or service marks of their respective owners. © 2024 FMR LLC. All rights reserved. |
| | For additional information about the Fund; including its prospectus, financial information, holdings and proxy information, scan the QR code or visit fundresearch.fidelity.com/prospectus/sec 1.9913399.100 204-TSRA-0924 |
| |
| | ANNUAL SHAREHOLDER REPORT | AS OF JULY 31, 2024 | This report describes changes to the Fund that occurred during the reporting period. |
| | Fidelity Advisor® Real Estate Fund Fidelity Advisor® Real Estate Fund Class C : FHECX |
| | | |
This annual shareholder report contains information about Fidelity Advisor® Real Estate Fund for the period August 1, 2023 to July 31, 2024. You can find additional information about the Fund at fundresearch.fidelity.com/prospectus/sec. You can also request this information by contacting us at 1-877-208-0098 or by sending an e-mail to fidfunddocuments@fidelity.com.
What were your Fund costs for the last year?(based on hypothetical $10,000 investment)
FUND COST (PREVIOUS YEAR)
| | Costs of a $10,000 investment | Costs paid as a percentage of a $10,000 investment | |
| Class C | $ 189 | 1.81% | |
What affected the Fund's performance this period?
•U.S. equities gained for the 12 months ending July 31, 2024, driven by resilient corporate profits, a frenzy over generative artificial intelligence and the Federal Reserve's likely pivot to cutting interest rates later this year.
•Against this backdrop, security selection and industry positioning were the primary detractors from the fund's performance versus the MSCI US IMI Real Estate 25/50 Linked Index for the fiscal year, especially "other specialized" real estate investment trusts. Subpar picks and outsized exposure to the industrial and multi-family residential industries hurt as well.
•The biggest individual relative detractor this period was avoiding Iron Mountain, an index component that gained 73%. Similarly, not owning Simon Property Group, an index component that rose about 30%, proved detrimental to performance as well. An overweight stake in Americold Realty Trust (-4%) was another challenge, though we increased our investment in the stock this period.
•In contrast, the biggest contributor to performance versus the real estate index was stock selection among real estate services firms. Picks in health care also boosted the fund's relative performance. An undersized stake in timber REITs was another plus.
•The top individual relative contributor was an outsized stake in CBRE Group (+35%). The company was one of the fund's largest holdings. Avoiding shares of Realty Income, an index component that returned about -1%, aided performance as well. Not owning Weyerhaeuser, an index component that returned -4%, also proved advantageous.
•Notable changes in positioning include increased exposure to the retail industry and a lower allocation to other specialized REITs.
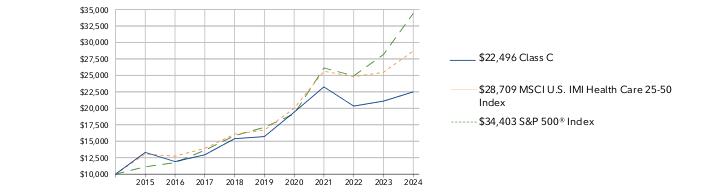
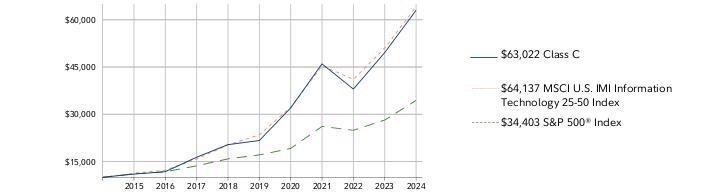
How did the Fund perform over the past 10 years?
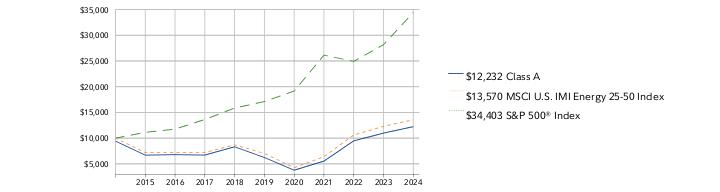
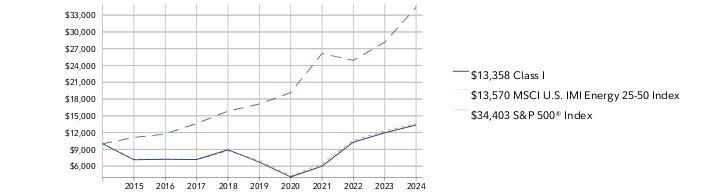
CUMULATIVE PERFORMANCE
July 31, 2014 through July 31, 2024.
Initial investment of $10,000.
Class C | $10,000 | $10,885 | $12,779 | $11,970 | $12,181 | $13,244 | $12,191 | $15,770 | $14,770 | $13,041 | $14,358 |
MSCI US IMI Real Estate 25/50 Linked Index | $10,000 | $11,129 | $13,457 | $12,695 | $13,185 | $14,621 | $12,238 | $16,556 | $15,854 | $14,323 | $15,860 |
S&P 500® Index | $10,000 | $11,121 | $11,745 | $13,629 | $15,843 | $17,108 | $19,153 | $26,134 | $24,921 | $28,165 | $34,403 |
| | 2014 | 2015 | 2016 | 2017 | 2018 | 2019 | 2020 | 2021 | 2022 | 2023 | 2024 |
AVERAGE ANNUAL TOTAL RETURNS: | | 1 Year | 5 Year | 10 Year |
| Class C (incl. contingent deferred sales charge) | 8.30% | 1.33% | 3.68% |
| Class C | 9.30% | 1.33% | 3.68% |
| MSCI US IMI Real Estate 25/50 Linked Index | 10.73% | 1.64% | 4.72% |
| S&P 500® Index | 22.15% | 15.00% | 13.15% |
Visit institutional.fidelity.com for more recent performance information. |
The Fund's past performance is not a good predictor of the Fund's future performance. The graph and table do not reflect the deduction of taxes that a shareholder would pay on fund distributions or redemption of fund shares. |
Key Fund Statistics (as of July 31, 2024)
KEY FACTS | | |
| Fund Size | $237,005,518 | |
| Number of Holdings | 35 | |
| Total Advisory Fee | $1,374,363 | |
| Portfolio Turnover | 24% | |
What did the Fund invest in?
(as of July 31, 2024)
TOP INDUSTRIES (% of Fund's net assets) |
| Specialized REITs | 37.6 | |
| Industrial REITs | 16.2 | |
| Residential REITs | 14.2 | |
| Retail REITs | 10.8 | |
| Health Care REITs | 9.1 | |
| Real Estate Management & Development | 7.7 | |
| Hotel & Resort REITs | 2.5 | |
| Office REITs | 1.2 | |
| |
| Common Stocks | 99.3 |
| Short-Term Investments and Net Other Assets (Liabilities) | 0.7 |
ASSET ALLOCATION (% of Fund's net assets) |
|
|
GEOGRAPHIC DIVERSIFICATION (% of Fund's net assets) |
|
| |
|
TOP HOLDINGS (% of Fund's net assets) | | |
| Prologis Inc | 9.6 | |
| Equinix Inc | 7.8 | |
| Crown Castle Inc | 7.5 | |
| CBRE Group Inc Class A | 6.3 | |
| American Tower Corp | 5.9 | |
| Ventas Inc | 5.8 | |
| CubeSmart | 5.4 | |
| Digital Realty Trust Inc | 3.5 | |
| Welltower Inc | 3.3 | |
| Mid-America Apartment Communities Inc | 3.3 | |
| | 58.4 | |
| |
How has the Fund changed?
This is a summary of certain changes to the Fund since August 1, 2023. For more complete information, you may review the Fund's next prospectus, which we expect to be available by September 28, 2024 at fundresearch.fidelity.com/prospectus/sec or upon request at 1-877-208-0098 or by sending an e-mail to fidfunddocuments@fidelity.com.
The fees associated with this class changed during the reporting year. The variations in class fees are primarily the result of the following changes: - •Management fee
- •Operating expenses
The fund's transfer agent and pricing & bookkeeping fees were changed to a fixed rate effective December 1, 2023, through February 29, 2024, in anticipation of the transition to a new management fee structure. Effective March 1, 2024, the fund's management contract was amended to incorporate administrative services previously covered under separate services agreements (transfer agent and pricing & bookkeeping). The amended contract incorporates a management fee rate that may vary by class. The Adviser or an affiliate pays certain expenses of managing and operating the fund out of each class's management fee. |
| Fidelity, the Fidelity Investments Logo and all other Fidelity trademarks or service marks used herein are trademarks or service marks of FMR LLC. Any third-party marks that are used herein are trademarks or service marks of their respective owners. © 2024 FMR LLC. All rights reserved. |
| | For additional information about the Fund; including its prospectus, financial information, holdings and proxy information, scan the QR code or visit fundresearch.fidelity.com/prospectus/sec 1.9913447.100 1130-TSRA-0924 |
| |
| | ANNUAL SHAREHOLDER REPORT | AS OF JULY 31, 2024 | This report describes changes to the Fund that occurred during the reporting period. |
| | Fidelity Advisor® Technology Fund Fidelity Advisor® Technology Fund Class I : FATIX |
| | | |
This annual shareholder report contains information about Fidelity Advisor® Technology Fund for the period August 1, 2023 to July 31, 2024. You can find additional information about the Fund at fundresearch.fidelity.com/prospectus/sec. You can also request this information by contacting us at 1-877-208-0098 or by sending an e-mail to fidfunddocuments@fidelity.com.
What were your Fund costs for the last year?(based on hypothetical $10,000 investment)
FUND COST (PREVIOUS YEAR)
| | Costs of a $10,000 investment | Costs paid as a percentage of a $10,000 investment | |
| Class I | $ 79 | 0.70% | |
What affected the Fund's performance this period?
•U.S. equities gained for the 12 months ending July 31, 2024, driven by resilient corporate profits, a frenzy over generative artificial intelligence and the Federal Reserve's likely pivot to cutting interest rates later this year.
•Against this backdrop, industry positioning was the primary contributor to the fund's performance versus the MSCI US IMI Information Technology 25/50 Index for the fiscal year, led by an overweight in the outperforming semiconductors group. An underweight in technology hardware, storage & peripherals also boosted the fund's relative performance.
•The fund's top individual relative contributor was an overweight in Nvidia (+150%), which was the biggest holding at period end even though we reduced our stake. The second-largest relative contributor was an underweight position in Apple (+13%). Still, Apple was one of the fund's largest holdings. Our larger-than-index stake in Splunk (+36%) also contributed. Splunk was not held at period end.
•In contrast, the biggest detractor from the fund's performance versus the sector index was stock picking in semiconductors. An overweight in the lagging internet services & infrastructure group also hampered the fund's relative result.
•The fund's largest individual relative detractor was an overweight in onsemi (-28%). We increased the size of the position in onsemi, and it was one of our largest holdings as of July 31. The fund's second-largest relative detractor this period was avoiding Broadcom, an index component that gained 82%. A non-index stake in GlobalFoundries (-20%) also notably hurt, but we increased our holdings this period.
•Notable changes in positioning include decreased exposure to the application software and internet services & infrastructure industries.
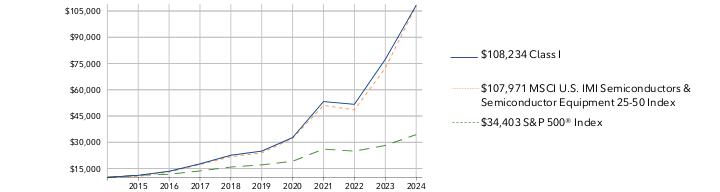
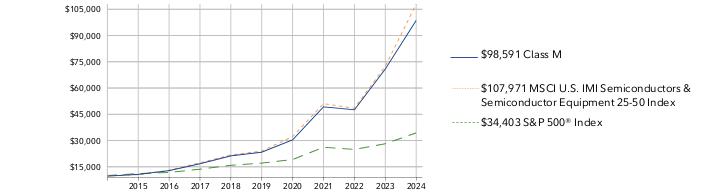
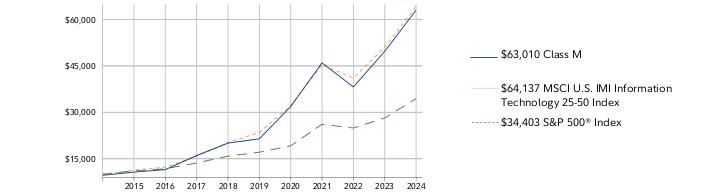
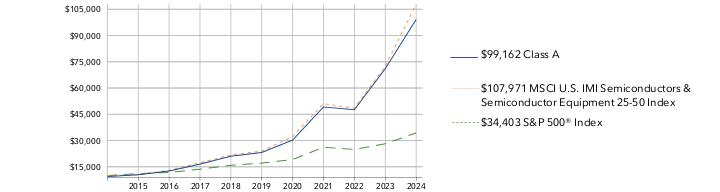
How did the Fund perform over the past 10 years?
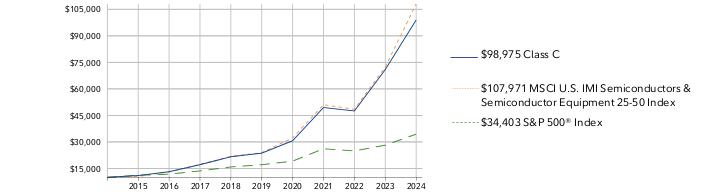
CUMULATIVE PERFORMANCE
July 31, 2014 through July 31, 2024.
Initial investment of $10,000.
Class I | $10,000 | $11,130 | $12,048 | $16,898 | $21,249 | $22,855 | $34,104 | $49,513 | $41,313 | $54,052 | $68,871 |
MSCI U.S. IMI Information Technology 25-50 Index | $10,000 | $11,306 | $12,261 | $15,808 | $20,247 | $23,485 | $32,225 | $45,360 | $41,091 | $50,982 | $64,137 |
S&P 500® Index | $10,000 | $11,121 | $11,745 | $13,629 | $15,843 | $17,108 | $19,153 | $26,134 | $24,921 | $28,165 | $34,403 |
| | 2014 | 2015 | 2016 | 2017 | 2018 | 2019 | 2020 | 2021 | 2022 | 2023 | 2024 |
AVERAGE ANNUAL TOTAL RETURNS: | | 1 Year | 5 Year | 10 Year |
| Class I | 27.42% | 24.68% | 21.28% |
| MSCI U.S. IMI Information Technology 25-50 Index | 25.80% | 22.25% | 20.42% |
| S&P 500® Index | 22.15% | 15.00% | 13.15% |
Visit institutional.fidelity.com for more recent performance information. |
The Fund's past performance is not a good predictor of the Fund's future performance. The graph and table do not reflect the deduction of taxes that a shareholder would pay on fund distributions or redemption of fund shares. |
Key Fund Statistics (as of July 31, 2024)
KEY FACTS | | |
| Fund Size | $6,458,251,428 | |
| Number of Holdings | 89 | |
| Total Advisory Fee | $31,726,651 | |
| Portfolio Turnover | 34% | |
What did the Fund invest in?
(as of July 31, 2024)
TOP INDUSTRIES (% of Fund's net assets) |
| Semiconductors & Semiconductor Equipment | 41.8 | |
| Technology Hardware, Storage & Peripherals | 20.7 | |
| Software | 20.6 | |
| IT Services | 4.4 | |
| Communications Equipment | 2.5 | |
| Ground Transportation | 2.2 | |
| Broadline Retail | 1.5 | |
| Hotels, Restaurants & Leisure | 0.6 | |
| Entertainment | 0.5 | |
| Others | 0.9 | |
| |
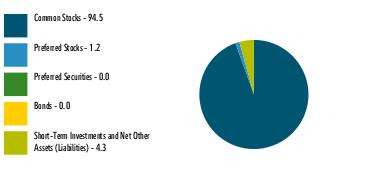
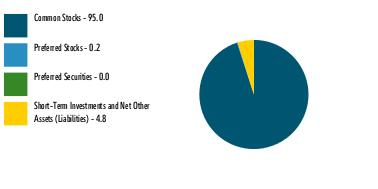
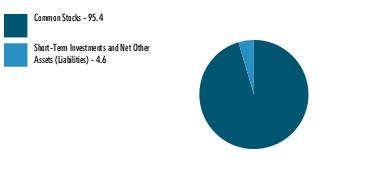
| Common Stocks | 94.5 |
| Preferred Stocks | 1.2 |
| Preferred Securities | 0.0 |
| Bonds | 0.0 |
| Short-Term Investments and Net Other Assets (Liabilities) | 4.3 |
ASSET ALLOCATION (% of Fund's net assets) |
|
|
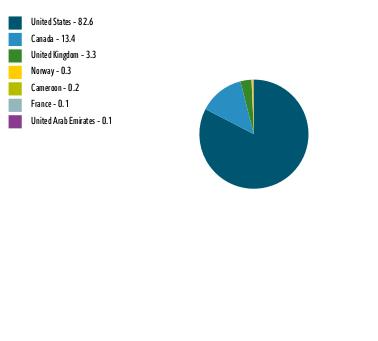
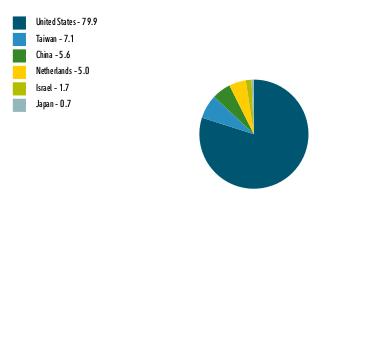
| United States | 91.2 |
| China | 4.5 |
| Taiwan | 2.0 |
| Netherlands | 1.2 |
| Canada | 1.0 |
| India | 0.1 |
| Korea (South) | 0.0 |
| Israel | 0.0 |
GEOGRAPHIC DIVERSIFICATION (% of Fund's net assets) |
|
| |
|
TOP HOLDINGS (% of Fund's net assets) | | |
| NVIDIA Corp | 20.1 | |
| Apple Inc | 19.2 | |
| Microsoft Corp | 10.7 | |
| NXP Semiconductors NV | 4.4 | |
| ON Semiconductor Corp | 4.4 | |
| Marvell Technology Inc | 3.9 | |
| Servicenow Inc | 3.6 | |
| Okta Inc Class A | 2.9 | |
| GlobalFoundries Inc | 2.8 | |
| Cisco Systems Inc | 2.5 | |
| | 74.5 | |
| |
How has the Fund changed?
This is a summary of certain changes to the Fund since August 1, 2023. For more complete information, you may review the Fund's next prospectus, which we expect to be available by September 28, 2024 at fundresearch.fidelity.com/prospectus/sec or upon request at 1-877-208-0098 or by sending an e-mail to fidfunddocuments@fidelity.com.
The fund's transfer agent and pricing and bookkeeping fees were changed to a fixed rate effective December 1, 2023, through February 29, 2024, in anticipation of the transition to a new management fee structure. Effective March 1, 2024, the fund's management contract was amended to incorporate administrative services previously covered under separate services agreements (transfer agent and pricing and bookkeeping).The amended contract incorporates a management fee rate that may vary by class. The Adviser or an affiliate pays certain expenses of managing and operating the fund out of each class's management fee. | |
| Fidelity, the Fidelity Investments Logo and all other Fidelity trademarks or service marks used herein are trademarks or service marks of FMR LLC. Any third-party marks that are used herein are trademarks or service marks of their respective owners. © 2024 FMR LLC. All rights reserved. |
| | For additional information about the Fund; including its prospectus, financial information, holdings and proxy information, scan the QR code or visit fundresearch.fidelity.com/prospectus/sec 1.9913414.100 202-TSRA-0924 |
| |
| | ANNUAL SHAREHOLDER REPORT | AS OF JULY 31, 2024 | This report describes changes to the Fund that occurred during the reporting period. |
| | Fidelity Advisor® Financials Fund Fidelity Advisor® Financials Fund Class C : FAFCX |
| | | |
This annual shareholder report contains information about Fidelity Advisor® Financials Fund for the period August 1, 2023 to July 31, 2024. You can find additional information about the Fund at fundresearch.fidelity.com/prospectus/sec. You can also request this information by contacting us at 1-877-208-0098 or by sending an e-mail to fidfunddocuments@fidelity.com.
What were your Fund costs for the last year?(based on hypothetical $10,000 investment)
FUND COST (PREVIOUS YEAR)
| | Costs of a $10,000 investment | Costs paid as a percentage of a $10,000 investment | |
| Class C | $ 203 | 1.77% | |
What affected the Fund's performance this period?
•U.S. equities gained for the 12 months ending July 31, 2024, driven by resilient corporate profits, a frenzy over generative artificial intelligence and the Federal Reserve's likely pivot to cutting interest rates later this year.
•Against this backdrop, security selection was the primary contributor to the fund's performance versus the MSCI US IMI Financials 5% Capped Linked Index for the fiscal year, led by regional banks. Picks among reinsurance firms and insurance brokers also boosted the fund's relative performance.
•The top individual relative contributor was an overweight in Reinsurance Group of America (+64%), though we decreased our exposure to the stock this period. The company was among the fund's largest holdings. Avoiding shares of Visa, an index component that gained approximately 13%, helped as well. An outsized stake in Baldwin Insurance Group (+79%) was another plus.
•In contrast, the primary detractor from performance versus the sector index was stock selection in the property & casualty insurance industry. Subpar investment choices among life & health insurance and financial exchanges & data companies hurt as well.
•The biggest individual relative detractor this period was avoiding Progressive, an index component that rose 71%. Similarly, not owing KKR, an index component that increased approximately 110%, also proved detrimental to performance. An underweight stake in JPMorgan Chase (+38%) also hurt. The stock was not held at period end.
•Notable changes in positioning include increased exposure to the investment banking & brokerage and diversified financial services industries.
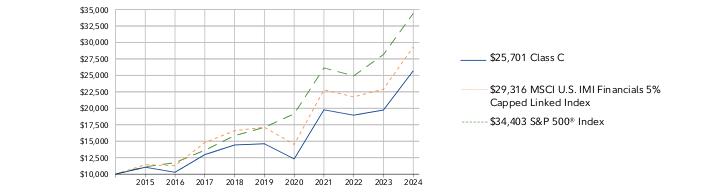
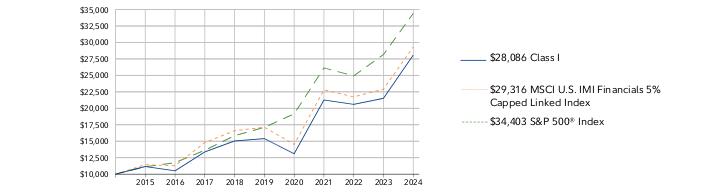
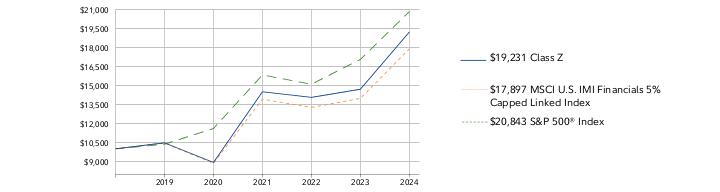
How did the Fund perform over the past 10 years?
CUMULATIVE PERFORMANCE
July 31, 2014 through July 31, 2024.
Initial investment of $10,000.
Class C | $10,000 | $11,045 | $10,285 | $12,966 | $14,429 | $14,616 | $12,308 | $19,769 | $18,952 | $19,743 | $25,701 |
MSCI U.S. IMI Financials 5% Capped Linked Index | $10,000 | $11,434 | $11,272 | $14,794 | $16,593 | $17,130 | $14,510 | $22,803 | $21,734 | $22,906 | $29,316 |
S&P 500® Index | $10,000 | $11,121 | $11,745 | $13,629 | $15,843 | $17,108 | $19,153 | $26,134 | $24,921 | $28,165 | $34,403 |
| | 2014 | 2015 | 2016 | 2017 | 2018 | 2019 | 2020 | 2021 | 2022 | 2023 | 2024 |
AVERAGE ANNUAL TOTAL RETURNS: | | 1 Year | 5 Year | 10 Year |
| Class C (incl. contingent deferred sales charge) | 28.23% | 11.62% | 9.90% |
| Class C | 29.23% | 11.62% | 9.90% |
| MSCI U.S. IMI Financials 5% Capped Linked Index | 27.98% | 11.35% | 11.36% |
| S&P 500® Index | 22.15% | 15.00% | 13.15% |
Visit institutional.fidelity.com for more recent performance information. |
The Fund's past performance is not a good predictor of the Fund's future performance. The graph and table do not reflect the deduction of taxes that a shareholder would pay on fund distributions or redemption of fund shares. |
Key Fund Statistics (as of July 31, 2024)
KEY FACTS | | |
| Fund Size | $507,414,487 | |
| Number of Holdings | 66 | |
| Total Advisory Fee | $2,566,292 | |
| Portfolio Turnover | 44% | |
What did the Fund invest in?
(as of July 31, 2024)
TOP INDUSTRIES (% of Fund's net assets) |
| Banks | 35.0 | |
| Capital Markets | 21.1 | |
| Financial Services | 20.7 | |
| Insurance | 18.5 | |
| Consumer Finance | 3.7 | |
| Professional Services | 1.0 | |
| |
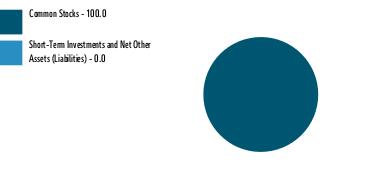
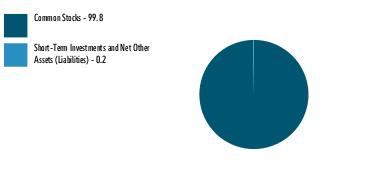
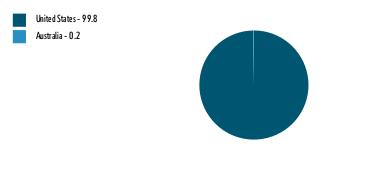
| Common Stocks | 100.0 |
| Short-Term Investments and Net Other Assets (Liabilities) | 0.0 |
ASSET ALLOCATION (% of Fund's net assets) |
|
|
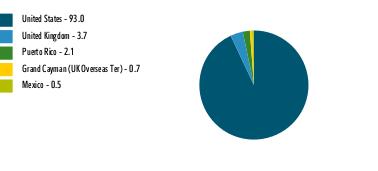
| United States | 93.0 |
| United Kingdom | 3.7 |
| Puerto Rico | 2.1 |
| Grand Cayman (UK Overseas Ter) | 0.7 |
| Mexico | 0.5 |
GEOGRAPHIC DIVERSIFICATION (% of Fund's net assets) |
|
| |
|
TOP HOLDINGS (% of Fund's net assets) | | |
| Mastercard Inc Class A | 10.1 | |
| Wells Fargo & Co | 6.4 | |
| Bank of America Corp | 5.1 | |
| Citigroup Inc | 3.1 | |
| Chubb Ltd | 2.6 | |
| M&T Bank Corp | 2.6 | |
| Morgan Stanley | 2.5 | |
| Apollo Global Management Inc | 2.4 | |
| Reinsurance Group of America Inc | 2.3 | |
| Popular Inc | 2.1 | |
| | 39.2 | |
| |
How has the Fund changed?
This is a summary of certain changes to the Fund since August 1, 2023. For more complete information, you may review the Fund's next prospectus, which we expect to be available by September 28, 2024 at fundresearch.fidelity.com/prospectus/sec or upon request at 1-877-208-0098 or by sending an e-mail to fidfunddocuments@fidelity.com.
The fund's name changed from Fidelity Advisor Financial Services Fund to Fidelity Advisor Financials Fund during the reporting period. | The fund's transfer agent and pricing and bookkeeping fees were changed to a fixed rate effective December 1, 2023, through February 29, 2024, in anticipation of the transition to a new management fee structure. Effective March 1, 2024, the fund's management contract was amended to incorporate administrative services previously covered under separate services agreements (transfer agent and pricing and bookkeeping).The amended contract incorporates a management fee rate that may vary by class. The Adviser or an affiliate pays certain expenses of managing and operating the fund out of each class's management fee. |
| Fidelity, the Fidelity Investments Logo and all other Fidelity trademarks or service marks used herein are trademarks or service marks of FMR LLC. Any third-party marks that are used herein are trademarks or service marks of their respective owners. © 2024 FMR LLC. All rights reserved. |
| | For additional information about the Fund; including its prospectus, financial information, holdings and proxy information, scan the QR code or visit fundresearch.fidelity.com/prospectus/sec 1.9913395.100 284-TSRA-0924 |
| |
| | ANNUAL SHAREHOLDER REPORT | AS OF JULY 31, 2024 | This report describes changes to the Fund that occurred during the reporting period. |
| | Fidelity Advisor® Technology Fund Fidelity Advisor® Technology Fund Class Z : FIKHX |
| | | |
This annual shareholder report contains information about Fidelity Advisor® Technology Fund for the period August 1, 2023 to July 31, 2024. You can find additional information about the Fund at fundresearch.fidelity.com/prospectus/sec. You can also request this information by contacting us at 1-877-208-0098 or by sending an e-mail to fidfunddocuments@fidelity.com.
What were your Fund costs for the last year?(based on hypothetical $10,000 investment)
FUND COST (PREVIOUS YEAR)
| | Costs of a $10,000 investment | Costs paid as a percentage of a $10,000 investment | |
| Class Z | $ 63 | 0.56% | |
What affected the Fund's performance this period?
•U.S. equities gained for the 12 months ending July 31, 2024, driven by resilient corporate profits, a frenzy over generative artificial intelligence and the Federal Reserve's likely pivot to cutting interest rates later this year.
•Against this backdrop, industry positioning was the primary contributor to the fund's performance versus the MSCI US IMI Information Technology 25/50 Index for the fiscal year, led by an overweight in the outperforming semiconductors group. An underweight in technology hardware, storage & peripherals also boosted the fund's relative performance.
•The fund's top individual relative contributor was an overweight in Nvidia (+150%), which was the biggest holding at period end even though we reduced our stake. The second-largest relative contributor was an underweight position in Apple (+13%). Still, Apple was one of the fund's largest holdings. Our larger-than-index stake in Splunk (+36%) also contributed. Splunk was not held at period end.
•In contrast, the biggest detractor from the fund's performance versus the sector index was stock picking in semiconductors. An overweight in the lagging internet services & infrastructure group also hampered the fund's relative result.
•The fund's largest individual relative detractor was an overweight in onsemi (-28%). We increased the size of the position in onsemi, and it was one of our largest holdings as of July 31. The fund's second-largest relative detractor this period was avoiding Broadcom, an index component that gained 82%. A non-index stake in GlobalFoundries (-20%) also notably hurt, but we increased our holdings this period.
•Notable changes in positioning include decreased exposure to the application software and internet services & infrastructure industries.
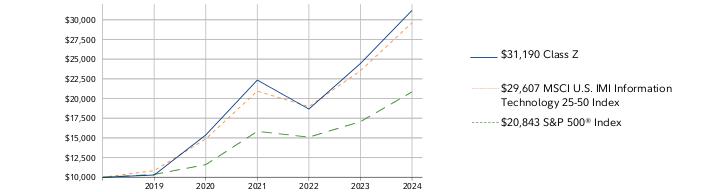
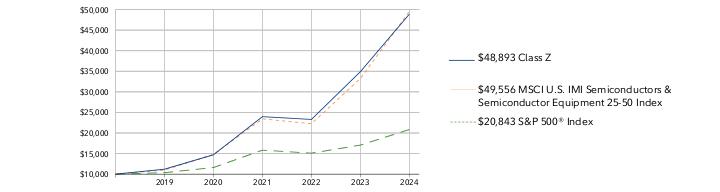
How did the Fund perform over the life of Fund?
CUMULATIVE PERFORMANCE
October 2, 2018 through July 31, 2024.
Initial investment of $10,000.
Class Z | $10,000 | $10,288 | $15,370 | $22,342 | $18,664 | $24,449 | $31,190 |
MSCI U.S. IMI Information Technology 25-50 Index | $10,000 | $10,841 | $14,876 | $20,939 | $18,969 | $23,535 | $29,607 |
S&P 500® Index | $10,000 | $10,365 | $11,604 | $15,833 | $15,098 | $17,064 | $20,843 |
| | 2018 | 2019 | 2020 | 2021 | 2022 | 2023 | 2024 |
AVERAGE ANNUAL TOTAL RETURNS: | | 1 Year | 5 Year | Life of Fund A |
| Class Z | 27.57% | 24.83% | 21.53% |
| MSCI U.S. IMI Information Technology 25-50 Index | 25.80% | 22.25% | 20.45% |
| S&P 500® Index | 22.15% | 15.00% | 13.42% |
A From October 2, 2018
Visit institutional.fidelity.com for more recent performance information. |
The Fund's past performance is not a good predictor of the Fund's future performance. The graph and table do not reflect the deduction of taxes that a shareholder would pay on fund distributions or redemption of fund shares. |
Key Fund Statistics (as of July 31, 2024)
KEY FACTS | | |
| Fund Size | $6,458,251,428 | |
| Number of Holdings | 89 | |
| Total Advisory Fee | $31,726,651 | |
| Portfolio Turnover | 34% | |
What did the Fund invest in?
(as of July 31, 2024)
TOP INDUSTRIES (% of Fund's net assets) |
| Semiconductors & Semiconductor Equipment | 41.8 | |
| Technology Hardware, Storage & Peripherals | 20.7 | |
| Software | 20.6 | |
| IT Services | 4.4 | |
| Communications Equipment | 2.5 | |
| Ground Transportation | 2.2 | |
| Broadline Retail | 1.5 | |
| Hotels, Restaurants & Leisure | 0.6 | |
| Entertainment | 0.5 | |
| Others | 0.9 | |
| |
| Common Stocks | 94.5 |
| Preferred Stocks | 1.2 |
| Preferred Securities | 0.0 |
| Bonds | 0.0 |
| Short-Term Investments and Net Other Assets (Liabilities) | 4.3 |
ASSET ALLOCATION (% of Fund's net assets) |
|
|
| United States | 91.2 |
| China | 4.5 |
| Taiwan | 2.0 |
| Netherlands | 1.2 |
| Canada | 1.0 |
| India | 0.1 |
| Korea (South) | 0.0 |
| Israel | 0.0 |
GEOGRAPHIC DIVERSIFICATION (% of Fund's net assets) |
|
| |
|
TOP HOLDINGS (% of Fund's net assets) | | |
| NVIDIA Corp | 20.1 | |
| Apple Inc | 19.2 | |
| Microsoft Corp | 10.7 | |
| NXP Semiconductors NV | 4.4 | |
| ON Semiconductor Corp | 4.4 | |
| Marvell Technology Inc | 3.9 | |
| Servicenow Inc | 3.6 | |
| Okta Inc Class A | 2.9 | |
| GlobalFoundries Inc | 2.8 | |
| Cisco Systems Inc | 2.5 | |
| | 74.5 | |
| |
How has the Fund changed?
This is a summary of certain changes to the Fund since August 1, 2023. For more complete information, you may review the Fund's next prospectus, which we expect to be available by September 28, 2024 at fundresearch.fidelity.com/prospectus/sec or upon request at 1-877-208-0098 or by sending an e-mail to fidfunddocuments@fidelity.com.
The fees associated with this class changed during the reporting year. The variations in class fees are primarily the result of the following changes: - •Management fee
- •Operating expenses
The fund's transfer agent and pricing and bookkeeping fees were changed to a fixed rate effective December 1, 2023, through February 29, 2024, in anticipation of the transition to a new management fee structure. Effective March 1, 2024, the fund's management contract was amended to incorporate administrative services previously covered under separate services agreements (transfer agent and pricing and bookkeeping).The amended contract incorporates a management fee rate that may vary by class. The Adviser or an affiliate pays certain expenses of managing and operating the fund out of each class's management fee. |
| Fidelity, the Fidelity Investments Logo and all other Fidelity trademarks or service marks used herein are trademarks or service marks of FMR LLC. Any third-party marks that are used herein are trademarks or service marks of their respective owners. © 2024 FMR LLC. All rights reserved. |
| | For additional information about the Fund; including its prospectus, financial information, holdings and proxy information, scan the QR code or visit fundresearch.fidelity.com/prospectus/sec 1.9913415.100 3297-TSRA-0924 |
| |
| | ANNUAL SHAREHOLDER REPORT | AS OF JULY 31, 2024 | This report describes changes to the Fund that occurred during the reporting period. |
| | Fidelity Advisor® Real Estate Fund Fidelity Advisor® Real Estate Fund Class A : FHEAX |
| | | |
This annual shareholder report contains information about Fidelity Advisor® Real Estate Fund for the period August 1, 2023 to July 31, 2024. You can find additional information about the Fund at fundresearch.fidelity.com/prospectus/sec. You can also request this information by contacting us at 1-877-208-0098 or by sending an e-mail to fidfunddocuments@fidelity.com.
What were your Fund costs for the last year?(based on hypothetical $10,000 investment)
FUND COST (PREVIOUS YEAR)
| | Costs of a $10,000 investment | Costs paid as a percentage of a $10,000 investment | |
| Class A | $ 112 | 1.07% | |
What affected the Fund's performance this period?
•U.S. equities gained for the 12 months ending July 31, 2024, driven by resilient corporate profits, a frenzy over generative artificial intelligence and the Federal Reserve's likely pivot to cutting interest rates later this year.
•Against this backdrop, security selection and industry positioning were the primary detractors from the fund's performance versus the MSCI US IMI Real Estate 25/50 Linked Index for the fiscal year, especially "other specialized" real estate investment trusts. Subpar picks and outsized exposure to the industrial and multi-family residential industries hurt as well.
•The biggest individual relative detractor this period was avoiding Iron Mountain, an index component that gained 73%. Similarly, not owning Simon Property Group, an index component that rose about 30%, proved detrimental to performance as well. An overweight stake in Americold Realty Trust (-4%) was another challenge, though we increased our investment in the stock this period.
•In contrast, the biggest contributor to performance versus the real estate index was stock selection among real estate services firms. Picks in health care also boosted the fund's relative performance. An undersized stake in timber REITs was another plus.
•The top individual relative contributor was an outsized stake in CBRE Group (+35%). The company was one of the fund's largest holdings. Avoiding shares of Realty Income, an index component that returned about -1%, aided performance as well. Not owning Weyerhaeuser, an index component that returned -4%, also proved advantageous.
•Notable changes in positioning include increased exposure to the retail industry and a lower allocation to other specialized REITs.
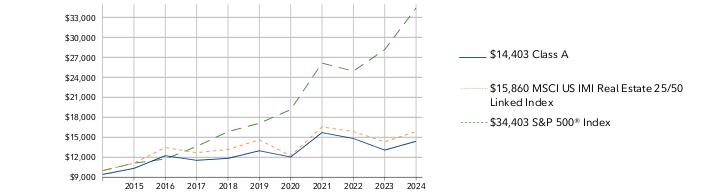
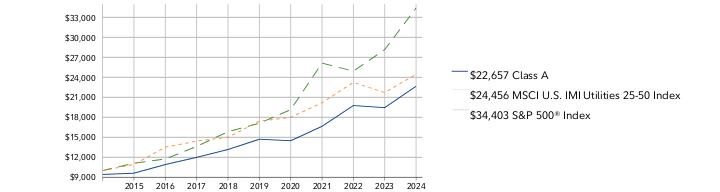
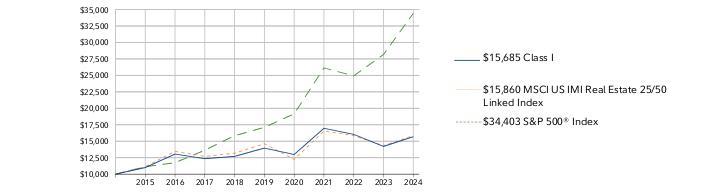
How did the Fund perform over the past 10 years?
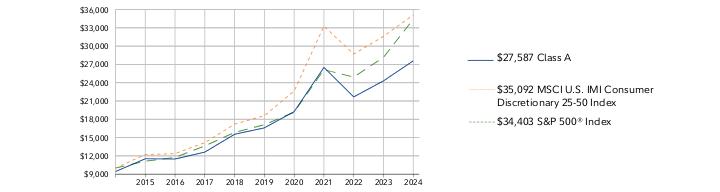
CUMULATIVE PERFORMANCE
July 31, 2014 through July 31, 2024.
Initial investment of $10,000 and the current sales charge was paid.
Class A | $9,425 | $10,340 | $12,235 | $11,546 | $11,841 | $12,980 | $12,044 | $15,703 | $14,816 | $13,082 | $14,403 |
MSCI US IMI Real Estate 25/50 Linked Index | $10,000 | $11,129 | $13,457 | $12,695 | $13,185 | $14,621 | $12,238 | $16,556 | $15,854 | $14,323 | $15,860 |
S&P 500® Index | $10,000 | $11,121 | $11,745 | $13,629 | $15,843 | $17,108 | $19,153 | $26,134 | $24,921 | $28,165 | $34,403 |
| | 2014 | 2015 | 2016 | 2017 | 2018 | 2019 | 2020 | 2021 | 2022 | 2023 | 2024 |
AVERAGE ANNUAL TOTAL RETURNS: | | 1 Year | 5 Year | 10 Year |
| Class A (incl. 5.75% sales charge) | 3.76% | 0.90% | 3.72% |
| Class A (without 5.75% sales charge) | 10.10% | 2.10% | 4.33% |
| MSCI US IMI Real Estate 25/50 Linked Index | 10.73% | 1.64% | 4.72% |
| S&P 500® Index | 22.15% | 15.00% | 13.15% |
Visit institutional.fidelity.com for more recent performance information. |
The Fund's past performance is not a good predictor of the Fund's future performance. The graph and table do not reflect the deduction of taxes that a shareholder would pay on fund distributions or redemption of fund shares. |
Key Fund Statistics (as of July 31, 2024)
KEY FACTS | | |
| Fund Size | $237,005,518 | |
| Number of Holdings | 35 | |
| Total Advisory Fee | $1,374,363 | |
| Portfolio Turnover | 24% | |
What did the Fund invest in?
(as of July 31, 2024)
TOP INDUSTRIES (% of Fund's net assets) |
| Specialized REITs | 37.6 | |
| Industrial REITs | 16.2 | |
| Residential REITs | 14.2 | |
| Retail REITs | 10.8 | |
| Health Care REITs | 9.1 | |
| Real Estate Management & Development | 7.7 | |
| Hotel & Resort REITs | 2.5 | |
| Office REITs | 1.2 | |
| |
| Common Stocks | 99.3 |
| Short-Term Investments and Net Other Assets (Liabilities) | 0.7 |
ASSET ALLOCATION (% of Fund's net assets) |
|
|
GEOGRAPHIC DIVERSIFICATION (% of Fund's net assets) |
|
| |
|
TOP HOLDINGS (% of Fund's net assets) | | |
| Prologis Inc | 9.6 | |
| Equinix Inc | 7.8 | |
| Crown Castle Inc | 7.5 | |
| CBRE Group Inc Class A | 6.3 | |
| American Tower Corp | 5.9 | |
| Ventas Inc | 5.8 | |
| CubeSmart | 5.4 | |
| Digital Realty Trust Inc | 3.5 | |
| Welltower Inc | 3.3 | |
| Mid-America Apartment Communities Inc | 3.3 | |
| | 58.4 | |
| |
How has the Fund changed?
This is a summary of certain changes to the Fund since August 1, 2023. For more complete information, you may review the Fund's next prospectus, which we expect to be available by September 28, 2024 at fundresearch.fidelity.com/prospectus/sec or upon request at 1-877-208-0098 or by sending an e-mail to fidfunddocuments@fidelity.com.
The fund's transfer agent and pricing & bookkeeping fees were changed to a fixed rate effective December 1, 2023, through February 29, 2024, in anticipation of the transition to a new management fee structure. Effective March 1, 2024, the fund's management contract was amended to incorporate administrative services previously covered under separate services agreements (transfer agent and pricing & bookkeeping). The amended contract incorporates a management fee rate that may vary by class. The Adviser or an affiliate pays certain expenses of managing and operating the fund out of each class's management fee. | |
| Fidelity, the Fidelity Investments Logo and all other Fidelity trademarks or service marks used herein are trademarks or service marks of FMR LLC. Any third-party marks that are used herein are trademarks or service marks of their respective owners. © 2024 FMR LLC. All rights reserved. |
| | For additional information about the Fund; including its prospectus, financial information, holdings and proxy information, scan the QR code or visit fundresearch.fidelity.com/prospectus/sec 1.9913446.100 1128-TSRA-0924 |
| |
| | ANNUAL SHAREHOLDER REPORT | AS OF JULY 31, 2024 | This report describes changes to the Fund that occurred during the reporting period. |
| | Fidelity Advisor® Global Real Estate Fund Fidelity Advisor® Global Real Estate Fund Class C : FWRCX |
| | | |
This annual shareholder report contains information about Fidelity Advisor® Global Real Estate Fund for the period August 1, 2023 to July 31, 2024. You can find additional information about the Fund at fundresearch.fidelity.com/prospectus/sec. You can also request this information by contacting us at 1-877-208-0098 or by sending an e-mail to fidfunddocuments@fidelity.com.
What were your Fund costs for the last year?(based on hypothetical $10,000 investment)
FUND COST (PREVIOUS YEAR)
| | Costs of a $10,000 investment | Costs paid as a percentage of a $10,000 investment | |
| Class C | $ 202 | 1.95% | |
What affected the Fund's performance this period?
•Investors in global real estate securities experienced fluctuating market conditions throughout the 12 months ending July 31, 2024, initially declining due to rate hike concerns but later rallying as hopes for rate cuts in 2024 grew. Market returns were weakened by a broadly stronger U.S. dollar.
•Against this backdrop, an underweight in Asia Pacific ex Japan - primarily Hong Kong - along with security selection in Japan, contributed to the fund's performance versus the FTSE® EPRASM/NAREIT® Developed Index for the fiscal year.
•By industry, security selection was the primary contributor, especially among diversified real estate activities stocks. Favorable picks in health care also boosted the fund's relative performance. Investment choices and an underweight in the diversified real estate segment helped as well.
•The top individual relative contributor was an overweight in Mitsui Fudosan (+57%). The company was one of the fund's biggest holdings. Outsized exposure to Mitsubishi Estate (+42%) was another plus. Not owning Wharf Real Estate Investment, an index component that returned -52%, also helped.
•In contrast, from a regional standpoint, stock picks in the U.K. and U.S. detracted from the fund's performance versus the real estate index.
•The biggest relative detractors were stock picks and an overweight in the single-family residential industry. Subpar investment choices and outsized exposure to industrial and multi-family residential stocks also were detrimental to performance.
•Not owning Simon Property Group, an index component that gained about 30%, was the largest individual relative detractor. An overweight stake in UOL Group (-22%) pressured performance as well. This period we decreased our stake in the company. Outsized exposure to Mitsui Fudosan Logistics Park (-18%) also hurt.
•Notable changes in positioning include decreased exposure to real estate stocks in Singapore and a higher allocation to the U.K. By industry, meaningful allocation shifts include increased exposure to the self storage industry and a reduction in hotel & resort holdings.
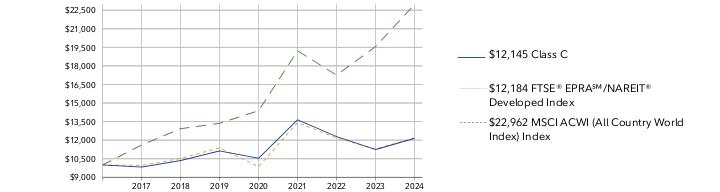
How did the Fund perform over the life of Fund?
CUMULATIVE PERFORMANCE
August 11, 2016 through July 31, 2024.
Initial investment of $10,000.
Class C | $10,000 | $9,823 | $10,352 | $11,130 | $10,539 | $13,647 | $12,287 | $11,239 | $12,145 |
FTSE® EPRA℠/NAREIT® Developed Index | $10,000 | $9,960 | $10,524 | $11,380 | $9,855 | $13,420 | $12,176 | $11,285 | $12,184 |
MSCI ACWI (All Country World Index) Index | $10,000 | $11,606 | $12,928 | $13,363 | $14,382 | $19,214 | $17,256 | $19,556 | $22,962 |
| | 2016 | 2017 | 2018 | 2019 | 2020 | 2021 | 2022 | 2023 | 2024 |
AVERAGE ANNUAL TOTAL RETURNS: | | 1 Year | 5 Year | Life of Fund A |
| Class C (incl. contingent deferred sales charge) | 7.06% | 1.76% | 2.47% |
| Class C | 8.06% | 1.76% | 2.47% |
| FTSE® EPRA℠/NAREIT® Developed Index | 7.97% | 1.38% | 2.51% |
| MSCI ACWI (All Country World Index) Index | 17.42% | 11.43% | 10.99% |
A From August 11, 2016
Visit institutional.fidelity.com for more recent performance information. |
The Fund's past performance is not a good predictor of the Fund's future performance. The graph and table do not reflect the deduction of taxes that a shareholder would pay on fund distributions or redemption of fund shares. |
Key Fund Statistics (as of July 31, 2024)
KEY FACTS | | |
| Fund Size | $6,027,346 | |
| Number of Holdings | 73 | |
| Total Advisory Fee | $39,394 | |
| Portfolio Turnover | 32% | |
What did the Fund invest in?
(as of July 31, 2024)
TOP INDUSTRIES (% of Fund's net assets) |
| Residential REITs | 19.8 | |
| Specialized REITs | 19.1 | |
| Industrial REITs | 18.3 | |
| Retail REITs | 18.0 | |
| Real Estate Management & Development | 11.9 | |
| Health Care REITs | 7.1 | |
| Diversified REITs | 2.8 | |
| Hotel & Resort REITs | 1.3 | |
| Office REITs | 0.6 | |
| |
| Common Stocks | 98.9 |
| Short-Term Investments and Net Other Assets (Liabilities) | 1.1 |
ASSET ALLOCATION (% of Fund's net assets) |
|
|
| United States | 61.9 |
| United Kingdom | 8.3 |
| Japan | 8.2 |
| Australia | 4.9 |
| Canada | 3.7 |
| Singapore | 3.0 |
| France | 2.3 |
| Sweden | 1.9 |
| Germany | 1.8 |
| Others | 4.0 |
GEOGRAPHIC DIVERSIFICATION (% of Fund's net assets) |
|
| |
|
TOP HOLDINGS (% of Fund's net assets) | | |
| Prologis Inc | 9.1 | |
| Equinix Inc | 5.2 | |
| Public Storage Operating Co | 3.9 | |
| Ventas Inc | 3.6 | |
| Digital Realty Trust Inc | 3.0 | |
| Kimco Realty Corp | 2.8 | |
| Grainger PLC | 2.6 | |
| NNN REIT Inc | 2.5 | |
| UDR Inc | 2.4 | |
| Welltower Inc | 2.4 | |
| | 37.5 | |
| |
How has the Fund changed?
This is a summary of certain changes to the Fund since August 1, 2023. For more complete information, you may review the Fund's next prospectus, which we expect to be available by September 28, 2024 at fundresearch.fidelity.com/prospectus/sec or upon request at 1-877-208-0098 or by sending an e-mail to fidfunddocuments@fidelity.com.
The fund's transfer agent and pricing & bookkeeping fees were changed to a fixed rate effective December 1, 2023, through February 29, 2024, in anticipation of the transition to a new management fee structure. Effective March 1, 2024, the fund's management contract was amended to incorporate administrative services previously covered under separate services agreements (transfer agent and pricing & bookkeeping). The amended contract incorporates a management fee rate that may vary by class. The Adviser or an affiliate pays certain expenses of managing and operating the fund out of each class's management fee. | |
| Fidelity, the Fidelity Investments Logo and all other Fidelity trademarks or service marks used herein are trademarks or service marks of FMR LLC. Any third-party marks that are used herein are trademarks or service marks of their respective owners. © 2024 FMR LLC. All rights reserved. |
| | For additional information about the Fund; including its prospectus, financial information, holdings and proxy information, scan the QR code or visit fundresearch.fidelity.com/prospectus/sec 1.9913535.100 2850-TSRA-0924 |
| |
| | ANNUAL SHAREHOLDER REPORT | AS OF JULY 31, 2024 | This report describes changes to the Fund that occurred during the reporting period. |
| | Fidelity Advisor® Biotechnology Fund Fidelity Advisor® Biotechnology Fund Class C : FBTCX |
| | | |
This annual shareholder report contains information about Fidelity Advisor® Biotechnology Fund for the period August 1, 2023 to July 31, 2024. You can find additional information about the Fund at fundresearch.fidelity.com/prospectus/sec. You can also request this information by contacting us at 1-877-208-0098 or by sending an e-mail to fidfunddocuments@fidelity.com.
What were your Fund costs for the last year?(based on hypothetical $10,000 investment)
FUND COST (PREVIOUS YEAR)
| | Costs of a $10,000 investment | Costs paid as a percentage of a $10,000 investment | |
| Class C | $ 196 | 1.72% | |
What affected the Fund's performance this period?
•U.S. equities gained for the 12 months ending July 31, 2024, driven by resilient corporate profits, a frenzy over generative artificial intelligence and the Federal Reserve's likely pivot to cutting interest rates later this year.
•Against this backdrop, security selection was the primary contributor to the fund's performance versus the MSCI US IMI Biotechnology 25/50 Index for the fiscal year, led by biotechnology.
•The top individual relative contributor this period was avoiding Biogen, an index component that returned -21%. A non-index stake in Fusion Pharmaceuticals gained 544% and was the second-largest relative contributor. Another notable relative contributor was an underweight in Gilead Sciences (+4%). The stock was one of our top holdings this period, but it was not held on July 31.
•In contrast, the biggest detractor from performance versus the industry index was stock picking in pharmaceuticals.
•The fund's non-index stake in Ventyx Biosciences returned approximately -93% and was the biggest individual relative detractor. The stock was not held at period end. A second notable relative detractor was an underweight in Amgen (+46%). This was an investment we established this period. The company was one of our largest holdings. Another notable relative detractor was an overweight in Acelyrin (-73%).
•Notable changes in positioning include a lower allocation to pharmaceuticals.
How did the Fund perform over the past 10 years?
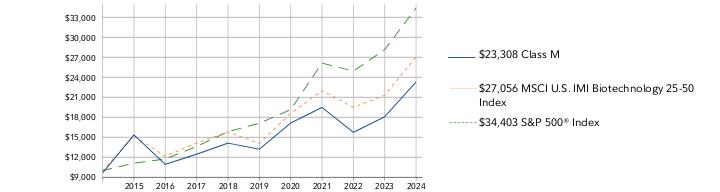
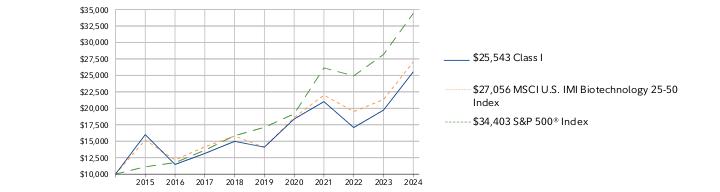
CUMULATIVE PERFORMANCE
July 31, 2014 through July 31, 2024.
Initial investment of $10,000.
Class C | $10,000 | $15,843 | $11,239 | $12,752 | $14,392 | $13,403 | $17,299 | $19,575 | $15,750 | $18,141 | $23,441 |
MSCI U.S. IMI Biotechnology 25-50 Index | $10,000 | $15,191 | $12,163 | $14,140 | $15,791 | $14,066 | $18,593 | $22,002 | $19,500 | $21,317 | $27,056 |
S&P 500® Index | $10,000 | $11,121 | $11,745 | $13,629 | $15,843 | $17,108 | $19,153 | $26,134 | $24,921 | $28,165 | $34,403 |
| | 2014 | 2015 | 2016 | 2017 | 2018 | 2019 | 2020 | 2021 | 2022 | 2023 | 2024 |
AVERAGE ANNUAL TOTAL RETURNS: | | 1 Year | 5 Year | 10 Year |
| Class C (incl. contingent deferred sales charge) | 27.15% | 11.48% | 8.89% |
| Class C | 28.15% | 11.48% | 8.89% |
| MSCI U.S. IMI Biotechnology 25-50 Index | 26.92% | 13.98% | 10.47% |
| S&P 500® Index | 22.15% | 15.00% | 13.15% |
Visit institutional.fidelity.com for more recent performance information. |
The Fund's past performance is not a good predictor of the Fund's future performance. The graph and table do not reflect the deduction of taxes that a shareholder would pay on fund distributions or redemption of fund shares. |
Key Fund Statistics (as of July 31, 2024)
KEY FACTS | | |
| Fund Size | $1,812,183,981 | |
| Number of Holdings | 100 | |
| Total Advisory Fee | $9,501,787 | |
| Portfolio Turnover | 73% | |
What did the Fund invest in?
(as of July 31, 2024)
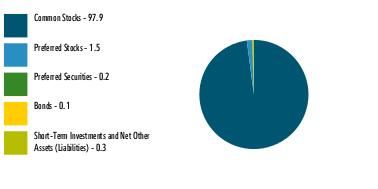
TOP INDUSTRIES (% of Fund's net assets) |
| Biotechnology | 92.6 | |
| Pharmaceuticals | 5.7 | |
| Financial Services | 0.2 | |
| Health Care Technology | 0.1 | |
| |
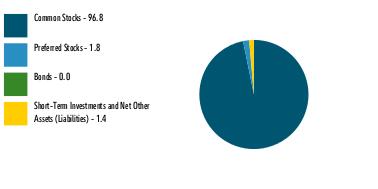
| Common Stocks | 96.8 |
| Preferred Stocks | 1.8 |
| Bonds | 0.0 |
| Short-Term Investments and Net Other Assets (Liabilities) | 1.4 |
ASSET ALLOCATION (% of Fund's net assets) |
|
|
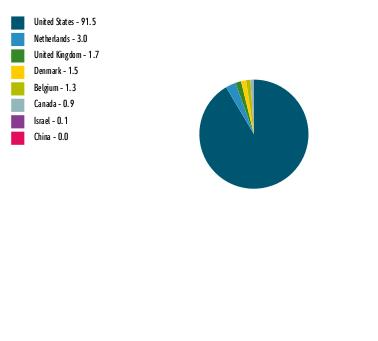
| United States | 88.0 |
| Netherlands | 5.1 |
| Denmark | 3.5 |
| Canada | 1.3 |
| Belgium | 1.1 |
| United Kingdom | 1.0 |
GEOGRAPHIC DIVERSIFICATION (% of Fund's net assets) |
|
| |
|
TOP HOLDINGS (% of Fund's net assets) | | |
| Abbvie Inc | 18.3 | |
| Amgen Inc | 9.4 | |
| Regeneron Pharmaceuticals Inc | 7.0 | |
| Vertex Pharmaceuticals Inc | 4.7 | |
| Alnylam Pharmaceuticals Inc | 4.5 | |
| Argenx SE ADR | 3.8 | |
| Ascendis Pharma A/S ADR | 3.5 | |
| Vaxcyte Inc | 2.6 | |
| Cytokinetics Inc | 2.6 | |
| Viking Therapeutics Inc | 2.3 | |
| | 58.7 | |
| |
How has the Fund changed?
This is a summary of certain changes to the Fund since August 1, 2023. For more complete information, you may review the Fund's next prospectus, which we expect to be available by September 28, 2024 at fundresearch.fidelity.com/prospectus/sec or upon request at 1-877-208-0098 or by sending an e-mail to fidfunddocuments@fidelity.com.
The fund's transfer agent and pricing and bookkeeping fees were changed to a fixed rate effective December 1, 2023, through February 29, 2024, in anticipation of the transition to a new management fee structure. Effective March 1, 2024, the fund's management contract was amended to incorporate administrative services previously covered under separate services agreements (transfer agent and pricing and bookkeeping).The amended contract incorporates a management fee rate that may vary by class. The Adviser or an affiliate pays certain expenses of managing and operating the fund out of each class's management fee. | |
| Fidelity, the Fidelity Investments Logo and all other Fidelity trademarks or service marks used herein are trademarks or service marks of FMR LLC. Any third-party marks that are used herein are trademarks or service marks of their respective owners. © 2024 FMR LLC. All rights reserved. |
| | For additional information about the Fund; including its prospectus, financial information, holdings and proxy information, scan the QR code or visit fundresearch.fidelity.com/prospectus/sec 1.9913425.100 114-TSRA-0924 |
| |
| | ANNUAL SHAREHOLDER REPORT | AS OF JULY 31, 2024 | This report describes changes to the Fund that occurred during the reporting period. |
| | Fidelity Advisor® Financials Fund Fidelity Advisor® Financials Fund Class M : FAFSX |
| | | |
This annual shareholder report contains information about Fidelity Advisor® Financials Fund for the period August 1, 2023 to July 31, 2024. You can find additional information about the Fund at fundresearch.fidelity.com/prospectus/sec. You can also request this information by contacting us at 1-877-208-0098 or by sending an e-mail to fidfunddocuments@fidelity.com.
What were your Fund costs for the last year?(based on hypothetical $10,000 investment)
FUND COST (PREVIOUS YEAR)
| | Costs of a $10,000 investment | Costs paid as a percentage of a $10,000 investment | |
| Class M | $ 146 | 1.27% | |
What affected the Fund's performance this period?
•U.S. equities gained for the 12 months ending July 31, 2024, driven by resilient corporate profits, a frenzy over generative artificial intelligence and the Federal Reserve's likely pivot to cutting interest rates later this year.
•Against this backdrop, security selection was the primary contributor to the fund's performance versus the MSCI US IMI Financials 5% Capped Linked Index for the fiscal year, led by regional banks. Picks among reinsurance firms and insurance brokers also boosted the fund's relative performance.
•The top individual relative contributor was an overweight in Reinsurance Group of America (+64%), though we decreased our exposure to the stock this period. The company was among the fund's largest holdings. Avoiding shares of Visa, an index component that gained approximately 13%, helped as well. An outsized stake in Baldwin Insurance Group (+79%) was another plus.
•In contrast, the primary detractor from performance versus the sector index was stock selection in the property & casualty insurance industry. Subpar investment choices among life & health insurance and financial exchanges & data companies hurt as well.
•The biggest individual relative detractor this period was avoiding Progressive, an index component that rose 71%. Similarly, not owing KKR, an index component that increased approximately 110%, also proved detrimental to performance. An underweight stake in JPMorgan Chase (+38%) also hurt. The stock was not held at period end.
•Notable changes in positioning include increased exposure to the investment banking & brokerage and diversified financial services industries.
How did the Fund perform over the past 10 years?
CUMULATIVE PERFORMANCE
July 31, 2014 through July 31, 2024.
Initial investment of $10,000 and the current sales charge was paid.
Class M | $9,650 | $10,710 | $10,021 | $12,689 | $14,192 | $14,443 | $12,222 | $19,736 | $19,019 | $19,757 | $25,665 |
MSCI U.S. IMI Financials 5% Capped Linked Index | $10,000 | $11,434 | $11,272 | $14,794 | $16,593 | $17,130 | $14,510 | $22,803 | $21,734 | $22,906 | $29,316 |
S&P 500® Index | $10,000 | $11,121 | $11,745 | $13,629 | $15,843 | $17,108 | $19,153 | $26,134 | $24,921 | $28,165 | $34,403 |
| | 2014 | 2015 | 2016 | 2017 | 2018 | 2019 | 2020 | 2021 | 2022 | 2023 | 2024 |
AVERAGE ANNUAL TOTAL RETURNS: | | 1 Year | 5 Year | 10 Year |
| Class M (incl. 3.50% sales charge) | 25.36% | 11.39% | 9.88% |
| Class M (without 3.50% sales charge) | 29.90% | 12.19% | 10.28% |
| MSCI U.S. IMI Financials 5% Capped Linked Index | 27.98% | 11.35% | 11.36% |
| S&P 500® Index | 22.15% | 15.00% | 13.15% |
Visit institutional.fidelity.com for more recent performance information. |
The Fund's past performance is not a good predictor of the Fund's future performance. The graph and table do not reflect the deduction of taxes that a shareholder would pay on fund distributions or redemption of fund shares. |
Key Fund Statistics (as of July 31, 2024)
KEY FACTS | | |
| Fund Size | $507,414,487 | |
| Number of Holdings | 66 | |
| Total Advisory Fee | $2,566,292 | |
| Portfolio Turnover | 44% | |
What did the Fund invest in?
(as of July 31, 2024)
TOP INDUSTRIES (% of Fund's net assets) |
| Banks | 35.0 | |
| Capital Markets | 21.1 | |
| Financial Services | 20.7 | |
| Insurance | 18.5 | |
| Consumer Finance | 3.7 | |
| Professional Services | 1.0 | |
| |
| Common Stocks | 100.0 |
| Short-Term Investments and Net Other Assets (Liabilities) | 0.0 |
ASSET ALLOCATION (% of Fund's net assets) |
|
|
| United States | 93.0 |
| United Kingdom | 3.7 |
| Puerto Rico | 2.1 |
| Grand Cayman (UK Overseas Ter) | 0.7 |
| Mexico | 0.5 |
GEOGRAPHIC DIVERSIFICATION (% of Fund's net assets) |
|
| |
|
TOP HOLDINGS (% of Fund's net assets) | | |
| Mastercard Inc Class A | 10.1 | |
| Wells Fargo & Co | 6.4 | |
| Bank of America Corp | 5.1 | |
| Citigroup Inc | 3.1 | |
| Chubb Ltd | 2.6 | |
| M&T Bank Corp | 2.6 | |
| Morgan Stanley | 2.5 | |
| Apollo Global Management Inc | 2.4 | |
| Reinsurance Group of America Inc | 2.3 | |
| Popular Inc | 2.1 | |
| | 39.2 | |
| |
How has the Fund changed?
This is a summary of certain changes to the Fund since August 1, 2023. For more complete information, you may review the Fund's next prospectus, which we expect to be available by September 28, 2024 at fundresearch.fidelity.com/prospectus/sec or upon request at 1-877-208-0098 or by sending an e-mail to fidfunddocuments@fidelity.com.
The fund's name changed from Fidelity Advisor Financial Services Fund to Fidelity Advisor Financials Fund during the reporting period. | The fund's transfer agent and pricing and bookkeeping fees were changed to a fixed rate effective December 1, 2023, through February 29, 2024, in anticipation of the transition to a new management fee structure. Effective March 1, 2024, the fund's management contract was amended to incorporate administrative services previously covered under separate services agreements (transfer agent and pricing and bookkeeping).The amended contract incorporates a management fee rate that may vary by class. The Adviser or an affiliate pays certain expenses of managing and operating the fund out of each class's management fee. |
| Fidelity, the Fidelity Investments Logo and all other Fidelity trademarks or service marks used herein are trademarks or service marks of FMR LLC. Any third-party marks that are used herein are trademarks or service marks of their respective owners. © 2024 FMR LLC. All rights reserved. |
| | For additional information about the Fund; including its prospectus, financial information, holdings and proxy information, scan the QR code or visit fundresearch.fidelity.com/prospectus/sec 1.9913393.100 193-TSRA-0924 |
| |
| | ANNUAL SHAREHOLDER REPORT | AS OF JULY 31, 2024 | This report describes changes to the Fund that occurred during the reporting period. |
| | Fidelity Advisor® Financials Fund Fidelity Advisor® Financials Fund Class I : FFSIX |
| | | |
This annual shareholder report contains information about Fidelity Advisor® Financials Fund for the period August 1, 2023 to July 31, 2024. You can find additional information about the Fund at fundresearch.fidelity.com/prospectus/sec. You can also request this information by contacting us at 1-877-208-0098 or by sending an e-mail to fidfunddocuments@fidelity.com.
What were your Fund costs for the last year?(based on hypothetical $10,000 investment)
FUND COST (PREVIOUS YEAR)
| | Costs of a $10,000 investment | Costs paid as a percentage of a $10,000 investment | |
| Class I | $ 86 | 0.75% | |
What affected the Fund's performance this period?
•U.S. equities gained for the 12 months ending July 31, 2024, driven by resilient corporate profits, a frenzy over generative artificial intelligence and the Federal Reserve's likely pivot to cutting interest rates later this year.
•Against this backdrop, security selection was the primary contributor to the fund's performance versus the MSCI US IMI Financials 5% Capped Linked Index for the fiscal year, led by regional banks. Picks among reinsurance firms and insurance brokers also boosted the fund's relative performance.
•The top individual relative contributor was an overweight in Reinsurance Group of America (+64%), though we decreased our exposure to the stock this period. The company was among the fund's largest holdings. Avoiding shares of Visa, an index component that gained approximately 13%, helped as well. An outsized stake in Baldwin Insurance Group (+79%) was another plus.
•In contrast, the primary detractor from performance versus the sector index was stock selection in the property & casualty insurance industry. Subpar investment choices among life & health insurance and financial exchanges & data companies hurt as well.
•The biggest individual relative detractor this period was avoiding Progressive, an index component that rose 71%. Similarly, not owing KKR, an index component that increased approximately 110%, also proved detrimental to performance. An underweight stake in JPMorgan Chase (+38%) also hurt. The stock was not held at period end.
•Notable changes in positioning include increased exposure to the investment banking & brokerage and diversified financial services industries.
How did the Fund perform over the past 10 years?
CUMULATIVE PERFORMANCE
July 31, 2014 through July 31, 2024.
Initial investment of $10,000.
Class I | $10,000 | $11,161 | $10,504 | $13,377 | $15,040 | $15,395 | $13,100 | $21,263 | $20,597 | $21,518 | $28,086 |
MSCI U.S. IMI Financials 5% Capped Linked Index | $10,000 | $11,434 | $11,272 | $14,794 | $16,593 | $17,130 | $14,510 | $22,803 | $21,734 | $22,906 | $29,316 |
S&P 500® Index | $10,000 | $11,121 | $11,745 | $13,629 | $15,843 | $17,108 | $19,153 | $26,134 | $24,921 | $28,165 | $34,403 |
| | 2014 | 2015 | 2016 | 2017 | 2018 | 2019 | 2020 | 2021 | 2022 | 2023 | 2024 |
AVERAGE ANNUAL TOTAL RETURNS: | | 1 Year | 5 Year | 10 Year |
| Class I | 30.52% | 12.78% | 10.88% |
| MSCI U.S. IMI Financials 5% Capped Linked Index | 27.98% | 11.35% | 11.36% |
| S&P 500® Index | 22.15% | 15.00% | 13.15% |
Visit institutional.fidelity.com for more recent performance information. |
The Fund's past performance is not a good predictor of the Fund's future performance. The graph and table do not reflect the deduction of taxes that a shareholder would pay on fund distributions or redemption of fund shares. |
Key Fund Statistics (as of July 31, 2024)
KEY FACTS | | |
| Fund Size | $507,414,487 | |
| Number of Holdings | 66 | |
| Total Advisory Fee | $2,566,292 | |
| Portfolio Turnover | 44% | |
What did the Fund invest in?
(as of July 31, 2024)
TOP INDUSTRIES (% of Fund's net assets) |
| Banks | 35.0 | |
| Capital Markets | 21.1 | |
| Financial Services | 20.7 | |
| Insurance | 18.5 | |
| Consumer Finance | 3.7 | |
| Professional Services | 1.0 | |
| |
| Common Stocks | 100.0 |
| Short-Term Investments and Net Other Assets (Liabilities) | 0.0 |
ASSET ALLOCATION (% of Fund's net assets) |
|
|
| United States | 93.0 |
| United Kingdom | 3.7 |
| Puerto Rico | 2.1 |
| Grand Cayman (UK Overseas Ter) | 0.7 |
| Mexico | 0.5 |
GEOGRAPHIC DIVERSIFICATION (% of Fund's net assets) |
|
| |
|
TOP HOLDINGS (% of Fund's net assets) | | |
| Mastercard Inc Class A | 10.1 | |
| Wells Fargo & Co | 6.4 | |
| Bank of America Corp | 5.1 | |
| Citigroup Inc | 3.1 | |
| Chubb Ltd | 2.6 | |
| M&T Bank Corp | 2.6 | |
| Morgan Stanley | 2.5 | |
| Apollo Global Management Inc | 2.4 | |
| Reinsurance Group of America Inc | 2.3 | |
| Popular Inc | 2.1 | |
| | 39.2 | |
| |
How has the Fund changed?
This is a summary of certain changes to the Fund since August 1, 2023. For more complete information, you may review the Fund's next prospectus, which we expect to be available by September 28, 2024 at fundresearch.fidelity.com/prospectus/sec or upon request at 1-877-208-0098 or by sending an e-mail to fidfunddocuments@fidelity.com.
The fund's name changed from Fidelity Advisor Financial Services Fund to Fidelity Advisor Financials Fund during the reporting period. | The fund's transfer agent and pricing and bookkeeping fees were changed to a fixed rate effective December 1, 2023, through February 29, 2024, in anticipation of the transition to a new management fee structure. Effective March 1, 2024, the fund's management contract was amended to incorporate administrative services previously covered under separate services agreements (transfer agent and pricing and bookkeeping).The amended contract incorporates a management fee rate that may vary by class. The Adviser or an affiliate pays certain expenses of managing and operating the fund out of each class's management fee. |
| Fidelity, the Fidelity Investments Logo and all other Fidelity trademarks or service marks used herein are trademarks or service marks of FMR LLC. Any third-party marks that are used herein are trademarks or service marks of their respective owners. © 2024 FMR LLC. All rights reserved. |
| | For additional information about the Fund; including its prospectus, financial information, holdings and proxy information, scan the QR code or visit fundresearch.fidelity.com/prospectus/sec 1.9913394.100 273-TSRA-0924 |
| |
| | ANNUAL SHAREHOLDER REPORT | AS OF JULY 31, 2024 | This report describes changes to the Fund that occurred during the reporting period. |
| | Fidelity Advisor® Energy Fund Fidelity Advisor® Energy Fund Class M : FAGNX |
| | | |
This annual shareholder report contains information about Fidelity Advisor® Energy Fund for the period August 1, 2023 to July 31, 2024. You can find additional information about the Fund at fundresearch.fidelity.com/prospectus/sec. You can also request this information by contacting us at 1-877-208-0098 or by sending an e-mail to fidfunddocuments@fidelity.com.
What were your Fund costs for the last year?(based on hypothetical $10,000 investment)
FUND COST (PREVIOUS YEAR)
| | Costs of a $10,000 investment | Costs paid as a percentage of a $10,000 investment | |
| Class M | $ 131 | 1.24% | |
What affected the Fund's performance this period?
•U.S. equities gained for the 12 months ending July 31, 2024, driven by resilient corporate profits, a frenzy over generative artificial intelligence and the Federal Reserve's likely pivot to cutting interest rates later this year.
•Against this backdrop, security selection was the primary contributor to the fund's performance versus the MSCI U.S. IMI Energy 25/50 Index for the fiscal year, led by oil & gas exploration & production. Stock picks in integrated oil & gas and independent power producers & energy traders also boosted the fund's relative performance.
•The top individual relative contributor was an overweight in TechnipFMC (+62%). We pared our stake in TechnipFMC. The second-largest relative contributor was an underweight in Chevron (+2%). The stock was one of the fund's largest holdings even though we reduced the position this period. Another notable relative contributor was our non-index stake in Vistra (+186%).
•In contrast, the biggest detractors from performance versus the sector index were security selection and an underweight in oil & gas storage & transportation. Also hurting our relative result were overweights in oil & gas drilling and oil & gas equipment & services.
•Not owning Targa Resources, an index component that gained 69%, was the fund's biggest individual relative detractor. Not owning Williams Companies, an index component that gained 31%, was the fund's second-largest relative detractor. Another notable relative detractor this period was avoiding ONEOK, an index component that gained about 30%.
•Notable changes in positioning include increased exposure to the oil & gas drilling industry and a lower allocation to oil & gas exploration & production.
How did the Fund perform over the past 10 years?
CUMULATIVE PERFORMANCE
July 31, 2014 through July 31, 2024.
Initial investment of $10,000 and the current sales charge was paid.
Class M | $9,650 | $6,843 | $6,910 | $6,813 | $8,431 | $6,299 | $3,801 | $5,563 | $9,494 | $10,979 | $12,202 |
MSCI U.S. IMI Energy 25-50 Index | $10,000 | $7,208 | $7,220 | $7,200 | $8,707 | $7,019 | $4,258 | $6,393 | $10,594 | $12,299 | $13,570 |
S&P 500® Index | $10,000 | $11,121 | $11,745 | $13,629 | $15,843 | $17,108 | $19,153 | $26,134 | $24,921 | $28,165 | $34,403 |
| | 2014 | 2015 | 2016 | 2017 | 2018 | 2019 | 2020 | 2021 | 2022 | 2023 | 2024 |
AVERAGE ANNUAL TOTAL RETURNS: | | 1 Year | 5 Year | 10 Year |
| Class M (incl. 3.50% sales charge) | 7.25% | 13.33% | 2.01% |
| Class M (without 3.50% sales charge) | 11.14% | 14.14% | 2.37% |
| MSCI U.S. IMI Energy 25-50 Index | 10.33% | 14.09% | 3.10% |
| S&P 500® Index | 22.15% | 15.00% | 13.15% |
Visit institutional.fidelity.com for more recent performance information. |
The Fund's past performance is not a good predictor of the Fund's future performance. The graph and table do not reflect the deduction of taxes that a shareholder would pay on fund distributions or redemption of fund shares. |
Key Fund Statistics (as of July 31, 2024)
KEY FACTS | | |
| Fund Size | $1,311,457,602 | |
| Number of Holdings | 43 | |
| Total Advisory Fee | $7,393,032 | |
| Portfolio Turnover | 31% | |
What did the Fund invest in?
(as of July 31, 2024)
TOP INDUSTRIES (% of Fund's net assets) |
| Oil, Gas & Consumable Fuels | 81.1 | |
| Energy Equipment & Services | 16.3 | |
| Independent Power and Renewable Electricity Producers | 1.4 | |
| Machinery | 1.0 | |
| |
| Common Stocks | 99.8 |
| Short-Term Investments and Net Other Assets (Liabilities) | 0.2 |
ASSET ALLOCATION (% of Fund's net assets) |
|
|
| United States | 82.6 |
| Canada | 13.4 |
| United Kingdom | 3.3 |
| Norway | 0.3 |
| Cameroon | 0.2 |
| France | 0.1 |
| United Arab Emirates | 0.1 |
GEOGRAPHIC DIVERSIFICATION (% of Fund's net assets) |
|
| |
|
TOP HOLDINGS (% of Fund's net assets) | | |
| Exxon Mobil Corp | 24.8 | |
| Cenovus Energy Inc | 6.2 | |
| Schlumberger NV | 5.4 | |
| Chevron Corp | 4.8 | |
| Marathon Petroleum Corp | 4.8 | |
| Canadian Natural Resources Ltd | 4.5 | |
| Valero Energy Corp | 3.9 | |
| Cheniere Energy Inc | 3.9 | |
| Occidental Petroleum Corp | 3.8 | |
| Hess Corp | 3.4 | |
| | 65.5 | |
| |
How has the Fund changed?
This is a summary of certain changes to the Fund since August 1, 2023. For more complete information, you may review the Fund's next prospectus, which we expect to be available by September 28, 2024 at fundresearch.fidelity.com/prospectus/sec or upon request at 1-877-208-0098 or by sending an e-mail to fidfunddocuments@fidelity.com.
The fund's transfer agent and pricing & bookkeeping fees were changed to a fixed rate effective December 1, 2023, through February 29, 2024, in anticipation of the transition to a new management fee structure. Effective March 1, 2024, the fund's management contract was amended to incorporate administrative services previously covered under separate services agreements (transfer agent and pricing & bookkeeping). The amended contract incorporates a management fee rate that may vary by class. The Adviser or an affiliate pays certain expenses of managing and operating the fund out of each class's management fee. | |
| Fidelity, the Fidelity Investments Logo and all other Fidelity trademarks or service marks used herein are trademarks or service marks of FMR LLC. Any third-party marks that are used herein are trademarks or service marks of their respective owners. © 2024 FMR LLC. All rights reserved. |
| | For additional information about the Fund; including its prospectus, financial information, holdings and proxy information, scan the QR code or visit fundresearch.fidelity.com/prospectus/sec 1.9913417.100 226-TSRA-0924 |
| |
| | ANNUAL SHAREHOLDER REPORT | AS OF JULY 31, 2024 | This report describes changes to the Fund that occurred during the reporting period. |
| | Fidelity Advisor® Energy Fund Fidelity Advisor® Energy Fund Class A : FANAX |
| | | |
This annual shareholder report contains information about Fidelity Advisor® Energy Fund for the period August 1, 2023 to July 31, 2024. You can find additional information about the Fund at fundresearch.fidelity.com/prospectus/sec. You can also request this information by contacting us at 1-877-208-0098 or by sending an e-mail to fidfunddocuments@fidelity.com.
What were your Fund costs for the last year?(based on hypothetical $10,000 investment)
FUND COST (PREVIOUS YEAR)
| | Costs of a $10,000 investment | Costs paid as a percentage of a $10,000 investment | |
| Class A | $ 105 | 0.99% | |
What affected the Fund's performance this period?
•U.S. equities gained for the 12 months ending July 31, 2024, driven by resilient corporate profits, a frenzy over generative artificial intelligence and the Federal Reserve's likely pivot to cutting interest rates later this year.
•Against this backdrop, security selection was the primary contributor to the fund's performance versus the MSCI U.S. IMI Energy 25/50 Index for the fiscal year, led by oil & gas exploration & production. Stock picks in integrated oil & gas and independent power producers & energy traders also boosted the fund's relative performance.
•The top individual relative contributor was an overweight in TechnipFMC (+62%). We pared our stake in TechnipFMC. The second-largest relative contributor was an underweight in Chevron (+2%). The stock was one of the fund's largest holdings even though we reduced the position this period. Another notable relative contributor was our non-index stake in Vistra (+186%).
•In contrast, the biggest detractors from performance versus the sector index were security selection and an underweight in oil & gas storage & transportation. Also hurting our relative result were overweights in oil & gas drilling and oil & gas equipment & services.
•Not owning Targa Resources, an index component that gained 69%, was the fund's biggest individual relative detractor. Not owning Williams Companies, an index component that gained 31%, was the fund's second-largest relative detractor. Another notable relative detractor this period was avoiding ONEOK, an index component that gained about 30%.
•Notable changes in positioning include increased exposure to the oil & gas drilling industry and a lower allocation to oil & gas exploration & production.
How did the Fund perform over the past 10 years?
CUMULATIVE PERFORMANCE
July 31, 2014 through July 31, 2024.
Initial investment of $10,000 and the current sales charge was paid.
Class A | $9,425 | $6,699 | $6,783 | $6,705 | $8,319 | $6,234 | $3,769 | $5,532 | $9,467 | $10,976 | $12,232 |
MSCI U.S. IMI Energy 25-50 Index | $10,000 | $7,208 | $7,220 | $7,200 | $8,707 | $7,019 | $4,258 | $6,393 | $10,594 | $12,299 | $13,570 |
S&P 500® Index | $10,000 | $11,121 | $11,745 | $13,629 | $15,843 | $17,108 | $19,153 | $26,134 | $24,921 | $28,165 | $34,403 |
| | 2014 | 2015 | 2016 | 2017 | 2018 | 2019 | 2020 | 2021 | 2022 | 2023 | 2024 |
AVERAGE ANNUAL TOTAL RETURNS: | | 1 Year | 5 Year | 10 Year |
| Class A (incl. 5.75% sales charge) | 5.03% | 13.08% | 2.03% |
| Class A (without 5.75% sales charge) | 11.44% | 14.43% | 2.64% |
| MSCI U.S. IMI Energy 25-50 Index | 10.33% | 14.09% | 3.10% |
| S&P 500® Index | 22.15% | 15.00% | 13.15% |
Visit institutional.fidelity.com for more recent performance information. |
The Fund's past performance is not a good predictor of the Fund's future performance. The graph and table do not reflect the deduction of taxes that a shareholder would pay on fund distributions or redemption of fund shares. |
Key Fund Statistics (as of July 31, 2024)
KEY FACTS | | |
| Fund Size | $1,311,457,602 | |
| Number of Holdings | 43 | |
| Total Advisory Fee | $7,393,032 | |
| Portfolio Turnover | 31% | |
What did the Fund invest in?
(as of July 31, 2024)
TOP INDUSTRIES (% of Fund's net assets) |
| Oil, Gas & Consumable Fuels | 81.1 | |
| Energy Equipment & Services | 16.3 | |
| Independent Power and Renewable Electricity Producers | 1.4 | |
| Machinery | 1.0 | |
| |
| Common Stocks | 99.8 |
| Short-Term Investments and Net Other Assets (Liabilities) | 0.2 |
ASSET ALLOCATION (% of Fund's net assets) |
|
|
| United States | 82.6 |
| Canada | 13.4 |
| United Kingdom | 3.3 |
| Norway | 0.3 |
| Cameroon | 0.2 |
| France | 0.1 |
| United Arab Emirates | 0.1 |
GEOGRAPHIC DIVERSIFICATION (% of Fund's net assets) |
|
| |
|
TOP HOLDINGS (% of Fund's net assets) | | |
| Exxon Mobil Corp | 24.8 | |
| Cenovus Energy Inc | 6.2 | |
| Schlumberger NV | 5.4 | |
| Chevron Corp | 4.8 | |
| Marathon Petroleum Corp | 4.8 | |
| Canadian Natural Resources Ltd | 4.5 | |
| Valero Energy Corp | 3.9 | |
| Cheniere Energy Inc | 3.9 | |
| Occidental Petroleum Corp | 3.8 | |
| Hess Corp | 3.4 | |
| | 65.5 | |
| |
How has the Fund changed?
This is a summary of certain changes to the Fund since August 1, 2023. For more complete information, you may review the Fund's next prospectus, which we expect to be available by September 28, 2024 at fundresearch.fidelity.com/prospectus/sec or upon request at 1-877-208-0098 or by sending an e-mail to fidfunddocuments@fidelity.com.
The fund's transfer agent and pricing & bookkeeping fees were changed to a fixed rate effective December 1, 2023, through February 29, 2024, in anticipation of the transition to a new management fee structure. Effective March 1, 2024, the fund's management contract was amended to incorporate administrative services previously covered under separate services agreements (transfer agent and pricing & bookkeeping). The amended contract incorporates a management fee rate that may vary by class. The Adviser or an affiliate pays certain expenses of managing and operating the fund out of each class's management fee. | |
| Fidelity, the Fidelity Investments Logo and all other Fidelity trademarks or service marks used herein are trademarks or service marks of FMR LLC. Any third-party marks that are used herein are trademarks or service marks of their respective owners. © 2024 FMR LLC. All rights reserved. |
| | For additional information about the Fund; including its prospectus, financial information, holdings and proxy information, scan the QR code or visit fundresearch.fidelity.com/prospectus/sec 1.9913418.100 247-TSRA-0924 |
| |
| | ANNUAL SHAREHOLDER REPORT | AS OF JULY 31, 2024 | This report describes changes to the Fund that occurred during the reporting period. |
| | Fidelity Advisor® Financials Fund Fidelity Advisor® Financials Fund Class A : FAFDX |
| | | |
This annual shareholder report contains information about Fidelity Advisor® Financials Fund for the period August 1, 2023 to July 31, 2024. You can find additional information about the Fund at fundresearch.fidelity.com/prospectus/sec. You can also request this information by contacting us at 1-877-208-0098 or by sending an e-mail to fidfunddocuments@fidelity.com.
What were your Fund costs for the last year?(based on hypothetical $10,000 investment)
FUND COST (PREVIOUS YEAR)
| | Costs of a $10,000 investment | Costs paid as a percentage of a $10,000 investment | |
| Class A | $ 118 | 1.03% | |
What affected the Fund's performance this period?
•U.S. equities gained for the 12 months ending July 31, 2024, driven by resilient corporate profits, a frenzy over generative artificial intelligence and the Federal Reserve's likely pivot to cutting interest rates later this year.
•Against this backdrop, security selection was the primary contributor to the fund's performance versus the MSCI US IMI Financials 5% Capped Linked Index for the fiscal year, led by regional banks. Picks among reinsurance firms and insurance brokers also boosted the fund's relative performance.
•The top individual relative contributor was an overweight in Reinsurance Group of America (+64%), though we decreased our exposure to the stock this period. The company was among the fund's largest holdings. Avoiding shares of Visa, an index component that gained approximately 13%, helped as well. An outsized stake in Baldwin Insurance Group (+79%) was another plus.
•In contrast, the primary detractor from performance versus the sector index was stock selection in the property & casualty insurance industry. Subpar investment choices among life & health insurance and financial exchanges & data companies hurt as well.
•The biggest individual relative detractor this period was avoiding Progressive, an index component that rose 71%. Similarly, not owing KKR, an index component that increased approximately 110%, also proved detrimental to performance. An underweight stake in JPMorgan Chase (+38%) also hurt. The stock was not held at period end.
•Notable changes in positioning include increased exposure to the investment banking & brokerage and diversified financial services industries.
How did the Fund perform over the past 10 years?
CUMULATIVE PERFORMANCE
July 31, 2014 through July 31, 2024.
Initial investment of $10,000 and the current sales charge was paid.
Class A | $9,425 | $10,489 | $9,844 | $12,499 | $14,014 | $14,301 | $12,135 | $19,639 | $18,971 | $19,762 | $25,727 |
MSCI U.S. IMI Financials 5% Capped Linked Index | $10,000 | $11,434 | $11,272 | $14,794 | $16,593 | $17,130 | $14,510 | $22,803 | $21,734 | $22,906 | $29,316 |
S&P 500® Index | $10,000 | $11,121 | $11,745 | $13,629 | $15,843 | $17,108 | $19,153 | $26,134 | $24,921 | $28,165 | $34,403 |
| | 2014 | 2015 | 2016 | 2017 | 2018 | 2019 | 2020 | 2021 | 2022 | 2023 | 2024 |
AVERAGE ANNUAL TOTAL RETURNS: | | 1 Year | 5 Year | 10 Year |
| Class A (incl. 5.75% sales charge) | 22.69% | 11.14% | 9.91% |
| Class A (without 5.75% sales charge) | 30.18% | 12.46% | 10.56% |
| MSCI U.S. IMI Financials 5% Capped Linked Index | 27.98% | 11.35% | 11.36% |
| S&P 500® Index | 22.15% | 15.00% | 13.15% |
Visit institutional.fidelity.com for more recent performance information. |
The Fund's past performance is not a good predictor of the Fund's future performance. The graph and table do not reflect the deduction of taxes that a shareholder would pay on fund distributions or redemption of fund shares. |
Key Fund Statistics (as of July 31, 2024)
KEY FACTS | | |
| Fund Size | $507,414,487 | |
| Number of Holdings | 66 | |
| Total Advisory Fee | $2,566,292 | |
| Portfolio Turnover | 44% | |
What did the Fund invest in?
(as of July 31, 2024)
TOP INDUSTRIES (% of Fund's net assets) |
| Banks | 35.0 | |
| Capital Markets | 21.1 | |
| Financial Services | 20.7 | |
| Insurance | 18.5 | |
| Consumer Finance | 3.7 | |
| Professional Services | 1.0 | |
| |
| Common Stocks | 100.0 |
| Short-Term Investments and Net Other Assets (Liabilities) | 0.0 |
ASSET ALLOCATION (% of Fund's net assets) |
|
|
| United States | 93.0 |
| United Kingdom | 3.7 |
| Puerto Rico | 2.1 |
| Grand Cayman (UK Overseas Ter) | 0.7 |
| Mexico | 0.5 |
GEOGRAPHIC DIVERSIFICATION (% of Fund's net assets) |
|
| |
|
TOP HOLDINGS (% of Fund's net assets) | | |
| Mastercard Inc Class A | 10.1 | |
| Wells Fargo & Co | 6.4 | |
| Bank of America Corp | 5.1 | |
| Citigroup Inc | 3.1 | |
| Chubb Ltd | 2.6 | |
| M&T Bank Corp | 2.6 | |
| Morgan Stanley | 2.5 | |
| Apollo Global Management Inc | 2.4 | |
| Reinsurance Group of America Inc | 2.3 | |
| Popular Inc | 2.1 | |
| | 39.2 | |
| |
How has the Fund changed?
This is a summary of certain changes to the Fund since August 1, 2023. For more complete information, you may review the Fund's next prospectus, which we expect to be available by September 28, 2024 at fundresearch.fidelity.com/prospectus/sec or upon request at 1-877-208-0098 or by sending an e-mail to fidfunddocuments@fidelity.com.
The fund's name changed from Fidelity Advisor Financial Services Fund to Fidelity Advisor Financials Fund during the reporting period. | The fund's transfer agent and pricing and bookkeeping fees were changed to a fixed rate effective December 1, 2023, through February 29, 2024, in anticipation of the transition to a new management fee structure. Effective March 1, 2024, the fund's management contract was amended to incorporate administrative services previously covered under separate services agreements (transfer agent and pricing and bookkeeping).The amended contract incorporates a management fee rate that may vary by class. The Adviser or an affiliate pays certain expenses of managing and operating the fund out of each class's management fee. |
| Fidelity, the Fidelity Investments Logo and all other Fidelity trademarks or service marks used herein are trademarks or service marks of FMR LLC. Any third-party marks that are used herein are trademarks or service marks of their respective owners. © 2024 FMR LLC. All rights reserved. |
| | For additional information about the Fund; including its prospectus, financial information, holdings and proxy information, scan the QR code or visit fundresearch.fidelity.com/prospectus/sec 1.9913392.100 183-TSRA-0924 |
| |
| | ANNUAL SHAREHOLDER REPORT | AS OF JULY 31, 2024 | This report describes changes to the Fund that occurred during the reporting period. |
| | Fidelity Advisor® Semiconductors Fund Fidelity Advisor® Semiconductors Fund Class C : FELCX |
| | | |
This annual shareholder report contains information about Fidelity Advisor® Semiconductors Fund for the period August 1, 2023 to July 31, 2024. You can find additional information about the Fund at fundresearch.fidelity.com/prospectus/sec. You can also request this information by contacting us at 1-877-208-0098 or by sending an e-mail to fidfunddocuments@fidelity.com.
What were your Fund costs for the last year?(based on hypothetical $10,000 investment)
FUND COST (PREVIOUS YEAR)
| | Costs of a $10,000 investment | Costs paid as a percentage of a $10,000 investment | |
| Class C | $ 204 | 1.71% | |
What affected the Fund's performance this period?
•U.S. equities gained for the 12 months ending July 31, 2024, driven by resilient corporate profits, a frenzy over generative artificial intelligence and the Federal Reserve's likely pivot to cutting interest rates later this year.
•Against this backdrop, security selection was the primary detractor from the fund's performance versus the MSCI U.S. IMI Semiconductors & Semiconductor Equipment 25/50 Index for the fiscal year, especially within semiconductors. Also hurting our result were picks in technology hardware, storage & peripherals. Lastly, the fund's position in cash was a notable detractor.
•The biggest individual relative detractor was an overweight in onsemi (-28%). This period we increased our stake in onsemi, and it was among our largest holdings. The fund's second-largest relative detractor was our non-index stake in GlobalFoundries (-20%). This period we increased our stake in GlobalFoundries, and it was among the fund's biggest holdings. An underweight in Broadcom (+82%) also detracted. The company was among the fund's largest holdings.
•In contrast, the primary contributors to performance versus the industry index were picks and an underweight in the semiconductor materials & equipment group.
•The fund's top individual relative contributor this period was avoiding Intel, an index component that returned -13%. The second-largest relative contributor was an underweight in Texas Instruments (+18%). This period we decreased our position in Texas Instruments. Not owning SolarEdge Technologies, an index component that returned -88%, was another notable relative contributor.
How did the Fund perform over the past 10 years?
CUMULATIVE PERFORMANCE
July 31, 2014 through July 31, 2024.
Initial investment of $10,000.
Class C | $10,000 | $11,003 | $13,147 | $17,118 | $21,634 | $23,652 | $30,685 | $49,454 | $47,513 | $70,942 | $98,975 |
MSCI U.S. IMI Semiconductors & Semiconductor Equipment 25-50 Index | $10,000 | $10,481 | $13,028 | $17,291 | $21,750 | $23,948 | $32,281 | $51,070 | $48,484 | $72,407 | $107,971 |
S&P 500® Index | $10,000 | $11,121 | $11,745 | $13,629 | $15,843 | $17,108 | $19,153 | $26,134 | $24,921 | $28,165 | $34,403 |
| | 2014 | 2015 | 2016 | 2017 | 2018 | 2019 | 2020 | 2021 | 2022 | 2023 | 2024 |
AVERAGE ANNUAL TOTAL RETURNS: | | 1 Year | 5 Year | 10 Year |
| Class C (incl. contingent deferred sales charge) | 37.46% | 32.74% | 25.76% |
| Class C | 38.46% | 32.74% | 25.76% |
| MSCI U.S. IMI Semiconductors & Semiconductor Equipment 25-50 Index | 49.12% | 35.15% | 26.86% |
| S&P 500® Index | 22.15% | 15.00% | 13.15% |
Visit institutional.fidelity.com for more recent performance information. |
The Fund's past performance is not a good predictor of the Fund's future performance. The graph and table do not reflect the deduction of taxes that a shareholder would pay on fund distributions or redemption of fund shares. |
Key Fund Statistics (as of July 31, 2024)
KEY FACTS | | |
| Fund Size | $2,698,217,311 | |
| Number of Holdings | 45 | |
| Total Advisory Fee | $11,387,050 | |
| Portfolio Turnover | 30% | |
What did the Fund invest in?
(as of July 31, 2024)
TOP INDUSTRIES (% of Fund's net assets) |
| Semiconductors & Semiconductor Equipment | 92.7 | |
| Technology Hardware, Storage & Peripherals | 2.4 | |
| Electronic Equipment, Instruments & Components | 0.1 | |
| Financial Services | 0.0 | |
| Metals & Mining | 0.0 | |
| |
| Common Stocks | 95.0 |
| Preferred Stocks | 0.2 |
| Preferred Securities | 0.0 |
| Short-Term Investments and Net Other Assets (Liabilities) | 4.8 |
ASSET ALLOCATION (% of Fund's net assets) |
|
|
| United States | 79.9 |
| Taiwan | 7.1 |
| China | 5.6 |
| Netherlands | 5.0 |
| Israel | 1.7 |
| Japan | 0.7 |
GEOGRAPHIC DIVERSIFICATION (% of Fund's net assets) |
|
| |
|
TOP HOLDINGS (% of Fund's net assets) | | |
| NVIDIA Corp | 25.8 | |
| ON Semiconductor Corp | 7.3 | |
| Taiwan Semiconductor Manufacturing Co Ltd ADR | 6.1 | |
| NXP Semiconductors NV | 5.6 | |
| Micron Technology Inc | 5.4 | |
| ASML Holding NV depository receipt | 5.0 | |
| GlobalFoundries Inc | 4.8 | |
| Lam Research Corp | 4.8 | |
| Broadcom Inc | 4.3 | |
| Advanced Micro Devices Inc | 3.8 | |
| | 72.9 | |
| |
How has the Fund changed?
This is a summary of certain changes to the Fund since August 1, 2023. For more complete information, you may review the Fund's next prospectus, which we expect to be available by September 28, 2024 at fundresearch.fidelity.com/prospectus/sec or upon request at 1-877-208-0098 or by sending an e-mail to fidfunddocuments@fidelity.com.
The fees associated with this class changed during the reporting year. The variations in class fees are primarily the result of the following changes: - •Management fee
- •Operating expenses
The fund's transfer agent and pricing and bookkeeping fees were changed to a fixed rate effective December 1, 2023, through February 29, 2024, in anticipation of the transition to a new management fee structure. Effective March 1, 2024, the fund's management contract was amended to incorporate administrative services previously covered under separate services agreements (transfer agent and pricing and bookkeeping).The amended contract incorporates a management fee rate that may vary by class. The Adviser or an affiliate pays certain expenses of managing and operating the fund out of each class's management fee. |
| Fidelity, the Fidelity Investments Logo and all other Fidelity trademarks or service marks used herein are trademarks or service marks of FMR LLC. Any third-party marks that are used herein are trademarks or service marks of their respective owners. © 2024 FMR LLC. All rights reserved. |
| | For additional information about the Fund; including its prospectus, financial information, holdings and proxy information, scan the QR code or visit fundresearch.fidelity.com/prospectus/sec 1.9913441.100 119-TSRA-0924 |
| |
| | ANNUAL SHAREHOLDER REPORT | AS OF JULY 31, 2024 | This report describes changes to the Fund that occurred during the reporting period. |
| | Fidelity Advisor® Utilities Fund Fidelity Advisor® Utilities Fund Class I : FUGIX |
| | | |
This annual shareholder report contains information about Fidelity Advisor® Utilities Fund for the period August 1, 2023 to July 31, 2024. You can find additional information about the Fund at fundresearch.fidelity.com/prospectus/sec. You can also request this information by contacting us at 1-877-208-0098 or by sending an e-mail to fidfunddocuments@fidelity.com.
What were your Fund costs for the last year?(based on hypothetical $10,000 investment)
FUND COST (PREVIOUS YEAR)
| | Costs of a $10,000 investment | Costs paid as a percentage of a $10,000 investment | |
| Class I | $ 79 | 0.73% | |
What affected the Fund's performance this period?
•U.S. equities gained for the 12 months ending July 31, 2024, driven by resilient corporate profits, a frenzy over generative artificial intelligence and the Federal Reserve's likely pivot to cutting interest rates later this year.
•Against this backdrop, both security selection and market selection contributed to the fund's performance versus the MSCI US IMI Utilities 25/50 Index for the fiscal year, led by our stock picks in electric utilities. An overweight in independent power producers & energy traders also boosted the fund's relative performance, as did stock choices and an underweight in multi-utilities.
•The top individual relative contributor was an overweight in Vistra (+185%). This period we decreased our position in the stock, but the company was among the fund's biggest holdings at the end of the period. A second notable relative contributor was an overweight in Constellation Energy (+99%). Like Vistra, we decreased our position in Constellation Energy this period, but the stock remained among the fund's largest holdings. Another notable relative contributor was an underweight in Exelon (-8%), a stock was not held at period end.
•In contrast, the biggest detractors from performance versus the sector index were stock picking and an overweight in renewable electricity. Our picks in coal & consumable fuels and gas utilities also hurt. Lastly, the fund's position in cash was a notable detractor.
•The largest individual relative detractor was an overweight in NextEra Energy Partners (-48%), the yield company subsidiary of another fund holding, NextEra Energy. This period we increased our investment in the stock. Other notable relative detractors included underweights in Duke Energy (+22%) and DTE Energy (+9%). We exited our positions in both during the period.
•Notable changes in positioning include decreased exposure to water utilities and a higher allocation to multi-utilities.
How did the Fund perform over the past 10 years?
CUMULATIVE PERFORMANCE
July 31, 2014 through July 31, 2024.
Initial investment of $10,000.
Class I | $10,000 | $10,235 | $11,648 | $12,833 | $14,133 | $15,835 | $15,628 | $18,020 | $21,444 | $21,156 | $24,715 |
MSCI U.S. IMI Utilities 25-50 Index | $10,000 | $10,922 | $13,519 | $14,434 | $15,013 | $17,419 | $17,988 | $20,183 | $23,242 | $21,712 | $24,456 |
S&P 500® Index | $10,000 | $11,121 | $11,745 | $13,629 | $15,843 | $17,108 | $19,153 | $26,134 | $24,921 | $28,165 | $34,403 |
| | 2014 | 2015 | 2016 | 2017 | 2018 | 2019 | 2020 | 2021 | 2022 | 2023 | 2024 |
AVERAGE ANNUAL TOTAL RETURNS: | | 1 Year | 5 Year | 10 Year |
| Class I | 16.82% | 9.31% | 9.47% |
| MSCI U.S. IMI Utilities 25-50 Index | 12.64% | 7.02% | 9.36% |
| S&P 500® Index | 22.15% | 15.00% | 13.15% |
Visit institutional.fidelity.com for more recent performance information. |
The Fund's past performance is not a good predictor of the Fund's future performance. The graph and table do not reflect the deduction of taxes that a shareholder would pay on fund distributions or redemption of fund shares. |
Key Fund Statistics (as of July 31, 2024)
KEY FACTS | | |
| Fund Size | $819,716,826 | |
| Number of Holdings | 30 | |
| Total Advisory Fee | $4,138,318 | |
| Portfolio Turnover | 84% | |
What did the Fund invest in?
(as of July 31, 2024)
TOP INDUSTRIES (% of Fund's net assets) |
| Electric Utilities | 63.0 | |
| Multi-Utilities | 23.0 | |
| Independent Power and Renewable Electricity Producers | 7.0 | |
| Gas Utilities | 2.2 | |
| Oil, Gas & Consumable Fuels | 0.2 | |
| |
| Common Stocks | 95.4 |
| Short-Term Investments and Net Other Assets (Liabilities) | 4.6 |
ASSET ALLOCATION (% of Fund's net assets) |
|
|
| United States | 99.8 |
| Australia | 0.2 |
GEOGRAPHIC DIVERSIFICATION (% of Fund's net assets) |
|
| |
|
TOP HOLDINGS (% of Fund's net assets) | | |
| NextEra Energy Inc | 12.7 | |
| Sempra | 7.1 | |
| PG&E Corp | 5.9 | |
| American Electric Power Co Inc | 5.6 | |
| Edison International | 5.4 | |
| Public Service Enterprise Group Inc | 5.0 | |
| Eversource Energy | 5.0 | |
| Constellation Energy Corp | 5.0 | |
| Entergy Corp | 4.8 | |
| FirstEnergy Corp | 4.3 | |
| | 60.8 | |
| |
How has the Fund changed?
This is a summary of certain changes to the Fund since August 1, 2023. For more complete information, you may review the Fund's next prospectus, which we expect to be available by September 28, 2024 at fundresearch.fidelity.com/prospectus/sec or upon request at 1-877-208-0098 or by sending an e-mail to fidfunddocuments@fidelity.com.
| The fund's transfer agent and pricing & bookkeeping fees were changed to a fixed rate effective December 1, 2023, through February 29, 2024, in anticipation of the transition to a new management fee structure. Effective March 1, 2024, the fund's management contract was amended to incorporate administrative services previously covered under separate services agreements (transfer agent and pricing & bookkeeping). The amended contract incorporates a management fee rate that may vary by class. The Adviser or an affiliate pays certain expenses of managing and operating the fund out of each class's management fee. |
| Fidelity, the Fidelity Investments Logo and all other Fidelity trademarks or service marks used herein are trademarks or service marks of FMR LLC. Any third-party marks that are used herein are trademarks or service marks of their respective owners. © 2024 FMR LLC. All rights reserved. |
| | For additional information about the Fund; including its prospectus, financial information, holdings and proxy information, scan the QR code or visit fundresearch.fidelity.com/prospectus/sec 1.9913409.100 206-TSRA-0924 |
| |
| | ANNUAL SHAREHOLDER REPORT | AS OF JULY 31, 2024 | This report describes changes to the Fund that occurred during the reporting period. |
| | Fidelity Advisor® Health Care Fund Fidelity Advisor® Health Care Fund Class C : FHCCX |
| | | |
This annual shareholder report contains information about Fidelity Advisor® Health Care Fund for the period August 1, 2023 to July 31, 2024. You can find additional information about the Fund at fundresearch.fidelity.com/prospectus/sec. You can also request this information by contacting us at 1-877-208-0098 or by sending an e-mail to fidfunddocuments@fidelity.com.
What were your Fund costs for the last year?(based on hypothetical $10,000 investment)
FUND COST (PREVIOUS YEAR)
| | Costs of a $10,000 investment | Costs paid as a percentage of a $10,000 investment | |
| Class C | $ 175 | 1.70% | |
What affected the Fund's performance this period?
•U.S. equities gained for the 12 months ending July 31, 2024, driven by resilient corporate profits, a frenzy over generative artificial intelligence and the Federal Reserve's likely pivot to cutting interest rates later this year.
•Against this backdrop, security selection and market selection were the primary detractors to the fund's performance versus the benchmark, led by health care services. Also hurting the fund's relative result was security selection in health care facilities and biotechnology.
•The largest individual relative detractor was an overweight in Penumbra (-45%), which was among our biggest holdings. It also hurt to overweight agilon health (-64%) and 10X Genomics (-67%). This period we decreased our position in agilon.
•In contrast, the biggest contributor to performance versus the sector index was security selection in pharmaceuticals. Stock picks in health care equipment also boosted relative performance.
•The top individual relative contributor was an overweight in Boston Scientific (+42%). The stock was the fund's largest holding, even though we decreased the fund's stake this period. It also helped to avoid index components Johnson & Johnson (-3%) and Pfizer (-10%).
•Notable changes in positioning include decreased exposure to the life sciences tools & services industry and a higher allocation to biotechnology.
How did the Fund perform over the past 10 years?
CUMULATIVE PERFORMANCE
July 31, 2014 through July 31, 2024.
Initial investment of $10,000.
Class C | $10,000 | $13,304 | $11,907 | $12,940 | $15,384 | $15,708 | $19,413 | $23,253 | $20,332 | $21,087 | $22,496 |
MSCI U.S. IMI Health Care 25-50 Index | $10,000 | $13,063 | $12,726 | $13,917 | $16,068 | $16,693 | $19,997 | $25,628 | $24,807 | $25,460 | $28,709 |
S&P 500® Index | $10,000 | $11,121 | $11,745 | $13,629 | $15,843 | $17,108 | $19,153 | $26,134 | $24,921 | $28,165 | $34,403 |
| | 2014 | 2015 | 2016 | 2017 | 2018 | 2019 | 2020 | 2021 | 2022 | 2023 | 2024 |
AVERAGE ANNUAL TOTAL RETURNS: | | 1 Year | 5 Year | 10 Year |
| Class C (incl. contingent deferred sales charge) | 4.90% | 7.13% | 8.45% |
| Class C | 5.90% | 7.13% | 8.45% |
| MSCI U.S. IMI Health Care 25-50 Index | 12.76% | 11.45% | 11.12% |
| S&P 500® Index | 22.15% | 15.00% | 13.15% |
Visit institutional.fidelity.com for more recent performance information. |
The Fund's past performance is not a good predictor of the Fund's future performance. The graph and table do not reflect the deduction of taxes that a shareholder would pay on fund distributions or redemption of fund shares. |
Key Fund Statistics (as of July 31, 2024)
KEY FACTS | | |
| Fund Size | $4,615,583,149 | |
| Number of Holdings | 103 | |
| Total Advisory Fee | $27,914,465 | |
| Portfolio Turnover | 37% | |
What did the Fund invest in?
(as of July 31, 2024)
TOP INDUSTRIES (% of Fund's net assets) |
| Biotechnology | 24.4 | |
| Health Care Equipment & Supplies | 23.5 | |
| Health Care Providers & Services | 21.8 | |
| Pharmaceuticals | 16.6 | |
| Life Sciences Tools & Services | 10.9 | |
| Health Care Technology | 2.0 | |
| Financial Services | 0.2 | |
| |
| Common Stocks | 97.9 |
| Preferred Stocks | 1.5 |
| Preferred Securities | 0.2 |
| Bonds | 0.1 |
| Short-Term Investments and Net Other Assets (Liabilities) | 0.3 |
ASSET ALLOCATION (% of Fund's net assets) |
|
|
| United States | 91.5 |
| Netherlands | 3.0 |
| United Kingdom | 1.7 |
| Denmark | 1.5 |
| Belgium | 1.3 |
| Canada | 0.9 |
| Israel | 0.1 |
| China | 0.0 |
GEOGRAPHIC DIVERSIFICATION (% of Fund's net assets) |
|
| |
|
TOP HOLDINGS (% of Fund's net assets) | | |
| Boston Scientific Corp | 9.6 | |
| Eli Lilly & Co | 8.2 | |
| UnitedHealth Group Inc | 7.8 | |
| Danaher Corp | 6.4 | |
| Regeneron Pharmaceuticals Inc | 4.4 | |
| Merck & Co Inc | 3.9 | |
| Cigna Group/The | 3.4 | |
| Penumbra Inc | 3.1 | |
| Stryker Corp | 2.4 | |
| Insulet Corp | 2.2 | |
| | 51.4 | |
| |
How has the Fund changed?
This is a summary of certain changes to the Fund since August 1, 2023. For more complete information, you may review the Fund's next prospectus, which we expect to be available by September 28, 2024 at fundresearch.fidelity.com/prospectus/sec or upon request at 1-877-208-0098 or by sending an e-mail to fidfunddocuments@fidelity.com.
The fund's transfer agent and pricing & bookkeeping fees were changed to a fixed rate effective December 1, 2023, through February 29, 2024, in anticipation of the transition to a new management fee structure. Effective March 1, 2024, the fund's management contract was amended to incorporate administrative services previously covered under separate services agreements (transfer agent and pricing & bookkeeping). The amended contract incorporates a management fee rate that may vary by class. The Adviser or an affiliate pays certain expenses of managing and operating the fund out of each class's management fee. | |
| Fidelity, the Fidelity Investments Logo and all other Fidelity trademarks or service marks used herein are trademarks or service marks of FMR LLC. Any third-party marks that are used herein are trademarks or service marks of their respective owners. © 2024 FMR LLC. All rights reserved. |
| | For additional information about the Fund; including its prospectus, financial information, holdings and proxy information, scan the QR code or visit fundresearch.fidelity.com/prospectus/sec 1.9913390.100 285-TSRA-0924 |
| |
| | ANNUAL SHAREHOLDER REPORT | AS OF JULY 31, 2024 | This report describes changes to the Fund that occurred during the reporting period. |
| | Fidelity Advisor® Industrials Fund Fidelity Advisor® Industrials Fund Class Z : FIKEX |
| | | |
This annual shareholder report contains information about Fidelity Advisor® Industrials Fund for the period August 1, 2023 to July 31, 2024. You can find additional information about the Fund at fundresearch.fidelity.com/prospectus/sec. You can also request this information by contacting us at 1-877-208-0098 or by sending an e-mail to fidfunddocuments@fidelity.com.
What were your Fund costs for the last year?(based on hypothetical $10,000 investment)
FUND COST (PREVIOUS YEAR)
| | Costs of a $10,000 investment | Costs paid as a percentage of a $10,000 investment | |
| Class Z | $ 69 | 0.61% | |
What affected the Fund's performance this period?
•U.S. equities gained for the 12 months ending July 31, 2024, driven by resilient corporate profits, a frenzy over generative artificial intelligence and the Federal Reserve's likely pivot to cutting interest rates later this year.
•Against this backdrop, security selection was the primary contributor to the fund's performance versus the benchmark for the fiscal year, led by industrial machinery & supplies & components. Stock picks and an overweight in aerospace & defense also boosted the fund's relative performance.
•The top individual relative contributor was an overweight in Howmet Aerospace (+88%). The second-largest relative contributor was an overweight in General Electric (+88%), the fund's largest holding. Not owning United Parcel Service, an index component that returned roughly -27%, also contributed.
•In contrast, the primary detractor from performance versus the sector index was security selection in construction & engineering. The largest individual relative detractor was an overweight in Boeing (-20%), one of the fund's biggest holdings. A second notable relative detractor was an overweight in Knight-Swift Transportation (-9%). Another notable relative detractor was an overweight in Chart Industries (-12%).
•Notable changes in positioning include increased exposure to the trading companies & distributors industry and a lower allocation to environmental & facilities services.
How did the Fund perform over the life of Fund?
CUMULATIVE PERFORMANCE
October 2, 2018 through July 31, 2024.
Initial investment of $10,000.
Class Z | $10,000 | $9,808 | $9,199 | $12,525 | $11,596 | $13,816 | $17,564 |
MSCI U.S. IMI Industrials 25-50 Index | $10,000 | $10,039 | $9,457 | $13,947 | $12,942 | $15,447 | $18,353 |
S&P 500® Index | $10,000 | $10,365 | $11,604 | $15,833 | $15,098 | $17,064 | $20,843 |
| | 2018 | 2019 | 2020 | 2021 | 2022 | 2023 | 2024 |
AVERAGE ANNUAL TOTAL RETURNS: | | 1 Year | 5 Year | Life of Fund A |
| Class Z | 27.12% | 12.36% | 10.14% |
| MSCI U.S. IMI Industrials 25-50 Index | 18.81% | 12.83% | 10.97% |
| S&P 500® Index | 22.15% | 15.00% | 13.42% |
A From October 2, 2018
Visit institutional.fidelity.com for more recent performance information. |
The Fund's past performance is not a good predictor of the Fund's future performance. The graph and table do not reflect the deduction of taxes that a shareholder would pay on fund distributions or redemption of fund shares. |
Key Fund Statistics (as of July 31, 2024)
KEY FACTS | | |
| Fund Size | $582,010,248 | |
| Number of Holdings | 51 | |
| Total Advisory Fee | $3,019,014 | |
| Portfolio Turnover | 29% | |
What did the Fund invest in?
(as of July 31, 2024)
TOP INDUSTRIES (% of Fund's net assets) |
| Aerospace & Defense | 22.7 | |
| Machinery | 20.2 | |
| Ground Transportation | 13.1 | |
| Electrical Equipment | 11.1 | |
| Building Products | 10.2 | |
| Trading Companies & Distributors | 5.6 | |
| Construction & Engineering | 3.8 | |
| Air Freight & Logistics | 3.6 | |
| Professional Services | 3.2 | |
| Others | 5.5 | |
| |
| Common Stocks | 99.0 |
| Short-Term Investments and Net Other Assets (Liabilities) | 1.0 |
ASSET ALLOCATION (% of Fund's net assets) |
|
|
GEOGRAPHIC DIVERSIFICATION (% of Fund's net assets) |
|
| |
|
TOP HOLDINGS (% of Fund's net assets) | | |
| General Electric Co | 6.3 | |
| Union Pacific Corp | 4.9 | |
| Ingersoll Rand Inc | 4.9 | |
| Howmet Aerospace Inc | 4.7 | |
| Boeing Co | 4.2 | |
| Parker-Hannifin Corp | 4.1 | |
| Trane Technologies PLC | 3.9 | |
| TransDigm Group Inc | 3.7 | |
| FedEx Corp | 3.4 | |
| Eaton Corp PLC | 3.3 | |
| | 43.4 | |
| |
How has the Fund changed?
This is a summary of certain changes to the Fund since August 1, 2023. For more complete information, you may review the Fund's next prospectus, which we expect to be available by September 28, 2024 at fundresearch.fidelity.com/prospectus/sec or upon request at 1-877-208-0098 or by sending an e-mail to fidfunddocuments@fidelity.com.
The fund's transfer agent and pricing and bookkeeping fees were changed to a fixed rate effective December 1, 2023, through February 29, 2024, in anticipation of the transition to a new management fee structure. Effective March 1, 2024, the fund's management contract was amended to incorporate administrative services previously covered under separate services agreements (transfer agent and pricing and bookkeeping).The amended contract incorporates a management fee rate that may vary by class. The Adviser or an affiliate pays certain expenses of managing and operating the fund out of each class's management fee. | |
| Fidelity, the Fidelity Investments Logo and all other Fidelity trademarks or service marks used herein are trademarks or service marks of FMR LLC. Any third-party marks that are used herein are trademarks or service marks of their respective owners. © 2024 FMR LLC. All rights reserved. |
| | For additional information about the Fund; including its prospectus, financial information, holdings and proxy information, scan the QR code or visit fundresearch.fidelity.com/prospectus/sec 1.9913401.100 3295-TSRA-0924 |
| |
| | ANNUAL SHAREHOLDER REPORT | AS OF JULY 31, 2024 | This report describes changes to the Fund that occurred during the reporting period. |
| | Fidelity Advisor® Global Real Estate Fund Fidelity Advisor® Global Real Estate Fund Class Z : FIKKX |
| | | |
This annual shareholder report contains information about Fidelity Advisor® Global Real Estate Fund for the period August 1, 2023 to July 31, 2024. You can find additional information about the Fund at fundresearch.fidelity.com/prospectus/sec. You can also request this information by contacting us at 1-877-208-0098 or by sending an e-mail to fidfunddocuments@fidelity.com.
What were your Fund costs for the last year?(based on hypothetical $10,000 investment)
FUND COST (PREVIOUS YEAR)
| | Costs of a $10,000 investment | Costs paid as a percentage of a $10,000 investment | |
| Class Z | $ 83 | 0.80% | |
What affected the Fund's performance this period?
•Investors in global real estate securities experienced fluctuating market conditions throughout the 12 months ending July 31, 2024, initially declining due to rate hike concerns but later rallying as hopes for rate cuts in 2024 grew. Market returns were weakened by a broadly stronger U.S. dollar.
•Against this backdrop, an underweight in Asia Pacific ex Japan - primarily Hong Kong - along with security selection in Japan, contributed to the fund's performance versus the FTSE® EPRASM/NAREIT® Developed Index for the fiscal year.
•By industry, security selection was the primary contributor, especially among diversified real estate activities stocks. Favorable picks in health care also boosted the fund's relative performance. Investment choices and an underweight in the diversified real estate segment helped as well.
•The top individual relative contributor was an overweight in Mitsui Fudosan (+57%). The company was one of the fund's biggest holdings. Outsized exposure to Mitsubishi Estate (+42%) was another plus. Not owning Wharf Real Estate Investment, an index component that returned -52%, also helped.
•In contrast, from a regional standpoint, stock picks in the U.K. and U.S. detracted from the fund's performance versus the real estate index.
•The biggest relative detractors were stock picks and an overweight in the single-family residential industry. Subpar investment choices and outsized exposure to industrial and multi-family residential stocks also were detrimental to performance.
•Not owning Simon Property Group, an index component that gained about 30%, was the largest individual relative detractor. An overweight stake in UOL Group (-22%) pressured performance as well. This period we decreased our stake in the company. Outsized exposure to Mitsui Fudosan Logistics Park (-18%) also hurt.
•Notable changes in positioning include decreased exposure to real estate stocks in Singapore and a higher allocation to the U.K. By industry, meaningful allocation shifts include increased exposure to the self storage industry and a reduction in hotel & resort holdings.
How did the Fund perform over the life of Fund?
CUMULATIVE PERFORMANCE
October 2, 2018 through July 31, 2024.
Initial investment of $10,000.
Class Z | $10,000 | $11,017 | $10,544 | $13,820 | $12,587 | $11,646 | $12,734 |
FTSE® EPRA℠/NAREIT® Developed Index | $10,000 | $11,066 | $9,583 | $13,050 | $11,840 | $10,973 | $11,848 |
MSCI ACWI (All Country World Index) Index | $10,000 | $10,222 | $11,001 | $14,698 | $13,199 | $14,959 | $17,565 |
| | 2018 | 2019 | 2020 | 2021 | 2022 | 2023 | 2024 |
AVERAGE ANNUAL TOTAL RETURNS: | | 1 Year | 5 Year | Life of Fund A |
| Class Z | 9.34% | 2.94% | 4.23% |
| FTSE® EPRA℠/NAREIT® Developed Index | 7.97% | 1.38% | 2.95% |
| MSCI ACWI (All Country World Index) Index | 17.42% | 11.43% | 10.14% |
A From October 2, 2018
Visit institutional.fidelity.com for more recent performance information. |
The Fund's past performance is not a good predictor of the Fund's future performance. The graph and table do not reflect the deduction of taxes that a shareholder would pay on fund distributions or redemption of fund shares. |
Key Fund Statistics (as of July 31, 2024)
KEY FACTS | | |
| Fund Size | $6,027,346 | |
| Number of Holdings | 73 | |
| Total Advisory Fee | $39,394 | |
| Portfolio Turnover | 32% | |
What did the Fund invest in?
(as of July 31, 2024)
TOP INDUSTRIES (% of Fund's net assets) |
| Residential REITs | 19.8 | |
| Specialized REITs | 19.1 | |
| Industrial REITs | 18.3 | |
| Retail REITs | 18.0 | |
| Real Estate Management & Development | 11.9 | |
| Health Care REITs | 7.1 | |
| Diversified REITs | 2.8 | |
| Hotel & Resort REITs | 1.3 | |
| Office REITs | 0.6 | |
| |
| Common Stocks | 98.9 |
| Short-Term Investments and Net Other Assets (Liabilities) | 1.1 |
ASSET ALLOCATION (% of Fund's net assets) |
|
|
| United States | 61.9 |
| United Kingdom | 8.3 |
| Japan | 8.2 |
| Australia | 4.9 |
| Canada | 3.7 |
| Singapore | 3.0 |
| France | 2.3 |
| Sweden | 1.9 |
| Germany | 1.8 |
| Others | 4.0 |
GEOGRAPHIC DIVERSIFICATION (% of Fund's net assets) |
|
| |
|
TOP HOLDINGS (% of Fund's net assets) | | |
| Prologis Inc | 9.1 | |
| Equinix Inc | 5.2 | |
| Public Storage Operating Co | 3.9 | |
| Ventas Inc | 3.6 | |
| Digital Realty Trust Inc | 3.0 | |
| Kimco Realty Corp | 2.8 | |
| Grainger PLC | 2.6 | |
| NNN REIT Inc | 2.5 | |
| UDR Inc | 2.4 | |
| Welltower Inc | 2.4 | |
| | 37.5 | |
| |
How has the Fund changed?
This is a summary of certain changes to the Fund since August 1, 2023. For more complete information, you may review the Fund's next prospectus, which we expect to be available by September 28, 2024 at fundresearch.fidelity.com/prospectus/sec or upon request at 1-877-208-0098 or by sending an e-mail to fidfunddocuments@fidelity.com.
The fund's transfer agent and pricing & bookkeeping fees were changed to a fixed rate effective December 1, 2023, through February 29, 2024, in anticipation of the transition to a new management fee structure. Effective March 1, 2024, the fund's management contract was amended to incorporate administrative services previously covered under separate services agreements (transfer agent and pricing & bookkeeping). The amended contract incorporates a management fee rate that may vary by class. The Adviser or an affiliate pays certain expenses of managing and operating the fund out of each class's management fee. | |
| Fidelity, the Fidelity Investments Logo and all other Fidelity trademarks or service marks used herein are trademarks or service marks of FMR LLC. Any third-party marks that are used herein are trademarks or service marks of their respective owners. © 2024 FMR LLC. All rights reserved. |
| | For additional information about the Fund; including its prospectus, financial information, holdings and proxy information, scan the QR code or visit fundresearch.fidelity.com/prospectus/sec 1.9913538.100 3300-TSRA-0924 |
| |
| | ANNUAL SHAREHOLDER REPORT | AS OF JULY 31, 2024 | This report describes changes to the Fund that occurred during the reporting period. |
| | Fidelity Advisor® Semiconductors Fund Fidelity Advisor® Semiconductors Fund Class I : FELIX |
| | | |
This annual shareholder report contains information about Fidelity Advisor® Semiconductors Fund for the period August 1, 2023 to July 31, 2024. You can find additional information about the Fund at fundresearch.fidelity.com/prospectus/sec. You can also request this information by contacting us at 1-877-208-0098 or by sending an e-mail to fidfunddocuments@fidelity.com.
What were your Fund costs for the last year?(based on hypothetical $10,000 investment)
FUND COST (PREVIOUS YEAR)
| | Costs of a $10,000 investment | Costs paid as a percentage of a $10,000 investment | |
| Class I | $ 86 | 0.71% | |
What affected the Fund's performance this period?
•U.S. equities gained for the 12 months ending July 31, 2024, driven by resilient corporate profits, a frenzy over generative artificial intelligence and the Federal Reserve's likely pivot to cutting interest rates later this year.
•Against this backdrop, security selection was the primary detractor from the fund's performance versus the MSCI U.S. IMI Semiconductors & Semiconductor Equipment 25/50 Index for the fiscal year, especially within semiconductors. Also hurting our result were picks in technology hardware, storage & peripherals. Lastly, the fund's position in cash was a notable detractor.
•The biggest individual relative detractor was an overweight in onsemi (-28%). This period we increased our stake in onsemi, and it was among our largest holdings. The fund's second-largest relative detractor was our non-index stake in GlobalFoundries (-20%). This period we increased our stake in GlobalFoundries, and it was among the fund's biggest holdings. An underweight in Broadcom (+82%) also detracted. The company was among the fund's largest holdings.
•In contrast, the primary contributors to performance versus the industry index were picks and an underweight in the semiconductor materials & equipment group.
•The fund's top individual relative contributor this period was avoiding Intel, an index component that returned -13%. The second-largest relative contributor was an underweight in Texas Instruments (+18%). This period we decreased our position in Texas Instruments. Not owning SolarEdge Technologies, an index component that returned -88%, was another notable relative contributor.
How did the Fund perform over the past 10 years?
CUMULATIVE PERFORMANCE
July 31, 2014 through July 31, 2024.
Initial investment of $10,000.
Class I | $10,000 | $11,117 | $13,435 | $17,683 | $22,589 | $24,951 | $32,705 | $53,262 | $51,688 | $77,383 | $108,234 |
MSCI U.S. IMI Semiconductors & Semiconductor Equipment 25-50 Index | $10,000 | $10,481 | $13,028 | $17,291 | $21,750 | $23,948 | $32,281 | $51,070 | $48,484 | $72,407 | $107,971 |
S&P 500® Index | $10,000 | $11,121 | $11,745 | $13,629 | $15,843 | $17,108 | $19,153 | $26,134 | $24,921 | $28,165 | $34,403 |
| | 2014 | 2015 | 2016 | 2017 | 2018 | 2019 | 2020 | 2021 | 2022 | 2023 | 2024 |
AVERAGE ANNUAL TOTAL RETURNS: | | 1 Year | 5 Year | 10 Year |
| Class I | 39.87% | 34.11% | 26.89% |
| MSCI U.S. IMI Semiconductors & Semiconductor Equipment 25-50 Index | 49.12% | 35.15% | 26.86% |
| S&P 500® Index | 22.15% | 15.00% | 13.15% |
Visit institutional.fidelity.com for more recent performance information. |
The Fund's past performance is not a good predictor of the Fund's future performance. The graph and table do not reflect the deduction of taxes that a shareholder would pay on fund distributions or redemption of fund shares. |
Key Fund Statistics (as of July 31, 2024)
KEY FACTS | | |
| Fund Size | $2,698,217,311 | |
| Number of Holdings | 45 | |
| Total Advisory Fee | $11,387,050 | |
| Portfolio Turnover | 30% | |
What did the Fund invest in?
(as of July 31, 2024)
TOP INDUSTRIES (% of Fund's net assets) |
| Semiconductors & Semiconductor Equipment | 92.7 | |
| Technology Hardware, Storage & Peripherals | 2.4 | |
| Electronic Equipment, Instruments & Components | 0.1 | |
| Financial Services | 0.0 | |
| Metals & Mining | 0.0 | |
| |
| Common Stocks | 95.0 |
| Preferred Stocks | 0.2 |
| Preferred Securities | 0.0 |
| Short-Term Investments and Net Other Assets (Liabilities) | 4.8 |
ASSET ALLOCATION (% of Fund's net assets) |
|
|
| United States | 79.9 |
| Taiwan | 7.1 |
| China | 5.6 |
| Netherlands | 5.0 |
| Israel | 1.7 |
| Japan | 0.7 |
GEOGRAPHIC DIVERSIFICATION (% of Fund's net assets) |
|
| |
|
TOP HOLDINGS (% of Fund's net assets) | | |
| NVIDIA Corp | 25.8 | |
| ON Semiconductor Corp | 7.3 | |
| Taiwan Semiconductor Manufacturing Co Ltd ADR | 6.1 | |
| NXP Semiconductors NV | 5.6 | |
| Micron Technology Inc | 5.4 | |
| ASML Holding NV depository receipt | 5.0 | |
| GlobalFoundries Inc | 4.8 | |
| Lam Research Corp | 4.8 | |
| Broadcom Inc | 4.3 | |
| Advanced Micro Devices Inc | 3.8 | |
| | 72.9 | |
| |
How has the Fund changed?
This is a summary of certain changes to the Fund since August 1, 2023. For more complete information, you may review the Fund's next prospectus, which we expect to be available by September 28, 2024 at fundresearch.fidelity.com/prospectus/sec or upon request at 1-877-208-0098 or by sending an e-mail to fidfunddocuments@fidelity.com.
The fund's transfer agent and pricing and bookkeeping fees were changed to a fixed rate effective December 1, 2023, through February 29, 2024, in anticipation of the transition to a new management fee structure. Effective March 1, 2024, the fund's management contract was amended to incorporate administrative services previously covered under separate services agreements (transfer agent and pricing and bookkeeping).The amended contract incorporates a management fee rate that may vary by class. The Adviser or an affiliate pays certain expenses of managing and operating the fund out of each class's management fee. | |
| Fidelity, the Fidelity Investments Logo and all other Fidelity trademarks or service marks used herein are trademarks or service marks of FMR LLC. Any third-party marks that are used herein are trademarks or service marks of their respective owners. © 2024 FMR LLC. All rights reserved. |
| | For additional information about the Fund; including its prospectus, financial information, holdings and proxy information, scan the QR code or visit fundresearch.fidelity.com/prospectus/sec 1.9913442.100 121-TSRA-0924 |
| |
| | ANNUAL SHAREHOLDER REPORT | AS OF JULY 31, 2024 | This report describes changes to the Fund that occurred during the reporting period. |
| | Fidelity Advisor® Biotechnology Fund Fidelity Advisor® Biotechnology Fund Class M : FBTTX |
| | | |
This annual shareholder report contains information about Fidelity Advisor® Biotechnology Fund for the period August 1, 2023 to July 31, 2024. You can find additional information about the Fund at fundresearch.fidelity.com/prospectus/sec. You can also request this information by contacting us at 1-877-208-0098 or by sending an e-mail to fidfunddocuments@fidelity.com.
What were your Fund costs for the last year?(based on hypothetical $10,000 investment)
FUND COST (PREVIOUS YEAR)
| | Costs of a $10,000 investment | Costs paid as a percentage of a $10,000 investment | |
| Class M | $ 142 | 1.24% | |
What affected the Fund's performance this period?
•U.S. equities gained for the 12 months ending July 31, 2024, driven by resilient corporate profits, a frenzy over generative artificial intelligence and the Federal Reserve's likely pivot to cutting interest rates later this year.
•Against this backdrop, security selection was the primary contributor to the fund's performance versus the MSCI US IMI Biotechnology 25/50 Index for the fiscal year, led by biotechnology.
•The top individual relative contributor this period was avoiding Biogen, an index component that returned -21%. A non-index stake in Fusion Pharmaceuticals gained 544% and was the second-largest relative contributor. Another notable relative contributor was an underweight in Gilead Sciences (+4%). The stock was one of our top holdings this period, but it was not held on July 31.
•In contrast, the biggest detractor from performance versus the industry index was stock picking in pharmaceuticals.
•The fund's non-index stake in Ventyx Biosciences returned approximately -93% and was the biggest individual relative detractor. The stock was not held at period end. A second notable relative detractor was an underweight in Amgen (+46%). This was an investment we established this period. The company was one of our largest holdings. Another notable relative detractor was an overweight in Acelyrin (-73%).
•Notable changes in positioning include a lower allocation to pharmaceuticals.
How did the Fund perform over the past 10 years?
CUMULATIVE PERFORMANCE
July 31, 2014 through July 31, 2024.
Initial investment of $10,000 and the current sales charge was paid.
Class M | $9,650 | $15,360 | $10,944 | $12,463 | $14,127 | $13,217 | $17,135 | $19,480 | $15,745 | $18,087 | $23,308 |
MSCI U.S. IMI Biotechnology 25-50 Index | $10,000 | $15,191 | $12,163 | $14,140 | $15,791 | $14,066 | $18,593 | $22,002 | $19,500 | $21,317 | $27,056 |
S&P 500® Index | $10,000 | $11,121 | $11,745 | $13,629 | $15,843 | $17,108 | $19,153 | $26,134 | $24,921 | $28,165 | $34,403 |
| | 2014 | 2015 | 2016 | 2017 | 2018 | 2019 | 2020 | 2021 | 2022 | 2023 | 2024 |
AVERAGE ANNUAL TOTAL RETURNS: | | 1 Year | 5 Year | 10 Year |
| Class M (incl. 3.50% sales charge) | 24.36% | 11.22% | 8.83% |
| Class M (without 3.50% sales charge) | 28.87% | 12.01% | 9.22% |
| MSCI U.S. IMI Biotechnology 25-50 Index | 26.92% | 13.98% | 10.47% |
| S&P 500® Index | 22.15% | 15.00% | 13.15% |
Visit institutional.fidelity.com for more recent performance information. |
The Fund's past performance is not a good predictor of the Fund's future performance. The graph and table do not reflect the deduction of taxes that a shareholder would pay on fund distributions or redemption of fund shares. |
Key Fund Statistics (as of July 31, 2024)
KEY FACTS | | |
| Fund Size | $1,812,183,981 | |
| Number of Holdings | 100 | |
| Total Advisory Fee | $9,501,787 | |
| Portfolio Turnover | 73% | |
What did the Fund invest in?
(as of July 31, 2024)
TOP INDUSTRIES (% of Fund's net assets) |
| Biotechnology | 92.6 | |
| Pharmaceuticals | 5.7 | |
| Financial Services | 0.2 | |
| Health Care Technology | 0.1 | |
| |
| Common Stocks | 96.8 |
| Preferred Stocks | 1.8 |
| Bonds | 0.0 |
| Short-Term Investments and Net Other Assets (Liabilities) | 1.4 |
ASSET ALLOCATION (% of Fund's net assets) |
|
|
| United States | 88.0 |
| Netherlands | 5.1 |
| Denmark | 3.5 |
| Canada | 1.3 |
| Belgium | 1.1 |
| United Kingdom | 1.0 |
GEOGRAPHIC DIVERSIFICATION (% of Fund's net assets) |
|
| |
|
TOP HOLDINGS (% of Fund's net assets) | | |
| Abbvie Inc | 18.3 | |
| Amgen Inc | 9.4 | |
| Regeneron Pharmaceuticals Inc | 7.0 | |
| Vertex Pharmaceuticals Inc | 4.7 | |
| Alnylam Pharmaceuticals Inc | 4.5 | |
| Argenx SE ADR | 3.8 | |
| Ascendis Pharma A/S ADR | 3.5 | |
| Vaxcyte Inc | 2.6 | |
| Cytokinetics Inc | 2.6 | |
| Viking Therapeutics Inc | 2.3 | |
| | 58.7 | |
| |
How has the Fund changed?
This is a summary of certain changes to the Fund since August 1, 2023. For more complete information, you may review the Fund's next prospectus, which we expect to be available by September 28, 2024 at fundresearch.fidelity.com/prospectus/sec or upon request at 1-877-208-0098 or by sending an e-mail to fidfunddocuments@fidelity.com.
The fund's transfer agent and pricing and bookkeeping fees were changed to a fixed rate effective December 1, 2023, through February 29, 2024, in anticipation of the transition to a new management fee structure. Effective March 1, 2024, the fund's management contract was amended to incorporate administrative services previously covered under separate services agreements (transfer agent and pricing and bookkeeping).The amended contract incorporates a management fee rate that may vary by class. The Adviser or an affiliate pays certain expenses of managing and operating the fund out of each class's management fee. | |
| Fidelity, the Fidelity Investments Logo and all other Fidelity trademarks or service marks used herein are trademarks or service marks of FMR LLC. Any third-party marks that are used herein are trademarks or service marks of their respective owners. © 2024 FMR LLC. All rights reserved. |
| | For additional information about the Fund; including its prospectus, financial information, holdings and proxy information, scan the QR code or visit fundresearch.fidelity.com/prospectus/sec 1.9913426.100 115-TSRA-0924 |
| |
| | ANNUAL SHAREHOLDER REPORT | AS OF JULY 31, 2024 | This report describes changes to the Fund that occurred during the reporting period. |
| | Fidelity Advisor® Health Care Fund Fidelity Advisor® Health Care Fund Class M : FACTX |
| | | |
This annual shareholder report contains information about Fidelity Advisor® Health Care Fund for the period August 1, 2023 to July 31, 2024. You can find additional information about the Fund at fundresearch.fidelity.com/prospectus/sec. You can also request this information by contacting us at 1-877-208-0098 or by sending an e-mail to fidfunddocuments@fidelity.com.
What were your Fund costs for the last year?(based on hypothetical $10,000 investment)
FUND COST (PREVIOUS YEAR)
| | Costs of a $10,000 investment | Costs paid as a percentage of a $10,000 investment | |
| Class M | $ 126 | 1.22% | |
What affected the Fund's performance this period?
•U.S. equities gained for the 12 months ending July 31, 2024, driven by resilient corporate profits, a frenzy over generative artificial intelligence and the Federal Reserve's likely pivot to cutting interest rates later this year.
•Against this backdrop, security selection and market selection were the primary detractors to the fund's performance versus the benchmark, led by health care services. Also hurting the fund's relative result was security selection in health care facilities and biotechnology.
•The largest individual relative detractor was an overweight in Penumbra (-45%), which was among our biggest holdings. It also hurt to overweight agilon health (-64%) and 10X Genomics (-67%). This period we decreased our position in agilon.
•In contrast, the biggest contributor to performance versus the sector index was security selection in pharmaceuticals. Stock picks in health care equipment also boosted relative performance.
•The top individual relative contributor was an overweight in Boston Scientific (+42%). The stock was the fund's largest holding, even though we decreased the fund's stake this period. It also helped to avoid index components Johnson & Johnson (-3%) and Pfizer (-10%).
•Notable changes in positioning include decreased exposure to the life sciences tools & services industry and a higher allocation to biotechnology.
How did the Fund perform over the past 10 years?
CUMULATIVE PERFORMANCE
July 31, 2014 through July 31, 2024.
Initial investment of $10,000 and the current sales charge was paid.
Class M | $9,650 | $12,901 | $11,604 | $12,669 | $15,135 | $15,530 | $19,287 | $23,219 | $20,405 | $21,109 | $22,466 |
MSCI U.S. IMI Health Care 25-50 Index | $10,000 | $13,063 | $12,726 | $13,917 | $16,068 | $16,693 | $19,997 | $25,628 | $24,807 | $25,460 | $28,709 |
S&P 500® Index | $10,000 | $11,121 | $11,745 | $13,629 | $15,843 | $17,108 | $19,153 | $26,134 | $24,921 | $28,165 | $34,403 |
| | 2014 | 2015 | 2016 | 2017 | 2018 | 2019 | 2020 | 2021 | 2022 | 2023 | 2024 |
AVERAGE ANNUAL TOTAL RETURNS: | | 1 Year | 5 Year | 10 Year |
| Class M (incl. 3.50% sales charge) | 2.71% | 6.90% | 8.43% |
| Class M (without 3.50% sales charge) | 6.43% | 7.66% | 8.82% |
| MSCI U.S. IMI Health Care 25-50 Index | 12.76% | 11.45% | 11.12% |
| S&P 500® Index | 22.15% | 15.00% | 13.15% |
Visit institutional.fidelity.com for more recent performance information. |
The Fund's past performance is not a good predictor of the Fund's future performance. The graph and table do not reflect the deduction of taxes that a shareholder would pay on fund distributions or redemption of fund shares. |
Key Fund Statistics (as of July 31, 2024)
KEY FACTS | | |
| Fund Size | $4,615,583,149 | |
| Number of Holdings | 103 | |
| Total Advisory Fee | $27,914,465 | |
| Portfolio Turnover | 37% | |
What did the Fund invest in?
(as of July 31, 2024)
TOP INDUSTRIES (% of Fund's net assets) |
| Biotechnology | 24.4 | |
| Health Care Equipment & Supplies | 23.5 | |
| Health Care Providers & Services | 21.8 | |
| Pharmaceuticals | 16.6 | |
| Life Sciences Tools & Services | 10.9 | |
| Health Care Technology | 2.0 | |
| Financial Services | 0.2 | |
| |
| Common Stocks | 97.9 |
| Preferred Stocks | 1.5 |
| Preferred Securities | 0.2 |
| Bonds | 0.1 |
| Short-Term Investments and Net Other Assets (Liabilities) | 0.3 |
ASSET ALLOCATION (% of Fund's net assets) |
|
|
| United States | 91.5 |
| Netherlands | 3.0 |
| United Kingdom | 1.7 |
| Denmark | 1.5 |
| Belgium | 1.3 |
| Canada | 0.9 |
| Israel | 0.1 |
| China | 0.0 |
GEOGRAPHIC DIVERSIFICATION (% of Fund's net assets) |
|
| |
|
TOP HOLDINGS (% of Fund's net assets) | | |
| Boston Scientific Corp | 9.6 | |
| Eli Lilly & Co | 8.2 | |
| UnitedHealth Group Inc | 7.8 | |
| Danaher Corp | 6.4 | |
| Regeneron Pharmaceuticals Inc | 4.4 | |
| Merck & Co Inc | 3.9 | |
| Cigna Group/The | 3.4 | |
| Penumbra Inc | 3.1 | |
| Stryker Corp | 2.4 | |
| Insulet Corp | 2.2 | |
| | 51.4 | |
| |
How has the Fund changed?
This is a summary of certain changes to the Fund since August 1, 2023. For more complete information, you may review the Fund's next prospectus, which we expect to be available by September 28, 2024 at fundresearch.fidelity.com/prospectus/sec or upon request at 1-877-208-0098 or by sending an e-mail to fidfunddocuments@fidelity.com.
The fund's transfer agent and pricing & bookkeeping fees were changed to a fixed rate effective December 1, 2023, through February 29, 2024, in anticipation of the transition to a new management fee structure. Effective March 1, 2024, the fund's management contract was amended to incorporate administrative services previously covered under separate services agreements (transfer agent and pricing & bookkeeping). The amended contract incorporates a management fee rate that may vary by class. The Adviser or an affiliate pays certain expenses of managing and operating the fund out of each class's management fee. | |
| Fidelity, the Fidelity Investments Logo and all other Fidelity trademarks or service marks used herein are trademarks or service marks of FMR LLC. Any third-party marks that are used herein are trademarks or service marks of their respective owners. © 2024 FMR LLC. All rights reserved. |
| | For additional information about the Fund; including its prospectus, financial information, holdings and proxy information, scan the QR code or visit fundresearch.fidelity.com/prospectus/sec 1.9913388.100 191-TSRA-0924 |
| |
| | ANNUAL SHAREHOLDER REPORT | AS OF JULY 31, 2024 | This report describes changes to the Fund that occurred during the reporting period. |
| | Fidelity Advisor® Biotechnology Fund Fidelity Advisor® Biotechnology Fund Class A : FBTAX |
| | | |
This annual shareholder report contains information about Fidelity Advisor® Biotechnology Fund for the period August 1, 2023 to July 31, 2024. You can find additional information about the Fund at fundresearch.fidelity.com/prospectus/sec. You can also request this information by contacting us at 1-877-208-0098 or by sending an e-mail to fidfunddocuments@fidelity.com.
What were your Fund costs for the last year?(based on hypothetical $10,000 investment)
FUND COST (PREVIOUS YEAR)
| | Costs of a $10,000 investment | Costs paid as a percentage of a $10,000 investment | |
| Class A | $ 113 | 0.98% | |
What affected the Fund's performance this period?
•U.S. equities gained for the 12 months ending July 31, 2024, driven by resilient corporate profits, a frenzy over generative artificial intelligence and the Federal Reserve's likely pivot to cutting interest rates later this year.
•Against this backdrop, security selection was the primary contributor to the fund's performance versus the MSCI US IMI Biotechnology 25/50 Index for the fiscal year, led by biotechnology.
•The top individual relative contributor this period was avoiding Biogen, an index component that returned -21%. A non-index stake in Fusion Pharmaceuticals gained 544% and was the second-largest relative contributor. Another notable relative contributor was an underweight in Gilead Sciences (+4%). The stock was one of our top holdings this period, but it was not held on July 31.
•In contrast, the biggest detractor from performance versus the industry index was stock picking in pharmaceuticals.
•The fund's non-index stake in Ventyx Biosciences returned approximately -93% and was the biggest individual relative detractor. The stock was not held at period end. A second notable relative detractor was an underweight in Amgen (+46%). This was an investment we established this period. The company was one of our largest holdings. Another notable relative detractor was an overweight in Acelyrin (-73%).
•Notable changes in positioning include a lower allocation to pharmaceuticals.
How did the Fund perform over the past 10 years?
CUMULATIVE PERFORMANCE
July 31, 2014 through July 31, 2024.
Initial investment of $10,000 and the current sales charge was paid.
Class A | $9,425 | $15,048 | $10,752 | $12,291 | $13,975 | $13,113 | $17,047 | $19,440 | $15,756 | $18,148 | $23,450 |
MSCI U.S. IMI Biotechnology 25-50 Index | $10,000 | $15,191 | $12,163 | $14,140 | $15,791 | $14,066 | $18,593 | $22,002 | $19,500 | $21,317 | $27,056 |
S&P 500® Index | $10,000 | $11,121 | $11,745 | $13,629 | $15,843 | $17,108 | $19,153 | $26,134 | $24,921 | $28,165 | $34,403 |
| | 2014 | 2015 | 2016 | 2017 | 2018 | 2019 | 2020 | 2021 | 2022 | 2023 | 2024 |
AVERAGE ANNUAL TOTAL RETURNS: | | 1 Year | 5 Year | 10 Year |
| Class A (incl. 5.75% sales charge) | 21.78% | 11.01% | 8.90% |
| Class A (without 5.75% sales charge) | 29.21% | 12.33% | 9.54% |
| MSCI U.S. IMI Biotechnology 25-50 Index | 26.92% | 13.98% | 10.47% |
| S&P 500® Index | 22.15% | 15.00% | 13.15% |
Visit institutional.fidelity.com for more recent performance information. |
The Fund's past performance is not a good predictor of the Fund's future performance. The graph and table do not reflect the deduction of taxes that a shareholder would pay on fund distributions or redemption of fund shares. |
Key Fund Statistics (as of July 31, 2024)
KEY FACTS | | |
| Fund Size | $1,812,183,981 | |
| Number of Holdings | 100 | |
| Total Advisory Fee | $9,501,787 | |
| Portfolio Turnover | 73% | |
What did the Fund invest in?
(as of July 31, 2024)
TOP INDUSTRIES (% of Fund's net assets) |
| Biotechnology | 92.6 | |
| Pharmaceuticals | 5.7 | |
| Financial Services | 0.2 | |
| Health Care Technology | 0.1 | |
| |
| Common Stocks | 96.8 |
| Preferred Stocks | 1.8 |
| Bonds | 0.0 |
| Short-Term Investments and Net Other Assets (Liabilities) | 1.4 |
ASSET ALLOCATION (% of Fund's net assets) |
|
|
| United States | 88.0 |
| Netherlands | 5.1 |
| Denmark | 3.5 |
| Canada | 1.3 |
| Belgium | 1.1 |
| United Kingdom | 1.0 |
GEOGRAPHIC DIVERSIFICATION (% of Fund's net assets) |
|
| |
|
TOP HOLDINGS (% of Fund's net assets) | | |
| Abbvie Inc | 18.3 | |
| Amgen Inc | 9.4 | |
| Regeneron Pharmaceuticals Inc | 7.0 | |
| Vertex Pharmaceuticals Inc | 4.7 | |
| Alnylam Pharmaceuticals Inc | 4.5 | |
| Argenx SE ADR | 3.8 | |
| Ascendis Pharma A/S ADR | 3.5 | |
| Vaxcyte Inc | 2.6 | |
| Cytokinetics Inc | 2.6 | |
| Viking Therapeutics Inc | 2.3 | |
| | 58.7 | |
| |
How has the Fund changed?
This is a summary of certain changes to the Fund since August 1, 2023. For more complete information, you may review the Fund's next prospectus, which we expect to be available by September 28, 2024 at fundresearch.fidelity.com/prospectus/sec or upon request at 1-877-208-0098 or by sending an e-mail to fidfunddocuments@fidelity.com.
The fund's transfer agent and pricing and bookkeeping fees were changed to a fixed rate effective December 1, 2023, through February 29, 2024, in anticipation of the transition to a new management fee structure. Effective March 1, 2024, the fund's management contract was amended to incorporate administrative services previously covered under separate services agreements (transfer agent and pricing and bookkeeping).The amended contract incorporates a management fee rate that may vary by class. The Adviser or an affiliate pays certain expenses of managing and operating the fund out of each class's management fee. | |
| Fidelity, the Fidelity Investments Logo and all other Fidelity trademarks or service marks used herein are trademarks or service marks of FMR LLC. Any third-party marks that are used herein are trademarks or service marks of their respective owners. © 2024 FMR LLC. All rights reserved. |
| | For additional information about the Fund; including its prospectus, financial information, holdings and proxy information, scan the QR code or visit fundresearch.fidelity.com/prospectus/sec 1.9913424.100 112-TSRA-0924 |
| |
| | ANNUAL SHAREHOLDER REPORT | AS OF JULY 31, 2024 | This report describes changes to the Fund that occurred during the reporting period. |
| | Fidelity Advisor® Consumer Discretionary Fund Fidelity Advisor® Consumer Discretionary Fund Class I : FCNIX |
| | | |
This annual shareholder report contains information about Fidelity Advisor® Consumer Discretionary Fund for the period August 1, 2023 to July 31, 2024. You can find additional information about the Fund at fundresearch.fidelity.com/prospectus/sec. You can also request this information by contacting us at 1-877-208-0098 or by sending an e-mail to fidfunddocuments@fidelity.com.
What were your Fund costs for the last year?(based on hypothetical $10,000 investment)
FUND COST (PREVIOUS YEAR)
| | Costs of a $10,000 investment | Costs paid as a percentage of a $10,000 investment | |
| Class I | $ 79 | 0.74% | |
What affected the Fund's performance this period?
•U.S. equities gained for the 12 months ending July 31, 2024, driven by resilient corporate profits, a frenzy over generative artificial intelligence and the Federal Reserve's likely pivot to cutting interest rates later this year.
•Against this backdrop, security selection was the primary contributor to the fund's performance versus the benchmark for the fiscal year, led by hotels, resorts & cruise lines. Stock picking in footwear also boosted the fund's relative performance.
•The top individual relative contributor was an overweight in Dick's Sporting Goods (+56%). The stock was among the fund's largest holdings, though we decreased our stake this period. The second-largest relative contributor was an overweight in Williams-Sonoma (+129%). Another notable relative contributor was an overweight in Deckers Outdoor (+67%), and we decreased our holdings in the company.
•In contrast, the biggest detractors from performance versus the sector index were stock picks and an overweight in automotive parts & equipment. Stock selection in consumer staples merchandise retail also hampered the fund's relative result.
•The largest individual relative detractor was an overweight in Aptiv (-37%). The company was one of our biggest holdings at period end. A stake in Dollar Tree returned approximately -34% and was a second notable relative detractor. This period we decreased our position in Dollar Tree. An overweight in Five Below (-62%) also detracted. This was a position we established this period.
•Notable changes in positioning include increased exposure to the other specialty retail industry and a lower allocation to footwear.
How did the Fund perform over the past 10 years?
CUMULATIVE PERFORMANCE
July 31, 2014 through July 31, 2024.
Initial investment of $10,000.
Class I | $10,000 | $12,260 | $12,245 | $13,502 | $16,669 | $17,853 | $20,771 | $28,675 | $23,502 | $26,428 | $30,087 |
MSCI U.S. IMI Consumer Discretionary 25-50 Index | $10,000 | $12,215 | $12,366 | $14,162 | $17,199 | $18,581 | $22,632 | $33,278 | $28,694 | $31,608 | $35,092 |
S&P 500® Index | $10,000 | $11,121 | $11,745 | $13,629 | $15,843 | $17,108 | $19,153 | $26,134 | $24,921 | $28,165 | $34,403 |
| | 2014 | 2015 | 2016 | 2017 | 2018 | 2019 | 2020 | 2021 | 2022 | 2023 | 2024 |
AVERAGE ANNUAL TOTAL RETURNS: | | 1 Year | 5 Year | 10 Year |
| Class I | 13.84% | 11.00% | 11.64% |
| MSCI U.S. IMI Consumer Discretionary 25-50 Index | 11.02% | 13.56% | 13.38% |
| S&P 500® Index | 22.15% | 15.00% | 13.15% |
Visit institutional.fidelity.com for more recent performance information. |
The Fund's past performance is not a good predictor of the Fund's future performance. The graph and table do not reflect the deduction of taxes that a shareholder would pay on fund distributions or redemption of fund shares. |
Key Fund Statistics (as of July 31, 2024)
KEY FACTS | | |
| Fund Size | $475,554,258 | |
| Number of Holdings | 60 | |
| Total Advisory Fee | $2,742,271 | |
| Portfolio Turnover | 25% | |
What did the Fund invest in?
(as of July 31, 2024)
TOP INDUSTRIES (% of Fund's net assets) |
| Broadline Retail | 25.9 | |
| Specialty Retail | 23.6 | |
| Hotels, Restaurants & Leisure | 18.7 | |
| Automobiles | 12.5 | |
| Textiles, Apparel & Luxury Goods | 8.0 | |
| Household Durables | 5.7 | |
| Automobile Components | 3.1 | |
| Consumer Staples Distribution & Retail | 1.1 | |
| Building Products | 0.8 | |
| Others | 0.7 | |
| |
ASSET ALLOCATION (% of Fund's net assets) |
|
| Short-Term Investments and Net Other Assets (Liabilities) - (0.1)% |
|
| United States | 96.1 |
| Canada | 2.3 |
| Brazil | 0.7 |
| France | 0.3 |
| United Kingdom | 0.3 |
| Switzerland | 0.3 |
GEOGRAPHIC DIVERSIFICATION (% of Fund's net assets) |
|
| |
|
TOP HOLDINGS (% of Fund's net assets) | | |
| Amazon.com Inc | 23.9 | |
| Tesla Inc | 10.8 | |
| Home Depot Inc/The | 5.0 | |
| Lowe's Cos Inc | 4.8 | |
| TJX Cos Inc/The | 3.8 | |
| Hilton Worldwide Holdings Inc | 3.2 | |
| Dick's Sporting Goods Inc | 2.4 | |
| McDonald's Corp | 2.4 | |
| Booking Holdings Inc | 2.1 | |
| Aptiv PLC | 2.1 | |
| | 60.5 | |
| |
How has the Fund changed?
This is a summary of certain changes to the Fund since August 1, 2023. For more complete information, you may review the Fund's next prospectus, which we expect to be available by September 28, 2024 at fundresearch.fidelity.com/prospectus/sec or upon request at 1-877-208-0098 or by sending an e-mail to fidfunddocuments@fidelity.com.
| The fund's transfer agent and pricing & bookkeeping fees were changed to a fixed rate effective December 1, 2023, through February 29, 2024, in anticipation of the transition to a new management fee structure. Effective March 1, 2024, the fund's management contract was amended to incorporate administrative services previously covered under separate services agreements (transfer agent and pricing & bookkeeping). The amended contract incorporates a management fee rate that may vary by class. The Adviser or an affiliate pays certain expenses of managing and operating the fund out of each class's management fee. |
| Fidelity, the Fidelity Investments Logo and all other Fidelity trademarks or service marks used herein are trademarks or service marks of FMR LLC. Any third-party marks that are used herein are trademarks or service marks of their respective owners. © 2024 FMR LLC. All rights reserved. |
| | For additional information about the Fund; including its prospectus, financial information, holdings and proxy information, scan the QR code or visit fundresearch.fidelity.com/prospectus/sec 1.9913404.100 205-TSRA-0924 |
| |
| | ANNUAL SHAREHOLDER REPORT | AS OF JULY 31, 2024 | This report describes changes to the Fund that occurred during the reporting period. |
| | Fidelity Advisor® Real Estate Fund Fidelity Advisor® Real Estate Fund Class M : FHETX |
| | | |
This annual shareholder report contains information about Fidelity Advisor® Real Estate Fund for the period August 1, 2023 to July 31, 2024. You can find additional information about the Fund at fundresearch.fidelity.com/prospectus/sec. You can also request this information by contacting us at 1-877-208-0098 or by sending an e-mail to fidfunddocuments@fidelity.com.
What were your Fund costs for the last year?(based on hypothetical $10,000 investment)
FUND COST (PREVIOUS YEAR)
| | Costs of a $10,000 investment | Costs paid as a percentage of a $10,000 investment | |
| Class M | $ 137 | 1.30% | |
What affected the Fund's performance this period?
•U.S. equities gained for the 12 months ending July 31, 2024, driven by resilient corporate profits, a frenzy over generative artificial intelligence and the Federal Reserve's likely pivot to cutting interest rates later this year.
•Against this backdrop, security selection and industry positioning were the primary detractors from the fund's performance versus the MSCI US IMI Real Estate 25/50 Linked Index for the fiscal year, especially "other specialized" real estate investment trusts. Subpar picks and outsized exposure to the industrial and multi-family residential industries hurt as well.
•The biggest individual relative detractor this period was avoiding Iron Mountain, an index component that gained 73%. Similarly, not owning Simon Property Group, an index component that rose about 30%, proved detrimental to performance as well. An overweight stake in Americold Realty Trust (-4%) was another challenge, though we increased our investment in the stock this period.
•In contrast, the biggest contributor to performance versus the real estate index was stock selection among real estate services firms. Picks in health care also boosted the fund's relative performance. An undersized stake in timber REITs was another plus.
•The top individual relative contributor was an outsized stake in CBRE Group (+35%). The company was one of the fund's largest holdings. Avoiding shares of Realty Income, an index component that returned about -1%, aided performance as well. Not owning Weyerhaeuser, an index component that returned -4%, also proved advantageous.
•Notable changes in positioning include increased exposure to the retail industry and a lower allocation to other specialized REITs.
How did the Fund perform over the past 10 years?
CUMULATIVE PERFORMANCE
July 31, 2014 through July 31, 2024.
Initial investment of $10,000 and the current sales charge was paid.
Class M | $9,650 | $10,563 | $12,467 | $11,740 | $12,014 | $13,138 | $12,163 | $15,828 | $14,906 | $13,137 | $14,431 |
MSCI US IMI Real Estate 25/50 Linked Index | $10,000 | $11,129 | $13,457 | $12,695 | $13,185 | $14,621 | $12,238 | $16,556 | $15,854 | $14,323 | $15,860 |
S&P 500® Index | $10,000 | $11,121 | $11,745 | $13,629 | $15,843 | $17,108 | $19,153 | $26,134 | $24,921 | $28,165 | $34,403 |
| | 2014 | 2015 | 2016 | 2017 | 2018 | 2019 | 2020 | 2021 | 2022 | 2023 | 2024 |
AVERAGE ANNUAL TOTAL RETURNS: | | 1 Year | 5 Year | 10 Year |
| Class M (incl. 3.50% sales charge) | 6.01% | 1.17% | 3.74% |
| Class M (without 3.50% sales charge) | 9.85% | 1.90% | 4.11% |
| MSCI US IMI Real Estate 25/50 Linked Index | 10.73% | 1.64% | 4.72% |
| S&P 500® Index | 22.15% | 15.00% | 13.15% |
Visit institutional.fidelity.com for more recent performance information. |
The Fund's past performance is not a good predictor of the Fund's future performance. The graph and table do not reflect the deduction of taxes that a shareholder would pay on fund distributions or redemption of fund shares. |
Key Fund Statistics (as of July 31, 2024)
KEY FACTS | | |
| Fund Size | $237,005,518 | |
| Number of Holdings | 35 | |
| Total Advisory Fee | $1,374,363 | |
| Portfolio Turnover | 24% | |
What did the Fund invest in?
(as of July 31, 2024)
TOP INDUSTRIES (% of Fund's net assets) |
| Specialized REITs | 37.6 | |
| Industrial REITs | 16.2 | |
| Residential REITs | 14.2 | |
| Retail REITs | 10.8 | |
| Health Care REITs | 9.1 | |
| Real Estate Management & Development | 7.7 | |
| Hotel & Resort REITs | 2.5 | |
| Office REITs | 1.2 | |
| |
| Common Stocks | 99.3 |
| Short-Term Investments and Net Other Assets (Liabilities) | 0.7 |
ASSET ALLOCATION (% of Fund's net assets) |
|
|
GEOGRAPHIC DIVERSIFICATION (% of Fund's net assets) |
|
| |
|
TOP HOLDINGS (% of Fund's net assets) | | |
| Prologis Inc | 9.6 | |
| Equinix Inc | 7.8 | |
| Crown Castle Inc | 7.5 | |
| CBRE Group Inc Class A | 6.3 | |
| American Tower Corp | 5.9 | |
| Ventas Inc | 5.8 | |
| CubeSmart | 5.4 | |
| Digital Realty Trust Inc | 3.5 | |
| Welltower Inc | 3.3 | |
| Mid-America Apartment Communities Inc | 3.3 | |
| | 58.4 | |
| |
How has the Fund changed?
This is a summary of certain changes to the Fund since August 1, 2023. For more complete information, you may review the Fund's next prospectus, which we expect to be available by September 28, 2024 at fundresearch.fidelity.com/prospectus/sec or upon request at 1-877-208-0098 or by sending an e-mail to fidfunddocuments@fidelity.com.
The fund's transfer agent and pricing & bookkeeping fees were changed to a fixed rate effective December 1, 2023, through February 29, 2024, in anticipation of the transition to a new management fee structure. Effective March 1, 2024, the fund's management contract was amended to incorporate administrative services previously covered under separate services agreements (transfer agent and pricing & bookkeeping). The amended contract incorporates a management fee rate that may vary by class. The Adviser or an affiliate pays certain expenses of managing and operating the fund out of each class's management fee. | |
| Fidelity, the Fidelity Investments Logo and all other Fidelity trademarks or service marks used herein are trademarks or service marks of FMR LLC. Any third-party marks that are used herein are trademarks or service marks of their respective owners. © 2024 FMR LLC. All rights reserved. |
| | For additional information about the Fund; including its prospectus, financial information, holdings and proxy information, scan the QR code or visit fundresearch.fidelity.com/prospectus/sec 1.9913448.100 1131-TSRA-0924 |
| |
| | ANNUAL SHAREHOLDER REPORT | AS OF JULY 31, 2024 | This report describes changes to the Fund that occurred during the reporting period. |
| | Fidelity Advisor® Industrials Fund Fidelity Advisor® Industrials Fund Class A : FCLAX |
| | | |
This annual shareholder report contains information about Fidelity Advisor® Industrials Fund for the period August 1, 2023 to July 31, 2024. You can find additional information about the Fund at fundresearch.fidelity.com/prospectus/sec. You can also request this information by contacting us at 1-877-208-0098 or by sending an e-mail to fidfunddocuments@fidelity.com.
What were your Fund costs for the last year?(based on hypothetical $10,000 investment)
FUND COST (PREVIOUS YEAR)
| | Costs of a $10,000 investment | Costs paid as a percentage of a $10,000 investment | |
| Class A | $ 113 | 1.00% | |
What affected the Fund's performance this period?
•U.S. equities gained for the 12 months ending July 31, 2024, driven by resilient corporate profits, a frenzy over generative artificial intelligence and the Federal Reserve's likely pivot to cutting interest rates later this year.
•Against this backdrop, security selection was the primary contributor to the fund's performance versus the benchmark for the fiscal year, led by industrial machinery & supplies & components. Stock picks and an overweight in aerospace & defense also boosted the fund's relative performance.
•The top individual relative contributor was an overweight in Howmet Aerospace (+88%). The second-largest relative contributor was an overweight in General Electric (+88%), the fund's largest holding. Not owning United Parcel Service, an index component that returned roughly -27%, also contributed.
•In contrast, the primary detractor from performance versus the sector index was security selection in construction & engineering. The largest individual relative detractor was an overweight in Boeing (-20%), one of the fund's biggest holdings. A second notable relative detractor was an overweight in Knight-Swift Transportation (-9%). Another notable relative detractor was an overweight in Chart Industries (-12%).
•Notable changes in positioning include increased exposure to the trading companies & distributors industry and a lower allocation to environmental & facilities services.
How did the Fund perform over the past 10 years?
CUMULATIVE PERFORMANCE
July 31, 2014 through July 31, 2024.
Initial investment of $10,000 and the current sales charge was paid.
Class A | $9,425 | $10,195 | $10,709 | $12,060 | $13,985 | $14,274 | $13,335 | $18,086 | $16,677 | $19,792 | $25,065 |
MSCI U.S. IMI Industrials 25-50 Index | $10,000 | $10,697 | $11,622 | $13,810 | $15,836 | $16,344 | $15,397 | $22,708 | $21,070 | $25,150 | $29,881 |
S&P 500® Index | $10,000 | $11,121 | $11,745 | $13,629 | $15,843 | $17,108 | $19,153 | $26,134 | $24,921 | $28,165 | $34,403 |
| | 2014 | 2015 | 2016 | 2017 | 2018 | 2019 | 2020 | 2021 | 2022 | 2023 | 2024 |
AVERAGE ANNUAL TOTAL RETURNS: | | 1 Year | 5 Year | 10 Year |
| Class A (incl. 5.75% sales charge) | 19.36% | 10.60% | 9.62% |
| Class A (without 5.75% sales charge) | 26.64% | 11.92% | 10.28% |
| MSCI U.S. IMI Industrials 25-50 Index | 18.81% | 12.83% | 11.57% |
| S&P 500® Index | 22.15% | 15.00% | 13.15% |
Visit institutional.fidelity.com for more recent performance information. |
The Fund's past performance is not a good predictor of the Fund's future performance. The graph and table do not reflect the deduction of taxes that a shareholder would pay on fund distributions or redemption of fund shares. |
Key Fund Statistics (as of July 31, 2024)
KEY FACTS | | |
| Fund Size | $582,010,248 | |
| Number of Holdings | 51 | |
| Total Advisory Fee | $3,019,014 | |
| Portfolio Turnover | 29% | |
What did the Fund invest in?
(as of July 31, 2024)
TOP INDUSTRIES (% of Fund's net assets) |
| Aerospace & Defense | 22.7 | |
| Machinery | 20.2 | |
| Ground Transportation | 13.1 | |
| Electrical Equipment | 11.1 | |
| Building Products | 10.2 | |
| Trading Companies & Distributors | 5.6 | |
| Construction & Engineering | 3.8 | |
| Air Freight & Logistics | 3.6 | |
| Professional Services | 3.2 | |
| Others | 5.5 | |
| |
| Common Stocks | 99.0 |
| Short-Term Investments and Net Other Assets (Liabilities) | 1.0 |
ASSET ALLOCATION (% of Fund's net assets) |
|
|
GEOGRAPHIC DIVERSIFICATION (% of Fund's net assets) |
|
| |
|
TOP HOLDINGS (% of Fund's net assets) | | |
| General Electric Co | 6.3 | |
| Union Pacific Corp | 4.9 | |
| Ingersoll Rand Inc | 4.9 | |
| Howmet Aerospace Inc | 4.7 | |
| Boeing Co | 4.2 | |
| Parker-Hannifin Corp | 4.1 | |
| Trane Technologies PLC | 3.9 | |
| TransDigm Group Inc | 3.7 | |
| FedEx Corp | 3.4 | |
| Eaton Corp PLC | 3.3 | |
| | 43.4 | |
| |
How has the Fund changed?
This is a summary of certain changes to the Fund since August 1, 2023. For more complete information, you may review the Fund's next prospectus, which we expect to be available by September 28, 2024 at fundresearch.fidelity.com/prospectus/sec or upon request at 1-877-208-0098 or by sending an e-mail to fidfunddocuments@fidelity.com.
The fund's transfer agent and pricing and bookkeeping fees were changed to a fixed rate effective December 1, 2023, through February 29, 2024, in anticipation of the transition to a new management fee structure. Effective March 1, 2024, the fund's management contract was amended to incorporate administrative services previously covered under separate services agreements (transfer agent and pricing and bookkeeping).The amended contract incorporates a management fee rate that may vary by class. The Adviser or an affiliate pays certain expenses of managing and operating the fund out of each class's management fee. | |
| Fidelity, the Fidelity Investments Logo and all other Fidelity trademarks or service marks used herein are trademarks or service marks of FMR LLC. Any third-party marks that are used herein are trademarks or service marks of their respective owners. © 2024 FMR LLC. All rights reserved. |
| | For additional information about the Fund; including its prospectus, financial information, holdings and proxy information, scan the QR code or visit fundresearch.fidelity.com/prospectus/sec 1.9913397.100 184-TSRA-0924 |
| |
| | ANNUAL SHAREHOLDER REPORT | AS OF JULY 31, 2024 | This report describes changes to the Fund that occurred during the reporting period. |
| | Fidelity Advisor® Consumer Discretionary Fund Fidelity Advisor® Consumer Discretionary Fund Class M : FACPX |
| | | |
This annual shareholder report contains information about Fidelity Advisor® Consumer Discretionary Fund for the period August 1, 2023 to July 31, 2024. You can find additional information about the Fund at fundresearch.fidelity.com/prospectus/sec. You can also request this information by contacting us at 1-877-208-0098 or by sending an e-mail to fidfunddocuments@fidelity.com.
What were your Fund costs for the last year?(based on hypothetical $10,000 investment)
FUND COST (PREVIOUS YEAR)
| | Costs of a $10,000 investment | Costs paid as a percentage of a $10,000 investment | |
| Class M | $ 135 | 1.27% | |
What affected the Fund's performance this period?
•U.S. equities gained for the 12 months ending July 31, 2024, driven by resilient corporate profits, a frenzy over generative artificial intelligence and the Federal Reserve's likely pivot to cutting interest rates later this year.
•Against this backdrop, security selection was the primary contributor to the fund's performance versus the benchmark for the fiscal year, led by hotels, resorts & cruise lines. Stock picking in footwear also boosted the fund's relative performance.
•The top individual relative contributor was an overweight in Dick's Sporting Goods (+56%). The stock was among the fund's largest holdings, though we decreased our stake this period. The second-largest relative contributor was an overweight in Williams-Sonoma (+129%). Another notable relative contributor was an overweight in Deckers Outdoor (+67%), and we decreased our holdings in the company.
•In contrast, the biggest detractors from performance versus the sector index were stock picks and an overweight in automotive parts & equipment. Stock selection in consumer staples merchandise retail also hampered the fund's relative result.
•The largest individual relative detractor was an overweight in Aptiv (-37%). The company was one of our biggest holdings at period end. A stake in Dollar Tree returned approximately -34% and was a second notable relative detractor. This period we decreased our position in Dollar Tree. An overweight in Five Below (-62%) also detracted. This was a position we established this period.
•Notable changes in positioning include increased exposure to the other specialty retail industry and a lower allocation to footwear.
How did the Fund perform over the past 10 years?
CUMULATIVE PERFORMANCE
July 31, 2014 through July 31, 2024.
Initial investment of $10,000 and the current sales charge was paid.
Class M | $9,650 | $11,765 | $11,686 | $12,810 | $15,728 | $16,760 | $19,391 | $26,628 | $21,706 | $24,282 | $27,493 |
MSCI U.S. IMI Consumer Discretionary 25-50 Index | $10,000 | $12,215 | $12,366 | $14,162 | $17,199 | $18,581 | $22,632 | $33,278 | $28,694 | $31,608 | $35,092 |
S&P 500® Index | $10,000 | $11,121 | $11,745 | $13,629 | $15,843 | $17,108 | $19,153 | $26,134 | $24,921 | $28,165 | $34,403 |
| | 2014 | 2015 | 2016 | 2017 | 2018 | 2019 | 2020 | 2021 | 2022 | 2023 | 2024 |
AVERAGE ANNUAL TOTAL RETURNS: | | 1 Year | 5 Year | 10 Year |
| Class M (incl. 3.50% sales charge) | 9.26% | 9.62% | 10.64% |
| Class M (without 3.50% sales charge) | 13.23% | 10.41% | 11.04% |
| MSCI U.S. IMI Consumer Discretionary 25-50 Index | 11.02% | 13.56% | 13.38% |
| S&P 500® Index | 22.15% | 15.00% | 13.15% |
Visit institutional.fidelity.com for more recent performance information. |
The Fund's past performance is not a good predictor of the Fund's future performance. The graph and table do not reflect the deduction of taxes that a shareholder would pay on fund distributions or redemption of fund shares. |
Key Fund Statistics (as of July 31, 2024)
KEY FACTS | | |
| Fund Size | $475,554,258 | |
| Number of Holdings | 60 | |
| Total Advisory Fee | $2,742,271 | |
| Portfolio Turnover | 25% | |
What did the Fund invest in?
(as of July 31, 2024)
TOP INDUSTRIES (% of Fund's net assets) |
| Broadline Retail | 25.9 | |
| Specialty Retail | 23.6 | |
| Hotels, Restaurants & Leisure | 18.7 | |
| Automobiles | 12.5 | |
| Textiles, Apparel & Luxury Goods | 8.0 | |
| Household Durables | 5.7 | |
| Automobile Components | 3.1 | |
| Consumer Staples Distribution & Retail | 1.1 | |
| Building Products | 0.8 | |
| Others | 0.7 | |
| |
ASSET ALLOCATION (% of Fund's net assets) |
|
| Short-Term Investments and Net Other Assets (Liabilities) - (0.1)% |
|
| United States | 96.1 |
| Canada | 2.3 |
| Brazil | 0.7 |
| France | 0.3 |
| United Kingdom | 0.3 |
| Switzerland | 0.3 |
GEOGRAPHIC DIVERSIFICATION (% of Fund's net assets) |
|
| |
|
TOP HOLDINGS (% of Fund's net assets) | | |
| Amazon.com Inc | 23.9 | |
| Tesla Inc | 10.8 | |
| Home Depot Inc/The | 5.0 | |
| Lowe's Cos Inc | 4.8 | |
| TJX Cos Inc/The | 3.8 | |
| Hilton Worldwide Holdings Inc | 3.2 | |
| Dick's Sporting Goods Inc | 2.4 | |
| McDonald's Corp | 2.4 | |
| Booking Holdings Inc | 2.1 | |
| Aptiv PLC | 2.1 | |
| | 60.5 | |
| |
How has the Fund changed?
This is a summary of certain changes to the Fund since August 1, 2023. For more complete information, you may review the Fund's next prospectus, which we expect to be available by September 28, 2024 at fundresearch.fidelity.com/prospectus/sec or upon request at 1-877-208-0098 or by sending an e-mail to fidfunddocuments@fidelity.com.
| The fund's transfer agent and pricing & bookkeeping fees were changed to a fixed rate effective December 1, 2023, through February 29, 2024, in anticipation of the transition to a new management fee structure. Effective March 1, 2024, the fund's management contract was amended to incorporate administrative services previously covered under separate services agreements (transfer agent and pricing & bookkeeping). The amended contract incorporates a management fee rate that may vary by class. The Adviser or an affiliate pays certain expenses of managing and operating the fund out of each class's management fee. |
| Fidelity, the Fidelity Investments Logo and all other Fidelity trademarks or service marks used herein are trademarks or service marks of FMR LLC. Any third-party marks that are used herein are trademarks or service marks of their respective owners. © 2024 FMR LLC. All rights reserved. |
| | For additional information about the Fund; including its prospectus, financial information, holdings and proxy information, scan the QR code or visit fundresearch.fidelity.com/prospectus/sec 1.9913403.100 195-TSRA-0924 |
| |
| | ANNUAL SHAREHOLDER REPORT | AS OF JULY 31, 2024 | This report describes changes to the Fund that occurred during the reporting period. |
| | Fidelity Advisor® Utilities Fund Fidelity Advisor® Utilities Fund Class M : FAUFX |
| | | |
This annual shareholder report contains information about Fidelity Advisor® Utilities Fund for the period August 1, 2023 to July 31, 2024. You can find additional information about the Fund at fundresearch.fidelity.com/prospectus/sec. You can also request this information by contacting us at 1-877-208-0098 or by sending an e-mail to fidfunddocuments@fidelity.com.
What were your Fund costs for the last year?(based on hypothetical $10,000 investment)
FUND COST (PREVIOUS YEAR)
| | Costs of a $10,000 investment | Costs paid as a percentage of a $10,000 investment | |
| Class M | $ 137 | 1.27% | |
What affected the Fund's performance this period?
•U.S. equities gained for the 12 months ending July 31, 2024, driven by resilient corporate profits, a frenzy over generative artificial intelligence and the Federal Reserve's likely pivot to cutting interest rates later this year.
•Against this backdrop, both security selection and market selection contributed to the fund's performance versus the MSCI US IMI Utilities 25/50 Index for the fiscal year, led by our stock picks in electric utilities. An overweight in independent power producers & energy traders also boosted the fund's relative performance, as did stock choices and an underweight in multi-utilities.
•The top individual relative contributor was an overweight in Vistra (+185%). This period we decreased our position in the stock, but the company was among the fund's biggest holdings at the end of the period. A second notable relative contributor was an overweight in Constellation Energy (+99%). Like Vistra, we decreased our position in Constellation Energy this period, but the stock remained among the fund's largest holdings. Another notable relative contributor was an underweight in Exelon (-8%), a stock was not held at period end.
•In contrast, the biggest detractors from performance versus the sector index were stock picking and an overweight in renewable electricity. Our picks in coal & consumable fuels and gas utilities also hurt. Lastly, the fund's position in cash was a notable detractor.
•The largest individual relative detractor was an overweight in NextEra Energy Partners (-48%), the yield company subsidiary of another fund holding, NextEra Energy. This period we increased our investment in the stock. Other notable relative detractors included underweights in Duke Energy (+22%) and DTE Energy (+9%). We exited our positions in both during the period.
•Notable changes in positioning include decreased exposure to water utilities and a higher allocation to multi-utilities.
How did the Fund perform over the past 10 years?
CUMULATIVE PERFORMANCE
July 31, 2014 through July 31, 2024.
Initial investment of $10,000 and the current sales charge was paid.
Class M | $9,650 | $9,816 | $11,111 | $12,167 | $13,327 | $14,844 | $14,575 | $16,707 | $19,776 | $19,411 | $22,554 |
MSCI U.S. IMI Utilities 25-50 Index | $10,000 | $10,922 | $13,519 | $14,434 | $15,013 | $17,419 | $17,988 | $20,183 | $23,242 | $21,712 | $24,456 |
S&P 500® Index | $10,000 | $11,121 | $11,745 | $13,629 | $15,843 | $17,108 | $19,153 | $26,134 | $24,921 | $28,165 | $34,403 |
| | 2014 | 2015 | 2016 | 2017 | 2018 | 2019 | 2020 | 2021 | 2022 | 2023 | 2024 |
AVERAGE ANNUAL TOTAL RETURNS: | | 1 Year | 5 Year | 10 Year |
| Class M (incl. 3.50% sales charge) | 12.13% | 7.95% | 8.47% |
| Class M (without 3.50% sales charge) | 16.19% | 8.73% | 8.86% |
| MSCI U.S. IMI Utilities 25-50 Index | 12.64% | 7.02% | 9.36% |
| S&P 500® Index | 22.15% | 15.00% | 13.15% |
Visit institutional.fidelity.com for more recent performance information. |
The Fund's past performance is not a good predictor of the Fund's future performance. The graph and table do not reflect the deduction of taxes that a shareholder would pay on fund distributions or redemption of fund shares. |
Key Fund Statistics (as of July 31, 2024)
KEY FACTS | | |
| Fund Size | $819,716,826 | |
| Number of Holdings | 30 | |
| Total Advisory Fee | $4,138,318 | |
| Portfolio Turnover | 84% | |
What did the Fund invest in?
(as of July 31, 2024)
TOP INDUSTRIES (% of Fund's net assets) |
| Electric Utilities | 63.0 | |
| Multi-Utilities | 23.0 | |
| Independent Power and Renewable Electricity Producers | 7.0 | |
| Gas Utilities | 2.2 | |
| Oil, Gas & Consumable Fuels | 0.2 | |
| |
| Common Stocks | 95.4 |
| Short-Term Investments and Net Other Assets (Liabilities) | 4.6 |
ASSET ALLOCATION (% of Fund's net assets) |
|
|
| United States | 99.8 |
| Australia | 0.2 |
GEOGRAPHIC DIVERSIFICATION (% of Fund's net assets) |
|
| |
|
TOP HOLDINGS (% of Fund's net assets) | | |
| NextEra Energy Inc | 12.7 | |
| Sempra | 7.1 | |
| PG&E Corp | 5.9 | |
| American Electric Power Co Inc | 5.6 | |
| Edison International | 5.4 | |
| Public Service Enterprise Group Inc | 5.0 | |
| Eversource Energy | 5.0 | |
| Constellation Energy Corp | 5.0 | |
| Entergy Corp | 4.8 | |
| FirstEnergy Corp | 4.3 | |
| | 60.8 | |
| |
How has the Fund changed?
This is a summary of certain changes to the Fund since August 1, 2023. For more complete information, you may review the Fund's next prospectus, which we expect to be available by September 28, 2024 at fundresearch.fidelity.com/prospectus/sec or upon request at 1-877-208-0098 or by sending an e-mail to fidfunddocuments@fidelity.com.
| The fund's transfer agent and pricing & bookkeeping fees were changed to a fixed rate effective December 1, 2023, through February 29, 2024, in anticipation of the transition to a new management fee structure. Effective March 1, 2024, the fund's management contract was amended to incorporate administrative services previously covered under separate services agreements (transfer agent and pricing & bookkeeping). The amended contract incorporates a management fee rate that may vary by class. The Adviser or an affiliate pays certain expenses of managing and operating the fund out of each class's management fee. |
| Fidelity, the Fidelity Investments Logo and all other Fidelity trademarks or service marks used herein are trademarks or service marks of FMR LLC. Any third-party marks that are used herein are trademarks or service marks of their respective owners. © 2024 FMR LLC. All rights reserved. |
| | For additional information about the Fund; including its prospectus, financial information, holdings and proxy information, scan the QR code or visit fundresearch.fidelity.com/prospectus/sec 1.9913408.100 196-TSRA-0924 |
| |
| | ANNUAL SHAREHOLDER REPORT | AS OF JULY 31, 2024 | This report describes changes to the Fund that occurred during the reporting period. |
| | Fidelity Advisor® Biotechnology Fund Fidelity Advisor® Biotechnology Fund Class Z : FIJYX |
| | | |
This annual shareholder report contains information about Fidelity Advisor® Biotechnology Fund for the period August 1, 2023 to July 31, 2024. You can find additional information about the Fund at fundresearch.fidelity.com/prospectus/sec. You can also request this information by contacting us at 1-877-208-0098 or by sending an e-mail to fidfunddocuments@fidelity.com.
What were your Fund costs for the last year?(based on hypothetical $10,000 investment)
FUND COST (PREVIOUS YEAR)
| | Costs of a $10,000 investment | Costs paid as a percentage of a $10,000 investment | |
| Class Z | $ 68 | 0.60% | |
What affected the Fund's performance this period?
•U.S. equities gained for the 12 months ending July 31, 2024, driven by resilient corporate profits, a frenzy over generative artificial intelligence and the Federal Reserve's likely pivot to cutting interest rates later this year.
•Against this backdrop, security selection was the primary contributor to the fund's performance versus the MSCI US IMI Biotechnology 25/50 Index for the fiscal year, led by biotechnology.
•The top individual relative contributor this period was avoiding Biogen, an index component that returned -21%. A non-index stake in Fusion Pharmaceuticals gained 544% and was the second-largest relative contributor. Another notable relative contributor was an underweight in Gilead Sciences (+4%). The stock was one of our top holdings this period, but it was not held on July 31.
•In contrast, the biggest detractor from performance versus the industry index was stock picking in pharmaceuticals.
•The fund's non-index stake in Ventyx Biosciences returned approximately -93% and was the biggest individual relative detractor. The stock was not held at period end. A second notable relative detractor was an underweight in Amgen (+46%). This was an investment we established this period. The company was one of our largest holdings. Another notable relative detractor was an overweight in Acelyrin (-73%).
•Notable changes in positioning include a lower allocation to pharmaceuticals.
How did the Fund perform over the life of Fund?
CUMULATIVE PERFORMANCE
October 2, 2018 through July 31, 2024.
Initial investment of $10,000.
Class Z | $10,000 | $9,217 | $12,031 | $13,774 | $11,207 | $12,965 | $16,814 |
MSCI U.S. IMI Biotechnology 25-50 Index | $10,000 | $8,683 | $11,477 | $13,581 | $12,037 | $13,159 | $16,701 |
S&P 500® Index | $10,000 | $10,365 | $11,604 | $15,833 | $15,098 | $17,064 | $20,843 |
| | 2018 | 2019 | 2020 | 2021 | 2022 | 2023 | 2024 |
AVERAGE ANNUAL TOTAL RETURNS: | | 1 Year | 5 Year | Life of Fund A |
| Class Z | 29.69% | 12.77% | 9.32% |
| MSCI U.S. IMI Biotechnology 25-50 Index | 26.92% | 13.98% | 9.19% |
| S&P 500® Index | 22.15% | 15.00% | 13.42% |
A From October 2, 2018
Visit institutional.fidelity.com for more recent performance information. |
The Fund's past performance is not a good predictor of the Fund's future performance. The graph and table do not reflect the deduction of taxes that a shareholder would pay on fund distributions or redemption of fund shares. |
Key Fund Statistics (as of July 31, 2024)
KEY FACTS | | |
| Fund Size | $1,812,183,981 | |
| Number of Holdings | 100 | |
| Total Advisory Fee | $9,501,787 | |
| Portfolio Turnover | 73% | |
What did the Fund invest in?
(as of July 31, 2024)
TOP INDUSTRIES (% of Fund's net assets) |
| Biotechnology | 92.6 | |
| Pharmaceuticals | 5.7 | |
| Financial Services | 0.2 | |
| Health Care Technology | 0.1 | |
| |
| Common Stocks | 96.8 |
| Preferred Stocks | 1.8 |
| Bonds | 0.0 |
| Short-Term Investments and Net Other Assets (Liabilities) | 1.4 |
ASSET ALLOCATION (% of Fund's net assets) |
|
|
| United States | 88.0 |
| Netherlands | 5.1 |
| Denmark | 3.5 |
| Canada | 1.3 |
| Belgium | 1.1 |
| United Kingdom | 1.0 |
GEOGRAPHIC DIVERSIFICATION (% of Fund's net assets) |
|
| |
|
TOP HOLDINGS (% of Fund's net assets) | | |
| Abbvie Inc | 18.3 | |
| Amgen Inc | 9.4 | |
| Regeneron Pharmaceuticals Inc | 7.0 | |
| Vertex Pharmaceuticals Inc | 4.7 | |
| Alnylam Pharmaceuticals Inc | 4.5 | |
| Argenx SE ADR | 3.8 | |
| Ascendis Pharma A/S ADR | 3.5 | |
| Vaxcyte Inc | 2.6 | |
| Cytokinetics Inc | 2.6 | |
| Viking Therapeutics Inc | 2.3 | |
| | 58.7 | |
| |
How has the Fund changed?
This is a summary of certain changes to the Fund since August 1, 2023. For more complete information, you may review the Fund's next prospectus, which we expect to be available by September 28, 2024 at fundresearch.fidelity.com/prospectus/sec or upon request at 1-877-208-0098 or by sending an e-mail to fidfunddocuments@fidelity.com.
The fund's transfer agent and pricing and bookkeeping fees were changed to a fixed rate effective December 1, 2023, through February 29, 2024, in anticipation of the transition to a new management fee structure. Effective March 1, 2024, the fund's management contract was amended to incorporate administrative services previously covered under separate services agreements (transfer agent and pricing and bookkeeping).The amended contract incorporates a management fee rate that may vary by class. The Adviser or an affiliate pays certain expenses of managing and operating the fund out of each class's management fee. | |
| Fidelity, the Fidelity Investments Logo and all other Fidelity trademarks or service marks used herein are trademarks or service marks of FMR LLC. Any third-party marks that are used herein are trademarks or service marks of their respective owners. © 2024 FMR LLC. All rights reserved. |
| | For additional information about the Fund; including its prospectus, financial information, holdings and proxy information, scan the QR code or visit fundresearch.fidelity.com/prospectus/sec 1.9913428.100 3290-TSRA-0924 |
| |
| | ANNUAL SHAREHOLDER REPORT | AS OF JULY 31, 2024 | This report describes changes to the Fund that occurred during the reporting period. |
| | Fidelity Advisor® Utilities Fund Fidelity Advisor® Utilities Fund Class Z : FIKIX |
| | | |
This annual shareholder report contains information about Fidelity Advisor® Utilities Fund for the period August 1, 2023 to July 31, 2024. You can find additional information about the Fund at fundresearch.fidelity.com/prospectus/sec. You can also request this information by contacting us at 1-877-208-0098 or by sending an e-mail to fidfunddocuments@fidelity.com.
What were your Fund costs for the last year?(based on hypothetical $10,000 investment)
FUND COST (PREVIOUS YEAR)
| | Costs of a $10,000 investment | Costs paid as a percentage of a $10,000 investment | |
| Class Z | $ 62 | 0.57% | |
What affected the Fund's performance this period?
•U.S. equities gained for the 12 months ending July 31, 2024, driven by resilient corporate profits, a frenzy over generative artificial intelligence and the Federal Reserve's likely pivot to cutting interest rates later this year.
•Against this backdrop, both security selection and market selection contributed to the fund's performance versus the MSCI US IMI Utilities 25/50 Index for the fiscal year, led by our stock picks in electric utilities. An overweight in independent power producers & energy traders also boosted the fund's relative performance, as did stock choices and an underweight in multi-utilities.
•The top individual relative contributor was an overweight in Vistra (+185%). This period we decreased our position in the stock, but the company was among the fund's biggest holdings at the end of the period. A second notable relative contributor was an overweight in Constellation Energy (+99%). Like Vistra, we decreased our position in Constellation Energy this period, but the stock remained among the fund's largest holdings. Another notable relative contributor was an underweight in Exelon (-8%), a stock was not held at period end.
•In contrast, the biggest detractors from performance versus the sector index were stock picking and an overweight in renewable electricity. Our picks in coal & consumable fuels and gas utilities also hurt. Lastly, the fund's position in cash was a notable detractor.
•The largest individual relative detractor was an overweight in NextEra Energy Partners (-48%), the yield company subsidiary of another fund holding, NextEra Energy. This period we increased our investment in the stock. Other notable relative detractors included underweights in Duke Energy (+22%) and DTE Energy (+9%). We exited our positions in both during the period.
•Notable changes in positioning include decreased exposure to water utilities and a higher allocation to multi-utilities.
How did the Fund perform over the life of Fund?
CUMULATIVE PERFORMANCE
October 2, 2018 through July 31, 2024.
Initial investment of $10,000.
Class Z | $10,000 | $10,904 | $10,778 | $12,439 | $14,824 | $14,644 | $17,129 |
MSCI U.S. IMI Utilities 25-50 Index | $10,000 | $11,420 | $11,793 | $13,232 | $15,237 | $14,234 | $16,033 |
S&P 500® Index | $10,000 | $10,365 | $11,604 | $15,833 | $15,098 | $17,064 | $20,843 |
| | 2018 | 2019 | 2020 | 2021 | 2022 | 2023 | 2024 |
AVERAGE ANNUAL TOTAL RETURNS: | | 1 Year | 5 Year | Life of Fund A |
| Class Z | 16.97% | 9.45% | 9.67% |
| MSCI U.S. IMI Utilities 25-50 Index | 12.64% | 7.02% | 8.43% |
| S&P 500® Index | 22.15% | 15.00% | 13.42% |
A From October 2, 2018
Visit institutional.fidelity.com for more recent performance information. |
The Fund's past performance is not a good predictor of the Fund's future performance. The graph and table do not reflect the deduction of taxes that a shareholder would pay on fund distributions or redemption of fund shares. |
Key Fund Statistics (as of July 31, 2024)
KEY FACTS | | |
| Fund Size | $819,716,826 | |
| Number of Holdings | 30 | |
| Total Advisory Fee | $4,138,318 | |
| Portfolio Turnover | 84% | |
What did the Fund invest in?
(as of July 31, 2024)
TOP INDUSTRIES (% of Fund's net assets) |
| Electric Utilities | 63.0 | |
| Multi-Utilities | 23.0 | |
| Independent Power and Renewable Electricity Producers | 7.0 | |
| Gas Utilities | 2.2 | |
| Oil, Gas & Consumable Fuels | 0.2 | |
| |
| Common Stocks | 95.4 |
| Short-Term Investments and Net Other Assets (Liabilities) | 4.6 |
ASSET ALLOCATION (% of Fund's net assets) |
|
|
| United States | 99.8 |
| Australia | 0.2 |
GEOGRAPHIC DIVERSIFICATION (% of Fund's net assets) |
|
| |
|
TOP HOLDINGS (% of Fund's net assets) | | |
| NextEra Energy Inc | 12.7 | |
| Sempra | 7.1 | |
| PG&E Corp | 5.9 | |
| American Electric Power Co Inc | 5.6 | |
| Edison International | 5.4 | |
| Public Service Enterprise Group Inc | 5.0 | |
| Eversource Energy | 5.0 | |
| Constellation Energy Corp | 5.0 | |
| Entergy Corp | 4.8 | |
| FirstEnergy Corp | 4.3 | |
| | 60.8 | |
| |
How has the Fund changed?
This is a summary of certain changes to the Fund since August 1, 2023. For more complete information, you may review the Fund's next prospectus, which we expect to be available by September 28, 2024 at fundresearch.fidelity.com/prospectus/sec or upon request at 1-877-208-0098 or by sending an e-mail to fidfunddocuments@fidelity.com.
The fees associated with this class changed during the reporting year. The variations in class fees are primarily the result of the following changes: - •Management fee
- •Operating expenses
The fund's transfer agent and pricing & bookkeeping fees were changed to a fixed rate effective December 1, 2023, through February 29, 2024, in anticipation of the transition to a new management fee structure. Effective March 1, 2024, the fund's management contract was amended to incorporate administrative services previously covered under separate services agreements (transfer agent and pricing & bookkeeping). The amended contract incorporates a management fee rate that may vary by class. The Adviser or an affiliate pays certain expenses of managing and operating the fund out of each class's management fee. |
| Fidelity, the Fidelity Investments Logo and all other Fidelity trademarks or service marks used herein are trademarks or service marks of FMR LLC. Any third-party marks that are used herein are trademarks or service marks of their respective owners. © 2024 FMR LLC. All rights reserved. |
| | For additional information about the Fund; including its prospectus, financial information, holdings and proxy information, scan the QR code or visit fundresearch.fidelity.com/prospectus/sec 1.9913410.100 3298-TSRA-0924 |
| |
| | ANNUAL SHAREHOLDER REPORT | AS OF JULY 31, 2024 | This report describes changes to the Fund that occurred during the reporting period. |
| | Fidelity Advisor® Global Real Estate Fund Fidelity Advisor® Global Real Estate Fund Class A : FWRAX |
| | | |
This annual shareholder report contains information about Fidelity Advisor® Global Real Estate Fund for the period August 1, 2023 to July 31, 2024. You can find additional information about the Fund at fundresearch.fidelity.com/prospectus/sec. You can also request this information by contacting us at 1-877-208-0098 or by sending an e-mail to fidfunddocuments@fidelity.com.
What were your Fund costs for the last year?(based on hypothetical $10,000 investment)
FUND COST (PREVIOUS YEAR)
| | Costs of a $10,000 investment | Costs paid as a percentage of a $10,000 investment | |
| Class A | $ 125 | 1.20% | |
What affected the Fund's performance this period?
•Investors in global real estate securities experienced fluctuating market conditions throughout the 12 months ending July 31, 2024, initially declining due to rate hike concerns but later rallying as hopes for rate cuts in 2024 grew. Market returns were weakened by a broadly stronger U.S. dollar.
•Against this backdrop, an underweight in Asia Pacific ex Japan - primarily Hong Kong - along with security selection in Japan, contributed to the fund's performance versus the FTSE® EPRASM/NAREIT® Developed Index for the fiscal year.
•By industry, security selection was the primary contributor, especially among diversified real estate activities stocks. Favorable picks in health care also boosted the fund's relative performance. Investment choices and an underweight in the diversified real estate segment helped as well.
•The top individual relative contributor was an overweight in Mitsui Fudosan (+57%). The company was one of the fund's biggest holdings. Outsized exposure to Mitsubishi Estate (+42%) was another plus. Not owning Wharf Real Estate Investment, an index component that returned -52%, also helped.
•In contrast, from a regional standpoint, stock picks in the U.K. and U.S. detracted from the fund's performance versus the real estate index.
•The biggest relative detractors were stock picks and an overweight in the single-family residential industry. Subpar investment choices and outsized exposure to industrial and multi-family residential stocks also were detrimental to performance.
•Not owning Simon Property Group, an index component that gained about 30%, was the largest individual relative detractor. An overweight stake in UOL Group (-22%) pressured performance as well. This period we decreased our stake in the company. Outsized exposure to Mitsui Fudosan Logistics Park (-18%) also hurt.
•Notable changes in positioning include decreased exposure to real estate stocks in Singapore and a higher allocation to the U.K. By industry, meaningful allocation shifts include increased exposure to the self storage industry and a reduction in hotel & resort holdings.
How did the Fund perform over the life of Fund?
CUMULATIVE PERFORMANCE
August 11, 2016 through July 31, 2024.
Initial investment of $10,000 and the current sales charge was paid.
Class A | $9,425 | $9,331 | $9,906 | $10,722 | $10,228 | $13,356 | $12,101 | $11,156 | $12,146 |
FTSE® EPRA℠/NAREIT® Developed Index | $10,000 | $9,960 | $10,524 | $11,380 | $9,855 | $13,420 | $12,176 | $11,285 | $12,184 |
MSCI ACWI (All Country World Index) Index | $10,000 | $11,606 | $12,928 | $13,363 | $14,382 | $19,214 | $17,256 | $19,556 | $22,962 |
| | 2016 | 2017 | 2018 | 2019 | 2020 | 2021 | 2022 | 2023 | 2024 |
AVERAGE ANNUAL TOTAL RETURNS: | | 1 Year | 5 Year | Life of Fund A |
| Class A (incl. 5.75% sales charge) | 2.62% | 1.32% | 2.47% |
| Class A (without 5.75% sales charge) | 8.88% | 2.52% | 3.23% |
| FTSE® EPRA℠/NAREIT® Developed Index | 7.97% | 1.38% | 2.51% |
| MSCI ACWI (All Country World Index) Index | 17.42% | 11.43% | 10.99% |
A From August 11, 2016
Visit institutional.fidelity.com for more recent performance information. |
The Fund's past performance is not a good predictor of the Fund's future performance. The graph and table do not reflect the deduction of taxes that a shareholder would pay on fund distributions or redemption of fund shares. |
Key Fund Statistics (as of July 31, 2024)
KEY FACTS | | |
| Fund Size | $6,027,346 | |
| Number of Holdings | 73 | |
| Total Advisory Fee | $39,394 | |
| Portfolio Turnover | 32% | |
What did the Fund invest in?
(as of July 31, 2024)
TOP INDUSTRIES (% of Fund's net assets) |
| Residential REITs | 19.8 | |
| Specialized REITs | 19.1 | |
| Industrial REITs | 18.3 | |
| Retail REITs | 18.0 | |
| Real Estate Management & Development | 11.9 | |
| Health Care REITs | 7.1 | |
| Diversified REITs | 2.8 | |
| Hotel & Resort REITs | 1.3 | |
| Office REITs | 0.6 | |
| |
| Common Stocks | 98.9 |
| Short-Term Investments and Net Other Assets (Liabilities) | 1.1 |
ASSET ALLOCATION (% of Fund's net assets) |
|
|
| United States | 61.9 |
| United Kingdom | 8.3 |
| Japan | 8.2 |
| Australia | 4.9 |
| Canada | 3.7 |
| Singapore | 3.0 |
| France | 2.3 |
| Sweden | 1.9 |
| Germany | 1.8 |
| Others | 4.0 |
GEOGRAPHIC DIVERSIFICATION (% of Fund's net assets) |
|
| |
|
TOP HOLDINGS (% of Fund's net assets) | | |
| Prologis Inc | 9.1 | |
| Equinix Inc | 5.2 | |
| Public Storage Operating Co | 3.9 | |
| Ventas Inc | 3.6 | |
| Digital Realty Trust Inc | 3.0 | |
| Kimco Realty Corp | 2.8 | |
| Grainger PLC | 2.6 | |
| NNN REIT Inc | 2.5 | |
| UDR Inc | 2.4 | |
| Welltower Inc | 2.4 | |
| | 37.5 | |
| |
How has the Fund changed?
This is a summary of certain changes to the Fund since August 1, 2023. For more complete information, you may review the Fund's next prospectus, which we expect to be available by September 28, 2024 at fundresearch.fidelity.com/prospectus/sec or upon request at 1-877-208-0098 or by sending an e-mail to fidfunddocuments@fidelity.com.
The fund's transfer agent and pricing & bookkeeping fees were changed to a fixed rate effective December 1, 2023, through February 29, 2024, in anticipation of the transition to a new management fee structure. Effective March 1, 2024, the fund's management contract was amended to incorporate administrative services previously covered under separate services agreements (transfer agent and pricing & bookkeeping). The amended contract incorporates a management fee rate that may vary by class. The Adviser or an affiliate pays certain expenses of managing and operating the fund out of each class's management fee. | |
| Fidelity, the Fidelity Investments Logo and all other Fidelity trademarks or service marks used herein are trademarks or service marks of FMR LLC. Any third-party marks that are used herein are trademarks or service marks of their respective owners. © 2024 FMR LLC. All rights reserved. |
| | For additional information about the Fund; including its prospectus, financial information, holdings and proxy information, scan the QR code or visit fundresearch.fidelity.com/prospectus/sec 1.9913534.100 2849-TSRA-0924 |
| |
| | ANNUAL SHAREHOLDER REPORT | AS OF JULY 31, 2024 | This report describes changes to the Fund that occurred during the reporting period. |
| | Fidelity Advisor® Health Care Fund Fidelity Advisor® Health Care Fund Class I : FHCIX |
| | | |
This annual shareholder report contains information about Fidelity Advisor® Health Care Fund for the period August 1, 2023 to July 31, 2024. You can find additional information about the Fund at fundresearch.fidelity.com/prospectus/sec. You can also request this information by contacting us at 1-877-208-0098 or by sending an e-mail to fidfunddocuments@fidelity.com.
What were your Fund costs for the last year?(based on hypothetical $10,000 investment)
FUND COST (PREVIOUS YEAR)
| | Costs of a $10,000 investment | Costs paid as a percentage of a $10,000 investment | |
| Class I | $ 72 | 0.70% | |
What affected the Fund's performance this period?
•U.S. equities gained for the 12 months ending July 31, 2024, driven by resilient corporate profits, a frenzy over generative artificial intelligence and the Federal Reserve's likely pivot to cutting interest rates later this year.
•Against this backdrop, security selection and market selection were the primary detractors to the fund's performance versus the benchmark, led by health care services. Also hurting the fund's relative result was security selection in health care facilities and biotechnology.
•The largest individual relative detractor was an overweight in Penumbra (-45%), which was among our biggest holdings. It also hurt to overweight agilon health (-64%) and 10X Genomics (-67%). This period we decreased our position in agilon.
•In contrast, the biggest contributor to performance versus the sector index was security selection in pharmaceuticals. Stock picks in health care equipment also boosted relative performance.
•The top individual relative contributor was an overweight in Boston Scientific (+42%). The stock was the fund's largest holding, even though we decreased the fund's stake this period. It also helped to avoid index components Johnson & Johnson (-3%) and Pfizer (-10%).
•Notable changes in positioning include decreased exposure to the life sciences tools & services industry and a higher allocation to biotechnology.
How did the Fund perform over the past 10 years?
CUMULATIVE PERFORMANCE
July 31, 2014 through July 31, 2024.
Initial investment of $10,000.
Class I | $10,000 | $13,440 | $12,150 | $13,338 | $16,018 | $16,522 | $20,626 | $24,959 | $22,044 | $22,921 | $24,520 |
MSCI U.S. IMI Health Care 25-50 Index | $10,000 | $13,063 | $12,726 | $13,917 | $16,068 | $16,693 | $19,997 | $25,628 | $24,807 | $25,460 | $28,709 |
S&P 500® Index | $10,000 | $11,121 | $11,745 | $13,629 | $15,843 | $17,108 | $19,153 | $26,134 | $24,921 | $28,165 | $34,403 |
| | 2014 | 2015 | 2016 | 2017 | 2018 | 2019 | 2020 | 2021 | 2022 | 2023 | 2024 |
AVERAGE ANNUAL TOTAL RETURNS: | | 1 Year | 5 Year | 10 Year |
| Class I | 6.98% | 8.22% | 9.38% |
| MSCI U.S. IMI Health Care 25-50 Index | 12.76% | 11.45% | 11.12% |
| S&P 500® Index | 22.15% | 15.00% | 13.15% |
Visit institutional.fidelity.com for more recent performance information. |
The Fund's past performance is not a good predictor of the Fund's future performance. The graph and table do not reflect the deduction of taxes that a shareholder would pay on fund distributions or redemption of fund shares. |
Key Fund Statistics (as of July 31, 2024)
KEY FACTS | | |
| Fund Size | $4,615,583,149 | |
| Number of Holdings | 103 | |
| Total Advisory Fee | $27,914,465 | |
| Portfolio Turnover | 37% | |
What did the Fund invest in?
(as of July 31, 2024)
TOP INDUSTRIES (% of Fund's net assets) |
| Biotechnology | 24.4 | |
| Health Care Equipment & Supplies | 23.5 | |
| Health Care Providers & Services | 21.8 | |
| Pharmaceuticals | 16.6 | |
| Life Sciences Tools & Services | 10.9 | |
| Health Care Technology | 2.0 | |
| Financial Services | 0.2 | |
| |
| Common Stocks | 97.9 |
| Preferred Stocks | 1.5 |
| Preferred Securities | 0.2 |
| Bonds | 0.1 |
| Short-Term Investments and Net Other Assets (Liabilities) | 0.3 |
ASSET ALLOCATION (% of Fund's net assets) |
|
|
| United States | 91.5 |
| Netherlands | 3.0 |
| United Kingdom | 1.7 |
| Denmark | 1.5 |
| Belgium | 1.3 |
| Canada | 0.9 |
| Israel | 0.1 |
| China | 0.0 |
GEOGRAPHIC DIVERSIFICATION (% of Fund's net assets) |
|
| |
|
TOP HOLDINGS (% of Fund's net assets) | | |
| Boston Scientific Corp | 9.6 | |
| Eli Lilly & Co | 8.2 | |
| UnitedHealth Group Inc | 7.8 | |
| Danaher Corp | 6.4 | |
| Regeneron Pharmaceuticals Inc | 4.4 | |
| Merck & Co Inc | 3.9 | |
| Cigna Group/The | 3.4 | |
| Penumbra Inc | 3.1 | |
| Stryker Corp | 2.4 | |
| Insulet Corp | 2.2 | |
| | 51.4 | |
| |
How has the Fund changed?
This is a summary of certain changes to the Fund since August 1, 2023. For more complete information, you may review the Fund's next prospectus, which we expect to be available by September 28, 2024 at fundresearch.fidelity.com/prospectus/sec or upon request at 1-877-208-0098 or by sending an e-mail to fidfunddocuments@fidelity.com.
The fund's transfer agent and pricing & bookkeeping fees were changed to a fixed rate effective December 1, 2023, through February 29, 2024, in anticipation of the transition to a new management fee structure. Effective March 1, 2024, the fund's management contract was amended to incorporate administrative services previously covered under separate services agreements (transfer agent and pricing & bookkeeping). The amended contract incorporates a management fee rate that may vary by class. The Adviser or an affiliate pays certain expenses of managing and operating the fund out of each class's management fee. | |
| Fidelity, the Fidelity Investments Logo and all other Fidelity trademarks or service marks used herein are trademarks or service marks of FMR LLC. Any third-party marks that are used herein are trademarks or service marks of their respective owners. © 2024 FMR LLC. All rights reserved. |
| | For additional information about the Fund; including its prospectus, financial information, holdings and proxy information, scan the QR code or visit fundresearch.fidelity.com/prospectus/sec 1.9913389.100 271-TSRA-0924 |
| |
| | ANNUAL SHAREHOLDER REPORT | AS OF JULY 31, 2024 | This report describes changes to the Fund that occurred during the reporting period. |
| | Fidelity Advisor® Financials Fund Fidelity Advisor® Financials Fund Class Z : FIKBX |
| | | |
This annual shareholder report contains information about Fidelity Advisor® Financials Fund for the period August 1, 2023 to July 31, 2024. You can find additional information about the Fund at fundresearch.fidelity.com/prospectus/sec. You can also request this information by contacting us at 1-877-208-0098 or by sending an e-mail to fidfunddocuments@fidelity.com.
What were your Fund costs for the last year?(based on hypothetical $10,000 investment)
FUND COST (PREVIOUS YEAR)
| | Costs of a $10,000 investment | Costs paid as a percentage of a $10,000 investment | |
| Class Z | $ 72 | 0.62% | |
What affected the Fund's performance this period?
•U.S. equities gained for the 12 months ending July 31, 2024, driven by resilient corporate profits, a frenzy over generative artificial intelligence and the Federal Reserve's likely pivot to cutting interest rates later this year.
•Against this backdrop, security selection was the primary contributor to the fund's performance versus the MSCI US IMI Financials 5% Capped Linked Index for the fiscal year, led by regional banks. Picks among reinsurance firms and insurance brokers also boosted the fund's relative performance.
•The top individual relative contributor was an overweight in Reinsurance Group of America (+64%), though we decreased our exposure to the stock this period. The company was among the fund's largest holdings. Avoiding shares of Visa, an index component that gained approximately 13%, helped as well. An outsized stake in Baldwin Insurance Group (+79%) was another plus.
•In contrast, the primary detractor from performance versus the sector index was stock selection in the property & casualty insurance industry. Subpar investment choices among life & health insurance and financial exchanges & data companies hurt as well.
•The biggest individual relative detractor this period was avoiding Progressive, an index component that rose 71%. Similarly, not owing KKR, an index component that increased approximately 110%, also proved detrimental to performance. An underweight stake in JPMorgan Chase (+38%) also hurt. The stock was not held at period end.
•Notable changes in positioning include increased exposure to the investment banking & brokerage and diversified financial services industries.
How did the Fund perform over the life of Fund?
CUMULATIVE PERFORMANCE
October 2, 2018 through July 31, 2024.
Initial investment of $10,000.
Class Z | $10,000 | $10,472 | $8,924 | $14,504 | $14,065 | $14,710 | $19,231 |
MSCI U.S. IMI Financials 5% Capped Linked Index | $10,000 | $10,457 | $8,858 | $13,921 | $13,268 | $13,983 | $17,897 |
S&P 500® Index | $10,000 | $10,365 | $11,604 | $15,833 | $15,098 | $17,064 | $20,843 |
| | 2018 | 2019 | 2020 | 2021 | 2022 | 2023 | 2024 |
AVERAGE ANNUAL TOTAL RETURNS: | | 1 Year | 5 Year | Life of Fund A |
| Class Z | 30.73% | 12.92% | 11.86% |
| MSCI U.S. IMI Financials 5% Capped Linked Index | 27.98% | 11.35% | 10.49% |
| S&P 500® Index | 22.15% | 15.00% | 13.42% |
A From October 2, 2018
Visit institutional.fidelity.com for more recent performance information. |
The Fund's past performance is not a good predictor of the Fund's future performance. The graph and table do not reflect the deduction of taxes that a shareholder would pay on fund distributions or redemption of fund shares. |
Key Fund Statistics (as of July 31, 2024)
KEY FACTS | | |
| Fund Size | $507,414,487 | |
| Number of Holdings | 66 | |
| Total Advisory Fee | $2,566,292 | |
| Portfolio Turnover | 44% | |
What did the Fund invest in?
(as of July 31, 2024)
TOP INDUSTRIES (% of Fund's net assets) |
| Banks | 35.0 | |
| Capital Markets | 21.1 | |
| Financial Services | 20.7 | |
| Insurance | 18.5 | |
| Consumer Finance | 3.7 | |
| Professional Services | 1.0 | |
| |
| Common Stocks | 100.0 |
| Short-Term Investments and Net Other Assets (Liabilities) | 0.0 |
ASSET ALLOCATION (% of Fund's net assets) |
|
|
| United States | 93.0 |
| United Kingdom | 3.7 |
| Puerto Rico | 2.1 |
| Grand Cayman (UK Overseas Ter) | 0.7 |
| Mexico | 0.5 |
GEOGRAPHIC DIVERSIFICATION (% of Fund's net assets) |
|
| |
|
TOP HOLDINGS (% of Fund's net assets) | | |
| Mastercard Inc Class A | 10.1 | |
| Wells Fargo & Co | 6.4 | |
| Bank of America Corp | 5.1 | |
| Citigroup Inc | 3.1 | |
| Chubb Ltd | 2.6 | |
| M&T Bank Corp | 2.6 | |
| Morgan Stanley | 2.5 | |
| Apollo Global Management Inc | 2.4 | |
| Reinsurance Group of America Inc | 2.3 | |
| Popular Inc | 2.1 | |
| | 39.2 | |
| |
How has the Fund changed?
This is a summary of certain changes to the Fund since August 1, 2023. For more complete information, you may review the Fund's next prospectus, which we expect to be available by September 28, 2024 at fundresearch.fidelity.com/prospectus/sec or upon request at 1-877-208-0098 or by sending an e-mail to fidfunddocuments@fidelity.com.
The fund's name changed from Fidelity Advisor Financial Services Fund to Fidelity Advisor Financials Fund during the reporting period. | The fund's transfer agent and pricing and bookkeeping fees were changed to a fixed rate effective December 1, 2023, through February 29, 2024, in anticipation of the transition to a new management fee structure. Effective March 1, 2024, the fund's management contract was amended to incorporate administrative services previously covered under separate services agreements (transfer agent and pricing and bookkeeping).The amended contract incorporates a management fee rate that may vary by class. The Adviser or an affiliate pays certain expenses of managing and operating the fund out of each class's management fee. |
| Fidelity, the Fidelity Investments Logo and all other Fidelity trademarks or service marks used herein are trademarks or service marks of FMR LLC. Any third-party marks that are used herein are trademarks or service marks of their respective owners. © 2024 FMR LLC. All rights reserved. |
| | For additional information about the Fund; including its prospectus, financial information, holdings and proxy information, scan the QR code or visit fundresearch.fidelity.com/prospectus/sec 1.9913396.100 3293-TSRA-0924 |
| |
| | ANNUAL SHAREHOLDER REPORT | AS OF JULY 31, 2024 | This report describes changes to the Fund that occurred during the reporting period. |
| | Fidelity Advisor® Semiconductors Fund Fidelity Advisor® Semiconductors Fund Class M : FELTX |
| | | |
This annual shareholder report contains information about Fidelity Advisor® Semiconductors Fund for the period August 1, 2023 to July 31, 2024. You can find additional information about the Fund at fundresearch.fidelity.com/prospectus/sec. You can also request this information by contacting us at 1-877-208-0098 or by sending an e-mail to fidfunddocuments@fidelity.com.
What were your Fund costs for the last year?(based on hypothetical $10,000 investment)
FUND COST (PREVIOUS YEAR)
| | Costs of a $10,000 investment | Costs paid as a percentage of a $10,000 investment | |
| Class M | $ 144 | 1.21% | |
What affected the Fund's performance this period?
•U.S. equities gained for the 12 months ending July 31, 2024, driven by resilient corporate profits, a frenzy over generative artificial intelligence and the Federal Reserve's likely pivot to cutting interest rates later this year.
•Against this backdrop, security selection was the primary detractor from the fund's performance versus the MSCI U.S. IMI Semiconductors & Semiconductor Equipment 25/50 Index for the fiscal year, especially within semiconductors. Also hurting our result were picks in technology hardware, storage & peripherals. Lastly, the fund's position in cash was a notable detractor.
•The biggest individual relative detractor was an overweight in onsemi (-28%). This period we increased our stake in onsemi, and it was among our largest holdings. The fund's second-largest relative detractor was our non-index stake in GlobalFoundries (-20%). This period we increased our stake in GlobalFoundries, and it was among the fund's biggest holdings. An underweight in Broadcom (+82%) also detracted. The company was among the fund's largest holdings.
•In contrast, the primary contributors to performance versus the industry index were picks and an underweight in the semiconductor materials & equipment group.
•The fund's top individual relative contributor this period was avoiding Intel, an index component that returned -13%. The second-largest relative contributor was an underweight in Texas Instruments (+18%). This period we decreased our position in Texas Instruments. Not owning SolarEdge Technologies, an index component that returned -88%, was another notable relative contributor.
How did the Fund perform over the past 10 years?
CUMULATIVE PERFORMANCE
July 31, 2014 through July 31, 2024.
Initial investment of $10,000 and the current sales charge was paid.
Class M | $9,650 | $10,668 | $12,803 | $16,735 | $21,245 | $23,337 | $30,403 | $49,249 | $47,558 | $70,838 | $98,591 |
MSCI U.S. IMI Semiconductors & Semiconductor Equipment 25-50 Index | $10,000 | $10,481 | $13,028 | $17,291 | $21,750 | $23,948 | $32,281 | $51,070 | $48,484 | $72,407 | $107,971 |
S&P 500® Index | $10,000 | $11,121 | $11,745 | $13,629 | $15,843 | $17,108 | $19,153 | $26,134 | $24,921 | $28,165 | $34,403 |
| | 2014 | 2015 | 2016 | 2017 | 2018 | 2019 | 2020 | 2021 | 2022 | 2023 | 2024 |
AVERAGE ANNUAL TOTAL RETURNS: | | 1 Year | 5 Year | 10 Year |
| Class M (incl. 3.50% sales charge) | 34.31% | 32.45% | 25.71% |
| Class M (without 3.50% sales charge) | 39.18% | 33.40% | 26.16% |
| MSCI U.S. IMI Semiconductors & Semiconductor Equipment 25-50 Index | 49.12% | 35.15% | 26.86% |
| S&P 500® Index | 22.15% | 15.00% | 13.15% |
Visit institutional.fidelity.com for more recent performance information. |
The Fund's past performance is not a good predictor of the Fund's future performance. The graph and table do not reflect the deduction of taxes that a shareholder would pay on fund distributions or redemption of fund shares. |
Key Fund Statistics (as of July 31, 2024)
KEY FACTS | | |
| Fund Size | $2,698,217,311 | |
| Number of Holdings | 45 | |
| Total Advisory Fee | $11,387,050 | |
| Portfolio Turnover | 30% | |
What did the Fund invest in?
(as of July 31, 2024)
TOP INDUSTRIES (% of Fund's net assets) |
| Semiconductors & Semiconductor Equipment | 92.7 | |
| Technology Hardware, Storage & Peripherals | 2.4 | |
| Electronic Equipment, Instruments & Components | 0.1 | |
| Financial Services | 0.0 | |
| Metals & Mining | 0.0 | |
| |
| Common Stocks | 95.0 |
| Preferred Stocks | 0.2 |
| Preferred Securities | 0.0 |
| Short-Term Investments and Net Other Assets (Liabilities) | 4.8 |
ASSET ALLOCATION (% of Fund's net assets) |
|
|
| United States | 79.9 |
| Taiwan | 7.1 |
| China | 5.6 |
| Netherlands | 5.0 |
| Israel | 1.7 |
| Japan | 0.7 |
GEOGRAPHIC DIVERSIFICATION (% of Fund's net assets) |
|
| |
|
TOP HOLDINGS (% of Fund's net assets) | | |
| NVIDIA Corp | 25.8 | |
| ON Semiconductor Corp | 7.3 | |
| Taiwan Semiconductor Manufacturing Co Ltd ADR | 6.1 | |
| NXP Semiconductors NV | 5.6 | |
| Micron Technology Inc | 5.4 | |
| ASML Holding NV depository receipt | 5.0 | |
| GlobalFoundries Inc | 4.8 | |
| Lam Research Corp | 4.8 | |
| Broadcom Inc | 4.3 | |
| Advanced Micro Devices Inc | 3.8 | |
| | 72.9 | |
| |
How has the Fund changed?
This is a summary of certain changes to the Fund since August 1, 2023. For more complete information, you may review the Fund's next prospectus, which we expect to be available by September 28, 2024 at fundresearch.fidelity.com/prospectus/sec or upon request at 1-877-208-0098 or by sending an e-mail to fidfunddocuments@fidelity.com.
The fund's transfer agent and pricing and bookkeeping fees were changed to a fixed rate effective December 1, 2023, through February 29, 2024, in anticipation of the transition to a new management fee structure. Effective March 1, 2024, the fund's management contract was amended to incorporate administrative services previously covered under separate services agreements (transfer agent and pricing and bookkeeping).The amended contract incorporates a management fee rate that may vary by class. The Adviser or an affiliate pays certain expenses of managing and operating the fund out of each class's management fee. | |
| Fidelity, the Fidelity Investments Logo and all other Fidelity trademarks or service marks used herein are trademarks or service marks of FMR LLC. Any third-party marks that are used herein are trademarks or service marks of their respective owners. © 2024 FMR LLC. All rights reserved. |
| | For additional information about the Fund; including its prospectus, financial information, holdings and proxy information, scan the QR code or visit fundresearch.fidelity.com/prospectus/sec 1.9913444.100 139-TSRA-0924 |
| |
| | ANNUAL SHAREHOLDER REPORT | AS OF JULY 31, 2024 | This report describes changes to the Fund that occurred during the reporting period. |
| | Fidelity Advisor® Health Care Fund Fidelity Advisor® Health Care Fund Class Z : FIKCX |
| | | |
This annual shareholder report contains information about Fidelity Advisor® Health Care Fund for the period August 1, 2023 to July 31, 2024. You can find additional information about the Fund at fundresearch.fidelity.com/prospectus/sec. You can also request this information by contacting us at 1-877-208-0098 or by sending an e-mail to fidfunddocuments@fidelity.com.
What were your Fund costs for the last year?(based on hypothetical $10,000 investment)
FUND COST (PREVIOUS YEAR)
| | Costs of a $10,000 investment | Costs paid as a percentage of a $10,000 investment | |
| Class Z | $ 58 | 0.56% | |
What affected the Fund's performance this period?
•U.S. equities gained for the 12 months ending July 31, 2024, driven by resilient corporate profits, a frenzy over generative artificial intelligence and the Federal Reserve's likely pivot to cutting interest rates later this year.
•Against this backdrop, security selection and market selection were the primary detractors to the fund's performance versus the benchmark, led by health care services. Also hurting the fund's relative result was security selection in health care facilities and biotechnology.
•The largest individual relative detractor was an overweight in Penumbra (-45%), which was among our biggest holdings. It also hurt to overweight agilon health (-64%) and 10X Genomics (-67%). This period we decreased our position in agilon.
•In contrast, the biggest contributor to performance versus the sector index was security selection in pharmaceuticals. Stock picks in health care equipment also boosted relative performance.
•The top individual relative contributor was an overweight in Boston Scientific (+42%). The stock was the fund's largest holding, even though we decreased the fund's stake this period. It also helped to avoid index components Johnson & Johnson (-3%) and Pfizer (-10%).
•Notable changes in positioning include decreased exposure to the life sciences tools & services industry and a higher allocation to biotechnology.
How did the Fund perform over the life of Fund?
CUMULATIVE PERFORMANCE
October 2, 2018 through July 31, 2024.
Initial investment of $10,000.
Class Z | $10,000 | $9,714 | $12,141 | $14,709 | $13,008 | $13,543 | $14,506 |
MSCI U.S. IMI Health Care 25-50 Index | $10,000 | $9,682 | $11,598 | $14,864 | $14,388 | $14,767 | $16,651 |
S&P 500® Index | $10,000 | $10,365 | $11,604 | $15,833 | $15,098 | $17,064 | $20,843 |
| | 2018 | 2019 | 2020 | 2021 | 2022 | 2023 | 2024 |
AVERAGE ANNUAL TOTAL RETURNS: | | 1 Year | 5 Year | Life of Fund A |
| Class Z | 7.11% | 8.35% | 6.58% |
| MSCI U.S. IMI Health Care 25-50 Index | 12.76% | 11.45% | 9.14% |
| S&P 500® Index | 22.15% | 15.00% | 13.42% |
A From October 2, 2018
Visit institutional.fidelity.com for more recent performance information. |
The Fund's past performance is not a good predictor of the Fund's future performance. The graph and table do not reflect the deduction of taxes that a shareholder would pay on fund distributions or redemption of fund shares. |
Key Fund Statistics (as of July 31, 2024)
KEY FACTS | | |
| Fund Size | $4,615,583,149 | |
| Number of Holdings | 103 | |
| Total Advisory Fee | $27,914,465 | |
| Portfolio Turnover | 37% | |
What did the Fund invest in?
(as of July 31, 2024)
TOP INDUSTRIES (% of Fund's net assets) |
| Biotechnology | 24.4 | |
| Health Care Equipment & Supplies | 23.5 | |
| Health Care Providers & Services | 21.8 | |
| Pharmaceuticals | 16.6 | |
| Life Sciences Tools & Services | 10.9 | |
| Health Care Technology | 2.0 | |
| Financial Services | 0.2 | |
| |
| Common Stocks | 97.9 |
| Preferred Stocks | 1.5 |
| Preferred Securities | 0.2 |
| Bonds | 0.1 |
| Short-Term Investments and Net Other Assets (Liabilities) | 0.3 |
ASSET ALLOCATION (% of Fund's net assets) |
|
|
| United States | 91.5 |
| Netherlands | 3.0 |
| United Kingdom | 1.7 |
| Denmark | 1.5 |
| Belgium | 1.3 |
| Canada | 0.9 |
| Israel | 0.1 |
| China | 0.0 |
GEOGRAPHIC DIVERSIFICATION (% of Fund's net assets) |
|
| |
|
TOP HOLDINGS (% of Fund's net assets) | | |
| Boston Scientific Corp | 9.6 | |
| Eli Lilly & Co | 8.2 | |
| UnitedHealth Group Inc | 7.8 | |
| Danaher Corp | 6.4 | |
| Regeneron Pharmaceuticals Inc | 4.4 | |
| Merck & Co Inc | 3.9 | |
| Cigna Group/The | 3.4 | |
| Penumbra Inc | 3.1 | |
| Stryker Corp | 2.4 | |
| Insulet Corp | 2.2 | |
| | 51.4 | |
| |
How has the Fund changed?
This is a summary of certain changes to the Fund since August 1, 2023. For more complete information, you may review the Fund's next prospectus, which we expect to be available by September 28, 2024 at fundresearch.fidelity.com/prospectus/sec or upon request at 1-877-208-0098 or by sending an e-mail to fidfunddocuments@fidelity.com.
The fees associated with this class changed during the reporting year. The variations in class fees are primarily the result of the following changes: The fund's transfer agent and pricing & bookkeeping fees were changed to a fixed rate effective December 1, 2023, through February 29, 2024, in anticipation of the transition to a new management fee structure. Effective March 1, 2024, the fund's management contract was amended to incorporate administrative services previously covered under separate services agreements (transfer agent and pricing & bookkeeping). The amended contract incorporates a management fee rate that may vary by class. The Adviser or an affiliate pays certain expenses of managing and operating the fund out of each class's management fee. |
| Fidelity, the Fidelity Investments Logo and all other Fidelity trademarks or service marks used herein are trademarks or service marks of FMR LLC. Any third-party marks that are used herein are trademarks or service marks of their respective owners. © 2024 FMR LLC. All rights reserved. |
| | For additional information about the Fund; including its prospectus, financial information, holdings and proxy information, scan the QR code or visit fundresearch.fidelity.com/prospectus/sec 1.9913391.100 3294-TSRA-0924 |
| |
| | ANNUAL SHAREHOLDER REPORT | AS OF JULY 31, 2024 | This report describes changes to the Fund that occurred during the reporting period. |
| | Fidelity Advisor® Health Care Fund Fidelity Advisor® Health Care Fund Class A : FACDX |
| | | |
This annual shareholder report contains information about Fidelity Advisor® Health Care Fund for the period August 1, 2023 to July 31, 2024. You can find additional information about the Fund at fundresearch.fidelity.com/prospectus/sec. You can also request this information by contacting us at 1-877-208-0098 or by sending an e-mail to fidfunddocuments@fidelity.com.
What were your Fund costs for the last year?(based on hypothetical $10,000 investment)
FUND COST (PREVIOUS YEAR)
| | Costs of a $10,000 investment | Costs paid as a percentage of a $10,000 investment | |
| Class A | $ 100 | 0.96% | |
What affected the Fund's performance this period?
•U.S. equities gained for the 12 months ending July 31, 2024, driven by resilient corporate profits, a frenzy over generative artificial intelligence and the Federal Reserve's likely pivot to cutting interest rates later this year.
•Against this backdrop, security selection and market selection were the primary detractors to the fund's performance versus the benchmark, led by health care services. Also hurting the fund's relative result was security selection in health care facilities and biotechnology.
•The largest individual relative detractor was an overweight in Penumbra (-45%), which was among our biggest holdings. It also hurt to overweight agilon health (-64%) and 10X Genomics (-67%). This period we decreased our position in agilon.
•In contrast, the biggest contributor to performance versus the sector index was security selection in pharmaceuticals. Stock picks in health care equipment also boosted relative performance.
•The top individual relative contributor was an overweight in Boston Scientific (+42%). The stock was the fund's largest holding, even though we decreased the fund's stake this period. It also helped to avoid index components Johnson & Johnson (-3%) and Pfizer (-10%).
•Notable changes in positioning include decreased exposure to the life sciences tools & services industry and a higher allocation to biotechnology.
How did the Fund perform over the past 10 years?
CUMULATIVE PERFORMANCE
July 31, 2014 through July 31, 2024.
Initial investment of $10,000 and the current sales charge was paid.
Class A | $9,425 | $12,636 | $11,395 | $12,474 | $14,945 | $15,374 | $19,141 | $23,102 | $20,352 | $21,109 | $22,519 |
MSCI U.S. IMI Health Care 25-50 Index | $10,000 | $13,063 | $12,726 | $13,917 | $16,068 | $16,693 | $19,997 | $25,628 | $24,807 | $25,460 | $28,709 |
S&P 500® Index | $10,000 | $11,121 | $11,745 | $13,629 | $15,843 | $17,108 | $19,153 | $26,134 | $24,921 | $28,165 | $34,403 |
| | 2014 | 2015 | 2016 | 2017 | 2018 | 2019 | 2020 | 2021 | 2022 | 2023 | 2024 |
AVERAGE ANNUAL TOTAL RETURNS: | | 1 Year | 5 Year | 10 Year |
| Class A (incl. 5.75% sales charge) | 0.55% | 6.66% | 8.46% |
| Class A (without 5.75% sales charge) | 6.68% | 7.93% | 9.10% |
| MSCI U.S. IMI Health Care 25-50 Index | 12.76% | 11.45% | 11.12% |
| S&P 500® Index | 22.15% | 15.00% | 13.15% |
Visit institutional.fidelity.com for more recent performance information. |
The Fund's past performance is not a good predictor of the Fund's future performance. The graph and table do not reflect the deduction of taxes that a shareholder would pay on fund distributions or redemption of fund shares. |
Key Fund Statistics (as of July 31, 2024)
KEY FACTS | | |
| Fund Size | $4,615,583,149 | |
| Number of Holdings | 103 | |
| Total Advisory Fee | $27,914,465 | |
| Portfolio Turnover | 37% | |
What did the Fund invest in?
(as of July 31, 2024)
TOP INDUSTRIES (% of Fund's net assets) |
| Biotechnology | 24.4 | |
| Health Care Equipment & Supplies | 23.5 | |
| Health Care Providers & Services | 21.8 | |
| Pharmaceuticals | 16.6 | |
| Life Sciences Tools & Services | 10.9 | |
| Health Care Technology | 2.0 | |
| Financial Services | 0.2 | |
| |
| Common Stocks | 97.9 |
| Preferred Stocks | 1.5 |
| Preferred Securities | 0.2 |
| Bonds | 0.1 |
| Short-Term Investments and Net Other Assets (Liabilities) | 0.3 |
ASSET ALLOCATION (% of Fund's net assets) |
|
|
| United States | 91.5 |
| Netherlands | 3.0 |
| United Kingdom | 1.7 |
| Denmark | 1.5 |
| Belgium | 1.3 |
| Canada | 0.9 |
| Israel | 0.1 |
| China | 0.0 |
GEOGRAPHIC DIVERSIFICATION (% of Fund's net assets) |
|
| |
|
TOP HOLDINGS (% of Fund's net assets) | | |
| Boston Scientific Corp | 9.6 | |
| Eli Lilly & Co | 8.2 | |
| UnitedHealth Group Inc | 7.8 | |
| Danaher Corp | 6.4 | |
| Regeneron Pharmaceuticals Inc | 4.4 | |
| Merck & Co Inc | 3.9 | |
| Cigna Group/The | 3.4 | |
| Penumbra Inc | 3.1 | |
| Stryker Corp | 2.4 | |
| Insulet Corp | 2.2 | |
| | 51.4 | |
| |
How has the Fund changed?
This is a summary of certain changes to the Fund since August 1, 2023. For more complete information, you may review the Fund's next prospectus, which we expect to be available by September 28, 2024 at fundresearch.fidelity.com/prospectus/sec or upon request at 1-877-208-0098 or by sending an e-mail to fidfunddocuments@fidelity.com.
The fund's transfer agent and pricing & bookkeeping fees were changed to a fixed rate effective December 1, 2023, through February 29, 2024, in anticipation of the transition to a new management fee structure. Effective March 1, 2024, the fund's management contract was amended to incorporate administrative services previously covered under separate services agreements (transfer agent and pricing & bookkeeping). The amended contract incorporates a management fee rate that may vary by class. The Adviser or an affiliate pays certain expenses of managing and operating the fund out of each class's management fee. | |
| Fidelity, the Fidelity Investments Logo and all other Fidelity trademarks or service marks used herein are trademarks or service marks of FMR LLC. Any third-party marks that are used herein are trademarks or service marks of their respective owners. © 2024 FMR LLC. All rights reserved. |
| | For additional information about the Fund; including its prospectus, financial information, holdings and proxy information, scan the QR code or visit fundresearch.fidelity.com/prospectus/sec 1.9913387.100 177-TSRA-0924 |
| |
| | ANNUAL SHAREHOLDER REPORT | AS OF JULY 31, 2024 | This report describes changes to the Fund that occurred during the reporting period. |
| | Fidelity Advisor® Real Estate Fund Fidelity Advisor® Real Estate Fund Class Z : FIKJX |
| | | |
This annual shareholder report contains information about Fidelity Advisor® Real Estate Fund for the period August 1, 2023 to July 31, 2024. You can find additional information about the Fund at fundresearch.fidelity.com/prospectus/sec. You can also request this information by contacting us at 1-877-208-0098 or by sending an e-mail to fidfunddocuments@fidelity.com.
What were your Fund costs for the last year?(based on hypothetical $10,000 investment)
FUND COST (PREVIOUS YEAR)
| | Costs of a $10,000 investment | Costs paid as a percentage of a $10,000 investment | |
| Class Z | $ 67 | 0.64% | |
What affected the Fund's performance this period?
•U.S. equities gained for the 12 months ending July 31, 2024, driven by resilient corporate profits, a frenzy over generative artificial intelligence and the Federal Reserve's likely pivot to cutting interest rates later this year.
•Against this backdrop, security selection and industry positioning were the primary detractors from the fund's performance versus the MSCI US IMI Real Estate 25/50 Linked Index for the fiscal year, especially "other specialized" real estate investment trusts. Subpar picks and outsized exposure to the industrial and multi-family residential industries hurt as well.
•The biggest individual relative detractor this period was avoiding Iron Mountain, an index component that gained 73%. Similarly, not owning Simon Property Group, an index component that rose about 30%, proved detrimental to performance as well. An overweight stake in Americold Realty Trust (-4%) was another challenge, though we increased our investment in the stock this period.
•In contrast, the biggest contributor to performance versus the real estate index was stock selection among real estate services firms. Picks in health care also boosted the fund's relative performance. An undersized stake in timber REITs was another plus.
•The top individual relative contributor was an outsized stake in CBRE Group (+35%). The company was one of the fund's largest holdings. Avoiding shares of Realty Income, an index component that returned about -1%, aided performance as well. Not owning Weyerhaeuser, an index component that returned -4%, also proved advantageous.
•Notable changes in positioning include increased exposure to the retail industry and a lower allocation to other specialized REITs.
How did the Fund perform over the life of Fund?
CUMULATIVE PERFORMANCE
October 2, 2018 through July 31, 2024.
Initial investment of $10,000.
Class Z | $10,000 | $11,122 | $10,366 | $13,574 | $12,867 | $11,413 | $12,622 |
MSCI US IMI Real Estate 25/50 Linked Index | $10,000 | $11,209 | $9,382 | $12,693 | $12,155 | $10,981 | $12,159 |
S&P 500® Index | $10,000 | $10,365 | $11,604 | $15,833 | $15,098 | $17,064 | $20,843 |
| | 2018 | 2019 | 2020 | 2021 | 2022 | 2023 | 2024 |
AVERAGE ANNUAL TOTAL RETURNS: | | 1 Year | 5 Year | Life of Fund A |
| Class Z | 10.60% | 2.56% | 4.07% |
| MSCI US IMI Real Estate 25/50 Linked Index | 10.73% | 1.64% | 3.41% |
| S&P 500® Index | 22.15% | 15.00% | 13.42% |
A From October 2, 2018
Visit institutional.fidelity.com for more recent performance information. |
The Fund's past performance is not a good predictor of the Fund's future performance. The graph and table do not reflect the deduction of taxes that a shareholder would pay on fund distributions or redemption of fund shares. |
Key Fund Statistics (as of July 31, 2024)
KEY FACTS | | |
| Fund Size | $237,005,518 | |
| Number of Holdings | 35 | |
| Total Advisory Fee | $1,374,363 | |
| Portfolio Turnover | 24% | |
What did the Fund invest in?
(as of July 31, 2024)
TOP INDUSTRIES (% of Fund's net assets) |
| Specialized REITs | 37.6 | |
| Industrial REITs | 16.2 | |
| Residential REITs | 14.2 | |
| Retail REITs | 10.8 | |
| Health Care REITs | 9.1 | |
| Real Estate Management & Development | 7.7 | |
| Hotel & Resort REITs | 2.5 | |
| Office REITs | 1.2 | |
| |
| Common Stocks | 99.3 |
| Short-Term Investments and Net Other Assets (Liabilities) | 0.7 |
ASSET ALLOCATION (% of Fund's net assets) |
|
|
GEOGRAPHIC DIVERSIFICATION (% of Fund's net assets) |
|
| |
|
TOP HOLDINGS (% of Fund's net assets) | | |
| Prologis Inc | 9.6 | |
| Equinix Inc | 7.8 | |
| Crown Castle Inc | 7.5 | |
| CBRE Group Inc Class A | 6.3 | |
| American Tower Corp | 5.9 | |
| Ventas Inc | 5.8 | |
| CubeSmart | 5.4 | |
| Digital Realty Trust Inc | 3.5 | |
| Welltower Inc | 3.3 | |
| Mid-America Apartment Communities Inc | 3.3 | |
| | 58.4 | |
| |
How has the Fund changed?
This is a summary of certain changes to the Fund since August 1, 2023. For more complete information, you may review the Fund's next prospectus, which we expect to be available by September 28, 2024 at fundresearch.fidelity.com/prospectus/sec or upon request at 1-877-208-0098 or by sending an e-mail to fidfunddocuments@fidelity.com.
The fund's transfer agent and pricing & bookkeeping fees were changed to a fixed rate effective December 1, 2023, through February 29, 2024, in anticipation of the transition to a new management fee structure. Effective March 1, 2024, the fund's management contract was amended to incorporate administrative services previously covered under separate services agreements (transfer agent and pricing & bookkeeping). The amended contract incorporates a management fee rate that may vary by class. The Adviser or an affiliate pays certain expenses of managing and operating the fund out of each class's management fee. | |
| Fidelity, the Fidelity Investments Logo and all other Fidelity trademarks or service marks used herein are trademarks or service marks of FMR LLC. Any third-party marks that are used herein are trademarks or service marks of their respective owners. © 2024 FMR LLC. All rights reserved. |
| | For additional information about the Fund; including its prospectus, financial information, holdings and proxy information, scan the QR code or visit fundresearch.fidelity.com/prospectus/sec 1.9913450.100 3299-TSRA-0924 |
| |
| | ANNUAL SHAREHOLDER REPORT | AS OF JULY 31, 2024 | This report describes changes to the Fund that occurred during the reporting period. |
| | Fidelity Advisor® Biotechnology Fund Fidelity Advisor® Biotechnology Fund Class I : FBTIX |
| | | |
This annual shareholder report contains information about Fidelity Advisor® Biotechnology Fund for the period August 1, 2023 to July 31, 2024. You can find additional information about the Fund at fundresearch.fidelity.com/prospectus/sec. You can also request this information by contacting us at 1-877-208-0098 or by sending an e-mail to fidfunddocuments@fidelity.com.
What were your Fund costs for the last year?(based on hypothetical $10,000 investment)
FUND COST (PREVIOUS YEAR)
| | Costs of a $10,000 investment | Costs paid as a percentage of a $10,000 investment | |
| Class I | $ 82 | 0.72% | |
What affected the Fund's performance this period?
•U.S. equities gained for the 12 months ending July 31, 2024, driven by resilient corporate profits, a frenzy over generative artificial intelligence and the Federal Reserve's likely pivot to cutting interest rates later this year.
•Against this backdrop, security selection was the primary contributor to the fund's performance versus the MSCI US IMI Biotechnology 25/50 Index for the fiscal year, led by biotechnology.
•The top individual relative contributor this period was avoiding Biogen, an index component that returned -21%. A non-index stake in Fusion Pharmaceuticals gained 544% and was the second-largest relative contributor. Another notable relative contributor was an underweight in Gilead Sciences (+4%). The stock was one of our top holdings this period, but it was not held on July 31.
•In contrast, the biggest detractor from performance versus the industry index was stock picking in pharmaceuticals.
•The fund's non-index stake in Ventyx Biosciences returned approximately -93% and was the biggest individual relative detractor. The stock was not held at period end. A second notable relative detractor was an underweight in Amgen (+46%). This was an investment we established this period. The company was one of our largest holdings. Another notable relative detractor was an overweight in Acelyrin (-73%).
•Notable changes in positioning include a lower allocation to pharmaceuticals.
How did the Fund perform over the past 10 years?
CUMULATIVE PERFORMANCE
July 31, 2014 through July 31, 2024.
Initial investment of $10,000.
Class I | $10,000 | $16,000 | $11,469 | $13,139 | $14,982 | $14,100 | $18,376 | $21,010 | $17,073 | $19,721 | $25,543 |
MSCI U.S. IMI Biotechnology 25-50 Index | $10,000 | $15,191 | $12,163 | $14,140 | $15,791 | $14,066 | $18,593 | $22,002 | $19,500 | $21,317 | $27,056 |
S&P 500® Index | $10,000 | $11,121 | $11,745 | $13,629 | $15,843 | $17,108 | $19,153 | $26,134 | $24,921 | $28,165 | $34,403 |
| | 2014 | 2015 | 2016 | 2017 | 2018 | 2019 | 2020 | 2021 | 2022 | 2023 | 2024 |
AVERAGE ANNUAL TOTAL RETURNS: | | 1 Year | 5 Year | 10 Year |
| Class I | 29.53% | 12.62% | 9.83% |
| MSCI U.S. IMI Biotechnology 25-50 Index | 26.92% | 13.98% | 10.47% |
| S&P 500® Index | 22.15% | 15.00% | 13.15% |
Visit institutional.fidelity.com for more recent performance information. |
The Fund's past performance is not a good predictor of the Fund's future performance. The graph and table do not reflect the deduction of taxes that a shareholder would pay on fund distributions or redemption of fund shares. |
Key Fund Statistics (as of July 31, 2024)
KEY FACTS | | |
| Fund Size | $1,812,183,981 | |
| Number of Holdings | 100 | |
| Total Advisory Fee | $9,501,787 | |
| Portfolio Turnover | 73% | |
What did the Fund invest in?
(as of July 31, 2024)
TOP INDUSTRIES (% of Fund's net assets) |
| Biotechnology | 92.6 | |
| Pharmaceuticals | 5.7 | |
| Financial Services | 0.2 | |
| Health Care Technology | 0.1 | |
| |
| Common Stocks | 96.8 |
| Preferred Stocks | 1.8 |
| Bonds | 0.0 |
| Short-Term Investments and Net Other Assets (Liabilities) | 1.4 |
ASSET ALLOCATION (% of Fund's net assets) |
|
|
| United States | 88.0 |
| Netherlands | 5.1 |
| Denmark | 3.5 |
| Canada | 1.3 |
| Belgium | 1.1 |
| United Kingdom | 1.0 |
GEOGRAPHIC DIVERSIFICATION (% of Fund's net assets) |
|
| |
|
TOP HOLDINGS (% of Fund's net assets) | | |
| Abbvie Inc | 18.3 | |
| Amgen Inc | 9.4 | |
| Regeneron Pharmaceuticals Inc | 7.0 | |
| Vertex Pharmaceuticals Inc | 4.7 | |
| Alnylam Pharmaceuticals Inc | 4.5 | |
| Argenx SE ADR | 3.8 | |
| Ascendis Pharma A/S ADR | 3.5 | |
| Vaxcyte Inc | 2.6 | |
| Cytokinetics Inc | 2.6 | |
| Viking Therapeutics Inc | 2.3 | |
| | 58.7 | |
| |
How has the Fund changed?
This is a summary of certain changes to the Fund since August 1, 2023. For more complete information, you may review the Fund's next prospectus, which we expect to be available by September 28, 2024 at fundresearch.fidelity.com/prospectus/sec or upon request at 1-877-208-0098 or by sending an e-mail to fidfunddocuments@fidelity.com.
The fund's transfer agent and pricing and bookkeeping fees were changed to a fixed rate effective December 1, 2023, through February 29, 2024, in anticipation of the transition to a new management fee structure. Effective March 1, 2024, the fund's management contract was amended to incorporate administrative services previously covered under separate services agreements (transfer agent and pricing and bookkeeping).The amended contract incorporates a management fee rate that may vary by class. The Adviser or an affiliate pays certain expenses of managing and operating the fund out of each class's management fee. | |
| Fidelity, the Fidelity Investments Logo and all other Fidelity trademarks or service marks used herein are trademarks or service marks of FMR LLC. Any third-party marks that are used herein are trademarks or service marks of their respective owners. © 2024 FMR LLC. All rights reserved. |
| | For additional information about the Fund; including its prospectus, financial information, holdings and proxy information, scan the QR code or visit fundresearch.fidelity.com/prospectus/sec 1.9913427.100 116-TSRA-0924 |
| |
| | ANNUAL SHAREHOLDER REPORT | AS OF JULY 31, 2024 | This report describes changes to the Fund that occurred during the reporting period. |
| | Fidelity Advisor® Technology Fund Fidelity Advisor® Technology Fund Class A : FADTX |
| | | |
This annual shareholder report contains information about Fidelity Advisor® Technology Fund for the period August 1, 2023 to July 31, 2024. You can find additional information about the Fund at fundresearch.fidelity.com/prospectus/sec. You can also request this information by contacting us at 1-877-208-0098 or by sending an e-mail to fidfunddocuments@fidelity.com.
What were your Fund costs for the last year?(based on hypothetical $10,000 investment)
FUND COST (PREVIOUS YEAR)
| | Costs of a $10,000 investment | Costs paid as a percentage of a $10,000 investment | |
| Class A | $ 107 | 0.95% | |
What affected the Fund's performance this period?
•U.S. equities gained for the 12 months ending July 31, 2024, driven by resilient corporate profits, a frenzy over generative artificial intelligence and the Federal Reserve's likely pivot to cutting interest rates later this year.
•Against this backdrop, industry positioning was the primary contributor to the fund's performance versus the MSCI US IMI Information Technology 25/50 Index for the fiscal year, led by an overweight in the outperforming semiconductors group. An underweight in technology hardware, storage & peripherals also boosted the fund's relative performance.
•The fund's top individual relative contributor was an overweight in Nvidia (+150%), which was the biggest holding at period end even though we reduced our stake. The second-largest relative contributor was an underweight position in Apple (+13%). Still, Apple was one of the fund's largest holdings. Our larger-than-index stake in Splunk (+36%) also contributed. Splunk was not held at period end.
•In contrast, the biggest detractor from the fund's performance versus the sector index was stock picking in semiconductors. An overweight in the lagging internet services & infrastructure group also hampered the fund's relative result.
•The fund's largest individual relative detractor was an overweight in onsemi (-28%). We increased the size of the position in onsemi, and it was one of our largest holdings as of July 31. The fund's second-largest relative detractor this period was avoiding Broadcom, an index component that gained 82%. A non-index stake in GlobalFoundries (-20%) also notably hurt, but we increased our holdings this period.
•Notable changes in positioning include decreased exposure to the application software and internet services & infrastructure industries.
How did the Fund perform over the past 10 years?
CUMULATIVE PERFORMANCE
July 31, 2014 through July 31, 2024.
Initial investment of $10,000 and the current sales charge was paid.
Class A | $9,425 | $10,456 | $11,278 | $15,772 | $19,783 | $21,219 | $31,580 | $45,729 | $38,057 | $49,667 | $63,121 |
MSCI U.S. IMI Information Technology 25-50 Index | $10,000 | $11,306 | $12,261 | $15,808 | $20,247 | $23,485 | $32,225 | $45,360 | $41,091 | $50,982 | $64,137 |
S&P 500® Index | $10,000 | $11,121 | $11,745 | $13,629 | $15,843 | $17,108 | $19,153 | $26,134 | $24,921 | $28,165 | $34,403 |
| | 2014 | 2015 | 2016 | 2017 | 2018 | 2019 | 2020 | 2021 | 2022 | 2023 | 2024 |
AVERAGE ANNUAL TOTAL RETURNS: | | 1 Year | 5 Year | 10 Year |
| Class A (incl. 5.75% sales charge) | 19.78% | 22.90% | 20.23% |
| Class A (without 5.75% sales charge) | 27.09% | 24.36% | 20.95% |
| MSCI U.S. IMI Information Technology 25-50 Index | 25.80% | 22.25% | 20.42% |
| S&P 500® Index | 22.15% | 15.00% | 13.15% |
Visit institutional.fidelity.com for more recent performance information. |
The Fund's past performance is not a good predictor of the Fund's future performance. The graph and table do not reflect the deduction of taxes that a shareholder would pay on fund distributions or redemption of fund shares. |
Key Fund Statistics (as of July 31, 2024)
KEY FACTS | | |
| Fund Size | $6,458,251,428 | |
| Number of Holdings | 89 | |
| Total Advisory Fee | $31,726,651 | |
| Portfolio Turnover | 34% | |
What did the Fund invest in?
(as of July 31, 2024)
TOP INDUSTRIES (% of Fund's net assets) |
| Semiconductors & Semiconductor Equipment | 41.8 | |
| Technology Hardware, Storage & Peripherals | 20.7 | |
| Software | 20.6 | |
| IT Services | 4.4 | |
| Communications Equipment | 2.5 | |
| Ground Transportation | 2.2 | |
| Broadline Retail | 1.5 | |
| Hotels, Restaurants & Leisure | 0.6 | |
| Entertainment | 0.5 | |
| Others | 0.9 | |
| |
| Common Stocks | 94.5 |
| Preferred Stocks | 1.2 |
| Preferred Securities | 0.0 |
| Bonds | 0.0 |
| Short-Term Investments and Net Other Assets (Liabilities) | 4.3 |
ASSET ALLOCATION (% of Fund's net assets) |
|
|
| United States | 91.2 |
| China | 4.5 |
| Taiwan | 2.0 |
| Netherlands | 1.2 |
| Canada | 1.0 |
| India | 0.1 |
| Korea (South) | 0.0 |
| Israel | 0.0 |
GEOGRAPHIC DIVERSIFICATION (% of Fund's net assets) |
|
| |
|
TOP HOLDINGS (% of Fund's net assets) | | |
| NVIDIA Corp | 20.1 | |
| Apple Inc | 19.2 | |
| Microsoft Corp | 10.7 | |
| NXP Semiconductors NV | 4.4 | |
| ON Semiconductor Corp | 4.4 | |
| Marvell Technology Inc | 3.9 | |
| Servicenow Inc | 3.6 | |
| Okta Inc Class A | 2.9 | |
| GlobalFoundries Inc | 2.8 | |
| Cisco Systems Inc | 2.5 | |
| | 74.5 | |
| |
How has the Fund changed?
This is a summary of certain changes to the Fund since August 1, 2023. For more complete information, you may review the Fund's next prospectus, which we expect to be available by September 28, 2024 at fundresearch.fidelity.com/prospectus/sec or upon request at 1-877-208-0098 or by sending an e-mail to fidfunddocuments@fidelity.com.
The fund's transfer agent and pricing and bookkeeping fees were changed to a fixed rate effective December 1, 2023, through February 29, 2024, in anticipation of the transition to a new management fee structure. Effective March 1, 2024, the fund's management contract was amended to incorporate administrative services previously covered under separate services agreements (transfer agent and pricing and bookkeeping).The amended contract incorporates a management fee rate that may vary by class. The Adviser or an affiliate pays certain expenses of managing and operating the fund out of each class's management fee. | |
| Fidelity, the Fidelity Investments Logo and all other Fidelity trademarks or service marks used herein are trademarks or service marks of FMR LLC. Any third-party marks that are used herein are trademarks or service marks of their respective owners. © 2024 FMR LLC. All rights reserved. |
| | For additional information about the Fund; including its prospectus, financial information, holdings and proxy information, scan the QR code or visit fundresearch.fidelity.com/prospectus/sec 1.9913412.100 187-TSRA-0924 |
| |
| | ANNUAL SHAREHOLDER REPORT | AS OF JULY 31, 2024 | This report describes changes to the Fund that occurred during the reporting period. |
| | Fidelity Advisor® Consumer Discretionary Fund Fidelity Advisor® Consumer Discretionary Fund Class C : FCECX |
| | | |
This annual shareholder report contains information about Fidelity Advisor® Consumer Discretionary Fund for the period August 1, 2023 to July 31, 2024. You can find additional information about the Fund at fundresearch.fidelity.com/prospectus/sec. You can also request this information by contacting us at 1-877-208-0098 or by sending an e-mail to fidfunddocuments@fidelity.com.
What were your Fund costs for the last year?(based on hypothetical $10,000 investment)
FUND COST (PREVIOUS YEAR)
| | Costs of a $10,000 investment | Costs paid as a percentage of a $10,000 investment | |
| Class C | $ 188 | 1.76% | |
What affected the Fund's performance this period?
•U.S. equities gained for the 12 months ending July 31, 2024, driven by resilient corporate profits, a frenzy over generative artificial intelligence and the Federal Reserve's likely pivot to cutting interest rates later this year.
•Against this backdrop, security selection was the primary contributor to the fund's performance versus the benchmark for the fiscal year, led by hotels, resorts & cruise lines. Stock picking in footwear also boosted the fund's relative performance.
•The top individual relative contributor was an overweight in Dick's Sporting Goods (+56%). The stock was among the fund's largest holdings, though we decreased our stake this period. The second-largest relative contributor was an overweight in Williams-Sonoma (+129%). Another notable relative contributor was an overweight in Deckers Outdoor (+67%), and we decreased our holdings in the company.
•In contrast, the biggest detractors from performance versus the sector index were stock picks and an overweight in automotive parts & equipment. Stock selection in consumer staples merchandise retail also hampered the fund's relative result.
•The largest individual relative detractor was an overweight in Aptiv (-37%). The company was one of our biggest holdings at period end. A stake in Dollar Tree returned approximately -34% and was a second notable relative detractor. This period we decreased our position in Dollar Tree. An overweight in Five Below (-62%) also detracted. This was a position we established this period.
•Notable changes in positioning include increased exposure to the other specialty retail industry and a lower allocation to footwear.
How did the Fund perform over the past 10 years?
CUMULATIVE PERFORMANCE
July 31, 2014 through July 31, 2024.
Initial investment of $10,000.
Class C | $10,000 | $12,137 | $12,002 | $13,092 | $15,998 | $16,962 | $19,529 | $26,688 | $21,648 | $24,276 | $27,562 |
MSCI U.S. IMI Consumer Discretionary 25-50 Index | $10,000 | $12,215 | $12,366 | $14,162 | $17,199 | $18,581 | $22,632 | $33,278 | $28,694 | $31,608 | $35,092 |
S&P 500® Index | $10,000 | $11,121 | $11,745 | $13,629 | $15,843 | $17,108 | $19,153 | $26,134 | $24,921 | $28,165 | $34,403 |
| | 2014 | 2015 | 2016 | 2017 | 2018 | 2019 | 2020 | 2021 | 2022 | 2023 | 2024 |
AVERAGE ANNUAL TOTAL RETURNS: | | 1 Year | 5 Year | 10 Year |
| Class C (incl. contingent deferred sales charge) | 11.70% | 9.87% | 10.67% |
| Class C | 12.70% | 9.87% | 10.67% |
| MSCI U.S. IMI Consumer Discretionary 25-50 Index | 11.02% | 13.56% | 13.38% |
| S&P 500® Index | 22.15% | 15.00% | 13.15% |
Visit institutional.fidelity.com for more recent performance information. |
The Fund's past performance is not a good predictor of the Fund's future performance. The graph and table do not reflect the deduction of taxes that a shareholder would pay on fund distributions or redemption of fund shares. |
Key Fund Statistics (as of July 31, 2024)
KEY FACTS | | |
| Fund Size | $475,554,258 | |
| Number of Holdings | 60 | |
| Total Advisory Fee | $2,742,271 | |
| Portfolio Turnover | 25% | |
What did the Fund invest in?
(as of July 31, 2024)
TOP INDUSTRIES (% of Fund's net assets) |
| Broadline Retail | 25.9 | |
| Specialty Retail | 23.6 | |
| Hotels, Restaurants & Leisure | 18.7 | |
| Automobiles | 12.5 | |
| Textiles, Apparel & Luxury Goods | 8.0 | |
| Household Durables | 5.7 | |
| Automobile Components | 3.1 | |
| Consumer Staples Distribution & Retail | 1.1 | |
| Building Products | 0.8 | |
| Others | 0.7 | |
| |
ASSET ALLOCATION (% of Fund's net assets) |
|
| Short-Term Investments and Net Other Assets (Liabilities) - (0.1)% |
|
| United States | 96.1 |
| Canada | 2.3 |
| Brazil | 0.7 |
| France | 0.3 |
| United Kingdom | 0.3 |
| Switzerland | 0.3 |
GEOGRAPHIC DIVERSIFICATION (% of Fund's net assets) |
|
| |
|
TOP HOLDINGS (% of Fund's net assets) | | |
| Amazon.com Inc | 23.9 | |
| Tesla Inc | 10.8 | |
| Home Depot Inc/The | 5.0 | |
| Lowe's Cos Inc | 4.8 | |
| TJX Cos Inc/The | 3.8 | |
| Hilton Worldwide Holdings Inc | 3.2 | |
| Dick's Sporting Goods Inc | 2.4 | |
| McDonald's Corp | 2.4 | |
| Booking Holdings Inc | 2.1 | |
| Aptiv PLC | 2.1 | |
| | 60.5 | |
| |
How has the Fund changed?
This is a summary of certain changes to the Fund since August 1, 2023. For more complete information, you may review the Fund's next prospectus, which we expect to be available by September 28, 2024 at fundresearch.fidelity.com/prospectus/sec or upon request at 1-877-208-0098 or by sending an e-mail to fidfunddocuments@fidelity.com.
| The fund's transfer agent and pricing & bookkeeping fees were changed to a fixed rate effective December 1, 2023, through February 29, 2024, in anticipation of the transition to a new management fee structure. Effective March 1, 2024, the fund's management contract was amended to incorporate administrative services previously covered under separate services agreements (transfer agent and pricing & bookkeeping). The amended contract incorporates a management fee rate that may vary by class. The Adviser or an affiliate pays certain expenses of managing and operating the fund out of each class's management fee. |
| Fidelity, the Fidelity Investments Logo and all other Fidelity trademarks or service marks used herein are trademarks or service marks of FMR LLC. Any third-party marks that are used herein are trademarks or service marks of their respective owners. © 2024 FMR LLC. All rights reserved. |
| | For additional information about the Fund; including its prospectus, financial information, holdings and proxy information, scan the QR code or visit fundresearch.fidelity.com/prospectus/sec 1.9913405.100 282-TSRA-0924 |
| |
| | ANNUAL SHAREHOLDER REPORT | AS OF JULY 31, 2024 | This report describes changes to the Fund that occurred during the reporting period. |
| | Fidelity Advisor® Energy Fund Fidelity Advisor® Energy Fund Class Z : FIKAX |
| | | |
This annual shareholder report contains information about Fidelity Advisor® Energy Fund for the period August 1, 2023 to July 31, 2024. You can find additional information about the Fund at fundresearch.fidelity.com/prospectus/sec. You can also request this information by contacting us at 1-877-208-0098 or by sending an e-mail to fidfunddocuments@fidelity.com.
What were your Fund costs for the last year?(based on hypothetical $10,000 investment)
FUND COST (PREVIOUS YEAR)
| | Costs of a $10,000 investment | Costs paid as a percentage of a $10,000 investment | |
| Class Z | $ 63 | 0.59% | |
What affected the Fund's performance this period?
•U.S. equities gained for the 12 months ending July 31, 2024, driven by resilient corporate profits, a frenzy over generative artificial intelligence and the Federal Reserve's likely pivot to cutting interest rates later this year.
•Against this backdrop, security selection was the primary contributor to the fund's performance versus the MSCI U.S. IMI Energy 25/50 Index for the fiscal year, led by oil & gas exploration & production. Stock picks in integrated oil & gas and independent power producers & energy traders also boosted the fund's relative performance.
•The top individual relative contributor was an overweight in TechnipFMC (+62%). We pared our stake in TechnipFMC. The second-largest relative contributor was an underweight in Chevron (+2%). The stock was one of the fund's largest holdings even though we reduced the position this period. Another notable relative contributor was our non-index stake in Vistra (+186%).
•In contrast, the biggest detractors from performance versus the sector index were security selection and an underweight in oil & gas storage & transportation. Also hurting our relative result were overweights in oil & gas drilling and oil & gas equipment & services.
•Not owning Targa Resources, an index component that gained 69%, was the fund's biggest individual relative detractor. Not owning Williams Companies, an index component that gained 31%, was the fund's second-largest relative detractor. Another notable relative detractor this period was avoiding ONEOK, an index component that gained about 30%.
•Notable changes in positioning include increased exposure to the oil & gas drilling industry and a lower allocation to oil & gas exploration & production.
How did the Fund perform over the life of Fund?
CUMULATIVE PERFORMANCE
October 2, 2018 through July 31, 2024.
Initial investment of $10,000.
Class Z | $10,000 | $7,566 | $4,598 | $6,781 | $11,652 | $13,563 | $15,178 |
MSCI U.S. IMI Energy 25-50 Index | $10,000 | $7,981 | $4,842 | $7,269 | $12,046 | $13,985 | $15,431 |
S&P 500® Index | $10,000 | $10,365 | $11,604 | $15,833 | $15,098 | $17,064 | $20,843 |
| | 2018 | 2019 | 2020 | 2021 | 2022 | 2023 | 2024 |
AVERAGE ANNUAL TOTAL RETURNS: | | 1 Year | 5 Year | Life of Fund A |
| Class Z | 11.90% | 14.94% | 7.42% |
| MSCI U.S. IMI Energy 25-50 Index | 10.33% | 14.09% | 7.72% |
| S&P 500® Index | 22.15% | 15.00% | 13.42% |
A From October 2, 2018
Visit institutional.fidelity.com for more recent performance information. |
The Fund's past performance is not a good predictor of the Fund's future performance. The graph and table do not reflect the deduction of taxes that a shareholder would pay on fund distributions or redemption of fund shares. |
Key Fund Statistics (as of July 31, 2024)
KEY FACTS | | |
| Fund Size | $1,311,457,602 | |
| Number of Holdings | 43 | |
| Total Advisory Fee | $7,393,032 | |
| Portfolio Turnover | 31% | |
What did the Fund invest in?
(as of July 31, 2024)
TOP INDUSTRIES (% of Fund's net assets) |
| Oil, Gas & Consumable Fuels | 81.1 | |
| Energy Equipment & Services | 16.3 | |
| Independent Power and Renewable Electricity Producers | 1.4 | |
| Machinery | 1.0 | |
| |
| Common Stocks | 99.8 |
| Short-Term Investments and Net Other Assets (Liabilities) | 0.2 |
ASSET ALLOCATION (% of Fund's net assets) |
|
|
| United States | 82.6 |
| Canada | 13.4 |
| United Kingdom | 3.3 |
| Norway | 0.3 |
| Cameroon | 0.2 |
| France | 0.1 |
| United Arab Emirates | 0.1 |
GEOGRAPHIC DIVERSIFICATION (% of Fund's net assets) |
|
| |
|
TOP HOLDINGS (% of Fund's net assets) | | |
| Exxon Mobil Corp | 24.8 | |
| Cenovus Energy Inc | 6.2 | |
| Schlumberger NV | 5.4 | |
| Chevron Corp | 4.8 | |
| Marathon Petroleum Corp | 4.8 | |
| Canadian Natural Resources Ltd | 4.5 | |
| Valero Energy Corp | 3.9 | |
| Cheniere Energy Inc | 3.9 | |
| Occidental Petroleum Corp | 3.8 | |
| Hess Corp | 3.4 | |
| | 65.5 | |
| |
How has the Fund changed?
This is a summary of certain changes to the Fund since August 1, 2023. For more complete information, you may review the Fund's next prospectus, which we expect to be available by September 28, 2024 at fundresearch.fidelity.com/prospectus/sec or upon request at 1-877-208-0098 or by sending an e-mail to fidfunddocuments@fidelity.com.
The fund's transfer agent and pricing & bookkeeping fees were changed to a fixed rate effective December 1, 2023, through February 29, 2024, in anticipation of the transition to a new management fee structure. Effective March 1, 2024, the fund's management contract was amended to incorporate administrative services previously covered under separate services agreements (transfer agent and pricing & bookkeeping). The amended contract incorporates a management fee rate that may vary by class. The Adviser or an affiliate pays certain expenses of managing and operating the fund out of each class's management fee. | |
| Fidelity, the Fidelity Investments Logo and all other Fidelity trademarks or service marks used herein are trademarks or service marks of FMR LLC. Any third-party marks that are used herein are trademarks or service marks of their respective owners. © 2024 FMR LLC. All rights reserved. |
| | For additional information about the Fund; including its prospectus, financial information, holdings and proxy information, scan the QR code or visit fundresearch.fidelity.com/prospectus/sec 1.9913419.100 3292-TSRA-0924 |
| |
| | ANNUAL SHAREHOLDER REPORT | AS OF JULY 31, 2024 | This report describes changes to the Fund that occurred during the reporting period. |
| | Fidelity Advisor® Energy Fund Fidelity Advisor® Energy Fund Class I : FANIX |
| | | |
This annual shareholder report contains information about Fidelity Advisor® Energy Fund for the period August 1, 2023 to July 31, 2024. You can find additional information about the Fund at fundresearch.fidelity.com/prospectus/sec. You can also request this information by contacting us at 1-877-208-0098 or by sending an e-mail to fidfunddocuments@fidelity.com.
What were your Fund costs for the last year?(based on hypothetical $10,000 investment)
FUND COST (PREVIOUS YEAR)
| | Costs of a $10,000 investment | Costs paid as a percentage of a $10,000 investment | |
| Class I | $ 76 | 0.72% | |
What affected the Fund's performance this period?
•U.S. equities gained for the 12 months ending July 31, 2024, driven by resilient corporate profits, a frenzy over generative artificial intelligence and the Federal Reserve's likely pivot to cutting interest rates later this year.
•Against this backdrop, security selection was the primary contributor to the fund's performance versus the MSCI U.S. IMI Energy 25/50 Index for the fiscal year, led by oil & gas exploration & production. Stock picks in integrated oil & gas and independent power producers & energy traders also boosted the fund's relative performance.
•The top individual relative contributor was an overweight in TechnipFMC (+62%). We pared our stake in TechnipFMC. The second-largest relative contributor was an underweight in Chevron (+2%). The stock was one of the fund's largest holdings even though we reduced the position this period. Another notable relative contributor was our non-index stake in Vistra (+186%).
•In contrast, the biggest detractors from performance versus the sector index were security selection and an underweight in oil & gas storage & transportation. Also hurting our relative result were overweights in oil & gas drilling and oil & gas equipment & services.
•Not owning Targa Resources, an index component that gained 69%, was the fund's biggest individual relative detractor. Not owning Williams Companies, an index component that gained 31%, was the fund's second-largest relative detractor. Another notable relative detractor this period was avoiding ONEOK, an index component that gained about 30%.
•Notable changes in positioning include increased exposure to the oil & gas drilling industry and a lower allocation to oil & gas exploration & production.
How did the Fund perform over the past 10 years?
CUMULATIVE PERFORMANCE
July 31, 2014 through July 31, 2024.
Initial investment of $10,000.
Class I | $10,000 | $7,127 | $7,234 | $7,172 | $8,924 | $6,707 | $4,069 | $5,992 | $10,284 | $11,955 | $13,358 |
MSCI U.S. IMI Energy 25-50 Index | $10,000 | $7,208 | $7,220 | $7,200 | $8,707 | $7,019 | $4,258 | $6,393 | $10,594 | $12,299 | $13,570 |
S&P 500® Index | $10,000 | $11,121 | $11,745 | $13,629 | $15,843 | $17,108 | $19,153 | $26,134 | $24,921 | $28,165 | $34,403 |
| | 2014 | 2015 | 2016 | 2017 | 2018 | 2019 | 2020 | 2021 | 2022 | 2023 | 2024 |
AVERAGE ANNUAL TOTAL RETURNS: | | 1 Year | 5 Year | 10 Year |
| Class I | 11.73% | 14.77% | 2.94% |
| MSCI U.S. IMI Energy 25-50 Index | 10.33% | 14.09% | 3.10% |
| S&P 500® Index | 22.15% | 15.00% | 13.15% |
Visit institutional.fidelity.com for more recent performance information. |
The Fund's past performance is not a good predictor of the Fund's future performance. The graph and table do not reflect the deduction of taxes that a shareholder would pay on fund distributions or redemption of fund shares. |
Key Fund Statistics (as of July 31, 2024)
KEY FACTS | | |
| Fund Size | $1,311,457,602 | |
| Number of Holdings | 43 | |
| Total Advisory Fee | $7,393,032 | |
| Portfolio Turnover | 31% | |
What did the Fund invest in?
(as of July 31, 2024)
TOP INDUSTRIES (% of Fund's net assets) |
| Oil, Gas & Consumable Fuels | 81.1 | |
| Energy Equipment & Services | 16.3 | |
| Independent Power and Renewable Electricity Producers | 1.4 | |
| Machinery | 1.0 | |
| |
| Common Stocks | 99.8 |
| Short-Term Investments and Net Other Assets (Liabilities) | 0.2 |
ASSET ALLOCATION (% of Fund's net assets) |
|
|
| United States | 82.6 |
| Canada | 13.4 |
| United Kingdom | 3.3 |
| Norway | 0.3 |
| Cameroon | 0.2 |
| France | 0.1 |
| United Arab Emirates | 0.1 |
GEOGRAPHIC DIVERSIFICATION (% of Fund's net assets) |
|
| |
|
TOP HOLDINGS (% of Fund's net assets) | | |
| Exxon Mobil Corp | 24.8 | |
| Cenovus Energy Inc | 6.2 | |
| Schlumberger NV | 5.4 | |
| Chevron Corp | 4.8 | |
| Marathon Petroleum Corp | 4.8 | |
| Canadian Natural Resources Ltd | 4.5 | |
| Valero Energy Corp | 3.9 | |
| Cheniere Energy Inc | 3.9 | |
| Occidental Petroleum Corp | 3.8 | |
| Hess Corp | 3.4 | |
| | 65.5 | |
| |
How has the Fund changed?
This is a summary of certain changes to the Fund since August 1, 2023. For more complete information, you may review the Fund's next prospectus, which we expect to be available by September 28, 2024 at fundresearch.fidelity.com/prospectus/sec or upon request at 1-877-208-0098 or by sending an e-mail to fidfunddocuments@fidelity.com.
The fund's transfer agent and pricing & bookkeeping fees were changed to a fixed rate effective December 1, 2023, through February 29, 2024, in anticipation of the transition to a new management fee structure. Effective March 1, 2024, the fund's management contract was amended to incorporate administrative services previously covered under separate services agreements (transfer agent and pricing & bookkeeping). The amended contract incorporates a management fee rate that may vary by class. The Adviser or an affiliate pays certain expenses of managing and operating the fund out of each class's management fee. | |
| Fidelity, the Fidelity Investments Logo and all other Fidelity trademarks or service marks used herein are trademarks or service marks of FMR LLC. Any third-party marks that are used herein are trademarks or service marks of their respective owners. © 2024 FMR LLC. All rights reserved. |
| | For additional information about the Fund; including its prospectus, financial information, holdings and proxy information, scan the QR code or visit fundresearch.fidelity.com/prospectus/sec 1.9913421.100 686-TSRA-0924 |
| |
| | ANNUAL SHAREHOLDER REPORT | AS OF JULY 31, 2024 | This report describes changes to the Fund that occurred during the reporting period. |
| | Fidelity Advisor® Consumer Discretionary Fund Fidelity Advisor® Consumer Discretionary Fund Class A : FCNAX |
| | | |
This annual shareholder report contains information about Fidelity Advisor® Consumer Discretionary Fund for the period August 1, 2023 to July 31, 2024. You can find additional information about the Fund at fundresearch.fidelity.com/prospectus/sec. You can also request this information by contacting us at 1-877-208-0098 or by sending an e-mail to fidfunddocuments@fidelity.com.
What were your Fund costs for the last year?(based on hypothetical $10,000 investment)
FUND COST (PREVIOUS YEAR)
| | Costs of a $10,000 investment | Costs paid as a percentage of a $10,000 investment | |
| Class A | $ 107 | 1.00% | |
What affected the Fund's performance this period?
•U.S. equities gained for the 12 months ending July 31, 2024, driven by resilient corporate profits, a frenzy over generative artificial intelligence and the Federal Reserve's likely pivot to cutting interest rates later this year.
•Against this backdrop, security selection was the primary contributor to the fund's performance versus the benchmark for the fiscal year, led by hotels, resorts & cruise lines. Stock picking in footwear also boosted the fund's relative performance.
•The top individual relative contributor was an overweight in Dick's Sporting Goods (+56%). The stock was among the fund's largest holdings, though we decreased our stake this period. The second-largest relative contributor was an overweight in Williams-Sonoma (+129%). Another notable relative contributor was an overweight in Deckers Outdoor (+67%), and we decreased our holdings in the company.
•In contrast, the biggest detractors from performance versus the sector index were stock picks and an overweight in automotive parts & equipment. Stock selection in consumer staples merchandise retail also hampered the fund's relative result.
•The largest individual relative detractor was an overweight in Aptiv (-37%). The company was one of our biggest holdings at period end. A stake in Dollar Tree returned approximately -34% and was a second notable relative detractor. This period we decreased our position in Dollar Tree. An overweight in Five Below (-62%) also detracted. This was a position we established this period.
•Notable changes in positioning include increased exposure to the other specialty retail industry and a lower allocation to footwear.
How did the Fund perform over the past 10 years?
CUMULATIVE PERFORMANCE
July 31, 2014 through July 31, 2024.
Initial investment of $10,000 and the current sales charge was paid.
Class A | $9,425 | $11,523 | $11,479 | $12,618 | $15,536 | $16,593 | $19,253 | $26,507 | $21,668 | $24,298 | $27,587 |
MSCI U.S. IMI Consumer Discretionary 25-50 Index | $10,000 | $12,215 | $12,366 | $14,162 | $17,199 | $18,581 | $22,632 | $33,278 | $28,694 | $31,608 | $35,092 |
S&P 500® Index | $10,000 | $11,121 | $11,745 | $13,629 | $15,843 | $17,108 | $19,153 | $26,134 | $24,921 | $28,165 | $34,403 |
| | 2014 | 2015 | 2016 | 2017 | 2018 | 2019 | 2020 | 2021 | 2022 | 2023 | 2024 |
AVERAGE ANNUAL TOTAL RETURNS: | | 1 Year | 5 Year | 10 Year |
| Class A (incl. 5.75% sales charge) | 7.01% | 9.40% | 10.68% |
| Class A (without 5.75% sales charge) | 13.54% | 10.70% | 11.34% |
| MSCI U.S. IMI Consumer Discretionary 25-50 Index | 11.02% | 13.56% | 13.38% |
| S&P 500® Index | 22.15% | 15.00% | 13.15% |
Visit institutional.fidelity.com for more recent performance information. |
The Fund's past performance is not a good predictor of the Fund's future performance. The graph and table do not reflect the deduction of taxes that a shareholder would pay on fund distributions or redemption of fund shares. |
Key Fund Statistics (as of July 31, 2024)
KEY FACTS | | |
| Fund Size | $475,554,258 | |
| Number of Holdings | 60 | |
| Total Advisory Fee | $2,742,271 | |
| Portfolio Turnover | 25% | |
What did the Fund invest in?
(as of July 31, 2024)
TOP INDUSTRIES (% of Fund's net assets) |
| Broadline Retail | 25.9 | |
| Specialty Retail | 23.6 | |
| Hotels, Restaurants & Leisure | 18.7 | |
| Automobiles | 12.5 | |
| Textiles, Apparel & Luxury Goods | 8.0 | |
| Household Durables | 5.7 | |
| Automobile Components | 3.1 | |
| Consumer Staples Distribution & Retail | 1.1 | |
| Building Products | 0.8 | |
| Others | 0.7 | |
| |
ASSET ALLOCATION (% of Fund's net assets) |
|
| Short-Term Investments and Net Other Assets (Liabilities) - (0.1)% |
|
| United States | 96.1 |
| Canada | 2.3 |
| Brazil | 0.7 |
| France | 0.3 |
| United Kingdom | 0.3 |
| Switzerland | 0.3 |
GEOGRAPHIC DIVERSIFICATION (% of Fund's net assets) |
|
| |
|
TOP HOLDINGS (% of Fund's net assets) | | |
| Amazon.com Inc | 23.9 | |
| Tesla Inc | 10.8 | |
| Home Depot Inc/The | 5.0 | |
| Lowe's Cos Inc | 4.8 | |
| TJX Cos Inc/The | 3.8 | |
| Hilton Worldwide Holdings Inc | 3.2 | |
| Dick's Sporting Goods Inc | 2.4 | |
| McDonald's Corp | 2.4 | |
| Booking Holdings Inc | 2.1 | |
| Aptiv PLC | 2.1 | |
| | 60.5 | |
| |
How has the Fund changed?
This is a summary of certain changes to the Fund since August 1, 2023. For more complete information, you may review the Fund's next prospectus, which we expect to be available by September 28, 2024 at fundresearch.fidelity.com/prospectus/sec or upon request at 1-877-208-0098 or by sending an e-mail to fidfunddocuments@fidelity.com.
| The fund's transfer agent and pricing & bookkeeping fees were changed to a fixed rate effective December 1, 2023, through February 29, 2024, in anticipation of the transition to a new management fee structure. Effective March 1, 2024, the fund's management contract was amended to incorporate administrative services previously covered under separate services agreements (transfer agent and pricing & bookkeeping). The amended contract incorporates a management fee rate that may vary by class. The Adviser or an affiliate pays certain expenses of managing and operating the fund out of each class's management fee. |
| Fidelity, the Fidelity Investments Logo and all other Fidelity trademarks or service marks used herein are trademarks or service marks of FMR LLC. Any third-party marks that are used herein are trademarks or service marks of their respective owners. © 2024 FMR LLC. All rights reserved. |
| | For additional information about the Fund; including its prospectus, financial information, holdings and proxy information, scan the QR code or visit fundresearch.fidelity.com/prospectus/sec 1.9913402.100 185-TSRA-0924 |
| |
| | ANNUAL SHAREHOLDER REPORT | AS OF JULY 31, 2024 | This report describes changes to the Fund that occurred during the reporting period. |
| | Fidelity Advisor® Industrials Fund Fidelity Advisor® Industrials Fund Class M : FCLTX |
| | | |
This annual shareholder report contains information about Fidelity Advisor® Industrials Fund for the period August 1, 2023 to July 31, 2024. You can find additional information about the Fund at fundresearch.fidelity.com/prospectus/sec. You can also request this information by contacting us at 1-877-208-0098 or by sending an e-mail to fidfunddocuments@fidelity.com.
What were your Fund costs for the last year?(based on hypothetical $10,000 investment)
FUND COST (PREVIOUS YEAR)
| | Costs of a $10,000 investment | Costs paid as a percentage of a $10,000 investment | |
| Class M | $ 141 | 1.25% | |
What affected the Fund's performance this period?
•U.S. equities gained for the 12 months ending July 31, 2024, driven by resilient corporate profits, a frenzy over generative artificial intelligence and the Federal Reserve's likely pivot to cutting interest rates later this year.
•Against this backdrop, security selection was the primary contributor to the fund's performance versus the benchmark for the fiscal year, led by industrial machinery & supplies & components. Stock picks and an overweight in aerospace & defense also boosted the fund's relative performance.
•The top individual relative contributor was an overweight in Howmet Aerospace (+88%). The second-largest relative contributor was an overweight in General Electric (+88%), the fund's largest holding. Not owning United Parcel Service, an index component that returned roughly -27%, also contributed.
•In contrast, the primary detractor from performance versus the sector index was security selection in construction & engineering. The largest individual relative detractor was an overweight in Boeing (-20%), one of the fund's biggest holdings. A second notable relative detractor was an overweight in Knight-Swift Transportation (-9%). Another notable relative detractor was an overweight in Chart Industries (-12%).
•Notable changes in positioning include increased exposure to the trading companies & distributors industry and a lower allocation to environmental & facilities services.
How did the Fund perform over the past 10 years?
CUMULATIVE PERFORMANCE
July 31, 2014 through July 31, 2024.
Initial investment of $10,000 and the current sales charge was paid.
Class M | $9,650 | $10,410 | $10,903 | $12,248 | $14,171 | $14,423 | $13,440 | $18,178 | $16,719 | $19,793 | $24,999 |
MSCI U.S. IMI Industrials 25-50 Index | $10,000 | $10,697 | $11,622 | $13,810 | $15,836 | $16,344 | $15,397 | $22,708 | $21,070 | $25,150 | $29,881 |
S&P 500® Index | $10,000 | $11,121 | $11,745 | $13,629 | $15,843 | $17,108 | $19,153 | $26,134 | $24,921 | $28,165 | $34,403 |
| | 2014 | 2015 | 2016 | 2017 | 2018 | 2019 | 2020 | 2021 | 2022 | 2023 | 2024 |
AVERAGE ANNUAL TOTAL RETURNS: | | 1 Year | 5 Year | 10 Year |
| Class M (incl. 3.50% sales charge) | 21.88% | 10.84% | 9.60% |
| Class M (without 3.50% sales charge) | 26.30% | 11.63% | 9.99% |
| MSCI U.S. IMI Industrials 25-50 Index | 18.81% | 12.83% | 11.57% |
| S&P 500® Index | 22.15% | 15.00% | 13.15% |
Visit institutional.fidelity.com for more recent performance information. |
The Fund's past performance is not a good predictor of the Fund's future performance. The graph and table do not reflect the deduction of taxes that a shareholder would pay on fund distributions or redemption of fund shares. |
Key Fund Statistics (as of July 31, 2024)
KEY FACTS | | |
| Fund Size | $582,010,248 | |
| Number of Holdings | 51 | |
| Total Advisory Fee | $3,019,014 | |
| Portfolio Turnover | 29% | |
What did the Fund invest in?
(as of July 31, 2024)
TOP INDUSTRIES (% of Fund's net assets) |
| Aerospace & Defense | 22.7 | |
| Machinery | 20.2 | |
| Ground Transportation | 13.1 | |
| Electrical Equipment | 11.1 | |
| Building Products | 10.2 | |
| Trading Companies & Distributors | 5.6 | |
| Construction & Engineering | 3.8 | |
| Air Freight & Logistics | 3.6 | |
| Professional Services | 3.2 | |
| Others | 5.5 | |
| |
| Common Stocks | 99.0 |
| Short-Term Investments and Net Other Assets (Liabilities) | 1.0 |
ASSET ALLOCATION (% of Fund's net assets) |
|
|
GEOGRAPHIC DIVERSIFICATION (% of Fund's net assets) |
|
| |
|
TOP HOLDINGS (% of Fund's net assets) | | |
| General Electric Co | 6.3 | |
| Union Pacific Corp | 4.9 | |
| Ingersoll Rand Inc | 4.9 | |
| Howmet Aerospace Inc | 4.7 | |
| Boeing Co | 4.2 | |
| Parker-Hannifin Corp | 4.1 | |
| Trane Technologies PLC | 3.9 | |
| TransDigm Group Inc | 3.7 | |
| FedEx Corp | 3.4 | |
| Eaton Corp PLC | 3.3 | |
| | 43.4 | |
| |
How has the Fund changed?
This is a summary of certain changes to the Fund since August 1, 2023. For more complete information, you may review the Fund's next prospectus, which we expect to be available by September 28, 2024 at fundresearch.fidelity.com/prospectus/sec or upon request at 1-877-208-0098 or by sending an e-mail to fidfunddocuments@fidelity.com.
The fund's transfer agent and pricing and bookkeeping fees were changed to a fixed rate effective December 1, 2023, through February 29, 2024, in anticipation of the transition to a new management fee structure. Effective March 1, 2024, the fund's management contract was amended to incorporate administrative services previously covered under separate services agreements (transfer agent and pricing and bookkeeping).The amended contract incorporates a management fee rate that may vary by class. The Adviser or an affiliate pays certain expenses of managing and operating the fund out of each class's management fee. | |
| Fidelity, the Fidelity Investments Logo and all other Fidelity trademarks or service marks used herein are trademarks or service marks of FMR LLC. Any third-party marks that are used herein are trademarks or service marks of their respective owners. © 2024 FMR LLC. All rights reserved. |
| | For additional information about the Fund; including its prospectus, financial information, holdings and proxy information, scan the QR code or visit fundresearch.fidelity.com/prospectus/sec 1.9913398.100 194-TSRA-0924 |
| |
| | ANNUAL SHAREHOLDER REPORT | AS OF JULY 31, 2024 | This report describes changes to the Fund that occurred during the reporting period. |
| | Fidelity Advisor® Technology Fund Fidelity Advisor® Technology Fund Class M : FATEX |
| | | |
This annual shareholder report contains information about Fidelity Advisor® Technology Fund for the period August 1, 2023 to July 31, 2024. You can find additional information about the Fund at fundresearch.fidelity.com/prospectus/sec. You can also request this information by contacting us at 1-877-208-0098 or by sending an e-mail to fidfunddocuments@fidelity.com.
What were your Fund costs for the last year?(based on hypothetical $10,000 investment)
FUND COST (PREVIOUS YEAR)
| | Costs of a $10,000 investment | Costs paid as a percentage of a $10,000 investment | |
| Class M | $ 135 | 1.19% | |
What affected the Fund's performance this period?
•U.S. equities gained for the 12 months ending July 31, 2024, driven by resilient corporate profits, a frenzy over generative artificial intelligence and the Federal Reserve's likely pivot to cutting interest rates later this year.
•Against this backdrop, industry positioning was the primary contributor to the fund's performance versus the MSCI US IMI Information Technology 25/50 Index for the fiscal year, led by an overweight in the outperforming semiconductors group. An underweight in technology hardware, storage & peripherals also boosted the fund's relative performance.
•The fund's top individual relative contributor was an overweight in Nvidia (+150%), which was the biggest holding at period end even though we reduced our stake. The second-largest relative contributor was an underweight position in Apple (+13%). Still, Apple was one of the fund's largest holdings. Our larger-than-index stake in Splunk (+36%) also contributed. Splunk was not held at period end.
•In contrast, the biggest detractor from the fund's performance versus the sector index was stock picking in semiconductors. An overweight in the lagging internet services & infrastructure group also hampered the fund's relative result.
•The fund's largest individual relative detractor was an overweight in onsemi (-28%). We increased the size of the position in onsemi, and it was one of our largest holdings as of July 31. The fund's second-largest relative detractor this period was avoiding Broadcom, an index component that gained 82%. A non-index stake in GlobalFoundries (-20%) also notably hurt, but we increased our holdings this period.
•Notable changes in positioning include decreased exposure to the application software and internet services & infrastructure industries.
How did the Fund perform over the past 10 years?
CUMULATIVE PERFORMANCE
July 31, 2014 through July 31, 2024.
Initial investment of $10,000 and the current sales charge was paid.
Class M | $9,650 | $10,676 | $11,486 | $16,023 | $20,044 | $21,446 | $31,834 | $45,991 | $38,175 | $49,703 | $63,010 |
MSCI U.S. IMI Information Technology 25-50 Index | $10,000 | $11,306 | $12,261 | $15,808 | $20,247 | $23,485 | $32,225 | $45,360 | $41,091 | $50,982 | $64,137 |
S&P 500® Index | $10,000 | $11,121 | $11,745 | $13,629 | $15,843 | $17,108 | $19,153 | $26,134 | $24,921 | $28,165 | $34,403 |
| | 2014 | 2015 | 2016 | 2017 | 2018 | 2019 | 2020 | 2021 | 2022 | 2023 | 2024 |
AVERAGE ANNUAL TOTAL RETURNS: | | 1 Year | 5 Year | 10 Year |
| Class M (incl. 3.50% sales charge) | 22.34% | 23.17% | 20.21% |
| Class M (without 3.50% sales charge) | 26.77% | 24.05% | 20.64% |
| MSCI U.S. IMI Information Technology 25-50 Index | 25.80% | 22.25% | 20.42% |
| S&P 500® Index | 22.15% | 15.00% | 13.15% |
Visit institutional.fidelity.com for more recent performance information. |
The Fund's past performance is not a good predictor of the Fund's future performance. The graph and table do not reflect the deduction of taxes that a shareholder would pay on fund distributions or redemption of fund shares. |
Key Fund Statistics (as of July 31, 2024)
KEY FACTS | | |
| Fund Size | $6,458,251,428 | |
| Number of Holdings | 89 | |
| Total Advisory Fee | $31,726,651 | |
| Portfolio Turnover | 34% | |
What did the Fund invest in?
(as of July 31, 2024)
TOP INDUSTRIES (% of Fund's net assets) |
| Semiconductors & Semiconductor Equipment | 41.8 | |
| Technology Hardware, Storage & Peripherals | 20.7 | |
| Software | 20.6 | |
| IT Services | 4.4 | |
| Communications Equipment | 2.5 | |
| Ground Transportation | 2.2 | |
| Broadline Retail | 1.5 | |
| Hotels, Restaurants & Leisure | 0.6 | |
| Entertainment | 0.5 | |
| Others | 0.9 | |
| |
| Common Stocks | 94.5 |
| Preferred Stocks | 1.2 |
| Preferred Securities | 0.0 |
| Bonds | 0.0 |
| Short-Term Investments and Net Other Assets (Liabilities) | 4.3 |
ASSET ALLOCATION (% of Fund's net assets) |
|
|
| United States | 91.2 |
| China | 4.5 |
| Taiwan | 2.0 |
| Netherlands | 1.2 |
| Canada | 1.0 |
| India | 0.1 |
| Korea (South) | 0.0 |
| Israel | 0.0 |
GEOGRAPHIC DIVERSIFICATION (% of Fund's net assets) |
|
| |
|
TOP HOLDINGS (% of Fund's net assets) | | |
| NVIDIA Corp | 20.1 | |
| Apple Inc | 19.2 | |
| Microsoft Corp | 10.7 | |
| NXP Semiconductors NV | 4.4 | |
| ON Semiconductor Corp | 4.4 | |
| Marvell Technology Inc | 3.9 | |
| Servicenow Inc | 3.6 | |
| Okta Inc Class A | 2.9 | |
| GlobalFoundries Inc | 2.8 | |
| Cisco Systems Inc | 2.5 | |
| | 74.5 | |
| |
How has the Fund changed?
This is a summary of certain changes to the Fund since August 1, 2023. For more complete information, you may review the Fund's next prospectus, which we expect to be available by September 28, 2024 at fundresearch.fidelity.com/prospectus/sec or upon request at 1-877-208-0098 or by sending an e-mail to fidfunddocuments@fidelity.com.
The fund's transfer agent and pricing and bookkeeping fees were changed to a fixed rate effective December 1, 2023, through February 29, 2024, in anticipation of the transition to a new management fee structure. Effective March 1, 2024, the fund's management contract was amended to incorporate administrative services previously covered under separate services agreements (transfer agent and pricing and bookkeeping).The amended contract incorporates a management fee rate that may vary by class. The Adviser or an affiliate pays certain expenses of managing and operating the fund out of each class's management fee. | |
| Fidelity, the Fidelity Investments Logo and all other Fidelity trademarks or service marks used herein are trademarks or service marks of FMR LLC. Any third-party marks that are used herein are trademarks or service marks of their respective owners. © 2024 FMR LLC. All rights reserved. |
| | For additional information about the Fund; including its prospectus, financial information, holdings and proxy information, scan the QR code or visit fundresearch.fidelity.com/prospectus/sec 1.9913413.100 192-TSRA-0924 |
| |
| | ANNUAL SHAREHOLDER REPORT | AS OF JULY 31, 2024 | This report describes changes to the Fund that occurred during the reporting period. |
| | Fidelity Advisor® Semiconductors Fund Fidelity Advisor® Semiconductors Fund Class Z : FIKGX |
| | | |
This annual shareholder report contains information about Fidelity Advisor® Semiconductors Fund for the period August 1, 2023 to July 31, 2024. You can find additional information about the Fund at fundresearch.fidelity.com/prospectus/sec. You can also request this information by contacting us at 1-877-208-0098 or by sending an e-mail to fidfunddocuments@fidelity.com.
What were your Fund costs for the last year?(based on hypothetical $10,000 investment)
FUND COST (PREVIOUS YEAR)
| | Costs of a $10,000 investment | Costs paid as a percentage of a $10,000 investment | |
| Class Z | $ 71 | 0.59% | |
What affected the Fund's performance this period?
•U.S. equities gained for the 12 months ending July 31, 2024, driven by resilient corporate profits, a frenzy over generative artificial intelligence and the Federal Reserve's likely pivot to cutting interest rates later this year.
•Against this backdrop, security selection was the primary detractor from the fund's performance versus the MSCI U.S. IMI Semiconductors & Semiconductor Equipment 25/50 Index for the fiscal year, especially within semiconductors. Also hurting our result were picks in technology hardware, storage & peripherals. Lastly, the fund's position in cash was a notable detractor.
•The biggest individual relative detractor was an overweight in onsemi (-28%). This period we increased our stake in onsemi, and it was among our largest holdings. The fund's second-largest relative detractor was our non-index stake in GlobalFoundries (-20%). This period we increased our stake in GlobalFoundries, and it was among the fund's biggest holdings. An underweight in Broadcom (+82%) also detracted. The company was among the fund's largest holdings.
•In contrast, the primary contributors to performance versus the industry index were picks and an underweight in the semiconductor materials & equipment group.
•The fund's top individual relative contributor this period was avoiding Intel, an index component that returned -13%. The second-largest relative contributor was an underweight in Texas Instruments (+18%). This period we decreased our position in Texas Instruments. Not owning SolarEdge Technologies, an index component that returned -88%, was another notable relative contributor.
How did the Fund perform over the life of Fund?
CUMULATIVE PERFORMANCE
October 2, 2018 through July 31, 2024.
Initial investment of $10,000.
Class Z | $10,000 | $11,203 | $14,700 | $23,970 | $23,292 | $34,912 | $48,893 |
MSCI U.S. IMI Semiconductors & Semiconductor Equipment 25-50 Index | $10,000 | $10,992 | $14,816 | $23,440 | $22,253 | $33,233 | $49,556 |
S&P 500® Index | $10,000 | $10,365 | $11,604 | $15,833 | $15,098 | $17,064 | $20,843 |
| | 2018 | 2019 | 2020 | 2021 | 2022 | 2023 | 2024 |
AVERAGE ANNUAL TOTAL RETURNS: | | 1 Year | 5 Year | Life of Fund A |
| Class Z | 40.05% | 34.27% | 31.27% |
| MSCI U.S. IMI Semiconductors & Semiconductor Equipment 25-50 Index | 49.12% | 35.15% | 31.57% |
| S&P 500® Index | 22.15% | 15.00% | 13.42% |
A From October 2, 2018
Visit institutional.fidelity.com for more recent performance information. |
The Fund's past performance is not a good predictor of the Fund's future performance. The graph and table do not reflect the deduction of taxes that a shareholder would pay on fund distributions or redemption of fund shares. |
Key Fund Statistics (as of July 31, 2024)
KEY FACTS | | |
| Fund Size | $2,698,217,311 | |
| Number of Holdings | 45 | |
| Total Advisory Fee | $11,387,050 | |
| Portfolio Turnover | 30% | |
What did the Fund invest in?
(as of July 31, 2024)
TOP INDUSTRIES (% of Fund's net assets) |
| Semiconductors & Semiconductor Equipment | 92.7 | |
| Technology Hardware, Storage & Peripherals | 2.4 | |
| Electronic Equipment, Instruments & Components | 0.1 | |
| Financial Services | 0.0 | |
| Metals & Mining | 0.0 | |
| |
| Common Stocks | 95.0 |
| Preferred Stocks | 0.2 |
| Preferred Securities | 0.0 |
| Short-Term Investments and Net Other Assets (Liabilities) | 4.8 |
ASSET ALLOCATION (% of Fund's net assets) |
|
|
| United States | 79.9 |
| Taiwan | 7.1 |
| China | 5.6 |
| Netherlands | 5.0 |
| Israel | 1.7 |
| Japan | 0.7 |
GEOGRAPHIC DIVERSIFICATION (% of Fund's net assets) |
|
| |
|
TOP HOLDINGS (% of Fund's net assets) | | |
| NVIDIA Corp | 25.8 | |
| ON Semiconductor Corp | 7.3 | |
| Taiwan Semiconductor Manufacturing Co Ltd ADR | 6.1 | |
| NXP Semiconductors NV | 5.6 | |
| Micron Technology Inc | 5.4 | |
| ASML Holding NV depository receipt | 5.0 | |
| GlobalFoundries Inc | 4.8 | |
| Lam Research Corp | 4.8 | |
| Broadcom Inc | 4.3 | |
| Advanced Micro Devices Inc | 3.8 | |
| | 72.9 | |
| |
How has the Fund changed?
This is a summary of certain changes to the Fund since August 1, 2023. For more complete information, you may review the Fund's next prospectus, which we expect to be available by September 28, 2024 at fundresearch.fidelity.com/prospectus/sec or upon request at 1-877-208-0098 or by sending an e-mail to fidfunddocuments@fidelity.com.
The fund's transfer agent and pricing and bookkeeping fees were changed to a fixed rate effective December 1, 2023, through February 29, 2024, in anticipation of the transition to a new management fee structure. Effective March 1, 2024, the fund's management contract was amended to incorporate administrative services previously covered under separate services agreements (transfer agent and pricing and bookkeeping).The amended contract incorporates a management fee rate that may vary by class. The Adviser or an affiliate pays certain expenses of managing and operating the fund out of each class's management fee. | |
| Fidelity, the Fidelity Investments Logo and all other Fidelity trademarks or service marks used herein are trademarks or service marks of FMR LLC. Any third-party marks that are used herein are trademarks or service marks of their respective owners. © 2024 FMR LLC. All rights reserved. |
| | For additional information about the Fund; including its prospectus, financial information, holdings and proxy information, scan the QR code or visit fundresearch.fidelity.com/prospectus/sec 1.9913445.100 3296-TSRA-0924 |
| |
| | ANNUAL SHAREHOLDER REPORT | AS OF JULY 31, 2024 | This report describes changes to the Fund that occurred during the reporting period. |
| | Fidelity Advisor® Utilities Fund Fidelity Advisor® Utilities Fund Class A : FUGAX |
| | | |
This annual shareholder report contains information about Fidelity Advisor® Utilities Fund for the period August 1, 2023 to July 31, 2024. You can find additional information about the Fund at fundresearch.fidelity.com/prospectus/sec. You can also request this information by contacting us at 1-877-208-0098 or by sending an e-mail to fidfunddocuments@fidelity.com.
What were your Fund costs for the last year?(based on hypothetical $10,000 investment)
FUND COST (PREVIOUS YEAR)
| | Costs of a $10,000 investment | Costs paid as a percentage of a $10,000 investment | |
| Class A | $ 109 | 1.00% | |
What affected the Fund's performance this period?
•U.S. equities gained for the 12 months ending July 31, 2024, driven by resilient corporate profits, a frenzy over generative artificial intelligence and the Federal Reserve's likely pivot to cutting interest rates later this year.
•Against this backdrop, both security selection and market selection contributed to the fund's performance versus the MSCI US IMI Utilities 25/50 Index for the fiscal year, led by our stock picks in electric utilities. An overweight in independent power producers & energy traders also boosted the fund's relative performance, as did stock choices and an underweight in multi-utilities.
•The top individual relative contributor was an overweight in Vistra (+185%). This period we decreased our position in the stock, but the company was among the fund's biggest holdings at the end of the period. A second notable relative contributor was an overweight in Constellation Energy (+99%). Like Vistra, we decreased our position in Constellation Energy this period, but the stock remained among the fund's largest holdings. Another notable relative contributor was an underweight in Exelon (-8%), a stock was not held at period end.
•In contrast, the biggest detractors from performance versus the sector index were stock picking and an overweight in renewable electricity. Our picks in coal & consumable fuels and gas utilities also hurt. Lastly, the fund's position in cash was a notable detractor.
•The largest individual relative detractor was an overweight in NextEra Energy Partners (-48%), the yield company subsidiary of another fund holding, NextEra Energy. This period we increased our investment in the stock. Other notable relative detractors included underweights in Duke Energy (+22%) and DTE Energy (+9%). We exited our positions in both during the period.
•Notable changes in positioning include decreased exposure to water utilities and a higher allocation to multi-utilities.
How did the Fund perform over the past 10 years?
CUMULATIVE PERFORMANCE
July 31, 2014 through July 31, 2024.
Initial investment of $10,000 and the current sales charge was paid.
Class A | $9,425 | $9,615 | $10,912 | $11,989 | $13,169 | $14,713 | $14,485 | $16,651 | $19,764 | $19,451 | $22,657 |
MSCI U.S. IMI Utilities 25-50 Index | $10,000 | $10,922 | $13,519 | $14,434 | $15,013 | $17,419 | $17,988 | $20,183 | $23,242 | $21,712 | $24,456 |
S&P 500® Index | $10,000 | $11,121 | $11,745 | $13,629 | $15,843 | $17,108 | $19,153 | $26,134 | $24,921 | $28,165 | $34,403 |
| | 2014 | 2015 | 2016 | 2017 | 2018 | 2019 | 2020 | 2021 | 2022 | 2023 | 2024 |
AVERAGE ANNUAL TOTAL RETURNS: | | 1 Year | 5 Year | 10 Year |
| Class A (incl. 5.75% sales charge) | 9.78% | 7.73% | 8.52% |
| Class A (without 5.75% sales charge) | 16.48% | 9.02% | 9.17% |
| MSCI U.S. IMI Utilities 25-50 Index | 12.64% | 7.02% | 9.36% |
| S&P 500® Index | 22.15% | 15.00% | 13.15% |
Visit institutional.fidelity.com for more recent performance information. |
The Fund's past performance is not a good predictor of the Fund's future performance. The graph and table do not reflect the deduction of taxes that a shareholder would pay on fund distributions or redemption of fund shares. |
Key Fund Statistics (as of July 31, 2024)
KEY FACTS | | |
| Fund Size | $819,716,826 | |
| Number of Holdings | 30 | |
| Total Advisory Fee | $4,138,318 | |
| Portfolio Turnover | 84% | |
What did the Fund invest in?
(as of July 31, 2024)
TOP INDUSTRIES (% of Fund's net assets) |
| Electric Utilities | 63.0 | |
| Multi-Utilities | 23.0 | |
| Independent Power and Renewable Electricity Producers | 7.0 | |
| Gas Utilities | 2.2 | |
| Oil, Gas & Consumable Fuels | 0.2 | |
| |
| Common Stocks | 95.4 |
| Short-Term Investments and Net Other Assets (Liabilities) | 4.6 |
ASSET ALLOCATION (% of Fund's net assets) |
|
|
| United States | 99.8 |
| Australia | 0.2 |
GEOGRAPHIC DIVERSIFICATION (% of Fund's net assets) |
|
| |
|
TOP HOLDINGS (% of Fund's net assets) | | |
| NextEra Energy Inc | 12.7 | |
| Sempra | 7.1 | |
| PG&E Corp | 5.9 | |
| American Electric Power Co Inc | 5.6 | |
| Edison International | 5.4 | |
| Public Service Enterprise Group Inc | 5.0 | |
| Eversource Energy | 5.0 | |
| Constellation Energy Corp | 5.0 | |
| Entergy Corp | 4.8 | |
| FirstEnergy Corp | 4.3 | |
| | 60.8 | |
| |
How has the Fund changed?
This is a summary of certain changes to the Fund since August 1, 2023. For more complete information, you may review the Fund's next prospectus, which we expect to be available by September 28, 2024 at fundresearch.fidelity.com/prospectus/sec or upon request at 1-877-208-0098 or by sending an e-mail to fidfunddocuments@fidelity.com.
| The fund's transfer agent and pricing & bookkeeping fees were changed to a fixed rate effective December 1, 2023, through February 29, 2024, in anticipation of the transition to a new management fee structure. Effective March 1, 2024, the fund's management contract was amended to incorporate administrative services previously covered under separate services agreements (transfer agent and pricing & bookkeeping). The amended contract incorporates a management fee rate that may vary by class. The Adviser or an affiliate pays certain expenses of managing and operating the fund out of each class's management fee. |
| Fidelity, the Fidelity Investments Logo and all other Fidelity trademarks or service marks used herein are trademarks or service marks of FMR LLC. Any third-party marks that are used herein are trademarks or service marks of their respective owners. © 2024 FMR LLC. All rights reserved. |
| | For additional information about the Fund; including its prospectus, financial information, holdings and proxy information, scan the QR code or visit fundresearch.fidelity.com/prospectus/sec 1.9913407.100 186-TSRA-0924 |
| |
| | ANNUAL SHAREHOLDER REPORT | AS OF JULY 31, 2024 | This report describes changes to the Fund that occurred during the reporting period. |
| | Fidelity Advisor® Utilities Fund Fidelity Advisor® Utilities Fund Class C : FUGCX |
| | | |
This annual shareholder report contains information about Fidelity Advisor® Utilities Fund for the period August 1, 2023 to July 31, 2024. You can find additional information about the Fund at fundresearch.fidelity.com/prospectus/sec. You can also request this information by contacting us at 1-877-208-0098 or by sending an e-mail to fidfunddocuments@fidelity.com.
What were your Fund costs for the last year?(based on hypothetical $10,000 investment)
FUND COST (PREVIOUS YEAR)
| | Costs of a $10,000 investment | Costs paid as a percentage of a $10,000 investment | |
| Class C | $ 189 | 1.75% | |
What affected the Fund's performance this period?
•U.S. equities gained for the 12 months ending July 31, 2024, driven by resilient corporate profits, a frenzy over generative artificial intelligence and the Federal Reserve's likely pivot to cutting interest rates later this year.
•Against this backdrop, both security selection and market selection contributed to the fund's performance versus the MSCI US IMI Utilities 25/50 Index for the fiscal year, led by our stock picks in electric utilities. An overweight in independent power producers & energy traders also boosted the fund's relative performance, as did stock choices and an underweight in multi-utilities.
•The top individual relative contributor was an overweight in Vistra (+185%). This period we decreased our position in the stock, but the company was among the fund's biggest holdings at the end of the period. A second notable relative contributor was an overweight in Constellation Energy (+99%). Like Vistra, we decreased our position in Constellation Energy this period, but the stock remained among the fund's largest holdings. Another notable relative contributor was an underweight in Exelon (-8%), a stock was not held at period end.
•In contrast, the biggest detractors from performance versus the sector index were stock picking and an overweight in renewable electricity. Our picks in coal & consumable fuels and gas utilities also hurt. Lastly, the fund's position in cash was a notable detractor.
•The largest individual relative detractor was an overweight in NextEra Energy Partners (-48%), the yield company subsidiary of another fund holding, NextEra Energy. This period we increased our investment in the stock. Other notable relative detractors included underweights in Duke Energy (+22%) and DTE Energy (+9%). We exited our positions in both during the period.
•Notable changes in positioning include decreased exposure to water utilities and a higher allocation to multi-utilities.
How did the Fund perform over the past 10 years?
CUMULATIVE PERFORMANCE
July 31, 2014 through July 31, 2024.
Initial investment of $10,000.
Class C | $10,000 | $10,129 | $11,409 | $12,438 | $13,562 | $15,036 | $14,693 | $16,765 | $19,747 | $19,434 | $22,637 |
MSCI U.S. IMI Utilities 25-50 Index | $10,000 | $10,922 | $13,519 | $14,434 | $15,013 | $17,419 | $17,988 | $20,183 | $23,242 | $21,712 | $24,456 |
S&P 500® Index | $10,000 | $11,121 | $11,745 | $13,629 | $15,843 | $17,108 | $19,153 | $26,134 | $24,921 | $28,165 | $34,403 |
| | 2014 | 2015 | 2016 | 2017 | 2018 | 2019 | 2020 | 2021 | 2022 | 2023 | 2024 |
AVERAGE ANNUAL TOTAL RETURNS: | | 1 Year | 5 Year | 10 Year |
| Class C (incl. contingent deferred sales charge) | 14.64% | 8.20% | 8.51% |
| Class C | 15.64% | 8.20% | 8.51% |
| MSCI U.S. IMI Utilities 25-50 Index | 12.64% | 7.02% | 9.36% |
| S&P 500® Index | 22.15% | 15.00% | 13.15% |
Visit institutional.fidelity.com for more recent performance information. |
The Fund's past performance is not a good predictor of the Fund's future performance. The graph and table do not reflect the deduction of taxes that a shareholder would pay on fund distributions or redemption of fund shares. |
Key Fund Statistics (as of July 31, 2024)
KEY FACTS | | |
| Fund Size | $819,716,826 | |
| Number of Holdings | 30 | |
| Total Advisory Fee | $4,138,318 | |
| Portfolio Turnover | 84% | |
What did the Fund invest in?
(as of July 31, 2024)
TOP INDUSTRIES (% of Fund's net assets) |
| Electric Utilities | 63.0 | |
| Multi-Utilities | 23.0 | |
| Independent Power and Renewable Electricity Producers | 7.0 | |
| Gas Utilities | 2.2 | |
| Oil, Gas & Consumable Fuels | 0.2 | |
| |
| Common Stocks | 95.4 |
| Short-Term Investments and Net Other Assets (Liabilities) | 4.6 |
ASSET ALLOCATION (% of Fund's net assets) |
|
|
| United States | 99.8 |
| Australia | 0.2 |
GEOGRAPHIC DIVERSIFICATION (% of Fund's net assets) |
|
| |
|
TOP HOLDINGS (% of Fund's net assets) | | |
| NextEra Energy Inc | 12.7 | |
| Sempra | 7.1 | |
| PG&E Corp | 5.9 | |
| American Electric Power Co Inc | 5.6 | |
| Edison International | 5.4 | |
| Public Service Enterprise Group Inc | 5.0 | |
| Eversource Energy | 5.0 | |
| Constellation Energy Corp | 5.0 | |
| Entergy Corp | 4.8 | |
| FirstEnergy Corp | 4.3 | |
| | 60.8 | |
| |
How has the Fund changed?
This is a summary of certain changes to the Fund since August 1, 2023. For more complete information, you may review the Fund's next prospectus, which we expect to be available by September 28, 2024 at fundresearch.fidelity.com/prospectus/sec or upon request at 1-877-208-0098 or by sending an e-mail to fidfunddocuments@fidelity.com.
| The fund's transfer agent and pricing & bookkeeping fees were changed to a fixed rate effective December 1, 2023, through February 29, 2024, in anticipation of the transition to a new management fee structure. Effective March 1, 2024, the fund's management contract was amended to incorporate administrative services previously covered under separate services agreements (transfer agent and pricing & bookkeeping). The amended contract incorporates a management fee rate that may vary by class. The Adviser or an affiliate pays certain expenses of managing and operating the fund out of each class's management fee. |
| Fidelity, the Fidelity Investments Logo and all other Fidelity trademarks or service marks used herein are trademarks or service marks of FMR LLC. Any third-party marks that are used herein are trademarks or service marks of their respective owners. © 2024 FMR LLC. All rights reserved. |
| | For additional information about the Fund; including its prospectus, financial information, holdings and proxy information, scan the QR code or visit fundresearch.fidelity.com/prospectus/sec 1.9913411.100 477-TSRA-0924 |
| |
| | ANNUAL SHAREHOLDER REPORT | AS OF JULY 31, 2024 | This report describes changes to the Fund that occurred during the reporting period. |
| | Fidelity Advisor® Industrials Fund Fidelity Advisor® Industrials Fund Class C : FCLCX |
| | | |
This annual shareholder report contains information about Fidelity Advisor® Industrials Fund for the period August 1, 2023 to July 31, 2024. You can find additional information about the Fund at fundresearch.fidelity.com/prospectus/sec. You can also request this information by contacting us at 1-877-208-0098 or by sending an e-mail to fidfunddocuments@fidelity.com.
What were your Fund costs for the last year?(based on hypothetical $10,000 investment)
FUND COST (PREVIOUS YEAR)
| | Costs of a $10,000 investment | Costs paid as a percentage of a $10,000 investment | |
| Class C | $ 198 | 1.76% | |
What affected the Fund's performance this period?
•U.S. equities gained for the 12 months ending July 31, 2024, driven by resilient corporate profits, a frenzy over generative artificial intelligence and the Federal Reserve's likely pivot to cutting interest rates later this year.
•Against this backdrop, security selection was the primary contributor to the fund's performance versus the benchmark for the fiscal year, led by industrial machinery & supplies & components. Stock picks and an overweight in aerospace & defense also boosted the fund's relative performance.
•The top individual relative contributor was an overweight in Howmet Aerospace (+88%). The second-largest relative contributor was an overweight in General Electric (+88%), the fund's largest holding. Not owning United Parcel Service, an index component that returned roughly -27%, also contributed.
•In contrast, the primary detractor from performance versus the sector index was security selection in construction & engineering. The largest individual relative detractor was an overweight in Boeing (-20%), one of the fund's biggest holdings. A second notable relative detractor was an overweight in Knight-Swift Transportation (-9%). Another notable relative detractor was an overweight in Chart Industries (-12%).
•Notable changes in positioning include increased exposure to the trading companies & distributors industry and a lower allocation to environmental & facilities services.
How did the Fund perform over the past 10 years?
CUMULATIVE PERFORMANCE
July 31, 2014 through July 31, 2024.
Initial investment of $10,000.
Class C | $10,000 | $10,736 | $11,191 | $12,507 | $14,399 | $14,583 | $13,523 | $18,199 | $16,655 | $19,766 | $25,032 |
MSCI U.S. IMI Industrials 25-50 Index | $10,000 | $10,697 | $11,622 | $13,810 | $15,836 | $16,344 | $15,397 | $22,708 | $21,070 | $25,150 | $29,881 |
S&P 500® Index | $10,000 | $11,121 | $11,745 | $13,629 | $15,843 | $17,108 | $19,153 | $26,134 | $24,921 | $28,165 | $34,403 |
| | 2014 | 2015 | 2016 | 2017 | 2018 | 2019 | 2020 | 2021 | 2022 | 2023 | 2024 |
AVERAGE ANNUAL TOTAL RETURNS: | | 1 Year | 5 Year | 10 Year |
| Class C (incl. contingent deferred sales charge) | 24.68% | 11.08% | 9.61% |
| Class C | 25.68% | 11.08% | 9.61% |
| MSCI U.S. IMI Industrials 25-50 Index | 18.81% | 12.83% | 11.57% |
| S&P 500® Index | 22.15% | 15.00% | 13.15% |
Visit institutional.fidelity.com for more recent performance information. |
The Fund's past performance is not a good predictor of the Fund's future performance. The graph and table do not reflect the deduction of taxes that a shareholder would pay on fund distributions or redemption of fund shares. |
Key Fund Statistics (as of July 31, 2024)
KEY FACTS | | |
| Fund Size | $582,010,248 | |
| Number of Holdings | 51 | |
| Total Advisory Fee | $3,019,014 | |
| Portfolio Turnover | 29% | |
What did the Fund invest in?
(as of July 31, 2024)
TOP INDUSTRIES (% of Fund's net assets) |
| Aerospace & Defense | 22.7 | |
| Machinery | 20.2 | |
| Ground Transportation | 13.1 | |
| Electrical Equipment | 11.1 | |
| Building Products | 10.2 | |
| Trading Companies & Distributors | 5.6 | |
| Construction & Engineering | 3.8 | |
| Air Freight & Logistics | 3.6 | |
| Professional Services | 3.2 | |
| Others | 5.5 | |
| |
| Common Stocks | 99.0 |
| Short-Term Investments and Net Other Assets (Liabilities) | 1.0 |
ASSET ALLOCATION (% of Fund's net assets) |
|
|
GEOGRAPHIC DIVERSIFICATION (% of Fund's net assets) |
|
| |
|
TOP HOLDINGS (% of Fund's net assets) | | |
| General Electric Co | 6.3 | |
| Union Pacific Corp | 4.9 | |
| Ingersoll Rand Inc | 4.9 | |
| Howmet Aerospace Inc | 4.7 | |
| Boeing Co | 4.2 | |
| Parker-Hannifin Corp | 4.1 | |
| Trane Technologies PLC | 3.9 | |
| TransDigm Group Inc | 3.7 | |
| FedEx Corp | 3.4 | |
| Eaton Corp PLC | 3.3 | |
| | 43.4 | |
| |
How has the Fund changed?
This is a summary of certain changes to the Fund since August 1, 2023. For more complete information, you may review the Fund's next prospectus, which we expect to be available by September 28, 2024 at fundresearch.fidelity.com/prospectus/sec or upon request at 1-877-208-0098 or by sending an e-mail to fidfunddocuments@fidelity.com.
The fund's transfer agent and pricing and bookkeeping fees were changed to a fixed rate effective December 1, 2023, through February 29, 2024, in anticipation of the transition to a new management fee structure. Effective March 1, 2024, the fund's management contract was amended to incorporate administrative services previously covered under separate services agreements (transfer agent and pricing and bookkeeping).The amended contract incorporates a management fee rate that may vary by class. The Adviser or an affiliate pays certain expenses of managing and operating the fund out of each class's management fee. | |
| Fidelity, the Fidelity Investments Logo and all other Fidelity trademarks or service marks used herein are trademarks or service marks of FMR LLC. Any third-party marks that are used herein are trademarks or service marks of their respective owners. © 2024 FMR LLC. All rights reserved. |
| | For additional information about the Fund; including its prospectus, financial information, holdings and proxy information, scan the QR code or visit fundresearch.fidelity.com/prospectus/sec 1.9913400.100 283-TSRA-0924 |
| |
| | ANNUAL SHAREHOLDER REPORT | AS OF JULY 31, 2024 | This report describes changes to the Fund that occurred during the reporting period. |
| | Fidelity Advisor® Energy Fund Fidelity Advisor® Energy Fund Class C : FNRCX |
| | | |
This annual shareholder report contains information about Fidelity Advisor® Energy Fund for the period August 1, 2023 to July 31, 2024. You can find additional information about the Fund at fundresearch.fidelity.com/prospectus/sec. You can also request this information by contacting us at 1-877-208-0098 or by sending an e-mail to fidfunddocuments@fidelity.com.
What were your Fund costs for the last year?(based on hypothetical $10,000 investment)
FUND COST (PREVIOUS YEAR)
| | Costs of a $10,000 investment | Costs paid as a percentage of a $10,000 investment | |
| Class C | $ 183 | 1.74% | |
What affected the Fund's performance this period?
•U.S. equities gained for the 12 months ending July 31, 2024, driven by resilient corporate profits, a frenzy over generative artificial intelligence and the Federal Reserve's likely pivot to cutting interest rates later this year.
•Against this backdrop, security selection was the primary contributor to the fund's performance versus the MSCI U.S. IMI Energy 25/50 Index for the fiscal year, led by oil & gas exploration & production. Stock picks in integrated oil & gas and independent power producers & energy traders also boosted the fund's relative performance.
•The top individual relative contributor was an overweight in TechnipFMC (+62%). We pared our stake in TechnipFMC. The second-largest relative contributor was an underweight in Chevron (+2%). The stock was one of the fund's largest holdings even though we reduced the position this period. Another notable relative contributor was our non-index stake in Vistra (+186%).
•In contrast, the biggest detractors from performance versus the sector index were security selection and an underweight in oil & gas storage & transportation. Also hurting our relative result were overweights in oil & gas drilling and oil & gas equipment & services.
•Not owning Targa Resources, an index component that gained 69%, was the fund's biggest individual relative detractor. Not owning Williams Companies, an index component that gained 31%, was the fund's second-largest relative detractor. Another notable relative detractor this period was avoiding ONEOK, an index component that gained about 30%.
•Notable changes in positioning include increased exposure to the oil & gas drilling industry and a lower allocation to oil & gas exploration & production.
How did the Fund perform over the past 10 years?
CUMULATIVE PERFORMANCE
July 31, 2014 through July 31, 2024.
Initial investment of $10,000.
Class C | $10,000 | $7,056 | $7,093 | $6,962 | $8,575 | $6,378 | $3,830 | $5,580 | $9,478 | $10,989 | $12,247 |
MSCI U.S. IMI Energy 25-50 Index | $10,000 | $7,208 | $7,220 | $7,200 | $8,707 | $7,019 | $4,258 | $6,393 | $10,594 | $12,299 | $13,570 |
S&P 500® Index | $10,000 | $11,121 | $11,745 | $13,629 | $15,843 | $17,108 | $19,153 | $26,134 | $24,921 | $28,165 | $34,403 |
| | 2014 | 2015 | 2016 | 2017 | 2018 | 2019 | 2020 | 2021 | 2022 | 2023 | 2024 |
AVERAGE ANNUAL TOTAL RETURNS: | | 1 Year | 5 Year | 10 Year |
| Class C (incl. contingent deferred sales charge) | 9.61% | 13.60% | 2.05% |
| Class C | 10.61% | 13.60% | 2.05% |
| MSCI U.S. IMI Energy 25-50 Index | 10.33% | 14.09% | 3.10% |
| S&P 500® Index | 22.15% | 15.00% | 13.15% |
Visit institutional.fidelity.com for more recent performance information. |
The Fund's past performance is not a good predictor of the Fund's future performance. The graph and table do not reflect the deduction of taxes that a shareholder would pay on fund distributions or redemption of fund shares. |
Key Fund Statistics (as of July 31, 2024)
KEY FACTS | | |
| Fund Size | $1,311,457,602 | |
| Number of Holdings | 43 | |
| Total Advisory Fee | $7,393,032 | |
| Portfolio Turnover | 31% | |
What did the Fund invest in?
(as of July 31, 2024)
TOP INDUSTRIES (% of Fund's net assets) |
| Oil, Gas & Consumable Fuels | 81.1 | |
| Energy Equipment & Services | 16.3 | |
| Independent Power and Renewable Electricity Producers | 1.4 | |
| Machinery | 1.0 | |
| |
| Common Stocks | 99.8 |
| Short-Term Investments and Net Other Assets (Liabilities) | 0.2 |
ASSET ALLOCATION (% of Fund's net assets) |
|
|
| United States | 82.6 |
| Canada | 13.4 |
| United Kingdom | 3.3 |
| Norway | 0.3 |
| Cameroon | 0.2 |
| France | 0.1 |
| United Arab Emirates | 0.1 |
GEOGRAPHIC DIVERSIFICATION (% of Fund's net assets) |
|
| |
|
TOP HOLDINGS (% of Fund's net assets) | | |
| Exxon Mobil Corp | 24.8 | |
| Cenovus Energy Inc | 6.2 | |
| Schlumberger NV | 5.4 | |
| Chevron Corp | 4.8 | |
| Marathon Petroleum Corp | 4.8 | |
| Canadian Natural Resources Ltd | 4.5 | |
| Valero Energy Corp | 3.9 | |
| Cheniere Energy Inc | 3.9 | |
| Occidental Petroleum Corp | 3.8 | |
| Hess Corp | 3.4 | |
| | 65.5 | |
| |
How has the Fund changed?
This is a summary of certain changes to the Fund since August 1, 2023. For more complete information, you may review the Fund's next prospectus, which we expect to be available by September 28, 2024 at fundresearch.fidelity.com/prospectus/sec or upon request at 1-877-208-0098 or by sending an e-mail to fidfunddocuments@fidelity.com.
The fund's transfer agent and pricing & bookkeeping fees were changed to a fixed rate effective December 1, 2023, through February 29, 2024, in anticipation of the transition to a new management fee structure. Effective March 1, 2024, the fund's management contract was amended to incorporate administrative services previously covered under separate services agreements (transfer agent and pricing & bookkeeping). The amended contract incorporates a management fee rate that may vary by class. The Adviser or an affiliate pays certain expenses of managing and operating the fund out of each class's management fee. | |
| Fidelity, the Fidelity Investments Logo and all other Fidelity trademarks or service marks used herein are trademarks or service marks of FMR LLC. Any third-party marks that are used herein are trademarks or service marks of their respective owners. © 2024 FMR LLC. All rights reserved. |
| | For additional information about the Fund; including its prospectus, financial information, holdings and proxy information, scan the QR code or visit fundresearch.fidelity.com/prospectus/sec 1.9913420.100 528-TSRA-0924 |
| |
| | ANNUAL SHAREHOLDER REPORT | AS OF JULY 31, 2024 | This report describes changes to the Fund that occurred during the reporting period. |
| | Fidelity Advisor® Technology Fund Fidelity Advisor® Technology Fund Class C : FTHCX |
| | | |
This annual shareholder report contains information about Fidelity Advisor® Technology Fund for the period August 1, 2023 to July 31, 2024. You can find additional information about the Fund at fundresearch.fidelity.com/prospectus/sec. You can also request this information by contacting us at 1-877-208-0098 or by sending an e-mail to fidfunddocuments@fidelity.com.
What were your Fund costs for the last year?(based on hypothetical $10,000 investment)
FUND COST (PREVIOUS YEAR)
| | Costs of a $10,000 investment | Costs paid as a percentage of a $10,000 investment | |
| Class C | $ 192 | 1.70% | |
What affected the Fund's performance this period?
•U.S. equities gained for the 12 months ending July 31, 2024, driven by resilient corporate profits, a frenzy over generative artificial intelligence and the Federal Reserve's likely pivot to cutting interest rates later this year.
•Against this backdrop, industry positioning was the primary contributor to the fund's performance versus the MSCI US IMI Information Technology 25/50 Index for the fiscal year, led by an overweight in the outperforming semiconductors group. An underweight in technology hardware, storage & peripherals also boosted the fund's relative performance.
•The fund's top individual relative contributor was an overweight in Nvidia (+150%), which was the biggest holding at period end even though we reduced our stake. The second-largest relative contributor was an underweight position in Apple (+13%). Still, Apple was one of the fund's largest holdings. Our larger-than-index stake in Splunk (+36%) also contributed. Splunk was not held at period end.
•In contrast, the biggest detractor from the fund's performance versus the sector index was stock picking in semiconductors. An overweight in the lagging internet services & infrastructure group also hampered the fund's relative result.
•The fund's largest individual relative detractor was an overweight in onsemi (-28%). We increased the size of the position in onsemi, and it was one of our largest holdings as of July 31. The fund's second-largest relative detractor this period was avoiding Broadcom, an index component that gained 82%. A non-index stake in GlobalFoundries (-20%) also notably hurt, but we increased our holdings this period.
•Notable changes in positioning include decreased exposure to the application software and internet services & infrastructure industries.
How did the Fund perform over the past 10 years?
CUMULATIVE PERFORMANCE
July 31, 2014 through July 31, 2024.
Initial investment of $10,000.
Class C | $10,000 | $11,007 | $11,786 | $16,359 | $20,363 | $21,675 | $32,012 | $46,010 | $37,997 | $49,589 | $63,022 |
MSCI U.S. IMI Information Technology 25-50 Index | $10,000 | $11,306 | $12,261 | $15,808 | $20,247 | $23,485 | $32,225 | $45,360 | $41,091 | $50,982 | $64,137 |
S&P 500® Index | $10,000 | $11,121 | $11,745 | $13,629 | $15,843 | $17,108 | $19,153 | $26,134 | $24,921 | $28,165 | $34,403 |
| | 2014 | 2015 | 2016 | 2017 | 2018 | 2019 | 2020 | 2021 | 2022 | 2023 | 2024 |
AVERAGE ANNUAL TOTAL RETURNS: | | 1 Year | 5 Year | 10 Year |
| Class C (incl. contingent deferred sales charge) | 25.14% | 23.42% | 20.21% |
| Class C | 26.14% | 23.42% | 20.21% |
| MSCI U.S. IMI Information Technology 25-50 Index | 25.80% | 22.25% | 20.42% |
| S&P 500® Index | 22.15% | 15.00% | 13.15% |
Visit institutional.fidelity.com for more recent performance information. |
The Fund's past performance is not a good predictor of the Fund's future performance. The graph and table do not reflect the deduction of taxes that a shareholder would pay on fund distributions or redemption of fund shares. |
Key Fund Statistics (as of July 31, 2024)
KEY FACTS | | |
| Fund Size | $6,458,251,428 | |
| Number of Holdings | 89 | |
| Total Advisory Fee | $31,726,651 | |
| Portfolio Turnover | 34% | |
What did the Fund invest in?
(as of July 31, 2024)
TOP INDUSTRIES (% of Fund's net assets) |
| Semiconductors & Semiconductor Equipment | 41.8 | |
| Technology Hardware, Storage & Peripherals | 20.7 | |
| Software | 20.6 | |
| IT Services | 4.4 | |
| Communications Equipment | 2.5 | |
| Ground Transportation | 2.2 | |
| Broadline Retail | 1.5 | |
| Hotels, Restaurants & Leisure | 0.6 | |
| Entertainment | 0.5 | |
| Others | 0.9 | |
| |
| Common Stocks | 94.5 |
| Preferred Stocks | 1.2 |
| Preferred Securities | 0.0 |
| Bonds | 0.0 |
| Short-Term Investments and Net Other Assets (Liabilities) | 4.3 |
ASSET ALLOCATION (% of Fund's net assets) |
|
|
| United States | 91.2 |
| China | 4.5 |
| Taiwan | 2.0 |
| Netherlands | 1.2 |
| Canada | 1.0 |
| India | 0.1 |
| Korea (South) | 0.0 |
| Israel | 0.0 |
GEOGRAPHIC DIVERSIFICATION (% of Fund's net assets) |
|
| |
|
TOP HOLDINGS (% of Fund's net assets) | | |
| NVIDIA Corp | 20.1 | |
| Apple Inc | 19.2 | |
| Microsoft Corp | 10.7 | |
| NXP Semiconductors NV | 4.4 | |
| ON Semiconductor Corp | 4.4 | |
| Marvell Technology Inc | 3.9 | |
| Servicenow Inc | 3.6 | |
| Okta Inc Class A | 2.9 | |
| GlobalFoundries Inc | 2.8 | |
| Cisco Systems Inc | 2.5 | |
| | 74.5 | |
| |
How has the Fund changed?
This is a summary of certain changes to the Fund since August 1, 2023. For more complete information, you may review the Fund's next prospectus, which we expect to be available by September 28, 2024 at fundresearch.fidelity.com/prospectus/sec or upon request at 1-877-208-0098 or by sending an e-mail to fidfunddocuments@fidelity.com.
The fund's transfer agent and pricing and bookkeeping fees were changed to a fixed rate effective December 1, 2023, through February 29, 2024, in anticipation of the transition to a new management fee structure. Effective March 1, 2024, the fund's management contract was amended to incorporate administrative services previously covered under separate services agreements (transfer agent and pricing and bookkeeping).The amended contract incorporates a management fee rate that may vary by class. The Adviser or an affiliate pays certain expenses of managing and operating the fund out of each class's management fee. | |
| Fidelity, the Fidelity Investments Logo and all other Fidelity trademarks or service marks used herein are trademarks or service marks of FMR LLC. Any third-party marks that are used herein are trademarks or service marks of their respective owners. © 2024 FMR LLC. All rights reserved. |
| | For additional information about the Fund; including its prospectus, financial information, holdings and proxy information, scan the QR code or visit fundresearch.fidelity.com/prospectus/sec 1.9913416.100 476-TSRA-0924 |
| |
| | ANNUAL SHAREHOLDER REPORT | AS OF JULY 31, 2024 | This report describes changes to the Fund that occurred during the reporting period. |
| | Fidelity Advisor® Semiconductors Fund Fidelity Advisor® Semiconductors Fund Class A : FELAX |
| | | |
This annual shareholder report contains information about Fidelity Advisor® Semiconductors Fund for the period August 1, 2023 to July 31, 2024. You can find additional information about the Fund at fundresearch.fidelity.com/prospectus/sec. You can also request this information by contacting us at 1-877-208-0098 or by sending an e-mail to fidfunddocuments@fidelity.com.
What were your Fund costs for the last year?(based on hypothetical $10,000 investment)
FUND COST (PREVIOUS YEAR)
| | Costs of a $10,000 investment | Costs paid as a percentage of a $10,000 investment | |
| Class A | $ 115 | 0.96% | |
What affected the Fund's performance this period?
•U.S. equities gained for the 12 months ending July 31, 2024, driven by resilient corporate profits, a frenzy over generative artificial intelligence and the Federal Reserve's likely pivot to cutting interest rates later this year.
•Against this backdrop, security selection was the primary detractor from the fund's performance versus the MSCI U.S. IMI Semiconductors & Semiconductor Equipment 25/50 Index for the fiscal year, especially within semiconductors. Also hurting our result were picks in technology hardware, storage & peripherals. Lastly, the fund's position in cash was a notable detractor.
•The biggest individual relative detractor was an overweight in onsemi (-28%). This period we increased our stake in onsemi, and it was among our largest holdings. The fund's second-largest relative detractor was our non-index stake in GlobalFoundries (-20%). This period we increased our stake in GlobalFoundries, and it was among the fund's biggest holdings. An underweight in Broadcom (+82%) also detracted. The company was among the fund's largest holdings.
•In contrast, the primary contributors to performance versus the industry index were picks and an underweight in the semiconductor materials & equipment group.
•The fund's top individual relative contributor this period was avoiding Intel, an index component that returned -13%. The second-largest relative contributor was an underweight in Texas Instruments (+18%). This period we decreased our position in Texas Instruments. Not owning SolarEdge Technologies, an index component that returned -88%, was another notable relative contributor.
How did the Fund perform over the past 10 years?
CUMULATIVE PERFORMANCE
July 31, 2014 through July 31, 2024.
Initial investment of $10,000 and the current sales charge was paid.
Class A | $9,425 | $10,448 | $12,585 | $16,514 | $21,031 | $23,171 | $30,274 | $49,179 | $47,602 | $71,075 | $99,162 |
MSCI U.S. IMI Semiconductors & Semiconductor Equipment 25-50 Index | $10,000 | $10,481 | $13,028 | $17,291 | $21,750 | $23,948 | $32,281 | $51,070 | $48,484 | $72,407 | $107,971 |
S&P 500® Index | $10,000 | $11,121 | $11,745 | $13,629 | $15,843 | $17,108 | $19,153 | $26,134 | $24,921 | $28,165 | $34,403 |
| | 2014 | 2015 | 2016 | 2017 | 2018 | 2019 | 2020 | 2021 | 2022 | 2023 | 2024 |
AVERAGE ANNUAL TOTAL RETURNS: | | 1 Year | 5 Year | 10 Year |
| Class A (incl. 5.75% sales charge) | 31.49% | 32.17% | 25.79% |
| Class A (without 5.75% sales charge) | 39.52% | 33.75% | 26.53% |
| MSCI U.S. IMI Semiconductors & Semiconductor Equipment 25-50 Index | 49.12% | 35.15% | 26.86% |
| S&P 500® Index | 22.15% | 15.00% | 13.15% |
Visit institutional.fidelity.com for more recent performance information. |
The Fund's past performance is not a good predictor of the Fund's future performance. The graph and table do not reflect the deduction of taxes that a shareholder would pay on fund distributions or redemption of fund shares. |
Key Fund Statistics (as of July 31, 2024)
KEY FACTS | | |
| Fund Size | $2,698,217,311 | |
| Number of Holdings | 45 | |
| Total Advisory Fee | $11,387,050 | |
| Portfolio Turnover | 30% | |
What did the Fund invest in?
(as of July 31, 2024)
TOP INDUSTRIES (% of Fund's net assets) |
| Semiconductors & Semiconductor Equipment | 92.7 | |
| Technology Hardware, Storage & Peripherals | 2.4 | |
| Electronic Equipment, Instruments & Components | 0.1 | |
| Financial Services | 0.0 | |
| Metals & Mining | 0.0 | |
| |
| Common Stocks | 95.0 |
| Preferred Stocks | 0.2 |
| Preferred Securities | 0.0 |
| Short-Term Investments and Net Other Assets (Liabilities) | 4.8 |
ASSET ALLOCATION (% of Fund's net assets) |
|
|
| United States | 79.9 |
| Taiwan | 7.1 |
| China | 5.6 |
| Netherlands | 5.0 |
| Israel | 1.7 |
| Japan | 0.7 |
GEOGRAPHIC DIVERSIFICATION (% of Fund's net assets) |
|
| |
|
TOP HOLDINGS (% of Fund's net assets) | | |
| NVIDIA Corp | 25.8 | |
| ON Semiconductor Corp | 7.3 | |
| Taiwan Semiconductor Manufacturing Co Ltd ADR | 6.1 | |
| NXP Semiconductors NV | 5.6 | |
| Micron Technology Inc | 5.4 | |
| ASML Holding NV depository receipt | 5.0 | |
| GlobalFoundries Inc | 4.8 | |
| Lam Research Corp | 4.8 | |
| Broadcom Inc | 4.3 | |
| Advanced Micro Devices Inc | 3.8 | |
| | 72.9 | |
| |
How has the Fund changed?
This is a summary of certain changes to the Fund since August 1, 2023. For more complete information, you may review the Fund's next prospectus, which we expect to be available by September 28, 2024 at fundresearch.fidelity.com/prospectus/sec or upon request at 1-877-208-0098 or by sending an e-mail to fidfunddocuments@fidelity.com.
The fund's transfer agent and pricing and bookkeeping fees were changed to a fixed rate effective December 1, 2023, through February 29, 2024, in anticipation of the transition to a new management fee structure. Effective March 1, 2024, the fund's management contract was amended to incorporate administrative services previously covered under separate services agreements (transfer agent and pricing and bookkeeping).The amended contract incorporates a management fee rate that may vary by class. The Adviser or an affiliate pays certain expenses of managing and operating the fund out of each class's management fee. | |
| Fidelity, the Fidelity Investments Logo and all other Fidelity trademarks or service marks used herein are trademarks or service marks of FMR LLC. Any third-party marks that are used herein are trademarks or service marks of their respective owners. © 2024 FMR LLC. All rights reserved. |
| | For additional information about the Fund; including its prospectus, financial information, holdings and proxy information, scan the QR code or visit fundresearch.fidelity.com/prospectus/sec 1.9913443.100 138-TSRA-0924 |
| |
| | ANNUAL SHAREHOLDER REPORT | AS OF JULY 31, 2024 | This report describes changes to the Fund that occurred during the reporting period. |
| | Fidelity Advisor® Real Estate Fund Fidelity Advisor® Real Estate Fund Class I : FHEIX |
| | | |
This annual shareholder report contains information about Fidelity Advisor® Real Estate Fund for the period August 1, 2023 to July 31, 2024. You can find additional information about the Fund at fundresearch.fidelity.com/prospectus/sec. You can also request this information by contacting us at 1-877-208-0098 or by sending an e-mail to fidfunddocuments@fidelity.com.
What were your Fund costs for the last year?(based on hypothetical $10,000 investment)
FUND COST (PREVIOUS YEAR)
| | Costs of a $10,000 investment | Costs paid as a percentage of a $10,000 investment | |
| Class I | $ 83 | 0.79% | |
What affected the Fund's performance this period?
•U.S. equities gained for the 12 months ending July 31, 2024, driven by resilient corporate profits, a frenzy over generative artificial intelligence and the Federal Reserve's likely pivot to cutting interest rates later this year.
•Against this backdrop, security selection and industry positioning were the primary detractors from the fund's performance versus the MSCI US IMI Real Estate 25/50 Linked Index for the fiscal year, especially "other specialized" real estate investment trusts. Subpar picks and outsized exposure to the industrial and multi-family residential industries hurt as well.
•The biggest individual relative detractor this period was avoiding Iron Mountain, an index component that gained 73%. Similarly, not owning Simon Property Group, an index component that rose about 30%, proved detrimental to performance as well. An overweight stake in Americold Realty Trust (-4%) was another challenge, though we increased our investment in the stock this period.
•In contrast, the biggest contributor to performance versus the real estate index was stock selection among real estate services firms. Picks in health care also boosted the fund's relative performance. An undersized stake in timber REITs was another plus.
•The top individual relative contributor was an outsized stake in CBRE Group (+35%). The company was one of the fund's largest holdings. Avoiding shares of Realty Income, an index component that returned about -1%, aided performance as well. Not owning Weyerhaeuser, an index component that returned -4%, also proved advantageous.
•Notable changes in positioning include increased exposure to the retail industry and a lower allocation to other specialized REITs.
How did the Fund perform over the past 10 years?
CUMULATIVE PERFORMANCE
July 31, 2014 through July 31, 2024.
Initial investment of $10,000.
Class I | $10,000 | $10,999 | $13,046 | $12,347 | $12,698 | $13,958 | $12,982 | $16,961 | $16,041 | $14,208 | $15,685 |
MSCI US IMI Real Estate 25/50 Linked Index | $10,000 | $11,129 | $13,457 | $12,695 | $13,185 | $14,621 | $12,238 | $16,556 | $15,854 | $14,323 | $15,860 |
S&P 500® Index | $10,000 | $11,121 | $11,745 | $13,629 | $15,843 | $17,108 | $19,153 | $26,134 | $24,921 | $28,165 | $34,403 |
| | 2014 | 2015 | 2016 | 2017 | 2018 | 2019 | 2020 | 2021 | 2022 | 2023 | 2024 |
AVERAGE ANNUAL TOTAL RETURNS: | | 1 Year | 5 Year | 10 Year |
| Class I | 10.40% | 2.36% | 4.60% |
| MSCI US IMI Real Estate 25/50 Linked Index | 10.73% | 1.64% | 4.72% |
| S&P 500® Index | 22.15% | 15.00% | 13.15% |
Visit institutional.fidelity.com for more recent performance information. |
The Fund's past performance is not a good predictor of the Fund's future performance. The graph and table do not reflect the deduction of taxes that a shareholder would pay on fund distributions or redemption of fund shares. |
Key Fund Statistics (as of July 31, 2024)
KEY FACTS | | |
| Fund Size | $237,005,518 | |
| Number of Holdings | 35 | |
| Total Advisory Fee | $1,374,363 | |
| Portfolio Turnover | 24% | |
What did the Fund invest in?
(as of July 31, 2024)
TOP INDUSTRIES (% of Fund's net assets) |
| Specialized REITs | 37.6 | |
| Industrial REITs | 16.2 | |
| Residential REITs | 14.2 | |
| Retail REITs | 10.8 | |
| Health Care REITs | 9.1 | |
| Real Estate Management & Development | 7.7 | |
| Hotel & Resort REITs | 2.5 | |
| Office REITs | 1.2 | |
| |
| Common Stocks | 99.3 |
| Short-Term Investments and Net Other Assets (Liabilities) | 0.7 |
ASSET ALLOCATION (% of Fund's net assets) |
|
|
GEOGRAPHIC DIVERSIFICATION (% of Fund's net assets) |
|
| |
|
TOP HOLDINGS (% of Fund's net assets) | | |
| Prologis Inc | 9.6 | |
| Equinix Inc | 7.8 | |
| Crown Castle Inc | 7.5 | |
| CBRE Group Inc Class A | 6.3 | |
| American Tower Corp | 5.9 | |
| Ventas Inc | 5.8 | |
| CubeSmart | 5.4 | |
| Digital Realty Trust Inc | 3.5 | |
| Welltower Inc | 3.3 | |
| Mid-America Apartment Communities Inc | 3.3 | |
| | 58.4 | |
| |
How has the Fund changed?
This is a summary of certain changes to the Fund since August 1, 2023. For more complete information, you may review the Fund's next prospectus, which we expect to be available by September 28, 2024 at fundresearch.fidelity.com/prospectus/sec or upon request at 1-877-208-0098 or by sending an e-mail to fidfunddocuments@fidelity.com.
The fund's transfer agent and pricing & bookkeeping fees were changed to a fixed rate effective December 1, 2023, through February 29, 2024, in anticipation of the transition to a new management fee structure. Effective March 1, 2024, the fund's management contract was amended to incorporate administrative services previously covered under separate services agreements (transfer agent and pricing & bookkeeping). The amended contract incorporates a management fee rate that may vary by class. The Adviser or an affiliate pays certain expenses of managing and operating the fund out of each class's management fee. | |
| Fidelity, the Fidelity Investments Logo and all other Fidelity trademarks or service marks used herein are trademarks or service marks of FMR LLC. Any third-party marks that are used herein are trademarks or service marks of their respective owners. © 2024 FMR LLC. All rights reserved. |
| | For additional information about the Fund; including its prospectus, financial information, holdings and proxy information, scan the QR code or visit fundresearch.fidelity.com/prospectus/sec 1.9913449.100 1132-TSRA-0924 |
Item 2.
Code of Ethics
As of the end of the period, July 31, 2024, Fidelity Advisor Series VII (the trust) has adopted a code of ethics, as defined in Item 2 of Form N-CSR, that applies to its President and Treasurer and its Chief Financial Officer. A copy of the code of ethics is filed as an exhibit to this Form N-CSR.
Item 3.
Audit Committee Financial Expert
The Board of Trustees of the trust has determined that Donald F. Donahue is an audit committee financial expert, as defined in Item 3 of Form N-CSR. Mr. Donahue is independent for purposes of Item 3 of Form N-CSR.
Item 4.
Principal Accountant Fees and Services
Fees and Services
The following table presents fees billed by Deloitte & Touche LLP, the member firms of Deloitte Touche Tohmatsu, and their respective affiliates (collectively, “Deloitte Entities”) in each of the last two fiscal years for services rendered to Fidelity Advisor Biotechnology Fund, Fidelity Advisor Consumer Discretionary Fund, Fidelity Advisor Energy Fund, Fidelity Advisor Financials Fund, Fidelity Advisor Global Real Estate Fund, Fidelity Advisor Health Care Fund, Fidelity Advisor Industrials Fund, Fidelity Advisor Real Estate Fund, Fidelity Advisor Semiconductors Fund, Fidelity Advisor Technology Fund and Fidelity Advisor Utilities Fund (the “Funds”):
Services Billed by Deloitte Entities
July 31, 2024 FeesA
| | | | |
| Audit Fees | Audit-Related Fees | Tax Fees | All Other Fees |
Fidelity Advisor Biotechnology Fund | $51,800 | $- | $7,700 | $1,300 |
Fidelity Advisor Consumer Discretionary Fund | $34,400 | $- | $9,200 | $900 |
Fidelity Advisor Energy Fund | $36,300 | $- | $10,800 | $1,000 |
Fidelity Advisor Financials Fund | $36,200 | $- | $11,100 | $1,000 |
Fidelity Advisor Global Real Estate Fund | $43,700 | $- | $9,800 | $1,100 |
Fidelity Advisor Health Care Fund | $36,300 | $- | $9,900 | $1,000 |
Fidelity Advisor Industrials Fund | $38,300 | $- | $10,900 | $900 |
Fidelity Advisor Real Estate Fund | $38,300 | $- | $8,900 | $1,000 |
Fidelity Advisor Semiconductors Fund | $34,200 | $- | $8,200 | $900 |
Fidelity Advisor Technology Fund | $37,900 | $- | $9,400 | $1,000 |
Fidelity Advisor Utilities Fund | $34,000 | $- | $9,700 | $900 |
|
|
|
|
|
| | | | |
| Audit Fees | Audit-Related Fees | Tax Fees | All Other Fees |
Fidelity Advisor Biotechnology Fund | $51,900 | $- | $7,200 | $1,300 |
Fidelity Advisor Consumer Discretionary Fund | $34,500 | $- | $8,700 | $900 |
Fidelity Advisor Energy Fund | $36,500 | $- | $10,000 | $1,000 |
Fidelity Advisor Financials Fund | $36,400 | $- | $9,700 | $1,000 |
Fidelity Advisor Global Real Estate Fund | $43,900 | $- | $8,900 | $1,100 |
Fidelity Advisor Health Care Fund | $36,400 | $- | $8,900 | $1,000 |
Fidelity Advisor Industrials Fund | $35,400 | $- | $8,700 | $900 |
Fidelity Advisor Real Estate Fund | $38,500 | $- | $8,700 | $1,000 |
Fidelity Advisor Semiconductors Fund | $34,500 | $- | $7,200 | $900 |
Fidelity Advisor Technology Fund | $38,100 | $- | $8,900 | $1,000 |
Fidelity Advisor Utilities Fund | $34,100 | $- | $8,900 | $900 |
A Amounts may reflect rounding.
The following table(s) present(s) fees billed by Deloitte Entities that were required to be approved by the Audit Committee for services that relate directly to the operations and financial reporting of the Fund(s) and that are rendered on behalf of Fidelity Management & Research Company LLC ("FMR") and entities controlling, controlled by, or under
common control with FMR (not including any sub-adviser whose role is primarily portfolio management and is subcontracted with or overseen by another investment adviser) that provide ongoing services to the Fund(s) (“Fund Service Providers”):
Services Billed by Deloitte Entities
| | |
| July 31, 2024A | July 31, 2023A |
Audit-Related Fees | $200,000 | $80,000 |
Tax Fees | $- | $- |
All Other Fees | $1,929,500 | $- |
A Amounts may reflect rounding.
“Audit-Related Fees” represent fees billed for assurance and related services that are reasonably related to the performance of the fund audit or the review of the fund's financial statements and that are not reported under Audit Fees.
“Tax Fees” represent fees billed for tax compliance, tax advice or tax planning that relate directly to the operations and financial reporting of the fund.
“All Other Fees” represent fees billed for services provided to the fund or Fund Service Provider, a significant portion of which are assurance related, that relate directly to the operations and financial reporting of the fund, excluding those services that are reported under Audit Fees, Audit-Related Fees or Tax Fees.
Assurance services must be performed by an independent public accountant.
* * *
The aggregate non-audit fees billed by Deloitte Entities for services rendered to the Fund(s), FMR (not including any sub-adviser whose role is primarily portfolio management and is subcontracted with or overseen by another investment adviser), and any Fund Service Provider for each of the last two fiscal years of the Fund(s) are as follows:
| | |
Billed By | July 31, 2024A | July 31, 2023A |
Deloitte Entities | $5,065,100 | $3,404,800 |
A Amounts may reflect rounding.
The trust's Audit Committee has considered non-audit services that were not pre-approved that were provided by Deloitte Entities to Fund Service Providers to be compatible with maintaining the independence of Deloitte Entities in its(their) audit of the Fund(s), taking into account representations from Deloitte Entities, in accordance with Public Company Accounting Oversight Board rules, regarding its independence from the Fund(s) and its(their) related entities and FMR’s review of the appropriateness and permissibility under applicable law of such non-audit services prior to their provision to the Fund(s) Service Providers.
Audit Committee Pre-Approval Policies and Procedures
The trust’s Audit Committee must pre-approve all audit and non-audit services provided by a fund’s independent registered public accounting firm relating to the operations or financial reporting of the fund. Prior to the commencement of any audit or non-audit services to a fund, the Audit Committee reviews the services to determine whether they are appropriate and permissible under applicable law.
The Audit Committee has adopted policies and procedures to, among other purposes, provide a framework for the Committee’s consideration of non-audit services by the audit firms that audit the Fidelity funds. The policies and procedures require that any non-audit service provided by a fund audit firm to a Fidelity fund and any non-audit service provided by a fund auditor to a Fund Service Provider that relates directly to the operations and financial reporting of a Fidelity fund (“Covered Service”) are subject to approval by the Audit Committee before such service is provided.
All Covered Services must be approved in advance of provision of the service either: (i) by formal resolution of the Audit Committee, or (ii) by oral or written approval of the service by the Chair of the Audit Committee (or if the Chair is unavailable, such other member of the Audit Committee as may be designated by the Chair to act in the Chair’s absence). The approval contemplated by (ii) above is permitted where the Treasurer determines that action on such an engagement is necessary before the next meeting of the Audit Committee.
Non-audit services provided by a fund audit firm to a Fund Service Provider that do not relate directly to the operations and financial reporting of a Fidelity fund are reported to the Audit Committee periodically.
Non-Audit Services Approved Pursuant to Rule 2-01(c)(7)(i)(C) and (ii) of Regulation S-X (“De Minimis Exception”)
There were no non-audit services approved or required to be approved by the Audit Committee pursuant to the De Minimis Exception during the Fund’s(s’) last two fiscal years relating to services provided to (i) the Fund(s) or (ii) any Fund Service Provider that relate directly to the operations and financial reporting of the Fund(s).
The Registrant has not retained, for the preparation of the audit report on the financial statements included in the Form N-CSR, a registered public accounting firm that has a branch or office that is located in a foreign jurisdiction and that the Public Company Accounting Oversight Board (the “PCAOB”) has determined that the PCAOB is unable to inspect or investigate completely because of a position taken by an authority in the foreign jurisdiction.
The Registrant is not a “foreign issuer,” as defined in 17 CFR 240.3b-4.
Item 5.
Audit Committee of Listed Registrants
Not applicable.
Item 6.
Investments
(a)
Not applicable.
(b)
Not applicable.
Item 7.
Financial Statements and Financial Highlights for Open-End Management Investment Companies
Fidelity Advisor Focus Funds®
Fidelity Advisor® Biotechnology Fund
Fidelity Advisor® Consumer Discretionary Fund
Fidelity Advisor® Energy Fund
Fidelity Advisor® Financials Fund
Fidelity Advisor® Health Care Fund
Fidelity Advisor® Industrials Fund
Fidelity Advisor® Semiconductors Fund
Fidelity Advisor® Technology Fund
Fidelity Advisor® Utilities Fund
Annual Report
July 31, 2024
Contents
To view a fund's proxy voting guidelines and proxy voting record for the 12-month period ended June 30, visit http://www.fidelity.com/proxyvotingresults or visit the Securities and Exchange Commission's (SEC) web site at http://www.sec.gov.
You may also call 1-877-208-0098 to request a free copy of the proxy voting guidelines.
Standard & Poor's, S&P and S&P 500 are registered service marks of The McGraw-Hill Companies, Inc. and have been licensed for use by Fidelity Distributors Corporation.
Other third-party marks appearing herein are the property of their respective owners.
All other marks appearing herein are registered or unregistered trademarks or service marks of FMR LLC or an affiliated company. © 2024 FMR LLC. All rights reserved.
This report and the financial statements contained herein are submitted for the general information of the shareholders of the Funds. This report is not authorized for distribution to prospective investors in the Funds unless preceded or accompanied by an effective prospectus.
A fund files its complete schedule of portfolio holdings with the SEC for the first and third quarters of each fiscal year on Form N-PORT. Forms N-PORT are available on the SEC's web site at http://www.sec.gov. A fund's Forms N-PORT may be reviewed and copied at the SEC's Public Reference Room in Washington, DC. Information regarding the operation of the SEC's Public Reference Room may be obtained by calling 1-800-SEC-0330.
For a complete list of a fund's portfolio holdings, view the most recent holdings listing, semiannual report, or annual report on Fidelity's web site at http://www.fidelity.com, http://www.institutional.fidelity.com, or http://www.401k.com, as applicable.
NOT FDIC INSURED •MAY LOSE VALUE •NO BANK GUARANTEE
Neither the Funds nor Fidelity Distributors Corporation is a bank.
Item 7: Consolidated Financial Statements and Consolidated Financial Highlights for Open-End Management Investment Companies (Annual Report)
Fidelity Advisor® Biotechnology Fund
Schedule of Investments July 31, 2024
Showing Percentage of Net Assets
| Common Stocks - 96.7% |
| | | Shares | Value ($) |
| Biotechnology - 91.1% | | | |
| Biotechnology - 91.1% | | | |
| AbbVie, Inc. | | 1,777,380 | 329,384,061 |
| Acelyrin, Inc. (a)(b) | | 1,264,947 | 7,589,682 |
| Allakos, Inc. (a)(c) | | 4,856,700 | 4,371,030 |
| Allogene Therapeutics, Inc. (a)(b) | | 2,074,832 | 6,100,006 |
| Alnylam Pharmaceuticals, Inc. (a) | | 345,386 | 82,015,360 |
| ALX Oncology Holdings, Inc. (a)(b) | | 920,239 | 4,417,147 |
| Amgen, Inc. | | 513,303 | 170,657,848 |
| AnaptysBio, Inc. (a)(b) | | 423,100 | 14,740,804 |
| Annexon, Inc. (a) | | 501,548 | 3,214,923 |
| Apellis Pharmaceuticals, Inc. (a) | | 333,600 | 13,210,560 |
| Apogee Therapeutics, Inc. (b) | | 470,123 | 22,894,990 |
| Arcellx, Inc. (a) | | 384,000 | 23,735,040 |
| Argenx SE ADR (a) | | 132,000 | 68,094,840 |
| Arrowhead Pharmaceuticals, Inc. (a) | | 399,890 | 11,420,858 |
| Ascendis Pharma A/S sponsored ADR (a)(b) | | 474,825 | 63,389,138 |
| Astria Therapeutics, Inc. (a)(b) | | 978,738 | 11,431,660 |
| Astria Therapeutics, Inc. warrants (a) | | 247,630 | 1,600,130 |
| Autolus Therapeutics PLC ADR (a)(b) | | 3,009,146 | 14,112,895 |
| Bicycle Therapeutics PLC ADR (a)(b) | | 150,200 | 3,651,362 |
| Blueprint Medicines Corp. (a) | | 157,026 | 17,005,916 |
| Boundless Bio, Inc. | | 189,933 | 731,242 |
| Boundless Bio, Inc. | | 9,400 | 36,190 |
| BridgeBio Pharma, Inc. (d) | | 393,764 | 10,218,176 |
| BridgeBio Pharma, Inc. (a) | | 245,200 | 6,362,940 |
| Cargo Therapeutics, Inc. | | 204,001 | 3,474,137 |
| Cargo Therapeutics, Inc. (d) | | 169,762 | 2,891,047 |
| Cartesian Therapeutics, Inc. (d) | | 167,950 | 2,737,585 |
| Celldex Therapeutics, Inc. (a) | | 426,252 | 16,244,464 |
| Cogent Biosciences, Inc. (a)(b) | | 1,331,700 | 12,557,931 |
| Crinetics Pharmaceuticals, Inc. (a) | | 534,100 | 28,371,392 |
| Cytokinetics, Inc. (a) | | 796,371 | 46,993,853 |
| Denali Therapeutics, Inc. (a) | | 243,007 | 5,922,081 |
| Dianthus Therapeutics, Inc. (a) | | 500,662 | 14,909,714 |
| Exact Sciences Corp. (a) | | 228,200 | 10,424,176 |
| Immunovant, Inc. (a) | | 466,900 | 13,572,783 |
| Insmed, Inc. (a) | | 137,200 | 9,981,300 |
| Janux Therapeutics, Inc. (a) | | 391,585 | 15,898,351 |
| Keros Therapeutics, Inc. (a) | | 249,200 | 12,499,872 |
| Kymera Therapeutics, Inc. (a) | | 43,000 | 1,986,600 |
| Larimar Therapeutics, Inc. (a) | | 524,800 | 4,403,072 |
| Madrigal Pharmaceuticals, Inc. (a)(b) | | 81,600 | 23,228,256 |
| Merus BV (a)(b) | | 473,500 | 25,114,440 |
| Mineralys Therapeutics, Inc. (a)(b) | | 301,700 | 3,738,063 |
| Monte Rosa Therapeutics, Inc. (a)(b) | | 982,758 | 4,442,066 |
| Moonlake Immunotherapeutics Class A (a)(b) | | 204,962 | 8,536,667 |
| Neurogene, Inc. (a)(b) | | 133,000 | 5,471,620 |
| Nuvalent, Inc. Class A (a)(b) | | 341,177 | 27,273,689 |
| ORIC Pharmaceuticals, Inc. (a)(b) | | 581,716 | 6,515,219 |
| Perspective Therapeutics, Inc. (a)(b) | | 309,233 | 4,205,569 |
| Q32 Bio, Inc. (a)(b) | | 241,078 | 9,180,250 |
| Regeneron Pharmaceuticals, Inc. (a) | | 117,500 | 126,804,825 |
| Revolution Medicines, Inc. (a) | | 375,200 | 17,124,128 |
| Sarepta Therapeutics, Inc. (a) | | 190,200 | 27,054,048 |
| Savara, Inc. (a) | | 986,500 | 4,537,900 |
| Scholar Rock Holding Corp. (a)(b) | | 448,880 | 4,075,830 |
| Scholar Rock Holding Corp. warrants 12/31/25 (a)(d) | | 6,000 | 18,854 |
| Shattuck Labs, Inc. (a)(b) | | 1,318,444 | 5,247,407 |
| Spyre Therapeutics, Inc. (a) | | 629,468 | 17,310,370 |
| Tango Therapeutics, Inc. (d) | | 317,852 | 3,130,842 |
| Tango Therapeutics, Inc. (a)(b) | | 406,869 | 4,007,660 |
| Tectonic Therapeutic, Inc. (d) | | 72,841 | 1,305,311 |
| Tyra Biosciences, Inc. (a)(b) | | 390,888 | 8,662,078 |
| Vaxcyte, Inc. (a) | | 598,729 | 47,233,731 |
| Vertex Pharmaceuticals, Inc. (a) | | 172,400 | 85,462,128 |
| Viking Therapeutics, Inc. (a)(b) | | 716,687 | 40,851,159 |
| Viridian Therapeutics, Inc. (a) | | 1,284,907 | 21,650,683 |
| Xenon Pharmaceuticals, Inc. (a) | | 525,558 | 22,667,317 |
| Zentalis Pharmaceuticals, Inc. (a) | | 667,156 | 2,595,237 |
| | | | 1,650,700,503 |
| Pharmaceuticals - 5.6% | | | |
| Pharmaceuticals - 5.6% | | | |
| Afferent Pharmaceuticals, Inc. rights 12/31/24 (a)(e) | | 1,915,787 | 383,157 |
| Alto Neuroscience, Inc. (b) | | 289,600 | 3,121,888 |
| Arvinas Holding Co. LLC (a) | | 324,800 | 8,935,248 |
| Axsome Therapeutics, Inc. (a)(b) | | 53,100 | 4,636,161 |
| Contineum Therapeutics, Inc. Class A (b) | | 264,800 | 5,311,888 |
| Edgewise Therapeutics, Inc. (a) | | 199,100 | 3,390,673 |
| Enliven Therapeutics, Inc. (d) | | 73,200 | 1,931,016 |
| Enliven Therapeutics, Inc. (a)(b) | | 676,113 | 17,835,861 |
| Enliven Therapeutics, Inc. rights (a)(e) | | 739,725 | 7 |
| Longboard Pharmaceuticals, Inc. (a) | | 286,270 | 9,515,615 |
| Neumora Therapeutics, Inc. (b) | | 902,400 | 11,604,864 |
| Rapport Therapeutics, Inc. | | 13,400 | 304,448 |
| Rapport Therapeutics, Inc. | | 167,046 | 3,795,285 |
| Structure Therapeutics, Inc. ADR (a)(b) | | 315,269 | 11,787,908 |
| UCB SA | | 117,600 | 19,682,708 |
| | | | 102,236,727 |
| TOTAL COMMON STOCKS (Cost $1,068,889,691) | | | 1,752,937,230 |
| | | | |
| Convertible Preferred Stocks - 1.8% |
| | | Shares | Value ($) |
| Biotechnology - 1.5% | | | |
| Biotechnology - 1.5% | | | |
| Bright Peak Therapeutics, Inc.: | | | |
| Series B (a)(d)(e) | | 1,920,122 | 3,129,799 |
| Series C (d)(e) | | 873,604 | 995,909 |
| Cardurion Pharmaceuticals, Inc. Series B (d)(e) | | 331,596 | 1,624,025 |
| Endeavor BioMedicines, Inc. Series C (d)(e) | | 526,643 | 3,781,297 |
| Fog Pharmaceuticals, Inc. Series D (a)(d)(e) | | 239,281 | 1,459,614 |
| LifeMine Therapeutics, Inc. Series C (a)(d)(e) | | 1,950,028 | 4,036,558 |
| Sonoma Biotherapeutics, Inc.: | | | |
| Series B (a)(d)(e) | | 1,967,762 | 5,647,477 |
| Series B1 (a)(d)(e) | | 1,049,456 | 3,400,237 |
| T-Knife Therapeutics, Inc. Series B (a)(d)(e) | | 1,300,097 | 2,171,162 |
| Treeline Biosciences Series A (a)(d)(e) | | 47,600 | 427,448 |
| | | | 26,673,526 |
| Financial Services - 0.2% | | | |
| Diversified Financial Services - 0.2% | | | |
| Kartos Therapeutics, Inc. Series C (d)(e) | | 530,692 | 3,422,963 |
| Health Care Technology - 0.1% | | | |
| Health Care Technology - 0.1% | | | |
| Wugen, Inc. Series B (a)(d)(e) | | 580,277 | 2,413,952 |
| Pharmaceuticals - 0.0% | | | |
| Pharmaceuticals - 0.0% | | | |
| Afferent Pharmaceuticals, Inc. Series C (a)(d)(e) | | 1,915,787 | 19 |
| TOTAL CONVERTIBLE PREFERRED STOCKS (Cost $42,469,781) | | | 32,510,460 |
| | | | |
| Convertible Bonds - 0.1% |
| | | Principal Amount (f) | Value ($) |
| Health Care Technology - 0.1% | | | |
| Health Care Technology - 0.1% | | | |
Wugen, Inc. 10% 6/14/25 (d)(e) (Cost $831,313) | | 831,313 | 850,350 |
| | | | |
| Money Market Funds - 9.7% |
| | | Shares | Value ($) |
| Fidelity Cash Central Fund 5.39% (g) | | 21,077,669 | 21,081,884 |
| Fidelity Securities Lending Cash Central Fund 5.39% (g)(h) | | 155,084,448 | 155,099,956 |
| TOTAL MONEY MARKET FUNDS (Cost $176,177,717) | | | 176,181,840 |
| | | | |
| TOTAL INVESTMENT IN SECURITIES - 108.3% (Cost $1,288,368,502) | 1,962,479,880 |
NET OTHER ASSETS (LIABILITIES) - (8.3)% | (150,295,899) |
| NET ASSETS - 100.0% | 1,812,183,981 |
| | |
Legend
| (b) | Security or a portion of the security is on loan at period end. |
| (d) | Restricted securities (including private placements) - Investment in securities not registered under the Securities Act of 1933 (excluding 144A issues). At the end of the period, the value of restricted securities (excluding 144A issues) amounted to $55,593,641 or 3.1% of net assets. |
| (f) | Amount is stated in United States dollars unless otherwise noted. |
| (g) | Affiliated fund that is generally available only to investment companies and other accounts managed by Fidelity Investments. The rate quoted is the annualized seven-day yield of the fund at period end. A complete unaudited listing of the fund's holdings as of its most recent quarter end is available upon request. In addition, each Fidelity Central Fund's financial statements, which are not covered by the Fund's Report of Independent Registered Public Accounting Firm, are available on the SEC's website or upon request. |
| (h) | Investment made with cash collateral received from securities on loan. |
| Additional information on each restricted holding is as follows: |
| Security | Acquisition Date | Acquisition Cost ($) |
| Afferent Pharmaceuticals, Inc. Series C | 7/01/15 | 0 |
| | | |
| BridgeBio Pharma, Inc. | 9/25/23 | 10,737,944 |
| | | |
| Bright Peak Therapeutics, Inc. Series B | 5/14/21 | 7,499,997 |
| | | |
| Bright Peak Therapeutics, Inc. Series C | 5/07/24 | 990,230 |
| | | |
| Cardurion Pharmaceuticals, Inc. Series B | 7/10/24 | 1,624,025 |
| | | |
| Cargo Therapeutics, Inc. | 5/28/24 | 2,885,954 |
| | | |
| Cartesian Therapeutics, Inc. | 7/02/24 | 3,359,000 |
| | | |
| Endeavor BioMedicines, Inc. Series C | 4/22/24 | 3,436,135 |
| | | |
| Enliven Therapeutics, Inc. | 3/19/24 | 1,024,800 |
| | | |
| Fog Pharmaceuticals, Inc. Series D | 11/17/22 | 2,575,405 |
| | | |
| Kartos Therapeutics, Inc. Series C | 8/22/23 | 3,000,002 |
| | | |
| LifeMine Therapeutics, Inc. Series C | 2/15/22 | 3,971,408 |
| | | |
| Scholar Rock Holding Corp. warrants 12/31/25 | 6/17/22 | 0 |
| | | |
| Sonoma Biotherapeutics, Inc. Series B | 7/26/21 | 3,888,888 |
| | | |
| Sonoma Biotherapeutics, Inc. Series B1 | 7/26/21 | 3,111,112 |
| | | |
| T-Knife Therapeutics, Inc. Series B | 6/30/21 | 7,500,000 |
| | | |
| Tango Therapeutics, Inc. | 8/09/23 | 1,636,938 |
| | | |
| Tectonic Therapeutic, Inc. | 1/30/24 | 1,689,995 |
| | | |
| Treeline Biosciences Series A | 7/30/21 | 372,589 |
| | | |
| Wugen, Inc. Series B | 7/09/21 | 4,499,990 |
| | | |
| Wugen, Inc. 10% 6/14/25 | 6/14/24 | 831,313 |
| | | |
Affiliated Central Funds
Fiscal year to date information regarding the Fund's investments in Fidelity Central Funds, including the ownership percentage, is presented below.
| Affiliate | Value, beginning of period ($) | Purchases ($) | Sales Proceeds ($) | Dividend Income ($) | Realized Gain (loss) ($) | Change in Unrealized appreciation (depreciation) ($) | Value, end of period ($) | % ownership, end of period |
| Fidelity Cash Central Fund 5.39% | 14,192,363 | 609,044,110 | 602,155,374 | 714,416 | 785 | - | 21,081,884 | 0.0% |
| Fidelity Securities Lending Cash Central Fund 5.39% | 200,794,912 | 1,013,864,473 | 1,059,559,429 | 1,406,063 | - | - | 155,099,956 | 0.7% |
| Total | 214,987,275 | 1,622,908,583 | 1,661,714,803 | 2,120,479 | 785 | - | 176,181,840 | |
| | | | | | | | | |
Amounts in the dividend income column in the above table include any capital gain distributions from underlying funds, which are presented in the corresponding line item in the Statement of Operations, if applicable.
Amounts in the dividend income column for Fidelity Securities Lending Cash Central Fund represents the income earned on investing cash collateral, less rebates paid to borrowers and any lending agent fees associated with the loan, plus any premium payments received for lending certain types of securities.
Amounts included in the purchases and sales proceeds columns may include in-kind transactions, if applicable.
Other Affiliated Issuers
An affiliated company is a company in which the Fund has ownership of at least 5% of the voting securities. Fiscal year to date transactions with companies which are or were affiliates are presented in the table below. Certain corporate actions, such as mergers, are excluded from the amounts in this table if applicable. A dash in the Value end of period ($) column means either the issuer is no longer held at period end, or the issuer is held at period end but is no longer an affiliate.
| Affiliate | Value, beginning of period ($) | Purchases ($) | Sales Proceeds ($) | Dividend Income ($) | Realized Gain (loss) ($) | Change in Unrealized appreciation (depreciation) ($) | Value, end of period ($) |
| Allakos, Inc. | - | 7,909,224 | - | - | - | (3,538,194) | 4,371,030 |
| Total | - | 7,909,224 | - | - | - | (3,538,194) | 4,371,030 |
Amounts included in the purchases and sales proceeds columns may include in-kind transactions, if applicable.
Investment Valuation
The following is a summary of the inputs used, as of July 31, 2024, involving the Fund's assets and liabilities carried at fair value. The inputs or methodology used for valuing securities may not be an indication of the risk associated with investing in those securities. For more information on valuation inputs, and their aggregation into the levels used below, please refer to the Investment Valuation section in the accompanying Notes to Financial Statements.
| Valuation Inputs at Reporting Date: |
| Description | Total ($) | Level 1 ($) | Level 2 ($) | Level 3 ($) |
Investments in Securities: | | | | |
|
| Common Stocks | 1,752,937,230 | 1,750,935,082 | 1,618,984 | 383,164 |
|
| Convertible Preferred Stocks | 32,510,460 | - | - | 32,510,460 |
|
| Convertible Bonds | 850,350 | - | - | 850,350 |
|
| Money Market Funds | 176,181,840 | 176,181,840 | - | - |
| Total Investments in Securities: | 1,962,479,880 | 1,927,116,922 | 1,618,984 | 33,743,974 |
| | | | | |
|
| Net Unrealized Appreciation on Unfunded Commitments | 2,795,057 | - | - | 2,795,057 |
| Total | 2,795,057 | - | - | 2,795,057 |
The following is a reconciliation of Investments in Securities for which Level 3 inputs were used in determining value:
| |
| Investments in Securities: | |
| Convertible Preferred Stocks | | | |
| Beginning Balance | $ | 39,058,366 | |
| Net Realized Gain (Loss) on Investment Securities | | - | |
| Net Unrealized Gain (Loss) on Investment Securities | | (4,634,964) | |
| Cost of Purchases | | 9,050,392 | |
| Proceeds of Sales | | (3,734,583) | |
| Amortization/Accretion | | - | |
| Transfers into Level 3 | | - | |
| Transfers out of Level 3 | | (7,228,751) | |
| Ending Balance | $ | 32,510,460 | |
| The change in unrealized gain (loss) for the period attributable to Level 3 securities held at July 31, 2024 | $ | (4,637,469) | |
| Other Investments in Securities | | | |
| Beginning Balance | $ | 3,827,453 | |
| Net Realized Gain (Loss) on Investment Securities | | - | |
| Net Unrealized Gain (Loss) on Investment Securities | | (1,666,856) | |
| Cost of Purchases | | 831,313 | |
| Proceeds of Sales | | - | |
| Amortization/Accretion | | - | |
| Transfers into Level 3 | | - | |
| Transfers out of Level 3 | | (1,758,396) | |
| Ending Balance | $ | 1,233,514 | |
| The change in unrealized gain (loss) for the period attributable to Level 3 securities held at July 31, 2024 | $ | (1,666,856) | |
| The information used in the above reconciliation represents fiscal year to date activity for any Investments in Securities identified as using Level 3 inputs at either the beginning or the end of the current fiscal period. Cost of purchases and proceeds of sales may include securities received and/or delivered through in-kind transactions, corporate actions or exchanges. Transfers into Level 3 were attributable to a lack of observable market data resulting from decreases in market activity, decreases in liquidity, security restructurings or corporate actions. Transfers out of Level 3 were attributable to observable market data becoming available for those securities. Transfers in or out of Level 3 represent the beginning value of any Security or Instrument where a change in the pricing level occurred from the beginning to the end of the period. Realized and unrealized gains (losses) disclosed in the reconciliation are included in Net Gain (Loss) on the Fund's Statement of Operations. | |
Fidelity Advisor® Biotechnology Fund
Financial Statements
| Statement of Assets and Liabilities |
As of July 31, 2024 |
| Assets | | | | |
| Investment in securities, at value (including securities loaned of $151,541,804) - See accompanying schedule: | | | | |
Unaffiliated issuers (cost $1,104,281,561) | $ | 1,781,927,010 | | |
Fidelity Central Funds (cost $176,177,717) | | 176,181,840 | | |
Other affiliated issuers (cost $7,909,224) | | 4,371,030 | | |
| | | | | |
| | | | | |
| Total Investment in Securities (cost $1,288,368,502) | | | $ | 1,962,479,880 |
| Cash | | | | 6,281 |
| Unrealized appreciation on unfunded commitments | | | | 2,795,057 |
| Receivable for fund shares sold | | | | 1,635,553 |
| Dividends receivable | | | | 2,889,727 |
| Interest receivable | | | | 10,853 |
| Distributions receivable from Fidelity Central Funds | | | | 147,464 |
| Prepaid expenses | | | | 2,257 |
| Other receivables | | | | 1,945 |
Total assets | | | | 1,969,969,017 |
| Liabilities | | | | |
| Payable for investments purchased | $ | 14,690 | | |
| Payable for fund shares redeemed | | 1,294,831 | | |
| Accrued management fee | | 1,003,967 | | |
| Distribution and service plan fees payable | | 278,244 | | |
| Other payables and accrued expenses | | 126,451 | | |
| Collateral on securities loaned | | 155,066,853 | | |
| Total liabilities | | | | 157,785,036 |
| Net Assets | | | $ | 1,812,183,981 |
| Net Assets consist of: | | | | |
| Paid in capital | | | $ | 1,095,097,712 |
| Total accumulated earnings (loss) | | | | 717,086,269 |
| Net Assets | | | $ | 1,812,183,981 |
| | | | | |
| Net Asset Value and Maximum Offering Price | | | | |
| Class A : | | | | |
Net Asset Value and redemption price per share ($737,152,466 ÷ 22,797,329 shares)(a) | | | $ | 32.34 |
| Maximum offering price per share (100/94.25 of $32.34) | | | $ | 34.31 |
| Class M : | | | | |
Net Asset Value and redemption price per share ($130,546,655 ÷ 4,416,733 shares)(a) | | | $ | 29.56 |
| Maximum offering price per share (100/96.50 of $29.56) | | | $ | 30.63 |
| Class C : | | | | |
Net Asset Value and offering price per share ($92,045,601 ÷ 3,636,052 shares)(a) | | | $ | 25.31 |
| Class I : | | | | |
Net Asset Value, offering price and redemption price per share ($768,135,863 ÷ 21,714,490 shares) | | | $ | 35.37 |
| Class Z : | | | | |
Net Asset Value, offering price and redemption price per share ($84,303,396 ÷ 2,377,006 shares) | | | $ | 35.47 |
(a)Redemption price per share is equal to net asset value less any applicable contingent deferred sales charge. |
| Statement of Operations |
| Year ended July 31, 2024 |
| Investment Income | | | | |
| Dividends | | | $ | 19,987,119 |
| Interest | | | | 10,853 |
| Income from Fidelity Central Funds (including $1,406,063 from security lending) | | | | 2,120,479 |
| Total income | | | | 22,118,451 |
| Expenses | | | | |
| Management fee | $ | 9,602,224 | | |
| Transfer agent fees | | 1,600,789 | | |
| Distribution and service plan fees | | 3,173,036 | | |
| Accounting fees | | 250,241 | | |
| Custodian fees and expenses | | 71,670 | | |
| Independent trustees' fees and expenses | | 7,837 | | |
| Registration fees | | 81,377 | | |
| Audit fees | | 69,855 | | |
| Legal | | 7,551 | | |
| Interest | | 10,909 | | |
| Miscellaneous | | 24,632 | | |
| Total expenses before reductions | | 14,900,121 | | |
| Expense reductions | | (105,663) | | |
| Total expenses after reductions | | | | 14,794,458 |
| Net Investment income (loss) | | | | 7,323,993 |
| Realized and Unrealized Gain (Loss) | | | | |
| Net realized gain (loss) on: | | | | |
| Investment Securities: | | | | |
| Unaffiliated issuers | | 91,726,863 | | |
| Fidelity Central Funds | | 785 | | |
| Foreign currency transactions | | 16,501 | | |
| Total net realized gain (loss) | | | | 91,744,149 |
| Change in net unrealized appreciation (depreciation) on: | | | | |
| Investment Securities: | | | | |
| Unaffiliated issuers | | 316,453,971 | | |
| Affiliated issuers | | (3,538,194) | | |
| Unfunded commitments | | 2,895,903 | | |
| Assets and liabilities in foreign currencies | | 404 | | |
| Total change in net unrealized appreciation (depreciation) | | | | 315,812,084 |
| Net gain (loss) | | | | 407,556,233 |
| Net increase (decrease) in net assets resulting from operations | | | $ | 414,880,226 |
| Statement of Changes in Net Assets |
| |
| | Year ended July 31, 2024 | | Year ended July 31, 2023 |
| Increase (Decrease) in Net Assets | | | | |
| Operations | | | | |
| Net investment income (loss) | $ | 7,323,993 | $ | 1,917,025 |
| Net realized gain (loss) | | 91,744,149 | | 80,783,949 |
| Change in net unrealized appreciation (depreciation) | | 315,812,084 | | 158,023,113 |
| Net increase (decrease) in net assets resulting from operations | | 414,880,226 | | 240,724,087 |
| Distributions to shareholders | | (18,817,060) | | - |
| | | | | |
| Share transactions - net increase (decrease) | | (217,017,143) | | (240,917,348) |
| Total increase (decrease) in net assets | | 179,046,023 | | (193,261) |
| | | | | |
| Net Assets | | | | |
| Beginning of period | | 1,633,137,958 | | 1,633,331,219 |
| End of period | $ | 1,812,183,981 | $ | 1,633,137,958 |
| | | | | |
| | | | | |
Financial Highlights
Fidelity Advisor® Biotechnology Fund Class A |
| |
| Years ended July 31, | | 2024 | | 2023 | | 2022 | | 2021 | | 2020 |
Selected Per-Share Data | | | | | | | | | | |
| Net asset value, beginning of period | $ | 25.34 | $ | 22.00 | $ | 32.58 | $ | 31.03 | $ | 25.48 |
| Income from Investment Operations | | | | | | | | | | |
Net investment income (loss) A,B | | .10 | | .02 | | (.06) | | .07 | | .03 |
| Net realized and unrealized gain (loss) | | 7.22 | | 3.32 | | (5.16) | | 4.42 | | 7.40 |
| Total from investment operations | | 7.32 | | 3.34 | | (5.22) | | 4.49 | | 7.43 |
| Distributions from net investment income | | (.32) | | - | | (.11) | | (.13) | | - |
| Distributions from net realized gain | | - | | - | | (5.25) | | (2.81) | | (1.88) |
| Total distributions | | (.32) | | - | | (5.36) | | (2.94) | | (1.88) |
| Net asset value, end of period | $ | 32.34 | $ | 25.34 | $ | 22.00 | $ | 32.58 | $ | 31.03 |
Total Return C,D | | | | 15.18% | | (18.95)% | | 14.03% | | 30.00% |
Ratios to Average Net Assets B,E,F | | | | | | | | | | |
| Expenses before reductions | | .99% | | 1.01% | | 1.00% | | 1.01% | | 1.02% |
| Expenses net of fee waivers, if any | | | | 1.00% | | 1.00% | | 1.00% | | 1.02% |
| Expenses net of all reductions | | .98% | | 1.00% | | 1.00% | | 1.00% | | 1.02% |
| Net investment income (loss) | | .39% | | .07% | | (.23)% | | .20% | | .11% |
| Supplemental Data | | | | | | | | | | |
| Net assets, end of period (000 omitted) | $ | 737,152 | $ | 636,505 | $ | 594,911 | $ | 808,610 | $ | 722,896 |
Portfolio turnover rate G | | | | 78% | | 43% | | 72% | | 66% |
ACalculated based on average shares outstanding during the period.
BNet investment income (loss) is affected by the timing of the declaration of dividends by any underlying mutual funds or exchange-traded funds (ETFs). Net investment income (loss) of any mutual funds or ETFs is not included in the Fund's net investment income (loss) ratio.
CTotal returns would have been lower if certain expenses had not been reduced during the applicable periods shown.
DTotal returns do not include the effect of the sales charges.
EFees and expenses of any underlying mutual funds or exchange-traded funds (ETFs) are not included in the Fund's expense ratio. The Fund indirectly bears its proportionate share of these expenses. For additional expense information related to investments in Fidelity Central Funds, please refer to the "Investments in Fidelity Central Funds" note found in the Notes to Financial Statements section of the most recent Annual or Semi-Annual report.
FExpense ratios reflect operating expenses of the class. Expenses before reductions do not reflect amounts reimbursed, waived, or reduced through arrangements with the investment adviser, brokerage services, or other offset arrangements, if applicable, and do not represent the amount paid by the class during periods when reimbursements, waivers or reductions occur.
GAmount does not include the portfolio activity of any underlying mutual funds or exchange-traded funds (ETFs).
Fidelity Advisor® Biotechnology Fund Class M |
| |
| Years ended July 31, | | 2024 | | 2023 | | 2022 | | 2021 | | 2020 |
Selected Per-Share Data | | | | | | | | | | |
| Net asset value, beginning of period | $ | 23.17 | $ | 20.17 | $ | 30.35 | $ | 29.08 | $ | 24.02 |
| Income from Investment Operations | | | | | | | | | | |
Net investment income (loss) A,B | | .03 | | (.05) | | (.13) | | (.02) | | (.05) |
| Net realized and unrealized gain (loss) | | 6.59 | | 3.05 | | (4.73) | | 4.14 | | 6.96 |
| Total from investment operations | | 6.62 | | 3.00 | | (4.86) | | 4.12 | | 6.91 |
| Distributions from net investment income | | (.23) | | - | | (.07) | | (.07) | | - |
| Distributions from net realized gain | | - | | - | | (5.25) | | (2.78) | | (1.85) |
| Total distributions | | (.23) | | - | | (5.32) | | (2.85) | | (1.85) |
| Net asset value, end of period | $ | 29.56 | $ | 23.17 | $ | 20.17 | $ | 30.35 | $ | 29.08 |
Total Return C,D | | | | 14.87% | | (19.18)% | | 13.69% | | 29.64% |
Ratios to Average Net Assets B,E,F | | | | | | | | | | |
| Expenses before reductions | | 1.25% | | 1.29% | | 1.28% | | 1.28% | | 1.32% |
| Expenses net of fee waivers, if any | | | | 1.28% | | 1.28% | | 1.28% | | 1.32% |
| Expenses net of all reductions | | 1.24% | | 1.28% | | 1.28% | | 1.28% | | 1.31% |
| Net investment income (loss) | | .13% | | (.20)% | | (.51)% | | (.07)% | | (.18)% |
| Supplemental Data | | | | | | | | | | |
| Net assets, end of period (000 omitted) | $ | 130,547 | $ | 113,960 | $ | 109,815 | $ | 161,619 | $ | 144,568 |
Portfolio turnover rate G | | | | 78% | | 43% | | 72% | | 66% |
ACalculated based on average shares outstanding during the period.
BNet investment income (loss) is affected by the timing of the declaration of dividends by any underlying mutual funds or exchange-traded funds (ETFs). Net investment income (loss) of any mutual funds or ETFs is not included in the Fund's net investment income (loss) ratio.
CTotal returns would have been lower if certain expenses had not been reduced during the applicable periods shown.
DTotal returns do not include the effect of the sales charges.
EFees and expenses of any underlying mutual funds or exchange-traded funds (ETFs) are not included in the Fund's expense ratio. The Fund indirectly bears its proportionate share of these expenses. For additional expense information related to investments in Fidelity Central Funds, please refer to the "Investments in Fidelity Central Funds" note found in the Notes to Financial Statements section of the most recent Annual or Semi-Annual report.
FExpense ratios reflect operating expenses of the class. Expenses before reductions do not reflect amounts reimbursed, waived, or reduced through arrangements with the investment adviser, brokerage services, or other offset arrangements, if applicable, and do not represent the amount paid by the class during periods when reimbursements, waivers or reductions occur.
GAmount does not include the portfolio activity of any underlying mutual funds or exchange-traded funds (ETFs).
Fidelity Advisor® Biotechnology Fund Class C |
| |
| Years ended July 31, | | 2024 | | 2023 | | 2022 | | 2021 | | 2020 |
Selected Per-Share Data | | | | | | | | | | |
| Net asset value, beginning of period | $ | 19.75 | $ | 17.27 | $ | 26.79 | $ | 25.97 | $ | 21.71 |
| Income from Investment Operations | | | | | | | | | | |
Net investment income (loss) A,B | | (.07) | | (.13) | | (.21) | | (.15) | | (.15) |
| Net realized and unrealized gain (loss) | | 5.63 | | 2.61 | | (4.07) | | 3.71 | | 6.26 |
| Total from investment operations | | 5.56 | | 2.48 | | (4.28) | | 3.56 | | 6.11 |
| Distributions from net investment income | | - | | - | | - | | (.01) | | - |
| Distributions from net realized gain | | - | | - | | (5.24) | | (2.73) | | (1.85) |
| Total distributions | | - | | - | | (5.24) | | (2.74) | | (1.85) |
| Net asset value, end of period | $ | 25.31 | $ | 19.75 | $ | 17.27 | $ | 26.79 | $ | 25.97 |
Total Return C,D | | | | 14.36% | | (19.54)% | | 13.15% | | 29.07% |
Ratios to Average Net Assets B,E,F | | | | | | | | | | |
| Expenses before reductions | | 1.72% | | 1.76% | | 1.75% | | 1.75% | | 1.77% |
| Expenses net of fee waivers, if any | | | | 1.76% | | 1.74% | | 1.75% | | 1.77% |
| Expenses net of all reductions | | 1.72% | | 1.76% | | 1.74% | | 1.75% | | 1.76% |
| Net investment income (loss) | | (.35)% | | (.69)% | | (.97)% | | (.55)% | | (.63)% |
| Supplemental Data | | | | | | | | | | |
| Net assets, end of period (000 omitted) | $ | 92,046 | $ | 119,843 | $ | 168,797 | $ | 328,417 | $ | 384,420 |
Portfolio turnover rate G | | | | 78% | | 43% | | 72% | | 66% |
ACalculated based on average shares outstanding during the period.
BNet investment income (loss) is affected by the timing of the declaration of dividends by any underlying mutual funds or exchange-traded funds (ETFs). Net investment income (loss) of any mutual funds or ETFs is not included in the Fund's net investment income (loss) ratio.
CTotal returns would have been lower if certain expenses had not been reduced during the applicable periods shown.
DTotal returns do not include the effect of the contingent deferred sales charge.
EFees and expenses of any underlying mutual funds or exchange-traded funds (ETFs) are not included in the Fund's expense ratio. The Fund indirectly bears its proportionate share of these expenses. For additional expense information related to investments in Fidelity Central Funds, please refer to the "Investments in Fidelity Central Funds" note found in the Notes to Financial Statements section of the most recent Annual or Semi-Annual report.
FExpense ratios reflect operating expenses of the class. Expenses before reductions do not reflect amounts reimbursed, waived, or reduced through arrangements with the investment adviser, brokerage services, or other offset arrangements, if applicable, and do not represent the amount paid by the class during periods when reimbursements, waivers or reductions occur.
GAmount does not include the portfolio activity of any underlying mutual funds or exchange-traded funds (ETFs).
Fidelity Advisor® Biotechnology Fund Class I |
| |
| Years ended July 31, | | 2024 | | 2023 | | 2022 | | 2021 | | 2020 |
Selected Per-Share Data | | | | | | | | | | |
| Net asset value, beginning of period | $ | 27.71 | $ | 23.99 | $ | 35.00 | $ | 33.16 | $ | 27.08 |
| Income from Investment Operations | | | | | | | | | | |
Net investment income (loss) A,B | | .19 | | .09 | | .01 | | .17 | | .11 |
| Net realized and unrealized gain (loss) | | 7.88 | | 3.63 | | (5.61) | | 4.72 | | 7.88 |
| Total from investment operations | | 8.07 | | 3.72 | | (5.60) | | 4.89 | | 7.99 |
| Distributions from net investment income | | (.41) | | - | | (.16) | | (.21) | | - |
| Distributions from net realized gain | | - | | - | | (5.25) | | (2.85) | | (1.91) |
| Total distributions | | (.41) | | - | | (5.41) | | (3.05) C | | (1.91) |
| Net asset value, end of period | $ | 35.37 | $ | 27.71 | $ | 23.99 | $ | 35.00 | $ | 33.16 |
Total Return D | | | | 15.51% | | (18.74)% | | 14.34% | | 30.32% |
Ratios to Average Net Assets B,E,F | | | | | | | | | | |
| Expenses before reductions | | .72% | | .74% | | .73% | | .74% | | .75% |
| Expenses net of fee waivers, if any | | | | .73% | | .73% | | .74% | | .75% |
| Expenses net of all reductions | | .72% | | .73% | | .73% | | .74% | | .75% |
| Net investment income (loss) | | .65% | | .34% | | .04% | | .47% | | .38% |
| Supplemental Data | | | | | | | | | | |
| Net assets, end of period (000 omitted) | $ | 768,136 | $ | 701,786 | $ | 697,079 | $ | 1,129,492 | $ | 1,092,145 |
Portfolio turnover rate G | | | | 78% | | 43% | | 72% | | 66% |
ACalculated based on average shares outstanding during the period.
BNet investment income (loss) is affected by the timing of the declaration of dividends by any underlying mutual funds or exchange-traded funds (ETFs). Net investment income (loss) of any mutual funds or ETFs is not included in the Fund's net investment income (loss) ratio.
CTotal distributions per share do not sum due to rounding.
DTotal returns would have been lower if certain expenses had not been reduced during the applicable periods shown.
EFees and expenses of any underlying mutual funds or exchange-traded funds (ETFs) are not included in the Fund's expense ratio. The Fund indirectly bears its proportionate share of these expenses. For additional expense information related to investments in Fidelity Central Funds, please refer to the "Investments in Fidelity Central Funds" note found in the Notes to Financial Statements section of the most recent Annual or Semi-Annual report.
FExpense ratios reflect operating expenses of the class. Expenses before reductions do not reflect amounts reimbursed, waived, or reduced through arrangements with the investment adviser, brokerage services, or other offset arrangements, if applicable, and do not represent the amount paid by the class during periods when reimbursements, waivers or reductions occur.
GAmount does not include the portfolio activity of any underlying mutual funds or exchange-traded funds (ETFs).
Fidelity Advisor® Biotechnology Fund Class Z |
| |
| Years ended July 31, | | 2024 | | 2023 | | 2022 | | 2021 | | 2020 |
Selected Per-Share Data | | | | | | | | | | |
| Net asset value, beginning of period | $ | 27.81 | $ | 24.04 | $ | 35.05 | $ | 33.22 | $ | 27.10 |
| Income from Investment Operations | | | | | | | | | | |
Net investment income (loss) A,B | | .23 | | .13 | | .05 | | .21 | | .15 |
| Net realized and unrealized gain (loss) | | 7.90 | | 3.64 | | (5.62) | | 4.74 | | 7.90 |
| Total from investment operations | | 8.13 | | 3.77 | | (5.57) | | 4.95 | | 8.05 |
| Distributions from net investment income | | (.47) | | - | | (.19) | | (.26) | | (.02) |
| Distributions from net realized gain | | - | | - | | (5.25) | | (2.87) | | (1.91) |
| Total distributions | | (.47) | | - | | (5.44) | | (3.12) C | | (1.93) |
| Net asset value, end of period | $ | 35.47 | $ | 27.81 | $ | 24.04 | $ | 35.05 | $ | 33.22 |
Total Return D | | | | 15.68% | | (18.63)% | | 14.49% | | 30.53% |
Ratios to Average Net Assets B,E,F | | | | | | | | | | |
| Expenses before reductions | | .60% | | .61% | | .61% | | .61% | | .62% |
| Expenses net of fee waivers, if any | | | | .60% | | .60% | | .61% | | .62% |
| Expenses net of all reductions | | .59% | | .60% | | .60% | | .61% | | .62% |
| Net investment income (loss) | | .78% | | .47% | | .16% | | .60% | | .51% |
| Supplemental Data | | | | | | | | | | |
| Net assets, end of period (000 omitted) | $ | 84,303 | $ | 61,044 | $ | 62,729 | $ | 89,641 | $ | 62,743 |
Portfolio turnover rate G | | | | 78% | | 43% | | 72% | | 66% |
ACalculated based on average shares outstanding during the period.
BNet investment income (loss) is affected by the timing of the declaration of dividends by any underlying mutual funds or exchange-traded funds (ETFs). Net investment income (loss) of any mutual funds or ETFs is not included in the Fund's net investment income (loss) ratio.
CTotal distributions per share do not sum due to rounding.
DTotal returns would have been lower if certain expenses had not been reduced during the applicable periods shown.
EFees and expenses of any underlying mutual funds or exchange-traded funds (ETFs) are not included in the Fund's expense ratio. The Fund indirectly bears its proportionate share of these expenses. For additional expense information related to investments in Fidelity Central Funds, please refer to the "Investments in Fidelity Central Funds" note found in the Notes to Financial Statements section of the most recent Annual or Semi-Annual report.
FExpense ratios reflect operating expenses of the class. Expenses before reductions do not reflect amounts reimbursed, waived, or reduced through arrangements with the investment adviser, brokerage services, or other offset arrangements, if applicable, and do not represent the amount paid by the class during periods when reimbursements, waivers or reductions occur.
GAmount does not include the portfolio activity of any underlying mutual funds or exchange-traded funds (ETFs).
Fidelity Advisor® Consumer Discretionary Fund
Schedule of Investments July 31, 2024
Showing Percentage of Net Assets
| Common Stocks - 100.0% |
| | | Shares | Value ($) |
| Automobile Components - 3.1% | | | |
| Automotive Parts & Equipment - 3.1% | | | |
| Adient PLC (a) | | 77,521 | 1,996,941 |
| Aptiv PLC (a) | | 144,820 | 10,049,060 |
| Magna International, Inc. (b) | | 59,080 | 2,621,380 |
| | | | 14,667,381 |
| Automobiles - 12.5% | | | |
| Automobile Manufacturers - 12.5% | | | |
| General Motors Co. | | 182,150 | 8,072,888 |
| Tesla, Inc. (a) | | 221,895 | 51,495,173 |
| | | | 59,568,061 |
| Broadline Retail - 25.9% | | | |
| Broadline Retail - 25.9% | | | |
| Amazon.com, Inc. (a) | | 605,949 | 113,300,343 |
| Etsy, Inc. (a) | | 38,180 | 2,487,045 |
| MercadoLibre, Inc. (a) | | 2,125 | 3,546,413 |
| Ollie's Bargain Outlet Holdings, Inc. (a) | | 37,543 | 3,665,699 |
| | | | 122,999,500 |
| Building Products - 0.8% | | | |
| Building Products - 0.8% | | | |
| The AZEK Co., Inc. Class A, (a) | | 81,051 | 3,638,379 |
| Commercial Services & Supplies - 0.2% | | | |
| Diversified Support Services - 0.2% | | | |
| Vestis Corp. | | 72,695 | 942,854 |
| Consumer Staples Distribution & Retail - 1.1% | | | |
| Consumer Staples Merchandise Retail - 0.6% | | | |
| Dollar Tree, Inc. (a) | | 26,144 | 2,727,865 |
| Food Distributors - 0.5% | | | |
| Performance Food Group Co. (a) | | 37,392 | 2,580,048 |
TOTAL CONSUMER STAPLES DISTRIBUTION & RETAIL | | | 5,307,913 |
| Food Products - 0.4% | | | |
| Packaged Foods & Meats - 0.4% | | | |
| Lamb Weston Holdings, Inc. | | 36,560 | 2,194,331 |
| Hotels, Restaurants & Leisure - 18.7% | | | |
| Casinos & Gaming - 2.8% | | | |
| Caesars Entertainment, Inc. (a) | | 74,591 | 2,979,910 |
| Churchill Downs, Inc. | | 27,734 | 3,981,493 |
| Penn Entertainment, Inc. (a) | | 76,475 | 1,527,206 |
| Red Rock Resorts, Inc. | | 86,300 | 4,919,100 |
| | | | 13,407,709 |
| Hotels, Resorts & Cruise Lines - 7.6% | | | |
| Booking Holdings, Inc. | | 2,722 | 10,112,257 |
| Hilton Worldwide Holdings, Inc. | | 67,585 | 14,508,472 |
| Marriott International, Inc. Class A | | 31,174 | 7,085,850 |
| Royal Caribbean Cruises Ltd. (b) | | 29,020 | 4,548,014 |
| | | | 36,254,593 |
| Restaurants - 8.3% | | | |
| Aramark | | 69,239 | 2,372,821 |
| Brinker International, Inc. (a) | | 21,940 | 1,465,811 |
| Chipotle Mexican Grill, Inc. (a) | | 136,710 | 7,426,087 |
| Domino's Pizza, Inc. | | 18,914 | 8,108,432 |
| McDonald's Corp. | | 43,561 | 11,561,089 |
| Restaurant Brands International, Inc. | | 62,700 | 4,390,113 |
| Starbucks Corp. | | 51,500 | 4,014,425 |
| | | | 39,338,778 |
TOTAL HOTELS, RESTAURANTS & LEISURE | | | 89,001,080 |
| Household Durables - 5.7% | | | |
| Home Furnishings - 2.0% | | | |
| Tempur Sealy International, Inc. | | 179,705 | 9,407,557 |
| Homebuilding - 3.7% | | | |
| KB Home | | 39,890 | 3,433,731 |
| PulteGroup, Inc. | | 52,080 | 6,874,560 |
| TopBuild Corp. (a) | | 15,085 | 7,218,776 |
| | | | 17,527,067 |
TOTAL HOUSEHOLD DURABLES | | | 26,934,624 |
| Specialty Retail - 23.6% | | | |
| Apparel Retail - 5.1% | | | |
| Aritzia, Inc. (a) | | 112,200 | 3,682,978 |
| Burlington Stores, Inc. (a) | | 11,103 | 2,890,333 |
| TJX Companies, Inc. | | 157,849 | 17,840,094 |
| | | | 24,413,405 |
| Automotive Retail - 1.1% | | | |
| Advance Auto Parts, Inc. | | 22,480 | 1,423,658 |
| O'Reilly Automotive, Inc. (a) | | 3,540 | 3,987,244 |
| | | | 5,410,902 |
| Home Improvement Retail - 11.0% | | | |
| Floor & Decor Holdings, Inc. Class A (a) | | 60,618 | 5,940,564 |
| Lowe's Companies, Inc. | | 93,292 | 22,904,119 |
| The Home Depot, Inc. | | 64,083 | 23,592,797 |
| | | | 52,437,480 |
| Homefurnishing Retail - 1.7% | | | |
| Wayfair LLC Class A (a) | | 16,385 | 891,836 |
| Williams-Sonoma, Inc. | | 45,470 | 7,033,300 |
| | | | 7,925,136 |
| Other Specialty Retail - 4.7% | | | |
| Academy Sports & Outdoors, Inc. | | 107,180 | 5,795,223 |
| Dick's Sporting Goods, Inc. | | 53,469 | 11,568,018 |
| Five Below, Inc. (a) | | 23,520 | 1,710,845 |
| JD Sports Fashion PLC | | 876,100 | 1,482,172 |
| Sally Beauty Holdings, Inc. (a) | | 135,680 | 1,553,536 |
| | | | 22,109,794 |
TOTAL SPECIALTY RETAIL | | | 112,296,717 |
| Textiles, Apparel & Luxury Goods - 8.0% | | | |
| Apparel, Accessories & Luxury Goods - 4.1% | | | |
| Capri Holdings Ltd. (a) | | 36,400 | 1,220,856 |
| lululemon athletica, Inc. (a) | | 17,880 | 4,624,841 |
| LVMH Moet Hennessy Louis Vuitton SE | | 2,357 | 1,662,539 |
| PVH Corp. | | 47,919 | 4,887,259 |
| Tapestry, Inc. | | 121,834 | 4,884,325 |
| VF Corp. | | 133,890 | 2,270,774 |
| | | | 19,550,594 |
| Footwear - 3.9% | | | |
| Deckers Outdoor Corp. (a) | | 6,832 | 6,303,408 |
| NIKE, Inc. Class B | | 128,982 | 9,655,593 |
| On Holding AG (a) | | 31,484 | 1,304,067 |
| Skechers U.S.A., Inc. Class A (sub. vtg.) (a) | | 20,900 | 1,361,217 |
| | | | 18,624,285 |
TOTAL TEXTILES, APPAREL & LUXURY GOODS | | | 38,174,879 |
| TOTAL COMMON STOCKS (Cost $247,432,893) | | | 475,725,719 |
| | | | |
| Money Market Funds - 1.0% |
| | | Shares | Value ($) |
| Fidelity Cash Central Fund 5.39% (c) | | 596,536 | 596,655 |
| Fidelity Securities Lending Cash Central Fund 5.39% (c)(d) | | 3,857,614 | 3,858,000 |
| TOTAL MONEY MARKET FUNDS (Cost $4,454,655) | | | 4,454,655 |
| | | | |
| TOTAL INVESTMENT IN SECURITIES - 101.0% (Cost $251,887,548) | 480,180,374 |
NET OTHER ASSETS (LIABILITIES) - (1.0)% | (4,626,116) |
| NET ASSETS - 100.0% | 475,554,258 |
| | |
Legend
| (b) | Security or a portion of the security is on loan at period end. |
| (c) | Affiliated fund that is generally available only to investment companies and other accounts managed by Fidelity Investments. The rate quoted is the annualized seven-day yield of the fund at period end. A complete unaudited listing of the fund's holdings as of its most recent quarter end is available upon request. In addition, each Fidelity Central Fund's financial statements, which are not covered by the Fund's Report of Independent Registered Public Accounting Firm, are available on the SEC's website or upon request. |
| (d) | Investment made with cash collateral received from securities on loan. |
Affiliated Central Funds
Fiscal year to date information regarding the Fund's investments in Fidelity Central Funds, including the ownership percentage, is presented below.
| Affiliate | Value, beginning of period ($) | Purchases ($) | Sales Proceeds ($) | Dividend Income ($) | Realized Gain (loss) ($) | Change in Unrealized appreciation (depreciation) ($) | Value, end of period ($) | % ownership, end of period |
| Fidelity Cash Central Fund 5.39% | 7,175,962 | 58,725,527 | 65,304,940 | 72,123 | 106 | - | 596,655 | 0.0% |
| Fidelity Securities Lending Cash Central Fund 5.39% | 8,748,675 | 119,569,580 | 124,460,255 | 16,500 | - | - | 3,858,000 | 0.0% |
| Total | 15,924,637 | 178,295,107 | 189,765,195 | 88,623 | 106 | - | 4,454,655 | |
| | | | | | | | | |
Amounts in the dividend income column in the above table include any capital gain distributions from underlying funds, which are presented in the corresponding line item in the Statement of Operations, if applicable.
Amounts in the dividend income column for Fidelity Securities Lending Cash Central Fund represents the income earned on investing cash collateral, less rebates paid to borrowers and any lending agent fees associated with the loan, plus any premium payments received for lending certain types of securities.
Amounts included in the purchases and sales proceeds columns may include in-kind transactions, if applicable.
Investment Valuation
The following is a summary of the inputs used, as of July 31, 2024, involving the Fund's assets and liabilities carried at fair value. The inputs or methodology used for valuing securities may not be an indication of the risk associated with investing in those securities. For more information on valuation inputs, and their aggregation into the levels used below, please refer to the Investment Valuation section in the accompanying Notes to Financial Statements.
| Valuation Inputs at Reporting Date: |
| Description | Total ($) | Level 1 ($) | Level 2 ($) | Level 3 ($) |
Investments in Securities: | | | | |
|
| Common Stocks | 475,725,719 | 474,063,180 | 1,662,539 | - |
|
| Money Market Funds | 4,454,655 | 4,454,655 | - | - |
| Total Investments in Securities: | 480,180,374 | 478,517,835 | 1,662,539 | - |
Fidelity Advisor® Consumer Discretionary Fund
Financial Statements
| Statement of Assets and Liabilities |
As of July 31, 2024 |
| Assets | | | | |
| Investment in securities, at value (including securities loaned of $3,794,046) - See accompanying schedule: | | | | |
Unaffiliated issuers (cost $247,432,893) | $ | 475,725,719 | | |
Fidelity Central Funds (cost $4,454,655) | | 4,454,655 | | |
| | | | | |
| | | | | |
| Total Investment in Securities (cost $251,887,548) | | | $ | 480,180,374 |
| Foreign currency held at value (cost $19,952) | | | | 19,997 |
| Receivable for fund shares sold | | | | 94,398 |
| Dividends receivable | | | | 152,857 |
| Distributions receivable from Fidelity Central Funds | | | | 7,687 |
| Prepaid expenses | | | | 327 |
| Other receivables | | | | 2,296 |
Total assets | | | | 480,457,936 |
| Liabilities | | | | |
| Payable for fund shares redeemed | $ | 638,363 | | |
| Accrued management fee | | 272,887 | | |
| Distribution and service plan fees payable | | 88,079 | | |
| Other payables and accrued expenses | | 46,524 | | |
| Collateral on securities loaned | | 3,857,825 | | |
| Total liabilities | | | | 4,903,678 |
| Net Assets | | | $ | 475,554,258 |
| Net Assets consist of: | | | | |
| Paid in capital | | | $ | 230,449,089 |
| Total accumulated earnings (loss) | | | | 245,105,169 |
| Net Assets | | | $ | 475,554,258 |
| | | | | |
| Net Asset Value and Maximum Offering Price | | | | |
| Class A : | | | | |
Net Asset Value and redemption price per share ($222,157,079 ÷ 5,192,845 shares)(a) | | | $ | 42.78 |
| Maximum offering price per share (100/94.25 of $42.78) | | | $ | 45.39 |
| Class M : | | | | |
Net Asset Value and redemption price per share ($35,773,474 ÷ 918,407 shares)(a) | | | $ | 38.95 |
| Maximum offering price per share (100/96.50 of $38.95) | | | $ | 40.36 |
| Class C : | | | | |
Net Asset Value and offering price per share ($31,368,737 ÷ 981,870 shares)(a) | | | $ | 31.95 |
| Class I : | | | | |
Net Asset Value, offering price and redemption price per share ($144,233,649 ÷ 3,044,975 shares) | | | $ | 47.37 |
| Class Z : | | | | |
Net Asset Value, offering price and redemption price per share ($42,021,319 ÷ 881,541 shares) | | | $ | 47.67 |
(a)Redemption price per share is equal to net asset value less any applicable contingent deferred sales charge. |
| Statement of Operations |
| Year ended July 31, 2024 |
| Investment Income | | | | |
| Dividends | | | $ | 3,562,253 |
| Income from Fidelity Central Funds (including $16,500 from security lending) | | | | 88,623 |
| Total income | | | | 3,650,876 |
| Expenses | | | | |
| Management fee | $ | 2,772,151 | | |
| Transfer agent fees | | 453,837 | | |
| Distribution and service plan fees | | 1,060,178 | | |
| Accounting fees | | 96,285 | | |
| Custodian fees and expenses | | 9,161 | | |
| Independent trustees' fees and expenses | | 2,299 | | |
| Registration fees | | 76,691 | | |
| Audit fees | | 64,759 | | |
| Legal | | 629 | | |
| Miscellaneous | | 7,057 | | |
| Total expenses before reductions | | 4,543,047 | | |
| Expense reductions | | (29,880) | | |
| Total expenses after reductions | | | | 4,513,167 |
| Net Investment income (loss) | | | | (862,291) |
| Realized and Unrealized Gain (Loss) | | | | |
| Net realized gain (loss) on: | | | | |
| Investment Securities: | | | | |
| Unaffiliated issuers | | 30,917,284 | | |
| Redemptions in-kind | | 15,311,646 | | |
| Fidelity Central Funds | | 106 | | |
| Foreign currency transactions | | (4,135) | | |
| Total net realized gain (loss) | | | | 46,224,901 |
| Change in net unrealized appreciation (depreciation) on: | | | | |
| Investment Securities: | | | | |
| Unaffiliated issuers | | 8,839,810 | | |
| Assets and liabilities in foreign currencies | | 1,026 | | |
| Total change in net unrealized appreciation (depreciation) | | | | 8,840,836 |
| Net gain (loss) | | | | 55,065,737 |
| Net increase (decrease) in net assets resulting from operations | | | $ | 54,203,446 |
| Statement of Changes in Net Assets |
| |
| | Year ended July 31, 2024 | | Year ended July 31, 2023 |
| Increase (Decrease) in Net Assets | | | | |
| Operations | | | | |
| Net investment income (loss) | $ | (862,291) | $ | (990,830) |
| Net realized gain (loss) | | 46,224,901 | | 11,406,804 |
| Change in net unrealized appreciation (depreciation) | | 8,840,836 | | 43,207,276 |
| Net increase (decrease) in net assets resulting from operations | | 54,203,446 | | 53,623,250 |
| Distributions to shareholders | | - | | (17,163,089) |
| | | | | |
| Share transactions - net increase (decrease) | | (86,759,146) | | 30,658,500 |
| Total increase (decrease) in net assets | | (32,555,700) | | 67,118,661 |
| | | | | |
| Net Assets | | | | |
| Beginning of period | | 508,109,958 | | 440,991,297 |
| End of period | $ | 475,554,258 | $ | 508,109,958 |
| | | | | |
| | | | | |
Financial Highlights
Fidelity Advisor® Consumer Discretionary Fund Class A |
| |
| Years ended July 31, | | 2024 | | 2023 | | 2022 | | 2021 | | 2020 |
Selected Per-Share Data | | | | | | | | | | |
| Net asset value, beginning of period | $ | 37.68 | $ | 35.05 | $ | 45.74 | $ | 33.70 | $ | 29.83 |
| Income from Investment Operations | | | | | | | | | | |
Net investment income (loss) A,B | | (.09) | | (.09) | | (.16) | | (.20) | | (.04) |
| Net realized and unrealized gain (loss) | | 5.19 | | 4.07 | | (7.62) | | 12.82 | | 4.73 |
| Total from investment operations | | 5.10 | | 3.98 | | (7.78) | | 12.62 | | 4.69 |
| Distributions from net realized gain | | - | | (1.35) | | (2.91) | | (.58) | | (.82) |
| Total distributions | | - | | (1.35) | | (2.91) | | (.58) | | (.82) |
| Net asset value, end of period | $ | 42.78 | $ | 37.68 | $ | 35.05 | $ | 45.74 | $ | 33.70 |
Total Return C,D | | | | 12.14% | | (18.26)% | | 37.68% | | 16.03% |
Ratios to Average Net Assets B,E,F | | | | | | | | | | |
| Expenses before reductions | | 1.01% | | 1.04% | | 1.01% | | 1.03% | | 1.07% |
| Expenses net of fee waivers, if any | | | | 1.04% | | 1.01% | | 1.03% | | 1.07% |
| Expenses net of all reductions | | 1.00% | | 1.04% | | 1.01% | | 1.03% | | 1.06% |
| Net investment income (loss) | | (.22)% | | (.27)% | | (.38)% | | (.48)% | | (.14)% |
| Supplemental Data | | | | | | | | | | |
| Net assets, end of period (000 omitted) | $ | 222,157 | $ | 203,468 | $ | 188,092 | $ | 259,488 | $ | 159,603 |
Portfolio turnover rate G | | | | 43% | | 34% | | 35% | | 41% H |
ACalculated based on average shares outstanding during the period.
BNet investment income (loss) is affected by the timing of the declaration of dividends by any underlying mutual funds or exchange-traded funds (ETFs). Net investment income (loss) of any mutual funds or ETFs is not included in the Fund's net investment income (loss) ratio.
CTotal returns would have been lower if certain expenses had not been reduced during the applicable periods shown.
DTotal returns do not include the effect of the sales charges.
EFees and expenses of any underlying mutual funds or exchange-traded funds (ETFs) are not included in the Fund's expense ratio. The Fund indirectly bears its proportionate share of these expenses. For additional expense information related to investments in Fidelity Central Funds, please refer to the "Investments in Fidelity Central Funds" note found in the Notes to Financial Statements section of the most recent Annual or Semi-Annual report.
FExpense ratios reflect operating expenses of the class. Expenses before reductions do not reflect amounts reimbursed, waived, or reduced through arrangements with the investment adviser, brokerage services, or other offset arrangements, if applicable, and do not represent the amount paid by the class during periods when reimbursements, waivers or reductions occur.
GAmount does not include the portfolio activity of any underlying mutual funds or exchange-traded funds (ETFs).
HPortfolio turnover rate excludes securities received or delivered in-kind.
Fidelity Advisor® Consumer Discretionary Fund Class M |
| |
| Years ended July 31, | | 2024 | | 2023 | | 2022 | | 2021 | | 2020 |
Selected Per-Share Data | | | | | | | | | | |
| Net asset value, beginning of period | $ | 34.40 | $ | 32.20 | $ | 42.23 | $ | 31.23 | $ | 27.78 |
| Income from Investment Operations | | | | | | | | | | |
Net investment income (loss) A,B | | (.17) | | (.16) | | (.24) | | (.29) | | (.11) |
| Net realized and unrealized gain (loss) | | 4.72 | | 3.71 | | (7.02) | | 11.87 | | 4.38 |
| Total from investment operations | | 4.55 | | 3.55 | | (7.26) | | 11.58 | | 4.27 |
| Distributions from net realized gain | | - | | (1.35) | | (2.77) | | (.58) | | (.82) |
| Total distributions | | - | | (1.35) | | (2.77) | | (.58) | | (.82) |
| Net asset value, end of period | $ | 38.95 | $ | 34.40 | $ | 32.20 | $ | 42.23 | $ | 31.23 |
Total Return C,D | | | | 11.87% | | (18.49)% | | 37.32% | | 15.70% |
Ratios to Average Net Assets B,E,F | | | | | | | | | | |
| Expenses before reductions | | 1.28% | | 1.31% | | 1.28% | | 1.30% | | 1.34% |
| Expenses net of fee waivers, if any | | | | 1.30% | | 1.27% | | 1.30% | | 1.34% |
| Expenses net of all reductions | | 1.27% | | 1.30% | | 1.27% | | 1.29% | | 1.33% |
| Net investment income (loss) | | (.49)% | | (.53)% | | (.64)% | | (.75)% | | (.41)% |
| Supplemental Data | | | | | | | | | | |
| Net assets, end of period (000 omitted) | $ | 35,773 | $ | 35,811 | $ | 35,219 | $ | 48,288 | $ | 33,896 |
Portfolio turnover rate G | | | | 43% | | 34% | | 35% | | 41% H |
ACalculated based on average shares outstanding during the period.
BNet investment income (loss) is affected by the timing of the declaration of dividends by any underlying mutual funds or exchange-traded funds (ETFs). Net investment income (loss) of any mutual funds or ETFs is not included in the Fund's net investment income (loss) ratio.
CTotal returns would have been lower if certain expenses had not been reduced during the applicable periods shown.
DTotal returns do not include the effect of the sales charges.
EFees and expenses of any underlying mutual funds or exchange-traded funds (ETFs) are not included in the Fund's expense ratio. The Fund indirectly bears its proportionate share of these expenses. For additional expense information related to investments in Fidelity Central Funds, please refer to the "Investments in Fidelity Central Funds" note found in the Notes to Financial Statements section of the most recent Annual or Semi-Annual report.
FExpense ratios reflect operating expenses of the class. Expenses before reductions do not reflect amounts reimbursed, waived, or reduced through arrangements with the investment adviser, brokerage services, or other offset arrangements, if applicable, and do not represent the amount paid by the class during periods when reimbursements, waivers or reductions occur.
GAmount does not include the portfolio activity of any underlying mutual funds or exchange-traded funds (ETFs).
HPortfolio turnover rate excludes securities received or delivered in-kind.
Fidelity Advisor® Consumer Discretionary Fund Class C |
| |
| Years ended July 31, | | 2024 | | 2023 | | 2022 | | 2021 | | 2020 |
Selected Per-Share Data | | | | | | | | | | |
| Net asset value, beginning of period | $ | 28.35 | $ | 26.92 | $ | 35.82 | $ | 26.69 | $ | 23.97 |
| Income from Investment Operations | | | | | | | | | | |
Net investment income (loss) A,B | | (.29) | | (.25) | | (.36) | | (.40) | | (.21) |
| Net realized and unrealized gain (loss) | | 3.89 | | 3.03 | | (5.87) | | 10.11 | | 3.75 |
| Total from investment operations | | 3.60 | | 2.78 | | (6.23) | | 9.71 | | 3.54 |
| Distributions from net realized gain | | - | | (1.35) | | (2.67) | | (.58) | | (.82) |
| Total distributions | | - | | (1.35) | | (2.67) | | (.58) | | (.82) |
| Net asset value, end of period | $ | 31.95 | $ | 28.35 | $ | 26.92 | $ | 35.82 | $ | 26.69 |
Total Return C,D | | | | 11.32% | | (18.88)% | | 36.66% | | 15.14% |
Ratios to Average Net Assets B,E,F | | | | | | | | | | |
| Expenses before reductions | | 1.77% | | 1.80% | | 1.77% | | 1.79% | | 1.82% |
| Expenses net of fee waivers, if any | | | | 1.79% | | 1.76% | | 1.79% | | 1.82% |
| Expenses net of all reductions | | 1.76% | | 1.79% | | 1.76% | | 1.79% | | 1.82% |
| Net investment income (loss) | | (.99)% | | (1.02)% | | (1.13)% | | (1.24)% | | (.90)% |
| Supplemental Data | | | | | | | | | | |
| Net assets, end of period (000 omitted) | $ | 31,369 | $ | 43,294 | $ | 54,035 | $ | 85,549 | $ | 65,223 |
Portfolio turnover rate G | | | | 43% | | 34% | | 35% | | 41% H |
ACalculated based on average shares outstanding during the period.
BNet investment income (loss) is affected by the timing of the declaration of dividends by any underlying mutual funds or exchange-traded funds (ETFs). Net investment income (loss) of any mutual funds or ETFs is not included in the Fund's net investment income (loss) ratio.
CTotal returns would have been lower if certain expenses had not been reduced during the applicable periods shown.
DTotal returns do not include the effect of the contingent deferred sales charge.
EFees and expenses of any underlying mutual funds or exchange-traded funds (ETFs) are not included in the Fund's expense ratio. The Fund indirectly bears its proportionate share of these expenses. For additional expense information related to investments in Fidelity Central Funds, please refer to the "Investments in Fidelity Central Funds" note found in the Notes to Financial Statements section of the most recent Annual or Semi-Annual report.
FExpense ratios reflect operating expenses of the class. Expenses before reductions do not reflect amounts reimbursed, waived, or reduced through arrangements with the investment adviser, brokerage services, or other offset arrangements, if applicable, and do not represent the amount paid by the class during periods when reimbursements, waivers or reductions occur.
GAmount does not include the portfolio activity of any underlying mutual funds or exchange-traded funds (ETFs).
HPortfolio turnover rate excludes securities received or delivered in-kind.
Fidelity Advisor® Consumer Discretionary Fund Class I |
| |
| Years ended July 31, | | 2024 | | 2023 | | 2022 | | 2021 | | 2020 |
Selected Per-Share Data | | | | | | | | | | |
| Net asset value, beginning of period | $ | 41.61 | $ | 38.45 | $ | 49.91 | $ | 36.63 | $ | 32.27 |
| Income from Investment Operations | | | | | | | | | | |
Net investment income (loss) A,B | | .02 | | - C | | (.05) | | (.10) | | .04 |
| Net realized and unrealized gain (loss) | | 5.74 | | 4.51 | | (8.36) | | 13.96 | | 5.14 |
| Total from investment operations | | 5.76 | | 4.51 | | (8.41) | | 13.86 | | 5.18 |
| Distributions from net realized gain | | - | | (1.35) | | (3.05) | | (.58) | | (.82) |
| Total distributions | | - | | (1.35) | | (3.05) | | (.58) | | (.82) |
| Net asset value, end of period | $ | 47.37 | $ | 41.61 | $ | 38.45 | $ | 49.91 | $ | 36.63 |
Total Return D | | | | 12.45% | | (18.04)% | | 38.05% | | 16.34% |
Ratios to Average Net Assets B,E,F | | | | | | | | | | |
| Expenses before reductions | | .75% | | .77% | | .75% | | .77% | | .79% |
| Expenses net of fee waivers, if any | | | | .76% | | .74% | | .76% | | .79% |
| Expenses net of all reductions | | .74% | | .76% | | .74% | | .76% | | .79% |
| Net investment income (loss) | | .04% | | .01% | | (.11)% | | (.22)% | | .13% |
| Supplemental Data | | | | | | | | | | |
| Net assets, end of period (000 omitted) | $ | 144,234 | $ | 139,088 | $ | 118,859 | $ | 259,846 | $ | 134,907 |
Portfolio turnover rate G | | | | 43% | | 34% | | 35% | | 41% H |
ACalculated based on average shares outstanding during the period.
BNet investment income (loss) is affected by the timing of the declaration of dividends by any underlying mutual funds or exchange-traded funds (ETFs). Net investment income (loss) of any mutual funds or ETFs is not included in the Fund's net investment income (loss) ratio.
CAmount represents less than $.005 per share.
DTotal returns would have been lower if certain expenses had not been reduced during the applicable periods shown.
EFees and expenses of any underlying mutual funds or exchange-traded funds (ETFs) are not included in the Fund's expense ratio. The Fund indirectly bears its proportionate share of these expenses. For additional expense information related to investments in Fidelity Central Funds, please refer to the "Investments in Fidelity Central Funds" note found in the Notes to Financial Statements section of the most recent Annual or Semi-Annual report.
FExpense ratios reflect operating expenses of the class. Expenses before reductions do not reflect amounts reimbursed, waived, or reduced through arrangements with the investment adviser, brokerage services, or other offset arrangements, if applicable, and do not represent the amount paid by the class during periods when reimbursements, waivers or reductions occur.
GAmount does not include the portfolio activity of any underlying mutual funds or exchange-traded funds (ETFs).
HPortfolio turnover rate excludes securities received or delivered in-kind.
Fidelity Advisor® Consumer Discretionary Fund Class Z |
| |
| Years ended July 31, | | 2024 | | 2023 | | 2022 | | 2021 | | 2020 |
Selected Per-Share Data | | | | | | | | | | |
| Net asset value, beginning of period | $ | 41.82 | $ | 38.59 | $ | 50.10 | $ | 36.72 | $ | 32.31 |
| Income from Investment Operations | | | | | | | | | | |
Net investment income (loss) A,B | | .07 | | .05 | | - C | | (.04) | | .09 |
| Net realized and unrealized gain (loss) | | 5.78 | | 4.53 | | (8.38) | | 14.00 | | 5.14 |
| Total from investment operations | | 5.85 | | 4.58 | | (8.38) | | 13.96 | | 5.23 |
| Distributions from net realized gain | | - | | (1.35) | | (3.13) | | (.58) | | (.82) |
| Total distributions | | - | | (1.35) | | (3.13) | | (.58) | | (.82) |
| Net asset value, end of period | $ | 47.67 | $ | 41.82 | $ | 38.59 | $ | 50.10 | $ | 36.72 |
Total Return D | | | | 12.59% | | (17.93)% | | 38.23% | | 16.48% |
Ratios to Average Net Assets B,E,F | | | | | | | | | | |
| Expenses before reductions | | .62% | | .64% | | .62% | | .64% | | .66% |
| Expenses net of fee waivers, if any | | | | .64% | | .62% | | .64% | | .66% |
| Expenses net of all reductions | | .62% | | .64% | | .62% | | .64% | | .66% |
| Net investment income (loss) | | .16% | | .13% | | .01% | | (.09)% | | .26% |
| Supplemental Data | | | | | | | | | | |
| Net assets, end of period (000 omitted) | $ | 42,021 | $ | 86,450 | $ | 44,785 | $ | 87,644 | $ | 48,668 |
Portfolio turnover rate G | | | | 43% | | 34% | | 35% | | 41% H |
ACalculated based on average shares outstanding during the period.
BNet investment income (loss) is affected by the timing of the declaration of dividends by any underlying mutual funds or exchange-traded funds (ETFs). Net investment income (loss) of any mutual funds or ETFs is not included in the Fund's net investment income (loss) ratio.
CAmount represents less than $.005 per share.
DTotal returns would have been lower if certain expenses had not been reduced during the applicable periods shown.
EFees and expenses of any underlying mutual funds or exchange-traded funds (ETFs) are not included in the Fund's expense ratio. The Fund indirectly bears its proportionate share of these expenses. For additional expense information related to investments in Fidelity Central Funds, please refer to the "Investments in Fidelity Central Funds" note found in the Notes to Financial Statements section of the most recent Annual or Semi-Annual report.
FExpense ratios reflect operating expenses of the class. Expenses before reductions do not reflect amounts reimbursed, waived, or reduced through arrangements with the investment adviser, brokerage services, or other offset arrangements, if applicable, and do not represent the amount paid by the class during periods when reimbursements, waivers or reductions occur.
GAmount does not include the portfolio activity of any underlying mutual funds or exchange-traded funds (ETFs).
HPortfolio turnover rate excludes securities received or delivered in-kind.
Fidelity Advisor® Energy Fund
Schedule of Investments July 31, 2024
Showing Percentage of Net Assets
| Common Stocks - 99.8% |
| | | Shares | Value ($) |
| Energy Equipment & Services - 16.3% | | | |
| Oil & Gas Drilling - 4.3% | | | |
| Noble Corp. PLC | | 157,200 | 7,422,984 |
| Odfjell Drilling Ltd. | | 664,656 | 3,478,439 |
| Patterson-UTI Energy, Inc. | | 610,896 | 6,713,747 |
| Shelf Drilling Ltd. (a)(b) | | 513,728 | 1,065,068 |
| Valaris Ltd. (a) | | 474,600 | 37,298,814 |
| | | | 55,979,052 |
| Oil & Gas Equipment & Services - 12.0% | | | |
| Halliburton Co. | | 574,100 | 19,909,788 |
| Liberty Energy, Inc. Class A | | 390,500 | 9,430,575 |
| Oceaneering International, Inc. (a) | | 340,500 | 10,221,810 |
| Schlumberger Ltd. | | 1,448,718 | 69,958,592 |
| TechnipFMC PLC | | 1,450,300 | 42,783,850 |
| Tidewater, Inc. (a) | | 34,900 | 3,453,704 |
| Vallourec SA (a) | | 100,900 | 1,635,801 |
| | | | 157,394,120 |
TOTAL ENERGY EQUIPMENT & SERVICES | | | 213,373,172 |
| Independent Power and Renewable Electricity Producers - 1.4% | | | |
| Independent Power Producers & Energy Traders - 1.4% | | | |
| Vistra Corp. | | 232,400 | 18,410,728 |
| Machinery - 1.0% | | | |
| Industrial Machinery & Supplies & Components - 1.0% | | | |
| Chart Industries, Inc. (a)(c) | | 82,600 | 13,305,208 |
| Oil, Gas & Consumable Fuels - 81.1% | | | |
| Integrated Oil & Gas - 42.4% | | | |
| Cenovus Energy, Inc. (Canada) (c) | | 3,992,100 | 80,440,533 |
| Chevron Corp. | | 392,208 | 62,937,618 |
| Exxon Mobil Corp. | | 2,744,871 | 325,514,250 |
| Imperial Oil Ltd. | | 234,900 | 16,828,276 |
| Occidental Petroleum Corp. | | 819,900 | 49,866,318 |
| Occidental Petroleum Corp. warrants 8/3/27 (a) | | 36,987 | 1,440,644 |
| Suncor Energy, Inc. | | 472,300 | 18,862,581 |
| | | | 555,890,220 |
| Oil & Gas Exploration & Production - 22.4% | | | |
| Antero Resources Corp. (a) | | 578,700 | 16,793,874 |
| Canadian Natural Resources Ltd. | | 1,680,300 | 59,659,078 |
| Chord Energy Corp. | | 46,330 | 7,953,008 |
| ConocoPhillips Co. | | 354,450 | 39,414,840 |
| Devon Energy Corp. | | 46,700 | 2,196,301 |
| Diamondback Energy, Inc. | | 213,400 | 43,172,954 |
| EOG Resources, Inc. | | 60,686 | 7,694,985 |
| Hess Corp. | | 288,400 | 44,246,328 |
| National Energy Services Reunited Corp. (a) | | 2,082,400 | 20,261,752 |
| Northern Oil & Gas, Inc. | | 60,030 | 2,592,696 |
| Ovintiv, Inc. | | 593,600 | 27,566,784 |
| Permian Resource Corp. Class A | | 177,500 | 2,722,850 |
| Range Resources Corp. | | 474,400 | 14,815,512 |
| SM Energy Co. | | 99,400 | 4,592,280 |
| | | | 293,683,242 |
| Oil & Gas Refining & Marketing - 9.8% | | | |
| Marathon Petroleum Corp. | | 351,978 | 62,307,146 |
| Phillips 66 Co. | | 100,418 | 14,608,811 |
| Valero Energy Corp. | | 320,200 | 51,782,744 |
| | | | 128,698,701 |
| Oil & Gas Storage & Transportation - 6.5% | | | |
| Cheniere Energy, Inc. | | 283,400 | 51,760,176 |
| Energy Transfer LP | | 1,884,300 | 30,657,561 |
| Golar LNG Ltd. | | 71,400 | 2,491,860 |
| | | | 84,909,597 |
TOTAL OIL, GAS & CONSUMABLE FUELS | | | 1,063,181,760 |
| TOTAL COMMON STOCKS (Cost $746,547,541) | | | 1,308,270,868 |
| | | | |
| Money Market Funds - 1.6% |
| | | Shares | Value ($) |
| Fidelity Cash Central Fund 5.39% (d) | | 3,328,969 | 3,329,635 |
| Fidelity Securities Lending Cash Central Fund 5.39% (d)(e) | | 18,240,356 | 18,242,180 |
| TOTAL MONEY MARKET FUNDS (Cost $21,571,815) | | | 21,571,815 |
| | | | |
| TOTAL INVESTMENT IN SECURITIES - 101.4% (Cost $768,119,356) | 1,329,842,683 |
NET OTHER ASSETS (LIABILITIES) - (1.4)% | (18,385,081) |
| NET ASSETS - 100.0% | 1,311,457,602 |
| | |
Legend
| (b) | Security exempt from registration under Rule 144A of the Securities Act of 1933. These securities may be resold in transactions exempt from registration, normally to qualified institutional buyers. At the end of the period, the value of these securities amounted to $1,065,068 or 0.1% of net assets. |
| (c) | Security or a portion of the security is on loan at period end. |
| (d) | Affiliated fund that is generally available only to investment companies and other accounts managed by Fidelity Investments. The rate quoted is the annualized seven-day yield of the fund at period end. A complete unaudited listing of the fund's holdings as of its most recent quarter end is available upon request. In addition, each Fidelity Central Fund's financial statements, which are not covered by the Fund's Report of Independent Registered Public Accounting Firm, are available on the SEC's website or upon request. |
| (e) | Investment made with cash collateral received from securities on loan. |
Affiliated Central Funds
Fiscal year to date information regarding the Fund's investments in Fidelity Central Funds, including the ownership percentage, is presented below.
| Affiliate | Value, beginning of period ($) | Purchases ($) | Sales Proceeds ($) | Dividend Income ($) | Realized Gain (loss) ($) | Change in Unrealized appreciation (depreciation) ($) | Value, end of period ($) | % ownership, end of period |
| Fidelity Cash Central Fund 5.39% | 4,273,105 | 204,621,843 | 205,565,629 | 247,875 | 316 | - | 3,329,635 | 0.0% |
| Fidelity Securities Lending Cash Central Fund 5.39% | 39,722,849 | 948,469,256 | 969,949,925 | 68,159 | - | - | 18,242,180 | 0.1% |
| Total | 43,995,954 | 1,153,091,099 | 1,175,515,554 | 316,034 | 316 | - | 21,571,815 | |
| | | | | | | | | |
Amounts in the dividend income column in the above table include any capital gain distributions from underlying funds, which are presented in the corresponding line item in the Statement of Operations, if applicable.
Amounts in the dividend income column for Fidelity Securities Lending Cash Central Fund represents the income earned on investing cash collateral, less rebates paid to borrowers and any lending agent fees associated with the loan, plus any premium payments received for lending certain types of securities.
Amounts included in the purchases and sales proceeds columns may include in-kind transactions, if applicable.
Investment Valuation
The following is a summary of the inputs used, as of July 31, 2024, involving the Fund's assets and liabilities carried at fair value. The inputs or methodology used for valuing securities may not be an indication of the risk associated with investing in those securities. For more information on valuation inputs, and their aggregation into the levels used below, please refer to the Investment Valuation section in the accompanying Notes to Financial Statements.
| Valuation Inputs at Reporting Date: |
| Description | Total ($) | Level 1 ($) | Level 2 ($) | Level 3 ($) |
Investments in Securities: | | | | |
|
| Common Stocks | 1,308,270,868 | 1,308,270,868 | - | - |
|
| Money Market Funds | 21,571,815 | 21,571,815 | - | - |
| Total Investments in Securities: | 1,329,842,683 | 1,329,842,683 | - | - |
Fidelity Advisor® Energy Fund
Financial Statements
| Statement of Assets and Liabilities |
As of July 31, 2024 |
| Assets | | | | |
| Investment in securities, at value (including securities loaned of $18,044,910) - See accompanying schedule: | | | | |
Unaffiliated issuers (cost $746,547,541) | $ | 1,308,270,868 | | |
Fidelity Central Funds (cost $21,571,815) | | 21,571,815 | | |
| | | | | |
| | | | | |
| Total Investment in Securities (cost $768,119,356) | | | $ | 1,329,842,683 |
| Foreign currency held at value (cost $50,501) | | | | 49,986 |
| Receivable for investments sold | | | | 4,578,179 |
| Receivable for fund shares sold | | | | 1,223,058 |
| Dividends receivable | | | | 40,774 |
| Distributions receivable from Fidelity Central Funds | | | | 24,567 |
| Prepaid expenses | | | | 812 |
| Other receivables | | | | 104,447 |
Total assets | | | | 1,335,864,506 |
| Liabilities | | | | |
| Payable for investments purchased | $ | 4,287,544 | | |
| Payable for fund shares redeemed | | 791,910 | | |
| Accrued management fee | | 729,902 | | |
| Distribution and service plan fees payable | | 193,441 | | |
| Other payables and accrued expenses | | 162,251 | | |
| Collateral on securities loaned | | 18,241,856 | | |
| Total liabilities | | | | 24,406,904 |
| Net Assets | | | $ | 1,311,457,602 |
| Net Assets consist of: | | | | |
| Paid in capital | | | $ | 947,713,964 |
| Total accumulated earnings (loss) | | | | 363,743,638 |
| Net Assets | | | $ | 1,311,457,602 |
| | | | | |
| Net Asset Value and Maximum Offering Price | | | | |
| Class A : | | | | |
Net Asset Value and redemption price per share ($397,263,190 ÷ 8,120,951 shares)(a) | | | $ | 48.92 |
| Maximum offering price per share (100/94.25 of $48.92) | | | $ | 51.90 |
| Class M : | | | | |
Net Asset Value and redemption price per share ($111,844,226 ÷ 2,223,834 shares)(a) | | | $ | 50.29 |
| Maximum offering price per share (100/96.50 of $50.29) | | | $ | 52.11 |
| Class C : | | | | |
Net Asset Value and offering price per share ($80,847,925 ÷ 1,815,498 shares)(a) | | | $ | 44.53 |
| Class I : | | | | |
Net Asset Value, offering price and redemption price per share ($609,321,706 ÷ 11,725,892 shares) | | | $ | 51.96 |
| Class Z : | | | | |
Net Asset Value, offering price and redemption price per share ($112,180,555 ÷ 2,160,968 shares) | | | $ | 51.91 |
(a)Redemption price per share is equal to net asset value less any applicable contingent deferred sales charge. |
| Statement of Operations |
| Year ended July 31, 2024 |
| Investment Income | | | | |
| Dividends | | | $ | 32,426,291 |
| Income from Fidelity Central Funds (including $68,159 from security lending) | | | | 316,034 |
| Total income | | | | 32,742,325 |
| Expenses | | | | |
| Management fee | $ | 7,470,757 | | |
| Transfer agent fees | | 1,200,621 | | |
| Distribution and service plan fees | | 2,350,978 | | |
| Accounting fees | | 209,327 | | |
| Custodian fees and expenses | | 47,685 | | |
| Independent trustees' fees and expenses | | 6,298 | | |
| Registration fees | | 106,952 | | |
| Audit fees | | 56,472 | | |
| Legal | | 2,562 | | |
| Interest | | 9,653 | | |
| Miscellaneous | | 18,168 | | |
| Total expenses before reductions | | 11,479,473 | | |
| Expense reductions | | (77,876) | | |
| Total expenses after reductions | | | | 11,401,597 |
| Net Investment income (loss) | | | | 21,340,728 |
| Realized and Unrealized Gain (Loss) | | | | |
| Net realized gain (loss) on: | | | | |
| Investment Securities: | | | | |
| Unaffiliated issuers | | 86,976,139 | | |
| Redemptions in-kind | | 42,342,201 | | |
| Fidelity Central Funds | | 316 | | |
| Foreign currency transactions | | (49,106) | | |
| Total net realized gain (loss) | | | | 129,269,550 |
| Change in net unrealized appreciation (depreciation) on: | | | | |
| Investment Securities: | | | | |
| Unaffiliated issuers | | (30,845,192) | | |
| Assets and liabilities in foreign currencies | | 12,743 | | |
| Total change in net unrealized appreciation (depreciation) | | | | (30,832,449) |
| Net gain (loss) | | | | 98,437,101 |
| Net increase (decrease) in net assets resulting from operations | | | $ | 119,777,829 |
| Statement of Changes in Net Assets |
| |
| | Year ended July 31, 2024 | | Year ended July 31, 2023 |
| Increase (Decrease) in Net Assets | | | | |
| Operations | | | | |
| Net investment income (loss) | $ | 21,340,728 | $ | 35,265,025 |
| Net realized gain (loss) | | 129,269,550 | | 43,349,912 |
| Change in net unrealized appreciation (depreciation) | | (30,832,449) | | 113,842,540 |
| Net increase (decrease) in net assets resulting from operations | | 119,777,829 | | 192,457,477 |
| Distributions to shareholders | | (23,514,383) | | (33,434,847) |
| | | | | |
| Share transactions - net increase (decrease) | | (146,093,812) | | (175,324,623) |
| Total increase (decrease) in net assets | | (49,830,366) | | (16,301,993) |
| | | | | |
| Net Assets | | | | |
| Beginning of period | | 1,361,287,968 | | 1,377,589,961 |
| End of period | $ | 1,311,457,602 | $ | 1,361,287,968 |
| | | | | |
| | | | | |
Financial Highlights
Fidelity Advisor® Energy Fund Class A |
| |
| Years ended July 31, | | 2024 | | 2023 | | 2022 | | 2021 | | 2020 |
Selected Per-Share Data | | | | | | | | | | |
| Net asset value, beginning of period | $ | 44.81 | $ | 39.49 | $ | 23.59 | $ | 16.59 | $ | 27.88 |
| Income from Investment Operations | | | | | | | | | | |
Net investment income (loss) A,B | | .73 | | .96 | | .80 | | .65 C | | .57 |
| Net realized and unrealized gain (loss) | | 4.26 | | 5.26 | | 15.68 | | 6.94 | | (11.42) |
| Total from investment operations | | 4.99 | | 6.22 | | 16.48 | | 7.59 | | (10.85) |
| Distributions from net investment income | | (.88) | | (.90) | | (.58) | | (.59) | | (.44) |
| Total distributions | | (.88) | | (.90) | | (.58) | | (.59) | | (.44) |
| Net asset value, end of period | $ | 48.92 | $ | 44.81 | $ | 39.49 | $ | 23.59 | $ | 16.59 |
Total Return D,E | | | | 15.94% | | 71.12% | | 46.78% | | (39.54)% |
Ratios to Average Net Assets A,F,G | | | | | | | | | | |
| Expenses before reductions | | 1.00% | | 1.01% | | 1.05% | | 1.11% | | 1.14% |
| Expenses net of fee waivers, if any | | | | 1.01% | | 1.04% | | 1.11% | | 1.14% |
| Expenses net of all reductions | | .99% | | 1.01% | | 1.04% | | 1.11% | | 1.12% |
| Net investment income (loss) | | 1.59% | | 2.29% | | 2.43% | | 3.15% C | | 2.62% |
| Supplemental Data | | | | | | | | | | |
| Net assets, end of period (000 omitted) | $ | 397,263 | $ | 379,351 | $ | 361,023 | $ | 175,221 | $ | 114,321 |
Portfolio turnover rate H | | | | 21% | | 37% | | 45% | | 84% I |
ANet investment income (loss) is affected by the timing of the declaration of dividends by any underlying mutual funds or exchange-traded funds (ETFs). Net investment income (loss) of any mutual funds or ETFs is not included in the Fund's net investment income (loss) ratio.
BCalculated based on average shares outstanding during the period.
CNet investment income per share reflects one or more large, non-recurring dividend(s) which amounted to $.11 per share. Excluding such non-recurring dividend(s), the ratio of net investment income (loss) to average net assets would have been 2.60%.
DTotal returns would have been lower if certain expenses had not been reduced during the applicable periods shown.
ETotal returns do not include the effect of the sales charges.
FFees and expenses of any underlying mutual funds or exchange-traded funds (ETFs) are not included in the Fund's expense ratio. The Fund indirectly bears its proportionate share of these expenses. For additional expense information related to investments in Fidelity Central Funds, please refer to the "Investments in Fidelity Central Funds" note found in the Notes to Financial Statements section of the most recent Annual or Semi-Annual report.
GExpense ratios reflect operating expenses of the class. Expenses before reductions do not reflect amounts reimbursed, waived, or reduced through arrangements with the investment adviser, brokerage services, or other offset arrangements, if applicable, and do not represent the amount paid by the class during periods when reimbursements, waivers or reductions occur.
HAmount does not include the portfolio activity of any underlying mutual funds or exchange-traded funds (ETFs).
IPortfolio turnover rate excludes securities received or delivered in-kind.
Fidelity Advisor® Energy Fund Class M |
| |
| Years ended July 31, | | 2024 | | 2023 | | 2022 | | 2021 | | 2020 |
Selected Per-Share Data | | | | | | | | | | |
| Net asset value, beginning of period | $ | 46.03 | $ | 40.53 | $ | 24.20 | $ | 17.00 | $ | 28.53 |
| Income from Investment Operations | | | | | | | | | | |
Net investment income (loss) A,B | | .63 | | .88 | | .73 | | .60 C | | .53 |
| Net realized and unrealized gain (loss) | | 4.38 | | 5.39 | | 16.11 | | 7.13 | | (11.71) |
| Total from investment operations | | 5.01 | | 6.27 | | 16.84 | | 7.73 | | (11.18) |
| Distributions from net investment income | | (.75) | | (.77) | | (.51) | | (.53) | | (.35) |
| Total distributions | | (.75) | | (.77) | | (.51) | | (.53) | | (.35) |
| Net asset value, end of period | $ | 50.29 | $ | 46.03 | $ | 40.53 | $ | 24.20 | $ | 17.00 |
Total Return D,E | | | | 15.64% | | 70.66% | | 46.37% | | (39.66)% |
Ratios to Average Net Assets B,F,G | | | | | | | | | | |
| Expenses before reductions | | 1.25% | | 1.27% | | 1.31% | | 1.38% | | 1.40% |
| Expenses net of fee waivers, if any | | | | 1.27% | | 1.31% | | 1.38% | | 1.40% |
| Expenses net of all reductions | | 1.24% | | 1.27% | | 1.31% | | 1.38% | | 1.38% |
| Net investment income (loss) | | 1.34% | | 2.04% | | 2.16% | | 2.88% C | | 2.36% |
| Supplemental Data | | | | | | | | | | |
| Net assets, end of period (000 omitted) | $ | 111,844 | $ | 109,406 | $ | 114,014 | $ | 62,519 | $ | 43,768 |
Portfolio turnover rate H | | | | 21% | | 37% | | 45% | | 84% I |
ACalculated based on average shares outstanding during the period.
BNet investment income (loss) is affected by the timing of the declaration of dividends by any underlying mutual funds or exchange-traded funds (ETFs). Net investment income (loss) of any mutual funds or ETFs is not included in the Fund's net investment income (loss) ratio.
CNet investment income per share reflects one or more large, non-recurring dividend(s) which amounted to $.11 per share. Excluding such non-recurring dividend(s), the ratio of net investment income (loss) to average net assets would have been 2.34%.
DTotal returns would have been lower if certain expenses had not been reduced during the applicable periods shown.
ETotal returns do not include the effect of the sales charges.
FFees and expenses of any underlying mutual funds or exchange-traded funds (ETFs) are not included in the Fund's expense ratio. The Fund indirectly bears its proportionate share of these expenses. For additional expense information related to investments in Fidelity Central Funds, please refer to the "Investments in Fidelity Central Funds" note found in the Notes to Financial Statements section of the most recent Annual or Semi-Annual report.
GExpense ratios reflect operating expenses of the class. Expenses before reductions do not reflect amounts reimbursed, waived, or reduced through arrangements with the investment adviser, brokerage services, or other offset arrangements, if applicable, and do not represent the amount paid by the class during periods when reimbursements, waivers or reductions occur.
HAmount does not include the portfolio activity of any underlying mutual funds or exchange-traded funds (ETFs).
IPortfolio turnover rate excludes securities received or delivered in-kind.
Fidelity Advisor® Energy Fund Class C |
| |
| Years ended July 31, | | 2024 | | 2023 | | 2022 | | 2021 | | 2020 |
Selected Per-Share Data | | | | | | | | | | |
| Net asset value, beginning of period | $ | 40.83 | $ | 36.08 | $ | 21.60 | $ | 15.23 | $ | 25.58 |
| Income from Investment Operations | | | | | | | | | | |
Net investment income (loss) A,B | | .35 | | .59 | | .51 | | .45 C | | .39 |
| Net realized and unrealized gain (loss) | | 3.90 | | 4.80 | | 14.38 | | 6.38 | | (10.52) |
| Total from investment operations | | 4.25 | | 5.39 | | 14.89 | | 6.83 | | (10.13) |
| Distributions from net investment income | | (.55) | | (.64) | | (.41) | | (.46) | | (.22) |
| Total distributions | | (.55) | | (.64) | | (.41) | | (.46) | | (.22) |
| Net asset value, end of period | $ | 44.53 | $ | 40.83 | $ | 36.08 | $ | 21.60 | $ | 15.23 |
Total Return D,E | | | | 15.09% | | 69.86% | | 45.68% | | (39.95)% |
Ratios to Average Net Assets B,F,G | | | | | | | | | | |
| Expenses before reductions | | 1.74% | | 1.76% | | 1.79% | | 1.84% | | 1.86% |
| Expenses net of fee waivers, if any | | | | 1.75% | | 1.78% | | 1.84% | | 1.86% |
| Expenses net of all reductions | | 1.74% | | 1.75% | | 1.78% | | 1.84% | | 1.84% |
| Net investment income (loss) | | .85% | | 1.55% | | 1.69% | | 2.42% C | | 1.90% |
| Supplemental Data | | | | | | | | | | |
| Net assets, end of period (000 omitted) | $ | 80,848 | $ | 94,348 | $ | 105,747 | $ | 56,068 | $ | 45,212 |
Portfolio turnover rate H | | | | 21% | | 37% | | 45% | | 84% I |
ACalculated based on average shares outstanding during the period.
BNet investment income (loss) is affected by the timing of the declaration of dividends by any underlying mutual funds or exchange-traded funds (ETFs). Net investment income (loss) of any mutual funds or ETFs is not included in the Fund's net investment income (loss) ratio.
CNet investment income per share reflects one or more large, non-recurring dividend(s) which amounted to $.10 per share. Excluding such non-recurring dividend(s), the ratio of net investment income (loss) to average net assets would have been 1.88%.
DTotal returns would have been lower if certain expenses had not been reduced during the applicable periods shown.
ETotal returns do not include the effect of the contingent deferred sales charge.
FFees and expenses of any underlying mutual funds or exchange-traded funds (ETFs) are not included in the Fund's expense ratio. The Fund indirectly bears its proportionate share of these expenses. For additional expense information related to investments in Fidelity Central Funds, please refer to the "Investments in Fidelity Central Funds" note found in the Notes to Financial Statements section of the most recent Annual or Semi-Annual report.
GExpense ratios reflect operating expenses of the class. Expenses before reductions do not reflect amounts reimbursed, waived, or reduced through arrangements with the investment adviser, brokerage services, or other offset arrangements, if applicable, and do not represent the amount paid by the class during periods when reimbursements, waivers or reductions occur.
HAmount does not include the portfolio activity of any underlying mutual funds or exchange-traded funds (ETFs).
IPortfolio turnover rate excludes securities received or delivered in-kind.
Fidelity Advisor® Energy Fund Class I |
| |
| Years ended July 31, | | 2024 | | 2023 | | 2022 | | 2021 | | 2020 |
Selected Per-Share Data | | | | | | | | | | |
| Net asset value, beginning of period | $ | 47.54 | $ | 41.83 | $ | 24.95 | $ | 17.51 | $ | 29.39 |
| Income from Investment Operations | | | | | | | | | | |
Net investment income (loss) A,B | | .91 | | 1.14 | | .97 | | .74 C | | .67 |
| Net realized and unrealized gain (loss) | | 4.51 | | 5.57 | | 16.57 | | 7.35 | | (12.02) |
| Total from investment operations | | 5.42 | | 6.71 | | 17.54 | | 8.09 | | (11.35) |
| Distributions from net investment income | | (1.00) | | (1.00) | | (.66) | | (.65) | | (.53) |
| Total distributions | | (1.00) | | (1.00) | | (.66) | | (.65) | | (.53) |
| Net asset value, end of period | $ | 51.96 | $ | 47.54 | $ | 41.83 | $ | 24.95 | $ | 17.51 |
Total Return D | | | | 16.25% | | 71.63% | | 47.26% | | (39.33)% |
Ratios to Average Net Assets B,E,F | | | | | | | | | | |
| Expenses before reductions | | .73% | | .74% | | .76% | | .79% | | .82% |
| Expenses net of fee waivers, if any | | | | .74% | | .76% | | .79% | | .82% |
| Expenses net of all reductions | | .72% | | .74% | | .76% | | .79% | | .80% |
| Net investment income (loss) | | 1.86% | | 2.57% | | 2.71% | | 3.47% C | | 2.95% |
| Supplemental Data | | | | | | | | | | |
| Net assets, end of period (000 omitted) | $ | 609,322 | $ | 511,737 | $ | 533,005 | $ | 177,248 | $ | 154,575 |
Portfolio turnover rate G | | | | 21% | | 37% | | 45% | | 84% H |
ACalculated based on average shares outstanding during the period.
BNet investment income (loss) is affected by the timing of the declaration of dividends by any underlying mutual funds or exchange-traded funds (ETFs). Net investment income (loss) of any mutual funds or ETFs is not included in the Fund's net investment income (loss) ratio.
CNet investment income per share reflects one or more large, non-recurring dividend(s) which amounted to $.12 per share. Excluding such non-recurring dividend(s), the ratio of net investment income (loss) to average net assets would have been 2.93%.
DTotal returns would have been lower if certain expenses had not been reduced during the applicable periods shown.
EFees and expenses of any underlying mutual funds or exchange-traded funds (ETFs) are not included in the Fund's expense ratio. The Fund indirectly bears its proportionate share of these expenses. For additional expense information related to investments in Fidelity Central Funds, please refer to the "Investments in Fidelity Central Funds" note found in the Notes to Financial Statements section of the most recent Annual or Semi-Annual report.
FExpense ratios reflect operating expenses of the class. Expenses before reductions do not reflect amounts reimbursed, waived, or reduced through arrangements with the investment adviser, brokerage services, or other offset arrangements, if applicable, and do not represent the amount paid by the class during periods when reimbursements, waivers or reductions occur.
GAmount does not include the portfolio activity of any underlying mutual funds or exchange-traded funds (ETFs).
HPortfolio turnover rate excludes securities received or delivered in-kind.
Fidelity Advisor® Energy Fund Class Z |
| |
| Years ended July 31, | | 2024 | | 2023 | | 2022 | | 2021 | | 2020 |
Selected Per-Share Data | | | | | | | | | | |
| Net asset value, beginning of period | $ | 47.46 | $ | 41.75 | $ | 24.91 | $ | 17.48 | $ | 29.35 |
| Income from Investment Operations | | | | | | | | | | |
Net investment income (loss) A,B | | .97 | | 1.19 | | 1.02 | | .80 C | | .69 |
| Net realized and unrealized gain (loss) | | 4.51 | | 5.56 | | 16.52 | | 7.30 | | (11.97) |
| Total from investment operations | | 5.48 | | 6.75 | | 17.54 | | 8.10 | | (11.28) |
| Distributions from net investment income | | (1.03) | | (1.04) | | (.70) | | (.67) | | (.59) |
| Total distributions | | (1.03) | | (1.04) | | (.70) | | (.67) | | (.59) |
| Net asset value, end of period | $ | 51.91 | $ | 47.46 | $ | 41.75 | $ | 24.91 | $ | 17.48 |
Total Return D | | | | 16.40% | | 71.83% | | 47.47% | | (39.22)% |
Ratios to Average Net Assets B,E,F | | | | | | | | | | |
| Expenses before reductions | | .60% | | .62% | | .63% | | .65% | | .66% |
| Expenses net of fee waivers, if any | | | | .61% | | .62% | | .64% | | .66% |
| Expenses net of all reductions | | .59% | | .61% | | .62% | | .64% | | .64% |
| Net investment income (loss) | | 1.99% | | 2.69% | | 2.85% | | 3.62% C | | 3.10% |
| Supplemental Data | | | | | | | | | | |
| Net assets, end of period (000 omitted) | $ | 112,181 | $ | 266,447 | $ | 263,802 | $ | 81,903 | $ | 40,742 |
Portfolio turnover rate G | | | | 21% | | 37% | | 45% | | 84% H |
ACalculated based on average shares outstanding during the period.
BNet investment income (loss) is affected by the timing of the declaration of dividends by any underlying mutual funds or exchange-traded funds (ETFs). Net investment income (loss) of any mutual funds or ETFs is not included in the Fund's net investment income (loss) ratio.
CNet investment income per share reflects one or more large, non-recurring dividend(s) which amounted to $.12 per share. Excluding such non-recurring dividend(s), the ratio of net investment income (loss) to average net assets would have been 3.07%.
DTotal returns would have been lower if certain expenses had not been reduced during the applicable periods shown.
EFees and expenses of any underlying mutual funds or exchange-traded funds (ETFs) are not included in the Fund's expense ratio. The Fund indirectly bears its proportionate share of these expenses. For additional expense information related to investments in Fidelity Central Funds, please refer to the "Investments in Fidelity Central Funds" note found in the Notes to Financial Statements section of the most recent Annual or Semi-Annual report.
FExpense ratios reflect operating expenses of the class. Expenses before reductions do not reflect amounts reimbursed, waived, or reduced through arrangements with the investment adviser, brokerage services, or other offset arrangements, if applicable, and do not represent the amount paid by the class during periods when reimbursements, waivers or reductions occur.
GAmount does not include the portfolio activity of any underlying mutual funds or exchange-traded funds (ETFs).
HPortfolio turnover rate excludes securities received or delivered in-kind.
Fidelity Advisor® Financials Fund
Schedule of Investments July 31, 2024
Showing Percentage of Net Assets
| Common Stocks - 100.0% |
| | | Shares | Value ($) |
| Banks - 35.0% | | | |
| Diversified Banks - 19.7% | | | |
| Bank of America Corp. | | 640,656 | 25,824,843 |
| Citigroup, Inc. | | 241,605 | 15,675,332 |
| KeyCorp | | 506,500 | 8,169,845 |
| PNC Financial Services Group, Inc. | | 53,900 | 9,761,290 |
| U.S. Bancorp | | 172,600 | 7,746,288 |
| Wells Fargo & Co. | | 549,428 | 32,603,058 |
| | | | 99,780,656 |
| Regional Banks - 15.3% | | | |
| Associated Banc-Corp. | | 202,800 | 4,660,344 |
| BOK Financial Corp. | | 52,700 | 5,419,668 |
| Cadence Bank | | 93,924 | 3,087,282 |
| East West Bancorp, Inc. | | 72,700 | 6,389,603 |
| Eastern Bankshares, Inc. | | 311,800 | 5,188,352 |
| First Hawaiian, Inc. | | 127,800 | 3,200,112 |
| First Interstate Bancsystem, Inc. | | 171,952 | 5,428,525 |
| Heartland Financial U.S.A., Inc. | | 83,128 | 4,532,139 |
| M&T Bank Corp. | | 75,188 | 12,945,118 |
| Popular, Inc. | | 102,571 | 10,526,862 |
| Trico Bancshares | | 75,700 | 3,522,321 |
| UMB Financial Corp. (a) | | 60,800 | 6,202,816 |
| WesBanco, Inc. | | 120,200 | 3,831,976 |
| Wintrust Financial Corp. | | 25,466 | 2,755,421 |
| | | | 77,690,539 |
TOTAL BANKS | | | 177,471,195 |
| Capital Markets - 21.1% | | | |
| Asset Management & Custody Banks - 7.3% | | | |
| AllianceBernstein Holding LP | | 157,700 | 5,565,233 |
| Blue Owl Capital, Inc. Class A | | 182,200 | 3,474,554 |
| Carlyle Group LP | | 128,700 | 6,401,538 |
| Northern Trust Corp. | | 98,100 | 8,696,565 |
| Patria Investments Ltd. | | 281,300 | 3,659,713 |
| State Street Corp. | | 111,600 | 9,482,652 |
| | | | 37,280,255 |
| Financial Exchanges & Data - 4.0% | | | |
| Bolsa Mexicana de Valores S.A.B. de CV | | 1,785,141 | 2,778,653 |
| MarketAxess Holdings, Inc. | | 36,300 | 8,114,139 |
| Moody's Corp. | | 20,400 | 9,312,192 |
| | | | 20,204,984 |
| Investment Banking & Brokerage - 9.8% | | | |
| Lazard, Inc. Class A | | 139,552 | 6,861,772 |
| LPL Financial | | 33,700 | 7,465,224 |
| Morgan Stanley | | 124,100 | 12,808,361 |
| Perella Weinberg Partners Class A | | 291,800 | 5,515,020 |
| Raymond James Financial, Inc. | | 52,750 | 6,119,000 |
| Stifel Financial Corp. | | 61,000 | 5,408,870 |
| Virtu Financial, Inc. Class A | | 201,460 | 5,503,887 |
| | | | 49,682,134 |
TOTAL CAPITAL MARKETS | | | 107,167,373 |
| Consumer Finance - 3.7% | | | |
| Consumer Finance - 3.7% | | | |
| Discover Financial Services | | 67,600 | 9,733,724 |
| FirstCash Holdings, Inc. | | 50,371 | 5,621,404 |
| OneMain Holdings, Inc. | | 64,300 | 3,360,318 |
| | | | 18,715,446 |
| Financial Services - 20.7% | | | |
| Commercial & Residential Mortgage Finance - 1.9% | | | |
| Essent Group Ltd. | | 73,500 | 4,618,740 |
| NMI Holdings, Inc. Class A (b) | | 122,500 | 4,820,375 |
| | | | 9,439,115 |
| Diversified Financial Services - 4.2% | | | |
| Apollo Global Management, Inc. | | 97,700 | 12,242,787 |
| Corebridge Financial, Inc. | | 157,001 | 4,639,380 |
| Voya Financial, Inc. | | 62,700 | 4,560,171 |
| | | | 21,442,338 |
| Multi-Sector Holdings - 0.5% | | | |
| Cannae Holdings, Inc. | | 133,340 | 2,681,467 |
| Transaction & Payment Processing Services - 14.1% | | | |
| Corpay, Inc. (b) | | 19,000 | 5,544,580 |
| Fiserv, Inc. (b) | | 50,400 | 8,243,928 |
| Global Payments, Inc. | | 68,600 | 6,972,504 |
| MasterCard, Inc. Class A | | 109,300 | 50,683,501 |
| | | | 71,444,513 |
TOTAL FINANCIAL SERVICES | | | 105,007,433 |
| Insurance - 18.5% | | | |
| Insurance Brokers - 5.7% | | | |
| Arthur J. Gallagher & Co. | | 35,300 | 10,007,197 |
| Marsh & McLennan Companies, Inc. | | 45,200 | 10,060,164 |
| The Baldwin Insurance Group, Inc. Class A, (b) | | 205,304 | 8,979,997 |
| | | | 29,047,358 |
| Property & Casualty Insurance - 10.5% | | | |
| American Financial Group, Inc. | | 51,200 | 6,705,152 |
| Assurant, Inc. | | 200 | 34,974 |
| Beazley PLC | | 500,100 | 4,394,246 |
| Chubb Ltd. | | 47,000 | 12,956,020 |
| Direct Line Insurance Group PLC | | 1,475,800 | 3,576,250 |
| Fidelity National Financial, Inc. | | 87,100 | 4,826,211 |
| First American Financial Corp. | | 37,619 | 2,278,959 |
| Hartford Financial Services Group, Inc. | | 70,900 | 7,864,228 |
| Hiscox Ltd. | | 441,500 | 7,213,819 |
| Lancashire Holdings Ltd. | | 428,000 | 3,488,366 |
| | | | 53,338,225 |
| Reinsurance - 2.3% | | | |
| Reinsurance Group of America, Inc. | | 51,500 | 11,609,645 |
TOTAL INSURANCE | | | 93,995,228 |
| Professional Services - 1.0% | | | |
| Research & Consulting Services - 1.0% | | | |
| Dun & Bradstreet Holdings, Inc. | | 475,700 | 5,175,616 |
| TOTAL COMMON STOCKS (Cost $366,943,351) | | | 507,532,291 |
| | | | |
| Money Market Funds - 1.3% |
| | | Shares | Value ($) |
| Fidelity Cash Central Fund 5.39% (c) | | 1,867,634 | 1,868,007 |
| Fidelity Securities Lending Cash Central Fund 5.39% (c)(d) | | 4,707,654 | 4,708,125 |
| TOTAL MONEY MARKET FUNDS (Cost $6,576,132) | | | 6,576,132 |
| | | | |
| TOTAL INVESTMENT IN SECURITIES - 101.3% (Cost $373,519,483) | 514,108,423 |
NET OTHER ASSETS (LIABILITIES) - (1.3)% | (6,693,936) |
| NET ASSETS - 100.0% | 507,414,487 |
| | |
Legend
| (a) | Security or a portion of the security is on loan at period end. |
| (c) | Affiliated fund that is generally available only to investment companies and other accounts managed by Fidelity Investments. The rate quoted is the annualized seven-day yield of the fund at period end. A complete unaudited listing of the fund's holdings as of its most recent quarter end is available upon request. In addition, each Fidelity Central Fund's financial statements, which are not covered by the Fund's Report of Independent Registered Public Accounting Firm, are available on the SEC's website or upon request. |
| (d) | Investment made with cash collateral received from securities on loan. |
Affiliated Central Funds
Fiscal year to date information regarding the Fund's investments in Fidelity Central Funds, including the ownership percentage, is presented below.
| Affiliate | Value, beginning of period ($) | Purchases ($) | Sales Proceeds ($) | Dividend Income ($) | Realized Gain (loss) ($) | Change in Unrealized appreciation (depreciation) ($) | Value, end of period ($) | % ownership, end of period |
| Fidelity Cash Central Fund 5.39% | - | 94,056,566 | 92,188,722 | 58,769 | 163 | - | 1,868,007 | 0.0% |
| Fidelity Securities Lending Cash Central Fund 5.39% | 3,295,125 | 75,517,853 | 74,104,853 | 8,109 | - | - | 4,708,125 | 0.0% |
| Total | 3,295,125 | 169,574,419 | 166,293,575 | 66,878 | 163 | - | 6,576,132 | |
| | | | | | | | | |
Amounts in the dividend income column in the above table include any capital gain distributions from underlying funds, which are presented in the corresponding line item in the Statement of Operations, if applicable.
Amounts in the dividend income column for Fidelity Securities Lending Cash Central Fund represents the income earned on investing cash collateral, less rebates paid to borrowers and any lending agent fees associated with the loan, plus any premium payments received for lending certain types of securities.
Amounts included in the purchases and sales proceeds columns may include in-kind transactions, if applicable.
Investment Valuation
The following is a summary of the inputs used, as of July 31, 2024, involving the Fund's assets and liabilities carried at fair value. The inputs or methodology used for valuing securities may not be an indication of the risk associated with investing in those securities. For more information on valuation inputs, and their aggregation into the levels used below, please refer to the Investment Valuation section in the accompanying Notes to Financial Statements.
| Valuation Inputs at Reporting Date: |
| Description | Total ($) | Level 1 ($) | Level 2 ($) | Level 3 ($) |
Investments in Securities: | | | | |
|
| Common Stocks | 507,532,291 | 507,532,291 | - | - |
|
| Money Market Funds | 6,576,132 | 6,576,132 | - | - |
| Total Investments in Securities: | 514,108,423 | 514,108,423 | - | - |
Fidelity Advisor® Financials Fund
Financial Statements
| Statement of Assets and Liabilities |
As of July 31, 2024 |
| Assets | | | | |
| Investment in securities, at value (including securities loaned of $4,743,930) - See accompanying schedule: | | | | |
Unaffiliated issuers (cost $366,943,351) | $ | 507,532,291 | | |
Fidelity Central Funds (cost $6,576,132) | | 6,576,132 | | |
| | | | | |
| | | | | |
| Total Investment in Securities (cost $373,519,483) | | | $ | 514,108,423 |
| Receivable for fund shares sold | | | | 247,581 |
| Dividends receivable | | | | 310,566 |
| Distributions receivable from Fidelity Central Funds | | | | 8,259 |
| Prepaid expenses | | | | 459 |
Total assets | | | | 514,675,288 |
| Liabilities | | | | |
| Payable for investments purchased | $ | 1,009,980 | | |
| Payable for fund shares redeemed | | 1,111,079 | | |
| Accrued management fee | | 277,570 | | |
| Distribution and service plan fees payable | | 100,803 | | |
| Other payables and accrued expenses | | 53,244 | | |
| Collateral on securities loaned | | 4,708,125 | | |
| Total liabilities | | | | 7,260,801 |
| Net Assets | | | $ | 507,414,487 |
| Net Assets consist of: | | | | |
| Paid in capital | | | $ | 359,571,763 |
| Total accumulated earnings (loss) | | | | 147,842,724 |
| Net Assets | | | $ | 507,414,487 |
| | | | | |
| Net Asset Value and Maximum Offering Price | | | | |
| Class A : | | | | |
Net Asset Value and redemption price per share ($203,327,831 ÷ 6,183,189 shares)(a) | | | $ | 32.88 |
| Maximum offering price per share (100/94.25 of $32.88) | | | $ | 34.89 |
| Class M : | | | | |
Net Asset Value and redemption price per share ($76,610,821 ÷ 2,362,409 shares)(a) | | | $ | 32.43 |
| Maximum offering price per share (100/96.50 of $32.43) | | | $ | 33.61 |
| Class C : | | | | |
Net Asset Value and offering price per share ($36,108,310 ÷ 1,186,456 shares)(a) | | | $ | 30.43 |
| Class I : | | | | |
Net Asset Value, offering price and redemption price per share ($124,435,408 ÷ 3,648,854 shares) | | | $ | 34.10 |
| Class Z : | | | | |
Net Asset Value, offering price and redemption price per share ($66,932,117 ÷ 1,964,619 shares) | | | $ | 34.07 |
(a)Redemption price per share is equal to net asset value less any applicable contingent deferred sales charge. |
| Statement of Operations |
| Year ended July 31, 2024 |
| Investment Income | | | | |
| Dividends | | | $ | 12,340,454 |
| Interest | | | | 40,453 |
| Income from Fidelity Central Funds (including $8,109 from security lending) | | | | 66,878 |
| Total income | | | | 12,447,785 |
| Expenses | | | | |
| Management fee | $ | 2,593,045 | | |
| Transfer agent fees | | 418,034 | | |
| Distribution and service plan fees | | 1,125,818 | | |
| Accounting fees | | 86,849 | | |
| Custodian fees and expenses | | 34,190 | | |
| Independent trustees' fees and expenses | | 2,135 | | |
| Registration fees | | 78,463 | | |
| Audit fees | | 54,115 | | |
| Legal | | 3,668 | | |
| Interest | | 7,191 | | |
| Miscellaneous | | 7,596 | | |
| Total expenses before reductions | | 4,411,104 | | |
| Expense reductions | | (26,773) | | |
| Total expenses after reductions | | | | 4,384,331 |
| Net Investment income (loss) | | | | 8,063,454 |
| Realized and Unrealized Gain (Loss) | | | | |
| Net realized gain (loss) on: | | | | |
| Investment Securities: | | | | |
| Unaffiliated issuers | | 15,739,015 | | |
| Redemptions in-kind | | 7,051,602 | | |
| Fidelity Central Funds | | 163 | | |
| Foreign currency transactions | | (1,068) | | |
| Total net realized gain (loss) | | | | 22,789,712 |
| Change in net unrealized appreciation (depreciation) on investment securities | | | | 79,119,055 |
| Net gain (loss) | | | | 101,908,767 |
| Net increase (decrease) in net assets resulting from operations | | | $ | 109,972,221 |
| Statement of Changes in Net Assets |
| |
| | Year ended July 31, 2024 | | Year ended July 31, 2023 |
| Increase (Decrease) in Net Assets | | | | |
| Operations | | | | |
| Net investment income (loss) | $ | 8,063,454 | $ | 10,530,140 |
| Net realized gain (loss) | | 22,789,712 | | (3,804,150) |
| Change in net unrealized appreciation (depreciation) | | 79,119,055 | | 9,650,146 |
| Net increase (decrease) in net assets resulting from operations | | 109,972,221 | | 16,376,136 |
| Distributions to shareholders | | (8,982,095) | | (30,785,451) |
| | | | | |
| Share transactions - net increase (decrease) | | (66,836,659) | | (23,222,656) |
| Total increase (decrease) in net assets | | 34,153,467 | | (37,631,971) |
| | | | | |
| Net Assets | | | | |
| Beginning of period | | 473,261,020 | | 510,892,991 |
| End of period | $ | 507,414,487 | $ | 473,261,020 |
| | | | | |
| | | | | |
Financial Highlights
Fidelity Advisor® Financials Fund Class A |
| |
| Years ended July 31, | | 2024 | | 2023 | | 2022 | | 2021 | | 2020 |
Selected Per-Share Data | | | | | | | | | | |
| Net asset value, beginning of period | $ | 25.84 | $ | 26.31 | $ | 28.41 | $ | 18.00 | $ | 21.47 |
| Income from Investment Operations | | | | | | | | | | |
Net investment income (loss) A,B | | .51 | | .51 | | .44 | | .42 | | .40 |
| Net realized and unrealized gain (loss) | | 7.17 | | .50 | | (1.32) | | 10.55 | | (3.59) |
| Total from investment operations | | 7.68 | | 1.01 | | (.88) | | 10.97 | | (3.19) |
| Distributions from net investment income | | (.64) | | (.45) | | (.43) | | (.45) | | (.28) |
| Distributions from net realized gain | | - | | (1.03) | | (.80) | | (.11) | | - |
| Total distributions | | (.64) | | (1.48) | | (1.22) C | | (.56) | | (.28) |
| Net asset value, end of period | $ | 32.88 | $ | 25.84 | $ | 26.31 | $ | 28.41 | $ | 18.00 |
Total Return D,E | | | | 4.17% | | (3.40)% | | 61.84% | | (15.15)% |
Ratios to Average Net Assets B,F,G | | | | | | | | | | |
| Expenses before reductions | | 1.03% | | 1.05% | | 1.03% | | 1.07% | | 1.09% |
| Expenses net of fee waivers, if any | | | | 1.04% | | 1.03% | | 1.07% | | 1.09% |
| Expenses net of all reductions | | 1.03% | | 1.04% | | 1.03% | | 1.06% | | 1.08% |
| Net investment income (loss) | | 1.83% | | 2.02% | | 1.55% | | 1.76% | | 1.97% |
| Supplemental Data | | | | | | | | | | |
| Net assets, end of period (000 omitted) | $ | 203,328 | $ | 169,271 | $ | 189,413 | $ | 181,251 | $ | 104,761 |
Portfolio turnover rate H | | | | 55% | | 40% | | 51% | | 88% I |
ACalculated based on average shares outstanding during the period.
BNet investment income (loss) is affected by the timing of the declaration of dividends by any underlying mutual funds or exchange-traded funds (ETFs). Net investment income (loss) of any mutual funds or ETFs is not included in the Fund's net investment income (loss) ratio.
CTotal distributions per share do not sum due to rounding.
DTotal returns would have been lower if certain expenses had not been reduced during the applicable periods shown.
ETotal returns do not include the effect of the sales charges.
FFees and expenses of any underlying mutual funds or exchange-traded funds (ETFs) are not included in the Fund's expense ratio. The Fund indirectly bears its proportionate share of these expenses. For additional expense information related to investments in Fidelity Central Funds, please refer to the "Investments in Fidelity Central Funds" note found in the Notes to Financial Statements section of the most recent Annual or Semi-Annual report.
GExpense ratios reflect operating expenses of the class. Expenses before reductions do not reflect amounts reimbursed, waived, or reduced through arrangements with the investment adviser, brokerage services, or other offset arrangements, if applicable, and do not represent the amount paid by the class during periods when reimbursements, waivers or reductions occur.
HAmount does not include the portfolio activity of any underlying mutual funds or exchange-traded funds (ETFs).
IPortfolio turnover rate excludes securities received or delivered in-kind.
Fidelity Advisor® Financials Fund Class M |
| |
| Years ended July 31, | | 2024 | | 2023 | | 2022 | | 2021 | | 2020 |
Selected Per-Share Data | | | | | | | | | | |
| Net asset value, beginning of period | $ | 25.49 | $ | 25.98 | $ | 28.08 | $ | 17.79 | $ | 21.23 |
| Income from Investment Operations | | | | | | | | | | |
Net investment income (loss) A,B | | .44 | | .44 | | .37 | | .36 | | .34 |
| Net realized and unrealized gain (loss) | | 7.07 | | .49 | | (1.31) | | 10.44 | | (3.55) |
| Total from investment operations | | 7.51 | | .93 | | (.94) | | 10.80 | | (3.21) |
| Distributions from net investment income | | (.57) | | (.39) | | (.37) | | (.39) | | (.23) |
| Distributions from net realized gain | | - | | (1.03) | | (.80) | | (.11) | | - |
| Total distributions | | (.57) | | (1.42) | | (1.16) C | | (.51) C | | (.23) |
| Net asset value, end of period | $ | 32.43 | $ | 25.49 | $ | 25.98 | $ | 28.08 | $ | 17.79 |
Total Return D,E | | | | 3.88% | | (3.63)% | | 61.48% | | (15.38)% |
Ratios to Average Net Assets B,F,G | | | | | | | | | | |
| Expenses before reductions | | 1.27% | | 1.29% | | 1.28% | | 1.32% | | 1.35% |
| Expenses net of fee waivers, if any | | | | 1.28% | | 1.28% | | 1.32% | | 1.35% |
| Expenses net of all reductions | | 1.27% | | 1.28% | | 1.28% | | 1.31% | | 1.34% |
| Net investment income (loss) | | 1.60% | | 1.78% | | 1.30% | | 1.51% | | 1.72% |
| Supplemental Data | | | | | | | | | | |
| Net assets, end of period (000 omitted) | $ | 76,611 | $ | 64,588 | $ | 69,176 | $ | 60,508 | $ | 34,828 |
Portfolio turnover rate H | | | | 55% | | 40% | | 51% | | 88% I |
ACalculated based on average shares outstanding during the period.
BNet investment income (loss) is affected by the timing of the declaration of dividends by any underlying mutual funds or exchange-traded funds (ETFs). Net investment income (loss) of any mutual funds or ETFs is not included in the Fund's net investment income (loss) ratio.
CTotal distributions per share do not sum due to rounding.
DTotal returns would have been lower if certain expenses had not been reduced during the applicable periods shown.
ETotal returns do not include the effect of the sales charges.
FFees and expenses of any underlying mutual funds or exchange-traded funds (ETFs) are not included in the Fund's expense ratio. The Fund indirectly bears its proportionate share of these expenses. For additional expense information related to investments in Fidelity Central Funds, please refer to the "Investments in Fidelity Central Funds" note found in the Notes to Financial Statements section of the most recent Annual or Semi-Annual report.
GExpense ratios reflect operating expenses of the class. Expenses before reductions do not reflect amounts reimbursed, waived, or reduced through arrangements with the investment adviser, brokerage services, or other offset arrangements, if applicable, and do not represent the amount paid by the class during periods when reimbursements, waivers or reductions occur.
HAmount does not include the portfolio activity of any underlying mutual funds or exchange-traded funds (ETFs).
IPortfolio turnover rate excludes securities received or delivered in-kind.
Fidelity Advisor® Financials Fund Class C |
| |
| Years ended July 31, | | 2024 | | 2023 | | 2022 | | 2021 | | 2020 |
Selected Per-Share Data | | | | | | | | | | |
| Net asset value, beginning of period | $ | 23.92 | $ | 24.44 | $ | 26.48 | $ | 16.80 | $ | 20.04 |
| Income from Investment Operations | | | | | | | | | | |
Net investment income (loss) A,B | | .28 | | .30 | | .21 | | .22 | | .23 |
| Net realized and unrealized gain (loss) | | 6.64 | | .46 | | (1.23) | | 9.85 | | (3.37) |
| Total from investment operations | | 6.92 | | .76 | | (1.02) | | 10.07 | | (3.14) |
| Distributions from net investment income | | (.41) | | (.25) | | (.23) | | (.28) | | (.10) |
| Distributions from net realized gain | | - | | (1.03) | | (.80) | | (.11) | | - |
| Total distributions | | (.41) | | (1.28) | | (1.02) C | | (.39) | | (.10) |
| Net asset value, end of period | $ | 30.43 | $ | 23.92 | $ | 24.44 | $ | 26.48 | $ | 16.80 |
Total Return D,E | | | | 3.38% | | (4.13)% | | 60.62% | | (15.79)% |
Ratios to Average Net Assets B,F,G | | | | | | | | | | |
| Expenses before reductions | | 1.78% | | 1.79% | | 1.79% | | 1.83% | | 1.84% |
| Expenses net of fee waivers, if any | | | | 1.79% | | 1.78% | | 1.82% | | 1.84% |
| Expenses net of all reductions | | 1.77% | | 1.79% | | 1.78% | | 1.82% | | 1.83% |
| Net investment income (loss) | | 1.09% | | 1.27% | | .80% | | 1.00% | | 1.22% |
| Supplemental Data | | | | | | | | | | |
| Net assets, end of period (000 omitted) | $ | 36,108 | $ | 41,339 | $ | 58,177 | $ | 57,856 | $ | 41,947 |
Portfolio turnover rate H | | | | 55% | | 40% | | 51% | | 88% I |
ACalculated based on average shares outstanding during the period.
BNet investment income (loss) is affected by the timing of the declaration of dividends by any underlying mutual funds or exchange-traded funds (ETFs). Net investment income (loss) of any mutual funds or ETFs is not included in the Fund's net investment income (loss) ratio.
CTotal distributions per share do not sum due to rounding.
DTotal returns would have been lower if certain expenses had not been reduced during the applicable periods shown.
ETotal returns do not include the effect of the contingent deferred sales charge.
FFees and expenses of any underlying mutual funds or exchange-traded funds (ETFs) are not included in the Fund's expense ratio. The Fund indirectly bears its proportionate share of these expenses. For additional expense information related to investments in Fidelity Central Funds, please refer to the "Investments in Fidelity Central Funds" note found in the Notes to Financial Statements section of the most recent Annual or Semi-Annual report.
GExpense ratios reflect operating expenses of the class. Expenses before reductions do not reflect amounts reimbursed, waived, or reduced through arrangements with the investment adviser, brokerage services, or other offset arrangements, if applicable, and do not represent the amount paid by the class during periods when reimbursements, waivers or reductions occur.
HAmount does not include the portfolio activity of any underlying mutual funds or exchange-traded funds (ETFs).
IPortfolio turnover rate excludes securities received or delivered in-kind.
Fidelity Advisor® Financials Fund Class I |
| |
| Years ended July 31, | | 2024 | | 2023 | | 2022 | | 2021 | | 2020 |
Selected Per-Share Data | | | | | | | | | | |
| Net asset value, beginning of period | $ | 26.77 | $ | 27.20 | $ | 29.32 | $ | 18.55 | $ | 22.11 |
| Income from Investment Operations | | | | | | | | | | |
Net investment income (loss) A,B | | .61 | | .60 | | .54 | | .52 | | .47 |
| Net realized and unrealized gain (loss) | | 7.43 | | .52 | | (1.37) | | 10.86 | | (3.69) |
| Total from investment operations | | 8.04 | | 1.12 | | (.83) | | 11.38 | | (3.22) |
| Distributions from net investment income | | (.71) | | (.53) | | (.50) | | (.50) | | (.34) |
| Distributions from net realized gain | | - | | (1.03) | | (.80) | | (.11) | | - |
| Total distributions | | (.71) | | (1.55) C | | (1.29) C | | (.61) | | (.34) |
| Net asset value, end of period | $ | 34.10 | $ | 26.77 | $ | 27.20 | $ | 29.32 | $ | 18.55 |
Total Return D | | | | 4.47% | | (3.13)% | | 62.31% | | (14.91)% |
Ratios to Average Net Assets B,E,F | | | | | | | | | | |
| Expenses before reductions | | .76% | | .77% | | .76% | | .79% | | .80% |
| Expenses net of fee waivers, if any | | | | .77% | | .76% | | .79% | | .80% |
| Expenses net of all reductions | | .75% | | .77% | | .76% | | .78% | | .78% |
| Net investment income (loss) | | 2.11% | | 2.29% | | 1.82% | | 2.04% | | 2.27% |
| Supplemental Data | | | | | | | | | | |
| Net assets, end of period (000 omitted) | $ | 124,435 | $ | 110,244 | $ | 131,118 | $ | 118,424 | $ | 85,299 |
Portfolio turnover rate G | | | | 55% | | 40% | | 51% | | 88% H |
ACalculated based on average shares outstanding during the period.
BNet investment income (loss) is affected by the timing of the declaration of dividends by any underlying mutual funds or exchange-traded funds (ETFs). Net investment income (loss) of any mutual funds or ETFs is not included in the Fund's net investment income (loss) ratio.
CTotal distributions per share do not sum due to rounding.
DTotal returns would have been lower if certain expenses had not been reduced during the applicable periods shown.
EFees and expenses of any underlying mutual funds or exchange-traded funds (ETFs) are not included in the Fund's expense ratio. The Fund indirectly bears its proportionate share of these expenses. For additional expense information related to investments in Fidelity Central Funds, please refer to the "Investments in Fidelity Central Funds" note found in the Notes to Financial Statements section of the most recent Annual or Semi-Annual report.
FExpense ratios reflect operating expenses of the class. Expenses before reductions do not reflect amounts reimbursed, waived, or reduced through arrangements with the investment adviser, brokerage services, or other offset arrangements, if applicable, and do not represent the amount paid by the class during periods when reimbursements, waivers or reductions occur.
GAmount does not include the portfolio activity of any underlying mutual funds or exchange-traded funds (ETFs).
HPortfolio turnover rate excludes securities received or delivered in-kind.
Fidelity Advisor® Financials Fund Class Z |
| |
| Years ended July 31, | | 2024 | | 2023 | | 2022 | | 2021 | | 2020 |
Selected Per-Share Data | | | | | | | | | | |
| Net asset value, beginning of period | $ | 26.71 | $ | 27.16 | $ | 29.28 | $ | 18.53 | $ | 22.09 |
| Income from Investment Operations | | | | | | | | | | |
Net investment income (loss) A,B | | .63 | | .63 | | .57 | | .54 | | .49 |
| Net realized and unrealized gain (loss) | | 7.44 | | .51 | | (1.37) | | 10.86 | | (3.67) |
| Total from investment operations | | 8.07 | | 1.14 | | (.80) | | 11.40 | | (3.18) |
| Distributions from net investment income | | (.71) | | (.57) | | (.53) | | (.54) | | (.38) |
| Distributions from net realized gain | | - | | (1.03) | | (.80) | | (.11) | | - |
| Total distributions | | (.71) | | (1.59) C | | (1.32) C | | (.65) | | (.38) |
| Net asset value, end of period | $ | 34.07 | $ | 26.71 | $ | 27.16 | $ | 29.28 | $ | 18.53 |
Total Return D | | | | 4.58% | | (3.03)% | | 62.53% | | (14.79)% |
Ratios to Average Net Assets B,E,F | | | | | | | | | | |
| Expenses before reductions | | .63% | | .64% | | .64% | | .66% | | .67% |
| Expenses net of fee waivers, if any | | | | .64% | | .63% | | .66% | | .67% |
| Expenses net of all reductions | | .62% | | .64% | | .63% | | .65% | | .65% |
| Net investment income (loss) | | 2.24% | | 2.42% | | 1.95% | | 2.17% | | 2.40% |
| Supplemental Data | | | | | | | | | | |
| Net assets, end of period (000 omitted) | $ | 66,932 | $ | 87,819 | $ | 63,009 | $ | 49,214 | $ | 30,790 |
Portfolio turnover rate G | | | | 55% | | 40% | | 51% | | 88% H |
ACalculated based on average shares outstanding during the period.
BNet investment income (loss) is affected by the timing of the declaration of dividends by any underlying mutual funds or exchange-traded funds (ETFs). Net investment income (loss) of any mutual funds or ETFs is not included in the Fund's net investment income (loss) ratio.
CTotal distributions per share do not sum due to rounding.
DTotal returns would have been lower if certain expenses had not been reduced during the applicable periods shown.
EFees and expenses of any underlying mutual funds or exchange-traded funds (ETFs) are not included in the Fund's expense ratio. The Fund indirectly bears its proportionate share of these expenses. For additional expense information related to investments in Fidelity Central Funds, please refer to the "Investments in Fidelity Central Funds" note found in the Notes to Financial Statements section of the most recent Annual or Semi-Annual report.
FExpense ratios reflect operating expenses of the class. Expenses before reductions do not reflect amounts reimbursed, waived, or reduced through arrangements with the investment adviser, brokerage services, or other offset arrangements, if applicable, and do not represent the amount paid by the class during periods when reimbursements, waivers or reductions occur.
GAmount does not include the portfolio activity of any underlying mutual funds or exchange-traded funds (ETFs).
HPortfolio turnover rate excludes securities received or delivered in-kind.
Fidelity Advisor® Health Care Fund
Consolidated Schedule of Investments July 31, 2024
Showing Percentage of Net Assets
| Common Stocks - 97.8% |
| | | Shares | Value ($) |
| Biotechnology - 23.6% | | | |
| Biotechnology - 23.6% | | | |
| Acelyrin, Inc. (a)(b) | | 600,000 | 3,600,000 |
| Acumen Pharmaceuticals, Inc. (a)(b) | | 700,000 | 2,310,000 |
| Allogene Therapeutics, Inc. (a)(b) | | 2,964,600 | 8,715,924 |
| Alnylam Pharmaceuticals, Inc. (a) | | 425,000 | 100,920,500 |
| Apogee Therapeutics, Inc. | | 33,300 | 1,621,710 |
| Arcellx, Inc. (a) | | 240,000 | 14,834,400 |
| Arcus Biosciences, Inc. (a) | | 450,000 | 7,384,500 |
| Argenx SE ADR (a) | | 184,000 | 94,920,080 |
| Ascendis Pharma A/S sponsored ADR (a) | | 515,000 | 68,752,500 |
| Avidity Biosciences, Inc. (a) | | 400,000 | 18,232,000 |
| Blueprint Medicines Corp. (a) | | 400,000 | 43,320,000 |
| Cargo Therapeutics, Inc. (b) | | 637,201 | 10,851,533 |
| Caris Life Sciences, Inc. (a)(c)(d) | | 1,098,028 | 3,008,597 |
| Cartesian Therapeutics, Inc. (c) | | 230,254 | 3,753,140 |
| Celldex Therapeutics, Inc. (a) | | 340,000 | 12,957,400 |
| Cytokinetics, Inc. (a)(b) | | 800,000 | 47,208,000 |
| Exact Sciences Corp. (a)(b) | | 1,120,000 | 51,161,600 |
| Immunocore Holdings PLC ADR (a) | | 260,952 | 10,359,794 |
| Intellia Therapeutics, Inc. (a)(b) | | 360,000 | 9,435,600 |
| Janux Therapeutics, Inc. (a)(b) | | 428,000 | 17,376,800 |
| Keros Therapeutics, Inc. (a) | | 400,000 | 20,064,000 |
| Legend Biotech Corp. ADR (a) | | 1,560,000 | 87,968,400 |
| Merus BV (a) | | 613,423 | 32,535,956 |
| Moonlake Immunotherapeutics Class A (a)(b) | | 320,000 | 13,328,000 |
| Nuvalent, Inc. Class A (a)(b) | | 425,300 | 33,998,482 |
| Perspective Therapeutics, Inc. (a) | | 19,774 | 268,926 |
| Poseida Therapeutics, Inc. (a) | | 1,452,091 | 5,125,881 |
| Regeneron Pharmaceuticals, Inc. (a) | | 186,500 | 201,268,935 |
| Sarepta Therapeutics, Inc. (a) | | 160,000 | 22,758,400 |
| Spyre Therapeutics, Inc. (a)(b) | | 330,000 | 9,075,000 |
| Summit Therapeutics, Inc. (a)(b) | | 750,000 | 8,100,000 |
| Vaxcyte, Inc. (a)(b) | | 875,000 | 69,028,750 |
| Viking Therapeutics, Inc. (a) | | 36,800 | 2,097,600 |
| Viridian Therapeutics, Inc. (a) | | 1,000,000 | 16,850,000 |
| Xenon Pharmaceuticals, Inc. (a) | | 760,000 | 32,778,800 |
| Zealand Pharma A/S (a) | | 9,100 | 1,227,340 |
| | | | 1,087,198,548 |
| Health Care Equipment & Supplies - 23.2% | | | |
| Health Care Equipment - 23.2% | | | |
| Boston Scientific Corp. (a) | | 5,925,000 | 437,738,999 |
| DexCom, Inc. (a) | | 220,000 | 14,920,400 |
| Edwards Lifesciences Corp. (a) | | 180,000 | 11,349,000 |
| Glaukos Corp. (a) | | 525,000 | 61,514,250 |
| Inspire Medical Systems, Inc. (a) | | 285,000 | 40,199,250 |
| Insulet Corp. (a) | | 525,000 | 102,033,750 |
| Intuitive Surgical, Inc. (a) | | 156,000 | 69,359,160 |
| Masimo Corp. (a) | | 550,000 | 58,839,000 |
| Medical Microinstruments, Inc. warrants 2/16/31 (a)(c)(d) | | 9,982 | 122,280 |
| Penumbra, Inc. (a) | | 850,000 | 142,026,500 |
| PROCEPT BioRobotics Corp. (a) | | 380,000 | 24,061,600 |
| Stryker Corp. | | 335,000 | 109,695,750 |
| | | | 1,071,859,939 |
| Health Care Providers & Services - 21.8% | | | |
| Health Care Distributors - 1.7% | | | |
| McKesson Corp. | | 124,000 | 76,510,480 |
| Health Care Facilities - 1.5% | | | |
| Surgery Partners, Inc. (a)(b) | | 2,250,000 | 68,310,000 |
| Health Care Services - 7.1% | | | |
| agilon health, Inc. (a)(b) | | 3,150,000 | 21,703,500 |
| BrightSpring Health Services, Inc. (b) | | 1,850,000 | 22,921,500 |
| Cigna Group | | 454,000 | 158,296,180 |
| CVS Health Corp. | | 860,000 | 51,883,800 |
| LifeStance Health Group, Inc. (a) | | 4,280,000 | 23,582,800 |
| Privia Health Group, Inc. (a) | | 2,500,000 | 51,850,000 |
| | | | 330,237,780 |
| Managed Health Care - 11.5% | | | |
| Alignment Healthcare, Inc. (a) | | 3,500,000 | 30,590,000 |
| Centene Corp. (a) | | 720,000 | 55,382,400 |
| Elevance Health, Inc. | | 160,000 | 85,124,800 |
| UnitedHealth Group, Inc. | | 625,000 | 360,100,000 |
| | | | 531,197,200 |
TOTAL HEALTH CARE PROVIDERS & SERVICES | | | 1,006,255,460 |
| Health Care Technology - 1.7% | | | |
| Health Care Technology - 1.7% | | | |
| Phreesia, Inc. (a) | | 903,744 | 22,548,413 |
| Veeva Systems, Inc. Class A (a) | | 294,900 | 56,600,157 |
| | | | 79,148,570 |
| Life Sciences Tools & Services - 10.9% | | | |
| Life Sciences Tools & Services - 10.9% | | | |
| 10X Genomics, Inc. (a) | | 1,611,400 | 33,307,638 |
| Bruker Corp. | | 680,000 | 46,586,800 |
| Danaher Corp. | | 1,060,000 | 293,704,800 |
| IQVIA Holdings, Inc. (a) | | 228,000 | 56,140,440 |
| Thermo Fisher Scientific, Inc. | | 102,000 | 62,560,680 |
| West Pharmaceutical Services, Inc. | | 28,000 | 8,572,760 |
| | | | 500,873,118 |
| Pharmaceuticals - 16.6% | | | |
| Pharmaceuticals - 16.6% | | | |
| AstraZeneca PLC (United Kingdom) | | 440,000 | 69,903,189 |
| Contineum Therapeutics, Inc. Class A | | 128,000 | 2,567,680 |
| Eli Lilly & Co. | | 472,000 | 379,615,440 |
| Enliven Therapeutics, Inc. (a) | | 280,000 | 7,386,400 |
| Merck & Co., Inc. | | 1,600,000 | 181,008,000 |
| Pharvaris BV (a)(b) | | 478,189 | 8,196,159 |
| Rapport Therapeutics, Inc. (b) | | 160,000 | 3,635,200 |
| Royalty Pharma PLC | | 1,400,000 | 39,438,000 |
| Structure Therapeutics, Inc. ADR (a) | | 412,000 | 15,404,680 |
| UCB SA | | 365,000 | 61,090,037 |
| | | | 768,244,785 |
| TOTAL COMMON STOCKS (Cost $2,760,483,375) | | | 4,513,580,420 |
| | | | |
| Convertible Preferred Stocks - 1.6% |
| | | Shares | Value ($) |
| Biotechnology - 0.8% | | | |
| Biotechnology - 0.8% | | | |
| Asimov, Inc. Series B (a)(c)(d) | | 67,547 | 3,042,992 |
| Caris Life Sciences, Inc. Series D (a)(c)(d) | | 2,082,481 | 5,705,998 |
| Cleerly, Inc. Series C (a)(c)(d) | | 882,089 | 9,526,561 |
| Element Biosciences, Inc.: | | | |
| Series C (a)(c)(d) | | 376,690 | 4,030,583 |
| Series D (c)(d) | | 246,623 | 1,933,524 |
| Series D1 (c)(d) | | 246,623 | 1,933,524 |
| ElevateBio LLC Series C (a)(c)(d) | | 163,300 | 517,661 |
| Endeavor BioMedicines, Inc. Series C (c)(d) | | 863,746 | 6,201,696 |
| Inscripta, Inc. Series E (a)(c)(d) | | 826,424 | 2,479,272 |
| | | | 35,371,811 |
| Financial Services - 0.1% | | | |
| Specialized Finance - 0.1% | | | |
| Saluda Medical, Inc. Series E (a)(c)(d) | | 781,583 | 5,439,818 |
| Health Care Equipment & Supplies - 0.3% | | | |
| Health Care Equipment - 0.3% | | | |
| Insightec Ltd. Series G (c)(d) | | 7,391,153 | 6,578,126 |
| Medical Microinstruments, Inc. Series C (c)(d) | | 199,633 | 6,573,915 |
| | | | 13,152,041 |
| Health Care Providers & Services - 0.1% | | | |
| Health Care Services - 0.1% | | | |
| dMed Biopharmaceutical Co. Ltd. Series C (a)(c)(d) | | 236,142 | 1,081,530 |
| Thriveworks TopCo LLC Series B (a)(c)(d)(e) | | 327,591 | 3,252,979 |
| | | | 4,334,509 |
| Health Care Technology - 0.3% | | | |
| Health Care Technology - 0.3% | | | |
| Aledade, Inc.: | | | |
| Series B1 (a)(c)(d) | | 130,618 | 5,168,554 |
| Series E1 (a)(c)(d) | | 46,526 | 1,841,034 |
| Omada Health, Inc. Series E (a)(c)(d) | | 1,456,953 | 5,550,991 |
| Wugen, Inc. Series B (a)(c)(d) | | 300,054 | 1,248,225 |
| | | | 13,808,804 |
| Pharmaceuticals - 0.0% | | | |
| Pharmaceuticals - 0.0% | | | |
| Galvanize Therapeutics Series B (a)(c)(d) | | 2,552,870 | 2,169,940 |
| TOTAL CONVERTIBLE PREFERRED STOCKS (Cost $113,972,307) | | | 74,276,923 |
| | | | |
| Convertible Bonds - 0.1% |
| | | Principal Amount (f) | Value ($) |
| Health Care Technology - 0.0% | | | |
| Health Care Technology - 0.0% | | | |
| Wugen, Inc. 10% 6/14/25 (c)(d) | | 1,433,586 | 1,466,415 |
| Pharmaceuticals - 0.1% | | | |
| Pharmaceuticals - 0.1% | | | |
| Galvanize Therapeutics 6% 2/28/27 (c)(d) | | 2,082,600 | 2,176,734 |
| TOTAL CONVERTIBLE BONDS (Cost $3,516,186) | | | 3,643,149 |
| | | | |
| Preferred Securities - 0.2% |
| | | Principal Amount (f) | Value ($) |
| Health Care Equipment & Supplies - 0.2% | | | |
| Health Care Supplies - 0.2% | | | |
Kardium, Inc. 10% 12/31/26 (c)(d) (Cost $7,565,529) | | 7,565,529 | 7,682,374 |
| | | | |
| Money Market Funds - 4.6% |
| | | Shares | Value ($) |
| Fidelity Cash Central Fund 5.39% (g) | | 9,057,109 | 9,058,921 |
| Fidelity Securities Lending Cash Central Fund 5.39% (g)(h) | | 204,641,621 | 204,662,086 |
| TOTAL MONEY MARKET FUNDS (Cost $213,721,007) | | | 213,721,007 |
| | | | |
| TOTAL INVESTMENT IN SECURITIES - 104.3% (Cost $3,099,258,404) | 4,812,903,873 |
NET OTHER ASSETS (LIABILITIES) - (4.3)% | (197,320,724) |
| NET ASSETS - 100.0% | 4,615,583,149 |
| | |
Legend
| (b) | Security or a portion of the security is on loan at period end. |
| (c) | Restricted securities (including private placements) - Investment in securities not registered under the Securities Act of 1933 (excluding 144A issues). At the end of the period, the value of restricted securities (excluding 144A issues) amounted to $92,486,463 or 2.0% of net assets. |
| (e) | Investment is owned by a wholly-owned subsidiary (Subsidiary) that is treated as a corporation for U.S. tax purposes. |
| (f) | Amount is stated in United States dollars unless otherwise noted. |
| (g) | Affiliated fund that is generally available only to investment companies and other accounts managed by Fidelity Investments. The rate quoted is the annualized seven-day yield of the fund at period end. A complete unaudited listing of the fund's holdings as of its most recent quarter end is available upon request. In addition, each Fidelity Central Fund's financial statements, which are not covered by the Fund's Report of Independent Registered Public Accounting Firm, are available on the SEC's website or upon request. |
| (h) | Investment made with cash collateral received from securities on loan. |
| Additional information on each restricted holding is as follows: |
| Security | Acquisition Date | Acquisition Cost ($) |
| Aledade, Inc. Series B1 | 5/07/21 | 5,001,455 |
| | | |
| Aledade, Inc. Series E1 | 5/20/22 | 2,317,665 |
| | | |
| Asimov, Inc. Series B | 10/29/21 | 6,260,303 |
| | | |
| Caris Life Sciences, Inc. | 10/06/22 | 6,148,957 |
| | | |
| Caris Life Sciences, Inc. Series D | 5/11/21 | 16,868,096 |
| | | |
| Cartesian Therapeutics, Inc. | 7/02/24 | 4,605,080 |
| | | |
| Cleerly, Inc. Series C | 7/08/22 | 10,391,538 |
| | | |
| dMed Biopharmaceutical Co. Ltd. Series C | 12/01/20 | 3,353,960 |
| | | |
| Element Biosciences, Inc. Series C | 6/21/21 | 7,743,503 |
| | | |
| Element Biosciences, Inc. Series D | 6/28/24 | 1,934,338 |
| | | |
| Element Biosciences, Inc. Series D1 | 6/28/24 | 1,934,338 |
| | | |
| ElevateBio LLC Series C | 3/09/21 | 685,044 |
| | | |
| Endeavor BioMedicines, Inc. Series C | 4/22/24 | 5,635,597 |
| | | |
| Galvanize Therapeutics Series B | 3/29/22 | 4,419,746 |
| | | |
| Galvanize Therapeutics 6% 2/28/27 | 2/28/24 | 2,082,600 |
| | | |
| Inscripta, Inc. Series E | 3/30/21 | 7,297,324 |
| | | |
| Insightec Ltd. Series G | 6/17/24 | 6,561,866 |
| | | |
| Kardium, Inc. 10% 12/31/26 | 5/31/24 | 7,565,529 |
| | | |
| Medical Microinstruments, Inc. warrants 2/16/31 | 2/16/24 | 0 |
| | | |
| Medical Microinstruments, Inc. Series C | 2/16/24 | 6,654,507 |
| | | |
| Omada Health, Inc. Series E | 12/22/21 | 8,734,725 |
| | | |
| Saluda Medical, Inc. Series E | 4/06/23 | 6,310,345 |
| | | |
| Thriveworks TopCo LLC Series B | 7/23/21 - 2/25/22 | 9,402,913 |
| | | |
| Wugen, Inc. Series B | 7/09/21 | 2,326,889 |
| | | |
| Wugen, Inc. 10% 6/14/25 | 6/14/24 | 1,433,586 |
| | | |
Affiliated Central Funds
Fiscal year to date information regarding the Fund's investments in Fidelity Central Funds, including the ownership percentage, is presented below.
| Affiliate | Value, beginning of period ($) | Purchases ($) | Sales Proceeds ($) | Dividend Income ($) | Realized Gain (loss) ($) | Change in Unrealized appreciation (depreciation) ($) | Value, end of period ($) | % ownership, end of period |
| Fidelity Cash Central Fund 5.39% | 41,922,825 | 689,833,317 | 722,697,317 | 858,308 | 96 | - | 9,058,921 | 0.0% |
| Fidelity Securities Lending Cash Central Fund 5.39% | 260,931,533 | 960,164,992 | 1,016,434,439 | 529,638 | - | - | 204,662,086 | 0.9% |
| Total | 302,854,358 | 1,649,998,309 | 1,739,131,756 | 1,387,946 | 96 | - | 213,721,007 | |
| | | | | | | | | |
Amounts in the dividend income column in the above table include any capital gain distributions from underlying funds, which are presented in the corresponding line item in the Consolidated Statement of Operations, if applicable.
Amounts in the dividend income column for Fidelity Securities Lending Cash Central Fund represents the income earned on investing cash collateral, less rebates paid to borrowers and any lending agent fees associated with the loan, plus any premium payments received for lending certain types of securities.
Amounts included in the purchases and sales proceeds columns may include in-kind transactions, if applicable.
Investment Valuation
The following is a summary of the inputs used, as of July 31, 2024, involving the Fund's assets and liabilities carried at fair value. The inputs or methodology used for valuing securities may not be an indication of the risk associated with investing in those securities. For more information on valuation inputs, and their aggregation into the levels used below, please refer to the Investment Valuation section in the accompanying Notes to Consolidated Financial Statements.
| Valuation Inputs at Reporting Date: |
| Description | Total ($) | Level 1 ($) | Level 2 ($) | Level 3 ($) |
Investments in Securities: | | | | |
|
| Common Stocks | 4,513,580,420 | 4,440,546,354 | 69,903,189 | 3,130,877 |
|
| Convertible Preferred Stocks | 74,276,923 | - | - | 74,276,923 |
|
| Convertible Bonds | 3,643,149 | - | - | 3,643,149 |
|
| Preferred Securities | 7,682,374 | - | - | 7,682,374 |
|
| Money Market Funds | 213,721,007 | 213,721,007 | - | - |
| Total Investments in Securities: | 4,812,903,873 | 4,654,267,361 | 69,903,189 | 88,733,323 |
| | | | | |
|
| Net Unrealized Appreciation on Unfunded Commitments | 3,804,424 | - | - | 3,804,424 |
| Total | 3,804,424 | - | - | 3,804,424 |
The following is a reconciliation of consolidated Investments in Securities for which Level 3 inputs were used in determining value:
| |
| Investments in Securities: | |
| Preferred Stocks | | | |
| Beginning Balance | $ | 71,533,558 | |
| Net Realized Gain (Loss) on Investment Securities | | - | |
| Net Unrealized Gain (Loss) on Investment Securities | | (16,542,326) | |
| Cost of Purchases | | 22,808,394 | |
| Proceeds of Sales | | (3,522,703) | |
| Amortization/Accretion | | - | |
| Transfers into Level 3 | | - | |
| Transfers out of Level 3 | | - | |
| Ending Balance | $ | 74,276,923 | |
| The change in unrealized gain (loss) for the period attributable to Level 3 securities held at July 31, 2024 | $ | (16,544,690) | |
| Other Investments in Securities | | | |
| Beginning Balance | $ | 6,148,957 | |
| Net Realized Gain (Loss) on Investment Securities | | - | |
| Net Unrealized Gain (Loss) on Investment Securities | | (2,774,272) | |
| Cost of Purchases | | 11,081,715 | |
| Proceeds of Sales | | - | |
| Amortization/Accretion | | - | |
| Transfers into Level 3 | | - | |
| Transfers out of Level 3 | | - | |
| Ending Balance | $ | 14,456,400 | |
| The change in unrealized gain (loss) for the period attributable to Level 3 securities held at July 31, 2024 | $ | (2,774,272) | |
| The information used in the above reconciliation represents fiscal year to date activity for any Investments in Securities identified as using Level 3 inputs at either the beginning or the end of the current fiscal period. Cost of purchases and proceeds of sales may include securities received and/or delivered through in-kind transactions, corporate actions or exchanges. Transfers into Level 3 were attributable to a lack of observable market data resulting from decreases in market activity, decreases in liquidity, security restructurings or corporate actions. Transfers out of Level 3 were attributable to observable market data becoming available for those securities. Transfers in or out of Level 3 represent the beginning value of any Security or Instrument where a change in the pricing level occurred from the beginning to the end of the period. Realized and unrealized gains (losses) disclosed in the reconciliation are included in Net Gain (Loss) on the Fund's consolidated Statement of Operations. | |
Fidelity Advisor® Health Care Fund
Consolidated Financial Statements
| Consolidated Statement of Assets and Liabilities |
As of July 31, 2024 |
| Assets | | | | |
| Investment in securities, at value (including securities loaned of $194,614,058) - See accompanying schedule: | | | | |
Unaffiliated issuers (cost $2,885,537,397) | $ | 4,599,182,866 | | |
Fidelity Central Funds (cost $213,721,007) | | 213,721,007 | | |
| | | | | |
| | | | | |
| Total Investment in Securities (cost $3,099,258,404) | | | $ | 4,812,903,873 |
| Foreign currency held at value (cost $870,526) | | | | 880,151 |
| Receivable for investments sold | | | | 15,832,992 |
| Unrealized appreciation on unfunded commitments | | | | 3,804,424 |
| Receivable for fund shares sold | | | | 1,968,017 |
| Dividends receivable | | | | 1,622,905 |
| Interest receivable | | | | 68,159 |
| Distributions receivable from Fidelity Central Funds | | | | 239,520 |
| Prepaid expenses | | | | 2,619 |
| Other receivables | | | | 303 |
Total assets | | | | 4,837,322,963 |
| Liabilities | | | | |
| Payable for investments purchased | $ | 9,316,291 | | |
| Payable for fund shares redeemed | | 4,340,789 | | |
| Accrued management fee | | 2,538,578 | | |
| Distribution and service plan fees payable | | 648,920 | | |
| Other payables and accrued expenses | | 235,028 | | |
| Collateral on securities loaned | | 204,660,208 | | |
| Total liabilities | | | | 221,739,814 |
| Net Assets | | | $ | 4,615,583,149 |
| Net Assets consist of: | | | | |
| Paid in capital | | | $ | 2,641,249,753 |
| Total accumulated earnings (loss) | | | | 1,974,333,396 |
| Net Assets | | | $ | 4,615,583,149 |
| | | | | |
| Net Asset Value and Maximum Offering Price | | | | |
| Class A : | | | | |
Net Asset Value and redemption price per share ($1,437,682,629 ÷ 22,561,416 shares)(a) | | | $ | 63.72 |
| Maximum offering price per share (100/94.25 of $63.72) | | | $ | 67.61 |
| Class M : | | | | |
Net Asset Value and redemption price per share ($301,381,994 ÷ 5,188,607 shares)(a) | | | $ | 58.09 |
| Maximum offering price per share (100/96.50 of $58.09) | | | $ | 60.20 |
| Class C : | | | | |
Net Asset Value and offering price per share ($265,779,403 ÷ 5,670,424 shares)(a) | | | $ | 46.87 |
| Class I : | | | | |
Net Asset Value, offering price and redemption price per share ($2,031,441,137 ÷ 28,612,653 shares) | | | $ | 71.00 |
| Class Z : | | | | |
Net Asset Value, offering price and redemption price per share ($579,297,986 ÷ 8,125,935 shares) | | | $ | 71.29 |
(a)Redemption price per share is equal to net asset value less any applicable contingent deferred sales charge. |
| Consolidated Statement of Operations |
| Year ended July 31, 2024 |
| Investment Income | | | | |
| Dividends | | | $ | 30,007,371 |
| Interest | | | | 103,427 |
| Income from Fidelity Central Funds (including $529,638 from security lending) | | | | 1,387,946 |
| Total income | | | | 31,498,744 |
| Expenses | | | | |
| Management fee | $ | 28,231,289 | | |
| Transfer agent fees | | 4,546,086 | | |
| Distribution and service plan fees | | 8,052,644 | | |
| Accounting fees | | 533,935 | | |
| Custodian fees and expenses | | 112,094 | | |
| Independent trustees' fees and expenses | | 24,894 | | |
| Registration fees | | 131,846 | | |
| Audit fees | | 55,229 | | |
| Legal | | 10,378 | | |
| Interest | | 76,123 | | |
| Miscellaneous | | 150,161 | | |
| Total expenses before reductions | | 41,924,679 | | |
| Expense reductions | | (316,824) | | |
| Total expenses after reductions | | | | 41,607,855 |
| Net Investment income (loss) | | | | (10,109,111) |
| Realized and Unrealized Gain (Loss) | | | | |
| Net realized gain (loss) on: | | | | |
| Investment Securities: | | | | |
| Unaffiliated issuers | | 306,745,950 | | |
| Fidelity Central Funds | | 96 | | |
| Foreign currency transactions | | 32,407 | | |
| Total net realized gain (loss) | | | | 306,778,453 |
| Change in net unrealized appreciation (depreciation) on: | | | | |
| Investment Securities: | | | | |
| Unaffiliated issuers | | (43,122,880) | | |
| Unfunded commitments | | 3,804,424 | | |
| Assets and liabilities in foreign currencies | | 17,621 | | |
| Total change in net unrealized appreciation (depreciation) | | | | (39,300,835) |
| Net gain (loss) | | | | 267,477,618 |
| Net increase (decrease) in net assets resulting from operations | | | $ | 257,368,507 |
| Consolidated Statement of Changes in Net Assets |
| |
| | Year ended July 31, 2024 | | Year ended July 31, 2023 |
| Increase (Decrease) in Net Assets | | | | |
| Operations | | | | |
| Net investment income (loss) | $ | (10,109,111) | $ | (17,932,909) |
| Net realized gain (loss) | | 306,778,453 | | 45,561,038 |
| Change in net unrealized appreciation (depreciation) | | (39,300,835) | | 188,268,771 |
| Net increase (decrease) in net assets resulting from operations | | 257,368,507 | | 215,896,900 |
| | | | | |
| Share transactions - net increase (decrease) | | (1,313,714,176) | | (425,461,599) |
| Total increase (decrease) in net assets | | (1,056,345,669) | | (209,564,699) |
| | | | | |
| Net Assets | | | | |
| Beginning of period | | 5,671,928,818 | | 5,881,493,517 |
| End of period | $ | 4,615,583,149 | $ | 5,671,928,818 |
| | | | | |
| | | | | |
Consolidated Financial Highlights
Fidelity Advisor® Health Care Fund Class A |
| |
| Years ended July 31, | | 2024 | | 2023 | | 2022 | | 2021 | | 2020 |
Selected Per-Share Data | | | | | | | | | | |
| Net asset value, beginning of period | $ | 59.73 | $ | 57.59 | $ | 69.58 | $ | 61.07 | $ | 49.21 |
| Income from Investment Operations | | | | | | | | | | |
Net investment income (loss) A,B | | (.19) | | (.24) | | (.26) | | (.26) | | (.04) |
| Net realized and unrealized gain (loss) | | 4.18 | | 2.38 | | (7.58) | | 12.55 | | 12.08 |
| Total from investment operations | | 3.99 | | 2.14 | | (7.84) | | 12.29 | | 12.04 |
| Distributions from net investment income | | - | | - | | - | | (.16) | | - |
| Distributions from net realized gain | | - | | - | | (4.15) | | (3.62) | | (.18) |
| Total distributions | | - | | - | | (4.15) | | (3.78) | | (.18) |
| Net asset value, end of period | $ | 63.72 | $ | 59.73 | $ | 57.59 | $ | 69.58 | $ | 61.07 |
Total Return C,D | | | | 3.72% | | (11.90)% | | 20.70% | | 24.50% |
Ratios to Average Net Assets B,E,F | | | | | | | | | | |
| Expenses before reductions | | .97% | | .98% | | .97% | | .98% | | 1.01% |
| Expenses net of fee waivers, if any | | | | .97% | | .97% | | .98% | | 1.00% |
| Expenses net of all reductions | | .96% | | .97% | | .97% | | .98% | | 1.00% |
| Net investment income (loss) | | (.32)% | | (.42)% | | (.42)% | | (.39)% | | (.07)% |
| Supplemental Data | | | | | | | | | | |
| Net assets, end of period (000 omitted) | $ | 1,437,683 | $ | 1,535,212 | $ | 1,488,238 | $ | 1,735,235 | $ | 1,372,082 |
Portfolio turnover rate G | | | | 47% | | 33% | | 38% | | 53% H |
ACalculated based on average shares outstanding during the period.
BNet investment income (loss) is affected by the timing of the declaration of dividends by any underlying mutual funds or exchange-traded funds (ETFs). Net investment income (loss) of any mutual funds or ETFs is not included in the Fund's net investment income (loss) ratio.
CTotal returns would have been lower if certain expenses had not been reduced during the applicable periods shown.
DTotal returns do not include the effect of the sales charges.
EFees and expenses of any underlying mutual funds or exchange-traded funds (ETFs) are not included in the Fund's expense ratio. The Fund indirectly bears its proportionate share of these expenses. For additional expense information related to investments in Fidelity Central Funds, please refer to the "Investments in Fidelity Central Funds" note found in the Notes to Consolidated Financial Statements section of the most recent Annual or Semi-Annual report.
FExpense ratios reflect operating expenses of the class. Expenses before reductions do not reflect amounts reimbursed, waived, or reduced through arrangements with the investment adviser, brokerage services, or other offset arrangements, if applicable, and do not represent the amount paid by the class during periods when reimbursements, waivers or reductions occur.
GAmount does not include the portfolio activity of any underlying mutual funds or exchange-traded funds (ETFs).
HPortfolio turnover rate excludes securities received or delivered in-kind.
Fidelity Advisor® Health Care Fund Class M |
| |
| Years ended July 31, | | 2024 | | 2023 | | 2022 | | 2021 | | 2020 |
Selected Per-Share Data | | | | | | | | | | |
| Net asset value, beginning of period | $ | 54.58 | $ | 52.76 | $ | 64.25 | $ | 56.62 | $ | 45.75 |
| Income from Investment Operations | | | | | | | | | | |
Net investment income (loss) A,B | | (.31) | | (.36) | | (.38) | | (.39) | | (.16) |
| Net realized and unrealized gain (loss) | | 3.82 | | 2.18 | | (6.96) | | 11.61 | | 11.21 |
| Total from investment operations | | 3.51 | | 1.82 | | (7.34) | | 11.22 | | 11.05 |
| Distributions from net investment income | | - | | - | | - | | (.02) | | - |
| Distributions from net realized gain | | - | | - | | (4.15) | | (3.57) | | (.18) |
| Total distributions | | - | | - | | (4.15) | | (3.59) | | (.18) |
| Net asset value, end of period | $ | 58.09 | $ | 54.58 | $ | 52.76 | $ | 64.25 | $ | 56.62 |
Total Return C,D | | | | 3.45% | | (12.12)% | | 20.39% | | 24.19% |
Ratios to Average Net Assets B,E,F | | | | | | | | | | |
| Expenses before reductions | | 1.22% | | 1.23% | | 1.22% | | 1.23% | | 1.26% |
| Expenses net of fee waivers, if any | | | | 1.23% | | 1.22% | | 1.23% | | 1.26% |
| Expenses net of all reductions | | 1.22% | | 1.23% | | 1.22% | | 1.23% | | 1.26% |
| Net investment income (loss) | | (.57)% | | (.67)% | | (.67)% | | (.65)% | | (.33)% |
| Supplemental Data | | | | | | | | | | |
| Net assets, end of period (000 omitted) | $ | 301,382 | $ | 315,963 | $ | 330,452 | $ | 402,175 | $ | 349,280 |
Portfolio turnover rate G | | | | 47% | | 33% | | 38% | | 53% H |
ACalculated based on average shares outstanding during the period.
BNet investment income (loss) is affected by the timing of the declaration of dividends by any underlying mutual funds or exchange-traded funds (ETFs). Net investment income (loss) of any mutual funds or ETFs is not included in the Fund's net investment income (loss) ratio.
CTotal returns would have been lower if certain expenses had not been reduced during the applicable periods shown.
DTotal returns do not include the effect of the sales charges.
EFees and expenses of any underlying mutual funds or exchange-traded funds (ETFs) are not included in the Fund's expense ratio. The Fund indirectly bears its proportionate share of these expenses. For additional expense information related to investments in Fidelity Central Funds, please refer to the "Investments in Fidelity Central Funds" note found in the Notes to Consolidated Financial Statements section of the most recent Annual or Semi-Annual report.
FExpense ratios reflect operating expenses of the class. Expenses before reductions do not reflect amounts reimbursed, waived, or reduced through arrangements with the investment adviser, brokerage services, or other offset arrangements, if applicable, and do not represent the amount paid by the class during periods when reimbursements, waivers or reductions occur.
GAmount does not include the portfolio activity of any underlying mutual funds or exchange-traded funds (ETFs).
HPortfolio turnover rate excludes securities received or delivered in-kind.
Fidelity Advisor® Health Care Fund Class C |
| |
| Years ended July 31, | | 2024 | | 2023 | | 2022 | | 2021 | | 2020 |
Selected Per-Share Data | | | | | | | | | | |
| Net asset value, beginning of period | $ | 44.26 | $ | 43.00 | $ | 53.40 | $ | 47.63 | $ | 38.70 |
| Income from Investment Operations | | | | | | | | | | |
Net investment income (loss) A,B | | (.46) | | (.51) | | (.55) | | (.58) | | (.34) |
| Net realized and unrealized gain (loss) | | 3.07 | | 1.77 | | (5.70) | | 9.71 | | 9.45 |
| Total from investment operations | | 2.61 | | 1.26 | | (6.25) | | 9.13 | | 9.11 |
| Distributions from net realized gain | | - | | - | | (4.15) | | (3.36) | | (.18) |
| Total distributions | | - | | - | | (4.15) | | (3.36) | | (.18) |
| Net asset value, end of period | $ | 46.87 | $ | 44.26 | $ | 43.00 | $ | 53.40 | $ | 47.63 |
Total Return C,D | | | | 2.93% | | (12.56)% | | 19.78% | | 23.58% |
Ratios to Average Net Assets B,E,F | | | | | | | | | | |
| Expenses before reductions | | 1.71% | | 1.73% | | 1.72% | | 1.73% | | 1.76% |
| Expenses net of fee waivers, if any | | | | 1.73% | | 1.72% | | 1.73% | | 1.76% |
| Expenses net of all reductions | | 1.70% | | 1.73% | | 1.72% | | 1.73% | | 1.75% |
| Net investment income (loss) | | (1.06)% | | (1.17)% | | (1.17)% | | (1.15)% | | (.82)% |
| Supplemental Data | | | | | | | | | | |
| Net assets, end of period (000 omitted) | $ | 265,779 | $ | 365,165 | $ | 501,742 | $ | 697,626 | $ | 654,487 |
Portfolio turnover rate G | | | | 47% | | 33% | | 38% | | 53% H |
ACalculated based on average shares outstanding during the period.
BNet investment income (loss) is affected by the timing of the declaration of dividends by any underlying mutual funds or exchange-traded funds (ETFs). Net investment income (loss) of any mutual funds or ETFs is not included in the Fund's net investment income (loss) ratio.
CTotal returns would have been lower if certain expenses had not been reduced during the applicable periods shown.
DTotal returns do not include the effect of the contingent deferred sales charge.
EFees and expenses of any underlying mutual funds or exchange-traded funds (ETFs) are not included in the Fund's expense ratio. The Fund indirectly bears its proportionate share of these expenses. For additional expense information related to investments in Fidelity Central Funds, please refer to the "Investments in Fidelity Central Funds" note found in the Notes to Consolidated Financial Statements section of the most recent Annual or Semi-Annual report.
FExpense ratios reflect operating expenses of the class. Expenses before reductions do not reflect amounts reimbursed, waived, or reduced through arrangements with the investment adviser, brokerage services, or other offset arrangements, if applicable, and do not represent the amount paid by the class during periods when reimbursements, waivers or reductions occur.
GAmount does not include the portfolio activity of any underlying mutual funds or exchange-traded funds (ETFs).
HPortfolio turnover rate excludes securities received or delivered in-kind.
Fidelity Advisor® Health Care Fund Class I |
| |
| Years ended July 31, | | 2024 | | 2023 | | 2022 | | 2021 | | 2020 |
Selected Per-Share Data | | | | | | | | | | |
| Net asset value, beginning of period | $ | 66.37 | $ | 63.83 | $ | 76.48 | $ | 66.81 | $ | 53.77 |
| Income from Investment Operations | | | | | | | | | | |
Net investment income (loss) A,B | | (.04) | | (.10) | | (.11) | | (.10) | | .11 |
| Net realized and unrealized gain (loss) | | 4.67 | | 2.64 | | (8.39) | | 13.76 | | 13.22 |
| Total from investment operations | | 4.63 | | 2.54 | | (8.50) | | 13.66 | | 13.33 |
| Distributions from net investment income | | - | | - | | - | | (.30) | | - |
| Distributions from net realized gain | | - | | - | | (4.15) | | (3.69) | | (.29) |
| Total distributions | | - | | - | | (4.15) | | (3.99) | | (.29) |
| Net asset value, end of period | $ | 71.00 | $ | 66.37 | $ | 63.83 | $ | 76.48 | $ | 66.81 |
Total Return C | | | | 3.98% | | (11.68)% | | 21.01% | | 24.84% |
Ratios to Average Net Assets B,D,E | | | | | | | | | | |
| Expenses before reductions | | .70% | | .72% | | .71% | | .72% | | .74% |
| Expenses net of fee waivers, if any | | | | .71% | | .71% | | .72% | | .74% |
| Expenses net of all reductions | | .70% | | .71% | | .71% | | .72% | | .74% |
| Net investment income (loss) | | (.05)% | | (.16)% | | (.16)% | | (.13)% | | .19% |
| Supplemental Data | | | | | | | | | | |
| Net assets, end of period (000 omitted) | $ | 2,031,441 | $ | 2,593,539 | $ | 2,743,740 | $ | 3,410,787 | $ | 2,546,323 |
Portfolio turnover rate F | | | | 47% | | 33% | | 38% | | 53% G |
ACalculated based on average shares outstanding during the period.
BNet investment income (loss) is affected by the timing of the declaration of dividends by any underlying mutual funds or exchange-traded funds (ETFs). Net investment income (loss) of any mutual funds or ETFs is not included in the Fund's net investment income (loss) ratio.
CTotal returns would have been lower if certain expenses had not been reduced during the applicable periods shown.
DFees and expenses of any underlying mutual funds or exchange-traded funds (ETFs) are not included in the Fund's expense ratio. The Fund indirectly bears its proportionate share of these expenses. For additional expense information related to investments in Fidelity Central Funds, please refer to the "Investments in Fidelity Central Funds" note found in the Notes to Consolidated Financial Statements section of the most recent Annual or Semi-Annual report.
EExpense ratios reflect operating expenses of the class. Expenses before reductions do not reflect amounts reimbursed, waived, or reduced through arrangements with the investment adviser, brokerage services, or other offset arrangements, if applicable, and do not represent the amount paid by the class during periods when reimbursements, waivers or reductions occur.
FAmount does not include the portfolio activity of any underlying mutual funds or exchange-traded funds (ETFs).
GPortfolio turnover rate excludes securities received or delivered in-kind.
Fidelity Advisor® Health Care Fund Class Z |
| |
| Years ended July 31, | | 2024 | | 2023 | | 2022 | | 2021 | | 2020 |
Selected Per-Share Data | | | | | | | | | | |
| Net asset value, beginning of period | $ | 66.56 | $ | 63.93 | $ | 76.55 | $ | 66.88 | $ | 53.84 |
| Income from Investment Operations | | | | | | | | | | |
Net investment income (loss) A,B | | .06 | | (.02) | | (.03) | | (.01) | | .19 |
| Net realized and unrealized gain (loss) | | 4.67 | | 2.65 | | (8.38) | | 13.77 | | 13.22 |
| Total from investment operations | | 4.73 | | 2.63 | | (8.41) | | 13.76 | | 13.41 |
| Distributions from net investment income | | - | | - | | - | | (.37) | | - |
| Distributions from net realized gain | | - | | - | | (4.21) | | (3.73) | | (.37) |
| Total distributions | | - | | - | | (4.21) | | (4.09) C | | (.37) |
| Net asset value, end of period | $ | 71.29 | $ | 66.56 | $ | 63.93 | $ | 76.55 | $ | 66.88 |
Total Return D | | | | 4.11% | | (11.56)% | | 21.15% | | 24.98% |
Ratios to Average Net Assets B,E,F | | | | | | | | | | |
| Expenses before reductions | | .56% | | .59% | | .59% | | .60% | | .61% |
| Expenses net of fee waivers, if any | | | | .59% | | .59% | | .60% | | .61% |
| Expenses net of all reductions | | .56% | | .59% | | .59% | | .59% | | .61% |
| Net investment income (loss) | | .08% | | (.03)% | | (.04)% | | (.01)% | | .32% |
| Supplemental Data | | | | | | | | | | |
| Net assets, end of period (000 omitted) | $ | 579,298 | $ | 862,051 | $ | 817,321 | $ | 952,460 | $ | 610,481 |
Portfolio turnover rate G | | | | 47% | | 33% | | 38% | | 53% H |
ACalculated based on average shares outstanding during the period.
BNet investment income (loss) is affected by the timing of the declaration of dividends by any underlying mutual funds or exchange-traded funds (ETFs). Net investment income (loss) of any mutual funds or ETFs is not included in the Fund's net investment income (loss) ratio.
CTotal distributions per share do not sum due to rounding.
DTotal returns would have been lower if certain expenses had not been reduced during the applicable periods shown.
EFees and expenses of any underlying mutual funds or exchange-traded funds (ETFs) are not included in the Fund's expense ratio. The Fund indirectly bears its proportionate share of these expenses. For additional expense information related to investments in Fidelity Central Funds, please refer to the "Investments in Fidelity Central Funds" note found in the Notes to Consolidated Financial Statements section of the most recent Annual or Semi-Annual report.
FExpense ratios reflect operating expenses of the class. Expenses before reductions do not reflect amounts reimbursed, waived, or reduced through arrangements with the investment adviser, brokerage services, or other offset arrangements, if applicable, and do not represent the amount paid by the class during periods when reimbursements, waivers or reductions occur.
GAmount does not include the portfolio activity of any underlying mutual funds or exchange-traded funds (ETFs).
HPortfolio turnover rate excludes securities received or delivered in-kind.
Fidelity Advisor® Industrials Fund
Schedule of Investments July 31, 2024
Showing Percentage of Net Assets
| Common Stocks - 99.0% |
| | | Shares | Value ($) |
| Aerospace & Defense - 22.7% | | | |
| Aerospace & Defense - 22.7% | | | |
| Axon Enterprise, Inc. (a) | | 4,600 | 1,380,046 |
| General Dynamics Corp. | | 41,900 | 12,515,949 |
| General Electric Co. | | 214,437 | 36,497,178 |
| Howmet Aerospace, Inc. | | 287,858 | 27,548,011 |
| Huntington Ingalls Industries, Inc. | | 13,800 | 3,863,724 |
| Loar Holdings, Inc. | | 500 | 31,250 |
| Lockheed Martin Corp. | | 8,120 | 4,400,390 |
| The Boeing Co. (a) | | 127,704 | 24,340,382 |
| TransDigm Group, Inc. | | 16,714 | 21,631,593 |
| | | | 132,208,523 |
| Air Freight & Logistics - 3.6% | | | |
| Air Freight & Logistics - 3.6% | | | |
| C.H. Robinson Worldwide, Inc. | | 12,700 | 1,130,935 |
| FedEx Corp. | | 65,600 | 19,827,600 |
| | | | 20,958,535 |
| Building Products - 10.2% | | | |
| Building Products - 10.2% | | | |
| Carlisle Companies, Inc. | | 19,224 | 8,046,782 |
| Fortune Brands Innovations, Inc. | | 74,400 | 6,012,264 |
| Johnson Controls International PLC | | 103,357 | 7,394,160 |
| Simpson Manufacturing Co. Ltd. | | 31,779 | 6,104,428 |
| The AZEK Co., Inc. Class A, (a) | | 208,900 | 9,377,521 |
| Trane Technologies PLC | | 66,700 | 22,296,476 |
| | | | 59,231,631 |
| Commercial Services & Supplies - 3.0% | | | |
| Diversified Support Services - 0.9% | | | |
| Cintas Corp. | | 7,000 | 5,347,580 |
| Environmental & Facilities Services - 2.1% | | | |
| Waste Connections, Inc. (United States) | | 68,800 | 12,230,576 |
TOTAL COMMERCIAL SERVICES & SUPPLIES | | | 17,578,156 |
| Construction & Engineering - 3.8% | | | |
| Construction & Engineering - 3.8% | | | |
| Comfort Systems U.S.A., Inc. | | 8,500 | 2,825,570 |
| Quanta Services, Inc. | | 43,000 | 11,411,340 |
| Willscot Holdings Corp. (a) | | 188,000 | 7,708,000 |
| | | | 21,944,910 |
| Construction Materials - 1.2% | | | |
| Construction Materials - 1.2% | | | |
| Eagle Materials, Inc. | | 25,200 | 6,861,960 |
| Electrical Equipment - 11.1% | | | |
| Electrical Components & Equipment - 8.4% | | | |
| AMETEK, Inc. | | 72,834 | 12,635,242 |
| Eaton Corp. PLC | | 63,316 | 19,298,084 |
| Regal Rexnord Corp. | | 88,305 | 14,188,847 |
| Vertiv Holdings Co. | | 34,900 | 2,746,630 |
| | | | 48,868,803 |
| Heavy Electrical Equipment - 2.7% | | | |
| GE Vernova LLC | | 87,359 | 15,570,868 |
TOTAL ELECTRICAL EQUIPMENT | | | 64,439,671 |
| Ground Transportation - 13.1% | | | |
| Cargo Ground Transportation - 5.4% | | | |
| Knight-Swift Transportation Holdings, Inc. | | 211,400 | 11,506,502 |
| Saia, Inc. (a) | | 28,300 | 11,825,155 |
| XPO, Inc. (a) | | 72,500 | 8,329,525 |
| | | | 31,661,182 |
| Passenger Ground Transportation - 2.4% | | | |
| Uber Technologies, Inc. (a) | | 212,600 | 13,706,322 |
| Rail Transportation - 5.3% | | | |
| CSX Corp. | | 65,783 | 2,308,983 |
| Union Pacific Corp. | | 116,500 | 28,744,045 |
| | | | 31,053,028 |
TOTAL GROUND TRANSPORTATION | | | 76,420,532 |
| Household Durables - 1.3% | | | |
| Homebuilding - 1.3% | | | |
| TopBuild Corp. (a)(b) | | 16,300 | 7,800,202 |
| Machinery - 20.2% | | | |
| Agricultural & Farm Machinery - 1.2% | | | |
| Deere & Co. | | 18,800 | 6,993,224 |
| Construction Machinery & Heavy Transportation Equipment - 1.8% | | | |
| Caterpillar, Inc. | | 29,200 | 10,109,040 |
| Industrial Machinery & Supplies & Components - 17.2% | | | |
| Chart Industries, Inc. (a)(b) | | 65,000 | 10,470,200 |
| Dover Corp. | | 94,600 | 17,430,996 |
| Fortive Corp. | | 34,175 | 2,455,474 |
| Ingersoll Rand, Inc. | | 276,843 | 27,795,037 |
| ITT, Inc. | | 128,509 | 18,178,883 |
| Parker Hannifin Corp. | | 42,613 | 23,912,711 |
| | | | 100,243,301 |
TOTAL MACHINERY | | | 117,345,565 |
| Professional Services - 3.2% | | | |
| Research & Consulting Services - 3.2% | | | |
| KBR, Inc. | | 123,900 | 8,250,501 |
| Leidos Holdings, Inc. | | 71,500 | 10,324,600 |
| | | | 18,575,101 |
| Trading Companies & Distributors - 5.6% | | | |
| Trading Companies & Distributors - 5.6% | | | |
| FTAI Aviation Ltd. | | 38,500 | 4,290,825 |
| United Rentals, Inc. | | 19,700 | 14,914,870 |
| W.W. Grainger, Inc. | | 7,900 | 7,716,799 |
| Watsco, Inc. | | 11,800 | 5,775,982 |
| | | | 32,698,476 |
| TOTAL COMMON STOCKS (Cost $405,592,832) | | | 576,063,262 |
| | | | |
| Money Market Funds - 2.4% |
| | | Shares | Value ($) |
| Fidelity Cash Central Fund 5.39% (c) | | 2,941,011 | 2,941,600 |
| Fidelity Securities Lending Cash Central Fund 5.39% (c)(d) | | 10,895,885 | 10,896,975 |
| TOTAL MONEY MARKET FUNDS (Cost $13,838,575) | | | 13,838,575 |
| | | | |
| TOTAL INVESTMENT IN SECURITIES - 101.4% (Cost $419,431,407) | 589,901,837 |
NET OTHER ASSETS (LIABILITIES) - (1.4)% | (7,891,589) |
| NET ASSETS - 100.0% | 582,010,248 |
| | |
Legend
| (b) | Security or a portion of the security is on loan at period end. |
| (c) | Affiliated fund that is generally available only to investment companies and other accounts managed by Fidelity Investments. The rate quoted is the annualized seven-day yield of the fund at period end. A complete unaudited listing of the fund's holdings as of its most recent quarter end is available upon request. In addition, each Fidelity Central Fund's financial statements, which are not covered by the Fund's Report of Independent Registered Public Accounting Firm, are available on the SEC's website or upon request. |
| (d) | Investment made with cash collateral received from securities on loan. |
Affiliated Central Funds
Fiscal year to date information regarding the Fund's investments in Fidelity Central Funds, including the ownership percentage, is presented below.
| Affiliate | Value, beginning of period ($) | Purchases ($) | Sales Proceeds ($) | Dividend Income ($) | Realized Gain (loss) ($) | Change in Unrealized appreciation (depreciation) ($) | Value, end of period ($) | % ownership, end of period |
| Fidelity Cash Central Fund 5.39% | 2,126,016 | 86,774,663 | 85,959,158 | 115,947 | 79 | - | 2,941,600 | 0.0% |
| Fidelity Securities Lending Cash Central Fund 5.39% | - | 155,026,245 | 144,129,270 | 6,560 | - | - | 10,896,975 | 0.0% |
| Total | 2,126,016 | 241,800,908 | 230,088,428 | 122,507 | 79 | - | 13,838,575 | |
| | | | | | | | | |
Amounts in the dividend income column in the above table include any capital gain distributions from underlying funds, which are presented in the corresponding line item in the Statement of Operations, if applicable.
Amounts in the dividend income column for Fidelity Securities Lending Cash Central Fund represents the income earned on investing cash collateral, less rebates paid to borrowers and any lending agent fees associated with the loan, plus any premium payments received for lending certain types of securities.
Amounts included in the purchases and sales proceeds columns may include in-kind transactions, if applicable.
Investment Valuation
The following is a summary of the inputs used, as of July 31, 2024, involving the Fund's assets and liabilities carried at fair value. The inputs or methodology used for valuing securities may not be an indication of the risk associated with investing in those securities. For more information on valuation inputs, and their aggregation into the levels used below, please refer to the Investment Valuation section in the accompanying Notes to Financial Statements.
| Valuation Inputs at Reporting Date: |
| Description | Total ($) | Level 1 ($) | Level 2 ($) | Level 3 ($) |
Investments in Securities: | | | | |
|
| Common Stocks | 576,063,262 | 576,063,262 | - | - |
|
| Money Market Funds | 13,838,575 | 13,838,575 | - | - |
| Total Investments in Securities: | 589,901,837 | 589,901,837 | - | - |
Fidelity Advisor® Industrials Fund
Financial Statements
| Statement of Assets and Liabilities |
As of July 31, 2024 |
| Assets | | | | |
| Investment in securities, at value (including securities loaned of $10,784,968) - See accompanying schedule: | | | | |
Unaffiliated issuers (cost $405,592,832) | $ | 576,063,262 | | |
Fidelity Central Funds (cost $13,838,575) | | 13,838,575 | | |
| | | | | |
| | | | | |
| Total Investment in Securities (cost $419,431,407) | | | $ | 589,901,837 |
| Receivable for investments sold | | | | 1,151,261 |
| Receivable for fund shares sold | | | | 2,685,022 |
| Dividends receivable | | | | 128,732 |
| Distributions receivable from Fidelity Central Funds | | | | 13,229 |
| Prepaid expenses | | | | 747 |
Total assets | | | | 593,880,828 |
| Liabilities | | | | |
| Payable for investments purchased | $ | 243,630 | | |
| Payable for fund shares redeemed | | 250,532 | | |
| Accrued management fee | | 319,172 | | |
| Distribution and service plan fees payable | | 109,990 | | |
| Other payables and accrued expenses | | 50,281 | | |
| Collateral on securities loaned | | 10,896,975 | | |
| Total liabilities | | | | 11,870,580 |
| Net Assets | | | $ | 582,010,248 |
| Net Assets consist of: | | | | |
| Paid in capital | | | $ | 402,154,443 |
| Total accumulated earnings (loss) | | | | 179,855,805 |
| Net Assets | | | $ | 582,010,248 |
| | | | | |
| Net Asset Value and Maximum Offering Price | | | | |
| Class A : | | | | |
Net Asset Value and redemption price per share ($275,457,415 ÷ 6,030,686 shares)(a) | | | $ | 45.68 |
| Maximum offering price per share (100/94.25 of $45.68) | | | $ | 48.47 |
| Class M : | | | | |
Net Asset Value and redemption price per share ($67,472,064 ÷ 1,542,447 shares)(a) | | | $ | 43.74 |
| Maximum offering price per share (100/96.50 of $43.74) | | | $ | 45.33 |
| Class C : | | | | |
Net Asset Value and offering price per share ($33,930,157 ÷ 920,386 shares)(a) | | | $ | 36.87 |
| Class I : | | | | |
Net Asset Value, offering price and redemption price per share ($157,454,868 ÷ 3,152,980 shares) | | | $ | 49.94 |
| Class Z : | | | | |
Net Asset Value, offering price and redemption price per share ($47,695,744 ÷ 954,912 shares) | | | $ | 49.95 |
(a)Redemption price per share is equal to net asset value less any applicable contingent deferred sales charge. |
| Statement of Operations |
| Year ended July 31, 2024 |
| Investment Income | | | | |
| Dividends | | | $ | 4,476,148 |
| Special dividends | | | | 651,490 |
| Income from Fidelity Central Funds (including $6,560 from security lending) | | | | 122,507 |
| Total income | | | | 5,250,145 |
| Expenses | | | | |
| Management fee | $ | 3,050,562 | | |
| Transfer agent fees | | 474,098 | | |
| Distribution and service plan fees | | 1,212,441 | | |
| Accounting fees | | 98,827 | | |
| Custodian fees and expenses | | 16,906 | | |
| Independent trustees' fees and expenses | | 2,486 | | |
| Registration fees | | 75,953 | | |
| Audit fees | | 55,607 | | |
| Legal | | 2,368 | | |
| Interest | | 3,445 | | |
| Miscellaneous | | 8,011 | | |
| Total expenses before reductions | | 5,000,704 | | |
| Expense reductions | | (31,624) | | |
| Total expenses after reductions | | | | 4,969,080 |
| Net Investment income (loss) | | | | 281,065 |
| Realized and Unrealized Gain (Loss) | | | | |
| Net realized gain (loss) on: | | | | |
| Investment Securities: | | | | |
| Unaffiliated issuers | | 13,564,350 | | |
| Redemptions in-kind | | 11,201,399 | | |
| Fidelity Central Funds | | 79 | | |
| Total net realized gain (loss) | | | | 24,765,828 |
| Change in net unrealized appreciation (depreciation) on investment securities | | | | 93,441,973 |
| Net gain (loss) | | | | 118,207,801 |
| Net increase (decrease) in net assets resulting from operations | | | $ | 118,488,866 |
| Statement of Changes in Net Assets |
| |
| | Year ended July 31, 2024 | | Year ended July 31, 2023 |
| Increase (Decrease) in Net Assets | | | | |
| Operations | | | | |
| Net investment income (loss) | $ | 281,065 | $ | (375,128) |
| Net realized gain (loss) | | 24,765,828 | | 64,106,491 |
| Change in net unrealized appreciation (depreciation) | | 93,441,973 | | 32,286,790 |
| Net increase (decrease) in net assets resulting from operations | | 118,488,866 | | 96,018,153 |
| Distributions to shareholders | | (39,770,362) | | (17,549,942) |
| | | | | |
| Share transactions - net increase (decrease) | | (55,430,353) | | 8,937,216 |
| Total increase (decrease) in net assets | | 23,288,151 | | 87,405,427 |
| | | | | |
| Net Assets | | | | |
| Beginning of period | | 558,722,097 | | 471,316,670 |
| End of period | $ | 582,010,248 | $ | 558,722,097 |
| | | | | |
| | | | | |
Financial Highlights
Fidelity Advisor® Industrials Fund Class A |
| |
| Years ended July 31, | | 2024 | | 2023 | | 2022 | | 2021 | | 2020 |
Selected Per-Share Data | | | | | | | | | | |
| Net asset value, beginning of period | $ | 39.24 | $ | 34.23 | $ | 45.64 | $ | 33.85 | $ | 38.95 |
| Income from Investment Operations | | | | | | | | | | |
Net investment income (loss) A,B | | .01 C | | (.05) D | | (.14) | | (.17) | | .18 E |
| Net realized and unrealized gain (loss) | | 9.77 | | 6.24 | | (2.62) | | 12.20 | | (2.46) |
| Total from investment operations | | 9.78 | | 6.19 | | (2.76) | | 12.03 | | (2.28) |
| Distributions from net investment income | | - | | (.02) | | - | | - | | (.25) |
| Distributions from net realized gain | | (3.34) | | (1.16) | | (8.65) | | (.24) | | (2.57) |
| Total distributions | | (3.34) | | (1.18) | | (8.65) | | (.24) | | (2.82) |
| Net asset value, end of period | $ | 45.68 | $ | 39.24 | $ | 34.23 | $ | 45.64 | $ | 33.85 |
Total Return F,G | | | | 18.68% | | (7.79)% | | 35.63% | | (6.58)% |
Ratios to Average Net Assets B,H,I | | | | | | | | | | |
| Expenses before reductions | | 1.00% | | 1.03% | | 1.02% | | 1.03% | | 1.05% |
| Expenses net of fee waivers, if any | | | | 1.03% | | 1.01% | | 1.03% | | 1.05% |
| Expenses net of all reductions | | 1.00% | | 1.03% | | 1.01% | | 1.01% | | 1.03% |
| Net investment income (loss) | | .02% C | | (.13)% D | | (.35)% | | (.40)% | | .49% E |
| Supplemental Data | | | | | | | | | | |
| Net assets, end of period (000 omitted) | $ | 275,457 | $ | 226,370 | $ | 214,576 | $ | 264,130 | $ | 199,835 |
Portfolio turnover rate J | | | | 189% K | | 106% | | 205% | | 219% K |
ACalculated based on average shares outstanding during the period.
BNet investment income (loss) is affected by the timing of the declaration of dividends by any underlying mutual funds or exchange-traded funds (ETFs). Net investment income (loss) of any mutual funds or ETFs is not included in the Fund's net investment income (loss) ratio.
CNet investment income per share reflects one or more large, non-recurring dividend(s) which amounted to $.05 per share. Excluding such non-recurring dividend(s), the ratio of net investment income (loss) to average net assets would have been (.10)%.
DNet investment income per share reflects one or more large, non-recurring dividend(s) which amounted to $.04 per share. Excluding such non-recurring dividend(s), the ratio of net investment income (loss) to average net assets would have been (.25)%.
ENet investment income per share reflects one or more large, non-recurring dividend(s) which amounted to $.07 per share. Excluding such non-recurring dividend(s), the ratio of net investment income (loss) to average net assets would have been .29%.
FTotal returns would have been lower if certain expenses had not been reduced during the applicable periods shown.
GTotal returns do not include the effect of the sales charges.
HFees and expenses of any underlying mutual funds or exchange-traded funds (ETFs) are not included in the Fund's expense ratio. The Fund indirectly bears its proportionate share of these expenses. For additional expense information related to investments in Fidelity Central Funds, please refer to the "Investments in Fidelity Central Funds" note found in the Notes to Financial Statements section of the most recent Annual or Semi-Annual report.
IExpense ratios reflect operating expenses of the class. Expenses before reductions do not reflect amounts reimbursed, waived, or reduced through arrangements with the investment adviser, brokerage services, or other offset arrangements, if applicable, and do not represent the amount paid by the class during periods when reimbursements, waivers or reductions occur.
JAmount does not include the portfolio activity of any underlying mutual funds or exchange-traded funds (ETFs).
KPortfolio turnover rate excludes securities received or delivered in-kind.
Fidelity Advisor® Industrials Fund Class M |
| |
| Years ended July 31, | | 2024 | | 2023 | | 2022 | | 2021 | | 2020 |
Selected Per-Share Data | | | | | | | | | | |
| Net asset value, beginning of period | $ | 37.77 | $ | 33.05 | $ | 44.31 | $ | 32.96 | $ | 37.99 |
| Income from Investment Operations | | | | | | | | | | |
Net investment income (loss) A,B | | (.09) C | | (.13) D | | (.23) | | (.27) | | .08 E |
| Net realized and unrealized gain (loss) | | 9.36 | | 6.01 | | (2.53) | | 11.86 | | (2.39) |
| Total from investment operations | | 9.27 | | 5.88 | | (2.76) | | 11.59 | | (2.31) |
| Distributions from net investment income | | - | | - | | - | | - | | (.15) |
| Distributions from net realized gain | | (3.30) | | (1.16) | | (8.50) | | (.24) | | (2.57) |
| Total distributions | | (3.30) | | (1.16) | | (8.50) | | (.24) | | (2.72) |
| Net asset value, end of period | $ | 43.74 | $ | 37.77 | $ | 33.05 | $ | 44.31 | $ | 32.96 |
Total Return F,G | | | | 18.39% | | (8.03)% | | 35.25% | | (6.82)% |
Ratios to Average Net Assets B,H,I | | | | | | | | | | |
| Expenses before reductions | | 1.25% | | 1.29% | | 1.27% | | 1.29% | | 1.31% |
| Expenses net of fee waivers, if any | | | | 1.28% | | 1.27% | | 1.29% | | 1.31% |
| Expenses net of all reductions | | 1.25% | | 1.28% | | 1.27% | | 1.27% | | 1.30% |
| Net investment income (loss) | | (.23)% C | | (.38)% D | | (.60)% | | (.66)% | | .23% E |
| Supplemental Data | | | | | | | | | | |
| Net assets, end of period (000 omitted) | $ | 67,472 | $ | 54,175 | $ | 49,501 | $ | 56,680 | $ | 45,157 |
Portfolio turnover rate J | | | | 189% K | | 106% | | 205% | | 219% K |
ACalculated based on average shares outstanding during the period.
BNet investment income (loss) is affected by the timing of the declaration of dividends by any underlying mutual funds or exchange-traded funds (ETFs). Net investment income (loss) of any mutual funds or ETFs is not included in the Fund's net investment income (loss) ratio.
CNet investment income per share reflects one or more large, non-recurring dividend(s) which amounted to $.05 per share. Excluding such non-recurring dividend(s), the ratio of net investment income (loss) to average net assets would have been (.35)%.
DNet investment income per share reflects one or more large, non-recurring dividend(s) which amounted to $.04 per share. Excluding such non-recurring dividend(s), the ratio of net investment income (loss) to average net assets would have been (.51)%.
ENet investment income per share reflects one or more large, non-recurring dividend(s) which amounted to $.07 per share. Excluding such non-recurring dividend(s), the ratio of net investment income (loss) to average net assets would have been .03%.
FTotal returns would have been lower if certain expenses had not been reduced during the applicable periods shown.
GTotal returns do not include the effect of the sales charges.
HFees and expenses of any underlying mutual funds or exchange-traded funds (ETFs) are not included in the Fund's expense ratio. The Fund indirectly bears its proportionate share of these expenses. For additional expense information related to investments in Fidelity Central Funds, please refer to the "Investments in Fidelity Central Funds" note found in the Notes to Financial Statements section of the most recent Annual or Semi-Annual report.
IExpense ratios reflect operating expenses of the class. Expenses before reductions do not reflect amounts reimbursed, waived, or reduced through arrangements with the investment adviser, brokerage services, or other offset arrangements, if applicable, and do not represent the amount paid by the class during periods when reimbursements, waivers or reductions occur.
JAmount does not include the portfolio activity of any underlying mutual funds or exchange-traded funds (ETFs).
KPortfolio turnover rate excludes securities received or delivered in-kind.
Fidelity Advisor® Industrials Fund Class C |
| |
| Years ended July 31, | | 2024 | | 2023 | | 2022 | | 2021 | | 2020 |
Selected Per-Share Data | | | | | | | | | | |
| Net asset value, beginning of period | $ | 32.48 | $ | 28.72 | $ | 39.46 | $ | 29.52 | $ | 34.27 |
| Income from Investment Operations | | | | | | | | | | |
Net investment income (loss) A,B | | (.24) C | | (.26) D | | (.37) | | (.41) | | (.08) E |
| Net realized and unrealized gain (loss) | | 7.93 | | 5.18 | | (2.19) | | 10.59 | | (2.15) |
| Total from investment operations | | 7.69 | | 4.92 | | (2.56) | | 10.18 | | (2.23) |
| Distributions from net investment income | | - | | - | | - | | - | | (.03) |
| Distributions from net realized gain | | (3.30) | | (1.16) | | (8.18) | | (.24) | | (2.49) |
| Total distributions | | (3.30) | | (1.16) | | (8.18) | | (.24) | | (2.52) |
| Net asset value, end of period | $ | 36.87 | $ | 32.48 | $ | 28.72 | $ | 39.46 | $ | 29.52 |
Total Return F,G | | | | 17.81% | | (8.48)% | | 34.58% | | (7.27)% |
Ratios to Average Net Assets B,H,I | | | | | | | | | | |
| Expenses before reductions | | 1.76% | | 1.79% | | 1.77% | | 1.79% | | 1.81% |
| Expenses net of fee waivers, if any | | | | 1.78% | | 1.77% | | 1.79% | | 1.81% |
| Expenses net of all reductions | | 1.76% | | 1.78% | | 1.77% | | 1.77% | | 1.79% |
| Net investment income (loss) | | (.74)% C | | (.89)% D | | (1.10)% | | (1.16)% | | (.26)% E |
| Supplemental Data | | | | | | | | | | |
| Net assets, end of period (000 omitted) | $ | 33,930 | $ | 33,293 | $ | 37,417 | $ | 55,576 | $ | 53,969 |
Portfolio turnover rate J | | | | 189% K | | 106% | | 205% | | 219% K |
ACalculated based on average shares outstanding during the period.
BNet investment income (loss) is affected by the timing of the declaration of dividends by any underlying mutual funds or exchange-traded funds (ETFs). Net investment income (loss) of any mutual funds or ETFs is not included in the Fund's net investment income (loss) ratio.
CNet investment income per share reflects one or more large, non-recurring dividend(s) which amounted to $.04 per share. Excluding such non-recurring dividend(s), the ratio of net investment income (loss) to average net assets would have been (.86)%.
DNet investment income per share reflects one or more large, non-recurring dividend(s) which amounted to $.04 per share. Excluding such non-recurring dividend(s), the ratio of net investment income (loss) to average net assets would have been (1.01)%.
ENet investment income per share reflects one or more large, non-recurring dividend(s) which amounted to $.06 per share. Excluding such non-recurring dividend(s), the ratio of net investment income (loss) to average net assets would have been (.46)%.
FTotal returns would have been lower if certain expenses had not been reduced during the applicable periods shown.
GTotal returns do not include the effect of the contingent deferred sales charge.
HFees and expenses of any underlying mutual funds or exchange-traded funds (ETFs) are not included in the Fund's expense ratio. The Fund indirectly bears its proportionate share of these expenses. For additional expense information related to investments in Fidelity Central Funds, please refer to the "Investments in Fidelity Central Funds" note found in the Notes to Financial Statements section of the most recent Annual or Semi-Annual report.
IExpense ratios reflect operating expenses of the class. Expenses before reductions do not reflect amounts reimbursed, waived, or reduced through arrangements with the investment adviser, brokerage services, or other offset arrangements, if applicable, and do not represent the amount paid by the class during periods when reimbursements, waivers or reductions occur.
JAmount does not include the portfolio activity of any underlying mutual funds or exchange-traded funds (ETFs).
KPortfolio turnover rate excludes securities received or delivered in-kind.
Fidelity Advisor® Industrials Fund Class I |
| |
| Years ended July 31, | | 2024 | | 2023 | | 2022 | | 2021 | | 2020 |
Selected Per-Share Data | | | | | | | | | | |
| Net asset value, beginning of period | $ | 42.55 | $ | 36.95 | $ | 48.64 | $ | 35.97 | $ | 41.20 |
| Income from Investment Operations | | | | | | | | | | |
Net investment income (loss) A,B | | .13 C | | .05 D | | (.03) | | (.06) | | .29 E |
| Net realized and unrealized gain (loss) | | 10.65 | | 6.77 | | (2.84) | | 12.97 | | (2.60) |
| Total from investment operations | | 10.78 | | 6.82 | | (2.87) | | 12.91 | | (2.31) |
| Distributions from net investment income | | - | | (.06) | | - | | - | | (.35) |
| Distributions from net realized gain | | (3.39) | | (1.16) | | (8.82) | | (.24) | | (2.57) |
| Total distributions | | (3.39) | | (1.22) | | (8.82) | | (.24) | | (2.92) |
| Net asset value, end of period | $ | 49.94 | $ | 42.55 | $ | 36.95 | $ | 48.64 | $ | 35.97 |
Total Return F | | | | 19.02% | | (7.55)% | | 35.98% | | (6.32)% |
Ratios to Average Net Assets B,G,H | | | | | | | | | | |
| Expenses before reductions | | .74% | | .76% | | .75% | | .76% | | .78% |
| Expenses net of fee waivers, if any | | | | .76% | | .75% | | .76% | | .78% |
| Expenses net of all reductions | | .73% | | .76% | | .75% | | .74% | | .76% |
| Net investment income (loss) | | .29% C | | .14% D | | (.08)% | | (.14)% | | .76% E |
| Supplemental Data | | | | | | | | | | |
| Net assets, end of period (000 omitted) | $ | 157,455 | $ | 140,764 | $ | 145,849 | $ | 248,090 | $ | 123,603 |
Portfolio turnover rate I | | | | 189% J | | 106% | | 205% | | 219% J |
ACalculated based on average shares outstanding during the period.
BNet investment income (loss) is affected by the timing of the declaration of dividends by any underlying mutual funds or exchange-traded funds (ETFs). Net investment income (loss) of any mutual funds or ETFs is not included in the Fund's net investment income (loss) ratio.
CNet investment income per share reflects one or more large, non-recurring dividend(s) which amounted to $.06 per share. Excluding such non-recurring dividend(s), the ratio of net investment income (loss) to average net assets would have been .16%.
DNet investment income per share reflects one or more large, non-recurring dividend(s) which amounted to $.05 per share. Excluding such non-recurring dividend(s), the ratio of net investment income (loss) to average net assets would have been .02%.
ENet investment income per share reflects one or more large, non-recurring dividend(s) which amounted to $.08 per share. Excluding such non-recurring dividend(s), the ratio of net investment income (loss) to average net assets would have been .56%.
FTotal returns would have been lower if certain expenses had not been reduced during the applicable periods shown.
GFees and expenses of any underlying mutual funds or exchange-traded funds (ETFs) are not included in the Fund's expense ratio. The Fund indirectly bears its proportionate share of these expenses. For additional expense information related to investments in Fidelity Central Funds, please refer to the "Investments in Fidelity Central Funds" note found in the Notes to Financial Statements section of the most recent Annual or Semi-Annual report.
HExpense ratios reflect operating expenses of the class. Expenses before reductions do not reflect amounts reimbursed, waived, or reduced through arrangements with the investment adviser, brokerage services, or other offset arrangements, if applicable, and do not represent the amount paid by the class during periods when reimbursements, waivers or reductions occur.
IAmount does not include the portfolio activity of any underlying mutual funds or exchange-traded funds (ETFs).
JPortfolio turnover rate excludes securities received or delivered in-kind.
Fidelity Advisor® Industrials Fund Class Z |
| |
| Years ended July 31, | | 2024 | | 2023 | | 2022 | | 2021 | | 2020 |
Selected Per-Share Data | | | | | | | | | | |
| Net asset value, beginning of period | $ | 42.52 | $ | 36.91 | $ | 48.61 | $ | 35.90 | $ | 41.15 |
| Income from Investment Operations | | | | | | | | | | |
Net investment income (loss) A,B | | .18 C | | .10 D | | .02 | | - E | | .34 F |
| Net realized and unrealized gain (loss) | | 10.65 | | 6.75 | | (2.83) | | 12.95 | | (2.60) |
| Total from investment operations | | 10.83 | | 6.85 | | (2.81) | | 12.95 | | (2.26) |
| Distributions from net investment income | | - | | (.08) | | - | | - | | (.42) |
| Distributions from net realized gain | | (3.40) | | (1.16) | | (8.89) | | (.24) | | (2.57) |
| Total distributions | | (3.40) | | (1.24) | | (8.89) | | (.24) | | (2.99) |
| Net asset value, end of period | $ | 49.95 | $ | 42.52 | $ | 36.91 | $ | 48.61 | $ | 35.90 |
Total Return G | | | | 19.14% | | (7.42)% | | 36.16% | | (6.21)% |
Ratios to Average Net Assets B,H,I | | | | | | | | | | |
| Expenses before reductions | | .61% | | .64% | | .63% | | .64% | | .65% |
| Expenses net of fee waivers, if any | | | | .63% | | .62% | | .64% | | .65% |
| Expenses net of all reductions | | .61% | | .63% | | .62% | | .62% | | .63% |
| Net investment income (loss) | | .41% C | | .26% D | | .04% | | (.01)% | | .89% F |
| Supplemental Data | | | | | | | | | | |
| Net assets, end of period (000 omitted) | $ | 47,696 | $ | 104,120 | $ | 23,974 | $ | 50,167 | $ | 29,168 |
Portfolio turnover rate J | | | | 189% K | | 106% | | 205% | | 219% K |
ACalculated based on average shares outstanding during the period.
BNet investment income (loss) is affected by the timing of the declaration of dividends by any underlying mutual funds or exchange-traded funds (ETFs). Net investment income (loss) of any mutual funds or ETFs is not included in the Fund's net investment income (loss) ratio.
CNet investment income per share reflects one or more large, non-recurring dividend(s) which amounted to $.06 per share. Excluding such non-recurring dividend(s), the ratio of net investment income (loss) to average net assets would have been .29%.
DNet investment income per share reflects one or more large, non-recurring dividend(s) which amounted to $.05 per share. Excluding such non-recurring dividend(s), the ratio of net investment income (loss) to average net assets would have been .14%.
EAmount represents less than $.005 per share.
FNet investment income per share reflects one or more large, non-recurring dividend(s) which amounted to $.08 per share. Excluding such non-recurring dividend(s), the ratio of net investment income (loss) to average net assets would have been .69%.
GTotal returns would have been lower if certain expenses had not been reduced during the applicable periods shown.
HFees and expenses of any underlying mutual funds or exchange-traded funds (ETFs) are not included in the Fund's expense ratio. The Fund indirectly bears its proportionate share of these expenses. For additional expense information related to investments in Fidelity Central Funds, please refer to the "Investments in Fidelity Central Funds" note found in the Notes to Financial Statements section of the most recent Annual or Semi-Annual report.
IExpense ratios reflect operating expenses of the class. Expenses before reductions do not reflect amounts reimbursed, waived, or reduced through arrangements with the investment adviser, brokerage services, or other offset arrangements, if applicable, and do not represent the amount paid by the class during periods when reimbursements, waivers or reductions occur.
JAmount does not include the portfolio activity of any underlying mutual funds or exchange-traded funds (ETFs).
KPortfolio turnover rate excludes securities received or delivered in-kind.
Fidelity Advisor® Semiconductors Fund
Schedule of Investments July 31, 2024
Showing Percentage of Net Assets
| Common Stocks - 95.0% |
| | | Shares | Value ($) |
| Electronic Equipment, Instruments & Components - 0.0% | | | |
| Electronic Equipment & Instruments - 0.0% | | | |
| Aeva Technologies, Inc. (a)(b) | | 23,620 | 85,741 |
| Semiconductors & Semiconductor Equipment - 92.5% | | | |
| Semiconductor Materials & Equipment - 14.4% | | | |
| Applied Materials, Inc. | | 44,800 | 9,506,560 |
| ASML Holding NV (depository receipt) | | 142,789 | 133,750,456 |
| Lam Research Corp. | | 139,446 | 128,463,233 |
| Nova Ltd. (a)(b) | | 218,232 | 45,058,361 |
| Teradyne, Inc. | | 559,600 | 73,397,136 |
| | | | 390,175,746 |
| Semiconductors - 78.1% | | | |
| Advanced Micro Devices, Inc. (a) | | 702,923 | 101,558,315 |
| Allegro MicroSystems LLC (a)(b) | | 803,500 | 19,316,140 |
| Astera Labs, Inc. (b) | | 820,500 | 35,970,720 |
| Astera Labs, Inc. | | 89,460 | 3,921,926 |
| Broadcom, Inc. | | 726,250 | 116,693,850 |
| GlobalFoundries, Inc. (a) | | 2,562,212 | 130,698,434 |
| Impinj, Inc. (a) | | 229,859 | 36,614,240 |
| Lattice Semiconductor Corp. (a) | | 179,319 | 9,503,907 |
| MACOM Technology Solutions Holdings, Inc. (a) | | 317,992 | 32,091,753 |
| Marvell Technology, Inc. | | 1,444,351 | 96,742,630 |
| Microchip Technology, Inc. | | 74,117 | 6,580,107 |
| Micron Technology, Inc. | | 1,335,900 | 146,708,538 |
| Monolithic Power Systems, Inc. | | 111,943 | 96,616,884 |
| NVIDIA Corp. | | 5,942,370 | 695,376,139 |
| NXP Semiconductors NV | | 578,853 | 152,330,955 |
| ON Semiconductor Corp. (a) | | 2,519,057 | 197,116,210 |
| Qualcomm, Inc. | | 54,200 | 9,807,490 |
| Silicon Motion Tech Corp. sponsored ADR | | 374,800 | 26,026,112 |
| Synaptics, Inc. (a) | | 245,804 | 21,463,605 |
| Taiwan Semiconductor Manufacturing Co. Ltd. sponsored ADR | | 999,188 | 165,665,370 |
| Texas Instruments, Inc. | | 24,300 | 4,952,583 |
| Wolfspeed, Inc. (a)(b) | | 54,700 | 1,031,095 |
| | | | 2,106,787,003 |
TOTAL SEMICONDUCTORS & SEMICONDUCTOR EQUIPMENT | | | 2,496,962,749 |
| Technology Hardware, Storage & Peripherals - 2.5% | | | |
| Technology Hardware, Storage & Peripherals - 2.5% | | | |
| Western Digital Corp. (a) | | 983,312 | 65,931,070 |
| TOTAL COMMON STOCKS (Cost $1,407,976,957) | | | 2,562,979,560 |
| | | | |
| Convertible Preferred Stocks - 0.2% |
| | | Shares | Value ($) |
| Electronic Equipment, Instruments & Components - 0.1% | | | |
| Electronic Components - 0.1% | | | |
| Frore Systems, Inc. Series C (c)(d) | | 143,630 | 2,318,188 |
| Menlo Micro, Inc. Series C (a)(c)(d) | | 79,800 | 55,860 |
| | | | 2,374,048 |
| Financial Services - 0.0% | | | |
| Diversified Financial Services - 0.0% | | | |
| Akeana Series C (c)(d) | | 11,132 | 146,608 |
| Tenstorrent Holdings, Inc.: | | | |
| Series C1 (c)(d) | | 1,740 | 129,230 |
| Series D1 (c)(d) | | 4,400 | 346,852 |
| Series D2 (c)(d) | | 1,019 | 77,424 |
| | | | 700,114 |
| Metals & Mining - 0.0% | | | |
| Precious Metals & Minerals - 0.0% | | | |
| Diamond Foundry, Inc. Series C (a)(c)(d) | | 18,335 | 504,946 |
| Semiconductors & Semiconductor Equipment - 0.1% | | | |
| Semiconductor Materials & Equipment - 0.0% | | | |
| Sima Technologies, Inc.: | | | |
| Series B (a)(c)(d) | | 30,638 | 200,066 |
| Series B1 (a)(c)(d) | | 18,145 | 136,995 |
| | | | 337,061 |
| Semiconductors - 0.1% | | | |
| Alif Semiconductor Series C (a)(c)(d) | | 48,363 | 896,650 |
| Retym, Inc. Series C (a)(c)(d) | | 55,074 | 474,738 |
| | | | 1,371,388 |
TOTAL SEMICONDUCTORS & SEMICONDUCTOR EQUIPMENT | | | 1,708,449 |
| Technology Hardware, Storage & Peripherals - 0.0% | | | |
| Technology Hardware, Storage & Peripherals - 0.0% | | | |
| Lightmatter, Inc.: | | | |
| Series C (a)(c)(d) | | 32,553 | 711,934 |
| Series C2 (c)(d) | | 5,113 | 133,500 |
| | | | 845,434 |
| TOTAL CONVERTIBLE PREFERRED STOCKS (Cost $5,888,524) | | | 6,132,991 |
| | | | |
| Preferred Securities - 0.0% |
| | | Principal Amount (e) | Value ($) |
| Semiconductors & Semiconductor Equipment - 0.0% | | | |
| Semiconductor Materials & Equipment - 0.0% | | | |
Sima Technologies, Inc. 10% 12/31/27 (c)(d) (Cost $45,376) | | 45,376 | 45,840 |
| | | | |
| Money Market Funds - 3.0% |
| | | Shares | Value ($) |
| Fidelity Cash Central Fund 5.39% (f) | | 483 | 483 |
| Fidelity Securities Lending Cash Central Fund 5.39% (f)(g) | | 80,703,355 | 80,711,425 |
| TOTAL MONEY MARKET FUNDS (Cost $80,711,908) | | | 80,711,908 |
| | | | |
| TOTAL INVESTMENT IN SECURITIES - 98.2% (Cost $1,494,622,765) | 2,649,870,299 |
NET OTHER ASSETS (LIABILITIES) - 1.8% | 48,347,012 |
| NET ASSETS - 100.0% | 2,698,217,311 |
| | |
Legend
| (b) | Security or a portion of the security is on loan at period end. |
| (c) | Restricted securities (including private placements) - Investment in securities not registered under the Securities Act of 1933 (excluding 144A issues). At the end of the period, the value of restricted securities (excluding 144A issues) amounted to $6,178,831 or 0.2% of net assets. |
| (e) | Amount is stated in United States dollars unless otherwise noted. |
| (f) | Affiliated fund that is generally available only to investment companies and other accounts managed by Fidelity Investments. The rate quoted is the annualized seven-day yield of the fund at period end. A complete unaudited listing of the fund's holdings as of its most recent quarter end is available upon request. In addition, each Fidelity Central Fund's financial statements, which are not covered by the Fund's Report of Independent Registered Public Accounting Firm, are available on the SEC's website or upon request. |
| (g) | Investment made with cash collateral received from securities on loan. |
| Additional information on each restricted holding is as follows: |
| Security | Acquisition Date | Acquisition Cost ($) |
| Akeana Series C | 1/23/24 | 142,053 |
| | | |
| Alif Semiconductor Series C | 3/08/22 | 981,698 |
| | | |
| Diamond Foundry, Inc. Series C | 3/15/21 | 440,040 |
| | | |
| Frore Systems, Inc. Series C | 5/10/24 | 2,308,192 |
| | | |
| Lightmatter, Inc. Series C | 5/19/23 | 535,718 |
| | | |
| Lightmatter, Inc. Series C2 | 12/18/23 | 132,947 |
| | | |
| Menlo Micro, Inc. Series C | 2/09/22 | 105,775 |
| | | |
| Retym, Inc. Series C | 5/17/23 - 6/20/23 | 428,575 |
| | | |
| Sima Technologies, Inc. Series B | 5/10/21 | 157,093 |
| | | |
| Sima Technologies, Inc. Series B1 | 4/25/22 - 10/17/22 | 128,665 |
| | | |
| Sima Technologies, Inc. 10% 12/31/27 | 4/08/24 - 7/05/24 | 45,376 |
| | | |
| Tenstorrent Holdings, Inc. Series C1 | 4/23/21 | 103,509 |
| | | |
| Tenstorrent Holdings, Inc. Series D1 | 7/16/24 | 346,836 |
| | | |
| Tenstorrent Holdings, Inc. Series D2 | 7/17/24 | 77,423 |
| | | |
Affiliated Central Funds
Fiscal year to date information regarding the Fund's investments in Fidelity Central Funds, including the ownership percentage, is presented below.
| Affiliate | Value, beginning of period ($) | Purchases ($) | Sales Proceeds ($) | Dividend Income ($) | Realized Gain (loss) ($) | Change in Unrealized appreciation (depreciation) ($) | Value, end of period ($) | % ownership, end of period |
| Fidelity Cash Central Fund 5.39% | 62,347,605 | 472,196,369 | 534,544,872 | 2,217,509 | 1,381 | - | 483 | 0.0% |
| Fidelity Securities Lending Cash Central Fund 5.39% | 39,629,775 | 450,763,435 | 409,681,785 | 335,546 | - | - | 80,711,425 | 0.4% |
| Total | 101,977,380 | 922,959,804 | 944,226,657 | 2,553,055 | 1,381 | - | 80,711,908 | |
| | | | | | | | | |
Amounts in the dividend income column in the above table include any capital gain distributions from underlying funds, which are presented in the corresponding line item in the Statement of Operations, if applicable.
Amounts in the dividend income column for Fidelity Securities Lending Cash Central Fund represents the income earned on investing cash collateral, less rebates paid to borrowers and any lending agent fees associated with the loan, plus any premium payments received for lending certain types of securities.
Amounts included in the purchases and sales proceeds columns may include in-kind transactions, if applicable.
Investment Valuation
The following is a summary of the inputs used, as of July 31, 2024, involving the Fund's assets and liabilities carried at fair value. The inputs or methodology used for valuing securities may not be an indication of the risk associated with investing in those securities. For more information on valuation inputs, and their aggregation into the levels used below, please refer to the Investment Valuation section in the accompanying Notes to Financial Statements.
| Valuation Inputs at Reporting Date: |
| Description | Total ($) | Level 1 ($) | Level 2 ($) | Level 3 ($) |
Investments in Securities: | | | | |
|
| Common Stocks | 2,562,979,560 | 2,562,979,560 | - | - |
|
| Convertible Preferred Stocks | 6,132,991 | - | - | 6,132,991 |
|
| Preferred Securities | 45,840 | - | - | 45,840 |
|
| Money Market Funds | 80,711,908 | 80,711,908 | - | - |
| Total Investments in Securities: | 2,649,870,299 | 2,643,691,468 | - | 6,178,831 |
Fidelity Advisor® Semiconductors Fund
Financial Statements
| Statement of Assets and Liabilities |
As of July 31, 2024 |
| Assets | | | | |
| Investment in securities, at value (including securities loaned of $82,267,165) - See accompanying schedule: | | | | |
Unaffiliated issuers (cost $1,413,910,857) | $ | 2,569,158,391 | | |
Fidelity Central Funds (cost $80,711,908) | | 80,711,908 | | |
| | | | | |
| | | | | |
| Total Investment in Securities (cost $1,494,622,765) | | | $ | 2,649,870,299 |
| Receivable for investments sold | | | | 149,856,406 |
| Receivable for fund shares sold | | | | 3,789,608 |
| Dividends receivable | | | | 238,447 |
| Distributions receivable from Fidelity Central Funds | | | | 264,511 |
| Prepaid expenses | | | | 942 |
Total assets | | | | 2,804,020,213 |
| Liabilities | | | | |
| Payable for investments purchased | $ | 4,020,431 | | |
| Payable for fund shares redeemed | | 1,227,247 | | |
| Accrued management fee | | 1,565,264 | | |
| Distribution and service plan fees payable | | 498,387 | | |
| Notes payable to affiliates | | 17,716,000 | | |
| Other payables and accrued expenses | | 64,148 | | |
| Collateral on securities loaned | | 80,711,425 | | |
| Total liabilities | | | | 105,802,902 |
| Net Assets | | | $ | 2,698,217,311 |
| Net Assets consist of: | | | | |
| Paid in capital | | | $ | 1,455,199,216 |
| Total accumulated earnings (loss) | | | | 1,243,018,095 |
| Net Assets | | | $ | 2,698,217,311 |
| | | | | |
| Net Asset Value and Maximum Offering Price | | | | |
| Class A : | | | | |
Net Asset Value and redemption price per share ($1,056,997,711 ÷ 12,611,551 shares)(a) | | | $ | 83.81 |
| Maximum offering price per share (100/94.25 of $83.81) | | | $ | 88.92 |
| Class M : | | | | |
Net Asset Value and redemption price per share ($176,276,208 ÷ 2,254,464 shares)(a) | | | $ | 78.19 |
| Maximum offering price per share (100/96.50 of $78.19) | | | $ | 81.03 |
| Class C : | | | | |
Net Asset Value and offering price per share ($221,748,629 ÷ 3,314,565 shares)(a) | | | $ | 66.90 |
| Class I : | | | | |
Net Asset Value, offering price and redemption price per share ($1,016,505,386 ÷ 11,205,712 shares) | | | $ | 90.71 |
| Class Z : | | | | |
Net Asset Value, offering price and redemption price per share ($226,689,377 ÷ 2,492,821 shares) | | | $ | 90.94 |
(a)Redemption price per share is equal to net asset value less any applicable contingent deferred sales charge. |
| Statement of Operations |
| Year ended July 31, 2024 |
| Investment Income | | | | |
| Dividends | | | $ | 9,670,311 |
| Income from Fidelity Central Funds (including $335,546 from security lending) | | | | 2,553,055 |
| Total income | | | | 12,223,366 |
| Expenses | | | | |
| Management fee | $ | 11,487,050 | | |
| Transfer agent fees | | 1,400,862 | | |
| Distribution and service plan fees | | 4,121,287 | | |
| Accounting fees | | 245,692 | | |
| Custodian fees and expenses | | 23,868 | | |
| Independent trustees' fees and expenses | | 8,100 | | |
| Registration fees | | 176,955 | | |
| Audit fees | | 48,522 | | |
| Legal | | 3,030 | | |
| Interest | | 2,748 | | |
| Miscellaneous | | 18,785 | | |
| Total expenses before reductions | | 17,536,899 | | |
| Expense reductions | | (101,803) | | |
| Total expenses after reductions | | | | 17,435,096 |
| Net Investment income (loss) | | | | (5,211,730) |
| Realized and Unrealized Gain (Loss) | | | | |
| Net realized gain (loss) on: | | | | |
| Investment Securities: | | | | |
| Unaffiliated issuers | | 100,768,041 | | |
| Fidelity Central Funds | | 1,381 | | |
| Total net realized gain (loss) | | | | 100,769,422 |
| Change in net unrealized appreciation (depreciation) on investment securities | | | | 572,951,806 |
| Net gain (loss) | | | | 673,721,228 |
| Net increase (decrease) in net assets resulting from operations | | | $ | 668,509,498 |
| Statement of Changes in Net Assets |
| |
| | Year ended July 31, 2024 | | Year ended July 31, 2023 |
| Increase (Decrease) in Net Assets | | | | |
| Operations | | | | |
| Net investment income (loss) | $ | (5,211,730) | $ | (649,806) |
| Net realized gain (loss) | | 100,769,422 | | 49,397,259 |
| Change in net unrealized appreciation (depreciation) | | 572,951,806 | | 374,257,020 |
| Net increase (decrease) in net assets resulting from operations | | 668,509,498 | | 423,004,473 |
| Distributions to shareholders | | (51,832,290) | | (22,158,679) |
| | | | | |
| Share transactions - net increase (decrease) | | 649,803,004 | | 216,742,474 |
| Total increase (decrease) in net assets | | 1,266,480,212 | | 617,588,268 |
| | | | | |
| Net Assets | | | | |
| Beginning of period | | 1,431,737,099 | | 814,148,831 |
| End of period | $ | 2,698,217,311 | $ | 1,431,737,099 |
| | | | | |
| | | | | |
Financial Highlights
Fidelity Advisor® Semiconductors Fund Class A |
| |
| Years ended July 31, | | 2024 | | 2023 | | 2022 | | 2021 | | 2020 |
Selected Per-Share Data | | | | | | | | | | |
| Net asset value, beginning of period | $ | 62.13 | $ | 42.85 | $ | 46.29 | $ | 29.79 | $ | 23.03 |
| Income from Investment Operations | | | | | | | | | | |
Net investment income (loss) A,B | | (.22) | | (.05) | | (.13) | | (.08) | | .14 |
| Net realized and unrealized gain (loss) | | 23.97 | | 20.53 | | (.83) | | 18.29 | | 6.90 |
| Total from investment operations | | 23.75 | | 20.48 | | (.96) | | 18.21 | | 7.04 |
| Distributions from net investment income | | - | | - | | - | | (.04) | | (.07) |
| Distributions from net realized gain | | (2.07) | | (1.20) | | (2.48) | | (1.67) | | (.20) |
| Total distributions | | (2.07) | | (1.20) | | (2.48) | | (1.71) | | (.28) C |
| Net asset value, end of period | $ | 83.81 | $ | 62.13 | $ | 42.85 | $ | 46.29 | $ | 29.79 |
Total Return D,E | | | | 49.31% | | (3.21)% | | 62.45% | | 30.65% |
Ratios to Average Net Assets B,F,G | | | | | | | | | | |
| Expenses before reductions | | .97% | | 1.01% | | 1.01% | | 1.04% | | 1.10% |
| Expenses net of fee waivers, if any | | | | 1.00% | | 1.01% | | 1.04% | | 1.09% |
| Expenses net of all reductions | | .96% | | 1.00% | | 1.01% | | 1.03% | | 1.08% |
| Net investment income (loss) | | (.31)% | | (.10)% | | (.27)% | | (.21)% | | .53% |
| Supplemental Data | | | | | | | | | | |
| Net assets, end of period (000 omitted) | $ | 1,056,998 | $ | 581,690 | $ | 319,402 | $ | 279,755 | $ | 140,072 |
Portfolio turnover rate H | | | | 40% | | 32% | | 41% | | 136% |
ACalculated based on average shares outstanding during the period.
BNet investment income (loss) is affected by the timing of the declaration of dividends by any underlying mutual funds or exchange-traded funds (ETFs). Net investment income (loss) of any mutual funds or ETFs is not included in the Fund's net investment income (loss) ratio.
CTotal distributions per share do not sum due to rounding.
DTotal returns would have been lower if certain expenses had not been reduced during the applicable periods shown.
ETotal returns do not include the effect of the sales charges.
FFees and expenses of any underlying mutual funds or exchange-traded funds (ETFs) are not included in the Fund's expense ratio. The Fund indirectly bears its proportionate share of these expenses. For additional expense information related to investments in Fidelity Central Funds, please refer to the "Investments in Fidelity Central Funds" note found in the Notes to Financial Statements section of the most recent Annual or Semi-Annual report.
GExpense ratios reflect operating expenses of the class. Expenses before reductions do not reflect amounts reimbursed, waived, or reduced through arrangements with the investment adviser, brokerage services, or other offset arrangements, if applicable, and do not represent the amount paid by the class during periods when reimbursements, waivers or reductions occur.
HAmount does not include the portfolio activity of any underlying mutual funds or exchange-traded funds (ETFs).
Fidelity Advisor® Semiconductors Fund Class M |
| |
| Years ended July 31, | | 2024 | | 2023 | | 2022 | | 2021 | | 2020 |
Selected Per-Share Data | | | | | | | | | | |
| Net asset value, beginning of period | $ | 58.24 | $ | 40.34 | $ | 43.75 | $ | 28.25 | $ | 21.89 |
| Income from Investment Operations | | | | | | | | | | |
Net investment income (loss) A,B | | (.37) | | (.15) | | (.23) | | (.17) | | .06 |
| Net realized and unrealized gain (loss) | | 22.39 | | 19.25 | | (.76) | | 17.31 | | 6.55 |
| Total from investment operations | | 22.02 | | 19.10 | | (.99) | | 17.14 | | 6.61 |
| Distributions from net investment income | | - | | - | | - | | - | | (.05) |
| Distributions from net realized gain | | (2.07) | | (1.20) | | (2.42) | | (1.64) | | (.20) |
| Total distributions | | (2.07) | | (1.20) | | (2.42) | | (1.64) | | (.25) |
| Net asset value, end of period | $ | 78.19 | $ | 58.24 | $ | 40.34 | $ | 43.75 | $ | 28.25 |
Total Return C,D | | | | 48.95% | | (3.43)% | | 61.98% | | 30.28% |
Ratios to Average Net Assets B,E,F | | | | | | | | | | |
| Expenses before reductions | | 1.21% | | 1.25% | | 1.26% | | 1.30% | | 1.38% |
| Expenses net of fee waivers, if any | | | | 1.25% | | 1.25% | | 1.30% | | 1.38% |
| Expenses net of all reductions | | 1.21% | | 1.25% | | 1.25% | | 1.29% | | 1.37% |
| Net investment income (loss) | | (.56)% | | (.35)% | | (.52)% | | (.47)% | | .24% |
| Supplemental Data | | | | | | | | | | |
| Net assets, end of period (000 omitted) | $ | 176,276 | $ | 94,006 | $ | 48,499 | $ | 49,963 | $ | 29,262 |
Portfolio turnover rate G | | | | 40% | | 32% | | 41% | | 136% |
ACalculated based on average shares outstanding during the period.
BNet investment income (loss) is affected by the timing of the declaration of dividends by any underlying mutual funds or exchange-traded funds (ETFs). Net investment income (loss) of any mutual funds or ETFs is not included in the Fund's net investment income (loss) ratio.
CTotal returns would have been lower if certain expenses had not been reduced during the applicable periods shown.
DTotal returns do not include the effect of the sales charges.
EFees and expenses of any underlying mutual funds or exchange-traded funds (ETFs) are not included in the Fund's expense ratio. The Fund indirectly bears its proportionate share of these expenses. For additional expense information related to investments in Fidelity Central Funds, please refer to the "Investments in Fidelity Central Funds" note found in the Notes to Financial Statements section of the most recent Annual or Semi-Annual report.
FExpense ratios reflect operating expenses of the class. Expenses before reductions do not reflect amounts reimbursed, waived, or reduced through arrangements with the investment adviser, brokerage services, or other offset arrangements, if applicable, and do not represent the amount paid by the class during periods when reimbursements, waivers or reductions occur.
GAmount does not include the portfolio activity of any underlying mutual funds or exchange-traded funds (ETFs).
Fidelity Advisor® Semiconductors Fund Class C |
| |
| Years ended July 31, | | 2024 | | 2023 | | 2022 | | 2021 | | 2020 |
Selected Per-Share Data | | | | | | | | | | |
| Net asset value, beginning of period | $ | 50.38 | $ | 35.24 | $ | 38.59 | $ | 25.18 | $ | 19.59 |
| Income from Investment Operations | | | | | | | | | | |
Net investment income (loss) A,B | | (.60) | | (.31) | | (.40) | | (.31) | | (.05) |
| Net realized and unrealized gain (loss) | | 19.19 | | 16.65 | | (.61) | | 15.35 | | 5.86 |
| Total from investment operations | | 18.59 | | 16.34 | | (1.01) | | 15.04 | | 5.81 |
| Distributions from net investment income | | - | | - | | - | | - | | (.01) |
| Distributions from net realized gain | | (2.07) | | (1.20) | | (2.34) | | (1.63) | | (.20) |
| Total distributions | | (2.07) | | (1.20) | | (2.34) | | (1.63) | | (.22) C |
| Net asset value, end of period | $ | 66.90 | $ | 50.38 | $ | 35.24 | $ | 38.59 | $ | 25.18 |
Total Return D,E | | | | 48.18% | | (3.93)% | | 61.17% | | 29.73% |
Ratios to Average Net Assets B,F,G | | | | | | | | | | |
| Expenses before reductions | | 1.72% | | 1.76% | | 1.76% | | 1.79% | | 1.85% |
| Expenses net of fee waivers, if any | | | | 1.76% | | 1.76% | | 1.79% | | 1.85% |
| Expenses net of all reductions | | 1.71% | | 1.76% | | 1.76% | | 1.79% | | 1.83% |
| Net investment income (loss) | | (1.07)% | | (.86)% | | (1.03)% | | (.97)% | | (.23)% |
| Supplemental Data | | | | | | | | | | |
| Net assets, end of period (000 omitted) | $ | 221,749 | $ | 129,390 | $ | 88,592 | $ | 86,217 | $ | 57,320 |
Portfolio turnover rate H | | | | 40% | | 32% | | 41% | | 136% |
ACalculated based on average shares outstanding during the period.
BNet investment income (loss) is affected by the timing of the declaration of dividends by any underlying mutual funds or exchange-traded funds (ETFs). Net investment income (loss) of any mutual funds or ETFs is not included in the Fund's net investment income (loss) ratio.
CTotal distributions per share do not sum due to rounding.
DTotal returns would have been lower if certain expenses had not been reduced during the applicable periods shown.
ETotal returns do not include the effect of the contingent deferred sales charge.
FFees and expenses of any underlying mutual funds or exchange-traded funds (ETFs) are not included in the Fund's expense ratio. The Fund indirectly bears its proportionate share of these expenses. For additional expense information related to investments in Fidelity Central Funds, please refer to the "Investments in Fidelity Central Funds" note found in the Notes to Financial Statements section of the most recent Annual or Semi-Annual report.
GExpense ratios reflect operating expenses of the class. Expenses before reductions do not reflect amounts reimbursed, waived, or reduced through arrangements with the investment adviser, brokerage services, or other offset arrangements, if applicable, and do not represent the amount paid by the class during periods when reimbursements, waivers or reductions occur.
HAmount does not include the portfolio activity of any underlying mutual funds or exchange-traded funds (ETFs).
Fidelity Advisor® Semiconductors Fund Class I |
| |
| Years ended July 31, | | 2024 | | 2023 | | 2022 | | 2021 | | 2020 |
Selected Per-Share Data | | | | | | | | | | |
| Net asset value, beginning of period | $ | 66.91 | $ | 45.93 | $ | 49.39 | $ | 31.68 | $ | 24.42 |
| Income from Investment Operations | | | | | | | | | | |
Net investment income (loss) A,B | | (.05) | | .08 | | (.01) | | .03 | | .22 |
| Net realized and unrealized gain (loss) | | 25.92 | | 22.10 | | (.92) | | 19.47 | | 7.34 |
| Total from investment operations | | 25.87 | | 22.18 | | (.93) | | 19.50 | | 7.56 |
| Distributions from net investment income | | - | | - | | - | | (.12) | | (.10) |
| Distributions from net realized gain | | (2.07) | | (1.20) | | (2.53) | | (1.67) | | (.20) |
| Total distributions | | (2.07) | | (1.20) | | (2.53) | | (1.79) | | (.30) |
| Net asset value, end of period | $ | 90.71 | $ | 66.91 | $ | 45.93 | $ | 49.39 | $ | 31.68 |
Total Return C | | | | 49.71% | | (2.96)% | | 62.86% | | 31.08% |
Ratios to Average Net Assets B,D,E | | | | | | | | | | |
| Expenses before reductions | | .72% | | .74% | | .75% | | .77% | | .81% |
| Expenses net of fee waivers, if any | | | | .74% | | .74% | | .77% | | .81% |
| Expenses net of all reductions | | .71% | | .74% | | .74% | | .76% | | .79% |
| Net investment income (loss) | | (.07)% | | .16% | | (.01)% | | .06% | | .81% |
| Supplemental Data | | | | | | | | | | |
| Net assets, end of period (000 omitted) | $ | 1,016,505 | $ | 530,775 | $ | 309,873 | $ | 257,502 | $ | 126,660 |
Portfolio turnover rate F | | | | 40% | | 32% | | 41% | | 136% |
ACalculated based on average shares outstanding during the period.
BNet investment income (loss) is affected by the timing of the declaration of dividends by any underlying mutual funds or exchange-traded funds (ETFs). Net investment income (loss) of any mutual funds or ETFs is not included in the Fund's net investment income (loss) ratio.
CTotal returns would have been lower if certain expenses had not been reduced during the applicable periods shown.
DFees and expenses of any underlying mutual funds or exchange-traded funds (ETFs) are not included in the Fund's expense ratio. The Fund indirectly bears its proportionate share of these expenses. For additional expense information related to investments in Fidelity Central Funds, please refer to the "Investments in Fidelity Central Funds" note found in the Notes to Financial Statements section of the most recent Annual or Semi-Annual report.
EExpense ratios reflect operating expenses of the class. Expenses before reductions do not reflect amounts reimbursed, waived, or reduced through arrangements with the investment adviser, brokerage services, or other offset arrangements, if applicable, and do not represent the amount paid by the class during periods when reimbursements, waivers or reductions occur.
FAmount does not include the portfolio activity of any underlying mutual funds or exchange-traded funds (ETFs).
Fidelity Advisor® Semiconductors Fund Class Z |
| |
| Years ended July 31, | | 2024 | | 2023 | | 2022 | | 2021 | | 2020 |
Selected Per-Share Data | | | | | | | | | | |
| Net asset value, beginning of period | $ | 66.99 | $ | 45.93 | $ | 49.35 | $ | 31.65 | $ | 24.38 |
| Income from Investment Operations | | | | | | | | | | |
Net investment income (loss) A,B | | .04 | | .14 | | .06 | | .08 | | .26 |
| Net realized and unrealized gain (loss) | | 25.98 | | 22.12 | | (.92) | | 19.45 | | 7.33 |
| Total from investment operations | | 26.02 | | 22.26 | | (.86) | | 19.53 | | 7.59 |
| Distributions from net investment income | | - | | - | | - | | (.16) | | (.11) |
| Distributions from net realized gain | | (2.07) | | (1.20) | | (2.56) | | (1.67) | | (.20) |
| Total distributions | | (2.07) | | (1.20) | | (2.56) | | (1.83) | | (.32) C |
| Net asset value, end of period | $ | 90.94 | $ | 66.99 | $ | 45.93 | $ | 49.35 | $ | 31.65 |
Total Return D | | | | 49.89% | | (2.83)% | | 63.06% | | 31.22% |
Ratios to Average Net Assets B,E,F | | | | | | | | | | |
| Expenses before reductions | | .60% | | .62% | | .62% | | .64% | | .68% |
| Expenses net of fee waivers, if any | | | | .62% | | .62% | | .64% | | .68% |
| Expenses net of all reductions | | .59% | | .62% | | .62% | | .64% | | .66% |
| Net investment income (loss) | | .05% | | .28% | | .11% | | .18% | | .94% |
| Supplemental Data | | | | | | | | | | |
| Net assets, end of period (000 omitted) | $ | 226,689 | $ | 95,876 | $ | 47,782 | $ | 26,856 | $ | 7,920 |
Portfolio turnover rate G | | | | 40% | | 32% | | 41% | | 136% |
ACalculated based on average shares outstanding during the period.
BNet investment income (loss) is affected by the timing of the declaration of dividends by any underlying mutual funds or exchange-traded funds (ETFs). Net investment income (loss) of any mutual funds or ETFs is not included in the Fund's net investment income (loss) ratio.
CTotal distributions per share do not sum due to rounding.
DTotal returns would have been lower if certain expenses had not been reduced during the applicable periods shown.
EFees and expenses of any underlying mutual funds or exchange-traded funds (ETFs) are not included in the Fund's expense ratio. The Fund indirectly bears its proportionate share of these expenses. For additional expense information related to investments in Fidelity Central Funds, please refer to the "Investments in Fidelity Central Funds" note found in the Notes to Financial Statements section of the most recent Annual or Semi-Annual report.
FExpense ratios reflect operating expenses of the class. Expenses before reductions do not reflect amounts reimbursed, waived, or reduced through arrangements with the investment adviser, brokerage services, or other offset arrangements, if applicable, and do not represent the amount paid by the class during periods when reimbursements, waivers or reductions occur.
GAmount does not include the portfolio activity of any underlying mutual funds or exchange-traded funds (ETFs).
Fidelity Advisor® Technology Fund
Schedule of Investments July 31, 2024
Showing Percentage of Net Assets
| Common Stocks - 94.5% |
| | | Shares | Value ($) |
| Broadline Retail - 1.5% | | | |
| Broadline Retail - 1.5% | | | |
| Amazon.com, Inc. (a) | | 499,500 | 93,396,510 |
| Chemicals - 0.0% | | | |
| Commodity Chemicals - 0.0% | | | |
| LG Chemical Ltd. | | 9,410 | 2,098,683 |
| Communications Equipment - 2.5% | | | |
| Communications Equipment - 2.5% | | | |
| Cisco Systems, Inc. | | 3,359,300 | 162,758,085 |
| Consumer Staples Distribution & Retail - 0.0% | | | |
| Food Retail - 0.0% | | | |
| Maplebear, Inc. (NASDAQ) | | 29,110 | 1,004,004 |
| Entertainment - 0.5% | | | |
| Movies & Entertainment - 0.5% | | | |
| Netflix, Inc. (a) | | 52,366 | 32,904,176 |
| Ground Transportation - 2.3% | | | |
| Cargo Ground Transportation - 0.0% | | | |
| TuSimple Holdings, Inc. (a) | | 86,300 | 17,174 |
| Passenger Ground Transportation - 2.3% | | | |
| Lyft, Inc. (a) | | 713,642 | 8,599,386 |
| Uber Technologies, Inc. (a) | | 2,117,864 | 136,538,692 |
| | | | 145,138,078 |
TOTAL GROUND TRANSPORTATION | | | 145,155,252 |
| Hotels, Restaurants & Leisure - 0.6% | | | |
| Hotels, Resorts & Cruise Lines - 0.6% | | | |
| Airbnb, Inc. Class A (a) | | 289,300 | 40,374,708 |
| Interactive Media & Services - 0.3% | | | |
| Interactive Media & Services - 0.3% | | | |
| Reddit, Inc.: | | | |
| Class A (b) | | 15,600 | 949,260 |
| Class B | | 254,214 | 15,468,922 |
| | | | 16,418,182 |
| IT Services - 4.4% | | | |
| Internet Services & Infrastructure - 4.4% | | | |
| MongoDB, Inc. Class A (a) | | 97,742 | 24,666,171 |
| Okta, Inc. (a) | | 1,978,235 | 185,835,396 |
| Shopify, Inc. Class A (a) | | 1,076,700 | 65,894,040 |
| Snowflake, Inc. (a) | | 45,900 | 5,984,442 |
| | | | 282,380,049 |
| Life Sciences Tools & Services - 0.0% | | | |
| Life Sciences Tools & Services - 0.0% | | | |
| Eden Biologics, Inc. (a)(c) | | 387,462 | 0 |
| Pharmaceuticals - 0.0% | | | |
| Pharmaceuticals - 0.0% | | | |
| Chime Biologics Wuhan Co. Ltd. (a)(c) | | 387,462 | 201,802 |
| Semiconductors & Semiconductor Equipment - 41.6% | | | |
| Semiconductor Materials & Equipment - 2.5% | | | |
| ASML Holding NV (Netherlands) | | 85,100 | 78,330,604 |
| Teradyne, Inc. | | 637,400 | 83,601,384 |
| | | | 161,931,988 |
| Semiconductors - 39.1% | | | |
| Astera Labs, Inc. | | 93,819 | 4,113,025 |
| Astera Labs, Inc. | | 447,652 | 19,625,064 |
| GlobalFoundries, Inc. (a) | | 3,536,106 | 180,376,767 |
| Marvell Technology, Inc. | | 3,780,764 | 253,235,573 |
| Micron Technology, Inc. | | 730,600 | 80,234,492 |
| NVIDIA Corp. | | 11,064,880 | 1,294,812,258 |
| NXP Semiconductors NV | | 1,075,045 | 282,908,842 |
| ON Semiconductor Corp. (a) | | 3,564,232 | 278,901,154 |
| Taiwan Semiconductor Manufacturing Co. Ltd. | | 4,502,000 | 131,903,100 |
| Xsight Labs Ltd. warrants 1/11/34 (a)(c)(d) | | 27,709 | 58,466 |
| | | | 2,526,168,741 |
TOTAL SEMICONDUCTORS & SEMICONDUCTOR EQUIPMENT | | | 2,688,100,729 |
| Software - 20.1% | | | |
| Application Software - 5.9% | | | |
| Bill Holdings, Inc. (a) | | 459,600 | 22,961,616 |
| Convoy, Inc. warrants (a)(c)(d) | | 5,358 | 0 |
| CoreWeave, Inc. Class A (c) | | 23,100 | 17,972,262 |
| Datadog, Inc. Class A (a) | | 629,188 | 73,262,651 |
| Dynatrace, Inc. (a) | | 796,100 | 34,964,712 |
| HubSpot, Inc. (a) | | 77,903 | 38,720,128 |
| Manhattan Associates, Inc. (a) | | 136,877 | 34,955,648 |
| Palantir Technologies, Inc. Class A (a) | | 468,100 | 12,587,209 |
| Pine Labs Private Ltd. (a)(c)(d) | | 3,660 | 1,180,606 |
| Salesforce, Inc. | | 554,639 | 143,540,573 |
| | | | 380,145,405 |
| Systems Software - 14.2% | | | |
| Microsoft Corp. | | 1,646,800 | 688,938,780 |
| Rubrik, Inc. (b) | | 14,700 | 546,840 |
| ServiceNow, Inc. (a) | | 284,069 | 231,342,953 |
| | | | 920,828,573 |
TOTAL SOFTWARE | | | 1,300,973,978 |
| Technology Hardware, Storage & Peripherals - 20.7% | | | |
| Technology Hardware, Storage & Peripherals - 20.7% | | | |
| Apple, Inc. | | 5,591,216 | 1,241,697,249 |
| Seagate Technology Holdings PLC | | 303,655 | 31,024,431 |
| Western Digital Corp. (a) | | 963,175 | 64,580,884 |
| | | | 1,337,302,564 |
| TOTAL COMMON STOCKS (Cost $2,960,990,289) | | | 6,103,068,722 |
| | | | |
| Convertible Preferred Stocks - 1.2% |
| | | Shares | Value ($) |
| Aerospace & Defense - 0.2% | | | |
| Aerospace & Defense - 0.2% | | | |
| Relativity Space, Inc. Series E (a)(c)(d) | | 482,616 | 10,395,549 |
| Broadline Retail - 0.0% | | | |
| Broadline Retail - 0.0% | | | |
| Meesho: | | | |
| Series E1 (c)(d) | | 3,406 | 189,953 |
| Series F (a)(c)(d) | | 46,600 | 2,644,084 |
| | | | 2,834,037 |
| Consumer Staples Distribution & Retail - 0.0% | | | |
| Food Retail - 0.0% | | | |
| GoBrands, Inc. Series G (a)(c)(d) | | 14,100 | 349,116 |
| Electronic Equipment, Instruments & Components - 0.2% | | | |
| Electronic Equipment & Instruments - 0.1% | | | |
| Enevate Corp. Series E (a)(c)(d) | | 9,477,386 | 6,634,170 |
| Technology Distributors - 0.1% | | | |
| VAST Data Ltd.: | | | |
| Series A (c)(d) | | 30,141 | 525,659 |
| Series A1 (c)(d) | | 74,185 | 1,293,786 |
| Series A2 (c)(d) | | 85,337 | 1,488,277 |
| Series B (c)(d) | | 67,904 | 1,184,246 |
| Series C (c)(d) | | 1,979 | 34,514 |
| Series E (c)(d) | | 64,886 | 1,131,612 |
| | | | 5,658,094 |
TOTAL ELECTRONIC EQUIPMENT, INSTRUMENTS & COMPONENTS | | | 12,292,264 |
| Financial Services - 0.0% | | | |
| Diversified Financial Services - 0.0% | | | |
| Akeana Series C (c)(d) | | 35,600 | 468,852 |
| Tenstorrent Holdings, Inc.: | | | |
| Series C1 (c)(d) | | 12,823 | 952,364 |
| Series D1 (c)(d) | | 10,200 | 804,066 |
| Series D2 (c)(d) | | 4,547 | 345,481 |
| | | | 2,570,763 |
| Hotels, Restaurants & Leisure - 0.0% | | | |
| Casinos & Gaming - 0.0% | | | |
| Discord, Inc. Series I (a)(c)(d) | | 500 | 132,705 |
| Interactive Media & Services - 0.1% | | | |
| Interactive Media & Services - 0.1% | | | |
| ByteDance Ltd. Series E1 (a)(c)(d) | | 26,036 | 5,983,594 |
| Metals & Mining - 0.1% | | | |
| Precious Metals & Minerals - 0.1% | | | |
| Diamond Foundry, Inc. Series C (a)(c)(d) | | 151,757 | 4,179,388 |
| Semiconductors & Semiconductor Equipment - 0.1% | | | |
| Semiconductor Materials & Equipment - 0.0% | | | |
| Sima Technologies, Inc.: | | | |
| Series B (a)(c)(d) | | 231,000 | 1,508,430 |
| Series B1 (a)(c)(d) | | 100,683 | 760,157 |
| | | | 2,268,587 |
| Semiconductors - 0.1% | | | |
| Retym, Inc. Series C (a)(c)(d) | | 139,441 | 1,201,981 |
| Xsight Labs Ltd.: | | | |
| Series D (a)(c)(d) | | 101,300 | 563,228 |
| Series D1 (c)(d) | | 92,364 | 731,523 |
| | | | 2,496,732 |
TOTAL SEMICONDUCTORS & SEMICONDUCTOR EQUIPMENT | | | 4,765,319 |
| Software - 0.5% | | | |
| Application Software - 0.5% | | | |
| Anthropic PBC: | | | |
| Series B (c)(d) | | 190,100 | 5,703,000 |
| Series D (c)(d) | | 195,705 | 5,871,150 |
| Convoy, Inc. Series D (a)(c)(d) | | 81,762 | 1 |
| CoreWeave, Inc. Series C (c)(d) | | 1,482 | 1,191,187 |
| Databricks, Inc.: | | | |
| Series G (a)(c)(d) | | 37,800 | 2,923,452 |
| Series H (a)(c)(d) | | 99,786 | 7,717,449 |
| Series I (c)(d) | | 1,265 | 97,835 |
| Pine Labs Private Ltd.: | | | |
| Series 1 (a)(c)(d) | | 8,747 | 2,821,520 |
| Series A (a)(c)(d) | | 2,186 | 705,138 |
| Series B (a)(c)(d) | | 2,378 | 767,071 |
| Series B2 (a)(c)(d) | | 1,923 | 620,302 |
| Series C (a)(c)(d) | | 3,578 | 1,154,155 |
| Series C1 (a)(c)(d) | | 754 | 243,218 |
| Series D (a)(c)(d) | | 806 | 259,991 |
| | | | 30,075,469 |
| Technology Hardware, Storage & Peripherals - 0.0% | | | |
| Technology Hardware, Storage & Peripherals - 0.0% | | | |
| Lightmatter, Inc.: | | | |
| Series C (a)(c)(d) | | 82,421 | 1,802,547 |
| Series C2 (c)(d) | | 12,946 | 338,020 |
| | | | 2,140,567 |
| TOTAL CONVERTIBLE PREFERRED STOCKS (Cost $79,778,806) | | | 75,718,771 |
| | | | |
| Convertible Bonds - 0.0% |
| | | Principal Amount (e) | Value ($) |
| Software - 0.0% | | | |
| Application Software - 0.0% | | | |
Convoy, Inc. 15% 9/30/26 (c)(d) (Cost $35,680) | | 35,680 | 0 |
| | | | |
| Preferred Securities - 0.0% |
| | | Principal Amount (e) | Value ($) |
| Electronic Equipment, Instruments & Components - 0.0% | | | |
| Electronic Equipment & Instruments - 0.0% | | | |
| Enevate Corp. 6% (c)(d)(f) | | 492,835 | 559,532 |
| Semiconductors & Semiconductor Equipment - 0.0% | | | |
| Semiconductor Materials & Equipment - 0.0% | | | |
| Sima Technologies, Inc. 10% 12/31/27 (c)(d) | | 308,514 | 311,668 |
| TOTAL PREFERRED SECURITIES (Cost $801,349) | | | 871,200 |
| | | | |
| Money Market Funds - 1.0% |
| | | Shares | Value ($) |
| Fidelity Cash Central Fund 5.39% (g) | | 64,883,103 | 64,896,079 |
| Fidelity Securities Lending Cash Central Fund 5.39% (g)(h) | | 1,473,478 | 1,473,625 |
| TOTAL MONEY MARKET FUNDS (Cost $66,369,704) | | | 66,369,704 |
| | | | |
| TOTAL INVESTMENT IN SECURITIES - 96.7% (Cost $3,107,975,828) | 6,246,028,397 |
NET OTHER ASSETS (LIABILITIES) - 3.3% | 212,223,031 |
| NET ASSETS - 100.0% | 6,458,251,428 |
| | |
Legend
| (b) | Security or a portion of the security is on loan at period end. |
| (d) | Restricted securities (including private placements) - Investment in securities not registered under the Securities Act of 1933 (excluding 144A issues). At the end of the period, the value of restricted securities (excluding 144A issues) amounted to $77,829,043 or 1.2% of net assets. |
| (e) | Amount is stated in United States dollars unless otherwise noted. |
| (f) | Security is perpetual in nature with no stated maturity date. |
| (g) | Affiliated fund that is generally available only to investment companies and other accounts managed by Fidelity Investments. The rate quoted is the annualized seven-day yield of the fund at period end. A complete unaudited listing of the fund's holdings as of its most recent quarter end is available upon request. In addition, each Fidelity Central Fund's financial statements, which are not covered by the Fund's Report of Independent Registered Public Accounting Firm, are available on the SEC's website or upon request. |
| (h) | Investment made with cash collateral received from securities on loan. |
| Additional information on each restricted holding is as follows: |
| Security | Acquisition Date | Acquisition Cost ($) |
| Akeana Series C | 1/23/24 | 454,284 |
| | | |
| Anthropic PBC Series B | 3/22/24 | 5,932,010 |
| | | |
| Anthropic PBC Series D | 5/31/24 | 5,872,031 |
| | | |
| ByteDance Ltd. Series E1 | 11/18/20 | 2,852,873 |
| | | |
| Convoy, Inc. Series D | 10/30/19 | 1,107,057 |
| | | |
| Convoy, Inc. warrants | 3/24/23 | 0 |
| | | |
| Convoy, Inc. 15% 9/30/26 | 3/24/23 | 35,680 |
| | | |
| CoreWeave, Inc. Series C | 5/17/24 | 1,154,552 |
| | | |
| Databricks, Inc. Series G | 2/01/21 | 2,234,836 |
| | | |
| Databricks, Inc. Series H | 8/31/21 | 7,332,688 |
| | | |
| Databricks, Inc. Series I | 9/14/23 | 92,978 |
| | | |
| Diamond Foundry, Inc. Series C | 3/15/21 | 3,642,168 |
| | | |
| Discord, Inc. Series I | 9/15/21 | 275,312 |
| | | |
| Enevate Corp. Series E | 1/29/21 | 10,507,436 |
| | | |
| Enevate Corp. 6% | 11/02/23 | 492,835 |
| | | |
| GoBrands, Inc. Series G | 3/02/21 | 3,521,014 |
| | | |
| Lightmatter, Inc. Series C | 5/19/23 | 1,356,386 |
| | | |
| Lightmatter, Inc. Series C2 | 12/18/23 | 336,619 |
| | | |
| Meesho Series E1 | 4/18/24 | 190,736 |
| | | |
| Meesho Series F | 9/21/21 | 3,572,929 |
| | | |
| Pine Labs Private Ltd. | 6/30/21 | 1,364,668 |
| | | |
| Pine Labs Private Ltd. Series 1 | 6/30/21 | 3,261,406 |
| | | |
| Pine Labs Private Ltd. Series A | 6/30/21 | 815,072 |
| | | |
| Pine Labs Private Ltd. Series B | 6/30/21 | 886,661 |
| | | |
| Pine Labs Private Ltd. Series B2 | 6/30/21 | 717,010 |
| | | |
| Pine Labs Private Ltd. Series C | 6/30/21 | 1,334,093 |
| | | |
| Pine Labs Private Ltd. Series C1 | 6/30/21 | 281,136 |
| | | |
| Pine Labs Private Ltd. Series D | 6/30/21 | 300,525 |
| | | |
| Relativity Space, Inc. Series E | 5/27/21 | 11,020,585 |
| | | |
| Retym, Inc. Series C | 5/17/23 - 6/20/23 | 1,085,102 |
| | | |
| Sima Technologies, Inc. Series B | 5/10/21 | 1,184,429 |
| | | |
| Sima Technologies, Inc. Series B1 | 4/25/22 - 10/17/22 | 713,934 |
| | | |
| Sima Technologies, Inc. 10% 12/31/27 | 4/08/24 - 7/05/24 | 308,514 |
| | | |
| Tenstorrent Holdings, Inc. Series C1 | 4/23/21 | 762,398 |
| | | |
| Tenstorrent Holdings, Inc. Series D1 | 7/16/24 | 804,030 |
| | | |
| Tenstorrent Holdings, Inc. Series D2 | 7/17/24 | 345,481 |
| | | |
| VAST Data Ltd. Series A | 11/28/23 | 331,551 |
| | | |
| VAST Data Ltd. Series A1 | 11/28/23 | 816,035 |
| | | |
| VAST Data Ltd. Series A2 | 11/28/23 | 938,707 |
| | | |
| VAST Data Ltd. Series B | 11/28/23 | 746,944 |
| | | |
| VAST Data Ltd. Series C | 11/28/23 | 21,769 |
| | | |
| VAST Data Ltd. Series E | 11/28/23 | 1,427,492 |
| | | |
| Xsight Labs Ltd. warrants 1/11/34 | 1/11/24 | 0 |
| | | |
| Xsight Labs Ltd. Series D | 2/16/21 | 809,995 |
| | | |
| Xsight Labs Ltd. Series D1 | 1/11/24 | 738,543 |
| | | |
Affiliated Central Funds
Fiscal year to date information regarding the Fund's investments in Fidelity Central Funds, including the ownership percentage, is presented below.
| Affiliate | Value, beginning of period ($) | Purchases ($) | Sales Proceeds ($) | Dividend Income ($) | Realized Gain (loss) ($) | Change in Unrealized appreciation (depreciation) ($) | Value, end of period ($) | % ownership, end of period |
| Fidelity Cash Central Fund 5.39% | 12,460,075 | 1,208,507,091 | 1,156,075,722 | 4,346,220 | 4,635 | - | 64,896,079 | 0.1% |
| Fidelity Securities Lending Cash Central Fund 5.39% | 5,023,259 | 206,623,208 | 210,172,842 | 273,490 | - | - | 1,473,625 | 0.0% |
| Total | 17,483,334 | 1,415,130,299 | 1,366,248,564 | 4,619,710 | 4,635 | - | 66,369,704 | |
| | | | | | | | | |
Amounts in the dividend income column in the above table include any capital gain distributions from underlying funds, which are presented in the corresponding line item in the Statement of Operations, if applicable.
Amounts in the dividend income column for Fidelity Securities Lending Cash Central Fund represents the income earned on investing cash collateral, less rebates paid to borrowers and any lending agent fees associated with the loan, plus any premium payments received for lending certain types of securities.
Amounts included in the purchases and sales proceeds columns may include in-kind transactions, if applicable.
Investment Valuation
The following is a summary of the inputs used, as of July 31, 2024, involving the Fund's assets and liabilities carried at fair value. The inputs or methodology used for valuing securities may not be an indication of the risk associated with investing in those securities. For more information on valuation inputs, and their aggregation into the levels used below, please refer to the Investment Valuation section in the accompanying Notes to Financial Statements.
| Valuation Inputs at Reporting Date: |
| Description | Total ($) | Level 1 ($) | Level 2 ($) | Level 3 ($) |
Investments in Securities: | | | | |
|
| Common Stocks | 6,103,068,722 | 5,951,752,486 | 131,903,100 | 19,413,136 |
|
| Convertible Preferred Stocks | 75,718,771 | - | - | 75,718,771 |
|
| Convertible Bonds | - | - | - | - |
|
| Preferred Securities | 871,200 | - | - | 871,200 |
|
| Money Market Funds | 66,369,704 | 66,369,704 | - | - |
| Total Investments in Securities: | 6,246,028,397 | 6,018,122,190 | 131,903,100 | 96,003,107 |
The following is a reconciliation of Investments in Securities for which Level 3 inputs were used in determining value:
| |
| Investments in Securities: | |
| Preferred Stocks | | | |
| Beginning Balance | $ | 74,365,732 | |
| Net Realized Gain (Loss) on Investment Securities | | - | |
| Net Unrealized Gain (Loss) on Investment Securities | | 503,804 | |
| Cost of Purchases | | 20,203,761 | |
| Proceeds of Sales | | - | |
| Amortization/Accretion | | - | |
| Transfers into Level 3 | | - | |
| Transfers out of Level 3 | | (19,354,526) | |
| Ending Balance | $ | 75,718,771 | |
| The change in unrealized gain (loss) for the period attributable to Level 3 securities held at July 31, 2024 | $ | 503,804 | |
| Other Investments in Securities | | | |
| Beginning Balance | $ | 6,662,283 | |
| Net Realized Gain (Loss) on Investment Securities | | (3,985,179) | |
| Net Unrealized Gain (Loss) on Investment Securities | | 13,908,678 | |
| Cost of Purchases | | 7,959,115 | |
| Proceeds of Sales | | (4,260,561) | |
| Amortization/Accretion | | - | |
| Transfers into Level 3 | | - | |
| Transfers out of Level 3 | | - | |
| Ending Balance | $ | 20,284,336 | |
| The change in unrealized gain (loss) for the period attributable to Level 3 securities held at July 31, 2024 | $ | 9,730,234 | |
| The information used in the above reconciliation represents fiscal year to date activity for any Investments in Securities identified as using Level 3 inputs at either the beginning or the end of the current fiscal period. Cost of purchases and proceeds of sales may include securities received and/or delivered through in-kind transactions, corporate actions or exchanges. Transfers into Level 3 were attributable to a lack of observable market data resulting from decreases in market activity, decreases in liquidity, security restructurings or corporate actions. Transfers out of Level 3 were attributable to observable market data becoming available for those securities. Transfers in or out of Level 3 represent the beginning value of any Security or Instrument where a change in the pricing level occurred from the beginning to the end of the period. Realized and unrealized gains (losses) disclosed in the reconciliation are included in Net Gain (Loss) on the Fund's Statement of Operations. | |
Fidelity Advisor® Technology Fund
Financial Statements
| Statement of Assets and Liabilities |
As of July 31, 2024 |
| Assets | | | | |
| Investment in securities, at value (including securities loaned of $1,486,295) - See accompanying schedule: | | | | |
Unaffiliated issuers (cost $3,041,606,124) | $ | 6,179,658,693 | | |
Fidelity Central Funds (cost $66,369,704) | | 66,369,704 | | |
| | | | | |
| | | | | |
| Total Investment in Securities (cost $3,107,975,828) | | | $ | 6,246,028,397 |
| Foreign currency held at value (cost $139) | | | | 138 |
| Receivable for investments sold | | | | 218,637,093 |
| Receivable for fund shares sold | | | | 3,453,357 |
| Dividends receivable | | | | 156,265 |
| Interest receivable | | | | 7,255 |
| Distributions receivable from Fidelity Central Funds | | | | 190,040 |
| Prepaid expenses | | | | 2,847 |
| Other receivables | | | | 168,632 |
Total assets | | | | 6,468,644,024 |
| Liabilities | | | | |
| Payable for fund shares redeemed | $ | 3,833,170 | | |
| Accrued management fee | | 3,628,359 | | |
| Distribution and service plan fees payable | | 1,178,349 | | |
| Other payables and accrued expenses | | 279,093 | | |
| Collateral on securities loaned | | 1,473,625 | | |
| Total liabilities | | | | 10,392,596 |
| Net Assets | | | $ | 6,458,251,428 |
| Net Assets consist of: | | | | |
| Paid in capital | | | $ | 2,903,398,333 |
| Total accumulated earnings (loss) | | | | 3,554,853,095 |
| Net Assets | | | $ | 6,458,251,428 |
| | | | | |
| Net Asset Value and Maximum Offering Price | | | | |
| Class A : | | | | |
Net Asset Value and redemption price per share ($2,469,498,542 ÷ 21,225,473 shares)(a) | | | $ | 116.35 |
| Maximum offering price per share (100/94.25 of $116.35) | | | $ | 123.45 |
| Class M : | | | | |
Net Asset Value and redemption price per share ($778,465,199 ÷ 7,368,045 shares)(a) | | | $ | 105.65 |
| Maximum offering price per share (100/96.50 of $105.65) | | | $ | 109.48 |
| Class C : | | | | |
Net Asset Value and offering price per share ($358,186,222 ÷ 4,210,056 shares)(a) | | | $ | 85.08 |
| Class I : | | | | |
Net Asset Value, offering price and redemption price per share ($2,039,046,099 ÷ 15,512,782 shares) | | | $ | 131.44 |
| Class Z : | | | | |
Net Asset Value, offering price and redemption price per share ($813,055,366 ÷ 6,182,949 shares) | | | $ | 131.50 |
(a)Redemption price per share is equal to net asset value less any applicable contingent deferred sales charge. |
| Statement of Operations |
| Year ended July 31, 2024 |
| Investment Income | | | | |
| Dividends | | | $ | 27,045,620 |
| Interest | | | | 102,344 |
| Income from Fidelity Central Funds (including $273,490 from security lending) | | | | 4,619,710 |
| Total income | | | | 31,767,674 |
| Expenses | | | | |
| Management fee | $ | 32,051,316 | | |
| Transfer agent fees | | 4,387,562 | | |
| Distribution and service plan fees | | 11,825,301 | | |
| Accounting fees | | 569,228 | | |
| Custodian fees and expenses | | 65,433 | | |
| Independent trustees' fees and expenses | | 25,408 | | |
| Registration fees | | 191,782 | | |
| Audit fees | | 75,122 | | |
| Legal | | 5,671 | | |
| Interest | | 2,547 | | |
| Miscellaneous | | 55,965 | | |
| Total expenses before reductions | | 49,255,335 | | |
| Expense reductions | | (326,235) | | |
| Total expenses after reductions | | | | 48,929,100 |
| Net Investment income (loss) | | | | (17,161,426) |
| Realized and Unrealized Gain (Loss) | | | | |
| Net realized gain (loss) on: | | | | |
| Investment Securities: | | | | |
| Unaffiliated issuers | | 576,716,714 | | |
| Redemptions in-kind | | 75,184,814 | | |
| Fidelity Central Funds | | 4,635 | | |
| Foreign currency transactions | | (1,505) | | |
| Total net realized gain (loss) | | | | 651,904,658 |
| Change in net unrealized appreciation (depreciation) on: | | | | |
| Investment Securities: | | | | |
| Unaffiliated issuers | | 699,491,295 | | |
| Assets and liabilities in foreign currencies | | 4,134 | | |
| Total change in net unrealized appreciation (depreciation) | | | | 699,495,429 |
| Net gain (loss) | | | | 1,351,400,087 |
| Net increase (decrease) in net assets resulting from operations | | | $ | 1,334,238,661 |
| Statement of Changes in Net Assets |
| |
| | Year ended July 31, 2024 | | Year ended July 31, 2023 |
| Increase (Decrease) in Net Assets | | | | |
| Operations | | | | |
| Net investment income (loss) | $ | (17,161,426) | $ | (9,304,481) |
| Net realized gain (loss) | | 651,904,658 | | 139,820,713 |
| Change in net unrealized appreciation (depreciation) | | 699,495,429 | | 1,053,544,131 |
| Net increase (decrease) in net assets resulting from operations | | 1,334,238,661 | | 1,184,060,363 |
| Distributions to shareholders | | (196,415,004) | | (117,622,896) |
| | | | | |
| Share transactions - net increase (decrease) | | 200,670,691 | | 221,530,897 |
| Total increase (decrease) in net assets | | 1,338,494,348 | | 1,287,968,364 |
| | | | | |
| Net Assets | | | | |
| Beginning of period | | 5,119,757,080 | | 3,831,788,716 |
| End of period | $ | 6,458,251,428 | $ | 5,119,757,080 |
| | | | | |
| | | | | |
Financial Highlights
Fidelity Advisor® Technology Fund Class A |
| |
| Years ended July 31, | | 2024 | | 2023 | | 2022 | | 2021 | | 2020 |
Selected Per-Share Data | | | | | | | | | | |
| Net asset value, beginning of period | $ | 95.17 | $ | 75.41 | $ | 102.43 | $ | 76.36 | $ | 52.61 |
| Income from Investment Operations | | | | | | | | | | |
Net investment income (loss) A,B | | (.37) | | (.21) | | (.37) | | (.39) | | (.12) |
| Net realized and unrealized gain (loss) | | 25.30 | | 22.28 | | (13.94) | | 33.48 | | 25.35 |
| Total from investment operations | | 24.93 | | 22.07 | | (14.31) | | 33.09 | | 25.23 |
| Distributions from net realized gain | | (3.75) | | (2.31) | | (12.71) | | (7.02) | | (1.48) |
| Total distributions | | (3.75) | | (2.31) | | (12.71) | | (7.02) | | (1.48) |
| Net asset value, end of period | $ | 116.35 | $ | 95.17 | $ | 75.41 | $ | 102.43 | $ | 76.36 |
Total Return C,D | | | | 30.51% | | (16.78)% | | 44.80% | | 48.83% |
Ratios to Average Net Assets B,E,F | | | | | | | | | | |
| Expenses before reductions | | .95% | | .98% | | .97% | | .98% | | 1.01% |
| Expenses net of fee waivers, if any | | | | .98% | | .97% | | .98% | | 1.01% |
| Expenses net of all reductions | | .95% | | .98% | | .97% | | .98% | | 1.01% |
| Net investment income (loss) | | (.37)% | | (.29)% | | (.41)% | | (.43)% | | (.20)% |
| Supplemental Data | | | | | | | | | | |
| Net assets, end of period (000 omitted) | $ | 2,469,499 | $ | 1,906,585 | $ | 1,467,792 | $ | 1,848,643 | $ | 1,339,059 |
Portfolio turnover rate G | | | | 30% | | 20% | | 44% | | 40% H |
ACalculated based on average shares outstanding during the period.
BNet investment income (loss) is affected by the timing of the declaration of dividends by any underlying mutual funds or exchange-traded funds (ETFs). Net investment income (loss) of any mutual funds or ETFs is not included in the Fund's net investment income (loss) ratio.
CTotal returns would have been lower if certain expenses had not been reduced during the applicable periods shown.
DTotal returns do not include the effect of the sales charges.
EFees and expenses of any underlying mutual funds or exchange-traded funds (ETFs) are not included in the Fund's expense ratio. The Fund indirectly bears its proportionate share of these expenses. For additional expense information related to investments in Fidelity Central Funds, please refer to the "Investments in Fidelity Central Funds" note found in the Notes to Financial Statements section of the most recent Annual or Semi-Annual report.
FExpense ratios reflect operating expenses of the class. Expenses before reductions do not reflect amounts reimbursed, waived, or reduced through arrangements with the investment adviser, brokerage services, or other offset arrangements, if applicable, and do not represent the amount paid by the class during periods when reimbursements, waivers or reductions occur.
GAmount does not include the portfolio activity of any underlying mutual funds or exchange-traded funds (ETFs).
HPortfolio turnover rate excludes securities received or delivered in-kind.
Fidelity Advisor® Technology Fund Class M |
| |
| Years ended July 31, | | 2024 | | 2023 | | 2022 | | 2021 | | 2020 |
Selected Per-Share Data | | | | | | | | | | |
| Net asset value, beginning of period | $ | 86.92 | $ | 69.25 | $ | 95.15 | $ | 71.37 | $ | 49.28 |
| Income from Investment Operations | | | | | | | | | | |
Net investment income (loss) A,B | | (.56) | | (.36) | | (.55) | | (.57) | | (.25) |
| Net realized and unrealized gain (loss) | | 23.00 | | 20.34 | | (12.76) | | 31.22 | | 23.71 |
| Total from investment operations | | 22.44 | | 19.98 | | (13.31) | | 30.65 | | 23.46 |
| Distributions from net realized gain | | (3.71) | | (2.31) | | (12.59) | | (6.87) | | (1.37) |
| Total distributions | | (3.71) | | (2.31) | | (12.59) | | (6.87) | | (1.37) |
| Net asset value, end of period | $ | 105.65 | $ | 86.92 | $ | 69.25 | $ | 95.15 | $ | 71.37 |
Total Return C,D | | | | 30.20% | | (16.99)% | | 44.47% | | 48.44% |
Ratios to Average Net Assets B,E,F | | | | | | | | | | |
| Expenses before reductions | | 1.20% | | 1.22% | | 1.21% | | 1.23% | | 1.26% |
| Expenses net of fee waivers, if any | | | | 1.22% | | 1.21% | | 1.23% | | 1.26% |
| Expenses net of all reductions | | 1.19% | | 1.22% | | 1.21% | | 1.22% | | 1.26% |
| Net investment income (loss) | | (.61)% | | (.53)% | | (.65)% | | (.68)% | | (.45)% |
| Supplemental Data | | | | | | | | | | |
| Net assets, end of period (000 omitted) | $ | 778,465 | $ | 624,612 | $ | 484,293 | $ | 624,534 | $ | 464,093 |
Portfolio turnover rate G | | | | 30% | | 20% | | 44% | | 40% H |
ACalculated based on average shares outstanding during the period.
BNet investment income (loss) is affected by the timing of the declaration of dividends by any underlying mutual funds or exchange-traded funds (ETFs). Net investment income (loss) of any mutual funds or ETFs is not included in the Fund's net investment income (loss) ratio.
CTotal returns would have been lower if certain expenses had not been reduced during the applicable periods shown.
DTotal returns do not include the effect of the sales charges.
EFees and expenses of any underlying mutual funds or exchange-traded funds (ETFs) are not included in the Fund's expense ratio. The Fund indirectly bears its proportionate share of these expenses. For additional expense information related to investments in Fidelity Central Funds, please refer to the "Investments in Fidelity Central Funds" note found in the Notes to Financial Statements section of the most recent Annual or Semi-Annual report.
FExpense ratios reflect operating expenses of the class. Expenses before reductions do not reflect amounts reimbursed, waived, or reduced through arrangements with the investment adviser, brokerage services, or other offset arrangements, if applicable, and do not represent the amount paid by the class during periods when reimbursements, waivers or reductions occur.
GAmount does not include the portfolio activity of any underlying mutual funds or exchange-traded funds (ETFs).
HPortfolio turnover rate excludes securities received or delivered in-kind.
Fidelity Advisor® Technology Fund Class C |
| |
| Years ended July 31, | | 2024 | | 2023 | | 2022 | | 2021 | | 2020 |
Selected Per-Share Data | | | | | | | | | | |
| Net asset value, beginning of period | $ | 71.04 | $ | 57.35 | $ | 80.98 | $ | 61.67 | $ | 42.81 |
| Income from Investment Operations | | | | | | | | | | |
Net investment income (loss) A,B | | (.83) | | (.58) | | (.83) | | (.85) | | (.46) |
| Net realized and unrealized gain (loss) | | 18.58 | | 16.58 | | (10.43) | | 26.79 | | 20.52 |
| Total from investment operations | | 17.75 | | 16.00 | | (11.26) | | 25.94 | | 20.06 |
| Distributions from net realized gain | | (3.71) | | (2.31) | | (12.37) | | (6.63) | | (1.20) |
| Total distributions | | (3.71) | | (2.31) | | (12.37) | | (6.63) | | (1.20) |
| Net asset value, end of period | $ | 85.08 | $ | 71.04 | $ | 57.35 | $ | 80.98 | $ | 61.67 |
Total Return C,D | | | | 29.50% | | (17.41)% | | 43.73% | | 47.69% |
Ratios to Average Net Assets B,E,F | | | | | | | | | | |
| Expenses before reductions | | 1.70% | | 1.75% | | 1.73% | | 1.75% | | 1.77% |
| Expenses net of fee waivers, if any | | | | 1.74% | | 1.73% | | 1.74% | | 1.77% |
| Expenses net of all reductions | | 1.70% | | 1.74% | | 1.73% | | 1.74% | | 1.77% |
| Net investment income (loss) | | (1.12)% | | (1.05)% | | (1.17)% | | (1.20)% | | (.96)% |
| Supplemental Data | | | | | | | | | | |
| Net assets, end of period (000 omitted) | $ | 358,186 | $ | 313,457 | $ | 288,008 | $ | 410,661 | $ | 343,585 |
Portfolio turnover rate G | | | | 30% | | 20% | | 44% | | 40% H |
ACalculated based on average shares outstanding during the period.
BNet investment income (loss) is affected by the timing of the declaration of dividends by any underlying mutual funds or exchange-traded funds (ETFs). Net investment income (loss) of any mutual funds or ETFs is not included in the Fund's net investment income (loss) ratio.
CTotal returns would have been lower if certain expenses had not been reduced during the applicable periods shown.
DTotal returns do not include the effect of the contingent deferred sales charge.
EFees and expenses of any underlying mutual funds or exchange-traded funds (ETFs) are not included in the Fund's expense ratio. The Fund indirectly bears its proportionate share of these expenses. For additional expense information related to investments in Fidelity Central Funds, please refer to the "Investments in Fidelity Central Funds" note found in the Notes to Financial Statements section of the most recent Annual or Semi-Annual report.
FExpense ratios reflect operating expenses of the class. Expenses before reductions do not reflect amounts reimbursed, waived, or reduced through arrangements with the investment adviser, brokerage services, or other offset arrangements, if applicable, and do not represent the amount paid by the class during periods when reimbursements, waivers or reductions occur.
GAmount does not include the portfolio activity of any underlying mutual funds or exchange-traded funds (ETFs).
HPortfolio turnover rate excludes securities received or delivered in-kind.
Fidelity Advisor® Technology Fund Class I |
| |
| Years ended July 31, | | 2024 | | 2023 | | 2022 | | 2021 | | 2020 |
Selected Per-Share Data | | | | | | | | | | |
| Net asset value, beginning of period | $ | 107.03 | $ | 84.29 | $ | 112.95 | $ | 83.56 | $ | 57.41 |
| Income from Investment Operations | | | | | | | | | | |
Net investment income (loss) A,B | | (.13) | | (.02) | | (.15) | | (.17) | | .04 |
| Net realized and unrealized gain (loss) | | 28.56 | | 25.07 | | (15.67) | | 36.76 | | 27.72 |
| Total from investment operations | | 28.43 | | 25.05 | | (15.82) | | 36.59 | | 27.76 |
| Distributions from net realized gain | | (4.02) | | (2.31) | | (12.84) | | (7.20) | | (1.61) |
| Total distributions | | (4.02) | | (2.31) | | (12.84) | | (7.20) | | (1.61) |
| Net asset value, end of period | $ | 131.44 | $ | 107.03 | $ | 84.29 | $ | 112.95 | $ | 83.56 |
Total Return C | | | | 30.84% | | (16.56)% | | 45.18% | | 49.22% |
Ratios to Average Net Assets B,D,E | | | | | | | | | | |
| Expenses before reductions | | .70% | | .72% | | .71% | | .72% | | .74% |
| Expenses net of fee waivers, if any | | | | .71% | | .71% | | .72% | | .74% |
| Expenses net of all reductions | | .70% | | .71% | | .71% | | .72% | | .74% |
| Net investment income (loss) | | (.11)% | | (.03)% | | (.15)% | | (.18)% | | .07% |
| Supplemental Data | | | | | | | | | | |
| Net assets, end of period (000 omitted) | $ | 2,039,046 | $ | 1,515,475 | $ | 1,129,418 | $ | 1,470,830 | $ | 1,035,091 |
Portfolio turnover rate F | | | | 30% | | 20% | | 44% | | 40% G |
ACalculated based on average shares outstanding during the period.
BNet investment income (loss) is affected by the timing of the declaration of dividends by any underlying mutual funds or exchange-traded funds (ETFs). Net investment income (loss) of any mutual funds or ETFs is not included in the Fund's net investment income (loss) ratio.
CTotal returns would have been lower if certain expenses had not been reduced during the applicable periods shown.
DFees and expenses of any underlying mutual funds or exchange-traded funds (ETFs) are not included in the Fund's expense ratio. The Fund indirectly bears its proportionate share of these expenses. For additional expense information related to investments in Fidelity Central Funds, please refer to the "Investments in Fidelity Central Funds" note found in the Notes to Financial Statements section of the most recent Annual or Semi-Annual report.
EExpense ratios reflect operating expenses of the class. Expenses before reductions do not reflect amounts reimbursed, waived, or reduced through arrangements with the investment adviser, brokerage services, or other offset arrangements, if applicable, and do not represent the amount paid by the class during periods when reimbursements, waivers or reductions occur.
FAmount does not include the portfolio activity of any underlying mutual funds or exchange-traded funds (ETFs).
GPortfolio turnover rate excludes securities received or delivered in-kind.
Fidelity Advisor® Technology Fund Class Z |
| |
| Years ended July 31, | | 2024 | | 2023 | | 2022 | | 2021 | | 2020 |
Selected Per-Share Data | | | | | | | | | | |
| Net asset value, beginning of period | $ | 107.07 | $ | 84.22 | $ | 112.81 | $ | 83.44 | $ | 57.34 |
| Income from Investment Operations | | | | | | | | | | |
Net investment income (loss) A,B | | .03 | | .08 | | (.04) | | (.06) | | .12 |
| Net realized and unrealized gain (loss) | | 28.54 | | 25.08 | | (15.63) | | 36.72 | | 27.68 |
| Total from investment operations | | 28.57 | | 25.16 | | (15.67) | | 36.66 | | 27.80 |
| Distributions from net realized gain | | (4.14) | | (2.31) | | (12.92) | | (7.29) | | (1.70) |
| Total distributions | | (4.14) | | (2.31) | | (12.92) | | (7.29) | | (1.70) |
| Net asset value, end of period | $ | 131.50 | $ | 107.07 | $ | 84.22 | $ | 112.81 | $ | 83.44 |
Total Return C | | | | 31.00% | | (16.46)% | | 45.37% | | 49.39% |
Ratios to Average Net Assets B,D,E | | | | | | | | | | |
| Expenses before reductions | | .56% | | .60% | | .59% | | .60% | | .62% |
| Expenses net of fee waivers, if any | | | | .59% | | .59% | | .60% | | .62% |
| Expenses net of all reductions | | .56% | | .59% | | .59% | | .60% | | .62% |
| Net investment income (loss) | | .02% | | .09% | | (.04)% | | (.06)% | | .19% |
| Supplemental Data | | | | | | | | | | |
| Net assets, end of period (000 omitted) | $ | 813,055 | $ | 759,629 | $ | 462,278 | $ | 524,383 | $ | 298,255 |
Portfolio turnover rate F | | | | 30% | | 20% | | 44% | | 40% G |
ACalculated based on average shares outstanding during the period.
BNet investment income (loss) is affected by the timing of the declaration of dividends by any underlying mutual funds or exchange-traded funds (ETFs). Net investment income (loss) of any mutual funds or ETFs is not included in the Fund's net investment income (loss) ratio.
CTotal returns would have been lower if certain expenses had not been reduced during the applicable periods shown.
DFees and expenses of any underlying mutual funds or exchange-traded funds (ETFs) are not included in the Fund's expense ratio. The Fund indirectly bears its proportionate share of these expenses. For additional expense information related to investments in Fidelity Central Funds, please refer to the "Investments in Fidelity Central Funds" note found in the Notes to Financial Statements section of the most recent Annual or Semi-Annual report.
EExpense ratios reflect operating expenses of the class. Expenses before reductions do not reflect amounts reimbursed, waived, or reduced through arrangements with the investment adviser, brokerage services, or other offset arrangements, if applicable, and do not represent the amount paid by the class during periods when reimbursements, waivers or reductions occur.
FAmount does not include the portfolio activity of any underlying mutual funds or exchange-traded funds (ETFs).
GPortfolio turnover rate excludes securities received or delivered in-kind.
Fidelity Advisor® Utilities Fund
Schedule of Investments July 31, 2024
Showing Percentage of Net Assets
| Common Stocks - 95.4% |
| | | Shares | Value ($) |
| Electric Utilities - 63.0% | | | |
| Electric Utilities - 63.0% | | | |
| American Electric Power Co., Inc. | | 466,814 | 45,803,790 |
| Constellation Energy Corp. | | 214,665 | 40,743,417 |
| Edison International | | 557,309 | 44,590,293 |
| Entergy Corp. | | 340,600 | 39,499,382 |
| Eversource Energy | | 628,779 | 40,814,045 |
| FirstEnergy Corp. | | 836,168 | 35,043,801 |
| Hawaiian Electric Industries, Inc. | | 704,687 | 11,669,617 |
| NextEra Energy, Inc. | | 1,363,112 | 104,128,127 |
| NRG Energy, Inc. | | 219,454 | 16,496,357 |
| PG&E Corp. | | 2,629,498 | 47,988,339 |
| Pinnacle West Capital Corp. (a) | | 135,800 | 11,623,122 |
| PPL Corp. | | 954,834 | 28,377,666 |
| Southern Co. | | 343,272 | 28,670,077 |
| Xcel Energy, Inc. | | 350,418 | 20,422,361 |
| | | | 515,870,394 |
| Gas Utilities - 2.2% | | | |
| Gas Utilities - 2.2% | | | |
| Southwest Gas Holdings, Inc. (a) | | 105,258 | 7,805,933 |
| UGI Corp. | | 405,571 | 10,050,049 |
| | | | 17,855,982 |
| Independent Power and Renewable Electricity Producers - 7.0% | | | |
| Independent Power Producers & Energy Traders - 4.7% | | | |
| The AES Corp. | | 474,800 | 8,446,692 |
| Vistra Corp. | | 380,035 | 30,106,373 |
| | | | 38,553,065 |
| Renewable Electricity - 2.3% | | | |
| Clearway Energy, Inc. Class A | | 93,226 | 2,296,156 |
| NextEra Energy Partners LP | | 655,018 | 16,735,710 |
| | | | 19,031,866 |
TOTAL INDEPENDENT POWER AND RENEWABLE ELECTRICITY PRODUCERS | | | 57,584,931 |
| Multi-Utilities - 23.0% | | | |
| Multi-Utilities - 23.0% | | | |
| Ameren Corp. | | 252,303 | 20,000,059 |
| CenterPoint Energy, Inc. | | 733,687 | 20,359,814 |
| Consolidated Edison, Inc. | | 92,921 | 9,061,656 |
| Dominion Energy, Inc. | | 279,300 | 14,931,378 |
| NiSource, Inc. | | 812,844 | 25,401,375 |
| Public Service Enterprise Group, Inc. | | 516,596 | 41,208,863 |
| Sempra | | 722,073 | 57,809,164 |
| | | | 188,772,309 |
| Oil, Gas & Consumable Fuels - 0.2% | | | |
| Coal & Consumable Fuels - 0.2% | | | |
| Paladin Energy Ltd. (Australia) (b) | | 227,357 | 1,696,440 |
| TOTAL COMMON STOCKS (Cost $590,628,873) | | | 781,780,056 |
| | | | |
| Money Market Funds - 5.1% |
| | | Shares | Value ($) |
| Fidelity Cash Central Fund 5.39% (c) | | 29,942,686 | 29,948,674 |
| Fidelity Securities Lending Cash Central Fund 5.39% (c)(d) | | 12,139,611 | 12,140,825 |
| TOTAL MONEY MARKET FUNDS (Cost $42,089,499) | | | 42,089,499 |
| | | | |
| TOTAL INVESTMENT IN SECURITIES - 100.5% (Cost $632,718,372) | 823,869,555 |
NET OTHER ASSETS (LIABILITIES) - (0.5)% | (4,152,729) |
| NET ASSETS - 100.0% | 819,716,826 |
| | |
Legend
| (a) | Security or a portion of the security is on loan at period end. |
| (c) | Affiliated fund that is generally available only to investment companies and other accounts managed by Fidelity Investments. The rate quoted is the annualized seven-day yield of the fund at period end. A complete unaudited listing of the fund's holdings as of its most recent quarter end is available upon request. In addition, each Fidelity Central Fund's financial statements, which are not covered by the Fund's Report of Independent Registered Public Accounting Firm, are available on the SEC's website or upon request. |
| (d) | Investment made with cash collateral received from securities on loan. |
Affiliated Central Funds
Fiscal year to date information regarding the Fund's investments in Fidelity Central Funds, including the ownership percentage, is presented below.
| Affiliate | Value, beginning of period ($) | Purchases ($) | Sales Proceeds ($) | Dividend Income ($) | Realized Gain (loss) ($) | Change in Unrealized appreciation (depreciation) ($) | Value, end of period ($) | % ownership, end of period |
| Fidelity Cash Central Fund 5.39% | - | 298,621,380 | 268,672,541 | 411,296 | (165) | - | 29,948,674 | 0.1% |
| Fidelity Securities Lending Cash Central Fund 5.39% | 1,061,200 | 90,881,452 | 79,801,827 | 7,722 | - | - | 12,140,825 | 0.1% |
| Total | 1,061,200 | 389,502,832 | 348,474,368 | 419,018 | (165) | - | 42,089,499 | |
| | | | | | | | | |
Amounts in the dividend income column in the above table include any capital gain distributions from underlying funds, which are presented in the corresponding line item in the Statement of Operations, if applicable.
Amounts in the dividend income column for Fidelity Securities Lending Cash Central Fund represents the income earned on investing cash collateral, less rebates paid to borrowers and any lending agent fees associated with the loan, plus any premium payments received for lending certain types of securities.
Amounts included in the purchases and sales proceeds columns may include in-kind transactions, if applicable.
Investment Valuation
The following is a summary of the inputs used, as of July 31, 2024, involving the Fund's assets and liabilities carried at fair value. The inputs or methodology used for valuing securities may not be an indication of the risk associated with investing in those securities. For more information on valuation inputs, and their aggregation into the levels used below, please refer to the Investment Valuation section in the accompanying Notes to Financial Statements.
| Valuation Inputs at Reporting Date: |
| Description | Total ($) | Level 1 ($) | Level 2 ($) | Level 3 ($) |
Investments in Securities: | | | | |
|
| Common Stocks | 781,780,056 | 781,780,056 | - | - |
|
| Money Market Funds | 42,089,499 | 42,089,499 | - | - |
| Total Investments in Securities: | 823,869,555 | 823,869,555 | - | - |
Fidelity Advisor® Utilities Fund
Financial Statements
| Statement of Assets and Liabilities |
As of July 31, 2024 |
| Assets | | | | |
| Investment in securities, at value (including securities loaned of $11,911,203) - See accompanying schedule: | | | | |
Unaffiliated issuers (cost $590,628,873) | $ | 781,780,056 | | |
Fidelity Central Funds (cost $42,089,499) | | 42,089,499 | | |
| | | | | |
| | | | | |
| Total Investment in Securities (cost $632,718,372) | | | $ | 823,869,555 |
| Receivable for investments sold | | | | 7,784,801 |
| Receivable for fund shares sold | | | | 891,075 |
| Dividends receivable | | | | 237,573 |
| Distributions receivable from Fidelity Central Funds | | | | 81,477 |
| Prepaid expenses | | | | 318 |
Total assets | | | | 832,864,799 |
| Liabilities | | | | |
| Payable for fund shares redeemed | $ | 367,546 | | |
| Accrued management fee | | 444,521 | | |
| Distribution and service plan fees payable | | 143,604 | | |
| Other payables and accrued expenses | | 51,477 | | |
| Collateral on securities loaned | | 12,140,825 | | |
| Total liabilities | | | | 13,147,973 |
| Net Assets | | | $ | 819,716,826 |
| Net Assets consist of: | | | | |
| Paid in capital | | | $ | 599,109,593 |
| Total accumulated earnings (loss) | | | | 220,607,233 |
| Net Assets | | | $ | 819,716,826 |
| | | | | |
| Net Asset Value and Maximum Offering Price | | | | |
| Class A : | | | | |
Net Asset Value and redemption price per share ($348,275,686 ÷ 8,303,281 shares)(a) | | | $ | 41.94 |
| Maximum offering price per share (100/94.25 of $41.94) | | | $ | 44.50 |
| Class M : | | | | |
Net Asset Value and redemption price per share ($70,287,991 ÷ 1,670,730 shares)(a) | | | $ | 42.07 |
| Maximum offering price per share (100/96.50 of $42.07) | | | $ | 43.60 |
| Class C : | | | | |
Net Asset Value and offering price per share ($56,099,622 ÷ 1,374,055 shares)(a) | | | $ | 40.83 |
| Class I : | | | | |
Net Asset Value, offering price and redemption price per share ($270,962,071 ÷ 6,292,663 shares) | | | $ | 43.06 |
| Class Z : | | | | |
Net Asset Value, offering price and redemption price per share ($74,091,456 ÷ 1,721,634 shares) | | | $ | 43.04 |
(a)Redemption price per share is equal to net asset value less any applicable contingent deferred sales charge. |
| Statement of Operations |
| Year ended July 31, 2024 |
| Investment Income | | | | |
| Dividends | | | $ | 21,020,366 |
| Income from Fidelity Central Funds (including $7,722 from security lending) | | | | 419,018 |
| Total income | | | | 21,439,384 |
| Expenses | | | | |
| Management fee | $ | 4,181,712 | | |
| Transfer agent fees | | 670,378 | | |
| Distribution and service plan fees | | 1,617,910 | | |
| Accounting fees | | 127,133 | | |
| Custodian fees and expenses | | 16,184 | | |
| Independent trustees' fees and expenses | | 3,532 | | |
| Registration fees | | 97,814 | | |
| Audit fees | | 50,138 | | |
| Legal | | 1,061 | | |
| Interest | | 13,559 | | |
| Miscellaneous | | 11,767 | | |
| Total expenses before reductions | | 6,791,188 | | |
| Expense reductions | | (43,461) | | |
| Total expenses after reductions | | | | 6,747,727 |
| Net Investment income (loss) | | | | 14,691,657 |
| Realized and Unrealized Gain (Loss) | | | | |
| Net realized gain (loss) on: | | | | |
| Investment Securities: | | | | |
| Unaffiliated issuers | | 37,077,733 | | |
| Fidelity Central Funds | | (165) | | |
| Foreign currency transactions | | 1,328 | | |
| Total net realized gain (loss) | | | | 37,078,896 |
| Change in net unrealized appreciation (depreciation) on: | | | | |
| Investment Securities: | | | | |
| Unaffiliated issuers | | 47,868,926 | | |
| Assets and liabilities in foreign currencies | | 153 | | |
| Total change in net unrealized appreciation (depreciation) | | | | 47,869,079 |
| Net gain (loss) | | | | 84,947,975 |
| Net increase (decrease) in net assets resulting from operations | | | $ | 99,639,632 |
| Statement of Changes in Net Assets |
| |
| | Year ended July 31, 2024 | | Year ended July 31, 2023 |
| Increase (Decrease) in Net Assets | | | | |
| Operations | | | | |
| Net investment income (loss) | $ | 14,691,657 | $ | 15,393,791 |
| Net realized gain (loss) | | 37,078,896 | | 16,244,128 |
| Change in net unrealized appreciation (depreciation) | | 47,869,079 | | (49,018,005) |
| Net increase (decrease) in net assets resulting from operations | | 99,639,632 | | (17,380,086) |
| Distributions to shareholders | | (23,696,221) | | (42,208,285) |
| | | | | |
| Share transactions - net increase (decrease) | | (74,826,763) | | 47,417,119 |
| Total increase (decrease) in net assets | | 1,116,648 | | (12,171,252) |
| | | | | |
| Net Assets | | | | |
| Beginning of period | | 818,600,178 | | 830,771,430 |
| End of period | $ | 819,716,826 | $ | 818,600,178 |
| | | | | |
| | | | | |
Financial Highlights
Fidelity Advisor® Utilities Fund Class A |
| |
| Years ended July 31, | | 2024 | | 2023 | | 2022 | | 2021 | | 2020 |
Selected Per-Share Data | | | | | | | | | | |
| Net asset value, beginning of period | $ | 37.27 | $ | 39.71 | $ | 34.53 | $ | 30.67 | $ | 31.73 |
| Income from Investment Operations | | | | | | | | | | |
Net investment income (loss) A,B | | .75 | | .64 | | .52 | | .56 | | .60 |
| Net realized and unrealized gain (loss) | | 5.18 | | (1.29) | | 5.84 | | 3.98 | | (1.03) |
| Total from investment operations | | 5.93 | | (.65) | | 6.36 | | 4.54 | | (.43) |
| Distributions from net investment income | | (.77) | | (.64) | | (.67) | | (.68) | | (.62) |
| Distributions from net realized gain | | (.49) | | (1.15) | | (.51) | | - | | - C |
| Total distributions | | (1.26) | | (1.79) | | (1.18) | | (.68) | | (.63) D |
| Net asset value, end of period | $ | 41.94 | $ | 37.27 | $ | 39.71 | $ | 34.53 | $ | 30.67 |
Total Return E,F | | | | (1.58)% | | 18.70% | | 14.95% | | (1.56)% |
Ratios to Average Net Assets B,G,H | | | | | | | | | | |
| Expenses before reductions | | 1.01% | | 1.01% | | 1.02% | | 1.05% | | 1.06% |
| Expenses net of fee waivers, if any | | | | 1.01% | | 1.02% | | 1.04% | | 1.06% |
| Expenses net of all reductions | | 1.00% | | 1.01% | | 1.02% | | 1.03% | | 1.05% |
| Net investment income (loss) | | 2.04% | | 1.71% | | 1.41% | | 1.70% | | 1.88% |
| Supplemental Data | | | | | | | | | | |
| Net assets, end of period (000 omitted) | $ | 348,276 | $ | 327,807 | $ | 322,060 | $ | 254,388 | $ | 249,158 |
Portfolio turnover rate I | | | | 66% | | 36% | | 45% | | 80% J |
ACalculated based on average shares outstanding during the period.
BNet investment income (loss) is affected by the timing of the declaration of dividends by any underlying mutual funds or exchange-traded funds (ETFs). Net investment income (loss) of any mutual funds or ETFs is not included in the Fund's net investment income (loss) ratio.
CAmount represents less than $.005 per share.
DTotal distributions per share do not sum due to rounding.
ETotal returns would have been lower if certain expenses had not been reduced during the applicable periods shown.
FTotal returns do not include the effect of the sales charges.
GFees and expenses of any underlying mutual funds or exchange-traded funds (ETFs) are not included in the Fund's expense ratio. The Fund indirectly bears its proportionate share of these expenses. For additional expense information related to investments in Fidelity Central Funds, please refer to the "Investments in Fidelity Central Funds" note found in the Notes to Financial Statements section of the most recent Annual or Semi-Annual report.
HExpense ratios reflect operating expenses of the class. Expenses before reductions do not reflect amounts reimbursed, waived, or reduced through arrangements with the investment adviser, brokerage services, or other offset arrangements, if applicable, and do not represent the amount paid by the class during periods when reimbursements, waivers or reductions occur.
IAmount does not include the portfolio activity of any underlying mutual funds or exchange-traded funds (ETFs).
JPortfolio turnover rate excludes securities received or delivered in-kind.
Fidelity Advisor® Utilities Fund Class M |
| |
| Years ended July 31, | | 2024 | | 2023 | | 2022 | | 2021 | | 2020 |
Selected Per-Share Data | | | | | | | | | | |
| Net asset value, beginning of period | $ | 37.37 | $ | 39.81 | $ | 34.57 | $ | 30.71 | $ | 31.77 |
| Income from Investment Operations | | | | | | | | | | |
Net investment income (loss) A,B | | .66 | | .54 | | .42 | | .47 | | .51 |
| Net realized and unrealized gain (loss) | | 5.20 | | (1.29) | | 5.85 | | 3.99 | | (1.03) |
| Total from investment operations | | 5.86 | | (.75) | | 6.27 | | 4.46 | | (.52) |
| Distributions from net investment income | | (.67) | | (.54) | | (.51) | | (.60) | | (.53) |
| Distributions from net realized gain | | (.49) | | (1.15) | | (.51) | | - | | - C |
| Total distributions | | (1.16) | | (1.69) | | (1.03) D | | (.60) | | (.54) D |
| Net asset value, end of period | $ | 42.07 | $ | 37.37 | $ | 39.81 | $ | 34.57 | $ | 30.71 |
Total Return E,F | | | | (1.85)% | | 18.37% | | 14.63% | | (1.82)% |
Ratios to Average Net Assets B,G,H | | | | | | | | | | |
| Expenses before reductions | | 1.27% | | 1.28% | | 1.30% | | 1.32% | | 1.33% |
| Expenses net of fee waivers, if any | | | | 1.27% | | 1.29% | | 1.32% | | 1.33% |
| Expenses net of all reductions | | 1.27% | | 1.27% | | 1.29% | | 1.31% | | 1.33% |
| Net investment income (loss) | | 1.78% | | 1.45% | | 1.14% | | 1.42% | | 1.60% |
| Supplemental Data | | | | | | | | | | |
| Net assets, end of period (000 omitted) | $ | 70,288 | $ | 68,733 | $ | 71,690 | $ | 58,065 | $ | 58,773 |
Portfolio turnover rate I | | | | 66% | | 36% | | 45% | | 80% J |
ACalculated based on average shares outstanding during the period.
BNet investment income (loss) is affected by the timing of the declaration of dividends by any underlying mutual funds or exchange-traded funds (ETFs). Net investment income (loss) of any mutual funds or ETFs is not included in the Fund's net investment income (loss) ratio.
CAmount represents less than $.005 per share.
DTotal distributions per share do not sum due to rounding.
ETotal returns would have been lower if certain expenses had not been reduced during the applicable periods shown.
FTotal returns do not include the effect of the sales charges.
GFees and expenses of any underlying mutual funds or exchange-traded funds (ETFs) are not included in the Fund's expense ratio. The Fund indirectly bears its proportionate share of these expenses. For additional expense information related to investments in Fidelity Central Funds, please refer to the "Investments in Fidelity Central Funds" note found in the Notes to Financial Statements section of the most recent Annual or Semi-Annual report.
HExpense ratios reflect operating expenses of the class. Expenses before reductions do not reflect amounts reimbursed, waived, or reduced through arrangements with the investment adviser, brokerage services, or other offset arrangements, if applicable, and do not represent the amount paid by the class during periods when reimbursements, waivers or reductions occur.
IAmount does not include the portfolio activity of any underlying mutual funds or exchange-traded funds (ETFs).
JPortfolio turnover rate excludes securities received or delivered in-kind.
Fidelity Advisor® Utilities Fund Class C |
| |
| Years ended July 31, | | 2024 | | 2023 | | 2022 | | 2021 | | 2020 |
Selected Per-Share Data | | | | | | | | | | |
| Net asset value, beginning of period | $ | 36.30 | $ | 38.73 | $ | 33.60 | $ | 29.83 | $ | 30.90 |
| Income from Investment Operations | | | | | | | | | | |
Net investment income (loss) A,B | | .47 | | .35 | | .24 | | .30 | | .35 |
| Net realized and unrealized gain (loss) | | 5.05 | | (1.26) | | 5.67 | | 3.88 | | (1.01) |
| Total from investment operations | | 5.52 | | (.91) | | 5.91 | | 4.18 | | (.66) |
| Distributions from net investment income | | (.50) | | (.37) | | (.27) | | (.41) | | (.40) |
| Distributions from net realized gain | | (.49) | | (1.15) | | (.51) | | - | | - C |
| Total distributions | | (.99) | | (1.52) | | (.78) | | (.41) | | (.41) D |
| Net asset value, end of period | $ | 40.83 | $ | 36.30 | $ | 38.73 | $ | 33.60 | $ | 29.83 |
Total Return E,F | | | | (2.34)% | | 17.78% | | 14.10% | | (2.28)% |
Ratios to Average Net Assets B,G,H | | | | | | | | | | |
| Expenses before reductions | | 1.76% | | 1.77% | | 1.78% | | 1.80% | | 1.81% |
| Expenses net of fee waivers, if any | | | | 1.76% | | 1.78% | | 1.80% | | 1.81% |
| Expenses net of all reductions | | 1.75% | | 1.76% | | 1.78% | | 1.79% | | 1.80% |
| Net investment income (loss) | | 1.30% | | .96% | | .65% | | .94% | | 1.12% |
| Supplemental Data | | | | | | | | | | |
| Net assets, end of period (000 omitted) | $ | 56,100 | $ | 58,042 | $ | 61,087 | $ | 49,312 | $ | 63,458 |
Portfolio turnover rate I | | | | 66% | | 36% | | 45% | | 80% J |
ACalculated based on average shares outstanding during the period.
BNet investment income (loss) is affected by the timing of the declaration of dividends by any underlying mutual funds or exchange-traded funds (ETFs). Net investment income (loss) of any mutual funds or ETFs is not included in the Fund's net investment income (loss) ratio.
CAmount represents less than $.005 per share.
DTotal distributions per share do not sum due to rounding.
ETotal returns would have been lower if certain expenses had not been reduced during the applicable periods shown.
FTotal returns do not include the effect of the contingent deferred sales charge.
GFees and expenses of any underlying mutual funds or exchange-traded funds (ETFs) are not included in the Fund's expense ratio. The Fund indirectly bears its proportionate share of these expenses. For additional expense information related to investments in Fidelity Central Funds, please refer to the "Investments in Fidelity Central Funds" note found in the Notes to Financial Statements section of the most recent Annual or Semi-Annual report.
HExpense ratios reflect operating expenses of the class. Expenses before reductions do not reflect amounts reimbursed, waived, or reduced through arrangements with the investment adviser, brokerage services, or other offset arrangements, if applicable, and do not represent the amount paid by the class during periods when reimbursements, waivers or reductions occur.
IAmount does not include the portfolio activity of any underlying mutual funds or exchange-traded funds (ETFs).
JPortfolio turnover rate excludes securities received or delivered in-kind.
Fidelity Advisor® Utilities Fund Class I |
| |
| Years ended July 31, | | 2024 | | 2023 | | 2022 | | 2021 | | 2020 |
Selected Per-Share Data | | | | | | | | | | |
| Net asset value, beginning of period | $ | 38.22 | $ | 40.68 | $ | 35.39 | $ | 31.40 | $ | 32.47 |
| Income from Investment Operations | | | | | | | | | | |
Net investment income (loss) A,B | | .88 | | .76 | | .64 | | .66 | | .71 |
| Net realized and unrealized gain (loss) | | 5.32 | | (1.33) | | 5.98 | | 4.10 | | (1.07) |
| Total from investment operations | | 6.20 | | (.57) | | 6.62 | | 4.76 | | (.36) |
| Distributions from net investment income | | (.87) | | (.74) | | (.81) | | (.77) | | (.71) |
| Distributions from net realized gain | | (.49) | | (1.15) | | (.51) | | - | | - C |
| Total distributions | | (1.36) | | (1.89) | | (1.33) D | | (.77) | | (.71) |
| Net asset value, end of period | $ | 43.06 | $ | 38.22 | $ | 40.68 | $ | 35.39 | $ | 31.40 |
Total Return E | | | | (1.34)% | | 19.00% | | 15.30% | | (1.30)% |
Ratios to Average Net Assets B,F,G | | | | | | | | | | |
| Expenses before reductions | | .74% | | .75% | | .76% | | .77% | | .79% |
| Expenses net of fee waivers, if any | | | | .74% | | .75% | | .77% | | .78% |
| Expenses net of all reductions | | .73% | | .74% | | .75% | | .76% | | .78% |
| Net investment income (loss) | | 2.31% | | 1.98% | | 1.68% | | 1.97% | | 2.15% |
| Supplemental Data | | | | | | | | | | |
| Net assets, end of period (000 omitted) | $ | 270,962 | $ | 255,201 | $ | 269,667 | $ | 143,582 | $ | 187,833 |
Portfolio turnover rate H | | | | 66% | | 36% | | 45% | | 80% I |
ACalculated based on average shares outstanding during the period.
BNet investment income (loss) is affected by the timing of the declaration of dividends by any underlying mutual funds or exchange-traded funds (ETFs). Net investment income (loss) of any mutual funds or ETFs is not included in the Fund's net investment income (loss) ratio.
CAmount represents less than $.005 per share.
DTotal distributions per share do not sum due to rounding.
ETotal returns would have been lower if certain expenses had not been reduced during the applicable periods shown.
FFees and expenses of any underlying mutual funds or exchange-traded funds (ETFs) are not included in the Fund's expense ratio. The Fund indirectly bears its proportionate share of these expenses. For additional expense information related to investments in Fidelity Central Funds, please refer to the "Investments in Fidelity Central Funds" note found in the Notes to Financial Statements section of the most recent Annual or Semi-Annual report.
GExpense ratios reflect operating expenses of the class. Expenses before reductions do not reflect amounts reimbursed, waived, or reduced through arrangements with the investment adviser, brokerage services, or other offset arrangements, if applicable, and do not represent the amount paid by the class during periods when reimbursements, waivers or reductions occur.
HAmount does not include the portfolio activity of any underlying mutual funds or exchange-traded funds (ETFs).
IPortfolio turnover rate excludes securities received or delivered in-kind.
Fidelity Advisor® Utilities Fund Class Z |
| |
| Years ended July 31, | | 2024 | | 2023 | | 2022 | | 2021 | | 2020 |
Selected Per-Share Data | | | | | | | | | | |
| Net asset value, beginning of period | $ | 38.20 | $ | 40.66 | $ | 35.38 | $ | 31.42 | $ | 32.48 |
| Income from Investment Operations | | | | | | | | | | |
Net investment income (loss) A,B | | .93 | | .81 | | .69 | | .71 | | .74 |
| Net realized and unrealized gain (loss) | | 5.31 | | (1.33) | | 5.98 | | 4.08 | | (1.04) |
| Total from investment operations | | 6.24 | | (.52) | | 6.67 | | 4.79 | | (.30) |
| Distributions from net investment income | | (.92) | | (.79) | | (.88) | | (.83) | | (.75) |
| Distributions from net realized gain | | (.49) | | (1.15) | | (.51) | | - | | - C |
| Total distributions | | (1.40) D | | (1.94) | | (1.39) | | (.83) | | (.76) D |
| Net asset value, end of period | $ | 43.04 | $ | 38.20 | $ | 40.66 | $ | 35.38 | $ | 31.42 |
Total Return E | | | | (1.21)% | | 19.17% | | 15.41% | | (1.15)% |
Ratios to Average Net Assets B,F,G | | | | | | | | | | |
| Expenses before reductions | | .58% | | .62% | | .63% | | .64% | | .65% |
| Expenses net of fee waivers, if any | | | | .62% | | .63% | | .64% | | .65% |
| Expenses net of all reductions | | .57% | | .62% | | .63% | | .63% | | .64% |
| Net investment income (loss) | | 2.48% | | 2.10% | | 1.81% | | 2.10% | | 2.29% |
| Supplemental Data | | | | | | | | | | |
| Net assets, end of period (000 omitted) | $ | 74,091 | $ | 108,817 | $ | 106,266 | $ | 54,746 | $ | 52,034 |
Portfolio turnover rate H | | | | 66% | | 36% | | 45% | | 80% I |
ACalculated based on average shares outstanding during the period.
BNet investment income (loss) is affected by the timing of the declaration of dividends by any underlying mutual funds or exchange-traded funds (ETFs). Net investment income (loss) of any mutual funds or ETFs is not included in the Fund's net investment income (loss) ratio.
CAmount represents less than $.005 per share.
DTotal distributions per share do not sum due to rounding.
ETotal returns would have been lower if certain expenses had not been reduced during the applicable periods shown.
FFees and expenses of any underlying mutual funds or exchange-traded funds (ETFs) are not included in the Fund's expense ratio. The Fund indirectly bears its proportionate share of these expenses. For additional expense information related to investments in Fidelity Central Funds, please refer to the "Investments in Fidelity Central Funds" note found in the Notes to Financial Statements section of the most recent Annual or Semi-Annual report.
GExpense ratios reflect operating expenses of the class. Expenses before reductions do not reflect amounts reimbursed, waived, or reduced through arrangements with the investment adviser, brokerage services, or other offset arrangements, if applicable, and do not represent the amount paid by the class during periods when reimbursements, waivers or reductions occur.
HAmount does not include the portfolio activity of any underlying mutual funds or exchange-traded funds (ETFs).
IPortfolio turnover rate excludes securities received or delivered in-kind.
Notes to Financial Statements
For the period ended July 31, 2024
1. Organization.
Fidelity Advisor Biotechnology Fund, Fidelity Advisor Consumer Discretionary Fund, Fidelity Advisor Energy Fund, Fidelity Advisor Financials Fund, Fidelity Advisor Health Care Fund, Fidelity Advisor Industrials Fund, Fidelity Advisor Semiconductors Fund, Fidelity Advisor Technology Fund and Fidelity Advisor Utilities Fund (the Funds) are funds of Fidelity Advisor Series VII (the Trust) and are authorized to issue an unlimited number of shares. The Trust is registered under the Investment Company Act of 1940, as amended (the 1940 Act), as an open-end management investment company organized as a Massachusetts business trust. The Funds are non-diversified with the exception of Fidelity Advisor Financials Fund and Fidelity Advisor Health Care Fund. Each Fund offers Class A, Class M, Class C, Class I and Class Z shares, each of which has equal rights as to assets and voting privileges. Class A, Class M, Class C, Class I and Class Z are Fidelity Advisor classes. Each class has exclusive voting rights with respect to matters that affect that class. Class C shares will automatically convert to Class A shares after a holding period of eight years from the initial date of purchase, with certain exceptions. Investments in emerging markets, if applicable, can be subject to social, economic, regulatory, and political uncertainties and can be extremely volatile. The financial statements for Fidelity Advisor Health Care Fund have been consolidated to include the Subsidiary accounts (see Consolidated Subsidiary note below).
2. Investments in Fidelity Central Funds.
Funds may invest in Fidelity Central Funds, which are open-end investment companies generally available only to other investment companies and accounts managed by the investment adviser and its affiliates. The Schedule of Investments lists any Fidelity Central Funds held as an investment as of period end, but does not include the underlying holdings of each Fidelity Central Fund. An investing fund indirectly bears its proportionate share of the expenses of the underlying Fidelity Central Funds.
Based on its investment objective, each Fidelity Central Fund may invest or participate in various investment vehicles or strategies that are similar to those of the investing fund. These strategies are consistent with the investment objectives of the investing fund and may involve certain economic risks which may cause a decline in value of each of the Fidelity Central Funds and thus a decline in the value of the investing fund.
| Fidelity Central Fund | Investment Manager | Investment Objective | Investment Practices | Expense RatioA |
| Fidelity Money Market Central Funds | Fidelity Management & Research Company LLC (FMR) | Each fund seeks to obtain a high level of current income consistent with the preservation of capital and liquidity. | Short-term Investments | Less than .005% |
A Expenses expressed as a percentage of average net assets and are as of each underlying Central Fund's most recent annual or semi-annual shareholder report.
A complete unaudited list of holdings for each Fidelity Central Fund is available upon request or at the Securities and Exchange Commission website at www.sec.gov. In addition, the financial statements of the Fidelity Central Funds which contain the significant accounting policies (including investment valuation policies) of those funds, and are not covered by the Report of Independent Registered Public Accounting Firm, are available on the Securities and Exchange Commission website or upon request.
3. Significant Accounting Policies.
Each Fund is an investment company and applies the accounting and reporting guidance of the Financial Accounting Standards Board (FASB) Accounting Standards Codification Topic 946 Financial Services - Investment Companies. The financial statements have been prepared in conformity with accounting principles generally accepted in the United States of America (GAAP), which require management to make certain estimates and assumptions at the date of the financial statements. Actual results could differ from those estimates. Subsequent events, if any, through the date that the financial statements were issued have been evaluated in the preparation of the financial statements. Each Fund's Schedule of Investments lists any underlying mutual funds or exchange-traded funds (ETFs) but does not include the underlying holdings of these funds. The following summarizes the significant accounting policies of each Fund:
Investment Valuation. Investments are valued as of 4:00 p.m. Eastern time on the last calendar day of the period. The Board of Trustees (the Board) has designated each Fund's investment adviser as the valuation designee responsible for the fair valuation function and performing fair value determinations as needed. The investment adviser has established a Fair Value Committee (the Committee) to carry out the day-to-day fair valuation responsibilities and has adopted policies and procedures to govern the fair valuation process and the activities of the Committee. In accordance with these fair valuation policies and procedures, which have been approved by the Board, each Fund attempts to obtain prices from one or more third party pricing services or brokers to value its investments. When current market prices, quotations or currency exchange rates are not readily available or reliable, investments will be fair valued in good faith by the Committee, in accordance with the policies and procedures. Factors used in determining fair value vary by investment type and may include market or investment specific events, transaction data, estimated cash flows, and market observations of comparable investments. The frequency that the fair valuation procedures are used cannot be predicted and they may be utilized to a significant extent. The Committee manages each Fund's fair valuation practices and maintains the fair valuation policies and procedures. Each Fund's investment adviser reports to the Board information regarding the fair valuation process and related material matters.
Each Fund categorizes the inputs to valuation techniques used to value its investments into a disclosure hierarchy consisting of three levels as shown below:
Level 1 - unadjusted quoted prices in active markets for identical investments
Level 2 - other significant observable inputs (including quoted prices for similar investments, interest rates, prepayment speeds, etc.)
Level 3 - unobservable inputs (including the Fund's own assumptions based on the best information available)
Valuation techniques used to value each Fund's investments by major category are as follows:
Equity securities, including restricted securities, for which market quotations are readily available, are valued at the last reported sale price or official closing price as reported by a third party pricing service on the primary market or exchange on which they are traded and are categorized as Level 1 in the hierarchy. In the event there were no sales during the day or closing prices are not available, securities are valued at the last quoted bid price or may be valued using the last available price and are generally categorized as Level 2 in the hierarchy. For foreign equity securities, when market or security specific events arise, comparisons to the valuation of American Depositary Receipts (ADRs), futures contracts, Exchange-Traded Funds (ETFs) and certain indexes as well as quoted prices for similar securities may be used and would be categorized as Level 2 in the hierarchy. For equity securities, including restricted securities, where observable inputs are limited, assumptions about market activity and risk are used and these securities may be categorized as Level 3 in the hierarchy. Securities, including private placements or other restricted securities, for which observable inputs are not available are valued using alternate valuation approaches, including the market approach, the income approach and cost approach, and are categorized as Level 3 in the hierarchy. The market approach considers factors including the price of recent investments in the same or a similar security or financial metrics of comparable securities. The income approach considers factors including expected future cash flows, security specific risks and corresponding discount rates. The cost approach considers factors including the value of the security's underlying assets and liabilities.
Debt securities, including restricted securities, are valued based on evaluated prices received from third party pricing services or from brokers who make markets in such securities. Corporate bonds and preferred securities are valued by pricing services who utilize matrix pricing which considers yield or price of bonds of comparable quality, coupon, maturity and type or by broker-supplied prices. When independent prices are unavailable or unreliable, debt securities may be valued utilizing pricing methodologies which consider similar factors that would be used by third party pricing services. Debt securities are generally categorized as Level 2 in the hierarchy but may be Level 3 depending on the circumstances.
Investments in open-end mutual funds, including the Fidelity Central Funds, are valued at their closing net asset value (NAV) each business day and are categorized as Level 1 in the hierarchy.
The following provides information on Level 3 securities held by the Fund that were valued at period end based on unobservable inputs. These amounts exclude valuations provided by a broker.
Fidelity Advisor Biotechnology Fund
| Asset Type | Fair Value | Valuation Technique(s) | Unobservable Input | Amount or Range/Weighted Average | Impact to Valuation from an Increase in InputA |
| Equities | $32,893,624 | Recovery value | Recovery value | $0.00 | Increase |
| | | Market approach | Transaction price | $1.13 - $8.61 / $4.17 | Increase |
| | | | Discount rate | 30.0% - 75.0% / 51.3% | Decrease |
| | | | Premium rate | 10.0% - 20.0% / 14.8% | Increase |
| | | Discounted cash flow | Discount rate | 5.1% - 6.1% / 5.4% | Decrease |
| | | | Probability rate | 0.0% - 90.0% / 45.0% | Increase |
| | | | Term | 0.2 - 6.9 / 3.9 | Increase |
| | | Black scholes | Discount rate | 4.2% | Increase |
| | | | Volatility | 75.0% - 90.0% / 82.4% | Increase |
| | | | Term | 3.0 | Increase |
| Corporate Bonds | $850,350 | Market approach | Transaction price | $100.00 | Increase |
| | | | Discount rate | 23.5% | Decrease |
| | | | Probability rate | 0.0% - 33.3% / 16.7% | Increase |
A Represents the directional change in the fair value of the Level 3 investments that could have resulted from an increase in the corresponding input as of period end. A decrease to the unobservable input would have had the opposite effect. Significant changes in these inputs may have resulted in a significantly higher or lower fair value measurement at period end.
Fidelity Advisor Health Care Fund
| Asset Type | Fair Value | Valuation Technique(s) | Unobservable Input | Amount or Range/Weighted Average | Impact to Valuation from an Increase in InputA |
| Equities | $77,407,800 | Market approach | Transaction price | $6.52 - $33.33 / $13.79 | Increase |
| | | | Discount rate | 10.0% - 70.0% / 23.1% | Decrease |
| | | | Premium rate | 10.0% | Increase |
| | | Market comparable | Enterprise value/Revenue multiple (EV/R) | 2.1 - 14.5 / 5.0 | Increase |
| | | Black scholes | Discount rate | 4.1% - 4.6% / 4.3% | Increase |
| | | | Volatility | 45.0% - 90.0% / 66.0% | Increase |
| | | | Term | 1.5 - 5.0 / 3.1 | Increase |
| Corporate Bonds | $3,643,149 | Market approach | Transaction price | $100.00 | Increase |
| | | | Discount rate | 23.5% | Decrease |
| | | | Probability rate | 0.0% - 33.3% / 16.7% | Increase |
| | | Market comparable | Enterprise value/Revenue multiple (EV/R) | 7.0 | Increase |
| | | | Discount rate | 25.0% | Decrease |
| | | | Probability rate | 0.0% - 25.0% / 13.8% | Increase |
| | | Black scholes | Discount rate | 4.8% | Increase |
| | | | Volatility | 55.0% | Increase |
| | | | Term | 1.1 | Increase |
| Preferred Securities | $7,682,374 | Market approach | Transaction price | $100.00 | Increase |
| | | | Discount rate | 33.9% | Decrease |
| | | | Probability rate | 0.0% - 50.0% / 25.0% | Increase |
| | | Black scholes | Discount rate | 4.3% | Increase |
| | | | Volatility | 70.0% | Increase |
| | | | Term | 2.4 | Increase |
A Represents the directional change in the fair value of the Level 3 investments that could have resulted from an increase in the corresponding input as of period end. A decrease to the unobservable input would have had the opposite effect. Significant changes in these inputs may have resulted in a significantly higher or lower fair value measurement at period end.
Fidelity Advisor Technology Fund
| Asset Type | Fair Value | Valuation Technique(s) | Unobservable Input | Amount or Range/Weighted Average | Impact to Valuation from an Increase in InputA |
| Equities | $95,131,907 | Recovery value | Recovery value | $0.00 | Increase |
| | | Market approach | Transaction price | $1.10 - $8.00 / $3.33 | Increase |
| | | | Discount rate | 75.0% | Decrease |
| | | | Premium rate | 10.0% - 30.0% / 22.5% | Increase |
| | | Market comparable | Enterprise value/Revenue multiple (EV/R) | 0.8 - 49.0 / 13.9 | Increase |
| | | Discounted cash flow | Weighted average cost of capital (WACC) | 30.6% | Decrease |
| | | | Yield | 33.0% | Decrease |
| | | | Exit multiple | 1.5 | Increase |
| | | Black scholes | Discount rate | 4.1% - 5.0% / 4.2% | Increase |
| | | | Volatility | 40.0% - 100.0% / 76.7% | Increase |
| | | | Term | 0.7 - 5.0 / 3.7 | Increase |
| Corporate Bonds | $- | Recovery value | Recovery value | $0.00 | Increase |
| Preferred Securities | $871,200 | Market approach | Transaction price | $100.00 | Increase |
| | | | Discount rate | 35.4% - 37.9% / 36.2% | Decrease |
| | | | Probability rate | 0.0% - 60.0% / 34.5% | Increase |
| | | Black scholes | Discount rate | 4.9% - 5.4% / 5.2% | Increase |
| | | | Volatility | 50.0% - 100.0% / 82.1% | Increase |
| | | | Term | 0.3 - 0.9 / 0.5 | Increase |
A Represents the directional change in the fair value of the Level 3 investments that could have resulted from an increase in the corresponding input as of period end. A decrease to the unobservable input would have had the opposite effect. Significant changes in these inputs may have resulted in a significantly higher or lower fair value measurement at period end.
Changes in valuation techniques may result in transfers in or out of an assigned level within the disclosure hierarchy. The aggregate value of investments by input level as of July 31, 2024, as well as a roll forward of Level 3 investments, is included at the end of each Fund's Schedule of Investments.
Foreign Currency. Certain Funds may use foreign currency contracts to facilitate transactions in foreign-denominated securities. Gains and losses from these transactions may arise from changes in the value of the foreign currency or if the counterparties do not perform under the contracts' terms.
Foreign-denominated assets, including investment securities, and liabilities are translated into U.S. dollars at the exchange rates at period end. Purchases and sales of investment securities, income and dividends received, and expenses denominated in foreign currencies are translated into U.S. dollars at the exchange rate in effect on the transaction date.
The effects of exchange rate fluctuations on investments are included with the net realized and unrealized gain (loss) on investment securities. Other foreign currency transactions resulting in realized and unrealized gain (loss) are disclosed separately.
Investment Transactions and Income. For financial reporting purposes, the Funds' investment holdings and NAV include trades executed through the end of the last business day of the period. The NAV per share for processing shareholder transactions is calculated as of the close of business of the New York Stock Exchange (NYSE), normally 4:00 p.m. Eastern time and includes trades executed through the end of the prior business day. Gains and losses on securities sold are determined on the basis of identified cost and for certain Funds include proceeds received from litigation. Commissions paid to certain brokers with whom the investment adviser, or its affiliates, places trades on behalf of a fund include an amount in addition to trade execution, which may be rebated back to a fund. Any such rebates are included in net realized gain (loss) on investments in the Statement of Operations. Dividend income is recorded on the ex-dividend date, except for certain dividends from foreign securities where the ex-dividend date may have passed, which are recorded as soon as the Funds are informed of the ex-dividend date. Non-cash dividends included in dividend income, if any, are recorded at the fair market value of the securities received. Income and capital gain distributions from Fidelity Central Funds, if any, are recorded on the ex-dividend date. Certain distributions received by the Funds represent a return of capital or capital gain. The Funds determine the components of these distributions subsequent to the ex-dividend date, based upon receipt of tax filings or other correspondence relating to the underlying investment. These distributions are recorded as a reduction of cost of investments and/or as a realized gain. Large, non-recurring dividends recognized by the Funds are presented separately on the Statement of Operations as "Special Dividends" and the impact of these dividends is presented in the Financial Highlights. Interest income is accrued as earned and includes coupon interest and amortization of premium and accretion of discount on debt securities as applicable. Investment income is recorded net of foreign taxes withheld where recovery of such taxes is uncertain. Funds may file withholding tax reclaims in certain jurisdictions to recover a portion of amounts previously withheld. Any withholding tax reclaims income is included in the Statement of Operations in dividends. Any receivables for withholding tax reclaims are included in the Statement of Assets and Liabilities in dividends receivable.
Class Allocations and Expenses. Investment income, realized and unrealized capital gains and losses, common expenses of a fund, and certain fund-level expense reductions, if any, are allocated daily on a pro-rata basis to each class based on the relative net assets of each class to the total net assets of a fund. Each class differs with respect to transfer agent and distribution and service plan fees incurred, as applicable. Certain expense reductions may also differ by class, if applicable. For the reporting period, the allocated portion of income and expenses to each class as a percent of its average net assets may vary due to the timing of recording these transactions in relation to fluctuating net assets of the classes. Expenses directly attributable to a fund are charged to that fund. Expenses attributable to more than one fund are allocated among the respective funds on the basis of relative net assets or other appropriate methods. Expenses included in the accompanying financial statements reflect the expenses of that fund and do not include any expenses associated with any underlying mutual funds or exchange-traded funds (ETFs). Although not included in a fund's expenses, a fund indirectly bears its proportionate share of these expenses through the net asset value of each underlying mutual fund or exchange-traded fund (ETF). Expense estimates are accrued in the period to which they relate and adjustments are made when actual amounts are known.
Deferred Trustee Compensation. Under a Deferred Compensation Plan (the Plan) for certain Funds, certain independent Trustees have elected to defer receipt of a portion of their annual compensation. Deferred amounts are invested in affiliated mutual funds, are marked-to-market and remain in a fund until distributed in accordance with the Plan. The investment of deferred amounts and the offsetting payable to the Trustees presented below are included in the accompanying Statement of Assets and Liabilities in other receivables and other payables and accrued expenses, as applicable.
| Fidelity Advisor Energy Fund | 104,447 |
| Fidelity Advisor Technology Fund | 167,708 |
Income Tax Information and Distributions to Shareholders. Each year, each Fund intends to qualify as a regulated investment company under Subchapter M of the Internal Revenue Code, including distributing substantially all of its taxable income and realized gains. As a result, no provision for U.S. Federal income taxes is required. As of July 31, 2024, each Fund did not have any unrecognized tax benefits in the financial statements; nor is each Fund aware of any tax positions for which it is reasonably possible that the total amounts of unrecognized tax benefits will significantly change in the next twelve months. Each Fund files a U.S. federal tax return, in addition to state and local tax returns as required. Each Fund's federal income tax returns are subject to examination by the Internal Revenue Service (IRS) for a period of three fiscal years after they are filed. State and local tax returns may be subject to examination for an additional fiscal year depending on the jurisdiction. Foreign taxes are provided for based on each Fund's understanding of the tax rules and rates that exist in the foreign markets in which it invests.
Distributions are declared and recorded on the ex-dividend date. Income and capital gain distributions are declared separately for each class. Income and capital gain distributions are determined in accordance with income tax regulations, which may differ from GAAP. In addition, certain Funds claimed a portion of the payment made to redeeming shareholders as a distribution for income tax purposes.
Capital accounts within the financial statements are adjusted for permanent book-tax differences. These adjustments have no impact on net assets or the results of operations. Capital accounts are not adjusted for temporary book-tax differences which will reverse in a subsequent period.
Book-tax differences are primarily due to foreign currency transactions, certain foreign taxes, passive foreign investment companies (PFIC), redemptions in-kind, partnerships, deferred Trustee compensation, net operating losses, capital loss carryforwards and losses deferred due to wash sales and excise tax regulations.
As of period end, the cost and unrealized appreciation (depreciation) in securities, and derivatives if applicable, for federal income tax purposes were as follows for each Fund:
| | Tax cost ($) | Gross unrealized appreciation ($) | Gross unrealized depreciation ($) | Net unrealized appreciation (depreciation)($) |
| Fidelity Advisor Biotechnology Fund | 1,305,775,580 | 725,523,655 | (66,024,298) | 659,499,357 |
Fidelity Advisor Consumer Discretionary Fund | 253,512,562 | 239,999,068 | (13,331,256) | 226,667,812 |
| Fidelity Advisor Energy Fund | 772,877,007 | 561,892,458 | (4,926,782) | 556,965,676 |
| Fidelity Advisor Financials Fund | 375,843,263 | 145,409,954 | (7,144,794) | 138,265,160 |
| Fidelity Advisor Health Care Fund | 3,110,085,187 | 1,996,996,850 | (290,373,740) | 1,706,623,110 |
| Fidelity Advisor Industrials Fund | 421,337,382 | 170,841,199 | (2,276,744) | 168,564,455 |
Fidelity Advisor Semiconductors Fund | 1,509,671,774 | 1,203,634,313 | (63,435,788) | 1,140,198,525 |
| Fidelity Advisor Technology Fund | 3,118,296,136 | 3,282,184,118 | (154,451,857) | 3,127,732,261 |
| Fidelity Advisor Utilities Fund | 635,243,580 | 201,242,305 | (12,616,330) | 188,625,975 |
The tax-based components of distributable earnings as of period end were as follows for each Fund:
| | Undistributed ordinary income ($) | Undistributed long-term capital gain ($) | Capital loss carryforward ($) | Net unrealized appreciation (depreciation) on securities and other investments ($) |
| Fidelity Advisor Biotechnology Fund | 43,234,394 | 14,352,112 | - | 659,499,761 |
Fidelity Advisor Consumer Discretionary Fund | - | 19,002,180 | - | 226,666,881 |
| Fidelity Advisor Energy Fund | - | - | (191,455,812) | 555,264,959 |
| Fidelity Advisor Financials Fund | 3,603,126 | 5,974,438 | - | 138,265,160 |
| Fidelity Advisor Health Care Fund | - | 274,359,969 | - | 1,706,662,172 |
| Fidelity Advisor Industrials Fund | 901,577 | 10,389,773 | - | 168,564,455 |
Fidelity Advisor Semiconductors Fund | - | 107,753,073 | - | 1,140,198,525 |
| Fidelity Advisor Technology Fund | 5,365,610 | 439,024,533 | - | 3,127,732,605 |
| Fidelity Advisor Utilities Fund | 482,686 | 31,498,566 | - | 188,625,979 |
Capital loss carryforwards are only available to offset future capital gains of the Funds to the extent provided by regulations and may be limited. The capital loss carryforward information presented below, including any applicable limitation, is estimated as of fiscal period end and is subject to adjustment.
| | Short-term ($) | Total capital loss carryforward ($) |
| Fidelity Advisor Energy Fund | (191,455,812) | (191,455,812) |
Certain of the Funds intend to elect to defer to the next fiscal year ordinary losses recognized during the period January 1, 2024 to July 31, 2024. Loss deferrals were as follows:
| | Ordinary losses ($) |
| Fidelity Advisor Consumer Discretionary Fund | (563,892) |
| Fidelity Advisor Health Care Fund | (6,688,745) |
| Fidelity Advisor Semiconductors Fund | (4,933,502) |
| Fidelity Advisor Technology Fund | (17,165,728) |
The tax character of distributions paid was as follows:
| July 31, 2024 | | | |
| | Ordinary Income ($) | Long-term Capital Gains ($) | Total ($) |
| Fidelity Advisor Biotechnology Fund | 18,817,060 | - | 18,817,060 |
| Fidelity Advisor Energy Fund | 23,514,383 | - | 23,514,383 |
| Fidelity Advisor Financials Fund | 8,982,095 | - | 8,982,095 |
| Fidelity Advisor Industrials Fund | 555,876 | 39,214,486 | 39,770,362 |
Fidelity Advisor Semiconductors Fund | - | 51,832,290 | 51,832,290 |
| Fidelity Advisor Technology Fund | 7,387,545 | 189,027,459 | 196,415,004 |
| Fidelity Advisor Utilities Fund | 14,670,139 | 9,026,082 | 23,696,221 |
| July 31, 2023 | | | |
| | Ordinary Income ($) | Long-term Capital Gains ($) | Total ($) |
Fidelity Advisor Consumer Discretionary Fund | - | 17,163,089 | 17,163,089 |
| Fidelity Advisor Energy Fund | 33,434,847 | - | 33,434,847 |
| Fidelity Advisor Financials Fund | 9,591,816 | 21,193,635 | 30,785,451 |
| Fidelity Advisor Industrials Fund | 508,799 | 17,041,143 | 17,549,942 |
Fidelity Advisor Semiconductors Fund | - | 22,158,679 | 22,158,679 |
| Fidelity Advisor Technology Fund | - | 117,622,896 | 117,622,896 |
| Fidelity Advisor Utilities Fund | 15,146,470 | 27,061,815 | 42,208,285 |
Restricted Securities (including Private Placements). Funds may invest in securities that are subject to legal or contractual restrictions on resale. These securities generally may be resold in transactions exempt from registration or to the public if the securities are registered. Disposal of these securities may involve time-consuming negotiations and expense, and prompt sale at an acceptable price may be difficult. Information regarding restricted securities held at period end is included at the end of the Schedule of Investments, if applicable.
Consolidated Subsidiary. The Funds included in the table below hold certain investments through a wholly-owned subsidiary ("Subsidiary"), which may be subject to federal and state taxes upon disposition.
As of period end, investments in Subsidiaries were as follows:
| | Amount ($) | % of Net Assets |
| Fidelity Advisor Health Care Fund | 3,252,979 | .07 |
The financial statements have been consolidated to include the Subsidiary accounts where applicable. Accordingly, all inter-company transactions and balances have been eliminated.
At period end, any estimated tax liability for these investments is presented as "Deferred taxes" in the Consolidated Statement of Assets and Liabilities and included in "Change in net unrealized appreciation (depreciation) on investment securities" in the Consolidated Statement of Operations. The tax liability incurred may differ materially depending on conditions when these investments are disposed. Any cash held by a Subsidiary is restricted as to its use and is presented as "Restricted cash" in the Consolidated Statement of Assets and Liabilities, if applicable.
Commitments. A commitment is an agreement to acquire an investment at a future date (subject to conditions) in connection with a potential public or non-public offering. Commitments outstanding at period end are presented in the table below. Unrealized appreciation (depreciation) on any commitments outstanding at period end is separately presented in the Statement of Assets and Liabilities as Unrealized appreciation (depreciation) on unfunded commitments, and any change in unrealized appreciation (depreciation) on unfunded commitments during the period is separately presented in the Statement of Operations, as applicable based on contractual conditions of each commitment.
| | Investment to be Acquired | Commitment Amount ($) | Unrealized Appreciation (Depreciation)($) |
| Fidelity Advisor Biotechnology Fund | Oruka Therapeutics, Inc. | 4,000,000 | 2,795,057 |
| Fidelity Advisor Health Care Fund | Oruka Therapeutics, Inc. | 5,444,502 | 3,804,424 |
4. Purchases and Sales of Investments.
Purchases and sales of securities, other than short-term securities and in-kind transactions, as applicable, are noted in the table below.
| | Purchases ($) | Sales ($) |
| Fidelity Advisor Biotechnology Fund | 1,159,135,466 | 1,391,211,646 |
| Fidelity Advisor Consumer Discretionary Fund | 117,892,311 | 182,819,440 |
| Fidelity Advisor Energy Fund | 399,357,174 | 488,823,392 |
| Fidelity Advisor Financials Fund | 191,848,601 | 242,820,662 |
| Fidelity Advisor Health Care Fund | 1,809,052,848 | 3,132,822,673 |
| Fidelity Advisor Industrials Fund | 150,732,874 | 227,331,372 |
| Fidelity Advisor Semiconductors Fund | 1,097,168,383 | 554,923,226 |
| Fidelity Advisor Technology Fund | 1,843,143,251 | 1,944,067,982 |
| Fidelity Advisor Utilities Fund | 592,475,937 | 702,711,612 |
Unaffiliated Redemptions In-Kind. Shares that were redeemed in-kind for investments, including accrued interest and cash, if any, are shown in the table below. The net realized gain or loss on investments delivered through in-kind redemptions is included in the "Net realized gain (loss) on: Redemptions in-kind" line in the accompanying Statement of Operations. The amount of the in-kind redemptions is included in share transactions in the accompanying Statement of Changes in Net Assets. There was no gain or loss for federal income tax purposes.
| | Shares | Total net realized gain or loss ($) | Total Proceeds ($) |
| Fidelity Advisor Consumer Discretionary Fund | 493,122 | 15,311,646 | 19,147,937 |
| Fidelity Advisor Energy Fund | 1,253,395 | 42,342,401 | 57,668,686 |
| Fidelity Advisor Financials Fund | 629,921 | 7,051,602 | 15,955,906 |
| Fidelity Advisor Industrials Fund | 553,097 | 11,201,399 | 22,245,575 |
| Fidelity Advisor Technology Fund | 1,690,112 | 75,184,814 | 169,535,169 |
Prior Fiscal Year Unaffiliated Redemptions In-Kind. Shares that were redeemed in-kind for investments, including accrued interest and cash, if any, are shown in the table below; along with realized gain or loss on investments delivered through in-kind redemptions. The amount of the in-kind redemptions is included in share transactions in the accompanying Statement of Changes in Net Assets. There was no gain or loss for federal income tax purposes.
| | Shares | Total net realized gain or loss ($) | Total Proceeds ($) |
| Fidelity Advisor Industrials Fund | 634,301 | 16,690,939 | 26,323,494 |
5. Fees and Other Transactions with Affiliates.
Management Fee. Fidelity Management & Research Company LLC (the investment adviser) and its affiliates provide the Funds with investment management related services for which each Fund pays a monthly management fee.
Effective March 1, 2024, each Fund's management contract was amended to incorporate administrative services previously covered under separate services agreements (Transfer Agent and Accounting agreements). The amended contract incorporates a management fee rate that may vary by class. The investment adviser or an affiliate pays certain expenses of managing and operating each Fund out of each class's management fee. Each class of each Fund pays a management fee to the investment adviser. The management fee is calculated and paid to the investment adviser every month. When determining a class's management fee, a mandate rate is calculated based on the monthly average net assets of a group of funds advised by FMR within a designated asset class. A discount rate is subtracted from the mandate rate once each Fund's monthly average net assets reach a certain level. The mandate rate and discount rate may vary by class. The annual management fee rate for a class of shares of each Fund is the lesser of (1) the class's mandate rate reduced by the class's discount rate (if applicable) or (2) the amount set forth in the following table.
| | Maximum Management Fee Rate % |
| Fidelity Advisor Biotechnology Fund | |
| Class A | .71 |
| Class M | .72 |
| Class C | .72 |
| Class I | .69 |
| Class Z | .56 |
| Fidelity Advisor Consumer Discretionary Fund | |
| Class A | .70 |
| Class M | .72 |
| Class C | .71 |
| Class I | .69 |
| Class Z | .56 |
| Fidelity Advisor Energy Fund | |
| Class A | .72 |
| Class M | .72 |
| Class C | .71 |
| Class I | .69 |
| Class Z | .56 |
| Fidelity Advisor Financials Fund | |
| Class A | .72 |
| Class M | .71 |
| Class C | .71 |
| Class I | .69 |
| Class Z | .56 |
| Fidelity Advisor Health Care Fund | |
| Class A | .69 |
| Class M | .69 |
| Class C | .69 |
| Class I | .68 |
| Class Z | .55 |
| Fidelity Advisor Industrials Fund | |
| Class A | .70 |
| Class M | .70 |
| Class C | .71 |
| Class I | .68 |
| Class Z | .56 |
| Fidelity Advisor Semiconductors Fund | |
| Class A | .69 |
| Class M | .68 |
| Class C | .70 |
| Class I | .69 |
| Class Z | .56 |
| Fidelity Advisor Technology Fund | |
| Class A | .68 |
| Class M | .67 |
| Class C | .69 |
| Class I | .67 |
| Class Z | .55 |
| Fidelity Advisor Utilities Fund | |
| Class A | .71 |
| Class M | .72 |
| Class C | .71 |
| Class I | .69 |
| Class Z | .57 |
One-twelfth of the management fee rate for a class is applied to the average net assets of the class for the month, giving a dollar amount which is the management fee for the class for that month. A different management fee rate may be applicable to each class of each Fund. The difference between classes is the result of separate arrangements for class-level services and/or waivers of certain expenses. It is not the result of any difference in advisory or custodial fees or other expenses related to the management of each Fund's assets, which do not vary by class. For the portion of the reporting period on or after March 1, 2024, the total annualized management fee rates were as follows:
| | Total Management Fee Rate % |
| Fidelity Advisor Biotechnology Fund | |
| Class A | .69 |
| Class M | .70 |
| Class C | .70 |
| Class I | .69 |
| Class Z | .56 |
| Fidelity Advisor Consumer Discretionary Fund | |
| Class A | .70 |
| Class M | .72 |
| Class C | .71 |
| Class I | .69 |
| Class Z | .56 |
| Fidelity Advisor Energy Fund | |
| Class A | .71 |
| Class M | .71 |
| Class C | .71 |
| Class I | .69 |
| Class Z | .56 |
| Fidelity Advisor Financials Fund | |
| Class A | .72 |
| Class M | .71 |
| Class C | .71 |
| Class I | .69 |
| Class Z | .56 |
| Fidelity Advisor Health Care Fund | |
| Class A | .67 |
| Class M | .67 |
| Class C | .67 |
| Class I | .67 |
| Class Z | .55 |
| Fidelity Advisor Industrials Fund | |
| Class A | .70 |
| Class M | .70 |
| Class C | .71 |
| Class I | .68 |
| Class Z | .56 |
| Fidelity Advisor Semiconductors Fund | |
| Class A | .69 |
| Class M | .68 |
| Class C | .69 |
| Class I | .69 |
| Class Z | .56 |
| Fidelity Advisor Technology Fund | |
| Class A | .67 |
| Class M | .67 |
| Class C | .67 |
| Class I | .67 |
| Class Z | .55 |
| Fidelity Advisor Utilities Fund | |
| Class A | .71 |
| Class M | .72 |
| Class C | .71 |
| Class I | .69 |
| Class Z | .57 |
Prior to March 1, 2024, the management fee was the sum of an individual fund fee rate and an annualized group fee rate. The individual fund fee rate was applied to each Fund's average net assets. The group fee rate was based upon the monthly average net assets of a group of registered investment companies with which the investment adviser has management contracts. The group fee rate decreased as assets under management increased and increased as assets under management decreased. For the portion of the reporting period prior to March 1, 2024, each Fund's total annualized management fee rate expressed as a percentage of each Fund's average net assets was as follows:
| | Individual Rate % | Group Rate % | Total % |
| Fidelity Advisor Biotechnology Fund | .30 | .22 | .52 |
| Fidelity Advisor Consumer Discretionary Fund | .30 | .22 | .52 |
| Fidelity Advisor Energy Fund | .30 | .22 | .52 |
| Fidelity Advisor Financials Fund | .30 | .22 | .52 |
| Fidelity Advisor Health Care Fund | .30 | .22 | .52 |
| Fidelity Advisor Industrials Fund | .30 | .22 | .52 |
| Fidelity Advisor Semiconductors Fund | .30 | .22 | .52 |
| Fidelity Advisor Technology Fund | .30 | .22 | .52 |
| Fidelity Advisor Utilities Fund | .30 | .22 | .52 |
Effective March 1, 2024, each Fund's sub-advisory agreements with FMR Investment Management (UK) Limited, Fidelity Management & Research (Hong Kong) Limited, and Fidelity Management & Research (Japan) Limited were amended to provide that the investment adviser pays each sub-adviser monthly fees equal to 110% of the sub-adviser's costs for providing sub-advisory services.
Distribution and Service Plan Fees. In accordance with Rule 12b-1 of the 1940 Act, each Fund has adopted separate Distribution and Service Plans for each class of shares. Certain classes pay Fidelity Distributors Company LLC (FDC), an affiliate of the investment adviser, separate Distribution and Service Fees, each of which is based on an annual percentage of each class' average net assets. In addition, FDC may pay financial intermediaries for selling shares of each Fund and providing shareholder support services. For the period, the Distribution and Service Fee rates, total fees and amounts retained by FDC were as follows:
| | Distribution Fee | Service Fee | Total Fees ($) | Retained by FDC ($) |
| Fidelity Advisor Biotechnology Fund | | | | |
| Class A | - % | .25% | 1,615,089 | 1,241,837 |
| Class M | .25% | .25% | 578,438 | 142,674 |
| Class C | .75% | .25% | 979,509 | 805,311 |
| | | | 3,173,036 | 2,189,822 |
| Fidelity Advisor Consumer Discretionary Fund | | | | |
| Class A | - % | .25% | 527,979 | 366,992 |
| Class M | .25% | .25% | 172,032 | 83,364 |
| Class C | .75% | .25% | 360,167 | 291,526 |
| | | | 1,060,178 | 741,882 |
| Fidelity Advisor Energy Fund | | | | |
| Class A | - % | .25% | 952,359 | 593,839 |
| Class M | .25% | .25% | 544,158 | 198,494 |
| Class C | .75% | .25% | 854,461 | 725,485 |
| | | | 2,350,978 | 1,517,818 |
| Fidelity Advisor Financials Fund | | | | |
| Class A | - % | .25% | 436,174 | 299,303 |
| Class M | .25% | .25% | 330,348 | 81,398 |
| Class C | .75% | .25% | 359,296 | 306,615 |
| | | | 1,125,818 | 687,316 |
| Fidelity Advisor Health Care Fund | | | | |
| Class A | - % | .25% | 3,599,291 | 2,664,725 |
| Class M | .25% | .25% | 1,485,314 | 635,180 |
| Class C | .75% | .25% | 2,968,039 | 2,578,712 |
| | | | 8,052,644 | 5,878,617 |
| Fidelity Advisor Industrials Fund | | | | |
| Class A | - % | .25% | 600,380 | 429,756 |
| Class M | .25% | .25% | 290,484 | 122,410 |
| Class C | .75% | .25% | 321,577 | 257,511 |
| | | | 1,212,441 | 809,677 |
| Fidelity Advisor Semiconductors Fund | | | | |
| Class A | - % | .25% | 1,891,837 | 1,300,205 |
| Class M | .25% | .25% | 612,806 | 138,054 |
| Class C | .75% | .25% | 1,616,644 | 1,257,852 |
| | | | 4,121,287 | 2,696,111 |
| Fidelity Advisor Technology Fund | | | | |
| Class A | - % | .25% | 5,238,162 | 3,426,169 |
| Class M | .25% | .25% | 3,397,300 | 961,018 |
| Class C | .75% | .25% | 3,189,839 | 2,594,399 |
| | | | 11,825,301 | 6,981,586 |
| Fidelity Advisor Utilities Fund | | | | |
| Class A | - % | .25% | 771,651 | 510,598 |
| Class M | .25% | .25% | 322,490 | 122,000 |
| Class C | .75% | .25% | 523,769 | 421,577 |
| | | | 1,617,910 | 1,054,175 |
Sales Load. FDC may receive a front-end sales charge of up to 5.75% for selling Class A shares and 3.50% for selling Class M shares, some of which is paid to financial intermediaries for selling shares of each Fund. Depending on the holding period, FDC may receive contingent deferred sales charges levied on Class A, Class M and Class C redemptions. The deferred sales charges are 1.00% for Class C shares, 1.00% for certain purchases of Class A shares and .25% for certain purchases of Class M shares.
For the period, sales charge amounts retained by FDC were as follows:
| | Retained by FDC ($) |
| Fidelity Advisor Biotechnology Fund | |
| Class A | 72,280 |
| Class M | 4,721 |
Class C A | 15,114 |
| | 92,115 |
| Fidelity Advisor Consumer Discretionary Fund | |
| Class A | 47,152 |
| Class M | 3,102 |
Class C A | 98 |
| | 50,352 |
| Fidelity Advisor Energy Fund | |
| Class A | 151,246 |
| Class M | 8,269 |
Class C A | 554 |
| | 160,069 |
| Fidelity Advisor Financials Fund | |
| Class A | 29,543 |
| Class M | 2,261 |
Class C A | 303 |
| | 32,107 |
| Fidelity Advisor Health Care Fund | |
| Class A | 182,078 |
| Class M | 17,621 |
Class C A | 2,274 |
| | 201,973 |
| Fidelity Advisor Industrials Fund | |
| Class A | 37,674 |
| Class M | 4,308 |
Class C A | 67 |
| | 42,049 |
| Fidelity Advisor Semiconductors Fund | |
| Class A | 1,216,268 |
| Class M | 42,395 |
Class C A | 1,767 |
| | 1,260,430 |
| Fidelity Advisor Technology Fund | |
| Class A | 818,504 |
| Class M | 42,568 |
Class C A | 2,644 |
| | 863,716 |
| Fidelity Advisor Utilities Fund | |
| Class A | 118,382 |
| Class M | 8,536 |
Class C A | 992 |
| | 127,910 |
A When Class C shares are initially sold, FDC pays commissions from its own resources to financial intermediaries through which the sales are made.
Transfer Agent Fees. Fidelity Investments Institutional Operations Company LLC (FIIOC), an affiliate of the investment adviser, is the transfer, dividend disbursing and shareholder servicing agent for each class of the Funds. Effective March 1, 2024, each Fund's management contract was amended to incorporate transfer agent services and associated fees previously covered under a separate services agreement. FIIOC pays for typesetting, printing and mailing of shareholder reports, except proxy statements.
During the period December 1, 2023 through February 29, 2024, the transfer agent fees for each class were a fixed annual rate of class-level average net assets as follows:
| | | % of Class-Level Average Net Assets |
| Fidelity Advisor Biotechnology Fund | | |
| Class A | | .1903 |
| Class M | | .2000 |
| Class C | | .2000 |
| Class I | | .1685 |
| Class Z | | .0420 |
| | | |
| Fidelity Advisor Consumer Discretionary Fund | | |
| Class A | | .1852 |
| Class M | | .1966 |
| Class C | | .1935 |
| Class I | | .1674 |
| Class Z | | .0420 |
| | | |
| Fidelity Advisor Energy Fund | | |
| Class A | | .1947 |
| Class M | | .2000 |
| Class C | | .1869 |
| Class I | | .1705 |
| Class Z | | .0420 |
| | | |
| Fidelity Advisor Financials Fund | | |
| Class A | | .1976 |
| Class M | | .1869 |
| Class C | | .1947 |
| Class I | | .1737 |
| Class Z | | .0420 |
| | | |
| Fidelity Advisor Health Care Fund | | |
| Class A | | .1777 |
| Class M | | .1808 |
| Class C | | .1825 |
| Class I | | .1682 |
| Class Z | | .0420 |
| | | |
| Fidelity Advisor Industrials Fund | | |
| Class A | | .1826 |
| Class M | | .1827 |
| Class C | | .1899 |
| Class I | | .1650 |
| Class Z | | .0420 |
| | | |
| Fidelity Advisor Semiconductors Fund | | |
| Class A | | .1685 |
| Class M | | .1551 |
| Class C | | .1746 |
| Class I | | .1642 |
| Class Z | | .0420 |
| | | |
| Fidelity Advisor Technology Fund | | |
| Class A | | .1674 |
| Class M | | .1602 |
| Class C | | .1813 |
| Class I | | .1597 |
| Class Z | | .0420 |
| | | |
| Fidelity Advisor Utilities Fund | | |
| Class A | | .1841 |
| Class M | | .1996 |
| Class C | | .1879 |
| Class I | | .1669 |
| Class Z | | .0420 |
Prior to December 1, 2023, FIIOC received account fees and asset-based fees that varied according to the account size and type of account of the shareholders of the respective classes of each Fund, except for Class Z. FIIOC received an asset-based fee of Class Z's average net assets. For the portion of the reporting period prior to March 1, 2024, the fees were equivalent to the following annualized rates:
| | Amount ($) | % of Class-Level Average Net Assets |
| Fidelity Advisor Biotechnology Fund | | |
| Class A | 686,254 | .19 |
| Class M | 135,743 | .21 |
| Class C | 118,567 | .20 |
| Class I | 644,183 | .17 |
| Class Z | 16,042 | .04 |
| | 1,600,789 | |
| Fidelity Advisor Consumer Discretionary Fund | | |
| Class A | 222,815 | .19 |
| Class M | 39,211 | .20 |
| Class C | 43,337 | .20 |
| Class I | 134,720 | .17 |
| Class Z | 13,754 | .04 |
| | 453,837 | |
| Fidelity Advisor Energy Fund | | |
| Class A | 420,054 | .19 |
| Class M | 125,045 | .20 |
| Class C | 95,132 | .19 |
| Class I | 515,419 | .17 |
| Class Z | 44,971 | .04 |
| | 1,200,621 | |
| Fidelity Advisor Financials Fund | | |
| Class A | 191,405 | .20 |
| Class M | 68,361 | .19 |
| Class C | 41,300 | .19 |
| Class I | 103,382 | .17 |
| Class Z | 13,586 | .04 |
| | 418,034 | |
| Fidelity Advisor Health Care Fund | | |
| Class A | 1,497,939 | .18 |
| Class M | 313,448 | .18 |
| Class C | 330,836 | .18 |
| Class I | 2,232,092 | .17 |
| Class Z | 171,771 | .04 |
| | 4,546,086 | |
| Fidelity Advisor Industrials Fund | | |
| Class A | 240,975 | .19 |
| Class M | 58,099 | .19 |
| Class C | 34,917 | .19 |
| Class I | 128,216 | .17 |
| Class Z | 11,891 | .04 |
| | 474,098 | |
| Fidelity Advisor Semiconductors Fund | | |
| Class A | 604,970 | .17 |
| Class M | 88,624 | .16 |
| Class C | 133,796 | .18 |
| Class I | 547,635 | .17 |
| Class Z | 25,837 | .04 |
| | 1,400,862 | |
| Fidelity Advisor Technology Fund | | |
| Class A | 1,880,653 | .17 |
| Class M | 587,999 | .16 |
| Class C | 318,057 | .18 |
| Class I | 1,444,921 | .16 |
| Class Z | 155,932 | .04 |
| | 4,387,562 | |
| Fidelity Advisor Utilities Fund | | |
| Class A | 324,000 | .19 |
| Class M | 73,990 | .20 |
| Class C | 57,162 | .19 |
| Class I | 195,543 | .17 |
| Class Z | 19,683 | .04 |
| | 670,378 | |
Accounting Fees. Fidelity Service Company, Inc. (FSC), an affiliate of the investment adviser, maintains each Fund's accounting records. Effective March 1, 2024, the Fund's management contract was amended to incorporate accounting services and associated fees previously covered under a separate services agreement.
During the period December 1, 2023 through February 29, 2024, the accounting fees for each class were a fixed annual rate of average net assets as follows:
| | % of Average Net Assets |
| Fidelity Advisor Biotechnology Fund | .0275 |
| Fidelity Advisor Consumer Discretionary Fund | .0353 |
| Fidelity Advisor Energy Fund | .0283 |
| Fidelity Advisor Financials Fund | .0354 |
| Fidelity Advisor Health Care Fund | .0174 |
| Fidelity Advisor Industrials Fund | .0344 |
| Fidelity Advisor Semiconductors Fund | .0281 |
| Fidelity Advisor Technology Fund | .0192 |
| Fidelity Advisor Utilities Fund | .0308 |
Prior to December 1, 2023, the accounting fee was based on the level of average net assets for each month. For the portion of the reporting period prior to March 1, 2024, the fees were equivalent to the following annualized rates:
| | % of Average Net Assets |
| Fidelity Advisor Biotechnology Fund | .03 |
| Fidelity Advisor Consumer Discretionary Fund | .04 |
| Fidelity Advisor Energy Fund | .03 |
| Fidelity Advisor Financials Fund | .04 |
| Fidelity Advisor Health Care Fund | .02 |
| Fidelity Advisor Industrials Fund | .03 |
| Fidelity Advisor Semiconductors Fund | .03 |
| Fidelity Advisor Technology Fund | .02 |
| Fidelity Advisor Utilities Fund | .03 |
Brokerage Commissions. A portion of portfolio transactions were placed with brokerage firms which are affiliates of the investment adviser. Brokerage commissions are included in net realized gain (loss) and change in net unrealized appreciation (depreciation) in the Statement of Operations. The commissions paid to these affiliated firms were as follows:
| | Amount ($) |
| Fidelity Advisor Biotechnology Fund | 52,037 |
| Fidelity Advisor Consumer Discretionary Fund | 1,854 |
| Fidelity Advisor Energy Fund | 9,643 |
| Fidelity Advisor Financials Fund | 2,922 |
| Fidelity Advisor Health Care Fund | 32,039 |
| Fidelity Advisor Industrials Fund | 2,514 |
| Fidelity Advisor Semiconductors Fund | 11,094 |
| Fidelity Advisor Technology Fund | 17,085 |
| Fidelity Advisor Utilities Fund | 9,327 |
Interfund Lending Program. Pursuant to an Exemptive Order issued by the Securities and Exchange Commission (the SEC), each Fund, along with other registered investment companies having management contracts with Fidelity Management & Research Company LLC (FMR), or other affiliated entities of FMR, may participate in an interfund lending program. This program provides an alternative credit facility allowing each Fund to borrow from, or lend money to, other participating affiliated funds. At period end, there were no interfund loans outstanding. Any open loans, including accrued interest, at period end are presented as Notes payable to affiliates in the Statement of Assets and Liabilities. Activity in this program during the period for which loans were outstanding was as follows:
| | Borrower or Lender | Average Loan Balance ($) | Weighted Average Interest Rate | Interest Expense ($) |
| Fidelity Advisor Biotechnology Fund | Borrower | 11,723,000 | 5.58% | 10,909 |
| Fidelity Advisor Energy Fund | Borrower | 4,631,538 | 5.57% | 9,311 |
| Fidelity Advisor Financials Fund | Borrower | 4,389,143 | 5.57% | 4,754 |
| Fidelity Advisor Health Care Fund | Borrower | 10,464,064 | 5.57% | 76,086 |
| Fidelity Advisor Industrials Fund | Borrower | 5,571,750 | 5.57% | 3,445 |
Fidelity Advisor Semiconductors Fund | Borrower | 17,716,000 | 5.59% | 2,748 |
| Fidelity Advisor Technology Fund | Borrower | 4,118,000 | 5.57% | 2,547 |
| Fidelity Advisor Utilities Fund | Borrower | 14,616,167 | 5.57% | 13,559 |
Interfund Trades. Funds may purchase from or sell securities to other Fidelity Funds under procedures adopted by the Board. The procedures have been designed to ensure these interfund trades are executed in accordance with Rule 17a-7 of the 1940 Act. Any interfund trades are included within the respective purchases and sales amounts shown in the Purchases and Sales of Investments note. Interfund trades during the period are noted in the table below.
| | Purchases ($) | Sales ($) | Realized Gain (Loss)($) |
| Fidelity Advisor Biotechnology Fund | 32,276,446 | 135,088,376 | 8,886,029 |
| Fidelity Advisor Consumer Discretionary Fund | 15,233,410 | 7,234,899 | 1,321,723 |
| Fidelity Advisor Energy Fund | 33,291,995 | 6,662,362 | 1,434,682 |
| Fidelity Advisor Financials Fund | 8,869,692 | 13,651,497 | 814,406 |
| Fidelity Advisor Health Care Fund | 121,743,458 | 252,382,893 | (13,447,111) |
| Fidelity Advisor Industrials Fund | 3,770,859 | 2,872,364 | 267,114 |
| Fidelity Advisor Semiconductors Fund | 58,058,584 | 1,736,381 | (473,896) |
| Fidelity Advisor Technology Fund | 138,815,916 | 96,000,846 | 23,368,932 |
| Fidelity Advisor Utilities Fund | 8,306,606 | 36,836,375 | 2,296,597 |
Other. During the period, the investment adviser reimbursed the Funds for certain losses as follows:
| | Amount ($) |
| Fidelity Advisor Biotechnology Fund | 8,171 |
6. Committed Line of Credit.
Certain Funds participate with other funds managed by the investment adviser or an affiliate in a $4.25 billion credit facility (the "line of credit") to be utilized for temporary or emergency purposes to fund shareholder redemptions or for other short-term liquidity purposes. The participating funds have agreed to pay commitment fees on their pro-rata portion of the line of credit, which are reflected in Miscellaneous expenses on the Statement of Operations, and are listed below. During the period, there were no borrowings on this line of credit.
| | Amount ($) |
| Fidelity Advisor Biotechnology Fund | 2,707 |
| Fidelity Advisor Consumer Discretionary Fund | 790 |
| Fidelity Advisor Energy Fund | 2,114 |
| Fidelity Advisor Financials Fund | 727 |
| Fidelity Advisor Health Care Fund | 8,378 |
| Fidelity Advisor Industrials Fund | 859 |
| Fidelity Advisor Semiconductors Fund | 2,981 |
| Fidelity Advisor Technology Fund | 8,969 |
| Fidelity Advisor Utilities Fund | 1,180 |
7. Security Lending.
Funds lend portfolio securities from time to time in order to earn additional income. Lending agents are used, including National Financial Services (NFS), an affiliate of the investment adviser. Pursuant to a securities lending agreement, NFS will receive a fee, which is capped at 9.9% of a fund's daily lending revenue, for its services as lending agent. A fund may lend securities to certain qualified borrowers, including NFS. On the settlement date of the loan, a fund receives collateral (in the form of U.S. Treasury obligations, letters of credit and/or cash) against the loaned securities and maintains collateral in an amount not less than 100% of the market value of the loaned securities during the period of the loan. The market value of the loaned securities is determined at the close of business of a fund and any additional required collateral is delivered to a fund on the next business day. A fund or borrower may terminate the loan at any time, and if the borrower defaults on its obligation to return the securities loaned because of insolvency or other reasons, a fund may apply collateral received from the borrower against the obligation. A fund may experience delays and costs in recovering the securities loaned. Any cash collateral received is invested in the Fidelity Securities Lending Cash Central Fund. Any loaned securities are identified as such in the Schedule of Investments, and the value of loaned securities and cash collateral at period end, as applicable, are presented in the Statement of Assets and Liabilities. Security lending income represents the income earned on investing cash collateral, less rebates paid to borrowers and any lending agent fees associated with the loan, plus any premium payments received for lending certain types of securities. Security lending income is presented in the Statement of Operations as a component of income from Fidelity Central Funds. Affiliated security lending activity, if any, was as follows:
| | Total Security Lending Fees Paid to NFS ($) | Security Lending Income From Securities Loaned to NFS ($) | Value of Securities Loaned to NFS at Period End ($) |
| Fidelity Advisor Biotechnology Fund | 149,246 | 15,605 | - |
| Fidelity Advisor Consumer Discretionary Fund | 1,623 | 69 | - |
| Fidelity Advisor Energy Fund | 7,169 | - | - |
| Fidelity Advisor Financials Fund | 874 | - | - |
| Fidelity Advisor Health Care Fund | 55,760 | 1,160 | 10,218 |
| Fidelity Advisor Industrials Fund | 700 | - | - |
| Fidelity Advisor Semiconductors Fund | 37,276 | 6,088 | 8,768,000 |
| Fidelity Advisor Technology Fund | 5,077 | 18,196 | - |
| Fidelity Advisor Utilities Fund | 803 | - | - |
8. Bank Borrowings.
Each Fund is permitted to have bank borrowings for temporary or emergency purposes to fund shareholder redemptions or for other short-term liquidity requirements. Each Fund has established borrowing arrangements with certain banks. The interest rate on the borrowings is the bank's base rate, as revised from time to time. Any open loans, including accrued interest, at period end are presented under the caption "Notes payable" in the Statement of Assets and Liabilities, if applicable. Activity in this program during the period for which loans were outstanding was as follows:
| | Average Loan Balance ($) | Weighted Average Interest Rate | Interest Expense ($) |
| Fidelity Advisor Energy Fund | 527,250 | 5.83% | 342 |
| Fidelity Advisor Financials Fund | 2,508,833 | 5.83% | 2,437 |
| Fidelity Advisor Health Care Fund | 115,000 | 5.83% | 37 |
9. Expense Reductions.
Through arrangements with each applicable Fund's custodian and each class' transfer agent, credits realized as a result of certain uninvested cash balances were used to reduce each applicable Fund's or class' expenses. All of the applicable expense reductions are noted in the table below.
| | Custodian credits ($) | Transfer Agent credits ($) |
| Fidelity Advisor Biotechnology Fund | 4,799 | - |
| Class M | - | 427 |
| Fidelity Advisor Energy Fund | - | - |
| Class M | - | 151 |
| Fidelity Advisor Financials Fund | - | - |
| Class M | - | 20 |
| Fidelity Advisor Industrials Fund | - | - |
| Class M | - | 76 |
Fidelity Advisor Semiconductors Fund | 1,803 | - |
| Fidelity Advisor Technology Fund | 1,570 | - |
| Fidelity Advisor Utilities Fund | - | - |
| Class M | - | 67 |
In addition, during the period the investment adviser or an affiliate reimbursed and/or waived a portion of fund-level operating expenses as follows:
| | Fund-Level Amount ($) |
| Fidelity Advisor Biotechnology Fund | 100,437 |
| Fidelity Advisor Consumer Discretionary Fund | 29,880 |
| Fidelity Advisor Energy Fund | 77,725 |
| Fidelity Advisor Financials Fund | 26,753 |
| Fidelity Advisor Health Care Fund | 316,824 |
| Fidelity Advisor Industrials Fund | 31,548 |
| Fidelity Advisor Semiconductors Fund | 100,000 |
| Fidelity Advisor Technology Fund | 324,665 |
| Fidelity Advisor Utilities Fund | 43,394 |
10. Distributions to Shareholders.
Distributions to shareholders of each class were as follows:
| | Year ended July 31, 2024 | Year ended July 31, 2023 |
| Fidelity Advisor Biotechnology Fund | | |
| Distributions to shareholders | | |
| Class A | $7,399,425 | $ - |
| Class M | 1,088,438 | - |
| Class I | 9,290,645 | - |
| Class Z | 1,038,552 | - |
Total | $18,817,060 | $ - |
| Fidelity Advisor Consumer Discretionary Fund | | |
| Distributions to shareholders | | |
| Class A | $ - | $6,880,690 |
| Class M | - | 1,398,366 |
| Class C | - | 2,489,252 |
| Class I | - | 3,782,125 |
| Class Z | - | 2,612,656 |
Total | $ - | $17,163,089 |
| Fidelity Advisor Energy Fund | | |
| Distributions to shareholders | | |
| Class A | $7,318,255 | $ 8,545,498 |
| Class M | 1,764,969 | 2,095,293 |
| Class C | 1,178,876 | 1,833,534 |
| Class I | 11,020,177 | 13,584,550 |
| Class Z | 2,232,106 | 7,375,972 |
Total | $23,514,383 | $33,434,847 |
| Fidelity Advisor Financials Fund | | |
| Distributions to shareholders | | |
| Class A | $3,936,144 | $10,343,831 |
| Class M | 1,359,712 | 3,691,281 |
| Class C | 580,285 | 2,770,639 |
| Class I | 2,558,939 | 7,089,508 |
| Class Z | 547,015 | 6,890,192 |
Total | $8,982,095 | $30,785,451 |
| Fidelity Advisor Health Care Fund | | |
| Distributions to shareholders | | |
| Class A | $ - | $ - |
| Class M | - | - |
| Class C | - | - |
| Class I | - | - |
| Class Z | - | - |
Total | $ - | $ - |
| Fidelity Advisor Industrials Fund | | |
| Distributions to shareholders | | |
| Class A | $19,091,663 | $7,071,012 |
| Class M | 4,801,657 | 1,678,793 |
| Class C | 3,163,271 | 1,387,568 |
| Class I | 9,988,265 | 4,233,189 |
| Class Z | 2,725,506 | 3,179,380 |
Total | $39,770,362 | $17,549,942 |
| Fidelity Advisor Semiconductors Fund | | |
| Distributions to shareholders | | |
| Class A | $21,083,648 | $8,928,808 |
| Class M | 3,540,848 | 1,417,206 |
| Class C | 5,533,444 | 2,898,996 |
| Class I | 18,203,721 | 7,802,658 |
| Class Z | 3,470,629 | 1,111,011 |
Total | $51,832,290 | $22,158,679 |
| Fidelity Advisor Technology Fund | | |
| Distributions to shareholders | | |
| Class A | $75,972,488 | $44,657,722 |
| Class M | 26,864,038 | 15,873,515 |
| Class C | 15,432,543 | 11,031,237 |
| Class I | 58,230,400 | 31,149,239 |
| Class Z | 19,915,535 | 14,911,183 |
Total | $196,415,004 | $117,622,896 |
| Fidelity Advisor Utilities Fund | | |
| Distributions to shareholders | | |
| Class A | $10,455,083 | $15,827,969 |
| Class M | 2,004,102 | 3,178,096 |
| Class C | 1,433,195 | 2,595,233 |
| Class I | 7,152,393 | 14,746,535 |
| Class Z | 2,651,448 | 5,860,452 |
Total | $23,696,221 | $42,208,285 |
11. Share Transactions.
Share transactions for each class were as follows and may contain in-kind transactions, automatic conversions between classes or exchanges between affiliated funds:
| | Shares | Shares | Dollars | Dollars |
| | Year ended July 31, 2024 | Year ended July 31, 2023 | Year ended July 31, 2024 | Year ended July 31, 2023 |
| Fidelity Advisor Biotechnology Fund | | | | |
| Class A | | | | |
| Shares sold | 2,649,700 | 3,200,209 | $72,502,956 | $78,997,743 |
| Reinvestment of distributions | 273,310 | - | 6,909,269 | - |
| Shares redeemed | (5,241,119) | (5,129,445) | (139,324,676) | (126,229,442) |
| Net increase (decrease) | (2,318,109) | (1,929,236) | $(59,912,451) | $(47,231,699) |
| Class M | | | | |
| Shares sold | 306,124 | 585,052 | $7,730,359 | $13,155,289 |
| Reinvestment of distributions | 46,475 | - | 1,075,432 | - |
| Shares redeemed | (853,680) | (1,112,087) | (21,109,524) | (25,079,956) |
| Net increase (decrease) | (501,081) | (527,035) | $(12,303,733) | $(11,924,667) |
| Class C | | | | |
| Shares sold | 291,630 | 406,454 | $6,284,802 | $7,809,259 |
| Shares redeemed | (2,724,748) | (4,111,528) | (56,457,308) | (79,272,567) |
| Net increase (decrease) | (2,433,118) | (3,705,074) | $(50,172,506) | $(71,463,308) |
| Class I | | | | |
| Shares sold | 4,210,816 | 3,930,484 | $128,411,204 | $105,588,310 |
| Reinvestment of distributions | 282,262 | - | 7,793,263 | - |
| Shares redeemed | (8,100,490) | (7,664,664) | (236,749,589) | (205,027,950) |
| Net increase (decrease) | (3,607,412) | (3,734,180) | $(100,545,122) | $(99,439,640) |
| Class Z | | | | |
| Shares sold | 906,906 | 772,947 | $26,839,138 | $20,513,188 |
| Reinvestment of distributions | 32,151 | - | 889,286 | - |
| Shares redeemed | (757,301) | (1,187,102) | (21,811,755) | (31,371,222) |
| Net increase (decrease) | 181,756 | (414,155) | $5,916,669 | $(10,858,034) |
| Fidelity Advisor Consumer Discretionary Fund | | | | |
| Class A | | | | |
| Shares sold | 751,655 | 982,071 | $29,127,454 | $32,708,559 |
| Reinvestment of distributions | - | 213,159 | - | 6,684,934 |
| Shares redeemed | (959,120) | (1,161,794) | (37,712,464) | (37,480,011) |
| Net increase (decrease) | (207,465) | 33,436 | $(8,585,010) | $1,913,482 |
| Class M | | | | |
| Shares sold | 65,698 | 139,907 | $2,328,548 | $4,259,426 |
| Reinvestment of distributions | - | 48,202 | - | 1,382,434 |
| Shares redeemed | (188,451) | (240,619) | (6,523,190) | (7,160,832) |
| Net increase (decrease) | (122,753) | (52,510) | $(4,194,642) | $(1,518,972) |
| Class C | | | | |
| Shares sold | 106,037 | 166,292 | $3,101,374 | $4,242,334 |
| Reinvestment of distributions | - | 104,574 | - | 2,479,122 |
| Shares redeemed | (651,288) | (750,676) | (18,972,585) | (18,507,976) |
| Net increase (decrease) | (545,251) | (479,810) | $(15,871,211) | $(11,786,520) |
| Class I | | | | |
| Shares sold | 1,605,539 | 1,961,206 | $67,012,895 | $72,509,098 |
| Reinvestment of distributions | - | 105,097 | - | 3,632,142 |
| Shares redeemed | (1,903,546) | (1,814,837) | (79,673,073) | (64,112,469) |
| Net increase (decrease) | (298,007) | 251,466 | $(12,660,178) | $12,028,771 |
| Class Z | | | | |
| Shares sold | 388,498 | 1,607,768 | $16,440,384 | $55,088,683 |
| Reinvestment of distributions | - | 73,211 | - | 2,541,170 |
| Shares redeemed | (1,574,354) | (774,213) | (61,888,489) | (27,608,114) |
| Net increase (decrease) | (1,185,856) | 906,766 | $(45,448,105) | $30,021,739 |
| Fidelity Advisor Energy Fund | | | | |
| Class A | | | | |
| Shares sold | 1,802,738 | 2,965,090 | $83,797,509 | $125,359,435 |
| Reinvestment of distributions | 167,879 | 200,714 | 7,094,565 | 8,281,444 |
| Shares redeemed | (2,315,640) | (3,841,903) | (105,057,379) | (159,054,801) |
| Net increase (decrease) | (345,023) | (676,099) | $(14,165,305) | $(25,413,922) |
| Class M | | | | |
| Shares sold | 361,787 | 390,349 | $17,332,099 | $16,951,245 |
| Reinvestment of distributions | 39,715 | 48,467 | 1,727,981 | 2,057,403 |
| Shares redeemed | (554,617) | (875,129) | (25,806,670) | (37,005,996) |
| Net increase (decrease) | (153,115) | (436,313) | $(6,746,590) | $(17,997,348) |
| Class C | | | | |
| Shares sold | 340,034 | 662,408 | $14,247,108 | $25,703,152 |
| Reinvestment of distributions | 29,115 | 46,957 | 1,125,303 | 1,773,567 |
| Shares redeemed | (864,275) | (1,329,293) | (35,707,272) | (50,167,462) |
| Net increase (decrease) | (495,126) | (619,928) | $(20,334,861) | $(22,690,743) |
| Class I | | | | |
| Shares sold | 7,331,050 | 5,904,399 | $360,535,890 | $264,297,953 |
| Reinvestment of distributions | 226,380 | 282,440 | 10,144,089 | 12,342,610 |
| Shares redeemed | (6,596,082) | (8,165,711) | (313,054,267) | (357,278,979) |
| Net increase (decrease) | 961,348 | (1,978,872) | $57,625,712 | $(80,638,416) |
| Class Z | | | | |
| Shares sold | 1,885,365 | 3,968,517 | $93,387,839 | $175,402,328 |
| Reinvestment of distributions | 42,781 | 162,239 | 1,913,609 | 7,071,987 |
| Shares redeemed | (5,380,884) | (4,835,412) | (257,774,216) | (211,058,509) |
| Net increase (decrease) | (3,452,738) | (704,656) | $(162,472,768) | $(28,584,194) |
| Fidelity Advisor Financials Fund | | | | |
| Class A | | | | |
| Shares sold | 818,003 | 1,007,482 | $22,800,145 | $25,570,300 |
| Reinvestment of distributions | 136,530 | 408,292 | 3,770,958 | 9,950,068 |
| Shares redeemed | (1,321,630) | (2,063,576) | (36,117,669) | (51,294,760) |
| Net increase (decrease) | (367,097) | (647,802) | $(9,546,566) | $(15,774,392) |
| Class M | | | | |
| Shares sold | 257,400 | 382,498 | $7,324,391 | $9,695,969 |
| Reinvestment of distributions | 49,122 | 150,930 | 1,340,046 | 3,634,395 |
| Shares redeemed | (477,488) | (663,018) | (12,892,718) | (16,163,119) |
| Net increase (decrease) | (170,966) | (129,590) | $(4,228,281) | $(2,832,755) |
| Class C | | | | |
| Shares sold | 89,000 | 158,220 | $2,319,425 | $3,741,582 |
| Reinvestment of distributions | 22,503 | 121,519 | 577,888 | 2,753,627 |
| Shares redeemed | (652,906) | (931,916) | (16,390,802) | (21,566,685) |
| Net increase (decrease) | (541,403) | (652,177) | $(13,493,489) | $(15,071,476) |
| Class I | | | | |
| Shares sold | 1,755,800 | 1,989,855 | $49,634,580 | $52,766,831 |
| Reinvestment of distributions | 87,544 | 277,356 | 2,502,894 | 6,989,374 |
| Shares redeemed | (2,313,168) | (2,968,307) | (63,481,344) | (75,651,884) |
| Net increase (decrease) | (469,824) | (701,096) | $(11,343,870) | $(15,895,679) |
| Class Z | | | | |
| Shares sold | 1,757,445 | 3,844,623 | $51,626,690 | $99,675,825 |
| Reinvestment of distributions | 14,544 | 239,686 | 415,095 | 6,020,924 |
| Shares redeemed | (3,095,014) | (3,116,457) | (80,266,238) | (79,345,103) |
| Net increase (decrease) | (1,323,025) | 967,852 | $(28,224,453) | $26,351,646 |
| Fidelity Advisor Health Care Fund | | | | |
| Class A | | | | |
| Shares sold | 2,311,559 | 3,952,012 | $136,317,319 | $229,948,864 |
| Shares redeemed | (5,454,640) | (4,091,037) | (322,642,152) | (237,824,749) |
| Net increase (decrease) | (3,143,081) | (139,025) | $(186,324,833) | $(7,875,885) |
| Class M | | | | |
| Shares sold | 223,594 | 323,729 | $12,194,685 | $17,197,627 |
| Shares redeemed | (824,131) | (798,274) | (44,498,389) | (42,502,451) |
| Net increase (decrease) | (600,537) | (474,545) | $(32,303,704) | $(25,304,824) |
| Class C | | | | |
| Shares sold | 348,702 | 724,395 | $15,349,798 | $31,252,102 |
| Shares redeemed | (2,928,311) | (4,142,787) | (127,438,226) | (179,275,708) |
| Net increase (decrease) | (2,579,609) | (3,418,392) | $(112,088,428) | $(148,023,606) |
| Class I | | | | |
| Shares sold | 4,486,201 | 7,285,756 | $294,961,288 | $469,523,346 |
| Shares redeemed | (14,948,048) | (11,196,061) | (974,268,206) | (721,560,464) |
| Net increase (decrease) | (10,461,847) | (3,910,305) | $(679,306,918) | $(252,037,118) |
| Class Z | | | | |
| Shares sold | 2,694,277 | 5,264,645 | $178,292,993 | $334,148,597 |
| Shares redeemed | (7,519,316) | (5,098,057) | (481,983,286) | (326,368,763) |
| Net increase (decrease) | (4,825,039) | 166,588 | $(303,690,293) | $7,779,834 |
| Fidelity Advisor Industrials Fund | | | | |
| Class A | | | | |
| Shares sold | 691,375 | 406,707 | $27,779,266 | $14,207,996 |
| Reinvestment of distributions | 476,634 | 199,881 | 18,093,011 | 6,692,020 |
| Shares redeemed | (905,850) | (1,106,776) | (36,408,194) | (38,331,064) |
| Net increase (decrease) | 262,159 | (500,188) | $9,464,083 | $(17,431,048) |
| Class M | | | | |
| Shares sold | 218,666 | 126,166 | $8,638,732 | $4,217,090 |
| Reinvestment of distributions | 130,912 | 51,559 | 4,766,508 | 1,664,332 |
| Shares redeemed | (241,457) | (241,056) | (9,358,794) | (8,188,209) |
| Net increase (decrease) | 108,121 | (63,331) | $4,046,446 | $(2,306,787) |
| Class C | | | | |
| Shares sold | 133,579 | 76,596 | $4,409,475 | $2,255,873 |
| Reinvestment of distributions | 101,765 | 49,445 | 3,132,328 | 1,376,542 |
| Shares redeemed | (340,007) | (403,651) | (11,096,876) | (11,609,090) |
| Net increase (decrease) | (104,663) | (277,610) | $(3,555,073) | $(7,976,675) |
| Class I | | | | |
| Shares sold | 1,502,930 | 1,580,336 | $65,003,554 | $62,430,757 |
| Reinvestment of distributions | 219,293 | 106,079 | 9,085,300 | 3,845,348 |
| Shares redeemed | (1,877,502) | (2,324,872) | (79,570,258) | (89,149,470) |
| Net increase (decrease) | (155,279) | (638,457) | $(5,481,404) | $(22,873,365) |
| Class Z | | | | |
| Shares sold | 600,142 | 2,596,658 | $26,252,508 | $89,451,331 |
| Reinvestment of distributions | 62,886 | 86,441 | 2,604,125 | 3,128,307 |
| Shares redeemed | (2,156,935) | (883,875) | (88,761,038) | (33,054,547) |
| Net increase (decrease) | (1,493,907) | 1,799,224 | $(59,904,405) | $59,525,091 |
| Fidelity Advisor Semiconductors Fund | | | | |
| Class A | | | | |
| Shares sold | 4,838,303 | 3,139,559 | $343,697,111 | $151,745,716 |
| Reinvestment of distributions | 344,846 | 219,674 | 20,876,979 | 8,824,286 |
| Shares redeemed | (1,933,905) | (1,450,894) | (133,711,892) | (63,995,324) |
| Net increase (decrease) | 3,249,244 | 1,908,339 | $230,862,198 | $96,574,678 |
| Class M | | | | |
| Shares sold | 791,906 | 543,026 | $53,531,235 | $24,086,971 |
| Reinvestment of distributions | 61,148 | 37,061 | 3,458,547 | 1,398,675 |
| Shares redeemed | (212,743) | (168,156) | (13,778,612) | (6,902,970) |
| Net increase (decrease) | 640,311 | 411,931 | $43,211,170 | $18,582,676 |
| Class C | | | | |
| Shares sold | 1,308,621 | 750,418 | $75,362,622 | $29,626,090 |
| Reinvestment of distributions | 113,850 | 88,413 | 5,527,405 | 2,894,656 |
| Shares redeemed | (676,236) | (784,500) | (37,788,799) | (28,516,396) |
| Net increase (decrease) | 746,235 | 54,331 | $43,101,228 | $4,004,350 |
| Class I | | | | |
| Shares sold | 5,918,967 | 4,070,496 | $451,679,642 | $212,088,692 |
| Reinvestment of distributions | 273,927 | 177,505 | 17,923,026 | 7,666,452 |
| Shares redeemed | (2,919,636) | (3,061,827) | (224,521,109) | (145,241,848) |
| Net increase (decrease) | 3,273,258 | 1,186,174 | $245,081,559 | $74,513,296 |
| Class Z | | | | |
| Shares sold | 1,603,015 | 773,142 | $127,452,494 | $40,811,429 |
| Reinvestment of distributions | 44,183 | 20,319 | 2,895,741 | 877,292 |
| Shares redeemed | (585,589) | (402,594) | (42,801,386) | (18,621,247) |
| Net increase (decrease) | 1,061,609 | 390,867 | $87,546,849 | $23,067,474 |
| Fidelity Advisor Technology Fund | | | | |
| Class A | | | | |
| Shares sold | 3,228,116 | 2,719,769 | $326,552,310 | $206,725,335 |
| Reinvestment of distributions | 764,250 | 628,818 | 72,565,432 | 42,658,884 |
| Shares redeemed | (2,801,337) | (2,778,801) | (282,697,295) | (202,519,149) |
| Net increase (decrease) | 1,191,029 | 569,786 | $116,420,447 | $46,865,070 |
| Class M | | | | |
| Shares sold | 1,078,923 | 889,665 | $98,350,142 | $63,637,995 |
| Reinvestment of distributions | 307,073 | 252,456 | 26,518,839 | 15,667,387 |
| Shares redeemed | (1,204,017) | (949,000) | (111,499,551) | (63,257,879) |
| Net increase (decrease) | 181,979 | 193,121 | $13,369,430 | $16,047,503 |
| Class C | | | | |
| Shares sold | 823,369 | 560,367 | $61,716,478 | $32,443,071 |
| Reinvestment of distributions | 217,843 | 213,030 | 15,194,548 | 10,843,236 |
| Shares redeemed | (1,243,391) | (1,383,227) | (91,783,163) | (76,050,104) |
| Net increase (decrease) | (202,179) | (609,830) | $(14,872,137) | $(32,763,797) |
| Class I | | | | |
| Shares sold | 7,101,062 | 4,444,591 | $783,888,507 | $375,313,502 |
| Reinvestment of distributions | 518,428 | 387,393 | 55,528,866 | 29,507,702 |
| Shares redeemed | (6,265,629) | (4,072,906) | (699,659,492) | (338,992,438) |
| Net increase (decrease) | 1,353,861 | 759,078 | $139,757,881 | $65,828,766 |
| Class Z | | | | |
| Shares sold | 3,570,966 | 3,452,388 | $412,531,561 | $279,946,819 |
| Reinvestment of distributions | 147,530 | 169,093 | 15,797,497 | 12,873,087 |
| Shares redeemed | (4,630,106) | (2,016,130) | (482,333,988) | (167,266,551) |
| Net increase (decrease) | (911,610) | 1,605,351 | $(54,004,930) | $125,553,355 |
| Fidelity Advisor Utilities Fund | | | | |
| Class A | | | | |
| Shares sold | 1,280,858 | 2,215,949 | $48,456,309 | $84,107,146 |
| Reinvestment of distributions | 279,588 | 413,410 | 10,124,466 | 15,411,688 |
| Shares redeemed | (2,053,712) | (1,942,608) | (74,697,612) | (72,156,394) |
| Net increase (decrease) | (493,266) | 686,751 | $(16,116,837) | $27,362,440 |
| Class M | | | | |
| Shares sold | 140,983 | 249,639 | $5,275,029 | $9,574,291 |
| Reinvestment of distributions | 54,023 | 83,223 | 1,961,658 | 3,114,610 |
| Shares redeemed | (363,636) | (294,172) | (13,403,536) | (10,991,952) |
| Net increase (decrease) | (168,630) | 38,690 | $(6,166,849) | $1,696,949 |
| Class C | | | | |
| Shares sold | 292,050 | 551,415 | $10,544,703 | $20,505,123 |
| Reinvestment of distributions | 40,395 | 70,929 | 1,423,265 | 2,585,729 |
| Shares redeemed | (557,312) | (600,716) | (19,899,030) | (21,673,319) |
| Net increase (decrease) | (224,867) | 21,628 | $(7,931,062) | $1,417,533 |
| Class I | | | | |
| Shares sold | 3,105,540 | 4,966,694 | $124,002,559 | $194,190,345 |
| Reinvestment of distributions | 187,848 | 377,332 | 6,984,725 | 14,409,343 |
| Shares redeemed | (3,677,678) | (5,296,143) | (136,341,969) | (200,737,485) |
| Net increase (decrease) | (384,290) | 47,883 | $(5,354,685) | $7,862,203 |
| Class Z | | | | |
| Shares sold | 1,408,595 | 2,267,279 | $53,605,471 | $86,908,960 |
| Reinvestment of distributions | 58,601 | 135,003 | 2,156,332 | 5,151,177 |
| Shares redeemed | (2,594,297) | (2,167,228) | (95,019,133) | (82,982,143) |
| Net increase (decrease) | (1,127,101) | 235,054 | $(39,257,330) | $9,077,994 |
12. Other.
A fund's organizational documents provide former and current trustees and officers with a limited indemnification against liabilities arising in connection with the performance of their duties to the fund. In the normal course of business, a fund may also enter into contracts that provide general indemnifications. A fund's maximum exposure under these arrangements is unknown as this would be dependent on future claims that may be made against a fund. The risk of material loss from such claims is considered remote.
13. Risk and Uncertainties.
Many factors affect a fund's performance. Developments that disrupt global economies and financial markets, such as pandemics, epidemics, outbreaks of infectious diseases, war, terrorism, and environmental disasters, may significantly affect a fund's investment performance. The effects of these developments to a fund will be impacted by the types of securities in which a fund invests, the financial condition, industry, economic sector, and geographic location of an issuer, and a fund's level of investment in the securities of that issuer. Significant concentrations in security types, issuers, industries, sectors, and geographic locations may magnify the factors that affect a fund's performance.
Report of Independent Registered Public Accounting Firm
To the Board of Trustees of Fidelity Advisor Series VII and the Shareholders of Fidelity Advisor Biotechnology Fund, Fidelity Advisor Consumer Discretionary Fund, Fidelity Advisor Energy Fund, Fidelity Advisor Financials Fund, Fidelity Advisor Health Care Fund, Fidelity Advisor Industrials Fund, Fidelity Advisor Semiconductors Fund, Fidelity Advisor Technology Fund, and Fidelity Advisor Utilities Fund:
Opinion on the Financial Statements and Financial Highlights
We have audited the accompanying statements of assets and liabilities of Fidelity Advisor Biotechnology Fund, Fidelity Advisor Consumer Discretionary Fund, Fidelity Advisor Energy Fund, Fidelity Advisor Financials Fund, Fidelity Advisor Health Care Fund, Fidelity Advisor Industrials Fund, Fidelity Advisor Semiconductors Fund, Fidelity Advisor Technology Fund, and Fidelity Advisor Utilities Fund (the "Funds"), each a fund of Fidelity Advisor Series VII, including the schedules of investments, as of July 31, 2024, the related statements of operations for the year then ended, the statements of changes in net assets for each of the two years in the period then ended, the financial highlights for each of the five years in the period then ended, and the related notes. The financial statements and financial highlights for Fidelity Advisor Health Care Fund have been consolidated. In our opinion, the financial statements and financial highlights present fairly, in all material respects, the financial position of each of the Funds as of July 31, 2024, and the results of their operations for the year then ended, the changes in their net assets for each of the two years in the period then ended, and the financial highlights for each of the five years in the period then ended in conformity with accounting principles generally accepted in the United States of America.
Basis for Opinion
These financial statements and financial highlights are the responsibility of the Funds' management. Our responsibility is to express an opinion on the Funds' financial statements and financial highlights based on our audits. We are a public accounting firm registered with the Public Company Accounting Oversight Board (United States) (PCAOB) and are required to be independent with respect to the Funds in accordance with the U.S. federal securities laws and the applicable rules and regulations of the Securities and Exchange Commission and the PCAOB.
We conducted our audits in accordance with the standards of the PCAOB. Those standards require that we plan and perform the audit to obtain reasonable assurance about whether the financial statements and financial highlights are free of material misstatement, whether due to error or fraud. The Funds are not required to have, nor were we engaged to perform, an audit of their internal control over financial reporting. As part of our audits, we are required to obtain an understanding of internal control over financial reporting but not for the purpose of expressing an opinion on the effectiveness of the Funds' internal control over financial reporting. Accordingly, we express no such opinion.
Our audits included performing procedures to assess the risks of material misstatement of the financial statements and financial highlights, whether due to error or fraud, and performing procedures that respond to those risks. Such procedures included examining, on a test basis, evidence regarding the amounts and disclosures in the financial statements and financial highlights. Our audits also included evaluating the accounting principles used and significant estimates made by management, as well as evaluating the overall presentation of the financial statements and financial highlights. Our procedures included confirmation of securities owned as of July 31, 2024, by correspondence with the custodian and brokers; when replies were not received from brokers, we performed other auditing procedures. We believe that our audits provide a reasonable basis for our opinion.
/s/ Deloitte & Touche LLP
Boston, Massachusetts
September 17, 2024
We have served as the auditor of one or more of the Fidelity investment companies since 1999.
Distributions
(Unaudited)The dividend and capital gains distributions for the fund(s) are available on Fidelity.com or Institutional.Fidelity.com.
The funds hereby designate as capital gain dividend the amounts noted below for the taxable year ended July 31, 2024, or, if subsequently determined to be different, the net capital gain of such year.
| Fidelity Advisor Biotechnology Fund | $15,473,928 |
| Fidelity Advisor Consumer Discretionary Fund | $22,477,106 |
| Fidelity Advisor Financials Fund | $6,282,976 |
| Fidelity Advisor Health Care Fund | $274,359,969 |
| Fidelity Advisor Industrials Fund | $10,398,559 |
| Fidelity Advisor Semiconductors Fund | $110,412,754 |
| Fidelity Advisor Technology Fund | $468,929,629 |
| Fidelity Advisor Utilities Fund | $36,755,900 |
A percentage of the dividends distributed during the fiscal year for the following funds were derived from interest on U.S. Government securities which is generally exempt from state income tax.
| Fidelity Advisor Utilities Fund | 0.36% |
The funds hereby designate the percentages noted below of the short-term capital gain dividends distributed during the fiscal year as qualifying to be taxed as short-term capital gain dividends for nonresident alien shareholders:
| | December, 2023 | |
| Fidelity Advisor Industrials Fund | 100% | |
| Fidelity Advisor Technology Fund | 99.80% | |
A percentage of the dividends distributed during the fiscal year for the following funds qualify for the dividends-received deduction for corporate shareholders:
| | Class A | Class M | Class C | Class I | Class Z |
| Fidelity Advisor Biotechnology Fund | | | | | |
| December, 2023 | 91% | 100% | - | 71% | 62% |
| Fidelity Advisor Energy Fund | | | | | |
| December, 2023 | 100% | 100% | 100% | 100% | 100% |
| Fidelity Advisor Financials Fund | | | | | |
| December, 2023 | 100% | 100% | 100% | 100% | 100% |
| Fidelity Advisor Industrials Fund | | | | | |
| December, 2023 | 100% | - | - | 100% | 100% |
| Fidelity Advisor Technology Fund | | | | | |
| December, 2023 | 100% | - | - | 100% | 100% |
| Fidelity Advisor Utilities Fund | | | | | |
| October, 2023 | 100% | 100% | 100% | 100% | 100% |
| December, 2023 | 100% | 100% | 100% | 100% | 100% |
| April, 2024 | 100% | 100% | 100% | 100% | 100% |
| July, 2024 | 100% | 100% | 100% | 100% | 100% |
| | | | | | |
A percentage of the dividends distributed during the fiscal year for the following funds may be taken into account as a dividend for purposes of the maximum rate under section 1(h)(11) of the Internal Revenue Code.
| | Class A | Class M | Class C | Class I | Class Z |
| Fidelity Advisor Biotechnology Fund | | | | | |
| December, 2023 | 88.98% | 100% | - | 68.86% | 60.28% |
| Fidelity Advisor Energy Fund | | | | | |
| December, 2023 | 100% | 100% | 100% | 100% | 100% |
| Fidelity Advisor Financials Fund | | | | | |
| December, 2023 | 100% | 100% | 100% | 100% | 100% |
| Fidelity Advisor Industrials Fund | | | | | |
| December, 2023 | 100% | - | - | 100% | 100% |
| Fidelity Advisor Technology Fund | | | | | |
| December, 2023 | 100% | - | - | 100% | 100% |
| Fidelity Advisor Utilities Fund | | | | | |
| October, 2023 | 100% | 100% | 100% | 100% | 100% |
| December, 2023 | 100% | 100% | 100% | 100% | 100% |
| April, 2024 | 100% | 100% | 100% | 100% | 100% |
| July, 2024 | 100% | 100% | 100% | 100% | 100% |
The funds will notify shareholders in January 2025 of amounts for use in preparing 2024 income tax returns.
Item 8: Changes in and Disagreements with Accountants for Open-End Management Investment Companies
Note: This is not applicable for any fund included in this document.
Item 9: Proxy Disclosures for Open-End Management Investment Companies
| A special meeting of shareholders was held on July 16, 2024. The results of votes taken among shareholders on the proposal before them are reported below. Each vote reported represents one dollar of net asset value held on the record date for the meeting. |
| Proposal 1 |
| To elect a Board of Trustees. |
| | # of Votes | % of Votes |
| Bettina Doulton |
| Affirmative | 11,673,835,823.95 | 96.01 |
| Withheld | 484,880,332.79 | 3.99 |
| TOTAL | 12,158,716,156.74 | 100.00 |
| Robert A. Lawrence |
| Affirmative | 11,649,437,829.16 | 95.81 |
| Withheld | 509,278,327.57 | 4.19 |
| TOTAL | 12,158,716,156.74 | 100.00 |
| Vijay C. Advani |
| Affirmative | 11,613,776,744.77 | 95.52 |
| Withheld | 544,939,411.97 | 4.48 |
| TOTAL | 12,158,716,156.74 | 100.00 |
| Thomas P. Bostick |
| Affirmative | 11,653,386,078.49 | 95.84 |
| Withheld | 505,330,078.25 | 4.16 |
| TOTAL | 12,158,716,156.74 | 100.00 |
| Donald F. Donahue |
| Affirmative | 11,632,589,030.61 | 95.67 |
| Withheld | 526,127,126.13 | 4.33 |
| TOTAL | 12,158,716,156.74 | 100.00 |
| Vicki L. Fuller |
| Affirmative | 11,691,940,576.27 | 96.16 |
| Withheld | 466,775,580.46 | 3.84 |
| TOTAL | 12,158,716,156.74 | 100.00 |
| Patricia L. Kampling |
| Affirmative | 11,685,988,743.05 | 96.11 |
| Withheld | 472,727,413.69 | 3.89 |
| TOTAL | 12,158,716,156.74 | 100.00 |
| Thomas A. Kennedy |
| Affirmative | 11,651,823,552.03 | 95.83 |
| Withheld | 506,892,604.70 | 4.17 |
| TOTAL | 12,158,716,156.74 | 100.00 |
| Oscar Munoz |
| Affirmative | 11,630,338,090.08 | 95.65 |
| Withheld | 528,378,066.66 | 4.35 |
| TOTAL | 12,158,716,156.74 | 100.00 |
| Karen B. Peetz |
| Affirmative | 11,652,647,210.01 | 95.84 |
| Withheld | 506,068,946.73 | 4.16 |
| TOTAL | 12,158,716,156.74 | 100.00 |
| David M. Thomas |
| Affirmative | 11,635,848,489.52 | 95.70 |
| Withheld | 522,867,667.21 | 4.30 |
| TOTAL | 12,158,716,156.74 | 100.00 |
| Susan Tomasky |
| Affirmative | 11,679,774,589.51 | 96.06 |
| Withheld | 478,941,567.22 | 3.94 |
| TOTAL | 12,158,716,156.74 | 100.00 |
| Michael E. Wiley |
| Affirmative | 11,645,598,691.16 | 95.78 |
| Withheld | 513,117,465.58 | 4.22 |
| TOTAL | 12,158,716,156.74 | 100.00 |
| | | |
| Proposal 1 reflects trust-wide proposal and voting results. |
Item 10: Remuneration Paid to Directors, Officers, and others of Open-End Management Investment Companies
Note: This information is disclosed as part of the financial statements for each Fund as part of Item 7: Financial Statements and Financial Highlights for Open-End Management Investment companies.
Item 11: Statement Regarding Basis for Approval of Investment Advisory Contract
Board Approval of Investment Advisory Contracts and Management Fees
Fidelity Advisor Biotechnology Fund
Fidelity Advisor Consumer Discretionary Fund
Fidelity Advisor Energy Fund
Fidelity Advisor Financials Fund
Fidelity Advisor Health Care Fund
Fidelity Advisor Industrials Fund
Fidelity Advisor Semiconductors Fund
Fidelity Advisor Technology Fund
Fidelity Advisor Utilities Fund
Each year, the Board of Trustees, including the Independent Trustees (together, the Board), considers the renewal of the management contract with Fidelity Management & Research Company LLC (FMR) and the sub-advisory agreements (together, the Advisory Contracts) for each fund. FMR and the sub-advisers are referred to herein as the Investment Advisers. The Board, assisted by the advice of fund counsel and Independent Trustees' counsel, requests and considers a broad range of information relevant to the renewal of the Advisory Contracts throughout the year.
The Board meets regularly and, at each of its meetings, covers an extensive agenda of topics and materials and considers factors that are relevant to its annual consideration of the renewal of each fund's Advisory Contracts, including the services and support provided to each fund and its shareholders. The Board, acting directly and through its Committees (each of which is composed of and chaired by Independent Trustees), requests and receives information concerning the annual consideration of the renewal of each fund's Advisory Contracts. The Board also meets as needed to review matters specifically related to the Board's annual consideration of the renewal of the Advisory Contracts. Members of the Board may also meet with trustees of other Fidelity funds through joint ad hoc committees to discuss certain matters relevant to all of the Fidelity funds.
At its May 2024 meeting, the Board unanimously determined to renew each fund's Advisory Contracts. In reaching its determination, the Board considered all factors it believed relevant, including (i) the nature, extent, and quality of the services provided to each fund and its shareholders (including the investment performance of each fund); (ii) the competitiveness relative to peer funds of each fund's management fee and the total expense ratio of a representative class of each fund (Class I, which was selected because it was the largest class without 12b-1 fees); (iii) the total costs of the services provided by and the profits realized by FMR and its affiliates (Fidelity) from its relationships with each fund; and (iv) the extent to which, if any, economies of scale exist and are realized as each fund grows, and whether any economies of scale are appropriately shared with fund shareholders. The Board also considered the broad range of investment choices available to shareholders from FMR's competitors and that each fund's shareholders have chosen to invest in the fund, which is part of the Fidelity family of funds. The Board's decision to renew the Advisory Contracts was not based on any single factor.
The Board reached a determination, with the assistance of fund counsel and Independent Trustees' counsel and through the exercise of its business judgment, that the renewal of the Advisory Contracts was in the best interests of each fund and its shareholders and that the compensation payable under the Advisory Contracts was fair and reasonable in light of all of the surrounding circumstances.
Nature, Extent, and Quality of Services Provided. The Board considered staffing as it relates to the funds, including the backgrounds and experience of investment personnel of the Investment Advisers, and also considered the Investment Advisers' implementation of the funds' investment programs. The Independent Trustees also had discussions with senior management of Fidelity's investment operations and investment groups. The Board considered the structure of the investment personnel compensation program and whether this structure provides appropriate incentives to act in the best interests of each fund. Additionally, the Board considered the portfolio managers' investments, if any, in the funds that they manage.
Resources Dedicated to Investment Management and Support Services. The Board and the Fund Oversight and Research Committees reviewed the general qualifications and capabilities of Fidelity's investment staff, including its size, education, experience, and resources, as well as Fidelity's approach to recruiting, training, managing, and compensating investment personnel. The Board noted the resources devoted to expansion of Fidelity's global investment organization, and that Fidelity's analysts have extensive resources, tools and capabilities that allow them to conduct sophisticated quantitative and fundamental analysis, as well as credit analysis of issuers, counterparties and guarantors. Further, the Board considered that Fidelity's investment professionals have sufficient access to global information and data so as to provide competitive investment results over time, and that those professionals also have access to sophisticated tools that permit them to assess portfolio construction and risk and performance attribution characteristics continuously, as well as to transmit new information and research conclusions rapidly around the world. Additionally, in its deliberations, the Board considered Fidelity's trading, risk management, compliance, and technology and operations capabilities and resources, which are integral parts of the investment management process.
Shareholder and Administrative Services. The Board considered (i) the nature, extent, quality, and cost of advisory, administrative, shareholder, transfer agency, and pricing and bookkeeping services performed by the Investment Advisers and their affiliates under the Advisory Contracts; (ii) the nature and extent of Fidelity's supervision of third party service providers, principally custodians, subcustodians, and pricing vendors; and (iii) the resources devoted by Fidelity to, and the record of compliance with, the fund's compliance policies and procedures. The Board also reviewed the allocation of fund brokerage, including allocations to brokers affiliated with the Investment Advisers, the use of brokerage commissions to pay fund expenses, and the use of "soft" commission dollars to pay for research services. The Board also considered the fund's securities lending activities and any payments made to Fidelity relating to securities lending under a separate agreement.
The Board noted that the growth of fund assets over time across the complex allows Fidelity to reinvest in the development of services designed to enhance the value and convenience of the Fidelity funds as investment vehicles. These services include 24-hour access to account information and market information over the Internet and through telephone representatives, investor education materials and asset allocation tools. The Board also considered that it reviews customer service metrics such as telephone response times, continuity of services on the website and metrics addressing services at Fidelity Investor Centers.
Investment in a Large Fund Family. The Board considered the benefits to shareholders of investing in a fund that is part of a large family of funds offering a variety of investment disciplines and providing a large variety of fund investor services. The Board noted that Fidelity had taken, or had made recommendations that resulted in the Fidelity funds taking, a number of actions over the previous year that benefited particular funds and/or the Fidelity funds in general.
Investment Performance. The Board took into account discussions that occur with representatives of the Investment Advisers, and reports that it receives, at Board meetings throughout the year, relating to fund investment performance. In this regard, the Board noted that as part of regularly scheduled fund reviews and other reports to the Board on fund performance, the Board considered annualized return information for the fund for different time periods, measured against an appropriate securities market index (benchmark index). The Board also considered information about performance attribution. In its ongoing evaluation of fund investment performance, the Board gives particular attention to information indicating changes in performance of the funds over different time periods and discussed with the Investment Advisers the reasons for any overperformance or underperformance. Each of Fidelity Advisor Health Care Fund and Fidelity Advisor Semiconductors Fund underperformed its benchmark for the one-, three-, and five-year periods ended February 29, 2024, and as a result, the Board continues to engage in discussions with FMR about the steps it is taking to address the fund's performance.
In addition to reviewing absolute and relative fund performance, the Independent Trustees periodically consider the appropriateness of fund performance metrics in evaluating the results achieved. The Independent Trustees generally give greater weight to fund performance over longer time periods than over shorter time periods. Depending on the circumstances, the Independent Trustees may be satisfied with a fund's performance notwithstanding that it lags its benchmark index or peer group for certain periods.
Based on its review, the Board concluded that the nature, extent, and quality of services provided to each fund under the Advisory Contracts should continue to benefit the shareholders of each fund.
Competitiveness of Management Fee and Total Expense Ratio. The Board was provided with information regarding industry trends in management fees and expenses. The Board considered that, effective March 1, 2024, an amended Advisory Contract with FMR for each fund went into effect with class-level management fees based on tiered schedules and subject to a maximum class-level rate (the management fee). The Board also considered that in exchange for the variable management fee, each class of each fund receives investment advisory, management, administrative, transfer agent, and pricing and bookkeeping services. In its review of the management fee and total expense ratio of Class I of each fund, the Board considered a pro forma management fee rate for Class I of each fund as if it had been in effect for the 12-month period ended September 30, 2023, as well as other third-party fund expenses, as applicable, such as custodial, legal, and audit fees and any fund-paid 12b-1 fees. The Board noted that Fidelity may agree to waive fees or reimburse expenses from time to time, and the extent to which, if any, it has done so for each fund.
Comparisons of Management Fees and Total Expense Ratios. Among other things, the Board reviewed data for selected groups of competitive funds and classes (referred to as "mapped groups") that were compiled by Fidelity based on combining similar investment objective categories (as classified by Morningstar) that have comparable investment mandates. The data reviewed by the Board included (i) gross management fee comparisons (before taking into account expense reimbursements or caps) relative to the total universe of funds within the mapped group; (ii) gross management fee comparisons relative to a subset of non-Fidelity funds in the mapped group that are similar in size and management fee structure to each fund (referred to as the "asset size peer group"); (iii) total expense comparisons of Class I of each fund relative to funds and classes in the mapped group that have a similar sales load structure to the fund (referred to as the "similar sales load structure group"); and (iv) total expense comparisons of Class I of each fund relative to funds and classes in the similar load structure group that are similar in size and management fee structure to the fund (referred to as the "total expense asset size peer group"). The total expense asset size peer group comparison excludes performance adjustments and fund-paid 12b-1 fees to eliminate variability in fee structures.
The information provided to the Board indicated that each fund's management fee rate ranked below the competitive median of the mapped group for the 12-month period ended September 30, 2023 and below the competitive median of the asset size peer group for the 12-month period ended September 30, 2023. Further, the information provided to the Board indicated that the total expense ratio of Class I of each fund ranked below the competitive median of the similar sales load structure group for the 12-month period ended September 30, 2023 and below the competitive median of the total expense asset size peer group for the 12-month period ended September 30, 2023.
The Board noted that a different variable management fee rate is applicable to each class of the fund. The Board considered that the difference in management fee rates between classes is the result of separate arrangements for class-level services and/or waivers of certain expenses and not the result of any difference in advisory or custodial fees or other expenses related to the management of the fund's assets, which do not vary by class.
Based on its review, the Board concluded that each fund's management fee is fair and reasonable in light of the services that the fund receives and the other factors considered.
Fees Charged to Other Fidelity Clients. The Board also considered Fidelity fee structures and other information with respect to clients of Fidelity, such as other funds advised or subadvised by Fidelity, pension plan clients, and other institutional clients with similar mandates. The Board noted that a joint ad hoc committee created by it and the boards of other Fidelity funds periodically reviews and compares Fidelity's institutional investment advisory business with its business of providing services to the Fidelity funds and also noted the most recent findings of the committee. The Board noted that the committee's review included a consideration of the differences in services provided, fees charged, and costs incurred, as well as competition in the markets serving the different categories of clients.
Based on its review, the Board concluded that each fund's management fee is fair and reasonable in light of the services that the fund receives and the other factors considered. Further, based on its review of total expense ratios and fees charged to other Fidelity clients, the Board concluded that the total expense ratio of each class of each fund was reasonable in light of the services that the fund and its shareholders receive and the other factors considered.
Costs of the Services and Profitability. The Board considered the revenues earned and the expenses incurred by Fidelity in conducting the business of developing, marketing, distributing, managing, administering and servicing each fund and servicing each fund's shareholders. The Board also considered the level of Fidelity's profits in respect of all the Fidelity funds.
On an annual basis, Fidelity presents to the Board information about the profitability of its relationships with each fund. Fidelity calculates profitability information for each fund, as well as aggregate profitability information for groups of Fidelity funds and all Fidelity funds, using a series of detailed revenue and cost allocation methodologies which originate with the books and records of Fidelity on which Fidelity's audited financial statements are based. The Audit Committee of the Board reviews any significant changes from the prior year's methodologies and the full Board approves such changes.
A public accounting firm has been engaged annually by the Board as part of the Board's assessment of Fidelity's profitability analysis. The engagement includes the review and assessment of the methodologies used by Fidelity in determining the revenues and expenses attributable to Fidelity's fund business, and completion of agreed-upon procedures in respect of the mathematical accuracy of certain fund profitability information and its conformity to established allocation methodologies. After considering the reports issued under the engagement and information provided by Fidelity, the Board concluded that while other allocation methods may also be reasonable, Fidelity's profitability methodologies are reasonable in all material respects.
The Board also reviewed Fidelity's non-fund businesses and potential indirect benefits such businesses may have received as a result of their association with Fidelity's fund business (i.e., fall-out benefits) as well as cases where Fidelity's affiliates may benefit from the funds' business. The Board considered areas where potential indirect benefits to the Fidelity funds from their relationships with Fidelity may exist. The Board's consideration of these matters was informed by the findings of a joint ad hoc committee created by it and the boards of other Fidelity funds to evaluate potential fall-out benefits.
The Board considered the costs of the services provided by and the profits realized by Fidelity in connection with the operation of each fund and was satisfied that the profitability was not excessive.
Economies of Scale. The Board considered whether there have been economies of scale in respect of the management of the Fidelity funds, whether the Fidelity funds (including each fund) have appropriately benefited from any such economies of scale, and whether there is potential for realization of any further economies of scale. The Board considered the extent to which each fund will benefit from economies of scale as assets grow through increased services to the fund, through waivers or reimbursements, or through fee or expense ratio reductions. The Board also noted that a committee created by it and the boards of other Fidelity funds periodically analyzes whether Fidelity attains economies of scale in respect of the management and servicing of the Fidelity funds, whether the Fidelity funds have appropriately benefited from such economies of scale, and whether there is potential for realization of any further economies of scale.
The Board recognized that each fund's management contract incorporates a variable management fee structure, which provides breakpoints as a way to share, in part, any potential economies of scale that may exist at the asset class level and through a discount that considers both fund size and total assets of the four applicable asset classes. The Board considered that the variable management fee is designed to deliver the benefits of economies of scale to fund shareholders even if assets of any particular fund are unchanged or have declined, because some portion of Fidelity's costs are attributable to services provided to all funds subject to the variable management fee, and all such funds benefit if those costs can be allocated among more assets. The Board concluded that, given the variable management fee structure, fund shareholders will benefit from lower management fees due to the application of the breakpoints and discount factor, regardless of whether Fidelity achieves any such economies of scale.
The Board concluded, taking into account the analysis of the committee, that economies of scale, if any, are being appropriately shared between fund shareholders and Fidelity.
Additional Information Requested by the Board. In order to develop fully the factual basis for consideration of the Fidelity funds' advisory contracts, the Board requested and received additional information on certain topics, including, but not limited to: (i) fund flow and performance trends, in particular the underperformance of certain funds and strategies, and Fidelity's long-term strategies for certain funds; (ii) the operation of performance fees and the rationale for implementing performance fees on certain categories of funds but not others; (iii) Fidelity's pricing philosophy compared to competitors; (iv) fund profitability methodology and data; (v) evaluation of competitive fund data and peer group classifications and fee and expense comparisons; (vi) the management fee and expense structures for different funds and classes and information about the differences between various fee and expense structures; (vii) the variable management fee implemented for certain funds effective March 1, 2024; and (viii) information regarding other accounts managed by Fidelity and the funds' sub-advisory arrangements.
Conclusion. Based on its evaluation of all of the conclusions noted above, and after considering all factors it believed relevant, the Board, including the Independent Trustees, concluded that the advisory and sub-advisory fee arrangements are fair and reasonable in light of all of the surrounding circumstances and that each fund's Advisory Contracts should be renewed through May 31, 2025.
1.762411.123
AFOC-ANN-0924
Fidelity Advisor® Global Real Estate Fund
Annual Report
July 31, 2024
Contents
To view a fund's proxy voting guidelines and proxy voting record for the 12-month period ended June 30, visit http://www.fidelity.com/proxyvotingresults or visit the Securities and Exchange Commission's (SEC) web site at http://www.sec.gov.
You may also call 1-877-208-0098 to request a free copy of the proxy voting guidelines.
Standard & Poor's, S&P and S&P 500 are registered service marks of The McGraw-Hill Companies, Inc. and have been licensed for use by Fidelity Distributors Corporation.
Other third-party marks appearing herein are the property of their respective owners.
All other marks appearing herein are registered or unregistered trademarks or service marks of FMR LLC or an affiliated company. © 2024 FMR LLC. All rights reserved.
This report and the financial statements contained herein are submitted for the general information of the shareholders of the Fund. This report is not authorized for distribution to prospective investors in the Fund unless preceded or accompanied by an effective prospectus.
A fund files its complete schedule of portfolio holdings with the SEC for the first and third quarters of each fiscal year on Form N-PORT. Forms N-PORT are available on the SEC's web site at http://www.sec.gov. A fund's Forms N-PORT may be reviewed and copied at the SEC's Public Reference Room in Washington, DC. Information regarding the operation of the SEC's Public Reference Room may be obtained by calling 1-800-SEC-0330.
For a complete list of a fund's portfolio holdings, view the most recent holdings listing, semiannual report, or annual report on Fidelity's web site at http://www.fidelity.com, http://www.institutional.fidelity.com, or http://www.401k.com, as applicable.
NOT FDIC INSURED •MAY LOSE VALUE •NO BANK GUARANTEE
Neither the Fund nor Fidelity Distributors Corporation is a bank.
Item 7: Financial Statements and Financial Highlights for Open-End Management Investment Companies (Annual Report)
Fidelity Advisor® Global Real Estate Fund
Schedule of Investments July 31, 2024
Showing Percentage of Net Assets
| Common Stocks - 98.9% |
| | | Shares | Value ($) |
| Australia - 4.9% | | | |
| Arena (REIT) unit | | 31,621 | 79,819 |
| Charter Hall Retail REIT | | 34,126 | 77,885 |
| National Storage REIT unit | | 29,563 | 47,752 |
| Scentre Group unit | | 40,184 | 91,186 |
TOTAL AUSTRALIA | | | 296,642 |
| Belgium - 0.7% | | | |
| Xior Student Housing NV | | 1,309 | 44,058 |
| Xior Student Housing NV rights (a) | | 1,190 | 672 |
TOTAL BELGIUM | | | 44,730 |
| Canada - 3.7% | | | |
| Boardwalk (REIT) | | 2,146 | 121,239 |
| Dream Industrial (REIT) | | 10,301 | 100,574 |
TOTAL CANADA | | | 221,813 |
| France - 2.3% | | | |
| ARGAN SA | | 350 | 28,598 |
| Covivio | | 1,453 | 75,072 |
| Unibail-Rodamco-Westfield NV | | 468 | 35,100 |
TOTAL FRANCE | | | 138,770 |
| Germany - 1.8% | | | |
| LEG Immobilien AG | | 439 | 38,417 |
| Vonovia SE | | 2,264 | 69,611 |
TOTAL GERMANY | | | 108,028 |
| Hong Kong - 1.5% | | | |
| Link (REIT) | | 12,741 | 53,816 |
| Sun Hung Kai Properties Ltd. | | 3,969 | 34,366 |
TOTAL HONG KONG | | | 88,182 |
| Japan - 8.2% | | | |
| Advance Residence Investment Corp. | | 24 | 50,466 |
| GLP J-REIT | | 25 | 21,929 |
| Invincible Investment Corp. | | 7 | 3,182 |
| Katitas Co. Ltd. | | 1,937 | 24,296 |
| LaSalle Logiport REIT | | 83 | 82,111 |
| Mitsubishi Estate Co. Ltd. | | 6,407 | 109,201 |
| Mitsui Fudosan Co. Ltd. | | 13,469 | 139,537 |
| Mitsui Fudosan Logistics Park, Inc. | | 22 | 62,047 |
TOTAL JAPAN | | | 492,769 |
| Singapore - 3.0% | | | |
| CapitaLand Integrated Commercial Trust | | 82,926 | 129,039 |
| Mapletree Pan Asia Commercial Trust | | 20,463 | 19,595 |
| UOL Group Ltd. | | 8,598 | 34,606 |
TOTAL SINGAPORE | | | 183,240 |
| Spain - 1.8% | | | |
| Lar Espana Real Estate Socimi SA | | 4,307 | 37,943 |
| Merlin Properties Socimi SA | | 5,924 | 67,639 |
TOTAL SPAIN | | | 105,582 |
| Sweden - 1.9% | | | |
| Catena AB | | 1,858 | 94,555 |
| Swedish Logistic Property AB (a) | | 5,951 | 21,116 |
TOTAL SWEDEN | | | 115,671 |
| United Kingdom - 8.3% | | | |
| Assura PLC | | 125,537 | 65,683 |
| Grainger Trust PLC | | 49,872 | 154,512 |
| Great Portland Estates PLC | | 2,800 | 12,598 |
| Helical PLC | | 7,623 | 21,951 |
| Londonmetric Properity PLC | | 10,571 | 27,369 |
| Segro PLC | | 6,126 | 72,122 |
| Shaftesbury Capital PLC | | 35,151 | 68,822 |
| Unite Group PLC | | 6,335 | 77,612 |
TOTAL UNITED KINGDOM | | | 500,669 |
| United States of America - 60.8% | | | |
| Acadia Realty Trust (SBI) | | 340 | 7,358 |
| American Homes 4 Rent Class A | | 2,940 | 106,105 |
| Americold Realty Trust | | 2,344 | 70,062 |
| Camden Property Trust (SBI) | | 464 | 51,388 |
| CubeSmart | | 2,908 | 138,363 |
| DiamondRock Hospitality Co. | | 5,346 | 43,998 |
| Digital Realty Trust, Inc. | | 1,195 | 178,641 |
| Elme Communities (SBI) | | 1,344 | 22,122 |
| Equinix, Inc. | | 399 | 315,306 |
| Equity Lifestyle Properties, Inc. | | 442 | 30,357 |
| Equity Residential (SBI) | | 1,903 | 132,506 |
| Extra Space Storage, Inc. | | 698 | 111,415 |
| Flagship Communities (REIT) | | 5,501 | 78,114 |
| Invitation Homes, Inc. | | 2,135 | 75,301 |
| Iron Mountain, Inc. | | 450 | 46,152 |
| Kimco Realty Corp. | | 7,522 | 163,453 |
| Lineage, Inc. | | 320 | 28,122 |
| Mid-America Apartment Communities, Inc. | | 882 | 123,277 |
| NNN (REIT), Inc. | | 3,361 | 150,875 |
| Phillips Edison & Co., Inc. | | 923 | 32,397 |
| Prologis, Inc. | | 4,335 | 546,423 |
| Public Storage Operating Co. | | 801 | 237,032 |
| Realty Income Corp. | | 539 | 30,955 |
| Regency Centers Corp. | | 665 | 44,781 |
| Ryman Hospitality Properties, Inc. | | 269 | 27,037 |
| SITE Centers Corp. | | 3,163 | 48,868 |
| STAG Industrial, Inc. | | 1,147 | 46,809 |
| Sun Communities, Inc. | | 1,088 | 137,882 |
| Tanger, Inc. | | 1,075 | 31,068 |
| Terreno Realty Corp. | | 567 | 38,788 |
| UDR, Inc. | | 3,606 | 144,492 |
| Urban Edge Properties | | 3,125 | 63,438 |
| Ventas, Inc. | | 4,020 | 218,849 |
| Welltower, Inc. | | 1,296 | 144,180 |
TOTAL UNITED STATES OF AMERICA | | | 3,665,914 |
| TOTAL COMMON STOCKS (Cost $5,017,277) | | | 5,962,010 |
| | | | |
| Money Market Funds - 0.6% |
| | | Shares | Value ($) |
Fidelity Cash Central Fund 5.39% (b) (Cost $34,600) | | 34,593 | 34,600 |
| | | | |
| TOTAL INVESTMENT IN SECURITIES - 99.5% (Cost $5,051,877) | 5,996,610 |
NET OTHER ASSETS (LIABILITIES) - 0.5% | 30,736 |
| NET ASSETS - 100.0% | 6,027,346 |
| | |
Legend
| (b) | Affiliated fund that is generally available only to investment companies and other accounts managed by Fidelity Investments. The rate quoted is the annualized seven-day yield of the fund at period end. A complete unaudited listing of the fund's holdings as of its most recent quarter end is available upon request. In addition, each Fidelity Central Fund's financial statements, which are not covered by the Fund's Report of Independent Registered Public Accounting Firm, are available on the SEC's website or upon request. |
Affiliated Central Funds
Fiscal year to date information regarding the Fund's investments in Fidelity Central Funds, including the ownership percentage, is presented below.
| Affiliate | Value, beginning of period ($) | Purchases ($) | Sales Proceeds ($) | Dividend Income ($) | Realized Gain (loss) ($) | Change in Unrealized appreciation (depreciation) ($) | Value, end of period ($) | % ownership, end of period |
| Fidelity Cash Central Fund 5.39% | 128,414 | 863,516 | 957,330 | 3,449 | - | - | 34,600 | 0.0% |
| Total | 128,414 | 863,516 | 957,330 | 3,449 | - | - | 34,600 | |
| | | | | | | | | |
Amounts in the dividend income column in the above table include any capital gain distributions from underlying funds, which are presented in the corresponding line item in the Statement of Operations, if applicable.
Amounts included in the purchases and sales proceeds columns may include in-kind transactions, if applicable.
Investment Valuation
The following is a summary of the inputs used, as of July 31, 2024, involving the Fund's assets and liabilities carried at fair value. The inputs or methodology used for valuing securities may not be an indication of the risk associated with investing in those securities. For more information on valuation inputs, and their aggregation into the levels used below, please refer to the Investment Valuation section in the accompanying Notes to Financial Statements.
| Valuation Inputs at Reporting Date: |
| Description | Total ($) | Level 1 ($) | Level 2 ($) | Level 3 ($) |
Investments in Securities: | | | | |
|
| Equities: | | | | |
Real Estate | 5,962,010 | 5,678,906 | 283,104 | - |
|
| Money Market Funds | 34,600 | 34,600 | - | - |
| Total Investments in Securities: | 5,996,610 | 5,713,506 | 283,104 | - |
Financial Statements
| Statement of Assets and Liabilities |
As of July 31, 2024 |
| Assets | | | | |
| Investment in securities, at value - See accompanying schedule: | | | | |
Unaffiliated issuers (cost $5,017,277) | $ | 5,962,010 | | |
Fidelity Central Funds (cost $34,600) | | 34,600 | | |
| | | | | |
| | | | | |
| Total Investment in Securities (cost $5,051,877) | | | $ | 5,996,610 |
| Cash | | | | 15,166 |
| Receivable for investments sold | | | | 25,902 |
| Receivable for fund shares sold | | | | 3,915 |
| Dividends receivable | | | | 14,369 |
| Distributions receivable from Fidelity Central Funds | | | | 150 |
| Prepaid expenses | | | | 3 |
| Receivable from investment adviser for expense reductions | | | | 46,143 |
| Other receivables | | | | 1,093 |
Total assets | | | | 6,103,351 |
| Liabilities | | | | |
| Payable for investments purchased | $ | 12,386 | | |
| Accrued management fee | | 4,147 | | |
| Distribution and service plan fees payable | | 1,339 | | |
| Audit fee payable | | 49,452 | | |
| Custody fee payable | | 8,428 | | |
| Other payables and accrued expenses | | 253 | | |
| Total liabilities | | | | 76,005 |
| Net Assets | | | $ | 6,027,346 |
| Net Assets consist of: | | | | |
| Paid in capital | | | $ | 5,875,007 |
| Total accumulated earnings (loss) | | | | 152,339 |
| Net Assets | | | $ | 6,027,346 |
| | | | | |
| Net Asset Value and Maximum Offering Price | | | | |
| Class A : | | | | |
Net Asset Value and redemption price per share ($2,937,316 ÷ 270,370 shares)(a) | | | $ | 10.86 |
| Maximum offering price per share (100/94.25 of $10.86) | | | $ | 11.52 |
| Class M : | | | | |
Net Asset Value and redemption price per share ($1,270,674 ÷ 117,280 shares)(a) | | | $ | 10.83 |
| Maximum offering price per share (100/96.50 of $10.83) | | | $ | 11.22 |
| Class C : | | | | |
Net Asset Value and offering price per share ($270,749 ÷ 24,974 shares)(a) | | | $ | 10.84 |
| Class I : | | | | |
Net Asset Value, offering price and redemption price per share ($1,191,004 ÷ 109,378 shares) | | | $ | 10.89 |
| Class Z : | | | | |
Net Asset Value, offering price and redemption price per share ($357,603 ÷ 32,547 shares) | | | $ | 10.99 |
(a)Redemption price per share is equal to net asset value less any applicable contingent deferred sales charge. |
| Statement of Operations |
| Year ended July 31, 2024 |
| Investment Income | | | | |
| Dividends | | | $ | 190,379 |
| Income from Fidelity Central Funds | | | | 3,449 |
| Income before foreign taxes withheld | | | $ | 193,828 |
| Less foreign taxes withheld | | | | (8,408) |
| Total income | | | | 185,420 |
| Expenses | | | | |
| Management fee | $ | 39,729 | | |
| Transfer agent fees | | 5,939 | | |
| Distribution and service plan fees | | 14,155 | | |
| Accounting fees and expenses | | 1,059 | | |
| Custodian fees and expenses | | 17,078 | | |
| Independent trustees' fees and expenses | | 25 | | |
| Registration fees | | 75,224 | | |
| Audit fees | | 62,279 | | |
| Legal | | 5 | | |
| Miscellaneous | | 231 | | |
| Total expenses before reductions | | 215,724 | | |
| Expense reductions | | (152,270) | | |
| Total expenses after reductions | | | | 63,454 |
| Net Investment income (loss) | | | | 121,966 |
| Realized and Unrealized Gain (Loss) | | | | |
| Net realized gain (loss) on: | | | | |
| Investment Securities: | | | | |
| Unaffiliated issuers | | 51,019 | | |
| Foreign currency transactions | | (1,034) | | |
| Total net realized gain (loss) | | | | 49,985 |
| Change in net unrealized appreciation (depreciation) on: | | | | |
| Investment Securities: | | | | |
| Unaffiliated issuers | | 300,351 | | |
| Assets and liabilities in foreign currencies | | (77) | | |
| Total change in net unrealized appreciation (depreciation) | | | | 300,274 |
| Net gain (loss) | | | | 350,259 |
| Net increase (decrease) in net assets resulting from operations | | | $ | 472,225 |
| Statement of Changes in Net Assets |
| |
| | Year ended July 31, 2024 | | Year ended July 31, 2023 |
| Increase (Decrease) in Net Assets | | | | |
| Operations | | | | |
| Net investment income (loss) | $ | 121,966 | $ | 133,483 |
| Net realized gain (loss) | | 49,985 | | (689,970) |
| Change in net unrealized appreciation (depreciation) | | 300,274 | | (11,330) |
| Net increase (decrease) in net assets resulting from operations | | 472,225 | | (567,817) |
| Distributions to shareholders | | (127,792) | | (76,041) |
| | | | | |
| Share transactions - net increase (decrease) | | 445,205 | | (1,482,271) |
| Total increase (decrease) in net assets | | 789,638 | | (2,126,129) |
| | | | | |
| Net Assets | | | | |
| Beginning of period | | 5,237,708 | | 7,363,837 |
| End of period | $ | 6,027,346 | $ | 5,237,708 |
| | | | | |
| | | | | |
Financial Highlights
Fidelity Advisor® Global Real Estate Fund Class A |
| |
| Years ended July 31, | | 2024 | | 2023 | | 2022 | | 2021 | | 2020 |
Selected Per-Share Data | | | | | | | | | | |
| Net asset value, beginning of period | $ | 10.21 | $ | 11.18 | $ | 12.49 | $ | 9.69 | $ | 10.72 |
| Income from Investment Operations | | | | | | | | | | |
Net investment income (loss) A,B | | .23 | | .23 | | .17 | | .17 | | .15 |
| Net realized and unrealized gain (loss) | | .67 | | (1.11) | | (1.33) | | 2.76 | | (.58) |
| Total from investment operations | | .90 | | (.88) | | (1.16) | | 2.93 | | (.43) |
| Distributions from net investment income | | (.25) | | (.09) | | (.15) | | (.13) | | (.23) |
| Distributions from net realized gain | | - | | - | | - | | - | | (.37) |
| Total distributions | | (.25) | | (.09) | | (.15) | | (.13) | | (.60) |
| Net asset value, end of period | $ | 10.86 | $ | 10.21 | $ | 11.18 | $ | 12.49 | $ | 9.69 |
Total Return C,D | | | | (7.81)% | | (9.40)% | | 30.59% | | (4.61)% |
Ratios to Average Net Assets B,E,F | | | | | | | | | | |
| Expenses before reductions | | 4.06% | | 3.85% | | 3.19% | | 4.19% | | 4.22% |
| Expenses net of fee waivers, if any | | | | 1.20% | | 1.28% | | 1.38% | | 1.40% |
| Expenses net of all reductions | | 1.19% | | 1.19% | | 1.28% | | 1.37% | | 1.39% |
| Net investment income (loss) | | 2.31% | | 2.31% | | 1.45% | | 1.60% | | 1.47% |
| Supplemental Data | | | | | | | | | | |
| Net assets, end of period (000 omitted) | $ | 2,937 | $ | 2,771 | $ | 3,021 | $ | 2,747 | $ | 1,732 |
Portfolio turnover rate G | | | | 84% | | 33% | | 32% | | 52% |
ACalculated based on average shares outstanding during the period.
BNet investment income (loss) is affected by the timing of the declaration of dividends by any underlying mutual funds or exchange-traded funds (ETFs). Net investment income (loss) of any mutual funds or ETFs is not included in the Fund's net investment income (loss) ratio.
CTotal returns would have been lower if certain expenses had not been reduced during the applicable periods shown.
DTotal returns do not include the effect of the sales charges.
EFees and expenses of any underlying mutual funds or exchange-traded funds (ETFs) are not included in the Fund's expense ratio. The Fund indirectly bears its proportionate share of these expenses. For additional expense information related to investments in Fidelity Central Funds, please refer to the "Investments in Fidelity Central Funds" note found in the Notes to Financial Statements section of the most recent Annual or Semi-Annual report.
FExpense ratios reflect operating expenses of the class. Expenses before reductions do not reflect amounts reimbursed, waived, or reduced through arrangements with the investment adviser, brokerage services, or other offset arrangements, if applicable, and do not represent the amount paid by the class during periods when reimbursements, waivers or reductions occur.
GAmount does not include the portfolio activity of any underlying mutual funds or exchange-traded funds (ETFs).
Fidelity Advisor® Global Real Estate Fund Class M |
| |
| Years ended July 31, | | 2024 | | 2023 | | 2022 | | 2021 | | 2020 |
Selected Per-Share Data | | | | | | | | | | |
| Net asset value, beginning of period | $ | 10.19 | $ | 11.16 | $ | 12.46 | $ | 9.67 | $ | 10.71 |
| Income from Investment Operations | | | | | | | | | | |
Net investment income (loss) A,B | | .21 | | .20 | | .14 | | .14 | | .12 |
| Net realized and unrealized gain (loss) | | .65 | | (1.11) | | (1.31) | | 2.76 | | (.58) |
| Total from investment operations | | .86 | | (.91) | | (1.17) | | 2.90 | | (.46) |
| Distributions from net investment income | | (.22) | | (.06) | | (.13) | | (.11) | | (.21) |
| Distributions from net realized gain | | - | | - | | - | | - | | (.37) |
| Total distributions | | (.22) | | (.06) | | (.13) | | (.11) | | (.58) |
| Net asset value, end of period | $ | 10.83 | $ | 10.19 | $ | 11.16 | $ | 12.46 | $ | 9.67 |
Total Return C,D | | | | (8.09)% | | (9.51)% | | 30.20% | | (4.87)% |
Ratios to Average Net Assets B,E,F | | | | | | | | | | |
| Expenses before reductions | | 4.39% | | 4.03% | | 3.39% | | 4.41% | | 4.46% |
| Expenses net of fee waivers, if any | | | | 1.45% | | 1.52% | | 1.63% | | 1.66% |
| Expenses net of all reductions | | 1.44% | | 1.45% | | 1.52% | | 1.62% | | 1.64% |
| Net investment income (loss) | | 2.06% | | 2.05% | | 1.21% | | 1.35% | | 1.22% |
| Supplemental Data | | | | | | | | | | |
| Net assets, end of period (000 omitted) | $ | 1,271 | $ | 918 | $ | 1,070 | $ | 876 | $ | 658 |
Portfolio turnover rate G | | | | 84% | | 33% | | 32% | | 52% |
ACalculated based on average shares outstanding during the period.
BNet investment income (loss) is affected by the timing of the declaration of dividends by any underlying mutual funds or exchange-traded funds (ETFs). Net investment income (loss) of any mutual funds or ETFs is not included in the Fund's net investment income (loss) ratio.
CTotal returns would have been lower if certain expenses had not been reduced during the applicable periods shown.
DTotal returns do not include the effect of the sales charges.
EFees and expenses of any underlying mutual funds or exchange-traded funds (ETFs) are not included in the Fund's expense ratio. The Fund indirectly bears its proportionate share of these expenses. For additional expense information related to investments in Fidelity Central Funds, please refer to the "Investments in Fidelity Central Funds" note found in the Notes to Financial Statements section of the most recent Annual or Semi-Annual report.
FExpense ratios reflect operating expenses of the class. Expenses before reductions do not reflect amounts reimbursed, waived, or reduced through arrangements with the investment adviser, brokerage services, or other offset arrangements, if applicable, and do not represent the amount paid by the class during periods when reimbursements, waivers or reductions occur.
GAmount does not include the portfolio activity of any underlying mutual funds or exchange-traded funds (ETFs).
Fidelity Advisor® Global Real Estate Fund Class C |
| |
| Years ended July 31, | | 2024 | | 2023 | | 2022 | | 2021 | | 2020 |
Selected Per-Share Data | | | | | | | | | | |
| Net asset value, beginning of period | $ | 10.21 | $ | 11.17 | $ | 12.47 | $ | 9.63 | $ | 10.63 |
| Income from Investment Operations | | | | | | | | | | |
Net investment income (loss) A,B | | .16 | | .16 | | .09 | | .09 | | .07 |
| Net realized and unrealized gain (loss) | | .66 | | (1.11) | | (1.33) | | 2.75 | | (.58) |
| Total from investment operations | | .82 | | (.95) | | (1.24) | | 2.84 | | (.51) |
| Distributions from net investment income | | (.19) | | (.01) | | (.06) | | - | | (.12) |
| Distributions from net realized gain | | - | | - | | - | | - | | (.37) |
| Total distributions | | (.19) | | (.01) | | (.06) | | - | | (.49) |
| Net asset value, end of period | $ | 10.84 | $ | 10.21 | $ | 11.17 | $ | 12.47 | $ | 9.63 |
Total Return C,D | | | | (8.53)% | | (9.97)% | | 29.49% | | (5.31)% |
Ratios to Average Net Assets B,E,F | | | | | | | | | | |
| Expenses before reductions | | 4.78% | | 4.59% | | 3.93% | | 5.02% | | 4.46% |
| Expenses net of fee waivers, if any | | | | 1.94% | | 2.02% | | 2.14% | | 2.16% |
| Expenses net of all reductions | | 1.94% | | 1.93% | | 2.02% | | 2.13% | | 2.15% |
| Net investment income (loss) | | 1.56% | | 1.57% | | .72% | | .85% | | .71% |
| Supplemental Data | | | | | | | | | | |
| Net assets, end of period (000 omitted) | $ | 271 | $ | 193 | $ | 203 | $ | 223 | $ | 185 |
Portfolio turnover rate G | | | | 84% | | 33% | | 32% | | 52% |
ACalculated based on average shares outstanding during the period.
BNet investment income (loss) is affected by the timing of the declaration of dividends by any underlying mutual funds or exchange-traded funds (ETFs). Net investment income (loss) of any mutual funds or ETFs is not included in the Fund's net investment income (loss) ratio.
CTotal returns would have been lower if certain expenses had not been reduced during the applicable periods shown.
DTotal returns do not include the effect of the contingent deferred sales charge.
EExpense ratios reflect operating expenses of the class. Expenses before reductions do not reflect amounts reimbursed, waived, or reduced through arrangements with the investment adviser, brokerage services, or other offset arrangements, if applicable, and do not represent the amount paid by the class during periods when reimbursements, waivers or reductions occur.
FFees and expenses of any underlying mutual funds or exchange-traded funds (ETFs) are not included in the Fund's expense ratio. The Fund indirectly bears its proportionate share of these expenses. For additional expense information related to investments in Fidelity Central Funds, please refer to the "Investments in Fidelity Central Funds" note found in the Notes to Financial Statements section of the most recent Annual or Semi-Annual report.
GAmount does not include the portfolio activity of any underlying mutual funds or exchange-traded funds (ETFs).
Fidelity Advisor® Global Real Estate Fund Class I |
| |
| Years ended July 31, | | 2024 | | 2023 | | 2022 | | 2021 | | 2020 |
Selected Per-Share Data | | | | | | | | | | |
| Net asset value, beginning of period | $ | 10.23 | $ | 11.21 | $ | 12.51 | $ | 9.71 | $ | 10.75 |
| Income from Investment Operations | | | | | | | | | | |
Net investment income (loss) A,B | | .26 | | .25 | | .20 | | .20 | | .17 |
| Net realized and unrealized gain (loss) | | .67 | | (1.11) | | (1.32) | | 2.76 | | (.58) |
| Total from investment operations | | .93 | | (.86) | | (1.12) | | 2.96 | | (.41) |
| Distributions from net investment income | | (.27) | | (.12) | | (.18) | | (.16) | | (.26) |
| Distributions from net realized gain | | - | | - | | - | | - | | (.37) |
| Total distributions | | (.27) | | (.12) | | (.18) | | (.16) | | (.63) |
| Net asset value, end of period | $ | 10.89 | $ | 10.23 | $ | 11.21 | $ | 12.51 | $ | 9.71 |
Total Return C | | | | (7.61)% | | (9.12)% | | 30.82% | | (4.40)% |
Ratios to Average Net Assets B,D,E | | | | | | | | | | |
| Expenses before reductions | | 3.75% | | 3.31% | | 2.94% | | 3.81% | | 3.97% |
| Expenses net of fee waivers, if any | | | | .95% | | 1.02% | | 1.13% | | 1.16% |
| Expenses net of all reductions | | .94% | | .95% | | 1.02% | | 1.12% | | 1.14% |
| Net investment income (loss) | | 2.56% | | 2.55% | | 1.71% | | 1.85% | | 1.71% |
| Supplemental Data | | | | | | | | | | |
| Net assets, end of period (000 omitted) | $ | 1,191 | $ | 1,162 | $ | 1,766 | $ | 1,483 | $ | 1,066 |
Portfolio turnover rate F | | | | 84% | | 33% | | 32% | | 52% |
ACalculated based on average shares outstanding during the period.
BNet investment income (loss) is affected by the timing of the declaration of dividends by any underlying mutual funds or exchange-traded funds (ETFs). Net investment income (loss) of any mutual funds or ETFs is not included in the Fund's net investment income (loss) ratio.
CTotal returns would have been lower if certain expenses had not been reduced during the applicable periods shown.
DFees and expenses of any underlying mutual funds or exchange-traded funds (ETFs) are not included in the Fund's expense ratio. The Fund indirectly bears its proportionate share of these expenses. For additional expense information related to investments in Fidelity Central Funds, please refer to the "Investments in Fidelity Central Funds" note found in the Notes to Financial Statements section of the most recent Annual or Semi-Annual report.
EExpense ratios reflect operating expenses of the class. Expenses before reductions do not reflect amounts reimbursed, waived, or reduced through arrangements with the investment adviser, brokerage services, or other offset arrangements, if applicable, and do not represent the amount paid by the class during periods when reimbursements, waivers or reductions occur.
FAmount does not include the portfolio activity of any underlying mutual funds or exchange-traded funds (ETFs).
Fidelity Advisor® Global Real Estate Fund Class Z |
| |
| Years ended July 31, | | 2024 | | 2023 | | 2022 | | 2021 | | 2020 |
Selected Per-Share Data | | | | | | | | | | |
| Net asset value, beginning of period | $ | 10.31 | $ | 11.28 | $ | 12.56 | $ | 9.73 | $ | 10.76 |
| Income from Investment Operations | | | | | | | | | | |
Net investment income (loss) A,B | | .27 | | .28 | | .22 | | .22 | | .19 |
| Net realized and unrealized gain (loss) | | .68 | | (1.13) | | (1.32) | | 2.77 | | (.59) |
| Total from investment operations | | .95 | | (.85) | | (1.10) | | 2.99 | | (.40) |
| Distributions from net investment income | | (.27) | | (.12) | | (.18) | | (.16) | | (.26) |
| Distributions from net realized gain | | - | | - | | - | | - | | (.37) |
| Total distributions | | (.27) | | (.12) | | (.18) | | (.16) | | (.63) |
| Net asset value, end of period | $ | 10.99 | $ | 10.31 | $ | 11.28 | $ | 12.56 | $ | 9.73 |
Total Return C | | | | (7.48)% | | (8.93)% | | 31.07% | | (4.29)% |
Ratios to Average Net Assets B,D,E | | | | | | | | | | |
| Expenses before reductions | | 3.61% | | 3.38% | | 2.71% | | 3.72% | | 3.54% |
| Expenses net of fee waivers, if any | | | | .80% | | .89% | | .97% | | 1.02% |
| Expenses net of all reductions | | .79% | | .80% | | .89% | | .96% | | 1.00% |
| Net investment income (loss) | | 2.71% | | 2.70% | | 1.84% | | 2.01% | | 1.86% |
| Supplemental Data | | | | | | | | | | |
| Net assets, end of period (000 omitted) | $ | 358 | $ | 194 | $ | 1,303 | $ | 1,180 | $ | 233 |
Portfolio turnover rate F | | | | 84% | | 33% | | 32% | | 52% |
ACalculated based on average shares outstanding during the period.
BNet investment income (loss) is affected by the timing of the declaration of dividends by any underlying mutual funds or exchange-traded funds (ETFs). Net investment income (loss) of any mutual funds or ETFs is not included in the Fund's net investment income (loss) ratio.
CTotal returns would have been lower if certain expenses had not been reduced during the applicable periods shown.
DFees and expenses of any underlying mutual funds or exchange-traded funds (ETFs) are not included in the Fund's expense ratio. The Fund indirectly bears its proportionate share of these expenses. For additional expense information related to investments in Fidelity Central Funds, please refer to the "Investments in Fidelity Central Funds" note found in the Notes to Financial Statements section of the most recent Annual or Semi-Annual report.
EExpense ratios reflect operating expenses of the class. Expenses before reductions do not reflect amounts reimbursed, waived, or reduced through arrangements with the investment adviser, brokerage services, or other offset arrangements, if applicable, and do not represent the amount paid by the class during periods when reimbursements, waivers or reductions occur.
FAmount does not include the portfolio activity of any underlying mutual funds or exchange-traded funds (ETFs).
Notes to Financial Statements
For the period ended July 31, 2024
1. Organization.
Fidelity Advisor Global Real Estate Fund (the Fund) is a fund of Fidelity Advisor Series VII (the Trust) and is authorized to issue an unlimited number of shares. The Trust is registered under the Investment Company Act of 1940, as amended (the 1940 Act), as an open-end management investment company organized as a Massachusetts business trust. The Fund offers Class A, Class M, Class C, Class I and Class Z shares, each of which has equal rights as to assets and voting privileges. Class A, Class M, Class C, Class I and Class Z are Fidelity Advisor classes. Each class has exclusive voting rights with respect to matters that affect that class. Class C shares will automatically convert to Class A shares after a holding period of eight years from the initial date of purchase, with certain exceptions.
2. Investments in Fidelity Central Funds.
Funds may invest in Fidelity Central Funds, which are open-end investment companies generally available only to other investment companies and accounts managed by the investment adviser and its affiliates. The Schedule of Investments lists any Fidelity Central Funds held as an investment as of period end, but does not include the underlying holdings of each Fidelity Central Fund. An investing fund indirectly bears its proportionate share of the expenses of the underlying Fidelity Central Funds.
Based on its investment objective, each Fidelity Central Fund may invest or participate in various investment vehicles or strategies that are similar to those of the investing fund. These strategies are consistent with the investment objectives of the investing fund and may involve certain economic risks which may cause a decline in value of each of the Fidelity Central Funds and thus a decline in the value of the investing fund.
| Fidelity Central Fund | Investment Manager | Investment Objective | Investment Practices | Expense RatioA |
| Fidelity Money Market Central Funds | Fidelity Management & Research Company LLC (FMR) | Each fund seeks to obtain a high level of current income consistent with the preservation of capital and liquidity. | Short-term Investments | Less than .005% |
A Expenses expressed as a percentage of average net assets and are as of each underlying Central Fund's most recent annual or semi-annual shareholder report.
A complete unaudited list of holdings for each Fidelity Central Fund is available upon request or at the Securities and Exchange Commission website at www.sec.gov. In addition, the financial statements of the Fidelity Central Funds which contain the significant accounting policies (including investment valuation policies) of those funds, and are not covered by the Report of Independent Registered Public Accounting Firm, are available on the Securities and Exchange Commission website or upon request.
3. Significant Accounting Policies.
The Fund is an investment company and applies the accounting and reporting guidance of the Financial Accounting Standards Board (FASB) Accounting Standards Codification Topic 946 Financial Services - Investment Companies. The financial statements have been prepared in conformity with accounting principles generally accepted in the United States of America (GAAP), which require management to make certain estimates and assumptions at the date of the financial statements. Actual results could differ from those estimates. Subsequent events, if any, through the date that the financial statements were issued have been evaluated in the preparation of the financial statements. The Fund's Schedule of Investments lists any underlying mutual funds or exchange-traded funds (ETFs) but does not include the underlying holdings of these funds. The following summarizes the significant accounting policies of the Fund:
Investment Valuation. Investments are valued as of 4:00 p.m. Eastern time on the last calendar day of the period. The Board of Trustees (the Board) has designated the Fund's investment adviser as the valuation designee responsible for the fair valuation function and performing fair value determinations as needed. The investment adviser has established a Fair Value Committee (the Committee) to carry out the day-to-day fair valuation responsibilities and has adopted policies and procedures to govern the fair valuation process and the activities of the Committee. In accordance with these fair valuation policies and procedures, which have been approved by the Board, the Fund attempts to obtain prices from one or more third party pricing services or brokers to value its investments. When current market prices, quotations or currency exchange rates are not readily available or reliable, investments will be fair valued in good faith by the Committee, in accordance with the policies and procedures. Factors used in determining fair value vary by investment type and may include market or investment specific events, transaction data, estimated cash flows, and market observations of comparable investments. The frequency that the fair valuation procedures are used cannot be predicted and they may be utilized to a significant extent. The Committee manages the Fund's fair valuation practices and maintains the fair valuation policies and procedures. The Fund's investment adviser reports to the Board information regarding the fair valuation process and related material matters.
The Fund categorizes the inputs to valuation techniques used to value its investments into a disclosure hierarchy consisting of three levels as shown below:
Level 1 - unadjusted quoted prices in active markets for identical investments
Level 2 - other significant observable inputs (including quoted prices for similar investments, interest rates, prepayment speeds, etc.)
Level 3 - unobservable inputs (including the Fund's own assumptions based on the best information available)
Valuation techniques used to value the Fund's investments by major category are as follows:
Equity securities, including restricted securities, for which market quotations are readily available, are valued at the last reported sale price or official closing price as reported by a third party pricing service on the primary market or exchange on which they are traded and are categorized as Level 1 in the hierarchy. In the event there were no sales during the day or closing prices are not available, securities are valued at the last quoted bid price or may be valued using the last available price and are generally categorized as Level 2 in the hierarchy. For foreign equity securities, when market or security specific events arise, comparisons to the valuation of American Depositary Receipts (ADRs), futures contracts, Exchange-Traded Funds (ETFs) and certain indexes as well as quoted prices for similar securities may be used and would be categorized as Level 2 in the hierarchy. For equity securities, including restricted securities, where observable inputs are limited, assumptions about market activity and risk are used and these securities may be categorized as Level 3 in the hierarchy.
Investments in open-end mutual funds, including the Fidelity Central Funds, are valued at their closing net asset value (NAV) each business day and are categorized as Level 1 in the hierarchy.
Changes in valuation techniques may result in transfers in or out of an assigned level within the disclosure hierarchy. The aggregate value of investments by input level as of July 31, 2024 is included at the end of the Fund's Schedule of Investments.
Foreign Currency. Certain Funds may use foreign currency contracts to facilitate transactions in foreign-denominated securities. Gains and losses from these transactions may arise from changes in the value of the foreign currency or if the counterparties do not perform under the contracts' terms.
Foreign-denominated assets, including investment securities, and liabilities are translated into U.S. dollars at the exchange rates at period end. Purchases and sales of investment securities, income and dividends received, and expenses denominated in foreign currencies are translated into U.S. dollars at the exchange rate in effect on the transaction date.
The effects of exchange rate fluctuations on investments are included with the net realized and unrealized gain (loss) on investment securities. Other foreign currency transactions resulting in realized and unrealized gain (loss) are disclosed separately.
Investment Transactions and Income. For financial reporting purposes, the Fund's investment holdings and NAV include trades executed through the end of the last business day of the period. The NAV per share for processing shareholder transactions is calculated as of the close of business of the New York Stock Exchange (NYSE), normally 4:00 p.m. Eastern time and includes trades executed through the end of the prior business day. Gains and losses on securities sold are determined on the basis of identified cost. Commissions paid to certain brokers with whom the investment adviser, or its affiliates, places trades on behalf of a fund include an amount in addition to trade execution, which may be rebated back to a fund. Any such rebates are included in net realized gain (loss) on investments in the Statement of Operations. Dividend income is recorded on the ex-dividend date, except for certain dividends from foreign securities where the ex-dividend date may have passed, which are recorded as soon as the Fund is informed of the ex-dividend date. Non-cash dividends included in dividend income, if any, are recorded at the fair market value of the securities received. Income and capital gain distributions from Fidelity Central Funds, if any, are recorded on the ex-dividend date. Certain distributions received by the Fund represent a return of capital or capital gain. The Fund determines the components of these distributions subsequent to the ex-dividend date, based upon receipt of tax filings or other correspondence relating to the underlying investment. These distributions are recorded as a reduction of cost of investments and/or as a realized gain. Investment income is recorded net of foreign taxes withheld where recovery of such taxes is uncertain. Funds may file withholding tax reclaims in certain jurisdictions to recover a portion of amounts previously withheld. Any withholding tax reclaims income is included in the Statement of Operations in foreign taxes withheld. Any receivables for withholding tax reclaims are included in the Statement of Assets and Liabilities in dividends receivable.
Class Allocations and Expenses. Investment income, realized and unrealized capital gains and losses, common expenses of a fund, and certain fund-level expense reductions, if any, are allocated daily on a pro-rata basis to each class based on the relative net assets of each class to the total net assets of a fund. Each class differs with respect to transfer agent and distribution and service plan fees incurred, as applicable. Certain expense reductions may also differ by class, if applicable. For the reporting period, the allocated portion of income and expenses to each class as a percent of its average net assets may vary due to the timing of recording these transactions in relation to fluctuating net assets of the classes. Expenses directly attributable to a fund are charged to that fund. Expenses attributable to more than one fund are allocated among the respective funds on the basis of relative net assets or other appropriate methods. Expenses included in the accompanying financial statements reflect the expenses of that fund and do not include any expenses associated with any underlying mutual funds or exchange-traded funds (ETFs). Although not included in a fund's expenses, a fund indirectly bears its proportionate share of these expenses through the net asset value of each underlying mutual fund or exchange-traded fund (ETF). Expense estimates are accrued in the period to which they relate and adjustments are made when actual amounts are known.
Income Tax Information and Distributions to Shareholders. Each year, the Fund intends to qualify as a regulated investment company under Subchapter M of the Internal Revenue Code, including distributing substantially all of its taxable income and realized gains. As a result, no provision for U.S. Federal income taxes is required. As of July 31, 2024, the Fund did not have any unrecognized tax benefits in the financial statements; nor is the Fund aware of any tax positions for which it is reasonably possible that the total amounts of unrecognized tax benefits will significantly change in the next twelve months. The Fund files a U.S. federal tax return, in addition to state and local tax returns as required. The Fund's federal income tax returns are subject to examination by the Internal Revenue Service (IRS) for a period of three fiscal years after they are filed. State and local tax returns may be subject to examination for an additional fiscal year depending on the jurisdiction. Foreign taxes are provided for based on the Fund's understanding of the tax rules and rates that exist in the foreign markets in which it invests.
Distributions are declared and recorded on the ex-dividend date. Income and capital gain distributions are declared separately for each class. Income and capital gain distributions are determined in accordance with income tax regulations, which may differ from GAAP.
Capital accounts within the financial statements are adjusted for permanent book-tax differences. These adjustments have no impact on net assets or the results of operations. Capital accounts are not adjusted for temporary book-tax differences which will reverse in a subsequent period.
Book-tax differences are primarily due to foreign currency transactions, passive foreign investment companies (PFIC), capital loss carryforwards and losses deferred due to wash sales.
As of period end, the cost and unrealized appreciation (depreciation) in securities, and derivatives if applicable, for federal income tax purposes were as follows:
Gross unrealized appreciation | $1,062,960 |
Gross unrealized depreciation | (189,257) |
Net unrealized appreciation (depreciation) | $873,703 |
Tax Cost | $5,122,907 |
The tax-based components of distributable earnings as of period end were as follows:
Undistributed ordinary income | $95,421 |
Capital loss carryforward | $(816,613) |
| Net unrealized appreciation (depreciation) on securities and other investments | $873,530 |
| | |
Capital loss carryforwards are only available to offset future capital gains of the Fund to the extent provided by regulations and may be limited. The capital loss carryforward information presented below, including any applicable limitation, is estimated as of fiscal period end and is subject to adjustment.
Short-term | $(527,079) |
Long-term | (289,534) |
| Total capital loss carryforward | $(816,613) |
The tax character of distributions paid was as follows:
| | July 31, 2024 | July 31, 2023 |
Ordinary Income | $127,792 | $ 76,041 |
Total | $127,792 | $ 76,041 |
4. Purchases and Sales of Investments.
Purchases and sales of securities, other than short-term securities, and in-kind transactions, as applicable, are noted in the table below.
| | Purchases ($) | Sales ($) |
Fidelity Advisor Global Real Estate Fund | 2,165,420 | 1,666,328 |
5. Fees and Other Transactions with Affiliates.
Management Fee. Fidelity Management & Research Company LLC (the investment adviser) and its affiliates provide the Fund with investment management related services for which the Fund pays a monthly management fee.
Effective March 1, 2024, the Fund's management contract was amended to incorporate administrative services previously covered under separate services agreements (Transfer Agent and Accounting agreements). The amended contract incorporates a management fee rate that may vary by class. The investment adviser or an affiliate pays certain expenses of managing and operating the Fund out of each class's management fee. Each class of the Fund pays a management fee to the investment adviser. The management fee is calculated and paid to the investment adviser every month. When determining a class's management fee, a mandate rate is calculated based on the monthly average net assets of a group of funds advised by FMR within a designated asset class. A discount rate is subtracted from the mandate rate once the Fund's monthly average net assets reach a certain level. The mandate rate and discount rate may vary by class. The annual management fee rate for a class of shares of the Fund is the lesser of (1) the class's mandate rate reduced by the class's discount rate (if applicable) or (2) the amount set forth in the following table.
| | Maximum Management Fee Rate % |
| Class A | .87 |
| Class M | .87 |
| Class C | .87 |
| Class I | .80 |
| Class Z | .71 |
One-twelfth of the management fee rate for a class is applied to the average net assets of the class for the month, giving a dollar amount which is the management fee for the class for that month. A different management fee rate may be applicable to each class of the Fund. The difference between classes is the result of separate arrangements for class-level services and/or waivers of certain expenses. It is not the result of any difference in advisory or custodial fees or other expenses related to the management of the Fund's assets, which do not vary by class. For the portion of the reporting period on or after March 1, 2024, the total annualized management fee rates were as follows:
| | Total Management Fee Rate % |
| Class A | .87 |
| Class M | .87 |
| Class C | .87 |
| Class I | .80 |
| Class Z | .71 |
| | |
Prior to March 1, 2024, the management fee was the sum of an individual fund fee rate that was based on an annual rate of .45% of the Fund's average net assets and an annualized group fee rate that averaged .22% during the period. The group fee rate was based upon the monthly average net assets of a group of registered investment companies with which the investment adviser has management contracts. The group fee rate decreased as assets under management increased and increased as assets under management decreased. For the portion of the reporting period prior to March 1, 2024, the total annualized management fee rate was .67%.
Effective March 1, 2024, the Fund's sub-advisory agreements with FMR Investment Management (UK) Limited, Fidelity Management & Research (Hong Kong) Limited, and Fidelity Management & Research (Japan) Limited were amended to provide that the investment adviser pays each sub-adviser monthly fees equal to 110% of the sub-adviser's costs for providing sub-advisory services.
Distribution and Service Plan Fees. In accordance with Rule 12b-1 of the 1940 Act, the Fund has adopted separate Distribution and Service Plans for each class of shares. Certain classes pay Fidelity Distributors Company LLC (FDC), an affiliate of the investment adviser, separate Distribution and Service Fees, each of which is based on an annual percentage of each class' average net assets. In addition, FDC may pay financial intermediaries for selling shares of the Fund and providing shareholder support services. For the period, the Distribution and Service Fee rates, total fees and amounts retained by FDC were as follows:
| | Distribution Fee | Service Fee | Total Fees ($) | Retained by FDC ($) |
Class A | - % | .25% | 6,743 | 5,151 |
Class M | .25% | .25% | 4,900 | 2,774 |
| Class C | .75% | .25% | 2,512 | 1,448 |
| | | | 14,155 | 9,373 |
Sales Load. FDC may receive a front-end sales charge of up to 5.75% for selling Class A shares and 3.50% for selling Class M shares, some of which is paid to financial intermediaries for selling shares of the Fund. Depending on the holding period, FDC may receive contingent deferred sales charges levied on Class A, Class M and Class C redemptions. The deferred sales charges are 1.00% for Class C shares, 1.00% for certain purchases of Class A shares and .25% for certain purchases of Class M shares.
For the period, sales charge amounts retained by FDC were as follows:
| | Retained by FDC ($) |
Class A | 681 |
Class M | 136 |
Class CA | 8 |
| | 825 |
A When Class C shares are initially sold, FDC pays commissions from its own resources to financial intermediaries through which the sales are made.
Transfer Agent Fees. Fidelity Investments Institutional Operations Company LLC (FIIOC), an affiliate of the investment adviser, is the transfer, dividend disbursing and shareholder servicing agent for each class of the Fund. Effective March 1, 2024, the Fund's management contract was amended to incorporate transfer agent services and associated fees previously covered under a separate services agreement. FIIOC pays for typesetting, printing and mailing of shareholder reports, except proxy statements.
During the period December 1, 2023 through February 29, 2024, the transfer agent fees for each class were a fixed annual rate of class-level average net assets as follows:
| | | % of Class-Level Average Net Assets |
| Class A | | .2000 |
| Class M | | .1995 |
| Class C | | .2000 |
| Class I | | .1333 |
Class Z | | .0420 |
| | | |
Prior to December 1, 2023, FIIOC received account fees and asset-based fees that varied according to the account size and type of account of the shareholders of the respective classes of the Fund, except for Class Z. FIIOC received an asset-based fee of Class Z's average net assets. For the portion of the reporting period prior to March 1, 2024, the fees were equivalent to the following annualized rates:
| | Amount ($) | % of Class-Level Average Net Assets |
Class A | 3,588 | .23 |
Class M | 1,077 | .21 |
Class C | 318 | .23 |
Class I | 891 | .14 |
Class Z | 65 5,939 | .04 |
Accounting Fees. Fidelity Service Company, Inc. (FSC), an affiliate of the investment adviser, maintains the Fund's accounting records. Effective March 1, 2024, the Fund's management contract was amended to incorporate accounting services and associated fees previously covered under a separate services agreement.
During the period December 1, 2023 through February 29, 2024, the accounting fees were a fixed annual rate of average net assets as follows:
| | % of Average Net Assets |
Fidelity Advisor Global Real Estate Fund | .0354 |
Prior to December 1, 2023, the accounting fee was based on the level of average net assets for each month. For the portion of the reporting period prior to March 1, 2024, the fees were equivalent to the following annualized rates:
| | % of Average Net Assets |
| Fidelity Advisor Global Real Estate Fund | .04 |
Brokerage Commissions. A portion of portfolio transactions were placed with brokerage firms which are affiliates of the investment adviser. Brokerage commissions are included in net realized gain (loss) and change in net unrealized appreciation (depreciation) in the Statement of Operations. The commissions paid to these affiliated firms were as follows:
| | Amount ($) |
Fidelity Advisor Global Real Estate Fund | 71 |
Interfund Trades. Funds may purchase from or sell securities to other Fidelity Funds under procedures adopted by the Board. The procedures have been designed to ensure these interfund trades are executed in accordance with Rule 17a-7 of the 1940 Act. Any interfund trades are included within the respective purchases and sales amounts shown in the Purchases and Sales of Investments note. Interfund trades during the period are noted in the table below.
| | Purchases ($) | Sales ($) | Realized Gain (Loss)($) |
Fidelity Advisor Global Real Estate Fund | 77,611 | 76,175 | (4,464) |
6. Committed Line of Credit.
Certain Funds participate with other funds managed by the investment adviser or an affiliate in a $4.25 billion credit facility (the "line of credit") to be utilized for temporary or emergency purposes to fund shareholder redemptions or for other short-term liquidity purposes. The participating funds have agreed to pay commitment fees on their pro-rata portion of the line of credit, which are reflected in Miscellaneous expenses on the Statement of Operations, and are listed below. During the period, there were no borrowings on this line of credit.
| | Amount ($) |
Fidelity Advisor Global Real Estate Fund | 9 |
7. Expense Reductions.
The investment adviser contractually agreed to reimburse expenses of each class to the extent annual operating expenses exceeded certain levels of class-level average net assets as noted in the table below. This reimbursement will remain in place through November 30, 2025. Some expenses, for example the compensation of the independent Trustees, and certain miscellaneous expenses such as proxy and shareholder meeting expenses, are excluded from this reimbursement.
The following classes were in reimbursement during the period:
| | Expense Limitations | Reimbursement ($) |
Class A | 1.20% | 76,899 |
Class M | 1.45% | 28,739 |
| Class C | 1.95% | 7,095 |
| Class I | .95% | 30,553 |
Class Z | .80% | 8,140 |
| | | 151,426 |
Through arrangements with the Fund's custodian, credits realized as a result of certain uninvested cash balances were used to reduce the Fund's expenses. During the period, custodian credits reduced the Fund's expenses by $509.
In addition, during the period the investment adviser or an affiliate reimbursed and/or waived a portion of fund-level operating expenses in the amount of $335.
8. Distributions to Shareholders.
Distributions to shareholders of each class were as follows:
| | Year ended July 31, 2024 | Year ended July 31, 2023 |
| Fidelity Advisor Global Real Estate Fund | | |
| Distributions to shareholders | | |
Class A | $65,583 | $23,736 |
| Class M | 20,354 | 5,995 |
Class C | 4,497 | 136 |
Class I | 28,380 | 43,870 |
| Class Z | 8,978 | 2,304 |
Total | $127,792 | $76,041 |
9. Share Transactions.
Share transactions for each class were as follows and may contain in-kind transactions, automatic conversions between classes or exchanges between affiliated funds:
| | Shares | Shares | Dollars | Dollars |
| | Year ended July 31, 2024 | Year ended July 31, 2023 | Year ended July 31, 2024 | Year ended July 31, 2023 |
| Fidelity Advisor Global Real Estate Fund | | | | |
| Class A | | | | |
| Shares sold | 25,269 | 40,105 | $253,147 | $395,082 |
| Reinvestment of distributions | 6,294 | 2,489 | 65,581 | 23,736 |
| Shares redeemed | (32,550) | (41,363) | (322,865) | (410,949) |
| Net increase (decrease) | (987) | 1,231 | $(4,137) | $7,869 |
| Class M | | | | |
| Shares sold | 36,978 | 7,122 | $377,014 | $70,044 |
| Reinvestment of distributions | 1,957 | 629 | 20,354 | 5,995 |
| Shares redeemed | (11,751) | (13,581) | (115,045) | (130,257) |
| Net increase (decrease) | 27,184 | (5,830) | $282,323 | $(54,218) |
| Class C | | | | |
| Shares sold | 11,367 | 5,080 | $113,511 | $50,554 |
| Reinvestment of distributions | 431 | 14 | 4,497 | 136 |
| Shares redeemed | (5,682) | (4,441) | (56,703) | (44,663) |
| Net increase (decrease) | 6,116 | 653 | $61,305 | $6,027 |
| Class I | | | | |
| Shares sold | 10,965 | 267,118 | $111,722 | $2,612,072 |
| Reinvestment of distributions | 2,677 | 4,304 | 27,921 | 41,084 |
| Shares redeemed | (17,818) | (315,343) | (169,830) | (3,144,342) |
| Net increase (decrease) | (4,176) | (43,921) | $(30,187) | $(491,186) |
| Class Z | | | | |
| Shares sold | 17,973 | 79,530 | $179,119 | $764,368 |
| Reinvestment of distributions | 577 | 240 | 6,068 | 2,304 |
| Shares redeemed | (4,792) | (176,559) | (49,286) | (1,717,435) |
| Net increase (decrease) | 13,758 | (96,789) | $135,901 | $(950,763) |
10. Other.
A fund's organizational documents provide former and current trustees and officers with a limited indemnification against liabilities arising in connection with the performance of their duties to the fund. In the normal course of business, a fund may also enter into contracts that provide general indemnifications. A fund's maximum exposure under these arrangements is unknown as this would be dependent on future claims that may be made against a fund. The risk of material loss from such claims is considered remote.
At the end of the period, the investment adviser or its affiliates were owners of record of more than 10% of the outstanding shares as follows:
| Fund | Affiliated % |
| Fidelity Advisor Global Real Estate Fund | 44% |
11. Risk and Uncertainties.
Many factors affect a fund's performance. Developments that disrupt global economies and financial markets, such as pandemics, epidemics, outbreaks of infectious diseases, war, terrorism, and environmental disasters, may significantly affect a fund's investment performance. The effects of these developments to a fund will be impacted by the types of securities in which a fund invests, the financial condition, industry, economic sector, and geographic location of an issuer, and a fund's level of investment in the securities of that issuer. Significant concentrations in security types, issuers, industries, sectors, and geographic locations may magnify the factors that affect a fund's performance.
Report of Independent Registered Public Accounting Firm
To the Board of Trustees of Fidelity Advisor Series VII and the Shareholders of Fidelity Advisor Global Real Estate Fund:
Opinion on the Financial Statements and Financial Highlights
We have audited the accompanying statement of assets and liabilities of Fidelity Advisor Global Real Estate Fund (the "Fund"), a fund of Fidelity Advisor Series VII, including the schedule of investments, as of July 31, 2024, the related statement of operations for the year then ended, the statement of changes in net assets for each of the two years in the period then ended, the financial highlights for each of the five years in the period then ended, and the related notes. In our opinion, the financial statements and financial highlights present fairly, in all material respects, the financial position of the Fund as of July 31, 2024, and the results of its operations for the year then ended, the changes in its net assets for each of the two years in the period then ended, and the financial highlights for each of the five years in the period then ended in conformity with accounting principles generally accepted in the United States of America.
Basis for Opinion
These financial statements and financial highlights are the responsibility of the Fund's management. Our responsibility is to express an opinion on the Fund's financial statements and financial highlights based on our audits. We are a public accounting firm registered with the Public Company Accounting Oversight Board (United States) (PCAOB) and are required to be independent with respect to the Fund in accordance with the U.S. federal securities laws and the applicable rules and regulations of the Securities and Exchange Commission and the PCAOB.
We conducted our audits in accordance with the standards of the PCAOB. Those standards require that we plan and perform the audit to obtain reasonable assurance about whether the financial statements and financial highlights are free of material misstatement, whether due to error or fraud. The Fund is not required to have, nor were we engaged to perform, an audit of its internal control over financial reporting. As part of our audits, we are required to obtain an understanding of internal control over financial reporting but not for the purpose of expressing an opinion on the effectiveness of the Fund's internal control over financial reporting. Accordingly, we express no such opinion.
Our audits included performing procedures to assess the risks of material misstatement of the financial statements and financial highlights, whether due to error or fraud, and performing procedures that respond to those risks. Such procedures included examining, on a test basis, evidence regarding the amounts and disclosures in the financial statements and financial highlights. Our audits also included evaluating the accounting principles used and significant estimates made by management, as well as evaluating the overall presentation of the financial statements and financial highlights. Our procedures included confirmation of securities owned as of July 31, 2024, by correspondence with the custodian and brokers; when replies were not received from brokers, we performed other auditing procedures. We believe that our audits provide a reasonable basis for our opinion.
/s/ Deloitte & Touche LLP
Boston, Massachusetts
September 12, 2024
We have served as the auditor of one or more of the Fidelity investment companies since 1999.
Distributions
(Unaudited)The dividend and capital gains distributions for the fund(s) are available on Fidelity.com or Institutional.Fidelity.com.
The fund designates $2,032 of distributions paid during the fiscal year ended 2024 as qualifying to be taxed as section 163(j) interest dividends.
Class A designates 32.37%; Class M designates 35.70%; Class C designates 42.81%; Class I designates 29.38%; and Class Z designates 29.38%; of the dividend distributed in December, respectively during the fiscal year as amounts which may be taken into account as a dividend for purposes of the maximum rate under section 1(h)(11) of the Internal Revenue Code.
Class A designates 59.39%; Class M designates 64.31%; Class C designates 57.20%; Class I designates 53.91%; and Class Z designates 53.91%; of the dividend distributed in December, respectively during the fiscal year as a section 199A dividend.
The fund will notify shareholders in January 2025 of amounts for use in preparing 2024 income tax returns.
Item 8: Changes in and Disagreements with Accountants for Open-End Management Investment Companies
Note: This is not applicable for any fund included in this document.
Item 9: Proxy Disclosures for Open-End Management Investment Companies
| A special meeting of shareholders was held on July 16, 2024. The results of votes taken among shareholders on the proposal before them are reported below. Each vote reported represents one dollar of net asset value held on the record date for the meeting. |
| Proposal 1 |
| To elect a Board of Trustees. |
| | # of Votes | % of Votes |
| Bettina Doulton |
| Affirmative | 11,673,835,823.95 | 96.01 |
| Withheld | 484,880,332.79 | 3.99 |
| TOTAL | 12,158,716,156.74 | 100.00 |
| Robert A. Lawrence |
| Affirmative | 11,649,437,829.16 | 95.81 |
| Withheld | 509,278,327.57 | 4.19 |
| TOTAL | 12,158,716,156.74 | 100.00 |
| Vijay C. Advani |
| Affirmative | 11,613,776,744.77 | 95.52 |
| Withheld | 544,939,411.97 | 4.48 |
| TOTAL | 12,158,716,156.74 | 100.00 |
| Thomas P. Bostick |
| Affirmative | 11,653,386,078.49 | 95.84 |
| Withheld | 505,330,078.25 | 4.16 |
| TOTAL | 12,158,716,156.74 | 100.00 |
| Donald F. Donahue |
| Affirmative | 11,632,589,030.61 | 95.67 |
| Withheld | 526,127,126.13 | 4.33 |
| TOTAL | 12,158,716,156.74 | 100.00 |
| Vicki L. Fuller |
| Affirmative | 11,691,940,576.27 | 96.16 |
| Withheld | 466,775,580.46 | 3.84 |
| TOTAL | 12,158,716,156.74 | 100.00 |
| Patricia L. Kampling |
| Affirmative | 11,685,988,743.05 | 96.11 |
| Withheld | 472,727,413.69 | 3.89 |
| TOTAL | 12,158,716,156.74 | 100.00 |
| Thomas A. Kennedy |
| Affirmative | 11,651,823,552.03 | 95.83 |
| Withheld | 506,892,604.70 | 4.17 |
| TOTAL | 12,158,716,156.74 | 100.00 |
| Oscar Munoz |
| Affirmative | 11,630,338,090.08 | 95.65 |
| Withheld | 528,378,066.66 | 4.35 |
| TOTAL | 12,158,716,156.74 | 100.00 |
| Karen B. Peetz |
| Affirmative | 11,652,647,210.01 | 95.84 |
| Withheld | 506,068,946.73 | 4.16 |
| TOTAL | 12,158,716,156.74 | 100.00 |
| David M. Thomas |
| Affirmative | 11,635,848,489.52 | 95.70 |
| Withheld | 522,867,667.21 | 4.30 |
| TOTAL | 12,158,716,156.74 | 100.00 |
| Susan Tomasky |
| Affirmative | 11,679,774,589.51 | 96.06 |
| Withheld | 478,941,567.22 | 3.94 |
| TOTAL | 12,158,716,156.74 | 100.00 |
| Michael E. Wiley |
| Affirmative | 11,645,598,691.16 | 95.78 |
| Withheld | 513,117,465.58 | 4.22 |
| TOTAL | 12,158,716,156.74 | 100.00 |
| | | |
| Proposal 1 reflects trust-wide proposal and voting results. |
Item 10: Remuneration Paid to Directors, Officers, and others of Open-End Management Investment Companies
Note: This information is disclosed as part of the financial statements for each Fund as part of Item 7: Financial Statements and Financial Highlights for Open-End Management Investment companies.
Item 11: Statement Regarding Basis for Approval of Investment Advisory Contract
Board Approval of Investment Advisory Contracts and Management Fees
Fidelity Advisor Global Real Estate Fund
Each year, the Board of Trustees, including the Independent Trustees (together, the Board), considers the renewal of the fund's management contract with Fidelity Management & Research Company LLC (FMR) and the sub-advisory agreements (together, the Advisory Contracts) for the fund. FMR and the sub-advisers are referred to herein as the Investment Advisers. The Board, assisted by the advice of fund counsel and Independent Trustees' counsel, requests and considers a broad range of information relevant to the renewal of the Advisory Contracts throughout the year.
The Board meets regularly and, at each of its meetings, covers an extensive agenda of topics and materials and considers factors that are relevant to its annual consideration of the renewal of the fund's Advisory Contracts, including the services and support provided to the fund and its shareholders. The Board, acting directly and through its Committees (each of which is composed of and chaired by Independent Trustees), requests and receives information concerning the annual consideration of the renewal of the fund's Advisory Contracts. The Board also meets as needed to review matters specifically related to the Board's annual consideration of the renewal of the Advisory Contracts. Members of the Board may also meet with trustees of other Fidelity funds through joint ad hoc committees to discuss certain matters relevant to all of the Fidelity funds.
At its May 2024 meeting, the Board unanimously determined to renew the fund's Advisory Contracts. In reaching its determination, the Board considered all factors it believed relevant, including (i) the nature, extent, and quality of the services provided to the fund and its shareholders (including the investment performance of the fund); (ii) the competitiveness relative to peer funds of the fund's management fee and the total expense ratio of a representative class (Class I, which was selected because it was the largest class without 12b-1 fees); (iii) the total costs of the services provided by and the profits realized by FMR and its affiliates (Fidelity) from its relationships with the fund; and (iv) the extent to which, if any, economies of scale exist and are realized as the fund grows, and whether any economies of scale are appropriately shared with fund shareholders. The Board also considered the broad range of investment choices available to shareholders from FMR's competitors and that the fund's shareholders have chosen to invest in the fund, which is part of the Fidelity family of funds. The Board's decision to renew the Advisory Contracts was not based on any single factor.
The Board reached a determination, with the assistance of fund counsel and Independent Trustees' counsel and through the exercise of its business judgment, that the renewal of the Advisory Contracts was in the best interests of the fund and its shareholders and that the compensation payable under the Advisory Contracts was fair and reasonable in light of all of the surrounding circumstances.
Nature, Extent, and Quality of Services Provided. The Board considered staffing as it relates to the fund, including the backgrounds and experience of investment personnel of the Investment Advisers, and also considered the Investment Advisers' implementation of the fund's investment program. The Independent Trustees also had discussions with senior management of Fidelity's investment operations and investment groups. The Board considered the structure of the investment personnel compensation program and whether this structure provides appropriate incentives to act in the best interests of the fund. Additionally, the Board considered the portfolio managers' investments, if any, in the funds that they manage.
Resources Dedicated to Investment Management and Support Services. The Board and the Fund Oversight and Research Committees reviewed the general qualifications and capabilities of Fidelity's investment staff, including its size, education, experience, and resources, as well as Fidelity's approach to recruiting, training, managing, and compensating investment personnel. The Board noted the resources devoted to expansion of Fidelity's global investment organization, and that Fidelity's analysts have extensive resources, tools and capabilities that allow them to conduct sophisticated quantitative and fundamental analysis, as well as credit analysis of issuers, counterparties and guarantors. Further, the Board considered that Fidelity's investment professionals have sufficient access to global information and data so as to provide competitive investment results over time, and that those professionals also have access to sophisticated tools that permit them to assess portfolio construction and risk and performance attribution characteristics continuously, as well as to transmit new information and research conclusions rapidly around the world. Additionally, in its deliberations, the Board considered Fidelity's trading, risk management, compliance, and technology and operations capabilities and resources, which are integral parts of the investment management process.
Shareholder and Administrative Services. The Board considered (i) the nature, extent, quality, and cost of advisory, administrative, shareholder, transfer agency, and pricing and bookkeeping services performed by the Investment Advisers and their affiliates under the Advisory Contracts; (ii) the nature and extent of Fidelity's supervision of third party service providers, principally custodians, subcustodians, and pricing vendors; and (iii) the resources devoted by Fidelity to, and the record of compliance with, the fund's compliance policies and procedures. The Board also reviewed the allocation of fund brokerage, including allocations to brokers affiliated with the Investment Advisers, the use of brokerage commissions to pay fund expenses, and the use of "soft" commission dollars to pay for research services. The Board also considered the fund's securities lending activities and any payments made to Fidelity relating to securities lending under a separate agreement.
The Board noted that the growth of fund assets over time across the complex allows Fidelity to reinvest in the development of services designed to enhance the value and convenience of the Fidelity funds as investment vehicles. These services include 24-hour access to account information and market information over the Internet and through telephone representatives, investor education materials and asset allocation tools. The Board also considered that it reviews customer service metrics such as telephone response times, continuity of services on the website and metrics addressing services at Fidelity Investor Centers.
Investment in a Large Fund Family. The Board considered the benefits to shareholders of investing in a fund that is part of a large family of funds offering a variety of investment disciplines and providing a large variety of fund investor services. The Board noted that Fidelity had taken, or had made recommendations that resulted in the Fidelity funds taking, a number of actions over the previous year that benefited particular funds and/or the Fidelity funds in general.
Investment Performance. The Board took into account discussions that occur with representatives of the Investment Advisers, and reports that it receives, at Board meetings throughout the year, relating to fund investment performance. In this regard the Board noted that as part of regularly scheduled fund reviews and other reports to the Board on fund performance, the Board considered annualized return information for the fund for different time periods, measured against an appropriate securities market index (benchmark index) and an appropriate peer group of funds with similar objectives (peer group). The Board also considered information about performance attribution. In its ongoing evaluation of fund investment performance, the Board gives particular attention to information indicating changes in performance of the funds over different time periods and discussed with the Investment Advisers the reasons for any overperformance or underperformance.
In addition to reviewing absolute and relative fund performance, the Independent Trustees periodically consider the appropriateness of fund performance metrics in evaluating the results achieved. The Independent Trustees generally give greater weight to fund performance over longer time periods than over shorter time periods. Depending on the circumstances, the Independent Trustees may be satisfied with a fund's performance notwithstanding that it lags its benchmark index or peer group for certain periods.
Based on its review, the Board concluded that the nature, extent, and quality of services provided to the fund under the Advisory Contracts should continue to benefit the shareholders of the fund.
Competitiveness of Management Fee and Total Expense Ratio. The Board was provided with information regarding industry trends in management fees and expenses. The Board considered that, effective March 1, 2024, an amended Advisory Contract with FMR went into effect with class-level management fees based on tiered schedules and subject to a maximum class-level rate (the management fee). The Board also considered that in exchange for the variable management fee, each class of the fund receives investment advisory, management, administrative, transfer agent, and pricing and bookkeeping services. In its review of the management fee and total expense ratio of Class I, the Board considered a pro forma management fee rate for Class I as if it had been in effect for the 12-month period ended September 30, 2023, as well as other third-party fund expenses, as applicable, such as custodial, legal, and audit fees and any fund-paid 12b-1 fees. The Board noted that Fidelity may agree to waive fees or reimburse expenses from time to time, and the extent to which, if any, it has done so for the fund.
Comparisons of Management Fees and Total Expense Ratios. Among other things, the Board reviewed data for selected groups of competitive funds and classes (referred to as "mapped groups") that were compiled by Fidelity based on combining similar investment objective categories (as classified by Morningstar) that have comparable investment mandates. The data reviewed by the Board included (i) gross management fee comparisons (before taking into account expense reimbursements or caps) relative to the total universe of funds within the mapped group; (ii) gross management fee comparisons relative to a subset of non-Fidelity funds in the mapped group that are similar in size and management fee structure to the fund (referred to as the "asset size peer group"); (iii) total expense comparisons of Class I of the fund relative to funds and classes in the mapped group that have a similar sales load structure to Class I of the fund (referred to as the "similar sales load structure group"); and (iv) total expense comparisons of Class I of the fund relative to funds and classes in the similar sales load structure group that are similar in size and management fee structure to the fund (referred to as the "total expense asset size peer group"). The total expense asset size peer group comparison excludes performance adjustments and fund-paid 12b-1 fees to eliminate variability in fee structures.
The information provided to the Board indicated that the fund's management fee rate ranked below the competitive median of the mapped group for the 12-month period ended September 30, 2023 and below the competitive median of the asset size peer group for the 12-month period ended September 30, 2023. Further, the information provided to the Board indicated that the total expense ratio of Class I of the fund ranked above the competitive median of the similar sales load structure group for the 12-month period ended September 30, 2023 and below the competitive median of the total expense asset size peer group for the 12-month period ended September 30, 2023. The Board noted that, although the total expense ratio of Class I was one basis point about the similar sales load structure group median, Fidelity believes the fees that the fund is charged are reasonable for the overall value of services shareholders receive.
The Board noted that a different variable management fee rate is applicable to each class of the fund. The Board considered that the difference in management fee rates between classes is the result of separate arrangements for class-level services and/or waivers of certain expenses and not the result of any difference in advisory or custodial fees or other expenses related to the management of the fund's assets, which do not vary by class.
Other Contractual Arrangements. The Board further considered that the investment adviser has contractually agreed to reimburse Class A, Class M, Class C, Class I, and Class Z of the fund to the extent that total operating expenses, with certain exceptions, as a percentage of their respective average net assets, exceed 1.20%, 1.45%, 1.95%,0.95%, and 0.80% through November 30, 2024.
Fees Charged to Other Fidelity Clients. The Board also considered Fidelity fee structures and other information with respect to clients of Fidelity, such as other funds advised or subadvised by Fidelity, pension plan clients, and other institutional clients with similar mandates. The Board noted that a joint ad hoc committee created by it and the boards of other Fidelity funds periodically reviews and compares Fidelity's institutional investment advisory business with its business of providing services to the Fidelity funds and also noted the most recent findings of the committee. The Board noted that the committee's review included a consideration of the differences in services provided, fees charged, and costs incurred, as well as competition in the markets serving the different categories of clients.
Based on its review, the Board concluded that the fund's management fee is fair and reasonable in light of the services that the fund receives and the other factors considered. Further, based on its review of total expense ratios and fees charged to other Fidelity clients, the Board concluded that the total expense ratio of each class of the fund was reasonable in light of the services that the fund and its shareholders receive and the other factors considered.
Costs of the Services and Profitability. The Board considered the revenues earned and the expenses incurred by Fidelity in conducting the business of developing, marketing, distributing, managing, administering and servicing the fund and servicing the fund's shareholders. The Board also considered the level of Fidelity's profits in respect of all the Fidelity funds.
On an annual basis, Fidelity presents to the Board information about the profitability of its relationships with the fund. Fidelity calculates profitability information for each fund, as well as aggregate profitability information for groups of Fidelity funds and all Fidelity funds, using a series of detailed revenue and cost allocation methodologies which originate with the books and records of Fidelity on which Fidelity's audited financial statements are based. The Audit Committee of the Board reviews any significant changes from the prior year's methodologies and the full Board approves such changes.
A public accounting firm has been engaged annually by the Board as part of the Board's assessment of Fidelity's profitability analysis. The engagement includes the review and assessment of the methodologies used by Fidelity in determining the revenues and expenses attributable to Fidelity's fund business, and completion of agreed-upon procedures in respect of the mathematical accuracy of certain fund profitability information and its conformity to established allocation methodologies. After considering the reports issued under the engagement and information provided by Fidelity, the Board concluded that while other allocation methods may also be reasonable, Fidelity's profitability methodologies are reasonable in all material respects.
The Board also reviewed Fidelity's non-fund businesses and potential indirect benefits such businesses may have received as a result of their association with Fidelity's fund business (i.e., fall-out benefits) as well as cases where Fidelity's affiliates may benefit from the funds' business. The Board considered areas where potential indirect benefits to the Fidelity funds from their relationships with Fidelity may exist. The Board's consideration of these matters was informed by the findings of a joint ad hoc committee created by it and the boards of other Fidelity funds to evaluate potential fall-out benefits.
The Board considered the costs of the services provided by and the profits realized by Fidelity in connection with the operation of the fund and was satisfied that the profitability was not excessive.
Economies of Scale. The Board considered whether there have been economies of scale in respect of the management of the Fidelity funds, whether the Fidelity funds (including the fund) have appropriately benefited from any such economies of scale, and whether there is potential for realization of any further economies of scale. The Board considered the extent to which the fund will benefit from economies of scale as assets grow through increased services to the fund, through waivers or reimbursements, or through fee or expense ratio reductions. The Board also noted that a committee created by it and the boards of other Fidelity funds periodically analyzes whether Fidelity attains economies of scale in respect of the management and servicing of the Fidelity funds, whether the Fidelity funds have appropriately benefited from such economies of scale, and whether there is potential for realization of any further economies of scale.
The Board recognized that the fund's management contract incorporates a variable management fee structure, which provides breakpoints as a way to share, in part, any potential economies of scale that may exist at the asset class level and through a discount that considers both fund size and total assets of the four applicable asset classes. The Board considered that the variable management fee is designed to deliver the benefits of economies of scale to fund shareholders even if assets of any particular fund are unchanged or have declined, because some portion of Fidelity's costs are attributable to services provided to all funds subject to the variable management fee, and all such funds benefit if those costs can be allocated among more assets. The Board concluded that, given the variable management fee structure, fund shareholders will benefit from lower management fees due to the application of the breakpoints and discount factor, regardless of whether Fidelity achieves any such economies of scale.
The Board concluded, taking into account the analysis of the committee, that economies of scale, if any, are being appropriately shared between fund shareholders and Fidelity.
Additional Information Requested by the Board. In order to develop fully the factual basis for consideration of the Fidelity funds' advisory contracts, the Board requested and received additional information on certain topics, including but not limited to: (i) fund flow and performance trends, in particular the underperformance of certain funds and strategies, and Fidelity's long-term strategies for certain funds; (ii) the operation of performance fees and the rationale for implementing performance fees on certain categories of funds but not others; (iii) Fidelity's pricing philosophy compared to competitors; (iv) fund profitability methodology and data; (v) evaluation of competitive fund data and peer group classifications and fee and expense comparisons; (vi) the management fee and expense structures for different funds and classes and information about the differences between various fee and expense structures; (vii) the variable management fee implemented for certain funds effective March 1, 2024; and (viii) information regarding other accounts managed by Fidelity and the funds' sub-advisory arrangements.
Conclusion. Based on its evaluation of all of the conclusions noted above, and after considering all factors it believed relevant, the Board, including the Independent Trustees, concluded that the advisory and sub-advisory fee arrangements are fair and reasonable in light of all of the surrounding circumstances and that the fund's Advisory Contracts should be renewed through May 31, 2025.
1.9881280.107
AGRE-ANN-0924
Fidelity Advisor® Real Estate Fund
Annual Report
July 31, 2024
Contents
To view a fund's proxy voting guidelines and proxy voting record for the 12-month period ended June 30, visit http://www.fidelity.com/proxyvotingresults or visit the Securities and Exchange Commission's (SEC) web site at http://www.sec.gov.
You may also call 1-877-208-0098 to request a free copy of the proxy voting guidelines.
Standard & Poor's, S&P and S&P 500 are registered service marks of The McGraw-Hill Companies, Inc. and have been licensed for use by Fidelity Distributors Corporation.
Other third-party marks appearing herein are the property of their respective owners.
All other marks appearing herein are registered or unregistered trademarks or service marks of FMR LLC or an affiliated company. © 2024 FMR LLC. All rights reserved.
This report and the financial statements contained herein are submitted for the general information of the shareholders of the Fund. This report is not authorized for distribution to prospective investors in the Fund unless preceded or accompanied by an effective prospectus.
A fund files its complete schedule of portfolio holdings with the SEC for the first and third quarters of each fiscal year on Form N-PORT. Forms N-PORT are available on the SEC's web site at http://www.sec.gov. A fund's Forms N-PORT may be reviewed and copied at the SEC's Public Reference Room in Washington, DC. Information regarding the operation of the SEC's Public Reference Room may be obtained by calling 1-800-SEC-0330.
For a complete list of a fund's portfolio holdings, view the most recent holdings listing, semiannual report, or annual report on Fidelity's web site at http://www.fidelity.com, http://www.institutional.fidelity.com, or http://www.401k.com, as applicable.
NOT FDIC INSURED •MAY LOSE VALUE •NO BANK GUARANTEE
Neither the Fund nor Fidelity Distributors Corporation is a bank.
Item 7: Financial Statements and Financial Highlights for Open-End Management Investment Companies (Annual Report)
Fidelity Advisor® Real Estate Fund
Schedule of Investments July 31, 2024
Showing Percentage of Net Assets
| Common Stocks - 99.2% |
| | | Shares | Value ($) |
| Equity Real Estate Investment Trusts (REITs) - 91.5% | | | |
| REITs - Apartments - 11.2% | | | |
| Camden Property Trust (SBI) | | 2,200 | 243,650 |
| Essex Property Trust, Inc. | | 25,447 | 7,083,427 |
| Invitation Homes, Inc. | | 198,200 | 6,990,514 |
| Mid-America Apartment Communities, Inc. | | 55,700 | 7,785,189 |
| UDR, Inc. | | 114,100 | 4,571,987 |
| | | | 26,674,767 |
| REITs - Diversified - 20.4% | | | |
| Crown Castle, Inc. | | 161,500 | 17,777,920 |
| Digital Realty Trust, Inc. | | 54,800 | 8,192,052 |
| Equinix, Inc. | | 23,500 | 18,570,640 |
| Lamar Advertising Co. Class A | | 31,600 | 3,787,576 |
| | | | 48,328,188 |
| REITs - Health Care - 9.1% | | | |
| Ventas, Inc. | | 253,405 | 13,795,368 |
| Welltower, Inc. | | 70,400 | 7,832,000 |
| | | | 21,627,368 |
| REITs - Hotels - 2.5% | | | |
| Ryman Hospitality Properties, Inc. | | 58,700 | 5,899,937 |
| REITs - Management/Investment - 8.0% | | | |
| American Tower Corp. | | 63,200 | 13,929,280 |
| NNN (REIT), Inc. | | 112,500 | 5,050,125 |
| | | | 18,979,405 |
| REITs - Manufactured Homes - 3.0% | | | |
| Equity Lifestyle Properties, Inc. | | 102,306 | 7,026,376 |
| REITs - Office Property - 1.2% | | | |
| Douglas Emmett, Inc. (a) | | 180,000 | 2,896,200 |
| REITs - Regional Malls - 2.3% | | | |
| Tanger, Inc. | | 189,200 | 5,467,880 |
| REITs - Shopping Centers - 5.4% | | | |
| Federal Realty Investment Trust (SBI) | | 9,500 | 1,060,675 |
| SITE Centers Corp. | | 460,500 | 7,114,725 |
| Urban Edge Properties | | 231,800 | 4,705,540 |
| | | | 12,880,940 |
| REITs - Single Tenant - 3.8% | | | |
| Agree Realty Corp. | | 18,000 | 1,241,460 |
| Four Corners Property Trust, Inc. | | 252,600 | 6,855,564 |
| NETSTREIT Corp. (a) | | 51,200 | 843,264 |
| | | | 8,940,288 |
| REITs - Storage - 8.4% | | | |
| CubeSmart | | 269,200 | 12,808,536 |
| Extra Space Storage, Inc. | | 41,800 | 6,672,116 |
| Public Storage Operating Co. | | 1,400 | 414,288 |
| | | | 19,894,940 |
| REITs - Warehouse/Industrial - 16.2% | | | |
| Americold Realty Trust | | 171,700 | 5,132,113 |
| EastGroup Properties, Inc. | | 23,400 | 4,375,566 |
| Lineage, Inc. | | 12,800 | 1,124,864 |
| Prologis, Inc. | | 180,816 | 22,791,857 |
| Terreno Realty Corp. | | 71,500 | 4,891,315 |
| | | | 38,315,715 |
TOTAL EQUITY REAL ESTATE INVESTMENT TRUSTS (REITS) | | | 216,932,004 |
| Real Estate Management & Development - 7.7% | | | |
| Real Estate Services - 7.7% | | | |
| CBRE Group, Inc. (b) | | 132,400 | 14,922,804 |
| CoStar Group, Inc. (b) | | 42,900 | 3,347,058 |
| | | | 18,269,862 |
| TOTAL COMMON STOCKS (Cost $177,413,094) | | | 235,201,866 |
| | | | |
| Money Market Funds - 2.1% |
| | | Shares | Value ($) |
| Fidelity Cash Central Fund 5.39% (c) | | 2,430,760 | 2,431,246 |
| Fidelity Securities Lending Cash Central Fund 5.39% (c)(d) | | 2,412,584 | 2,412,825 |
| TOTAL MONEY MARKET FUNDS (Cost $4,844,071) | | | 4,844,071 |
| | | | |
| TOTAL INVESTMENT IN SECURITIES - 101.3% (Cost $182,257,165) | 240,045,937 |
NET OTHER ASSETS (LIABILITIES) - (1.3)% | (3,040,419) |
| NET ASSETS - 100.0% | 237,005,518 |
| | |
Legend
| (a) | Security or a portion of the security is on loan at period end. |
| (c) | Affiliated fund that is generally available only to investment companies and other accounts managed by Fidelity Investments. The rate quoted is the annualized seven-day yield of the fund at period end. A complete unaudited listing of the fund's holdings as of its most recent quarter end is available upon request. In addition, each Fidelity Central Fund's financial statements, which are not covered by the Fund's Report of Independent Registered Public Accounting Firm, are available on the SEC's website or upon request. |
| (d) | Investment made with cash collateral received from securities on loan. |
Affiliated Central Funds
Fiscal year to date information regarding the Fund's investments in Fidelity Central Funds, including the ownership percentage, is presented below.
| Affiliate | Value, beginning of period ($) | Purchases ($) | Sales Proceeds ($) | Dividend Income ($) | Realized Gain (loss) ($) | Change in Unrealized appreciation (depreciation) ($) | Value, end of period ($) | % ownership, end of period |
| Fidelity Cash Central Fund 5.39% | 3,119,380 | 51,593,198 | 52,281,323 | 52,919 | (9) | - | 2,431,246 | 0.0% |
| Fidelity Securities Lending Cash Central Fund 5.39% | 478,200 | 7,743,362 | 5,808,737 | 5,385 | - | - | 2,412,825 | 0.0% |
| Total | 3,597,580 | 59,336,560 | 58,090,060 | 58,304 | (9) | - | 4,844,071 | |
| | | | | | | | | |
Amounts in the dividend income column in the above table include any capital gain distributions from underlying funds, which are presented in the corresponding line item in the Statement of Operations, if applicable.
Amounts in the dividend income column for Fidelity Securities Lending Cash Central Fund represents the income earned on investing cash collateral, less rebates paid to borrowers and any lending agent fees associated with the loan, plus any premium payments received for lending certain types of securities.
Amounts included in the purchases and sales proceeds columns may include in-kind transactions, if applicable.
Investment Valuation
The following is a summary of the inputs used, as of July 31, 2024, involving the Fund's assets and liabilities carried at fair value. The inputs or methodology used for valuing securities may not be an indication of the risk associated with investing in those securities. For more information on valuation inputs, and their aggregation into the levels used below, please refer to the Investment Valuation section in the accompanying Notes to Financial Statements.
| Valuation Inputs at Reporting Date: |
| Description | Total ($) | Level 1 ($) | Level 2 ($) | Level 3 ($) |
Investments in Securities: | | | | |
|
| Common Stocks | 235,201,866 | 235,201,866 | - | - |
|
| Money Market Funds | 4,844,071 | 4,844,071 | - | - |
| Total Investments in Securities: | 240,045,937 | 240,045,937 | - | - |
Financial Statements
| Statement of Assets and Liabilities |
As of July 31, 2024 |
| Assets | | | | |
| Investment in securities, at value (including securities loaned of $2,353,557) - See accompanying schedule: | | | | |
Unaffiliated issuers (cost $177,413,094) | $ | 235,201,866 | | |
Fidelity Central Funds (cost $4,844,071) | | 4,844,071 | | |
| | | | | |
| | | | | |
| Total Investment in Securities (cost $182,257,165) | | | $ | 240,045,937 |
| Receivable for investments sold | | | | 1,036,363 |
| Receivable for fund shares sold | | | | 40,378 |
| Dividends receivable | | | | 121,780 |
| Distributions receivable from Fidelity Central Funds | | | | 6,317 |
| Prepaid expenses | | | | 523 |
| Other receivables | | | | 107,205 |
Total assets | | | | 241,358,503 |
| Liabilities | | | | |
| Payable for investments purchased | $ | 774,926 | | |
| Payable for fund shares redeemed | | 814,480 | | |
| Accrued management fee | | 136,922 | | |
| Distribution and service plan fees payable | | 54,013 | | |
| Other payables and accrued expenses | | 159,819 | | |
| Collateral on securities loaned | | 2,412,825 | | |
| Total liabilities | | | | 4,352,985 |
| Net Assets | | | $ | 237,005,518 |
| Net Assets consist of: | | | | |
| Paid in capital | | | $ | 181,455,369 |
| Total accumulated earnings (loss) | | | | 55,550,149 |
| Net Assets | | | $ | 237,005,518 |
| | | | | |
| Net Asset Value and Maximum Offering Price | | | | |
| Class A : | | | | |
Net Asset Value and redemption price per share ($83,617,894 ÷ 4,768,655 shares)(a) | | | $ | 17.53 |
| Maximum offering price per share (100/94.25 of $17.53) | | | $ | 18.60 |
| Class M : | | | | |
Net Asset Value and redemption price per share ($81,022,235 ÷ 4,646,680 shares)(a) | | | $ | 17.44 |
| Maximum offering price per share (100/96.50 of $17.44) | | | $ | 18.07 |
| Class C : | | | | |
Net Asset Value and offering price per share ($5,355,436 ÷ 323,033 shares)(a) | | | $ | 16.58 |
| Class I : | | | | |
Net Asset Value, offering price and redemption price per share ($60,501,800 ÷ 3,388,213 shares) | | | $ | 17.86 |
| Class Z : | | | | |
Net Asset Value, offering price and redemption price per share ($6,508,153 ÷ 364,834 shares) | | | $ | 17.84 |
(a)Redemption price per share is equal to net asset value less any applicable contingent deferred sales charge. |
| Statement of Operations |
| Year ended July 31, 2024 |
| Investment Income | | | | |
| Dividends | | | $ | 7,305,929 |
| Income from Fidelity Central Funds (including $5,385 from security lending) | | | | 58,304 |
| Total income | | | | 7,364,233 |
| Expenses | | | | |
| Management fee | $ | 1,389,455 | | |
| Transfer agent fees | | 282,629 | | |
| Distribution and service plan fees | | 648,286 | | |
| Accounting fees | | 48,443 | | |
| Custodian fees and expenses | | 11,681 | | |
| Independent trustees' fees and expenses | | 1,164 | | |
| Registration fees | | 74,696 | | |
| Audit fees | | 54,124 | | |
| Legal | | 405 | | |
| Miscellaneous | | 6,460 | | |
| Total expenses before reductions | | 2,517,343 | | |
| Expense reductions | | (15,175) | | |
| Total expenses after reductions | | | | 2,502,168 |
| Net Investment income (loss) | | | | 4,862,065 |
| Realized and Unrealized Gain (Loss) | | | | |
| Net realized gain (loss) on: | | | | |
| Investment Securities: | | | | |
| Unaffiliated issuers | | 4,967,996 | | |
| Fidelity Central Funds | | (9) | | |
| Total net realized gain (loss) | | | | 4,967,987 |
| Change in net unrealized appreciation (depreciation) on investment securities | | | | 11,235,336 |
| Net gain (loss) | | | | 16,203,323 |
| Net increase (decrease) in net assets resulting from operations | | | $ | 21,065,388 |
| Statement of Changes in Net Assets |
| |
| | Year ended July 31, 2024 | | Year ended July 31, 2023 |
| Increase (Decrease) in Net Assets | | | | |
| Operations | | | | |
| Net investment income (loss) | $ | 4,862,065 | $ | 5,878,612 |
| Net realized gain (loss) | | 4,967,987 | | (4,606,425) |
| Change in net unrealized appreciation (depreciation) | | 11,235,336 | | (51,993,325) |
| Net increase (decrease) in net assets resulting from operations | | 21,065,388 | | (50,721,138) |
| Distributions to shareholders | | (4,738,172) | | (43,497,468) |
| | | | | |
| Share transactions - net increase (decrease) | | (37,939,622) | | (57,482,753) |
| Total increase (decrease) in net assets | | (21,612,406) | | (151,701,359) |
| | | | | |
| Net Assets | | | | |
| Beginning of period | | 258,617,924 | | 410,319,283 |
| End of period | $ | 237,005,518 | $ | 258,617,924 |
| | | | | |
| | | | | |
Financial Highlights
Fidelity Advisor® Real Estate Fund Class A |
| |
| Years ended July 31, | | 2024 | | 2023 | | 2022 | | 2021 | | 2020 |
Selected Per-Share Data | | | | | | | | | | |
| Net asset value, beginning of period | $ | 16.24 | $ | 21.95 | $ | 24.66 | $ | 19.62 | $ | 22.91 |
| Income from Investment Operations | | | | | | | | | | |
Net investment income (loss) A,B | | .33 | | .34 | | .22 | | .26 | | .41 |
| Net realized and unrealized gain (loss) | | 1.28 | | (3.09) | | (1.47) | | 5.50 | | (1.91) |
| Total from investment operations | | 1.61 | | (2.75) | | (1.25) | | 5.76 | | (1.50) |
| Distributions from net investment income | | (.32) | | (.26) | | (.17) | | (.24) | | (.38) |
| Distributions from net realized gain | | - | | (2.69) | | (1.30) | | (.48) | | (1.41) |
| Total distributions | | (.32) | | (2.96) C | | (1.46) C | | (.72) | | (1.79) |
| Net asset value, end of period | $ | 17.53 | $ | 16.24 | $ | 21.95 | $ | 24.66 | $ | 19.62 |
Total Return D,E | | | | (11.70)% | | (5.65)% | | 30.38% | | (7.21)% |
Ratios to Average Net Assets B,F,G | | | | | | | | | | |
| Expenses before reductions | | 1.07% | | 1.11% | | 1.07% | | 1.09% | | 1.10% |
| Expenses net of fee waivers, if any | | | | 1.10% | | 1.07% | | 1.09% | | 1.10% |
| Expenses net of all reductions | | 1.07% | | 1.10% | | 1.07% | | 1.08% | | 1.09% |
| Net investment income (loss) | | 2.11% | | 1.96% | | .95% | | 1.24% | | 1.93% |
| Supplemental Data | | | | | | | | | | |
| Net assets, end of period (000 omitted) | $ | 83,618 | $ | 91,784 | $ | 122,949 | $ | 138,134 | $ | 115,736 |
Portfolio turnover rate H | | | | 31% | | 48% | | 53% | | 56% |
ACalculated based on average shares outstanding during the period.
BNet investment income (loss) is affected by the timing of the declaration of dividends by any underlying mutual funds or exchange-traded funds (ETFs). Net investment income (loss) of any mutual funds or ETFs is not included in the Fund's net investment income (loss) ratio.
CTotal distributions per share do not sum due to rounding.
DTotal returns would have been lower if certain expenses had not been reduced during the applicable periods shown.
ETotal returns do not include the effect of the sales charges.
FFees and expenses of any underlying mutual funds or exchange-traded funds (ETFs) are not included in the Fund's expense ratio. The Fund indirectly bears its proportionate share of these expenses. For additional expense information related to investments in Fidelity Central Funds, please refer to the "Investments in Fidelity Central Funds" note found in the Notes to Financial Statements section of the most recent Annual or Semi-Annual report.
GExpense ratios reflect operating expenses of the class. Expenses before reductions do not reflect amounts reimbursed, waived, or reduced through arrangements with the investment adviser, brokerage services, or other offset arrangements, if applicable, and do not represent the amount paid by the class during periods when reimbursements, waivers or reductions occur.
HAmount does not include the portfolio activity of any underlying mutual funds or exchange-traded funds (ETFs).
Fidelity Advisor® Real Estate Fund Class M |
| |
| Years ended July 31, | | 2024 | | 2023 | | 2022 | | 2021 | | 2020 |
Selected Per-Share Data | | | | | | | | | | |
| Net asset value, beginning of period | $ | 16.16 | $ | 21.87 | $ | 24.59 | $ | 19.58 | $ | 22.87 |
| Income from Investment Operations | | | | | | | | | | |
Net investment income (loss) A,B | | .29 | | .30 | | .17 | | .21 | | .36 |
| Net realized and unrealized gain (loss) | | 1.28 | | (3.08) | | (1.46) | | 5.49 | | (1.90) |
| Total from investment operations | | 1.57 | | (2.78) | | (1.29) | | 5.70 | | (1.54) |
| Distributions from net investment income | | (.29) | | (.24) | | (.13) | | (.22) | | (.34) |
| Distributions from net realized gain | | - | | (2.69) | | (1.30) | | (.48) | | (1.41) |
| Total distributions | | (.29) | | (2.93) | | (1.43) | | (.69) C | | (1.75) |
| Net asset value, end of period | $ | 17.44 | $ | 16.16 | $ | 21.87 | $ | 24.59 | $ | 19.58 |
Total Return D,E | | | | (11.87)% | | (5.83)% | | 30.14% | | (7.42)% |
Ratios to Average Net Assets B,F,G | | | | | | | | | | |
| Expenses before reductions | | 1.31% | | 1.31% | | 1.29% | | 1.31% | | 1.31% |
| Expenses net of fee waivers, if any | | | | 1.31% | | 1.28% | | 1.31% | | 1.31% |
| Expenses net of all reductions | | 1.30% | | 1.31% | | 1.28% | | 1.30% | | 1.30% |
| Net investment income (loss) | | 1.88% | | 1.75% | | .73% | | 1.03% | | 1.71% |
| Supplemental Data | | | | | | | | | | |
| Net assets, end of period (000 omitted) | $ | 81,022 | $ | 84,126 | $ | 100,892 | $ | 118,778 | $ | 98,724 |
Portfolio turnover rate H | | | | 31% | | 48% | | 53% | | 56% |
ACalculated based on average shares outstanding during the period.
BNet investment income (loss) is affected by the timing of the declaration of dividends by any underlying mutual funds or exchange-traded funds (ETFs). Net investment income (loss) of any mutual funds or ETFs is not included in the Fund's net investment income (loss) ratio.
CTotal distributions per share do not sum due to rounding.
DTotal returns would have been lower if certain expenses had not been reduced during the applicable periods shown.
ETotal returns do not include the effect of the sales charges.
FFees and expenses of any underlying mutual funds or exchange-traded funds (ETFs) are not included in the Fund's expense ratio. The Fund indirectly bears its proportionate share of these expenses. For additional expense information related to investments in Fidelity Central Funds, please refer to the "Investments in Fidelity Central Funds" note found in the Notes to Financial Statements section of the most recent Annual or Semi-Annual report.
GExpense ratios reflect operating expenses of the class. Expenses before reductions do not reflect amounts reimbursed, waived, or reduced through arrangements with the investment adviser, brokerage services, or other offset arrangements, if applicable, and do not represent the amount paid by the class during periods when reimbursements, waivers or reductions occur.
HAmount does not include the portfolio activity of any underlying mutual funds or exchange-traded funds (ETFs).
Fidelity Advisor® Real Estate Fund Class C |
| |
| Years ended July 31, | | 2024 | | 2023 | | 2022 | | 2021 | | 2020 |
Selected Per-Share Data | | | | | | | | | | |
| Net asset value, beginning of period | $ | 15.38 | $ | 21.00 | $ | 23.74 | $ | 18.97 | $ | 22.26 |
| Income from Investment Operations | | | | | | | | | | |
Net investment income (loss) A,B | | .20 | | .20 | | .03 | | .09 | | .23 |
| Net realized and unrealized gain (loss) | | 1.21 | | (2.97) | | (1.39) | | 5.30 | | (1.85) |
| Total from investment operations | | 1.41 | | (2.77) | | (1.36) | | 5.39 | | (1.62) |
| Distributions from net investment income | | (.21) | | (.16) | | (.08) | | (.15) | | (.26) |
| Distributions from net realized gain | | - | | (2.69) | | (1.30) | | (.48) | | (1.41) |
| Total distributions | | (.21) | | (2.85) | | (1.38) | | (.62) C | | (1.67) |
| Net asset value, end of period | $ | 16.58 | $ | 15.38 | $ | 21.00 | $ | 23.74 | $ | 18.97 |
Total Return D,E | | | | (12.38)% | | (6.35)% | | 29.36% | | (7.95)% |
Ratios to Average Net Assets B,F,G | | | | | | | | | | |
| Expenses before reductions | | 1.81% | | 1.87% | | 1.86% | | 1.88% | | 1.89% |
| Expenses net of fee waivers, if any | | | | 1.86% | | 1.86% | | 1.88% | | 1.89% |
| Expenses net of all reductions | | 1.81% | | 1.86% | | 1.86% | | 1.87% | | 1.88% |
| Net investment income (loss) | | 1.37% | | 1.20% | | .15% | | .46% | | 1.14% |
| Supplemental Data | | | | | | | | | | |
| Net assets, end of period (000 omitted) | $ | 5,355 | $ | 6,937 | $ | 12,375 | $ | 16,069 | $ | 20,774 |
Portfolio turnover rate H | | | | 31% | | 48% | | 53% | | 56% |
ACalculated based on average shares outstanding during the period.
BNet investment income (loss) is affected by the timing of the declaration of dividends by any underlying mutual funds or exchange-traded funds (ETFs). Net investment income (loss) of any mutual funds or ETFs is not included in the Fund's net investment income (loss) ratio.
CTotal distributions per share do not sum due to rounding.
DTotal returns would have been lower if certain expenses had not been reduced during the applicable periods shown.
ETotal returns do not include the effect of the contingent deferred sales charge.
FFees and expenses of any underlying mutual funds or exchange-traded funds (ETFs) are not included in the Fund's expense ratio. The Fund indirectly bears its proportionate share of these expenses. For additional expense information related to investments in Fidelity Central Funds, please refer to the "Investments in Fidelity Central Funds" note found in the Notes to Financial Statements section of the most recent Annual or Semi-Annual report.
GExpense ratios reflect operating expenses of the class. Expenses before reductions do not reflect amounts reimbursed, waived, or reduced through arrangements with the investment adviser, brokerage services, or other offset arrangements, if applicable, and do not represent the amount paid by the class during periods when reimbursements, waivers or reductions occur.
HAmount does not include the portfolio activity of any underlying mutual funds or exchange-traded funds (ETFs).
Fidelity Advisor® Real Estate Fund Class I |
| |
| Years ended July 31, | | 2024 | | 2023 | | 2022 | | 2021 | | 2020 |
Selected Per-Share Data | | | | | | | | | | |
| Net asset value, beginning of period | $ | 16.54 | $ | 22.26 | $ | 24.96 | $ | 19.84 | $ | 23.15 |
| Income from Investment Operations | | | | | | | | | | |
Net investment income (loss) A,B | | .38 | | .40 | | .27 | | .31 | | .46 |
| Net realized and unrealized gain (loss) | | 1.30 | | (3.14) | | (1.48) | | 5.56 | | (1.92) |
| Total from investment operations | | 1.68 | | (2.74) | | (1.21) | | 5.87 | | (1.46) |
| Distributions from net investment income | | (.36) | | (.29) | | (.19) | | (.27) | | (.44) |
| Distributions from net realized gain | | - | | (2.69) | | (1.30) | | (.48) | | (1.41) |
| Total distributions | | (.36) | | (2.98) | | (1.49) | | (.75) | | (1.85) |
| Net asset value, end of period | $ | 17.86 | $ | 16.54 | $ | 22.26 | $ | 24.96 | $ | 19.84 |
Total Return C | | | | (11.43)% | | (5.43)% | | 30.65% | | (6.99)% |
Ratios to Average Net Assets B,D,E | | | | | | | | | | |
| Expenses before reductions | | .80% | | .84% | | .86% | | .88% | | .86% |
| Expenses net of fee waivers, if any | | | | .83% | | .86% | | .87% | | .86% |
| Expenses net of all reductions | | .79% | | .83% | | .86% | | .87% | | .85% |
| Net investment income (loss) | | 2.39% | | 2.23% | | 1.15% | | 1.46% | | 2.17% |
| Supplemental Data | | | | | | | | | | |
| Net assets, end of period (000 omitted) | $ | 60,502 | $ | 69,081 | $ | 160,565 | $ | 197,873 | $ | 180,346 |
Portfolio turnover rate F | | | | 31% | | 48% | | 53% | | 56% |
ACalculated based on average shares outstanding during the period.
BNet investment income (loss) is affected by the timing of the declaration of dividends by any underlying mutual funds or exchange-traded funds (ETFs). Net investment income (loss) of any mutual funds or ETFs is not included in the Fund's net investment income (loss) ratio.
CTotal returns would have been lower if certain expenses had not been reduced during the applicable periods shown.
DFees and expenses of any underlying mutual funds or exchange-traded funds (ETFs) are not included in the Fund's expense ratio. The Fund indirectly bears its proportionate share of these expenses. For additional expense information related to investments in Fidelity Central Funds, please refer to the "Investments in Fidelity Central Funds" note found in the Notes to Financial Statements section of the most recent Annual or Semi-Annual report.
EExpense ratios reflect operating expenses of the class. Expenses before reductions do not reflect amounts reimbursed, waived, or reduced through arrangements with the investment adviser, brokerage services, or other offset arrangements, if applicable, and do not represent the amount paid by the class during periods when reimbursements, waivers or reductions occur.
FAmount does not include the portfolio activity of any underlying mutual funds or exchange-traded funds (ETFs).
Fidelity Advisor® Real Estate Fund Class Z |
| |
| Years ended July 31, | | 2024 | | 2023 | | 2022 | | 2021 | | 2020 |
Selected Per-Share Data | | | | | | | | | | |
| Net asset value, beginning of period | $ | 16.52 | $ | 22.29 | $ | 24.97 | $ | 19.85 | $ | 23.16 |
| Income from Investment Operations | | | | | | | | | | |
Net investment income (loss) A,B | | .41 | | .43 | | .33 | | .36 | | .50 |
| Net realized and unrealized gain (loss) | | 1.30 | | (3.15) | | (1.48) | | 5.56 | | (1.92) |
| Total from investment operations | | 1.71 | | (2.72) | | (1.15) | | 5.92 | | (1.42) |
| Distributions from net investment income | | (.39) | | (.36) | | (.23) | | (.32) | | (.48) |
| Distributions from net realized gain | | - | | (2.69) | | (1.30) | | (.48) | | (1.41) |
| Total distributions | | (.39) | | (3.05) | | (1.53) | | (.80) | | (1.89) |
| Net asset value, end of period | $ | 17.84 | $ | 16.52 | $ | 22.29 | $ | 24.97 | $ | 19.85 |
Total Return C | | | | (11.30)% | | (5.21)% | | 30.95% | | (6.80)% |
Ratios to Average Net Assets B,D,E | | | | | | | | | | |
| Expenses before reductions | | .64% | | .65% | | .64% | | .64% | | .65% |
| Expenses net of fee waivers, if any | | | | .65% | | .63% | | .64% | | .65% |
| Expenses net of all reductions | | .64% | | .65% | | .63% | | .64% | | .64% |
| Net investment income (loss) | | 2.54% | | 2.41% | | 1.38% | | 1.69% | | 2.38% |
| Supplemental Data | | | | | | | | | | |
| Net assets, end of period (000 omitted) | $ | 6,508 | $ | 6,690 | $ | 13,539 | $ | 16,573 | $ | 9,157 |
Portfolio turnover rate F | | | | 31% | | 48% | | 53% | | 56% |
ACalculated based on average shares outstanding during the period.
BNet investment income (loss) is affected by the timing of the declaration of dividends by any underlying mutual funds or exchange-traded funds (ETFs). Net investment income (loss) of any mutual funds or ETFs is not included in the Fund's net investment income (loss) ratio.
CTotal returns would have been lower if certain expenses had not been reduced during the applicable periods shown.
DFees and expenses of any underlying mutual funds or exchange-traded funds (ETFs) are not included in the Fund's expense ratio. The Fund indirectly bears its proportionate share of these expenses. For additional expense information related to investments in Fidelity Central Funds, please refer to the "Investments in Fidelity Central Funds" note found in the Notes to Financial Statements section of the most recent Annual or Semi-Annual report.
EExpense ratios reflect operating expenses of the class. Expenses before reductions do not reflect amounts reimbursed, waived, or reduced through arrangements with the investment adviser, brokerage services, or other offset arrangements, if applicable, and do not represent the amount paid by the class during periods when reimbursements, waivers or reductions occur.
FAmount does not include the portfolio activity of any underlying mutual funds or exchange-traded funds (ETFs).
Notes to Financial Statements
For the period ended July 31, 2024
1. Organization.
Fidelity Advisor Real Estate Fund (the Fund) is a non-diversified fund of Fidelity Advisor Series VII (the Trust) and is authorized to issue an unlimited number of shares. The Trust is registered under the Investment Company Act of 1940, as amended (the 1940 Act), as an open-end management investment company organized as a Massachusetts business trust. The Fund offers Class A, Class M, Class C, Class I and Class Z shares, each of which has equal rights as to assets and voting privileges. Class A, Class M, Class C, Class I and Class Z are Fidelity Advisor classes. Each class has exclusive voting rights with respect to matters that affect that class. Class C shares will automatically convert to Class A shares after a holding period of eight years from the initial date of purchase, with certain exceptions.
2. Investments in Fidelity Central Funds.
Funds may invest in Fidelity Central Funds, which are open-end investment companies generally available only to other investment companies and accounts managed by the investment adviser and its affiliates. The Schedule of Investments lists any Fidelity Central Funds held as an investment as of period end, but does not include the underlying holdings of each Fidelity Central Fund. An investing fund indirectly bears its proportionate share of the expenses of the underlying Fidelity Central Funds.
Based on its investment objective, each Fidelity Central Fund may invest or participate in various investment vehicles or strategies that are similar to those of the investing fund. These strategies are consistent with the investment objectives of the investing fund and may involve certain economic risks which may cause a decline in value of each of the Fidelity Central Funds and thus a decline in the value of the investing fund.
| Fidelity Central Fund | Investment Manager | Investment Objective | Investment Practices | Expense RatioA |
| Fidelity Money Market Central Funds | Fidelity Management & Research Company LLC (FMR) | Each fund seeks to obtain a high level of current income consistent with the preservation of capital and liquidity. | Short-term Investments | Less than .005% |
A Expenses expressed as a percentage of average net assets and are as of each underlying Central Fund's most recent annual or semi-annual shareholder report.
A complete unaudited list of holdings for each Fidelity Central Fund is available upon request or at the Securities and Exchange Commission website at www.sec.gov. In addition, the financial statements of the Fidelity Central Funds which contain the significant accounting policies (including investment valuation policies) of those funds, and are not covered by the Report of Independent Registered Public Accounting Firm, are available on the Securities and Exchange Commission website or upon request.
3. Significant Accounting Policies.
The Fund is an investment company and applies the accounting and reporting guidance of the Financial Accounting Standards Board (FASB) Accounting Standards Codification Topic 946 Financial Services - Investment Companies. The financial statements have been prepared in conformity with accounting principles generally accepted in the United States of America (GAAP), which require management to make certain estimates and assumptions at the date of the financial statements. Actual results could differ from those estimates. Subsequent events, if any, through the date that the financial statements were issued have been evaluated in the preparation of the financial statements. The Fund's Schedule of Investments lists any underlying mutual funds or exchange-traded funds (ETFs) but does not include the underlying holdings of these funds. The following summarizes the significant accounting policies of the Fund:
Investment Valuation. Investments are valued as of 4:00 p.m. Eastern time on the last calendar day of the period. The Board of Trustees (the Board) has designated the Fund's investment adviser as the valuation designee responsible for the fair valuation function and performing fair value determinations as needed. The investment adviser has established a Fair Value Committee (the Committee) to carry out the day-to-day fair valuation responsibilities and has adopted policies and procedures to govern the fair valuation process and the activities of the Committee. In accordance with these fair valuation policies and procedures, which have been approved by the Board, the Fund attempts to obtain prices from one or more third party pricing services or brokers to value its investments. When current market prices, quotations or currency exchange rates are not readily available or reliable, investments will be fair valued in good faith by the Committee, in accordance with the policies and procedures. Factors used in determining fair value vary by investment type and may include market or investment specific events, transaction data, estimated cash flows, and market observations of comparable investments. The frequency that the fair valuation procedures are used cannot be predicted and they may be utilized to a significant extent. The Committee manages the Fund's fair valuation practices and maintains the fair valuation policies and procedures. The Fund's investment adviser reports to the Board information regarding the fair valuation process and related material matters.
The Fund categorizes the inputs to valuation techniques used to value its investments into a disclosure hierarchy consisting of three levels as shown below:
Level 1 - unadjusted quoted prices in active markets for identical investments
Level 2 - other significant observable inputs (including quoted prices for similar investments, interest rates, prepayment speeds, etc.)
Level 3 - unobservable inputs (including the Fund's own assumptions based on the best information available)
Valuation techniques used to value the Fund's investments by major category are as follows:
Equity securities, including restricted securities, for which market quotations are readily available, are valued at the last reported sale price or official closing price as reported by a third party pricing service on the primary market or exchange on which they are traded and are categorized as Level 1 in the hierarchy. In the event there were no sales during the day or closing prices are not available, securities are valued at the last quoted bid price or may be valued using the last available price and are generally categorized as Level 2 in the hierarchy. For foreign equity securities, when market or security specific events arise, comparisons to the valuation of American Depositary Receipts (ADRs), futures contracts, Exchange-Traded Funds (ETFs) and certain indexes as well as quoted prices for similar securities may be used and would be categorized as Level 2 in the hierarchy. For equity securities, including restricted securities, where observable inputs are limited, assumptions about market activity and risk are used and these securities may be categorized as Level 3 in the hierarchy.
Investments in open-end mutual funds, including the Fidelity Central Funds, are valued at their closing net asset value (NAV) each business day and are categorized as Level 1 in the hierarchy.
Changes in valuation techniques may result in transfers in or out of an assigned level within the disclosure hierarchy. The aggregate value of investments by input level as of July 31, 2024 is included at the end of the Fund's Schedule of Investments.
Investment Transactions and Income. For financial reporting purposes, the Fund's investment holdings and NAV include trades executed through the end of the last business day of the period. The NAV per share for processing shareholder transactions is calculated as of the close of business of the New York Stock Exchange (NYSE), normally 4:00 p.m. Eastern time and includes trades executed through the end of the prior business day. Gains and losses on securities sold are determined on the basis of identified cost. Commissions paid to certain brokers with whom the investment adviser, or its affiliates, places trades on behalf of a fund include an amount in addition to trade execution, which may be rebated back to a fund. Any such rebates are included in net realized gain (loss) on investments in the Statement of Operations. Dividend income is recorded on the ex-dividend date, except for certain dividends from foreign securities where the ex-dividend date may have passed, which are recorded as soon as the Fund is informed of the ex-dividend date. Non-cash dividends included in dividend income, if any, are recorded at the fair market value of the securities received. Income and capital gain distributions from Fidelity Central Funds, if any, are recorded on the ex-dividend date. Certain distributions received by the Fund represent a return of capital or capital gain. The Fund determines the components of these distributions subsequent to the ex-dividend date, based upon receipt of tax filings or other correspondence relating to the underlying investment. These distributions are recorded as a reduction of cost of investments and/or as a realized gain.
Class Allocations and Expenses. Investment income, realized and unrealized capital gains and losses, common expenses of a fund, and certain fund-level expense reductions, if any, are allocated daily on a pro-rata basis to each class based on the relative net assets of each class to the total net assets of a fund. Each class differs with respect to transfer agent and distribution and service plan fees incurred, as applicable. Certain expense reductions may also differ by class, if applicable. For the reporting period, the allocated portion of income and expenses to each class as a percent of its average net assets may vary due to the timing of recording these transactions in relation to fluctuating net assets of the classes. Expenses directly attributable to a fund are charged to that fund. Expenses attributable to more than one fund are allocated among the respective funds on the basis of relative net assets or other appropriate methods. Expenses included in the accompanying financial statements reflect the expenses of that fund and do not include any expenses associated with any underlying mutual funds or exchange-traded funds (ETFs). Although not included in a fund's expenses, a fund indirectly bears its proportionate share of these expenses through the net asset value of each underlying mutual fund or exchange-traded fund (ETF). Expense estimates are accrued in the period to which they relate and adjustments are made when actual amounts are known.
Deferred Trustee Compensation. Under a Deferred Compensation Plan (the Plan) for certain Funds, certain independent Trustees have elected to defer receipt of a portion of their annual compensation. Deferred amounts are invested in affiliated mutual funds, are marked-to-market and remain in a fund until distributed in accordance with the Plan. The investment of deferred amounts and the offsetting payable to the Trustees presented below are included in the accompanying Statement of Assets and Liabilities in other receivables and other payables and accrued expenses, as applicable.
| Fidelity Advisor Real Estate Fund | $107,205 |
Income Tax Information and Distributions to Shareholders. Each year, the Fund intends to qualify as a regulated investment company under Subchapter M of the Internal Revenue Code, including distributing substantially all of its taxable income and realized gains. As a result, no provision for U.S. Federal income taxes is required. As of July 31, 2024, the Fund did not have any unrecognized tax benefits in the financial statements; nor is the Fund aware of any tax positions for which it is reasonably possible that the total amounts of unrecognized tax benefits will significantly change in the next twelve months. The Fund files a U.S. federal tax return, in addition to state and local tax returns as required. The Fund's federal income tax returns are subject to examination by the Internal Revenue Service (IRS) for a period of three fiscal years after they are filed. State and local tax returns may be subject to examination for an additional fiscal year depending on the jurisdiction.
Distributions are declared and recorded on the ex-dividend date. Income and capital gain distributions are declared separately for each class. Income and capital gain distributions are determined in accordance with income tax regulations, which may differ from GAAP.
Capital accounts within the financial statements are adjusted for permanent book-tax differences. These adjustments have no impact on net assets or the results of operations. Capital accounts are not adjusted for temporary book-tax differences which will reverse in a subsequent period.
Book-tax differences are primarily due to capital loss carryforwards, deferred Trustee compensation and losses deferred due to wash sales and excise tax regulations.
As of period end, the cost and unrealized appreciation (depreciation) in securities, and derivatives if applicable, for federal income tax purposes were as follows:
Gross unrealized appreciation | $68,664,082 |
Gross unrealized depreciation | (11,784,931) |
Net unrealized appreciation (depreciation) | $56,879,151 |
Tax Cost | $183,166,786 |
The tax-based components of distributable earnings as of period end were as follows:
| | |
Undistributed ordinary income | $1,242,892 |
Capital loss carryforward | $(2,504,747) |
| Net unrealized appreciation (depreciation) on securities and other investments | $56,879,151 |
Capital loss carryforwards are only available to offset future capital gains of the Fund to the extent provided by regulations and may be limited. The capital loss carryforward information presented below, including any applicable limitation, is estimated as of fiscal period end and is subject to adjustment.
Short-term | $(2,504,747) |
| Total capital loss carryforward | $(2,504,747) |
| | |
The tax character of distributions paid was as follows
| | July 31, 2024 | July 31, 2023 |
| Ordinary Income | $4,738,172 | $ 3,931,675 |
Long-term Capital Gains | - | 39,565,793 |
| Total | $4,738,172 | $ 43,497,468 |
4. Purchases and Sales of Investments.
Purchases and sales of securities, other than short-term securities and in-kind transactions, as applicable, are noted in the table below.
| | Purchases ($) | Sales ($) |
Fidelity Advisor Real Estate Fund | 54,960,017 | 90,694,028 |
5. Fees and Other Transactions with Affiliates.
Management Fee. Fidelity Management & Research Company LLC (the investment adviser) and its affiliates provide the Fund with investment management related services for which the Fund pays a monthly management fee.
Effective March 1, 2024, the Fund's management contract was amended to incorporate administrative services previously covered under separate services agreements (Transfer Agent and Accounting agreements). The amended contract incorporates a management fee rate that may vary by class. The investment adviser or an affiliate pays certain expenses of managing and operating the Fund out of each class's management fee. Each class of the Fund pays a management fee to the investment adviser. The management fee is calculated and paid to the investment adviser every month. When determining a class's management fee, a mandate rate is calculated based on the monthly average net assets of a group of funds advised by FMR within a designated asset class. A discount rate is subtracted from the mandate rate once the Fund's monthly average net assets reach a certain level. The mandate rate and discount rate may vary by class. The annual management fee rate for a class of shares of the Fund is the lesser of (1) the class's mandate rate reduced by the class's discount rate (if applicable) or (2) the amount set forth in the following table.
| | Maximum Management Fee Rate % |
| Class A | .72 |
| Class M | .72 |
| Class C | .72 |
| Class I | .71 |
| Class Z | .56 |
One-twelfth of the management fee rate for a class is applied to the average net assets of the class for the month, giving a dollar amount which is the management fee for the class for that month. A different management fee rate may be applicable to each class of the Fund. The difference between classes is the result of separate arrangements for class-level services and/or waivers of certain expenses. It is not the result of any difference in advisory or custodial fees or other expenses related to the management of the Fund's assets, which do not vary by class. For the portion of the reporting period on or after March 1, 2024, the total annualized management fee rates were as follows:
| | Total Management Fee Rate % |
| Class A | .72 |
| Class M | .72 |
| Class C | .72 |
| Class I | .71 |
| Class Z | .56 |
Prior to March 1, 2024, the management fee was the sum of an individual fund fee rate that was based on an annual rate of .30% of the Fund's average net assets and an annualized group fee rate that averaged .22% during the period. The group fee rate was based upon the monthly average net assets of a group of registered investment companies with which the investment adviser has management contracts. The group fee rate decreased as assets under management increased and increased as assets under management decreased. For the portion of the reporting period prior to March 1, 2024, the total annualized management fee rate was .52%.
Effective March 1, 2024, the Fund's sub-advisory agreements with FMR Investment Management (UK) Limited, Fidelity Management & Research (Hong Kong) Limited, and Fidelity Management & Research (Japan) Limited were amended to provide that the investment adviser pays each sub-adviser monthly fees equal to 110% of the sub-adviser's costs for providing sub-advisory services.
Distribution and Service Plan Fees. In accordance with Rule 12b-1 of the 1940 Act, the Fund has adopted separate Distribution and Service Plans for each class of shares. Certain classes pay Fidelity Distributors Company LLC (FDC), an affiliate of the investment adviser, separate Distribution and Service Fees, each of which is based on an annual percentage of each class' average net assets. In addition, FDC may pay financial intermediaries for selling shares of the Fund and providing shareholder support services. For the period, the Distribution and Service Fee rates, total fees and amounts retained by FDC were as follows:
| | Distribution Fee | Service Fee | Total Fees ($) | Retained by FDC ($) |
Class A | - % | .25% | 204,450 | 90,778 |
Class M | .25% | .25% | 387,768 | 25,088 |
| Class C | .75% | .25% | 56,068 | 31,747 |
| | | | 648,286 | 147,613 |
Sales Load. FDC may receive a front-end sales charge of up to 5.75% for selling Class A shares and 3.50% for selling Class M shares, some of which is paid to financial intermediaries for selling shares of the Fund. Depending on the holding period, FDC may receive contingent deferred sales charges levied on Class A, Class M and Class C redemptions. The deferred sales charges are 1.00% for Class C shares, 1.00% for certain purchases of Class A shares and .25% for certain purchases of Class M shares.
For the period, sales charge amounts retained by FDC were as follows:
| | Retained by FDC ($) |
Class A | 7,570 |
Class M | 1,935 |
Class CA | 265 |
| | 9,770 |
A When Class C shares are initially sold, FDC pays commissions from its own resources to financial intermediaries through which the sales are made.
Transfer Agent Fees. Fidelity Investments Institutional Operations Company LLC (FIIOC), an affiliate of the investment adviser, is the transfer, dividend disbursing and shareholder servicing agent for each class of the Fund. Effective March 1, 2024, the Fund's management contract was amended to incorporate transfer agent services and associated fees previously covered under a separate services agreement. FIIOC pays for typesetting, printing and mailing of shareholder reports, except proxy statements.
During the period December 1, 2023 through February 29, 2024, the transfer agent fees for each class were a fixed annual rate of class-level average net assets as follows:
| | | % of Class-Level Average Net Assets |
Class A | | .2000 |
| Class M | | .2000 |
Class C | | .2000 |
Class I | | .1941 |
| Class Z | | .0420 |
| | | |
Prior to December 1, 2023, FIIOC received account fees and asset-based fees that varied according to the account size and type of account of the shareholders of the respective classes of the Fund, except for Class Z. FIIOC received an asset-based fee of Class Z's average net assets. For the portion of the reporting period prior to March 1, 2024, the fees were equivalent to the following annualized rates:
| | Amount ($) | % of Class-Level Average Net Assets |
Class A | 111,265 | .23 |
Class M | 93,401 | .20 |
Class C | 7,914 | .23 |
Class I | 68,528 | .19 |
| Class Z | 1,521 | .04 |
| 282,629 | |
Accounting Fees. Fidelity Service Company, Inc. (FSC), an affiliate of the investment adviser, maintains the Fund's accounting records. Effective March 1, 2024, the Fund's management contract was amended to incorporate accounting services and associated fees previously covered under a separate services agreement.
During the period December 1, 2023 through February 29, 2024, the accounting fees were a fixed annual rate of average net assets as follows:
| | % of Average Net Assets |
Fidelity Advisor Real Estate Fund | .0354 |
Prior to December 1, 2023, the accounting fee was based on the level of average net assets for each month. For the portion of the reporting period prior to March 1, 2024, the fees were equivalent to the following annualized rates:
| | % of Average Net Assets |
Fidelity Advisor Real Estate Fund | .04 |
Brokerage Commissions. A portion of portfolio transactions were placed with brokerage firms which are affiliates of the investment adviser. Brokerage commissions are included in net realized gain (loss) and change in net unrealized appreciation (depreciation) in the Statement of Operations. The commissions paid to these affiliated firms were as follows:
| | Amount ($) |
| Fidelity Advisor Real Estate Fund | 1,280 |
Interfund Trades. Funds may purchase from or sell securities to other Fidelity Funds under procedures adopted by the Board. The procedures have been designed to ensure these interfund trades are executed in accordance with Rule 17a-7 of the 1940 Act. Any interfund trades are included within the respective purchases and sales amounts shown in the Purchases and Sales of Investments note. Interfund trades during the period are noted in the table below.
| | Purchases ($) | Sales ($) | Realized Gain (Loss)($) |
Fidelity Advisor Real Estate Fund | 3,507,141 | 6,615,190 | 620,053 |
6. Committed Line of Credit.
Certain Funds participate with other funds managed by the investment adviser or an affiliate in a $4.25 billion credit facility (the "line of credit") to be utilized for temporary or emergency purposes to fund shareholder redemptions or for other short-term liquidity purposes. The participating funds have agreed to pay commitment fees on their pro-rata portion of the line of credit, which are reflected in Miscellaneous expenses on the Statement of Operations, and are listed below. During the period, there were no borrowings on this line of credit.
| | Amount ($) |
Fidelity Advisor Real Estate Fund | 394 |
7. Security Lending.
Funds lend portfolio securities from time to time in order to earn additional income. Lending agents are used, including National Financial Services (NFS), an affiliate of the investment adviser. Pursuant to a securities lending agreement, NFS will receive a fee, which is capped at 9.9% of a fund's daily lending revenue, for its services as lending agent. A fund may lend securities to certain qualified borrowers, including NFS. On the settlement date of the loan, a fund receives collateral (in the form of U.S. Treasury obligations, letters of credit and/or cash) against the loaned securities and maintains collateral in an amount not less than 100% of the market value of the loaned securities during the period of the loan. The market value of the loaned securities is determined at the close of business of a fund and any additional required collateral is delivered to a fund on the next business day. A fund or borrower may terminate the loan at any time, and if the borrower defaults on its obligation to return the securities loaned because of insolvency or other reasons, a fund may apply collateral received from the borrower against the obligation. A fund may experience delays and costs in recovering the securities loaned. Any cash collateral received is invested in the Fidelity Securities Lending Cash Central Fund. Any loaned securities are identified as such in the Schedule of Investments, and the value of loaned securities and cash collateral at period end, as applicable, are presented in the Statement of Assets and Liabilities. Security lending income represents the income earned on investing cash collateral, less rebates paid to borrowers and any lending agent fees associated with the loan, plus any premium payments received for lending certain types of securities. Security lending income is presented in the Statement of Operations as a component of income from Fidelity Central Funds. Affiliated security lending activity, if any, was as follows:
| | Total Security Lending Fees Paid to NFS ($) | Security Lending Income From Securities Loaned to NFS ($) | Value of Securities Loaned to NFS at Period End ($) |
| Fidelity Advisor Real Estate Fund | 525 | - | - |
8. Expense Reductions.
Through arrangements with each class' transfer agent, credits realized as a result of certain uninvested cash balances were used to reduce the Fund's expenses. During the period, transfer agent credits reduced each class' expenses as noted in the table below.
| | Expense reduction ($) |
| | |
Class M | 83 |
In addition, during the period the investment adviser or an affiliate reimbursed and/or waived a portion of fund-level operating expenses in the amount of $15,092.
9. Distributions to Shareholders.
Distributions to shareholders of each class were as follows:
| | Year ended July 31, 2024 | Year ended July 31, 2023 |
| Fidelity Advisor Real Estate Fund | | |
| Distributions to shareholders | | |
Class A | $1,689,144 | $15,393,613 |
Class M | 1,436,091 | 13,294,219 |
Class C | 84,828 | 1,438,033 |
Class I | 1,372,528 | 12,249,509 |
Class Z | 155,581 | 1,122,094 |
Total | $4,738,172 | $43,497,468 |
10. Share Transactions.
Share transactions for each class were as follows and may contain in-kind transactions, automatic conversions between classes or exchanges between affiliated funds:
| | Shares | Shares | Dollars | Dollars |
| | Year ended July 31, 2024 | Year ended July 31, 2023 | Year ended July 31, 2024 | Year ended July 31, 2023 |
| Fidelity Advisor Real Estate Fund | | | | |
| Class A | | | | |
| Shares sold | 451,227 | 548,565 | $7,090,438 | $9,379,631 |
| Reinvestment of distributions | 103,378 | 988,337 | 1,662,406 | 15,169,887 |
| Shares redeemed | (1,436,554) | (1,486,572) | (22,498,145) | (25,486,524) |
| Net increase (decrease) | (881,949) | 50,330 | $(13,745,301) | $(937,006) |
| Class M | | | | |
| Shares sold | 347,408 | 415,463 | $5,408,153 | $7,039,884 |
| Reinvestment of distributions | 89,517 | 868,723 | 1,432,781 | 13,263,543 |
| Shares redeemed | (996,785) | (691,075) | (15,582,053) | (11,816,775) |
| Net increase (decrease) | (559,860) | 593,111 | $(8,741,119) | $8,486,652 |
| Class C | | | | |
| Shares sold | 36,190 | 34,213 | $540,520 | $548,005 |
| Reinvestment of distributions | 5,452 | 97,245 | 82,977 | 1,414,160 |
| Shares redeemed | (169,564) | (269,790) | (2,502,399) | (4,377,700) |
| Net increase (decrease) | (127,922) | (138,332) | $(1,878,902) | $(2,415,535) |
| Class I | | | | |
| Shares sold | 743,512 | 1,212,683 | $11,842,316 | $21,265,339 |
| Reinvestment of distributions | 82,703 | 773,432 | 1,353,197 | 12,074,421 |
| Shares redeemed | (1,615,757) | (5,020,909) | (26,190,165) | (92,269,058) |
| Net increase (decrease) | (789,542) | (3,034,794) | $(12,994,652) | $(58,929,298) |
| Class Z | | | | |
| Shares sold | 146,206 | 147,772 | $2,345,828 | $2,504,135 |
| Reinvestment of distributions | 8,833 | 66,006 | 144,068 | 1,033,635 |
| Shares redeemed | (195,106) | (416,258) | (3,069,544) | (7,225,336) |
| Net increase (decrease) | (40,067) | (202,480) | $(579,648) | $(3,687,566) |
11. Other.
A fund's organizational documents provide former and current trustees and officers with a limited indemnification against liabilities arising in connection with the performance of their duties to the fund. In the normal course of business, a fund may also enter into contracts that provide general indemnifications. A fund's maximum exposure under these arrangements is unknown as this would be dependent on future claims that may be made against a fund. The risk of material loss from such claims is considered remote.
12. Risk and Uncertainties.
Many factors affect a fund's performance. Developments that disrupt global economies and financial markets, such as pandemics, epidemics, outbreaks of infectious diseases, war, terrorism, and environmental disasters, may significantly affect a fund's investment performance. The effects of these developments to a fund will be impacted by the types of securities in which a fund invests, the financial condition, industry, economic sector, and geographic location of an issuer, and a fund's level of investment in the securities of that issuer. Significant concentrations in security types, issuers, industries, sectors, and geographic locations may magnify the factors that affect a fund's performance.
Report of Independent Registered Public Accounting Firm
To the Board of Trustees of Fidelity Advisor Series VII and the Shareholders of Fidelity Advisor Real Estate Fund:
Opinion on the Financial Statements and Financial Highlights
We have audited the accompanying statement of assets and liabilities of Fidelity Advisor Real Estate Fund (the "Fund"), a fund of Fidelity Advisor Series VII, including the schedule of investments, as of July 31, 2024, the related statement of operations for the year then ended, the statement of changes in net assets for each of the two years in the period then ended, the financial highlights for each of the five years in the period then ended, and the related notes. In our opinion, the financial statements and financial highlights present fairly, in all material respects, the financial position of the Fund as of July 31, 2024, and the results of its operations for the year then ended, the changes in its net assets for each of the two years in the period then ended, and the financial highlights for each of the five years in the period then ended in conformity with accounting principles generally accepted in the United States of America.
Basis for Opinion
These financial statements and financial highlights are the responsibility of the Fund's management. Our responsibility is to express an opinion on the Fund's financial statements and financial highlights based on our audits. We are a public accounting firm registered with the Public Company Accounting Oversight Board (United States) (PCAOB) and are required to be independent with respect to the Fund in accordance with the U.S. federal securities laws and the applicable rules and regulations of the Securities and Exchange Commission and the PCAOB.
We conducted our audits in accordance with the standards of the PCAOB. Those standards require that we plan and perform the audit to obtain reasonable assurance about whether the financial statements and financial highlights are free of material misstatement, whether due to error or fraud. The Fund is not required to have, nor were we engaged to perform, an audit of its internal control over financial reporting. As part of our audits, we are required to obtain an understanding of internal control over financial reporting but not for the purpose of expressing an opinion on the effectiveness of the Fund's internal control over financial reporting. Accordingly, we express no such opinion.
Our audits included performing procedures to assess the risks of material misstatement of the financial statements and financial highlights, whether due to error or fraud, and performing procedures that respond to those risks. Such procedures included examining, on a test basis, evidence regarding the amounts and disclosures in the financial statements and financial highlights. Our audits also included evaluating the accounting principles used and significant estimates made by management, as well as evaluating the overall presentation of the financial statements and financial highlights. Our procedures included confirmation of securities owned as of July 31, 2024, by correspondence with the custodian and brokers; when replies were not received from brokers, we performed other auditing procedures. We believe that our audits provide a reasonable basis for our opinion.
/s/ Deloitte & Touche LLP
Boston, Massachusetts
September 12, 2024
We have served as the auditor of one or more of the Fidelity investment companies since 1999.
Distributions
(Unaudited)The dividend and capital gains distributions for the fund(s) are available on Fidelity.com or Institutional.Fidelity.com.
A total of 0.11% of the dividends distributed during the fiscal year was derived from interest on U.S. Government securities which is generally exempt from state income tax.
The fund designates $29,234 of distributions paid during the fiscal year ended 2024 as qualifying to be taxed as section 163(j) interest dividends.
Class A designates 91.30%, 100%, and 100%; Class C designates 100%, 100%, and 0%; Class I designates 83.62%, 100%, and 100%; Class M designates 97.26%, 100%, and 100%; and Class Z designates 79.18%, 100%, and 100%; of the dividends distributed in September 2023, December 2023, and June 2024, respectively during the fiscal year as a section 199A dividend.
The fund will notify shareholders in January 2025 of amounts for use in preparing 2024 income tax returns.
Item 8: Changes in and Disagreements with Accountants for Open-End Management Investment Companies
Note: This is not applicable for any fund included in this document.
Item 9: Proxy Disclosures for Open-End Management Investment Companies
| A special meeting of shareholders was held on July 16, 2024. The results of votes taken among shareholders on the proposal before them are reported below. Each vote reported represents one dollar of net asset value held on the record date for the meeting. |
| Proposal 1 |
| To elect a Board of Trustees. |
| | # of Votes | % of Votes |
| Bettina Doulton |
| Affirmative | 11,673,835,823.95 | 96.01 |
| Withheld | 484,880,332.79 | 3.99 |
| TOTAL | 12,158,716,156.74 | 100.00 |
| Robert A. Lawrence |
| Affirmative | 11,649,437,829.16 | 95.81 |
| Withheld | 509,278,327.57 | 4.19 |
| TOTAL | 12,158,716,156.74 | 100.00 |
| Vijay C. Advani |
| Affirmative | 11,613,776,744.77 | 95.52 |
| Withheld | 544,939,411.97 | 4.48 |
| TOTAL | 12,158,716,156.74 | 100.00 |
| Thomas P. Bostick |
| Affirmative | 11,653,386,078.49 | 95.84 |
| Withheld | 505,330,078.25 | 4.16 |
| TOTAL | 12,158,716,156.74 | 100.00 |
| Donald F. Donahue |
| Affirmative | 11,632,589,030.61 | 95.67 |
| Withheld | 526,127,126.13 | 4.33 |
| TOTAL | 12,158,716,156.74 | 100.00 |
| Vicki L. Fuller |
| Affirmative | 11,691,940,576.27 | 96.16 |
| Withheld | 466,775,580.46 | 3.84 |
| TOTAL | 12,158,716,156.74 | 100.00 |
| Patricia L. Kampling |
| Affirmative | 11,685,988,743.05 | 96.11 |
| Withheld | 472,727,413.69 | 3.89 |
| TOTAL | 12,158,716,156.74 | 100.00 |
| Thomas A. Kennedy |
| Affirmative | 11,651,823,552.03 | 95.83 |
| Withheld | 506,892,604.70 | 4.17 |
| TOTAL | 12,158,716,156.74 | 100.00 |
| Oscar Munoz |
| Affirmative | 11,630,338,090.08 | 95.65 |
| Withheld | 528,378,066.66 | 4.35 |
| TOTAL | 12,158,716,156.74 | 100.00 |
| Karen B. Peetz |
| Affirmative | 11,652,647,210.01 | 95.84 |
| Withheld | 506,068,946.73 | 4.16 |
| TOTAL | 12,158,716,156.74 | 100.00 |
| David M. Thomas |
| Affirmative | 11,635,848,489.52 | 95.70 |
| Withheld | 522,867,667.21 | 4.30 |
| TOTAL | 12,158,716,156.74 | 100.00 |
| Susan Tomasky |
| Affirmative | 11,679,774,589.51 | 96.06 |
| Withheld | 478,941,567.22 | 3.94 |
| TOTAL | 12,158,716,156.74 | 100.00 |
| Michael E. Wiley |
| Affirmative | 11,645,598,691.16 | 95.78 |
| Withheld | 513,117,465.58 | 4.22 |
| TOTAL | 12,158,716,156.74 | 100.00 |
| | | |
| Proposal 1 reflects trust-wide proposal and voting results. |
Item 10: Remuneration Paid to Directors, Officers, and others of Open-End Management Investment Companies
Note: This information is disclosed as part of the financial statements for each Fund as part of Item 7: Financial Statements and Financial Highlights for Open-End Management Investment companies.
Item 11: Statement Regarding Basis for Approval of Investment Advisory Contract
Board Approval of Investment Advisory Contracts and Management Fees
Fidelity Advisor Real Estate Fund
Each year, the Board of Trustees, including the Independent Trustees (together, the Board), considers the renewal of the fund's management contract with Fidelity Management & Research Company LLC (FMR) and the sub-advisory agreements (together, the Advisory Contracts) for the fund. FMR and the sub-advisers are referred to herein as the Investment Advisers. The Board, assisted by the advice of fund counsel and Independent Trustees' counsel, requests and considers a broad range of information relevant to the renewal of the Advisory Contracts throughout the year.
The Board meets regularly and, at each of its meetings, covers an extensive agenda of topics and materials and considers factors that are relevant to its annual consideration of the renewal of the fund's Advisory Contracts, including the services and support provided to the fund and its shareholders. The Board, acting directly and through its Committees (each of which is composed of and chaired by Independent Trustees), requests and receives information concerning the annual consideration of the renewal of the fund's Advisory Contracts. The Board also meets as needed to review matters specifically related to the Board's annual consideration of the renewal of the Advisory Contracts. Members of the Board may also meet with trustees of other Fidelity funds through joint ad hoc committees to discuss certain matters relevant to all of the Fidelity funds.
At its May 2024 meeting, the Board unanimously determined to renew the fund's Advisory Contracts. In reaching its determination, the Board considered all factors it believed relevant, including (i) the nature, extent, and quality of the services provided to the fund and its shareholders (including the investment performance of the fund); (ii) the competitiveness relative to peer funds of the fund's management fee and the total expense ratio of a representative class (Class I, which was selected because it was the largest class without 12b-1 fees); (iii) the total costs of the services provided by and the profits realized by FMR and its affiliates (Fidelity) from its relationships with the fund; and (iv) the extent to which, if any, economies of scale exist and are realized as the fund grows, and whether any economies of scale are appropriately shared with fund shareholders. The Board also considered the broad range of investment choices available to shareholders from FMR's competitors and that the fund's shareholders have chosen to invest in the fund, which is part of the Fidelity family of funds. The Board's decision to renew the Advisory Contracts was not based on any single factor.
The Board reached a determination, with the assistance of fund counsel and Independent Trustees' counsel and through the exercise of its business judgment, that the renewal of the Advisory Contracts was in the best interests of the fund and its shareholders and that the compensation payable under the Advisory Contracts was fair and reasonable in light of all of the surrounding circumstances.
Nature, Extent, and Quality of Services Provided. The Board considered staffing as it relates to the fund, including the backgrounds and experience of investment personnel of the Investment Advisers, and also considered the Investments Advisers' implementation of the fund's investment program. The Independent Trustees also had discussions with senior management of Fidelity's investment operations and investment groups. The Board considered the structure of the investment personnel compensation program and whether this structure provides appropriate incentives to act in the best interests of the fund. Additionally, the Board considered the portfolio managers' investments, if any, in the funds that they manage.
Resources Dedicated to Investment Management and Support Services. The Board and the Fund Oversight and Research Committees reviewed the general qualifications and capabilities of Fidelity's investment staff, including its size, education, experience, and resources, as well as Fidelity's approach to recruiting, training, managing, and compensating investment personnel. The Board noted the resources devoted to expansion of Fidelity's global investment organization, and that Fidelity's analysts have extensive resources, tools and capabilities that allow them to conduct sophisticated quantitative and fundamental analysis, as well as credit analysis of issuers, counterparties and guarantors. Further, the Board considered that Fidelity's investment professionals have sufficient access to global information and data so as to provide competitive investment results over time, and that those professionals also have access to sophisticated tools that permit them to assess portfolio construction and risk and performance attribution characteristics continuously, as well as to transmit new information and research conclusions rapidly around the world. Additionally, in its deliberations, the Board considered Fidelity's trading, risk management, compliance, and technology and operations capabilities and resources, which are integral parts of the investment management process.
Shareholder and Administrative Services. The Board considered (i) the nature, extent, quality, and cost of advisory, administrative, shareholder, transfer agency, and pricing and bookkeeping services performed by the Investment Advisers and their affiliates under the Advisory Contracts; (ii) the nature and extent of Fidelity's supervision of third party service providers, principally custodians, subcustodians, and pricing vendors; and (iii) the resources devoted by Fidelity to, and the record of compliance with, the fund's compliance policies and procedures. The Board also reviewed the allocation of fund brokerage, including allocations to brokers affiliated with the Investment Advisers, the use of brokerage commissions to pay fund expenses, and the use of "soft" commission dollars to pay for research services. The Board also considered the fund's securities lending activities and any payments made to Fidelity relating to securities lending under a separate agreement.
The Board noted that the growth of fund assets over time across the complex allows Fidelity to reinvest in the development of services designed to enhance the value and convenience of the Fidelity funds as investment vehicles. These services include 24-hour access to account information and market information over the Internet and through telephone representatives, investor education materials and asset allocation tools. The Board also considered that it reviews customer service metrics such as telephone response times, continuity of services on the website and metrics addressing services at Fidelity Investor Centers.
Investment in a Large Fund Family. The Board considered the benefits to shareholders of investing in a fund that is part of a large family of funds offering a variety of investment disciplines and providing a large variety of fund investor services. The Board noted that Fidelity had taken, or had made recommendations that resulted in the Fidelity funds taking, a number of actions over the previous year that benefited particular funds and/or the Fidelity funds in general.
Investment Performance. The Board took into account discussions that occur with representatives of the Investment Advisers, and reports that it receives, at Board meetings throughout the year, relating to fund investment performance. In this regard the Board noted that as part of regularly scheduled fund reviews and other reports to the Board on fund performance, the Board considered annualized return information for the fund for different time periods, measured against an appropriate securities market index (benchmark index) and an appropriate peer group of funds with similar objectives (peer group). The Board also considered information about performance attribution. In its ongoing evaluation of fund investment performance, the Board gives particular attention to information indicating changes in performance of the funds over different time periods and discussed with the Investment Advisers the reasons for any overperformance or underperformance. The fund underperformed its benchmark and peers for the one- and three-year periods ended February 29, 2024, and as a result, the Board continues to engage in discussions with FMR about the steps it is taking to address the fund's performance.
In addition to reviewing absolute and relative fund performance, the Independent Trustees periodically consider the appropriateness of fund performance metrics in evaluating the results achieved. The Independent Trustees generally give greater weight to fund performance over longer time periods than over shorter time periods. Depending on the circumstances, the Independent Trustees may be satisfied with a fund's performance notwithstanding that it lags its benchmark index or peer group for certain periods.
Based on its review, the Board concluded that the nature, extent, and quality of services provided to the fund under the Advisory Contracts should continue to benefit the shareholders of the fund.
Competitiveness of Management Fee and Total Expense Ratio. The Board was provided with information regarding industry trends in management fees and expenses. The Board considered that, effective March 1, 2024, an amended Advisory Contract with FMR went into effect with class-level management fees based on tiered schedules and subject to a maximum class-level rate (the management fee). The Board also considered that in exchange for the variable management fee, each class of the fund receives investment advisory, management, administrative, transfer agent, and pricing and bookkeeping services. In its review of the management fee and total expense ratio of Class I, the Board considered a pro forma management fee rate for Class I as if it had been in effect for the 12-month period ended September 30, 2023, as well as other third-party fund expenses, as applicable, such as custodial, legal, and audit fees and any fund-paid 12b-1 fees. The Board noted that Fidelity may agree to waive fees or reimburse expenses from time to time, and the extent to which, if any, it has done so for the fund.
Comparisons of Management Fees and Total Expense Ratios. Among other things, the Board reviewed data for selected groups of competitive funds and classes (referred to as "mapped groups") that were compiled by Fidelity based on combining similar investment objective categories (as classified by Morningstar) that have comparable investment mandates. The data reviewed by the Board included (i) gross management fee comparisons (before taking into account expense reimbursements or caps) relative to the total universe of funds within the mapped group; (ii) gross management fee comparisons relative to a subset of non-Fidelity funds in the mapped group that are similar in size and management fee structure to the fund (referred to as the "asset size peer group"); (iii) total expense comparisons of Class I of the fund relative to funds and classes in the mapped group that have a similar sales load structure to Class I of the fund (referred to as the "similar sales load structure group"); and (iv) total expense comparisons of Class I of the fund relative to funds and classes in the similar sales load structure group that are similar in size and management fee structure to the fund (referred to as the "total expense asset size peer group"). The total expense asset size peer group comparison excludes performance adjustments and fund-paid 12b-1 fees to eliminate variability in fee structures.
The information provided to the Board indicated that the fund's management fee rate ranked below the competitive median of the mapped group for the 12-month period ended September 30, 2023 and below the competitive median of the asset size peer group for the 12-month period ended September 30, 2023. Further, the information provided to the Board indicated that the total expense ratio of Class I of the fund ranked below the competitive median of the similar sales load structure group for the 12-month period ended September 30, 2023 and below the competitive median of the total expense asset size peer group for the 12-month period ended September 30, 2023.
The Board noted that a different variable management fee rate is applicable to each class of the fund. The Board considered that the difference in management fee rates between classes is the result of separate arrangements for class-level services and/or waivers of certain expenses and not the result of any difference in advisory or custodial fees or other expenses related to the management of the fund's assets, which do not vary by class.
Fees Charged to Other Fidelity Clients. The Board also considered Fidelity fee structures and other information with respect to clients of Fidelity, such as other funds advised or subadvised by Fidelity, pension plan clients, and other institutional clients with similar mandates. The Board noted that a joint ad hoc committee created by it and the boards of other Fidelity funds periodically reviews and compares Fidelity's institutional investment advisory business with its business of providing services to the Fidelity funds and also noted the most recent findings of the committee. The Board noted that the committee's review included a consideration of the differences in services provided, fees charged, and costs incurred, as well as competition in the markets serving the different categories of clients.
Based on its review, the Board concluded that the fund's management fee is fair and reasonable in light of the services that the fund receives and the other factors considered. Further, based on its review of total expense ratios and fees charged to other Fidelity clients, the Board concluded that the total expense ratio of each class of the fund was reasonable in light of the services that the fund and its shareholders receive and the other factors considered.
Costs of the Services and Profitability. The Board considered the revenues earned and the expenses incurred by Fidelity in conducting the business of developing, marketing, distributing, managing, administering and servicing the fund and servicing the fund's shareholders. The Board also considered the level of Fidelity's profits in respect of all the Fidelity funds.
On an annual basis, Fidelity presents to the Board information about the profitability of its relationships with the fund. Fidelity calculates profitability information for each fund, as well as aggregate profitability information for groups of Fidelity funds and all Fidelity funds, using a series of detailed revenue and cost allocation methodologies which originate with the books and records of Fidelity on which Fidelity's audited financial statements are based. The Audit Committee of the Board reviews any significant changes from the prior year's methodologies and the full Board approves such changes.
A public accounting firm has been engaged annually by the Board as part of the Board's assessment of Fidelity's profitability analysis. The engagement includes the review and assessment of the methodologies used by Fidelity in determining the revenues and expenses attributable to Fidelity's fund business, and completion of agreed-upon procedures in respect of the mathematical accuracy of certain fund profitability information and its conformity to established allocation methodologies. After considering the reports issued under the engagement and information provided by Fidelity, the Board concluded that while other allocation methods may also be reasonable, Fidelity's profitability methodologies are reasonable in all material respects.
The Board also reviewed Fidelity's non-fund businesses and potential indirect benefits such businesses may have received as a result of their association with Fidelity's fund business (i.e., fall-out benefits) as well as cases where Fidelity's affiliates may benefit from the funds' business. The Board considered areas where potential indirect benefits to the Fidelity funds from their relationships with Fidelity may exist. The Board's consideration of these matters was informed by the findings of a joint ad hoc committee created by it and the boards of other Fidelity funds to evaluate potential fall-out benefits.
The Board considered the costs of the services provided by and the profits realized by Fidelity in connection with the operation of the fund and was satisfied that the profitability was not excessive.
Economies of Scale. The Board considered whether there have been economies of scale in respect of the management of the Fidelity funds, whether the Fidelity funds (including the fund) have appropriately benefited from any such economies of scale, and whether there is potential for realization of any further economies of scale. The Board considered the extent to which the fund will benefit from economies of scale as assets grow through increased services to the fund, through waivers or reimbursements, or through fee or expense ratio reductions. The Board also noted that a committee created by it and the boards of other Fidelity funds periodically analyzes whether Fidelity attains economies of scale in respect of the management and servicing of the Fidelity funds, whether the Fidelity funds have appropriately benefited from such economies of scale, and whether there is potential for realization of any further economies of scale.
The Board recognized that the fund's management contract incorporates a variable management fee structure, which provides breakpoints as a way to share, in part, any potential economies of scale that may exist at the asset class level and through a discount that considers both fund size and total assets of the four applicable asset classes. The Board considered that the variable management fee is designed to deliver the benefits of economies of scale to fund shareholders even if assets of any particular fund are unchanged or have declined, because some portion of Fidelity's costs are attributable to services provided to all funds subject to the variable management fee, and all such funds benefit if those costs can be allocated among more assets. The Board concluded that, given the variable management fee structure, fund shareholders will benefit from lower management fees due to the application of the breakpoints and discount factor, regardless of whether Fidelity achieves any such economies of scale.
The Board concluded, taking into account the analysis of the committee, that economies of scale, if any, are being appropriately shared between fund shareholders and Fidelity.
Additional Information Requested by the Board. In order to develop fully the factual basis for consideration of the Fidelity funds' advisory contracts, the Board requested and received additional information on certain topics, including but not limited to: (i) fund flow and performance trends, in particular the underperformance of certain funds and strategies, and Fidelity's long-term strategies for certain funds; (ii) the operation of performance fees and the rationale for implementing performance fees on certain categories of funds but not others; (iii) Fidelity's pricing philosophy compared to competitors; (iv) fund profitability methodology and data; (v) evaluation of competitive fund data and peer group classifications and fee and expense comparisons; (vi) the management fee and expense structures for different funds and classes and information about the differences between various fee and expense structures; (vii) the variable management fee implemented for certain funds effective March 1, 2024; and (viii) information regarding other accounts managed by Fidelity and the funds' sub-advisory arrangements.
Conclusion. Based on its evaluation of all of the conclusions noted above, and after considering all factors it believed relevant, the Board, including the Independent Trustees, concluded that the advisory and sub-advisory fee arrangements are fair and reasonable in light of all of the surrounding circumstances and that the fund's Advisory Contracts should be renewed through May 31, 2025.
1.789690.121
ARE-ANN-0924
Item 8.
Changes in and Disagreements with Accountants for Open-End Management Investment Companies
See Item 7.
Item 9.
Proxy Disclosures for Open-End Management Investment Companies
See Item 7.
Item 10.
Remuneration Paid to Directors, Officers, and Others of Open-End Management Investment Companies
See Item 7.
Item 11.
Statement Regarding Basis for Approval of Investment Advisory Contract
See Item 7.
Item 12.
Disclosure of Proxy Voting Policies and Procedures for Closed-End Management Investment Companies
Not applicable.
Item 13.
Portfolio Managers of Closed-End Management Investment Companies
Not applicable.
Item 14.
Purchase of Equity Securities by Closed-End Management Investment Company and Affiliated Purchasers
Not applicable.
Item 15.
Submission of Matters to a Vote of Security Holders
There were no material changes to the procedures by which shareholders may recommend nominees to the trust’s Board of Trustees.
Item 16.
Controls and Procedures
(a)(i) The President and Treasurer and the Chief Financial Officer have concluded that the trust’s disclosure controls and procedures (as defined in Rule 30a-3(c) under the Investment Company Act) provide reasonable assurances that material information relating to the trust is made known to them by the appropriate persons, based on their evaluation of these controls and procedures as of a date within 90 days of the filing date of this report.
(a)(ii) There was no change in the trust’s internal control over financial reporting (as defined in Rule 30a-3(d) under the Investment Company Act) that occurred during the period covered by this report that has materially affected, or is reasonably likely to materially affect, the trust’s internal control over financial reporting.
Item 17.
Disclosure of Securities Lending Activities for Closed-End Management Investment Companies
Not applicable.
Item 18.
Recovery of Erroneously Awarded Compensation
(a)
Not applicable.
(b)
Not applicable.
Item 19.
Exhibits
SIGNATURES
Pursuant to the requirements of the Securities Exchange Act of 1934 and the Investment Company Act of 1940, the registrant has duly caused this report to be signed on its behalf by the undersigned, thereunto duly authorized.
Fidelity Advisor Series VII
|
By: | /s/Stacie M. Smith |
| Stacie M. Smith |
| President and Treasurer (Principal Executive Officer) |
|
|
Date: | September 20, 2024 |
Pursuant to the requirements of the Securities Exchange Act of 1934 and the Investment Company Act of 1940, this report has been signed below by the following persons on behalf of the registrant and in the capacities and on the dates indicated.
|
By: | /s/Stacie M. Smith |
| Stacie M. Smith |
| President and Treasurer (Principal Executive Officer) |
|
|
Date: | September 20, 2024 |
|
By: | /s/John J. Burke III |
| John J. Burke III |
| Chief Financial Officer (Principal Financial Officer) |
|
|
Date: | September 20, 2024 |