UNITED STATES
SECURITIES AND EXCHANGE COMMISSION
SECURITIES AND EXCHANGE COMMISSION
Washington, D.C. 20549
FORM N-CSR
CERTIFIED SHAREHOLDER REPORT OF REGISTERED
MANAGEMENT INVESTMENT COMPANIES
MANAGEMENT INVESTMENT COMPANIES
Investment Company Act file number 811-03015
Ohio National Fund, Inc.
(Exact name of registrant as specified in charter)
| One Financial Way, Cincinnati, Ohio | 45242 | |
| (Address of principal executive offices) | (Zip code) | |
CT Corporation 300 E. Lombard St. Suite 1400 Baltimore, MD 21202
(Name and address of agent for service)
Registrant’s telephone number, including area code: 513-794-6971
Date of fiscal year end: December 31
Date of reporting period: December 31, 2009
Form N-CSR is to be used by management investment companies to file reports with the Commission not later than 10 days after the transmission to stockholders of any report that is required to be transmitted to stockholders under Rule 30e-1 under the Investment Company Act of 1940 (17 CFR 270.30e-1). The Commission may use the information provided on Form N-CSR in its regulatory, disclosure review, inspection, and policymaking roles.
A registrant is required to disclose the information specified by Form N-CSR, and the Commission will make this information public. A registrant is not required to respond to the collection of information contained in Form N-CSR unless the Form displays a currently valid Office of Management and Budget (“OMB”) control number. Please direct comments concerning the accuracy of the information collection burden estimate and any suggestions for reducing the burden to Secretary, Securities and Exchange Commission, 450 Fifth Street, NW, Washington, DC 20549-0609. The OMB has reviewed this collection of information under the clearance requirements of 44 U.S.C. § 3507.
| Item 1. | Reports To Stockholders. |

| WEALTHBUILDINGOPPORTUNIT Y Ohio National Fund, Inc. Annual Report DECEMBER 31, 2009 Ohio National Fund, Inc. Ohio National Financial Services ,, Ohio National Fund, Inc. Post Office Box 371 Cincinnati, Ohio 45201 Form 1320 Rev. 2-10 |
OHIO NATIONAL FUND, INC.
TABLE OF CONTENTS
| President’s Message | 1 | |
| Directors and Officers of Ohio National Fund, Inc. | 2 | |
| The following pages contain Management’s Discussion of Fund Performance, Portfolio Composition, and Financial Statements for each of the Fund’s Portfolios: | ||
| Equity Portfolio | 3 | |
| Money Market Portfolio | 10 | |
| Bond Portfolio | 15 | |
| Omni Portfolio | 23 | |
| International Portfolio | 32 | |
| Capital Appreciation Portfolio | 41 | |
| Millennium Portfolio | 48 | |
| International Small-Mid Company Portfolio | 54 | |
| Aggressive Growth Portfolio | 61 | |
| Small Cap Growth Portfolio | 67 | |
| Mid Cap Opportunity Portfolio | 74 | |
S&P 500® Index Portfolio | 80 | |
| Strategic Value Portfolio | 91 | |
| High Income Bond Portfolio | 98 | |
| Capital Growth Portfolio | 111 | |
Nasdaq-100® Index Portfolio | 118 | |
| Bristol Portfolio | 124 | |
| Bryton Growth Portfolio | 130 | |
| U.S. Equity Portfolio | 136 | |
| Balanced Portfolio | 142 | |
| Income Opportunity Portfolio | 150 | |
| Target VIP Portfolio | 158 | |
| Target Equity/Income Portfolio | 165 | |
| Bristol Growth Portfolio | 171 | |
| Notes to Financial Statements | 177 | |
| Report of Independent Registered Public Accounting Firm | 200 | |
| Additional Information (Unaudited) | 201 | |
| Information About Directors and Officers (Unaudited) | 211 | |
[THIS PAGE INTENTIONALLY LEFT BLANK]
| President’s Message | ![[PALMER PHOTO]](https://capedge.com/proxy/N-CSR/0000950123-10-021904/l38589palmerjj.gif) |
Dear Investor:
If one were to look only at the equity market and fixed income returns for 2009, without looking at the events of the full year, one might conclude that 2009 was a very good year. After all, the Standard & Poor’s 500 Index finished the year up 26.5 percent, the best return for the index in six years and the second best return for the decade. Other markets fared even better with the Nasdaq Composite Index up 45.4 percent and the MSCI EAFE Index up 32.4 percent. Even the fixed income markets offered better-than-typical equity market returns posting 19.8 percent according to the Merrill Lynch U.S. Corporate Master Index.
However, the path to these very strong returns was anything but straight. The first quarter of 2009 started out as a continuation of 2008 with the Standard & Poor’s 500 Index down 24.6 percent through March 9, the low point for the year. From there, the market staged a tremendous recovery. Whether this was due to continued low interest rates, unprecedented government intervention, or just the belief that the market cannot go down forever, is difficult to say, but most were not asking why, but rather enjoying a long overdue market rally.
The Ohio National Fund
In general, the Portfolios in the Ohio National Fund performed well in 2009. Of course, all had positive returns, with several in excess of 40 percent and one over 50 percent. Fourteen of the twenty-one actively managed Portfolios ranked in the top half of their peer group and eight were in the top quartile. Some of the Portfolios that performed particularly well were the Equity Portfolio, sub-advised by Legg Mason Capital Management, which outperformed its benchmark by 1,265 basis points; the Small Cap Growth Portfolio sub-advised by Janus Capital Management, which outperformed its benchmark by 1,629 basis points; and the Capital Appreciation Portfolio sub-advised by Jennison Associates, which outperformed its benchmark by 1,638 basis points.
Finally, all of the Portfolios sub-advised by Suffolk Capital Management performed well, beating their respective benchmarks by 126 basis points to 937 basis points and ranking no worse than the top half of their peer group with two in the top quartile and one in the top decile.
There was one change in the Ohio National Fund’s portfolio management firms. In December, Goldman Sachs Asset Management was hired to sub-advise the Mid Cap Opportunity Portfolio. We hope that Goldman Sachs will be able to improve the performance.
Looking Ahead
From a portfolio management perspective, 2009, for all if its difficulties, was actually an easy year to manage money. The overriding question was simply, “Do you believe the economy will recover or do you believe the economy is leading towards depression?” Those who correctly answered that question positioned their portfolios for growth and were rewarded with very good returns. Those who believed the market had farther to fall positioned their portfolios defensively, and while they may still have enjoyed positive, perhaps even double digit returns, underperformed their benchmarks.
1
Fortunately, it appears that most of our managers answered the question correctly.
In 2010, neither the question nor the answer is nearly as clear. Many of the factors that have been a drag on the economy will continue to act as such, as job losses continue, unemployment remains in double digits, the housing market remains precarious and many states’ finances are fragile. Whether the market will continue its upward march in spite of these headwinds is difficult to say, but it’s the question that our portfolio managers will have to answer.
Thank you for entrusting your assets to the Ohio National Fund. We look forward to serving your investment needs.
Sincerely,

John J. Palmer, FSA
President
Directors and Officers of Ohio National Fund, Inc.
John J. Palmer, President and Director
L. Ross Love, Director
James E. Bushman, Director
George M. Vredeveld, Director
John I. Von Lehman, Director
Thomas A. Barefield, Vice President
Christopher A. Carlson, Vice President
Dennis R. Taney, Chief Compliance Officer
R. Todd Brockman, Treasurer
Catherine E. Gehr, Assistant Treasurer
Kimberly A. Plante, Secretary
Katherine L. Carter, Assistant Secretary
The Statement of Additional Information of Ohio National Fund, Inc. (the “Fund”) includes additional information about the Fund Directors and is available, without charge, upon request, by calling 877-781-6392 toll-free.
A description of the policies and procedures that the Fund uses in voting proxies relating to Fund securities, as well as information regarding how the Fund voted proxies during the most recent twelve-month period ended June 30, 2009, is available without charge, upon request, by calling 877-781-6392 toll-free and on the Securities and Exchange Commission (the “Commission”) website at http://www.sec.gov.
The Fund has filed its Schedules of Investments as of March 31 and September 30 with the Commission, as required, on Form N-Q. Form N-Q is required to be filed with the Commission for the first and third quarters of each fiscal year within sixty days after the end of each period and is available on the Commission website upon acceptance of each submission. The Fund’s Forms N-Q may be reviewed and copied at the Commission’s Public Reference Room in Washington, DC. Information about the Public Reference Room is available by calling 1-800-SEC-0330.
This report and the financial statements contained herein are submitted for the general information of the shareholders of the Fund. This report is not authorized for distribution to prospective investors in the Fund unless preceded or accompanied by an effective prospectus of Ohio National Fund, Inc. For a prospectus containing more complete information, including charges and expenses, please contact Ohio National Investments, Inc., One Financial Way, Cincinnati, OH 45242, telephone 513-794-6100.
2
Ohio National Fund, Inc.
Equity Portfolio
Equity Portfolio
Objective/Strategy
The Equity Portfolio seeks long-term growth of capital by investing primarily in common stocks or other equity securities.
Performance as of December 31, 2009
Average Annual Total Returns: | ||||
| One year | 39.11% | |||
| Five years | -7.71% | |||
| Ten years | -2.77% |
Past performance does not guarantee future results. The performance data quoted represents past performance and current returns may be lower or higher. Total return figures include change in share price and reinvestment of dividends and capital gains. The investment return and principal value will fluctuate so that an investor’s shares, when redeemed, may be worth more or less than the original cost. To obtain performance information up to the most recent month end, call toll-free 1-877-781-6392.
The Portfolio is not open to direct retail investment. Beneficial interest in shares is obtained solely by purchase of variable life insurance policies and variable annuity contracts. Actual performance results for variable annuity and variable universal life contracts will be lower due to contract charges. Consult your contract for applicable charges.
Comments
For the year ended December 31, 2009, the Equity Portfolio returned 39.11% versus 26.46% for the current benchmark, the S&P 500 Index.
Investors saw the major averages follow what seemed like a roller coaster ride during 2009, with the S&P 500 Index declining by nearly 25% between January 1 and March 9 before rising by nearly 68% between March 10 and December 31. The final tally was a 26.5% gain on the market, with the dynamics of the collapse and subsequent rally particularly pronounced for the financial stocks. The S&P Composite 1500 Financial Index fell 48.5% between the beginning of the year and the market bottom, but subsequently rallied 124.2% to end the year. Even national franchise financials posted amazing gains, with Bank of America Corp. up 300% from March through December and Wells Fargo & Co. up 172% over that time. The nature of the financial crisis was such that many investors were unloading their bank shares in a panic as the political rhetoric calling for nationalization heated up. As the crisis subsided, the risk of nationalization abated and investors could begin to discount the substantial normalized earning power of many of the financials. The equity markets over the last year were characterized by two things: the panic of the crisis and the outsized profits earned by those investors willing to take a chance on any companies that were given low probabilities of survival. Government efforts to restore liquidity and repair balance sheets, particularly through TARP (Troubled Asset Relief Program), helped restore confidence and drew capital back into the system.
The Portfolio did well during 2009, out-performing its S&P 500 Index benchmark. Information Technology stocks were among the best performers in the Portfolio, with eBay, Inc., Texas Instruments, Inc. and International Business Machines Corp. among the leading performers for the year ended December 31, 2009. Financials were also a source of out-performance during the year, with Aflac, Inc., The Goldman Sachs Group, Inc., Capital One Financial Corp., Wells Fargo & Co. and JPMorgan Chase & Co. all leading performers in the sector. Outside of these two sectors, there were leaders in the Consumer Discretionary sector, including Sears Holdings Corp. and Amazon.com, Inc., which both more than doubled during the year. Finally, the Portfolio’s large weight in power producer The AES Corp. benefited performance, with the stock’s 62.5% gain during the year helping to drive performance. Laggards emerged in the Industrials space, with General Electric Co.’s drop during the year hurting relative performance, along with the challenged performance of biotech stocks like Genzyme Corp. and Amgen, Inc. and managed-care stocks like UnitedHealth Group, Inc. and Aetna, Inc.(1)
The top five contributors were Amazon.com, Inc., Aflac, Inc., The AES Corp., Sears Holdings Corp., and eBay, Inc. The top five performers were Amazon.com, Inc., Aflac, Inc., American Express Co., MetLife Inc., and Sears Holdings Corp.(1)
Amazon.com, Inc. defied broader retail trends throughout 2009 thanks to its laser focus on pricing and its decision to emphasize low- or no-cost shipping with its Amazon SuperSaver and Prime offerings, staking a clear position as an everyday low price leader.
The company posted strong quarterly results throughout the year, punctuated by a stellar third quarter that sent shares up more than 25% in one day. Amazon.com, Inc. continues to gain share in e-commerce, which itself is gaining share from traditional retail. We believe its digital media distribution initiatives, Amazon Prime and Web Services should help to drive longer-term growth and reduce the risk that its core business is disrupted by media digitization.(1)
The AES Corp. contributed significantly to the Portfolio’s out-performance last year, thanks to this global power generator reporting better-than-expected earnings each quarter during the year. Investor fears about The AES Corp.’s leverage proved unfounded for the second crisis in a row, with both the holding company and its multitude of subsidiaries easily staying current on their debt obligations. The company’s decision late in the year to raise capital, selling equity to China Investment Corporation, put a damper on stock performance. This equity sale was dilutive to existing shareholders.(1)
Aflac, Inc. shares have more than doubled since the Portfolio initiated a position in the insurer in February 2009, thanks to better-than-expected earnings in all three subsequent quarters. Investors had overly discounted the impact of credit losses in its portfolio, particularly its hybrid securities investments. The market also underestimated the impact of a stronger yen on Aflac, Inc.’s statutory capital adequacy ratio, which remains well above levels required for its “AA” credit rating. We believe investors will continue to shift their attention to Aflac, Inc.’s earnings power and its low valuation of nine times 2010 earnings as they gain more confidence in the company’s ability to manage investment losses.(1)
Sears Holdings Corp. more than doubled in 2009, as an improving U.S. economy, better holiday sales outlook, strong cost controls
(continued)
3
Ohio National Fund, Inc.
Equity Portfolio (Continued)
Equity Portfolio (Continued)
amid a recession, and a six-fold increase in the company’s share repurchase authorization in mid-December encouraged investors to bid up the company’s shares. Despite its strong performance for the year, we remain positive on Sears Holdings Corp.’s shares and continue to believe in the ability of Chairman Eddie Lampert to realize significant value through improvements in Sears Holdings Corp.’s current operations and through intelligent allocation of the company’s cash flow.(1)
eBay, Inc. shares faced pressure early in the year due to concerns that the auction business was broken, but rallied heartily off the March bottom through the end of the year as it became clear that this business had stabilized. The company sold most of its much-maligned Skype unit in late summer, for what we viewed as a nice price, while retaining an equity stub. CEO John Donahoe continues to make rational capital allocation decisions, a departure from prior regimes. We continue to believe eBay, Inc. has strong prospects in both e-commerce and payments.(1)
Between the acquisition of Merrill Lynch and the government’s TARP investment, Bank of America Corp. was in the policy spotlight for over a year. The holding hurt performance as these regulatory challenges abounded, leading to the unexpected resignation of CEO Ken Lewis at the end of September. We continue to believe investors are underestimating the long-term earnings power of the Merrill Lynch and Countrywide Financial acquisitions, and the stock is attractively valued at just over seven times 2011 earnings estimates.(1)
Citigroup, Inc. detracted significantly from performance despite the Portfolio’s short holding period. Amid fears of bankruptcy and nationalization, Citigroup, Inc.’s shares fell by almost 75% into the March lows. The Portfolio liquidated its holdings ahead of concerns about dilution from the government’s proposed conversion of preferred shares to common shares, a move that we thought to be destructive to long-term shareholder value.(1)
Shares of Eastman Kodak Co. under-performed over the past twelve months as weak consumer spending cut into revenues and profits and as liquidity concerns continued to plague the stock. The company reported fourth-quarter results significantly below analyst estimates, and delivered a first-quarter report in April that was equally gloomy, including the suspension of its dividend. Shares bounced back somewhat after the company suggested demand and fundamentals were improving, but fell again after a highly dilutive increase in capital last month. Despite the challenges, we continue to believe Eastman Kodak Co. is an attractive turnaround story and that its shares will rebound from current levels.(1)
We have used the second half of 2009 to broaden out the Portfolio and move up the quality and market cap ladder. We think the Portfolio is positioned well to take advantage of the shift in market leadership that we and other observers have been anticipating. Moreover, we believe that signs of this shift continued throughout the fall and early winter. We are gradually trimming the top positions in the Portfolio and adding to smaller, existing positions.(1)
Many observers remain skeptical that the rally of 2009 will carry over into 2010, as the deeper structural issues facing the U.S. economy come to bear. Those issues include a shadow inventory of homes that are approaching foreclosure and may swamp the market, causing a “double dip” in the housing markets. Souring commercial real estate loans and unemployment that looks to remain elevated throughout the year and into 2011 are also touted as reasons for concern. However, we remain bullish on the outlook for U.S. equities in 2010. Some of us are more bullish than others, but it basically boils down to varying degrees of optimism. In recent commentaries, we have written that we thought the S&P 500 Index could trade in the range of 1,250 to 1,350 by the end of 2010. As we review the available evidence today, that still seems to us like a reasonable range of expectations. We believe the outlook for corporate earnings is also quite strong. First Call’s earnings revision index was a remarkably strong 74.3% in the last week of December. In fact, ISI Group calls the strength in First Call’s revision index over the last 13 weeks “unprecedented by a fairly wide margin.” The regression model ISI uses to forecast corporate earnings is projecting 35% annualized increases in the fourth quarter of 2009 and the first half of 2010. In our view, the current consensus forecast for S&P 500 earnings of $76.25 per share in 2010 has as good a chance of being low as it does of being high.
| (1) | The Portfolio’s composition is subject to change. Holdings and weightings are as of December 31, 2009. |
Change in Value of $10,000 Investment
![[PERFORMANCE GRAPH]](https://capedge.com/proxy/N-CSR/0000950123-10-021904/l38589l3858937.gif)
Hypothetical illustration based on past performance. Future performance will vary. The Portfolio’s returns reflect reinvested dividends. The Portfolio’s holdings may differ significantly from the securities in the index. The index is unmanaged and therefore does not reflect the cost of portfolio management and accounting.
The S&P 500 Index is a capitalization-weighted index designed to measure performance of the broad domestic economy through changes in the aggregate market value of 500 stocks representing all major industries. The index presented herein includes the effects of reinvested dividends.
(continued)
4
Ohio National Fund, Inc.
Equity Portfolio (Continued)
Equity Portfolio (Continued)
Portfolio Composition as of December 31, 2009 (1)
| % of Net Assets | |||
Common Stocks (3) | 96.8 | ||
Preferred Stocks (3) | 0.2 | ||
| Repurchase Agreements and Other Net Assets | 3.0 | ||
| 100.0 | |||
Top 10 Portfolio Holdings as of December 31, 2009 (1) (2)
| % of Net Assets | |||||||
| 1. | AES Corp. / The | 8.2 | |||||
| 2. | Aflac, Inc. | 3.7 | |||||
| 3. | Sears Holdings Corp. | 3.5 | |||||
| 4. | Aetna, Inc. | 3.4 | |||||
| 5. | eBay, Inc. | 3.3 | |||||
| 6. | International Business Machines Corp. | 3.2 | |||||
| 7. | Hewlett-Packard Co. | 3.1 | |||||
| 8. | CA, Inc. | 3.0 | |||||
| 9. | Cisco Systems, Inc. | 3.0 | |||||
| 10. | Capital One Financial Corp. | 2.9 |
| (1) | Composition of Portfolio subject to change. | |
| (2) | Short-term investments have been excluded from the list of Top 10 Portfolio holdings. | |
| (3) | Sectors (combined): |
| % of Net Assets | |||
| Information Technology | 27.9 | ||
| Financials | 25.8 | ||
| Consumer Discretionary | 16.0 | ||
| Health Care | 10.5 | ||
| Utilities | 8.2 | ||
| Industrials | 3.5 | ||
| Consumer Staples | 1.6 | ||
| Energy | 1.6 | ||
| Materials | 1.1 | ||
| Telecommunication Services | 0.8 | ||
| 97.0 | |||
5
Ohio National Fund, Inc.
Equity Portfolio
Equity Portfolio
| Schedule of Investments | December 31, 2009 |
| Common Stocks – 96.8% | Shares | Value | ||||||
CONSUMER DISCRETIONARY – 16.0% | ||||||||
Diversified Consumer Services – 0.8% | ||||||||
| Apollo Group, Inc. Class A (a) | 28,800 | $ | 1,744,704 | |||||
Hotels, Restaurants & Leisure – 0.9% | ||||||||
| Yum! Brands, Inc. | 61,300 | 2,143,661 | ||||||
Internet & Catalog Retail – 2.8% | ||||||||
| Amazon.com, Inc. (a) | 47,750 | 6,423,330 | ||||||
Leisure Equipment & Products – 1.7% | ||||||||
| Eastman Kodak Co. (a) | 886,090 | 3,739,300 | ||||||
Media – 4.6% | ||||||||
| DIRECTV (a) | 62,300 | 2,077,705 | ||||||
| Time Warner Cable, Inc. | 56,210 | 2,326,532 | ||||||
| Time Warner, Inc. | 209,500 | 6,104,830 | ||||||
| 10,509,067 | ||||||||
Multiline Retail – 5.2% | ||||||||
| J.C. Penney Co., Inc. | 142,900 | 3,802,569 | ||||||
| Sears Holdings Corp. (a) | 95,700 | 7,986,165 | ||||||
| 11,788,734 | ||||||||
TOTAL CONSUMER DISCRETIONARY | 36,348,796 | |||||||
CONSUMER STAPLES – 1.6% | ||||||||
Beverages – 0.5% | ||||||||
| PepsiCo, Inc. | 19,400 | 1,179,520 | ||||||
Food & Staples Retailing – 0.1% | ||||||||
| Safeway, Inc. | 12,100 | 257,609 | ||||||
Personal Products – 1.0% | ||||||||
| Avon Products, Inc. | 70,400 | 2,217,600 | ||||||
TOTAL CONSUMER STAPLES | 3,654,729 | |||||||
ENERGY – 1.6% | ||||||||
Oil, Gas & Consumable Fuels – 1.6% | ||||||||
| Chesapeake Energy Corp. | 52,300 | 1,353,524 | ||||||
| ConocoPhillips | 43,000 | 2,196,010 | ||||||
TOTAL ENERGY | 3,549,534 | |||||||
FINANCIALS – 25.6% | ||||||||
Capital Markets – 5.4% | ||||||||
| Goldman Sachs Group, Inc. / The | 34,700 | 5,858,748 | ||||||
| State Street Corp. | 145,900 | 6,352,486 | ||||||
| 12,211,234 | ||||||||
Commercial Banks – 2.2% | ||||||||
| Wells Fargo & Co. | 182,000 | 4,912,180 | ||||||
Consumer Finance – 4.3% | ||||||||
| American Express Co. | 79,100 | 3,205,132 | ||||||
| Capital One Financial Corp. | 173,300 | 6,644,322 | ||||||
| 9,849,454 | ||||||||
Diversified Financial Services – 7.3% | ||||||||
| Bank of America Corp. | 307,100 | 4,624,926 | ||||||
| CME Group, Inc. | 7,200 | 2,418,840 | ||||||
| JPMorgan Chase & Co. | 124,900 | 5,204,583 | ||||||
| NYSE Euronext | 171,100 | 4,328,830 | ||||||
| 16,577,179 | ||||||||
Insurance – 6.4% | ||||||||
| Aflac, Inc. | 178,900 | 8,274,125 | ||||||
| Allstate Corp. / The | 95,300 | 2,862,812 | ||||||
| Prudential Financial, Inc. | 67,000 | 3,333,920 | ||||||
| 14,470,857 | ||||||||
TOTAL FINANCIALS | 58,020,904 | |||||||
HEALTH CARE – 10.5% | ||||||||
Biotechnology – 2.9% | ||||||||
| Amgen, Inc. (a) | 96,100 | 5,436,377 | ||||||
| Genzyme Corp. (a) | 24,000 | 1,176,240 | ||||||
| 6,612,617 | ||||||||
Health Care Equipment & Supplies – 0.9% | ||||||||
| Medtronic, Inc. | 47,400 | 2,084,652 | ||||||
Health Care Providers & Services – 5.7% | ||||||||
| Aetna, Inc. | 241,000 | 7,639,700 | ||||||
| UnitedHealth Group, Inc. | 170,200 | 5,187,696 | ||||||
| 12,827,396 | ||||||||
Pharmaceuticals – 1.0% | ||||||||
| Merck & Co., Inc. | 60,100 | 2,196,054 | ||||||
TOTAL HEALTH CARE | 23,720,719 | |||||||
INDUSTRIALS – 3.5% | ||||||||
Aerospace & Defense – 0.6% | ||||||||
| Boeing Co. / The | 26,100 | 1,412,793 | ||||||
Industrial Conglomerates – 2.2% | ||||||||
| 3M Co. | 23,000 | 1,901,410 | ||||||
| General Electric Co. | 196,800 | 2,977,584 | ||||||
| 4,878,994 | ||||||||
Machinery – 0.7% | ||||||||
| Deere & Co. | 28,600 | 1,546,974 | ||||||
TOTAL INDUSTRIALS | 7,838,761 | |||||||
INFORMATION TECHNOLOGY – 27.9% | ||||||||
Communications Equipment – 3.3% | ||||||||
| Cisco Systems, Inc. (a) | 279,500 | 6,691,230 | ||||||
| QUALCOMM, Inc. | 15,600 | 721,656 | ||||||
| 7,412,886 | ||||||||
Computers & Peripherals – 7.4% | ||||||||
| EMC Corp. (a) | 146,900 | 2,566,343 | ||||||
| Hewlett-Packard Co. | 135,800 | 6,995,058 | ||||||
| International Business Machines Corp. | 54,900 | 7,186,410 | ||||||
| 16,747,811 | ||||||||
Internet Software & Services – 8.4% | ||||||||
| AOL Inc. (a) | 19,045 | 443,367 | ||||||
| eBay, Inc. (a) | 320,500 | 7,544,570 | ||||||
| Google, Inc. Class A (a) | 8,950 | 5,548,821 | ||||||
| Yahoo, Inc. (a) | 326,900 | 5,485,382 | ||||||
| 19,022,140 | ||||||||
(continued)
6
Ohio National Fund, Inc.
Equity Portfolio (Continued)
Equity Portfolio (Continued)
| Schedule of Investments | December 31, 2009 |
| Common Stocks – 96.8% | Shares | Value | ||||||
Semiconductors & Semiconductor Equipment – 2.9% | ||||||||
| Texas Instruments, Inc. | 254,800 | $ | 6,640,088 | |||||
Software – 5.9% | ||||||||
| CA, Inc. | 303,400 | 6,814,364 | ||||||
| Electronic Arts, Inc. (a) | 163,300 | 2,898,575 | ||||||
| Microsoft Corp. | 123,500 | 3,765,515 | ||||||
| 13,478,454 | ||||||||
TOTAL INFORMATION TECHNOLOGY | 63,301,379 | |||||||
MATERIALS – 1.1% | ||||||||
Metals & Mining – 1.1% | ||||||||
| Nucor Corp. | 52,600 | 2,453,790 | ||||||
TOTAL MATERIALS | 2,453,790 | |||||||
TELECOMMUNICATION SERVICES – 0.8% | ||||||||
Diversified Telecommunication Services – 0.8% | ||||||||
| AT&T, Inc. | 63,000 | 1,765,890 | ||||||
TOTAL TELECOMMUNICATION SERVICES | 1,765,890 | |||||||
UTILITIES – 8.2% | ||||||||
Independent Power Producers & Energy Traders – 8.2% | ||||||||
| AES Corp. / The (a) | 1,397,100 | 18,595,401 | ||||||
TOTAL UTILITIES | 18,595,401 | |||||||
Total Common Stocks (Cost $214,792,269) | $ | 219,249,903 | ||||||
| Preferred Stocks – 0.2% | Shares | Value | ||||||
FINANCIALS – 0.2% | ||||||||
Diversified Financial Services – 0.2% | ||||||||
| Bank of America Corp. 10.000%, convertible until 12/31/2049 | 31,200 | $ | 465,504 | |||||
Total Preferred Stocks (Cost $468,000) | $ | 465,504 | ||||||
| Face | Amortized | |||||||
| Repurchase Agreements – 2.1% | Amount | Cost | ||||||
| U.S. Bank 0.010% 01/04/2010 | $ | 4,868,220 | $ | 4,868,220 | ||||
| Agreement date: 12/31/2009 | ||||||||
| Repurchase price $4,868,225 | ||||||||
| Collateralized by: | ||||||||
| Various Agency Mortgage-Backed Securities 3.218% to 5.000%, Due 07/01/2018 through 10/01/2034 Fair Value: $4,965,474 | ||||||||
Total Repurchase Agreements (Cost $4,868,220) | $ | 4,868,220 | ||||||
Total Investments – 99.1% (Cost $220,128,489) (b) | $ | 224,583,627 | ||||||
Other Assets in Excess of Liabilities – 0.9% | 1,927,063 | |||||||
Net Assets – 100.0% | $ | 226,510,690 | ||||||
Percentages are stated as a percent of net assets.
Footnotes:
| (a) | Non-income producing security. | |
| (b) | Represents cost for financial reporting purposes, which may differ from cost basis for Federal income tax purposes. See also Note 8 of the Notes to Financial Statements. |
The accompanying notes are an integral part of these financial statements.
7
Ohio National Fund, Inc.
Equity Portfolio
Equity Portfolio
Statement of Assets and Liabilities
December 31, 2009
| Assets: | ||||
| Investments in securities, at value (Cost $215,260,269) | $ | 219,715,407 | ||
| Repurchase agreements | 4,868,220 | |||
| Cash | 1 | |||
| Receivable for securities sold | 1,528,084 | |||
| Receivable for fund shares sold | 599,315 | |||
| Dividends and accrued interest receivable | 114,479 | |||
| Prepaid expenses and other assets | 3,724 | |||
| Total assets | 226,829,230 | |||
| Liabilities: | ||||
| Payable for fund shares redeemed | 125,430 | |||
| Payable for investment management services | 150,358 | |||
| Payable for compliance services | 1,677 | |||
| Accrued custody expense | 1,307 | |||
| Accrued professional fees | 11,390 | |||
| Accrued accounting fees | 13,271 | |||
| Accrued printing and filing fees | 15,107 | |||
| Total liabilities | 318,540 | |||
| Net assets | $ | 226,510,690 | ||
| Net assets consist of: | ||||
| Par value, $1 per share | $ | 12,372,169 | ||
| Paid-in capital in excess of par value | 331,985,603 | |||
| Accumulated net realized loss on investments | (122,354,230 | ) | ||
| Net unrealized appreciation on investments | 4,455,138 | |||
| Undistributed net investment income | 52,010 | |||
| Net assets | $ | 226,510,690 | ||
| Shares outstanding | 12,372,169 | |||
| Authorized Fund shares allocated to Portfolio | 25,000,000 | |||
| Net asset value per share | $ | 18.31 | ||
Statement of Operations
For the Year Ended December 31, 2009
| Investment income: | ||||
| Interest | $ | 5,914 | ||
| Dividends | 2,262,510 | |||
| Total investment income | 2,268,424 | |||
| Expenses: | ||||
| Management fees | 1,561,918 | |||
| Custodian fees | 15,896 | |||
| Directors’ fees | 21,024 | |||
| Professional fees | 23,364 | |||
| Accounting fees | 75,622 | |||
| Printing and filing fees | 30,835 | |||
| Compliance expense | 6,376 | |||
| Other | 6,413 | |||
| Total expenses | 1,741,448 | |||
| Net investment income | 526,976 | |||
| Realized/unrealized gain (loss) on investments: | ||||
| Net realized gain (loss) on investments | (37,830,132 | ) | ||
| Change in unrealized appreciation/depreciation on investments | 103,793,956 | |||
| Net realized/unrealized gain (loss) on investments | 65,963,824 | |||
| Change in net assets from operations | $ | 66,490,800 | ||
The accompanying notes are an integral part of these financial statements.
8
Ohio National Fund, Inc.
Equity Portfolio
Equity Portfolio
Statements of Changes in Net Assets
| Years Ended December 31, | ||||||||
| 2009 | 2008 | |||||||
Increase (Decrease) in Net Assets: | ||||||||
| Operations: | ||||||||
| Net investment income | $ | 526,976 | $ | 2,971,115 | ||||
| Net realized gain (loss) on investments | (37,830,132 | ) | (77,156,737 | ) | ||||
| Change in unrealized appreciation/depreciation on investments | 103,793,956 | (176,365,358 | ) | |||||
| Change in net assets from operations | 66,490,800 | (250,550,980 | ) | |||||
| Distributions to shareholders: | ||||||||
| Distributions from net investment income | (474,966 | ) | (2,642,397 | ) | ||||
| Capital transactions: | ||||||||
| Received from shares sold | 24,521,613 | 87,902,505 | ||||||
| Received from dividends reinvested | 474,966 | 2,642,397 | ||||||
| Paid for shares redeemed | (52,012,006 | ) | (154,908,853 | ) | ||||
| Change in net assets from capital transactions | (27,015,427 | ) | (64,363,951 | ) | ||||
| Change in net assets | 39,000,407 | (317,557,328 | ) | |||||
Net Assets: | ||||||||
| Beginning of year | 187,510,283 | 505,067,611 | ||||||
| End of year | $ | 226,510,690 | $ | 187,510,283 | ||||
| Undistributed net investment income | $ | 52,010 | $ | 328,718 | ||||
Financial Highlights
| Years Ended December 31, | ||||||||||||||||||||
| 2009 | 2008 | 2007 | 2006 | 2005 | ||||||||||||||||
Selected Per-Share Data: | ||||||||||||||||||||
| Net asset value, beginning of year | $ | 13.19 | $ | 29.65 | $ | 31.52 | $ | 29.55 | $ | 27.85 | ||||||||||
| Operations: | ||||||||||||||||||||
| Net investment income (loss) | 0.05 | 0.22 | 0.02 | (0.01 | ) | (0.01 | ) | |||||||||||||
| Net realized and unrealized gain (loss) on investments | ||||||||||||||||||||
| and foreign currency related transactions | 5.11 | (16.48 | ) | (1.88 | ) | 1.98 | 1.71 | |||||||||||||
| Total from operations | 5.16 | (16.26 | ) | (1.86 | ) | 1.97 | 1.70 | |||||||||||||
| Distributions: | ||||||||||||||||||||
| Distributions from net investment income | (0.04 | ) | (0.20 | ) | (0.01 | ) | — | — | ||||||||||||
| Net asset value, end of year | $ | 18.31 | $ | 13.19 | $ | 29.65 | $ | 31.52 | $ | 29.55 | ||||||||||
Total return | 39.11 | % | –54.81 | % | –5.89 | % | 6.67 | % | 6.10 | % | ||||||||||
Ratios and supplemental data: | ||||||||||||||||||||
| Net assets at end of year (millions) | $ | 226.5 | $ | 187.5 | $ | 505.1 | $ | 550.1 | $ | 540.7 | ||||||||||
| Ratios to average net assets: | ||||||||||||||||||||
| Expenses | 0.88 | % | 0.84 | % | 0.84 | % | 0.86 | % | 0.88 | % | ||||||||||
| Net investment income (loss) | 0.27 | % | 0.89 | % | 0.05 | % | –0.04 | % | –0.03 | % | ||||||||||
| Portfolio turnover rate | 24 | % | 39 | % | 23 | % | 13 | % | 20 | % | ||||||||||
The accompanying notes are an integral part of these financial statements.
9
Ohio National Fund, Inc.
Money Market Portfolio
Money Market Portfolio
Portfolio Composition as of December 31, 2009 (1)
| % of Net Assets | |||
Commercial Paper (2) | 60.1 | ||
| Money Market Funds | 13.2 | ||
| U.S. Treasury Obligations | 4.4 | ||
| U.S. Government Agency Issues | 4.4 | ||
| Repurchase Agreements and Other Net Assets | 17.9 | ||
| 100.0 | |||
Top 10 Portfolio Holdings as of December 31, 2009 (1) (2)
| % of Net Assets | |||||||
| 1. | Federated Prime Cash Obligations Fund – Institutional Class | 4.4 | |||||
| 2. | Fidelity Institutional Money Market Funds – Money Market Portfolio – Class I | 4.4 | |||||
| 3. | Fidelity Institutional Money Market Funds – Prime Money Market Portfolio – Class I | 4.4 | |||||
| 4. | Prudential Funding LLC 0.070%, 01/04/2010 | 4.4 | |||||
| 5. | Nestle Capital Corp. 0.080%, 01/04/2010 | 4.4 | |||||
| 6. | Chevron Funding Corp. 0.070%, 01/07/2010 | 4.4 | |||||
| 7. | Federal Home Loan Bank 0.030%, 01/15/2010 | 4.4 | |||||
| 8. | American Express Credit Corp. 0.170%, 01/04/2010 | 4.4 | |||||
| 9. | General Electric Capital Corp. 0.050%, 01/13/2010 | 4.4 | |||||
| 10. | HSBC Finance Corp. 0.070%, 01/12/2010 | 4.4 | |||||
| (1) | Composition of Portfolio subject to change. | |
| (2) | Sectors: |
| % of Net Assets | |||
| Financials | 32.2 | ||
| Consumer Staples | 12.9 | ||
| Health Care | 5.9 | ||
| Energy | 4.4 | ||
| Information Technology | 3.8 | ||
| Consumer Discretionary | 0.9 | ||
| 60.1 | |||
10
Ohio National Fund, Inc.
Money Market Portfolio
Money Market Portfolio
| Schedule of Investments | December 31, 2009 |
| Face | Amortized | |||||||
| Commercial Paper – 60.1% | Amount | Cost | ||||||
CONSUMER DISCRETIONARY – 0.9% | ||||||||
Media – 0.9% | ||||||||
| Walt Disney Co. / The 0.110%, 01/21/2010 (a) | $ | 3,000,000 | $ | 2,999,817 | ||||
TOTAL CONSUMER DISCRETIONARY | 2,999,817 | |||||||
CONSUMER STAPLES – 12.9% | ||||||||
Beverages – 4.4% | ||||||||
Coca-Cola Co. / The 0.100%, 01/07/2010 (a) | 3,000,000 | 2,999,950 | ||||||
| 0.100%, 01/20/2010 (a) | 2,000,000 | 1,999,894 | ||||||
| 0.150%, 02/03/2010 (a) | 10,000,000 | 9,998,625 | ||||||
| 14,998,469 | ||||||||
Food Products – 4.4% | ||||||||
| Nestle Capital Corp. 0.080%, 01/04/2010 (a) | 15,000,000 | 14,999,900 | ||||||
| 14,999,900 | ||||||||
Household Products – 4.1% | ||||||||
| Procter & Gamble International Funding SCA 0.110%, 01/22/2010 (a) | 10,000,000 | 9,999,358 | ||||||
| 0.100%, 02/02/2010 (a) | 4,000,000 | 3,999,644 | ||||||
| 13,999,002 | ||||||||
TOTAL CONSUMER STAPLES | 43,997,371 | |||||||
ENERGY – 4.4% | ||||||||
Oil, Gas & Consumable Fuels – 4.4% | ||||||||
| Chevron Funding Corp. 0.070%, 01/07/2010 | 15,000,000 | 14,999,825 | ||||||
TOTAL ENERGY | 14,999,825 | |||||||
FINANCIALS – 32.2% | ||||||||
Consumer Finance – 13.2% | ||||||||
| American Express Credit Corp. 0.170%, 01/04/2010 | 15,000,000 | 14,999,787 | ||||||
| American Honda Finance Corp. 0.200%, 01/05/2010 | 4,000,000 | 3,999,911 | ||||||
| 0.160%, 01/06/2010 (a) | 6,000,000 | 5,999,867 | ||||||
| 0.150%, 01/06/2010 (a) | 5,000,000 | 4,999,896 | ||||||
| Toyota Motor Credit Corp. 0.130%, 01/08/2010 | 15,000,000 | 14,999,621 | ||||||
| 44,999,082 | ||||||||
Diversified Financial Services – 11.7% | ||||||||
| Citigroup Funding Inc. 0.300%, 01/05/2010 | 10,000,000 | 9,999,667 | ||||||
| General Electric Capital Corp. 0.050%, 01/13/2010 | 15,000,000 | 14,999,750 | ||||||
| HSBC Finance Corp. 0.070%, 01/12/2010 | 15,000,000 | 14,999,679 | ||||||
| 39,999,096 | ||||||||
Insurance – 7.3% | ||||||||
| MetLife Funding 0.120%, 01/19/2010 | 10,000,000 | 9,999,400 | ||||||
| Prudential Funding LLC 0.070%, 01/04/2010 | $ | 15,000,000 | 14,999,913 | |||||
| 24,999,313 | ||||||||
TOTAL FINANCIALS | 109,997,491 | |||||||
HEALTH CARE – 5.9% | ||||||||
Pharmaceuticals – 5.9% | ||||||||
| Abbott Laboratories 0.090%, 01/06/2010 (a) | 5,000,000 | 4,999,937 | ||||||
| Johnson & Johnson 0.080%, 01/04/2010 (a) | 5,000,000 | 4,999,967 | ||||||
| 0.100%, 01/11/2010 (a) | 10,000,000 | 9,999,722 | ||||||
TOTAL HEALTH CARE | 19,999,626 | |||||||
INFORMATION TECHNOLOGY – 3.8% | ||||||||
Software – 3.8% | ||||||||
| Microsoft Corp. 0.080%, 01/12/2010 (a) | 3,000,000 | 2,999,927 | ||||||
| 0.060%, 01/19/2010 (a) | 10,000,000 | 9,999,700 | ||||||
TOTAL INFORMATION TECHNOLOGY | 12,999,627 | |||||||
Total Commercial Paper (Cost $204,993,757) | $ | 204,993,757 | ||||||
| Money Market Funds – 13.2% | Shares | Value | ||||||
| Federated Prime Cash Obligations Fund Institutional Class | 15,000,000 | $ | 15,000,000 | |||||
| Fidelity Institutional Money Market Funds Money Market Portfolio – Class I | 15,000,000 | 15,000,000 | ||||||
| Fidelity Institutional Money Market Funds Prime Money Market Portfolio – Class I | 15,000,000 | 15,000,000 | ||||||
Total Money Market Funds (Cost $45,000,000) | $ | 45,000,000 | ||||||
| Face | Amortized | |||||||
| U.S. Treasury Obligations – 4.4% | Amount | Cost | ||||||
| U.S. Treasury Bill 0.035%, 03/18/2010 | $ | 15,000,000 | $ | 14,998,892 | ||||
Total U.S. Treasury Obligations (Cost $14,998,892) | $ | 14,998,892 | ||||||
| Face | Amortized | |||||||
| U.S. Government Agency Issues – 4.4% | Amount | Cost | ||||||
| Federal Home Loan Bank 0.030%, 01/15/2010 | $ | 15,000,000 | $ | 14,999,825 | ||||
Total U.S. Government Agency Issues (Cost $14,999,825) | $ | 14,999,825 | ||||||
(continued)
11
Ohio National Fund, Inc.
Money Market Portfolio (Continued)
Money Market Portfolio (Continued)
| Schedule of Investments | December 31, 2009 |
| Face | Amortized | |||||||
| Repurchase Agreements – 4.9% | Amount | Cost | ||||||
| U.S. Bank 0.010% 01/04/2010 | $ | 16,750,000 | $ | 16,750,000 | ||||
| Agreement date: 12/31/2009 | ||||||||
| Repurchase price $16,750,019 | ||||||||
| Collateralized by: | ||||||||
| Various Agency Mortgage-Backed Securities 3.218% to 5.000%, Due 07/01/2018 through 10/01/2034 Fair Value: $17,084,620 | ||||||||
Total Repurchase Agreements (Cost $16,750,000) | $ | 16,750,000 | ||||||
Total Investments – 87.0% (Cost $296,742,474) (b) | $ | 296,742,474 | ||||||
Other Assets in Excess of Liabilities – 13.0% | 44,500,726 | |||||||
Net Assets – 100.0% | $ | 341,243,200 | ||||||
Percentages are stated as a percent of net assets.
Footnotes:
| (a) | Security exempt from registration under Section 4 (2) of the Securities Act of 1933. These securities may be resold in transactions exempt from registration, normally to qualified buyers under Rule 144A. At December 31, 2009, the value of these securities totaled $90,996,204 or 26.7% of the Portfolio’s net assets. These securities were deemed liquid pursuant to procedures approved by the Board of Directors. | |
| (b) | Represents cost for Federal income tax and financial reporting purposes. See also Note 2 regarding the use of amortized cost for valuation of instruments in this Portfolio. |
The accompanying notes are an integral part of these financial statements.
12
Ohio National Fund, Inc.
Money Market Portfolio
Money Market Portfolio
Statement of Assets and Liabilities
December 31, 2009
| Assets: | ||||
| Investments in securities, at amortized cost | $ | 279,992,474 | ||
| Repurchase agreements | 16,750,000 | |||
| Cash | 43,795,709 | |||
| Due from adviser | 53,050 | |||
| Receivable for fund shares sold | 2,809,875 | |||
| Accrued interest receivable | 7,620 | |||
| Prepaid expenses and other assets | 674 | |||
| Total assets | 343,409,402 | |||
| Liabilities: | ||||
| Payable for fund shares redeemed | 2,032,859 | |||
| Payable for investment management services | 71,835 | |||
| Payable for compliance services | 1,677 | |||
| Accrued custody expense | 2,012 | |||
| Accrued professional fees | 11,557 | |||
| Accrued accounting fees | 22,790 | |||
| Accrued printing and filing fees | 23,472 | |||
| Total liabilities | 2,166,202 | |||
| Net assets | $ | 341,243,200 | ||
| Net assets consist of: | ||||
| Par value, $1 per share | $ | 34,124,333 | ||
| Paid-in capital in excess of par value | 307,118,867 | |||
| Net assets | $ | 341,243,200 | ||
| Shares outstanding | 34,124,333 | |||
| Authorized Fund shares allocated to Portfolio | 55,000,000 | |||
| Net asset value per share | $ | 10.00 | ||
Statement of Operations
For the Year Ended December 31, 2009
| Investment income: | ||||
| Interest | $ | 680,814 | ||
| Other income | 17,034 | |||
| Total investment income | 697,848 | |||
| Expenses: | ||||
| Management fees | 951,105 | |||
| Custodian fees | 31,677 | |||
| Directors’ fees | 41,193 | |||
| Professional fees | 33,136 | |||
| Accounting fees | 143,825 | |||
| Printing and filing fees | 61,496 | |||
| Compliance expense | 6,376 | |||
| Temporary guarantee program expense | 52,099 | |||
| Other | 1,378 | |||
| Total expenses | 1,322,285 | |||
| Less expenses reduced or reimbursed by adviser | (624,437 | ) | ||
| Net expenses | 697,848 | |||
| Net investment income | — | |||
| Change in net assets from operations | $ | — | ||
The accompanying notes are an integral part of these financial statements.
13
Ohio National Fund, Inc.
Money Market Portfolio
Money Market Portfolio
Statements of Changes in Net Assets
| Years Ended December 31, | ||||||||
| 2009 | 2008 | |||||||
Increase (Decrease) in Net Assets: | ||||||||
| Operations: | ||||||||
| Net investment income | $ | — | $ | 6,638,684 | ||||
| Distributions to shareholders: | ||||||||
| Distributions from net investment income | — | (6,638,684 | ) | |||||
| Capital transactions: | ||||||||
| Received from shares sold | 417,820,442 | 877,274,014 | ||||||
| Received from dividends reinvested | — | 6,638,684 | ||||||
| Paid for shares redeemed | (479,126,912 | ) | (817,575,412 | ) | ||||
| Change in net assets from capital transactions | (61,306,470 | ) | 66,337,286 | |||||
| Change in net assets | (61,306,470 | ) | 66,337,286 | |||||
Net Assets: | ||||||||
| Beginning of year | 402,549,670 | 336,212,384 | ||||||
| End of year | $ | 341,243,200 | $ | 402,549,670 | ||||
Financial Highlights
| Years Ended December 31, | ||||||||||||||||||||
| 2009 | 2008 | 2007 | 2006 | 2005 | ||||||||||||||||
Selected Per-Share Data: | ||||||||||||||||||||
| Net asset value, beginning of year | $ | 10.00 | $ | 10.00 | $ | 10.00 | $ | 10.00 | $ | 10.00 | ||||||||||
| Operations: | ||||||||||||||||||||
| Net investment income | — | 0.17 | 0.48 | 0.47 | 0.27 | |||||||||||||||
| Distributions: | ||||||||||||||||||||
| Distributions from net investment income | — | (0.17 | ) | (0.48 | ) | (0.47 | ) | (0.27 | ) | |||||||||||
| Net asset value, end of year | $ | 10.00 | $ | 10.00 | $ | 10.00 | $ | 10.00 | $ | 10.00 | ||||||||||
Total return | 0.00 | % | 1.77 | % | 4.92 | % | 4.79 | % | 2.92 | % | ||||||||||
Ratios and supplemental data: | ||||||||||||||||||||
| Net assets at end of year (millions) | $ | 341.2 | $ | 402.5 | $ | 336.2 | $ | 254.4 | $ | 169.6 | ||||||||||
| Ratios to average net assets: | ||||||||||||||||||||
| Ratios net of expenses reduced or reimbursed by adviser: | ||||||||||||||||||||
| Expenses | 0.19 | % | 0.32 | % | 0.31 | % | 0.32 | % | 0.33 | % | ||||||||||
| Net investment income | 0.00 | % | 1.72 | % | 4.79 | % | 4.72 | % | 2.92 | % | ||||||||||
| Ratios assuming no expenses reduced or reimbursed by adviser: | ||||||||||||||||||||
| Expenses | 0.36 | % | 0.35 | % | 0.32 | % | 0.35 | % | 0.37 | % | ||||||||||
| Net investment income | –0.17 | % | 1.68 | % | 4.77 | % | 4.70 | % | 2.89 | % | ||||||||||
The accompanying notes are an integral part of these financial statements.
14
Ohio National Fund, Inc.
Bond Portfolio
Bond Portfolio
Objective/Strategy
The Bond Portfolio seeks to obtain a high level of income and opportunity for capital appreciation consistent with the preservation of capital by investing primarily in intermediate-term and long-term fixed income securities.
Performance as of December 31, 2009
Average Annual Total Returns: | ||||
| One year | 20.93% | |||
| Five years | 3.10% | |||
| Ten years | 5.44% |
Past performance does not guarantee future results. The performance data quoted represents past performance and current returns may be lower or higher. Total return figures include change in share price and reinvestment of dividends and capital gains. The investment return and principal value will fluctuate so that an investor’s shares, when redeemed may be worth more or less than the original cost. To obtain performance information up to the most recent month end, call toll-free 1-877-781-6392.
The Portfolio is not open to direct retail investment. Beneficial interest in shares is obtained solely by purchase of variable life insurance policies and variable annuity contracts. Actual performance results for variable annuity and variable universal life contracts will be lower due to contract charges. Consult your contract for applicable charges.
Comments
For the year ended December 31, 2009, the Bond Portfolio returned 20.93% versus 19.76% for the current benchmark, the BofA Merrill Lynch U.S. Corporate Master Index (the “Merrill Lynch Index”).
Performance was excellent on an absolute basis and very good in comparison to the Merrill Lynch Index. The high total return in 2009 reflects the strong recovery in the capital markets during the year, and a recovery in bond values, which had declined dramatically during the credit crisis of 2008. In many respects, the performance of the Portfolio and the capital markets in 2009 were a reversal of what occurred during 2008.
During 2008, the credit crisis, which manifested itself through the collapse of several large, well-known financial institutions, resulted in corporate credit spreads widening during the year to an unprecedented level. At the end of 2008, the credit spread of the Merrill Lynch Index was 604 basis points. The widening of credit spreads depressed bond prices, resulting in a total return for the Merrill Lynch Index of -6.82% in 2008.
As the unprecedented global fiscal and monetary stimulus programs took effect, the panic that gripped the capital markets in late 2008 and early 2009 began to abate in March. Between March and the end of 2009, the equity and corporate bond markets made remarkable recoveries. The credit spread for the Merrill Lynch Index tightened to 190 basis points by the end of 2009. This tightening in credit spreads explains the high total returns for both the Merrill Lynch Index and the Portfolio. These positive returns were achieved despite a modest increase in U.S. Treasury yields.
The return of the Portfolio exceeded the return of the Merrill Lynch Index in 2009 primarily because the Portfolio had a lower average credit quality and a shorter duration than the Merrill Lynch Index. During 2009, lower quality bonds performed better than higher quality bonds. Also, because U.S. Treasury yields increased during the year, shorter duration bonds performed better than longer duration bonds.
Several industry weightings impacted performance in 2009. The Portfolio benefited from its over-weighting in Insurance and Real Estate Investment Trusts (REITs) because these industries outperformed. The Portfolio also benefited by its under-weighting in Telecommunication Services and the Pharmaceuticals industry, as these areas underperformed. The Portfolio’s over-weighting in the Utilities sector hurt performance, because this sector underperformed.(1)
Because the corporate bond market recovered so well in 2009 from the negative return of 2008, many bonds in the Portfolio had large, positive returns in 2009. The five bonds held by the Portfolio for the entire year that had the highest total returns were Teck Resources Ltd., Deutsche Bank Capital Funding Trust VII, Macy’s Retail Holdings, Inc., Axis Capital Holdings Ltd. and Liberty Mutual Group, Inc. Each of these securities had total returns exceeding 50%. The four poorest performing bonds were Allied Capital Corp., Capmark Financial Group, Inc., Wachovia Capital Trust III and Merrill Lynch & Co., Inc. Allied Capital Corp. and Capmark Financial Group, Inc. were troubled companies that were sold, and had negative returns of 73% and 26%, respectively. Wachovia Capital Trust III and Merrill Lynch & Co., Inc. were similarly troubled, but were acquired by stronger companies.(1)
The U.S. economy appears to be emerging from the worst recession since the Great Depression. Economic growth was positive in the third quarter of 2009 and is expected to be positive for the fourth quarter. Because of massive federal budget deficits and expectations that the Federal Reserve will begin to tighten monetary conditions in the latter half of 2010, Treasury yields will likely rise this year. For this reason, the duration of the Portfolio will be maintained short of the duration of the Merrill Lynch Index. Because credit spreads tightened so dramatically during 2009, it is unlikely that credit spreads will tighten much more in 2010. Because of the outlook for credit spreads, purchases for the Portfolio will be skewed toward higher quality credits.
| (1) | The Portfolio’s composition is subject to change. Holdings and weightings are as of December 31, 2009. |
(continued)
15
Ohio National Fund, Inc.
Bond Portfolio (Continued)
Bond Portfolio (Continued)
Change in Value of $10,000 Investment
![[PERFORMANCE GRAPH]](https://capedge.com/proxy/N-CSR/0000950123-10-021904/l38589l3858938.gif)
Hypothetical illustration based on past performance. Future performance will vary. The Portfolio’s returns reflect reinvested dividends. The Portfolio’s holdings may differ significantly from the securities in the index. The index is unmanaged and therefore does not reflect the cost of portfolio management and accounting.
The BofA Merrill Lynch U.S. Corporate Master Index tracks the performance of all U.S. dollar-denominated, investment grade corporate public debt issued in the U.S. domestic bond market. Qualifying bonds must have at least one year remaining term to maturity, a fixed coupon schedule, and a minimum amount outstanding of $250 million.
Top 10 Portfolio Holdings as of December 31, 2009 (1) (2)
| % of Net Assets | |||||||
| 1. | U.S. Treasury Note 2.375%, 09/30/2014 | 1.4 | |||||
| 2. | Morgan Stanley 4.750%, 04/01/2014 | 1.3 | |||||
| 3. | Safeway, Inc. 6.350%, 08/15/2017 | 1.2 | |||||
| 4. | Kroger Co. / The 6.400%, 08/15/2017 | 1.2 | |||||
| 5. | Computer Sciences Corp. 6.500%, 03/15/2018 | 1.2 | |||||
| 6. | Anadarko Petroleum Corp. 5.950%, 09/15/2016 | 1.2 | |||||
| 7. | Union Electric Co. 6.400%, 06/15/2017 | 1.2 | |||||
| 8. | Commonwealth Edison Co. 5.950%, 08/15/2016 | 1.2 | |||||
| 9. | Waste Management, Inc. 6.100%, 03/15/2018 | 1.2 | |||||
| 10. | Virginia Electric & Power Co. 5.400%, 01/15/2016 | 1.1 | |||||
Portfolio Composition as of December 31, 2009 (1)
| % of Net Assets | |||
Corporate Bonds (3) (4) | 87.1 | ||
U.S. Treasury Obligations (4) | 1.4 | ||
| Commercial Paper | 2.9 | ||
| Money Market Funds | 2.3 | ||
| Repurchase Agreements and | |||
| Other Net Assets | 6.3 | ||
| 100.0 | |||
| (1) | Composition of Portfolio subject to change. | |
| (2) | Short-term investments have been excluded from the list of Top 10 Portfolio holdings. | |
| (3) | Sectors: |
| % of Net Assets | |||
| Financials | 27.7 | ||
| Utilities | 16.1 | ||
| Consumer Staples | 8.7 | ||
| Industrials | 8.2 | ||
| Energy | 7.9 | ||
| Consumer Discretionary | 7.2 | ||
| Telecommunication Services | 4.6 | ||
| Health Care | 2.8 | ||
| Information Technology | 2.3 | ||
| Materials | 1.6 | ||
| 87.1 | |||
| (4) | Bond credit quality (Standard & Poor’s Ratings) (combined): |
| % of Total Bonds | |||
| Government (U.S. Treasury and Agency bonds) | 1.4 | ||
| AA | 12.7 | ||
| A | 27.0 | ||
| BBB | 53.7 | ||
| BB | 4.9 | ||
| CCC | 0.3 | ||
| 100.0 | |||
16
Ohio National Fund, Inc.
Bond Portfolio
Bond Portfolio
| Schedule of Investments | December 31, 2009 |
| Face | ||||||||
| Corporate Bonds – 87.1% | Amount | Value | ||||||
CONSUMER DISCRETIONARY – 7.2% | ||||||||
Auto Components – 1.0% | ||||||||
| Johnson Controls, Inc. 5.250%, 01/15/2011 | $ | 1,250,000 | $ | 1,312,087 | ||||
Household Durables – 1.1% | ||||||||
| Mohawk Industries, Inc. (b) 6.500%, 01/15/2011 | 1,000,000 | 1,030,000 | ||||||
| Newell Rubbermaid, Inc. 6.250%, 04/15/2018 | 500,000 | 494,839 | ||||||
| 1,524,839 | ||||||||
Media – 3.7% | ||||||||
| Comcast Corp. 5.875%, 02/15/2018 | 750,000 | 797,475 | ||||||
| Cox Communications, Inc. 6.750%, 03/15/2011 | 1,000,000 | 1,051,747 | ||||||
| Time Warner Cable, Inc. 5.850%, 05/01/2017 | 1,000,000 | 1,052,237 | ||||||
| Time Warner, Inc. 6.875%, 05/01/2012 | 1,000,000 | 1,095,336 | ||||||
| Viacom, Inc. 4.375%, 09/15/2014 | 1,000,000 | 1,032,351 | ||||||
| 5,029,146 | ||||||||
Multiline Retail – 0.7% | ||||||||
| Macy’s Retail Holdings, Inc. 5.900%, 12/01/2016 | 1,000,000 | 980,000 | ||||||
Specialty Retail – 0.8% | ||||||||
| Home Depot, Inc. / The 5.250%, 12/16/2013 | 1,000,000 | 1,071,513 | ||||||
TOTAL CONSUMER DISCRETIONARY | 9,917,585 | |||||||
CONSUMER STAPLES – 8.7% | ||||||||
Beverages – 0.7% | ||||||||
| Anheuser-Busch Cos., Inc. 5.500%, 01/15/2018 | 750,000 | 761,403 | ||||||
| Coca Cola Co. / The 4.875%, 03/15/2019 | 250,000 | 260,901 | ||||||
| 1,022,304 | ||||||||
Food & Staples Retailing – 3.1% | ||||||||
| CVS Caremark Corp. 5.750%, 06/01/2017 | 1,000,000 | 1,057,006 | ||||||
| Kroger Co. / The 6.400%, 08/15/2017 | 1,500,000 | 1,641,123 | ||||||
| Safeway, Inc. 6.350%, 08/15/2017 | 1,500,000 | 1,644,189 | ||||||
| 4,342,318 | ||||||||
Food Products – 3.0% | ||||||||
| Bunge N.A. Finance LP 5.900%, 04/01/2017 | 1,500,000 | 1,487,029 | ||||||
| Kraft Foods, Inc. 6.125%, 02/01/2018 | 1,500,000 | 1,579,826 | ||||||
| Tyson Foods, Inc. 7.850%, 04/01/2016 (b) | 1,000,000 | 1,030,000 | ||||||
| 4,096,855 | ||||||||
Household Products – 1.2% | ||||||||
| Clorox Co. / The 3.550%, 11/01/2015 | 300,000 | 296,978 | ||||||
| Kimberly-Clark Corp. 6.125%, 08/01/2017 | 1,000,000 | 1,110,266 | ||||||
| Procter & Gamble Co. / The 4.700%, 02/15/2019 | 250,000 | 256,394 | ||||||
| 1,663,638 | ||||||||
Personal Products – 0.6% | ||||||||
| Mead Johnson Nutrition Co. 3.500%, 11/01/2014 (a) | 800,000 | 791,752 | ||||||
TOTAL CONSUMER STAPLES | 11,916,867 | |||||||
ENERGY – 7.9% | ||||||||
Energy Equipment & Services – 1.1% | ||||||||
| Weatherford International Ltd. 6.000%, 03/15/2018 | 1,500,000 | 1,512,870 | ||||||
Oil, Gas & Consumable Fuels – 6.8% | ||||||||
| Anadarko Petroleum Corp. 5.950%, 09/15/2016 | 1,500,000 | 1,624,795 | ||||||
| Atlantic Richfield Co. 8.550%, 03/01/2012 | 200,000 | 227,237 | ||||||
| Cenovus Energy, Inc. 5.700%, 10/15/2019 (a) | 1,000,000 | 1,045,022 | ||||||
| Devon OEI Operating, Inc. 7.250%, 10/01/2011 | 1,000,000 | 1,091,446 | ||||||
| Energy Transfer Partners LP 5.650%, 08/01/2012 | 1,000,000 | 1,063,488 | ||||||
| Magellan Midstream Partners LP 6.550%, 07/15/2019 | 500,000 | 543,728 | ||||||
| Marathon Oil Corp. 6.125%, 03/15/2012 | 750,000 | 806,593 | ||||||
| Questar Market Resources, Inc. 6.800%, 03/01/2020 | 1,000,000 | 1,044,217 | ||||||
| Valero Energy Corp. 6.875%, 04/15/2012 | 750,000 | 819,346 | ||||||
| XTO Energy, Inc. 4.900%, 02/01/2014 | 1,000,000 | 1,075,632 | ||||||
| 9,341,504 | ||||||||
TOTAL ENERGY | 10,854,374 | |||||||
FINANCIALS – 27.7% | ||||||||
Capital Markets – 5.1% | ||||||||
| BlackRock, Inc. 2.250%, 12/10/2012 | 500,000 | 498,162 | ||||||
| Goldman Sachs Group, Inc. / The 6.150%, 04/01/2018 | 1,250,000 | 1,340,296 | ||||||
| Janus Capital Group, Inc. (b) 6.950%, 06/15/2017 | 1,500,000 | 1,415,832 | ||||||
| Jefferies Group, Inc. 5.875%, 06/08/2014 | 1,500,000 | 1,541,892 | ||||||
| Morgan Stanley 4.750%, 04/01/2014 | 1,750,000 | 1,761,732 | ||||||
(continued)
17
Ohio National Fund, Inc.
Bond Portfolio (Continued)
Bond Portfolio (Continued)
| Schedule of Investments | December 31, 2009 |
| Face | ||||||||
| Corporate Bonds – 87.1% | Amount | Value | ||||||
Capital Markets (continued) | ||||||||
| TD Ameritrade Holding Corp. 4.150%, 12/01/2014 | $ | 500,000 | $ | 493,505 | ||||
| 7,051,419 | ||||||||
Commercial Banks – 6.4% | ||||||||
| BB&T Corp. 5.200%, 12/23/2015 | 1,000,000 | 1,039,946 | ||||||
| Comerica Bank 5.750%, 11/21/2016 | 1,500,000 | 1,453,657 | ||||||
| Deutsche Bank Capital Funding Trust VII 5.628%, Perpetual (a) (c) | 1,500,000 | 1,102,500 | ||||||
| Fifth Third Bancorp 4.500%, 06/01/2018 | 1,750,000 | 1,429,995 | ||||||
| PNC Funding Corp. 5.250%, 11/15/2015 | 1,500,000 | 1,544,482 | ||||||
| SunTrust Bank 5.000%, 09/01/2015 | 1,500,000 | 1,455,521 | ||||||
| Wells Fargo & Co. 5.625%, 12/11/2017 | 750,000 | 781,363 | ||||||
| 8,807,464 | ||||||||
Consumer Finance – 2.1% | ||||||||
| American Express Co. 7.000%, 03/19/2018 | 1,250,000 | 1,378,764 | ||||||
| Capital One Bank USA NA 5.125%, 02/15/2014 | 750,000 | 780,953 | ||||||
| Discover Financial Services 6.450%, 06/12/2017 | 750,000 | 702,962 | ||||||
| 2,862,679 | ||||||||
Diversified Financial Services – 3.5% | ||||||||
| Bank of America Corp. 5.650%, 05/01/2018 | 1,000,000 | 1,017,287 | ||||||
| Citigroup, Inc. 6.125%, 05/15/2018 | 1,250,000 | 1,258,796 | ||||||
| General Electric Capital Corp. 5.625%, 05/01/2018 | 1,000,000 | 1,026,436 | ||||||
| JPMorgan Chase & Co. 5.150%, 10/01/2015 | 1,500,000 | 1,555,239 | ||||||
| 4,857,758 | ||||||||
Insurance – 7.0% | ||||||||
| Assurant, Inc. 5.625%, 02/15/2014 | 1,500,000 | 1,539,378 | ||||||
| Axis Capital Holdings Ltd. 5.750%, 12/01/2014 | 1,000,000 | 1,007,654 | ||||||
| Hartford Financial Services Group, Inc. / The 5.375%, 03/15/2017 | 1,500,000 | 1,431,990 | ||||||
| Liberty Mutual Group, Inc. 5.750%, 03/15/2014 (a) | 1,000,000 | 986,579 | ||||||
| Lincoln National Corp. 8.750%, 07/01/2019 | 750,000 | 858,372 | ||||||
| Loews Corp. 5.250%, 03/15/2016 | 750,000 | 762,671 | ||||||
| Metropolitan Life Global Funding I 2.875%, 09/17/2012 (a) | 1,000,000 | 1,008,498 | ||||||
| Prudential Financial, Inc. 6.100%, 06/15/2017 | 1,500,000 | 1,554,983 | ||||||
| StanCorp Financial Group, Inc. 6.875%, 10/01/2012 | 500,000 | 534,322 | ||||||
| 9,684,447 | ||||||||
Real Estate Investment Trusts – 3.6% | ||||||||
| Equity One, Inc. 6.250%, 01/15/2017 | 1,250,000 | 1,143,597 | ||||||
| HCP, Inc. 4.875%, 09/15/2010 | 1,500,000 | 1,530,825 | ||||||
| Mack-Cali Realty LP 4.600%, 06/15/2013 | 1,000,000 | 970,526 | ||||||
| Simon Property Group LP 4.875%, 08/15/2010 | 1,250,000 | 1,275,463 | ||||||
| 4,920,411 | ||||||||
TOTAL FINANCIALS | 38,184,178 | |||||||
HEALTH CARE – 2.8% | ||||||||
Health Care Equipment & Supplies – 0.4% | ||||||||
| Becton Dickinson & Co. 5.000%, 05/15/2019 | 500,000 | 514,467 | ||||||
Health Care Providers & Services – 1.5% | ||||||||
| AmerisourceBergen Corp. 4.875%, 11/15/2019 | 500,000 | 494,581 | ||||||
| UnitedHealth Group, Inc. 6.000%, 02/15/2018 | 1,500,000 | 1,551,900 | ||||||
| 2,046,481 | ||||||||
Life Sciences Tools & Services – 0.2% | ||||||||
| Thermo Fisher Scientific Inc. 3.250%, 11/18/2014 (a) | 300,000 | 294,449 | ||||||
Pharmaceuticals – 0.7% | ||||||||
| Merck & Co. Inc. 5.000%, 06/30/2019 | 1,000,000 | 1,041,400 | ||||||
TOTAL HEALTH CARE | 3,896,797 | |||||||
INDUSTRIALS – 8.2% | ||||||||
Aerospace & Defense – 1.5% | ||||||||
| Raytheon Co. 4.400%, 02/15/2020 | 1,250,000 | 1,233,674 | ||||||
| BAE Systems Holdings, Inc. 6.375%, 06/01/2019 (a) | 750,000 | 808,188 | ||||||
| 2,041,862 | ||||||||
Building Products – 0.7% | ||||||||
| Owens Corning, Inc. 6.500%, 12/01/2016 | 1,000,000 | 1,025,488 | ||||||
Commercial Services & Supplies – 1.2% | ||||||||
| Waste Management, Inc. 6.100%, 03/15/2018 | 1,500,000 | 1,597,736 | ||||||
(continued)
18
Ohio National Fund, Inc.
Bond Portfolio (Continued)
Bond Portfolio (Continued)
| Schedule of Investments | December 31, 2009 |
| Face | ||||||||
| Corporate Bonds – 87.1% | Amount | Value | ||||||
Electrical Equipment – 0.9% | ||||||||
| Emerson Electric Co. 4.250%, 11/15/2020 | $ | 1,250,000 | $ | 1,216,524 | ||||
Machinery – 1.7% | ||||||||
| Caterpillar, Inc. 5.700%, 08/15/2016 | 1,000,000 | 1,083,307 | ||||||
| Deere & Co. 4.375%, 10/16/2019 | 1,250,000 | 1,250,914 | ||||||
| 2,334,221 | ||||||||
Road & Rail – 2.2% | ||||||||
| CSX Corp. 5.600%, 05/01/2017 | 1,500,000 | 1,558,419 | ||||||
| Ryder System, Inc. 4.625%, 04/01/2010 | 506,000 | 508,381 | ||||||
| Union Pacific Corp. 3.625%, 06/01/2010 | 1,000,000 | 1,012,250 | ||||||
| 3,079,050 | ||||||||
TOTAL INDUSTRIALS | 11,294,881 | |||||||
INFORMATION TECHNOLOGY – 2.3% | ||||||||
Communications Equipment – 0.2% | ||||||||
| Cisco Systems, Inc. 2.900%, 11/17/2014 | 300,000 | 299,791 | ||||||
Computers & Peripherals – 0.9% | ||||||||
| International Business Machines Corp. 2.100%, 05/06/2013 | 1,250,000 | 1,248,500 | ||||||
IT Services – 1.2% | ||||||||
| Computer Sciences Corp. 6.500%, 03/15/2018 | 1,500,000 | 1,639,569 | ||||||
TOTAL INFORMATION TECHNOLOGY | 3,187,860 | |||||||
MATERIALS – 1.6% | ||||||||
Chemicals – 0.8% | ||||||||
| Monsanto Co. 7.375%, 08/15/2012 | 1,000,000 | 1,134,166 | ||||||
Metals & Mining – 0.8% | ||||||||
| Teck Resources Ltd. 7.000%, 09/15/2012 | 1,000,000 | 1,061,250 | ||||||
TOTAL MATERIALS | 2,195,416 | |||||||
TELECOMMUNICATION SERVICES – 4.6% | ||||||||
Diversified Telecommunication Services – 2.5% | ||||||||
| AT&T Corp. 7.300%, 11/15/2011 | 500,000 | 550,778 | ||||||
| Embarq Corp. 6.738%, 06/01/2013 | 1,000,000 | 1,087,312 | ||||||
| Telecom Italia Capital SA 5.250%, 10/01/2015 | 750,000 | 785,130 | ||||||
| Verizon Communications, Inc. 5.350%, 02/15/2011 | 1,000,000 | 1,043,026 | ||||||
| 3,466,246 | ||||||||
Wireless Telecommunication Services – 2.1% | ||||||||
| America Movil S.A.B. de C.V. 5.750%, 01/15/2015 | 1,000,000 | 1,057,548 | ||||||
| New Cingular Wireless Services, Inc. 7.875%, 03/01/2011 | 750,000 | 806,022 | ||||||
| Rogers Communications, Inc. 5.500%, 03/15/2014 | 1,000,000 | 1,072,532 | ||||||
| 2,936,102 | ||||||||
TOTAL TELECOMMUNICATION SERVICES | 6,402,348 | |||||||
UTILITIES – 16.1% | ||||||||
Electric Utilities – 10.3% | ||||||||
| Appalachian Power Co. 5.550%, 04/01/2011 | 1,000,000 | 1,040,319 | ||||||
| Commonwealth Edison Co. 5.950%, 08/15/2016 | 1,500,000 | 1,608,184 | ||||||
| Entergy Mississippi, Inc. 5.920%, 02/01/2016 | 1,000,000 | 1,025,784 | ||||||
| IPALCO Enterprises, Inc. 8.625%, 11/14/2011 | 1,000,000 | 1,050,000 | ||||||
| Kansas City Power & Light Co. 5.850%, 06/15/2017 | 1,500,000 | 1,548,459 | ||||||
| Metropolitan Edison Co. 4.875%, 04/01/2014 | 750,000 | 779,206 | ||||||
| Pepco Holdings, Inc. 4.000%, 05/15/2010 | 750,000 | 757,103 | ||||||
| Potomac Power Co. 6.500%, 11/15/2037 | 750,000 | 825,809 | ||||||
| PSEG Power LLC 5.000%, 04/01/2014 | 750,000 | 775,427 | ||||||
| Scottish Power Ltd. 4.910%, 03/15/2010 | 1,000,000 | 1,008,338 | ||||||
| Tenaska Georgia Partners LP 9.500%, 02/01/2030 | 491,244 | 550,216 | ||||||
| Union Electric Co. 6.400%, 06/15/2017 | 1,500,000 | 1,617,711 | ||||||
| Virginia Electric & Power Co. 5.400%, 01/15/2016 | 1,500,000 | 1,585,277 | ||||||
| 14,171,833 | ||||||||
Gas Utilities – 2.4% | ||||||||
| AGL Capital Corp. 5.250%, 08/15/2019 | 1,000,000 | 1,008,887 | ||||||
| CenterPoint Energy Resources Corp. 5.950%, 01/15/2014 | 500,000 | 527,015 | ||||||
| Southwest Gas Corp. 7.625%, 05/15/2012 | 1,000,000 | 1,089,003 | ||||||
| Spectra Energy Capital LLC 5.500%, 03/01/2014 | 750,000 | 789,247 | ||||||
| 3,414,152 | ||||||||
Independent Power Producers & Energy Traders – 1.1% | ||||||||
| Energy Future Competitive Holdings Co. 7.480%, 01/01/2017 | 642,667 | 408,841 | ||||||
| TransAlta Corp. 6.750%, 07/15/2012 | 1,000,000 | 1,082,662 | ||||||
| 1,491,503 | ||||||||
(continued)
19
Ohio National Fund, Inc.
Bond Portfolio (Continued)
Bond Portfolio (Continued)
| Schedule of Investments | December 31, 2009 |
| Face | ||||||||
| Corporate Bonds – 87.1% | Amount | Value | ||||||
Multi-Utilities – 2.3% | ||||||||
| Alliant Energy Corp. 4.000%, 10/15/2014 | $ | 1,000,000 | $ | 1,001,331 | ||||
| Avista Corp. 5.950%, 06/01/2018 | 1,000,000 | 1,049,226 | ||||||
| Consumers Energy Co. 6.000%, 02/15/2014 | 1,000,000 | 1,100,157 | ||||||
| 3,150,714 | ||||||||
TOTAL UTILITIES | 22,228,202 | |||||||
Total Corporate Bonds (Cost $116,236,238) | $ | 120,078,508 | ||||||
| Face | ||||||||
| U.S. Treasury Obligations – 1.4% | Amount | Value | ||||||
| U.S. Treasury Note 2.375%, 09/30/2014 | $ | 1,900,000 | $ | 1,884,559 | ||||
Total U.S. Treasury Obligations (Cost $1,901,978) | $ | 1,884,559 | ||||||
| Face | Amortized | |||||||
| Commercial Paper – 2.9% | Amount | Cost | ||||||
| Prudential Funding LLC 0.020%, 01/04/2010 | $ | 4,000,000 | $ | 3,999,993 | ||||
Total Commercial Paper (Cost $3,999,993) | $ | 3,999,993 | ||||||
| Money Market Funds – 2.3% | Shares | Value | ||||||
| Fidelity Institutional Money Market Funds Money Market Portfolio – Class I | 3,160,000 | $ | 3,160,000 | |||||
Total Money Market Funds (Cost $3,160,000) | $ | 3,160,000 | ||||||
| Face | Amortized | |||||||
| Repurchase Agreements – 4.2% | Amount | Cost | ||||||
| U.S. Bank 0.010% 01/04/2010 | $ | 5,829,000 | $ | 5,829,000 | ||||
| Agreement date: 12/31/2009 | ||||||||
| Repurchase price $5,829,006 | ||||||||
| Collateralized by: | ||||||||
| Various Agency Mortgage-Backed Securities 3.22% to 5.00%, Due 07/01/2018 through 10/01/2034 Fair Value: $5,945,448 | ||||||||
Total Repurchase Agreements (Cost $5,829,000) | $ | 5,829,000 | ||||||
Total Investments – 97.9% (Cost $131,127,209) (d) | $ | 134,952,060 | ||||||
Other Assets in Excess of Liabilities – 2.1% | 2,960,249 | |||||||
Net Assets – 100.0% | $ | 137,912,309 | ||||||
Percentages are stated as a percent of net assets.
Footnotes:
| (a) | Security exempt from registration under Regulation D of the Securities Act of 1933. These securities may be resold in transactions exempt from registration, normally to qualified buyers. At December 31, 2009, the value of these securities totaled $6,036,988 or 4.4% of the Portfolio’s net assets. These securities were deemed liquid pursuant to procedures approved by the Board of Directors. | |
| (b) | This security is a credit sensitive bond. The coupon rate is a variable rate subject to adjustment based on changes in either Moody’s or S&P ratings. | |
| (c) | Fixed-to-floating rate, callable, perpetual life trust preferred security. Interest rates stated are those in effect at December 31, 2009. | |
| (d) | Represents cost for financial reporting purposes, which may differ from cost basis for Federal income tax purposes. See also Note 8 of the Notes to Financial Statements. |
The accompanying notes are an integral part of these financial statements.
20
Ohio National Fund, Inc.
Bond Portfolio
Bond Portfolio
Statement of Assets and Liabilities
December 31, 2009
| Assets: | ||||
| Investments in securities, at value (Cost $125,298,209) | $ | 129,123,060 | ||
| Repurchase agreements | 5,829,000 | |||
| Cash | 236 | |||
| Receivable for fund shares sold | 1,392,954 | |||
| Accrued interest receivable | 1,707,689 | |||
| Prepaid expenses and other assets | 240 | |||
| Total assets | 138,053,179 | |||
| Liabilities: | ||||
| Payable for fund shares redeemed | 39,171 | |||
| Payable for investment management services | 66,852 | |||
| Payable for compliance services | 1,677 | |||
| Accrued custody expense | 841 | |||
| Accrued professional fees | 11,272 | |||
| Accrued accounting fees | 11,703 | |||
| Accrued printing and filing fees | 9,354 | |||
| Total liabilities | 140,870 | |||
| Net assets | $ | 137,912,309 | ||
| Net assets consist of: | ||||
| Par value, $1 per share | 11,258,369 | |||
| Paid-in capital in excess of par value | 134,097,025 | |||
| Accumulated net realized loss on investments | (17,312,362 | ) | ||
| Net unrealized appreciation on investments | 3,824,851 | |||
| Undistributed net investment income | 6,044,426 | |||
| Net assets | $ | 137,912,309 | ||
| Shares outstanding | 11,258,369 | |||
| Authorized Fund shares allocated to Portfolio | 20,000,000 | |||
| Net asset value per share | $ | 12.25 | ||
Statement of Operations
For the Year Ended December 31, 2009
| Investment income: | ||||
| Interest | $ | 6,868,550 | ||
| Expenses: | ||||
| Management fees | 696,693 | |||
| Custodian fees | 9,298 | |||
| Directors’ fees | 13,030 | |||
| Professional fees | 18,524 | |||
| Accounting fees | 63,948 | |||
| Printing and filing fees | 18,509 | |||
| Compliance expense | 6,376 | |||
| Other | 410 | |||
| Total expenses | 826,788 | |||
| Net investment income | 6,041,762 | |||
| Realized/unrealized gain (loss) on investments: | ||||
| Net realized gain (loss) on investments | (7,436,754 | ) | ||
| Change in unrealized appreciation/depreciation on investments | 23,501,373 | |||
| Net realized/unrealized gain (loss) on investments | 16,064,619 | |||
| Change in net assets from operations | $ | 22,106,381 | ||
The accompanying notes are an integral part of these financial statements.
21
Ohio National Fund, Inc.
Bond Portfolio
Bond Portfolio
Statements of Changes in Net Assets
| Years Ended December 31, | ||||||||
| 2009 | 2008 | |||||||
Increase (Decrease) in Net Assets: | ||||||||
| Operations: | ||||||||
| Net investment income | $ | 6,041,762 | $ | 8,183,385 | ||||
| Net realized gain (loss) on investments | (7,436,754 | ) | (7,121,821 | ) | ||||
| Change in unrealized appreciation/depreciation on investments | 23,501,373 | (18,186,256 | ) | |||||
| Change in net assets from operations | 22,106,381 | (17,124,692 | ) | |||||
| Capital transactions: | ||||||||
| Received from shares sold | 46,255,877 | 34,675,995 | ||||||
| Paid for shares redeemed | (38,208,419 | ) | (87,447,734 | ) | ||||
| Change in net assets from capital transactions | 8,047,458 | (52,771,739 | ) | |||||
| Change in net assets | 30,153,839 | (69,896,431 | ) | |||||
Net Assets: | ||||||||
| Beginning of year | 107,758,470 | 177,654,901 | ||||||
| End of year | $ | 137,912,309 | $ | 107,758,470 | ||||
| Undistributed net investment income | $ | 6,044,426 | $ | 8,186,049 | ||||
Financial Highlights
| Years Ended December 31, | ||||||||||||||||||||
| 2009 | 2008 | 2007 | 2006 | 2005 | ||||||||||||||||
Selected Per-Share Data: | ||||||||||||||||||||
| Net asset value, beginning of year | $ | 10.13 | $ | 11.44 | $ | 11.03 | $ | 10.96 | $ | 11.33 | ||||||||||
| Operations: | ||||||||||||||||||||
| Net investment income | 0.49 | 1.04 | 0.58 | 0.55 | (a) | 0.56 | (a) | |||||||||||||
| Net realized and unrealized gain (loss) on investments | 1.63 | (2.35 | ) | (0.17 | ) | (0.06 | ) | (0.51 | ) | |||||||||||
| Total from operations | 2.12 | (1.31 | ) | 0.41 | 0.49 | 0.05 | ||||||||||||||
| Distributions: | ||||||||||||||||||||
| Distributions from net investment income | — | — | — | (0.42 | ) | (0.42 | ) | |||||||||||||
| Net asset value, end of year | $ | 12.25 | $ | 10.13 | $ | 11.44 | $ | 11.03 | $ | 10.96 | ||||||||||
Total return | 20.93 | % | –11.45 | % | 3.72 | % | 4.44 | % | 0.42 | % | ||||||||||
Ratios and supplemental data: | ||||||||||||||||||||
| Net assets at end of year (millions) | $ | 137.9 | $ | 107.8 | $ | 177.7 | $ | 171.1 | $ | 139.0 | ||||||||||
| Ratios to average net assets: | ||||||||||||||||||||
| Expenses | 0.69 | % | 0.66 | % | 0.63 | % | 0.65 | % | 0.68 | % | ||||||||||
| Net investment income | 5.06 | % | 5.35 | % | 4.99 | % | 4.99 | % | 4.97 | % | ||||||||||
| Portfolio turnover rate | 27 | % | 15 | % | 13 | % | 25 | % | 13 | % | ||||||||||
| (a) | Calculated using the average daily shares method. |
The accompanying notes are an integral part of these financial statements.
22
Ohio National Fund, Inc.
Omni Portfolio
Omni Portfolio
Objective/Strategy
The Omni Portfolio seeks a high level of long-term total return consistent with preservation of capital by investing in stocks, bonds, and money market instruments.
Performance as of December 31, 2009
Average Annual Total Returns: | ||||
| One year | 33.15% | |||
| Five years | 3.91% | |||
| Ten years | -0.66% |
Past performance does not guarantee future results. The performance data quoted represents past performance and current returns may be lower or higher. Total return figures include change in share price and reinvestment of dividends and capital gains. The investment return and principal value will fluctuate so that an investor’s shares, when redeemed may be worth more or less than the original cost. To obtain performance information up to the most recent month end, call toll-free 1-877-781-6392.
The Portfolio is not open to direct retail investment. Beneficial interest in shares is obtained solely by purchase of variable life insurance policies and variable annuity contracts. Actual performance results for variable annuity and variable universal life contracts will be lower due to contract charges. Consult your contract for applicable charges.
Comments
For the year ended December 31, 2009, the Omni Portfolio returned 33.15% versus 24.87% for the current benchmark, which is composed of 70% S&P 500 Index and 30% BofA Merrill Lynch U.S. Corporate Master Index (the “Merrill Lynch Index”).
The 828 basis points of out-performance is the result of two factors. First, the equity component of the Portfolio out-performed the S&P 500 Index. Second, the bond component of the Portfolio out-performed the Merrill Lynch Index. The Portfolio, however, was under-weighted in stocks versus the blended benchmark, and this was a drag on overall performance starting in March when stocks began a significant rally.
Following a year in which the stock market declined nearly 40%, 2009 got off to a dreadful start with the S&P 500 Index plummeting 25% to its early March low of 667. As unprecedented global fiscal and monetary stimulus programs began to show some benefits, the panic gripping the markets early in the year lessened, a more fundamentals-based approach to valuations took hold and the market recovered 65% off the bottom to end the year up 26.46%. The equity portion of the Portfolio out-performed the market in 2009, ending the year up 40.28% gross of fees, or 1,382 basis points above the S&P 500 Index.
The top contributors to the Portfolio’s equity performance in 2009 included financial companies Wells Fargo & Co. and JPMorgan Chase & Co. Both Wells Fargo & Co. and JPMorgan Chase & Co. out-performed the S&P 500 Index and the Financials sector from the March lows as fears faded that the government would nationalize large banks and as signs of credit improvement emerged. Two other top contributors were Information Technology companies Apple, Inc. and Google, Inc. Apple, Inc.’s earnings estimates were increased throughout the year, as iPhone sales continued to exceed expectations and, more recently, as analysts expected increased contributions from their “Apps store”. Google, Inc. benefited from improving advertising trends, particularly online, and excitement surrounding their smartphone launch. Rounding out the top five equity contributors to the year was Celanese Corp., a top performer due to its low cost chemical production and exposure to the rebounding Chinese economy.(1)
Detractors from full year equity performance included Exxon Mobil Corp., as the company was negatively impacted by the falling price of oil during the period in which the Portfolio owned the stock. SunPower Corp. was hurt by aggressive pricing on polysilicon, which is used in the production of solar panels. Devon Energy Corp. cost the Portfolio due to unfavorable natural gas pricing. Two insurance companies, The Hartford Financial Services Group, Inc. and Lincoln National Corp. under-performed during the period the Portfolio owned them due to combined fears of investment portfolio losses and the need to raise capital to cover reserve requirements for their variable annuity businesses.(1)
Within the equity component of the Portfolio, the greatest shift in sector weightings during the year occurred in the Consumer Discretionary sector, where the sector weighting ended in line with the benchmark weighting and up from the start of the year. Purchases in this sector included Royal Caribbean Cruises Ltd. and Amazon.com, Inc. on rising earnings estimates and attractive valuations. Sales of Health Care stocks during the year resulted in a decreased weighting in that sector. Health care stocks that were sold include Abbott Laboratories and Wellpoint Corp., which were sold on valuation. The Portfolio weighting in Consumer Staples stocks is approximately 4% below the benchmark weighting and 3% below where the sector started the year.(1)
As we enter 2010, the equity component of the Portfolio has a weighting in the Materials and Industrials sectors that is well above a combined benchmark weighting. Recent new additions to the Portfolio in these sectors include Honeywell International Inc., Goodrich Corp. and United Technologies Corp., which were purchased based on attractive valuation and evidence of an improving aerospace aftermarket. We also purchased Illinois Tool Works Inc. based on positive earnings revisions due to the potential for the company to achieve higher margins versus previous economic cycles.(1)
The bond component of the Portfolio had a total return of 26.34% during 2009, out-performing the Merrill Lynch Index by approximately 650 basis points. The high total return in 2009 for the Portfolio’s bond holdings reflects the strong recovery in the capital markets during the year, and a recovery in bond values, which had declined dramatically during the credit crisis of 2008. In some respects, the performance of the bond component of the Portfolio in 2009 was a reversal of what occurred in 2008. During 2008, corporate credit spreads widened as the credit crisis ensued, reaching an unprecedented level of 604 basis points for the Merrill Lynch Index by the end of 2008. This widening in credit spreads depressed corporate bond prices in 2008. Corporate bond prices remained depressed until March of 2009 when the credit markets began their recovery. Between March and the end of 2009, the corporate bond market made a remarkable recovery. The credit spread of the Merrill Lynch Index tightened to 190 basis points by 2009 year-end. This tightening in credit
(continued)
23
Ohio National Fund, Inc.
Omni Portfolio (Continued)
Omni Portfolio (Continued)
spreads explains the high total returns for both the Merrill Lynch Index and the bond component of the Portfolio.
The return of the bond component of the Portfolio exceeded the return of the Merrill Lynch Index in 2009 primarily because the bond portion of the Portfolio had a lower average credit quality and a shorter duration than the Merrill Lynch Index. During 2009, lower quality bonds performed better than higher quality bonds. Also, because U.S. Treasury yields increased during the year, shorter duration bonds performed better than longer duration bonds. An over-weighting versus the Merrill Lynch Index in the Insurance and Real Estate Investment Trusts (REITs) industries benefited performance because these industries out-performed in 2009. An under-weighting in the Financials sector hurt performance because this sector out-performed in 2009. An over-weighting in the bonds of the Utilities sector also hurt performance because the Utility sector under-performed.(1)
Most bonds held by the Portfolio had very good returns in 2009. The five bonds that had the best returns for the year, were Health Care Property Investors Inc., Deutsche Bank Capital Funding Trust VII, American General Finance Corp., Macy’s Retail Holdings and Duke Realty LP. The five poorest performing bonds were Capmark Financial Group, Inc., Wachovia Capital Trust III, Merrill Lynch & Co., Inc., RBS Capital Trust III and Duke Energy Carolinas LLC.(1)
The U.S. economy appears to be emerging from the worst recession since the Great Depression. Economic growth was positive in the third quarter of 2009 and is expected to be positive for the fourth quarter. While there are certainly economic issues that cause concern, including commercial real estate exposure at financial institutions, high unemployment levels in the U.S., and record federal budget deficits, there are signs of economic stability, such as recovery of the equity and credit markets, a potential bottoming in the residential housing market and the newly lean cost structures of numerous blue chip companies that should enhance earning leverage going forward. More stocks currently exhibit both attractive valuations and improving fundamentals than was the case one year ago. The record federal budget deficits and the expectation that the Federal Reserve will begin to tighten monetary conditions in the latter half of 2010 suggests that U.S. Treasury yields will rise this year. Because credit spreads tightened so dramatically during 2009, it is unlikely spreads will tighten much more in 2010. Because of the expectations for higher Treasury yields and little credit spread tightening in 2010, the strategy for the bond component of the Portfolio is to maintain a duration that is short of the duration of the Merrill Lynch Index and to skew purchases toward higher quality credits.
| (1) | The Portfolio’s composition is subject to change. Holdings and weightings are as of December 31, 2009. |
Change in Value of $10,000 Investment
![[PERFORMANCE GRAPH]](https://capedge.com/proxy/N-CSR/0000950123-10-021904/l38589l3858939.gif)
Hypothetical illustration based on past performance. Future performance will vary. The Portfolio’s returns reflect reinvested dividends. The Portfolio’s holdings may differ significantly from the securities in the index. The index is unmanaged and therefore does not reflect the cost of portfolio management and accounting.
The BofA Merrill Lynch U.S. Corporate Master Index tracks the performance of all U.S. dollar-denominated, investment grade corporate public debt issued in the U.S. domestic bond market. Qualifying bonds must have at least one year remaining term to maturity, a fixed coupon schedule, and a minimum amount outstanding of $250 million.
The S&P 500 Index is a capitalization-weighted index designed to measure performance of the broad domestic market through changes in the aggregate market value of 500 stocks representing all major industries. The index presented herein includes the effects of reinvested dividends.
(continued)
24
Ohio National Fund, Inc.
Omni Portfolio (Continued)
Omni Portfolio (Continued)
Portfolio Composition as of December 31, 2009 (1)
| % of Net Assets | |||
Common Stocks (3) | 67.3 | ||
Corporate Bonds (3) | 26.9 | ||
| Money Market Funds and Other Net Assets | 5.8 | ||
| 100.0 | |||
Top 10 Portfolio Holdings as of December 31, 2009 (1) (2)
| % of Net Assets | |||||||
| 1. | Pfizer, Inc. | 1.7 | |||||
| 2. | Chevron Corp. | 1.7 | |||||
| 3. | General Electric Co. | 1.6 | |||||
| 4. | Dow Chemical Co. / The | 1.5 | |||||
| 5. | Bank of America Corp. | 1.5 | |||||
| 6. | Cisco Systems, Inc. | 1.4 | |||||
| 7. | United Technologies Corp. | 1.4 | |||||
| 8. | International Business Machines Corp. | 1.4 | |||||
| 9. | Google, Inc. Class A | 1.4 | |||||
| 10. | Texas Instruments Inc. | 1.4 | |||||
| (1) | Composition of Portfolio subject to change. | |
| (2) | Short-term investments have been excluded from the list of Top 10 Portfolio holdings. | |
| (3) | Sectors (combined): |
| % of Net Assets | |||
| Financials | 17.0 | ||
| Information Technology | 15.2 | ||
| Industrials | 12.0 | ||
| Energy | 11.0 | ||
| Consumer Discretionary | 8.1 | ||
| Consumer Staples | 8.1 | ||
| Health Care | 7.7 | ||
| Materials | 5.9 | ||
| Utilities | 5.5 | ||
| Telecommunication Services | 3.7 | ||
| 94.2 | |||
25
Ohio National Fund, Inc.
Omni Portfolio
Omni Portfolio
| Schedule of Investments | December 31, 2009 |
| Common Stocks – 67.3% | Shares | Value | ||||||
CONSUMER DISCRETIONARY – 6.7% | ||||||||
Hotels, Restaurants & Leisure – 1.4% | ||||||||
| Darden Restaurants, Inc. | 5,000 | $ | 175,350 | |||||
| Royal Caribbean Cruises Ltd. (a) | 16,100 | 407,008 | ||||||
| 582,358 | ||||||||
Internet & Catalog Retail – 0.6% | ||||||||
| Amazon.com, Inc. (a) | 1,800 | 242,136 | ||||||
Multiline Retail – 1.3% | ||||||||
| Target Corp. | 10,900 | 527,233 | ||||||
Specialty Retail – 2.1% | ||||||||
| Bed Bath & Beyond Inc. (a) | 8,800 | 339,944 | ||||||
| Lowe’s Companies, Inc. | 23,300 | 544,987 | ||||||
| 884,931 | ||||||||
Textiles, Apparel & Luxury Goods – 1.3% | ||||||||
| V.F. Corp. | 7,400 | 541,976 | ||||||
TOTAL CONSUMER DISCRETIONARY | 2,778,634 | |||||||
CONSUMER STAPLES – 4.9% | ||||||||
Food & Staples Retailing – 1.3% | ||||||||
| Wal – Mart Stores, Inc. | 10,100 | 539,845 | ||||||
Food Products – 2.3% | ||||||||
| ConAgra Foods, Inc. | 11,500 | 265,075 | ||||||
| General Mills, Inc. | 6,100 | 431,941 | ||||||
| Ralcorp Holdings, Inc. (a) | 4,300 | 256,753 | ||||||
| 953,769 | ||||||||
Household Products – 1.3% | ||||||||
| Procter & Gamble Co. / The | 8,900 | 539,607 | ||||||
TOTAL CONSUMER STAPLES | 2,033,221 | |||||||
ENERGY – 8.0% | ||||||||
Energy Equipment & Services – 0.9% | ||||||||
| Transocean Ltd. (a) | 4,600 | 380,880 | ||||||
Oil, Gas & Consumable Fuels – 7.1% | ||||||||
| Anadarko Petroleum Corp. | 6,600 | 411,972 | ||||||
| Apache Corp. | 1,800 | 185,706 | ||||||
| Chevron Corp. | 8,900 | 685,211 | ||||||
| Exxon Mobil Corp. | 8,200 | 559,158 | ||||||
| Hess Corp. | 9,300 | 562,650 | ||||||
| Occidental Petroleum Corp. | 6,700 | 545,045 | ||||||
| 2,949,742 | ||||||||
TOTAL ENERGY | 3,330,622 | |||||||
FINANCIALS – 9.2% | ||||||||
Capital Markets – 3.9% | ||||||||
| Goldman Sachs Group, Inc. / The | 3,400 | 574,056 | ||||||
| Morgan Stanley | 18,800 | 556,480 | ||||||
| State Street Corp. | 10,800 | 470,232 | ||||||
| 1,600,768 | ||||||||
Commercial Banks – 1.1% | ||||||||
| Wells Fargo & Co. | 17,700 | 477,723 | ||||||
Diversified Financial Services – 2.9% | ||||||||
| Bank of America Corp. | 40,900 | 615,954 | ||||||
| JPMorgan Chase & Co. | 13,700 | 570,879 | ||||||
| 1,186,833 | ||||||||
Insurance – 1.3% | ||||||||
| Prudential Financial, Inc. | 10,900 | 542,384 | ||||||
TOTAL FINANCIALS | 3,807,708 | |||||||
HEALTH CARE – 6.0% | ||||||||
Health Care Equipment & Supplies – 1.5% | ||||||||
| Hospira, Inc. (a) | 11,300 | 576,300 | ||||||
| Medtronic, Inc. | 1,200 | 52,776 | ||||||
| 629,076 | ||||||||
Health Care Providers & Services – 1.9% | ||||||||
| Laboratory Corp. of America Holdings (a) | 3,300 | 246,972 | ||||||
| McKesson Corp. | 8,700 | 543,750 | ||||||
| 790,722 | ||||||||
Life Sciences Tools & Services – 0.4% | ||||||||
| Thermo Fisher Scientific, Inc. (a) | 3,200 | 152,608 | ||||||
Pharmaceuticals – 2.2% | ||||||||
| Merck & Co. Inc. | 5,700 | 208,278 | ||||||
| Pfizer, Inc. | 39,100 | 711,229 | ||||||
| 919,507 | ||||||||
TOTAL HEALTH CARE | 2,491,913 | |||||||
INDUSTRIALS – 10.5% | ||||||||
Aerospace & Defense – 4.1% | ||||||||
| Goodrich Corp. | 8,800 | 565,400 | ||||||
| Honeywell International Inc. | 14,100 | 552,720 | ||||||
| United Technologies Corp. | 8,600 | 596,926 | ||||||
| 1,715,046 | ||||||||
Construction & Engineering – 0.7% | ||||||||
| Quanta Services, Inc. (a) | 13,000 | 270,920 | ||||||
Electrical Equipment – 0.1% | ||||||||
| SunPower Corp. (a) | 1,700 | 35,615 | ||||||
Industrial Conglomerates – 3.5% | ||||||||
| 3M Co. | 3,500 | 289,345 | ||||||
| General Electric Co. | 44,200 | 668,746 | ||||||
| Tyco International Ltd. | 13,500 | 481,680 | ||||||
| 1,439,771 | ||||||||
Machinery – 2.1% | ||||||||
| Caterpillar, Inc. | 9,500 | 541,405 | ||||||
| Illinois Tool Works Inc. | 7,100 | 340,729 | ||||||
| 882,134 | ||||||||
TOTAL INDUSTRIALS | 4,343,486 | |||||||
INFORMATION TECHNOLOGY – 14.8% | ||||||||
Communications Equipment – 2.8% | ||||||||
| Cisco Systems, Inc. (a) | 25,000 | 598,500 | ||||||
| QUALCOMM, Inc. | 12,200 | 564,372 | ||||||
| 1,162,872 | ||||||||
(continued)
26
Ohio National Fund, Inc.
Omni Portfolio (Continued)
Omni Portfolio (Continued)
| Schedule of Investments | December 31, 2009 |
| Common Stocks – 67.3% | Shares | Value | ||||||
Computers & Peripherals – 5.1% | ||||||||
| Apple, Inc. (a) | 2,300 | $ | 484,978 | |||||
| Dell, Inc. (a) | 35,000 | 502,600 | ||||||
| Hewlett-Packard Co. | 10,800 | 556,308 | ||||||
| International Business Machines Corp. | 4,500 | 589,050 | ||||||
| 2,132,936 | ||||||||
Internet Software & Services – 1.4% | ||||||||
| Google, Inc. Class A (a) | 950 | 588,981 | ||||||
Semiconductors & Semiconductor Equipment – 5.5% | ||||||||
| Applied Materials, Inc. | 40,200 | 560,388 | ||||||
| Intel Corp. | 26,600 | 542,640 | ||||||
| Maxim Integrated Products, Inc. | 29,000 | 588,700 | ||||||
| Texas Instruments Inc. | 22,600 | 588,956 | ||||||
| 2,280,684 | ||||||||
TOTAL INFORMATION TECHNOLOGY | 6,165,473 | |||||||
MATERIALS – 5.9% | ||||||||
Chemicals – 2.2% | ||||||||
| Air Products and Chemicals, Inc. | 3,300 | 267,498 | ||||||
| Dow Chemical Co. / The | 22,900 | 632,727 | ||||||
| 900,225 | ||||||||
Containers & Packaging – 1.1% | ||||||||
| Ball Corp. | 9,000 | 465,300 | ||||||
Metals & Mining – 2.6% | ||||||||
| Freeport-McMoRan Copper & Gold, Inc. | 6,900 | 554,001 | ||||||
| Teck Resources Ltd. (a) | 14,800 | 517,556 | ||||||
| 1,071,557 | ||||||||
TOTAL MATERIALS | 2,437,082 | |||||||
TELECOMMUNICATION SERVICES – 1.3% | ||||||||
Diversified Telecommunication Services – 1.3% | ||||||||
| Verizon Communications, Inc. | 16,500 | 546,645 | ||||||
TOTAL TELECOMMUNICATION SERVICES | 546,645 | |||||||
Total Common Stocks (Cost $25,612,054) | $ | 27,934,784 | ||||||
| Face | ||||||||
| Corporate Bonds – 26.9% | Amount | Value | ||||||
CONSUMER DISCRETIONARY – 1.4% | ||||||||
Automobiles – 0.3% | ||||||||
| Daimler Finance North America LLC 6.500%, 11/15/2013 | $ | 100,000 | $ | 109,717 | ||||
Media – 0.9% | ||||||||
| Comcast Corp. 5.875%, 02/15/2018 | 150,000 | 159,495 | ||||||
| Cox Communications, Inc. 6.750%, 03/15/2011 | 100,000 | 105,175 | ||||||
| Walt Disney Co. / The 6.200%, 06/20/2014 | 100,000 | 112,077 | ||||||
| 376,747 | ||||||||
Multiline Retail – 0.2% | ||||||||
| Macy’s Retail Holdings, Inc. 5.900%, 12/01/2016 | 100,000 | 98,000 | ||||||
TOTAL CONSUMER DISCRETIONARY | 584,464 | |||||||
CONSUMER STAPLES – 3.2% | ||||||||
Beverages – 0.6% | ||||||||
| Anheuser-Busch Cos., Inc. 5.500%, 01/15/2018 | 150,000 | 152,281 | ||||||
| Coca Cola Co. / The 4.875%, 03/15/2019 | 100,000 | 104,360 | ||||||
| 256,641 | ||||||||
Food & Staples Retailing – 1.2% | ||||||||
| CVS Caremark Corp. 5.750%, 06/01/2017 | 150,000 | 158,551 | ||||||
| Kroger Co. / The 6.400%, 08/15/2017 | 150,000 | 164,112 | ||||||
| Safeway, Inc. 6.350%, 08/15/2017 | 150,000 | 164,419 | ||||||
| 487,082 | ||||||||
Food Products – 0.8% | ||||||||
| Bunge N.A. Finance LP 5.900%, 04/01/2017 | 150,000 | 148,703 | ||||||
| Kraft Foods, Inc. 6.500%, 08/11/2017 | 150,000 | 163,004 | ||||||
| 311,707 | ||||||||
Household Products – 0.6% | ||||||||
| Kimberly-Clark Corp. 6.125%, 08/01/2017 | 150,000 | 166,540 | ||||||
| Procter & Gamble Co. / The 4.700%, 02/15/2019 | 100,000 | 102,558 | ||||||
| 269,098 | ||||||||
TOTAL CONSUMER STAPLES | 1,324,528 | |||||||
ENERGY – 3.0% | ||||||||
Energy Equipment & Services – 0.4% | ||||||||
| Weatherford International Ltd. 6.000%, 03/15/2018 | 150,000 | 151,287 | ||||||
Oil, Gas & Consumable Fuels – 2.6% | ||||||||
| Anadarko Petroleum Corp. 5.950%, 09/15/2016 | 150,000 | 162,480 | ||||||
| Boardwalk Pipelines LP 5.500%, 02/01/2017 | 250,000 | 248,791 | ||||||
| Enterprise Products Operating LLC 5.000%, 03/01/2015 | 150,000 | 154,339 | ||||||
| Magellan Midstream Partners LP 6.400%, 07/15/2018 | 150,000 | 159,664 | ||||||
| Valero Energy Corp. 4.750%, 06/15/2013 | 250,000 | 256,070 | ||||||
| XTO Energy, Inc. 4.900%, 02/01/2014 | 100,000 | 107,563 | ||||||
| 1,088,907 | ||||||||
TOTAL ENERGY | 1,240,194 | |||||||
(continued)
27
Ohio National Fund, Inc.
Omni Portfolio (Continued)
Omni Portfolio (Continued)
| Schedule of Investments | December 31, 2009 |
| Face | ||||||||
| Corporate Bonds – 26.9% | Amount | Value | ||||||
FINANCIALS – 7.8% | ||||||||
Capital Markets – 1.8% | ||||||||
| Goldman Sachs Group, Inc. / The 5.150%, 01/15/2014 | $ | 100,000 | $ | 105,882 | ||||
| Jefferies Group, Inc. 5.875%, 06/08/2014 | 150,000 | 154,189 | ||||||
| Mellon Funding Corp. 5.500%, 11/15/2018 | 250,000 | 257,041 | ||||||
| Morgan Stanley 4.750%, 04/01/2014 | 250,000 | 251,676 | ||||||
| 768,788 | ||||||||
Commercial Banks – 1.4% | ||||||||
| BB&T Corp. 5.200%, 12/23/2015 | 100,000 | 103,995 | ||||||
| Deutsche Bank Capital Funding Trust VII 5.628%, Perpetual (b) (c) | 250,000 | 183,750 | ||||||
| KeyBank NA 5.700%, 11/01/2017 | 150,000 | 125,150 | ||||||
| PNC Funding Corp. 5.250%, 11/15/2015 | 150,000 | 154,448 | ||||||
| 567,343 | ||||||||
Consumer Finance – 0.6% | ||||||||
| Capital One Bank USA NA 5.125%, 02/15/2014 | 100,000 | 104,127 | ||||||
| Discover Financial Services 6.450%, 06/12/2017 | 150,000 | 140,592 | ||||||
| 244,719 | ||||||||
Diversified Financial Services – 2.0% | ||||||||
| Bank of America Corp. 5.750%, 08/15/2016 | 150,000 | 151,184 | ||||||
| Citigroup, Inc. 5.850%, 08/02/2016 | 150,000 | 147,059 | ||||||
| General Electric Capital Corp. 5.000%, 01/08/2016 | 250,000 | 253,179 | ||||||
| JPMorgan Chase & Co. 5.150%, 10/01/2015 | 250,000 | 259,207 | ||||||
| 810,629 | ||||||||
Insurance – 1.1% | ||||||||
| Assurant, Inc. 5.625%, 02/15/2014 | 100,000 | 102,625 | ||||||
| Liberty Mutual Group, Inc. 5.750%, 03/15/2014 (b) | 250,000 | 246,645 | ||||||
| MetLife, Inc. 5.375%, 12/15/2012 | 100,000 | 106,351 | ||||||
| 455,621 | ||||||||
Real Estate Investment Trusts – 0.9% | ||||||||
| Duke Realty LP 4.625%, 05/15/2013 | 250,000 | 241,276 | ||||||
| HCP, Inc. 6.000%, 01/30/2017 | 150,000 | 141,364 | ||||||
| 382,640 | ||||||||
TOTAL FINANCIALS | 3,229,740 | |||||||
HEALTH CARE – 1.7% | ||||||||
Health Care Equipment & Supplies – 0.4% | ||||||||
| Hospira, Inc. 6.050%, 03/30/2017 | 150,000 | 157,222 | ||||||
Health Care Providers & Services – 0.7% | ||||||||
| UnitedHealth Group, Inc. 6.000%, 02/15/2018 | 150,000 | 155,190 | ||||||
| WellPoint, Inc. 5.875%, 06/15/2017 | 150,000 | 154,770 | ||||||
| 309,960 | ||||||||
Pharmaceuticals – 0.6% | ||||||||
| Abbott Laboratories 5.600%, 11/30/2017 | 150,000 | 163,162 | ||||||
| Wyeth 6.950%, 03/15/2011 | 100,000 | 106,857 | ||||||
| 270,019 | ||||||||
TOTAL HEALTH CARE | 737,201 | |||||||
INDUSTRIALS – 1.5% | ||||||||
Building Products – 0.4% | ||||||||
| Owens Corning, Inc. 6.500%, 12/01/2016 | 150,000 | 153,823 | ||||||
Commercial Services & Supplies – 0.4% | ||||||||
| Waste Management, Inc. 6.100%, 03/15/2018 | 150,000 | 159,774 | ||||||
Road & Rail – 0.7% | ||||||||
| CSX Corp. 5.600%, 05/01/2017 | 150,000 | 155,842 | ||||||
| ERAC USA Finance Co. 6.375%, 10/15/2017 (b) | 150,000 | 151,740 | ||||||
| 307,582 | ||||||||
TOTAL INDUSTRIALS | 621,179 | |||||||
INFORMATION TECHNOLOGY – 0.4% | ||||||||
IT Services – 0.4% | ||||||||
| Computer Sciences Corp. 6.500%, 03/15/2018 | 150,000 | 163,957 | ||||||
TOTAL INFORMATION TECHNOLOGY | 163,957 | |||||||
TELECOMMUNICATION SERVICES – 2.4% | ||||||||
Diversified Telecommunication Services – 1.8% | ||||||||
| AT&T Corp. 7.300%, 11/15/2011 | 100,000 | 110,155 | ||||||
| Embarq Corp. 6.738%, 06/01/2013 | 150,000 | 163,097 | ||||||
| Telecom Italia Capital SA 5.250%, 10/01/2015 | 100,000 | 104,684 | ||||||
| Telefonos de Mexico S.A.B. de C.V. 5.500%, 01/27/2015 | 100,000 | 103,594 | ||||||
| Verizon Florida LLC 6.125%, 01/15/2013 | 250,000 | 267,064 | ||||||
| 748,594 | ||||||||
(continued)
28
Ohio National Fund, Inc.
Omni Portfolio (Continued)
Omni Portfolio (Continued)
| Schedule of Investments | December 31, 2009 |
| Face | ||||||||
| Corporate Bonds – 26.9% | Amount | Value | ||||||
Wireless Telecommunication Services – 0.6% | ||||||||
| America Movil S.A.B. de C.V. 5.750%, 01/15/2015 | $ | 100,000 | $ | 105,755 | ||||
| Rogers Communications, Inc. 5.500%, 03/15/2014 | 150,000 | 160,880 | ||||||
| 266,635 | ||||||||
TOTAL TELECOMMUNICATION SERVICES | 1,015,229 | |||||||
UTILITIES – 5.5% | ||||||||
Electric Utilities – 4.2% | ||||||||
| Commonwealth Edison Co. 5.950%, 08/15/2016 | 150,000 | 160,818 | ||||||
| Duke Energy Carolinas LLC 6.050%, 04/15/2038 | 150,000 | 160,266 | ||||||
| Kansas City Power & Light Co. 5.850%, 06/15/2017 | 150,000 | 154,846 | ||||||
| Nevada Power Co. 5.950%, 03/15/2016 | 150,000 | 159,150 | ||||||
| Pennsylvania Electric Co. 6.050%, 09/01/2017 | 150,000 | 156,339 | ||||||
| Potomac Electric Power Co. 6.500%, 11/15/2037 | 150,000 | 165,162 | ||||||
| PSEG Power LLC 5.000%, 04/01/2014 | 250,000 | 258,476 | ||||||
| Southern Power Co. 4.875%, 07/15/2015 | 250,000 | 260,518 | ||||||
| Union Electric Co. 6.400%, 06/15/2017 | 150,000 | 161,771 | ||||||
| Virginia Electric & Power Co. 4.750%, 03/01/2013 | 100,000 | 104,707 | ||||||
| 1,742,053 | ||||||||
Gas Utilities – 0.6% | ||||||||
| Spectra Energy Capital LLC 5.500%, 03/01/2014 | 250,000 | 263,082 | ||||||
Multi-Utilities – 0.3% | ||||||||
| Consumers Energy Co. 6.000%, 02/15/2014 | 100,000 | 110,016 | ||||||
Water Utilities – 0.4% | ||||||||
| American Water Capital Corp. 6.085%, 10/15/2017 | 150,000 | 156,978 | ||||||
TOTAL UTILITIES | 2,272,129 | |||||||
Total Corporate Bonds (Cost $10,826,106) | $ | 11,188,621 | ||||||
| Money Market Funds – 5.3% | Shares | Value | ||||||
| Federated Prime Cash Obligations Fund | ||||||||
| Institutional Class | 113,000 | $ | 113,000 | |||||
| Fidelity Institutional Money Market Funds Money Market Portfolio – Class I | 2,084,000 | 2,084,000 | ||||||
Total Money Market Funds (Cost $2,197,000) | $ | 2,197,000 | ||||||
Total Investments – 99.5% (Cost $38,635,160) (d) | $ | 41,320,405 | ||||||
Other Assets in Excess of Liabilities – 0.5% | 196,970 | |||||||
Net Assets – 100.0% | $ | 41,517,375 | ||||||
Percentages are stated as a percent of net assets.
Footnotes:
| (a) | Non-income producing security. | |
| (b) | Security exempt from registration under Section 4 (2) of the Securities Act of 1933. These securities may be resold in transactions exempt from registration, normally to qualified buyers under Rule 144A. At December 31, 2009 the value of these securities totaled $582,135 or 1.4% of the Portfolio’s net assets. These securities were deemed liquid pursuant to procedures approved by the Board of Directors. | |
| (c) | Fixed-to-floating rate, callable, perpetual life trust preferred security. Interest rates stated are those in effect at December 31, 2009. | |
| (d) | Represents cost for financial reporting purposes, which may differ from cost basis for Federal income tax purposes. See also Note 8 of the Notes to Financial Statements. |
The accompanying notes are an integral part of these financial statements.
29
Ohio National Fund, Inc.
Omni Portfolio
Omni Portfolio
Statement of Assets and Liabilities
December 31, 2009
| Assets: | ||||
| Investments in securities, at value (Cost $38,635,160) | $ | 41,320,405 | ||
| Cash | 161 | |||
| Receivable for securities sold | 1,065,772 | |||
| Receivable for fund shares sold | 33,198 | |||
| Dividends and accrued interest receivable | 191,333 | |||
| Prepaid expenses and other assets | 665 | |||
| Total assets | 42,611,534 | |||
| Liabilities: | ||||
| Payable for securities purchased | 1,020,039 | |||
| Payable for fund shares redeemed | 31,284 | |||
| Payable for investment management services | 21,195 | |||
| Payable for compliance services | 1,677 | |||
| Accrued custody expense | 530 | |||
| Accrued professional fees | 11,140 | |||
| Accrued accounting fees | 5,492 | |||
| Accrued printing and filing fees | 2,802 | |||
| Total liabilities | 1,094,159 | |||
| Net assets | $ | 41,517,375 | ||
| Net assets consist of: | ||||
| Par value, $1 per share | $ | 2,879,683 | ||
| Paid-in capital in excess of par value | 46,694,782 | |||
| Accumulated net realized loss on investments | (10,838,642 | ) | ||
| Net unrealized appreciation on investments | 2,685,245 | |||
| Undistributed net investment income | 96,307 | |||
| Net assets | $ | 41,517,375 | ||
| Shares outstanding | 2,879,683 | |||
| Authorized Fund shares allocated to Portfolio | 5,000,000 | |||
| Net asset value per share | $ | 14.42 | ||
Statement of Operations
For the Year Ended December 31, 2009
| Investment income: | ||||
| Interest | $ | 707,226 | ||
| Dividends (net of withholding tax of $56) | 408,542 | |||
| Total investment income | 1,115,768 | |||
| Expenses: | ||||
| Management fees | 225,810 | |||
| Custodian fees | 8,545 | |||
| Directors’ fees | 4,074 | |||
| Professional fees | 13,870 | |||
| Accounting fees | 30,864 | |||
| Printing and filing fees | 6,089 | |||
| Compliance expense | 6,376 | |||
| Other | 1,008 | |||
| Total expenses | 296,636 | |||
| Net investment income | 819,132 | |||
| Realized/unrealized gain (loss) on investments and foreign currency related transactions: | ||||
| Net realized gain (loss) on: | ||||
| Investments | (2,391,949 | ) | ||
| Foreign currency related transactions | 12 | |||
| Change in unrealized appreciation/depreciation on investments | 12,249,119 | |||
| Net realized/unrealized gain (loss) on investments and foreign currency related transactions | 9,857,182 | |||
| Change in net assets from operations | $ | 10,676,314 | ||
The accompanying notes are an integral part of these financial statements.
30
Ohio National Fund, Inc.
Omni Portfolio
Omni Portfolio
Statements of Changes in Net Assets
| Years Ended December 31, | ||||||||
| 2009 | 2008 | |||||||
Increase (Decrease) in Net Assets: | ||||||||
| Operations: | ||||||||
| Net investment income | $ | 819,132 | $ | 1,212,367 | ||||
| Net realized gain (loss) on investments and foreign currency related transactions | (2,391,937 | ) | (8,024,274 | ) | ||||
| Change in unrealized appreciation/depreciation on investments | 12,249,119 | (10,555,311 | ) | |||||
| Change in net assets from operations | 10,676,314 | (17,367,218 | ) | |||||
| Distributions to shareholders: | ||||||||
| Distributions from net investment income | (722,837 | ) | (1,075,689 | ) | ||||
| Capital transactions: | ||||||||
| Received from shares sold | 3,952,680 | 6,110,882 | ||||||
| Received from dividends reinvested | 722,837 | 1,075,689 | ||||||
| Paid for shares redeemed | (8,026,435 | ) | (15,662,751 | ) | ||||
| Change in net assets from capital transactions | (3,350,918 | ) | (8,476,180 | ) | ||||
| Change in net assets | 6,602,559 | (26,919,087 | ) | |||||
Net Assets: | ||||||||
| Beginning of year | 34,914,816 | 61,833,903 | ||||||
| End of year | $ | 41,517,375 | $ | 34,914,816 | ||||
| Undistributed net investment income | $ | 96,307 | $ | 136,684 | ||||
Financial Highlights
| Years Ended December 31, | ||||||||||||||||||||
| 2009 | 2008 | 2007 | 2006 | 2005 | ||||||||||||||||
Selected Per-Share Data: | ||||||||||||||||||||
| Net asset value, beginning of year | $ | 11.02 | $ | 16.60 | $ | 15.79 | $ | 14.11 | $ | 13.05 | ||||||||||
| Operations: | ||||||||||||||||||||
| Net investment income | 0.29 | 0.40 | 0.34 | 0.27 | 0.25 | |||||||||||||||
| Net realized and unrealized gain (loss) on investments | ||||||||||||||||||||
| and foreign currency related transactions | 3.36 | (5.63 | ) | 0.76 | 1.61 | 0.99 | ||||||||||||||
| Total from operations | 3.65 | (5.23 | ) | 1.10 | 1.88 | 1.24 | ||||||||||||||
| Distributions: | ||||||||||||||||||||
| Distributions from net investment income | (0.25 | ) | (0.35 | ) | (0.29 | ) | (0.20 | ) | (0.18 | ) | ||||||||||
| Net asset value, end of year | $ | 14.42 | $ | 11.02 | $ | 16.60 | $ | 15.79 | $ | 14.11 | ||||||||||
Total return | 33.15 | % | –31.46 | % | 6.99 | % | 13.32 | % | 9.49 | % | ||||||||||
Ratios and supplemental data: | ||||||||||||||||||||
| Net assets at end of year (millions) | $ | 41.5 | $ | 34.9 | $ | 61.8 | $ | 67.1 | $ | 66.2 | ||||||||||
| Ratios to average net assets: | ||||||||||||||||||||
| Expenses | 0.79 | % | 0.74 | % | 0.71 | % | 0.71 | % | 0.71 | % | ||||||||||
| Net investment income | 2.18 | % | 2.43 | % | 1.85 | % | 1.69 | % | 1.66 | % | ||||||||||
| Portfolio turnover rate | 157 | % | 128 | % | 143 | % | 178 | % | 180 | % | ||||||||||
The accompanying notes are an integral part of these financial statements.
31
Ohio National Fund, Inc.
International Portfolio
International Portfolio
Objective/Strategy
The International Portfolio seeks total return on assets by investing primarily in equity securities of foreign companies.
Performance as of December 31, 2009
Average Annual Total Returns: | ||||
| One year | 38.23% | |||
| Five years | 1.25% | |||
| Ten years | -3.60% |
Past performance does not guarantee future results. The performance data quoted represents past performance and current returns may be lower or higher. Total return figures include change in share price and reinvestment of dividends and capital gains. The investment return and principal value will fluctuate so that an investor’s shares, when redeemed, may be worth more or less than the original cost. To obtain performance information up to the most recent month end, call toll-free 1-877-781-6392.
The Portfolio is not open to direct retail investment. Beneficial interest in shares is obtained solely by purchase of variable life insurance policies and variable annuity contracts. Actual performance results for variable annuity and variable universal life contracts will be lower due to contract charges. Consult your contract for applicable charges.
Comments
For the year ended December 31, 2009, the International Portfolio returned 38.23% versus 41.45% for the current benchmark, the MSCI All Country World ex-USA Index (Net-USD).
In response to rapidly deteriorating macroeconomic fundamentals, governments across the globe responded with unprecedented fiscal stimulus programs. All told, over $2 trillion in spending was announced over the past year. After the U.S., China has announced the second largest stimulus package with a plan to spend at least $586 billion over a two-year period. Japan announced multiple stimulus packages over the past year totaling $261 billion and very recently supplemented that with the announcement of a planned additional $81 billion in spending. Major European economies, such as the United Kingdom, Germany, France, Spain and Italy announced plans that totaled around $372 billion. In addition to fiscal stimulus, central banks around the world have also engaged in coordinated rate cuts and quantitative easing programs.
During the year, equity markets experienced extreme volatility. After breaking through their November 2008 lows in early March 2009, global markets staged a sharp rally: based initially on marginally less negative news and a more constructive view of government fiscal and monetary policies and more recently on a nascent economic recovery and stabilizing corporate fundamentals. Unlike 2008, this market move was characterized by a divergence in market and sector performance as correlations retreated from all time highs and investors refocused on fundamentals. International markets, particularly emerging markets, out-performed domestic markets, and financials and cyclicals were among the strongest performing sectors.
The divergence in market performance reflected the divergence in economic prospects for various economies. While the global economy remained challenging, international equities benefited from more optimistic economic assessment from organizations such as the International Monetary Fund and the Organization for Economic Cooperation and Development. The outlook has been particularly favorable for emerging market economies which were relatively resilient compared to developed markets and are leading the way in the global recovery. These markets have been reporting improvements in trade, industrial production and domestic consumption. As a result of the stronger outlook, and an increase in investors’ risk appetite, emerging markets strongly out-performed. For the year ended December 31, 2009, the MSCI Emerging Markets Index had a return of 78.51% compared to a return of 41.45% for the MSCI All Country World ex-USA Index and 26.25% for MSCI USA Index. Among the top emerging market performers for the year were Brazil 128.06%, Korea 71.35%, Turkey 97.51% and China 62.29%. Even though developed markets under-performed their emerging markets counterparts, they still posted strong returns. One of the major exceptions was Japan which posted a very weak 6.25% return for the year as concerns persisted as to the sustainability of a recovery in that economy.
From a policy perspective, many investors were focused on the prospect of central bank tightening. Three central banks we monitor raised rates toward the end of the year: Norway, Australia and Israel. The U.S. Federal Reserve continued to strike an optimistic tone on the economy while assuring markets that accommodative policies would continue.
The key contributor to the Portfolio’s performance was the strong country allocation. The strategy’s country ranking process identified leading countries that provided solid returns relative to world benchmarks over the year. The Portfolio was rewarded for maintaining an over-weight in the Norwegian economy. This smaller, faster growing continental European developed economy was the most positive contributor to the Portfolio during the year.(1)
The Portfolio correctly over-weighted South Korea and successfully pared the Portfolio’s exposure to the under-performing Japanese market. The reduction in Japanese holdings was rewarded as Japanese equities were the worst performing country stock market of the benchmark’s 15 largest economies. In addition to South Korea in Asia, several key emerging economies contributed positively to Portfolio performance including Brazil in Latin America and Turkey in Central Europe. These economies had attractive valuations given the accelerating corporate earnings growth as the global economy began to recover from the worldwide recession. Throughout the year, the Portfolio’s country allocation took advantage of favorable investment opportunities among emerging markets. As such, the Portfolio’s strong over-weight positions in select developing markets were significant drivers of performance.(1)
The Portfolio’s weakest performing country on a relative basis was Poland, which negatively contributed to Portfolio performance. At the beginning of the year the Portfolio held an over-weight position in Poland. Eastern European economies deteriorated swiftly in the first quarter. This heightened risk aversion saw capital flee Eastern Europe driving both the Polish stock market and Polish Zloty currency. Poland was forced to postpone its plan to adopt the Euro until at least 2014, which negatively impacted the Portfolio’s stock holdings in the region. Our holdings
(continued)
32
Ohio National Fund, Inc.
International Portfolio (Continued)
International Portfolio (Continued)
in the Czech Republic also negatively impacted our Portfolio’s relative performance.(1)
Certain currency pairs reached the highest level of volatility in more than a decade, with some currency movements in conflict with traditional fundamental factors. For example, the United Kingdom had strengthening currency while experiencing rapidly deteriorating public finances, which led Standard & Poor’s to downgrade its U.K. triple-A investment grade from stable to negative. A large part of our under-performance during the year was attributable to our under-weight of the U.K. and other countries such as Canada and Australia that had appreciating currencies even when the assets of those countries were relatively unattractive long-term investments.
Leading indicators suggest that economic activity in 2010 and 2011 is accelerating in all continents throughout the globe. With this strong growth, focus will return to traditional valuations, cash flows and quality — we find several countries with reasonable valuations, strong cash flows and quality firms. We remain positive on the prospects for several developing countries and our country allocation process continues to rate select markets highly. Our over-weight is spread amongst several top quality developing countries and diversified across the regions. The Portfolio narrowed its relative under-weight in Europe, increasing its weight in the region primarily through increasing our weight in Italy and other non-core European countries. We still remain cautious on the European region, but have identified Italian shares to be a bargain at these pre-recovery levels. We proceed with tempered optimism as we monitor government exit strategies. While we expect governments to begin to normalize policies, we believe actual monetary tightening is still a long way off.(1)
| (1) | The Portfolio’s composition is subject to change. Holdings and weightings are as of December 31, 2009. |
Change in Value of $10,000 Investment
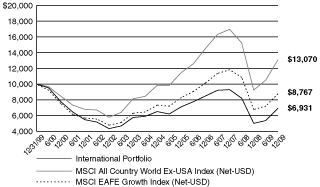
Hypothetical illustration based on past performance. Future performance will vary. The Portfolio’s returns reflect reinvested dividends. The Portfolio’s holdings may differ significantly from the securities in the index. The index is unmanaged and therefore does not reflect the cost of portfolio management and accounting.
The MSCI All Country World Ex-USA Index (Net-USD) is a free float-adjusted market capitalization weighted index that is designed to measure the equity market performance of the developed and emerging markets. As of June 2009, the MSCI All Country World Index consisted of 23 developed and 22 emerging market country indices.
The MSCI EAFE Growth Index (Net-USD) is a subset of securities derived from the MSCI EAFE Index, which is generally representative of performance of stock markets in that region, using a two dimensional framework for style segmentation. The index presented herein includes the effect of minimum reinvestment of dividends.
We are now using the MSCI All Country World Ex-USA Index as the Portfolio’s primary benchmark because we believe the Portfolio’s investments more closely resemble the securities represented in that index than those represented in the MSCI EAFE Growth Index.
(continued)
33
Ohio National Fund, Inc.
International Portfolio (Continued)
International Portfolio (Continued)
Portfolio Composition as of December 31, 2009 (1)
| % of Net Assets | |||
Common Stocks (3) | 94.4 | ||
Preference Shares (Brazil) (3) | 0.5 | ||
Exchange Traded Funds (3) | 4.0 | ||
| Money Market Funds and Other Net Assets | 1.1 | ||
| 100.0 | |||
Top 10 Portfolio Holdings as of December 31, 2009 (1) (2)
| % of Net Assets | |||||||
| 1. | iShares Asia Trust – iShares FTSE/Xinhua A50 China Tracker | 2.4 | |||||
| 2. | Samsung Electronics Co. Ltd. | 2.4 | |||||
| 3. | Statoil ASA | 2.3 | |||||
| 4. | Nestle SA | 1.9 | |||||
| 5. | Petroleo Brasileiro SA – ADR Class A | 1.8 | |||||
| 6. | Novo Nordisk A/S | 1.8 | |||||
| 7. | UniCredit SpA | 1.7 | |||||
| 8. | HSBC Holdings PLC | 1.7 | |||||
| 9. | America Movil SAB de CV – ADR | 1.6 | |||||
| 10. | Yara International ASA | 1.4 | |||||
| (1) | Composition of Portfolio subject to change. | |
| (2) | Short-term investments have been excluded from the list of Top 10 Portfolio holdings. | |
| (3) | Top 10 country weightings (combined): |
| % of Net Assets | |||
| South Korea | 10.7 | ||
| Denmark | 10.2 | ||
| Italy | 9.9 | ||
| Norway | 9.1 | ||
| Switzerland | 9.0 | ||
| Brazil | 8.7 | ||
| China | 8.1 | ||
| Mexico | 6.3 | ||
| Japan | 5.8 | ||
| Chile | 5.3 | ||
34
Ohio National Fund, Inc.
International Portfolio
International Portfolio
| Schedule of Investments | December 31, 2009 |
| Common Stocks – 94.4% | Shares | Value | ||||||
South Korea – 10.7% | ||||||||
| Busan Bank (a) (b) | 17,800 | $ | 212,380 | |||||
| Daewoo Shipbuilding & Marine Engineering Co. Ltd. (b) | 14,500 | 217,356 | ||||||
| GS Engineering & Construction Corp. (b) | 2,600 | 241,069 | ||||||
| Hana Financial Group, Inc. (b) | 6,700 | �� | 189,371 | |||||
| Hanjin Shipping Co. Ltd. (a) (c) | 11,318 | 201,190 | ||||||
| Hanjin Shipping Holdings Co. Ltd. (b) | 2,182 | 25,541 | ||||||
| Hanwha Chemical Corp. (b) | 29,000 | 334,845 | ||||||
| Hanwha Corp. (b) | 8,800 | 360,384 | ||||||
| Hyundai Heavy Industries Co. Ltd. (b) | 2,500 | 371,211 | ||||||
| Hyundai Motor Co. (a) (b) | 11,400 | 1,180,033 | ||||||
| Hyundai Steel Co. (b) | 5,800 | 430,720 | ||||||
| Industrial Bank of Korea (a) (b) | 16,000 | 191,698 | ||||||
| KB Financial Group, Inc. (a) (b) | 21,500 | 1,094,785 | ||||||
| Korea Electric Power Corp. (a) (b) | 11,600 | 338,597 | ||||||
| KT Corp. – ADR | 56,800 | 955,376 | ||||||
| LG Chem Ltd. (b) | 1,500 | 293,996 | ||||||
| LG Corp. (b) | 5,500 | 343,544 | ||||||
| LG Display Co. Ltd. (b) | 15,600 | 527,442 | ||||||
| LG Electronics, Inc. (b) | 15,600 | 1,626,272 | ||||||
| LS Corp. (b) | 2,600 | 258,627 | ||||||
| POSCO – ADR | 17,500 | 2,294,250 | ||||||
| Samsung Electro-Mechanics Co. Ltd. (b) | 16,100 | 1,480,662 | ||||||
| Samsung Electronics Co. Ltd. (b) | 7,400 | 5,074,402 | ||||||
| Samsung Heavy Industries Co. Ltd. (b) | 14,700 | 304,780 | ||||||
| Samsung SDI Co. Ltd. (b) | 12,000 | 1,528,007 | ||||||
| Shinhan Financial Group Co. Ltd. (a) (b) | 16,800 | 621,669 | ||||||
| SK Energy Co. Ltd. (b) | 5,700 | 572,673 | ||||||
| SK Holdings Co. Ltd. (b) | 4,200 | 320,500 | ||||||
| Woongjin Coway Co. Ltd. (b) | 19,800 | 654,795 | ||||||
| Woori Finance Holdings Co. Ltd. (a) (b) | 17,900 | 211,858 | ||||||
| 22,458,033 | ||||||||
Denmark – 10.2% | ||||||||
| A P Moller – Maersk A/S (b) | 262 | 1,840,784 | ||||||
| Bang & Olufsen A/S (a) (b) | 40,300 | 583,519 | ||||||
| Carlsberg A/S (b) | 21,950 | 1,615,842 | ||||||
| Coloplast A/S (b) | 6,700 | 605,897 | ||||||
| D/S Norden (b) | 12,200 | 491,120 | ||||||
| Danisco A/S (b) | 31,000 | 2,068,301 | ||||||
| Danske Bank A/S (a) (b) | 75,200 | 1,688,195 | ||||||
| DSV A/S (a) (b) | 78,525 | 1,423,097 | ||||||
| East Asiatic Co. Ltd A/S (b) | 9,100 | 317,494 | ||||||
| FLSmidth & Co. A/S (b) | 4,000 | 280,223 | ||||||
| H Lundbeck A/S (b) | 46,700 | 843,737 | ||||||
| NKT Holding A/S (a) (b) | 15,800 | 879,688 | ||||||
| Novo Nordisk A/S (b) | 58,825 | 3,755,489 | ||||||
| Novozymes A/S (b) | 5,700 | 593,015 | ||||||
| Sydbank A/S (a) (b) | 36,500 | 929,527 | ||||||
| Topdanmark A/S (a) (b) | 2,800 | 377,086 | ||||||
| Torm A/S (b) | 62,800 | 612,027 | ||||||
| TrygVesta AS (b) | 5,700 | 374,687 | ||||||
| Vestas Wind Systems A/S (a) (b) | 27,600 | 1,680,365 | ||||||
| William Demant Holding (a) (b) | 4,900 | 368,291 | ||||||
| 21,328,384 | ||||||||
Italy – 9.9% | ||||||||
| A2A SpA (b) | 525,000 | 1,101,454 | ||||||
| Ansaldo STS SpA (b) | 20,700 | 394,505 | ||||||
| Assicurazioni Generali SpA (b) | 13,200 | 355,612 | ||||||
| Benetton Group SpA (b) | 33,100 | 295,755 | ||||||
| Credito Emiliano SpA (a) (b) | 88,800 | 683,905 | ||||||
| Davide Campari – Milano SpA (b) | 69,500 | 726,063 | ||||||
| DiaSorin SpA (b) | 14,800 | 525,985 | ||||||
| Enel SpA (b) | 57,400 | 332,311 | ||||||
| ENI SpA (b) | 69,600 | 1,772,420 | ||||||
| Fiat SpA (a) (b) | 60,800 | 889,745 | ||||||
| Finmeccanica SpA (b) | 20,000 | 320,218 | ||||||
| Intesa Sanpaolo SpA (a) (b) | 459,000 | 2,065,511 | ||||||
| Italcementi SpA (b) | 14,800 | 202,444 | ||||||
| Maire Tecnimont SpA (b) | 131,300 | 464,643 | ||||||
| Mediaset SpA (b) | 292,400 | 2,404,097 | ||||||
| Mediobanca SpA (b) | 69,170 | 821,717 | ||||||
| Mediolanum SpA (b) | 35,200 | 219,884 | ||||||
| Parmalat SpA (b) | 132,400 | 370,153 | ||||||
| Piaggio & C SpA (b) | 451,500 | 1,293,351 | ||||||
| Prysmian SpA (b) | 40,100 | 699,955 | ||||||
| Saras SpA (b) | 145,000 | 455,293 | ||||||
| Sorin SpA (a) (b) | 105,000 | 200,020 | ||||||
| Telecom Italia SpA (b) | 318,500 | 496,843 | ||||||
| UniCredit SpA (a) (b) | 1,098,200 | 3,672,119 | ||||||
| 20,764,003 | ||||||||
Norway – 9.1% | ||||||||
| Aker Solutions ASA (b) | 32,000 | 415,849 | ||||||
| DnB NOR ASA (a) (b) | 191,644 | 2,068,936 | ||||||
| Fred Olsen Energy ASA (b) | 43,900 | 1,681,258 | ||||||
| Norsk Hydro ASA (a) (b) | 206,600 | 1,735,527 | ||||||
| Orkla ASA (b) | 65,600 | 643,590 | ||||||
| Statoil ASA (b) | 192,900 | 4,810,853 | ||||||
| Tandberg ASA (b) | 18,000 | 511,928 | ||||||
| Telenor ASA (a) (b) | 201,700 | 2,817,688 | ||||||
| TGS Nopec Geophysical Co. ASA (a) (b) | 77,600 | 1,401,609 | ||||||
| Yara International ASA (b) | 67,000 | 3,034,776 | ||||||
| 19,122,014 | ||||||||
Switzerland – 9.0% | ||||||||
| ABB Ltd. (a) (b) | 58,600 | 1,129,183 | ||||||
| Actelion Ltd. (a) (b) | 7,300 | 389,896 | ||||||
| Baloise-Holding AG (b) | 3,700 | 307,201 | ||||||
| Credit Suisse Group AG (b) | 33,400 | 1,654,682 | ||||||
| Julius Baer Group Ltd. (c) | 16,900 | 594,347 | ||||||
| Kuehne + Nagel International AG (b) | 8,400 | 816,725 | ||||||
| Nestle SA (b) | 83,000 | 4,028,291 | ||||||
| Nobel Biocare Holding AG (b) | 16,400 | 549,648 | ||||||
| Novartis AG (b) | 52,500 | 2,866,985 | ||||||
| Roche Holding AG – Genusscheine (b) | 16,300 | 2,787,510 | ||||||
| Sonova Holding AG (b) | 2,300 | 278,645 | ||||||
| Swatch Group AG / The (b) | 1,600 | 404,993 | ||||||
| Syngenta AG (b) | 3,500 | 988,428 | ||||||
| UBS AG (a) | 86,400 | 1,340,064 | ||||||
| Zurich Financial Services AG (b) | 3,500 | 765,183 | ||||||
| 18,901,781 | ||||||||
(continued)
35
Ohio National Fund, Inc.
International Portfolio (Continued)
International Portfolio (Continued)
| Schedule of Investments | December 31, 2009 |
| Common Stocks – 94.4% | Shares | Value | ||||||
Brazil – 8.2% | ||||||||
| Banco Bradesco SA – ADR | 48,800 | $ | 1,067,256 | |||||
| Banco do Brasil SA | 46,600 | 792,280 | ||||||
| Banco Santander Brasil SA – ADR | 24,000 | 334,560 | ||||||
| Cia de Bebidas das Americas – ADR | 12,500 | 1,263,625 | ||||||
| Cia de Saneamento Basico do Estado de Sao Paulo – ADR | 19,400 | 758,928 | ||||||
| Cia Energetica de Minas Gerais – ADR | 59,500 | 1,074,570 | ||||||
| Cia Siderurgica Nacional SA – ADR | 38,700 | 1,235,691 | ||||||
| Fibria Celulose SA – ADR | 26,535 | 606,059 | ||||||
| Itau Unibanco Banco Holding SA – ADR | 39,708 | 906,931 | ||||||
| Petroleo Brasileiro SA – ADR | 8,200 | 390,976 | ||||||
| Petroleo Brasileiro SA – ADR Class A | 90,100 | 3,819,339 | ||||||
| Souza Cruz SA | 10,400 | 347,304 | ||||||
| Tele Norte Leste Participacoes SA – ADR | 19,800 | 424,116 | ||||||
| Vale SA – ADR | 40,000 | 1,161,200 | ||||||
| Vale SA – ADR Class P | 119,900 | 2,975,918 | ||||||
| 17,158,753 | ||||||||
Mexico – 6.3% | ||||||||
| Alfa SAB de CV | 45,000 | 282,961 | ||||||
| America Movil SAB de CV – ADR | 70,300 | 3,302,694 | ||||||
| Cemex SAB de CV – ADR | 94,200 | 1,113,444 | ||||||
| Fomento Economico Mexicano SAB de CV – ADR | 9,600 | 459,648 | ||||||
| Grupo Aeroportuario del Sureste SAB de CV – ADR | 9,400 | 487,014 | ||||||
| Grupo Bimbo SAB de CV | 87,300 | 568,564 | ||||||
| Grupo Carso SAB de CV | 126,000 | 385,359 | ||||||
| Grupo Elektra SA de CV | 7,700 | 371,404 | ||||||
| Grupo Financiero Banorte SAB de CV | 259,000 | 934,079 | ||||||
| Grupo Mexico SAB de CV | 440,000 | 1,004,311 | ||||||
| Grupo Modelo SAB de CV (a) | 86,883 | 482,167 | ||||||
| Grupo Televisa SA – ADR | 54,000 | 1,121,040 | ||||||
| Industrias Penoles SAB de CV | 21,900 | 470,410 | ||||||
| Telefonos de Mexico SAB de CV – ADR | 34,200 | 567,036 | ||||||
| Wal-Mart de Mexico SAB de CV | 390,200 | 1,738,928 | ||||||
| 13,289,059 | ||||||||
Japan – 5.8% | ||||||||
| Ajinomoto Co., Inc. (b) | 73,000 | 687,073 | ||||||
| Asahi Glass Co. Ltd. (b) | 44,000 | 418,531 | ||||||
| Canon, Inc. (b) | 19,100 | 812,485 | ||||||
| Elpida Memory, Inc. (a) (b) | 34,000 | 554,131 | ||||||
| FUJIFILM Holdings Corp. (b) | 23,400 | 706,696 | ||||||
| Hokuhoku Financial Group, Inc. (b) | 168,000 | 343,497 | ||||||
| Honda Motor Co. Ltd. (b) | 20,000 | 678,574 | ||||||
| HOYA Corp. (b) | 25,600 | 683,073 | ||||||
| ITOCHU Corp. (b) | 59,000 | 435,820 | ||||||
| KDDI Corp. (b) | 105 | 556,155 | ||||||
| Komatsu Ltd. (b) | 30,900 | 646,866 | ||||||
| Kubota Corp. (b) | 61,000 | 559,726 | ||||||
| Marubeni Corp. (b) | 78,000 | 430,870 | ||||||
| Mitsubishi UFJ Financial Group, Inc. (b) | 73,000 | 359,582 | ||||||
| Nippon Telegraph & Telephone Corp. (b) | 20,000 | 790,061 | ||||||
| Nishi-Nippon City Bank Ltd. / The (b) | 154,000 | 377,095 | ||||||
| NTT DoCoMo, Inc. (b) | 287 | 400,505 | ||||||
| Sharp Corp. (b) | 74,000 | 934,494 | ||||||
| Shionogi & Co. Ltd. (b) | 28,000 | 607,078 | ||||||
| Sumitomo Corp. (b) | 40,000 | 407,310 | ||||||
| Toyota Motor Corp. (b) | 17,400 | 733,601 | ||||||
| 12,123,223 | ||||||||
China – 5.7% | ||||||||
| Bank of China Ltd. (b) | 1,922,400 | 1,033,081 | ||||||
| China Citic Bank Corp. Ltd. (b) | 977,900 | 827,758 | ||||||
| China Construction Bank Corp. (b) | 1,070,000 | 913,936 | ||||||
| China Life Insurance Co. Ltd. (b) | 302,000 | 1,477,769 | ||||||
| China Oilfield Services Ltd. (b) | 288,000 | 341,588 | ||||||
| China Shenhua Energy Co. Ltd. (b) | 75,000 | 364,073 | ||||||
| Dongfeng Motor Group Co. Ltd. (b) | 374,000 | 534,059 | ||||||
| Industrial & Commercial Bank of China (b) | 860,000 | 708,265 | ||||||
| Jiangsu Expressway Co. Ltd. (b) | 396,000 | 352,035 | ||||||
| Jiangxi Copper Co. Ltd. (b) | 385,000 | 900,383 | ||||||
| PetroChina Co. Ltd. (b) | 911,300 | 1,083,399 | ||||||
| Ping An Insurance Group Co. of China Ltd. (b) | 69,000 | 599,966 | ||||||
| Shandong Weigao Group Medical Polymer Co. Ltd. (b) | 56,000 | 186,632 | ||||||
| Tsingtao Brewery Co. Ltd. (b) | 153,200 | 847,420 | ||||||
| Weiqiao Textile Co. (b) | 285,000 | 193,769 | ||||||
| Yanzhou Coal Mining Co. Ltd. (b) | 260,000 | 568,652 | ||||||
| Zhejiang Expressway Co. Ltd. (b) | 494,000 | 455,179 | ||||||
| Zijin Mining Group Co. Ltd. (b) | 636,000 | 602,851 | ||||||
| 11,990,815 | ||||||||
Chile – 4.1% | ||||||||
| Banco Santander Chile – ADR | 32,800 | 2,124,784 | ||||||
| CAP SA | 15,200 | 447,808 | ||||||
| Centros Comerciales Sudamericanos SA | 215,000 | 727,471 | ||||||
| Colbun SA | 600,000 | 153,119 | ||||||
| Empresa Nacional de Electricidad SA – ADR | 16,150 | 811,860 | ||||||
| Empresas CMPC SA | 14,000 | 557,296 | ||||||
| Empresas COPEC SA | 60,232 | 900,898 | ||||||
| Enersis SA – ADR | 53,900 | 1,232,154 | ||||||
| Lan Airlines SA | 25,000 | 426,643 | ||||||
| SACI Falabella | 35,000 | 206,572 | ||||||
| Sociedad Quimica y Minera de Chile SA – ADR Series B | 24,000 | 901,680 | ||||||
| Vina Concha y Toro SA | 75,000 | 166,273 | ||||||
| 8,656,558 | ||||||||
Hong Kong – 3.2% | ||||||||
| Beijing Enterprises Holdings Ltd. (b) | 95,000 | 688,062 | ||||||
| China Mobile Ltd. (b) | 88,000 | 818,797 | ||||||
| China Resources Enterprise Ltd. (b) | 118,000 | 428,680 | ||||||
| CNOOC Ltd. (b) | 846,800 | 1,319,265 | ||||||
| Hang Lung Properties Ltd. (b) | 91,000 | 356,752 | ||||||
| Henderson Land Development Co. Ltd. (b) | 37,000 | 276,491 | ||||||
| Hong Kong & China Gas Co. Ltd. (b) | 86,000 | 215,701 | ||||||
| Hong Kong Exchanges & Clearing Ltd. (b) | 48,500 | 862,931 | ||||||
| Sinotruk Hong Kong Ltd. (b) | 85,000 | 98,830 | ||||||
(continued)
36
Ohio National Fund, Inc.
International Portfolio (Continued)
International Portfolio (Continued)
| Schedule of Investments | December 31, 2009 |
| Common Stocks – 94.4% | Shares | Value | ||||||
Hong Kong (continued) | ||||||||
| Sun Hung Kai Properties Ltd. (b) | 67,000 | $ | 996,231 | |||||
| Swire Pacific Ltd. (b) | 56,000 | 677,229 | ||||||
| 6,738,969 | ||||||||
Austria – 2.8% | ||||||||
| Erste Group Bank AG (b) | 41,643 | 1,547,410 | ||||||
| Mayr Melnhof Karton AG (b) | 2,700 | 277,668 | ||||||
| OMV AG (b) | 28,700 | 1,259,247 | ||||||
| Raiffeisen International Bank Holding AG (b) | 12,200 | 681,567 | ||||||
| Telekom Austria AG (b) | 34,100 | 486,768 | ||||||
| Verbund – Oesterreichische Elektrizitaetswirtschafts AG (b) | 10,500 | 445,223 | ||||||
| Vienna Insurance Group (b) | 25,200 | 1,293,493 | ||||||
| 5,991,376 | ||||||||
Cayman Islands – 2.5% | ||||||||
| Agile Property Holdings Ltd. (b) | 340,000 | 493,546 | ||||||
| Alibaba.com Ltd. (b) | 230,500 | 531,397 | ||||||
| Belle International Holdings Ltd. (b) | 475,000 | 550,274 | ||||||
| Hengan International Group Co. Ltd. (b) | 117,000 | 866,297 | ||||||
| Kingboard Chemical Holdings Ltd. (b) | 50,000 | 196,995 | ||||||
| Li Ning Co. Ltd. (b) | 178,000 | 674,943 | ||||||
| Subsea 7, Inc. (a) (b) | 26,000 | 430,518 | ||||||
| Tencent Holdings Ltd. (b) | 55,000 | 1,189,524 | ||||||
| Tingyi Cayman Islands Holding Corp. (b) | 120,000 | 296,940 | ||||||
| 5,230,434 | ||||||||
Czech Republic – 2.3% | ||||||||
| CEZ AS (b) | 33,500 | 1,572,936 | ||||||
| Komercni Banka AS (b) | 9,600 | 2,057,069 | ||||||
| Telefonica O2 Czech Republic AS (b) | 53,600 | 1,222,942 | ||||||
| 4,852,947 | ||||||||
United Kingdom – 1.8% | ||||||||
| HSBC Holdings PLC (b) | 304,700 | 3,465,944 | ||||||
| Standard Chartered PLC (b) | 12,000 | 297,863 | ||||||
| 3,763,807 | ||||||||
Bermuda – 1.7% | ||||||||
| Central European Media Enterprises Ltd. (a) (b) | 40,000 | 971,970 | ||||||
| Esprit Holdings Ltd. (b) | 42,627 | 282,816 | ||||||
| Frontline Ltd. (b) | 36,900 | 1,044,000 | ||||||
| Golden Ocean Group Ltd. (a) (b) | 585,600 | 1,061,288 | ||||||
| Yue Yuen Industrial Holdings Ltd. (b) | 102,000 | 295,315 | ||||||
| 3,655,389 | ||||||||
Luxembourg – 0.9% | ||||||||
| Acergy SA (b) | 114,900 | 1,809,970 | ||||||
United States – 0.2% | ||||||||
| Synthes, Inc. (b) | 3,300 | 432,593 | ||||||
Taiwan – 0.0% | ||||||||
| Taiwan Semiconductor Manufacturing Co. Ltd. (b) | 1 | 2 | ||||||
Total Common Stocks (Cost $153,665,525) | $ | 198,268,110 | ||||||
| Preference Shares (Brazil) – 0.5% | Shares | Value | ||||||
Brazil – 0.5% | ||||||||
| Fertilizantes Fosfatados SA (a) | 26,400 | $ | 249,064 | |||||
| Itau Unibanco Banco Holding SA | 36,620 | 813,485 | ||||||
Total Preference Shares (Brazil) (Cost $755,276) | $ | 1,062,549 | ||||||
| Exchange Traded Funds – 4.0% | Shares | Value | ||||||
China – 2.4% | ||||||||
| iShares Asia Trust – iShares FTSE/Xinhua A50 China Tracker (c) | 2,639,600 | $ | 5,079,427 | |||||
Chile – 1.2% | ||||||||
| iShares MSCI Chile Investable Market Index Fund | 45,600 | 2,498,424 | ||||||
United States – 0.4% | ||||||||
| iShares MSCI EAFE Index Fund | 11,174 | 617,699 | ||||||
| iShares MSCI Emerging Markets Index Fund | 5,081 | 210,862 | ||||||
| 828,561 | ||||||||
Total Exchange Traded Funds (Cost $6,495,249) | $ | 8,406,412 | ||||||
| Rights – 0.0% | Quantity | Value | ||||||
Australia – 0.0% | ||||||||
| Woodside Petroleum Ltd. (c) | 533 | $ | 2,322 | |||||
Total Rights (Cost $1,693) | $ | 2,322 | ||||||
| Warrants – 0.0% | Quantity | Value | ||||||
Italy – 0.0% | ||||||||
| Mediobanca SpA | ||||||||
| Expiration: March 2011, Exercise Price: $13.17 (a) (c) | 35,400 | $ | 5,496 | |||||
Total Warrants (Cost $0) | $ | 5,496 | ||||||
(continued)
37
Ohio National Fund, Inc.
International Portfolio (Continued)
International Portfolio (Continued)
| Schedule of Investments | December 31, 2009 |
| Money Market Funds – 0.8% | Shares | Value | ||||||
| State Street Institutional Liquid Reserves Fund Institutional Class 2 | 1,675,416 | $ | 1,675,416 | |||||
Total Money Market Funds (Cost $1,675,416) | $ | 1,675,416 | ||||||
Total Investments – 99.7% (Cost $162,593,159) (d) | $ | 209,420,305 | ||||||
Other Assets in Excess of Liabilities – 0.3% | 626,025 | |||||||
Net Assets – 100.0% | $ | 210,046,330 | ||||||
Percentages are stated as a percent of net assets.
Abbreviations:
ADR: American Depository Receipts
Footnotes:
| (a) | Non-Income producing security. | |
| (b) | Security traded on a foreign exchange has been valued at an estimate of fair value that is different than the local market close price. These fair value estimates are determined by an independent national fair valuation service that has been approved by the Board. These securities represent $153,778,513 or 73.2% of the Portfolio’s net assets. | |
| (c) | As discussed in Note 2 of the Notes to Financial Statements, not all investments that are traded on a foreign exchange are valued at an estimate that is different from the local close price. In some instances, the independent fair valuation service uses the local close price because the confidence interval associated with an investment is below the 75% threshold. These securities represent $5,882,782 or 2.8% of the Portfolio’s net assets. |
| Other Portfolio securities are not subjected to fair valuation procedures because they are traded on domestic or foreign exchanges that have close times that are consistent with the U.S. market close, normally 4:00 pm Eastern Time. Exchange traded funds and rights are also not evaluated by the fair valuation service. |
| (d) | Represents cost for financial reporting purposes, which may differ from cost basis for Federal income tax purposes. See also Note 8 of the Notes to Financial Statements. | |
| Sector Classifications (combined): |
| Financials | 22.4% | ||
| Energy | 11.5% | ||
| Materials | 10.8% | ||
| Industrials | 10.2% | ||
| Consumer Staples | 8.4% | ||
| Consumer Discretionary | 8.2% | ||
| Health Care | 6.9% | ||
| Information Technology | 6.6% | ||
| Telecommunication Services | 6.1% | ||
| Utilities | 3.8% | ||
| 94.9% | |||
The accompanying notes are an integral part of these financial statements.
38
Ohio National Fund, Inc.
International Portfolio
International Portfolio
Statement of Assets and Liabilities
December 31, 2009
| Assets: | ||||
| Investments in securities, at value (Cost $162,593,159) | $ | 209,420,305 | ||
| Foreign currency (Cost $262) | 265 | |||
| Receivable for fund shares sold | 198,239 | |||
| Dividends and accrued interest receivable | 147,096 | |||
| Foreign tax reclaim receivable | 80,499 | |||
| Prepaid expenses and other assets | 3,501 | |||
| Net unrealized appreciation on foreign currency contracts | 1,125,251 | |||
| Total assets | 210,975,156 | |||
| Liabilities: | ||||
| Payable for fund shares redeemed | 723,992 | |||
| Payable for investment management services | 146,525 | |||
| Payable for compliance services | 1,674 | |||
| Accrued custody expenses | 29,828 | |||
| Accrued professional fees | 11,372 | |||
| Accrued accounting fees | 1,412 | |||
| Accrued printing and filing fees | 14,023 | |||
| Total liabilities | 928,826 | |||
| Net assets | $ | 210,046,330 | ||
| Net assets consist of: | ||||
| Par value, $1 per share | $ | 20,109,468 | ||
| Paid-in capital in excess of par value | 268,945,362 | |||
| Accumulated net realized loss on investments | (128,303,123 | ) | ||
| Net unrealized appreciation/depreciation on: | ||||
| Investments | 46,827,146 | |||
| Foreign currency contracts | 1,125,251 | |||
| Foreign currency related transactions | 2,598 | |||
| Undistributed net investment income | 1,339,628 | |||
| Net assets | $ | 210,046,330 | ||
| Shares outstanding | 20,109,468 | |||
| Authorized Fund shares allocated to Portfolio | 34,000,000 | |||
| Net asset value per share | $ | 10.45 | ||
Statement of Operations
For the Year Ended December 31, 2009
| Investment income: | ||||
| Interest | $ | 977 | ||
| Dividends (net of $650,035 foreign taxes withheld) | 4,601,724 | |||
| Other income | 112,962 | |||
| Total investment income | 4,715,663 | |||
| Expenses: | ||||
| Management fees | 1,534,586 | |||
| Custodian fees | 279,152 | |||
| Directors’ fees | 19,819 | |||
| Professional fees | 22,699 | |||
| Accounting fees | 85,861 | |||
| Printing and filing fees | 30,336 | |||
| Compliance expense | 6,376 | |||
| Other | 5,222 | |||
| Total expenses | 1,984,051 | |||
| Net investment income | 2,731,612 | |||
| Realized/unrealized gain (loss) on investments, foreign currency contracts, and other foreign currency related transactions: | ||||
| Net realized gain (loss) on: | ||||
| Investments | (39,102,585 | ) | ||
| Foreign currency contracts | (77,667 | ) | ||
| Foreign currency related transactions | (1,042,180 | ) | ||
| Change in unrealized appreciation/depreciation on: | ||||
| Investments | 99,098,350 | |||
| Foreign currency contracts | 1,125,251 | |||
| Foreign currency related transactions | 12,581 | |||
| Net realized/unrealized gain (loss) on investments, foreign currency contracts, and other foreign currency related transactions | 60,013,750 | |||
| Change in net assets from operations | $ | 62,745,362 | ||
The accompanying notes are an integral part of these financial statements.
39
Ohio National Fund, Inc.
International Portfolio
International Portfolio
Statements of Changes in Net Assets
| Years Ended December 31, | ||||||||
| 2009 | 2008 | |||||||
Increase (Decrease) in Net Assets: | ||||||||
| Operations: | ||||||||
| Net investment income | $ | 2,731,612 | $ | 2,971,488 | ||||
| Net realized gain (loss) on investments, foreign currency contracts, futures contracts, and other foreign currency related transactions | (40,222,432 | ) | (87,679,937 | ) | ||||
| Change in unrealized appreciation/depreciation on investments, foreign currency contracts, and other foreign currency related transactions | 100,236,182 | (74,919,033 | ) | |||||
| Change in net assets from operations | 62,745,362 | (159,627,482 | ) | |||||
| Capital transactions: | ||||||||
| Received from shares sold | 20,610,913 | 86,201,321 | ||||||
| Paid for shares redeemed | (53,057,563 | ) | (135,986,904 | ) | ||||
| Change in net assets from capital transactions | (32,446,650 | ) | (49,785,583 | ) | ||||
| Change in net assets | 30,298,712 | (209,413,065 | ) | |||||
Net Assets: | ||||||||
| Beginning of year | 179,747,618 | 389,160,683 | ||||||
| End of year | $ | 210,046,330 | $ | 179,747,618 | ||||
| Undistributed net investment income | $ | 1,339,628 | $ | 1,021,830 | ||||
Financial Highlights
| Years Ended December 31, | ||||||||||||||||||||
| 2009 | 2008 | 2007 | 2006 | 2005 | ||||||||||||||||
Selected Per-Share Data: | ||||||||||||||||||||
| Net asset value, beginning of year | $ | 7.56 | $ | 14.02 | $ | 12.81 | $ | 10.76 | $ | 9.84 | ||||||||||
| Operations: | ||||||||||||||||||||
| Net investment income | 0.14 | 0.13 | 0.09 | 0.05 | 0.05 | |||||||||||||||
| Net realized and unrealized gain (loss) on investments, foreign currency contracts, futures contracts, and other foreign currency related transactions | 2.75 | (6.59 | ) | 1.12 | 2.02 | 0.87 | ||||||||||||||
| Total from operations | 2.89 | (6.46 | ) | 1.21 | 2.07 | 0.92 | ||||||||||||||
| Distributions: | ||||||||||||||||||||
| Distributions from net investment income | — | — | — | (0.02 | ) | — | ||||||||||||||
| Net asset value, end of year | $ | 10.45 | $ | 7.56 | $ | 14.02 | $ | 12.81 | $ | 10.76 | ||||||||||
Total return | 38.23 | % | –46.08 | % | 9.45 | % | 19.23 | % | 9.40 | % | ||||||||||
Ratios and supplemental data: | ||||||||||||||||||||
| Net assets at end of year (millions) | $ | 210.0 | $ | 179.7 | $ | 389.2 | $ | 333.0 | $ | 212.2 | ||||||||||
| Ratios to average net assets: | ||||||||||||||||||||
| Ratios net of expenses reduced or reimbursed by adviser: | ||||||||||||||||||||
| Expenses | 1.07 | % | 0.91 | % | 0.99 | % | 1.03 | % | 1.11 | % | ||||||||||
| Net investment income | 1.47 | % | 1.03 | % | 0.66 | % | 0.58 | % | 0.61 | % | ||||||||||
| Ratios assuming no expenses reduced or reimbursed by adviser: | ||||||||||||||||||||
| Expenses | 1.07 | % | 0.91 | % | 0.99 | % | 1.03 | % | 1.12 | % | ||||||||||
| Net investment income | 1.47 | % | 1.03 | % | 0.66 | % | 0.58 | % | 0.60 | % | ||||||||||
| Portfolio turnover rate | 168 | % | 214 | % | 123 | % | 72 | % | 117 | % | ||||||||||
The accompanying notes are an integral part of these financial statements.
40
Ohio National Fund, Inc.
Capital Appreciation Portfolio
Capital Appreciation Portfolio
Objective/Strategy
The Capital Appreciation Portfolio seeks long-term capital growth by investing primarily in common stocks of established companies with either current or emerging earnings growth not fully appreciated or recognized by the market.
Performance as of December 31, 2009
Average Annual Total Returns: | ||||
| One year | 42.84% | |||
| Five years | 2.07% | |||
| Ten years | 6.56% |
Past performance does not guarantee future results. The performance data quoted represents past performance and current returns may be lower or higher. Total return figures include change in share price and reinvestment of dividends and capital gains. The investment return and principal value will fluctuate so that an investor’s shares, when redeemed may be worth more or less than the original cost. To obtain performance information up to the most recent month end, call toll-free 1-877-781-6392.
The Portfolio is not open to direct retail investment. Beneficial interest in shares is obtained solely by purchase of variable life insurance policies and variable annuity contracts. Actual performance results for variable annuity and variable universal life contracts will be lower due to contract charges. Consult your contract for applicable charges.
Comments
For the year ended December 31, 2009, the Capital Appreciation Portfolio returned 42.84% versus 26.46% for the current benchmark, the S&P 500 Index.
Every sector in the Portfolio advanced in 2009, and all but Utilities generated triple or double-digit returns. Stock selection nearly across the board drove the strong relative and absolute performance. The top ten contributors came from seven different sectors. The Consumer Discretionary sector, bolstered by media holdings, made the strongest positive impact on absolute return and was a source of relative gain. While fears of advertising cuts led these media stocks to experience large 2008 declines, we maintained our positions. We recognized that there was little in the way of estimate cuts for our holdings, especially relative to the stock price declines. Discovery Communications, Inc., whose programming includes the Discovery Channel, TLC and Animal Planet, strongly rebounded in 2009 and was a major contributor to performance. Discovery Communications, Inc. has created value, out-executed and has grown faster than every traditional media company. We took a profit and closed the position in November due to valuation.(1)
The Health Care and Energy sectors made an outsized contribution to absolute return and meaningfully out-performed the broad market index. Advanced Medical Optics Inc. and Newfield Exploration Co. led their respective sectors. Advanced Medical Optics is an example where we took advantage of the disconnect between a company’s underlying fundamentals and market expectations. Despite Advanced Medical Optics’s under-performance in 2008, we remained confident that the steady nature of Advanced Medical Optics’s cataract business would carry the company through the Lasik down-cycle. The majority of Advanced Medical Optics’s business consisted of cataracts surgery, which is less economically sensitive. The market had placed too much focus on Lasik volumes, not distinguishing properly between a cyclical trough and a secular decline. Abbott Laboratories purchased Advanced Medical Optics in the beginning of January for a 160% premium over the prior trading day and a 450% premium over its October/November 2008 low.(1)
Newfield Exploration Co. is a U.S. oil and natural gas exploration and production company. We think Newfield Exploration Co.’s near-term growth prospects should be at the high end of management’s guidance, and we believe the company will generate free cash flow over and above its significant exploration and development budget. We are also optimistic about Newfield Exploration Co.’s decision to shift capital expenditures from dry gas to oil drilling, which should add value in weak gas market even if the shift slows barrel of oil equivalent production growth. In our view, Newfield Exploration Co.’s valuation is compelling; currently the stock is trading at a 15% discount to the group.(1)
Other standout performers included Celanese Corp. and The Goldman Sachs Group, Inc. Celanese Corp., an early cycle, specialty chemical company, has gained more than 170% from our initial purchase in early February through year end. Celanese Corp. is one of the lowest-cost producers of Acetyl (intermediate chemical used in many plastics) and has continued to cut costs in this tough operating environment, improving the company’s operating leverage. The company is continuing to take steps to protect its patented process technology lead. Currently, the stock still trades at a discount valuation to the specialty chemical group but has higher exposure to the growth areas within the sector. Acetyl’s demand, particularly within Asia, continues to remain robust as the overall manufacturing sector stabilizes and rebounds. In December, Celanese Corp. announced it will increase prices on certain products in the United States, Central and South America, Asia and Europe. We see normalized earnings well above $2.00 per share but have taken some profit and trimmed the position due to valuation on near-term EPS (earnings per share).(1)
The Goldman Sachs Group, Inc. was the ultimate survivor in the brokerage industry in 2009. As the credit crisis unfolded over the last 18 months, we were able to purchase the premier trading franchises on Wall Street below book value and under ten times the lower end of earnings estimates. As the year progressed, The Goldman Sachs Group, Inc. put more capital to work than any of its peers to take advantage of enormous bid/offer spreads throughout fixed income, and The Goldman Sachs Group, Inc.’s earnings estimates rose from under $10 per share to over $20 per share. While we believe The Goldman Sachs Group, Inc. is in the premier position within the industry and should be able to grow book value at double-digit rates, we have trimmed the position substantially as the risk/reward has narrowed.(1)
The Industrials sector was a detriment to absolute and relative performance. Delta Air Lines, Inc. and JetBlue Airways Corp. were among the largest detractors, reversing part of their strong 2008 contribution. Our investment thesis on both companies is predicated on significant revenue recovery, driven in part by lower fuel prices and a historic reduction of industry capacity. With recovery expectations muted, we think even a relatively
(continued)
41
Ohio National Fund, Inc.
Capital Appreciation Portfolio (Continued)
Capital Appreciation Portfolio (Continued)
modest recovery would pave the way for a profitable 2010 and materially higher share prices. On a company-specific level, we believe Delta Air Lines, Inc. should be able to exceed cost expectations amid its integration with Northwest Airlines. Delta Air Lines, Inc.’s CFO recently announced the company’s passenger traffic is steadily recovering, putting it on track to report an 8% year-over-year decline in unit revenue in the fourth quarter. We have taken some profit and trimmed the position.(1)
JetBlue Airways Corp. is gaining market share among the more price sensitive business travelers, an opportunity we think it will be able to exploit further when it transitions to a new reservation system in the first quarter of 2010. Moreover, JetBlue Airways Corp.’s strong leisure mix and management’s efforts to shift capacity towards more stable Caribbean and Latin American VFR (Visiting Friends and Relatives) traffic while maintaining a strong core New York, Boston, Florida, and West Coast network support robust relative performance. Additionally, JetBlue Airways Corp. is adding code-share deals with non-U.S. carriers that should drive solid unit revenue performance in the near term. We think JetBlue Airways Corp. is attractively valued, has a strong balance sheet with no defined benefit plan, and has positive free cash flow prospects.(1)
Sallie Mae Corp. also hurt returns. Sallie Mae Corp. declined due to the Obama administration’s proposal to replace the Federal Family Education Loan Program (FFELP) with the government- run Direct Loan Program (DLP). This action would eliminate fees paid to private banks that provide loans to students. We exited the position in March due to the negative catalyst of the Obama administration’s threat to “change the rules” and not allow student loans to be originated privately.(1)
The five best performers were Advanced Medical Optics, Inc., Celanese Corp., Sprint Nextel Corp., Newfield Exploration Co. and Discovery Communications, Inc. The five worst performers were Sallie Mae Corp., White Mountains Insurance Group Ltd., Goodyear Tire & Rubber Co., E.I. du Pont de Nemours & Co. and JetBlue Airways Corp. The five largest detractors were Sallie Mae Corp., Delta Air Lines, Inc., E.I. du Pont de Nemours & Co., JetBlue Airways Corp. and White Mountains Insurance Group Ltd. The five largest contributors were Advanced Medical Optics Inc., Celanese Corp., The Goldman Sachs Group, Inc., Newfield Exploration Co. and Discovery Communications, Inc.(1)
From the depths of their March lows, equity markets have posted impressive rebounds, with most indices gaining 50% or more through year end. Due to workforce and inventory reductions, corporate profit results were much better than expected last year and have provided much of the fuel for this recovery in equities. Favorable interest rate and liquidity conditions have also been instrumental in spurring the rally. With these tailwinds in place, we expect further, albeit likely modest, equity gains in 2010 as the economy further stabilizes and expands. Of course, significant challenges remain, including high unemployment, still-weak housing markets, probable increases in tax rates, and rising inflation expectations.
As the economy expands, interest rates will eventually rise, as the Federal Reserve reins in the easy money that helped to revive growth. This process will at least begin when the extraordinary liquidity-providing programs put in place during the financial crisis of 2008 expire. At some stage, short-term interest rates will rise, although current indications are that the Federal Reserve will keep them low by historical standards over the intermediate term.
Against this backdrop, we remain cautiously optimistic. Depending upon various policy outcomes, the recovery in 2010 could be subpar relative to previous post-recessionary periods, and the market overall seems to be reasonably valued as share prices over the past year had a sharp recovery. We believe the current environment, where stock selection will ultimately be the key driver for out-performance over market indices, is favorable for our opportunistic investment style. We continue to find individual stocks that have compelling risk/rewards with fundamental catalysts.
| (1) | The Portfolio’s composition is subject to change. Holdings and weightings are as of December 31, 2009. |
Change in Value of $10,000 Investment
![[PERFORMANCE GRAPH]](https://capedge.com/proxy/N-CSR/0000950123-10-021904/l38589l3858941.gif)
Hypothetical illustration based on past performance. Future performance will vary. The Portfolio’s returns reflect reinvested dividends. The Portfolio’s holdings may differ significantly from the securities in the index. The index is unmanaged and therefore does not reflect the cost of portfolio management and accounting.
The S&P 500 Index is a capitalization-weighted index designed to measure performance of the broad domestic economy through changes in the aggregate market value of 500 stocks representing all major industries. The index presented herein includes the effects of reinvested dividends.
(continued)
42
Ohio National Fund, Inc.
Capital Appreciation Portfolio (Continued)
Capital Appreciation Portfolio (Continued)
Portfolio Composition as of December 31, 2009 (1)
| % of Net Assets | |||
Common Stocks (3) | 97.2 | ||
Preferred Stocks (3) | 0.2 | ||
| Money Market Funds Less Net Liabilities | 2.6 | ||
| 100.0 | |||
Top 10 Portfolio Holdings as of December 31, 2009 (1) (2)
| % of Net Assets | |||||||
| 1. | ConAgra Foods, Inc. | 2.3 | |||||
| 2. | Pfizer, Inc. | 2.2 | |||||
| 3. | Cisco Systems, Inc. | 2.2 | |||||
| 4. | Dover Corp. | 2.1 | |||||
| 5. | Newfield Exploration Co. | 2.1 | |||||
| 6. | Travelers Companies, Inc. / The | 2.0 | |||||
| 7. | Watson Pharmaceuticals, Inc. | 2.0 | |||||
| 8. | Shire PLC – ADR | 1.8 | |||||
| 9. | Republic Services, Inc. | 1.8 | |||||
| 10. | Akamai Technologies, Inc. | 1.8 | |||||
| (1) | Composition of Portfolio subject to change. | |
| (2) | Short-term investments have been excluded from the list of Top 10 Portfolio holdings. | |
| (3) | Sectors (combined): |
| % of Net Assets | |||
| Consumer Discretionary | 17.7 | ||
| Information Technology | 16.2 | ||
| Health Care | 14.7 | ||
| Financials | 12.7 | ||
| Energy | 11.8 | ||
| Industrials | 9.1 | ||
| Consumer Staples | 8.3 | ||
| Materials | 5.4 | ||
| Utilities | 1.5 | ||
| 97.4 | |||
43
Ohio National Fund, Inc.
Capital Appreciation Portfolio
Capital Appreciation Portfolio
| Schedule of Investments | December 31, 2009 |
| Common Stocks – 97.2% | Shares | Value | ||||||
CONSUMER DISCRETIONARY – 17.7% | ||||||||
Auto Components – 2.1% | ||||||||
| Gentex Corp. | 73,600 | $ | 1,313,760 | |||||
| Lear Corp. (a) | 18,700 | 1,264,868 | ||||||
| 2,578,628 | ||||||||
Diversified Consumer Services – 3.4% | ||||||||
| Career Education Corp. (a) | 61,000 | 1,421,910 | ||||||
| H&R Block, Inc. | 77,800 | 1,759,836 | ||||||
| Weight Watchers International, Inc. | 38,700 | 1,128,492 | ||||||
| 4,310,238 | ||||||||
Hotels, Restaurants & Leisure – 1.6% | ||||||||
| Pinnacle Entertainment, Inc. (a) | 225,400 | 2,024,092 | ||||||
Household Durables – 1.3% | ||||||||
| Ryland Group, Inc. | 81,400 | 1,603,580 | ||||||
Internet & Catalog Retail – 1.0% | ||||||||
| Ticketmaster Entertainment, Inc. (a) | 102,380 | 1,251,083 | ||||||
Media – 6.7% | ||||||||
| Liberty Global, Inc. Series C (a) | 86,496 | 1,889,938 | ||||||
| Time Warner Cable, Inc. | 49,000 | 2,028,110 | ||||||
| Viacom, Inc. Class B (a) | 70,744 | 2,103,219 | ||||||
| Vivendi SA (b) | 42,900 | 1,273,259 | ||||||
| Warner Music Group Corp. (a) | 212,500 | 1,202,750 | ||||||
| 8,497,276 | ||||||||
Specialty Retail – 1.6% | ||||||||
| GameStop Corp. Class A (a) | 94,200 | 2,066,748 | ||||||
TOTAL CONSUMER DISCRETIONARY | 22,331,645 | |||||||
CONSUMER STAPLES – 8.3% | ||||||||
Food & Staples Retailing – 2.4% | ||||||||
| Kroger Co. / The | 41,000 | 841,730 | ||||||
| Wal-Mart Stores, Inc. | 41,300 | 2,207,485 | ||||||
| 3,049,215 | ||||||||
Food Products – 5.9% | ||||||||
| Bunge Ltd. | 22,100 | 1,410,643 | ||||||
| Cadbury PLC (b) | 157,035 | 2,019,090 | ||||||
| ConAgra Foods, Inc. | 123,900 | 2,855,895 | ||||||
| Tyson Foods, Inc. Class A | 90,100 | 1,105,527 | ||||||
| 7,391,155 | ||||||||
TOTAL CONSUMER STAPLES | 10,440,370 | |||||||
ENERGY – 11.8% | ||||||||
Energy Equipment & Services – 1.6% | ||||||||
| Schlumberger Ltd. | 31,900 | 2,076,371 | ||||||
Oil, Gas & Consumable Fuels – 10.2% | ||||||||
| Apache Corp. | 20,100 | 2,073,717 | ||||||
| Cabot Oil & Gas Corp. | 33,600 | 1,464,624 | ||||||
| Exxon Mobil Corp. | 26,000 | 1,772,940 | ||||||
| Newfield Exploration Co. (a) | 55,300 | 2,667,119 | ||||||
| Occidental Petroleum Corp. | 21,600 | 1,757,160 | ||||||
| Suncor Energy, Inc. | 42,900 | 1,514,799 | ||||||
| Sunoco, Inc. | 59,900 | 1,563,390 | ||||||
| 12,813,749 | ||||||||
TOTAL ENERGY | 14,890,120 | |||||||
FINANCIALS – 12.5% | ||||||||
Capital Markets – 4.0% | ||||||||
| Charles Schwab Corp. / The | 107,378 | 2,020,854 | ||||||
| Goldman Sachs Group, Inc. / The | 9,300 | 1,570,212 | ||||||
| Lazard Ltd. Class A | 39,700 | 1,507,409 | ||||||
| 5,098,475 | ||||||||
Diversified Financial Services – 2.6% | ||||||||
| Bank of America Corp. | 107,462 | 1,618,378 | ||||||
| JPMorgan Chase & Co. | 40,100 | 1,670,967 | ||||||
| 3,289,345 | ||||||||
Insurance – 5.9% | ||||||||
| Axis Capital Holdings Ltd. | 76,300 | 2,167,683 | ||||||
| Marsh & McLennan Companies, Inc. | 61,700 | 1,362,336 | ||||||
| Travelers Companies, Inc. / The | 51,700 | 2,577,762 | ||||||
| Validus Holdings, Ltd. | 48,800 | 1,314,672 | ||||||
| 7,422,453 | ||||||||
TOTAL FINANCIALS | 15,810,273 | |||||||
HEALTH CARE – 14.7% | ||||||||
Biotechnology – 1.8% | ||||||||
| Amgen, Inc. (a) | 39,100 | 2,211,887 | ||||||
Health Care Equipment & Supplies – 1.3% | ||||||||
| Alcon, Inc. | 10,100 | 1,659,935 | ||||||
Health Care Providers & Services – 1.4% | ||||||||
| Medco Health Solutions, Inc. (a) | 28,200 | 1,802,262 | ||||||
Life Sciences Tools & Services – 1.4% | ||||||||
| Thermo Fisher Scientific, Inc. (a) | 37,300 | 1,778,837 | ||||||
Pharmaceuticals – 8.8% | ||||||||
| Abbott Laboratories | 40,600 | 2,191,994 | ||||||
| Novartis AG – ADR | 24,200 | 1,317,206 | ||||||
| Pfizer, Inc. | 152,212 | 2,768,736 | ||||||
| Shire PLC – ADR | 39,600 | 2,324,520 | ||||||
| Watson Pharmaceuticals, Inc. (a) | 62,400 | 2,471,664 | ||||||
| 11,074,120 | ||||||||
TOTAL HEALTH CARE | 18,527,041 | |||||||
INDUSTRIALS – 9.1% | ||||||||
Air Freight & Logistics – 1.3% | ||||||||
| Hub Group, Inc. Class A (a) | 60,400 | 1,620,532 | ||||||
Airlines – 2.8% | ||||||||
| Delta Air Lines, Inc. (a) | 161,300 | 1,835,594 | ||||||
| JetBlue Airways Corp. (a) | 311,300 | 1,696,585 | ||||||
| 3,532,179 | ||||||||
Commercial Services & Supplies – 1.8% | ||||||||
| Republic Services, Inc. | 79,215 | 2,242,577 | ||||||
Machinery – 2.1% | ||||||||
| Dover Corp. | 64,400 | 2,679,684 | ||||||
Trading Companies & Distributors – 1.1% | ||||||||
| RSC Holdings, Inc. (a) | 203,300 | 1,431,232 | ||||||
TOTAL INDUSTRIALS | 11,506,204 | |||||||
(continued)
44
Ohio National Fund, Inc.
Capital Appreciation Portfolio (Continued)
Capital Appreciation Portfolio (Continued)
| Schedule of Investments | December 31, 2009 |
| Common Stocks – 97.2% | Shares | Value | ||||||
INFORMATION TECHNOLOGY – 16.2% | ||||||||
Communications Equipment – 2.2% | ||||||||
| Cisco Systems, Inc. (a) | 114,900 | $ | 2,750,706 | |||||
Computers & Peripherals – 1.6% | ||||||||
| Dell, Inc. (a) | 139,400 | 2,001,784 | ||||||
Electronic Equipment, Instruments & Components – 1.0% | ||||||||
| Flextronics International Ltd. (a) | 177,100 | 1,294,601 | ||||||
Internet Software & Services – 4.6% | ||||||||
| Akamai Technologies, Inc. (a) | 88,000 | 2,229,040 | ||||||
| IAC/InterActiveCorp (a) | 78,450 | 1,606,656 | ||||||
| VeriSign, Inc. (a) | 80,800 | 1,958,592 | ||||||
| 5,794,288 | ||||||||
IT Services – 1.2% | ||||||||
| SAIC, Inc. (a) | 80,900 | 1,532,246 | ||||||
Semiconductors & Semiconductor Equipment – 2.7% | ||||||||
| Advanced Micro Devices, Inc. (a) | 143,400 | 1,388,112 | ||||||
| Intel Corp. | 97,800 | 1,995,120 | ||||||
| 3,383,232 | ||||||||
Software – 2.9% | ||||||||
| Adobe Systems, Inc. (a) | 48,900 | 1,798,542 | ||||||
| Symantec Corp. (a) | 104,200 | 1,864,138 | ||||||
| 3,662,680 | ||||||||
TOTAL INFORMATION TECHNOLOGY | 20,419,537 | |||||||
MATERIALS – 5.4% | ||||||||
Chemicals – 3.7% | ||||||||
| Celanese Corp. Class A | 42,600 | 1,367,460 | ||||||
| Ferro Corp. | 145,300 | 1,197,272 | ||||||
| Monsanto Co. | 10,300 | 842,025 | ||||||
| Nalco Holding Co. | 51,200 | 1,306,112 | ||||||
| 4,712,869 | ||||||||
Metals & Mining – 1.7% | ||||||||
| Goldcorp, Inc. | 55,000 | 2,163,700 | ||||||
TOTAL MATERIALS | 6,876,569 | |||||||
UTILITIES – 1.5% | ||||||||
Independent Power Producers & Energy Traders – 1.5% | ||||||||
| NRG Energy, Inc. (a) | 79,800 | 1,884,078 | ||||||
TOTAL UTILITIES | 1,884,078 | |||||||
Total Common Stocks (Cost $113,084,599) | $ | 122,685,837 | ||||||
| Preferred Stocks – 0.2% | Shares | Value | ||||||
FINANCIALS – 0.2% | ||||||||
Diversified Financial Services – 0.2% | ||||||||
| Bank of America Corp. 10.000%, convertible until 12/31/2049 | 15,300 | $ | 228,276 | |||||
Total Preferred Stocks (Cost $229,500) | $ | 228,276 | ||||||
| Money Market Funds – 3.6% | Shares | Value | ||||||
| Fidelity Institutional Money Market Funds Money Market Portfolio – Class I | 4,587,000 | $ | 4,587,000 | |||||
Total Money Market Funds (Cost $4,587,000) | $ | 4,587,000 | ||||||
Total Investments – 101.0% (Cost $117,901,099) (c) | $ | 127,501,113 | ||||||
Liabilities in Excess of Other Assets – (1.0)% | (1,246,914 | ) | ||||||
Net Assets – 100.0% | $ | 126,254,199 | ||||||
Percentages are stated as a percent of net assets.
Abbreviations:
ADR: American Depository Receipts
Footnotes:
| (a) | Non-income producing security. | |
| (b) | Security traded on a foreign exchange has been valued at an estimate of fair value that is different than the local market close price. These fair value estimates are determined by an independent national fair valuation service that has been approved by the Board. These securities represent $3,292,349 or 2.6% of the Portfolio’s net assets. Other Portfolio securities are not subjected to fair valuation procedures because they are traded on domestic or foreign exchanges that have close times that are consistent with the U.S. market close, normally 4:00 pm Eastern Time. | |
| (c) | Represents cost for financial reporting purposes, which may differ from cost basis for Federal income tax purposes. See also Note 8 of the Notes to Financial Statements. |
The accompanying notes are an integral part of these financial statements.
45
Ohio National Fund, Inc.
Capital Appreciation Portfolio
Capital Appreciation Portfolio
Statement of Assets and Liabilities
December 31, 2009
| Assets: | ||||
| Investments in securities, at value (Cost $117,901,099) | $ | 127,501,113 | ||
| Cash | 506 | |||
| Receivable for securities sold | 364,716 | |||
| Receivable for fund shares sold | 109,171 | |||
| Dividends and accrued interest receivable | 99,113 | |||
| Prepaid expenses and other assets | 2,001 | |||
| Total assets | 128,076,620 | |||
| Liabilities: | ||||
| Payable for securities purchased | 1,436,202 | |||
| Payable for fund shares redeemed | 271,494 | |||
| Payable for investment management services | 84,382 | |||
| Payable for compliance services | 1,677 | |||
| Accrued custody expense | 897 | |||
| Accrued professional fees | 11,254 | |||
| Accrued accounting fees | 8,083 | |||
| Accrued printing and filing fees | 8,432 | |||
| Total liabilities | 1,822,421 | |||
| Net assets | $ | 126,254,199 | ||
| Net assets consist of: | ||||
| Par value, $1 per share | $ | 7,233,900 | ||
| Paid-in capital in excess of par value | 151,342,244 | |||
| Accumulated net realized loss on investments | (42,078,559 | ) | ||
| Net unrealized appreciation on investments | 9,600,014 | |||
| Undistributed net investment income | 156,600 | |||
| Net assets | $ | 126,254,199 | ||
| Shares outstanding | 7,233,900 | |||
| Authorized Fund shares allocated to Portfolio | 15,000,000 | |||
| Net asset value per share | $ | 17.45 | ||
Statement of Operations
For the Year Ended December 31, 2009
| Investment income: | ||||
| Interest | $ | 32,941 | ||
| Dividends (net of withholding tax of $31,042) | 2,493,944 | |||
| Total investment income | 2,526,885 | |||
| Expenses: | ||||
| Management fees | 880,542 | |||
| Custodian fees | 9,439 | |||
| Directors’ fees | 11,842 | |||
| Professional fees | 18,148 | |||
| Accounting fees | 46,872 | |||
| Printing and filing fees | 18,304 | |||
| Compliance expense | 6,376 | |||
| Other | 3,058 | |||
| Total expenses | 994,581 | |||
| Net investment income | 1,532,304 | |||
| Realized/unrealized gain (loss) on investments and foreign currency related transactions: | ||||
| Net realized gain (loss) on: Investments | (21,852,381 | ) | ||
| Foreign currency related transactions | (4,027 | ) | ||
| Change in unrealized appreciation/depreciation on investments | 59,400,776 | |||
| Net realized/unrealized gain (loss) on investments and foreign currency related transactions | 37,544,368 | |||
| Change in net assets from operations | $ | 39,076,672 | ||
The accompanying notes are an integral part of these financial statements.
46
Ohio National Fund, Inc.
Capital Appreciation Portfolio
Capital Appreciation Portfolio
Statements of Changes in Net Assets
| Years Ended December 31, | ||||||||
| 2009 | 2008 | |||||||
Increase (Decrease) in Net Assets: | ||||||||
| Operations: | ||||||||
| Net investment income | $ | 1,532,304 | $ | 1,083,715 | ||||
| Net realized gain (loss) on investments and foreign currency related transactions | (21,856,408 | ) | (17,986,650 | ) | ||||
| Change in unrealized appreciation/depreciation on investments | 59,400,776 | (52,485,931 | ) | |||||
| Change in net assets from operations | 39,076,672 | (69,388,866 | ) | |||||
| Distributions to shareholders: | ||||||||
| Distributions from net investment income | (1,371,677 | ) | (936,890 | ) | ||||
| Capital transactions: | ||||||||
| Received from shares sold | 13,406,834 | 20,186,486 | ||||||
| Received from dividends reinvested | 1,371,677 | 936,890 | ||||||
| Paid for shares redeemed | (29,864,051 | ) | (44,797,966 | ) | ||||
| Change in net assets from capital transactions | (15,085,540 | ) | (23,674,590 | ) | ||||
| Change in net assets | 22,619,455 | (94,000,346 | ) | |||||
Net Assets: | ||||||||
| Beginning of year | 103,634,744 | 197,635,090 | ||||||
| End of year | $ | 126,254,199 | $ | 103,634,744 | ||||
| Undistributed net investment income | $ | 156,600 | $ | 133,059 | ||||
Financial Highlights
| Years Ended December 31, | ||||||||||||||||||||
| 2009 | 2008 | 2007 | 2006 | 2005 | ||||||||||||||||
Selected Per-Share Data: | ||||||||||||||||||||
| Net asset value, beginning of year | $ | 12.35 | $ | 20.45 | $ | 19.79 | $ | 17.08 | $ | 16.31 | ||||||||||
| Operations: | ||||||||||||||||||||
| Net investment income | 0.22 | 0.14 | 0.11 | 0.12 | 0.08 | |||||||||||||||
| Net realized and unrealized gain (loss) on investments | ||||||||||||||||||||
| and foreign currency related transactions | 5.07 | (8.12 | ) | 0.65 | 2.68 | 0.78 | ||||||||||||||
| Total from operations | 5.29 | (7.98 | ) | 0.76 | 2.80 | 0.86 | ||||||||||||||
| Distributions: | ||||||||||||||||||||
| Distributions from net investment income | (0.19 | ) | (0.12 | ) | (0.10 | ) | (0.09 | ) | (0.09 | ) | ||||||||||
| Net asset value, end of year | $ | 17.45 | $ | 12.35 | $ | 20.45 | $ | 19.79 | $ | 17.08 | ||||||||||
Total return | 42.84 | % | –39.01 | % | 3.82 | % | 16.37 | % | 5.27 | % | ||||||||||
Ratios and supplemental data: | ||||||||||||||||||||
| Net assets at end of year (millions) | $ | 126.3 | $ | 103.6 | $ | 197.6 | $ | 222.5 | $ | 169.6 | ||||||||||
| Ratios to average net assets: | ||||||||||||||||||||
| Expenses | 0.90 | % | 0.87 | % | 0.84 | % | 0.85 | % | 0.88 | % | ||||||||||
| Net investment income | 1.38 | % | 0.71 | % | 0.46 | % | 0.64 | % | 0.60 | % | ||||||||||
| Portfolio turnover rate | 84 | % | 79 | % | 69 | % | 80 | % | 86 | % | ||||||||||
The accompanying notes are an integral part of these financial statements.
47
Ohio National Fund, Inc.
Millennium Portfolio
Millennium Portfolio
Objective/Strategy
The Millennium Portfolio seeks maximum capital growth by investing primarily in common stocks of small sized companies.
Performance as of December 31, 2009
Average Annual Total Returns: | ||||
| One year | 20.84% | |||
| Five years | -1.24% | |||
| Ten years | -3.51% |
Past performance does not guarantee future results. The performance data quoted represents past performance and current returns may be lower or higher. Total return figures include change in share price and reinvestment of dividends and capital gains. The investment return and principal value will fluctuate so that an investor’s shares, when redeemed may be worth more or less than the original cost. To obtain performance information up to the most recent month end, call toll-free 1-877-781-6392.
The Portfolio is not open to direct retail investment. Beneficial interest in shares is obtained solely by purchase of variable life insurance policies and variable annuity contracts. Actual performance results for variable annuity and variable universal life contracts will be lower due to contract charges. Consult your contract for applicable charges.
Comments
For the year ended December 31, 2009, the Millennium Portfolio returned 20.84% versus 34.47% for the current benchmark, the Russell 2000 Growth Index.
While the markets ended 2009 decidedly up, the year contained two very different periods. Dramatic weakness carrying over from 2008 colored the early part of the year, and then markets rallied from March through year end. Growth stocks significantly out-performed value stocks during this period, as often happens at inflection points in the market.
Last year, defensive stocks out-performed on a relative basis while the markets were declining. This year, after the March low and into the current rally, the situation was somewhat reversed. From March until the fourth quarter, the rally was led by stocks with: low quality, prices under $5 per share, the lowest capitalization range, low or no-earnings, and the lowest Return on Equity (ROE). We typically lack exposure to lower quality areas given our stock selection process and fundamental criteria. We also do not believe that lower quality can out-perform over the longer term. In fact, we believe there are signs that the low quality rally may already be fading. The market shifted somewhat during the fourth quarter, when larger companies, high ROE stocks, and stocks over $20 assumed the lead. When markets are focused on fundamentals, as the shift during the fourth quarter suggests, our quality growth strategy tends to benefit.
Information Technology, Consumer Discretionary, and Materials were the best performing index sectors for the year, while Financials, Industrials, and Utilities were the weakest. Within the Portfolio, stock selection within Energy, Telecommunication Services, and Financials was the largest relative benefit.(1)
Within Energy, an over-weight position of oil & gas related names such as Concho Resources, Inc., a high quality, good earnings visibility oil and gas firm, was a significant benefit, followed by Arena Resources, Inc. Within Telecommunication Services, tower company SBA Communications Corp. was a standout performer early in the year. We took profits in SBA Communications Corp. and currently have no Telecommunication Services stocks. In Financials, higher quality asset managers and brokerage names like Janus Capital Group Inc. and Waddell and Reed Financial, Inc. performed well. We also benefited from Jones Lang LaSalle, Inc., a well-run real estate manager.(1)
Given that our higher quality discipline was out of favor for most of the year, however, many of our holdings were disadvantaged versus the market. This was most apparent in the Health Care, Information Technology, and Industrials sectors.(1)
Within Health Care, Psychiatric Solutions, Inc., Wright Medical Group, Inc., and Amedisys Inc. were weak. We eliminated them on earnings disappointments, ongoing pressure from weak hospital spending, as well as health care reform uncertainty that is plaguing this sector. We have, however, made selected investments in hospital outsourcing companies. Our focus is on outsourcing areas that offers hospitals a method to operate more efficiently. Air Methods Corp., an air emergency transport company, Emergency Medical Services Corp., an ER outsourcing firm, Mednax, Inc., a neonatal specialist, and IPC The Hospitalist Co., Inc., a company that helps hospitals reduce risk by coordinating patient care across specialties, are examples. Despite the aggregate weakness in the sector this year, SXC Health Solutions Corp., a health care software company, was a top performer.(1)
In Information Technology, our high quality holdings generally didn’t keep pace with their higher beta counterparts. Alliance Data Systems Corp. and Trimble Navigation under-performed in particular, while VistaPrint Ltd., a lower cost business products and services provider, was among top performers. We repositioned Information Technology holdings somewhat recently, adding to companies such as LivePerson, Inc., NetLogic Microsystems, Inc., and Varian Semiconductor Equipment Associates, Inc. that we expect will benefit as business spending increases. Assuming hiring will improve, we have also added to human resources related firms including SuccessFactors, Inc. and Ultimate Software Group, Inc.(1)
Within Industrials, where holdings also under-performed as investor attention was focused elsewhere, we have added to aerospace and defense, expecting a benefit from improving economic growth. Holdings include AAR Corp. and HEICO Corp., two aircraft parts firms.(1)
In retrospect, we were too defensive early in the year within Consumer Discretionary stocks. We sold Gymboree Corp. on missed earnings and consolidated our education theme, selling DeVry, Inc., ITT Educational Services, Inc., Lincoln Educational Services Corp., and Strayer Education, Inc. We shifted the Portfolio toward less defensive areas — companies we expect should do well even with a slight uptick in consumer spending. Isle of Capri Casinos, Inc., which we’ve since sold, Orient-Express Hotels Ltd., and Royal Caribbean Cruises Ltd. are examples. Under the same thesis, growing niche retailers are another area of interest. Holdings include Tractor Supply Co. and Ulta Salon Cosmetics & Fragrance, Inc.(1)
Looking ahead, we have positioned the Portfolio for a recovery with sustained muted growth, as consumer weakness and
(continued)
48
Ohio National Fund, Inc.
Millennium Portfolio (Continued)
Millennium Portfolio (Continued)
jobless claims continue to be concerns. We have become less defensive within the Portfolio over time, expecting that even within a subdued growth backdrop, well-positioned companies with clean balance sheets and good margins will benefit as economic activity increases. We believe that especially now, stock selection will be a key to out-performance, and that the market will continue to reward companies that possess strong fundamentals and quality growth characteristics over time.
| (1) | The Portfolio’s composition is subject to change. Holdings and weightings are as of December 31, 2009. |
Change in Value of $10,000 Investment
![[PERFORMANCE GRAPH]](https://capedge.com/proxy/N-CSR/0000950123-10-021904/l38589l3858942.gif)
Hypothetical illustration based on past performance. Future performance will vary. The Portfolio’s returns reflect reinvested dividends. The Portfolio’s holdings may differ significantly from the securities in the index. The index is unmanaged and therefore does not reflect the cost of portfolio management and accounting.
The Russell 2000 Growth Index is a market-weighted total return index that measures the performance of companies within the Russell 2000 Index having higher price to book ratios and higher forecasted growth values. The Russell 2000 Index includes the 2000 firms from the Russell 3000 Index with the smallest market capitalizations. The Russell 3000 Index represents 98% of the investable U.S. equity markets. The index presented herein includes the effects of reinvested dividends.
Portfolio Composition as of December 31, 2009 (1)
| % of Net Assets | |||
Common Stocks (3) | 96.3 | ||
| Money Market Funds and Other Net Assets | 3.7 | ||
| 100.0 | |||
Top 10 Portfolio Holdings as of December 31, 2009 (1) (2)
| % of Net Assets | |||||||
| 1. | HEICO Corp. | 2.5 | |||||
| 2. | Capella Education Co. | 2.5 | |||||
| 3. | Concho Resources, Inc. | 2.3 | |||||
| 4. | hhgregg, Inc. | 2.3 | |||||
| 5. | Solera Holdings, Inc. | 2.3 | |||||
| 6. | HMS Holdings Corp. | 2.2 | |||||
| 7. | Royal Caribbean Cruises Ltd. | 2.1 | |||||
| 8. | SXC Health Solutions Corp. | 2.1 | |||||
| 9. | Jarden Corp. | 2.0 | |||||
| 10. | LivePerson, Inc. | 1.9 | |||||
| (1) | Composition of Portfolio subject to change. | |
| (2) | Short-term investments have been excluded from the list of Top 10 Portfolio holdings. | |
| (3) | Sectors: |
| % of Net Assets | |||
| Information Technology | 29.6 | ||
| Health Care | 20.8 | ||
| Consumer Discretionary | 17.9 | ||
| Industrials | 14.5 | ||
| Energy | 4.1 | ||
| Consumer Staples | 3.6 | ||
| Financials | 3.3 | ||
| Materials | 2.5 | ||
| 96.3 | |||
49
Ohio National Fund, Inc.
Millennium Portfolio
Millennium Portfolio
| Schedule of Investments | December 31, 2009 |
| Common Stocks – 96.3% | Shares | Value | ||||||
CONSUMER DISCRETIONARY – 17.9% | ||||||||
Diversified Consumer Services – 2.4% | ||||||||
| Capella Education Co. (a) | 35,900 | $ | 2,703,270 | |||||
Hotels, Restaurants & Leisure – 4.6% | ||||||||
| Orient-Express Hotels Ltd. Class A (a) | 176,400 | 1,788,696 | ||||||
| Royal Caribbean Cruises Ltd. (a) | 92,900 | 2,348,512 | ||||||
| WMS Industries, Inc. (a) | 23,500 | 940,000 | ||||||
| 5,077,208 | ||||||||
Household Durables – 2.0% | ||||||||
| Jarden Corp. | 71,700 | 2,216,247 | ||||||
Media – 1.4% | ||||||||
| Focus Media Holding Ltd. – ADR (a) | 94,600 | 1,499,410 | ||||||
Specialty Retail – 4.8% | ||||||||
| hhgregg, Inc. (a) | 115,200 | 2,537,856 | ||||||
| Tractor Supply Co. (a) | 27,900 | 1,477,584 | ||||||
| Ulta Salon Cosmetics & Fragrance, Inc. (a) | 67,600 | 1,227,616 | ||||||
| 5,243,056 | ||||||||
Textiles, Apparel & Luxury Goods – 2.7% | ||||||||
| Lululemon Athletica, Inc. (a) | 65,400 | 1,968,540 | ||||||
| Warnaco Group, Inc. / The (a) | 23,500 | 991,465 | ||||||
| 2,960,005 | ||||||||
TOTAL CONSUMER DISCRETIONARY | 19,699,196 | |||||||
CONSUMER STAPLES – 3.6% | ||||||||
Beverages – 1.0% | ||||||||
| Central European Distribution Corp. (a) | 39,800 | 1,130,718 | ||||||
Food Products – 1.6% | ||||||||
| Diamond Foods, Inc. | 47,900 | 1,702,366 | ||||||
Personal Products – 1.0% | ||||||||
| Elizabeth Arden, Inc. (a) | 79,200 | 1,143,648 | ||||||
TOTAL CONSUMER STAPLES | 3,976,732 | |||||||
ENERGY – 4.1% | ||||||||
Oil, Gas & Consumable Fuels – 4.1% | ||||||||
| Arena Resources, Inc. (a) | 44,900 | 1,936,088 | ||||||
| Concho Resources, Inc. (a) | 57,100 | 2,563,790 | ||||||
TOTAL ENERGY | 4,499,878 | |||||||
FINANCIALS – 3.3% | ||||||||
Capital Markets – 1.6% | ||||||||
| Waddell & Reed Financial, Inc. Class A | 56,600 | 1,728,564 | ||||||
Real Estate Management & Development – 1.7% | ||||||||
| Jones Lang LaSalle, Inc. | 32,100 | 1,938,840 | ||||||
TOTAL FINANCIALS | 3,667,404 | |||||||
HEALTH CARE – 20.8% | ||||||||
Biotechnology – 3.0% | ||||||||
| Alexion Pharmaceuticals, Inc. (a) | 31,200 | 1,523,184 | ||||||
| Human Genome Sciences, Inc. (a) | 57,300 | 1,753,380 | ||||||
| 3,276,564 | ||||||||
Health Care Equipment & Supplies – 5.3% | ||||||||
| Align Technology, Inc. (a) | 66,400 | 1,183,248 | ||||||
| Inverness Medical Innovations, Inc. (a) | 38,400 | 1,593,984 | ||||||
| Sirona Dental Systems, Inc. (a) | 63,300 | 2,009,142 | ||||||
| Zoll Medical Corp. (a) | 40,200 | 1,074,144 | ||||||
| 5,860,518 | ||||||||
Health Care Providers & Services – 10.4% | ||||||||
| Air Methods Corp. (a) | 41,600 | 1,398,592 | ||||||
| Emergency Medical Services Corp. (a) | 29,900 | 1,619,085 | ||||||
| HMS Holdings Corp. (a) | 50,200 | 2,444,238 | ||||||
| IPC The Hospitalist Co, Inc. (a) | 41,100 | 1,366,575 | ||||||
| Magellan Health Services, Inc. (a) | 29,400 | 1,197,462 | ||||||
| Mednax, Inc. (a) | 31,400 | 1,887,454 | ||||||
| PSS World Medical, Inc. (a) | 70,500 | 1,591,185 | ||||||
| 11,504,591 | ||||||||
Health Care Technology – 2.1% | ||||||||
| SXC Health Solutions Corp. (a) | 42,800 | 2,309,060 | ||||||
TOTAL HEALTH CARE | 22,950,733 | |||||||
INDUSTRIALS – 14.5% | ||||||||
Aerospace & Defense – 4.9% | ||||||||
| AAR Corp. (a) | 54,100 | 1,243,218 | ||||||
| Global Defense Technology & Systems, Inc. (a) | 86,700 | 1,427,082 | ||||||
| HEICO Corp. | 61,900 | 2,744,027 | ||||||
| 5,414,327 | ||||||||
Commercial Services & Supplies – 2.9% | ||||||||
| Cornell Companies, Inc. (a) | 68,400 | 1,552,680 | ||||||
| Healthcare Services Group, Inc. | 77,800 | 1,669,588 | ||||||
| 3,222,268 | ||||||||
Electrical Equipment – 1.4% | ||||||||
| Harbin Electric, Inc. (a) | 76,400 | 1,569,256 | ||||||
Machinery – 4.0% | ||||||||
| Manitowoc Co., Inc. / The | 124,500 | 1,241,265 | ||||||
| Nordson Corp. | 19,500 | 1,193,010 | ||||||
| SmartHeat, Inc. (a) | 130,900 | 1,900,668 | ||||||
| 4,334,943 | ||||||||
Professional Services – 1.3% | ||||||||
| ICF International, Inc. (a) | 52,900 | 1,417,720 | ||||||
TOTAL INDUSTRIALS | 15,958,514 | |||||||
INFORMATION TECHNOLOGY – 29.6% | ||||||||
Computers & Peripherals – 1.8% | ||||||||
| Compellent Technologies, Inc. (a) | 89,900 | 2,038,932 | ||||||
Internet Software & Services – 6.3% | ||||||||
| LivePerson, Inc. (a) | 306,700 | 2,137,699 | ||||||
| NIC, Inc. | 142,600 | 1,303,364 | ||||||
| Rackspace Hosting, Inc. (a) | 100,900 | 2,103,765 | ||||||
| VistaPrint Ltd. (a) | 25,600 | 1,450,496 | ||||||
| 6,995,324 | ||||||||
IT Services – 1.6% | ||||||||
| RightNow Technologies, Inc. (a) | 100,000 | 1,737,000 | ||||||
Semiconductor & Semiconductor Equipment – 6.3% | ||||||||
| Hittite Microwave Corp. (a) | 27,300 | 1,112,475 | ||||||
| Netlogic Microsystems, Inc. (a) | 32,500 | 1,503,450 | ||||||
(continued)
50
Ohio National Fund, Inc.
Millennium Portfolio (Continued)
Millennium Portfolio (Continued)
| Schedule of Investments | December 31, 2009 |
| Common Stocks – 96.3% | Shares | Value | ||||||
Semiconductor & Semiconductor Equipment (continued) | ||||||||
| Silicon Laboratories, Inc. (a) | 25,300 | $ | 1,223,002 | |||||
| Varian Semiconductor Equipment Associates, Inc. (a) | 34,900 | 1,252,212 | ||||||
| Veeco Instruments, Inc. (a) | 55,900 | 1,846,936 | ||||||
| 6,938,075 | ||||||||
Software – 13.6% | ||||||||
| ArcSight, Inc. (a) | 52,500 | 1,342,950 | ||||||
| AsiaInfo Holdings, Inc. (a) | 42,500 | 1,294,975 | ||||||
| Informatica Corp. (a) | 67,500 | 1,745,550 | ||||||
| Manhattan Associates, Inc. (a) | 48,800 | 1,172,664 | ||||||
| Nuance Communications, Inc. (a) | 73,100 | 1,135,974 | ||||||
| Solera Holdings, Inc. | 69,800 | 2,513,498 | ||||||
| Sourcefire, Inc. (a) | 64,300 | 1,720,025 | ||||||
| SuccessFactors, Inc. (a) | 76,600 | 1,270,028 | ||||||
| Taleo Corp. (a) | 55,900 | 1,314,768 | ||||||
| Ultimate Software Group, Inc. (a) | 50,700 | 1,489,059 | ||||||
| 14,999,491 | ||||||||
TOTAL INFORMATION TECHNOLOGY | 32,708,822 | |||||||
MATERIALS – 2.5% | ||||||||
Chemicals – 2.5% | ||||||||
| Nalco Holding Co. | 62,200 | 1,586,722 | ||||||
| NewMarket Corp. | 10,500 | 1,205,085 | ||||||
TOTAL MATERIALS | 2,791,807 | |||||||
Total Common Stocks (Cost $88,695,013) | $ | 106,253,086 | ||||||
| Money Market Funds – 2.9% | Shares | Value | ||||||
| Fidelity Institutional Money Market Funds Money Market Portfolio – Class I | 3,176,000 | $ | 3,176,000 | |||||
Total Money Market Funds (Cost $3,176,000) | $ | 3,176,000 | ||||||
Total Investments – 99.2% (Cost $91,871,013) (b) | $ | 109,429,086 | ||||||
Other Assets in Excess of Liabilities – 0.8% | 880,875 | |||||||
Net Assets – 100.0% | $ | 110,309,961 | ||||||
Percentages are stated as a percent of net assets.
Abbreviations:
ADR: American Depository Receipts
Footnotes:
| (a) | Non-income producing security. | |
| (b) | Represents cost for financial reporting purposes, which may differ from cost basis for Federal income tax purposes. See also Note 8 of the Notes to Financial Statements. |
The accompanying notes are an integral part of these financial statements.
51
Ohio National Fund, Inc.
Millennium Portfolio
Millennium Portfolio
Statement of Assets and Liabilities
December 31, 2009
| Assets: | ||||
| Investments in securities, at value (Cost $91,871,013) | $ | 109,429,086 | ||
| Cash | 41 | |||
| Receivable for securities sold | 1,482,942 | |||
| Receivable for fund shares sold | 132,390 | |||
| Dividends and accrued interest receivable | 23,260 | |||
| Prepaid expenses and other assets | 1,584 | |||
| Total assets | 111,069,303 | |||
| Liabilities: | ||||
| Payable for fund shares redeemed | 658,698 | |||
| Payable for investment management services | 73,029 | |||
| Payable for compliance services | 1,677 | |||
| Accrued custody expense | 915 | |||
| Accrued professional fees | 11,226 | |||
| Accrued accounting fees | 6,572 | |||
| Accrued printing and filing fees | 7,225 | |||
| Total liabilities | 759,342 | |||
| Net assets | $ | 110,309,961 | ||
| Net assets consist of: | ||||
| Par value, $1 per share | $ | 6,322,672 | ||
| Paid-in capital in excess of par value | 121,457,588 | |||
| Accumulated net realized loss on investments | (35,028,372 | ) | ||
| Net unrealized appreciation on investments | 17,558,073 | |||
| Net assets | $ | 110,309,961 | ||
| Shares outstanding | 6,322,672 | |||
| Authorized Fund shares allocated to Portfolio | 10,000,000 | |||
| Net asset value per share | $ | 17.45 | ||
Statement of Operations
For the Year Ended December 31, 2009
| Investment income: | ||||
| Interest | $ | 13,137 | ||
| Dividends | 152,461 | |||
| Total investment income | 165,598 | |||
| Expenses: | ||||
| Management fees | 506,793 | |||
| Custodian fees | 11,888 | |||
| Directors’ fees | 6,553 | |||
| Professional fees | 15,438 | |||
| Accounting fees | 28,615 | |||
| Printing and filing fees | 11,703 | |||
| Compliance expense | 6,376 | |||
| Other | 1,409 | |||
| Total expenses | 588,775 | |||
| Net investment loss | �� | (423,177 | ) | |
| Realized/unrealized gain (loss) on investments: | ||||
| Net realized gain (loss) on investments | (3,066,143 | ) | ||
| Change in unrealized appreciation/depreciation on investments | 19,615,280 | |||
| Net realized/unrealized gain (loss) on investments | 16,549,137 | |||
| Change in net assets from operations | $ | 16,125,960 | ||
The accompanying notes are an integral part of these financial statements.
52
Ohio National Fund, Inc.
Millennium Portfolio
Millennium Portfolio
Statements of Changes in Net Assets
| Years Ended December 31, | ||||||||
| 2009 | 2008 | |||||||
Increase (Decrease) in Net Assets: | ||||||||
| Operations: | ||||||||
| Net investment loss | $ | (423,177 | ) | $ | (367,189 | ) | ||
| Net realized gain (loss) on investments and foreign currency related transactions | (3,066,143 | ) | (13,216,336 | ) | ||||
| Change in unrealized appreciation/depreciation on investments | 19,615,280 | (14,574,651 | ) | |||||
| Change in net assets from operations | 16,125,960 | (28,158,176 | ) | |||||
| Capital transactions: | ||||||||
| Received from shares sold | 74,284,850 | 12,734,336 | ||||||
| Paid for shares redeemed | (14,306,497 | ) | (21,422,842 | ) | ||||
| Change in net assets from capital transactions | 59,978,353 | (8,688,506 | ) | |||||
| Change in net assets | 76,104,313 | (36,846,682 | ) | |||||
Net Assets: | ||||||||
| Beginning of year | 34,205,648 | 71,052,330 | ||||||
| End of year | $ | 110,309,961 | $ | 34,205,648 | ||||
Financial Highlights
| Years Ended December 31, | ||||||||||||||||||||
| 2009 | 2008 | 2007 | 2006 | 2005 | ||||||||||||||||
Selected Per-Share Data: | ||||||||||||||||||||
| Net asset value, beginning of year | $ | 14.44 | $ | 25.13 | $ | 19.94 | $ | 18.57 | $ | 18.57 | ||||||||||
| Operations: | ||||||||||||||||||||
| Net investment loss | (0.07 | ) | (0.16 | ) | (0.16 | ) | (0.13 | ) | (0.10 | ) | ||||||||||
| Net realized and unrealized gain (loss) on investments and foreign currency related transactions | 3.08 | (10.53 | ) | 5.35 | 1.50 | 0.10 | ||||||||||||||
| Total from operations | 3.01 | (10.69 | ) | 5.19 | 1.37 | — | ||||||||||||||
| Net asset value, end of year | $ | 17.45 | $ | 14.44 | $ | 25.13 | $ | 19.94 | $ | 18.57 | ||||||||||
Total return | 20.84 | % | –42.54 | % | 26.03 | % | 7.38 | % | 0.00 | % | ||||||||||
Ratios and supplemental data: | ||||||||||||||||||||
| Net assets at end of year (millions) | $ | 110.3 | $ | 34.2 | $ | 71.1 | $ | 62.6 | $ | 71.4 | ||||||||||
| Ratios to average net assets: | ||||||||||||||||||||
| Expenses | 0.93 | % | 0.92 | % | 0.89 | % | 0.89 | % | 0.90 | % | ||||||||||
| Net investment loss | –0.67 | % | –0.70 | % | –0.70 | % | –0.59 | % | –0.53 | % | ||||||||||
| Portfolio turnover rate | 248 | % | 224 | % | 156 | % | 219 | % | 179 | % | ||||||||||
The accompanying notes are an integral part of these financial statements.
53
Ohio National Fund, Inc.
International Small-Mid Company Portfolio
International Small-Mid Company Portfolio
Objective/Strategy
The International Small-Mid Company Portfolio seeks long-term growth of capital by investing at least 80% of its assets in equity securities of foreign small and mid-cap companies.
Performance as of December 31, 2009
Average Annual Total Returns: | ||||
| One year | 46.05% | |||
| Five years | 6.37% | |||
| Ten years | 0.60% |
Past performance does not guarantee future results. The performance data quoted represents past performance and current returns may be lower or higher. Total return figures include change in share price and reinvestment of dividends and capital gains. The investment return and principal value will fluctuate so that an investor’s shares, when redeemed may be worth more or less than the original cost. To obtain performance information up to the most recent month end, call toll-free 1-877-781-6392.
The Portfolio is not open to direct retail investment. Beneficial interest in shares is obtained solely by purchase of variable life insurance policies and variable annuity contracts. Actual performance results for variable annuity and variable universal life contracts will be lower due to contract charges. Consult your contract for applicable charges.
Comments
For the year ended December 31, 2009, the International Small-Mid Company Portfolio returned 46.05% versus 48.19% for the current benchmark, the S&P Developed Small Cap Ex-U.S. Growth Index.
The Portfolio remained well diversified amongst its holdings. However, the Industrials, Materials, and Information Technology sectors’ investments were over-weighted relative to the benchmark. The most significant changes to the Portfolio’s holdings were: 1) a further reduction in Japanese small cap exposure from the previous year to the lowest investment level in years, and 2) new opportunistic investments in the Financials sector which proved to be timely and profitable. Every sector contributed positively to the Portfolio’s performance in 2009.(1)
International small caps, as measured by the benchmark index, had another good year of performance. On a regional basis, the S&P Asia Pacific Ex-Japan Small Cap Growth Index had the best performance returning 95.98%. The S&P Europe Small Cap Growth Index rose 51.97%, while Japanese small caps posted the lowest return of all countries as the S&P Japan Small Cap Growth Index gained 7.50% during the year. The U.S. dollar depreciated against major foreign currencies. Over this year, the euro gained 2.5%, while the Canadian dollar rose 13.6% against the U.S. dollar. The Japanese yen fell 2.6% against the U.S. dollar while British sterling appreciated 10.8% versus the dollar.
Key drivers of the Portfolio’s positive performance came from the strong returns and relatively over-weighted investments in Industrials, Materials, and Financials. Individual stocks that contributed to the Portfolio’s performance included Aixtron AG, a German manufacturer of equipment for the semiconductor industry which is one of two major global players whose equipment is used in the manufacturing process of light-emitting diodes (LED). The stock gained 345.8% during the year. Also, Teck Resources Ltd., a Canadian integrated resource group, rose 436.9% during the year and Hong Kong Exchanges and Clearing Ltd., the Hong Kong stock market operator, gained 93.2% during the year.(1)
The Portfolio’s relative performance was hurt by its weaker investments in Spain, France, and Australia. Japanese small cap investments worked against the Portfolio as the market returns were not only single-digit, as cited earlier, but our investments produced negative returns coupled with an adverse currency move for the year. On a broader basis, weaker relative performance was delivered by investments in Health Care and Energy.(1)
Stocks that held back relative performance included: Gamesa Corporation Tecnologica S.A., a Spanish wind turbine manufacturer and developer of wind farms, which fell 43.12% during the year; Terumo Corp., a Japanese manufacturer and supplier of pharmaceuticals and medical equipment, which fell 26.57% during the year, and Sundrug Co. Ltd., a Japanese drug store chain, which was down 50.8% for the year.(1)
The depreciation of the U.S. dollar positively impacted the Portfolio’s performance as the Portfolio’s assets held in foreign currencies were unhedged and worth more when converted back to U.S. dollars.
As the global economy pulls out of the doldrums, we will continue to monitor our exposure to economically sensitive sectors, namely Industrials, Materials, and Consumer Discretionary as these sectors will participate in the ensuing recovery. Emerging markets continue to exhibit areas of continuing earnings growth.
| (1) | The Portfolio’s composition is subject to change. Holdings and weightings are as of December 31, 2009. |
54
Ohio National Fund, Inc.
International Small-Mid Company Portfolio (Continued)
International Small-Mid Company Portfolio (Continued)
Change in Value of $10,000 Investment
![[PERFORMANCE GRAPH]](https://capedge.com/proxy/N-CSR/0000950123-10-021904/l38589l3858943.gif)
Hypothetical illustration based on past performance. Future performance will vary. The Portfolios returns reflect reinvested dividends. The Portfolios holdings may differ significantly from the securities in the index. The index is unmanaged and therefore does not reflect the cost of portfolio management and accounting.
The S&P Developed Small Cap Ex-U.S. Growth Index. S&P Developed Small Cap Ex-U.S. Growth Index is a subset of the S&P Global Broad Market Index (BMI), a broad index including all publicly listed equities with float-adjusted market values of US$ 100 million or more and annual dollar value traded of at least US$ 50 million in all included countries. The Developed Small Cap component of the BMI includes the equities in the bottom 15% of the market capitalization within each “developed” local market. Ex-U.S. denotes the use of all developed markets excluding the United States. The “Growth” subset includes those companies in each local market that exhibit the characteristics of growth. The index presented includes the effects of reinvested dividends.
Portfolio Composition as of December 31, 2009 (1)
| % of Net Assets | |||
Common Stocks (3) | 96.1 | ||
| Exchange Traded Funds | 0.9 | ||
| Money Market Funds Less Net Liabilities | 3.0 | ||
| 100.0 | |||
Top 10 Portfolio Holdings as of December 31, 2009 (1) (2)
| % of Net Assets | |||||||
| 1. | SNC-Lavalin Group, Inc. | 1.9 | |||||
| 2. | Hochtief AG | 1.8 | |||||
| 3. | Kazakhmys PLC | 1.7 | |||||
| 4. | Aixtron AG | 1.7 | |||||
| 5. | Adecco SA | 1.6 | |||||
| 6. | Autonomy Corp. PLC | 1.6 | |||||
| 7. | AMEC PLC | 1.6 | |||||
| 8. | ASML Holding NV | 1.6 | |||||
| 9. | Teck Resources Ltd. | 1.6 | |||||
| 10. | Fibria Celulose SA – ADR | 1.6 | |||||
| (1) | Composition of Portfolio subject to change. | |
| (2) | Short-term investments have been excluded from the list of Top 10 Portfolio holdings. | |
| (3) | Top 10 country weightings: |
| % of Net Assets | |||
| United Kingdom | 14.8 | ||
| Germany | 10.0 | ||
| Brazil | 8.6 | ||
| Canada | 7.0 | ||
| Cayman Islands | 6.9 | ||
| South Korea | 5.9 | ||
| Hong Kong | 4.6 | ||
| Netherlands | 4.1 | ||
| France | 3.5 | ||
| Singapore | 3.5 | ||
55
Ohio National Fund, Inc.
International Small-Mid Company Portfolio
International Small-Mid Company Portfolio
| Schedule of Investments | December 31, 2009 |
| Common Stocks – 96.1% | Shares | Value | ||||||
United Kingdom – 14.8% | ||||||||
| Aggreko PLC (b) | 52,459 | $ | 783,142 | |||||
| AMEC PLC (b) | 90,433 | 1,152,162 | ||||||
| Antofagasta PLC (b) | 24,068 | 382,864 | ||||||
| ASOS PLC (a) (b) | 91,707 | 720,465 | ||||||
| Autonomy Corp. PLC (a) (b) | 47,467 | 1,152,710 | ||||||
| Capita Group PLC / The (b) | 52,972 | 640,512 | ||||||
| Cobham PLC (b) | 91,291 | 368,752 | ||||||
| Cookson Group PLC (a) (b) | 79,475 | 537,674 | ||||||
| ICAP PLC (b) | 102,724 | 708,493 | ||||||
| John Wood Group PLC (b) | 94,039 | 467,224 | ||||||
| Kazakhmys PLC (a) (b) | 57,716 | 1,222,053 | ||||||
| Logica PLC (b) | 136,314 | 249,401 | ||||||
| Rightmove PLC (b) | 77,227 | 627,128 | ||||||
| Rolls-Royce Group PLC (a) (b) | 61,367 | 477,892 | ||||||
| Smith & Nephew PLC (b) | 63,481 | 652,991 | ||||||
| Wellstream Holdings PLC (b) | 41,565 | 353,666 | ||||||
| 10,497,129 | ||||||||
Germany – 10.0% | ||||||||
| Adidas AG (b) | 13,334 | 725,493 | ||||||
| Aixtron AG (b) | 36,600 | 1,219,557 | ||||||
| Deutsche Postbank AG (a) (b) | 18,314 | 597,766 | ||||||
| GEA Group AG (b) | 43,892 | 976,483 | ||||||
| Gildemeister AG (b) | 28,627 | 456,009 | ||||||
| Hochtief AG (b) | 16,745 | 1,267,550 | ||||||
| Leoni AG (b) | 32,430 | 752,767 | ||||||
| Stada Arzneimittel AG (b) | 15,422 | 535,827 | ||||||
| Wirecard AG (b) | 42,903 | 591,995 | ||||||
| 7,123,447 | ||||||||
Brazil – 8.6% | ||||||||
| CETIP SA – Balcao Organizado de Ativos e Derivativos | 42,500 | 347,860 | ||||||
| Cyrela Brazil Realty SA | 48,700 | 685,324 | ||||||
| Diagnosticos da America SA | 18,400 | 602,307 | ||||||
| Fibria Celulose SA – ADR | 48,338 | 1,104,040 | ||||||
| Fleury SA (a) | 51,200 | 540,820 | ||||||
| Gafisa SA – ADR | 22,900 | 741,044 | ||||||
| Hypermarcas SA (a) | 27,300 | 627,226 | ||||||
| Lojas Renner SA | 31,800 | 717,829 | ||||||
| MRV Engenharia e Participacoes SA | 88,500 | 716,743 | ||||||
| 6,083,193 | ||||||||
Canada – 7.0% | ||||||||
| Agrium, Inc. | 13,200 | 825,686 | ||||||
| HudBay Minerals, Inc. (a) | 65,600 | 851,166 | ||||||
| SNC-Lavalin Group, Inc. | 25,818 | 1,332,805 | ||||||
| Teck Resources Ltd. (a) | 32,000 | 1,126,586 | ||||||
| Thompson Creek Metals Co., Inc. (a) | 72,400 | 848,528 | ||||||
| 4,984,771 | ||||||||
Cayman Islands – 6.9% | ||||||||
| 361 Degrees International Ltd. (b) | 486,400 | 284,283 | ||||||
| Anta Sports Products Ltd. (b) | 554,119 | 817,160 | ||||||
| Comba Telecom Systems Holdings Ltd. (b) | 647,570 | 752,127 | ||||||
| Giant Interactive Group, Inc. – ADR | 80,100 | 562,302 | ||||||
| Hengan International Group Co. Ltd. (b) | 92,000 | 681,190 | ||||||
| Inspur International Ltd. (b) | 2,919,400 | 415,031 | ||||||
| Lee & Man Paper Manufacturing Ltd. (a) (c) | 854,400 | 589,553 | ||||||
| Parkson Retail Group Ltd. (b) | 286,000 | 503,278 | ||||||
| PCD Stores Ltd. (a) (c) | 844,000 | 327,655 | ||||||
| 4,932,579 | ||||||||
South Korea – 5.9% | ||||||||
| Cheil Worldwide, Inc. (b) | 1,980 | 536,218 | ||||||
| Hynix Semiconductor, Inc. (a) (b) | 28,410 | 564,968 | ||||||
| Hyundai Engineering & Construction Co. Ltd. (b) | 9,405 | 570,492 | ||||||
| LG Corp. (b) | 12,400 | 774,537 | ||||||
| LG Display Co. Ltd. (b) | 25,690 | 868,589 | ||||||
| Samsung Electro-Mechanics Co. Ltd. (b) | 5,566 | 511,886 | ||||||
| Samsung Techwin Co. Ltd. (b) | 4,570 | 356,350 | ||||||
| 4,183,040 | ||||||||
Hong Kong – 4.6% | ||||||||
| China Everbright International Ltd. (b) | 1,527,000 | 781,325 | ||||||
| China Merchants Holdings International Co. Ltd. (b) | 208,000 | 670,995 | ||||||
| Dah Sing Financial Holdings Ltd. (a) (b) | 84,000 | 462,865 | ||||||
| Techtronic Industries Co. (b) | 694,000 | 575,304 | ||||||
| Wing Hang Bank Ltd. (b) | 81,000 | 753,820 | ||||||
| 3,244,309 | ||||||||
Netherlands – 4.1% | ||||||||
| ASML Holding NV (b) | 33,358 | 1,138,903 | ||||||
| Fugro NV (b) | 9,699 | 557,104 | ||||||
| Imtech NV (b) | 26,753 | 720,911 | ||||||
| QIAGEN NV (a) (b) | 21,126 | 475,464 | ||||||
| 2,892,382 | ||||||||
France – 3.5% | ||||||||
| BioMerieux (b) | 1,963 | 229,353 | ||||||
| Cap Gemini SA (b) | 8,860 | 404,195 | ||||||
| Faiveley SA (b) | 5,346 | 425,517 | ||||||
| Faurecia (a) (b) | 24,955 | 545,748 | ||||||
| Saft Groupe SA (b) | 17,795 | 857,174 | ||||||
| 2,461,987 | ||||||||
Singapore – 3.5% | ||||||||
| Ezra Holdings Ltd. (a) (b) | 468,000 | 749,081 | ||||||
| Ho Bee Investment Ltd. (b) | 477,000 | 581,735 | ||||||
| Keppel Land Ltd. (b) | 201,700 | 498,425 | ||||||
| SembCorp Marine Ltd. (b) | 242,000 | 631,417 | ||||||
| 2,460,658 | ||||||||
Bermuda – 3.3% | ||||||||
| Aquarius Platinum Ltd. (a) (b) | 100,970 | 658,072 | ||||||
| Invesco Ltd. | 25,648 | 602,472 | ||||||
| Nine Dragons Paper Holdings Ltd. (b) | 324,622 | 517,794 | ||||||
| Ports Design Ltd. (b) | 192,000 | 591,980 | ||||||
| 2,370,318 | ||||||||
Spain – 3.2% | ||||||||
| Indra Sistemas SA (b) | 28,007 | 662,926 | ||||||
| Obrascon Huarte Lain SA (b) | 30,330 | 816,080 | ||||||
| Tecnicas Reunidas SA (b) | 13,566 | 780,181 | ||||||
| 2,259,187 | ||||||||
(continued)
56
Ohio National Fund, Inc.
International Small-Mid Company Portfolio (Continued)
International Small-Mid Company Portfolio (Continued)
| Schedule of Investments | December 31, 2009 |
| Common Stocks – 96.1% | Shares | Value | ||||||
China – 2.8% | ||||||||
| China South Locomotive and Rolling Stock Corp. (b) | 1,264,600 | $ | 923,497 | |||||
| Shandong Weigao Group Medical Polymer Co. Ltd. (b) | 133,901 | 446,255 | ||||||
| Zhuzhou CSR Times Electric Co. Ltd. (b) | 286,800 | 585,247 | ||||||
| 1,954,999 | ||||||||
Switzerland – 2.5% | ||||||||
| Actelion Ltd. (a) (b) | 11,264 | 601,615 | ||||||
| Adecco SA (b) | 20,949 | 1,155,651 | ||||||
| 1,757,266 | ||||||||
Italy – 2.2% | ||||||||
| DiaSorin SpA (b) | 5,793 | 205,880 | ||||||
| Sorin SpA (a) (b) | 130,535 | 248,663 | ||||||
| Trevi Finanziaria SpA (b) | 35,832 | 567,162 | ||||||
| Yoox SpA (a) (c) | 69,300 | 518,581 | ||||||
| 1,540,286 | ||||||||
Sweden – 1.6% | ||||||||
| Assa Abloy AB (b) | 37,000 | 712,805 | ||||||
| Getinge AB (b) | 20,613 | 393,956 | ||||||
| 1,106,761 | ||||||||
Russia – 1.3% | ||||||||
| Wimm-Bill-Dann Foods OJSC – ADR (a) | 39,200 | 934,136 | ||||||
Turkey – 1.2% | ||||||||
| Turkiye Halk Bankasi AS (b) | 110,500 | 884,493 | ||||||
Norway – 1.2% | ||||||||
| Fred Olsen Energy ASA (b) | 11,000 | 421,272 | ||||||
| Yara International ASA (b) | 9,550 | 432,569 | ||||||
| 853,841 | ||||||||
Israel – 1.2% | ||||||||
| NICE Systems Ltd. – ADR (a) | 27,500 | 853,600 | ||||||
Austria – 1.0% | ||||||||
| Andritz AG (b) | 12,738 | 734,361 | ||||||
Ireland – 1.0% | ||||||||
| Ingersoll-Rand PLC | 20,300 | 725,522 | ||||||
Thailand – 0.9% | ||||||||
| Banpu PCL (b) | 38,200 | 661,704 | ||||||
Gibraltar – 0.9% | ||||||||
| PartyGaming PLC (a) (b) | 150,939 | 630,739 | ||||||
Chile – 0.8% | ||||||||
| Sociedad Quimica y Minera de Chile SA – ADR Series B | 16,200 | 608,634 | ||||||
Luxembourg – 0.8% | ||||||||
| Millicom International Cellular SA (a) | 8,100 | 597,537 | ||||||
Japan – 0.5% | ||||||||
| JGC Corp. (b) | 21,000 | 386,981 | ||||||
Denmark – 0.4% | ||||||||
| H Lundbeck A/S (b) | 16,500 | 298,108 | ||||||
Mexico – 0.4% | ||||||||
| Genomma Lab Internacional SA de CV (a) | 133,100 | 292,918 | ||||||
Total Common Stocks (Cost $50,557,350) | $ | 68,314,886 | ||||||
| Exchange Traded Funds – 0.9% | Shares | Value | ||||||
| iShares MSCI Emerging Markets Index Fund | 15,720 | $ | 652,380 | |||||
Total Exchange Traded Funds (Cost $382,427) | $ | 652,380 | ||||||
| Money Market Funds – 3.0% | Shares | Value | ||||||
| State Street Institutional Liquid Reserves Fund Institutional Class 2 | 2,115,321 | $ | 2,115,321 | |||||
Total Money Market Funds (Cost $2,115,321) | $ | 2,115,321 | ||||||
Total Investments – 100.0% (Cost $53,055,098) (d) | $ | 71,082,587 | ||||||
Liabilities in Excess of Other Assets – (0.0%) | (18,317 | ) | ||||||
Net Assets – 100.0% | $ | 71,064,270 | ||||||
Percentages are stated as a percent of net assets.
Abbreviations:
ADR: American Depository Receipts
Footnotes:
| (a) | Non-Income producing security. | |
| (b) | Security traded on a foreign exchange has been valued at an estimate of fair value that is different than the local market close price. These fair value estimates are determined by an independent national fair valuation service that has been approved by the Board. These securities represent $50,634,012 or 71.3% of the Portfolio’s net assets. | |
| (c) | As discussed in Note 2 of the Notes to Financial Statements, not all investments that are traded on a foreign exchange are valued at an estimate that is different from the local close price. In some instances the independent fair valuation service uses the local close price because the confidence interval associated with an investment is below the 75% threshold. These securities represent $1,435,789 or 2.0% of the Portfolio’s net assets. |
| Other Portfolio securities are not subjected to fair valuation procedures because they are traded on domestic or foreign exchanges whose local close times are consistent with the U.S. market close, normally 4:00 pm Eastern Time. |
| (d) | Represents cost for financial reporting purposes, which may differ from cost basis for Federal income tax purposes. See also Note 8 of the Notes to Financial Statements. |
(continued)
57
Ohio National Fund, Inc.
International Small-Mid Company Portfolio (Continued)
International Small-Mid Company Portfolio (Continued)
| Schedule of Investments | December 31, 2009 |
| Sector Classifications: |
| Industrials | 27.1% | ||
| Consumer Discretionary | 15.5% | ||
| Information Technology | 14.0% | ||
| Materials | 12.9% | ||
| Health Care | 7.8% | ||
| Financials | 7.6% | ||
| Energy | 7.2% | ||
| Consumer Staples | 3.2% | ||
| Telecommunication Services | 0.8% | ||
| 96.1% | |||
The accompanying notes are an integral part of these financial statements.
58
Ohio National Fund, Inc.
International Small-Mid Company Portfolio
International Small-Mid Company Portfolio
Statement of Assets and Liabilities
December 31, 2009
| Assets: | ||||
| Investments in securities, at value (Cost $53,055,098) | $ | 71,082,587 | ||
| Foreign currency (Cost $2) | 2 | |||
| Receivable for securities sold | 5,947 | |||
| Receivable for fund shares sold | 124,492 | |||
| Dividends and accrued interest receivable | 33,147 | |||
| Foreign tax reclaim receivable | 42,482 | |||
| Prepaid expenses and other assets | 1,100 | |||
| Total assets | 71,289,757 | |||
| Liabilities: | ||||
| Payable for fund shares redeemed | 92,595 | |||
| Payable for investment management services | 59,430 | |||
| Accrued for compliance services | 1,674 | |||
| Accrued custody expense | 9,848 | |||
| Accrued professional fees | 11,179 | |||
| Accrued accounting fees | 2,085 | |||
| Accrued printing and filing fees | 4,637 | |||
| Foreign taxes payable | 44,039 | |||
| Total liabilities | 225,487 | |||
| Net assets | $ | 71,064,270 | ||
| Net assets consist of: | ||||
| Par value, $1 per share | $ | 3,661,246 | ||
| Paid-in capital in excess of par value | 76,503,745 | |||
| Accumulated net realized loss on investments | (27,205,986 | ) | ||
| Net unrealized appreciation/depreciation on: | ||||
| Investments | 18,027,489 | |||
| Foreign currency related transactions | (1,480 | ) | ||
| Undistributed net investment income | 79,256 | |||
| Net assets | $ | 71,064,270 | ||
| Shares outstanding | 3,661,246 | |||
| Authorized Fund shares allocated to Portfolio | 10,000,000 | |||
| Net asset value per share | $ | 19.41 | ||
Statement of Operations
For the Year Ended December 31, 2009
| Investment income: | ||||
| Interest | $ | 1,409 | ||
| Dividends (net of $123,194 foreign taxes withheld) | 1,020,116 | |||
| Total investment income | 1,021,525 | |||
| Expenses: | ||||
| Management fees | 582,867 | |||
| Custodian fees | 72,819 | |||
| Directors’ fees | 6,183 | |||
| Professional fees | 15,108 | |||
| Accounting fees | 53,030 | |||
| Printing and filing fees | 9,668 | |||
| Compliance expense | 6,376 | |||
| Other | 1,888 | |||
| Total expenses | 747,939 | |||
| Net investment income | 273,586 | |||
| Realized/unrealized gain (loss) on investments, foreign currency contracts, and other foreign currency related transactions: | ||||
| Net realized gain (loss) on: | ||||
| Investments | (1,170,899 | ) | ||
| Foreign currency contracts | 11,798 | |||
| Foreign currency related transactions | (138,738 | ) | ||
| Change in unrealized appreciation/depreciation on: | ||||
| Investments | 23,579,074 | |||
| Foreign currency related transactions | 2,387 | |||
| Net realized/unrealized gain (loss) on investments, foreign currency contracts, and other foreign currency related transactions | 22,283,622 | |||
| Change in net assets from operations | $ | 22,557,208 | ||
The accompanying notes are an integral part of these financial statements.
59
Ohio National Fund, Inc.
International Small-Mid Company Portfolio
International Small-Mid Company Portfolio
Statements of Changes in Net Assets
| Years Ended December 31, | ||||||||
| 2009 | 2008 | |||||||
Increase (Decrease) in Net Assets: | ||||||||
| Operations: | ||||||||
| Net investment income | $ | 273,586 | $ | 314,969 | ||||
| Net realized gain (loss) on investments, foreign currency contracts, and other foreign currency related transactions | (1,297,839 | ) | (26,268,151 | ) | ||||
| Change in unrealized appreciation/depreciation on investments and foreign currency related transactions | 23,581,461 | (31,078,310 | ) | |||||
| Change in net assets from operations | 22,557,208 | (57,031,492 | ) | |||||
| Capital transactions: | ||||||||
| Received from shares sold | 16,188,203 | 32,910,125 | ||||||
| Paid for shares redeemed | (20,381,525 | ) | (36,157,399 | ) | ||||
| Change in net assets from capital transactions | (4,193,322 | ) | (3,247,274 | ) | ||||
| Change in net assets | 18,363,886 | (60,278,766 | ) | |||||
Net Assets: | ||||||||
| Beginning of year | 52,700,384 | 112,979,150 | ||||||
| End of year | $ | 71,064,270 | $ | 52,700,384 | ||||
| Undistributed net investment income (Accumulated net investment loss) | $ | 79,256 | $ | (67,390 | ) | |||
Financial Highlights
| Years Ended December 31, | ||||||||||||||||||||
| 2009 | 2008 | 2007 | 2006 | 2005 | ||||||||||||||||
Selected Per-Share Data: | ||||||||||||||||||||
| Net asset value, beginning of year | $ | 13.29 | $ | 27.29 | $ | 23.23 | $ | 18.87 | $ | 14.69 | ||||||||||
| Operations: | ||||||||||||||||||||
| Net investment income (loss) | 0.07 | 0.08 | 0.07 | (0.01 | ) | 0.03 | ||||||||||||||
| Net realized and unrealized gain (loss) on investments, foreign currency contracts, and other foreign currency related transactions | 6.05 | (14.08 | ) | 3.99 | 4.98 | 4.23 | ||||||||||||||
| Total from operations | 6.12 | (14.00 | ) | 4.06 | 4.97 | 4.26 | ||||||||||||||
| Distributions: | ||||||||||||||||||||
| Distributions from net investment income | — | — | — | (0.03 | ) | (0.08 | ) | |||||||||||||
| Distributions of net realized capital gains | — | — | — | (0.58 | ) | — | ||||||||||||||
| Total distributions | — | — | — | (0.61 | ) | (0.08 | ) | |||||||||||||
| Net asset value, end of year | $ | 19.41 | $ | 13.29 | $ | 27.29 | $ | 23.23 | $ | 18.87 | ||||||||||
Total return | 46.05 | % | –51.30 | % | 17.48 | % | 26.35 | % | 28.99 | % | ||||||||||
Ratios and supplemental data: | ||||||||||||||||||||
| Net assets at end of year (millions) | $ | 71.1 | $ | 52.7 | $ | 113.0 | $ | 75.4 | $ | 49.9 | ||||||||||
| Ratios to average net assets: | ||||||||||||||||||||
| Expenses | 1.28 | % | 1.19 | % | 1.29 | % | 1.34 | % | 1.47 | % | ||||||||||
| Net investment income (loss) | 0.47 | % | 0.36 | % | 0.27 | % | –0.01 | % | 0.36 | % | ||||||||||
| Portfolio turnover rate | 125 | % | 75 | % | 53 | % | 69 | % | 85 | % | ||||||||||
The accompanying notes are an integral part of these financial statements.
60
Ohio National Fund, Inc.
Aggressive Growth Portfolio
Aggressive Growth Portfolio
Objective/Strategy
The Aggressive Growth Portfolio seeks long-term capital growth by investing primarily in equity securities with attractive growth opportunities.
Performance as of December 31, 2009
Average Annual Total Returns: | ||||
| One year | 42.61% | |||
| Five years | 4.51% | |||
| Ten years | -4.39% |
Past performance does not guarantee future results. The performance data quoted represents past performance and current returns may be lower or higher. Total return figures include change in share price and reinvestment of dividends and capital gains. The investment return and principal value will fluctuate so that an investor’s shares, when redeemed may be worth more or less than the original cost. To obtain performance information up to the most recent month end, call toll-free 1-877-781-6392.
The Portfolio is not open to direct retail investment. Beneficial interest in shares is obtained solely by purchase of variable life insurance policies and variable annuity contracts. Actual performance results for variable annuity and variable universal life contracts will be lower due to contract charges. Consult your contract for applicable charges.
Comments
For the year ended December 31, 2009, the Aggressive Growth Portfolio returned 42.61% versus 26.46% for the current benchmark, the S&P 500 Index.
Equity markets began the year in the midst of a significant sell-off, a continuation from the credit crisis that hit all capital markets severely in late 2008. Most indices touched the low point for the year in mid-March as evidence of an above-average contraction in the U.S. economy continued to unfold. Amid signs of stabilization in the economy and global financial system, markets rebounded strongly for much of the year. Despite a brief and slight pullback in October, broad indices finished the year significantly higher. For the year, mid cap stocks easily outpaced small and large cap stocks, which performed similarly. Growth-style indices also out-performed value indices, as Information Technology was easily the best performing sector within the S&P 500 Index followed distantly by Materials. Telecommunication Services and Utilities were relative laggards. Commodities generally were much higher during the year, led by industrial metals and crude oil. Natural gas finished the year with modest losses while gold futures touched record highs in December.
Holdings within Information Technology and Telecommunication Services were the largest contributors to relative results. In terms of detractors, our selections within Health Care and a relative under-weight in the Consumer Discretionary sector provided the largest drag on relative results in 2009.(1)
Apple, Inc. topped the individual stock performers. The company was a winning position for the Portfolio for much of the year. It has been gaining market share in the PC market during a period of soft economic growth. Its iPhone and other portable devices have been market leaders as well. We believe Apple, Inc. is still early in its market share gains, particularly in the high-end PC market. We also think its iPhone will remain a dominant device in the smart phone wireless market, an area we think will continue to expand.(1)
Global brewer Anheuser-Busch InBev performed well for the Portfolio for much of 2009. It has benefited from asset sales, cost cutting measures and strong earnings. We think the company will continue to make operating improvements. We like its dominant global presence in a market that has favorable pricing trends in our view. We believe there is a multi-year opportunity for the beer industry to see more rational pricing, making it an attractive industry to us. Anheuser-Busch InBev is well positioned in our opinion given its dominant market share in the U.S. and Brazil, two of the most profitable beer markets in the world.(1)
Wireless tower company Crown Castle International Corp. continued to be a top performer for the Portfolio amid growing need for mobile phone companies to expand/upgrade wireless network capacity due to rising demand for data transmission. We think growing smart phone usage will continue to be a driver of this trend and that Crown Castle International Corp. is well positioned to benefit as it will likely translate into more tenants on each of the company’s towers.(1)
Biopharmaceutical company Gilead Sciences, Inc. was the largest individual detractor during 2009 amid uncertainty surrounding health-care reform. Despite this uncertainty, we believe Gilead Sciences, Inc. has a strong differentiated drug franchise with its HIV-fighting drug Truvada. We also think the market for this drug is large and growing given indications of increased effectiveness when used earlier in treatment.(1)
The remaining top detractors included positions we exited during the year in favor of our higher conviction names or better opportunities elsewhere. FedEx Corp. and Switzerland-based bank investment manager UBS AG were among this list. Wells Fargo & Co., a regional bank, was weak early in the year amid concerns over its capital needs. We liked Wells Fargo & Co. given our belief that it would be a survivor of the credit crisis. However, we decided to exit the position because of the potential for problems with parts of its loan portfolio and the possible need for additional capital. We felt there were better opportunities within the Financials sector.(1)
First Solar, Inc. also declined during the year. The company designs and manufactures solar modules using a thin film semiconductor technology. We were attracted to the low cost manufacturer, but recent long-term contracts it signed clouds its sales prospects and profitability in our view. We sold this position given the lack of transparency.(1)
In terms of positioning, we were over-weighted in Information Technology and Health Care while under-weighted in Energy and Consumer Discretionary. We continue to focus on businesses we believe have multi-year opportunities to grow market share and improve margins. Overall, we have been favoring higher quality, less cyclical names in the Portfolio. These are companies we view as having clean balance sheets and strong cash flows and being typically less economically sensitive.(1)
(continued)
61
Ohio National Fund, Inc.
Aggressive Growth Portfolio (Continued)
Aggressive Growth Portfolio (Continued)
We believe the U.S. economy continues to face challenges, despite economic data continuing to point to a recovery. While a collapse of the financial system has been averted, the foundations for a recovery in the U.S. are lacking in our view. Unemployment and underemployment remain big concerns. Banks still seem reluctant to lend and falling commercial real estate values appear to be a drag on lending growth. We believe the developing world, particularly East Asia, South America and the Middle East, is showing strong growth in corporate and consumer spending. In addition, strong government and private-sector balance sheets seem capable of driving continued growth despite weakness in the U.S. and Western Europe. That said, we are concerned that many stock valuations at year end reflected optimistic assumptions about the economic environment.
We favor companies that we think have a distinct competitive advantage or “moat” and whose performance is more likely to be driven by company-specific fundamentals than the macroeconomic environment. Many of the Portfolio’s holdings have taken advantage of dislocations in the financial markets and real economy to improve their competitive positions. We believe that positions them well to drive market share and profitability gains in most any economic environment.(1)
| (1) | The Portfolio’s composition is subject to change. Holdings and weightings are as of December 31, 2009. |
Change in Value of $10,000 Investment
![[PERFORMANCE GRAPH]](https://capedge.com/proxy/N-CSR/0000950123-10-021904/l38589l3858944.gif)
Hypothetical illustration based on past performance. Future performance will vary. The Portfolio’s returns reflect reinvested dividends. The Portfolio’s holdings may differ significantly from the securities in the index. The index is unmanaged and therefore does not reflect the cost of portfolio management and accounting.
The S&P 500 Index is a capitalization-weighted index designed to measure performance of the broad domestic economy through changes in the aggregate market value of 500 stocks representing all major industries. The index presented herein includes the effects of reinvested dividends.
Portfolio Composition as of December 31, 2009 (1)
| % of Net Assets | |||
Common Stocks (3) | 90.2 | ||
Preference Shares (Brazil) (3) | 1.1 | ||
Preferred Stocks (3) | 1.5 | ||
| Money Market Funds Less Net Liabilities | 7.2 | ||
| 100.0 | |||
Top 10 Portfolio Holdings as of December 31, 2009 (1) (2)
| % of Net Assets | |||||||
| 1. | Apple, Inc. | 5.7 | |||||
| 2. | Anheuser-Busch InBev | 5.4 | |||||
| 3. | Celgene Corp. | 4.5 | |||||
| 4. | Cisco Systems, Inc. | 4.3 | |||||
| 5. | Gilead Sciences, Inc. | 4.2 | |||||
| 6. | Crown Castle International Corp. | 3.9 | |||||
| 7. | Corning, Inc. | 3.8 | |||||
| 8. | Oracle Corp. | 3.7 | |||||
| 9. | Davide Campari-Milano SpA | 3.0 | |||||
| 10. | CVS Caremark Corp. | 3.0 | |||||
| (1) | Composition of Portfolio subject to change. | |
| (2) | Short-term investments have been excluded from the list of Top 10 Portfolio holdings. | |
| (3) | Sectors (combined): |
| % of Net Assets | |||
| Information Technology | 33.9 | ||
| Financials | 14.4 | ||
| Consumer Staples | 14.3 | ||
| Health Care | 12.4 | ||
| Telecommunication Services | 7.1 | ||
| Consumer Discretionary | 3.6 | ||
| Energy | 2.7 | ||
| Materials | 2.4 | ||
| Industrials | 2.0 | ||
| 92.8 | |||
62
Ohio National Fund, Inc.
Aggressive Growth Portfolio
Aggressive Growth Portfolio
| Schedule of Investments | December 31, 2009 |
| Common Stocks – 90.2% | Shares | Value | ||||||
CONSUMER DISCRETIONARY – 3.6% | ||||||||
Media – 2.9% | ||||||||
| News Corp. Class A | 58,895 | $ | 806,272 | |||||
Multiline Retail – 0.7% | ||||||||
| Kohl’s Corp. (a) | 3,420 | 184,441 | ||||||
TOTAL CONSUMER DISCRETIONARY | 990,713 | |||||||
CONSUMER STAPLES – 14.3% | ||||||||
Beverages – 8.4% | ||||||||
| Anheuser-Busch InBev (b) | 28,347 | 1,467,442 | ||||||
| Davide Campari-Milano SpA (b) | 78,060 | 815,487 | ||||||
| 2,282,929 | ||||||||
Food & Staples Retailing – 3.0% | ||||||||
| CVS Caremark Corp. | 25,139 | 809,727 | ||||||
Household Products – 1.8% | ||||||||
| Colgate-Palmolive Co. | 3,080 | 253,022 | ||||||
| Reckitt Benckiser Group PLC (b) | 4,535 | 245,480 | ||||||
| 498,502 | ||||||||
Personal Products – 1.1% | ||||||||
| Mead Johnson Nutrition Co. | 6,825 | 298,253 | ||||||
TOTAL CONSUMER STAPLES | 3,889,411 | |||||||
ENERGY – 1.6% | ||||||||
Oil, Gas & Consumable Fuels – 1.6% | ||||||||
| Petroleo Brasileiro SA – ADR | 9,295 | 443,186 | ||||||
TOTAL ENERGY | 443,186 | |||||||
FINANCIALS – 12.9% | ||||||||
Capital Markets – 1.7% | ||||||||
| Charles Schwab Corp. / The | 2,167 | 40,783 | ||||||
| Goldman Sachs Group, Inc. / The | 2,465 | 416,191 | ||||||
| 456,974 | ||||||||
Commercial Banks – 2.2% | ||||||||
| CapitalSource, Inc. | 46,134 | 183,152 | ||||||
| Standard Chartered PLC (b) | 16,808 | 424,332 | ||||||
| 607,484 | ||||||||
Diversified Financial Services – 6.9% | ||||||||
| Bank of America Corp. | 41,160 | 619,870 | ||||||
| CME Group, Inc. | 1,355 | 455,212 | ||||||
| JPMorgan Chase & Co. | 13,315 | 554,836 | ||||||
| MarketAxess Holdings, Inc. | 16,755 | 232,894 | ||||||
| 1,862,812 | ||||||||
Insurance – 1.4% | ||||||||
| ACE Ltd. | 7,595 | 382,788 | ||||||
Real Estate Management & Development – 0.7% | ||||||||
| Hang Lung Properties Ltd. (b) | 48,000 | 188,177 | ||||||
TOTAL FINANCIALS | 3,498,235 | |||||||
HEALTH CARE – 12.4% | ||||||||
Biotechnology – 9.5% | ||||||||
| Celgene Corp. (a) | 21,765 | 1,211,875 | ||||||
| Gilead Sciences, Inc. (a) | 26,600 | 1,151,248 | ||||||
| Vertex Pharmaceuticals, Inc. (a) | 4,930 | 211,251 | ||||||
| 2,574,374 | ||||||||
Health Care Equipment & Supplies – 1.6% | ||||||||
| Intuitive Surgical, Inc. (a) | 1,494 | 453,160 | ||||||
Pharmaceuticals – 1.3% | ||||||||
| Roche Holdings AG (b) | 2,032 | 347,498 | ||||||
TOTAL HEALTH CARE | 3,375,032 | |||||||
INDUSTRIALS – 2.0% | ||||||||
Air Freight & Logistics – 1.1% | ||||||||
| United Parcel Service, Inc. Class B | 5,190 | 297,750 | ||||||
Professional Services – 0.9% | ||||||||
| CoStar Group, Inc. (a) | 5,870 | 245,190 | ||||||
TOTAL INDUSTRIALS | 542,940 | |||||||
INFORMATION TECHNOLOGY – 33.9% | ||||||||
Communications Equipment – 8.6% | ||||||||
| Cisco Systems, Inc. (a) | 48,660 | 1,164,920 | ||||||
| QUALCOMM, Inc. | 10,065 | 465,607 | ||||||
| Research In Motion Ltd. (a) | 10,572 | 714,033 | ||||||
| 2,344,560 | ||||||||
Computers & Peripherals – 5.8% | ||||||||
| Apple, Inc. (a) | 7,409 | 1,562,262 | ||||||
Electronic Equipment, Instruments & Components – 6.6% | ||||||||
| Amphenol Corp. Class A | 3,503 | 161,769 | ||||||
| Corning, Inc. | 53,375 | 1,030,671 | ||||||
| Trimble Navigation Ltd. (a) | 23,870 | 601,524 | ||||||
| 1,793,964 | ||||||||
Internet Software & Services – 9.2% | ||||||||
| AOL, Inc. (a) | 23,295 | 542,308 | ||||||
| Equinix, Inc. (a) | 4,595 | 487,759 | ||||||
| Google, Inc. Class A (a) | 1,130 | 700,577 | ||||||
| VistaPrint N.V. (a) | 8,160 | 462,346 | ||||||
| Yahoo, Inc. (a) | 18,616 | 312,376 | ||||||
| 2,505,366 | ||||||||
Software – 3.7% | ||||||||
| Oracle Corp. | 40,615 | 996,692 | ||||||
TOTAL INFORMATION TECHNOLOGY | 9,202,844 | |||||||
MATERIALS – 2.4% | ||||||||
Chemicals – 1.0% | ||||||||
| Israel Chemicals Ltd. (b) | 20,223 | 265,550 | ||||||
Metals & Mining – 1.4% | ||||||||
| Vale SA – ADR | 13,555 | 393,502 | ||||||
TOTAL MATERIALS | 659,052 | |||||||
TELECOMMUNICATION SERVICES – 7.1% | ||||||||
Diversified Telecommunication Services – 1.4% | ||||||||
| tw telecom, Inc. (a) | 22,005 | 377,165 | ||||||
Wireless Telecommunication Services – 5.7% | ||||||||
| America Movil S.A.B. de C.V. – ADR | 4,790 | 225,034 | ||||||
(continued)
63
Ohio National Fund, Inc.
Aggressive Growth Portfolio (Continued)
Aggressive Growth Portfolio (Continued)
| Schedule of Investments | December 31, 2009 |
| Common Stocks – 90.2% | Shares | Value | ||||||
Wireless Telecommunication Services (continued) | ||||||||
| Cellcom Israel Ltd. | 8,420 | $ | 269,945 | |||||
| Crown Castle International Corp. (a) | 26,860 | 1,048,615 | ||||||
| 1,543,594 | ||||||||
TOTAL TELECOMMUNICATION SERVICES | 1,920,759 | |||||||
Total Common Stocks (Cost $21,426,120) | $ | 24,522,172 | ||||||
| Preference Shares (Brazil) – 1.1% | Shares | Value | ||||||
ENERGY – 1.1% | ||||||||
Oil, Gas & Consumable Fuels – 1.1% | ||||||||
| Petroleo Brasileiro SA – ADR | 6,804 | $ | 288,421 | |||||
Total Preference Shares (Brazil) (Cost $258,784) | $ | 288,421 | ||||||
| Preferred Stocks – 1.5% | Shares | Value | ||||||
FINANCIALS – 1.5% | ||||||||
Diversified Financial Services – 1.5% | ||||||||
| Bank of America Corp. | ||||||||
| 10.000%, convertible until 12/31/2049 | 27,405 | $ | 408,883 | |||||
Total Preferred Stocks (Cost $411,075) | $ | 408,883 | ||||||
| VVPR Strips — 0.0% (c) | Quantity | Value | ||||||
CONSUMER STAPLES – 0.0% | ||||||||
Beverages – 0.0% | ||||||||
| Anheuser-Busch InBev (a) (b) | 6,992 | $ | 50 | |||||
Total VVPR Strips (Cost $0) | $ | 50 | ||||||
| Money Market Funds – 7.6% | Shares | Value | ||||||
| Federated Prime Cash Obligations Fund | ||||||||
| Institutional Shares | 764,000 | $ | 764,000 | |||||
| Fidelity Institutional Money Market Funds | ||||||||
| Money Market Portfolio – Class I | 1,313,000 | 1,313,000 | ||||||
Total Money Market Funds (Cost $2,077,000) | $ | 2,077,000 | ||||||
Total Investments – 100.4% (Cost $24,172,979) (d) | $ | 27,296,526 | ||||||
Liabilities in Excess of Other Assets – (0.4)% | (119,729 | ) | ||||||
Net Assets – 100.0% | $ | 27,176,797 | ||||||
Percentages are stated as a percent of net assets.
Abbreviations:
ADR: American Depository Receipts
Footnotes:
| (a) | Non-income producing security. | |
| (b) | Security traded on a foreign exchange has been valued at an estimate of fair value that is different than the local market close price. These fair value estimates are determined by an independent national fair valuation service that has been approved by the Board. These securities represent $3,754,016 or 13.8% of the Portfolio’s net assets. Other Portfolio securities are not subjected to fair value procedures because they are traded on domestic or foreign exchanges that have close times that are consistent with the U.S. market close, normally 4:00 pm Eastern Time. | |
| (c) | A VVPR Strip is a coupon attached to specific ordinary common shares that offers tax advantages. The coupon entitles a holder to reduced withholding tax rates on the dividends generated from the related common shares. | |
| (d) | Represents cost for financial reporting purposes, which may differ from cost basis for Federal income tax purposes. See also Note 8 of the Notes to Financial Statements. |
The accompanying notes are an integral part of these financial statements.
64
Ohio National Fund, Inc.
Aggressive Growth Portfolio
Aggressive Growth Portfolio
Statement of Assets and Liabilities
December 31, 2009
| Assets: | ||||
| Investments in securities, at value (Cost $24,172,979) | $ | 27,296,526 | ||
| Cash | 21 | |||
| Receivable for fund shares sold | 14,899 | |||
| Dividends and accrued interest receivable | 10,781 | |||
| Prepaid expenses and other assets | 417 | |||
| Total assets | 27,322,644 | |||
| Liabilities: | ||||
| Payable for securities purchased | 103,441 | |||
| Payable for fund shares redeemed | 4,402 | |||
| Payable for investment management services | 18,191 | |||
| Payable for compliance services | 1,677 | |||
| Accrued custody expense | 1,619 | |||
| Accrued professional fees | 11,120 | |||
| Accrued accounting fees | 2,710 | |||
| Accrued printing and filing fees | 1,780 | |||
| Other accrued expenses | 907 | |||
| Total liabilities | 145,847 | |||
| Net assets | $ | 27,176,797 | ||
| Net assets consist of: | ||||
| Par value, $1 per share | $ | 3,655,914 | ||
| Paid-in capital in excess of par value | 27,788,732 | |||
| Accumulated net realized loss on investments | (7,458,253 | ) | ||
| Net unrealized appreciation/depreciation on: | ||||
| Investments | 3,123,547 | |||
| Foreign currency related transactions | (34 | ) | ||
| Undistributed net investment income | 66,891 | |||
| Net assets | $ | 27,176,797 | ||
| Shares outstanding | 3,655,914 | |||
| Authorized Fund shares allocated to Portfolio | 10,000,000 | |||
| Net asset value per share | $ | 7.43 | ||
Statement of Operations
For the Year Ended December 31, 2009
| Investment income: | ||||
| Interest | $ | 6,942 | ||
| Dividends (net of withholding tax of $15,864) | 170,636 | |||
| Total investment income | 177,578 | |||
| Expenses: | ||||
| Management fees | 175,039 | |||
| Custodian fees | 11,460 | |||
| Directors’ fees | 2,341 | |||
| Professional fees | 12,990 | |||
| Accounting fees | 15,720 | |||
| Printing and filing fees | 3,778 | |||
| Compliance expense | 6,376 | |||
| Other | 504 | |||
| Total expenses | 228,208 | |||
| Net investment loss | (50,630 | ) | ||
| Realized/unrealized gain (loss) on investments and foreign currency related transactions: | ||||
| Net realized gain (loss) on: | ||||
| Investments | (758,294 | ) | ||
| Foreign currency related transactions | 594 | |||
| Change in unrealized appreciation/depreciation on investments and foreign currency related transactions | 8,725,649 | |||
| Net realized/unrealized gain (loss) on investments and foreign currency related transactions | 7,967,949 | |||
| Change in net assets from operations | $ | 7,917,319 | ||
The accompanying notes are an integral part of these financial statements.
65
Ohio National Fund, Inc.
Aggressive Growth Portfolio
Aggressive Growth Portfolio
Statements of Changes in Net Assets
| Years Ended December 31, | ||||||||
| 2009 | 2008 | |||||||
Increase (Decrease) in Net Assets: | ||||||||
| Operations: | ||||||||
| Net investment loss | $ | (50,630 | ) | $ | (9,928 | ) | ||
| Net realized gain (loss) on investments and foreign currency related transactions | (757,700 | ) | (2,272,356 | ) | ||||
| Change in unrealized appreciation/depreciation on investments and foreign currency related transactions | 8,725,649 | (11,572,466 | ) | |||||
| Change in net assets from operations | 7,917,319 | (13,854,750 | ) | |||||
| Capital transactions: | ||||||||
| Received from shares sold | 8,748,197 | 15,640,261 | ||||||
| Paid for shares redeemed | (7,473,737 | ) | (12,559,831 | ) | ||||
| Change in net assets from capital transactions | 1,274,460 | 3,080,430 | ||||||
| Change in net assets | 9,191,779 | (10,774,320 | ) | |||||
Net Assets: | ||||||||
| Beginning of year | 17,985,018 | 28,759,338 | ||||||
| End of year | $ | 27,176,797 | $ | 17,985,018 | ||||
| Undistributed net investment income | $ | 66,891 | $ | 84,605 | ||||
Financial Highlights
| Years Ended December 31, | ||||||||||||||||||||
| 2009 | 2008 | 2007 | 2006 | 2005 | ||||||||||||||||
Selected Per-Share Data: | ||||||||||||||||||||
| Net asset value, beginning of year | $ | 5.21 | $ | 9.25 | $ | 7.14 | $ | 6.75 | $ | 5.96 | ||||||||||
| Operations: | ||||||||||||||||||||
| Net investment income (loss) | (0.02 | ) | (0.01 | ) | 0.02 | 0.02 | (0.02 | ) | ||||||||||||
| Net realized and unrealized gain (loss) on investments and foreign currency related transactions | 2.24 | (4.03 | ) | 2.09 | 0.37 | 0.81 | ||||||||||||||
| Total from operations | 2.22 | (4.04 | ) | 2.11 | 0.39 | 0.79 | ||||||||||||||
| Net asset value, end of year | $ | 7.43 | $ | 5.21 | $ | 9.25 | $ | 7.14 | $ | 6.75 | ||||||||||
Total return | 42.61 | % | –43.68 | % | 29.55 | % | 5.78 | % | 13.28 | % | ||||||||||
Ratios and supplemental data: | ||||||||||||||||||||
| Net assets at end of year (millions) | $ | 27.2 | $ | 18.0 | $ | 28.8 | $ | 17.8 | $ | 16.6 | ||||||||||
| Ratios to average net assets: | ||||||||||||||||||||
| Expenses | 1.04 | % | 0.98 | % | 0.97 | % | 1.06 | % | 1.03 | % | ||||||||||
| Net investment income (loss) | –0.23 | % | –0.04 | % | 0.34 | % | 0.22 | % | –0.35 | % | ||||||||||
| Portfolio turnover rate | 28 | % | 43 | % | 29 | % | 105 | % | 139 | % | ||||||||||
The accompanying notes are an integral part of these financial statements.
66
Ohio National Fund, Inc.
Small Cap Growth Portfolio
Small Cap Growth Portfolio
Objective/Strategy
The Small Cap Growth Portfolio seeks long-term capital appreciation by investing at least 80% of its net assets in stocks of small companies, primarily those with strong business franchises and competitive positions that generate rapidly rising earnings or profits.
Performance as of December 31, 2009
Average Annual Total Returns: | ||||
| One year | 50.76% | |||
| Five years | 3.87% | |||
| Ten years | -3.53% |
Past performance does not guarantee future results. The performance data quoted represents past performance and current returns may be lower or higher. Total return figures include change in share price and reinvestment of dividends and capital gains. The investment return and principal value will fluctuate so that an investor’s shares, when redeemed may be worth more or less than the original cost. To obtain performance information up to the most recent month end, call toll-free 1-877-781-6392.
The Portfolio is not open to direct retail investment. Beneficial interest in shares is obtained solely by purchase of variable life insurance policies and variable annuity contracts. Actual performance results for variable annuity and variable universal life contracts will be lower due to contract charges. Consult your contract for applicable charges.
Comments
For the year ended December 31, 2009, the Small Cap Growth Portfolio returned 50.76% versus 34.47% for the current benchmark, the Russell 2000 Growth Index.
Equity markets began the year in the midst of a significant sell-off, a continuation from the credit crisis that hit all capital markets severely in late 2008. Most indices touched the low point for the year in mid-March as evidence of an above-average contraction in the U.S. economy continued to unfold. Amid signs of stabilization in the economy and global financial system, markets rebounded strongly for much of the year. Despite a brief and slight pullback in October, broad indices finished the year significantly higher. For the year, mid cap stocks easily outpaced small and large cap stocks, which performed similarly. Growth-style indices also out-performed value indices, as Information Technology was easily the best performing sector followed distantly by Materials. Telecommunication Services and Utilities were relative laggards. Commodities generally were much higher during the year, led by industrial metals and crude oil. Natural gas finished the year with modest losses while gold futures touched record highs in December.
Our holdings and over-weight in Information Technology, the best performing sector within the benchmark index, were the primary contributors to performance followed by our holdings in Consumer Discretionary. Detractors included our holdings in Materials and Consumer Staples.(1)
Online printing company VistaPrint N.V. returned over 200% during the year to lead all contributors. The company has demonstrated strong organic growth, which has been particularly impressive to us given that its customers have generally been small businesses and individual consumers, two segments of the market hardest hit by the difficult economic environment. We consider the company’s primary competitive advantage to be scale, which has resulted in a significant cost advantage over competitors and a better value proposition for customers. We believe that VistaPrint is changing the way the game is played in the small business printing market and has substantial runway ahead of it for growth.(1)
Ultimate Software Group, Inc., the subscription-based provider of human resource software and services, rebounded from weakness in 2008. We remain attracted to the company’s recurring revenue stream and strong earnings. In addition, Ultimate Software Group, Inc. was able to add customers even in this difficult environment, which we think supports our thesis that the company’s products are a value-added proposition for clients.(1)
Jarden Corp., a provider of a range of consumer products, returned 170% during the year. The company refinanced a significant portion of its balance sheet, which reassured investors. We like the company because its products are generally first or second in market share, which translates into retail shelf space security as large retailers look to reduce their number of vendors.(1)
Individual detractors from performance included Huron Consulting Group, Inc. The financial consulting firm sold off significantly after it reported accounting issues. We exited the position.(1)
CardioNet, Inc., the provider of mobile cardiac devices, sold off when one of its key customers, an insurance company, cut reimbursements for the devices more than expected. We decided to exit the name on the news as this is likely to result in lower revenues and a smaller market size for the company.(1)
Odyssey Marine Exploration, Inc. declined significantly after the exploration company of deep-ocean shipwrecks suffered a setback when an initial court ruling found that the company’s findings from its Black Swan project belonged to Spain. The company is appealing the finding. While the ultimate outcome of this court proceeding remains an unknown, we continue to like the risk/reward profile of the company in that one significant discovery of gold, for example, among their identified finds could more than offset many years of costs.(1)
We continue to await stronger signs of economic improvement. Data points suggest to us that we are likely still far from a broad-based recovery. As an example, the U.S. unemployment rate remains at high levels, which we believe may take years to return to a more normal level. Ultimately, we need capacity utilization to put people back to work. Transportation companies are seeing volume improvements, but that is off of depressed levels and will be more difficult to achieve as easy comparisons to year-ago levels pass. Similarly, airlines are benefiting from better use of capacity, but that is largely attributable to reducing the number of the flights, not necessarily increased demand. The outlook for consumer spending remains depressed, even though movie sales and holiday shopping demand for electronics products appears to have been strong. Among the companies we are attracted to are certain technology companies that provide new modes of distribution or help businesses become more efficient. These
(continued)
67
Ohio National Fund, Inc.
Small Cap Growth Portfolio (Continued)
Small Cap Growth Portfolio (Continued)
companies should continue to do well despite the near-term economic headwinds.
| (1) | The Portfolio’s composition is subject to change. Holdings and weightings are as of December 31, 2009. |
Change in Value of $10,000 Investment
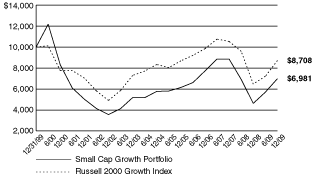
Hypothetical illustration based on past performance. Future performance will vary. The Portfolio’s returns reflect reinvested dividends. The Portfolio’s holdings may differ significantly from the securities in the index. The index is unmanaged and therefore does not reflect the cost of portfolio management and accounting.
The Russell 2000 Growth Index is a market-weighted total return index that measures the performance of companies within the Russell 2000 Index having higher price to book ratios and higher forecasted growth values. The Russell 2000 Index includes the 2000 firms from the Russell 3000 Index with the smallest market capitalizations. The Russell 3000 Index represents 98% of the investable U.S. equity markets. The index presented herein includes the effects of reinvested dividends.
Portfolio Composition as of December 31, 2009 (1)
| % of Net Assets | |||
Common Stocks (3) | 97.3 | ||
| Money Market Funds Less Net Liabilities | 2.7 | ||
| 100.0 | |||
Top 10 Portfolio Holdings as of December 31, 2009 (1) (2)
| % of Net Assets | |||||||
| 1. | Ultimate Software Group, Inc. | 3.5 | |||||
| 2. | VistaPrint N.V. | 3.1 | |||||
| 3. | Solera Holdings, Inc. | 3.0 | |||||
| 4. | Jarden Corp. | 2.9 | |||||
| 5. | SXC Health Solutions Corp. | 2.7 | |||||
| 6. | World Fuel Services Corp. | 2.5 | |||||
| 7. | Dresser-Rand Group, Inc. | 1.9 | |||||
| 8. | CoStar Group, Inc. | 1.9 | |||||
| 9. | Catalyst Health Solutions, Inc. | 1.9 | |||||
| 10. | MSCI, Inc. | 1.9 | |||||
| (1) | Composition of Portfolio subject to change. | |
| (2) | Short-term investments have been excluded from the list of Top 10 Portfolio holdings. | |
| (3) | Sectors: |
| % of Net Assets | |||
| Information Technology | 31.5 | ||
| Health Care | 22.5 | ||
| Consumer Discretionary | 18.1 | ||
| Industrials | 11.9 | ||
| Financials | 5.0 | ||
| Energy | 4.4 | ||
| Telecommunication Services | 2.0 | ||
| Materials | 1.8 | ||
| Consumer Staples | 0.1 | ||
| 97.3 | |||
68
Ohio National Fund, Inc.
Small Cap Growth Portfolio
Small Cap Growth Portfolio
| Schedule of Investments | December 31, 2009 |
| Common Stocks – 97.3% | Shares | Value | ||||||
CONSUMER DISCRETIONARY – 18.1% | ||||||||
Auto Components – 0.2% | ||||||||
| Motorcar Parts of America Inc. (a) | 11,349 | $ | 57,880 | |||||
Diversified Consumer Services – 3.6% | ||||||||
| American Public Education, Inc. (a) | 8,248 | 283,401 | ||||||
| Bridgepoint Education, Inc. (a) | 20,027 | 300,806 | ||||||
| ChinaCast Education Corp. (a) | 19,420 | 146,815 | ||||||
| Grand Canyon Education, Inc. (a) | 4,733 | 89,974 | ||||||
| 820,996 | ||||||||
Hotels, Restaurants & Leisure – 1.3% | ||||||||
| Great Canadian Gaming Corp. (a) | 16,074 | 122,186 | ||||||
| Kingdom Hotel Investments – GDR (a) | 34,025 | 119,088 | ||||||
| Morgans Hotel Group Co. (a) | 9,159 | 41,490 | ||||||
| PokerTek, Inc. (a) | 5,059 | 3,491 | ||||||
| 286,255 | ||||||||
Household Durables – 3.7% | ||||||||
| Deer Consumer Products Inc. (a) | 14,595 | 165,215 | ||||||
| Jarden Corp. | 21,657 | 669,418 | ||||||
| 834,633 | ||||||||
Leisure Equipment & Products – 0.3% | ||||||||
| Smith & Wesson Holding Corp. (a) | 1,682 | 6,879 | ||||||
| Sturm, Ruger & Co, Inc. | 5,862 | 56,862 | ||||||
| 63,741 | ||||||||
Media – 6.2% | ||||||||
| DreamWorks Animation SKG, Inc. (a) | 1,415 | 56,529 | ||||||
| Genius Products, Inc. (Acquired 12/12/2005 through 07/17/2009, Cost $238,059) (a) (c) | 225 | 1,372 | ||||||
| IMAX Corp. (a) | 26,232 | 348,886 | ||||||
| Interactive Data Corp. | 8,022 | 202,957 | ||||||
| Lions Gate Entertainment Corp. (a) | 67,995 | 395,051 | ||||||
| MDC Partners, Inc. (a) | 9,710 | 80,981 | ||||||
| National CineMedia, Inc. | 19,710 | 326,595 | ||||||
| 1,412,371 | ||||||||
Multiline Retail – 0.6% | ||||||||
| Saks, Inc. (a) | 19,590 | 128,510 | ||||||
Specialty Retail – 0.5% | ||||||||
| Rue21, Inc. (a) | 4,370 | 122,753 | ||||||
Textiles, Apparel & Luxury Goods – 1.7% | ||||||||
| Skechers U.S.A., Inc. (a) | 13,165 | 387,183 | ||||||
TOTAL CONSUMER DISCRETIONARY | 4,114,322 | |||||||
CONSUMER STAPLES – 0.1% | ||||||||
Beverages – 0.1% | ||||||||
| Heckmann Corp. (a) | 5,650 | 28,194 | ||||||
TOTAL CONSUMER STAPLES | 28,194 | |||||||
ENERGY – 4.4% | ||||||||
Energy Equipment & Services – 1.9% | ||||||||
| Dresser-Rand Group, Inc. (a) | 13,930 | 440,327 | ||||||
Oil, Gas & Consumable Fuels – 2.5% | ||||||||
| World Fuel Services Corp. | 21,268 | 569,770 | ||||||
TOTAL ENERGY | 1,010,097 | |||||||
FINANCIALS – 5.0% | ||||||||
Capital Markets – 1.2% | ||||||||
| Broadpoint Gleacher Securities, Inc. (a) | 21,045 | 93,861 | ||||||
| Epoch Holding Corp. | 36 | 376 | ||||||
| Riskmetrics Group, Inc. (a) | 10,936 | 173,992 | ||||||
| 268,229 | ||||||||
Diversified Financial Services – 3.4% | ||||||||
| MarketAxess Holdings, Inc. | 23,805 | 330,889 | ||||||
| MSCI, Inc. (a) | 13,571 | 431,558 | ||||||
| 762,447 | ||||||||
Thrifts & Mortgage Finance – 0.4% | ||||||||
| Northwest Bancshares, Inc. | 5,860 | 66,335 | ||||||
| Territorial Bancorp, Inc. (a) | 1,945 | 35,108 | ||||||
| 101,443 | ||||||||
TOTAL FINANCIALS | 1,132,119 | |||||||
HEALTH CARE – 22.5% | ||||||||
Biotechnology – 2.9% | ||||||||
| Acorda Therapeutics, Inc. (a) | 8,386 | 211,495 | ||||||
| Genomic Health, Inc. (a) | 6,238 | 122,015 | ||||||
| Incyte Corp. (a) | 14,420 | 131,366 | ||||||
| Myriad Genetics, Inc. (a) | 7,052 | 184,057 | ||||||
| 648,933 | ||||||||
Health Care Equipment & Supplies – 0.9% | ||||||||
| CONMED Corp. (a) | 4,801 | 109,463 | ||||||
| TomoTherapy, Inc. (a) | 22,940 | 89,466 | ||||||
| 198,929 | ||||||||
Health Care Providers & Services – 13.9% | ||||||||
| Alliance HealthCare Services, Inc. (a) | 15,615 | 89,162 | ||||||
| Amedisys, Inc. (a) | 5,265 | 255,668 | ||||||
| Bio-Reference Labs, Inc. (a) | 5,035 | 197,322 | ||||||
| Catalyst Health Solutions, Inc. (a) | 11,937 | 435,342 | ||||||
| Concord Medical Services Holdings Limited – ADR (a) | 11,235 | 97,070 | ||||||
| Genoptix, Inc. (a) | 5,107 | 181,452 | ||||||
| Health Grades, Inc. (a) | 31,388 | 134,654 | ||||||
| HMS Holdings Corp. (a) | 5,883 | 286,443 | ||||||
| LHC Group, Inc. (a) | 11,792 | 396,329 | ||||||
| MEDNAX, Inc. (a) | 4,461 | 268,151 | ||||||
| MWI Veterinary Supply, Inc. (a) | 4,275 | 161,167 | ||||||
| Providence Service Corp. / The (a) | 4,346 | 68,667 | ||||||
| PSS World Medical, Inc. (a) | 15,052 | 339,724 | ||||||
| Psychiatric Solutions, Inc. (a) | 10,911 | 230,659 | ||||||
| RadNet, Inc. (a) | 13,497 | 27,534 | ||||||
| 3,169,344 | ||||||||
Health Care Technology – 4.0% | ||||||||
| athenahealth, Inc. (a) | 4,059 | 183,629 | ||||||
| MedAssets, Inc. (a) | 4,878 | 103,463 | ||||||
| SXC Health Solutions Corp. (a) | 11,394 | 614,706 | ||||||
| 901,798 | ||||||||
Life Sciences Tools & Services – 0.8% | ||||||||
| Techne Corp. | 2,807 | 192,448 | ||||||
TOTAL HEALTH CARE | 5,111,452 | |||||||
(continued)
69
Ohio National Fund, Inc.
Small Cap Growth Portfolio (Continued)
Small Cap Growth Portfolio (Continued)
| Schedule of Investments | December 31, 2009 |
| Common Stocks – 97.3% | Shares | Value | ||||||
INDUSTRIALS – 11.9% | ||||||||
Aerospace & Defense – 1.0% | ||||||||
| TransDigm Group, Inc. | 4,785 | $ | 227,239 | |||||
Air Freight & Logistics – 0.7% | ||||||||
| Forward Air Corp. | 6,702 | 167,885 | ||||||
Commercial Services & Supplies – 2.1% | ||||||||
| Copart, Inc. (a) | 1,880 | 68,865 | ||||||
| Ritchie Bros. Auctioneers, Inc. | 6,826 | 153,107 | ||||||
| Standard Parking Corp. (a) | 15,515 | 246,378 | ||||||
| 468,350 | ||||||||
Electrical Equipment – 1.5% | ||||||||
| Harbin Electric, Inc. (a) | 16,835 | 345,791 | ||||||
Machinery – 1.4% | ||||||||
| Barnes Group, Inc. | 6,873 | 116,154 | ||||||
| Westinghouse Air Brake Technologies Corp. | 4,873 | 199,013 | ||||||
| 315,167 | ||||||||
Marine – 0.9% | ||||||||
| Horizon Lines, Inc. | 35,433 | 197,362 | ||||||
Professional Services – 3.3% | ||||||||
| CoStar Group, Inc. (a) | 10,428 | 435,577 | ||||||
| Odyssey Marine Exploration, Inc. (a) | 28,780 | 40,580 | ||||||
| Resources Connection, Inc. (a) | 13,512 | 286,725 | ||||||
| UTEK Corp. (a) | 3,370 | 14,322 | ||||||
| 777,204 | ||||||||
Road & Rail – 1.0% | ||||||||
| Landstar System, Inc. | 1,990 | 77,152 | ||||||
| Old Dominion Freight Line, Inc. (a) | 4,644 | 142,571 | ||||||
| 219,723 | ||||||||
TOTAL INDUSTRIALS | 2,718,721 | |||||||
INFORMATION TECHNOLOGY – 31.5% | ||||||||
Communications Equipment – 2.0% | ||||||||
| CommScope, Inc. (a) | 5,649 | 149,868 | ||||||
| DG FastChannel, Inc. (a) | 11,215 | 313,235 | ||||||
| 463,103 | ||||||||
Electronic Equipment, Instruments & Components – 2.2% | ||||||||
| DTS, Inc. (a) | 11,255 | 385,034 | ||||||
| L-1 Identity Solutions, Inc. (a) | 15,872 | 118,881 | ||||||
| 503,915 | ||||||||
Internet Software & Services – 13.8% | ||||||||
| Archipelago Learning, Inc. (a) | 6,290 | 130,203 | ||||||
| Constant Contact, Inc. (a) | 7,573 | 121,168 | ||||||
| DealerTrack Holdings, Inc. (a) | 11,251 | 211,406 | ||||||
| Equinix, Inc. (a) | 3,013 | 319,830 | ||||||
| GSI Commerce, Inc. (a) | 13,435 | 341,115 | ||||||
| LivePerson, Inc. (a) | 59,660 | 415,830 | ||||||
| NaviSite, Inc. (a) | 70,055 | 140,110 | ||||||
| NIC, Inc. | 22,168 | 202,615 | ||||||
| SAVVIS, Inc. (a) | 9,654 | 135,639 | ||||||
| Switch & Data Facilities Co., Inc. (a) | 7,557 | 152,727 | ||||||
| TechTarget, Inc. (a) | 7,650 | 43,069 | ||||||
| VistaPrint N.V. (a) | 12,265 | 694,935 | ||||||
| Vocus, Inc. (a) | 13,277 | 238,986 | ||||||
| 3,147,633 | ||||||||
IT Services – 2.0% | ||||||||
| Euronet Worldwide, Inc. (a) | 13,795 | 302,800 | ||||||
| Information Services Group, Inc. (a) | 45,551 | 144,397 | ||||||
| 447,197 | ||||||||
Semiconductors & Semiconductor Equipment – 1.7% | ||||||||
| Atmel Corp. (a) | 83,090 | 383,045 | ||||||
Software – 9.8% | ||||||||
| Blackboard, Inc. (a) | 2,800 | 127,092 | ||||||
| Concur Technologies, Inc. (a) | 4,141 | 177,028 | ||||||
| Fortinet, Inc. (a) | 2,410 | 42,344 | ||||||
| Informatica Corp. (a) | 940 | 24,308 | ||||||
| Monotype Imaging Holdings, Inc. (a) | 18,849 | 170,207 | ||||||
| Salary.com, Inc. (a) | 4,007 | 9,416 | ||||||
| Solera Holdings, Inc. | 19,127 | 688,763 | ||||||
| SuccessFactors, Inc. (a) | 11,705 | 194,069 | ||||||
| Ultimate Software Group, Inc. (a) | 27,122 | 796,573 | ||||||
| 2,229,800 | ||||||||
TOTAL INFORMATION TECHNOLOGY | 7,174,693 | |||||||
MATERIALS – 1.8% | ||||||||
Chemicals – 1.8% | ||||||||
| Nalco Holding Co. | 10,163 | 259,258 | ||||||
| Yongye International, Inc. (a) | 19,535 | 158,820 | ||||||
TOTAL MATERIALS | 418,078 | |||||||
TELECOMMUNICATION SERVICES – 2.0% | ||||||||
Diversified Telecommunication Services – 0.4% | ||||||||
| inContact, Inc. (a) | 33,999 | 99,617 | ||||||
Wireless Telecommunication Services – 1.6% | ||||||||
| SBA Communications Corp. Class A (a) | 10,256 | 350,345 | ||||||
TOTAL TELECOMMUNICATION SERVICES | 449,962 | |||||||
Total Common Stocks (Cost $20,516,541) | $ | 22,157,638 | ||||||
| Warrants – 0.0% | Quantity | Value | ||||||
CONSUMER DISCRETIONARY – 0.0% | ||||||||
Hotels, Restaurants & Leisure – 0.0% | ||||||||
| PokerTek, Inc. (Acquired 04/23/2007, Cost $10,537) (a) (b) (c) | ||||||||
| Expiration: April 2012, Exercise Price: $10.80 | 2,172 | $ | — | |||||
Total Warrants (Cost $10,537) | $ | — | ||||||
(continued)
70
Ohio National Fund, Inc.
Small Cap Growth Portfolio (Continued)
Small Cap Growth Portfolio (Continued)
| Schedule of Investments | December 31, 2009 |
| Money Market Funds – 2.9% | Shares | Value | ||||||
| Fidelity Institutional Money Market Funds | ||||||||
| Money Market Portfolio – Class I | 646,000 | $ | 646,000 | |||||
Total Money Market Funds (Cost $646,000) | $ | 646,000 | ||||||
Total Investments – 100.2% (Cost $21,173,078) (d) | $ | 22,803,638 | ||||||
Liabilities in Excess of Other Assets – (0.2)% | (42,097 | ) | ||||||
Net Assets – 100.0% | $ | 22,761,541 | ||||||
Percentages are stated as a percent of net assets.
Abbreviations:
ADR: American Depository Receipts
GDR: Global Depository Receipts
Footnotes:
| (a) | Non-income producing security. | |
| (b) | A market quotation for this investment was not readily available at December 31, 2009. As discussed in Note 2 of the Notes to Financial Statements, the price for this issue was derived from an estimate of fair market value using methods determined in good faith by the Fund’s Pricing Committee under the supervision of the Board. This security represents $0 or 0.0% of the Portfolio’s net assets. | |
| (c) | Represents a security deemed to be illiquid. At December 31, 2009, the value of illiquid securities in the Portfolio totalled $1,372 or 0.0% of the Portfolio’s net assets. | |
| (d) | Represents cost for financial reporting purposes, which may differ from cost basis for Federal income tax purposes. See also Note 8 of the Notes to Financial Statements. |
The accompanying notes are an integral part of these financial statements.
71
Ohio National Fund, Inc.
Small Cap Growth Portfolio
Small Cap Growth Portfolio
Statement of Assets and Liabilities
December 31, 2009
| Assets: | ||||
| Investments in securities, at value (Cost $21,173,078) | $ | 22,803,638 | ||
| Cash | 709 | |||
| Receivable for securities sold | 44,934 | |||
| Receivable for fund shares sold | 14,122 | |||
| Dividends and accrued interest receivable | 2,950 | |||
| Prepaid expenses and other assets | 338 | |||
| Total assets | 22,866,691 | |||
| Liabilities: | ||||
| Payable for securities purchased | 67,929 | |||
| Payable for fund shares redeemed | 2,541 | |||
| Payable for investment management services | 17,002 | |||
| Payable for compliance services | 1,677 | |||
| Accrued custody expense | 567 | |||
| Accrued professional fees | 11,113 | |||
| Accrued accounting fees | 2,829 | |||
| Accrued printing and filing fees | 1,492 | |||
| Total liabilities | 105,150 | |||
| Net assets | $ | 22,761,541 | ||
| Net assets consist of: | ||||
| Par value, $1 per share | $ | 2,302,090 | ||
| Paid-in capital in excess of par value | 26,152,930 | |||
| Accumulated net realized loss on investments | (7,324,039 | ) | ||
| Net unrealized appreciation on investments | 1,630,560 | |||
| Net assets | $ | 22,761,541 | ||
| Shares outstanding | 2,302,090 | |||
| Authorized Fund shares allocated to Portfolio | 5,000,000 | |||
| Net asset value per share | $ | 9.89 | ||
Statement of Operations
For the Year Ended December 31, 2009
| Investment income: | ||||
| Interest | $ | 2,488 | ||
| Dividends (net of withholding tax of $287) | 71,279 | |||
| Other income | 31 | |||
| Total investment income | 73,798 | |||
| Expenses: | ||||
| Management fees | 156,671 | |||
| Custodian fees | 8,667 | |||
| Directors’ fees | 1,763 | |||
| Professional fees | 12,688 | |||
| Accounting fees | 14,778 | |||
| Printing and filing fees | 3,021 | |||
| Compliance expense | 6,376 | |||
| Other | 452 | |||
| Total expenses | 204,416 | |||
| Net investment loss | (130,618 | ) | ||
| Realized/unrealized gain (loss) on investments and foreign currency related transactions: | ||||
| Net realized gain (loss) on: | ||||
| Investments | (1,455,152 | ) | ||
| Foreign currency related transactions | (48 | ) | ||
| Change in unrealized appreciation/depreciation on investments | 8,483,045 | |||
| Net realized/unrealized gain (loss) on investments and foreign currency related transactions | 7,027,845 | |||
| Change in net assets from operations | $ | 6,897,227 | ||
The accompanying notes are an integral part of these financial statements.
72
Ohio National Fund, Inc.
Small Cap Growth Portfolio
Small Cap Growth Portfolio
Statements of Changes in Net Assets
| Years Ended December 31, | ||||||||
| 2009 | 2008 | |||||||
Increase (Decrease) in Net Assets: | ||||||||
| Operations: | ||||||||
| Net investment loss | $ | (130,618 | ) | $ | (159,513 | ) | ||
| Net realized gain (loss) on investments and foreign currency related transactions | (1,455,200 | ) | (2,178,654 | ) | ||||
| Change in unrealized appreciation/depreciation on investments and foreign currency related transactions | 8,483,045 | (10,295,555 | ) | |||||
| Change in net assets from operations | 6,897,227 | (12,633,722 | ) | |||||
| Capital transactions: | ||||||||
| Received from shares sold | 7,889,316 | 6,841,384 | ||||||
| Paid for shares redeemed | (5,207,938 | ) | (8,002,206 | ) | ||||
| Change in net assets from capital transactions | 2,681,378 | (1,160,822 | ) | |||||
| Change in net assets | 9,578,605 | (13,794,544 | ) | |||||
Net Assets: | ||||||||
| Beginning of year | 13,182,936 | 26,977,480 | ||||||
| End of year | $ | 22,761,541 | $ | 13,182,936 | ||||
| Accumulated net investment loss | $ | — | $ | (89 | ) | |||
Financial Highlights
| Years Ended December 31, | ||||||||||||||||||||
| 2009 | 2008 | 2007 | 2006 | 2005 | ||||||||||||||||
Selected Per-Share Data: | ||||||||||||||||||||
| Net asset value, beginning of year | $ | 6.56 | $ | 12.54 | $ | 10.94 | $ | 8.71 | $ | 8.18 | ||||||||||
| Operations: | ||||||||||||||||||||
| Net investment loss | (0.06 | ) | (0.08 | ) | (0.09 | ) | (0.09 | ) | (0.07 | ) | ||||||||||
| Net realized and unrealized gain (loss) on investments and foreign currency related transactions | 3.39 | (5.90 | ) | 1.69 | 2.32 | 0.60 | ||||||||||||||
| Total from operations | 3.33 | (5.98 | ) | 1.60 | 2.23 | 0.53 | ||||||||||||||
| Net asset value, end of year | $ | 9.89 | $ | 6.56 | $ | 12.54 | $ | 10.94 | $ | 8.71 | ||||||||||
Total return | 50.76 | % | –47.69 | % | 14.63 | % | 25.60 | % | 6.48 | % | ||||||||||
Ratios and supplemental data: | ||||||||||||||||||||
| Net assets at end of year (millions) | $ | 22.8 | $ | 13.2 | $ | 27.0 | $ | 20.8 | $ | 17.1 | ||||||||||
| Ratios to average net assets: | ||||||||||||||||||||
| Expenses | 1.21 | % | 1.18 | % | 1.15 | % | 1.16 | % | 1.11 | % | ||||||||||
| Net investment loss | –0.77 | % | –0.84 | % | –0.77 | % | –0.92 | % | –0.77 | % | ||||||||||
| Portfolio turnover rate | 50 | % | 37 | % | 74 | % | 93 | % | 93 | % | ||||||||||
The accompanying notes are an integral part of these financial statements.
73
Ohio National Fund, Inc.
Mid Cap Opportunity Portfolio
Mid Cap Opportunity Portfolio
Objective/Strategy
The Mid Cap Opportunity Portfolio seeks long-term total return by investing at least 80% of its net assets in equity securities of mid-cap companies, primarily those that are strategically positioned for long-term growth.
Performance as of December 31, 2009
Average Annual Total Returns: | ||||
| One year | 40.60% | |||
| Five years | -0.54% | |||
| Ten years | -0.40% |
Past performance does not guarantee future results. The performance data quoted represents past performance and current returns may be lower or higher. Total return figures include change in share price and reinvestment of dividends and capital gains. The investment return and principal value will fluctuate so that an investor’s shares, when redeemed, may be worth more or less than the original cost. To obtain performance information up to the most recent month end, call toll-free 1-877-781-6392.
The Portfolio is not open to direct retail investment. Beneficial interest in shares is obtained solely by purchase of variable life insurance policies and variable annuity contracts. Actual performance results for variable annuity and variable universal life contracts will be lower due to contract charges. Consult your contract for applicable charges.
Comments
For the year ended December 31, 2009, the Mid Cap Opportunity Portfolio returned 40.60% versus 46.29% for the current benchmark, the Russell Midcap Growth Index.
Equity markets continued to sell off in early 2009 as economic fears and dismal corporate earnings weighed on investor confidence. Nonetheless, equities showed renewed strength in the second quarter as investors began to hope that coordinated government intervention might succeed in stabilizing the U.S. economy and banking system. This rally extended through the remainder of the year with volatile trading, even as we saw continued modest improvements in some areas of the U.S. and global economies. Nonetheless, economic news remained mixed. The unemployment rate hovered near 10%, while companies continued to announce layoffs. In this environment, consumers and businesses alike remained cautious in their spending plans. While bargain hunting and short-term trades dominated the early stages of the market rebound, we saw investors become more selective by year end as they focused on companies with solid fundamentals that appeared better able to weather an uneven economic recovery.
The Portfolio remained over-weighted in the Information Technology sector, where we continued to emphasize well-managed, well-capitalized companies that have already taken steps to rationalize their cost structures and reduce their debt levels. Unfortunately, many high quality, more defensive technology holdings, such as internet infrastructure firm VeriSign, Inc., were overlooked by investors seeking more speculative short-term plays. This hurt our relative performance for the year.
Additionally, a number of the Portfolio’s Health Care stocks were pressured over concerns of cuts in insurance reimbursement rates, as well as by worries over how the weaker economy might be affecting consumer demand for elective and even non-elective medical treatments. These issues also weighed on share price performance by Myriad Genetics, Inc., a molecular diagnostic company that owns rights to the market’s leading hereditary breast cancer test.
Stock selection was also detrimental in the Energy sector, due in part to our investment in Texas-based oil and gas exploration company Comstock Resources, Inc., which reported lower-than-expected third quarter profits as weakness in commodities prices more than offset improving demand trends.
On a positive note, the Portfolio’s relative performance benefited from stock selection in the Consumer Discretionary sector, notably from investments in disciplined retailers that were able to capitalize on stabilizing consumer spending trends as they improved their expense and inventory management. Standout contributors for the Portfolio included Aeropostale, Inc. and Urban Outfitters, Inc., two mall-based apparel retailers that appeal to the more resilient teenage consumer base.
The Portfolio’s relative performance also benefited from investments in a number of consumer companies that sell products or services primarily over the web. These included online discount travel booking company priceline.com, Inc. and online movie rental service Netflix, Inc., which continues to explore innovative ways to provide on-demand, streaming media content to its subscribers.
Outside of the consumer sector, relative performance was supported by an investment in mining equipment provider Bucyrus International, Inc., which has continued to augment its profit margins through strategic acquisitions and its aftermarket sales of spare parts.
The Portfolio returned 36.04% from January 1, 2009 through December 17, 2009, under-performing its benchmark, the Russell Midcap Growth Index, which returned 42.98% for the same period. Effective December 18, 2009, Goldman Sachs Asset Management L.P. became the sub-adviser of the Portfolio. During the period from December 18, 2009 to year end the Portfolio out-performed, returning 3.35% as compared to 2.32% for the benchmark index.
In the fourth quarter of 2009, market sentiment continued to improve as the economy showed early signs of a recovery. Volatility declined from peak levels and investors became less risk averse, trading out of the more defensive stocks that they favored in late 2008 and early 2009 and placing a premium on companies with greater growth prospects. We believe that normalized levels of market volatility should create an environment of compelling opportunity for those investors that discriminate at the individual stock level. Generally as economic stress abates, correlations tend to fall from extreme levels providing a target rich environment for active investors. As stocks begin to trade more in concert with their underlying companies’ fundamentals, we believe our research will give us an edge in picking the winners and avoiding the losers.
(continued)
74
Ohio National Fund, Inc.
Mid Cap Opportunity Portfolio (Continued)
Mid Cap Opportunity Portfolio (Continued)
In the current environment, we believe that high-quality growth companies with established competitive advantages can take market share, capitalize on secular growth drivers, exert pricing power and self-finance their growth. We expect these companies will therefore extend their competitive advantage, be positioned for superior future growth and command a premium valuation regardless of the market environment. We believe the market eventually recognizes the value of high quality, dominant growth franchises, and we are seeking opportunities to buy these companies at attractive valuations.
| (1) | The Portfolio’s composition is subject to change. Holdings and weightings are as of December 31, 2009. |
Change in Value of $10,000 Investment
![[PERFORMANCE GRAPH]](https://capedge.com/proxy/N-CSR/0000950123-10-021904/l38589l3858946.gif)
Hypothetical illustration based on past performance. Future performance will vary. The Portfolio’s returns reflect reinvested dividends. The Portfolio’s holdings may differ significantly from the securities in the index. The index is unmanaged and therefore does not reflect the cost of portfolio management and accounting.
The Russell Midcap Growth Index is a subset of the Russell Midcap Index, which measures the performance of the 800 smallest companies in the Russell 1000 Index. The Russell Midcap Growth Index measures the performance of those stocks of the Russell Midcap Index with higher price-to-book ratios and higher relative forecasted growth rates. The index presented herein includes the effects of reinvested dividends.
Portfolio Composition as of December 31, 2009 (1)
| % of Net Assets | |||
Common Stocks (3) | 96.5 | ||
| Money Market Funds | |||
| Less Net Liabilities | 3.5 | ||
| 100.0 | |||
Top 10 Portfolio Holdings as of December 31, 2009 (1) (2)
| % of Net Assets | |||||||
| 1. | CB Richard Ellis Group, Inc. | 2.7 | |||||
| 2. | Chattem, Inc. | 2.6 | |||||
| 3. | St. Jude Medical, Inc. | 2.5 | |||||
| 4. | Cameron International Corp. | 2.5 | |||||
| 5. | Northern Trust Corp. | 2.5 | |||||
| 6. | Equinix, Inc. | 2.5 | |||||
| 7. | Broadcom Corp. Class A | 2.4 | |||||
| 8. | Global Payments, Inc. | 2.2 | |||||
| 9. | American Tower Corp. Class A | 2.1 | |||||
| 10. | Biogen Idec, Inc. | 2.1 | |||||
| (1) | Composition of Portfolio subject to change. | |
| (2) | Short-term investments have been excluded from the list of Top 10 Portfolio holdings. | |
| (3) | Sectors: |
| �� | % of Net Assets | ||
| Consumer Discretionary | 19.8 | ||
| Information Technology | 18.2 | ||
| Health Care | 15.3 | ||
| Financials | 11.6 | ||
| Industrials | 8.6 | ||
| Consumer Staples | 8.1 | ||
| Energy | 7.2 | ||
| Telecommunication Services | 5.3 | ||
| Materials | 2.4 | ||
| 96.5 | |||
75
Ohio National Fund, Inc.
Mid Cap Opportunity Portfolio
Mid Cap Opportunity Portfolio
| Schedule of Investments | December 31, 2009 |
| Common Stocks – 96.5% | Shares | Value | ||||||
CONSUMER DISCRETIONARY – 19.8% | ||||||||
Diversified Consumer Services – 1.3% | ||||||||
| Apollo Group, Inc. Class A (a) | 13,579 | $ | 822,616 | |||||
Hotels, Restaurants & Leisure – 1.7% | ||||||||
| Marriott International, Inc. Class A | 21,834 | 594,977 | ||||||
| Starwood Hotels & Resorts Worldwide, Inc. | 13,139 | 480,493 | ||||||
| 1,075,470 | ||||||||
Household Durables – 2.3% | ||||||||
| Fortune Brands, Inc. | 18,350 | 792,720 | ||||||
| Newell Rubbermaid, Inc. | 43,013 | 645,625 | ||||||
| 1,438,345 | ||||||||
Internet & Catalog Retail – 1.7% | ||||||||
| NetFlix, Inc. (a) | 20,185 | 1,113,001 | ||||||
Media – 1.0% | ||||||||
| Lamar Advertising Co. Class A (a) | 20,405 | 634,391 | ||||||
Specialty Retail – 8.9% | ||||||||
| Bed Bath & Beyond, Inc. (a) | 15,634 | 603,941 | ||||||
| Dick’s Sporting Goods, Inc. (a) | 28,332 | 704,617 | ||||||
| GameStop Corp. Class A (a) | 27,617 | 605,917 | ||||||
| PetSmart, Inc. | 43,269 | 1,154,850 | ||||||
| Staples, Inc. | 50,940 | 1,252,615 | ||||||
| Tiffany & Co. | 22,827 | 981,561 | ||||||
| Urban Outfitters, Inc. (a) | 9,469 | 331,320 | ||||||
| 5,634,821 | ||||||||
Textiles, Apparel & Luxury Goods – 2.9% | ||||||||
| Coach, Inc. | 24,956 | 911,643 | ||||||
| Polo Ralph Lauren Corp. | 11,524 | 933,213 | ||||||
| 1,844,856 | ||||||||
TOTAL CONSUMER DISCRETIONARY | 12,563,500 | |||||||
CONSUMER STAPLES – 8.1% | ||||||||
Beverages – 1.8% | ||||||||
| Hansen Natural Corp. (a) | 30,168 | 1,158,451 | ||||||
Household Products – 1.8% | ||||||||
| Energizer Holdings, Inc. (a) | 18,570 | 1,137,970 | ||||||
Personal Products – 4.5% | ||||||||
| Avon Products, Inc. | 37,853 | 1,192,369 | ||||||
| Chattem, Inc. (a) | 17,836 | 1,664,099 | ||||||
| 2,856,468 | ||||||||
TOTAL CONSUMER STAPLES | 5,152,889 | |||||||
ENERGY – 7.2% | ||||||||
Energy Equipment & Services – 5.0% | ||||||||
| Cameron International Corp. (a) | 38,095 | 1,592,371 | ||||||
| Core Laboratories N.V. | 8,147 | 962,324 | ||||||
| Dril-Quip, Inc. (a) | 11,450 | 646,696 | ||||||
| 3,201,391 | ||||||||
Oil, Gas & Consumable Fuels – 2.2% | ||||||||
| Continental Resources, Inc. (a) | 16,442 | 705,197 | ||||||
| Whiting Petroleum Corp. (a) | 9,542 | 681,776 | ||||||
| 1,386,973 | ||||||||
TOTAL ENERGY | 4,588,364 | |||||||
FINANCIALS – 11.6% | ||||||||
Capital Markets – 3.7% | ||||||||
| Northern Trust Corp. | 30,198 | 1,582,375 | ||||||
| TD Ameritrade Holding Corp. (a) | 38,682 | 749,657 | ||||||
| 2,332,032 | ||||||||
Consumer Finance – 1.1% | ||||||||
| SLM Corp. (a) | 64,886 | 731,265 | ||||||
Diversified Financial Services – 2.0% | ||||||||
| IntercontinentalExchange Inc. (a) | 11,157 | 1,252,931 | ||||||
Real Estate Management & Development – 2.7% | ||||||||
| CB Richard Ellis Group, Inc. (a) | 128,377 | 1,742,076 | ||||||
Thrifts & Mortgage Finance – 2.1% | ||||||||
| People’s United Financial, Inc. | 79,125 | 1,321,388 | ||||||
TOTAL FINANCIALS | 7,379,692 | |||||||
HEALTH CARE – 15.3% | ||||||||
Biotechnology – 4.0% | ||||||||
| Amylin Pharmaceuticals, Inc. (a) | 60,408 | 857,190 | ||||||
| Biogen Idec, Inc. (a) | 24,736 | 1,323,376 | ||||||
| Talecris Biotherapeutics Holdings Corp. (a) | 15,120 | 336,722 | ||||||
| 2,517,288 | ||||||||
Health Care Equipment & Supplies – 5.0% | ||||||||
| C. R. Bard, Inc. | 13,946 | 1,086,393 | ||||||
| CareFusion Corp. (a) | 19,745 | 493,823 | ||||||
| St. Jude Medical, Inc. (a) | 43,967 | 1,617,106 | ||||||
| 3,197,322 | ||||||||
Health Care Providers & Services – 2.1% | ||||||||
| Emdeon, Inc. (a) | 39,049 | 595,497 | ||||||
| Henry Schein, Inc. (a) | 14,533 | 764,436 | ||||||
| 1,359,933 | ||||||||
Life Sciences Tools & Services – 2.7% | ||||||||
| Charles River Laboratories International, Inc. (a) | 27,525 | 927,317 | ||||||
| Millipore Corp. (a) | 10,790 | 780,657 | ||||||
| 1,707,974 | ||||||||
Pharmaceuticals – 1.5% | ||||||||
| Shire PLC – ADR | 16,295 | 956,516 | ||||||
TOTAL HEALTH CARE | 9,739,033 | |||||||
INDUSTRIALS – 8.6% | ||||||||
Aerospace & Defense – 1.3% | ||||||||
| Alliant Techsystems, Inc. (a) | 9,513 | 839,713 | ||||||
Air Freight & Logistics – 0.5% | ||||||||
| C.H. Robinson Worldwide, Inc. | 4,991 | 293,121 | ||||||
Commercial Services & Supplies – 1.8% | ||||||||
| Iron Mountain, Inc. (a) | 51,343 | 1,168,567 | ||||||
Construction & Engineering – 0.7% | ||||||||
| Quanta Services, Inc. (a) (b) | 20,772 | 432,889 | ||||||
Electrical Equipment – 1.9% | ||||||||
| Rockwell Automation, Inc. | 13,212 | 620,700 | ||||||
| Roper Industries, Inc. | 11,597 | 607,335 | ||||||
| 1,228,035 | ||||||||
(continued)
76
Ohio National Fund, Inc.
Mid Cap Opportunity Portfolio (continued)
Mid Cap Opportunity Portfolio (continued)
| Schedule of Investments | December 31, 2009 |
| Common Stocks – 96.5% | Shares | Value | ||||||
Machinery – 1.4% | ||||||||
| Kennametal, Inc. | 33,984 | $ | 880,865 | |||||
Professional Services – 1.0% | ||||||||
| Verisk Analytics, Inc. (a) | 20,223 | 612,352 | ||||||
TOTAL INDUSTRIALS | 5,455,542 | |||||||
INFORMATION TECHNOLOGY – 18.2% | ||||||||
Electronic Equipment, Instruments & Components – 3.6% | ||||||||
| Amphenol Corp. Class A | 27,672 | 1,277,893 | ||||||
| FLIR Systems, Inc. (a) | 29,947 | 979,866 | ||||||
| 2,257,759 | ||||||||
Internet Software & Services – 2.5% | ||||||||
| Equinix, Inc. (a) | 14,900 | 1,581,635 | ||||||
IT Services – 4.0% | ||||||||
| Cognizant Technology Solutions Corp. Class A (a) | 13,652 | 618,436 | ||||||
| Global Payments, Inc. | 25,470 | 1,371,814 | ||||||
| Western Union Co. / The | 30,902 | 582,503 | ||||||
| 2,572,753 | ||||||||
Semiconductors & Semiconductor Equipment – 5.9% | ||||||||
| Altera Corp. | 27,598 | 624,543 | ||||||
| Broadcom Corp. Class A (a) | 47,857 | 1,505,102 | ||||||
| FormFactor, Inc. (a) | 43,638 | 949,563 | ||||||
| Linear Technology Corp. | 21,139 | 645,585 | ||||||
| 3,724,793 | ||||||||
Software – 2.2% | ||||||||
| Citrix Systems, Inc. (a) | 17,102 | 711,614 | ||||||
| Salesforce.com, Inc. (a) | 9,395 | 693,069 | ||||||
| 1,404,683 | ||||||||
TOTAL INFORMATION TECHNOLOGY | 11,541,623 | |||||||
MATERIALS – 2.4% | ||||||||
Chemicals – 1.9% | ||||||||
| Ecolab, Inc. | 26,644 | 1,187,790 | ||||||
Paper & Forest Products – 0.5% | ||||||||
| Schweitzer-Mauduit International, Inc. | 4,844 | 340,775 | ||||||
TOTAL MATERIALS | 1,528,565 | |||||||
TELECOMMUNICATION SERVICES – 5.3% | ||||||||
Diversified Telecommunication Services – 1.8% | ||||||||
| tw telecom, inc. (a) | 66,647 | 1,142,330 | ||||||
Wireless Telecommunication Services – 3.5% | ||||||||
| American Tower Corp. Class A (a) | 30,830 | 1,332,164 | ||||||
| Crown Castle International Corp. (a) | 21,873 | 853,922 | ||||||
| 2,186,086 | ||||||||
TOTAL TELECOMMUNICATION SERVICES | 3,328,416 | |||||||
Total Common Stocks (Cost $57,704,627) | $ | 61,277,624 | ||||||
| Money Market Funds – 4.0% | Shares | Value | ||||||
| Fidelity Institutional Money Market Funds | ||||||||
| Prime Money Market Portfolio – Class I | 2,524,000 | $ | 2,524,000 | |||||
Total Money Market Funds (Cost $2,524,000) | $ | 2,524,000 | ||||||
Total Investments – 100.5% (Cost $60,228,627) (b) | $ | 63,801,624 | ||||||
Liabilities in Excess of Other Assets – (0.5)% | (299,846 | ) | ||||||
Net Assets – 100.0% | $ | 63,501,778 | ||||||
Percentages are stated as a percent of net assets.
Abbreviations:
ADR: American Depository Receipts
Footnotes:
| (a) | Non-income producing security. | |
| (b) | Represents cost for financial reporting purposes, which may differ from cost basis for Federal income tax purposes. See also Note 8 of the Note to Financial Statements. |
The accompanying notes are an integral part of these financial statements.
77
Ohio National Fund, Inc.
Mid Cap Opportunity Portfolio
Mid Cap Opportunity Portfolio
Statement of Assets and Liabilities
December 31, 2009
| Assets: | ||||
| Investments in securities, at value (Cost $60,228,627) | $ | 63,801,624 | ||
| Cash | 971 | |||
| Receivable for fund shares sold | 28,966 | |||
| Dividends and accrued interest receivable | 10,742 | |||
| Prepaid expenses and other assets | 893 | |||
| Total assets | 63,843,196 | |||
| Liabilities: | ||||
| Payable for securities purchased | 51,842 | |||
| Payable for fund shares redeemed | 223,430 | |||
| Payable for investment management services | 44,403 | |||
| Payable for compliance services | 1,677 | |||
| Accrued custody expense | 426 | |||
| Accrued professional fees | 11,165 | |||
| Accrued accounting fees | 4,259 | |||
| Accrued printing and filing fees | 4,216 | |||
| Total liabilities | 341,418 | |||
| Net assets | $ | 63,501,778 | ||
| Net assets consist of: | ||||
| Par value, $1 per share | $ | 4,121,406 | ||
| Paid-in capital in excess of par value | 96,328,818 | |||
| Accumulated net realized loss on investments | (40,521,443 | ) | ||
| Net unrealized appreciation on investments | 3,572,997 | |||
| Net assets | $ | 63,501,778 | ||
| Shares outstanding | 4,121,406 | |||
| Authorized Fund shares allocated to Portfolio | 10,000,000 | |||
| Net asset value per share | $ | 15.41 | ||
Statement of Operations
For the Year Ended December 31, 2009
| Investment income: | ||||
| Interest | $ | 30,709 | ||
| Dividends (net of withholding tax of $3,339) | 466,123 | |||
| Total investment income | 496,832 | |||
| Expenses: | ||||
| Management fees | 600,967 | |||
| Custodian fees | 9,433 | |||
| Directors’ fees | 7,769 | |||
| Professional fees | 15,793 | |||
| Accounting fees | 32,640 | |||
| Printing and filing fees | 13,866 | |||
| Compliance expense | 6,376 | |||
| Other | 1,859 | |||
| Total expenses | 688,703 | |||
| Net investment loss | (191,871 | ) | ||
| Realized/unrealized gain (loss) on investments: | ||||
| Net realized gain (loss) on investments | 7,384,263 | |||
| Change in unrealized appreciation/depreciation on investments | 14,668,798 | |||
| Net realized/unrealized gain (loss) on investments | 22,053,061 | |||
| Change in net assets from operations | $ | 21,861,190 | ||
The accompanying notes are an integral part of these financial statements.
78
Ohio National Fund, Inc.
Mid Cap Opportunity Portfolio
Mid Cap Opportunity Portfolio
Statements of Changes in Net Assets
| Years Ended December 31, | ||||||||
| 2009 | 2008 | |||||||
Increase (Decrease) in Net Assets: | ||||||||
| Operations: | ||||||||
| Net investment loss | $ | (191,871 | ) | $ | (520,337 | ) | ||
| Net realized gain (loss) on investments | 7,384,263 | (47,248,842 | ) | |||||
| Change in unrealized appreciation/depreciation on investments | 14,668,798 | (21,088,898 | ) | |||||
| Change in net assets from operations | 21,861,190 | (68,858,077 | ) | |||||
| Capital transactions: | ||||||||
| Received from shares sold | 37,239,976 | 66,864,431 | ||||||
| Paid for shares redeemed | (75,207,718 | ) | (33,801,822 | ) | ||||
| Change in net assets from capital transactions | (37,967,742 | ) | 33,062,609 | |||||
| Change in net assets | (16,106,552 | ) | (35,795,468 | ) | ||||
Net Assets: | ||||||||
| Beginning of year | 79,608,330 | 115,403,798 | ||||||
| End of year | $ | 63,501,778 | $ | 79,608,330 | ||||
Financial Highlights
| Years Ended December 31, | ||||||||||||||||||||
| 2009 | 2008 | 2007 | 2006 | 2005 | ||||||||||||||||
Selected Per-Share Data: | ||||||||||||||||||||
| Net asset value, beginning of year | $ | 10.96 | $ | 22.50 | $ | 19.09 | $ | 17.40 | $ | 15.83 | ||||||||||
| Operations: | ||||||||||||||||||||
| Net investment loss | (0.05 | ) | (0.07 | ) | (0.09 | ) | (0.09 | ) | (0.07 | ) | ||||||||||
| Net realized and unrealized gain (loss) on investments | 4.50 | (11.47 | ) | 3.50 | 1.78 | 1.64 | ||||||||||||||
| Total from operations | 4.45 | (11.54 | ) | 3.41 | 1.69 | 1.57 | ||||||||||||||
| Net asset value, end of year | $ | 15.41 | $ | 10.96 | $ | 22.50 | $ | 19.09 | $ | 17.40 | ||||||||||
Total return | 40.60 | % | –51.29 | % | 17.86 | % | 9.71 | % | 9.92 | % | ||||||||||
Ratios and supplemental data: | ||||||||||||||||||||
| Net assets at end of year (millions) | $ | 63.5 | $ | 79.6 | $ | 115.4 | $ | 86.6 | $ | 90.0 | ||||||||||
| Ratios to average net assets: | ||||||||||||||||||||
| Expenses | 0.97 | % | 0.94 | % | 0.93 | % | 0.94 | % | 0.95 | % | ||||||||||
| Net investment loss | –0.27 | % | –0.53 | % | –0.45 | % | –0.45 | % | –0.40 | % | ||||||||||
| Portfolio turnover rate | 276 | % | 297 | % | 267 | % | 209 | % | 205 | % | ||||||||||
The accompanying notes are an integral part of these financial statements.
79
Ohio National Fund, Inc.
S&P 500® Index Portfolio
S&P 500® Index Portfolio
Objective/Strategy
The S&P 500® Index Portfolio seeks total return that approximates the total return of the Standard & Poor’s 500® Index.
Performance as of December 31, 2009
Average Annual Total Returns: | ||||
| One year | 25.83% | |||
| Five years | -0.03% | |||
| Ten years | -1.58% |
Past performance does not guarantee future results. The performance data quoted represents past performance and current returns may be lower or higher. Total return figures include change in share price and reinvestment of dividends and capital gains. The investment return and principal value will fluctuate so that an investor’s shares, when redeemed may be worth more or less than the original cost. To obtain performance information up to the most recent month end, call toll-free 1-877-781-6392.
The Portfolio is not open to direct retail investment. Beneficial interest in shares is obtained solely by purchase of variable life insurance policies and variable annuity contracts. Actual performance results for variable annuity and variable universal life contracts will be lower due to contract charges. Consult your contract for applicable charges.
Comments
For the year ended December 31, 2009, the S&P 500® Index Portfolio returned 25.83% versus 26.46% for the current benchmark, the S&P 500® Index.
The Portfolio’s correlation with the S&P 500® Index was 99.9%. The high correlation is due to the fact that the Portfolio invests in each of the 500 stocks within the benchmark index. The Portfolio also invests in S&P 500 Depositary Receipts (“SPDRs”), an exchange traded fund that mimics the holdings and returns of the S&P 500® Index.(1)
The top five holdings in the Portfolio were Exxon Mobil Corp., Microsoft Corp., Apple, Inc., Johnson & Johnson, and The Procter & Gamble Co. The largest contributors in 2009 were Apple, Inc., Microsoft Corp., Google, Inc., International Business Machines Corp., and Cisco Systems, Inc. The largest detractors in 2009 were Exxon Mobil Corp., Citigroup, Inc., Wells Fargo & Co., Gilead Sciences, Inc., and General Electric Co.
Equities had a very good second half of 2009. Going into 2010, the economy might face some headwinds. High unemployment will depress consumer consumption, and access to easy credit will likely remain tight. The Federal Reserve is expected to keep a stimulative economic policy for 2010 and into 2011 to maintain the present economic momentum. Equities could see moderate growth in 2010.
| (1) | The Portfolio’s composition is subject to change. Holdings and weightings are as of December 31, 2009. |
“Standard & Poor’s®”, “S&P®”, “S&P 500®” and “Standard & Poor’s 500” are trademarks of The McGraw-Hill Companies, Inc. and have been licensed for use by Ohio National Investments, Inc. (ONI). The S&P 500® Index Portfolio is not sponsored, endorsed, sold or promoted by Standard & Poor’s (“S&P”) and S&P makes no representation regarding the advisability of investing in the S&P 500® Index Portfolio. S&P makes no representation or warranty, express or implied, to the owners of the Portfolio or any member of the public regarding the advisability of investing in securities generally or in the Portfolio particularly or the ability of the S&P 500® Index to track general stock market performance. S&P’s only relationship to ONI is the licensing of certain trademarks and trade names of S&P® and of the S&P 500® Index which is determined, composed and calculated by S&P® without regard to ONI or the S&P 500® Index Portfolio. S&P® has no obligation to take the needs of ONI or the owners of the Portfolio into consideration in determining, composing or calculating the S&P 500® Index. S&P® is not responsible for and has not participated in the determination of the prices and amount of the Portfolio or the timing of the issuance or sale of the Portfolio or in the determination or calculation of the equation by which the Portfolio is to be converted into cash. S&P® has no obligation or liability in connection with the administration, marketing or trading of the Portfolio.
Change in Value of $10,000 Investment
![[PERFORMANCE GRAPH]](https://capedge.com/proxy/N-CSR/0000950123-10-021904/l38589l3858947.gif)
Hypothetical illustration based on past performance. Future performance will vary. The Portfolio’s returns reflect reinvested dividends. The Portfolio’s holdings may differ significantly from the securities in the index. The index is unmanaged and therefore does not reflect the cost of portfolio management and accounting. Investors cannot invest directly in an index, although they can invest in its underlying securities or funds.
The S&P 500® Index is a capitalization-weighted index designed to measure performance of the broad domestic economy through changes in the aggregate market value of 500 stocks representing all major industries. The index presented herein includes the effects of reinvested dividends.
(continued)
80
Ohio National Fund, Inc.
S&P 500® Index Portfolio (Continued)
S&P 500® Index Portfolio (Continued)
Portfolio Composition as of December 31, 2009 (1)
| % of Net Assets | |||
Common Stocks (3) | 97.6 | ||
| Exchange Traded Funds | 2.1 | ||
| Commercial Paper and | |||
| Other Net Assets | 0.3 | ||
| 100.0 | |||
Top 10 Portfolio Holdings as of December 31, 2009 (1) (2)
| % of Net Assets | |||||||
| 1. | Exxon Mobil Corp. | 3.2 | |||||
| 2. | Microsoft Corp. | 2.3 | |||||
| 3. | Standard & Poor’s Depositary Receipts | 2.1 | |||||
| 4. | Apple, Inc. | 1.9 | |||||
| 5. | Johnson & Johnson | 1.7 | |||||
| 6. | Procter & Gamble Co. / The | 1.7 | |||||
| 7. | International Business Machines Corp. | 1.7 | |||||
| 8. | AT&T, Inc. | 1.6 | |||||
| 9. | JPMorgan Chase & Co. | 1.6 | |||||
| 10. | General Electric Co. | 1.6 | |||||
| (1) | Composition of Portfolio subject to change. | |
| (2) | Short-term investments have been excluded from the list of Top 10 Portfolio holdings. | |
| (3) | Sectors: |
| % of Net Assets | |||
| Information Technology | 19.4 | ||
| Financials | 14.0 | ||
| Health Care | 12.3 | ||
| Energy | 11.2 | ||
| Consumer Staples | 11.1 | ||
| Industrials | 10.0 | ||
| Consumer Discretionary | 9.4 | ||
| Utilities | 3.6 | ||
| Materials | 3.5 | ||
| Telecommunication Services | 3.1 | ||
| 97.6 | |||
81
Ohio National Fund, Inc.
S&P 500® Index Portfolio
S&P 500® Index Portfolio
| Schedule of Investments | December 31, 2009 |
| Common Stocks – 97.6% | Shares | Value | ||||||
CONSUMER DISCRETIONARY – 9.4% | ||||||||
Auto Components – 0.2% | ||||||||
| Goodyear Tire & Rubber Co. / The (a) | 3,800 | $ | 53,580 | |||||
| Johnson Controls, Inc. | 10,600 | 288,744 | ||||||
| 342,324 | ||||||||
Automobiles – 0.4% | ||||||||
| Ford Motor Co. (a) | 52,187 | 521,870 | ||||||
| Harley-Davidson, Inc. | 3,700 | 93,240 | ||||||
| 615,110 | ||||||||
Distributors – 0.1% | ||||||||
| Genuine Parts Co. | 2,500 | 94,900 | ||||||
Diversified Consumer Services – 0.2% | ||||||||
| Apollo Group, Inc. Class A (a) | 2,000 | 121,160 | ||||||
| DeVry, Inc. | 1,000 | 56,730 | ||||||
| H&R Block, Inc. | 5,300 | 119,886 | ||||||
| 297,776 | ||||||||
Hotels, Restaurants & Leisure – 1.5% | ||||||||
| Carnival Corp. (a) | 6,900 | 218,661 | ||||||
| Darden Restaurants, Inc. | 2,200 | 77,154 | ||||||
| International Game Technology | 4,700 | 88,219 | ||||||
| Marriott International, Inc. Class A | 4,046 | 110,254 | ||||||
| McDonald’s Corp. | 17,000 | 1,061,480 | ||||||
| Starbucks Corp. (a) | 11,700 | 269,802 | ||||||
| Starwood Hotels & Resorts Worldwide, Inc. | 3,000 | 109,710 | ||||||
| Wyndham Worldwide Corp. | 2,860 | 57,686 | ||||||
| Wynn Resorts Ltd. (a) | 1,100 | 64,053 | ||||||
| Yum! Brands, Inc. | 7,400 | 258,778 | ||||||
| 2,315,797 | ||||||||
Household Durables – 0.3% | ||||||||
| Black & Decker Corp. / The | 1,000 | 64,830 | ||||||
| D.R. Horton, Inc. | 4,400 | 47,828 | ||||||
| Fortune Brands, Inc. | 2,400 | 103,680 | ||||||
| Harman International Industries, Inc. | 1,100 | 38,808 | ||||||
| Leggett & Platt, Inc. | 2,400 | 48,960 | ||||||
| Lennar Corp. Class A | 2,500 | 31,925 | ||||||
| Newell Rubbermaid, Inc. | 4,400 | 66,044 | ||||||
| Pulte Homes, Inc. (a) | 4,950 | 49,500 | ||||||
| Whirlpool Corp. | 1,155 | 93,162 | ||||||
| 544,737 | ||||||||
Internet & Catalog Retail – 0.6% | ||||||||
| Amazon.com, Inc. (a) | 5,300 | 712,956 | ||||||
| Expedia, Inc. (a) | 3,300 | 84,843 | ||||||
| Priceline.com, Inc. (a) | 650 | 142,025 | ||||||
| 939,824 | ||||||||
Leisure Equipment & Products – 0.1% | ||||||||
| Eastman Kodak Co. (a) | 4,200 | 17,724 | ||||||
| Hasbro, Inc. | 2,000 | 64,120 | ||||||
| Mattel, Inc. | 5,700 | 113,886 | ||||||
| 195,730 | ||||||||
Media – 2.8% | ||||||||
| CBS Corp. Class B | 10,650 | 149,632 | ||||||
| Comcast Corp. Class A | 45,053 | 759,594 | ||||||
| DIRECTV Group, Inc. / The (a) | 15,100 | 503,585 | ||||||
| Gannett Co., Inc. | 3,700 | 54,945 | ||||||
| Interpublic Group of Companies, Inc. (a) | 7,723 | 56,996 | ||||||
| McGraw-Hill Companies, Inc. / The | 5,000 | 167,550 | ||||||
| Meredith Corp. | 600 | 18,510 | ||||||
| New York Times Co. Class A / The (a) | 1,800 | 22,248 | ||||||
| News Corp. Class A | 35,600 | 487,364 | ||||||
| Omnicom Group, Inc. | 4,900 | 191,835 | ||||||
| Scripps Networks Interactive, Inc. | 1,400 | 58,100 | ||||||
| Time Warner Cable, Inc. | 5,532 | 228,969 | ||||||
| Time Warner, Inc. | 18,466 | 538,099 | ||||||
| Viacom, Inc. Class B (a) | 9,550 | 283,922 | ||||||
| Walt Disney Co. / The | 30,300 | 977,175 | ||||||
| Washington Post Co. Class B / The | 100 | 43,960 | ||||||
| 4,542,484 | ||||||||
Multiline Retail – 0.8% | ||||||||
| Big Lots, Inc. (a) | 1,300 | 37,674 | ||||||
| Family Dollar Stores, Inc. | 2,200 | 61,226 | ||||||
| J.C. Penney Co., Inc. | 3,700 | 98,457 | ||||||
| Kohl’s Corp. (a) | 4,800 | 258,864 | ||||||
| Macy’s, Inc. | 6,676 | 111,890 | ||||||
| Nordstrom, Inc. | 2,600 | 97,708 | ||||||
| Sears Holdings Corp. (a) | 801 | 66,843 | ||||||
| Target Corp. | 11,900 | 575,603 | ||||||
| 1,308,265 | ||||||||
Specialty Retail – 1.9% | ||||||||
| Abercrombie & Fitch Co. Class A | 1,400 | 48,790 | ||||||
| AutoNation, Inc. (a) | 1,500 | 28,725 | ||||||
| AutoZone, Inc. (a) | 500 | 79,035 | ||||||
| Bed Bath & Beyond, Inc. (a) | 4,100 | 158,383 | ||||||
| Best Buy Co., Inc. | 5,375 | 212,097 | ||||||
| GameStop Corp. Class A (a) | 2,600 | 57,044 | ||||||
| Gap, Inc. / The | 7,550 | 158,173 | ||||||
| Home Depot, Inc. / The | 26,900 | 778,217 | ||||||
| Limited Brands, Inc. | 4,200 | 80,808 | ||||||
| Lowe’s Companies, Inc. | 23,200 | 542,648 | ||||||
| Office Depot, Inc. (a) | 4,300 | 27,735 | ||||||
| O’Reilly Automotive, Inc. (a) | 2,200 | 83,864 | ||||||
| RadioShack Corp. | 2,000 | 39,000 | ||||||
| Ross Stores, Inc. | 2,000 | 85,420 | ||||||
| Sherwin-Williams Co. / The | 1,500 | 92,475 | ||||||
| Staples, Inc. | 11,400 | 280,326 | ||||||
| Tiffany & Co. | 2,000 | 86,000 | ||||||
| TJX Cos., Inc. / The | 6,600 | 241,230 | ||||||
| 3,079,970 | ||||||||
Textiles, Apparel & Luxury Goods – 0.5% | ||||||||
| Coach, Inc. | 5,000 | 182,650 | ||||||
| NIKE, Inc. Class B | 6,200 | 409,634 | ||||||
(continued)
82
Ohio National Fund, Inc.
S&P 500® Index Portfolio (Continued)
S&P 500® Index Portfolio (Continued)
| Schedule of Investments | December 31, 2009 |
| Common Stocks – 97.6% | Shares | Value | ||||||
Textiles, Apparel & Luxury Goods (continued) | ||||||||
| Polo Ralph Lauren Corp. | 900 | $ | 72,882 | |||||
| V.F. Corp. | 1,400 | 102,536 | ||||||
| 767,702 | ||||||||
TOTAL CONSUMER DISCRETIONARY | 15,044,619 | |||||||
CONSUMER STAPLES – 11.1% | ||||||||
Beverages – 2.6% | ||||||||
| Brown-Forman Corp. Class B | 1,750 | 93,747 | ||||||
Coca-Cola Co. / The | 36,600 | 2,086,200 | ||||||
Coca-Cola Enterprises, Inc. | 5,000 | 106,000 | ||||||
| Constellation Brands, Inc. Class A (a) | 3,100 | 49,383 | ||||||
| Dr Pepper Snapple Group, Inc. | 4,000 | 113,200 | ||||||
| Molson Coors Brewing Co. Class B | 2,500 | 112,900 | ||||||
| Pepsi Bottling Group, Inc. / The | 2,300 | 86,250 | ||||||
| PepsiCo, Inc. | 24,600 | 1,495,680 | ||||||
| 4,143,360 | ||||||||
Food & Staples Retailing – 2.6% | ||||||||
| Costco Wholesale Corp. | 6,900 | 408,273 | ||||||
| CVS Caremark Corp. | 22,320 | 718,927 | ||||||
| Kroger Co. / The | 10,300 | 211,459 | ||||||
| Safeway, Inc. | 6,400 | 136,256 | ||||||
| SUPERVALU, Inc. | 3,319 | 42,185 | ||||||
| Sysco Corp. | 9,300 | 259,842 | ||||||
| Walgreen Co. | 15,600 | 572,832 | ||||||
| Wal-Mart Stores, Inc. | 33,700 | 1,801,265 | ||||||
| Whole Foods Market, Inc. (a) | 2,200 | 60,390 | ||||||
| 4,211,429 | ||||||||
Food Products – 1.6% | ||||||||
| Archer-Daniels-Midland Co. | 10,150 | 317,796 | ||||||
| Campbell Soup Co. | 3,000 | 101,400 | ||||||
| ConAgra Foods, Inc. | 7,000 | 161,350 | ||||||
| Dean Foods Co. (a) | 2,900 | 52,316 | ||||||
| General Mills, Inc. | 5,200 | 368,212 | ||||||
| H.J. Heinz Co. | 5,000 | 213,800 | ||||||
| Hershey Company / The | 2,600 | 93,054 | ||||||
| Hormel Foods Corp. | 1,100 | 42,295 | ||||||
| J.M. Smucker Co. / The | 1,900 | 117,325 | ||||||
| Kellogg Co. | 4,000 | 212,800 | ||||||
| Kraft Foods, Inc. Class A | 23,376 | 635,360 | ||||||
| McCormick & Co., Inc. | 2,100 | 75,873 | ||||||
| Sara Lee Corp. | 11,000 | 133,980 | ||||||
| Tyson Foods, Inc. Class A | 4,800 | 58,896 | ||||||
| 2,584,457 | ||||||||
Household Products – 2.5% | ||||||||
| Clorox Co. / The | 2,200 | 134,200 | ||||||
| Colgate-Palmolive Co. | 7,900 | 648,985 | ||||||
| Kimberly-Clark Corp. | 6,600 | 420,486 | ||||||
| Procter & Gamble Co. / The | 46,122 | 2,796,377 | ||||||
| 4,000,048 | ||||||||
Personal Products – 0.3% | ||||||||
| Avon Products, Inc. | 6,700 | 211,050 | ||||||
| Estee Lauder Cos. Inc. Class A / The | 1,900 | 91,884 | ||||||
| Mead Johnson Nutrition Co. | 3,251 | 142,069 | ||||||
| 445,003 | ||||||||
Tobacco – 1.5% | ||||||||
| Altria Group, Inc. | 32,700 | 641,901 | ||||||
| Lorillard, Inc. | 2,497 | 200,334 | ||||||
| Philip Morris International, Inc. | 30,100 | 1,450,519 | ||||||
| Reynolds American, Inc. | 2,700 | 143,019 | ||||||
| 2,435,773 | ||||||||
TOTAL CONSUMER STAPLES | 17,820,070 | |||||||
ENERGY – 11.2% | ||||||||
Energy Equipment & Services – 1.8% | ||||||||
| Baker Hughes, Inc. | 4,900 | 198,352 | ||||||
| BJ Services Co. | 4,600 | 85,560 | ||||||
| Cameron International Corp. (a) | 3,900 | 163,020 | ||||||
| Diamond Offshore Drilling, Inc. | 1,100 | 108,262 | ||||||
| FMC Technologies, Inc. (a) | 1,900 | 109,896 | ||||||
| Halliburton Co. | 14,200 | 427,278 | ||||||
| Nabors Industries Ltd. (a) | 4,500 | 98,505 | ||||||
| National Oilwell Varco, Inc. (a) | 6,600 | 290,994 | ||||||
| Rowan Cos., Inc. (a) | 1,800 | 40,752 | ||||||
| Schlumberger Ltd. | 19,000 | 1,236,710 | ||||||
| Smith International, Inc. | 3,900 | 105,963 | ||||||
| 2,865,292 | ||||||||
Oil, Gas & Consumable Fuels – 9.4% | ||||||||
| Anadarko Petroleum Corp. | 7,800 | 486,876 | ||||||
| Apache Corp. | 5,322 | 549,071 | ||||||
| Cabot Oil & Gas Corp. | 1,600 | 69,744 | ||||||
| Chesapeake Energy Corp. | 10,200 | 263,976 | ||||||
| Chevron Corp. | 31,638 | 2,435,810 | ||||||
| ConocoPhillips | 23,400 | 1,195,038 | ||||||
| CONSOL Energy, Inc. | 2,900 | 144,420 | ||||||
| Denbury Resources, Inc. (a) | 3,900 | 57,720 | ||||||
| Devon Energy Corp. | 7,000 | 514,500 | ||||||
| El Paso Corp.�� | 11,100 | 109,113 | ||||||
| EOG Resources, Inc. | 4,000 | 389,200 | ||||||
| Exxon Mobil Corp. | 75,000 | 5,114,250 | ||||||
| Hess Corp. | 4,600 | 278,300 | ||||||
| Marathon Oil Corp. | 11,220 | 350,288 | ||||||
| Massey Energy Corp. | 1,400 | 58,814 | ||||||
| Murphy Oil Corp. | 3,000 | 162,600 | ||||||
| Noble Energy, Inc. | 2,700 | 192,294 | ||||||
| Occidental Petroleum Corp. | 12,800 | 1,041,280 | ||||||
| Peabody Energy Corp. | 4,200 | 189,882 | ||||||
| Pioneer Natural Resources Co. | 1,800 | 86,706 | ||||||
| Range Resources Corp. | 2,500 | 124,625 | ||||||
| Southwestern Energy Co. (a) | 5,500 | 265,100 | ||||||
| Spectra Energy Corp. | 10,218 | 209,571 | ||||||
| Sunoco, Inc. | 1,800 | 46,980 | ||||||
| Tesoro Corp. | 2,200 | 29,810 | ||||||
| Valero Energy Corp. | 8,900 | 149,075 | ||||||
(continued)
83
Ohio National Fund, Inc.
S&P 500® Index Portfolio (Continued)
S&P 500® Index Portfolio (Continued)
| Schedule of Investments | December 31, 2009 |
| Common Stocks – 97.6% | Shares | Value | ||||||
Oil, Gas & Consumable Fuels (continued) | ||||||||
| Williams Cos., Inc. / The | 9,200 | $ | 193,936 | |||||
| XTO Energy, Inc. | 9,166 | 426,494 | ||||||
| 15,135,473 | ||||||||
TOTAL ENERGY | 18,000,765 | |||||||
FINANCIALS – 14.0% | ||||||||
Capital Markets – 2.7% | ||||||||
| Ameriprise Financial, Inc. | 3,980 | 154,503 | ||||||
| Bank Of New York Mellon Corp. / The | 19,011 | 531,738 | ||||||
| Charles Schwab Corp. / The | 15,000 | 282,300 | ||||||
| E*TRADE Financial Corp. (a) | 24,500 | 42,875 | ||||||
| Federated Investors, Inc. Class B | 1,400 | 38,500 | ||||||
| Franklin Resources, Inc. | 2,400 | 252,840 | ||||||
| Goldman Sachs Group, Inc. / The | 8,150 | 1,376,046 | ||||||
| Invesco Ltd. | 6,800 | 159,732 | ||||||
| Janus Capital Group, Inc. | 2,900 | 39,005 | ||||||
| Legg Mason, Inc. | 2,600 | 78,416 | ||||||
| Morgan Stanley | 21,500 | 636,400 | ||||||
| Northern Trust Corp. | 3,800 | 199,120 | ||||||
| State Street Corp. | 7,800 | 339,612 | ||||||
| T. Rowe Price Group, Inc. | 4,100 | 218,325 | ||||||
| 4,349,412 | ||||||||
Commercial Banks – 2.7% | ||||||||
| BB&T Corp. | 10,900 | 276,533 | ||||||
| Comerica, Inc. | 2,400 | 70,968 | ||||||
| Fifth Third Bancorp | 12,550 | 122,362 | ||||||
| First Horizon National Corp. (a) | 3,548 | 47,548 | ||||||
| Huntington Bancshares, Inc. | 11,300 | 41,245 | ||||||
| KeyCorp | 13,900 | 77,145 | ||||||
| M&T Bank Corp. | 1,300 | 86,957 | ||||||
| Marshall & Ilsley Corp. | 8,300 | 45,235 | ||||||
| PNC Financial Services Group, Inc. | 7,242 | 382,305 | ||||||
| Regions Financial Corp. | 18,775 | 99,320 | ||||||
| SunTrust Banks, Inc. | 7,900 | 160,291 | ||||||
| U.S. Bancorp | 30,190 | 679,577 | ||||||
| Wells Fargo & Co. | 80,713 | 2,178,444 | ||||||
| Zions Bancorporation | 2,200 | 28,226 | ||||||
| 4,296,156 | ||||||||
Consumer Finance – 0.8% | ||||||||
| American Express Co. | 18,800 | 761,776 | ||||||
| Capital One Financial Corp. | 7,073 | 271,179 | ||||||
| Discover Financial Services | 8,550 | 125,770 | ||||||
| SLM Corp. (a) | 7,500 | 84,525 | ||||||
| 1,243,250 | ||||||||
Diversified Financial Services – 4.2% | ||||||||
| Bank of America Corp. | 156,927 | 2,363,321 | ||||||
| Citigroup, Inc. | 308,169 | 1,020,039 | ||||||
| CME Group, Inc. | 1,075 | 361,146 | ||||||
| IntercontinentalExchange, Inc. (a) | 1,200 | 134,760 | ||||||
| JPMorgan Chase & Co. | 62,243 | 2,593,666 | ||||||
| Leucadia National Corp. (a) | 3,000 | 71,370 | ||||||
| Moody’s Corp. | 3,100 | 83,080 | ||||||
| NASDAQ OMX Group, Inc. / The (a) | 2,300 | 45,586 | ||||||
| NYSE Euronext | 4,100 | 103,730 | ||||||
| 6,776,698 | ||||||||
Insurance – 2.3% | ||||||||
| Aflac, Inc. | 7,400 | 342,250 | ||||||
| Allstate Corp. / The | 8,500 | 255,340 | ||||||
| American International Group, Inc. (a) | 2,095 | 62,808 | ||||||
| AON Corp. | 4,300 | 164,862 | ||||||
| Assurant, Inc. | 1,800 | 53,064 | ||||||
| Chubb Corp. / The | 5,400 | 265,572 | ||||||
| Cincinnati Financial Corp. | 2,566 | 67,332 | ||||||
| Genworth Financial, Inc. Class A (a) | 7,700 | 87,395 | ||||||
| Hartford Financial Services Group, Inc. / The | 6,000 | 139,560 | ||||||
| Lincoln National Corp. | 4,786 | 119,076 | ||||||
| Loews Corp. | 5,661 | 205,777 | ||||||
| Marsh & Mclennan Companies, Inc. | 8,300 | 183,264 | ||||||
| MetLife, Inc. | 12,900 | 456,015 | ||||||
| Principal Financial Group, Inc. | 5,000 | 120,200 | ||||||
| Progressive Corp. / The (a) | 10,600 | 190,694 | ||||||
| Prudential Financial, Inc. | 7,300 | 363,248 | ||||||
| Torchmark Corp. | 1,300 | 57,135 | ||||||
| Travelers Companies, Inc. / The | 8,659 | 431,738 | ||||||
| Unum Group | 5,200 | 101,504 | ||||||
| XL Capital Ltd. Class A | 5,400 | 98,982 | ||||||
| 3,765,816 | ||||||||
Real Estate Investment Trusts – 1.2% | ||||||||
| Apartment Investment & Management Co. Class A | 1,873 | 29,818 | ||||||
| AvalonBay Communities, Inc. | 1,331 | 109,289 | ||||||
| Boston Properties, Inc. | 2,200 | 147,554 | ||||||
| Equity Residential | 4,400 | 148,632 | ||||||
| HCP, Inc. | 4,600 | 140,484 | ||||||
| Health Care REIT, Inc. | 1,900 | 84,208 | ||||||
| Host Hotels & Resorts, Inc. | 10,002 | 116,734 | ||||||
| Kimco Realty Corp. | 6,300 | 85,239 | ||||||
| Plum Creek Timber Co. Inc. | 2,600 | 98,176 | ||||||
| ProLogis | 7,500 | 102,675 | ||||||
| Public Storage | 2,100 | 171,045 | ||||||
| Simon Property Group, Inc. | 4,562 | 364,053 | ||||||
| Ventas, Inc. | 2,500 | 109,350 | ||||||
| Vornado Realty Trust | 2,493 | 174,360 | ||||||
| 1,881,617 | ||||||||
Real Estate Management & Development – 0.0% | ||||||||
| CB Richard Ellis Group, Inc. (a) | 4,300 | 58,351 | ||||||
Thrifts & Mortgage Finance – 0.1% | ||||||||
| Hudson City Bancorp, Inc. | 7,500 | 102,975 | ||||||
| Peoples United Financial, Inc. | 5,500 | 91,850 | ||||||
| 194,825 | ||||||||
TOTAL FINANCIALS | 22,566,125 | |||||||
(continued)
84
Ohio National Fund, Inc.
S&P 500® Index Portfolio (Continued)
S&P 500® Index Portfolio (Continued)
| Schedule of Investments | December 31, 2009 |
| Common Stocks – 97.6% | Shares | Value | ||||||
HEALTH CARE – 12.3% | ||||||||
Biotechnology – 1.5% | ||||||||
| Amgen, Inc. (a) | 16,006 | $ | 905,459 | |||||
| Biogen Idec, Inc. (a) | 4,545 | 243,158 | ||||||
| Celgene Corp. (a) | 7,300 | 406,464 | ||||||
| Cephalon, Inc. (a) | 1,200 | 74,892 | ||||||
| Genzyme Corp. (a) | 4,200 | 205,842 | ||||||
| Gilead Sciences, Inc. (a) | 14,200 | 614,576 | ||||||
| 2,450,391 | ||||||||
Health Care Equipment & Supplies – 2.0% | ||||||||
| Baxter International, Inc. | 9,500 | 557,460 | ||||||
| Becton Dickinson & Co. | 3,700 | 291,782 | ||||||
| Boston Scientific Corp. (a) | 23,903 | 215,127 | ||||||
| C.R. Bard, Inc. | 1,500 | 116,850 | ||||||
| CareFusion Corp. (a) | 2,750 | 68,777 | ||||||
| DENTSPLY International, Inc. | 2,400 | 84,408 | ||||||
| Hospira, Inc. (a) | 2,610 | 133,110 | ||||||
| Intuitive Surgical, Inc. (a) | 600 | 181,992 | ||||||
| Medtronic, Inc. | 17,500 | 769,650 | ||||||
| St. Jude Medical, Inc. (a) | 5,300 | 194,934 | ||||||
| Stryker Corp. | 4,500 | 226,665 | ||||||
| Varian Medical Systems, Inc. (a) | 2,000 | 93,700 | ||||||
| Zimmer Holdings, Inc. (a) | 3,370 | 199,201 | ||||||
| 3,133,656 | ||||||||
Health Care Providers & Services – 2.1% | ||||||||
| Aetna, Inc. | 6,800 | 215,560 | ||||||
| AmerisourceBergen Corp. | 4,500 | 117,315 | ||||||
| Cardinal Health, Inc. | 5,700 | 183,768 | ||||||
| CIGNA Corp. | 4,300 | 151,661 | ||||||
| Coventry Health Care, Inc. (a) | 2,300 | 55,867 | ||||||
| DaVita, Inc. (a) | 1,600 | 93,984 | ||||||
| Express Scripts, Inc. (a) | 4,300 | 371,735 | ||||||
| Humana, Inc. (a) | 2,700 | 118,503 | ||||||
| Laboratory Corp. of America Holdings (a) | 1,700 | 127,228 | ||||||
| McKesson Corp. | 4,200 | 262,500 | ||||||
| Medco Health Solutions, Inc. (a) | 7,576 | 484,182 | ||||||
| Patterson Cos., Inc. (a) | 1,500 | 41,970 | ||||||
| Quest Diagnostics, Inc. | 2,500 | 150,950 | ||||||
| Tenet Healthcare Corp. (a) | 6,850 | 36,922 | ||||||
| UnitedHealth Group, Inc. | 18,400 | 560,832 | ||||||
| WellPoint, Inc. (a) | 7,200 | 419,688 | ||||||
| 3,392,665 | ||||||||
Health Care Technology – 0.0% | ||||||||
| IMS Health, Inc. | 2,900 | 61,074 | ||||||
Life Sciences Tools & Services – 0.4% | ||||||||
| Life Technologies Corp. (a) | 2,817 | 147,132 | ||||||
| Millipore Corp. (a) | 900 | 65,115 | ||||||
| PerkinElmer, Inc. | 1,800 | 37,062 | ||||||
| Thermo Fisher Scientific, Inc. (a) | 6,400 | 305,216 | ||||||
| Waters Corp. (a) | 1,500 | 92,940 | ||||||
| 647,465 | ||||||||
Pharmaceuticals – 6.3% | ||||||||
| Abbott Laboratories | 24,400 | 1,317,356 | ||||||
| Allergan, Inc. | 4,900 | 308,749 | ||||||
| Bristol-Myers Squibb Co. | 26,969 | 680,967 | ||||||
| Eli Lilly & Co. | 16,000 | 571,360 | ||||||
| Forest Laboratories, Inc. (a) | 4,800 | 154,128 | ||||||
| Johnson & Johnson | 43,600 | 2,808,276 | ||||||
| King Pharmaceuticals, Inc. (a) | 3,900 | 47,853 | ||||||
| Merck & Co., Inc. | 48,194 | 1,761,009 | ||||||
| Mylan, Inc. (a) | 4,800 | 88,464 | ||||||
| Pfizer, Inc. | 127,410 | 2,317,588 | ||||||
| Watson Pharmaceuticals, Inc. (a) | 1,700 | 67,337 | ||||||
| 10,123,087 | ||||||||
TOTAL HEALTH CARE | 19,808,338 | |||||||
INDUSTRIALS – 10.0% | ||||||||
Aerospace & Defense – 2.7% | ||||||||
| Boeing Co. / The | 11,500 | 622,495 | ||||||
| General Dynamics Corp. | 6,100 | 415,837 | ||||||
| Goodrich Corp. | 2,000 | 128,500 | ||||||
| Honeywell International, Inc. | 12,100 | 474,320 | ||||||
| ITT Corp. | 2,900 | 144,246 | ||||||
| L-3 Communications Holdings, Inc. | 1,800 | 156,510 | ||||||
| Lockheed Martin Corp. | 5,100 | 384,285 | ||||||
| Northrop Grumman Corp. | 5,000 | 279,250 | ||||||
| Precision Castparts Corp. | 2,200 | 242,770 | ||||||
| Raytheon Co. | 6,100 | 314,272 | ||||||
| Rockwell Collins, Inc. | 2,500 | 138,400 | ||||||
| United Technologies Corp. | 14,800 | 1,027,268 | ||||||
| 4,328,153 | ||||||||
Air Freight & Logistics – 1.0% | ||||||||
| C.H. Robinson Worldwide, Inc. | 2,600 | 152,698 | ||||||
| Expeditors International of Washington, Inc. | 3,300 | 114,609 | ||||||
| FedEx Corp. | 4,900 | 408,905 | ||||||
| United Parcel Service, Inc. Class B | 15,700 | 900,709 | ||||||
| 1,576,921 | ||||||||
Airlines – 0.1% | ||||||||
| Southwest Airlines Co. | 11,700 | 133,731 | ||||||
Building Products – 0.0% | ||||||||
| Masco Corp. | 5,700 | 78,717 | ||||||
Commercial Services & Supplies – 0.5% | ||||||||
| Avery Dennison Corp. | 1,800 | 65,682 | ||||||
| Cintas Corp. | 2,100 | 54,705 | ||||||
| Iron Mountain, Inc. (a) | 2,900 | 66,004 | ||||||
| Pitney Bowes, Inc. | 3,300 | 75,108 | ||||||
| R.R. Donnelley & Sons Co. | 3,200 | 71,264 | ||||||
| Republic Services, Inc. | 5,080 | 143,815 | ||||||
| Stericycle, Inc. (a) | 1,300 | 71,721 | ||||||
| Waste Management, Inc. | 7,700 | 260,337 | ||||||
| 808,636 | ||||||||
Construction & Engineering – 0.2% | ||||||||
| Fluor Corp. | 2,800 | 126,112 | ||||||
| Jacobs Engineering Group, Inc. (a) | 2,000 | 75,220 | ||||||
| Quanta Services, Inc. (a) | 3,300 | 68,772 | ||||||
| 270,104 | ||||||||
(continued)
85
Ohio National Fund, Inc.
S&P 500® Index Portfolio (Continued)
S&P 500® Index Portfolio (Continued)
| Schedule of Investments | December 31, 2009 |
| Common Stocks – 97.6% | Shares | Value | ||||||
Electrical Equipment – 0.5% | ||||||||
| Emerson Electric Co. | 11,900 | $ | 506,940 | |||||
| First Solar, Inc. (a) | 750 | 101,550 | ||||||
| Rockwell Automation, Inc. | 2,200 | 103,356 | ||||||
| Roper Industries, Inc. | 1,400 | 73,318 | ||||||
| 785,164 | ||||||||
Industrial Conglomerates – 2.2% | ||||||||
| 3M Co. | 11,200 | 925,904 | ||||||
| General Electric Co. | 168,200 | 2,544,866 | ||||||
| Textron, Inc. | 4,300 | 80,883 | ||||||
| 3,551,653 | ||||||||
Machinery – 1.6% | ||||||||
| Caterpillar, Inc. | 9,800 | 558,502 | ||||||
| Cummins, Inc. | 3,200 | 146,752 | ||||||
| Danaher Corp. | 4,100 | 308,320 | ||||||
| Deere & Co. | 6,700 | 362,403 | ||||||
| Dover Corp. | 2,900 | 120,669 | ||||||
| Eaton Corp. | 2,600 | 165,412 | ||||||
| Flowserve Corp. | 900 | 85,077 | ||||||
| Illinois Tool Works, Inc. | 6,100 | 292,739 | ||||||
| PACCAR, Inc. | 5,712 | 207,174 | ||||||
| Pall Corp. | 1,800 | 65,160 | ||||||
| Parker Hannifin Corp. | 2,500 | 134,700 | ||||||
| Snap-On, Inc. | 900 | 38,034 | ||||||
| Stanley Works / The | 1,300 | 66,963 | ||||||
| 2,551,905 | ||||||||
Professional Services – 0.1% | ||||||||
| Dun & Bradstreet Corp. | 800 | 67,496 | ||||||
| Equifax, Inc. | 2,000 | 61,780 | ||||||
| Monster Worldwide, Inc. (a) | 2,000 | 34,800 | ||||||
| Robert Half International, Inc. | 2,400 | 64,152 | ||||||
| 228,228 | ||||||||
Road & Rail – 1.0% | ||||||||
| Burlington Northern Santa Fe Corp. | 4,100 | 404,342 | ||||||
| CSX Corp. | 6,200 | 300,638 | ||||||
| Norfolk Southern Corp. | 5,800 | 304,036 | ||||||
| Ryder System, Inc. | 900 | 37,053 | ||||||
| Union Pacific Corp. | 8,000 | 511,200 | ||||||
| 1,557,269 | ||||||||
Trading Companies & Distributors – 0.1% | ||||||||
| Fastenal Co. | 2,100 | 87,444 | ||||||
| W.W. Grainger, Inc. | 1,000 | 96,830 | ||||||
| 184,274 | ||||||||
TOTAL INDUSTRIALS | 16,054,755 | |||||||
INFORMATION TECHNOLOGY – 19.4% | ||||||||
Communications Equipment – 2.5% | ||||||||
| Cisco Systems, Inc. (a) | 90,900 | 2,176,146 | ||||||
| Harris Corp. | 2,100 | 99,855 | ||||||
| JDS Uniphase Corp. (a) | 3,475 | 28,669 | ||||||
| Juniper Networks, Inc. (a) | 8,300 | 221,361 | ||||||
| Motorola, Inc. (a) | 36,500 | 283,240 | ||||||
| QUALCOMM, Inc. | 26,400 | 1,221,264 | ||||||
| Tellabs, Inc. (a) | 6,100 | 34,648 | ||||||
| 4,065,183 | ||||||||
Computers & Peripherals – 5.8% | ||||||||
| Apple, Inc. (a) | 14,200 | 2,994,212 | ||||||
| Dell, Inc. (a) | 27,200 | 390,592 | ||||||
| EMC Corp. (a) | 32,200 | 562,534 | ||||||
| Hewlett-Packard Co. | 37,400 | 1,926,474 | ||||||
| International Business Machines Corp. | 20,700 | 2,709,630 | ||||||
| Lexmark International, Inc. Class A (a) | 1,200 | 31,176 | ||||||
| NetApp, Inc. (a) | 5,400 | 185,706 | ||||||
| QLogic Corp. (a) | 1,800 | 33,966 | ||||||
| SanDisk Corp. (a) | 3,600 | 104,364 | ||||||
| Sun Microsystems, Inc. (a) | 11,850 | 111,035 | ||||||
| Teradata Corp. (a) | 2,700 | 84,861 | ||||||
| Western Digital Corp. (a) | 3,600 | 158,940 | ||||||
| 9,293,490 | ||||||||
Electronic Equipment, Instruments & Components – 0.6% | ||||||||
| Agilent Technologies, Inc. (a) | 5,500 | 170,885 | ||||||
| Amphenol Corp. Class A | 2,700 | 124,686 | ||||||
| Corning, Inc. | 24,600 | 475,026 | ||||||
| FLIR Systems, Inc. (a) | 2,400 | 78,528 | ||||||
| Jabil Circuit, Inc. | 3,000 | 52,110 | ||||||
| Molex, Inc. | 2,100 | 45,255 | ||||||
| 946,490 | ||||||||
Internet Software & Services – 2.0% | ||||||||
| Akamai Technologies, Inc. (a) | 2,700 | 68,391 | ||||||
| eBay, Inc. (a) | 17,800 | 419,012 | ||||||
| Google, Inc. Class A (a) | 3,850 | 2,386,923 | ||||||
| VeriSign, Inc. (a) | 3,000 | 72,720 | ||||||
| Yahoo!, Inc. (a) | 18,800 | 315,464 | ||||||
| 3,262,510 | ||||||||
IT Services – 1.6% | ||||||||
| Affiliated Computer Services, Inc. Class A (a) | 1,500 | 89,535 | ||||||
| Automatic Data Processing, Inc. | 8,000 | 342,560 | ||||||
| Cognizant Technology Solutions Corp. Class A (a) | 4,700 | 212,910 | ||||||
| Computer Sciences Corp. (a) | 2,400 | 138,072 | ||||||
| Fidelity National Information Services, Inc. | 5,200 | 121,888 | ||||||
| Fiserv, Inc. (a) | 2,400 | 116,352 | ||||||
| Mastercard, Inc. Class A | 1,525 | 390,369 | ||||||
| Paychex, Inc. | 5,100 | 156,264 | ||||||
| SAIC, Inc. (a) | 4,800 | 90,912 | ||||||
| Total System Services, Inc. | 3,077 | 53,140 | ||||||
| Visa, Inc. | 7,100 | 620,966 | ||||||
| Western Union Co. / The | 10,947 | 206,351 | ||||||
| 2,539,319 | ||||||||
Office Electronics – 0.1% | ||||||||
| Xerox Corp. | 13,700 | 115,902 | ||||||
(continued)
86
Ohio National Fund, Inc.
S&P 500® Index Portfolio (Continued)
S&P 500® Index Portfolio (Continued)
| Schedule of Investments | December 31, 2009 |
| Common Stocks – 97.6% | Shares | Value | ||||||
Semiconductors & Semiconductor Equipment – 2.5% | ||||||||
| Advanced Micro Devices, Inc. (a) | 8,900 | $ | 86,152 | |||||
| Altera Corp. | 4,700 | 106,361 | ||||||
| Analog Devices, Inc. | 4,600 | 145,268 | ||||||
| Applied Materials, Inc. | 21,100 | 294,134 | ||||||
| Broadcom Corp. Class A (a) | 6,850 | 215,432 | ||||||
| Intel Corp. | 87,200 | 1,778,880 | ||||||
| KLA-Tencor Corp. | 2,700 | 97,632 | ||||||
| Linear Technology Corp. | 3,500 | 106,890 | ||||||
| LSI Corp. (a) | 10,300 | 61,903 | ||||||
| MEMC Electronic Materials, Inc. (a) | 3,500 | 47,670 | ||||||
| Microchip Technology, Inc. | 2,900 | 84,274 | ||||||
| Micron Technology, Inc. (a) | 13,400 | 141,504 | ||||||
| National Semiconductor Corp. | 3,700 | 56,832 | ||||||
| Novellus Systems, Inc. (a) | 1,500 | 35,010 | ||||||
| NVIDIA Corp. (a) | 8,800 | 164,384 | ||||||
| Teradyne, Inc. (a) | 2,800 | 30,044 | ||||||
| Texas Instruments, Inc. | 19,800 | 515,988 | ||||||
| Xilinx, Inc. | 4,400 | 110,264 | ||||||
| 4,078,622 | ||||||||
Software – 4.3% | ||||||||
| Adobe Systems, Inc. (a) | 8,300 | 305,274 | ||||||
| Autodesk, Inc. (a) | 3,600 | 91,476 | ||||||
| BMC Software, Inc. (a) | 2,900 | 116,290 | ||||||
| CA, Inc. | 6,300 | 141,498 | ||||||
| Citrix Systems, Inc. (a) | 2,900 | 120,669 | ||||||
| Compuware Corp. (a) | 3,600 | 26,028 | ||||||
| Electronic Arts, Inc. (a) | 5,100 | 90,525 | ||||||
| Intuit, Inc. (a) | 5,000 | 153,550 | ||||||
| McAfee, Inc. (a) | 2,500 | 101,425 | ||||||
| Microsoft Corp. | 122,000 | 3,719,780 | ||||||
| Novell, Inc. (a) | 5,500 | 22,825 | ||||||
| Oracle Corp. | 61,800 | 1,516,572 | ||||||
| Red Hat, Inc. (a) | 3,000 | 92,700 | ||||||
| Salesforce.com, Inc. (a) | 1,700 | 125,409 | ||||||
| Symantec Corp. (a) | 12,794 | 228,885 | ||||||
| 6,852,906 | ||||||||
TOTAL INFORMATION TECHNOLOGY | 31,154,422 | |||||||
MATERIALS – 3.5% | ||||||||
Chemicals – 1.9% | ||||||||
| Air Products and Chemicals, Inc. | 3,300 | 267,498 | ||||||
| Airgas, Inc. | 1,300 | 61,880 | ||||||
| CF Industries Holdings, Inc. | 800 | 72,624 | ||||||
| Dow Chemical Co. / The | 18,100 | 500,103 | ||||||
| E.I. du Pont de Nemours & Co. | 14,300 | 481,481 | ||||||
| Eastman Chemical Co. | 1,100 | 66,264 | ||||||
| Ecolab, Inc. | 3,800 | 169,404 | ||||||
| FMC Corp. | 1,100 | 61,336 | ||||||
| International Flavors & Fragrances, Inc. | 1,200 | 49,368 | ||||||
| Monsanto Co. | 8,586 | 701,906 | ||||||
| PPG Industrials, Inc. | 2,600 | 152,204 | ||||||
| Praxair, Inc. | 4,800 | 385,488 | ||||||
| Sigma-Aldrich Corp. | 1,900 | 96,007 | ||||||
| 3,065,563 | ||||||||
Construction Materials – 0.1% | ||||||||
| Vulcan Materials Co. | 2,000 | 105,340 | ||||||
Containers & Packaging – 0.2% | ||||||||
| Ball Corp. | 1,500 | 77,550 | ||||||
| Bemis Co., Inc | 1,700 | 50,405 | ||||||
| Owens-Illinois, Inc. (a) | 2,700 | 88,749 | ||||||
| Pactiv Corp. (a) | 2,100 | 50,694 | ||||||
| Sealed Air Corp. | 2,500 | 54,650 | ||||||
| 322,048 | ||||||||
Metals & Mining – 1.1% | ||||||||
| AK Steel Holding Corp. | 1,700 | 36,295 | ||||||
| Alcoa, Inc. | 15,400 | 248,248 | ||||||
| Allegheny Technologies, Inc. | 1,500 | 67,155 | ||||||
| Cliffs Natural Resources, Inc. | 2,100 | 96,789 | ||||||
| Freeport-McMoRan Copper & Gold, Inc. | 6,776 | 544,045 | ||||||
| Newmont Mining Corp. | 7,700 | 364,287 | ||||||
| Nucor Corp. | 5,000 | 233,250 | ||||||
| Titanium Metals Corp. (a) | 1,300 | 16,276 | ||||||
| United States Steel Corp. | 2,300 | 126,776 | ||||||
| 1,733,121 | ||||||||
Paper & Forest Products – 0.2% | ||||||||
| International Paper Co. | 6,800 | 182,104 | ||||||
| MeadWestvaco Corp. | 2,700 | 77,301 | ||||||
| Weyerhaeuser Co. | 3,300 | 142,362 | ||||||
| 401,767 | ||||||||
TOTAL MATERIALS | 5,627,839 | |||||||
TELECOMMUNICATION SERVICES – 3.1% | ||||||||
Diversified Telecommunication Services – 2.8% | ||||||||
| AT&T, Inc. | 93,178 | 2,611,779 | ||||||
| CenturyTel, Inc. | 4,746 | 171,853 | ||||||
| Frontier Communications Corp. | 4,900 | 38,269 | ||||||
| Qwest Communications International, Inc. | 23,500 | 98,935 | ||||||
| Verizon Communications, Inc. | 44,900 | 1,487,537 | ||||||
| Windstream Corp. | 6,896 | 75,787 | ||||||
| 4,484,160 | ||||||||
Wireless Telecommunication Services – 0.3% | ||||||||
| American Tower Corp. Class A (a) | 6,300 | 272,223 | ||||||
| MetroPCS Communications, Inc. (a) | 4,100 | 31,283 | ||||||
| Sprint Nextel Corp. (a) | 46,932 | 171,771 | ||||||
| 475,277 | ||||||||
TOTAL TELECOMMUNICATION SERVICES | 4,959,437 | |||||||
UTILITIES – 3.6% | ||||||||
Electric Utilities – 2.0% | ||||||||
| Allegheny Energy, Inc. | 2,700 | 63,396 | ||||||
| American Electric Power Co., Inc. | 7,500 | 260,925 | ||||||
| Duke Energy Corp. | 20,636 | 355,145 | ||||||
| Edison International | 5,100 | 177,378 | ||||||
| Entergy Corp. | 3,000 | 245,520 | ||||||
| Exelon Corp. | 10,400 | 508,248 | ||||||
| FirstEnergy Corp. | 4,800 | 222,960 | ||||||
| FPL Group, Inc. | 6,500 | 343,330 | ||||||
| Northeast Utilities | 2,800 | 72,212 | ||||||
| Pepco Holdings, Inc. | 3,500 | 58,975 | ||||||
(continued)
87
Ohio National Fund, Inc.
S&P 500® Index Portfolio (Continued)
S&P 500® Index Portfolio (Continued)
| Schedule of Investments | December 31, 2009 |
| Common Stocks – 97.6% | Shares | Value | ||||||
Electric Utilities (continued) | ||||||||
| Pinnacle West Capital Corp. | 1,600 | $ | 58,528 | |||||
| PPL Corp. | 6,000 | 193,860 | ||||||
| Progress Energy, Inc. | 4,400 | 180,444 | ||||||
| Southern Co. / The | 12,600 | 419,832 | ||||||
| 3,160,753 | ||||||||
Gas Utilities – 0.1% | ||||||||
| EQT Corp. | 2,100 | 92,232 | ||||||
| Nicor, Inc. | 700 | 29,470 | ||||||
| Questar Corp. | 2,800 | 116,396 | ||||||
| 238,098 | ||||||||
Independent Power Producers & Energy Traders – 0.2% | ||||||||
| AES Corp. / The (a) | 10,500 | 139,755 | ||||||
| Constellation Energy Group, Inc. | 3,200 | 112,544 | ||||||
| 252,299 | ||||||||
Multi-Utilities – 1.3% | ||||||||
| Ameren Corp. | 3,700 | 103,415 | ||||||
| CenterPoint Energy, Inc. | 6,200 | 89,962 | ||||||
| CMS Energy Corp. | 3,600 | 56,376 | ||||||
| Consolidated Edison, Inc. | 4,400 | 199,892 | ||||||
| Dominion Resources, Inc. | 9,400 | 365,848 | ||||||
| DTE Energy Co. | 2,600 | 113,334 | ||||||
| Integrys Energy Group, Inc. | 1,212 | 50,892 | ||||||
| NiSource, Inc. | 4,400 | 67,672 | ||||||
| PG&E Corp. | 5,900 | 263,435 | ||||||
| Public Service Enterprise Group, Inc. | 8,000 | 266,000 | ||||||
| SCANA Corp. | 1,800 | 67,824 | ||||||
| Sempra Energy | 3,900 | 218,322 | ||||||
| TECO Energy, Inc. | 3,400 | 55,148 | ||||||
| Wisconsin Energy Corp. | 1,800 | 89,694 | ||||||
| Xcel Energy, Inc. | 7,200 | 152,784 | ||||||
| 2,160,598 | ||||||||
TOTAL UTILITIES | 5,811,748 | |||||||
Total Common Stocks (Cost $152,706,806) | $ | 156,848,118 | ||||||
| Exchange Traded Funds – 2.1% | Shares | Value | ||||||
| Standard & Poor’s Depositary Receipts (SPDRs) | 30,225 | $ | 3,368,274 | |||||
Total Exchange Traded Funds (Cost $3,286,189) | $ | 3,368,274 | ||||||
| Face | Amortized | |||||||
| Commercial Paper – 0.2% | Amount | Cost | ||||||
| Prudential Funding LLC 0.020%, 01/04/2010 | $ | 316,000 | $ | 316,000 | ||||
Total Commercial Paper (Cost $316,000) | $ | 316,000 | ||||||
Total Investments – 99.9% (Cost $156,308,995) (b) | $ | 160,532,392 | ||||||
Other Assets in Excess of Liabilities – 0.1% | 176,061 | |||||||
Net Assets – 100.0% | $ | 160,708,453 | ||||||
Percentages are stated as a percent of net assets.
Footnotes:
| (a) | Non-income producing security. | |
| (b) | Represents cost for financial reporting purposes, which may differ from cost basis for Federal income tax purposes. | |
| See also Note 8 of the Notes to Financial Statements. |
The accompanying notes are an integral part of these financial statements.
88
Ohio National Fund, Inc.
S&P 500® Index Portfolio
S&P 500® Index Portfolio
Statement of Assets and Liabilities
December 31, 2009
| Assets: | ||||
| Investments in securities, at value (Cost $156,308,995) | $ | 160,532,392 | ||
| Cash | 1,500 | |||
| Receivable for securities sold | 28 | |||
| Receivable for fund shares sold | 98,512 | |||
| Dividends and accrued interest receivable | 230,095 | |||
| Prepaid expenses and other assets | 2,483 | |||
| Total assets | 160,865,010 | |||
| Liabilities: | ||||
| Payable for securities purchased | 26,143 | |||
| Payable for fund shares redeemed | 41,716 | |||
| Payable for investment management services | 51,656 | |||
| Payable for compliance services | 1,677 | |||
| Accrued custody expense | 716 | |||
| Accrued professional fees | 11,301 | |||
| Accrued accounting fees | 12,643 | |||
| Accrued printing and filing fees | 10,705 | |||
| Total liabilities | 156,557 | |||
| Net assets | $ | 160,708,453 | ||
| Net assets consist of: | ||||
| Par value, $1 per share | $ | 13,749,946 | ||
| Paid-in capital in excess of par value | 160,117,468 | |||
| Accumulated net realized loss on investments | (17,694,384 | ) | ||
| Net unrealized appreciation on investments | 4,223,397 | |||
| Undistributed net investment income | 312,026 | |||
| Net assets | $ | 160,708,453 | ||
| Shares outstanding | 13,749,946 | |||
| Authorized Fund shares allocated to Portfolio | 23,000,000 | |||
| Net asset value per share | $ | 11.69 | ||
Statement of Operations
For the Year Ended December 31, 2009
| Investment income: | ||||
| Interest | $ | 635 | ||
| Dividends | 3,015,250 | |||
| Total investment income | 3,015,885 | |||
| Expenses: | ||||
| Management fees | 495,827 | |||
| Custodian fees | 24,444 | |||
| Directors’ fees | 13,567 | |||
| Professional fees | 19,239 | |||
| Accounting fees | 70,796 | |||
| Printing and filing fees | 21,758 | |||
| Compliance expense | 6,376 | |||
| Other | 3,117 | |||
| Total expenses | 655,124 | |||
| Net investment income | 2,360,761 | |||
| Realized/unrealized gain (loss) on investments: | ||||
| Net realized/unrealized gain (loss) on investments | (937,053 | ) | ||
| Change in unrealized appreciation/depreciation on investments | 31,621,689 | |||
| Net realized/unrealized gain (loss) on investments | 30,684,636 | |||
| Change in net assets from operations | $ | 33,045,397 | ||
The accompanying notes are an integral part of these financial statements.
89
Ohio National Fund, Inc.
S&P 500® Index Portfolio
S&P 500® Index Portfolio
Statements of Changes in Net Assets
| Years Ended December 31, | ||||||||
| 2009 | 2008 | |||||||
Increase (Decrease) in Net Assets: | ||||||||
| Operations: | ||||||||
| Net investment income | $ | 2,360,761 | $ | 2,645,943 | ||||
| Net realized gain (loss) on investments | (937,053 | ) | (2,389,253 | ) | ||||
| Change in unrealized appreciation/depreciation on investments | 31,621,689 | (63,273,864 | ) | |||||
| Change in net assets from operations | 33,045,397 | (63,017,174 | ) | |||||
| Distributions to shareholders: | ||||||||
| Distributions from net investment income | (2,047,655 | ) | (2,337,448 | ) | ||||
| Capital transactions: | ||||||||
| Received from shares sold | 62,219,156 | 38,152,445 | ||||||
| Received from dividends reinvested | 2,047,655 | 2,337,448 | ||||||
| Paid for shares redeemed | (40,764,928 | ) | (48,360,668 | ) | ||||
| Change in net assets from capital transactions | 23,501,883 | (7,870,775 | ) | |||||
| Change in net assets | 54,499,625 | (73,225,397 | ) | |||||
Net Assets: | ||||||||
| Beginning of year | 106,208,828 | 179,434,225 | ||||||
| End of year | $ | 160,708,453 | $ | 106,208,828 | ||||
| Undistributed net investment income | $ | 312,026 | $ | 285,045 | ||||
Financial Highlights
| Years Ended December 31, | ||||||||||||||||||||
| 2009 | 2008 | 2007 | 2006 | 2005 | ||||||||||||||||
Selected Per-Share Data: | ||||||||||||||||||||
| Net asset value, beginning of year | $ | 9.41 | $ | 15.36 | $ | 14.82 | $ | 12.99 | $ | 12.56 | ||||||||||
| Operations: | ||||||||||||||||||||
| Net investment income | 0.17 | 0.24 | 0.24 | 0.22 | 0.19 | |||||||||||||||
| Net realized and unrealized gain (loss) on investments | 2.26 | (5.98 | ) | 0.51 | 1.77 | 0.37 | ||||||||||||||
| Total from operations | 2.43 | (5.74 | ) | 0.75 | 1.99 | 0.56 | ||||||||||||||
| Distributions: | ||||||||||||||||||||
| Distributions from net investment income | (0.15 | ) | (0.21 | ) | (0.21 | ) | (0.16 | ) | (0.13 | ) | ||||||||||
| Net asset value, end of year | $ | 11.69 | $ | 9.41 | $ | 15.36 | $ | 14.82 | $ | 12.99 | ||||||||||
Total return | 25.83 | % | –37.30 | % | 5.06 | % | 15.30 | % | 4.47 | % | ||||||||||
Ratios and supplemental data: | ||||||||||||||||||||
| Net assets at end of year (millions) | $ | 160.7 | $ | 106.2 | $ | 179.4 | $ | 182.1 | $ | 190.5 | ||||||||||
| Ratios to average net assets: | ||||||||||||||||||||
| Expenses | 0.51 | % | 0.48 | % | 0.45 | % | 0.47 | % | 0.47 | % | ||||||||||
| Net investment income | 1.85 | % | 1.85 | % | 1.50 | % | 1.45 | % | 1.39 | % | ||||||||||
| Portfolio turnover rate | 21 | % | 12 | % | 7 | % | 7 | % | 9 | % | ||||||||||
The accompanying notes are an integral part of these financial statements.
90
Ohio National Fund, Inc.
Strategic Value Portfolio
Strategic Value Portfolio
Objective/Strategy
The Strategic Value Portfolio seeks growth of capital and income by investing primarily in securities of high dividend yielding companies.
Performance as of December 31, 2009
Average Annual Total Returns: | ||||
| One year | 11.52% | |||
| Five years | -2.31% | |||
| Ten years | -0.38% |
Past performance does not guarantee future results. The performance data quoted represents past performance and current returns may be lower or higher. Total return figures include change in share price and reinvestment of dividends and capital gains. The investment return and principal value will fluctuate so that an investor’s shares, when redeemed may be worth more or less than the original cost. To obtain performance information up to the most recent month end, call toll-free 1-877-781-6392.
The Portfolio is not open to direct retail investment. Beneficial interest in shares is obtained solely by purchase of variable life insurance policies and variable annuity contracts. Actual performance results for variable annuity and variable universal life contracts will be lower due to contract charges. Consult your contract for applicable charges.
Comments
For the year ended December 31, 2009, the Strategic Value Portfolio returned 11.52% versus 11.13% for the current benchmark, the Dow Jones U.S. Select Dividend Index.
The year ended December 31, 2009 was a challenging environment for an equity income strategy as we marked the bottom of the longest recession in the post World War II era and endured a low-quality post-recession rally. Over the course of the year, the stock market was buffeted by multiple head winds as almost every major indicator trended downward, from retail sales and industrial production to record lows for home sales, home prices and home building. On the employment front, the jobless rate hit a 26-year high, fueled by the worst job losses in decades. Attempting to stem further declines were the nearly $1 trillion in financial stimulus and the government’s intervention into numerous failing financial institutions. Despite unknown and potentially negative long-term implications, these moves provided near term support to economic activity and brought some hints of an eventual recovery.
Investor focus has shifted from relief over avoiding economic Armageddon to debate about the strength and timing of a recovery. While economic growth is expected to come, it will be at a much slower pace than past recoveries. The reality is, despite a stock market rally that added more than $1 trillion to household net worth in the second quarter, households are still down some $11 trillion from the collapse in stock and home prices, household debt is still a near-record 122% of disposable income, and home foreclosures and mortgage delinquencies are still on the rise — with 1 in 8 homeowners in arrears on their mortgages and nearly 1 in 3 being “underwater” (owing more than their home is worth). It’s hard to envision suddenly robust consumer spending under these weighty yokes. And without adequate consumer participation, it’s hard to envision an upside-surprise recovery.
Until we see evidence of something more, we will continue to remain cautious about overpaying for stocks. We remain committed to our strategy that, as history shows, benefits investors — selecting dividend-paying companies with a history of increasing dividend payouts over time.
Performance in the calendar year was dominated by the market’s preferences in the post recession rally. Since the bounce off the market bottom in early March, investors have favored features contrary to our style including high beta, small cap, and the lowest quality stocks. The highest returns in the broad market were focused in sectors that provide little to no investment opportunity for us, including Consumer Discretionary, Materials and Information Technology. As the markets returned to more balanced performance by year end, we noted investors preferring at least some factors typical of a value and dividend investing style. As a result, the Portfolio out-performed the universe of dividend-yielding stocks, as represented by the benchmark index, yet lagged the broad market.
In spite of choppy market preferences, the strategy outpaced its benchmark. The leading contributor to the Portfolio’s out-performance to the Dow Jones U.S. Select Dividend Index was our comparative avoidance of the Financials sector. Our 15.6% average under-weight position contributed 6.6% of positive group weight variance as the Financials sector was the worst performing sector in the index. The Portfolio gained another 3.4% of positive group weight variance from a 16.6% over-weight position in Consumer Staples, the second best performing sector in the index. Positive stock selection within Energy contributed 1.6% as Portfolio holdings, Chevron Corp., BP PLC, and Total S.A. posted returns of 40.3%, 32.9% and 26.0%, respectively, notably higher than the benchmark’s Energy return of 8.7%.(1)
Areas of weakness included our lack of exposure to the Materials sector, which posted a return of 60.1% in the index. This cost the Portfolio 4.2% of negative group weight variance. Likewise, the Portfolio lost 1.7% and 1.2% respectively from its under-weight exposures to Industrials and Consumer Discretionary. We continue to find little opportunity in these sectors to meet the specific objectives of our strategy. The Portfolio’s overall negative stock selection was mainly focused in the Consumer Staples sector. As noted previously, the Portfolio did gain significantly from an over-weight position in Consumer Staples, yet gave back 1.9% with negative stock selection by holding Kraft Foods, Inc.(1)
On an absolute performance basis, the Portfolio continued its focus on companies that offer attractively low valuations, high yield and the potential for dividend growth over time. To this end, the Portfolio finished the year with a weighted median 5.1% yield. This compares to a 3.8% yield for the Dow Jones U.S. Select Dividend Index. While the overall dividend growth profile of the Portfolio was impaired by the widespread dividend declines in the marketplace, the Portfolio experienced thirty dividend increases yet four dividend cuts for the year. We observed a revival in dividend increases towards the end of the calendar year and believe this is a positive indicator of collective company management’s renewed confidence as we exit the current economic crisis. As a third point, the low risk features of the Portfolio remained intact with the product offering a Portfolio beta of 0.64.(1)
(continued)
91
Ohio National Fund, Inc.
Strategic Value Portfolio (Continued)
Strategic Value Portfolio (Continued)
While the market’s attention has been focused on high risk and low quality, we have capitalized on the opportunity to purchase high-quality stocks offering historically low valuations, high dividend yields and reliable dividend growth opportunities. For the first time, we have been able to buy The Procter & Gamble Co. and McDonald’s Corp., attractive consumer stocks now trading at attractively low valuations and compelling dividend yield levels. We have also strategically added to our Energy exposure with new positions in Chevron Corp. and Total S.A. In mid-July, also for the first time, 3M Co. met our investment criteria and subsequently made its way into the Portfolio. We have subsequently sold the stock to lock in an attractive gain. As investor sentiment has been distracted by a low-quality rally, we have instead focused on positioning the Portfolio for future success.(1)
Overall, we believe our performance in each phase of the market cycle was consistent with our expectations. It’s important to point out that we will maintain focus on achieving our client’s objectives of providing attractively low valuations, high current income, and growth in their dividend income and downside protection regardless of market conditions. While past performance does not guarantee future results, history clearly indicates that a total return equity portfolio rooted in high dividend income that grows reliably will provide superior performance over the long term. We have high confidence in continued success with our strategy as we maintain our disciplined approach to identify stocks that possess significantly above-average dividend yields, respectable dividend growth, and strong valuations.
Clearly, consumers are feeling better. Respective December confidence readings from the Conference Board and University of Michigan rose during the month, while the International Council of Shopping Centers, Redbook and MasterCard Advisors reported a last-minute Christmas shopping rush and strong online activity. Not all the economic news was on an upward slope. Final third quarter Gross Domestic Product was revised down to a 2.2% gain, well below the consensus and markedly below the initial flash estimate of a 3.5% gain and the first revision of a 2.8% gain. Home prices, after improving substantially since mid-spring, also leveled off in October, with prices rising in only eight of twenty cities. With mortgage delinquencies still rising and a lot of shadow inventory (foreclosed and distressed properties not yet offered for sale), the supply of homes remains high relative to demand, putting further downward pressure on prices. This spring’s end of the home buyer’s tax credit, combined with the Federal Reserve’s intention to stop directly supporting the mortgage market at the end of March, should add to this pressure.
We continue to be troubled by record and accelerating public debt, which can only lead to higher taxes, as well as by household balance sheets that are still carrying a near record level of debt relative to income. A stronger-than-expected recovery, and faster-than-expected turn in non-farm payrolls, could help ease our minds. The next several months should tell if that relief will come. How consumers and businesses respond when the Federal Reserve starts easing off the throttle and the government stimulus starts to run out will go a long way towards determining the strength — and length — of this recovery.
| (1) | The Portfolio’s composition is subject to change. Holdings and weightings are as of December 31, 2009. |
Change in Value of $10,000 Investment

Hypothetical illustration based on past performance. Future performance will vary. The Portfolio’s returns reflect reinvested dividends. The Portfolio’s holdings may differ significantly from the securities in the index. The index is unmanaged and therefore does not reflect the cost of portfolio management and accounting.
The Dow Jones U.S. Select Dividend Index is comprised of all dividend-paying companies in the Dow Jones U.S. Index that have a non-negative historical five-year dividend-per-share growth rate, a five-year average dividend to earnings-per-share ratio of less than or equal to 60%, and a three-month average daily trading volume of 200,000 shares. Current index components are included in the universe regardless of their dividend payout ratio. The Dow Jones U.S. Index aims to consistently represent the top 95% of U.S. companies based on float-adjusted market capitalization, excluding the very smallest and least-liquid stocks. The index presented includes the effects of reinvested dividends.
(continued)
92
Ohio National Fund, Inc.
Strategic Value Portfolio (Continued)
Strategic Value Portfolio (Continued)
Portfolio Composition as of December 31, 2009 (1)
| % of Net Assets | |||
Common Stocks (3) | 98.0 | ||
| Money Market Funds and Other Net Assets | 2.0 | ||
| 100.0 | |||
Top 10 Portfolio Holdings as of December 31, 2009 (1) (2)
| % of Net Assets | |||||||
| 1. | BP PLC – ADR | 3.6 | |||||
| 2. | AT&T, Inc. | 3.5 | |||||
| 3. | BCE, Inc. | 3.3 | |||||
| 4. | Kimberly-Clark Corp. | 3.2 | |||||
| 5. | Chevron Corp. | 3.2 | |||||
| 6. | Eli Lilly & Co. | 3.2 | |||||
| 7. | Total S.A. | 3.2 | |||||
| 8. | Southern Co. / The | 3.1 | |||||
| 9. | Dominion Resources, Inc. | 3.1 | |||||
| 10. | Verizon Communications, Inc. | 3.1 |
| (1) | Composition of Portfolio subject to change. | |
| (2) | Short-term investments have been excluded from the list of Top 10 Portfolio holdings. | |
| (3) | Sectors: |
| % of Net Assets | |||
| Consumer Staples | 22.6 | ||
| Telecommunication Services | 20.4 | ||
| Health Care | 15.9 | ||
| Energy | 15.3 | ||
| Utilities | 14.6 | ||
| Financials | 4.5 | ||
| Consumer Discretionary | 2.9 | ||
| Industrials | 1.8 | ||
| 98.0 | |||
93
Ohio National Fund, Inc.
Strategic Value Portfolio
Strategic Value Portfolio
| Schedule of Investments | December 31, 2009 |
| Common Stocks – 98.0% | Shares | Value | ||||||
CONSUMER DISCRETIONARY – 2.9% | ||||||||
Hotels, Restaurants & Leisure – 2.9% | ||||||||
| McDonald’s Corp. | 9,025 | $ | 563,521 | |||||
TOTAL CONSUMER DISCRETIONARY | 563,521 | |||||||
CONSUMER STAPLES – 22.6% | ||||||||
Beverages – 3.3% | ||||||||
Coca-Cola Co. / The | 6,315 | 359,955 | ||||||
| Diageo PLC (a) | 16,910 | 295,014 | ||||||
| 654,969 | ||||||||
Food Products – 4.5% | ||||||||
| H.J. Heinz Co. | 12,975 | 554,811 | ||||||
| Unilever PLC (a) | 10,710 | 343,312 | ||||||
| 898,123 | ||||||||
Household Products – 5.7% | ||||||||
| Clorox Co. / The | 2,800 | 170,800 | ||||||
| Kimberly-Clark Corp. | 9,975 | 635,507 | ||||||
| Procter & Gamble Co. / The | 5,260 | 318,914 | ||||||
| 1,125,221 | ||||||||
Tobacco – 9.1% | ||||||||
| Altria Group, Inc. | 21,720 | 426,363 | ||||||
| Lorillard, Inc. | 4,200 | 336,966 | ||||||
| Philip Morris International, Inc. | 11,735 | 565,510 | ||||||
| Reynolds American, Inc. | 8,710 | 461,369 | ||||||
| 1,790,208 | ||||||||
TOTAL CONSUMER STAPLES | 4,468,521 | |||||||
ENERGY – 15.3% | ||||||||
Oil, Gas & Consumable Fuels – 15.3% | ||||||||
| BP PLC – ADR | 12,430 | 720,567 | ||||||
| Chevron Corp. | 8,150 | 627,469 | ||||||
| ConocoPhillips | 8,905 | 454,778 | ||||||
| Royal Dutch Shell PLC – B Shares (a) | 20,620 | 600,520 | ||||||
| Total S.A. (a) | 9,720 | 624,314 | ||||||
TOTAL ENERGY | 3,027,648 | |||||||
FINANCIALS – 4.5% | ||||||||
Real Estate Investment Trusts – 4.5% | ||||||||
| HCP, Inc. | 9,700 | 296,238 | ||||||
| Health Care REIT, Inc. | 6,600 | 292,512 | ||||||
| Realty Income Corp. | 11,600 | 300,556 | ||||||
TOTAL FINANCIALS | 889,306 | |||||||
HEALTH CARE – 15.9% | ||||||||
Pharmaceuticals – 15.9% | ||||||||
| Abbott Laboratories | 7,150 | 386,028 | ||||||
| AstraZeneca PLC (a) | 4,600 | 216,187 | ||||||
| Bristol-Myers Squibb Co. | 23,675 | 597,794 | ||||||
| Eli Lilly & Co. | 17,500 | 624,925 | ||||||
| GlaxoSmithKline PLC (a) | 24,805 | 526,011 | ||||||
| Johnson & Johnson | 7,360 | 474,057 | ||||||
| Merck & Co., Inc. | 8,920 | 325,937 | ||||||
TOTAL HEALTH CARE | 3,150,939 | |||||||
INDUSTRIALS – 1.8% | ||||||||
Commercial Services & Supplies – 0.8% | ||||||||
| Waste Management, Inc. | 4,900 | 165,669 | ||||||
Electrical Equipment – 1.0% | ||||||||
| Emerson Electric Co. | 4,400 | 187,440 | ||||||
TOTAL INDUSTRIALS | 353,109 | |||||||
TELECOMMUNICATION SERVICES – 20.4% | ||||||||
Diversified Telecommunication Services – 18.4% | ||||||||
| AT&T, Inc. | 24,500 | 686,735 | ||||||
| BCE, Inc. | 23,280 | 645,523 | ||||||
| CenturyTel, Inc. | 6,825 | 247,133 | ||||||
| Deutsche Telekom AG (a) | 21,795 | 319,728 | ||||||
| France Telecom SA (a) | 17,745 | 443,417 | ||||||
| Telefonica SA (a) | 16,300 | 456,221 | ||||||
| Verizon Communications, Inc. | 18,320 | 606,942 | ||||||
| Windstream Corp. | 21,405 | 235,241 | ||||||
| 3,640,940 | ||||||||
Wireless Telecommunication Services – 2.0% | ||||||||
| Vodafone Group PLC – ADR | 16,970 | 391,837 | ||||||
TOTAL TELECOMMUNICATION SERVICES | 4,032,777 | |||||||
UTILITIES – 14.6% | ||||||||
Electric Utilities – 7.3% | ||||||||
| Duke Energy Corp. | 26,720 | 459,851 | ||||||
| Progress Energy, Inc. | 8,990 | 368,680 | ||||||
| Southern Co. / The | 18,560 | 618,419 | ||||||
| 1,446,950 | ||||||||
Gas Utilities – 1.6% | ||||||||
| AGL Resources, Inc. | 8,310 | 303,066 | ||||||
Multi-Utilities – 5.7% | ||||||||
| Dominion Resources, Inc. | 15,825 | 615,909 | ||||||
| NSTAR | 5,200 | 191,360 | ||||||
| SCANA Corp. | 8,575 | 323,106 | ||||||
| 1,130,375 | ||||||||
TOTAL UTILITIES | 2,880,391 | |||||||
Total Common Stocks (Cost $19,077,573) | $ | 19,366,212 | ||||||
| Money Market Funds – 1.7% | Shares | Value | ||||||
| Fidelity Institutional Money Market Funds Money Market Portfolio – Class I | 341,000 | $ | 341,000 | |||||
Total Money Market Funds (Cost $341,000) | $ | 341,000 | ||||||
Total Investments – 99.7% (Cost $19,418,573) (b) | $ | 19,707,212 | ||||||
Other Assets in Excess of Liabilities – 0.3% | 55,796 | |||||||
Net Assets – 100.0% | $ | 19,763,008 | ||||||
(continued)
94
Ohio National Fund, Inc.
Strategic Value Portfolio (Continued)
Strategic Value Portfolio (Continued)
| Schedule of Investments | December 31, 2009 |
Percentages are stated as a percent of net assets.
Abbreviations:
ADR: American Depository Receipts
Footnotes:
| (a) | Security traded on a foreign exchange has been valued at an estimate of fair value that is different than the local market close price. These fair value estimates are determined by an independent national fair valuation service that has been approved by the Board. These securities represent $3,824,724 or 19.4% of the Portfolio’s net assets. Other Portfolio securities are not subjected to fair value procedures because they are traded on domestic or foreign exchanges that have close times that are consistent with the U.S. market close, normally 4:00 pm Eastern Time. | |
| (b) | Represents cost for financial reporting purposes, which may differ from cost basis for Federal income tax purposes. See also Note 8 of the Notes to Financial Statements. |
The accompanying notes are an integral part of these financial statements.
95
Ohio National Fund, Inc.
Strategic Value Portfolio
Strategic Value Portfolio
Statement of Assets and Liabilities
December 31, 2009
| Assets: | ||||
| Investments in securities, at value (Cost $19,418,573) | $ | 19,707,212 | ||
| Cash | 305 | |||
| Receivable for fund shares sold | 14,190 | |||
| Dividends and accrued interest receivable | 81,677 | |||
| Prepaid expenses and other assets | 269 | |||
| Total assets | 19,803,653 | |||
| Liabilities: | ||||
| Payable for fund shares redeemed | 9,844 | |||
| Payable for investment management services | 12,532 | |||
| Payable for compliance services | 1,677 | |||
| Accrued custody expense | 211 | |||
| Accrued professional fees | 11,110 | |||
| Accrued accounting fees | 2,412 | |||
| Accrued printing and filing fees | 1,315 | |||
| Other accrued expenses | 1,544 | |||
| Total liabilities | 40,645 | |||
| Net assets | $ | 19,763,008 | ||
| Net assets consist of: | ||||
| Par value, $1 per share | $ | 2,287,531 | ||
| Paid-in capital in excess of par value | 26,532,807 | |||
| Accumulated net realized loss on investments | (9,383,246 | ) | ||
| Net unrealized appreciation/depreciation on: | ||||
| Investments | 288,639 | |||
| Foreign currency related transactions | (242 | ) | ||
| Undistributed net investment income | 37,519 | |||
| Net assets | $ | 19,763,008 | ||
| Shares outstanding | 2,287,531 | |||
| Authorized Fund shares allocated to Portfolio | 5,000,000 | |||
| Net asset value per share | $ | 8.64 | ||
Statement of Operations
For the Year Ended December 31, 2009
| Investment income: | ||||
| Interest | $ | 2,513 | ||
| Dividends (net of withholding tax of $15,530) | 774,540 | |||
| Total investment income | 777,053 | |||
| Expenses: | ||||
| Management fees | 109,180 | |||
| Custodian fees | 1,891 | |||
| Directors’ fees | 1,548 | |||
| Professional fees | 12,537 | |||
| Accounting fees | 14,090 | |||
| Printing and filing fees | 2,561 | |||
| Compliance expense | 6,376 | |||
| Other | 383 | |||
| Total expenses | 148,566 | |||
| Net investment income | 628,487 | |||
| Realized/unrealized gain (loss) on investments and foreign currency related transactions: | ||||
| Net realized gain (loss) on: | ||||
| Investments | (1,820,735 | ) | ||
| Foreign currency related transactions | (25,685 | ) | ||
| Change in unrealized appreciation/depreciation on investments and foreign currency related transactions | 3,343,973 | |||
| Net realized/unrealized gain (loss) on investments and foreign currency related transactions | 1,497,553 | |||
| Change in net assets from operations | $ | 2,126,040 | ||
The accompanying notes are an integral part of these financial statements.
96
Ohio National Fund, Inc.
Strategic Value Portfolio
Strategic Value Portfolio
Statements of Changes in Net Assets
| Years Ended December 31, | ||||||||
| 2009 | 2008 | |||||||
Increase (Decrease) in Net Assets: | ||||||||
| Operations: | ||||||||
| Net investment income | $ | 628,487 | $ | 877,920 | ||||
| Net realized gain (loss) on investments and foreign currency related transactions | (1,846,420 | ) | (6,318,616 | ) | ||||
| Change in unrealized appreciation/depreciation on investments and foreign currency related transactions | 3,343,973 | (634,959 | ) | |||||
| Change in net assets from operations | 2,126,040 | (6,075,655 | ) | |||||
| Distributions to shareholders: | ||||||||
| Distributions from net investment income | (553,534 | ) | (771,804 | ) | ||||
| Capital transactions: | ||||||||
| Received from shares sold | 9,094,435 | 3,545,632 | ||||||
| Received from dividends reinvested | 553,534 | 771,804 | ||||||
| Paid for shares redeemed | (4,802,105 | ) | (12,524,636 | ) | ||||
| Change in net assets from capital transactions | 4,845,864 | (8,207,200 | ) | |||||
| Change in net assets | 6,418,370 | (15,054,659 | ) | |||||
Net Assets: | ||||||||
| Beginning of year | 13,344,638 | 28,399,297 | ||||||
| End of year | $ | 19,763,008 | $ | 13,344,638 | ||||
| Undistributed net investment income | $ | 37,519 | $ | 104,460 | ||||
Financial Highlights
| Years Ended December 31, | ||||||||||||||||||||
| 2009 | 2008 | 2007 | 2006 | 2005 | ||||||||||||||||
Selected Per-Share Data: | ||||||||||||||||||||
| Net asset value, beginning of year | $ | 7.97 | $ | 11.81 | $ | 13.10 | $ | 11.36 | $ | 10.95 | ||||||||||
| Operations: | ||||||||||||||||||||
| Net investment income | 0.27 | 0.56 | 0.17 | 0.16 | 0.15 | |||||||||||||||
| Net realized and unrealized gain (loss) on investments and foreign currency related transactions | 0.65 | (3.91 | ) | (1.31 | ) | 1.70 | 0.37 | |||||||||||||
| Total from operations | 0.92 | (3.35 | ) | (1.14 | ) | 1.86 | 0.52 | |||||||||||||
| Distributions: | ||||||||||||||||||||
| Distributions from net investment income | (0.25 | ) | (0.49 | ) | (0.15 | ) | (0.12 | ) | (0.11 | ) | ||||||||||
| Net asset value, end of year | $ | 8.64 | $ | 7.97 | $ | 11.81 | $ | 13.10 | $ | 11.36 | ||||||||||
Total return | 11.52 | % | –28.27 | % | –8.74 | % | 16.35 | % | 4.74 | % | ||||||||||
Ratios and supplemental data: | ||||||||||||||||||||
| Net assets at end of year (millions) | $ | 19.8 | $ | 13.3 | $ | 28.4 | $ | 34.8 | $ | 30.1 | ||||||||||
| Ratios to average net assets: | ||||||||||||||||||||
| Expenses | 1.02 | % | 0.96 | % | 0.87 | % | 0.88 | % | 0.92 | % | ||||||||||
| Net investment income | 4.31 | % | 4.68 | % | 1.18 | % | 1.38 | % | 1.27 | % | ||||||||||
| Portfolio turnover rate | 42 | % | 162 | % | 63 | % | 65 | % | 55 | % | ||||||||||
The accompanying notes are an integral part of these financial statements.
97
Ohio National Fund, Inc.
High Income Bond Portfolio
High Income Bond Portfolio
Objective/Strategy
The High Income Bond Portfolio seeks high current income by investing at least 80% of its net assets in lower rated corporate debt obligations commonly referred to as “junk bonds”. The Portfolio’s investments are generally rated Baa or lower by Moody’s, or BBB or lower by Standard & Poor’s or Fitch.
Performance as of December 31, 2009
Average Annual Total Returns: | ||||
| One year | 49.65% | |||
| Five years | 5.53% | |||
| Ten years | 6.00% |
Past performance does not guarantee future results. The performance data quoted represents past performance and current returns may be lower or higher. Total return figures include change in share price and reinvestment of dividends and capital gains. The investment return and principal value will fluctuate so that an investor’s shares, when redeemed may be worth more or less than the original cost. To obtain performance information up to the most recent month end, call toll-free 1-877-781-6392.
The Portfolio is not open to direct retail investment. Beneficial interest in shares is obtained solely by purchase of variable life insurance policies and variable annuity contracts. Actual performance results for variable annuity and variable universal life contracts will be lower due to contract charges. Consult your contract for applicable charges.
Comments
For the year ended December 31, 2009, the High Income Bond Portfolio returned 49.65% versus 58.76% for the current benchmark, the Barclays Capital High Yield 2% Issuer Constrained Index (“BCHY2%ICI”).
The high yield market staged a spectacular rally during the year ended December 31, 2009. This rally started from severely depressed levels brought about by the global financial meltdown which led to the worst recession in the post war period. Despite rising default rates and very weak economic growth in the first half of 2009, the high yield market bottomed in mid December 2008 and moved aggressively higher, discounting near term economic weakness and looking forward to rebounding economic growth in the second half of 2009. Unprecedented global fiscal and monetary policy stimulus coupled with worldwide government intervention to stabilize financial institutions was the primary driver of economic recovery and high yield performance. For the year, the BCHY2%ICI returned 58.76% compared to 5.93% for the Barclays Capital Aggregate Index, a measure of high quality bond performance. Indicative of this substantial out-performance by the BCHY2%ICI was the decline in yield spreads between high yield bonds and U.S. Treasuries. For example, the spread between the Credit Suisse High Yield Bond Index and comparable Treasuries declined from 17.06% on December 31, 2008 to 6.34% on December 31, 2009.
Within the high yield market during the year, major industry sectors that substantially out-performed the BCHY2%ICI included the financial institutions, services, technology, retail, chemicals and automotive. Despite substantial absolute returns, the electric utility, food and beverage, packaging, aerospace and defense, health care and natural gas utility sectors under-performed the BCHY2%ICI. From a ratings quality perspective, the CCC-rated sector of the BCHY2%ICI returned 95.28% outdistancing the BB-rated sector which returned 45.88% and the B-rated sector which returned 44.83%.
Two main factors led to the Portfolio’s under-performance versus the BCHY2%ICI. First, the Portfolio was under-weighted in the financial institutions sector, which returned 105.76% during the year. Financial institutions have historically represented a relatively small sector of the high yield market. Given the distress in the financial industry in 2008 and 2009, the sector expanded rapidly in size during the year as distressed issuers were downgraded into the high yield category (entering the benchmark at relatively low dollar prices). Many of these financial institutions subsequently benefited from government intervention which caused their bond prices to rise substantially. Secondly, the Portfolio, while over-weighted in the strong performing CCC-rated sector, generally had more exposure to “lower yielding” CCC-rated securities versus the “higher yielding” distressed sector of the CCC-rated universe which exhibited the strongest performance. This was especially true in the chemical, gaming, energy and wireline telecommunications industry sectors. The Portfolio was also negatively impacted by over-weights in more conservative industry sectors such as aerospace/defense, health care, industrial-other and food and beverage. Specific Portfolio holdings that substantially under-performed the BCHY2%ICI during the year included: Eurofresh, Aleris International, Inc., World Directories, Fairpoint Communications and Panolam Industries International, Inc.(1)
During the year, the Portfolio benefited from strong security selection in the health care, food and beverage and aerospace/defense sectors, which helped to offset over-weights in these more defensive under-performing sectors. The Portfolio also experienced strong security selection in the services and media cable sectors. The Portfolio also benefited from under-weights in the weak performing electric utility, wireline telecommunications and energy sectors and an over-weight in the strong performing technology sector. Specific Portfolio holdings that substantially out-performed the BCHY2%ICI included: Pilgrims Pride Corp., Univision Television Group, Nuveen Investments, Inc., XM Satellite Radio, Inc., Open Solutions, Inc., Freescale Semiconductor, Inc. and Unisys Corp.(1)
Going into 2010, we believe the domestic economy will continue its recovery, corporate earnings will continue to improve and high yield default rates will fall dramatically. This should lead to more spread tightening between high yield bonds and high quality bonds and produce a positive atmosphere for the relative performance of high yield securities.
| (1) | The Portfolio’s composition is subject to change. Holdings and weightings are as of December 31, 2009. |
(continued)
98
Ohio National Fund, Inc.
High Income Bond Portfolio (Continued)
High Income Bond Portfolio (Continued)
Change in Value of $10,000 Investment
![[PERFORMANCE GRAPH]](https://capedge.com/proxy/N-CSR/0000950123-10-021904/l38589l3858949.gif)
Hypothetical illustration based on past performance. Future performance will vary. All returns reflect reinvested dividends. The Portfolio’s holdings may differ significantly from the securities in the index. The index is unmanaged and therefore does not reflect the cost of Portfolio management or trading. Neither the Portfolio nor the index is open to direct investment.
The Barclays Capital High Yield 2% Issuer Constrained Index is the 2% Issuer Cap component of the Barclays Capital U.S. Corporate High Yield Bond Index. The Barclays Capital U.S. Corporate High Yield Bond Index is an unmanaged index that includes all fixed income securities having a maximum quality rating of Ba1, a minimum amount outstanding of $150 million, and a least 1 year to maturity. The 2% Issuer Cap component limits an issuer to 2% of the aggregate market capitalization. The index is presented on a total return basis.
Top 10 Portfolio Holdings as of December 31, 2009 (1) (2)
| % of Net Assets | |||||||
| 1. | HCA, Inc. 9.625%, 11/15/2016 | 1.6 | |||||
| 2. | GMAC, Inc. 6.875%, 09/15/2011 | 1.4 | |||||
| 3. | Sprint Capital Corp. 6.900%, 05/01/2019 | 1.1 | |||||
| 4. | Intelsat Intermediate Holdings Co. Ltd. 9.500%, 02/01/2015 | 1.1 | |||||
| 5. | Intelsat Jackson Holdings Ltd. 11.250%, 06/15/2016 | 1.0 | |||||
| 6. | Biomet, Inc. 11.625%, 10/15/2017 | 1.0 | |||||
| 7. | Visant Holding Corp. 8.750%, 12/01/2013 | 0.9 | |||||
| 8. | Visant Corp. 7.625%, 10/01/2012 | 0.8 | |||||
| 9. | Nalco Co. 8.875%, 11/15/2013 | 0.7 | |||||
| 10. | ARAMARK Corp. 8.500%, 02/01/2015 | 0.7 | |||||
Portfolio Composition as of December 31, 2009 (1)
| % of Net Assets | |||
Corporate Bonds (3) (4) | 97.5 | ||
Convertible Bonds (3) (4) | 0.5 | ||
Preferred Stocks (3) | 0.2 | ||
Common Stocks (3) | 0.1 | ||
| Money Market Funds and Other Net Assets | 1.7 | ||
| 100.0 | |||
| (1) | Composition of Portfolio subject to change. | |
| (2) | Short-term investments have been excluded from the list of Top 10 Portfolio holdings. | |
| (3) | Sectors (combined): |
| % of Net Assets | |||
| Consumer Discretionary | 30.7 | ||
| Industrials | 12.9 | ||
| Health Care | 9.8 | ||
| Materials | 9.4 | ||
| Financials | 6.9 | ||
| Consumer Staples | 6.8 | ||
| Energy | 6.4 | ||
| Information Technology | 6.3 | ||
| Telecommunication Services | 6.0 | ||
| Utilities | 3.1 | ||
| 98.3 | |||
| (4) | Bond credit quality (Standard & Poor’s ratings) (combined): |
| % of Total Bonds | |||
| BBB | 0.5 | ||
| BB | 19.6 | ||
| B | 45.2 | ||
| CCC | 30.9 | ||
| CC & Below | 3.8 | ||
| 100.0 | |||
99
Ohio National Fund, Inc.
High Income Bond Portfolio
High Income Bond Portfolio
| Schedule of Investments | December 31, 2009 |
| Face | ||||||||
| Corporate Bonds – 97.5% | Amount | Value | ||||||
CONSUMER DISCRETIONARY – 30.7% | ||||||||
Auto Components – 1.1% | ||||||||
| American Axle & Manufacturing, Inc. 9.250%, 01/15/2017 (b) | $ | 75,000 | $ | 76,500 | ||||
| Cooper-Standard Automotive, Inc. 8.375%, 12/15/2014 (Acquired 12/16/2004 through 05/15/2008, Cost $214,803) (a) (d) | 250,000 | 65,000 | ||||||
| Hawk Corp. 8.750%, 11/01/2014 | 100,000 | 100,375 | ||||||
| Tenneco, Inc. 8.625%, 11/15/2014 | 500,000 | 506,875 | ||||||
| TRW Automotive, Inc. 8.875%, 12/01/2017 (b) | 175,000 | 182,875 | ||||||
| United Components, Inc. 9.375%, 06/15/2013 | 850,000 | 824,500 | ||||||
| 1,756,125 | ||||||||
Automobiles – 0.7% | ||||||||
| Affinia Group, Inc. 10.750%, 08/15/2016 (b) | 425,000 | 462,719 | ||||||
| Motors Liquidation Co. 7.400%, 09/01/2025 (Acquired 12/20/2006 through 04/02/2008, Cost $891,003) (a) (d) | 1,100,000 | 280,500 | ||||||
| Yonkers Racing Corp. 11.375%, 07/15/2016 (b) | 300,000 | 316,500 | ||||||
| 1,059,719 | ||||||||
Distributors – 0.5% | ||||||||
| Baker & Taylor, Inc. 11.500%, 07/01/2013 (b) | 400,000 | 217,500 | ||||||
| McJunkin Red Man Corp. 9.500%, 12/15/2016 (b) | 550,000 | 540,375 | ||||||
| 757,875 | ||||||||
Diversified Consumer Services – 0.6% | ||||||||
| Education Management LLC / Education Management Finance Corp. 10.250%, 06/01/2016 | 450,000 | 483,750 | ||||||
| Knowledge Learning Corp. 7.750%, 02/01/2015 (b) | 550,000 | 530,750 | ||||||
| 1,014,500 | ||||||||
Hotels, Restaurants & Leisure – 7.7% | ||||||||
| American Casino & Entertainment Properties 11.000%, 06/15/2014 (b) | 550,000 | 466,125 | ||||||
| Ameristar Casinos, Inc. 9.250%, 06/01/2014 (b) | 625,000 | 651,562 | ||||||
| Dave & Busters, Inc. 11.250%, 03/15/2014 | 450,000 | 469,125 | ||||||
| Fontainebleau Las Vegas Holdings LLC 11.000%, 06/15/2015 (Acquired 05/24/2007 through 05/02/2008, Cost $361,055) (a) (b) (d) | 375,000 | 5,625 | ||||||
| Great Canadian Gaming Corp. 7.250%, 02/15/2015 (b) | 675,000 | 652,219 | ||||||
| Harrah’s Operating Co., Inc. 11.250%, 06/01/2017 (b) | 250,000 | 262,813 | ||||||
| Harrahs Operating Escrow LLC / Harrahs Escrow Corp. 11.250%, 06/01/2017 (b) | 400,000 | 420,500 | ||||||
| Herbst Gaming, Inc. 7.000%, 11/15/2014 (Acquired 11/05/2004 through 01/03/2008, Cost $352,676) (a) (d) | 375,000 | 2,109 | ||||||
| Indianapolis Downs LLC / Indiana Downs Capital Corp. 11.000%, 11/01/2012 (b) | 725,000 | 474,875 | ||||||
| 15.500%, 11/01/2013 (b) | 101,133 | 34,006 | ||||||
| Jacobs Entertainment, Inc. 9.750%, 06/15/2014 | 625,000 | 585,938 | ||||||
| Mandalay Resort Group 9.375%, 02/15/2010 | 165,000 | 165,000 | ||||||
| MGM Mirage, Inc. 8.375%, 02/01/2011 | 200,000 | 190,500 | ||||||
| 13.000%, 11/15/2013 | 150,000 | 172,875 | ||||||
| 5.875%, 02/27/2014 | 700,000 | 564,375 | ||||||
| 10.375%, 05/15/2014 (b) | 50,000 | 54,500 | ||||||
| 7.500%, 06/01/2016 | 625,000 | 490,625 | ||||||
| 11.125%, 11/15/2017 (b) | 175,000 | 194,688 | ||||||
| 11.375%, 03/01/2018 (b) | 425,000 | 382,500 | ||||||
| NPC International, Inc. 9.500%, 05/01/2014 | 650,000 | 646,750 | ||||||
| Penn National Gaming, Inc. 6.750%, 03/01/2015 | 425,000 | 412,781 | ||||||
| 8.750%, 08/15/2019 (b) | 225,000 | 231,188 | ||||||
| Penninsula Gaming LLC 8.375%, 08/15/2015 (b) | 250,000 | 250,625 | ||||||
| 10.750%, 08/15/2017 (b) | 575,000 | 580,750 | ||||||
| Royal Caribbean Cruises Ltd. 7.250%, 06/15/2016 | 425,000 | 412,781 | ||||||
| San Pasqual Casino 8.000%, 09/15/2013 (b) | 350,000 | 329,000 | ||||||
| Seminole Hard Rock Entertainment, Inc. 2.754%, 03/15/2014 (b) (c) | 475,000 | 393,656 | ||||||
| Seminole Indian Tribe of Florida 7.804%, 10/01/2020 (b) | 550,000 | 467,071 | ||||||
| Shingle Springs Tribal Gaming Authority 9.375%, 06/15/2015 (b) | 575,000 | 439,875 | ||||||
| Tunica-Biloxi Gaming Authority 9.000%, 11/15/2015 (b) | 400,000 | 362,500 | ||||||
| Universal City Development Partners, Ltd. 8.875%, 11/15/2015 (b) | 475,000 | 467,281 | ||||||
| 10.875%, 11/15/2016 (b) | 150,000 | 151,125 | ||||||
| Wynn Las Vegas LLC / Wynn Las Vegas Capital Corp. 6.625%, 12/01/2014 | 500,000 | 485,625 | ||||||
| 7.875%, 11/01/2017 (b) | 425,000 | 432,438 | ||||||
| 12,303,406 | ||||||||
Household Durables – 1.7% | ||||||||
| Jarden Corp. 8.000%, 05/01/2016 | 225,000 | 233,438 | ||||||
| 7.500%, 05/01/2017 | 725,000 | 726,812 | ||||||
(continued)
100
Ohio National Fund, Inc.
High Income Bond Portfolio (Continued)
High Income Bond Portfolio (Continued)
| Schedule of Investments | December 31, 2009 |
| Face | ||||||||
| Corporate Bonds – 97.5% | Amount | Value | ||||||
Household Durables (continued) | ||||||||
| Norcraft Companies LP / Norcraft Finance Corp. 10.500%, 12/15/2015 (b) | $ | 450,000 | $ | 463,500 | ||||
| Norcraft Holdings LP / Norcraft Capital Corp. 9.750%, 09/01/2012 | 182,000 | 175,630 | ||||||
| Sealy Mattress Co. 8.250%, 06/15/2014 | 675,000 | 678,375 | ||||||
| 10.875%, 04/15/2016 (b) | 375,000 | 419,063 | ||||||
| 2,696,818 | ||||||||
Leisure Equipment & Products – 2.3% | ||||||||
| Easton-Bell Sports, Inc. 9.750%, 12/01/2016 (b) | 450,000 | 468,562 | ||||||
| Visant Corp. 7.625%, 10/01/2012 | 1,225,000 | 1,237,250 | ||||||
| Visant Holding Corp. 8.750%, 12/01/2013 | 1,325,000 | 1,368,063 | ||||||
| 10.250%, 12/01/2013 | 550,000 | 570,625 | ||||||
| 3,644,500 | ||||||||
Media – 12.0% | ||||||||
| AAC Group Holding Corp. 10.250%, 10/01/2012 (b) | 625,000 | 629,687 | ||||||
| Affinity Group Holding, Inc. 10.875%, 02/15/2012 (Acquired 03/21/2005 through 02/22/2008, Cost $220,782) (a) (d) (e) | 225,490 | 91,042 | ||||||
| Affinity Group, Inc. 9.000%, 02/15/2012 | 175,000 | 120,094 | ||||||
| American Achievement Corp. 8.250%, 04/01/2012 (b) | 425,000 | 426,062 | ||||||
| American Achievement Group Holding Corp. 16.750% 10/01/2012 | 161,208 | 126,548 | ||||||
| Belo Corp. 8.000%, 11/15/2016 | 50,000 | 51,625 | ||||||
| CCH II LLC / CCH II Capital Corp. 13.500%, 11/30/2016 | 421,692 | 498,651 | ||||||
| CCO Holdings LLC / CCO Holdings Capital Corp. 8.750%, 11/15/2013 (a) | 450,000 | 464,062 | ||||||
| CSC Holdings LLC 8.500%, 04/15/2014 (b) | 125,000 | 133,750 | ||||||
| 7.875%, 02/15/2018 | 150,000 | 156,000 | ||||||
| Cinemark USA, Inc. 8.625%, 06/15/2019 (b) | 575,000 | 600,875 | ||||||
| Dex Media West LLC / Dex Media West Finance Co. 9.875%, 08/15/2013 (Acquired 08/15/2003 through 07/22/2008, Cost $419,420) (a) (d) | 422,000 | 133,985 | ||||||
| Dex Media, Inc. 9.000%, 11/15/2013 (Acquired 11/03/2003 through 02/05/2004, Cost $273,372) (a) (d) | 275,000 | 70,812 | ||||||
| DISH DBS Corp. 6.625%, 10/01/2014 | 850,000 | 859,562 | ||||||
| Fox Acquisition Sub. LLC 13.375%, 07/15/2016 (b) | 575,000 | 447,781 | ||||||
| Idearc, Inc. 8.000%, 11/15/2016 (Acquired 11/01/2006 through 06/08/2007, Cost $631,081) (a) (d) | 625,000 | 46,875 | ||||||
| Intelsat Intermediate Holding Co. Ltd. 0.000% to 02/01/2010 then | ||||||||
| 9.500%, 02/01/2015 | 1,650,000 | 1,703,625 | ||||||
| Intelsat Jackson Holdings Ltd. 11.250%, 06/15/2016 | 1,525,000 | 1,658,438 | ||||||
| 8.500%, 11/01/2019 (b) | 275,000 | 284,625 | ||||||
| Interpublic Group of Companies, Inc. 10.000%, 07/15/2017 | 700,000 | 780,500 | ||||||
| Kabel Deutschland GmbH 10.625%, 07/01/2014 | 650,000 | 682,500 | ||||||
| Lamar Media Corp. 7.250%, 01/01/2013 | 50,000 | 50,125 | ||||||
| 9.750%, 04/01/2014 | 175,000 | 194,031 | ||||||
| 6.625%, 08/15/2015 | 950,000 | 916,750 | ||||||
| MDC Partners, Inc. 11.000%, 11/01/2016 (b) | 625,000 | 653,125 | ||||||
| MediMedia USA, Inc. 11.375%, 11/15/2014 (b) | 775,000 | 654,875 | ||||||
| Newport Television LLC / NTV Finance Corp. 13.000%, 03/15/2017 (b) | 427,500 | 190,772 | ||||||
| Nexstar Broadcasting, Inc. 0.500% to 01/15/2011 then 7.000%, 01/15/2014 (b) | 430,113 | 325,273 | ||||||
| 7.000%, 01/15/2014 | 225,000 | 170,156 | ||||||
| Nielsen Finance LLC / Nielsen Finance Co. 11.625%, 02/01/2014 | 450,000 | 507,938 | ||||||
| 11.500%, 05/01/2016 | 400,000 | 449,000 | ||||||
| 0.000% to 08/01/2011 then 12.500%, 08/01/2016 | 325,000 | 298,188 | ||||||
| Quebecor Media, Inc. 7.750%, 03/15/2016 | 450,000 | 451,125 | ||||||
| R.H. Donnelley Corp. 6.875%, 01/15/2013 (Acquired 01/13/2006 through 02/28/2007, Cost $357,325) (a) (d) | 375,000 | 37,031 | ||||||
| 8.875%, 01/15/2016 (Acquired 01/13/2006, Cost $150,000) (a) (d) | 150,000 | 14,813 | ||||||
| 8.875%, 10/15/2017 (Acquired 09/19/2007 and 10/2/2007, Cost $450,000) (a) (d) | 450,000 | 44,438 | ||||||
| Rainbow National Services LLC 10.375%, 09/01/2014 (b) | 639,000 | 677,340 | ||||||
| Readers Digest Association, Inc. / The 9.000%, 02/15/2017 (Acquired 02/27/2007 through 10/31/2007, Cost $618,265) (a) (d) | 725,000 | 11,781 | ||||||
| Regal Cinemas Corp. 8.625%, 07/15/2019 | 225,000 | 235,125 | ||||||
| Reynolds Group Issuer, Inc. / Reynolds Group Issuer LLC 7.750%, 10/15/2016 (b) | 900,000 | 924,750 | ||||||
| TruVo Subsidiary Corp. 8.375%, 12/01/2014 (Acquired 11/30/2004 through 11/03/2005, Cost $445,453) (b) (e) | 475,000 | 40,375 | ||||||
(continued)
101
Ohio National Fund, Inc.
High Income Bond Portfolio (Continued)
High Income Bond Portfolio (Continued)
| Schedule of Investments | December 31, 2009 |
| Face | ||||||||
| Corporate Bonds – 97.5% | Amount | Value | ||||||
Media (continued) | ||||||||
| Umbrella Acquisition, Inc. 9.750%, 03/15/2015 (b) | $ | 494,687 | $ | 435,943 | ||||
| Univision Communications Inc. 12.000%, 07/01/2014 (b) | 75,000 | 82,969 | ||||||
| Videotron Ltee 6.375%, 12/15/2015 | 100,000 | 98,250 | ||||||
| 9.125%, 04/15/2018 | 75,000 | 82,875 | ||||||
| 9.125%, 04/15/2018 (b) | 200,000 | 221,000 | ||||||
| Virgin Media Finance PLC 9.500%, 08/15/2016 | 725,000 | 782,094 | ||||||
| XM Satellite Radio, Inc. 11.250%, 06/15/2013 (b) | 125,000 | 135,000 | ||||||
| 13.000%, 08/01/2014 (b) | 500,000 | 545,625 | ||||||
| 19,197,866 | ||||||||
Multiline Retail – 1.6% | ||||||||
| Dollar General Corp. 11.875%, 07/15/2017 | 635,000 | 736,600 | ||||||
| J.C. Penney Corp. Inc. 7.400%, 04/01/2037 | 125,000 | 124,687 | ||||||
| Macy’s Retail Holdings, Inc. 6.650%, 07/15/2024 | 175,000 | 160,125 | ||||||
| 7.000%, 02/15/2028 | 100,000 | 88,500 | ||||||
| 6.900%, 04/01/2029 | 125,000 | 110,625 | ||||||
| 6.900%, 01/15/2032 | 50,000 | 43,750 | ||||||
| QVC, Inc. 7.500%, 10/01/2019 (b) | 525,000 | 538,125 | ||||||
| Toys “R” Us Property Co. I LLC 10.750%, 07/15/2017 (b) | 700,000 | 770,000 | ||||||
| 2,572,412 | ||||||||
Specialty Retail – 2.1% | ||||||||
| Limited Brands, Inc. 8.500%, 06/15/2019 (b) | 525,000 | 573,562 | ||||||
| NBC Acquisition Corp. 11.000%, 03/15/2013 | 350,000 | 217,000 | ||||||
| Nebraska Book Co., Inc. 10.000%, 12/01/2011 (b) | 525,000 | 534,188 | ||||||
| 8.625%, 03/15/2012 | 825,000 | 713,625 | ||||||
| Penske Auto Group, Inc. 7.750%, 12/15/2016 | 275,000 | 267,438 | ||||||
| Sally Holdings LLC / Sally Capital, Inc. 10.500%, 11/15/2016 | 950,000 | 1,026,000 | ||||||
| 3,331,813 | ||||||||
Textiles, Apparel & Luxury Goods – 0.4% | ||||||||
| Hanesbrands, Inc. 8.000%, 12/15/2016 | 75,000 | 76,781 | ||||||
| Phillips-Van Heusen Corp. 7.250%, 02/15/2011 | 150,000 | 151,125 | ||||||
| 8.125%, 05/01/2013 | 450,000 | 461,250 | ||||||
| 689,156 | ||||||||
TOTAL CONSUMER DISCRETIONARY | 49,024,190 | |||||||
CONSUMER STAPLES – 6.8% | ||||||||
Beverages – 0.4% | ||||||||
| Constellation Brands, Inc. 8.375%, 12/15/2014 | 150,000 | 160,500 | ||||||
| 7.250%, 09/01/2016 | 175,000 | 178,500 | ||||||
| 7.250%, 05/15/2017 | 350,000 | 356,562 | ||||||
| 695,562 | ||||||||
Food & Staples Retailing – 0.7% | ||||||||
| General Nutrition Centers, Inc. 5.178%, 03/15/2014 (c) | 925,000 | 867,188 | ||||||
| SUPERVALU, Inc. 8.000%, 05/01/2016 | 225,000 | 229,500 | ||||||
| 1,096,688 | ||||||||
Food Products – 4.0% | ||||||||
| B&G Foods, Inc. 8.000%, 10/01/2011 | 1,000,000 | 1,022,500 | ||||||
| 12.000%, 10/30/2016 | 52,728 | 53,657 | ||||||
| Bumble Bee Foods LLC 7.750%, 12/15/2015 (b) | 150,000 | 150,750 | ||||||
| Dean Foods Co. 7.000%, 06/01/2016 | 775,000 | 763,375 | ||||||
| Del Monte Corp. 7.500%, 10/15/2019 (b) | 300,000 | 310,500 | ||||||
| M-Foods Holdings Inc. 9.750%, 10/01/2013 (b) | 425,000 | 443,594 | ||||||
| Michael Foods, Inc. 8.000%, 11/15/2013 | 550,000 | 565,812 | ||||||
| Pinnacle Foods Finance LLC / Pinnacle Foods Finance Corp. 9.250%, 04/01/2015 | 425,000 | 433,500 | ||||||
| 9.250%, 04/01/2015 (b) | 150,000 | 153,000 | ||||||
| 10.625%, 04/01/2017 | 425,000 | 444,125 | ||||||
| Reddy Ice Holdings, Inc. 10.500%, 11/01/2012 | 825,000 | 771,375 | ||||||
| Smithfield Foods, Inc. 7.750%, 05/15/2013 | 350,000 | 341,250 | ||||||
| 10.000%, 07/15/2014 (b) | 375,000 | 408,750 | ||||||
| 7.750%, 07/01/2017 | 325,000 | 301,438 | ||||||
| Tyson Foods, Inc. 10.500%, 03/01/2014 | 275,000 | 315,563 | ||||||
| 6,479,189 | ||||||||
Household Products – 1.3% | ||||||||
| Central Garden & Pet Co. 9.125%, 02/01/2013 | 825,000 | 840,469 | ||||||
| JohnsonDiversey Inc. 8.250%, 11/15/2019 (b) | 175,000 | 178,062 | ||||||
| JohnsonDiversey Holdings, Inc. 10.500%, 05/15/2020 (b) | 375,000 | 378,750 | ||||||
| Spectrum Brands, Inc. 12.000%, 08/28/2019 | 625,000 | 615,625 | ||||||
| 2,012,906 | ||||||||
(continued)
102
Ohio National Fund, Inc.
High Income Bond Portfolio (Continued)
High Income Bond Portfolio (Continued)
| Schedule of Investments | December 31, 2009 |
| Face | ||||||||
| Corporate Bonds – 97.5% | Amount | Value | ||||||
Tobacco – 0.4% | ||||||||
| Alliance One International, Inc. 10.000%, 07/15/2016 (b) | $ | 275,000 | $ | 290,125 | ||||
| Reynolds American, Inc. 7.750%, 06/01/2018 | 325,000 | 353,917 | ||||||
| 644,042 | ||||||||
TOTAL CONSUMER STAPLES | 10,928,387 | |||||||
ENERGY – 6.4% | ||||||||
Energy Equipment & Services – 0.6% | ||||||||
| Basic Energy Services, Inc. 7.125%, 04/15/2016 | 375,000 | 314,062 | ||||||
| CGG-Veritas 9.500%, 05/15/2016 (b) | 75,000 | 80,625 | ||||||
| 7.750%, 05/15/2017 | 375,000 | 374,063 | ||||||
| Complete Production Services, Inc. 8.000%, 12/15/2016 | 225,000 | 223,031 | ||||||
| 991,781 | ||||||||
Oil, Gas & Consumable Fuels – 5.8% | ||||||||
| Aquilex Holdings LLC / Aquilex Finance Corp. 11.125%, 12/15/2016 (b) | 250,000 | 250,625 | ||||||
| Chesapeake Energy Corp. 7.500%, 09/15/2013 | 325,000 | 332,312 | ||||||
| 9.500%, 02/15/2015 | 325,000 | 358,312 | ||||||
| 6.875%, 01/15/2016 | 675,000 | 678,375 | ||||||
| 6.875%, 11/15/2020 | 425,000 | 412,250 | ||||||
| Forest Oil Corp. 8.500%, 02/15/2014 (b) | 100,000 | 105,000 | ||||||
| 7.250%, 06/15/2019 | 450,000 | 446,625 | ||||||
| Hilcorp Energy I LP / Hilcorp Finance Co. 7.750%, 11/01/2015 (b) | 400,000 | 394,000 | ||||||
| Holly Energy Partners LP 6.250%, 03/01/2015 | 900,000 | 864,000 | ||||||
| Inergy LP / Inergy Finance Corp. 6.875%, 12/15/2014 | 625,000 | 620,313 | ||||||
| 8.750%, 03/01/2015 | 425,000 | 438,813 | ||||||
| Linn Energy LLC 11.750%, 05/15/2017 (b) | 200,000 | 225,500 | ||||||
| MarkWest Energy Partners LP / MarkWest Energy Finance Corp. 8.750%, 04/15/2018 | 850,000 | 879,750 | ||||||
| Petroplus Finance Ltd. 6.750%, 05/01/2014 (b) | 200,000 | 189,000 | ||||||
| 7.000%, 05/01/2017 (b) | 225,000 | 203,625 | ||||||
| Pioneer Natural Resources Co. 6.875%, 05/01/2018 | 300,000 | 298,326 | ||||||
| Plains Exploration & Production Co. 7.750%, 06/15/2015 | 600,000 | 613,500 | ||||||
| 7.000%, 03/15/2017 | 125,000 | 123,438 | ||||||
| Range Resources Corp. 6.375%, 03/15/2015 | 100,000 | 99,750 | ||||||
| 7.500%, 05/15/2016 | 150,000 | 154,875 | ||||||
| Regency Energy Partners LP / Regency Energy Finance Corp. 8.375%, 12/15/2013 | 575,000 | 598,000 | ||||||
| 9.375%, 06/01/2016 (b) | 250,000 | 267,500 | ||||||
| SandRidge Energy, Inc. 9.875%, 05/15/2016 (b) | 100,000 | 105,750 | ||||||
| 8.000%, 06/01/2018 (b) | 250,000 | 246,875 | ||||||
| Southern Star Central Corp. 6.750%, 03/01/2016 | 225,000 | 218,250 | ||||||
| Southwestern Energy Co. 7.500%, 02/01/2018 | 150,000 | 159,750 | ||||||
| 9,284,514 | ||||||||
TOTAL ENERGY | 10,276,295 | |||||||
FINANCIALS – 6.7% | ||||||||
Capital Markets – 1.0% | ||||||||
| Nuveen Investments, Inc. 10.500%, 11/15/2015 | 1,125,000 | 1,026,562 | ||||||
| Reliance Intermediate Holdings LP 9.500%, 12/15/2019 (b) | 550,000 | 575,438 | ||||||
| 1,602,000 | ||||||||
Consumer Finance – 4.3% | ||||||||
| Ford Motor Credit Co. LLC 9.875%, 08/10/2011 | 500,000 | 523,703 | ||||||
| 7.250%, 10/25/2011 | 875,000 | 884,025 | ||||||
| 3.034%, 01/13/2012 (c) | 550,000 | 512,187 | ||||||
| 7.500%, 08/01/2012 | 400,000 | 403,616 | ||||||
| 8.000%, 06/01/2014 | 250,000 | 256,933 | ||||||
| 8.000%, 12/15/2016 | 1,000,000 | 1,002,644 | ||||||
| 8.125%, 01/15/2020 | 150,000 | 147,653 | ||||||
| GMAC, Inc. 6.875%, 09/15/2011 (b) | 2,322,000 | 2,310,390 | ||||||
| 7.000%, 02/01/2012 (b) | 625,000 | 621,875 | ||||||
| 8.000%, 11/01/2031 (b) | 260,000 | 236,600 | ||||||
| 6,899,626 | ||||||||
Real Estate Investment Trusts – 1.2% | ||||||||
| Host Hotels & Resorts LP 7.125%, 11/01/2013 | 325,000 | 331,906 | ||||||
| 6.875%, 11/01/2014 | 250,000 | 252,812 | ||||||
| 6.375%, 03/15/2015 | 175,000 | 172,375 | ||||||
| 6.750%, 06/01/2016 | 100,000 | 100,000 | ||||||
| Ventas Realty LP / Ventas Capital Corp. 7.125%, 06/01/2015 | 100,000 | 100,500 | ||||||
| 6.500%, 06/01/2016 | 550,000 | 533,500 | ||||||
| 6.750%, 04/01/2017 | 375,000 | 364,688 | ||||||
| 1,855,781 | ||||||||
Real Estate Management & Development – 0.2% | ||||||||
| lcahn Enterprises LP / lcahn Enterprises Finance Corp. 7.125%, 02/15/2013 | 250,000 | 256,250 | ||||||
TOTAL FINANCIALS | 10,613,657 | |||||||
(continued)
103
Ohio National Fund, Inc.
High Income Bond Portfolio (Continued)
High Income Bond Portfolio (Continued)
| Schedule of Investments | December 31, 2009 |
| Face | ||||||||
| Corporate Bonds – 97.5% | Amount | Value | ||||||
HEALTH CARE – 9.8% | ||||||||
Biotechnology – 0.0% | ||||||||
| Talecris Biotherapeutics Holdings 7.750%, 11/15/2016 (b) | $ | 100,000 | $ | 102,000 | ||||
Health Care Equipment & Supplies – 2.9% | ||||||||
| Accellent, Inc. 10.500%, 12/01/2013 | 550,000 | 532,125 | ||||||
| Bausch & Lomb, Inc. 9.875%, 11/01/2015 | 550,000 | 583,000 | ||||||
| Biomet, Inc. 10.375%, 10/15/2017 | 75,000 | 81,750 | ||||||
| 11.625%, 10/15/2017 | 1,425,000 | 1,581,750 | ||||||
| Inverness Medical Innovations Inc. 7.875%, 02/01/2016 | 275,000 | 270,875 | ||||||
| 9.000%, 05/15/2016 | 500,000 | 513,750 | ||||||
| VWR Funding, Inc. 10.250%, 07/15/2015 | 975,000 | 1,018,875 | ||||||
| 4,582,125 | ||||||||
Health Care Providers & Services – 6.5% | ||||||||
| AMR HoldCo, Inc. / EmCare HoldCo, Inc. 10.000%, 02/15/2015 | 625,000 | 659,375 | ||||||
| CRC Health Corp. 10.750%, 02/01/2016 | 550,000 | 464,750 | ||||||
| Fresenius US Finance II, Inc. 9.000%, 07/15/2015 (b) | 325,000 | 359,125 | ||||||
| HCA, Inc. 9.250%, 11/15/2016 | 550,000 | 591,937 | ||||||
| 9.625%, 11/15/2016 | 2,376,516 | 2,578,520 | ||||||
| 9.875%, 02/15/2017 (b) | 225,000 | 249,750 | ||||||
| 7.875%, 02/15/2020 (b) | 275,000 | 287,031 | ||||||
| 7.500%, 11/06/2033 | 225,000 | 197,896 | ||||||
| National Mentor Holdings, Inc. 11.250%, 07/01/2014 | 475,000 | 486,875 | ||||||
| Omnicare, Inc. 6.875%, 12/15/2015 | 775,000 | 757,562 | ||||||
| Psychiatric Solutions, Inc. 7.750%, 07/15/2015 (b) | 125,000 | 118,438 | ||||||
| United Surgical Partners International, Inc. 9.250%, 05/01/2017 | 750,000 | 768,750 | ||||||
| Universal Hospital Services, Inc. 3.859%, 06/01/2015 (c) | 150,000 | 127,125 | ||||||
| 8.500%, 06/01/2015 | 325,000 | 321,750 | ||||||
| Vanguard Health Holding Co. I LLC 11.250%, 10/01/2015 | 150,000 | 158,625 | ||||||
| Vanguard Health Holding Co. II LLC 9.000%, 10/01/2014 | 550,000 | 572,688 | ||||||
| Viant Holdings, Inc. 10.125%, 07/15/2017 (b) | 625,000 | 625,000 | ||||||
| Yankee Acquisition Corp. 8.500%, 02/15/2015 | 200,000 | 199,500 | ||||||
| 9.750%, 02/15/2017 | 925,000 | 915,750 | ||||||
| 10,440,447 | ||||||||
Life Sciences Tools & Services – 0.4% | ||||||||
| Bio-Rad Laboratories, Inc. 6.125%, 12/15/2014 | 275,000 | 276,375 | ||||||
| 8.000%, 09/15/2016 (b) | 300,000 | 317,250 | ||||||
| 593,625 | ||||||||
TOTAL HEALTH CARE | 15,718,197 | |||||||
INDUSTRIALS – 12.3% | ||||||||
Aerospace & Defense – 2.1% | ||||||||
| Alliant Techsystems, Inc. 6.750%, 04/01/2016 | 500,000 | 497,500 | ||||||
| Hawker Beechcraft Acquisition Co. LLC / Hawker Beechcraft Notes Co. 9.750%, 04/01/2017 | 200,000 | 125,000 | ||||||
| L-3 Communications Corp. 6.125%, 07/15/2013 | 425,000 | 431,375 | ||||||
| 6.125%, 01/15/2014 | 700,000 | 707,875 | ||||||
| 5.875%, 01/15/2015 | 225,000 | 225,844 | ||||||
| 6.375%, 10/15/2015 | 225,000 | 226,969 | ||||||
| Sequa Corporation 11.750%, 12/01/2015 (b) | 300,000 | 280,500 | ||||||
| 13.500%, 12/01/2015 (b) | 183,054 | 170,240 | ||||||
| TransDigm, Inc. 7.750%, 07/15/2014 (b) | 225,000 | 229,500 | ||||||
| 7.750%, 07/15/2014 | 450,000 | 457,875 | ||||||
| 3,352,678 | ||||||||
Air Freight & Logistics – 0.4% | ||||||||
| CEVA Group PLC 10.000%, 09/01/2014 (b) | 450,000 | 429,750 | ||||||
| 11.625%, 10/01/2016 (b) | 150,000 | 154,687 | ||||||
| 584,437 | ||||||||
Building Products – 0.8% | ||||||||
| Associated Materials LLC / Associated Materials Finance, Inc. 9.875%, 11/15/2016 (b) | 50,000 | 53,000 | ||||||
| Goodman Global Group, Inc. 0.000%, 12/15/2014 (b) | 775,000 | 443,688 | ||||||
| Goodman Global, Inc. 13.500%, 02/15/2016 | 350,000 | 388,937 | ||||||
| Nortek, Inc. 11.000%, 12/01/2013 | 125,555 | 131,833 | ||||||
| Ply Gem Industries, Inc. 11.750%, 06/15/2013 | 250,000 | 251,250 | ||||||
| 1,268,708 | ||||||||
Commercial Services & Supplies – 4.3% | ||||||||
| Altegrity, Inc. 10.500%, 11/01/2015 (b) | 425,000 | 381,437 | ||||||
| 11.750%, 05/01/2016 (b) | 425,000 | 368,156 | ||||||
| ARAMARK Corp. 3.781%, 02/01/2015 (c) | 250,000 | 230,000 | ||||||
| 8.500%, 02/01/2015 | 1,075,000 | 1,112,625 | ||||||
| Browning-Ferris Industries, Inc. 9.250%, 05/01/2021 | 225,000 | 267,642 | ||||||
(continued)
104
Ohio National Fund, Inc.
High Income Bond Portfolio (Continued)
High Income Bond Portfolio (Continued)
| Schedule of Investments | December 31, 2009 |
| Face | ||||||||
| Corporate Bonds – 97.5% | Amount | Value | ||||||
Commercial Services & Supplies (continued) | ||||||||
| GEO Group, Inc. 7.750%, 10/15/2017 (b) | $ | 50,000 | $ | 51,438 | ||||
| Global Cash Access, Inc. / Global Cash Finance Corp. 8.750%, 03/15/2012 | 650,000 | 650,813 | ||||||
| Interface, Inc. 11.375%, 11/01/2013 | 50,000 | 56,125 | ||||||
| KAR Auction Services, Inc. 8.750%, 05/01/2014 | 150,000 | 155,437 | ||||||
| 10.000%, 05/01/2015 | 17,000 | 18,275 | ||||||
| RSC Equipment Rental, Inc. 9.500%, 12/01/2014 | 600,000 | 603,750 | ||||||
| 10.000%, 07/15/2017 (b) | 175,000 | 191,188 | ||||||
| SGS International, Inc. 12.000%, 12/15/2013 | 825,000 | 838,406 | ||||||
| West Corp. 9.500%, 10/15/2014 | 850,000 | 867,000 | ||||||
| 11.000%, 10/15/2016 | 1,000,000 | 1,050,000 | ||||||
| 6,842,292 | ||||||||
Electrical Equipment – 1.7% | ||||||||
| Baldor Electric Co. 8.625%, 02/15/2017 | 225,000 | 231,187 | ||||||
| Belden, Inc. 7.000%, 03/15/2017 | 450,000 | 440,438 | ||||||
| 9.250%, 06/15/2019 (b) | 200,000 | 212,250 | ||||||
| General Cable Corp. 2.665%, 04/01/2015 (c) | 325,000 | 290,469 | ||||||
| 7.125%, 04/01/2017 | 600,000 | 592,500 | ||||||
| Sensus USA, Inc. 8.625%, 12/15/2013 | 525,000 | 538,781 | ||||||
| Viasystems, Inc. 12.000%, 01/15/2015 (b) | 375,000 | 403,594 | ||||||
| 2,709,219 | ||||||||
Machinery – 1.5% | ||||||||
| ALH Finance LLC / ALH Finance Corp. 8.500%, 01/15/2013 | 600,000 | 603,000 | ||||||
| Esco Corp. 4.129%, 12/15/2013 (b) (c) | 225,000 | 206,156 | ||||||
| 8.625%, 12/15/2013 (b) | 250,000 | 250,000 | ||||||
| Mueller Water Products, Inc. 7.375%, 06/01/2017 | 250,000 | 232,500 | ||||||
| Navistar International Corp. 8.250%, 11/01/2021 | 400,000 | 412,000 | ||||||
| SPX Corp. 7.625%, 12/15/2014 | 550,000 | 569,250 | ||||||
| Valmont Industries, Inc. 6.875%, 05/01/2014 | 200,000 | 206,500 | ||||||
| 2,479,406 | ||||||||
Marine – 0.2% | ||||||||
| Stena AB 7.500%, 11/01/2013 | 200,000 | 193,500 | ||||||
| 7.000%, 12/01/2016 | 175,000 | 155,312 | ||||||
| 348,812 | ||||||||
Road & Rail – 0.9% | ||||||||
| Hertz Corp. / The 8.875%, 01/01/2014 | 625,000 | 642,187 | ||||||
| 10.500%, 01/01/2016 | 300,000 | 321,750 | ||||||
| Kansas City Southern Railway Co. 13.000%, 12/15/2013 | 225,000 | 262,125 | ||||||
| 8.000%, 06/01/2015 | 250,000 | 260,313 | ||||||
| 1,486,375 | ||||||||
Trading Companies & Distributors – 0.4% | ||||||||
| American Tire Distributors, Inc. 10.750%, 04/01/2013 | 175,000 | 161,875 | ||||||
| Interline Brands, Inc. 8.125%, 06/15/2014 | 400,000 | 404,000 | ||||||
| 565,875 | ||||||||
TOTAL INDUSTRIALS | 19,637,802 | |||||||
INFORMATION TECHNOLOGY – 6.3% | ||||||||
Computers & Peripherals – 0.4% | ||||||||
| Seagate Technology International / Seagate Technology HDD Holdings 10.000%, 05/01/2014 (b) | 100,000 | 111,000 | ||||||
| 6.800%, 10/01/2016 | 575,000 | 559,187 | ||||||
| 670,187 | ||||||||
Electronic Equipment, Instruments & Components – 0.1% | ||||||||
| SMART Modular Technologies (WWH), Inc. 5.790%, 04/01/2012 (c) | 114,000 | 103,170 | ||||||
Internet Software & Services – 0.5% | ||||||||
| Terremark Worldwide, Inc. 12.000%, 06/15/2017 (b) | 675,000 | 749,250 | ||||||
IT Services – 3.5% | ||||||||
| Ceridian Corp. 11.250%, 11/15/2015 | 675,000 | 647,156 | ||||||
| CompuCom Systems, Inc. 12.500%, 10/01/2015 (b) | 800,000 | 817,000 | ||||||
| First Data Corp. 9.875%, 09/24/2015 | 575,000 | 539,062 | ||||||
| iPayment, Inc. 9.750%, 05/15/2014 | 350,000 | 292,687 | ||||||
| Lender Processing Services, Inc. 8.125%, 07/01/2016 | 550,000 | 587,813 | ||||||
| Stream Global Services, Inc. 11.250%, 10/01/2014 (b) | 575,000 | 584,344 | ||||||
| SunGard Data Systems, Inc. 9.125%, 08/15/2013 | 350,000 | 360,500 | ||||||
| 10.625%, 05/15/2015 | 450,000 | 497,813 | ||||||
| 10.250%, 08/15/2015 | 975,000 | 1,043,250 | ||||||
(continued)
105
Ohio National Fund, Inc.
High Income Bond Portfolio (Continued)
High Income Bond Portfolio (Continued)
| Schedule of Investments | December 31, 2009 |
| Face | ||||||||
| Corporate Bonds – 97.5% | Amount | Value | ||||||
IT Services (continued) | ||||||||
| Unisys Corp. 12.500%, 01/15/2016 | $ | 225,000 | $ | 234,000 | ||||
| 5,603,625 | ||||||||
Office Electronics – 0.1% | ||||||||
| Xerox Corp. 7.625%, 06/15/2013 | 100,000 | 102,030 | ||||||
Semiconductor & Semiconductor Equipment – 0.6% | ||||||||
| Advanced Micro Devices, Inc. 8.125%, 12/15/2017 (b) | 250,000 | 250,313 | ||||||
| Freescale Semiconductor, Inc. 8.875%, 12/15/2014 | 375,000 | 345,937 | ||||||
| 9.125%, 12/15/2014 | 523,067 | 464,876 | ||||||
| 1,061,126 | ||||||||
Software – 1.1% | ||||||||
| Activant Solutions, Inc. 9.500%, 05/01/2016 | 500,000 | 474,375 | ||||||
| JDA Software Group, Inc. 8.000%, 12/15/2014 (b) | 175,000 | 179,375 | ||||||
| Open Solutions, Inc. 9.750%, 02/01/2015 (b) | 100,000 | 77,375 | ||||||
| Serena Software, Inc. 10.375%, 03/15/2016 | 525,000 | 507,281 | ||||||
| SS&C Technologies, Inc. 11.750%, 12/01/2013 | 500,000 | 532,500 | ||||||
| 1,770,906 | ||||||||
TOTAL INFORMATION TECHNOLOGY | 10,060,294 | |||||||
MATERIALS – 9.4% | ||||||||
Chemicals – 3.0% | ||||||||
| Ashland, Inc. 9.125%, 06/01/2017 (b) | 600,000 | 660,000 | ||||||
| Chemtura Corp. 6.875%, 06/01/2016 (Acquired 04/19/2006 and 04/11/2007, Cost $346,755) (a) (d) | 350,000 | 372,750 | ||||||
| Hexion US Finance Corp. / Hexion Nova Scotia Finance ULC 9.750%, 11/15/2014 | 450,000 | 443,250 | ||||||
| Huntsman International LLC 5.500%, 06/30/2016 (b) | 525,000 | 468,562 | ||||||
| Invista 9.250%, 05/01/2012 (b) | 275,000 | 280,500 | ||||||
| Koppers, Inc. 7.875%, 12/01/2019 (b) | 275,000 | 279,125 | ||||||
| Nalco Finance Holdings, Inc. 9.000%, 02/01/2014 | 66,000 | 67,650 | ||||||
| Nalco Co. 8.875%, 11/15/2013 | 1,150,000 | 1,190,250 | ||||||
| 8.250%, 05/15/2017 (b) | 75,000 | 80,063 | ||||||
| Solutia, Inc. 8.750%, 11/01/2017 | 450,000 | 470,813 | ||||||
| Terra Capital, Inc. 7.750%, 11/01/2019 (b) | 300,000 | 322,500 | ||||||
| Union Carbide Corp. 7.875%, 04/01/2023 | 100,000 | 89,478 | ||||||
| 7.500%, 06/01/2025 | 50,000 | 46,073 | ||||||
| 4,771,014 | ||||||||
Containers & Packaging – 3.5% | ||||||||
| Ball Corp. 7.125%, 09/01/2016 | 350,000 | 360,500 | ||||||
| 6.625%, 03/15/2018 | 250,000 | 248,125 | ||||||
| Berry Plastic Corp. 8.875%, 09/15/2014 | 725,000 | 708,687 | ||||||
| Cascades, Inc. 7.875%, 01/15/2020 (b) | 150,000 | 153,000 | ||||||
| Crown Americas LLC / Crown Americas Capital Corp. 7.750%, 11/15/2015 | 775,000 | 806,000 | ||||||
| 7.625%, 05/15/2017 (b) | 75,000 | 78,187 | ||||||
| Graham Packaging Co. LP / GPC Capital Corp. I 8.250%, 01/01/2017 (b) | 375,000 | 372,187 | ||||||
| Graphic Packaging International Corp. 9.500%, 08/15/2013 | 775,000 | 804,063 | ||||||
| 9.500%, 06/15/2017 | 250,000 | 266,250 | ||||||
| Greif, Inc. 7.750%, 08/01/2019 | 475,000 | 486,875 | ||||||
| Owens-Brockway Glass Container, Inc. 8.250%, 05/15/2013 | 500,000 | 516,250 | ||||||
| 7.375%, 05/15/2016 | 200,000 | 207,500 | ||||||
| Rock-Tenn Co. 9.250%, 03/15/2016 | 250,000 | 272,813 | ||||||
| 9.250%, 03/15/2016 (b) | 200,000 | 218,250 | ||||||
| Sealed Air Corp 7.875%, 06/15/2017 (b) | 100,000 | 106,667 | ||||||
| 5,605,354 | ||||||||
Metals & Mining – 1.2% | ||||||||
| Aleris International, Inc. 9.000%, 12/15/2014 (Acquired 12/13/2006, Cost $175,000) (a) (d) | 175,000 | 1,351 | ||||||
| 10.000%, 12/15/2016 (Acquired 12/13/2006 and 05/30/2007, Cost $256,970) (a) (d) | 250,000 | 1,875 | ||||||
| Compass Minerals International, Inc. 8.000%, 06/01/2019 (b) | 150,000 | 155,250 | ||||||
| Freeport-McMoRan Copper & Gold, Inc. 8.375%, 04/01/2017 | 400,000 | 438,600 | ||||||
| Teck Resources Ltd. 9.750%, 05/15/2014 | 125,000 | 144,844 | ||||||
| 10.250%, 05/15/2016 | 825,000 | 965,250 | ||||||
| 10.750%, 05/15/2019 | 150,000 | 180,000 | ||||||
| 1,887,170 | ||||||||
Paper & Forest Products – 1.7% | ||||||||
| Boise Paper Holdings LLC / Boise Finance Co. 9.000%, 11/01/2017 (b) | 600,000 | 624,750 | ||||||
| Clearwater Paper Corp. 10.625%, 06/15/2016 (b) | 125,000 | 140,156 | ||||||
(continued)
106
Ohio National Fund, Inc.
High Income Bond Portfolio (Continued)
High Income Bond Portfolio (Continued)
| Schedule of Investments | December 31, 2009 |
| Face | ||||||||
| Corporate Bonds – 97.5% | Amount | Value | ||||||
Paper & Forest Products (continued) | ||||||||
| Georgia-Pacific LLC 8.250%, 05/01/2016 (b) | $ | 900,000 | $ | 958,500 | ||||
| NewPage Corp. 10.000%, 05/01/2012 | 300,000 | 216,000 | ||||||
| 12.000%, 05/01/2013 | 425,000 | 217,281 | ||||||
| 11.375%, 12/31/2014 (b) | 250,000 | 253,750 | ||||||
| PE Paper Escrow GmbH 12.000%, 08/01/2014 (b) | 375,000 | 415,110 | ||||||
| 2,825,547 | ||||||||
TOTAL MATERIALS | 15,089,085 | |||||||
TELECOMMUNICATION SERVICES – 6.0% | ||||||||
Diversified Telecommunication Services – 1.9% | ||||||||
| Clear Channel Worldwide Holdings, Inc. 9.250%, 12/15/2017 (b) | 75,000 | 76,875 | ||||||
| 9.250%, 12/15/2017 (b) | 300,000 | 310,500 | ||||||
| GXS Worldwide Inc. 9.750%, 06/15/2015 (b) | 500,000 | 493,750 | ||||||
| Inmarsat Finance PLC 7.375%, 12/01/2017 (b) | 175,000 | 179,812 | ||||||
| Qwest Corp. 8.875%, 03/15/2012 | 800,000 | 864,000 | ||||||
| 8.375%, 05/01/2016 | 50,000 | 53,875 | ||||||
| SBA Telecommunications, Inc. 8.000%, 08/15/2016 (b) | 325,000 | 341,250 | ||||||
| 8.250%, 08/15/2019 (b) | 125,000 | 133,125 | ||||||
| Wind Acquisition Finance S.A. 11.750%, 07/15/2017 (b) | 525,000 | 576,188 | ||||||
| 3,029,375 | ||||||||
Wireless Telecommunication Services – 4.1% | ||||||||
| CC Holdings GS V LLC / Crown Castle GS III Corp. 7.750%, 05/01/2017 (b) | 75,000 | 80,250 | ||||||
| Crown Castle International Corp. 9.000%, 01/15/2015 | 75,000 | 80,250 | ||||||
| Digicel Group Ltd. 12.000%, 04/01/2014 (b) | 500,000 | 557,500 | ||||||
| 8.875%, 01/15/2015 (b) | 425,000 | 414,375 | ||||||
| 9.125%, 01/15/2015 (b) | 487,000 | 482,130 | ||||||
| 8.250%, 09/01/2017 (b) | 150,000 | 147,000 | ||||||
| MetroPCS Wireless, Inc. 9.250%, 11/01/2014 | 125,000 | 127,187 | ||||||
| 9.250%, 11/01/2014 | 1,025,000 | 1,042,937 | ||||||
| Nextel Communications, Inc. 7.375%, 08/01/2015 | 900,000 | 879,750 | ||||||
| Sprint Capital Corp. 6.900%, 05/01/2019 | 1,850,000 | 1,711,250 | ||||||
| Sprint Nextel Corp. 6.000%, 12/01/2016 | 725,000 | 665,188 | ||||||
| 8.375%, 08/15/2017 | 325,000 | 333,125 | ||||||
| 6,520,942 | ||||||||
TOTAL TELECOMMUNICATION SERVICES | 9,550,317 | |||||||
UTILITIES – 3.1% | ||||||||
Electric Utilities – 1.2% | ||||||||
| Edison Mission Energy 7.750%, 06/15/2016 | 250,000 | 213,750 | ||||||
| 7.000%, 05/15/2017 | 500,000 | 397,500 | ||||||
| NV Energy, Inc. 6.750%, 08/15/2017 | 425,000 | 416,196 | ||||||
| Texas Competitive Electric Holdings Co. LLC 10.250%, 11/01/2015 | 1,100,000 | 896,500 | ||||||
| 1,923,946 | ||||||||
Gas Utilities – 0.5% | ||||||||
| AmeriGas Partners LP 7.250%, 05/20/2015 | 425,000 | 427,125 | ||||||
| 7.125%, 05/20/2016 | 400,000 | 402,000 | ||||||
| 829,125 | ||||||||
Independent Power Producers & Energy Traders – 1.3% | ||||||||
| Dynegy Holdings, Inc. 7.750%, 06/01/2019 | 650,000 | 567,125 | ||||||
| Energy Future Competitive Holdings Co. 10.875%, 11/01/2017 | 100,000 | 82,250 | ||||||
| NRG Energy, Inc. 7.250%, 02/01/2014 | 375,000 | 380,625 | ||||||
| 7.375%, 02/01/2016 | 775,000 | 777,906 | ||||||
| 7.375%, 01/15/2017 | 200,000 | 201,000 | ||||||
| 2,008,906 | ||||||||
Multi-Utilities – 0.1% | ||||||||
| FPL Energy National Wind Portfolio 6.125%, 03/25/2019 (b) | 252,169 | 239,559 | ||||||
TOTAL UTILITIES | 5,001,536 | |||||||
Total Corporate Bonds (Cost $153,956,212) | $ | 155,899,760 | ||||||
| Face | ||||||||
| Convertible Bonds – 0.5% | Amount | Value | ||||||
INDUSTRIALS – 0.5% | ||||||||
Professional Services – 0.5% | ||||||||
| School Specialty, Inc. 3.750%, 08/01/2023 | $ | 550,000 | $ | 542,437 | ||||
| 3.750%, 11/30/2026 | 225,000 | 214,594 | ||||||
Total Convertible Bonds (Cost $658,028) | $ | 757,031 | ||||||
| Preferred Stocks – 0.2% | Shares | Value | ||||||
FINANCIALS – 0.2% | ||||||||
Consumer Finance – 0.2% | ||||||||
| GMAC, Inc. (b) | 346 | $ | 228,079 | |||||
Total Preferred Stocks (Cost $0) | $ | 228,079 | ||||||
(continued)
107
Ohio National Fund, Inc.
High Income Bond Portfolio (Continued)
High Income Bond Portfolio (Continued)
| Schedule of Investments | December 31, 2009 |
| Common Stocks – 0.1% | Shares | Value | ||||||
INDUSTRIALS – 0.1% | ||||||||
Building Products – 0.1% | ||||||||
| Nortek, Inc. (Private Company) (a) | 5,618 | $ | 199,439 | |||||
Total Common Stocks (Cost $197,541) | $ | 199,439 | ||||||
| Warrants – 0.0% | Quantity | Value | ||||||
CONSUMER DISCRETIONARY – 0.0% | ||||||||
Media – 0.0% | ||||||||
| Sirius XM Radio, Inc. | ||||||||
| Expiration: March 2010, Exercise Price: $9.83 (a) | 50 | $ | 31 | |||||
Total Warrants (Cost $0) | $ | 31 | ||||||
| Money Market Funds – 0.5% | Shares | Value | ||||||
| Fidelity Institutional Money Market Funds Money Market Portfolio – Class I | 867,000 | $ | 867,000 | |||||
Total Money Market Funds (Cost $867,000) | $ | 867,000 | ||||||
Total Investments (Cost $155,678,781) – 98.8% (f) | $ | 157,951,340 | ||||||
Other Assets in Excess of Liabilities – 1.2% | 1,955,869 | |||||||
Net Assets – 100.0% | $ | 159,907,209 | ||||||
Percentages are stated as a percent of net assets.
Footnotes:
| (a) | Non-income producing security. | |
| (b) | Security exempt from registration under Regulation D of the Securities Act of 1933. These securities may be resold in transactions exempt from registration, normally to qualified buyers. At December 31, 2009, the value of these securities totaled $47,815,087 or 29.9% of the Portfolio’s net assets. Unless otherwise noted by (e) below, these securities were deemed liquid pursuant to procedures approved by the Board of Directors. | |
| (c) | Security is a variable rate instrument in which the coupon rate is adjusted quarterly or semi-annually in concert with U.S. LIBOR. Interest rates stated are those in effect at December 31, 2009. | |
| (d) | Represents a security that is in default. Unless otherwise noted by (e) below, these securities were deemed liquid pursuant to procedures approved by the Board of Directors. | |
| (e) | Represents a security deemed to be illiquid. At December 31, 2009, the value of illiquid securities in the Portfolio totaled $131,417 or 0.1% of the Portfolio’s net assets. | |
| (f) | Represents cost for financial reporting purposes, which may differ from cost basis for Federal income tax purposes. See also Note 8 of the Notes to Financial Statements. |
The accompanying notes are an integral part of these financial statements.
108
Ohio National Fund, Inc.
High Income Bond Portfolio
High Income Bond Portfolio
Statement of Assets and Liabilities
December 31, 2009
| Assets: | ||||
| Investments in securities, at value (Cost $155,678,781) | $ | 157,951,340 | ||
| Cash | 3,342 | |||
| Receivable for securities sold | 783,481 | |||
| Receivable for fund shares sold | 90,079 | |||
| Dividends and accrued interest receivable | 3,061,617 | |||
| Prepaid expenses and other assets | 254 | |||
| Total assets | 161,890,113 | |||
| Liabilities: | ||||
| Payable for securities purchased | 72,841 | |||
| Payable for fund shares redeemed | 1,767,896 | |||
| Payable for investment management services | 97,100 | |||
| Payable for compliance services | 1,677 | |||
| Accrued custody expense | 800 | |||
| Accrued professional fees | 11,299 | |||
| Accrued accounting fees | 20,496 | |||
| Accrued printing and filing fees | 10,795 | |||
| Total liabilities | 1,982,904 | |||
| Net assets | $ | 159,907,209 | ||
| Net assets consist of: | ||||
| Par value, $1 per share | $ | 14,819,966 | ||
| Paid-in capital in excess of par value | 135,679,408 | |||
| Accumulated net realized loss on investments | (3,332,103 | ) | ||
| Net unrealized appreciation on investments | 2,272,559 | |||
| Undistributed net investment income | 10,467,379 | �� | ||
| Net assets | $ | 159,907,209 | ||
| Shares outstanding | 14,819,966 | |||
| Authorized Fund shares allocated to Portfolio | 25,000,000 | |||
| Net asset value per share | $ | 10.79 | ||
Statement of Operations
For the Year Ended December 31, 2009
| Investment income: | ||||
| Interest | $ | 11,448,946 | ||
| Dividends | 21,630 | |||
| Other income | 244 | |||
| Total investment income | 11,470,820 | |||
| Expenses: | ||||
| Management fees | 837,627 | |||
| Custodian fees | 9,409 | |||
| Directors’ fees | 12,300 | |||
| Professional fees | 18,575 | |||
| Accounting fees | 97,806 | |||
| Printing and filing fees | 21,075 | |||
| Compliance expense | 6,376 | |||
| Other | 273 | |||
| Total expenses | 1,003,441 | |||
| Net investment income | 10,467,379 | |||
| Realized/unrealized gain (loss) on investments: | ||||
| Net realized gain (loss) on investments | (967,160 | ) | ||
| Change in unrealized appreciation/depreciation on investments | 34,205,835 | |||
| Net realized/unrealized gain (loss) on investments | 33,238,675 | |||
| Change in net assets from operations | $ | 43,706,054 | ||
The accompanying notes are an integral part of these financial statements.
109
Ohio National Fund, Inc.
High Income Bond Portfolio
High Income Bond Portfolio
Statements of Changes in Net Assets
| Years Ended December 31, | ||||||||
| 2009 | 2008 | |||||||
Increase (Decrease) in Net Assets: | ||||||||
| Operations: | ||||||||
| Net investment income | $ | 10,467,379 | $ | 7,174,182 | ||||
| Net realized gain (loss) on investments | (967,160 | ) | (516,850 | ) | ||||
| Change in unrealized appreciation/depreciation on investments | 34,205,835 | (29,655,248 | ) | |||||
| Change in net assets from operations | 43,706,054 | (22,997,916 | ) | |||||
| Capital transactions: | ||||||||
| Received from shares sold | 89,610,175 | 46,469,522 | ||||||
| Paid for shares redeemed | (44,752,454 | ) | (41,091,673 | ) | ||||
| Change in net assets from capital transactions | 44,857,721 | 5,377,849 | ||||||
| Change in net assets | 88,563,775 | (17,620,067 | ) | |||||
Net Assets: | ||||||||
| Beginning of year | 71,343,434 | 88,963,501 | ||||||
| End of year | $ | 159,907,209 | $ | 71,343,434 | ||||
| Undistributed net investment income | $ | 10,467,379 | $ | 7,174,182 | ||||
Financial Highlights
| Years Ended December 31, | ||||||||||||||||||||
| 2009 | 2008 | 2007 | 2006 | 2005 | ||||||||||||||||
Selected Per-Share Data: | ||||||||||||||||||||
| Net asset value, beginning of year | $ | 7.21 | $ | 9.68 | $ | 9.35 | $ | 8.49 | $ | 8.65 | ||||||||||
| Operations: | ||||||||||||||||||||
| Net investment income | 0.46 | 0.68 | 0.59 | 0.47 | 0.60 | (a) | ||||||||||||||
| Net realized and unrealized gain (loss) on investments and foreign currency related transactions | 3.12 | (3.15 | ) | (0.26 | ) | 0.39 | (0.34 | ) | ||||||||||||
| Total from operations | 3.58 | (2.47 | ) | 0.33 | 0.86 | 0.26 | ||||||||||||||
| Distributions: | ||||||||||||||||||||
| Distributions from net investment income | — | — | — | — | (0.42 | ) | ||||||||||||||
| Net asset value, end of year | $ | 10.79 | $ | 7.21 | $ | 9.68 | $ | 9.35 | $ | 8.49 | ||||||||||
Total return | 49.65 | % | –25.52 | % | 3.53 | % | 10.13 | % | 2.99 | % | ||||||||||
Ratios and supplemental data: | ||||||||||||||||||||
| Net assets at end of year (millions) | $ | 159.9 | $ | 71.3 | $ | 89.0 | $ | 74.3 | $ | 54.0 | ||||||||||
| Ratios to average net assets: | ||||||||||||||||||||
| Expenses | 0.88 | % | 0.88 | % | 0.87 | % | 0.91 | % | 0.97 | % | ||||||||||
| Net investment income | 9.14 | % | 8.77 | % | 7.05 | % | 7.12 | % | 6.89 | % | ||||||||||
| Portfolio turnover rate | 20 | % | 18 | % | 32 | % | 32 | % | 36 | % | ||||||||||
| (a) | Calculated using the average daily shares method. |
The accompanying notes are an integral part of these financial statements.
110
Ohio National Fund, Inc.
Capital Growth Portfolio
Capital Growth Portfolio
Objective/Strategy
The Capital Growth Portfolio seeks long-term capital appreciation by investing in and actively managing equity securities of small-cap growth companies.
Performance as of December 31, 2009
Average Annual Total Returns: | ||||
| One year | 35.27% | |||
| Five years | 3.37% | |||
| Ten years | -3.17% |
Past performance does not guarantee future results. The performance data quoted represents past performance and current returns may be lower or higher. Total return figures include change in share price and reinvestment of dividends and capital gains. The investment return and principal value will fluctuate so that an investor’s shares, when redeemed may be worth more or less than the original cost. To obtain performance information up to the most recent month end, call toll-free 1-877-781-6392.
The Portfolio is not open to direct retail investment. Beneficial interest in shares is obtained solely by purchase of variable life insurance policies and variable annuity contracts. Actual performance results for variable annuity and variable universal life contracts will be lower due to contract charges. Consult your contract for applicable charges.
Comments
For the year ended December 31, 2009, the Capital Growth Portfolio returned 35.27% versus 34.47% for the current benchmark, the Russell 2000 Growth Index.
The Portfolio out-performed the benchmark index during 2009. On an absolute basis, Materials, Energy, Consumer Discretionary, Consumer Staples and Information Technology were each up more than 50 percent during 2009. On a relative basis, Energy, Materials and Consumer Staples were positive contributors to out-performance. Strong stock selection benefited each of these sectors and an over-weight position in Materials magnified out-performance in that sector.(1)
Our five strongest stocks for the year were Huntsman Corp., Rovi Corp., American Medical Systems Holdings, Inc., Terra Industries, Inc. and Compellent Technologies, Inc. Chemical producer Huntsman Corp. remained our best overall stock for the year (it returned more than 250 percent for 2009). This highly cyclical company rose in anticipation of an economic recovery and due to its cost-reduction program. Rovi Corp., a provider of solutions that enable digital-product protection, had strong performance during the first three quarters of the year due to excitement about a significant new contract, strong financial performance and increased guidance. American Medical Systems Holdings, Inc. has benefited this year from increased new-product flow, increased operational efficiency and the addition of new management resulting in improving margins and growth rate. Despite weaker crop prices and demand for nitrogen fertilizer, Terra Industries, Inc. benefited from lower costs due to depressed natural-gas prices and is the subject of a hostile takeover attempt by rival fertilizer producer CF Industries. Compellent Technologies, Inc. demonstrated exceptional growth, consistency and execution during 2009 as mid-sized customers sought out the feature-rich, efficient storage appliances that Compellent Technologies, Inc. provides. The company has also lined up several channel partners to help gain larger business customers, likely resulting in continued market share gains in 2010.(1)
On an absolute basis, Financials traded down during the year while Health Care, Financials and Information Technology detracted from relative returns. Health Care returns were most significantly impacted by the negative performance of medical-device producer Thoratec Corp. The Financials sector was dragged down by our investment in First Commonwealth Financial Corp. while EMS Technologies, Inc. damaged Information Technology returns.(1)
The five lagging stocks for the year were EMS Technologies, Inc., Thoratec Corp., Northwest Pipe Co., Texas Industries, Inc. and First Commonwealth Financial Corp. Telecommunications company EMS Technologies, Inc. declined after it announced lower-than-expected earnings and muted guidance due to the challenging economic environment; however, we continue to hold the stock because the company has implemented what we view as an important management change. Thoratec Corp. traded down slightly during the year but it had a particularly strong effect overall due to its heavy weighting in the Portfolio. We continue to hold the stock because we believe the company will out-perform due to continued strong financial results, FDA approval for a label expansion and potential pipeline announcements. Shares of Northwest Pipe Co. fell after the company pre-announced disappointing third-quarter results and delayed filing its financial reports due to an ongoing investigation in accounting irregularities. We continue to hold the stock due to favorable prospects for its end markets in 2010 and we believe the stock’s current valuation is well below replacement cost and appears to more than adequately discount the risks associated with an accounting restatement. We sold Texas Industries, Inc., a cement producer, during the first quarter when we became concerned about the continued construction downturn and did not feel that the federal economic-stimulus bill would benefit the industry as much as originally anticipated. First Commonwealth Financial Corp. shares have suffered as the bank has struggled with exposure to out-of-market real estate loans. The shares have traded below tangible book value, which we feel is due to an overestimation of the bank’s likely loan-loss exposure. We hope to see a boost in the share price when First Commonwealth Financial Corp. announces the hiring of a new chief financial officer.(1)
Continued government stimulus, stabilization of home prices, strong growth from emerging markets as well as easy economic comparisons should — in our view — lead to further strength in equity markets. We believe government policy will keep short-term rates low through the mid-term elections with maybe some increase in long-term rates. Over the long term, we believe government spending will be somewhat inflationary and, while we don’t take very large sector bets, we have established a modest over-weight in hard commodities (e.g., oil and materials). We are under-weighted in Consumer Staples because we have trouble finding growth-oriented companies in that sector that also allow us to maintain our valuation discipline.(1)
(continued)
111
Ohio National Fund, Inc.
Capital Growth Portfolio (Continued)
Capital Growth Portfolio (Continued)
We have upgraded our view of the Energy sector to positive because we now believe the outlook for natural gas is set to improve while oil prices should continue to remain strong. Natural-gas inventories remain high but the surplus is slowly being worked off and industrial demand has shown gradual improvement as the economic recovery gathers steam. Our current energy holdings are predominantly tied to oil but we may look to increase our natural-gas exposure.(1)
We remain optimistic about the Industrials sector and continue to favor companies with cyclical exposure to an improving global economy. Aggressive cost-cutting and inventory re-stocking should, in our view, help drive meaningful earnings growth from severely depressed levels. In Industrials, we continue to hold transportation stocks as an early-cycle play on an economic recovery. Specifically, we own Landstar System, Inc., which we believe should see strong earnings growth due to substantial operating leverage as freight volumes improve.(1)
We remain over-weighted in the Materials sector and continue to hold companies (e.g., Huntsman Corp.) that have what we believe to be higher growth potential in emerging economies and that could see a recovery in volumes as inventories are re-stocked.
Recessionary fallout continues to affect many financial stocks in the form of higher credit costs. We believe many financial companies may use the fourth quarter as a chance to “clear the decks” of their balance sheets by writing down troubled assets. Companies like optionsXpress Holdings Inc. generate more cash flow than needed and should benefit from an eventual increase in short-term interest rates as it earns interest on customer cash balances.(1)
We are now in the late stages of the healthcare-reform battle and have much better vision of what may be included in any healthcare bill. The Senate recently passed its version, which will now be reconciled with the House bill before going to the President. If the final piece of legislation resembles the Senate bill, we believe the following companies should benefit from healthcare reform: 1) those that provide electronic health-record systems (e.g., Quality Systems, Inc. and Eclipsys Corp.); 2) those that improve hospitals’ profitability by cutting costs and improving collections (e.g., MedAssets, Inc.); 3) those that provide cost-effective solutions to large unmet medical needs (e.g., Thoratec Corp.); and 4) those that provide managed-care services to states for their Medicaid programs (e.g., Centene Corp.), since Medicaid will be a primary way the government covers the uninsured.(1)
Consumer Discretionary stocks had another surprisingly good quarter in the face of continued high unemployment and tight consumer credit. We remain over-weighted in gaming-equipment suppliers (e.g., Bally Technologies, Inc. and Shuffle Master, Inc.) because we believe they will benefit from the expansion of gaming spurred by states’ weak tax revenues. American Axle & Manufacturing Holdings, Inc., a new holding, is benefiting from a recovery in the auto industry.(1)
In the Information Technology sector, we remain cautiously optimistic that consumer and business demand will strengthen throughout 2010. Stocks already have discounted much of the recovery based in part on the dramatic cost-cutting seen in the early part of 2009. Nevertheless, we believe there is still opportunity for increased demand to result in solid revenue growth, in turn leading to continued margin expansion and strong earnings growth in 2010. We may rotate more into mid-cycle stocks that are leveraged to improved industrial markets and employment growth. For example, we expect Informatica Corp., a provider of middleware integration software, to demonstrate strong secular growth.(1)
| (1) | The Portfolio’s composition is subject to change. Holdings and weightings are as of December 31, 2009. |
Change in Value of $10,000 Investment
![[PERFORMANCE GRAPH]](https://capedge.com/proxy/N-CSR/0000950123-10-021904/l38589l3858950.gif)
Hypothetical illustration based on past performance. Future performance will vary. The Portfolio’s returns reflect reinvested dividends. The Portfolio’s holdings may differ significantly from the securities in the index. The index is unmanaged and therefore does not reflect the cost of portfolio management and accounting.
The Russell 2000 Growth Index is a market-weighted total return index that measures the performance of companies within the Russell 2000 Index having higher price-to-book ratios and higher forecasted growth values. The Russell 2000 Index includes the 2000 firms from the Russell 3000 Index with the smallest market capitalizations. The Russell 3000 Index represents 98% of the investable U.S. equity market. The index presented herein includes the effects of reinvested dividends.
(continued)
112
Ohio National Fund, Inc.
Capital Growth Portfolio (Continued)
Capital Growth Portfolio (Continued)
Portfolio Composition as of December 31, 2009 (1)
| % of Net Assets | |||
Common Stocks (3) | 99.2 | ||
| Money Market Funds | |||
| Less Net Liabilities | 0.8 | ||
| 100.0 | |||
Top 10 Portfolio Holdings as of December 31, 2009 (1) (2)
| % of Net Assets | |||||||
| 1. | Huntsman Corp. | 3.4 | |||||
| 2. | Cash America International, Inc. | 3.2 | |||||
| 3. | Lufkin Industries, Inc. | 2.8 | |||||
| 4. | Thoratec Corp. | 2.7 | |||||
| 5. | Genesco, Inc. | 2.5 | |||||
| 6. | Varian Semiconductor Equipment Associates, Inc. | 2.5 | |||||
| 7. | Rovi Corp. | 2.4 | |||||
| 8. | American Medical Systems Holdings, Inc. | 2.3 | |||||
| 9. | DTS, Inc. | 2.2 | |||||
| 10. | Bally Technologies, Inc. | 2.2 | |||||
| (1) | Composition of Portfolio subject to change. | |
| (2) | Short-term investments have been excluded from the list of Top 10 Portfolio holdings. | |
| (3) | Sectors: |
| % of Net Assets | |||
| Information Technology | 25.7 | ||
| Health Care | 23.8 | ||
| Consumer Discretionary | 16.2 | ||
| Industrials | 14.6 | ||
| Financials | 6.6 | ||
| Energy | 5.9 | ||
| Materials | 5.5 | ||
| Consumer Staples | 0.9 | ||
| 99.2 | |||
113
Ohio National Fund, Inc.
Capital Growth Portfolio
Capital Growth Portfolio
| Schedule of Investments | December 31, 2009 |
| Common Stocks – 99.2% | Shares | Value | ||||||
CONSUMER DISCRETIONARY – 16.2% | ||||||||
Auto Components – 1.0% | ||||||||
| American Axle & Manufacturing Holdings, Inc. (a) | 46,235 | $ | 370,805 | |||||
Diversified Consumer Services – 2.9% | ||||||||
| Coinstar, Inc. (a) | 21,176 | 588,269 | ||||||
| Sotheby’s | 21,535 | 484,107 | ||||||
| 1,072,376 | ||||||||
Hotels, Restaurants & Leisure – 6.5% | ||||||||
| Bally Technologies, Inc. (a) | 19,750 | 815,478 | ||||||
| BJ’s Restaurants, Inc. (a) | 34,140 | 642,515 | ||||||
| Choice Hotels International, Inc. | 5,550 | 175,713 | ||||||
| Shuffle Master, Inc. (a) | 62,081 | 511,547 | ||||||
| Steak N Shake Co. / The (a) | 778 | 252,165 | ||||||
| 2,397,418 | ||||||||
Household Durables – 2.1% | ||||||||
| Universal Electronics, Inc. (a) | 33,666 | 781,724 | ||||||
Specialty Retail – 3.7% | ||||||||
| Genesco, Inc. (a) | 34,156 | 937,924 | ||||||
| Vitamin Shoppe, Inc. (a) | 18,038 | 401,165 | ||||||
| 1,339,089 | ||||||||
TOTAL CONSUMER DISCRETIONARY | 5,961,412 | |||||||
CONSUMER STAPLES – 0.9% | ||||||||
Personal Products – 0.9% | ||||||||
| Herbalife Ltd. | 8,595 | 348,699 | ||||||
TOTAL CONSUMER STAPLES | 348,699 | |||||||
ENERGY – 5.9% | ||||||||
Energy Equipment & Services – 4.6% | ||||||||
| Lufkin Industries, Inc. | 14,035 | 1,027,362 | ||||||
| OYO Geospace Corp. (a) | 15,500 | 664,795 | ||||||
| 1,692,157 | ||||||||
Oil, Gas & Consumable Fuels – 1.3% | ||||||||
| Whiting Petroleum Corp. (a) | 6,845 | 489,075 | ||||||
TOTAL ENERGY | 2,181,232 | |||||||
FINANCIALS – 6.6% | ||||||||
Capital Markets – 1.7% | ||||||||
| Broadpoint Gleacher Securities, Inc. (a) | 27,040 | 120,598 | ||||||
| Duff & Phelps Corp. Class A | 18,135 | 331,145 | ||||||
| optionsXpress Holdings Inc. | 10,760 | 166,242 | ||||||
| 617,985 | ||||||||
Commercial Banks – 1.0% | ||||||||
| First Commonwealth Financial Corp. | 31,175 | 144,964 | ||||||
| UMB Financial Corp. | 5,200 | 204,620 | ||||||
| 349,584 | ||||||||
Consumer Finance – 3.2% | ||||||||
| Cash America International, Inc. | 33,550 | 1,172,908 | ||||||
Real Estate Investment Trusts – 0.7% | ||||||||
| Redwood Trust, Inc. | 19,101 | 276,201 | ||||||
TOTAL FINANCIALS | 2,416,678 | |||||||
HEALTH CARE – 23.8% | ||||||||
Biotechnology – 3.9% | ||||||||
| BioMarin Pharmaceutical, Inc. (a) | 25,875 | 486,709 | ||||||
| Cubist Pharmaceuticals, Inc. (a) | 9,633 | 182,738 | ||||||
| Onyx Pharmaceuticals, Inc. (a) | 11,175 | 327,874 | ||||||
| Regeneron Pharmaceuticals, Inc. (a) | 11,115 | 268,761 | ||||||
| Seattle Genetics Inc. (a) | 16,225 | 164,846 | ||||||
| 1,430,928 | ||||||||
Health Care Equipment & Supplies – 5.8% | ||||||||
| American Medical Systems Holdings, Inc. (a) | 44,410 | 856,669 | ||||||
| Cutera, Inc. (a) | 18,335 | 156,031 | ||||||
| SurModics, Inc. (a) | 6,500 | 147,290 | ||||||
| Thoratec Corp. (a) | 36,758 | 989,525 | ||||||
| 2,149,515 | ||||||||
Health Care Providers & Services – 6.7% | ||||||||
| Addus HomeCare Corp. (a) | 8,905 | 81,926 | ||||||
| Amedisys, Inc. (a) | 12,335 | 598,988 | ||||||
| Centene Corp. (a) | 20,730 | 438,854 | ||||||
| Genoptix, Inc. (a) | 14,918 | 530,036 | ||||||
| Lincare Holdings, Inc. (a) | 12,909 | 479,182 | ||||||
| Psychiatric Solutions, Inc. (a) | 15,293 | 323,294 | ||||||
| 2,452,280 | ||||||||
Health Care Technology – 5.0% | ||||||||
| Eclipsys Corp. (a) | 38,287 | 709,075 | ||||||
| MedAssets, Inc. (a) | 16,091 | 341,290 | ||||||
| Quality Systems, Inc. | 9,203 | 577,857 | ||||||
| Vital Images, Inc. (a) | 16,815 | 213,382 | ||||||
| 1,841,604 | ||||||||
Life Sciences Tools & Services – 2.0% | ||||||||
| Bio-Rad Laboratories, Inc. (a) | 3,805 | 367,031 | ||||||
| ICON PLC – ADR (a) | 16,314 | 354,503 | ||||||
| 721,534 | ||||||||
Pharmaceuticals – 0.4% | ||||||||
| Vivus, Inc. (a) | 16,525 | 151,865 | ||||||
TOTAL HEALTH CARE | 8,747,726 | |||||||
INDUSTRIALS – 14.6% | ||||||||
Commercial Services & Supplies – 5.3% | ||||||||
| GEO Group, Inc. / The (a) | 35,135 | 768,754 | ||||||
| Ritchie Bros. Auctioneers, Inc. | 28,500 | 639,255 | ||||||
| Waste Connections, Inc. (a) | 16,783 | 559,545 | ||||||
| 1,967,554 | ||||||||
Construction & Engineering – 1.8% | ||||||||
| MasTec, Inc. (a) | 18,195 | 227,437 | ||||||
| Northwest Pipe Co. (a) | 15,825 | 425,060 | ||||||
| 652,497 | ||||||||
Electrical Equipment – 4.1% | ||||||||
| A123 Systems, Inc. (a) | 17,140 | 384,622 | ||||||
| GrafTech International Ltd. (a) | 29,975 | 466,111 | ||||||
| Regal-Beloit Corp. | 12,602 | 654,548 | ||||||
| 1,505,281 | ||||||||
(continued)
114
Ohio National Fund, Inc.
Capital Growth Portfolio (Continued)
Capital Growth Portfolio (Continued)
| Schedule of Investments | December 31, 2009 |
| Common Stocks – 99.2% | Shares | Value | ||||||
Marine – 0.8% | ||||||||
| Genco Shipping & Trading Ltd. (a) | 14,085 | $ | 315,222 | |||||
Professional Services – 1.0% | ||||||||
| Monster Worldwide, Inc. (a) | 20,335 | 353,829 | ||||||
Road & Rail – 1.6% | ||||||||
| Landstar System, Inc. | 15,285 | 592,600 | ||||||
TOTAL INDUSTRIALS | 5,386,983 | |||||||
INFORMATION TECHNOLOGY – 25.7% | ||||||||
Communications Equipment – 1.0% | ||||||||
| EMS Technologies, Inc. (a) | 26,106 | 378,537 | ||||||
Computers & Peripherals – 3.2% | ||||||||
| Compellent Technologies, Inc. (a) | 34,917 | 791,918 | ||||||
| Netezza Corp. (a) | 37,955 | 368,163 | ||||||
| 1,160,081 | ||||||||
Electronic Equipment, Instruments & Components – 4.3% | ||||||||
| Coherent, Inc. (a) | 24,750 | 735,817 | ||||||
| DTS, Inc. (a) | 23,976 | 820,219 | ||||||
| 1,556,036 | ||||||||
Semiconductors & Semiconductor Equipment – 7.8% | ||||||||
| FormFactor, Inc. (a) | 29,908 | 650,798 | ||||||
| ON Semiconductor Corp. (a) | 81,333 | 716,544 | ||||||
| Teradyne, Inc. (a) | 54,420 | 583,927 | ||||||
| Varian Semiconductor Equipment Associates, Inc. (a) | 25,865 | 928,036 | ||||||
| 2,879,305 | ||||||||
Software – 9.4% | ||||||||
| ANSYS, Inc. (a) | 18,485 | 803,358 | ||||||
| Informatica Corp. (a) | 28,130 | 727,442 | ||||||
| Novell, Inc. (a) | 48,074 | 199,507 | ||||||
| Radiant Systems, Inc. (a) | 16,785 | 174,564 | ||||||
| Rovi Corp. (a) | 27,185 | 866,386 | ||||||
| TIBCO Software, Inc. (a) | 72,241 | 695,681 | ||||||
| 3,466,938 | ||||||||
TOTAL INFORMATION TECHNOLOGY | 9,440,897 | |||||||
MATERIALS – 5.5% | ||||||||
Chemicals – 5.5% | ||||||||
| Huntsman Corp. | 109,921 | 1,241,008 | ||||||
| Terra Industries, Inc. | 23,880 | 768,697 | ||||||
TOTAL MATERIALS | 2,009,705 | |||||||
Total Common Stocks (Cost $29,464,864) | $ | 36,493,332 | ||||||
| Warrants – 0.0% | Quantity | Value | ||||||
INFORMATION TECHNOLOGY – 0.0% | ||||||||
Communications Equipment – 0.0% | ||||||||
| Lantronix, Inc. | ||||||||
| Expiration: February, 2011, | ||||||||
| Exercise Price: $28.08 (a) (b) | 305 | $ | — | |||||
Total Warrants (Cost $0) | $ | — | ||||||
| Money Market Funds – 1.0% | Shares | Value | ||||||
| Fidelity Institutional Money Market Funds | ||||||||
| Money Market Portfolio – Class I | 350,000 | $ | 350,000 | |||||
Total Money Market Funds (Cost $350,000) | $ | 350,000 | ||||||
Total Investments – 100.2% (Cost $29,814,864) (c) | $ | 36,843,332 | ||||||
Liabilities in Excess of Other Assets – (0.2)% | (59,505 | ) | ||||||
Net Assets – 100.0% | $ | 36,783,827 | ||||||
Percentages are stated as a percent of net assets.
Abbreviations:
ADR: American Depository Receipts
Footnotes:
| (a) | Non-income producing security. | |
| (b) | Market quotations for these investments were not readily available at December 31, 2009. As discussed in Note 2 of the Notes to Financial Statements, prices for these issues were derived from estimates of fair market value using methods determined in good faith by the Fund’s Pricing Committee under the supervision of the Board. At December 31, 2009 the value of these securities totaled $0 or 0.0% of the Portfolio’s net assets. | |
| (c) | Represents cost for financial reporting purposes, which may differ from cost basis for Federal income tax purposes. See also Note 8 of the Notes to Financial Statements. |
The accompanying notes are an integral part of these financial statements.
115
Ohio National Fund, Inc.
Capital Growth Portfolio
Capital Growth Portfolio
Statement of Assets and Liabilities
December 31, 2009
| Assets: | ||||
| Investments in securities, at value (Cost $29,814,864) | $ | 36,843,332 | ||
| Cash | 532 | |||
| Receivable for fund shares sold | 114,206 | |||
| Dividends and accrued interest receivable | 11,527 | |||
| Prepaid expenses and other assets | 579 | |||
| Total assets | 36,970,176 | |||
| Liabilities: | ||||
| Payable for securities purchased | 114,678 | |||
| Payable for fund shares redeemed | 25,778 | |||
| Payable for investment management services | 27,283 | |||
| Payable for compliance services | 1,677 | |||
| Accrued custody expense | 268 | |||
| Accrued professional fees | 11,131 | |||
| Accrued accounting fees | 3,135 | |||
| Accrued printing and filing fees | 2,399 | |||
| Total liabilities | 186,349 | |||
| Net assets | $ | 36,783,827 | ||
| Net assets consist of: | ||||
| Par value, $1 per share | $ | 1,812,753 | ||
| Paid-in capital in excess of par value | 42,967,548 | |||
| Accumulated net realized loss on investments | (15,029,618 | ) | ||
| Net unrealized appreciation on investments | 7,028,468 | |||
| Undistributed net investment income | 4,676 | |||
| Net assets | $ | 36,783,827 | ||
| Shares outstanding | 1,812,753 | |||
| Authorized Fund shares allocated to Portfolio | 5,000,000 | |||
| Net asset value per share | $ | 20.29 | ||
Statement of Operations
For the Year Ended December 31, 2009
| Investment income: | ||||
| Interest | $ | 2,738 | ||
| Dividends (net of withholding tax of $1,136) | 326,470 | |||
| Total investment income | 329,208 | |||
| Expenses: | ||||
| Management fees | 273,242 | |||
| Custodian fees | 4,543 | |||
| Directors’ fees | 3,187 | |||
| Professional fees | 13,474 | |||
| Accounting fees | 17,747 | |||
| Printing and filing fees | 5,174 | |||
| Compliance expense | 6,376 | |||
| Other | 789 | |||
| Total expenses | 324,532 | |||
| Net investment income | 4,676 | |||
| Realized/unrealized gain (loss) on investments: | ||||
| Net realized gain (loss) on investments | (2,009,614 | ) | ||
| Change in unrealized appreciation/depreciation on investments | 11,786,408 | |||
| Net realized/unrealized gain (loss) on investments | 9,776,794 | |||
| Change in net assets from operations | $ | 9,781,470 | ||
The accompanying notes are an integral part of these financial statements.
116
Ohio National Fund, Inc.
Capital Growth Portfolio
Capital Growth Portfolio
Statements of Changes in Net Assets
| Years Ended December 31, | ||||||||
| 2009 | 2008 | |||||||
Increase (Decrease) in Net Assets: | ||||||||
| Operations: | ||||||||
| Net investment income (loss) | $ | 4,676 | $ | (222,826 | ) | |||
| Net realized gain (loss) on investments | (2,009,614 | ) | (3,527,322 | ) | ||||
| Change in unrealized appreciation/depreciation on investments | 11,786,408 | (10,934,251 | ) | |||||
| Change in net assets from operations | 9,781,470 | (14,684,399 | ) | |||||
| Capital transactions: | ||||||||
| Received from shares sold | 10,662,186 | 15,704,298 | ||||||
| Paid for shares redeemed | (10,743,788 | ) | (12,143,882 | ) | ||||
| Change in net assets from capital transactions | (81,602 | ) | 3,560,416 | |||||
| Change in net assets | 9,699,868 | (11,123,983 | ) | |||||
Net Assets: | ||||||||
| Beginning of year | 27,083,959 | 38,207,942 | ||||||
| End of year | $ | 36,783,827 | $ | 27,083,959 | ||||
| Undistributed net investment income | $ | 4,676 | $ | — | ||||
Financial Highlights
| Years Ended December 31, | ||||||||||||||||||||
| 2009 | 2008 | 2007 | 2006 | 2005 | ||||||||||||||||
Selected Per-Share Data: | ||||||||||||||||||||
| Net asset value, beginning of year | $ | 15.00 | $ | 23.57 | $ | 21.19 | $ | 17.64 | $ | 17.19 | ||||||||||
| Operations: | ||||||||||||||||||||
| Net investment loss | — | (0.12 | ) | (0.16 | ) | (0.16 | ) | (0.14 | ) | |||||||||||
| Net realized and unrealized gain (loss) on investments | 5.29 | (8.45 | ) | 2.54 | 3.71 | 0.59 | ||||||||||||||
| Total from operations | 5.29 | (8.57 | ) | 2.38 | 3.55 | 0.45 | ||||||||||||||
| Net asset value, end of year | $ | 20.29 | $ | 15.00 | $ | 23.57 | $ | 21.19 | $ | 17.64 | ||||||||||
Total return | 35.27 | % | –36.36 | % | 11.23 | % | 20.12 | % | 2.62 | % | ||||||||||
Ratios and supplemental data: | ||||||||||||||||||||
| Net assets at end of year (millions) | $ | 36.8 | $ | 27.1 | $ | 38.2 | $ | 32.9 | $ | 28.2 | ||||||||||
| Ratios to average net assets: | ||||||||||||||||||||
| Expenses | 1.07 | % | 1.04 | % | 1.02 | % | 1.03 | % | 1.03 | % | ||||||||||
| Net investment income (loss) | 0.02 | % | –0.66 | % | –0.70 | % | –0.81 | % | –0.78 | % | ||||||||||
| Portfolio turnover rate | 67 | % | 63 | % | 63 | % | 69 | % | 52 | % | ||||||||||
The accompanying notes are an integral part of these financial statements.
117
Ohio National Fund, Inc.
Nasdaq-100® Index Portfolio
Nasdaq-100® Index Portfolio
Objective/Strategy
The Nasdaq-100® Index Portfolio seeks long-term growth of capital by investing primarily in stocks that are included in the Nasdaq-100® Index. Unlike other the other Portfolios of the Fund, the Nasdaq-100® Index Portfolio is a non-diversified portfolio for purposes of Section 5(b) of the Investment Company Act of 1940, as amended.
Performance as of December 31, 2009
Average Annual Total Returns: | ||||
| One year | 53.70% | |||
| Five years | 2.72% | |||
| Since inception (5/1/00) | -7.35% |
Past performance does not guarantee future results. The performance data quoted represents past performance and current returns may be lower or higher. Total return figures include change in share price and reinvestment of dividends and capital gains. The investment return and principal value will fluctuate so that an investor’s shares, when redeemed may be worth more or less than the original cost. To obtain performance information up to the most recent month end, call toll-free 1-877-781-6392.
The Portfolio is not open to direct retail investment. Beneficial interest in shares is obtained solely by purchase of variable life insurance policies and variable annuity contracts. Actual performance results for variable annuity and variable universal life contracts will be lower due to contract charges. Consult your contract for applicable charges.
Comments
For the year ended December 31, 2009, the Nasdaq-100® Index Portfolio returned 53.70% versus 54.63% for the current benchmark, the Nasdaq-100® Index.
The correlation to the benchmark index for the year was 99.8%. The high correlation is due to the fact that the Portfolio invests in each of the 100 stocks within the benchmark index. The Portfolio also invests in Powershares QQQ, an exchange traded fund that mimics the holdings and returns of the Nasdaq-100® Index.(1)
The top five stock holdings at year end were Apple, Inc., QUALCOMM, Inc., Microsoft Corp., Google, Inc., and Oracle Corp. The largest contributors for 2009 were Apple, Inc., Google. Inc. Class A, Microsoft Corp., Amazon.com, Inc., and QUALCOMM, Inc. The largest detractors for 2009 were Gilead Sciences, Inc., Genzyme Corp., Apollo Group, Inc. Class A, Cephalon, Inc., and Amgen, Inc.(1)
Equities had a very good second half of 2009. Going into 2010, the economy might face some headwinds. High unemployment will depress consumer consumption, and access to easy credit will remain tight. The Federal Reserve is expected to keep a stimulative economic policy for 2010 and into 2011 to keep the present economic momentum. Equities could see moderate growth in 2010.
| (1) | The Portfolio’s composition is subject to change. Holdings and weightings are as of December 31, 2009. |
The Nasdaq-100®, Nasdaq-100 Index®, and Nasdaq® are registered trademarks of The NASDAQ OMX Group, Inc. (which with its affiliates is referred to as “NASDAQ OMX”). Ohio National Investments, Inc. has licensed these marks for the Portfolio’s use. NASDAQ OMX has not passed on the Portfolio’s legality or suitability. NASDAQ OMX does not sponsor, endorse, sell or promote the Portfolio. NASDAQ OMX MAKES NO WARRANTIES AND BEARS NO LIABILITY WITH RESPECT TO THE PORTFOLIO.
Change in Value of $10,000 Investment
![[PERFORMANCE GRAPH]](https://capedge.com/proxy/N-CSR/0000950123-10-021904/l38589l3858951.gif)
Hypothetical illustration based on past performance. Future performance will vary. The Portfolio’s returns reflect reinvested dividends. The Portfolio’s holdings may differ significantly from the securities in the index. The index is unmanaged and therefore does not reflect the cost of portfolio management and accounting. Investors cannot invest in an index. Although they can invest in its underlying securities or funds.
The Nasdaq-100® Index is a modified capitalization-weighted index of the 100 largest domestic and international non-financial companies listed on the National Market tier of the NASDAQ stock market. The index presented herein includes the effects of reinvested dividends.
(continued)
118
Ohio National Fund, Inc.
Nasdaq-100® Index Portfolio (Continued)
Nasdaq-100® Index Portfolio (Continued)
Portfolio Composition as of December 31, 2009 (1)
| % of Net Assets | |||
Common Stocks (3) | 97.3 | ||
| Exchange Traded Funds | 3.4 | ||
| Commercial Paper | |||
| Less Net Liabilities | (0.7) | ||
| 100.0 | |||
Top 10 Portfolio Holdings as of December 31, 2009 (1) (2)
| % of Net Assets | |||||||
| 1. | Apple, Inc. | 15.1 | |||||
| 2. | QUALCOMM, Inc. | 5.3 | |||||
| 3. | Microsoft Corp. | 5.3 | |||||
| 4. | Google, Inc. Class A | 5.2 | |||||
| 5. | PowerShares QQQ | 3.4 | |||||
| 6. | Oracle Corp. | 2.9 | |||||
| 7. | Cisco Systems, Inc. | 2.8 | |||||
| 8. | Teva Pharmaceutical Industries, Ltd. – ADR | 2.4 | |||||
| 9. | Intel Corp. | 2.2 | |||||
| 10. | Amazon.com, Inc. | 2.2 | |||||
| (1) | Composition of Portfolio subject to change. | |
| (2) | Short-term investments have been excluded from the list of Top 10 Portfolio holdings. | |
| (3) | Sectors: |
| % of Net Assets | |||
| Information Technology | 61.4 | ||
| Health Care | 15.2 | ||
| Consumer Discretionary | 14.0 | ||
| Industrials | 4.0 | ||
| Telecommunication Services | 1.5 | ||
| Consumer Staples | 0.8 | ||
| Materials | 0.4 | ||
| 97.3 | |||
119
Ohio National Fund, Inc.
Nasdaq-100® Index Portfolio
Nasdaq-100® Index Portfolio
| Schedule of Investments | December 31, 2009 |
| Common Stocks – 97.3% | Shares | Value | ||||||
CONSUMER DISCRETIONARY – 14.0% | ||||||||
Diversified Consumer Services – 0.5% | ||||||||
| Apollo Group, Inc. Class A (a) | 4,250 | $ | 257,465 | |||||
Hotels, Restaurants & Leisure – 1.8% | ||||||||
| Starbucks Corp. (a) | 27,875 | 642,797 | ||||||
| Wynn Resorts Ltd. (a) | 3,625 | 211,084 | ||||||
| 853,881 | ||||||||
Household Durables – 0.3% | ||||||||
| Garmin Ltd. | 5,050 | 155,035 | ||||||
Internet & Catalog Retail – 3.5% | ||||||||
| Amazon.com, Inc. (a) | 7,775 | 1,045,893 | ||||||
| Expedia, Inc. (a) | 7,700 | 197,967 | ||||||
| Liberty Media Corp. – Interactive (a) | 14,800 | 160,432 | ||||||
| priceline.com, Inc. (a) | 1,250 | 273,125 | ||||||
| 1,677,417 | ||||||||
Leisure Equipment & Products – 0.5% | ||||||||
| Mattel, Inc. | 11,200 | 223,776 | ||||||
Media – 4.4% | ||||||||
| Comcast Corp. Class A | 39,097 | 659,175 | ||||||
| DIRECTV (a) | 18,875 | 629,481 | ||||||
| DISH Network Corp. | 5,835 | 121,193 | ||||||
| News Corp. Class A | 38,550 | 527,750 | ||||||
| Virgin Media Inc. | 9,125 | 153,574 | ||||||
| 2,091,173 | ||||||||
Multiline Retail – 0.6% | ||||||||
| Sears Holdings Corp. (a) | 3,275 | 273,299 | ||||||
Specialty Retail – 2.4% | ||||||||
| Bed Bath & Beyond, Inc. (a) | 9,575 | 369,882 | ||||||
| O’Reilly Automotive, Inc. (a) | 3,700 | 141,044 | ||||||
| Ross Stores, Inc. | 3,425 | 146,282 | ||||||
| Staples, Inc. | 13,150 | 323,358 | ||||||
| Urban Outfitters, Inc. (a) | 4,500 | 157,455 | ||||||
| 1,138,021 | ||||||||
TOTAL CONSUMER DISCRETIONARY | 6,670,067 | |||||||
CONSUMER STAPLES – 0.8% | ||||||||
Food & Staples Retailing – 0.8% | ||||||||
| Costco Wholesale Corp. | 6,210 | 367,446 | ||||||
TOTAL CONSUMER STAPLES | 367,446 | |||||||
HEALTH CARE – 15.2% | ||||||||
Biotechnology – 7.8% | ||||||||
| Amgen, Inc. (a) | 12,772 | 722,512 | ||||||
| Biogen Idec, Inc. (a) | 8,525 | 456,088 | ||||||
| Celgene Corp. (a) | 12,350 | 687,648 | ||||||
| Cephalon, Inc. (a) | 1,975 | 123,260 | ||||||
| Genzyme Corp. (a) | 9,000 | 441,090 | ||||||
| Gilead Sciences, Inc. (a) | 24,000 | 1,038,720 | ||||||
| Vertex Pharmaceuticals, Inc. (a) | 5,625 | 241,031 | ||||||
| 3,710,349 | ||||||||
Health Care Equipment & Supplies – 1.2% | ||||||||
| DENTSPLY International, Inc. | 3,950 | 138,921 | ||||||
| Hologic, Inc. (a) | 7,350 | 106,575 | ||||||
| Intuitive Surgical, Inc. (a) | 1,025 | 310,903 | ||||||
| 556,399 | ||||||||
Health Care Providers & Services – 1.7% | ||||||||
| Express Scripts, Inc. (a) | 6,650 | 574,893 | ||||||
| Henry Schein, Inc. (a) | 2,450 | 128,870 | ||||||
| Patterson Cos., Inc. (a) | 3,180 | 88,976 | ||||||
| 792,739 | ||||||||
Health Care Technology – 0.4% | ||||||||
| Cerner Corp. (a) | 2,200 | 181,368 | ||||||
Life Sciences Tools & Services – 1.0% | ||||||||
| Illumina, Inc. (a) | 3,325 | 101,911 | ||||||
| Life Technologies Corp. (a) | 4,875 | 254,621 | ||||||
| QIAGEN N.V. (a) | 6,325 | 141,174 | ||||||
| 497,706 | ||||||||
Pharmaceuticals – 3.1% | ||||||||
| Mylan Inc. (a) | 8,400 | 154,812 | ||||||
| Teva Pharmaceutical Industries, Ltd. – ADR | 20,010 | 1,124,162 | ||||||
| Warner Chilcott PLC Class A (a) | 6,775 | 192,884 | ||||||
| 1,471,858 | ||||||||
TOTAL HEALTH CARE | 7,210,419 | |||||||
INDUSTRIALS – 4.0% | ||||||||
Air Freight & Logistics – 1.0% | ||||||||
| C.H. Robinson Worldwide, Inc. | 4,500 | 264,285 | ||||||
| Expeditors International of Washington, Inc. | 5,650 | 196,224 | ||||||
| 460,509 | ||||||||
Commercial Services & Supplies – 0.6% | ||||||||
| Cintas Corp. | 4,975 | 129,599 | ||||||
| Stericycle, Inc. (a) | 2,400 | 132,408 | ||||||
| 262,007 | ||||||||
Construction & Engineering – 0.2% | ||||||||
| Foster Wheeler AG (a) | 3,600 | 105,984 | ||||||
Electrical Equipment – 0.6% | ||||||||
| First Solar, Inc. (a) | 2,025 | 274,185 | ||||||
Machinery – 1.1% | ||||||||
| Joy Global, Inc. | 2,725 | 140,583 | ||||||
| PACCAR, Inc. | 11,039 | 400,384 | ||||||
| 540,967 | ||||||||
Road & Rail – 0.2% | ||||||||
| J.B. Hunt Transport Services, Inc. | 3,450 | 111,332 | ||||||
Trading Companies & Distributors – 0.3% | ||||||||
| Fastenal Co. | 3,850 | 160,314 | ||||||
TOTAL INDUSTRIALS | 1,915,298 | |||||||
INFORMATION TECHNOLOGY – 61.4% | ||||||||
Communications Equipment – 10.3% | ||||||||
| Cisco Systems, Inc. (a) | 55,650 | 1,332,261 | ||||||
| QUALCOMM, Inc. | 54,545 | 2,523,252 | ||||||
| Research In Motion Ltd. (a) | 15,400 | 1,040,116 | ||||||
| 4,895,629 | ||||||||
Computers & Peripherals – 17.4% | ||||||||
| Apple, Inc. (a) | 34,020 | 7,173,457 | ||||||
| Dell, Inc. (a) | 19,475 | 279,661 | ||||||
| Logitech International SA (a) | 4,650 | 79,515 | ||||||
| NetApp, Inc. (a) | 9,535 | 327,909 | ||||||
(continued)
120
Ohio National Fund, Inc.
Nasdaq-100® Index Portfolio (Continued)
Nasdaq-100® Index Portfolio (Continued)
| Schedule of Investments | December 31, 2009 |
| Common Stocks – 97.3% | Shares | Value | ||||||
Computers & Peripherals (continued) | ||||||||
| SanDisk Corp. (a) | 6,275 | $ | 181,912 | |||||
| Seagate Technology | 13,450 | 244,656 | ||||||
| 8,287,110 | ||||||||
Electronic Equipment, Instruments & Components – 0.6% | ||||||||
| Flextronics International Ltd. (a) | 23,875 | 174,526 | ||||||
| FLIR Systems, Inc. (a) | 4,300 | 140,696 | ||||||
| 315,222 | ||||||||
Internet Software & Services – 8.0% | ||||||||
| Baidu, Inc. – ADR (a) | 725 | 298,142 | ||||||
| eBay, Inc.��(a) | 26,110 | 614,630 | ||||||
| Google, Inc. Class A (a) | 4,000 | 2,479,920 | ||||||
| VeriSign, Inc. (a) | 4,905 | 118,897 | ||||||
| Yahoo!, Inc. (a) | 18,235 | 305,983 | ||||||
| 3,817,572 | ||||||||
IT Services – 3.1% | ||||||||
| Automatic Data Processing, Inc. | 9,650 | 413,213 | ||||||
| Cognizant Technology Solutions Corp. Class A (a) | 7,775 | 352,207 | ||||||
| Fiserv, Inc. (a) | 5,212 | 252,678 | ||||||
| Infosys Technologies Ltd. – ADR | 2,950 | 163,046 | ||||||
| Paychex, Inc. | 9,295 | 284,799 | ||||||
| 1,465,943 | ||||||||
Semiconductors & Semiconductor Equipment – 7.7% | ||||||||
| Altera Corp. | 11,250 | 254,587 | ||||||
| Applied Materials, Inc. | 18,675 | 260,329 | ||||||
| Broadcom Corp. Class A (a) | 10,775 | 338,874 | ||||||
| Intel Corp. | 52,370 | 1,068,348 | ||||||
| KLA-Tencor Corp. | 5,600 | 202,496 | ||||||
| Lam Research Corp. (a) | 3,550 | 139,196 | ||||||
| Linear Technology Corp. | 8,080 | 246,763 | ||||||
| Marvell Technology Group Ltd. (a) | 16,100 | 334,075 | ||||||
| Maxim Integrated Products, Inc. | 8,125 | 164,938 | ||||||
| Microchip Technology, Inc. | 4,125 | 119,873 | ||||||
| NVIDIA Corp. (a) | 14,762 | 275,754 | ||||||
| Xilinx, Inc. | 9,955 | 249,472 | ||||||
| 3,654,705 | ||||||||
Software – 14.3% | ||||||||
| Activision Blizzard, Inc. (a) | 30,675 | 340,799 | ||||||
| Adobe Systems, Inc. (a) | 13,905 | 511,426 | ||||||
| Autodesk, Inc. (a) | 6,475 | 164,530 | ||||||
| BMC Software, Inc. (a) | 5,775 | 231,577 | ||||||
| CA, Inc. | 13,575 | 304,894 | ||||||
| Check Point Software Technologies Ltd. (a) | 5,595 | 189,559 | ||||||
| Citrix Systems, Inc. (a) | 5,875 | 244,459 | ||||||
| Electronic Arts, Inc. (a) | 8,880 | 157,620 | ||||||
| Intuit, Inc. (a) | 10,805 | 331,822 | ||||||
| Microsoft Corp. | 82,750 | 2,523,047 | ||||||
| Oracle Corp. | 56,610 | 1,389,209 | ||||||
| Symantec Corp. (a) | 22,948 | 410,540 | ||||||
| 6,799,482 | ||||||||
TOTAL INFORMATION TECHNOLOGY | 29,235,663 | |||||||
MATERIALS – 0.4% | ||||||||
Chemicals – 0.4% | ||||||||
| Sigma-Aldrich Corp. | 3,175 | 160,433 | ||||||
TOTAL MATERIALS | 160,433 | |||||||
TELECOMMUNICATION SERVICES – 1.5% | ||||||||
Wireless Telecommunication Services – 1.5% | ||||||||
| Millicom International Cellular S.A. | 2,850 | 210,245 | ||||||
| NII Holdings, Inc. (a) | 4,375 | 146,912 | ||||||
| Vodafone Group PLC – ADR | 15,825 | 365,399 | ||||||
TOTAL TELECOMMUNICATION SERVICES | 722,556 | |||||||
Total Common Stocks (Cost $37,197,625) | $ | 46,281,882 | ||||||
| Exchange Traded Funds – 3.4% | Shares | Value | ||||||
| PowerShares QQQ | 35,565 | $ | 1,633,145 | |||||
Total Exchange Traded Funds (Cost $1,552,063) | $ | 1,633,145 | ||||||
| Face | Amortized | |||||||
| Commercial Paper – 0.3% | Amount | Cost | ||||||
| Prudential Funding LLC 0.020%, 01/04/2010 | $ | 167,000 | $ | 167,000 | ||||
Total Commercial Paper (Cost $167,000) | $ | 167,000 | ||||||
Total Investments – 101.0% (Cost $38,916,688) (b) | $ | 48,082,027 | ||||||
Liabilities in Excess of Other Assets – (1.0)% | (493,748 | ) | ||||||
Net Assets – 100.0% | $ | 47,588,279 | ||||||
Percentages are stated as a percent of net assets.
Abbreviations:
ADR: American Depository Receipts
Footnotes:
| (a) | Non-income producing security. | |
| (b) | Represents cost for financial reporting purposes, which may differ from cost basis for Federal income tax purposes. See also Note 8 of the Notes to Financial Statements. |
The accompanying notes are an integral part of these financial statements.
121
Ohio National Fund, Inc.
Nasdaq-100® Index Portfolio
Nasdaq-100® Index Portfolio
Statement of Assets and Liabilities
December 31, 2009
| Assets: | ||||
| Investments in securities, at value (Cost $38,916,688) | $ | 48,082,027 | ||
| Cash | 477 | |||
| Receivable for fund shares sold | 49,929 | |||
| Dividends and accrued interest receivable | 9,298 | |||
| Prepaid expenses and other assets | 713 | |||
| Total assets | 48,142,444 | |||
| Liabilities: | ||||
| Payable for securities purchased | 21,681 | |||
| Payable for fund shares redeemed | 496,099 | |||
| Payable for investment management services | 15,837 | |||
| Payable for compliance services | 1,677 | |||
| Accrued custody expense | 247 | |||
| Accrued professional fees | 11,146 | |||
| Accrued accounting fees | 3,851 | |||
| Accrued printing and filing fees | 3,097 | |||
| Other accrued expenses | 530 | |||
| Total liabilities | 554,165 | |||
| Net assets | $ | 47,588,279 | ||
| Net assets consist of: | ||||
| Par value, $1 per share | $ | 9,947,009 | ||
| Paid-in capital in excess of par value | 34,350,682 | |||
| Accumulated net realized loss on investments | (5,943,767 | ) | ||
| Net unrealized appreciation on investments | 9,165,339 | |||
| Undistributed net investment income | 69,016 | |||
| Net assets | $ | 47,588,279 | ||
| Shares outstanding | 9,947,009 | |||
| Authorized Fund shares allocated to Portfolio | 20,000,000 | |||
| Net asset value per share | $ | 4.78 | ||
Statement of Operations
For the Year Ended December 31, 2009
| Investment income: | ||||
| Interest | $ | 149 | ||
| Dividends (net of withholding tax of $2,913) | 272,573 | |||
| Total investment income | 272,722 | |||
| Expenses: | ||||
| Management fees | 145,688 | |||
| Custodian fees | 6,624 | |||
| Directors’ fees | 3,868 | |||
| Professional fees | 13,843 | |||
| Accounting fees | 21,512 | |||
| Printing and filing fees | 6,240 | |||
| Compliance expense | 6,376 | |||
| Other | 858 | |||
| Total expenses | 205,009 | |||
| Net investment income | 67,713 | |||
| Realized/unrealized gain (loss) on investments: | ||||
| Net realized gain (loss) on investments | 232,855 | |||
| Change in unrealized appreciation/depreciation on investments | 15,353,126 | |||
| Net realized/unrealized gain (loss) on investments | 15,585,981 | |||
| Change in net assets from operations | $ | 15,653,694 | ||
The accompanying notes are an integral part of these financial statements.
122
Ohio National Fund, Inc.
Nasdaq-100® Index Portfolio
Nasdaq-100® Index Portfolio
Statements of Changes in Net Assets
| Years Ended December 31, | ||||||||
| 2009 | 2008 | |||||||
Increase (Decrease) in Net Assets: | ||||||||
| Operations: | ||||||||
| Net investment income | $ | 67,713 | $ | 4,870 | ||||
| Net realized gain (loss) on investments | 232,855 | (1,406,553 | ) | |||||
| Change in unrealized appreciation/depreciation on investments | 15,353,126 | (18,845,859 | ) | |||||
| Change in net assets from operations | 15,653,694 | (20,247,542 | ) | |||||
| Capital transactions: | ||||||||
| Received from shares sold | 18,529,577 | 17,536,823 | ||||||
| Paid for shares redeemed | (14,683,834 | ) | (17,821,298 | ) | ||||
| Change in net assets from capital transactions | 3,845,743 | (284,475 | ) | |||||
| Change in net assets | 19,499,437 | (20,532,017 | ) | |||||
Net Assets: | ||||||||
| Beginning of year | 28,088,842 | 48,620,859 | ||||||
| End of year | $ | 47,588,279 | $ | 28,088,842 | ||||
| Undistributed net investment income | $ | 69,016 | $ | 6,848 | ||||
Financial Highlights
| Years Ended December 31, | ||||||||||||||||||||
| 2009 | 2008 | 2007 | 2006 | 2005 | ||||||||||||||||
Selected Per-Share Data: | ||||||||||||||||||||
| Net asset value, beginning of year | $ | 3.11 | $ | 5.36 | $ | 4.52 | $ | 4.24 | $ | 4.18 | ||||||||||
| Operations: | ||||||||||||||||||||
| Net investment income (loss) | 0.01 | — | — | — | — | |||||||||||||||
| Net realized and unrealized gain (loss) on investments | 1.66 | (2.25 | ) | 0.84 | 0.28 | 0.06 | ||||||||||||||
| Total from operations | 1.67 | (2.25 | ) | 0.84 | 0.28 | 0.06 | ||||||||||||||
| Net asset value, end of year | $ | 4.78 | $ | 3.11 | $ | 5.36 | $ | 4.52 | $ | 4.24 | ||||||||||
Total return | 53.70 | % | –41.98 | % | 18.58 | % | 6.60 | % | 1.44 | % | ||||||||||
Ratios and supplemental data: | ||||||||||||||||||||
| Net assets at end of year (millions) | $ | 47.6 | $ | 28.1 | $ | 48.6 | $ | 45.7 | $ | 31.3 | ||||||||||
| Ratios to average net assets: | ||||||||||||||||||||
| Ratios net of expenses reduced or reimbursed by adviser: | ||||||||||||||||||||
| Expenses | 0.56 | % | 0.54 | % | 0.51 | % | 0.53 | % | 0.54 | % | ||||||||||
| Net investment income (loss) | 0.19 | % | 0.01 | % | –0.01 | % | 0.00 | % | 0.05 | % | ||||||||||
| Ratios assuming no expenses reduced or reimbursed by adviser: | ||||||||||||||||||||
| Expenses | 0.56 | % | 0.54 | % | 0.51 | % | 0.53 | % | 0.64 | % | ||||||||||
| Net investment income (loss) | 0.19 | % | 0.01 | % | –0.01 | % | 0.00 | % | –0.04 | % | ||||||||||
| Portfolio turnover rate | 29 | % | 27 | % | 13 | % | 36 | % | 45 | % | ||||||||||
The accompanying notes are an integral part of these financial statements.
123
Ohio National Fund, Inc.
Bristol Portfolio
Bristol Portfolio
Objective/Strategy
The Bristol Portfolio seeks long-term growth of capital by investing primarily in common stocks of the 1,000 largest publicly traded U.S. companies in terms of market capitalization.
Performance as of December 31, 2009
Average Annual Total Returns: | ||||
| One year | 35.83% | |||
| Five years | 2.56% | |||
| Since inception (5/1/02) | 3.38% |
Past performance does not guarantee future results. The performance data quoted represents past performance and current returns may be lower or higher. Total return figures include change in share price and reinvestment of dividends and capital gains. The investment return and principal value will fluctuate so that an investor’s shares, when redeemed, may be worth more or less than the original cost. To obtain performance information up to the most recent month end, call toll-free 1-877-781-6392
The Portfolio is not open to direct retail investment. Beneficial interest in shares is obtained solely by purchase of variable life insurance policies and variable annuity contracts. Actual performance results for variable annuity and variable universal life contracts will be lower due to contract charges. Consult your contract for applicable charges.
Comments
For the year ended December 31, 2009, the Bristol Portfolio returned 35.83% versus 26.46% for the current benchmark, the S&P 500 Index.
Following a year in which the stock market declined nearly 40%, 2009 got off to a dreadful start with the S&P 500 Index plummeting 25% to its early March low of 667. As unprecedented global fiscal and monetary stimulus programs began to show some benefits, the panic gripping the markets early in the year lessened, a more fundamentals-based approach to valuations took hold and the market rallied.
The Portfolio benefitted from underweight positions in two under-performing sectors in 2009, Health Care and Consumer Staples. Health Care was negatively impacted by concerns about reform under President Obama for most of the year, and the Consumer Staples lagged in an up-market, as is characteristic of that “defensive” sector. The Portfolio also benefitted from an over-weight position in the Information Technology sector, which experienced very positive results in 2009.
The top contributors to the Portfolio’s performance in 2009 included financial companies Wells Fargo & Co. and JPMorgan Chase & Co., which contributed 200 and 162 basis points to absolute performance, respectively. Both Wells Fargo & Co. and JPMorgan Chase & Co. out-performed the S&P 500 Index and the financial sector from the March lows, initially as fears faded that the government would nationalize large banks and then as initial signs of credit improvement emerged, particularly in credit cards. Two other top contributors were technology companies Apple, Inc. and Google, Inc., adding 199 and 142 basis points respectively. Apple, Inc.’s earnings estimates moved up throughout the year, as iPhone sales continued to exceed expectations and more recently analysts expected increased contributions from their “Apps store”. Google, Inc. benefited from improving advertising trends, particularly online, and excitement surrounding their smartphone launch. Rounding out the top five contributors to the year, Celanese Corp. added 192 basis points based on of its low cost chemical production and exposure to the rebounding Chinese economy.(1)
Detractors from full year performance included Exxon Mobil Corp., as the company was negatively impacted by the falling price of oil during the period in which we owned the stock, costing the Portfolio 98 basis points. SunPower Corp. was hurt by aggressive pricing on polysilicon which is used in the production of solar panels, detracting 97 basis points from absolute performance. Devon Energy Corp. cost the Portfolio 39 basis points based on unfavorable natural gas pricing. Two insurance companies, The Hartford Financial Services Group, Inc. and Lincoln National Corp. cost the Portfolio 97 and 45 basis points respectively; under-performing during the period we owned them due to combined fears of investment portfolio losses and the need to raise capital to cover reserve requirements for their variable annuity businesses.(1)
As a result of our bottom-up stock selection, the greatest shift in sector weightings during the year occurred in the Consumer Discretionary sector, where the sector weighting ended at 9.8%, in line with the benchmark weighting of 9.6% and up from 2.0% to start the year. Purchases in this sector include cruise line operator Royal Caribbean Cruises Ltd., where estimates have been moving up, valuation is attractive and the company is better positioned to withstand high fuel costs relative to prior years due to a significantly more efficient fleet of ships. We also initiated a position in Amazon.com, Inc. in the fourth quarter following a strong earnings report; we believe there is further upside to earnings estimates and valuation looks attractive.(1)
Sales of Health Care stocks during the year resulted in a decreased weighting in that sector, ending the year at 8.7% versus 16.3% at the start of the year and compared to a benchmark weighting of 12.6%. Health Care sales include Abbott Laboratories, a stock we sold as it approached our target and anecdotes emerged of weakening growth trends in a drug worth just under half of the company’s operating profits. We also sold WellPoint, Inc. based on valuation, as attention surrounding the public option faded and the stock recovered late in the year.(1)
The Portfolio weighting in Consumer Staples is roughly 4% below the benchmark weighting and approximately 3% below where it started the year. While activity in the Portfolio in the first half of the year reduced this sector weighting on balance, we have added a few positions in December which resulted in a reduced under-weight position to end the year. These recent purchases include General Mills, Inc., a food company that experienced positive revisions based on improvements in their Pillsbury division and continued strength in cereal, and Wal-Mart Stores, Inc. based on comments from an apparel supplier indicating strong reorder activity at the retailer.(1)
As we enter 2010, the combined Portfolio weighting in the Materials and Industrials sectors stands well above a combined benchmark weighting of 13.8%. Recent new additions to the Portfolio in these sectors include Honeywell International Inc., Goodrich Corp. and United Technologies Corp. which we purchased based on attractive valuation and evidence of an improving aerospace aftermarket. We also purchased Illinois Tool Works, Inc. based on positive revisions due to the potential for the company to achieve higher margins versus previous economic cycles.(1)
(continued)
124
Ohio National Fund, Inc.
Bristol Portfolio (Continued)
Bristol Portfolio (Continued)
While there are certainly economic issues that concern us, including the continued overhang of commercial real estate exposure on select financial companies and record high unemployment levels in the US, we are also seeing signs of stability in the economic recovery, such as evidence of a potential bottoming in the residential housing market and the newly lean cost structures of numerous blue chip companies that should provide enhanced earnings leverage going forward. We are certainly seeing more stocks exhibiting both attractive valuation and improving fundamentals than we saw one year ago, and we look forward to reporting on our progress to you again in the coming months.
| (1) | The Portfolio’s composition is subject to change. Holdings and weightings are as of December 31, 2009. |
Change in Value of $10,000 Investment
![[PERFORMANCE GRAPH]](https://capedge.com/proxy/N-CSR/0000950123-10-021904/l38589l3858952.gif)
Hypothetical illustration based on past performance. Future performance will vary. The Portfolio’s returns reflect reinvested dividends. The Portfolio’s holdings may differ significantly from the securities in the index. The index is unmanaged and therefore does not reflect the cost of portfolio management and accounting.
The S&P 500 Index is a capitalization-weighted index designed to measure performance of the broad domestic economy through changes in the aggregate market value of 500 stocks representing all major industries. The index presented herein includes the effects of reinvested dividends.
Portfolio Composition as of December 31, 2009 (1)
| % of Net Assets | |||
Common Stocks (3) | 96.7 | ||
| Money Market Funds Less Net Liabilities | 3.3 | ||
| 100.0 | |||
Top 10 Portfolio Holdings as of December 31, 2009 (1) (2)
| % of Net Assets | |||||||
| 1. | Exxon Mobil Corp. | 2.5 | |||||
| 2. | Chevron Corp. | 2.4 | |||||
| 3. | Pfizer, Inc. | 2.4 | |||||
| 4. | General Electric Co. | 2.3 | |||||
| 5. | Dow Chemical Company / The | 2.1 | |||||
| 6. | Applied Materials, Inc. | 2.1 | |||||
| 7. | Bank of America Corp. | 2.1 | |||||
| 8. | Goodrich Corp. | 2.1 | |||||
| 9. | JPMorgan Chase & Co. | 2.0 | |||||
| 10. | United Technologies Corp. | 2.0 | |||||
| (1) | Composition of Portfolio subject to change. | |
| (2) | Short-term investments have been excluded from the list of Top 10 Portfolio holdings. | |
| (3) | Sectors: |
| % of Net Assets | |||
| Information Technology | 20.7 | ||
| Industrials | 15.3 | ||
| Financials | 13.2 | ||
| Energy | 12.0 | ||
| Consumer Discretionary | 9.4 | ||
| Materials | 8.7 | ||
| Health Care | 8.4 | ||
| Consumer Staples | 7.1 | ||
| Telecommunication Services | 1.9 | ||
| 96.7 | |||
125
Ohio National Fund, Inc.
Bristol Portfolio
Bristol Portfolio
| Schedule of Investments | December 31, 2009 |
| Common Stocks – 96.7% | Shares | Value | ||||||
CONSUMER DISCRETIONARY – 9.4% | ||||||||
Hotels, Restaurants & Leisure – 2.0% | ||||||||
| Darden Restaurants, Inc. | 25,000 | $ | 876,750 | |||||
| Royal Caribbean Cruises Ltd. (a) | 78,400 | 1,981,952 | ||||||
| 2,858,702 | ||||||||
Internet & Catalog Retail – 0.8% | ||||||||
| Amazon.com, Inc. (a) | 8,600 | 1,156,872 | ||||||
Multiline Retail – 1.8% | ||||||||
| Target Corp. | 52,400 | 2,534,588 | ||||||
Specialty Retail – 3.0% | ||||||||
| Bed Bath & Beyond, Inc. (a) | 41,800 | 1,614,734 | ||||||
| Lowe’s Companies, Inc. | 115,800 | 2,708,562 | ||||||
| 4,323,296 | ||||||||
Textiles, Apparel & Luxury Goods – 1.8% | ||||||||
| V.F. Corp. | 35,500 | 2,600,020 | ||||||
TOTAL CONSUMER DISCRETIONARY | 13,473,478 | |||||||
CONSUMER STAPLES – 7.1% | ||||||||
Food & Staples Retailing – 1.9% | ||||||||
| Wal-Mart Stores, Inc. | 50,200 | 2,683,190 | ||||||
Food Products – 3.4% | ||||||||
| ConAgra Foods, Inc. | 61,000 | 1,406,050 | ||||||
| General Mills, Inc. | 32,700 | 2,315,487 | ||||||
| Ralcorp Holdings, Inc. (a) | 19,800 | 1,182,258 | ||||||
| 4,903,795 | ||||||||
Household Products – 1.8% | ||||||||
| Procter & Gamble Co. / The | 41,500 | 2,516,145 | ||||||
TOTAL CONSUMER STAPLES | 10,103,130 | |||||||
ENERGY – 12.0% | ||||||||
Energy Equipment & Services – 1.2% | ||||||||
| Transocean Ltd. (a) | 19,900 | 1,647,720 | ||||||
Oil, Gas & Consumable Fuels – 10.8% | ||||||||
| Anadarko Petroleum Corp. | 30,500 | 1,903,810 | ||||||
| Apache Corp. | 8,900 | 918,213 | ||||||
| Chevron Corp. | 44,800 | 3,449,152 | ||||||
| Exxon Mobil Corp. | 52,600 | 3,586,794 | ||||||
| Hess Corp. | 46,800 | 2,831,400 | ||||||
| Occidental Petroleum Corp. | 33,500 | 2,725,225 | ||||||
| 15,414,594 | ||||||||
TOTAL ENERGY | 17,062,314 | |||||||
FINANCIALS – 13.2% | ||||||||
Capital Markets – 5.4% | ||||||||
| Goldman Sachs Group, Inc. / The | 16,500 | 2,785,860 | ||||||
| Morgan Stanley | 87,900 | 2,601,840 | ||||||
| State Street Corp. | 53,800 | 2,342,452 | ||||||
| 7,730,152 | ||||||||
Commercial Banks – 1.8% | ||||||||
| Wells Fargo & Co. | 95,500 | 2,577,545 | ||||||
Diversified Financial Services – 4.1% | ||||||||
| Bank of America Corp. | 196,000 | 2,951,760 | ||||||
| JPMorgan Chase & Co. | 70,000 | 2,916,900 | ||||||
| 5,868,660 | ||||||||
Insurance – 1.9% | ||||||||
| Prudential Financial, Inc. | 55,000 | 2,736,800 | ||||||
TOTAL FINANCIALS | 18,913,157 | |||||||
HEALTH CARE – 8.4% | ||||||||
Health Care Equipment & Supplies – 2.1% | ||||||||
| Hospira, Inc. (a) | 54,200 | 2,764,200 | ||||||
| Medtronic, Inc. | 5,800 | 255,084 | ||||||
| 3,019,284 | ||||||||
Health Care Providers & Services – 2.6% | ||||||||
| Laboratory Corporation of America Holdings (a) | 15,100 | 1,130,084 | ||||||
| McKesson Corp. | 41,900 | 2,618,750 | ||||||
| 3,748,834 | ||||||||
Life Sciences Tools & Services – 0.5% | ||||||||
| Thermo Fisher Scientific, Inc. (a) | 15,000 | 715,350 | ||||||
Pharmaceuticals – 3.2% | ||||||||
| Merck & Co., Inc. | 28,800 | 1,052,352 | ||||||
| Pfizer, Inc. | 187,600 | 3,412,444 | ||||||
| 4,464,796 | ||||||||
TOTAL HEALTH CARE | 11,948,264 | |||||||
INDUSTRIALS – 15.3% | ||||||||
Aerospace & Defense – 6.0% | ||||||||
| Goodrich Corp. | 45,800 | 2,942,650 | ||||||
| Honeywell International Inc. | 70,000 | 2,744,000 | ||||||
| United Technologies Corp. | 41,500 | 2,880,515 | ||||||
| 8,567,165 | ||||||||
Construction & Engineering – 1.1% | ||||||||
| Quanta Services, Inc. (a) | 74,400 | 1,550,496 | ||||||
Electrical Equipment – 0.1% | ||||||||
| SunPower Corp. Class B (a) | 8,600 | 180,170 | ||||||
Industrial Conglomerates – 5.0% | ||||||||
| 3M Co. | 17,400 | 1,438,458 | ||||||
| General Electric Co. | 218,100 | 3,299,853 | ||||||
| Tyco International Ltd. | 66,500 | 2,372,720 | ||||||
| 7,111,031 | ||||||||
Machinery – 3.1% | ||||||||
| Caterpillar, Inc. | 48,500 | 2,764,015 | ||||||
| Illinois Tool Works, Inc. | 36,000 | 1,727,640 | ||||||
| 4,491,655 | ||||||||
TOTAL INDUSTRIALS | 21,900,517 | |||||||
INFORMATION TECHNOLOGY – 20.7% | ||||||||
Communications Equipment – 3.7% | ||||||||
| Cisco Systems, Inc. (a) | 110,100 | 2,635,794 | ||||||
| QUALCOMM, Inc. | 59,100 | 2,733,966 | ||||||
| 5,369,760 | ||||||||
Computers & Peripherals – 7.2% | ||||||||
| Apple, Inc. (a) | 11,300 | 2,382,718 | ||||||
| Dell, Inc. (a) | 164,800 | 2,366,528 | ||||||
| Hewlett-Packard Co. | 53,800 | 2,771,238 | ||||||
| International Business Machines Corp. | 21,400 | 2,801,260 | ||||||
| 10,321,744 | ||||||||
Internet Software & Services – 1.8% | ||||||||
| Google, Inc. Class A (a) | 4,100 | 2,541,918 | ||||||
Semiconductors & Semiconductor Equipment – 8.0% | ||||||||
| Applied Materials, Inc. | 216,600 | 3,019,404 | ||||||
| Intel Corp. | 137,900 | 2,813,160 | ||||||
(continued)
126
Ohio National Fund, Inc.
Bristol Portfolio (Continued)
Bristol Portfolio (Continued)
| Schedule of Investments | December 31, 2009 |
| Common Stocks – 96.7% | Shares | Value | ||||||
Semiconductors & Semiconductor Equipment (continued) | ||||||||
| Maxim Integrated Products, Inc. | 134,500 | $ | 2,730,350 | |||||
| Texas Instruments, Inc. | 108,400 | 2,824,904 | ||||||
| 11,387,818 | ||||||||
TOTAL INFORMATION TECHNOLOGY | 29,621,240 | |||||||
MATERIALS – 8.7% | ||||||||
Chemicals – 3.1% | ||||||||
| Air Products and Chemicals, Inc. | 16,300 | 1,321,278 | ||||||
| Dow Chemical Company / The | 109,500 | 3,025,485 | ||||||
| 4,346,763 | ||||||||
Containers & Packaging – 1.9% | ||||||||
| Ball Corp. | 53,400 | 2,760,780 | ||||||
Metals & Mining – 3.7% | ||||||||
| Freeport-McMoRan Copper & Gold, Inc. | 33,100 | 2,657,599 | ||||||
| Teck Resources Ltd. (a) | 74,100 | 2,591,277 | ||||||
| 5,248,876 | ||||||||
TOTAL MATERIALS | 12,356,419 | |||||||
TELECOMMUNICATION SERVICES – 1.9% | ||||||||
Diversified Telecommunication Services – 1.9% | ||||||||
| Verizon Communications, Inc. | 81,400 | 2,696,782 | ||||||
TOTAL TELECOMMUNICATION SERVICES | 2,696,782 | |||||||
Total Common Stocks (Cost $125,479,377) | $ | 138,075,301 | ||||||
| Money Market Funds – 4.0% | Shares | Value | ||||||
| Fidelity Institutional Money Market Funds | ||||||||
| Money Market Portfolio – Class I | 5,709,000 | $ | 5,709,000 | |||||
Total Money Market Funds (Cost $5,709,000) | $ | 5,709,000 | ||||||
Total Investments – 100.7% (Cost $131,188,377) (b) | $ | 143,784,301 | ||||||
Liabilities in Excess of Other Assets – (0.7)% | (985,379 | ) | ||||||
Net Assets – 100.0% | $ | 142,798,922 | ||||||
Percentages are stated as a percent of net assets.
Footnotes:
| (a) | Non-income producing security. | |
| (b) | Represents cost for financial reporting purposes, which may differ from cost basis for Federal income tax purposes. See also Note 8 of the Notes to Financial Statements. |
The accompanying notes are an integral part of these financial statements.
127
Ohio National Fund, Inc.
Bristol Portfolio
Bristol Portfolio
Statement of Assets and Liabilities
December 31, 2009
| Assets: | ||||
| Investments in securities, at value (Cost $131,188,377) | $ | 143,784,301 | ||
| Cash | 916 | |||
| Receivable for securities sold | 4,838,393 | |||
| Receivable for fund shares sold | 217,013 | |||
| Dividends and accrued interest receivable | 116,111 | |||
| Prepaid expenses and other assets | 2,111 | |||
| Total assets | 148,958,845 | |||
| Liabilities: | ||||
| Payable for securities purchased | 5,338,853 | |||
| Payable for fund shares redeemed | 696,693 | |||
| Payable for investment management services | 92,550 | |||
| Payable for compliance services | 1,677 | |||
| Accrued custody expense | 907 | |||
| Accrued professional fees | 11,275 | |||
| Accrued accounting fees | 8,490 | |||
| Accrued printing and filing fees | 9,478 | |||
| Total liabilities | 6,159,923 | |||
| Net assets | $ | 142,798,922 | ||
| Net assets consist of: | ||||
| Par value, $1 per share | $ | 12,847,042 | ||
| Paid-in capital in excess of par value | 141,755,997 | |||
| Accumulated net realized loss on investments | (24,507,412 | ) | ||
| Net unrealized appreciation on investments | 12,595,924 | |||
| Undistributed net investment income | 107,371 | |||
| Net assets | $ | 142,798,922 | ||
| Shares outstanding | 12,847,042 | |||
| Authorized Fund shares allocated to Portfolio | 25,000,000 | |||
| Net asset value per share | $ | 11.12 | ||
Statement of Operations
For the Year Ended December 31, 2009
| Investment income: | ||||
| Interest | $ | 20,798 | ||
| Dividends (net of withholding tax of $293) | 1,808,443 | |||
| Total investment income | 1,829,241 | |||
| Expenses: | ||||
| Management fees | 853,043 | |||
| Custodian fees | 12,829 | |||
| Directors’ fees | 11,643 | |||
| Professional fees | 18,094 | |||
| Accounting fees | 45,364 | |||
| Printing and filing fees | 19,010 | |||
| Compliance expense | 6,376 | |||
| Other | 2,280 | |||
| Total expenses | 968,639 | |||
| Net investment income | 860,602 | |||
| Realized/unrealized gain (loss) on investments and foreign currency related transactions: | ||||
| Net realized gain (loss) on: | ||||
| Investments | (2,496,547 | ) | ||
| Foreign currency related transactions | 72 | |||
| Change in unrealized appreciation/depreciation on investments | 35,271,355 | |||
| Net realized/unrealized gain (loss) on investments and foreign currency related transactions | 32,774,880 | |||
| Change in net assets from operations | $ | 33,635,482 | ||
The accompanying notes are an integral part of these financial statements.
128
Ohio National Fund, Inc.
Bristol Portfolio
Bristol Portfolio
Statements of Changes in Net Assets
| Years Ended December 31, | ||||||||
| 2009 | 2008 | |||||||
Increase (Decrease) in Net Assets: | ||||||||
| Operations: | ||||||||
| Net investment income | $ | 860,602 | $ | 1,039,053 | ||||
| Net realized gain (loss) on investments and foreign currency related transactions | (2,496,475 | ) | (21,019,200 | ) | ||||
| Change in unrealized appreciation/depreciation on investments | 35,271,355 | (25,860,147 | ) | |||||
| Change in net assets from operations | 33,635,482 | (45,840,294 | ) | |||||
| Distributions to shareholders: | ||||||||
| Distributions from net investment income | (753,303 | ) | (906,531 | ) | ||||
| Capital transactions: | ||||||||
| Received from shares sold | 53,481,033 | 53,323,139 | ||||||
| Received from dividends reinvested | 753,303 | 906,531 | ||||||
| Paid for shares redeemed | (25,861,068 | ) | (23,005,171 | ) | ||||
| Change in net assets from capital transactions | 28,373,268 | 31,224,499 | ||||||
| Change in net assets | 61,255,447 | (15,522,326 | ) | |||||
Net Assets: | ||||||||
| Beginning of year | 81,543,475 | 97,065,801 | ||||||
| End of year | $ | 142,798,922 | $ | 81,543,475 | ||||
| Undistributed net investment income | $ | 107,371 | $ | 132,522 | ||||
Financial Highlights
| Years Ended December 31, | ||||||||||||||||||||
| 2009 | 2008 | 2007 | 2006 | 2005 | ||||||||||||||||
Selected Per-Share Data: | ||||||||||||||||||||
| Net asset value, beginning of year | $ | 8.23 | $ | 14.02 | $ | 13.08 | $ | 11.27 | $ | 10.06 | ||||||||||
| Operations: | ||||||||||||||||||||
| Net investment income | 0.06 | 0.11 | 0.08 | 0.04 | 0.01 | |||||||||||||||
| Net realized and unrealized gain (loss) on investments | ||||||||||||||||||||
| and foreign currency related transactions | 2.89 | (5.80 | ) | 0.93 | 1.81 | 1.20 | ||||||||||||||
| Total from operations | 2.95 | (5.69 | ) | 1.01 | 1.85 | 1.21 | ||||||||||||||
| Distributions: | ||||||||||||||||||||
| Distributions from net investment income | (0.06 | ) | (0.10 | ) | (0.07 | ) | (0.04 | ) | — | |||||||||||
| Net asset value, end of year | $ | 11.12 | $ | 8.23 | $ | 14.02 | $ | 13.08 | $ | 11.27 | ||||||||||
Total return | 35.83 | % | –40.54 | % | 7.75 | % | 16.42 | % | 12.03 | % | ||||||||||
Ratios and supplemental data: | ||||||||||||||||||||
| Net assets at end of year (millions) | $ | 142.8 | $ | 81.5 | $ | 97.1 | $ | 62.4 | $ | 30.0 | ||||||||||
| Ratios to average net assets: | ||||||||||||||||||||
| Expenses | 0.89 | % | 0.90 | % | 0.89 | % | 0.92 | % | 0.96 | % | ||||||||||
| Net investment income | 0.79 | % | 1.13 | % | 0.69 | % | 0.56 | % | 0.54 | % | ||||||||||
| Portfolio turnover rate | 223 | % | 184 | % | 176 | % | 216 | % | 224 | % | ||||||||||
The accompanying notes are an integral part of these financial statements.
129
Ohio National Fund, Inc.
Bryton Growth Portfolio
Bryton Growth Portfolio
Objective/Strategy
The Bryton Growth Portfolio seeks long-term growth of capital by investing primarily in common stocks of growth-oriented U.S. companies smaller than the 500 largest publicly traded U.S. companies in terms of market capitalization.
Performance as of December 31, 2009
Average Annual Total Returns: | ||||
| One year | 35.73% | |||
| Five years | 1.89% | |||
| Since inception (5/1/02) | 1.27% |
Past performance does not guarantee future results. The performance data quoted represents past performance and current returns may be lower or higher. Total return figures include change in share price and reinvestment of dividends and capital gains. The investment return and principal value will fluctuate so that an investor’s shares, when redeemed, may be worth more, or less than the original cost. To obtain performance information up to the most recent month end, call toll-free 1-877-781-6392.
The Portfolio is not open to direct retail investment. Beneficial interest in shares is obtained solely by purchase of variable life insurance policies and variable annuity contracts. Actual performance results for variable annuity and variable universal life contracts will be lower due to contract charges. Consult your contract for applicable charges.
Comments
For the year ended December 31, 2009, the Bryton Growth Portfolio returned 35.73% versus 34.47% for the current benchmark, the Russell 2000 Growth Index.
Following a year in which the stock market declined nearly 40%, 2009 got off to a dreadful start with the Russell 2000 Growth Index plummeting over 25% to its early March lows. As unprecedented global fiscal and monetary stimulus programs began to show some benefits, the panic gripping the markets early in the year lessened, a more fundamentals-based approach to valuations took hold and the market rallied.
The Portfolio benefitted from underweight positions in two under-performing sectors in 2009, Health Care and Consumer Staples. Health Care was negatively impacted by concerns about reform under President Obama for most of the year, and the Consumer Staples lagged in an up-market, as is characteristic of that “defensive” sector. The Portfolio also benefitted from an over-weight position in the Information Technology sector, which experienced very positive results in 2009.
Positive contributors to absolute performance included a position in MercadoLibre, Inc., which added 219 basis points due to a sharp rebound in transactions by its Latin American customers. Skyworks Solutions, Inc. added 214 basis points as the company continued market share gains in the handset market and benefited from e-Readers adoption and smart meter rollout. Finish Line, Inc. contributed 180 basis points as the retailer executed a successful offering of value-oriented products that attracted customers looking to trade down. Riverbed Technology, Inc. added 166 basis points based on robust demand for its enterprise products from retail and financial sector customers as well as the Federal government. Rounding out the top five contributors to the year, Switch & Data Facilities Co., Inc. contributed 161 basis points as the data center operator was acquired by a competitor.(1)
Detractors from full year performance included a position in Energy Conversion Devices, Inc., a thin-film solar laminates manufacturer. The company suffered from pricing pressure and frozen credit markets and cost the Portfolio 98 basis points of performance. Bankrate, Inc. hurt performance by 70 basis points as their financial customers cut back on spending, and analysts cut estimates. Comstock Resources, Inc. cost the Portfolio 66 basis points on the year, as the stock under-performed due to a slowing economy and lower corresponding commodity prices. Celera Corp. cost the Portfolio 57 basis points due to worsening of bad debt expenses, and Hansen Medical, Inc. cost the Portfolio 56 basis points as the company was adversely affected by reductions in capital spending by hospitals.(1)
As a result of our bottom-up stock selection, the greatest shift in sector weightings during the year occurred in the Health Care sector, where the Portfolio weighting decreased from 26.5% at the end of 2008 to 17.4% at the end of 2009 compared to a 24.2% weighting in the Russell 2000 Growth Index. Stock sales in the sector include Sequenom, Inc., based on worse-than-expected clinical results, and positions in Align Technology Inc., Abaxis, Inc., and Alexion Pharmaceuticals, Inc. as those companies met their price targets. We also sold CardioNet, Inc. on competitive threat and risks of reimbursement cuts. We continue to believe that policies coming out of Washington could be detrimental to many of the companies in that sector.(1)
The Portfolio weighting in Consumer Discretionary stocks ended the year much higher than where it started the year. Throughout the year we added several consumer companies to the Portfolio, including The Finish Line, Inc., a specialty retailer of footwear, and Gymboree Corp., a children’s apparel shop, as the reduced estimates and low valuation multiples appear to be discounting bleak near and long term outlooks. Subsequently, we also bought The Cheesecake Factory, Inc. and P.F. Chang’s China Bistro, Inc. These companies substantially cut operating expenses and modified their offerings to attract customers. We also bought Lumber Liquidators, Inc. as the retailer benefited from consumer trade down and continues to take market share from capital-constrained independent operators.(1)
Though small cap stocks have rallied considerably, valuations still appear to be reasonable compared to historical metrics. We are optimistic that with the Federal Reserve keeping interest rates low, the U.S. economy will continue to improve and we will see continued gains in this segment of the market.
| (1) | The Portfolio’s composition is subject to change. Holdings and weightings are as of December 31, 2009. |
(continued)
130
Ohio National Fund, Inc.
Bryton Growth Portfolio (Continued)
Bryton Growth Portfolio (Continued)
Change in Value of $10,000 Investment
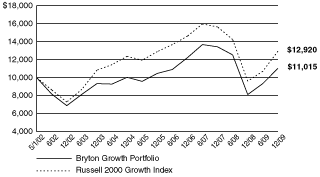
Hypothetical illustration based on past performance. Future performance will vary. The Portfolio’s returns reflect reinvested dividends. The Portfolio’s holdings may differ significantly from the securities in the index. The index is unmanaged and therefore does not reflect the cost of portfolio management and accounting.
The Russell 2000 Growth Index is a market-weighted total return index that measures the performance of companies within the Russell 2000 Index having higher price-to-book ratios and higher forecasted growth values. The Russell 2000 Index includes the 2000 firms from the Russell 3000 Index with the smallest market capitalizations. The Russell 3000 Index represents 98% of the investable U.S. equity market. The index presented herein includes the effects of reinvested dividends.
Portfolio Composition as of December 31, 2009 (1)
| % of Net Assets | |||
Common Stocks (3) | 95.4 | ||
| Money Market Funds Less Net Liabilities | 4.6 | ||
| 100.0 | |||
Top 10 Portfolio Holdings as of December 31, 2009 (1) (2)
| % of Net Assets | |||||||
| 1. | Arena Resources, Inc. | 1.7 | |||||
| 2. | Warnaco Group, Inc. / The | 1.7 | |||||
| 3. | Skyworks Solutions, Inc. | 1.6 | |||||
| 4. | Human Genome Sciences, Inc. | 1.6 | |||||
| 5. | Informatica Corp. | 1.6 | |||||
| 6. | Advanced Energy Industries, Inc. | 1.6 | |||||
| 7. | Medicis Pharmaceutical Corp. Class A | 1.6 | |||||
| 8. | Clean Energy Fuels Corp. | 1.5 | |||||
| 9. | Silicon Laboratories, Inc. | 1.5 | |||||
| 10. | Zoran Corp. | 1.5 | |||||
| (1) | Composition of Portfolio subject to change. | |
| (2) | Short-term investments have been excluded from the list of Top 10 Portfolio holdings. | |
| (3) | Sectors: |
| % of Net Assets | |||
| Information Technology | 34.4 | ||
| Consumer Discretionary | 16.7 | ||
| Health Care | 16.6 | ||
| Industrials | 14.0 | ||
| Energy | 5.9 | ||
| Financials | 4.7 | ||
| Materials | 2.0 | ||
| Consumer Staples | 1.1 | ||
| 95.4 | |||
131
Ohio National Fund, Inc.
Bryton Growth Portfolio
Bryton Growth Portfolio
| Schedule of Investments | December 31, 2009 |
| Common Stocks – 95.4% | Shares | Value | ||||||
CONSUMER DISCRETIONARY – 16.7% | ||||||||
Distributors – 1.1% | ||||||||
| LKQ Corp. (a) | 63,100 | $ | 1,236,129 | |||||
Hotels, Restaurants & Leisure – 5.0% | ||||||||
| Bally Technologies, Inc. (a) | 37,000 | 1,527,730 | ||||||
| California Pizza Kitchen, Inc. (a) | 100,000 | 1,345,000 | ||||||
| Cheesecake Factory, Inc. / The (a) | 70,000 | 1,511,300 | ||||||
| P.F. Chang’s China Bistro, Inc. (a) | 35,000 | 1,326,850 | ||||||
| 5,710,880 | ||||||||
Household Durables – 1.3% | ||||||||
| Tupperware Brands Corp. | 32,000 | 1,490,240 | ||||||
Leisure Equipment & Products – 1.0% | ||||||||
| Callaway Golf Co. | 150,000 | 1,131,000 | ||||||
Specialty Retail – 6.6% | ||||||||
| Childrens Place Retail Stores, Inc. / The (a) | 47,000 | 1,551,470 | ||||||
| Finish Line, Inc. Class A / The | 125,000 | 1,568,750 | ||||||
| Gymboree Corp. / The (a) | 28,000 | 1,217,720 | ||||||
| Monro Muffler Brake, Inc. | 45,000 | 1,504,800 | ||||||
| Pacific Sunwear of California, Inc. (a) | 140,000 | 557,200 | ||||||
| Tractor Supply Co. (a) | 20,000 | 1,059,200 | ||||||
| 7,459,140 | ||||||||
Textiles, Apparel & Luxury Goods – 1.7% | ||||||||
| Warnaco Group, Inc. / The (a) | 45,000 | 1,898,550 | ||||||
TOTAL CONSUMER DISCRETIONARY | 18,925,939 | |||||||
CONSUMER STAPLES – 1.1% | ||||||||
Food Products – 1.1% | ||||||||
| Diamond Foods, Inc. | 35,000 | 1,243,900 | ||||||
TOTAL CONSUMER STAPLES | 1,243,900 | |||||||
ENERGY – 5.9% | ||||||||
Energy Equipment & Services – 1.3% | ||||||||
| Dril-Quip, Inc. (a) | 25,000 | 1,412,000 | ||||||
Oil, Gas & Consumable Fuels – 4.6% | ||||||||
| Arena Resources, Inc. (a) | 45,000 | 1,940,400 | ||||||
| Carrizo Oil & Co., Inc. (a) | 60,000 | 1,589,400 | ||||||
| Clean Energy Fuels Corp. (a) | 110,000 | 1,695,100 | ||||||
| 5,224,900 | ||||||||
TOTAL ENERGY | 6,636,900 | |||||||
FINANCIALS – 4.7% | ||||||||
Capital Markets – 3.5% | ||||||||
| Affiliated Managers Group, Inc. (a) | 22,000 | 1,481,700 | ||||||
| Knight Capital Group, Inc. Class A (a) | 80,000 | 1,232,000 | ||||||
| Stifel Financial Corp. (a) | 22,000 | 1,303,280 | ||||||
| 4,016,980 | ||||||||
Diversified Financial Services – 1.2% | ||||||||
| Portfolio Recovery Associates, Inc. (a) | 30,000 | 1,346,400 | ||||||
TOTAL FINANCIALS | 5,363,380 | |||||||
HEALTH CARE – 16.6% | ||||||||
Biotechnology – 7.2% | ||||||||
| Celera Corp. (a) | 150,000 | 1,036,500 | ||||||
| Exelixis, Inc. (a) | 95,000 | 700,150 | ||||||
| Human Genome Sciences, Inc. (a) | 60,000 | 1,836,000 | ||||||
| InterMune, Inc. (a) | 40,000 | 521,600 | ||||||
| Isis Pharmaceuticals, Inc. (a) | 45,000 | 499,500 | ||||||
| Momenta Pharmaceuticals, Inc. (a) | 50,000 | 630,500 | ||||||
| Onyx Pharmaceuticals, Inc. (a) | 16,000 | 469,440 | ||||||
| Regeneron Pharmaceuticals, Inc. (a) | 42,000 | 1,015,560 | ||||||
| Rigel Pharmaceuticals, Inc. (a) | 65,000 | 618,150 | ||||||
| Savient Pharmaceuticals, Inc. (a) | 60,000 | 816,600 | ||||||
| 8,144,000 | ||||||||
Health Care Equipment & Supplies – 4.3% | ||||||||
| American Medical Systems Holdings, Inc. (a) | 78,000 | 1,504,620 | ||||||
| STERIS Corp. | 40,000 | 1,118,800 | ||||||
| Thoratec Corp. (a) | 30,000 | 807,600 | ||||||
| Wright Medical Group, Inc. (a) | 75,000 | 1,421,250 | ||||||
| 4,852,270 | ||||||||
Health Care Providers & Services – 1.2% | ||||||||
| MWI Veterinary Supply, Inc. (a) | 35,000 | 1,319,500 | ||||||
Health Care Technology – 1.3% | ||||||||
| Eclipsys Corp. (a) | 80,000 | 1,481,600 | ||||||
Life Sciences Tools & Services – 1.1% | ||||||||
| Luminex Corp. (a) | 85,000 | 1,269,050 | ||||||
Pharmaceuticals – 1.5% | ||||||||
| Medicis Pharmaceutical Corp. Class A | 65,000 | 1,758,250 | ||||||
TOTAL HEALTH CARE | 18,824,670 | |||||||
INDUSTRIALS – 14.0% | ||||||||
Aerospace & Defense – 1.1% | ||||||||
| Aerovironment, Inc. (a) | 45,000 | 1,308,600 | ||||||
Commercial Services & Supplies – 1.1% | ||||||||
| GEO Group, Inc. / The (a) | 55,000 | 1,203,400 | ||||||
Construction & Engineering – 3.7% | ||||||||
| MasTec, Inc. (a) | 125,000 | 1,562,500 | ||||||
| Michael Baker Corp. (a) | 36,000 | 1,490,400 | ||||||
| MYR Group Inc. (a) | 63,884 | 1,155,023 | ||||||
| 4,207,923 | ||||||||
Electrical Equipment – 2.0% | ||||||||
| Baldor Electric Co. | 30,000 | 842,700 | ||||||
| GrafTech International Ltd. (a) | 90,000 | 1,399,500 | ||||||
| 2,242,200 | ||||||||
Machinery – 4.9% | ||||||||
| Actuant Corp. Class A | 40,000 | 741,200 | ||||||
| Astec Industries, Inc. (a) | 47,000 | 1,266,180 | ||||||
| Columbus McKinnon Corp. (a) | 70,000 | 956,200 | ||||||
| Energy Recovery, Inc. (a) | 100,000 | 688,000 | ||||||
| ESCO Technologies, Inc. | 30,000 | 1,075,500 | ||||||
| Westinghouse Air Brake Technologies Corp. | 20,000 | 816,800 | ||||||
| 5,543,880 | ||||||||
Professional Services – 1.2% | ||||||||
| Watson Wyatt Worldwide Inc. | 30,000 | 1,425,600 | ||||||
TOTAL INDUSTRIALS | 15,931,603 | |||||||
(continued)
132
Ohio National Fund, Inc.
Bryton Growth Portfolio (Continued)
Bryton Growth Portfolio (Continued)
| Schedule of Investments | December 31, 2009 |
| Common Stocks – 95.4% | Shares | Value | ||||||
INFORMATION TECHNOLOGY – 34.4% | ||||||||
Communications Equipment – 3.5% | ||||||||
| Harmonic, Inc. (a) | 200,000 | $ | 1,266,000 | |||||
| Infinera Corporation (a) | 150,000 | 1,330,500 | ||||||
| Riverbed Technology, Inc. (a) | 60,000 | 1,378,200 | ||||||
| 3,974,700 | ||||||||
Internet Software & Services – 5.5% | ||||||||
| comScore, Inc. (a) | 75,000 | 1,316,250 | ||||||
| Equinix, Inc. (a) | 8,000 | 849,200 | ||||||
| MercadoLibre, Inc. (a) | 31,000 | 1,607,970 | ||||||
| Sohu.com, Inc. (a) | 18,000 | 1,031,040 | ||||||
| ValueClick, Inc. (a) | 140,000 | 1,416,800 | ||||||
| 6,221,260 | ||||||||
IT Services – 2.7% | ||||||||
| Euronet Worldwide, Inc. (a) | 65,000 | 1,426,750 | ||||||
| Sapient Corp. (a) | 195,000 | 1,612,650 | ||||||
| 3,039,400 | ||||||||
Semiconductors & Semiconductor Equipment – 15.8% | ||||||||
| Advanced Energy Industries, Inc. (a) | 120,000 | 1,809,600 | ||||||
| Applied Micro Circuits Corp. (a) | 190,000 | 1,419,300 | ||||||
| Cavium Networks, Inc. (a) | 65,000 | 1,548,950 | ||||||
| FormFactor Inc. (a) | 65,000 | 1,414,400 | ||||||
| Micrel, Inc. | 140,000 | 1,148,000 | ||||||
| Microsemi Corp. (a) | 80,000 | 1,420,000 | ||||||
| Semtech Corp. (a) | 70,000 | 1,190,700 | ||||||
| Silicon Laboratories, Inc. (a) | 35,000 | 1,691,900 | ||||||
| Skyworks Solutions, Inc. (a) | 130,000 | 1,844,700 | ||||||
| TriQuint Semiconductor, Inc. (a) | 200,000 | 1,200,000 | ||||||
| Volterra Semiconductor Corp. (a) | 80,000 | 1,529,600 | ||||||
| Zoran Corp. (a) | 150,000 | 1,657,500 | ||||||
| 17,874,650 | ||||||||
Software – 6.9% | ||||||||
| Informatica Corp. (a) | 70,000 | 1,810,200 | ||||||
| Quest Software, Inc. (a) | 80,000 | 1,472,000 | ||||||
| Solera Holdings, Inc. | 40,000 | 1,440,400 | ||||||
| Take-Two Interactive Software, Inc. (a) | 150,000 | 1,507,500 | ||||||
| TIBCO Software, Inc. (a) | 170,000 | 1,637,100 | ||||||
| 7,867,200 | ||||||||
TOTAL INFORMATION TECHNOLOGY | 38,977,210 | |||||||
MATERIALS – 2.0% | ||||||||
Containers & Packaging – 1.2% | ||||||||
| Silgan Holdings, Inc. | 24,000 | 1,389,120 | ||||||
Metals & Mining – 0.8% | ||||||||
| HudBay Minerals, Inc. (a) | 70,000 | 906,500 | ||||||
TOTAL MATERIALS | 2,295,620 | |||||||
Total Common Stocks (Cost $93,090,701) | $ | 108,199,222 | ||||||
| Money Market Funds – 4.8% | Shares | Value | ||||||
| Fidelity Institutional Money Market Funds Money Market Portfolio – Class I | 5,474,000 | $ | 5,474,000 | |||||
Total Money Market Funds (Cost $5,474,000) | $ | 5,474,000 | ||||||
Total Investments – 100.2% (Cost $98,564,701) (b) | $ | 113,673,222 | ||||||
Liabilities in Excess of Other Assets – (0.2)% | (239,100 | ) | ||||||
Net Assets – 100.0% | $ | 113,434,122 | ||||||
Percentages are stated as a percent of net assets.
Footnotes:
| (a) | Non-income producing security. | |
| (b) | Represents cost for financial reporting purposes, which may differ from cost basis for Federal income tax purposes. See also Note 8 of the Notes to Financial Statements. |
The accompanying notes are an integral part of these financial statements.
133
Ohio National Fund, Inc.
Bryton Growth Portfolio
Bryton Growth Portfolio
Statement of Assets and Liabilities
December 31, 2009
| Assets: | ||||
| Investments in securities, at value (Cost $98,564,701) | $ | 113,673,222 | ||
| Cash | 730 | |||
| Receivable for securities sold | 1,331,084 | |||
| Receivable for fund shares sold | 756,319 | |||
| Dividends and accrued interest receivable | 26,422 | |||
| Prepaid expenses and other assets | 1,640 | |||
| Total assets | 115,789,417 | |||
| Liabilities: | ||||
| Payable for securities purchased | 2,006,867 | |||
| Payable for fund shares redeemed | 243,437 | |||
| Payable for investment management services | 77,413 | |||
| Payable for compliance services | 1,677 | |||
| Accrued custody expense | 589 | |||
| Accrued professional fees | 11,228 | |||
| Accrued accounting fees | 6,838 | |||
| Accrued printing and filing fees | 7,246 | |||
| Total liabilities | 2,355,295 | |||
| Net assets | $ | 113,434,122 | ||
| Net assets consist of: | ||||
| Par value, $1 per share | $ | 10,366,666 | ||
| Paid-in capital in excess of par value | 101,770,871 | |||
| Accumulated net realized loss on investments | (13,811,936 | ) | ||
| Net unrealized appreciation on investments | 15,108,521 | |||
| Net assets | $ | 113,434,122 | ||
| Shares outstanding | 10,366,666 | |||
| Authorized Fund shares allocated to Portfolio | 20,000,000 | |||
| Net asset value per share | $ | 10.94 | ||
Statement of Operations
For the Year Ended December 31, 2009
| Investment income: | ||||
| Interest | $ | 19,049 | ||
| Dividends | 241,480 | |||
| Total investment income | 260,529 | |||
| Expenses: | ||||
| Management fees | 689,707 | |||
| Custodian fees | 8,684 | |||
| Directors’ fees | 8,541 | |||
| Professional fees | 16,562 | |||
| Accounting fees | 36,471 | |||
| Printing and filing fees | 14,627 | |||
| Compliance expense | 6,376 | |||
| Other | 1,704 | |||
| Total expenses | 782,672 | |||
| Net investment loss | (522,143 | ) | ||
| Realized/unrealized gain (loss) on investments: | ||||
| Net realized gain (loss) on investments | (3,579,256 | ) | ||
| Change in unrealized appreciation/depreciation on investments | 30,818,101 | |||
| Net realized/unrealized gain (loss) on investments | 27,238,845 | |||
| Change in net assets from operations | $ | 26,716,702 | ||
The accompanying notes are an integral part of these financial statements.
134
Ohio National Fund, Inc.
Bryton Growth Portfolio
Bryton Growth Portfolio
Statements of Changes in Net Assets
| Years Ended December 31, | ||||||||
| 2009 | 2008 | |||||||
Increase (Decrease) in Net Assets: | ||||||||
| Operations: | ||||||||
| Net investment loss | $ | (522,143 | ) | $ | (398,879 | ) | ||
| Net realized gain (loss) on investments | (3,579,256 | ) | (9,701,458 | ) | ||||
| Change in unrealized appreciation/depreciation on investments | 30,818,101 | (19,649,484 | ) | |||||
| Change in net assets from operations | 26,716,702 | (29,749,821 | ) | |||||
| Capital transactions: | ||||||||
| Received from shares sold | 48,509,791 | 46,393,507 | ||||||
| Paid for shares redeemed | (20,811,898 | ) | (22,858,481 | ) | ||||
| Change in net assets from capital transactions | 27,697,893 | 23,535,026 | ||||||
| Change in net assets | 54,414,595 | (6,214,795 | ) | |||||
Net Assets: | ||||||||
| Beginning of year | 59,019,527 | 65,234,322 | ||||||
| End of year | $ | 113,434,122 | $ | 59,019,527 | ||||
Financial Highlights
| Years Ended December 31, | ||||||||||||||||||||
| 2009 | 2008 | 2007 | 2006 | 2005 | ||||||||||||||||
Selected Per-Share Data: | ||||||||||||||||||||
| Net asset value, beginning of year | $ | 8.06 | $ | 13.33 | $ | 12.13 | $ | 10.46 | $ | 10.03 | ||||||||||
| Operations: | ||||||||||||||||||||
| Net investment loss | (0.05 | ) | (0.05 | ) | (0.05 | ) | (0.03 | ) | (0.06 | ) | ||||||||||
| Net realized and unrealized gain (loss) on investments | 2.93 | (5.22 | ) | 1.25 | 1.78 | 0.49 | ||||||||||||||
| Total from operations | 2.88 | (5.27 | ) | 1.20 | 1.75 | 0.43 | ||||||||||||||
| Distributions: | ||||||||||||||||||||
| Distributions of net realized capital gains | — | — | — | (0.08 | ) | — | ||||||||||||||
| Net asset value, end of year | $ | 10.94 | $ | 8.06 | $ | 13.33 | $ | 12.13 | $ | 10.46 | ||||||||||
Total return | 35.73 | % | –39.53 | % | 9.89 | % | 16.74 | % | 4.30 | % | ||||||||||
Ratios and supplemental data: | ||||||||||||||||||||
| Net assets at end of year (millions) | $ | 113.4 | $ | 59.0 | $ | 65.2 | $ | 29.3 | $ | 11.2 | ||||||||||
| Ratios to average net assets: | ||||||||||||||||||||
| Expenses | 0.96 | % | 0.96 | % | 0.96 | % | 1.04 | % | 1.11 | % | ||||||||||
| Net investment loss | –0.64 | % | –0.62 | % | –0.54 | % | –0.67 | % | –0.74 | % | ||||||||||
| Portfolio turnover rate | 82 | % | 54 | % | 55 | % | 99 | % | 155 | % | ||||||||||
The accompanying notes are an integral part of these financial statements.
135
Ohio National Fund, Inc.
U.S. Equity Portfolio
U.S. Equity Portfolio
Objective/Strategy
The U.S. Equity Portfolio seeks capital appreciation with a secondary objective of capital preservation to provide long term growth by investing at least 80% of its net assets in equity securities traded in the U.S. within under-priced sectors and industries.
Performance as of December 31, 2009
Average Annual Total Returns: | ||||
| One year | 16.57% | |||
| Five years | -4.24% | |||
| Since inception (5/1/04) | -1.03% |
Past performance does not guarantee future results. The performance data quoted represents past performance and current returns may be lower or higher. Total return figures include change in share price and reinvestment of dividends and capital gains. The investment return and principal value will fluctuate so that an investor’s shares, when redeemed may be worth more or less than the original cost. To obtain performance information up to the most recent month end, call toll-free 1-877-781-6392.
The Portfolio is not open to direct retail investment. Beneficial interest in shares is obtained solely by purchase of variable life insurance policies and variable annuity contracts. Actual performance results for variable annuity and variable universal life contracts will be lower due to contract charges. Consult your contract for applicable charges.
Comments
For the year ended December 31, 2009, the U.S. Equity Portfolio returned 16.57% versus 27.25% for the current benchmark, the S&P Composite 1500 Index.
We utilize a two part investment process that relies on aggregated company-specific valuations and relative strength measurements to aid in our industry rotation methodology. In response to the market conditions of 2008, we took an in-depth look at the strengths and weaknesses of our methodology and determined our valuation process was not fully accounting for company-specific risk factors. In the first quarter of 2009, and after considerable thought and research, we modified our proprietary formula in an effort to more accurately account for this risk. Moving forward, we feel that we are now better equipped to handle all types of market conditions.
Going into 2009, we saw bargains in virtually every segment of the equity market. Because we saw value throughout the market, the Portfolio was fully invested and heavily allocated in the cyclical based Financials, Industrials, Consumer Discretionary, and Energy sectors in anticipation of a market rebound. Unfortunately, fears about the economy and consumer demand disconnected equity prices from their fundamentals and the market continued its free-fall with the S&P Composite 1500 Index losing almost 25% in just over two months between December 31, 2008 and March 9, 2009. While the Portfolio’s holdings were distributed where we thought we saw the most value, the Portfolio nonetheless under-performed the benchmark during this time period.
Improved debt markets and economic outlooks sparked one of the strongest equity rallies in recent history, as the S&P Composite 1500 Index increased over 69% between March 9 and December 31, 2009. The Portfolio, utilizing the modified methodology referenced above, performed well during this rally, returning over 69.8% and slightly out-performing the broad-based benchmark.
Top industry contributors to performance included investment banking & brokerage, apparel retail, oil & gas drilling, computer hardware, and systems software. Both over-weight positions and/or strong stock selection helped out-performance in these industries. Largest industry detractors from performance include; airlines, life & health insurance, construction & farm machinery & heavy trucks, steel, and retail REITS (Real Estate Investment Trusts). Over-weight positions and/or bad stock selection in these under-performing industries significantly detracted from overall performance. Based on valuations, the Portfolio began 2009 with approximately 66% of the Portfolio in large-cap issues — that large cap tilt was increased throughout 2009 and we finished the year with approximately 81% of the Portfolio in large-cap names. The five best performers were: Ashland Inc., Guess?, Inc., The Goldman Sachs Group, Inc., Navios Maritime Holdings, Inc., and BE Aerospace, Inc. The five worst performers were: Delta Air Lines, Inc., Republic Airways Holdings, Inc., Bank of America Corp., StanCorp Financial Group, Inc., and AFLAC, Inc. The five largest contributors were: The Goldman Sachs Group, Inc., Microsoft Corp., Ashland Inc., Guess?, Inc., and International Business Machines Corp. The five largest detractors were: Delta Air Lines, Inc., U.S. Steel, SkyWest, Inc., Caterpillar, Inc., and StanCorp Financial Group, Inc.(1)
Going into 2010, we are optimistic about the overall market. On January 4, 2010, we calculated an average value-to-price ratio of 1.08, indicating that, based on current conditions; we see approximately 8% more upside within the equity market. As far as sector allocation is concerned, we see a two part strategy based on forward looking growth estimates and economic conditions. We believe domestic growth will continue to improve but still remain below trend when compared to other historical recoveries; this points us towards high quality names in both the Health Care and Consumer Staples sectors. Conversely, we believe emerging markets such as China and India should see a more aggressive post recession rebound that will bode well for companies that benefit from growth in those regions. That points us towards the Materials and Energy sectors as well as large-cap names in the Information Technology and Industrials sectors.
| (1) | The Portfolio’s composition is subject to change. Holdings and weightings are as of December 31, 2009. |
(continued)
136
Ohio National Fund, Inc.
U.S. Equity Portfolio (Continued)
U.S. Equity Portfolio (Continued)
Change in Value of $10,000 Investment
![[PERFORMANCE GRAPH]](https://capedge.com/proxy/N-CSR/0000950123-10-021904/l38589l3858954.gif)
Hypothetical illustration based on past performance. Future performance will vary. The Portfolio’s returns reflect reinvested dividends. The Portfolio’s holdings may differ significantly from the securities in the index. The index is unmanaged and therefore does not reflect the cost of portfolio management and accounting.
The S&P Composite 1500 Index is a broad-based capitalization-weighted Index of 1500 U.S. Companies and is comprised of the S&P 400, S&P 500, and the S&P 600. The index was developed with a base value of 100 as of December 30, 1994. The index presented herein includes the effects of reinvested dividends.
Portfolio Composition as of December 31, 2009 (1)
| % of Net Assets | |||
Common Stocks (3) | 95.7 | ||
| Money Market Funds and Other Net Assets | 4.3 | ||
| 100.0 | |||
Top 10 Portfolio Holdings as of December 31, 2009 (1) (2)
| % of Net Assets | |||||||
| 1. | Microsoft Corp. | 3.6 | |||||
| 2. | International Business Machines Corp. | 2.8 | |||||
| 3. | Google, Inc. Class A | 2.8 | |||||
| 4. | General Electric Co. | 2.5 | |||||
| 5. | Hewlett-Packard Co. | 2.3 | |||||
| 6. | Merck & Co., Inc. | 2.3 | |||||
| 7. | Union Pacific Corp. | 2.1 | |||||
| 8. | CSX Corp. | 2.1 | |||||
| 9. | Tyco International Ltd. | 2.1 | |||||
| 10. | Procter & Gamble Co. / The | 2.0 | |||||
| (1) | Composition of Portfolio subject to change. | |
| (2) | Short-term investments have been excluded from the list of Top 10 Portfolio holdings. | |
| (3) | Sectors: |
| % of Net Assets | |||
| Information Technology | 19.6 | ||
| Industrials | 15.2 | ||
| Health Care | 13.8 | ||
| Energy | 11.3 | ||
| Materials | 9.6 | ||
| Consumer Staples | 8.2 | ||
| Financials | 7.1 | ||
| Consumer Discretionary | 6.6 | ||
| Utilities | 4.3 | ||
| 95.7 | |||
137
Ohio National Fund, Inc.
U.S. Equity Portfolio
U.S. Equity Portfolio
| Schedule of Investments | December 31, 2009 |
| Common Stocks – 95.7% | Shares | Value | ||||||
CONSUMER DISCRETIONARY – 6.6% | ||||||||
Hotels, Restaurants & Leisure – 0.9% | ||||||||
| McDonald’s Corp. | 2,070 | $ | 129,251 | |||||
Media – 2.1% | ||||||||
| Arbitron, Inc. | 6,700 | 156,914 | ||||||
| Time Warner, Inc. | 5,100 | 148,614 | ||||||
| 305,528 | ||||||||
Multiline Retail – 1.0% | ||||||||
| Target Corp. | 3,000 | 145,110 | ||||||
Textiles, Apparel & Luxury Goods – 2.6% | ||||||||
| NIKE, Inc. Class B | 2,240 | 147,997 | ||||||
| V.F. Corp. | 1,060 | 77,634 | ||||||
| Wolverine World Wide, Inc. | 5,810 | 158,148 | ||||||
| 383,779 | ||||||||
TOTAL CONSUMER DISCRETIONARY | 963,668 | |||||||
CONSUMER STAPLES – 8.2% | ||||||||
Food & Staples Retailing – 1.0% | ||||||||
| Walgreen Co. | 4,050 | 148,716 | ||||||
Food Products – 2.3% | ||||||||
| Campbell Soup Co. | 3,290 | 111,202 | ||||||
| ConAgra Foods, Inc. | 4,990 | 115,020 | ||||||
| Kellogg Co. | 2,090 | 111,188 | ||||||
| 337,410 | ||||||||
Household Products – 2.1% | ||||||||
| Procter & Gamble Co. / The | 4,910 | 297,693 | ||||||
Tobacco – 2.8% | ||||||||
| Altria Group, Inc. | 5,820 | 114,246 | ||||||
| Philip Morris International, Inc. | 2,930 | 141,197 | ||||||
| Reynolds American, Inc. | 3,000 | 158,910 | ||||||
| 414,353 | ||||||||
TOTAL CONSUMER STAPLES | 1,198,172 | |||||||
ENERGY – 11.3% | ||||||||
Energy Equipment & Services – 3.5% | ||||||||
| Diamond Offshore Drilling, Inc. | 2,280 | 224,398 | ||||||
| Noble Corp. | 5,430 | 221,001 | ||||||
| Transocean Ltd. (a) | 910 | 75,348 | ||||||
| 520,747 | ||||||||
Oil, Gas & Consumable Fuels – 7.8% | ||||||||
| BP PLC – ADR (b) | 2,450 | 142,026 | ||||||
| Chevron Corp. | 2,840 | 218,652 | ||||||
| China Petroleum & Chemical Corp. – ADR | 1,790 | 157,645 | ||||||
| ConocoPhillips | 4,190 | 213,983 | ||||||
| Exxon Mobil Corp. | 1,930 | 131,607 | ||||||
| Murphy Oil Corp. | 2,280 | 123,576 | ||||||
| StatoilHydro ASA – ADR | 6,080 | 151,453 | ||||||
| 1,138,942 | ||||||||
TOTAL ENERGY | 1,659,689 | |||||||
FINANCIALS – 7.1% | ||||||||
Capital Markets – 0.8% | ||||||||
| Goldman Sachs Group, Inc. / The | 710 | 119,876 | ||||||
Commercial Banks – 1.8% | ||||||||
| Credicorp Ltd. | 1,530 | 117,841 | ||||||
| U.S. Bancorp | 6,060 | 136,410 | ||||||
| 254,251 | ||||||||
Consumer Finance – 2.1% | ||||||||
| Cash America International, Inc. | 5,580 | 195,077 | ||||||
| Dollar Financial Corp. (a) | 4,900 | 115,934 | ||||||
| 311,011 | ||||||||
Insurance – 2.4% | ||||||||
| Aflac, Inc. | 3,170 | 146,613 | ||||||
| Hartford Financial Services Group, Inc. / The | 5,970 | 138,862 | ||||||
| Prudential Financial, Inc. | 1,400 | 69,664 | ||||||
| 355,139 | ||||||||
TOTAL FINANCIALS | 1,040,277 | |||||||
HEALTH CARE – 13.8% | ||||||||
Health Care Equipment & Supplies – 1.7% | ||||||||
| Becton, Dickinson & Co. | 1,090 | 85,957 | ||||||
| Medtronic, Inc. | 1,990 | 87,520 | ||||||
| Stryker Corp. | 1,470 | 74,044 | ||||||
| 247,521 | ||||||||
Health Care Providers & Services – 3.6% | ||||||||
| Cardinal Health, Inc. | 3,630 | 117,031 | ||||||
| Express Scripts, Inc. (a) | 1,310 | 113,250 | ||||||
| Patterson Companies., Inc. (a) | 5,300 | 148,294 | ||||||
| UnitedHealth Group, Inc. | 2,360 | 71,933 | ||||||
| WellPoint, Inc. (a) | 1,260 | 73,445 | ||||||
| 523,953 | ||||||||
Life Sciences Tools & Services – 1.0% | ||||||||
| Covance, Inc. (a) | 2,750 | 150,068 | ||||||
Pharmaceuticals – 7.5% | ||||||||
| Abbott Laboratories | 2,730 | 147,393 | ||||||
| Eli Lilly & Co. | 6,260 | 223,545 | ||||||
| GlaxoSmithKline PLC – ADR | 3,530 | 149,142 | ||||||
| Merck & Co., Inc. | 9,090 | 332,148 | ||||||
| Pfizer, Inc. | 13,740 | 249,931 | ||||||
| 1,102,159 | ||||||||
TOTAL HEALTH CARE | 2,023,701 | |||||||
INDUSTRIALS – 15.2% | ||||||||
Aerospace & Defense – 1.1% | ||||||||
| Honeywell International, Inc. | 4,010 | 157,192 | ||||||
Airlines – 0.7% | ||||||||
| Alaska Air Group, Inc. (a) | 2,790 | 96,422 | ||||||
Electrical Equipment – 0.5% | ||||||||
| Emerson Electric Co. | 1,750 | 74,550 | ||||||
Industrial Conglomerates – 5.5% | ||||||||
| General Electric Co. | 24,150 | 365,390 | ||||||
| Siemens AG – ADR | 1,530 | 140,301 | ||||||
| Tyco International Ltd. | 8,450 | 301,496 | ||||||
| 807,187 | ||||||||
(continued)
138
Ohio National Fund, Inc.
U.S. Equity Portfolio (Continued)
U.S. Equity Portfolio (Continued)
| Schedule of Investments | December 31, 2009 |
| Common Stocks – 95.7% | Shares | Value | ||||||
Machinery – 2.6% | ||||||||
| Harsco Corp. | 2,380 | $ | 76,707 | |||||
| Parker Hannifin Corp. | 5,520 | 297,418 | ||||||
| 374,125 | ||||||||
Marine – 0.6% | ||||||||
| Navios Maritime Holdings, Inc. | 14,930 | 90,327 | ||||||
Road & Rail – 4.2% | ||||||||
| CSX Corp. | 6,390 | 309,851 | ||||||
| Union Pacific Corp. | 4,850 | 309,915 | ||||||
| 619,766 | ||||||||
TOTAL INDUSTRIALS | 2,219,569 | |||||||
INFORMATION TECHNOLOGY – 19.6% | ||||||||
Communications Equipment – 2.0% | ||||||||
| Cisco Systems, Inc. (a) | 12,380 | 296,377 | ||||||
Computers & Peripherals – 6.2% | ||||||||
| Apple, Inc. (a) | 730 | 153,928 | ||||||
| Hewlett-Packard Co. | 6,660 | 343,056 | ||||||
| International Business Machines Corp. | 3,100 | 405,790 | ||||||
| 902,774 | ||||||||
Electronic Equipment, Instruments & Components – 0.5% | ||||||||
| Avnet, Inc. (a) | 2,460 | 74,194 | ||||||
Internet Software & Services – 2.8% | ||||||||
| Google, Inc. Class A (a) | 650 | 402,987 | ||||||
IT Services – 4.5% | ||||||||
| Accenture PLC | 3,120 | 129,480 | ||||||
| Computer Sciences Corp. (a) | 2,900 | 166,837 | ||||||
| Mastercard, Inc. Class A | 720 | 184,305 | ||||||
| Visa, Inc. | 2,110 | 184,541 | ||||||
| 665,163 | ||||||||
Software – 3.6% | ||||||||
| Microsoft Corp. | 17,430 | 531,441 | ||||||
TOTAL INFORMATION TECHNOLOGY | 2,872,936 | |||||||
MATERIALS – 9.6% | ||||||||
Chemicals – 5.7% | ||||||||
| Air Products and Chemicals, Inc. | 1,360 | 110,242 | ||||||
| Albemarle Corp. | 6,150 | 223,675 | ||||||
| Dow Chemical Co. / The | 3,840 | 106,099 | ||||||
| FMC Corp. | 2,700 | 150,552 | ||||||
| Praxair, Inc. | 1,380 | 110,828 | ||||||
| RPM International, Inc. | 6,030 | 122,590 | ||||||
| 823,986 | ||||||||
Metals & Mining – 3.9% | ||||||||
| Barrick Gold Corp. | 1,240 | 48,831 | ||||||
| BHP Billiton Ltd. – ADR | 1,420 | 108,744 | ||||||
| Freeport-McMoRan Copper & Gold, Inc. | 2,770 | 222,403 | ||||||
| Newmont Mining Corp. | 4,110 | 194,444 | ||||||
| 574,422 | ||||||||
TOTAL MATERIALS | 1,398,408 | |||||||
UTILITIES – 4.3% | ||||||||
Electric Utilities – 2.0% | ||||||||
| Edison International | 4,060 | 141,207 | ||||||
| Portland General Electric Co. | 7,000 | 142,870 | ||||||
| 284,077 | ||||||||
Multi-Utilities – 2.3% | ||||||||
| Alliant Energy Corp. | 2,560 | 77,465 | ||||||
| Dominion Resources Inc. | 1,950 | 75,894 | ||||||
| PG&E Corp. | 2,460 | 109,839 | ||||||
| Xcel Energy, Inc. | 3,600 | 76,392 | ||||||
| 339,590 | ||||||||
TOTAL UTILITIES | 623,667 | |||||||
Total Common Stocks (Cost $12,139,094) | $ | 14,000,087 | ||||||
| Money Market Funds – 4.0% | Shares | Value | ||||||
| Fidelity Institutional Money Market Funds | ||||||||
| Money Market Portfolio – Class I | 585,000 | $ | 585,000 | |||||
Total Money Market Funds (Cost $585,000) | $ | 585,000 | ||||||
Total Investments – 99.7% (Cost $12,724,094) (b) | $ | 14,585,087 | ||||||
Other Assets in Excess of Liabilities – 0.3% | 44,915 | |||||||
Net Assets – 100.0% | $ | 14,630,002 | ||||||
Percentages are stated as a percent of net assets.
Abbreviations:
ADR: American Depository Receipts
Footnotes:
| (a) | Non-income producing security. | |
| (b) | Represents cost for financial reporting purposes, which may differ from cost basis for Federal income tax purposes. See also Note 8 of the Notes to Financial Statements. |
The accompanying notes are an integral part of these financial statements.
139
Ohio National Fund, Inc.
U.S. Equity Portfolio
U.S. Equity Portfolio
Statement of Assets and Liabilities
December 31, 2009
| Assets: | ||||
| Investments in securities, at value (Cost $12,724,094) | $ | 14,585,087 | ||
| Cash | 647 | |||
| Receivable for securities sold | 364,993 | |||
| Receivable for fund shares sold | 1,010 | |||
| Dividends and accrued interest receivable | 27,703 | |||
| Prepaid expenses and other assets | 235 | |||
| Total assets | 14,979,675 | |||
| Liabilities: | ||||
| Payable for securities purchased | 322,494 | |||
| Payable for fund shares redeemed | 1,763 | |||
| Payable for investment management services | 9,303 | |||
| Payable for compliance services | 1,677 | |||
| Accrued custody expense | 329 | |||
| Accrued professional fees | 11,103 | |||
| Accrued accounting fees | 2,028 | |||
| Accrued printing and filing fees | 976 | |||
| Total liabilities | 349,673 | |||
| Net assets | $ | 14,630,002 | ||
| Net assets consist of: | ||||
| Par value, $1 per share | $ | 1,597,451 | ||
| Paid-in capital in excess of par value | 19,698,292 | |||
| Accumulated net realized loss on investments | (8,545,817 | ) | ||
| Net unrealized appreciation on investments | 1,860,993 | |||
| Undistributed net investment income | 19,083 | |||
| Net assets | $ | 14,630,002 | ||
| Shares outstanding | 1,597,451 | |||
| Authorized Fund shares allocated to Portfolio | 5,000,000 | |||
| Net asset value per share | $ | 9.16 | ||
Statement of Operations
For the Year Ended December 31, 2009
| Investment income: | ||||
| Interest | $ | 4,019 | ||
| Dividends (net of withholding tax of $2,749) | 246,832 | |||
| Total investment income | 250,851 | |||
| Expenses: | ||||
| Management fees | 97,310 | |||
| Custodian fees | 3,040 | |||
| Directors’ fees | 1,384 | |||
| Professional fees | 12,448 | |||
| Accounting fees | 11,445 | |||
| Printing and filing fees | 2,107 | |||
| Compliance expense | 6,376 | |||
| Other | 372 | |||
| Total expenses | 134,482 | |||
| Net investment income | 116,369 | |||
| Realized/unrealized gain (loss) on investments: | ||||
| Net realized gain (loss) on investments | (657,934 | ) | ||
| Change in unrealized appreciation/depreciation on investments | 2,721,449 | |||
| Net realized/unrealized gain (loss) on investments | 2,063,515 | |||
| Change in net assets from operations | $ | 2,179,884 | ||
The accompanying notes are an integral part of these financial statements.
140
Ohio National Fund, Inc.
U.S. Equity Portfolio
U.S. Equity Portfolio
Statements of Changes in Net Assets
| Years Ended December 31, | ||||||||
| 2009 | 2008 | |||||||
Increase (Decrease) in Net Assets: | ||||||||
| Operations: | ||||||||
| Net investment income | $ | 116,369 | $ | 232,808 | ||||
| Net realized gain (loss) on investments and foreign currency related transactions | (657,934 | ) | (7,848,066 | ) | ||||
| Change in unrealized appreciation/depreciation on investments and foreign currency related transactions | 2,721,449 | (4,466,554 | ) | |||||
| Change in net assets from operations | 2,179,884 | (12,081,812 | ) | |||||
| Distributions to shareholders: | ||||||||
| Distributions from net investment income | (97,286 | ) | (195,588 | ) | ||||
| Capital transactions: | ||||||||
| Received from shares sold | 2,971,249 | 5,488,668 | ||||||
| Received from dividends reinvested | 97,286 | 195,588 | ||||||
| Paid for shares redeemed | (3,541,722 | ) | (5,158,816 | ) | ||||
| Change in net assets from capital transactions | (473,187 | ) | 525,440 | |||||
| Change in net assets | 1,609,411 | (11,751,960 | ) | |||||
Net Assets: | ||||||||
| Beginning of year | 13,020,591 | 24,772,551 | ||||||
| End of year | $ | 14,630,002 | $ | 13,020,591 | ||||
| Undistributed net investment income | $ | 19,083 | $ | 36,208 | ||||
Financial Highlights
| Years Ended December 31, | ||||||||||||||||||||
| 2009 | 2008 | 2007 | 2006 | 2005 | ||||||||||||||||
Selected Per-Share Data: | ||||||||||||||||||||
| Net asset value, beginning of year | $ | 7.91 | $ | 15.45 | $ | 13.70 | $ | 12.73 | $ | 11.71 | ||||||||||
| Operations: | ||||||||||||||||||||
| Net investment income (loss) | 0.07 | 0.14 | 0.06 | 0.05 | — | |||||||||||||||
| Net realized and unrealized gain (loss) on investments | ||||||||||||||||||||
| and foreign currency related transactions | 1.24 | (7.56 | ) | 1.74 | 0.96 | 1.02 | ||||||||||||||
| Total from operations | 1.31 | (7.42 | ) | 1.80 | 1.01 | 1.02 | ||||||||||||||
| Distributions: | ||||||||||||||||||||
| Distributions from net investment income | (0.06 | ) | (0.12 | ) | (0.05 | ) | (0.04 | ) | — | |||||||||||
| Net asset value, end of year | $ | 9.16 | $ | 7.91 | $ | 15.45 | $ | 13.70 | $ | 12.73 | ||||||||||
Total return | 16.57 | % | –47.98 | % | 13.17 | % | 7.93 | % | 8.71 | % | ||||||||||
Ratios and supplemental data: | ||||||||||||||||||||
| Net assets at end of year (millions) | $ | 14.6 | $ | 13.0 | $ | 24.8 | $ | 21.7 | $ | 12.7 | ||||||||||
| Ratios to average net assets: | ||||||||||||||||||||
| Expenses | 1.04 | % | 0.96 | % | 0.91 | % | 0.96 | % | 1.05 | % | ||||||||||
| Net investment income (loss) | 0.90 | % | 1.19 | % | 0.41 | % | 0.47 | % | 0.03 | % | ||||||||||
| Portfolio turnover rate | 173 | % | 216 | % | 128 | % | 139 | % | 136 | % | ||||||||||
The accompanying notes are an integral part of these financial statements.
141
Ohio National Fund, Inc.
Balanced Portfolio
Balanced Portfolio
Objective/Strategy
The Balanced Portfolio seeks capital appreciation and income by investing normally up to 75% of its assets in equity securities within under-priced sectors and industries while maintaining a minimum of 25% of its assets in fixed income securities.
Performance as of December 31, 2009
Average Annual Total Returns: | ||||
| One year | 24.92% | |||
| Five years | 3.71% | |||
| Since inception (5/1/04) | 5.56% |
Past performance does not guarantee future results. The performance data quoted represents past performance and current returns may be lower or higher. Total return figures include change in share price and reinvestment of dividends and capital gains. The investment return and principal value will fluctuate so that an investor’s shares, when redeemed may be worth more or less than the original cost. To obtain performance information up to the most recent month end, call toll-free 1-877-781-6392.
The Portfolio is not open to direct retail investment. Beneficial interest in shares is obtained solely by purchase of variable life insurance policies and variable annuity contracts. Actual performance results for variable annuity and variable universal life contracts will be lower due to contract charges. Consult your contract for applicable charges.
Comments
For the year ended December 31, 2009, the Balanced Portfolio returned 24.92% versus 20.02% for the current benchmark, which is composed of 60% S&P Composite 1500 Index and 40% Barclays Capital U.S. Universal Index.
Risk was the dominant theme in 2009. From the outset of the year through March 9th, investors shunned all types of risk and worried about the “second Great Depression”, bank and auto nationalization, deflation and hyperinflation all at the same time. From January 1, 2009 through March 9, 2009, the S&P Composite 1500 Index fell 24.90%, the Barclays Capital U.S. Universal Index lost 1.18% and even the “risk free” 10-year U.S. Treasury lost ground as its yield rose from 2.21% to 2.86%.
The only indicator that improved over this time period was the TED Spread. The TED Spread, a gauge of banks’ willingness to lend to one another, fell from its 2009 high of 1.35% on January 1st to 1.11% on March 9th. This one improving indicator proved prescient and it was the banks that reversed the freefall in risky assets on March 10th when Citigroup pre-announced a positive earnings surprise. This announcement, other similar earnings announcements and the favorably perceived results of the major bank stress tests helped lead risky assets to one of their best rallies of all time.
From the open on March 10, 2009 through the close on December 31, 2009, the S&P Composite 1500 Index rose 69.45% while the Barclays Capital U.S. Universal Index rose 9.90%. The Barclays Capital U.S. Universal Index, fueled by strong gains in corporate bonds, advanced in spite of a tremendous sell off in “risk free” securities such as the 10-year U.S. Treasury which saw its yield rise from 2.86% on March 10th to 3.84% to close the year.
The Portfolio’s out-performance in 2009 was generated by several key factors. First, in the equity portion of the Portfolio, we held over-weight positions in the cyclical Information Technology, Consumer Discretionary, Materials, and Industrials sectors which were the top 4 performing sectors within the S&P Composite 1500 Index. Second, our stock and industry holdings within the key cyclical sectors of the S&P Composite 1500 Index out-performed the respective sector benchmark returns. For example, our holdings in the Materials sector returned 104.78% versus a 49.72% return for the S&P Composite 1500 Materials Index, our holdings in Consumer Discretionary returned 72.71% versus a 43.45% return for the S&P Composite 1500 Consumer Discretionary Index, and our holdings in Information Technology returned 68.32% versus a 61.02% return for the S&P 1500 Composite Information Technology Index. Finally, our fixed income allocation rose approximately 14% out-performing the 8.60% return for the Barclays U.S. Universal Index. This out-performance was due in large part to the Portfolio’s over-weight position in corporate bonds and under-weight position in Treasury bonds.(1)
Our top five contributors to overall return were TJX Cos., Inc., Ashland, Inc., Google, Inc., Massey Energy Co. and Tech Data Corp. Our five largest detractors from performance were DryShips Inc., AFLAC, Inc., Pfizer, Inc., Exxon Mobil Corp. and Bank of America Corp. Our top five performers were Ashland Inc., Tech Data Corp., Massey Energy Co., Cognizant Technology Solutions Corp. and Google, Inc. Our five worst performers were DryShips Inc., Bank of America Corp., AFLAC, Inc., Republic Airways Holdings, Inc. and The Kroger Co.(1)
One slight change was made to our investment methodology during the year. Starting in February of 2009, we began to use company specific bond yields to account for risk rather than relying on company specific betas factored by the Moody’s Aaa Index. We feel this minor adjustment gives us a more reliable and timely indicator of risk premiums on a company specific level and allows us to be more precise in choosing the allocation between stocks and bonds. For example, after June 2nd we felt stocks were fairly valued with an overall market value-to-price (VP) ratio of 1.00 and, on the following day, rotated $998,729 or roughly 9% of the Portfolio out of equities and into cash and bonds. This proved to be an effective move as equities, as measured by the S&P Composite 1500 Index, fell 2.45% while bonds, as measured by the Barclay’s U.S. Universal Bond Index, rose 1.11% from June 4, 2009 through June 30, 2009. Aside from the slight modification noted above, there were no environmental changes that affected the management of the Portfolio and we were not disappointed by any environmental factors.(1)
Going into 2010, we are optimistic about the overall markets and certain areas specifically. We feel the equity market is undervalued with an overall 1.08 VP as of year end. More specifically we believe that large, blue chip companies are compelling while their higher beta, smaller cap peers appear slightly overvalued. We also continue to see value in corporate bonds and little value in Treasury securities. In sum, we believe investors will continue to be rewarded for moving out of “risk free” assets and into riskier assets, albeit large cap high quality risky assets.
| (1) | The Portfolio’s composition is subject to change. Holdings and weightings are as of December 31, 2009. |
(continued)
142
Ohio National Fund, Inc.
Balanced Portfolio (Continued)
Balanced Portfolio (Continued)
Change in Value of $10,000 Investment
![[PERFORMANCE GRAPH]](https://capedge.com/proxy/N-CSR/0000950123-10-021904/l38589l3858955.gif)
Hypothetical illustration based on past performance. Future performance will vary. The Portfolio’s returns reflect reinvested dividends. The Portfolio’s holdings may differ significantly from the securities in the index. The index is unmanaged and therefore does not reflect the cost of portfolio management and accounting.
The S&P Composite 1500 Index is a broad-based capitalization-weighted Index of 1500 U.S. Companies and is comprised of the S&P 400, S&P 500, and the S&P 600. The index was developed with a base value of 100 as of December 30, 1994. The index presented herein includes the effects of reinvested dividends.
The Barclays Capital U.S. Universal Index represents the union of the U.S. Aggregate Index, the U.S. High-Yield Corporate Index, the 144A Index, the Eurodollar Index, the Emerging Markets Index, the non-ERISA portion of the Commercial Mortgage-Backed Securities (CMBS) Index and the CMBS High-Yield Index. All securities in this market-value weighted index have at least one year remaining to maturity and meet certain minimum issue size criteria.
Top 10 Portfolio Holdings as of December 31, 2009 (1) (2)
| % of Net Assets | |||||||
| 1. | Hewlett-Packard Co. | 2.1 | |||||
| 2. | PPL Energy Supply LLC 6.500%, 05/01/2018 | 1.9 | |||||
| 3. | Google, Inc. Class A | 1.8 | |||||
| 4. | General Electric Co. | 1.7 | |||||
| 5. | Wells Fargo Capital XI 6.250%, cumulative | 1.7 | |||||
| 6. | Exxon Mobil Corp. | 1.6 | |||||
| 7. | TJX Cos., Inc. / The | 1.6 | |||||
| 8. | Rohm & Haas Co. 5.600%, 03/15/2013 | 1.6 | |||||
| 9. | International Business Machines Corp. | 1.5 | |||||
| 10. | American Express Credit Corp. 0.351%, 02/24/2012 | 1.4 | |||||
Portfolio Composition as of December 31, 2009 (1)
| % of Net Assets | |||
Common Stocks (3) | 60.7 | ||
Preferred Stocks (3) | 1.6 | ||
Corporate Bonds (3) | 31.1 | ||
| U.S. Government Agency Issues | 1.9 | ||
| Money Market Funds and Other Net Assets | 4.7 | ||
| 100.0 | |||
| (1) | Composition of Portfolio subject to change. | |
| (2) | Short-term investments have been excluded from the list of Top 10 Portfolio holdings. | |
| (3) | Sectors (combined): |
| % of Net Assets | |||
| Financials | 25.0 | ||
| Health Care | 12.6 | ||
| Information Technology | 12.4 | ||
| Industrials | 9.2 | ||
| Utilities | 8.4 | ||
| Consumer Discretionary | 7.4 | ||
| Materials | 6.5 | ||
| Energy | 6.1 | ||
| Consumer Staples | 4.4 | ||
| Telecommunication Services | 1.4 | ||
| 93.4 | |||
143
Ohio National Fund, Inc.
Balanced Portfolio
Balanced Portfolio
| Schedule of Investments | December 31, 2009 |
| Common Stocks – 60.7% | Shares | Value | ||||||
CONSUMER DISCRETIONARY – 4.4% | ||||||||
Media – 1.1% | ||||||||
| Comcast Corp. Class A | 9,000 | $ | 151,740 | |||||
Multiline Retail – 1.0% | ||||||||
| Target Corp. | 2,700 | 130,599 | ||||||
Specialty Retail – 1.6% | ||||||||
| TJX Cos., Inc. / The | 6,000 | 219,300 | ||||||
Textiles, Apparel & Luxury Goods – 0.7% | ||||||||
| NIKE, Inc. Class B | 1,500 | 99,105 | ||||||
TOTAL CONSUMER DISCRETIONARY | 600,744 | |||||||
CONSUMER STAPLES – 3.6% | ||||||||
Beverages – 0.6% | ||||||||
Coca-Cola Co. / The | 1,500 | 85,500 | ||||||
Food & Staples Retailing – 1.5% | ||||||||
| CVS Caremark Corp. | 3,600 | 115,956 | ||||||
| Kroger Co. / The | 4,000 | 82,120 | ||||||
| 198,076 | ||||||||
Household Products – 0.5% | ||||||||
| Kimberly-Clark Corp. | 1,100 | 70,081 | ||||||
Tobacco – 1.0% | ||||||||
| Altria Group, Inc. | 7,000 | 137,410 | ||||||
TOTAL CONSUMER STAPLES | 491,067 | |||||||
ENERGY – 5.3% | ||||||||
Energy Equipment & Services – 1.3% | ||||||||
| Diamond Offshore Drilling, Inc. | 1,000 | 98,420 | ||||||
| Transocean Ltd. (a) | 1,000 | 82,800 | ||||||
| 181,220 | ||||||||
Oil, Gas & Consumable Fuels – 4.0% | ||||||||
| Chevron Corp. | 2,500 | 192,475 | ||||||
| Exxon Mobil Corp. | 3,250 | 221,617 | ||||||
| PetroChina Co Ltd. – ADR | 500 | 59,480 | ||||||
| Statoil ASA – ADR | 2,500 | 62,275 | ||||||
| 535,847 | ||||||||
TOTAL ENERGY | 717,067 | |||||||
FINANCIALS – 9.0% | ||||||||
Commercial Banks – 0.8% | ||||||||
| Shinhan Financial Group Co Ltd. – ADR (a) | 500 | 37,140 | ||||||
| U.S. Bancorp | 3,000 | 67,530 | ||||||
| 104,670 | ||||||||
Consumer Finance – 2.6% | ||||||||
| EZCORP, Inc. (a) | 9,000 | 154,890 | ||||||
| World Acceptance Corp. (a) | 5,400 | 193,482 | ||||||
| 348,372 | ||||||||
Insurance – 4.6% | ||||||||
| Aflac, Inc. | 1,700 | 78,625 | ||||||
| Allstate Corp. / The | 2,500 | 75,100 | ||||||
| Delphi Financial Group, Inc. | 3,000 | 67,110 | ||||||
| HCC Insurance Holdings, Inc. | 4,500 | 125,865 | ||||||
| Reinsurance Group America, Inc. | 1,000 | 47,650 | ||||||
| Sun Life Financial, Inc. | 2,500 | 71,800 | ||||||
| Travelers Companies, Inc. / The | 1,500 | 74,790 | ||||||
| Willis Group Holdings Ltd. | 3,500 | 92,330 | ||||||
| 633,270 | ||||||||
Real Estate Investment Trusts – 1.0% | ||||||||
| Annaly Capital Management, Inc. | 7,800 | 135,330 | ||||||
TOTAL FINANCIALS | 1,221,642 | |||||||
HEALTH CARE – 12.6% | ||||||||
Health Care Equipment & Supplies – 2.1% | ||||||||
| Covidien PLC | 3,000 | 143,670 | ||||||
| Stryker Corp. | 2,950 | 148,591 | ||||||
| 292,261 | ||||||||
Health Care Providers & Services – 3.2% | ||||||||
| Aetna, Inc. | 3,000 | 95,100 | ||||||
| AmerisourceBergen Corp. | 2,000 | 52,140 | ||||||
| Cardinal Health, Inc. | 1,000 | 32,240 | ||||||
| Laboratory Corporation of America Holdings (a) | 1,800 | 134,712 | ||||||
| McKesson Corp. | 2,000 | 125,000 | ||||||
| 439,192 | ||||||||
Pharmaceuticals – 7.3% | ||||||||
| Abbott Laboratories | 2,500 | 134,975 | ||||||
| Bayer AG – ADR | 1,000 | 79,800 | ||||||
| Eli Lily & Co. | 2,000 | 71,420 | ||||||
| GlaxoSmithKline PLC – ADR | 3,170 | 133,932 | ||||||
| Johnson & Johnson | 2,050 | 132,041 | ||||||
| Merck & Co Inc. | 4,000 | 146,160 | ||||||
| Novartis AG – ADR | 2,760 | 150,227 | ||||||
| Pfizer, Inc. | 7,500 | 136,425 | ||||||
| 984,980 | ||||||||
TOTAL HEALTH CARE | 1,716,433 | |||||||
INDUSTRIALS – 7.4% | ||||||||
Aerospace & Defense – 2.0% | ||||||||
| General Dynamics Corp. | 1,500 | 102,255 | ||||||
| L-3 Communications Holdings Inc. | 1,300 | 113,035 | ||||||
| Lockheed Martin Corp. | 400 | 30,140 | ||||||
| Northrop Grumman Corp. | 500 | 27,925 | ||||||
| 273,355 | ||||||||
Airlines – 0.4% | ||||||||
| Republic Airways Holdings, Inc. (a) | 6,500 | 48,035 | ||||||
Electrical Equipment – 0.7% | ||||||||
| Hubbell, Inc. | 2,000 | 94,600 | ||||||
Industrial Conglomerates – 2.5% | ||||||||
| General Electric Co. | 15,000 | 226,950 | ||||||
| Siemens AG – ADR | 1,300 | 119,210 | ||||||
| 346,160 | ||||||||
Machinery – 0.8% | ||||||||
| Pall Corp. | 2,000 | 72,400 | ||||||
| Parker Hannifin Corp. | 700 | 37,716 | ||||||
| 110,116 | ||||||||
(continued)
144
Ohio National Fund, Inc.
Balanced Portfolio (Continued)
Balanced Portfolio (Continued)
| Schedule of Investments | December 31, 2009 |
| Common Stocks – 60.7% | Shares | Value | ||||||
Road & Rail – 1.0% | ||||||||
| Union Pacific Corp. | 2,100 | $ | 134,190 | |||||
TOTAL INDUSTRIALS | 1,006,456 | |||||||
INFORMATION TECHNOLOGY – 10.9% | ||||||||
Computers & Peripherals – 3.6% | ||||||||
| Hewlett-Packard Co. | 5,420 | 279,184 | ||||||
| International Business Machines Corp. | 1,600 | 209,440 | ||||||
| 488,624 | ||||||||
Electronic Equipment, Instruments & Components – 0.9% | ||||||||
| Avnet, Inc. (a) | 2,500 | 75,400 | ||||||
| Insight Enterprises, Inc. (a) | 4,000 | 45,680 | ||||||
| 121,080 | ||||||||
Internet Software & Services – 1.8% | ||||||||
| Google, Inc. Class A (a) | 400 | 247,992 | ||||||
IT Services – 3.5% | ||||||||
| Accenture PLC | 3,380 | 140,270 | ||||||
| Automatic Data Processing, Inc. | 2,500 | 107,050 | ||||||
| Cognizant Technology Solutions Corp. Class A (a) | 1,910 | 86,523 | ||||||
| Mastercard, Inc. Class A | 520 | 133,110 | ||||||
| 466,953 | ||||||||
Software – 1.1% | ||||||||
| Microsoft Corp. | 5,020 | 153,060 | ||||||
TOTAL INFORMATION TECHNOLOGY | 1,477,709 | |||||||
MATERIALS – 2.2% | ||||||||
Chemicals – 2.2% | ||||||||
| FMC Corp. | 2,000 | 111,520 | ||||||
| Lubrizol Corp. | 2,500 | 182,375 | ||||||
TOTAL MATERIALS | 293,895 | |||||||
TELECOMMUNICATION SERVICES – 1.4% | ||||||||
Diversified Telecommunication Services – 1.4% | ||||||||
| AT&T, Inc. | 2,300 | 64,469 | ||||||
| Telefonica SA – ADR | 1,520 | 126,950 | ||||||
TOTAL TELECOMMUNICATION SERVICES | 191,419 | |||||||
UTILITIES – 3.9% | ||||||||
Electric Utilities – 1.7% | ||||||||
| NV Energy, Inc. | 4,990 | 61,776 | ||||||
| Portland General Electric Co. | 3,250 | 66,333 | ||||||
| Progress Energy, Inc. | 2,500 | 102,525 | ||||||
| 230,634 | ||||||||
Gas Utilities – 1.1% | ||||||||
| Southwest Gas Corp. | 5,000 | 142,650 | ||||||
Multi-Utilities – 1.1% | ||||||||
| Consolidated Edison, Inc. | 1,500 | 68,145 | ||||||
| Public Service Enterprise Group, Inc. | 2,500 | 83,125 | ||||||
| 151,270 | ||||||||
TOTAL UTILITIES | 524,554 | |||||||
Total Common Stocks (Cost $7,342,997) | $ | 8,240,986 | ||||||
| Preferred Stocks – 1.6% | Shares | Value | ||||||
FINANCIALS – 1.6% | ||||||||
Commercial Banks – 1.6% | ||||||||
| Wells Fargo Capital XI 6.250%, cumulative | 10,000 | $ | 224,900 | |||||
Total Preferred Stocks (Cost $205,310) | $ | 224,900 | ||||||
| Face | ||||||||
| Corporate Bonds – 31.1% | Amount | Value | ||||||
CONSUMER DISCRETIONARY – 3.0% | ||||||||
Automobiles – 0.2% | ||||||||
| Daimler Finance North America LLC 6.500%, 11/15/2013 | $ | 30,000 | $ | 32,915 | ||||
Household Durables – 1.3% | ||||||||
| Black & Decker Corp. / The 8.950%, 04/15/2014 | 100,000 | 118,336 | ||||||
| Fortune Brands, Inc. 4.875%, 12/01/2013 | 50,000 | 51,117 | ||||||
| 169,453 | ||||||||
Leisure Equipment & Products – 0.3% | ||||||||
| Eastman Kodak Co. 7.250%, 11/15/2013 | 50,000 | 41,500 | ||||||
Multiline Retail – 1.2% | ||||||||
| Dillard’s, Inc. 9.125%, 08/01/2011 | 46,000 | 46,000 | ||||||
| Nordstrom, Inc. 6.750%, 06/01/2014 | 100,000 | 111,787 | ||||||
| 157,787 | ||||||||
TOTAL CONSUMER DISCRETIONARY | 401,655 | |||||||
CONSUMER STAPLES – 0.8% | ||||||||
Tobacco – 0.8% | ||||||||
| Reynolds American, Inc. 7.250%, 06/01/2013 | 100,000 | 109,185 | ||||||
TOTAL CONSUMER STAPLES | 109,185 | |||||||
ENERGY – 0.8% | ||||||||
Oil, Gas & Consumable Fuels – 0.8% | ||||||||
| Petrobras International Finance Co. 7.750%, 09/15/2014 | 50,000 | 58,500 | ||||||
| Williams Companies, Inc. / The 7.125%, 09/01/2011 | 50,000 | 53,456 | ||||||
TOTAL ENERGY | 111,956 | |||||||
FINANCIALS – 14.4% | ||||||||
Capital Markets – 5.3% | ||||||||
| Goldman Sachs Group, Inc. / The 5.125%, 01/15/2015 | 100,000 | 105,192 | ||||||
| Merrill Lynch & Co., Inc. 5.450%, 02/05/2013 | 150,000 | 157,952 | ||||||
| 5.000%, 02/03/2014 | 10,000 | 10,129 | ||||||
| 0.760%, 05/05/2014 (b) | 150,000 | 143,135 | ||||||
(continued)
145
Ohio National Fund, Inc.
Balanced Portfolio (Continued)
Balanced Portfolio (Continued)
| Schedule of Investments | December 31, 2009 |
| Face | ||||||||
| Corporate Bonds – 31.1% | Amount | Value | ||||||
Capital Markets (continued) | ||||||||
| Morgan Stanley 0.564%, 01/15/2010 (b) | $ | 100,000 | $ | 100,007 | ||||
| 0.764%, 10/15/2015 (b) | 100,000 | 93,910 | ||||||
| 5.375%, 10/15/2015 | 100,000 | 103,453 | ||||||
| 713,778 | ||||||||
Commercial Banks – 1.0% | ||||||||
| UBS AG 5.875%, 12/20/2017 | 50,000 | 51,466 | ||||||
| Wells Fargo Bank 0.483%, 05/16/2016 (b) | 100,000 | 88,685 | ||||||
| 140,151 | ||||||||
Consumer Finance – 3.3% | ||||||||
| American Express Credit Corp. 0.351%, 02/24/2012 (b) | 200,000 | 195,564 | ||||||
| American General Finance 4.625%, 09/01/2010 | 50,000 | 48,466 | ||||||
| HSBC Finance Corp. 7.000%, 05/15/2012 | 50,000 | 54,398 | ||||||
| 6.375%, 11/27/2012 | 50,000 | 54,488 | ||||||
| 2.020%, 11/10/2013 (b) | 100,000 | 96,215 | ||||||
| 449,131 | ||||||||
Diversified Financial Services – 1.3% | ||||||||
| Bank of America NA 0.554%, 06/15/2017 (b) | 50,000 | 42,561 | ||||||
| Bear Stearns Companies LLC / The 0.657%, 11/21/2016 (b) | 50,000 | 45,634 | ||||||
| Citigroup, Inc. 5.300%, 10/17/2012 | 50,000 | 52,121 | ||||||
| 5.125%, 05/05/2014 | 40,000 | 39,850 | ||||||
| 180,166 | ||||||||
Insurance – 2.7% | ||||||||
| American International Group, Inc. 5.375%, 10/18/2011 | 50,000 | 49,677 | ||||||
| Swiss Re Solutions Holding Corp. 7.000%, 02/15/2026 | 40,000 | 39,175 | ||||||
| Hartford Financial Services Group, Inc. / The 5.250%, 10/15/2011 | 50,000 | 51,623 | ||||||
| 5.375%, 03/15/2017 | 50,000 | 47,733 | ||||||
| Prudential Financial, Inc. 5.100%, 09/20/2014 | 100,000 | 104,372 | ||||||
| 6.100%, 06/15/2017 | 50,000 | 51,833 | ||||||
| Unum Group 7.190%, 02/01/2028 | 30,000 | 24,697 | ||||||
| 369,110 | ||||||||
Real Estate Investment Trusts – 0.8% | ||||||||
| Simon Property Group LP 5.450%, 03/15/2013 | 100,000 | 102,561 | ||||||
TOTAL FINANCIALS | 1,954,897 | |||||||
INDUSTRIALS – 1.8% | ||||||||
Industrial Conglomerates – 0.1% | ||||||||
| General Electric Co. 5.000%, 02/01/2013 | 15,000 | 15,881 | ||||||
Machinery – 0.9% | ||||||||
| Ingersoll-Rand Global Holding Co. 9.500%, 04/15/2014 | 100,000 | 119,601 | ||||||
Road & Rail – 0.8% | ||||||||
| Ryder System, Inc. 5.000%, 04/01/2011 | 100,000 | 102,204 | ||||||
TOTAL INDUSTRIALS | 237,686 | |||||||
INFORMATION TECHNOLOGY – 1.5% | ||||||||
IT Services – 0.8% | ||||||||
| Western Union Co. / The 5.400%, 11/17/2011 | 100,000 | 106,816 | ||||||
Office Electronics – 0.7% | ||||||||
| Xerox Corp. 5.650%, 05/15/2013 | 100,000 | 104,276 | ||||||
TOTAL INFORMATION TECHNOLOGY | 211,092 | |||||||
MATERIALS – 4.3% | ||||||||
Chemicals – 3.6% | ||||||||
| Dow Chemical Co. / The 6.000%, 10/01/2012 | 100,000 | 107,639 | ||||||
| 7.600%, 05/15/2014 | 100,000 | 113,896 | ||||||
| E.I. Du Pont de Nemours & Co. 5.000%, 07/15/2013 | 50,000 | 53,906 | ||||||
| Rohm & Haas Co. 5.600%, 03/15/2013 | 200,000 | 211,240 | ||||||
| 486,681 | ||||||||
Metals & Mining – 0.7% | ||||||||
| Alcoa, Inc. 6.500%, 06/01/2011 | 100,000 | 105,481 | ||||||
TOTAL MATERIALS | 592,162 | |||||||
UTILITIES – 4.5% | ||||||||
Electric Utilities – 2.6% | ||||||||
| Arizona Public Service Co. 6.375%, 10/15/2011 | 50,000 | 53,547 | ||||||
| DPL, Inc. 6.875%, 09/01/2011 | 150,000 | 160,372 | ||||||
| Exelon Generation Co. LLC 5.350%, 01/15/2014 | 100,000 | 105,665 | ||||||
| PSEG Energy Holdings LLC 8.500%, 06/15/2011 | 25,000 | 26,281 | ||||||
| 345,865 | ||||||||
Independent Power Producers & Energy Traders – 1.9% | ||||||||
| PPL Energy Supply LLC 6.500%, 05/01/2018 | $ | 250,000 | $ | 261,093 | ||||
TOTAL UTILITIES | 606,958 | |||||||
Total Corporate Bonds (Cost $3,958,754) | $ | 4,225,591 | ||||||
(continued)
146
Ohio National Fund, Inc.
Balanced Portfolio (Continued)
Balanced Portfolio (Continued)
| Schedule of Investments | December 31, 2009 |
| Face | ||||||||
| U.S. Government Agency Issues – 1.9% | Amount | Value | ||||||
| Federal Home Loan Bank 4.500%, 09/16/2013 | $ | 20,000 | $ | 21,610 | ||||
| 5.375%, 08/15/2018 | 20,000 | 21,712 | ||||||
| Federal National Mortgage Association 5.500%, 03/15/2011 | 100,000 | 105,711 | ||||||
| 5.250%, 08/01/2012 | 100,000 | 106,778 | ||||||
Total U.S. Government Agency Issues (Cost $240,926) | $ | 255,811 | ||||||
| Money Market Funds – 4.3% | Shares | Value | ||||||
| Fidelity Institutional Money Market Funds | ||||||||
| Money Market Portfolio – Class I | 580,000 | $ | 580,000 | |||||
Total Money Market Funds (Cost $580,000) | $ | 580,000 | ||||||
Total Investments – 99.6% (Cost $12,327,987) (c) | $ | 13,527,288 | ||||||
Other Assets in Excess of Liabilities – 0.4% | 55,059 | |||||||
Net Assets – 100.0% | $ | 13,582,347 | ||||||
Percentages are stated as a percent of net assets.
Abbreviations:
ADR: American Depository Receipts
Footnotes:
| (a) | Non-income producing security. | |
| (b) | Security is a variable rate instrument in which the coupon rate is adjusted monthly or quarterly in concert with U.S. LIBOR or Consumer Price Index. Interest rates stated are those in effect at December 31, 2009. | |
| (c) | Represents cost for financial reporting purposes, which may differ from cost basis for Federal income tax purposes. See also Note 8 of the Notes to Financial Statements. |
The accompanying notes are an integral part of these financial statements.
147
Ohio National Fund, Inc.
Balanced Portfolio
Balanced Portfolio
Statement of Assets and Liabilities
December 31, 2009
| Assets: | ||||
| Investments in securities, at value (Cost $12,327,987) | $ | 13,527,288 | ||
| Cash | 347 | |||
| Receivable for fund shares sold | 6,285 | |||
| Dividends and accrued interest receivable | 73,621 | |||
| Prepaid expenses and other assets | 205 | |||
| Total assets | 13,607,746 | |||
| Liabilities: | ||||
| Payable for fund shares redeemed | 498 | |||
| Payable for investment management services | 7,405 | |||
| Payable for compliance services | 1,677 | |||
| Accrued custody expense | 106 | |||
| Accrued professional fees | 11,102 | |||
| Accrued accounting fees | 3,582 | |||
| Accrued printing and filing fees | 903 | |||
| Other accrued expenses | 126 | |||
| Total liabilities | 25,399 | |||
| Net assets | $ | 13,582,347 | ||
| Net assets consist of: | ||||
| Par value, $1 per share | $ | 1,034,552 | ||
| Paid-in capital in excess of par value | 13,023,095 | |||
| Accumulated net realized loss on investments | (1,720,803 | ) | ||
| Net unrealized appreciation/depreciation on: | ||||
| Investments | 1,199,301 | |||
| Foreign currency related transactions | 16 | |||
| Undistributed net investment income | 46,186 | |||
| Net assets | $ | 13,582,347 | ||
| Shares outstanding | 1,034,552 | |||
| Authorized Fund shares allocated to Portfolio | 3,000,000 | |||
| Net asset value per share | $ | 13.13 | ||
Statement of Operations
For the Year Ended December 31, 2009
| Investment income: | ||||
| Interest | $ | 247,375 | ||
| Dividends (net of withholding tax of $2,800) | 210,166 | |||
| Total investment income | 457,541 | |||
| Expenses: | ||||
| Management fees | 79,818 | |||
| Custodian fees | 1,331 | |||
| Directors’ fees | 1,211 | |||
| Professional fees | 12,345 | |||
| Accounting fees | 18,446 | |||
| Printing and filing fees | 1,922 | |||
| Compliance expense | 6,376 | |||
| Other | 277 | |||
| Total expenses | 121,726 | |||
| Net investment income | 335,815 | |||
| Realized/unrealized gain (loss) on investments | ||||
| and foreign currency related transactions: | ||||
| Net realized gain (loss) on: | ||||
| Investments | (190,772 | ) | ||
| Foreign currency related transactions | (9 | ) | ||
| Change in unrealized appreciation/depreciation on investments and foreign currency related transactions | 2,509,467 | |||
| Net realized/unrealized gain (loss) on investments and foreign currency related transactions | 2,318,686 | |||
| Change in net assets from operations | $ | 2,654,501 | ||
The accompanying notes are an integral part of these financial statements.
148
Ohio National Fund, Inc.
Balanced Portfolio
Balanced Portfolio
Statements of Changes in Net Assets
| Years Ended December 31, | ||||||||
| 2009 | 2008 | |||||||
Increase (Decrease) in Net Assets: | ||||||||
| Operations: | ||||||||
| Net investment income | $ | 335,815 | $ | 251,540 | ||||
| Net realized gain (loss) on investments and foreign currency related transactions | (190,781 | ) | (1,530,107 | ) | ||||
| Change in unrealized appreciation/depreciation on investments | 2,509,467 | (2,184,764 | ) | |||||
| Change in net assets from operations | 2,654,501 | (3,463,331 | ) | |||||
| Distributions to shareholders: | ||||||||
| Distributions from net investment income | (289,620 | ) | — | |||||
| Capital transactions: | ||||||||
| Received from shares sold | 4,421,101 | 5,969,464 | ||||||
| Received from dividends reinvested | 289,620 | — | ||||||
| Paid for shares redeemed | (3,118,826 | ) | (3,837,953 | ) | ||||
| Change in net assets from capital transactions | 1,591,895 | 2,131,511 | ||||||
| Change in net assets | 3,956,776 | (1,331,820 | ) | |||||
Net Assets: | ||||||||
| Beginning of year | 9,625,571 | 10,957,391 | ||||||
| End of year | $ | 13,582,347 | $ | 9,625,571 | ||||
| Undistributed net investment income | $ | 46,186 | $ | 251,129 | ||||
Financial Highlights
| Years Ended December 31, | ||||||||||||||||||||
| 2009 | 2008 | 2007 | 2006 | 2005 | ||||||||||||||||
Selected Per-Share Data: | ||||||||||||||||||||
| Net asset value, beginning of year | $ | 10.74 | $ | 14.70 | $ | 13.09 | $ | 11.70 | $ | 11.33 | ||||||||||
| Operations: | ||||||||||||||||||||
| Net investment income | 0.29 | 0.25 | 0.20 | 0.17 | 0.06 | |||||||||||||||
| Net realized and unrealized gain (loss) on investments and foreign currency related transactions | 2.39 | (4.21 | ) | 1.41 | 1.37 | 0.33 | ||||||||||||||
| Total from operations | 2.68 | (3.96 | ) | 1.61 | 1.54 | 0.39 | ||||||||||||||
| Distributions: | ||||||||||||||||||||
| Distributions from net investment income | (0.29 | ) | — | — | (0.15 | ) | (0.02 | ) | ||||||||||||
| Net asset value, end of year | $ | 13.13 | $ | 10.74 | $ | 14.70 | $ | 13.09 | $ | 11.70 | ||||||||||
Total return | 24.92 | % | –26.94 | % | 12.30 | % | 13.12 | % | 3.47 | % | ||||||||||
Ratios and supplemental data: | ||||||||||||||||||||
| Net assets at end of year (millions) | $ | 13.6 | $ | 9.6 | $ | 11.0 | $ | 7.6 | $ | 4.1 | ||||||||||
| Ratios to average net assets: | ||||||||||||||||||||
| Ratios net of expenses reduced or reimbursed by adviser: | ||||||||||||||||||||
| Expenses | 1.08 | % | 1.09 | % | 1.13 | % | 1.31 | % | 1.50 | % | ||||||||||
| Net investment income | 2.99 | % | 2.29 | % | 1.77 | % | 1.95 | % | 0.99 | % | ||||||||||
| Ratios assuming no expenses reduced or reimbursed by adviser: | ||||||||||||||||||||
| Expenses | 1.08 | % | 1.09 | % | 1.13 | % | 1.31 | % | 1.55 | % | ||||||||||
| Net investment income | 2.99 | % | 2.29 | % | 1.77 | % | 1.95 | % | 0.93 | % | ||||||||||
| Portfolio turnover rate | 72 | % | 80 | % | 81 | % | 105 | % | 118 | % | ||||||||||
The accompanying notes are an integral part of these financial statements.
149
Ohio National Fund, Inc.
Income Opportunity Portfolio
Income Opportunity Portfolio
Objective/Strategy
The Income Opportunity Portfolio seeks modest capital appreciation and maximization of realized gains by investing within under-priced industries.
Performance as of December 31, 2009
Average Annual Total Returns: | ||||
| One year | 13.14% | |||
| Five years | 0.81% | |||
| Since inception (5/1/04) | 2.00% |
Past performance does not guarantee future results. The performance data quoted represents past performance and current returns may be lower or higher. Total return figures include change in share price and reinvestment of dividends and capital gains. The investment return and principal value will fluctuate so that an investor’s shares, when redeemed may be worth more or less than the original cost. To obtain performance information up to the most recent month end, call toll-free 1-877-781-6392.
The Portfolio is not open to direct retail investment. Beneficial interest in shares is obtained solely by purchase of variable life insurance policies and variable annuity contracts. Actual performance results for variable annuity and variable universal life contracts will be lower due to contract charges. Consult your contract for applicable charges.
Comments
For the year ended December 31, 2009, the Income Opportunity Portfolio returned 13.14% versus 27.25% for the current benchmark, the S&P Composite 1500 Index.
Coming off one of the worst declines in stock market history — in 2008 the S&P 500 Index fell 36.9% — the market went into a free fall early in 2009. From the end of 2008 to March 9, 2009, the S&P 500 Index dropped 24.6%. Markets around the world were spiraling downward as panic spread that the global economy may be falling into another Great Depression. Then, suddenly on March 9, 2009, the market changed course and began a furious rally catapulting the S&P 500 Index up 37.8% over about a two-month period, between March 9 and May 8, 2009, as tensions eased that world economies were falling off a cliff. The U.S. equity market continued on a strong upward path for the rest of the year, and by the end of the historic roller coaster ride the S&P 500 Index was up 26.5% for the year.
Over the course of the year, economic data slowly started to stabilize going from disastrous to quite strong. First quarter Gross Domestic Product (GDP) was down 6.40%, but in the second quarter the economy seemed to be bottoming out with GDP falling just .70%. As has historically been the case, the stock market started to rally ahead of the turn around in the economy. So, even though the economy was doing poorly headed into March 9, the stock market anticipated an economic turnaround and headed higher prior to a positive GDP number. In the third quarter GDP came in at positive 2.20%, confirming what equity investors were looking for as they scooped up bargains several months prior to the release of this positive GDP number.
From a sector perspective, as fears subsided that the world financial system would completely collapse investors rushed in to buy beaten down stocks in the Financials sector. For the period from March 9 to December 31, 2009, the S&P Composite 1500 Financials Index was up just over 124%. Investors also flocked to cyclical sectors such as Materials and Consumer Discretionary as the economy turned around. Over this same period, the S&P Composite 1500 Materials Index rose 92.3%, and the S&P Composite 1500 Consumer Discretionary Index gained 89.8%. Meanwhile, more defensive oriented sectors, those that tend to hold up well in unfavorable economic conditions, also rose but not nearly as much. For example, the S&P Composite 1500 Consumer Staples Index was up 41.7% from March 9 to December 31, 2009.
Amid one of the most turbulent markets in history, the Portfolio rose 13.14% for the year, trailing the S&P Composite 1500 Index which rose 27.25%. However, the Portfolio was less volatile than its benchmark, providing a smoother, calmer ride for investors. The beta of the Portfolio — a statistic that measures the price movements of the Portfolio relative to the price movements of its benchmark — was .52 based on weekly returns, indicating that it was about half as volatile as its benchmark index.(1)
This year’s return performance and volatility provides an excellent example of the trade-off associated with the options hedging strategy that is used in this Portfolio. Over the long-term, the strategy of writing index call options and buying index put options is intended to reduce the effects of market volatility on the Portfolio. The trade-off, however, is that the hedging strategy can limit the upside potential of the Portfolio.
In extreme cases, periods when the market moves dramatically in either direction in a very short period, the trade-off associated with this strategy can be stark. For example, over a seven day trading period this year, from March 9 to March 18, the benchmark index soared 17.72% while the Portfolio rose just 3.35%. This seven day trading period accounted for virtually all of the under-performance of the Portfolio vs. its benchmark index this year. On the other hand, when the market plummeted over a five day period — from October 3 to October 7, 2008— the benchmark fell 17.92% while the Portfolio dropped just 3.21%.
Drilling down further into the equity performance, our top five contributors were Exxon Mobil Corp., Ashland Inc., Cognizant Technology Solutions Corp., The Procter & Gamble Co., and The Goldman Sachs Group, Inc. The five largest detractors from the Portfolio’s performance were Apple, Inc., SkyWest Inc., MetLife, Inc., Allianz SE, and Sunoco Inc. Our top total return performing stocks were Mechel OAO, Ashland Inc., Cognizant Technology Solutions Corp., Guess?, Inc., and Ing Groep N.V. Our bottom total return performing stocks were Allianz SE, DryShips Inc., SkyWest Inc., AFLAC, Inc., and Heartland Payment Systems Inc.(1)
It is important to note that last year we did make a slight adjustment to our valuation model. Following the almost unprecedented market free fall in 2008, we re-examined our quantitative valuation model to see if we could fine tune our ability to more accurately value stocks. Based on comprehensive research we concluded that a minor adjustment was justified. The adjustment we made slightly modified how we account for company specific risk in our model. Prior to 2008, we used a proxy for the interest rate associated with investment grade bonds — the Moody’s AAA bond yield Index — as the variable to account for company specific risk. However, after comprehensive research, we
(continued)
150
Ohio National Fund, Inc.
Income Opportunity Portfolio (Continued)
Income Opportunity Portfolio (Continued)
adjusted this variable in our model. Starting in February 2009, we stopped using the Moody’s AAA proxy as the bond yield and instead we now use company specific bond yields.
Looking ahead to 2010, we believe the market will continue on its upward trajectory. With economic conditions improving and company earnings generally growing again, the fears that gripped the market early last year have faded considerably. We believe the market is about 8% under-priced as we start 2009. Should corporate credit spreads continue to narrow as they have been for some time now, this could provide a further boost to equity valuations. Keeping in line with this outlook, the Portfolio is fully invested. Further, in keeping with the Portfolio’s stated strategy we will continue to hedge our equity holdings.(1)
| (1) | The Portfolio’s composition is subject to change. Holdings and weightings are as of December 31, 2009. |
Change in Value of $10,000 Investment
![[PERFORMANCE GRAPH]](https://capedge.com/proxy/N-CSR/0000950123-10-021904/l38589l3858956.gif)
Hypothetical illustration based on past performance. Future performance will vary. The Portfolio’s returns reflect reinvested dividends. The Portfolio’s holdings may differ significantly from the securities in the index. The index is unmanaged and therefore does not reflect the cost of portfolio management and accounting.
The S&P Composite 1500 Index is a broad-based capitalization-weighted index of 1500 U.S. Companies and is comprised of the S&P 400, S&P 500, and the S&P 600. The index was developed with a base value of 100 as of December 30, 1994. The index presented herein includes the effects of reinvested dividends.
Portfolio Composition as of December 31, 2009 (1)
| % of Net Assets | |||
Common Stocks (3) | 99.7 | ||
| Purchased Options | 0.1 | ||
| Written Options Outstanding | (2.1) | ||
| Money Market Funds Less Net Liabilities | 2.3 | ||
| 100.0 | |||
Top 10 Portfolio Holdings as of December 31, 2009 (1) (2)
| % of Net Assets | |||||||
| 1. | Microsoft Corp. | 4.6 | |||||
| 2. | International Business Machines Corp. | 2.5 | |||||
| 3. | Hewlett-Packard Co. | 2.1 | |||||
| 4. | Kimberly-Clark Corp. | 2.0 | |||||
| 5. | Merck & Co, Inc. | 2.0 | |||||
| 6. | Google, Inc. Class A | 1.9 | |||||
| 7. | ConocoPhillips | 1.8 | |||||
| 8. | Pfizer, Inc. | 1.6 | |||||
| 9. | Medtronic, Inc. | 1.6 | |||||
| 10. | Apple, Inc. | 1.6 | |||||
| (1) | Composition of Portfolio subject to change. | |
| (2) | Short-term investments have been excluded from the list of Top 10 Portfolio holdings. | |
| (3) | Sectors: |
| % of Net Assets | |||
| Health Care | 20.2 | ||
| Information Technology | 18.4 | ||
| Consumer Staples | 13.7 | ||
| Industrials | 12.6 | ||
| Financials | 7.6 | ||
| Energy | 7.2 | ||
| Consumer Discretionary | 7.0 | ||
| Utilities | 6.6 | ||
| Materials | 4.8 | ||
| Telecommunication Services | 1.6 | ||
| 99.7 | |||
151
Ohio National Fund, Inc.
Income Opportunity Portfolio
Income Opportunity Portfolio
| Schedule of Investments | December 31, 2009 |
| Common Stocks – 99.7% | Shares | Value | ||||||
CONSUMER DISCRETIONARY – 7.0% | ||||||||
Media – 3.4% | ||||||||
| Arbitron, Inc. | 2,100 | $ | 49,182 | |||||
| Time Warner Cable, Inc. (b) | 1,100 | 45,529 | ||||||
| Time Warner, Inc. | 1,200 | 34,968 | ||||||
| Walt Disney Co. / The (b) | 3,100 | 99,975 | ||||||
| 229,654 | ||||||||
Multiline Retail – 0.9% | ||||||||
| Target Corp. (b) | 1,300 | 62,881 | ||||||
Specialty Retail – 0.7% | ||||||||
| TJX Cos., Inc. / The (b) | 1,300 | 47,515 | ||||||
Textiles, Apparel & Luxury Goods – 2.0% | ||||||||
| NIKE, Inc. Class B (b) | 900 | 59,463 | ||||||
| V.F. Corp. | 300 | 21,972 | ||||||
| Wolverine World Wide, Inc. (b) | 1,800 | 48,996 | ||||||
| 130,431 | ||||||||
TOTAL CONSUMER DISCRETIONARY | 470,481 | |||||||
CONSUMER STAPLES – 13.7% | ||||||||
Beverages – 2.4% | ||||||||
| Constellation Brands, Inc. Class A (a) | 1,700 | 27,081 | ||||||
| Pepsi Bottling Group, Inc. / The (b) | 900 | 33,750 | ||||||
| PepsiCo, Inc. (b) | 1,600 | 97,280 | ||||||
| 158,111 | ||||||||
Food & Staples Retailing – 2.3% | ||||||||
| Sysco Corp. (b) | 3,400 | 94,996 | ||||||
| Walgreen Co. (b) | 1,700 | 62,424 | ||||||
| 157,420 | ||||||||
Food Products – 2.9% | ||||||||
| Campbell Soup Co. (b) | 2,300 | 77,740 | ||||||
| ConAgra Foods, Inc. | 2,000 | 46,100 | ||||||
| Kellogg Co. | 700 | 37,240 | ||||||
| Unilever NV | 1,100 | 35,563 | ||||||
| 196,643 | ||||||||
Household Products – 3.3% | ||||||||
| Clorox Co. / The | 800 | 48,800 | ||||||
| Kimberly-Clark Corp. (b) | 2,100 | 133,791 | ||||||
| Procter & Gamble Co. / The | 600 | 36,378 | ||||||
| 218,969 | ||||||||
Tobacco – 2.8% | ||||||||
| Altria Group, Inc. (b) | 5,200 | 102,076 | ||||||
| Lorillard, Inc. | 400 | 32,092 | ||||||
| Reynolds American, Inc. (b) | 1,000 | 52,970 | ||||||
| 187,138 | ||||||||
TOTAL CONSUMER STAPLES | 918,281 | |||||||
ENERGY – 7.2% | ||||||||
Energy Equipment & Services – 1.6% | ||||||||
| Atwood Oceanics, Inc. (a) (b) | 1,400 | 50,190 | ||||||
| Diamond Offshore Drilling, Inc. (b) | 400 | 39,368 | ||||||
| Transocean Ltd. (a) (b) | 200 | 16,560 | ||||||
| 106,118 | ||||||||
Oil, Gas & Consumable Fuels – 5.6% | ||||||||
| BP PLC – ADR | 800 | 46,376 | ||||||
| Chevron Corp. (b) | 1,200 | 92,388 | ||||||
| ConocoPhillips (b) | 2,400 | 122,568 | ||||||
| Occidental Petroleum Corp. (b) | 900 | 73,215 | ||||||
| Royal Dutch Shell PLC – ADR | 700 | 42,077 | ||||||
| 376,624 | ||||||||
TOTAL ENERGY | 482,742 | |||||||
FINANCIALS – 7.6% | ||||||||
Capital Markets – 0.9% | ||||||||
| Ameriprise Financial, Inc. (b) | 800 | 31,056 | ||||||
| Deutsche Bank AG (b) | 400 | 28,364 | ||||||
| 59,420 | ||||||||
Commercial Banks – 1.6% | ||||||||
| Credicorp Ltd. (b) | 400 | 30,808 | ||||||
| PNC Financial Services Group, Inc. (b) | 700 | 36,953 | ||||||
| U.S. Bancorp | 1,700 | 38,267 | ||||||
| 106,028 | ||||||||
Consumer Finance – 0.5% | ||||||||
| Cash America International, Inc. (b) | 1,000 | 34,960 | ||||||
Insurance – 4.6% | ||||||||
| Allianz SE – ADR (b) | 2,300 | 28,635 | ||||||
| Allstate Corp. / The (b) | 1,600 | 48,064 | ||||||
| Everest Re Group, Ltd. | 300 | 25,704 | ||||||
| Loews Corp. | 1,000 | 36,350 | ||||||
| PartnerRe Ltd. | 500 | 37,330 | ||||||
| Prudential Financial, Inc. (b) | 1,100 | 54,736 | ||||||
| Reinsurance Group of America, Inc. | 500 | 23,825 | ||||||
| Travelers Companies, Inc. / The (b) | 1,000 | 49,860 | ||||||
| 304,504 | ||||||||
TOTAL FINANCIALS | 504,912 | |||||||
HEALTH CARE – 20.2% | ||||||||
Health Care Equipment & Supplies – 4.2% | ||||||||
| Becton, Dickinson & Co. | 600 | 47,316 | ||||||
| Medtronic, Inc. (b) | 2,400 | 105,552 | ||||||
| Stryker Corp. (b) | 1,300 | 65,481 | ||||||
| Varian Medical Systems, Inc. (a) (b) | 1,300 | 60,905 | ||||||
| 279,254 | ||||||||
Health Care Providers & Services – 7.0% | ||||||||
| Aetna, Inc. | 2,200 | 69,740 | ||||||
| AmerisourceBergen Corp. (b) | 3,400 | 88,638 | ||||||
| Cardinal Health, Inc. (b) | 1,900 | 61,256 | ||||||
| Express Scripts, Inc. (a) (b) | 1,000 | 86,450 | ||||||
| Humana, Inc. (a) | 1,200 | 52,668 | ||||||
| Patterson Companies., Inc. (a) | 1,700 | 47,566 | ||||||
| Quest Diagnostics, Inc. (b) | 1,100 | 66,418 | ||||||
| 472,736 | ||||||||
Pharmaceuticals – 9.0% | ||||||||
| Abbott Laboratories (b) | 1,900 | 102,581 | ||||||
| Allergan, Inc. (b) | 600 | 37,806 | ||||||
| GlaxoSmithKline PLC – ADR (b) | 2,100 | 88,725 | ||||||
| Medicis Pharmaceutical Corp. Class A | 800 | 21,640 | ||||||
(continued)
152
Ohio National Fund, Inc.
Income Opportunity Portfolio (Continued)
Income Opportunity Portfolio (Continued)
| Schedule of Investments | December 31, 2009 |
| Common Stocks – 99.7% | Shares | Value | ||||||
Pharmaceuticals (continued) | ||||||||
| Merck & Co, Inc. (b) | 3,600 | $ | 131,544 | |||||
| Mylan, Inc. (a) | 1,100 | 20,273 | ||||||
| Novartis AG – ADR (b) | 1,000 | 54,430 | ||||||
| Pfizer, Inc. (b) | 6,000 | 109,140 | ||||||
| Sanofi-Aventis – ADR | 900 | 35,343 | ||||||
| 601,482 | ||||||||
TOTAL HEALTH CARE | 1,353,472 | |||||||
INDUSTRIALS – 12.6% | ||||||||
Aerospace & Defense – 3.6% | ||||||||
| General Dynamics Corp. | 500 | 34,085 | ||||||
| Honeywell International, Inc. | 800 | 31,360 | ||||||
| Northrop Grumman Corp. | 1,400 | 78,190 | ||||||
| United Technologies Corp. (b) | 1,400 | 97,174 | ||||||
| 240,809 | ||||||||
Commercial Services & Supplies – 0.5% | ||||||||
| ATC Technology Corp. (a) (b) | 1,300 | 31,005 | ||||||
Electrical Equipment – 0.7% | ||||||||
| Cooper Industries PLC | 500 | 21,320 | ||||||
| Hubbell, Inc. (b) | 600 | 28,380 | ||||||
| 49,700 | ||||||||
Industrial Conglomerates – 3.4% | ||||||||
| 3M Co. (b) | 1,100 | 90,937 | ||||||
| General Electric Co. (b) | 4,200 | 63,546 | ||||||
| Siemens AG – ADR (b) | 800 | 73,360 | ||||||
| 227,843 | ||||||||
Machinery – 1.4% | ||||||||
| Eaton Corp. | 400 | 25,448 | ||||||
| Parker Hannifin Corp. | 400 | 21,552 | ||||||
| Snap-On, Inc. (b) | 1,100 | 46,486 | ||||||
| 93,486 | ||||||||
Road & Rail – 2.3% | ||||||||
| CSX Corp. (b) | 1,700 | 82,433 | ||||||
| Union Pacific Corp. (b) | 1,100 | 70,290 | ||||||
| 152,723 | ||||||||
Trading Companies & Distributors – 0.7% | ||||||||
| W.W. Grainger, Inc. (b) | 500 | 48,415 | ||||||
TOTAL INDUSTRIALS | 843,981 | |||||||
INFORMATION TECHNOLOGY – 18.4% | ||||||||
Computers & Peripherals – 6.9% | ||||||||
| Apple, Inc. (a) (b) | 500 | 105,430 | ||||||
| Hewlett-Packard Co. | 2,700 | 139,077 | ||||||
| International Business Machines Corp. (b) | 1,300 | 170,170 | ||||||
| Western Digital Corp. (a) | 1,000 | 44,150 | ||||||
| 458,827 | ||||||||
Internet Software & Services – 1.9% | ||||||||
| AOL, Inc. (a) | 109 | 2,538 | ||||||
| Google, Inc. Class A (a) (b) | 200 | 123,996 | ||||||
| 126,534 | ||||||||
IT Services – 4.5% | ||||||||
| Accenture PLC | 1,100 | 45,650 | ||||||
| Amdocs Ltd. (a) | 2,700 | 77,031 | ||||||
| Computer Sciences Corp. (a) | 1,000 | 57,530 | ||||||
| MasterCard, Inc. Class A | 200 | 51,196 | ||||||
| Visa, Inc. (b) | 800 | 69,968 | ||||||
| 301,375 | ||||||||
Semiconductors & Semiconductor Equipment – 0.6% | ||||||||
| Intel Corp. (b) | 2,000 | 40,800 | ||||||
Software – 4.5% | ||||||||
| Microsoft Corp. (b) | 10,000 | 304,900 | ||||||
TOTAL INFORMATION TECHNOLOGY | 1,232,436 | |||||||
MATERIALS – 4.8% | ||||||||
Chemicals – 3.0% | ||||||||
| Air Products and Chemicals, Inc. | 500 | 40,530 | ||||||
| Ecolab, Inc. | 500 | 22,290 | ||||||
| Lubrizol Corp. (b) | 700 | 51,065 | ||||||
| Potash Corp. of Saskatchewan, Inc. | 800 | 86,800 | ||||||
| 200,685 | ||||||||
Metals & Mining – 1.8% | ||||||||
| BHP Billiton Ltd. – ADR | 300 | 22,974 | ||||||
| Freeport-McMoRan Copper & Gold, Inc. (b) | 600 | 48,174 | ||||||
| Newmont Mining Corp. (b) | 1,000 | 47,310 | ||||||
| 118,458 | ||||||||
TOTAL MATERIALS | 319,143 | |||||||
TELECOMMUNICATION SERVICES – 1.6% | ||||||||
Diversified Telecommunication Services – 1.1% | ||||||||
| AT&T, Inc. | 1,300 | 36,439 | ||||||
| Verizon Communications, Inc. | 1,100 | 36,443 | ||||||
| 72,882 | ||||||||
Wireless Telecommunication Services – 0.5% | ||||||||
| America Movil SAB de C.V. – ADR | 700 | 32,886 | ||||||
TOTAL TELECOMMUNICATION SERVICES | 105,768 | |||||||
UTILITIES – 6.6% | ||||||||
Electric Utilities – 2.0% | ||||||||
| American Electric Power Co., Inc. (b) | 1,700 | 59,143 | ||||||
| Pinnacle West Capital Corp. | 900 | 32,922 | ||||||
| Southern Co. / The | 1,300 | 43,316 | ||||||
| 135,381 | ||||||||
Gas Utilities – 1.2% | ||||||||
| AGL Resources, Inc. | 1,100 | 40,117 | ||||||
| ONEOK, Inc. | 900 | 40,113 | ||||||
| 80,230 | ||||||||
Independent Power Producers & Energy Traders – 0.3% | ||||||||
| Constellation Energy Group, Inc. | 600 | 21,102 | ||||||
Multi-Utilities – 3.1% | ||||||||
| Consolidated Edison, Inc. | 900 | 40,887 | ||||||
| Sempra Energy | 800 | 44,784 | ||||||
(continued)
153
Ohio National Fund, Inc.
Income Opportunity Portfolio (Continued)
Income Opportunity Portfolio (Continued)
| Schedule of Investments | December 31, 2009 |
| Common Stocks – 99.7% | Shares | Value | ||||||
Multi-Utilities (continued) | ||||||||
| Wisconsin Energy Corp. | 1,500 | $ | 74,745 | |||||
| Xcel Energy, Inc. | 2,000 | 42,440 | ||||||
| 202,856 | ||||||||
TOTAL UTILITIES | 439,569 | |||||||
Total Common Stocks (Cost $5,857,572) | $ | 6,670,785 | ||||||
| Purchased Options – 0.1% | Contracts (c) | Value | ||||||
| S&P 500 Index Put Option | ||||||||
| Expiration: January 2010, | ||||||||
| Exercise Price: $1,050.00 | 23 | $ | 6,555 | |||||
Total Purchased Options (Cost $20,089) | $ | 6,555 | ||||||
| Money Market Funds – 12.4% | Shares | Value | ||||||
| Federated Prime Cash Obligations Fund Institutional Class | 372,000 | $ | 372,000 | |||||
| Fidelity Institutional Money Market Funds | ||||||||
| Money Market Portfolio – Class I | 376,000 | 376,000 | ||||||
| Fidelity Institutional Money Market Funds | ||||||||
| Prime Money Market Portfolio – Class I | 84,000 | 84,000 | ||||||
Total Money Market Funds (Cost $832,000) | $ | 832,000 | ||||||
Total Investments – 112.2% (Cost $6,709,661) (d) | $ | 7,509,340 | ||||||
Total Written Options Outstanding – (2.1)% (see following schedule) | (141,112 | ) | ||||||
Other Liabilities in Excess of Other Assets – (10.1)% | (676,780 | ) | ||||||
Net Assets – 100.0% | $ | 6,691,448 | ||||||
Percentages are stated as a percent of net assets.
Abbreviations:
ADR: American Depository Receipts
Footnotes:
| (a) | Non-income producing security. | |
| (b) | Security is fully or partially pledged as collateral for written call options outstanding. Outstanding written call options are presented in the following schedule. | |
| (c) | 100 shares per contract. | |
| (d) | Represents cost for financial reporting purposes, which may differ from cost basis for Federal income tax purposes. See also Note 8 of the Notes to Financial Statements. |
The accompanying notes are an integral part of these financial statements.
154
Ohio National Fund, Inc.
Income Opportunity Portfolio
Income Opportunity Portfolio
| Schedule of Written Options Outstanding | December 31, 2009 |
| Call Options | Contracts* | Value | ||||||
S&P 500 Index Call Option | ||||||||
| Expiration: January 2010, | ||||||||
| Exercise Price: $1,105.00 | 62 | $ | 141,112 | |||||
Total Written Options Outstanding (Premiums received $120,692) | $ | 141,112 | ||||||
| * | 100 shares per contract. |
The accompanying notes are an integral part of these financial statements.
155
Ohio National Fund, Inc.
Income Opportunity Portfolio
Income Opportunity Portfolio
Statement of Assets and Liabilities
December 31, 2009
| Assets: | ||||
| Investments in securities, at value (Cost $6,709,661) | $ | 7,509,340 | ||
| Cash | 114 | |||
| Receivable for fund shares sold | 4,149 | |||
| Dividends and accrued interest receivable | 14,155 | |||
| Prepaid expenses and other assets | 97 | |||
| Total assets | 7,527,855 | |||
| Liabilities: | ||||
| Margin payable to prime broker | 674,844 | |||
| Options written, at value (premiums received of $120,692) | 141,112 | |||
| Payable for fund shares redeemed | 218 | |||
| Payable for investment management services | 4,412 | |||
| Payable for compliance services | 1,677 | |||
| Accrued custody expense | 738 | |||
| Accrued professional fees | 11,092 | |||
| Accrued accounting fees | 1,879 | |||
| Accrued printing and filing fees | 435 | |||
| Total liabilities | 836,407 | |||
| Net assets | $ | 6,691,448 | ||
| Net assets consist of: | ||||
| Par value, $1 per share | $ | 598,125 | ||
| Paid-in capital in excess of par value | 5,843,900 | |||
| Accumulated net realized loss on investments | (549,876 | ) | ||
| Net unrealized appreciation/depreciation on: | ||||
| Investments | 799,679 | |||
| Written options | (20,420 | ) | ||
| Undistributed net investment income | 20,040 | |||
| Net assets | $ | 6,691,448 | ||
| Shares outstanding | 598,125 | |||
| Authorized Fund shares allocated to Portfolio | 3,000,000 | |||
| Net asset value per share | $ | 11.19 | ||
Statement of Operations
For the Year Ended December 31, 2009
| Investment income: | ||||
| Interest | $ | 2,385 | ||
| Dividends (net of withholding tax of $907) | 103,020 | |||
| Total investment income | 105,405 | |||
| Expenses: | ||||
| Management fees | 43,028 | |||
| Custodian fees | 10,197 | |||
| Directors’ fees | 602 | |||
| Professional fees | 12,005 | |||
| Accounting fees | 10,564 | |||
| Printing and filing fees | 913 | |||
| Compliance expense | 6,376 | |||
| Other | 119 | |||
| Total expenses | 83,804 | |||
| Net investment income | 21,601 | |||
| Realized/unrealized gain (loss) on investments, foreign currency related transactions, and written options: | ||||
| Net realized gain (loss) on: | ||||
| Investments | 130,262 | |||
| Foreign currency related transactions | 3 | |||
| Written options | (421,067 | ) | ||
| Change in unrealized appreciation/depreciation on: | ||||
| Investments | 1,090,904 | |||
| Written options | 5,831 | |||
| Net realized/unrealized gain (loss) on investments, foreign currency related transactions, and written options | 805,933 | |||
| Change in net assets from operations | $ | 827,534 | ||
The accompanying notes are an integral part of these financial statements.
156
Ohio National Fund, Inc.
Income Opportunity Portfolio
Income Opportunity Portfolio
Statements of Changes in Net Assets
| Years Ended December 31, | ||||||||
| 2009 | 2008 | |||||||
Increase (Decrease) in Net Assets: | ||||||||
| Operations: | ||||||||
| Net investment income | $ | 21,601 | $ | 46,558 | ||||
| Net realized gain (loss) on investments, foreign currency related transactions, and written options | (290,802 | ) | (109,701 | ) | ||||
| Change in unrealized appreciation/depreciation on investments, foreign currency related transactions, and written options | 1,096,735 | (1,018,989 | ) | |||||
| Change in net assets from operations | 827,534 | (1,082,132 | ) | |||||
| Capital transactions: | ||||||||
| Received from shares sold | 3,291,911 | 1,537,866 | ||||||
| Paid for shares redeemed | (1,941,532 | ) | (1,124,981 | ) | ||||
| Change in net assets from capital transactions | 1,350,379 | 412,885 | ||||||
| Change in net assets | 2,177,913 | (669,247 | ) | |||||
Net Assets: | ||||||||
| Beginning of year | 4,513,535 | 5,182,782 | ||||||
| End of year | $ | 6,691,448 | $ | 4,513,535 | ||||
| Undistributed net investment income | $ | 20,040 | $ | 45,735 | ||||
Financial Highlights
| Years Ended December 31, | ||||||||||||||||||||
| 2009 | 2008 | 2007 | 2006 | 2005 | ||||||||||||||||
Selected Per-Share Data: | ||||||||||||||||||||
| Net asset value, beginning of year | $ | 9.89 | $ | 12.49 | $ | 11.53 | $ | 11.07 | $ | 10.75 | ||||||||||
| Operations: | ||||||||||||||||||||
| Net investment income (loss) | 0.01 | 0.10 | — | 0.01 | (0.04 | ) | ||||||||||||||
| Net realized and unrealized gain (loss) on investments, foreign | ||||||||||||||||||||
| currency related transactions, and written options | 1.29 | (2.70 | ) | 0.96 | 0.45 | 0.36 | ||||||||||||||
| Total from operations | 1.30 | (2.60 | ) | 0.96 | 0.46 | 0.32 | ||||||||||||||
| Net asset value, end of year | $ | 11.19 | $ | 9.89 | $ | 12.49 | $ | 11.53 | $ | 11.07 | ||||||||||
Total return | 13.14 | % | –20.82 | % | 8.33 | % | 4.16 | % | 2.98 | % | ||||||||||
Ratios and supplemental data: | ||||||||||||||||||||
| Net assets at end of year (millions) | $ | 6.7 | $ | 4.5 | $ | 5.2 | $ | 5.7 | $ | 4.2 | ||||||||||
| Ratios to average net assets: | ||||||||||||||||||||
| Ratios net of expenses reduced or reimbursed by adviser: | ||||||||||||||||||||
| Expenses | 1.56 | % | 1.62 | % | 1.46 | % | 1.52 | % | 1.60 | % | ||||||||||
| Net investment income (loss) | 0.40 | % | 0.98 | % | –0.04 | % | 0.12 | % | –0.48 | % | ||||||||||
| Ratios assuming no expenses reduced or reimbursed by adviser: | ||||||||||||||||||||
| Expenses | 1.56 | % | 1.62 | % | 1.46 | % | 1.52 | % | 1.67 | % | ||||||||||
| Net investment income (loss) | 0.40 | % | 0.98 | % | –0.04 | % | 0.12 | % | –0.54 | % | ||||||||||
| Portfolio turnover rate | 200 | % | 203 | % | 159 | % | 140 | % | 158 | % | ||||||||||
The accompanying notes are an integral part of these financial statements.
157
Ohio National Fund, Inc.
Target VIP Portfolio
Target VIP Portfolio
Objective/Strategy
The Target VIP Portfolio seeks an above average total return by investing in the common stocks of companies which are identified by a model which applies separate uniquely specialized strategies.
Performance as of December 31, 2009
Average Annual Total Returns: | ||||
| One year | 14.77% | |||
| Since inception (11/2/05) | -5.18% |
Past performance does not guarantee future results. The performance data quoted represents past performance and current returns may be lower or higher. Total return figures include change in share price and reinvestment of dividends and capital gains. The investment return and principal value will fluctuate so that an investor’s shares, when redeemed may be worth more or less than the original cost. To obtain performance information up to the most recent month end, call toll-free 1-877-781-6392.
The Portfolio is not open to direct retail investment. Beneficial interest in shares is obtained solely by purchase of variable life insurance policies and variable annuity contracts. Actual performance results for variable annuity and variable universal life contracts will be lower due to contract charges. Consult your contract for applicable charges.
Comments
For the year ended December 31, 2009, the Target VIP Portfolio returned 14.77% versus 28.34% for the current benchmark, the Russell 3000 Index.
The equity markets staged an impressive rebound after bottoming on March 9, 2009. While the S&P 500 Index finished the year with a 26.46% gain, it was up an eye-popping 67.80% from March 9 through December 31. The top three performing sectors in 2009 were all cyclicals: Information Technology (+59.92%), Materials (+45.22%) and Consumer Discretionary (+38.76%). Within the ten major sectors in the S&P 500 Index lie 134 subsectors. In 2008, only six subsectors were up, versus 115 this year. In 2008, 94% of the constituents in the index suffered a loss, versus just 14% this year. Institutional investors were largely responsible for driving stock prices higher. The Investment Company Institute reported that net cash inflows to bond funds totaled $348.9 billion through the first eleven months of 2009, compared to net cash outflows totaling $4.1 billion for equity funds. The S&P 500 Index closed out the decade 28.75% below its ten-year high of 1,561.15 set on October 9, 2007. Six months from now we will revisit the issue of cash flows to see if retail investors are buying stocks.
The bull market in stocks was accompanied by a sharp reduction in volatility. The VIX, an index that measures the implied volatility of S&P 500 Index options, plunged from a high of nearly 80 in October 2008, one month after the Lehman Brothers bankruptcy, to 21.68 on December 31, 2009. The VIX averaged 21.92 from 2000 through 2009. The higher the index value the greater the implied risk in the market. The last time the VIX fell below 20 for an extended period of time was from May 2003 through July 2007. From April 30, 2003 through July 31, 2007, the S&P 500 Index posted a cumulative total return of 71.3%.
As bull markets mature, higher-quality stocks, which are the focus of the Portfolio, tend to lead the market higher, according to Sam Stovall, chief investment strategist at Standard & Poor’s. Lower-quality stocks tend to lead early in a bull market because they are often beaten down further in bear markets. Such companies tend to carry high debt loads, have few competitive advantages and earnings that are tougher to forecast.
The Portfolio significantly lagged the S&P Composite 1500 Index and Russell 3000 Index in 2009. The top performing stocks were the following: BNP Paribas ADR up 98.6%; NetFlix, Inc. up 84.3%; Banco Santander up 82.4%; Check Point Software Technologies Ltd. up 78.4%; and Computer Programs & Systems, Inc. up 77.2%. The worst performing stocks were the following: S&T Bancorp, Inc. down 50.4%; Questcor Pharmaceuticals, Inc. down 49.0%; Vaalco Energy, Inc. down 38.8%; Spartan Stores, Inc. down 37.7%; and Viropharma, Inc. down 35.6%.(1)
Poor stock selection in the Consumer Discretionary and Health Care sectors accounted for a majority of the under-performance. A large under-weight in Information Technology (9.7% average weight vs. 18.1% for the Russell 3000 Index) negatively impacted performance due to the fact that Information Technology was the top performing sector in 2009.(1)
The fourth quarter 2009 edition of the Investment Manager Outlook, a survey of investment managers conducted by Russell Investment Group, found that nearly 80% of those money managers polled expect the U.S. equity market will rise over the next twelve months. Managers are most bullish on the following: U.S. Large-Cap Growth (72%); Emerging Market Equities (69%); Non-U.S. (Developed Market) Equities (66%); U.S. Mid-Cap Growth (59%); and U.S. Small-Cap Growth (54%). The sector that managers are most bullish on is Information Technology (82%). The Portfolio’s diversification is in line with the findings of the Russell survey.(1)
According to Thomson First Call, the year-over-year estimated earnings growth rates for the companies in the S&P 500 Index, S&P 400 Index (mid-caps), and S&P 600 Index (small-caps) are expected to be 36.3%, 51.6%, and 111.9%, respectively, in 2010. In 2009, the estimates were 12.7%, -8.6%, and -18.3%, respectively.
| (1) | The Portfolio’s composition is subject to change. Holdings and weightings are as of December 31, 2009. |
(continued)
158
Ohio National Fund, Inc.
Target VIP Portfolio (Continued)
Target VIP Portfolio (Continued)
Change in Value of $10,000 Investment
![[PERFORMANCE GRAPH]](https://capedge.com/proxy/N-CSR/0000950123-10-021904/l38589l3858957.gif)
Hypothetical illustration based on past performance. Future performance will vary. The Portfolio’s returns reflect reinvested dividends. The Portfolio’s holdings may differ significantly from the securities in the index. The index is unmanaged and therefore does not reflect the cost of portfolio management and accounting.
The Russell 3000 Index measures the performance of the largest 3000 U.S. companies representing approximately 98% of the investable U.S. equity market. The Russell 3000 Index is constructed to provide a comprehensive, unbiased, and stable barometer of the broad market and is completely reconstituted annually to ensure new and growing equities are reflected. The index presented includes the effects of reinvested dividends.
Portfolio Composition as of December 31, 2009 (1)
| % of Net Assets | |||
Common Stocks (3) | 98.7 | ||
| Money Market Funds and Other Net Assets | 1.3 | ||
| 100.0 | |||
Top 10 Portfolio Holdings as of December 31, 2009 (1) (2)
| % of Net Assets | |||||||
| 1. | Microsoft Corp. | 4.5 | |||||
| 2. | Caterpillar, Inc. | 4.4 | |||||
| 3. | Johnson & Johnson | 4.3 | |||||
| 4. | McDonald’s Corp. | 4.0 | |||||
| 5. | Amgen, Inc. | 3.8 | |||||
| 6. | Gilead Sciences, Inc. | 3.4 | |||||
| 7. | AT&T, Inc. | 3.4 | |||||
| 8. | General Electric Co. | 3.3 | |||||
| 9. | Exxon Mobil Corp. | 2.9 | |||||
| 10. | DIRECTV | 2.5 | |||||
| (1) | Composition of Portfolio subject to change. | |
| (2) | Short-term investments have been excluded from the list of Top 10 Portfolio holdings. | |
| (3) | Sectors: |
| % of Net Assets | |||
| Financials | 19.7 | ||
| Health Care | 16.2 | ||
| Consumer Discretionary | 15.4 | ||
| Industrials | 14.1 | ||
| Energy | 11.1 | ||
| Information Technology | 10.1 | ||
| Telecommunication Services | 4.5 | ||
| Consumer Staples | 4.3 | ||
| Materials | 1.8 | ||
| Utilities | 1.5 | ||
| 98.7 | |||
159
Ohio National Fund, Inc.
Target VIP Portfolio
Target VIP Portfolio
| Schedule of Investments | December 31, 2009 |
| Common Stocks – 98.7% | Shares | Value | ||||||
CONSUMER DISCRETIONARY – 15.4% | ||||||||
Automobiles – 1.5% | ||||||||
| Daimler AG | 5,653 | $ | 301,305 | |||||
Diversified Consumer Services – 2.4% | ||||||||
| Apollo Group, Inc. Class A (a) | 5,225 | 316,530 | ||||||
| DeVry, Inc. | 1,238 | 70,232 | ||||||
| ITT Educational Services, Inc. (a) | 662 | 63,526 | ||||||
| Strayer Education, Inc. | 228 | 48,448 | ||||||
| 498,736 | ||||||||
Hotels, Restaurants & Leisure – 4.4% | ||||||||
| McDonald’s Corp. | 13,262 | 828,079 | ||||||
| Panera Bread Co. (a) | 962 | 64,425 | ||||||
| 892,504 | ||||||||
Internet & Catalog Retail – 0.7% | ||||||||
| NetFlix, Inc. (a) | 1,686 | 92,966 | ||||||
| PetMed Express, Inc. | 2,322 | 40,937 | ||||||
| 133,903 | ||||||||
Media – 2.5% | ||||||||
| DIRECTV (a) | 15,638 | 521,527 | ||||||
Multiline Retail – 0.6% | ||||||||
| Dollar Tree, Inc. (a) | 1,585 | 76,555 | ||||||
| Family Dollar Stores, Inc. | 1,891 | 52,627 | ||||||
| 129,182 | ||||||||
Specialty Retail – 3.1% | ||||||||
| AutoZone, Inc. (a) | 1,181 | 186,681 | ||||||
| Bed Bath & Beyond, Inc. (a) | 3,950 | 152,588 | ||||||
| Hot Topic, Inc. (a) | 4,382 | 27,870 | ||||||
| Jos. A Bank Clothiers, Inc. (a) | 1,949 | 82,228 | ||||||
| Ross Stores, Inc. | 1,970 | 84,139 | ||||||
| Tractor Supply Co. (a) | 1,426 | 75,521 | ||||||
| Wet Seal, Inc. / The (a) | 10,232 | 35,300 | ||||||
| 644,327 | ||||||||
Textiles, Apparel & Luxury Goods – 0.2% | ||||||||
| Coach, Inc. | 1,182 | 43,179 | ||||||
TOTAL CONSUMER DISCRETIONARY | 3,164,663 | |||||||
CONSUMER STAPLES – 4.3% | ||||||||
Beverages – 2.0% | ||||||||
| Hansen Natural Corp. (a) | 1,132 | 43,469 | ||||||
| PepsiCo, Inc. | 6,155 | 374,224 | ||||||
| 417,693 | ||||||||
Food & Staples Retailing – 0.3% | ||||||||
| Nash Finch Co. | 1,088 | 40,354 | ||||||
| Spartan Stores, Inc. | 2,090 | 29,866 | ||||||
| 70,220 | ||||||||
Food Products – 1.2% | ||||||||
| Campbell Soup Co. | 1,408 | 47,590 | ||||||
| TreeHouse Foods, Inc. (a) | 5,008 | 194,611 | ||||||
| 242,201 | ||||||||
Household Products – 0.8% | ||||||||
| Colgate-Palmolive Co. | 2,011 | 165,204 | ||||||
TOTAL CONSUMER STAPLES | 895,318 | |||||||
ENERGY – 11.1% | ||||||||
Energy Equipment & Services – 0.1% | ||||||||
| ENSCO International PLC – ADR | 406 | 16,216 | ||||||
Oil, Gas & Consumable Fuels – 11.0% | ||||||||
| BP PLC – ADR | 4,694 | 272,111 | ||||||
| Chevron Corp. | 5,726 | 440,845 | ||||||
| Clayton Williams Energy, Inc. (a) | 1,174 | 41,137 | ||||||
| ENI SpA – ADR | 4,516 | 228,555 | ||||||
| EOG Resources, Inc. | 725 | 70,542 | ||||||
| Exxon Mobil Corp. | 8,900 | 606,891 | ||||||
| Goodrich Petroleum Corp. (a) | 3,748 | 91,264 | ||||||
| Statoil ASA – ADR | 13,092 | 326,122 | ||||||
| Vaalco Energy, Inc. | 5,767 | 26,240 | ||||||
| World Fuel Services Corp. | 5,778 | 154,792 | ||||||
| 2,258,499 | ||||||||
TOTAL ENERGY | 2,274,715 | |||||||
FINANCIALS – 19.7% | ||||||||
Capital Markets – 4.6% | ||||||||
| Credit Suisse Group AG – ADR | 7,817 | 384,284 | ||||||
| Deutsche Bank AG | 5,309 | 376,461 | ||||||
| Stifel Financial Corp. (a) | 2,544 | 150,706 | ||||||
| SWS Group, Inc. | 2,727 | 32,997 | ||||||
| 944,448 | ||||||||
Commercial Banks – 8.2% | ||||||||
| Banco Bilbao Vizcaya Argentaria S.A. – ADR | 17,770 | 320,571 | ||||||
| Banco Santander S.A. – ADR | 22,501 | 369,917 | ||||||
| BNP Paribas – ADR | 10,094 | 405,375 | ||||||
| Community Bank System, Inc. | 3,336 | 64,418 | ||||||
| First Financial Bankshares, Inc. | 2,155 | 116,866 | ||||||
| HSBC Holdings PLC – ADR | 5,125 | 292,586 | ||||||
| Old National Bancorp | 6,614 | 82,212 | ||||||
| S&T Bancorp, Inc. | 2,842 | 48,342 | ||||||
| 1,700,287 | ||||||||
Consumer Finance – 0.7% | ||||||||
| Ezcorp, Inc. (a) | 4,110 | 70,733 | ||||||
| First Cash Financial Services, Inc. (a) | 3,105 | 68,900 | ||||||
| 139,633 | ||||||||
Diversified Financial Services – 0.3% | ||||||||
| Moody’s Corp. | 2,572 | 68,929 | ||||||
Insurance – 5.2% | ||||||||
| Allianz SE – ADR | 20,066 | 249,822 | ||||||
| AXA SA – ADR | 9,654 | 228,607 | ||||||
| Infinity Property & Casualty Corp. | 1,520 | 61,773 | ||||||
| Swiss Reinsurance Co. Ltd. – ADR | 4,564 | 219,939 | ||||||
| Travelers Companies, Inc. / The | 6,154 | 306,838 | ||||||
| 1,066,979 | ||||||||
(continued)
160
Ohio National Fund, Inc.
Target VIP Portfolio (Continued)
Target VIP Portfolio (Continued)
| Schedule of Investments | December 31, 2009 |
| Common Stocks – 98.7% | Shares | Value | ||||||
Real Estate Investment Trusts – 0.7% | ||||||||
| Public Storage | 1,760 | $ | 143,352 | |||||
TOTAL FINANCIALS | 4,063,628 | |||||||
HEALTH CARE – 16.2% | ||||||||
Biotechnology – 7.7% | ||||||||
| Amgen, Inc. (a) | 13,761 | 778,460 | ||||||
| Cephalon, Inc. (a) | 1,076 | 67,153 | ||||||
| Gilead Sciences, Inc. (a) | 16,035 | 693,995 | ||||||
| Myriad Genetics, Inc. (a) | 1,466 | 38,262 | ||||||
| Myriad Pharmaceuticals, Inc. (a) | 368 | 1,851 | ||||||
| 1,579,721 | ||||||||
Health Care Equipment & Supplies – 1.0% | ||||||||
| Cyberonics, Inc. (a) | 2,820 | 57,641 | ||||||
| Greatbatch, Inc. (a) | 4,246 | 81,650 | ||||||
| Merit Medical Systems, Inc. (a) | 2,938 | 56,674 | ||||||
| 195,965 | ||||||||
Health Care Providers & Services – 0.9% | ||||||||
| Gentiva Health Services, Inc. (a) | 2,965 | 80,085 | ||||||
| Hanger Orthopedic Group, Inc. (a) | 3,273 | 45,266 | ||||||
| LHC Group, Inc. (a) | 1,891 | 63,556 | ||||||
| 188,907 | ||||||||
Health Care Technology – 1.3% | ||||||||
| Computer Programs & Systems, Inc. | 1,822 | 83,903 | ||||||
| Quality Systems, Inc. | 2,970 | 186,487 | ||||||
| 270,390 | ||||||||
Life Sciences Tools & Services – 0.3% | ||||||||
| Luminex Corp. (a) | 4,384 | 65,453 | ||||||
Pharmaceuticals – 5.0% | ||||||||
| Forest Laboratories, Inc. (a) | 1,370 | 43,991 | ||||||
| Johnson & Johnson | 13,898 | 895,170 | ||||||
| Questcor Pharmaceuticals, Inc. (a) | 6,430 | 30,542 | ||||||
| Viropharma, Inc. (a) | 8,222 | 68,983 | ||||||
| 1,038,686 | ||||||||
TOTAL HEALTH CARE | 3,339,122 | |||||||
INDUSTRIALS – 14.1% | ||||||||
Aerospace & Defense – 0.6% | ||||||||
| Aerovironment, Inc. (a) | 2,176 | 63,278 | ||||||
| American Science & Engineering, Inc. | 908 | 68,863 | ||||||
| 132,141 | ||||||||
Air Freight & Logistics – 0.7% | ||||||||
| C.H. Robinson Worldwide, Inc. | 2,546 | 149,527 | ||||||
Airlines – 0.7% | ||||||||
| Allegiant Travel Co. (a) | 2,165 | 102,123 | ||||||
| Hawaiian Holdings, Inc. (a) | 4,917 | 34,419 | ||||||
| 136,542 | ||||||||
Commercial Services & Supplies – 0.2% | ||||||||
| Cintas Corp. | 1,700 | 44,285 | ||||||
Industrial Conglomerates – 3.3% | ||||||||
| General Electric Co. | 44,211 | 668,912 | ||||||
Machinery – 5.3% | ||||||||
| Caterpillar, Inc. | 16,018 | 912,866 | ||||||
| Dover Corp. | 4,440 | 184,748 | ||||||
| 1,097,614 | ||||||||
Professional Services – 0.5% | ||||||||
| Dun & Bradstreet Corp. / The | 1,311 | 110,609 | ||||||
Road & Rail – 1.1% | ||||||||
| Arkansas Best Corp. | 2,559 | 75,311 | ||||||
| Genesee & Wyoming, Inc. (a) | 3,264 | 106,537 | ||||||
| J.B. Hunt Transport Services, Inc. | 1,531 | 49,406 | ||||||
| 231,254 | ||||||||
Trading Companies & Distributors – 1.7% | ||||||||
| Beacon Roofing Supply, Inc. (a) | 4,419 | 70,704 | ||||||
| Fastenal Co. | 2,259 | 94,065 | ||||||
| W. W. Grainger, Inc. | 1,827 | 176,908 | ||||||
| 341,677 | ||||||||
TOTAL INDUSTRIALS | 2,912,561 | |||||||
INFORMATION TECHNOLOGY – 10.1% | ||||||||
Computers & Peripherals – 0.5% | ||||||||
| Lexmark International, Inc. Class A (a) | 4,272 | 110,987 | ||||||
IT Services – 0.9% | ||||||||
| CSG Systems International Inc. (a) | 3,603 | 68,781 | ||||||
| Mantech International Corp. Class A (a) | 903 | 43,597 | ||||||
| SAIC, Inc. (a) | 3,495 | 66,195 | ||||||
| 178,573 | ||||||||
Semiconductors & Semiconductor Equipment – 3.6% | ||||||||
| Altera Corp. | 20,148 | 455,949 | ||||||
| Microchip Technology, Inc. | 9,648 | 280,371 | ||||||
| 736,320 | ||||||||
Software – 5.1% | ||||||||
| Check Point Software Technologies Ltd. (a) | 3,299 | 111,770 | ||||||
| Microsoft Corp. | 30,541 | 931,195 | ||||||
| 1,042,965 | ||||||||
TOTAL INFORMATION TECHNOLOGY | 2,068,845 | |||||||
MATERIALS – 1.8% | ||||||||
Chemicals – 0.2% | ||||||||
| Innophos Holdings, Inc. | 1,942 | 44,647 | ||||||
Containers & Packaging – 1.3% | ||||||||
| Rock-Tenn Co.- Class A | 5,154 | 259,813 | ||||||
Metals & Mining – 0.3% | ||||||||
| Compass Minerals International, Inc. | 832 | 55,902 | ||||||
TOTAL MATERIALS | 360,362 | |||||||
TELECOMMUNICATION SERVICES – 4.5% | ||||||||
Diversified Telecommunication Services – 4.5% | ||||||||
| AT&T, Inc. | 24,756 | 693,911 | ||||||
| BT Group PLC – ADR | 10,783 | 234,422 | ||||||
TOTAL TELECOMMUNICATION SERVICES | 928,333 | |||||||
(continued)
161
Ohio National Fund, Inc.
Target VIP Portfolio (Continued)
Target VIP Portfolio (Continued)
| Schedule of Investments | December 31, 2009 |
| Common Stocks – 98.7% | Shares | Value | ||||||
UTILITIES – 1.5% | ||||||||
Electric Utilities – 0.4% | ||||||||
| Southern Co. / The | 2,766 | $ | 92,163 | |||||
Gas Utilities – 0.4% | ||||||||
| Laclede Group, Inc. / The | 2,293 | 77,434 | ||||||
Multi-Utilities – 0.3% | ||||||||
| Sempra Energy | 853 | 47,751 | ||||||
| TECO Energy, Inc. | 751 | 12,181 | ||||||
| 59,932 | ||||||||
Water Utilities – 0.4% | ||||||||
| California Water Service Group | 2,091 | 76,991 | ||||||
TOTAL UTILITIES | 306,520 | |||||||
Total Common Stocks (Cost $18,853,154) | $ | 20,314,067 | ||||||
| Money Market Funds – 1.3% | Shares | Value | ||||||
| Fidelity Institutional Money Market Funds | ||||||||
| Money Market Portfolio – Class I | 264,000 | $ | 264,000 | |||||
Total Money Market Funds (Cost $264,000) | $ | 264,000 | ||||||
Total Investments – 100.0% (Cost $19,117,154) (b) | $ | 20,578,067 | ||||||
Other Assets in Excess of Liabilities – 0.0% | 2,931 | |||||||
Net Assets – 100.0% | $ | 20,580,998 | ||||||
Percentages are stated as a percent of net assets.
Abbreviations:
ADR: American Depository Receipts
Footnotes:
| (a) | Non-income producing security. | |
| (b) | Represents cost for financial reporting purposes, which may differ from cost basis for Federal income tax purposes. See also Note 8 of the Notes to Financial Statements. |
The accompanying notes are an integral part of these financial statements.
162
Ohio National Fund, Inc.
Target VIP Portfolio
Target VIP Portfolio
Statement of Assets and Liabilities
December 31, 2009
| Assets: | ||||
| Investments in securities, at value (Cost $19,117,154) | $ | 20,578,067 | ||
| Cash | 802 | |||
| Receivable for fund shares sold | 9,271 | |||
| Dividends and accrued interest receivable | 22,753 | |||
| Prepaid expenses and other assets | 331 | |||
| Total assets | 20,611,224 | |||
| Liabilities: | ||||
| Payable for fund shares redeemed | 2,331 | |||
| Payable for investment management services | 10,464 | |||
| Payable for compliance services | 1,677 | |||
| Accrued custody expense | 84 | |||
| Accrued professional fees | 11,111 | |||
| Accrued accounting fees | 2,622 | |||
| Accrued printing and filing fees | 1,373 | |||
| Other accrued expenses | 564 | |||
| Total liabilities | 30,226 | |||
| Net assets | $ | 20,580,998 | ||
| Net assets consist of: | ||||
| Par value, $1 per share | $ | 2,665,997 | ||
| Paid-in capital in excess of par value | 27,639,691 | |||
| Accumulated net realized loss on investments | (11,217,802 | ) | ||
| Net unrealized appreciation on investments | 1,460,913 | |||
| Undistributed net investment income | 32,199 | |||
| Net assets | $ | 20,580,998 | ||
| Shares outstanding | 2,665,997 | |||
| Authorized Fund shares allocated to Portfolio | 5,000,000 | |||
| Net asset value per share | $ | 7.72 | ||
Statement of Operations
For the Year Ended December 31, 2009
| Investment income: | ||||
| Interest | $ | 2,576 | ||
| Dividends (net of withholding tax of $19,964) | 438,549 | |||
| Total investment income | 441,125 | |||
| Expenses: | ||||
| Management fees | 111,970 | |||
| Custodian fees | 3,405 | |||
| Directors’ fees | 2,004 | |||
| Professional fees | 12,782 | |||
| Accounting fees | 15,175 | |||
| Printing and filing fees | 3,025 | |||
| Compliance expense | 6,376 | |||
| Other | 489 | |||
| Total expenses | 155,226 | |||
| Net investment income | 285,899 | |||
| Realized/unrealized gain (loss) on investments: | ||||
| Net realized gain (loss) on investments | (11,189,698 | ) | ||
| Change in unrealized appreciation/depreciation on investments | 13,803,902 | |||
| Net realized/unrealized gain (loss) on investments | 2,614,204 | |||
| Change in net assets from operations | $ | 2,900,103 | ||
The accompanying notes are an integral part of these financial statements.
163
Ohio National Fund, Inc.
Target VIP Portfolio
Target VIP Portfolio
Statements of Changes in Net Assets
| Years Ended December 31, | ||||||||
| 2009 | 2008 | |||||||
Increase (Decrease) in Net Assets: | ||||||||
| Operations: | ||||||||
| Net investment income | $ | 285,899 | $ | 337,472 | ||||
| Net realized gain (loss) on investments | (11,189,698 | ) | 330,868 | |||||
| Change in unrealized appreciation/depreciation on investments | 13,803,902 | (13,398,858 | ) | |||||
| Change in net assets from operations | 2,900,103 | (12,730,518 | ) | |||||
| Distributions to shareholders: | ||||||||
| Distributions from net investment income | (253,696 | ) | (303,211 | ) | ||||
| Capital transactions: | ||||||||
| Received from shares sold | 6,226,014 | 13,635,800 | ||||||
| Received from dividends reinvested | 253,696 | 303,211 | ||||||
| Paid for shares redeemed | (6,742,319 | ) | (5,830,040 | ) | ||||
| Change in net assets from capital transactions | (262,609 | ) | 8,108,971 | |||||
| Change in net assets | 2,383,798 | (4,924,758 | ) | |||||
Net Assets: | ||||||||
| Beginning of year | 18,197,200 | 23,121,958 | ||||||
| End of year | $ | 20,580,998 | $ | 18,197,200 | ||||
| Undistributed net investment income | $ | 32,199 | $ | 34,261 | ||||
Financial Highlights
| For the | ||||||||||||||||||||
| Period from | ||||||||||||||||||||
| Years Ended December 31, | November 2, 2005* to | |||||||||||||||||||
| 2009 | 2008 | 2007 | 2006 | December 31, 2005 | ||||||||||||||||
Selected Per-Share Data: | ||||||||||||||||||||
| Net asset value, beginning of period | $ | 6.81 | $ | 12.23 | $ | 11.23 | $ | 10.14 | $ | 10.00 | ||||||||||
| Operations: | ||||||||||||||||||||
| Net investment income | 0.11 | 0.12 | 0.09 | 0.02 | 0.01 | |||||||||||||||
| Net realized and unrealized gain (loss) on investments | 0.90 | (5.42 | ) | 1.00 | 1.07 | 0.13 | ||||||||||||||
| Total from operations | 1.01 | (5.30 | ) | 1.09 | 1.09 | 0.14 | ||||||||||||||
| Distributions: | ||||||||||||||||||||
| Distributions from net investment income | (0.10 | ) | (0.12 | ) | (0.09 | ) | — | — | ||||||||||||
| Net asset value, end of period | $ | 7.72 | $ | 6.81 | $ | 12.23 | $ | 11.23 | $ | 10.14 | ||||||||||
Total return | 14.77 | % | –43.34 | % | 9.74 | % | 10.76 | % | 1.40 | %(b) | ||||||||||
Ratios and supplemental data: | ||||||||||||||||||||
| Net assets at end of period (millions) | $ | 20.6 | $ | 18.2 | $ | 23.1 | $ | 10.6 | $ | 1.5 | ||||||||||
| Ratios to average net assets: | ||||||||||||||||||||
| Ratios net of expenses reduced or reimbursed by adviser: | ||||||||||||||||||||
| Expenses | 0.83 | % | 0.80 | % | 0.83 | % | 1.26 | % | 1.60 | %(a) | ||||||||||
| Net investment income | 1.53 | % | 1.45 | % | 1.22 | % | 0.53 | % | 0.74 | %(a) | ||||||||||
| Ratios assuming no expenses reduced or reimbursed by adviser: | ||||||||||||||||||||
| Expenses | 0.83 | % | 0.80 | % | 0.83 | % | 1.30 | % | 7.39 | %(a) | ||||||||||
| Net investment income | 1.53 | % | 1.45 | % | 1.22 | % | 0.48 | % | –5.04 | %(a) | ||||||||||
| Portfolio turnover rate | 91 | % | 79 | % | 52 | % | 24 | % | 0 | % | ||||||||||
| (a) | Annualized. |
| (b) | Not annualized. |
| * | Represents date of commencement of operations. |
The accompanying notes are an integral part of these financial statements.
164
Ohio National Fund, Inc.
Target Equity/Income Portfolio
Target Equity/Income Portfolio
Objective/Strategy
The Target Equity/Income Portfolio seeks an above average total return by adhering to a disciplined, quantitative investment process that incorporates two distinct strategy methodologies.
Performance as of December 31, 2009
Average Annual Total Returns: | ||||
| One year | 12.33% | |||
| Since inception (11/2/05) | -6.54% |
Past performance does not guarantee future results. The performance data quoted represents past performance and current returns may be lower or higher. Total return figures include change in share price and reinvestment of dividends and capital gains. The investment return and principal value will fluctuate so that an investor’s shares, when redeemed may be worth more or less than the original cost. To obtain performance information up to the most recent month end, call toll-free 1-877-781-6392.
The Portfolio is not open to direct retail investment. Beneficial interest in shares is obtained solely by purchase of variable life insurance policies and variable annuity contracts. Actual performance results for variable annuity and variable universal life contracts will be lower due to contract charges. Consult your contract for applicable charges.
Comments
For the year ended December 31, 2009, the Target Equity/Income Portfolio returned 12.33% versus 28.34% for the current benchmark, the Russell 3000 Index.
The equity markets staged an impressive rebound after bottoming on March 9, 2009. While the S&P 500 Index finished the year with a 26.47% gain, it was up an eye-popping 67.80% from March 9 through December 31. The top three performing sectors in 2009 were all cyclicals: Information Technology (+59.92%), Materials (+45.22%) and Consumer Discretionary (+38.76%). Within the ten major sectors in the S&P 500 Index lie 134 subsectors. In 2008, only six subsectors were up, versus 115 this year. In 2008, 94% of the constituents in the index suffered a loss, versus just 14% this year. Institutional investors were largely responsible for driving stock prices higher. The Investment Company Institute reported that net cash inflows to bond funds totaled $348.9 billion through the first eleven months of 2009, compared to net cash outflows totaling $4.1 billion for equity funds. The S&P 500 Index closed out the decade 28.75% below its 10-year high of 1,561.15 set on October 9, 2007. Six months from now we will revisit the issue of cash flows to see if retail investors are buying stocks.
The bull market in stocks was accompanied by a sharp reduction in volatility. The VIX, an index that measures the implied volatility of S&P 500 Index options, plunged from a high of nearly 80 in October 2008, one month after the Lehman Brothers bankruptcy, to 21.68 on December 31, 2009. The VIX averaged 21.92 from 2000 through 2009. The higher the index value the greater the implied risk in the market. The last time the VIX fell below 20 for an extended period of time was from May 2003 through July 2007. From April 30, 2003 through July 31, 2007, the S&P 500 Index posted a cumulative total return of 71.3%.
As bull markets mature, higher-quality stocks, which are the focus of the Portfolio, tend to lead the market higher, according to Sam Stovall, chief investment strategist at Standard & Poor’s. Lower-quality stocks tend to lead early in a bull market because they are often beaten down further in bear markets. Such companies tend to carry high debt loads, have few competitive advantages and earnings that are tougher to forecast.
The Portfolio significantly lagged the S&P 500 Index and Russell 3000 Index in 2009. The top performing stocks were the following: Meadwestvaco Corp. up 164.1%; Eastman Chemical Co. up 95.5%; NetFlix, Inc. up 84.3%; Computer Programs & Systems, Inc. up 77.2%; and R.R. Donnelley & Sons Co. up 71.6%. The worst performing stocks were the following: First Bancorp down 78.1%; Zions Bancorporation down 47.2%; F.N.B. Corp. down 44.9%; Spartan Stores, Inc. down 37.7%; and Regions Financial Corp. down 31.9%.(1)
Poor stock selection in the Consumer Discretionary and Financial sectors accounted for a majority of the under-performance. Financial exposure was concentrated in small and mid-sized banks that under-performed. A large under-weight in Information Technology (2.2% average weight vs. 18.1% for the Russell 3000 Index) negatively impacted performance due to the fact that Information Technology was the top performing sector in 2009.(1)
Approximately 7,000 publicly owned companies report dividend information to Standard & Poor’s Dividend Record. In 2009, companies reported 1,191 dividend increases, down 36.4% from the 1,874 reported in 2008, and a 52.6% decline from the 2,513 registered in 2007. Historically speaking, 2009 had the fewest dividend increases and the most decreases since Standard & Poor’s began collecting data in 1955. Dividend cuts cost investors over $58 billion in income, according to Howard Silverblatt, Senior Index Analyst at S&P. As bad as the year was for payouts, there were signs of a turn in the fourth quarter. The number of companies that increased their dividend payouts totaled 484 — slightly better than the 475 increases registered in the fourth quarter of 2008. With respect to the S&P 500, Standard & Poor’s initial estimate for the dividend payment in 2010 calls for $23.67, or a 6.1% increase over 2009.
According to Standard & Poor’s, the year-over-year estimated earnings growth rate for the companies in the S&P 500 Index is expected be 36.3% in 2010, vs. 12.7% in 2009.
| (1) | The Portfolio’s composition is subject to change. Holdings and weightings are as of December 31, 2009. |
(continued)
165
Ohio National Fund, Inc.
Target Equity/Income Portfolio (Continued)
Target Equity/Income Portfolio (Continued)
Change in Value of $10,000 Investment
![[PERFORMANCE GRAPH]](https://capedge.com/proxy/N-CSR/0000950123-10-021904/l38589l3858958.gif)
Hypothetical illustration based on past performance. Future performance will vary. The Portfolio’s returns reflect reinvested dividends. The Portfolio’s holdings may differ significantly from the securities in the index. The index is unmanaged and therefore does not reflect the cost of portfolio management and accounting.
The Russell 3000 Index measures the performance of the largest 3000 U.S. companies representing approximately 98% of the investable U.S. equity market. The Russell 3000 index is constructed to provide a comprehensive, unbiased, and stable barometer of the broad market and is completely reconstituted annually to ensure new and growing equities are reflected. The index presented includes the effects of reinvested dividends.
Portfolio Composition as of December 31, 2009 (1)
| % of Net Assets | |||
Common Stocks (3) | 98.0 | ||
| Money Market Funds Less Net Liabilities | 2.0 | ||
| 100.0 | |||
Top 10 Portfolio Holdings as of December 31, 2009 (1) (2)
| % of Net Assets | |||||||
| 1. | Johnson & Johnson | 7.6 | |||||
| 2. | McDonald’s Corp. | 6.9 | |||||
| 3. | Amgen, Inc. | 6.0 | |||||
| 4. | MeadWestvaco Corp. | 4.6 | |||||
| 5. | Eastman Chemical Co. | 4.4 | |||||
| 6. | R.R. Donnelley & Sons Co. | 3.7 | |||||
| 7. | Universal Corp. | 3.4 | |||||
| 8. | Textron, Inc. | 3.3 | |||||
| 9. | NiSource, Inc. | 3.2 | |||||
| 10. | TECO Energy, Inc. | 3.1 | |||||
| (1) | Composition of Portfolio subject to change. | |
| (2) | Short-term investments have been excluded from the list of Top 10 Portfolio holdings. | |
| (3) | Sectors: |
| % of Net Assets | |||
| Consumer Discretionary | 23.9 | ||
| Health Care | 16.5 | ||
| Materials | 13.9 | ||
| Industrials | 12.3 | ||
| Financials | 12.3 | ||
| Utilities | 11.3 | ||
| Consumer Staples | 5.9 | ||
| Information Technology | 1.9 | ||
| 98.0 | |||
166
Ohio National Fund, Inc.
Target Equity/Income Portfolio
Target Equity/Income Portfolio
| Schedule of Investments | December 31, 2009 |
| Common Stocks – 98.0% | Shares | Value | ||||||
CONSUMER DISCRETIONARY – 23.9% | ||||||||
Diversified Consumer Services – 6.2% | ||||||||
| Apollo Group, Inc. Class A (a) | 11,149 | $ | 675,406 | |||||
| DeVry, Inc. | 5,013 | 284,387 | ||||||
| ITT Educational Services, Inc. (a) | 2,681 | 257,269 | ||||||
| Strayer Education, Inc. | 922 | 195,916 | ||||||
| 1,412,978 | ||||||||
Hotels, Restaurants & Leisure – 8.1% | ||||||||
| McDonald’s Corp. | 25,049 | 1,564,060 | ||||||
| Panera Bread Co. (a) | 3,897 | 260,982 | ||||||
| 1,825,042 | ||||||||
Internet & Catalog Retail – 1.7% | ||||||||
| NetFlix, Inc. (a) | 6,828 | 376,496 | ||||||
Multiline Retail – 2.3% | ||||||||
| Dollar Tree, Inc. (a) | 6,420 | 310,086 | ||||||
| Family Dollar Stores, Inc. | 7,672 | 213,512 | ||||||
| 523,598 | ||||||||
Specialty Retail – 5.6% | ||||||||
| AutoZone, Inc. (a) | 3,950 | 624,376 | ||||||
| Jos. A Bank Clothiers, Inc. (a) | 7,904 | 333,470 | ||||||
| Tractor Supply Co. (a) | 5,780 | 306,109 | ||||||
| 1,263,955 | ||||||||
TOTAL CONSUMER DISCRETIONARY | 5,402,069 | |||||||
CONSUMER STAPLES – 5.9% | ||||||||
Food & Staples Retailing – 1.3% | ||||||||
| Nash Finch Co. | 4,412 | 163,641 | ||||||
| Spartan Stores, Inc. | 8,472 | 121,065 | ||||||
| 284,706 | ||||||||
Food Products – 1.2% | ||||||||
| TreeHouse Foods, Inc. (a) | 7,187 | 279,287 | ||||||
Tobacco – 3.4% | ||||||||
| Universal Corp. | 16,823 | 767,297 | ||||||
TOTAL CONSUMER STAPLES | 1,331,290 | |||||||
FINANCIALS – 12.3% | ||||||||
Commercial Banks – 10.3% | ||||||||
| BB&T Corp. | 19,188 | 486,800 | ||||||
| First BanCorp/Puerto Rico | 46,358 | 106,623 | ||||||
| F.N.B. Corp. | 39,938 | 271,179 | ||||||
| Fulton Financial Corp. | 55,119 | 480,638 | ||||||
| Regions Financial Corp. | 64,690 | 342,210 | ||||||
| SunTrust Banks, Inc. | 17,685 | 358,829 | ||||||
| Zions Bancorporation | 22,298 | 286,083 | ||||||
| 2,332,362 | ||||||||
Thrifts & Mortgage Finance – 2.0% | ||||||||
| First Niagara Financial Group, Inc. | 31,821 | 442,630 | ||||||
TOTAL FINANCIALS | 2,774,992 | |||||||
HEALTH CARE – 16.5% | ||||||||
Biotechnology – 6.7% | ||||||||
| Amgen, Inc. (a) | 24,026 | 1,359,151 | ||||||
| Myriad Genetics, Inc. (a) | 5,939 | 155,008 | ||||||
| Myriad Pharmaceuticals, Inc. (a) | 1,296 | 6,519 | ||||||
| 1,520,678 | ||||||||
Health Care Equipment & Supplies – 0.7% | ||||||||
| Greatbatch, Inc. (a) | 7,571 | 145,590 | ||||||
Health Care Technology – 1.5% | ||||||||
| Computer Programs & Systems, Inc. | 7,388 | 340,217 | ||||||
Pharmaceuticals – 7.6% | ||||||||
| Johnson & Johnson | 26,706 | 1,720,134 | ||||||
TOTAL HEALTH CARE | 3,726,619 | |||||||
INDUSTRIALS – 12.3% | ||||||||
Commercial Services & Supplies – 3.7% | ||||||||
| R.R. Donnelley & Sons Co. | 37,864 | 843,231 | ||||||
Industrial Conglomerates – 3.3% | ||||||||
| Textron, Inc. | 39,597 | 744,819 | ||||||
Machinery – 5.3% | ||||||||
| Briggs & Stratton Corp. | 30,454 | 569,795 | ||||||
| Timken Co. / The | 26,737 | 633,934 | ||||||
| 1,203,729 | ||||||||
TOTAL INDUSTRIALS | 2,791,779 | |||||||
INFORMATION TECHNOLOGY – 1.9% | ||||||||
IT Services – 1.9% | ||||||||
| ManTech International Corp. – Class A (a) | 3,662 | 176,801 | ||||||
| SAIC, Inc. (a) | 14,170 | 268,380 | ||||||
TOTAL INFORMATION TECHNOLOGY | 445,181 | |||||||
MATERIALS – 13.9% | ||||||||
Chemicals – 7.0% | ||||||||
| Eastman Chemical Co. | 16,684 | 1,005,044 | ||||||
| Sensient Technologies Corp. | 22,172 | 583,124 | ||||||
| 1,588,168 | ||||||||
Containers & Packaging – 1.3% | ||||||||
| Rock-Tenn Co. Class A | 5,648 | 284,716 | ||||||
Metals & Mining – 1.0% | ||||||||
| Compass Minerals International, Inc. | 3,375 | 226,766 | ||||||
Paper & Forest Products – 4.6% | ||||||||
| MeadWestvaco Corp. | 36,464 | 1,043,964 | ||||||
TOTAL MATERIALS | 3,143,614 | |||||||
UTILITIES – 11.3% | ||||||||
Electric Utilities – 5.0% | ||||||||
| American Electric Power Co., Inc. | 15,925 | 554,031 | ||||||
| Pinnacle West Cap Corp. | 15,970 | 584,182 | ||||||
| 1,138,213 | ||||||||
(continued)
167
Ohio National Fund, Inc.
Target Equity/Income Portfolio (Continued)
Target Equity/Income Portfolio (Continued)
| Schedule of Investments | December 31, 2009 |
| Common Stocks – 98.0% | Shares | Value | ||||||
Multi-Utilities – 6.3% | ||||||||
| NiSource, Inc. | 46,655 | $ | 717,554 | |||||
| TECO Energy, Inc. | 43,072 | 698,628 | ||||||
| 1,416,182 | ||||||||
TOTAL UTILITIES | 2,554,395 | |||||||
Total Common Stocks (Cost $21,177,763) | $ | 22,169,939 | ||||||
| Money Market Funds – 2.1% | Shares | Value | ||||||
| Fidelity Institutional Money Market Funds | ||||||||
| Money Market Portfolio – Class I | 465,000 | $ | 465,000 | |||||
Total Money Market Funds (Cost $465,000) | $ | 465,000 | ||||||
Total Investments – 100.1% (Cost $21,642,763) (b) | $ | 22,634,939 | ||||||
Liabilities in Excess of Other Assets – (0.1)% | (18,258 | ) | ||||||
Net Assets – 100.0% | $ | 22,616,681 | ||||||
Percentages are stated as a percent of net assets.
Footnotes:
| (a) | Non-income producing security. | |
| (b) | Represents cost for financial reporting purposes, which may differ from cost basis for Federal income tax purposes. See also Note 8 of the Notes to Financial Statements. |
The accompanying notes are an integral part of these financial statements.
168
Ohio National Fund, Inc.
Target Equity/Income Portfolio
Target Equity/Income Portfolio
Statement of Assets and Liabilities
December 31, 2009
| Assets: | ||||
| Investments in securities, at value (Cost $21,642,763) | $ | 22,634,939 | ||
| Cash | 31 | |||
| Receivable for fund shares sold | 17,645 | |||
| Dividends and accrued interest receivable | 15,504 | |||
| Prepaid expenses and other assets | 391 | |||
| Total assets | 22,668,510 | |||
| Liabilities: | ||||
| Payable for fund shares redeemed | 23,300 | |||
| Payable for investment management services | 11,542 | |||
| Payable for compliance services | 1,677 | |||
| Accrued custody expense | 365 | |||
| Accrued professional fees | 11,114 | |||
| Accrued accounting fees | 2,311 | |||
| Accrued printing and filing fees | 1,520 | |||
| Total liabilities | 51,829 | |||
| Net assets | $ | 22,616,681 | ||
| Net assets consist of: | ||||
| Par value, $1 per share | $ | 3,200,758 | ||
| Paid-in capital in excess of par value | 36,534,506 | |||
| Accumulated net realized loss on investments | (18,149,114 | ) | ||
| Net unrealized appreciation on investments | 992,176 | |||
| Undistributed net investment income | 38,355 | |||
| Net assets | $ | 22,616,681 | ||
| Shares outstanding | 3,200,758 | |||
| Authorized Fund shares allocated to Portfolio | 7,000,000 | |||
| Net asset value per share | $ | 7.07 | ||
Statement of Operations
For the Year Ended December 31, 2009
| Investment income: | ||||
| Interest | $ | 1,314 | ||
| Dividends (net of withholding tax of $223) | 630,347 | |||
| Total investment income | 631,661 | |||
| Expenses: | ||||
| Management fees | 134,147 | |||
| Custodian fees | 3,280 | |||
| Directors’ fees | 2,382 | |||
| Professional fees | 12,985 | |||
| Accounting fees | 13,855 | |||
| Printing and filing fees | 3,471 | |||
| Compliance expense | 6,376 | |||
| Other | 666 | |||
| Total expenses | 177,162 | |||
| Net investment income | 454,499 | |||
| Realized/unrealized gain (loss) on investments: | ||||
| Net realized gain (loss) on investments | (17,723,261 | ) | ||
| Change in unrealized appreciation/depreciation on investments | 19,904,558 | |||
| Net realized/unrealized gain (loss) on investments | 2,181,297 | |||
| Change in net assets from operations | $ | 2,635,796 | ||
The accompanying notes are an integral part of these financial statements.
169
Ohio National Fund, Inc.
Target Equity/Income Portfolio
Target Equity/Income Portfolio
Statements of Changes in Net Assets
| Years Ended December 31, | ||||||||
| 2009 | 2008 | |||||||
Increase (Decrease) in Net Assets: | ||||||||
| Operations: | ||||||||
| Net investment income | $ | 454,499 | $ | 718,661 | ||||
| Net realized gain (loss) on investments | (17,723,261 | ) | (164,334 | ) | ||||
| Change in unrealized appreciation/depreciation on investments | 19,904,558 | (20,301,401 | ) | |||||
| Change in net assets from operations | 2,635,796 | (19,747,074 | ) | |||||
| Distributions to shareholders: | ||||||||
| Distributions from net investment income | (416,144 | ) | (637,109 | ) | ||||
| Capital transactions: | ||||||||
| Received from shares sold | 6,217,680 | 14,780,603 | ||||||
| Received from dividends reinvested | 416,144 | 637,109 | ||||||
| Paid for shares redeemed | (10,314,027 | ) | (11,395,135 | ) | ||||
| Change in net assets from capital transactions | (3,680,203 | ) | 4,022,577 | |||||
| Change in net assets | (1,460,551 | ) | (16,361,606 | ) | ||||
Net Assets: | ||||||||
| Beginning of year | 24,077,232 | 40,438,838 | ||||||
| End of year | $ | 22,616,681 | $ | 24,077,232 | ||||
| Undistributed net investment income | $ | 38,355 | $ | 81,552 | ||||
Financial Highlights
| For the | ||||||||||||||||||||
| Period from | ||||||||||||||||||||
| Years Ended December 31, | November 2, 2005* to | |||||||||||||||||||
| 2009 | 2008 | 2007 | 2006 | December 31, 2005 | ||||||||||||||||
Selected Per-Share Data: | ||||||||||||||||||||
| Net asset value, beginning of period | $ | 6.41 | $ | 12.00 | $ | 11.01 | $ | 10.13 | $ | 10.00 | ||||||||||
| Operations: | ||||||||||||||||||||
| Net investment income | 0.15 | 0.19 | 0.16 | 0.08 | 0.01 | |||||||||||||||
| Net realized and unrealized gain (loss) on investments | 0.64 | (5.61 | ) | 0.99 | 0.87 | 0.12 | ||||||||||||||
| Total from operations | 0.79 | (5.42 | ) | 1.15 | 0.95 | 0.13 | ||||||||||||||
| Distributions: | ||||||||||||||||||||
| Distributions from net investment income | (0.13 | ) | (0.17 | ) | (0.16 | ) | (0.07 | ) | — | |||||||||||
| Net asset value, end of period | $ | 7.07 | $ | 6.41 | $ | 12.00 | $ | 11.01 | $ | 10.13 | ||||||||||
Total return | 12.33 | % | –45.07 | % | 10.42 | % | 9.36 | % | 1.30 | %(b) | ||||||||||
Ratios and supplemental data: | ||||||||||||||||||||
| Net assets at end of period (millions) | $ | 22.6 | $ | 24.1 | $ | 40.4 | $ | 20.9 | $ | 3.6 | ||||||||||
| Ratios to average net assets: | ||||||||||||||||||||
| Ratios net of expenses reduced or reimbursed by adviser: | ||||||||||||||||||||
| Expenses | 0.79 | % | 0.74 | % | 0.73 | % | 0.88 | % | 1.60 | %(a) | ||||||||||
| Net investment income | 2.03 | % | 2.05 | % | 1.83 | % | 1.28 | % | 1.22 | %(a) | ||||||||||
| Ratios assuming no expenses reduced or reimbursed by adviser: | ||||||||||||||||||||
| Expenses | 0.79 | % | 0.74 | % | 0.73 | % | 0.88 | % | 3.38 | %(a) | ||||||||||
| Net investment income | 2.03 | % | 2.05 | % | 1.83 | % | 1.28 | % | -0.55 | %(a) | ||||||||||
| Portfolio turnover rate | 95 | % | 105 | % | 54 | % | 52 | % | 0 | % | ||||||||||
| (a) | Annualized. |
| (b) | Not annualized. |
| * | Represents date of commencement of operations. |
The accompanying notes are an integral part of these financial statements.
170
Ohio National Fund, Inc.
Bristol Growth Portfolio
Bristol Growth Portfolio
Objective/Strategy
The Bristol Growth Portfolio seeks long-term growth of capital by investing primarily in common stocks of the 1,000 largest publicly traded U.S. companies in terms of market capitalization.
Performance as of December 31, 2009
Average Annual Total Returns: | ||||
| One year | 42.28% | |||
| Since inception (5/1/07) | -4.92% |
Past performance does not guarantee future results. The performance data quoted represents past performance and current returns may be lower or higher. Total return figures include change in share price and reinvestment of dividends and capital gains. The investment return and principal value will fluctuate so that an investor’s shares, when redeemed, may be worth more or less than the original cost. To obtain performance information up to the most recent month end, call toll-free 1-877-781-6392.
The Portfolio is not open to direct retail investment. Beneficial interest in shares is obtained solely by purchase of variable life insurance policies and variable annuity contracts. Actual performance results for variable annuity and variable universal life contracts will be lower due to contract charges. Consult your contract for applicable charges.
Comments
For the year ended December 31, 2009, the Bristol Growth Portfolio returned 42.28% versus 37.21% for the current benchmark, the Russell 1000 Growth Index.
Following a year in which the stock market declined nearly 40%, 2009 got off to a dreadful start with the Russell 1000 Growth Index plummeting 18% to its early March low. As unprecedented global fiscal and monetary stimulus programs began to show some benefits, the panic gripping the markets early in the year lessened, a more fundamentals-based approach to valuations took hold and the market recovered nearly 65% off the bottom to end the year up.
The Portfolio benefitted from underweight positions in two under-performing sectors in 2009, Health Care and Consumer Staples. Health Care was negatively impacted by concerns about reform under President Obama for most of the year, and the Consumer Staples lagged in an up-market, as is characteristic of that “defensive” sector. The Portfolio also benefitted from an over-weight position in the Information Technology sector, which experienced very positive results in 2009.
Four of the top five contributors to the Portfolio’s performance in 2009 were technology companies: Apple, Inc., Microsoft Corp., Google, Inc. and International Business Machines Corp. added between 200-300 basis points to absolute performance each. Apple, Inc.’s earnings estimates moved up throughout the year, as iPhone sales continued to exceed expectations and more recently analysts expected increased contributions from their “Apps store.” Google, Inc. benefited from improving advertising trends, particularly online, and excitement surrounding their smartphone launch. Microsoft Corp. out-performed based on higher targeted cost cuts and market share gains for their Bing search engine. International Business Machines Corp. benefited from expectations of a strong year end budget flush from their enterprise customers. Rounding out the top five contributors to the year, Celanese Corp. added 184 basis points, based on of its low cost chemical production and exposure to the rebounding Chinese economy.(1)
Detractors from full year performance included Exxon Mobil Corp., as the company was negatively impacted by the falling price of oil during the year in which we owned the stock, costing the Portfolio 75 basis points. SunPower Corp. was hurt by aggressive pricing on polysilicon which is used in the production of solar panels, detracting 61 basis points from absolute performance. Insurer The Hartford Financial Services Group, Inc. under-performed during the period we owned the stock due to combined fears of investment portfolio losses and the need to raise capital to cover reserve requirements for their variable annuity businesses, costing the Portfolio 66 basis points. Raytheon Co. cost the Portfolio 30 basis points due to concerns over potential reductions in the defense budget, and Wal-Mart Stores, Inc. hurt performance by 29 basis points as we owned the stock when they gave disappointing earnings guidance mid-year.(1)
As a result of our bottom-up stock selection, the greatest shift in sector weightings during the year occurred in the Consumer Discretionary sector, where the sector weighting ended at 10.2%, in line with the benchmark weighting of 10.5% and up from 2.0% to start the year. Purchases in this sector include cruise line operator Royal Caribbean Cruises Ltd., where estimates have been moving, up, valuation is attractive and the company is better positioned to withstand high fuel costs relative to prior years due to a significantly more efficient fleet of ships. We also initiated a position in Amazon.com, Inc. in the fourth quarter following a strong earnings report; we believe there is further upside to earnings estimates and valuation looks attractive.(1)
Sales of Health Care stocks during the year resulted in a decreased weighting in that sector. Health Care sales include Abbott Laboratories, a stock we sold as it approached our target and anecdotes emerged of weakening growth trends in a drug worth just under half of the company’s operating profits. We also sold WellPoint, Inc. based on valuation, as attention surrounding the public option faded and the stock recovered late in the year.(1)
The Portfolio weighting in Consumer Staples is below the benchmark weighting and below where it started the year. While activity in the Portfolio in the first half of the year reduced this sector weighting on balance, we have added a few positions in December which resulted in a reduced under-weight position to end the year. These recent purchases include General Mills, Inc., a food company that experienced positive revisions based on improvements in their Pillsbury division and continued strength in cereal, and Wal-Mart Stores, Inc. based on comments from an apparel supplier indicating strong reorder activity at the retailer.(1)
As we enter 2010, the combined Portfolio weighting in the Materials and Industrials sectors stands well above a combined benchmark weighting. Recent new additions to the Portfolio in these sectors include Honeywell International, Inc., Goodrich Corp. and United Technologies Corp. which we purchased based on attractive valuation and evidence of an improving aerospace aftermarket. We also purchased Illinois Tool Works, Inc. based on positive revisions due to the potential for the company to achieve higher margins versus previous economic cycles.(1)
(continued)
171
Ohio National Fund, Inc.
Bristol Growth Portfolio (Continued)
Bristol Growth Portfolio (Continued)
While there are certainly economic issues that concern us, including the continued overhang of commercial real estate exposure on select financial companies and record high unemployment levels in the U.S., we are also seeing signs of stability in the economic recovery, such as evidence of a potential bottoming in the residential housing market and the newly lean cost structures of numerous blue chip companies that should provide enhanced earnings leverage going forward. We are certainly seeing more stocks exhibiting both attractive valuation and improving fundamentals than we saw one year ago, and we look forward to reporting on our progress to you again in the coming months.
| (1) | The Portfolio’s composition is subject to change. Holdings and weightings are as of December 31, 2009. |
Change in Value of $10,000 Investment
![[PERFORMANCE GRAPH]](https://capedge.com/proxy/N-CSR/0000950123-10-021904/l38589l3858959.gif)
Hypothetical illustration based on past performance. Future performance will vary. The Portfolio’s returns reflect reinvested dividends. The Portfolio’s holdings may differ significantly from the securities in the index. The index is unmanaged and therefore does not reflect the cost of portfolio management and accounting.
The Russell 1000 Growth Index is a market-capitalization weighted index of those firms in the Russell 1000 with higher price-to-book ratios and higher forecasted growth values. The index presented herein includes the effects of requested dividends.
Portfolio Composition as of December 31, 2009 (1)
| % of Net Assets | |||
Common Stocks (3) | 97.5 | ||
| Money Market Funds and Other Net Assets | 2.5 | ||
| 100.0 | |||
Top 10 Portfolio Holdings as of December 31, 2009 (1) (2)
| % of Net Assets | |||||||
| 1. | International Business Machines Corp. | 4.0 | |||||
| 2. | Cisco Systems, Inc. | 3.4 | |||||
| 3. | Microsoft Corp. | 3.2 | |||||
| 4. | Apple, Inc. | 3.1 | |||||
| 5. | Exxon Mobil Corp. | 3.0 | |||||
| 6. | Johnson & Johnson | 2.8 | |||||
| 7. | Google, Inc. Class A | 2.8 | |||||
| 8. | Hewlett-Packard Co. | 2.5 | |||||
| 9. | Procter & Gamble Co. / The | 2.4 | |||||
| 10. | Intel Corp. | 2.3 | |||||
| (1) | Composition of Portfolio subject to change. | |
| (2) | Short-term investments have been excluded from the list of Top 10 Portfolio holdings. | |
| (3) | Sectors: |
| % of Net Assets | |||
| Information Technology | 34.5 | ||
| Industrials | 13.7 | ||
| Health Care | 10.5 | ||
| Consumer Staples | 10.0 | ||
| Consumer Discretionary | 10.0 | ||
| Materials | 8.4 | ||
| Financials | 6.7 | ||
| Energy | 3.7 | ||
| 97.5 | |||
172
Ohio National Fund, Inc.
Bristol Growth Portfolio
Bristol Growth Portfolio
| Schedule of Investments | December 31, 2009 |
| Common Stocks – 97.5% | Shares | Value | ||||||
CONSUMER DISCRETIONARY – 10.0% | ||||||||
Hotels, Restaurants & Leisure – 2.0% | ||||||||
| Darden Restaurants, Inc. | 1,900 | $ | 66,633 | |||||
| Royal Caribbean Cruises Ltd. (a) | 5,900 | 149,152 | ||||||
| 215,785 | ||||||||
Internet & Catalog Retail – 0.8% | ||||||||
| Amazon.com, Inc. (a) | 600 | 80,712 | ||||||
Multiline Retail – 2.0% | ||||||||
| Target Corp. | 4,300 | 207,991 | ||||||
Specialty Retail – 3.3% | ||||||||
| Bed Bath & Beyond, Inc. (a) | 3,200 | 123,616 | ||||||
| Lowe’s Companies, Inc. | 9,400 | 219,866 | ||||||
| 343,482 | ||||||||
Textiles, Apparel & Luxury Goods – 1.9% | ||||||||
| VF Corp. | 2,700 | 197,748 | ||||||
TOTAL CONSUMER DISCRETIONARY | 1,045,718 | |||||||
CONSUMER STAPLES – 10.0% | ||||||||
Beverages – 2.9% | ||||||||
Coca-Cola Co. / The | 1,800 | 102,600 | ||||||
| PepsiCo, Inc. | 3,300 | 200,640 | ||||||
| 303,240 | ||||||||
Food & Staples Retailing – 1.9% | ||||||||
| Wal-Mart Stores, Inc. | 3,700 | 197,765 | ||||||
Food Products – 2.8% | ||||||||
| General Mills, Inc. | 2,900 | 205,349 | ||||||
| Ralcorp Holdings, Inc. (a) | 1,600 | 95,536 | ||||||
| 300,885 | ||||||||
Household Products – 2.4% | ||||||||
| Procter & Gamble Co. / The | 4,100 | 248,583 | ||||||
TOTAL CONSUMER STAPLES | 1,050,473 | |||||||
ENERGY – 3.7% | ||||||||
Oil, Gas & Consumable Fuels – 3.7% | ||||||||
| Apache Corp. | 700 | 72,219 | ||||||
| Exxon Mobil Corp. | 4,600 | 313,674 | ||||||
| 385,893 | ||||||||
TOTAL ENERGY | 385,893 | |||||||
FINANCIALS – 6.7% | ||||||||
Capital Markets – 3.8% | ||||||||
| Goldman Sachs Group, Inc. / The | 600 | 101,304 | ||||||
| Morgan Stanley | 4,200 | 124,320 | ||||||
| State Street Corp. | 4,000 | 174,160 | ||||||
| 399,784 | ||||||||
Diversified Financial Services – 1.7% | ||||||||
| Bank of America Corp. | 5,800 | 87,348 | ||||||
| JPMorgan Chase & Co. | 2,200 | 91,674 | ||||||
| 179,022 | ||||||||
Insurance – 1.2% | ||||||||
| Prudential Financial, Inc. | 2,500 | 124,400 | ||||||
TOTAL FINANCIALS | 703,206 | |||||||
HEALTH CARE – 10.5% | ||||||||
Health Care Equipment & Supplies – 2.2% | ||||||||
| Hospira, Inc. (a) | 4,250 | 216,750 | ||||||
| Medtronic, Inc. | 400 | 17,592 | ||||||
| 234,342 | ||||||||
Health Care Providers & Services – 2.8% | ||||||||
| Laboratory Corp. of America Holdings (a) | 1,200 | 89,808 | ||||||
| McKesson Corp. | 3,200 | 200,000 | ||||||
| 289,808 | ||||||||
Life Sciences Tools & Services – 0.5% | ||||||||
| Thermo Fisher Scientific, Inc. (a) | 1,100 | 52,459 | ||||||
Pharmaceuticals – 5.0% | ||||||||
| Johnson & Johnson | 4,600 | 296,286 | ||||||
| Merck & Co., Inc. | 2,100 | 76,734 | ||||||
| Pfizer, Inc. | 8,600 | 156,434 | ||||||
| 529,454 | ||||||||
TOTAL HEALTH CARE | 1,106,063 | |||||||
INDUSTRIALS – 13.7% | ||||||||
Aerospace & Defense – 6.1% | ||||||||
| Goodrich Corp. | 3,400 | 218,450 | ||||||
| Honeywell International, Inc. | 5,200 | 203,840 | ||||||
| United Technologies Corp. | 3,100 | 215,171 | ||||||
| 637,461 | ||||||||
Construction & Engineering – 0.9% | ||||||||
| Quanta Services, Inc. (a) | 4,700 | 97,948 | ||||||
Electrical Equipment – 0.1% | ||||||||
| SunPower Corp. (a) | 600 | 12,570 | ||||||
Industrial Conglomerates – 3.3% | ||||||||
| 3M Co. | 1,900 | 157,073 | ||||||
| Tyco International Ltd. | 5,400 | 192,672 | ||||||
| 349,745 | ||||||||
Machinery – 3.3% | ||||||||
| Caterpillar, Inc. | 3,400 | 193,766 | ||||||
| Illinois Tool Works, Inc. | 3,100 | 148,769 | ||||||
| 342,535 | ||||||||
TOTAL INDUSTRIALS | 1,440,259 | |||||||
INFORMATION TECHNOLOGY – 34.5% | ||||||||
Communications Equipment – 5.4% | ||||||||
| Cisco Systems, Inc. (a) | 14,900 | 356,706 | ||||||
| QUALCOMM, Inc. | 4,500 | 208,170 | ||||||
| 564,876 | ||||||||
Computers & Peripherals – 11.4% | ||||||||
| Apple, Inc. (a) | 1,550 | 326,833 | ||||||
| Dell, Inc. (a) | 13,700 | 196,732 | ||||||
| Hewlett-Packard Co. | 5,000 | 257,550 | ||||||
| International Business Machines Corp. | 3,200 | 418,880 | ||||||
| 1,199,995 | ||||||||
Internet Software & Services – 2.8% | ||||||||
| Google, Inc. Class A (a) | 470 | 291,391 | ||||||
(continued)
173
Ohio National Fund, Inc.
Bristol Growth Portfolio (Continued)
Bristol Growth Portfolio (Continued)
| Schedule of Investments | December 31, 2009 |
| Common Stocks – 97.5% | Shares | Value | ||||||
IT Services – 1.8% | ||||||||
| MasterCard, Inc. Class A | 750 | $ | 191,985 | |||||
Semiconductors & Semiconductor Equipment – 8.8% | ||||||||
| Applied Materials, Inc. | 11,000 | 153,340 | ||||||
| Intel Corp. | 12,000 | 244,800 | ||||||
| Maxim Integrated Products, Inc. | 10,300 | 209,090 | ||||||
| Texas Instruments, Inc. | 8,300 | 216,298 | ||||||
| Varian Semiconductor Equipment Associates, Inc. (a) | 2,700 | 96,876 | ||||||
| 920,404 | ||||||||
Software – 4.3.% | ||||||||
| Microsoft Corp. | 11,100 | 338,439 | ||||||
| Oracle Corp. | 4,600 | 112,884 | ||||||
| 451,323 | ||||||||
TOTAL INFORMATION TECHNOLOGY | 3,619,974 | |||||||
MATERIALS – 8.4% | ||||||||
Chemicals – 2.7% | ||||||||
| Air Products and Chemicals, Inc. | 1,200 | 97,272 | ||||||
| Dow Chemical Co. / The | 6,900 | 190,647 | ||||||
| 287,919 | ||||||||
Containers & Packaging – 2.0% | ||||||||
| Ball Corp. | 4,000 | 206,800 | ||||||
Metals & Mining – 3.7% | ||||||||
| Freeport-McMoRan Copper & Gold, Inc. (a) | 2,500 | 200,725 | ||||||
| Teck Resources Ltd. (a) | 5,500 | 192,335 | ||||||
| 393,060 | ||||||||
TOTAL MATERIALS | 887,779 | |||||||
Total Common Stocks (Cost $9,198,697) | $ | 10,239,365 | ||||||
| Money Market Funds – 1.8% | Shares | Value | ||||||
| Fidelity Institutional Money Market Funds | ||||||||
| Money Market Portfolio – Class I | 184,000 | $ | 184,000 | |||||
Total Money Market Funds (Cost $184,000) | $ | 184,000 | ||||||
Total Investments – 99.3% (Cost $9,382,697) (b) | $ | 10,423,365 | ||||||
Other Assets in Excess of Liabilities – 0.7% | 74,210 | |||||||
Net Assets – 100.0% | $ | 10,497,575 | ||||||
Percentages are stated as a percent of net assets.
Footnotes:
| (a) | Non-income producing security. | |
| (b) | Represents cost for financial reporting purposes, which may differ from cost basis for Federal income tax purposes. See also Note 8 of the Notes to Financial Statements. |
The accompanying notes are an integral part of these financial statements.
174
Ohio National Fund, Inc.
Bristol Growth Portfolio
Bristol Growth Portfolio
Statement of Assets and Liabilities
December 31, 2009
| Assets: | ||||
| Investments in securities, at value (Cost $9,382,697) | $ | 10,423,365 | ||
| Cash | 896 | |||
| Receivable for securities sold | 347,802 | |||
| Receivable for fund shares sold | 72 | |||
| Dividends and accrued interest receivable | 6,197 | |||
| Prepaid expenses and other assets | 158 | |||
| Total assets | 10,778,490 | |||
| Liabilities: | ||||
| Payable for securities purchased | 253,998 | |||
| Payable for fund shares redeemed | 4,352 | |||
| Payable for investment management services | 7,054 | |||
| Payable for compliance services | 1,677 | |||
| Accrued custody expense | 346 | |||
| Accrued professional fees | 11,097 | |||
| Accrued accounting fees | 1,699 | |||
| Accrued printing and filing fees | 692 | |||
| Total liabilities | 280,915 | |||
| Net assets | $ | 10,497,575 | ||
| Net assets consist of: | ||||
| Par value, $1 per share | $ | 1,199,998 | ||
| Paid-in capital in excess of par value | 9,851,920 | |||
| Accumulated net realized loss on investments | (1,614,285 | ) | ||
| Net unrealized appreciation on investments | 1,040,668 | |||
| Undistributed net investment income | 19,274 | |||
| Net assets | $ | 10,497,575 | ||
| Shares outstanding | 1,199,998 | |||
| Authorized Fund shares allocated to Portfolio | 5,000,000 | |||
| Net asset value per share | $ | 8.75 | ||
Statement of Operations
For the Year Ended December 31, 2009
| Investment income: | ||||
| Interest | $ | 850 | ||
| Dividends (net of withholding tax of $22) | 114,436 | |||
| Total investment income | 115,286 | |||
| Expenses: | ||||
| Management fees | 59,527 | |||
| Custodian fees | 6,658 | |||
| Directors’ fees | 795 | |||
| Professional fees | 12,137 | |||
| Accounting fees | 9,046 | |||
| Printing and filing fees | 1,318 | |||
| Compliance expense | 6,376 | |||
| Other | 161 | |||
| Total expenses | 96,018 | |||
| Net investment income | 19,268 | |||
| Realized/unrealized gain (loss) on investments and foreign currency related transactions: | ||||
| Net realized gain (loss) on: | ||||
| Investments | (87,073 | ) | ||
| Foreign currency related transactions | 6 | |||
| Change in unrealized appreciation/depreciation on investments | 2,664,053 | |||
| Net realized/unrealized gain (loss) on investments and foreign currency related transactions | 2,576,986 | |||
| Change in net assets from operations | $ | 2,596,254 | ||
The accompanying notes are an integral part of these financial statements.
175
Ohio National Fund, Inc.
Bristol Growth Portfolio
Bristol Growth Portfolio
Statements of Changes in Net Assets
| Years Ended December 31, | ||||||||
| 2009 | 2008 | |||||||
Increase (Decrease) in Net Assets: | ||||||||
| Operations: | ||||||||
| Net investment income | $ | 19,268 | $ | 11,955 | ||||
| Net realized gain (loss) on investments and foreign currency related transactions | (87,067 | ) | (1,469,277 | ) | ||||
| Change in unrealized appreciation/depreciation on investments | 2,664,053 | (1,710,774 | ) | |||||
| Change in net assets from operations | 2,596,254 | (3,168,096 | ) | |||||
| Capital transactions: | ||||||||
| Received from shares sold | 4,010,986 | 998,652 | ||||||
| Paid for shares redeemed | (953,320 | ) | (332,498 | ) | ||||
| Change in net assets from capital transactions | 3,057,666 | 666,154 | ||||||
| Change in net assets | 5,653,920 | (2,501,942 | ) | |||||
Net Assets: | ||||||||
| Beginning of year | 4,843,655 | 7,345,597 | ||||||
| End of year | $ | 10,497,575 | $ | 4,843,655 | ||||
| Undistributed net investment income | $ | 19,274 | $ | 11,955 | ||||
Financial Highlights
| For the | ||||||||||||
| Years Ended | Period from | |||||||||||
| December 31, | May 1, 2007* to | |||||||||||
| 2009 | 2008 | December 31, 2007 | ||||||||||
Selected Per-Share Data: | ||||||||||||
| Net asset value, beginning of period | $ | 6.15 | $ | 10.35 | $ | 10.00 | ||||||
| Operations: | ||||||||||||
| Net investment income | 0.01 | 0.01 | 0.01 | |||||||||
| Net realized and unrealized gain (loss) on investments | 2.59 | (4.21 | ) | 0.34 | ||||||||
| Total from operations | 2.60 | (4.20 | ) | 0.35 | ||||||||
| Net asset value, end of period | $ | 8.75 | $ | 6.15 | $ | 10.35 | ||||||
Total return | 42.28 | % | –40.58 | % | 3.50 | %(b) | ||||||
Ratios and supplemental data: | ||||||||||||
| Net assets at end of period (millions) | $ | 10.5 | $ | 4.8 | $ | 7.3 | ||||||
| Ratios to average net assets: | ||||||||||||
| Expenses | 1.29 | % | 1.26 | % | 1.30 | %(a) | ||||||
| Net investment income | 0.26 | % | 0.18 | % | 0.10 | %(a) | ||||||
| Portfolio turnover rate | 218 | % | 175 | % | 107 | % | ||||||
| (a) | Annualized. |
| (b) | Not annualized. |
| * | Represents date of commencement of operations. |
The accompanying notes are an integral part of these financial statements.
176
Ohio National Fund, Inc.
| Notes to Financial Statements | December 31, 2009 |
| (1) | Organization |
Ohio National Fund, Inc. (the “Fund”) is a Maryland corporation registered under the Investment Company Act of 1940, as amended (the “1940 Act”), as an open-end management investment company. The Fund consists of twenty four separate investment portfolios (the “Portfolios”) that seek the following objectives and strategies:
| n | Equity Portfolio — Long-term growth of capital by investing primarily in common stocks or other equity securities. | |
| n | Money Market Portfolio — Maximum current income consistent with preservation of capital and liquidity by investing in high quality money market instruments. | |
| n | Bond Portfolio — High level of income and opportunity for capital appreciation consistent with preservation of capital by investing primarily in intermediate-term and long-term fixed income securities. | |
| n | Omni Portfolio — High level of long-term total return consistent with preservation of capital by investing in stocks, bonds, and money market instruments. | |
| n | International Portfolio — Total return on assets by investing primarily in equity securities of foreign companies. | |
| n | Capital Appreciation Portfolio — Long term capital growth by investing primarily in common stocks of established companies with either current or emerging earnings growth not fully appreciated or recognized by the market. | |
| n | Millennium Portfolio — Maximum capital growth by investing primarily in common stocks of small sized companies. | |
| n | International Small-Mid Company Portfolio — Long-term growth of capital by investing at least 80% of its assets in equity securities of foreign small and mid-cap companies. | |
| n | Aggressive Growth Portfolio — Long-term capital growth by investing primarily in equity securities with attractive growth opportunities. | |
| n | Small Cap Growth Portfolio — Long-term capital appreciation by investing at least 80% of its net assets in stocks of small companies, primarily those with strong business franchises and competitive positions that generate rapidly rising earnings or profits. | |
| n | Mid Cap Opportunity Portfolio — Long-term total return by investing at least 80% of its net assets in equity securities of mid-cap companies, primarily those that are strategically positioned for long-term growth. | |
| n | S&P 500® Index Portfolio — Total return that approximates the total return of the Standard & Poor’s 500® Index. | |
| n | Strategic Value Portfolio — Growth of capital and income by investing primarily in securities of high dividend yielding companies. | |
| n | High Income Bond Portfolio — High current income by investing at least 80% of its net assets in lower rated corporate debt obligations commonly referred to as “junk bonds”. The Portfolio’s investments are generally rated Baa or lower by Moody’s, or BBB or lower by Standard & Poor’s or Fitch. | |
| n | Capital Growth Portfolio — Long-term capital appreciation by investing in and actively managing equity securities of small cap growth companies. | |
| n | Nasdaq-100® Index Portfolio — Long-term growth of capital by investing primarily in stocks that are included in the Nasdaq-100® Index. Unlike the other Portfolios of the Fund, the Nasdaq-100® Index Portfolio is a non-diversified portfolio for purposes of Section 5 (b) of the 1940 Act. | |
| n | Bristol Portfolio — Long-term growth of capital by investing primarily in common stocks of the 1,000 largest publicly traded U.S. companies in terms of market capitalization. | |
| n | Bryton Growth Portfolio — Long-term growth of capital by investing primarily in common stocks of growth-oriented U.S. companies smaller than the 500 largest publicly traded U.S. companies in terms of market capitalization. |
(continued)
177
Ohio National Fund, Inc.
| Notes to Financial Statements (Continued) | December 31, 2009 |
| n | U.S. Equity Portfolio — Capital appreciation with a secondary objective of capital preservation to provide long term growth by investing at least 80% of its net assets in equity securities traded in the U.S. within under-priced sectors and industries. | |
| n | Balanced Portfolio — Capital appreciation and income by investing normally up to 75% of its assets in equity securities within under-priced sectors and industries while maintaining a minimum of 25% of its assets in fixed income securities. | |
| n | Income Opportunity Portfolio — Modest capital appreciation and maximization of realized gains by investing within under-priced industries. | |
| n | Target VIP Portfolio — Above average total return by investing in the common stocks of companies which are identified by a model that applies separate uniquely specialized strategies. | |
| n | Target Equity/Income Portfolio — Above average total return by adhering to a disciplined, quantitative investment process that incorporates two distinct strategy methodologies. | |
| n | Bristol Growth Portfolio — Long-term growth of capital by investing primarily in common stocks of the 1,000 largest publicly traded U.S. companies in terms of market capitalization. |
Additional detail regarding portfolio-specific objectives, policies, and investment strategies is provided in the prospectus and Statement of Additional Information of Ohio National Fund, Inc. There are no assurances these objectives will be met. Each Portfolio, except the Nasdaq-100® Index Portfolio, is classified as diversified for purposes of Section 5 (b) of the 1940 Act.
At present, the Fund sells its shares only to separate accounts of The Ohio National Life Insurance Company (“ONLIC”), Ohio National Life Assurance Corporation (“ONLAC”), and National Security Life and Annuity Company (“NSLA”) to support certain benefits under variable contracts issued by those entities. In the future, Fund shares may be used for other purposes but, unless there is a change in applicable law, they will not be sold directly to the public.
Interest in each Portfolio is represented by a separate class of the Fund’s capital stock, par value $1. Each share of a Portfolio participates equally in the Portfolio’s dividends, distributions, net assets, and voting matters.
The Fund is authorized to issue 350 million of its capital shares. These authorized shares have been allocated to specific Portfolios of the Fund as follows:
| Portfolio | Authorized Shares | |||
| Equity | 25,000,000 | |||
| Money Market | 55,000,000 | |||
| Bond | 20,000,000 | |||
| Omni | 5,000,000 | |||
| International | 34,000,000 | |||
| Capital Appreciation | 15,000,000 | |||
| Millennium | 10,000,000 | |||
| International Small-Mid Company | 10,000,000 | |||
| Aggressive Growth | 10,000,000 | |||
| Small Cap Growth | 5,000,000 | |||
| Mid Cap Opportunity | 10,000,000 | |||
S&P 500® Index | 23,000,000 | |||
| Portfolio | Authorized Shares | |||
| Strategic Value | 5,000,000 | |||
| High Income Bond | 25,000,000 | |||
| Capital Growth | 5,000,000 | |||
Nasdaq-100® Index | 20,000,000 | |||
| Bristol | 25,000,000 | |||
| Bryton Growth | 20,000,000 | |||
| U.S. Equity | 5,000,000 | |||
| Balanced | 3,000,000 | |||
| Income Opportunity | 3,000,000 | |||
| Target VIP | 5,000,000 | |||
| Target Equity/Income | 7,000,000 | |||
| Bristol Growth | 5,000,000 | |||
The Fund’s Board of Directors (the “Board”) periodically reallocates authorized shares among the Portfolios of the Fund as deemed necessary.
Under the Fund’s organizational documents, its Officers and Directors are indemnified against certain liabilities arising out of the performance of their duties to the Fund. In addition, in the normal course of business, the Fund enters into contracts with its vendors and others that provide for general indemnifications. The Fund’s maximum exposure under these arrangements is unknown as this would involve future claims that may be made against the Fund. However, based on experience, the risk of loss to the Fund is expected to be remote.
(continued)
178
Ohio National Fund, Inc.
| Notes to Financial Statements (Continued) | December 31, 2009 |
| (2) | Significant Accounting Policies |
The following is a summary of significant accounting policies followed by the Fund in preparation of its financial statements:
Use of Estimates
The preparation of financial statements in conformity with U.S. generally accepted accounting principles (“GAAP”) requires management to make estimates and assumptions that affect the reported amounts of assets and liabilities and disclosure of contingent assets and liabilities at the date of the financial statements and the reported amounts of increases and decreases in net assets from operations during the reporting period. Actual results could differ from those estimates.
Security Valuation
Investments are valued using pricing procedures approved by the Board.
All investments in the Money Market Portfolio are valued at amortized cost in accordance with Rule 2a-7 of the 1940 Act. Should the short-term debt securities held in the Omni Portfolio maintain a dollar-weighted average maturity of 120 days or less and have no maturities greater than one year, such instruments will be valued at amortized cost. In all Portfolios of the Fund, fixed income instruments that mature in sixty days or less are consistently valued at amortized cost. Amortized cost valuation involves valuing a security at its cost initially and thereafter amortizing to maturity any discounts or premiums on the level-yield method, regardless of the impact of fluctuating market interest rates on the fair value of the security. In these instances, amortized cost approximates fair value.
Investments, other than those securities aforementioned, are valued as follows:
| Domestic equity securities that are traded on U.S. exchanges, with the exception of options, are valued at the last trade price reported by the primary exchange of each security (4:00 pm Eastern Time for normal trading sessions). Option securities are currently valued on a composite close price basis. Over-the-counter domestic equity securities are valued at the last trade price reported daily as of 4:00 pm Eastern Time (normal trading sessions). Over-the-counter traded ADRs may be valued at an evaluated price based on the value of the underlying securities. If a domestic equity security is not traded on a particular day, the mean between the bid and ask prices reported at 4:00 pm Eastern Time (normal trading sessions) by the primary exchange will generally be used for valuation purposes. The principal sources for market quotations are independent national pricing services that have been approved by the Board. | ||
| Fixed income securities that have a remaining maturity exceeding sixty days are generally valued at the mean between the daily close bid and ask prices, as provided by independent pricing services approved by the Board. | ||
| Repurchase agreements are valued at amortized cost, which approximates fair value. | ||
| Restricted securities, illiquid securities, or other investments for which market quotations are not readily available are valued at estimated fair market value using methods determined in good faith by the Fund’s Pricing Committee under the supervision of the Board. | ||
| Foreign equity securities are initially priced at the reported close price of the exchange on which a security is primarily traded. Securities not traded on a particular day are valued at the mean between the last reported bid and ask quotes at daily close, or the last sale price when appropriate. The principal sources for market quotations are independent pricing services that have been approved by the Board. | ||
| Equity securities that are primarily traded on foreign exchanges, other than those in North or South America, are further subjected to fair valuation pricing procedures provided by an independent fair valuation service. The service provides data that can be used to estimate the price of a foreign issue that would prevail in a liquid market given market information available daily at 4:00 pm Eastern Time (normal trading sessions). Multiple factors may be considered in performing this valuation, including an issue’s local close price, relevant general and sector indices, currency fluctuations, and pricing of related depository receipts, exchange traded funds, and futures. The assumptions selected by the Fund that are used in the |
(continued)
179
Ohio National Fund, Inc.
| Notes to Financial Statements (Continued) | December 31, 2009 |
valuation include a zero-basis trigger using the S&P 500 Index and a 75% confidence interval. These assumptions result in the performance of the pricing procedures each day there is a change in the S&P 500 Index from the time of local close to the U.S. market close for each individual security for which there is a fairly large degree of certainty that the local close price is not the liquid market price at the time of U.S. market close. Backtesting analysis is performed on a quarterly basis to monitor the effectiveness of these procedures. The testing is reviewed by management of the Fund as well as the Fund’s Board. Prior results have indicated that the fair value procedures have been effective in reaching valuation objectives.
The differences between the aggregate cost and values of investments are reflected as unrealized appreciation or unrealized depreciation.
Pricing inputs used in the Fund’s determination of its investment values are categorized according to a three-tier hierarchy framework. The hierarchy is summarized in three broad levels:
| Level 1: | Quoted prices in active markets for identical securities. | |
| Level 2: | Other significant observable inputs, including quoted prices for similar securities, interest rates, prepayment speeds, credit risk, etc. | |
| Level 3: | Significant unobservable inputs, including the Fund’s own assumptions used to determine the value of securities. |
The following is a summary of the inputs used in valuing each of the Portfolio’s assets (liabilities) at value as of December 31, 2009:
Portfolio | Financial Instrument Type | Level 1 | Level 2 | Level 3 | ||||||||||
| Equity | Common Stocks | $ | 219,249,903 | $ | — | $ | — | |||||||
| Preferred Stocks | 465,504 | — | — | |||||||||||
| Repurchase Agreements | — | 4,868,220 | — | |||||||||||
| $ | 219,715,407 | $ | 4,868,220 | $ | — | |||||||||
| Money Market* | Commercial Paper | $ | — | $ | 204,993,757 | $ | — | |||||||
| Money Market Funds | 45,000,000 | — | — | |||||||||||
| U.S. Treasury Obligations | — | 14,998,892 | — | |||||||||||
| U.S. Government Agency Issues | — | 14,999,825 | — | |||||||||||
| Repurchase Agreements | — | 16,750,000 | — | |||||||||||
| $ | 45,000,000 | $ | 251,742,474 | $ | — | |||||||||
| Bond | Corporate Bonds | $ | — | $ | 120,078,508 | $ | — | |||||||
| U.S. Treasury Obligations | — | 1,884,559 | — | |||||||||||
| Commercial Paper | — | 3,999,993 | — | |||||||||||
| Money Market Funds | 3,160,000 | — | — | |||||||||||
| Repurchase Agreements | — | 5,829,000 | — | |||||||||||
| $ | 3,160,000 | $ | 131,792,060 | $ | — | |||||||||
| Omni | Common Stocks | $ | 27,934,784 | $ | — | $ | — | |||||||
| Corporate Bonds | — | 11,188,621 | — | |||||||||||
| Money Market Funds | 2,197,000 | — | — | |||||||||||
| $ | 30,131,784 | $ | 11,188,621 | $ | — | |||||||||
(continued)
180
Ohio National Fund, Inc.
| Notes to Financial Statements (Continued) | December 31, 2009 |
Portfolio | Financial Instrument Type | Level 1 | Level 2 | Level 3 | ||||||||||
| International | Common Stocks | $ | 44,489,597 | $ | 153,778,513 | $ | — | |||||||
| Preference Shares (Brazil) | 1,062,549 | — | — | |||||||||||
| Exchange Traded Funds | 8,406,412 | — | — | |||||||||||
| Rights | — | 2,322 | — | |||||||||||
| Warrants | 5,496 | — | — | |||||||||||
| Money Market Funds | 1,675,416 | — | — | |||||||||||
| $ | 55,639,470 | $ | 153,780,835 | $ | — | |||||||||
| Foreign currency contracts | $ | 20,478,030 | $ | — | $ | — | ||||||||
| (19,352,779 | ) | — | — | |||||||||||
| $ | 1,125,251 | $ | — | $ | — | |||||||||
| Capital Appreciation | Common Stocks | $ | 119,393,488 | $ | 3,292,349 | $ | — | |||||||
| Preferred Stocks | 228,276 | — | — | |||||||||||
| Money Market Funds | 4,587,000 | — | — | |||||||||||
| $ | 124,208,764 | $ | 3,292,349 | $ | — | |||||||||
| Millennium | Common Stocks | $ | 106,253,086 | $ | — | $ | — | |||||||
| Money Market Funds | 3,176,000 | — | — | |||||||||||
| $ | 109,429,086 | $ | — | $ | — | |||||||||
| International Small-Mid Company | Common Stocks | $ | 17,680,874 | $ | 50,634,012 | $ | — | |||||||
| Exchange Traded Funds | 652,380 | — | — | |||||||||||
| Money Market Funds | 2,115,321 | — | — | |||||||||||
| $ | 20,448,575 | $ | 50,634,012 | $ | — | |||||||||
| Aggressive Growth | Common Stocks | $ | 20,768,206 | $ | 3,753,966 | $ | — | |||||||
| Preference Shares (Brazil) | 288,421 | — | — | |||||||||||
| Preferred Stocks | 408,883 | — | — | |||||||||||
| VVPR Strips | — | 50 | — | |||||||||||
| Money Market Funds | 2,077,000 | — | — | |||||||||||
| $ | 23,542,510 | $ | 3,754,016 | $ | — | |||||||||
| Small Cap Growth | Common Stocks | $ | 22,157,638 | $ | — | $ | — | |||||||
| Money Market Funds | 646,000 | — | — | |||||||||||
| $ | 22,803,638 | $ | — | $ | — | |||||||||
| Mid Cap Opportunity | Common Stocks | $ | 61,277,624 | $ | — | $ | — | |||||||
| Money Market Funds | 2,524,000 | — | — | |||||||||||
| $ | 63,801,624 | $ | — | $ | — | |||||||||
S&P 500® Index | Common Stocks | $ | 156,848,118 | $ | — | $ | — | |||||||
| Exchange Traded Funds | 3,368,274 | — | — | |||||||||||
| Commercial Paper | — | 316,000 | — | |||||||||||
| $ | 160,216,392 | $ | 316,000 | $ | — | |||||||||
| Strategic Value | Common Stocks | $ | 15,541,488 | $ | 3,824,724 | $ | — | |||||||
| Money Market Funds | 341,000 | — | — | |||||||||||
| $ | 15,882,488 | $ | 3,824,724 | $ | — | |||||||||
(continued)
181
Ohio National Fund, Inc.
| Notes to Financial Statements (Continued) | December 31, 2009 |
Portfolio | Financial Instrument Type | Level 1 | Level 2 | Level 3 | ||||||||||
| High Income Bond | Corporate Bonds | $ | — | $ | 155,899,760 | $ | — | |||||||
| Convertible Bonds | — | 757,031 | — | |||||||||||
| Preferred Stocks | — | 228,079 | — | |||||||||||
| Common Stocks | — | 199,439 | — | |||||||||||
| Warrants | — | 31 | — | |||||||||||
| Money Market Funds | 867,000 | — | — | |||||||||||
| $ | 867,000 | $ | 157,084,340 | $ | — | |||||||||
| Capital Growth | Common Stocks | $ | 36,493,332 | $ | — | $ | — | |||||||
| Money Market Funds | 350,000 | — | — | |||||||||||
| $ | 36,843,332 | $ | — | $ | — | |||||||||
Nasdaq-100® Index | Common Stocks | $ | 46,281,882 | $ | — | $ | — | |||||||
| Exchange Traded Funds | 1,633,145 | — | — | |||||||||||
| Commercial Paper | — | 167,000 | — | |||||||||||
| $ | 47,915,027 | $ | 167,000 | $ | — | |||||||||
| Bristol | Common Stocks | $ | 138,075,301 | $ | — | $ | — | |||||||
| Money Market Funds | 5,709,000 | — | — | |||||||||||
| $ | 143,784,301 | $ | — | $ | — | |||||||||
| Bryton Growth | Common Stocks | $ | 108,199,222 | $ | — | $ | — | |||||||
| Money Market Funds | 5,474,000 | — | — | |||||||||||
| $ | 113,673,222 | $ | — | $ | — | |||||||||
| U.S. Equity | Common Stocks | $ | 14,000,087 | $ | — | $ | — | |||||||
| Money Market Funds | 585,000 | — | — | |||||||||||
| $ | 14,585,087 | $ | — | $ | — | |||||||||
| Balanced | Common Stocks | $ | 8,240,986 | $ | — | $ | — | |||||||
| Preferred Stocks | 224,900 | — | — | |||||||||||
| Corporate Bonds | — | 4,225,591 | — | |||||||||||
| U.S. Government Agency Issues | — | 255,811 | — | |||||||||||
| Money Market Funds | 580,000 | — | — | |||||||||||
| $ | 9,045,886 | $ | 4,481,402 | $ | — | |||||||||
| Income Opportunity | Common Stocks | $ | 6,670,785 | $ | — | $ | — | |||||||
| Purchased Options | 6,555 | — | — | |||||||||||
| Money Market Funds | 832,000 | — | — | |||||||||||
| $ | 7,509,340 | $ | — | $ | — | |||||||||
| Written Options Outstanding | $ | (141,112 | ) | $ | — | $ | — | |||||||
| Target VIP | Common Stocks | $ | 20,314,067 | $ | — | $ | — | |||||||
| Money Market Funds | 264,000 | — | — | |||||||||||
| $ | 20,578,067 | $ | — | $ | — | |||||||||
| Target Equity/Income | Common Stocks | $ | 22,169,939 | $ | — | $ | — | |||||||
| Money Market Funds | 465,000 | — | — | |||||||||||
| $ | 22,634,939 | $ | — | $ | — | |||||||||
(continued)
182
Ohio National Fund, Inc.
| Notes to Financial Statements (Continued) | December 31, 2009 |
Portfolio | Financial Instrument Type | Level 1 | Level 2 | Level 3 | ||||||||||
| Bristol Growth | Common Stocks | $ | 10,239,365 | $ | — | $ | — | |||||||
| Money Market Funds | 184,000 | — | — | |||||||||||
| $ | 10,423,365 | $ | — | $ | — | |||||||||
| * | At December 31, 2009, the Money Market Portfolio’s investments, with the exception of money market funds, were valued using amortized cost, in accordance with rules under the 1940 Act. Amortized cost approximates the current fair value of a security, but since the value is not obtained from a quoted price in an active market, such securities are considered to be valued using Level 2 inputs. |
Below is a reconciliation that details the activity of securities in Level 3 from January 1, 2009 to December 31, 2009:
Corporate Bonds | High Income Bond | |||
| Beginning Balance – December 31, 2008 | $ | 341,503 | ||
| Total gains or losses (realized/unrealized): | ||||
| Included in earnings (or changes in net assets) | (199,672 | ) | ||
| Purchases, issuances, and settlements | (423 | ) | ||
Transfers in and/or out of Level 3 | (141,408 | ) | ||
| Ending Balance – December 31, 2009 | $ | — | ||
| The amount of total gains or losses for the period included in earnings (or changes in net assets) attributable to the change in unrealized gains or losses relating to assets still held at the reporting date | $ | (11 | ) | |
Foreign Securities and Currency
The books and records of all the Portfolios are maintained in U.S. dollars. All investments and cash quoted in foreign currencies are valued daily in U.S. dollars on the basis of the foreign currency exchange rates provided by an independent source. These exchange rates are currently determined daily, at 4:00 pm Eastern Time for normal trading sessions. Purchases and sales of foreign-denominated investments are recorded at rates of exchange prevailing on the respective dates of such transactions.
The Fund may not fully isolate that portion of the results of operations resulting from changes in foreign exchange rates from fluctuations arising from changes in market prices on foreign currency-denominated investments. However, for tax purposes, the Fund does fully isolate the effect of fluctuations in foreign exchange rates when determining the gain or loss upon sale or maturity of such investments to the extent required by Federal income tax regulations.
All Portfolios of the Fund, other than the Target VIP and Target Equity/Income Portfolios, may invest in securities of foreign issuers, although foreign securities purchased by the Money Market Portfolio must be denominated in U.S. dollars and held in custody in the United States of America. The International and International Small-Mid Company Portfolios may be invested entirely in foreign securities. Investments in securities of foreign issuers, including investments in foreign companies through the use of depository receipts, carry certain risks not ordinarily associated with investments in securities of domestic issuers. Such risks include future political and economic developments, and the possible imposition of exchange controls or other foreign governmental laws and restrictions. In addition, with respect to certain countries, there is the possibility of expropriation of assets, confiscatory taxation, political or social instability, or diplomatic developments that could adversely affect capital investment within those countries.
Repurchase Agreements
The Portfolios may acquire repurchase agreements from member banks of the Federal Reserve System which are deemed creditworthy under guidelines approved by the Board, subject to the seller’s agreement to repurchase such securities at a mutually agreed upon date and price. The repurchase price generally equals the price paid by a Portfolio plus interest negotiated on the basis of current short-term rates, which may be more or less than the rate on the underlying securities. The maturities of these instruments vary from overnight to one week. The seller, under a repurchase agreement, is required to maintain as collateral
(continued)
183
Ohio National Fund, Inc.
| Notes to Financial Statements (Continued) | December 31, 2009 |
for the repurchase transaction securities in which the Portfolio has a perfected security interest with a value not less than 100% of the repurchase price (including accrued interest). Securities subject to repurchase agreements are held by the Portfolio’s custodian or another qualified custodian or in the Federal Reserve/Treasury book-entry system. In the event of counterparty default, the Fund has the right to use the collateral to offset losses incurred. There is potential for loss to the Fund in the event the Fund is delayed or prevented from exercising its rights to dispose of the collateral securities, including the risk of a possible decline in the fair value of the underlying securities during the period while the Fund seeks to assert its rights.
Restricted and Illiquid Securities
Restricted securities are those securities purchased through a private offering and cannot be resold to the general public without prior registration under the Securities Act of 1933 (“the 1933 Act”) or pursuant to the resale limitations provided by Rule 144A under the 1933 Act, or an exemption from the registration requirements of the 1933 Act. 144A securities are issued by corporations without registration in reliance on 1933 Act provisions allowing for the private resale of unregistered securities to qualified institutional buyers. Section 4(2) commercial paper is issued pursuant to Section 4(2) of the 1933 Act which exempts an issue from registration. This paper may be used to finance non-current transactions, such as acquisitions, stock repurchase programs, and other long-term assets. Investments by a Portfolio in Rule 144A and Section 4(2) securities could have the effect of decreasing the liquidity of a Portfolio during any period in which qualified institutional investors were no longer interested in purchasing these securities.
Typically, the restricted securities noted above are not considered illiquid. The criteria used to determine if a restricted security is illiquid includes frequency of trades and quotes, available dealers willing to make transactions, availability of market makers in the security, and the nature of the security and its trades. The Money Market, Bond, and Omni Portfolios may invest up to 10% of assets in illiquid securities. Each of the other Portfolios of the Fund may invest up to 15% of its assets in illiquid securities.
When-issued Securities
The Portfolios may purchase or sell securities on a when-issued or forward commitment basis. The price of the underlying securities and date when the securities will be delivered and paid for are fixed at the time the transaction is negotiated. Losses may arise due to changes in the market value of the securities or from the inability of counterparties to meet the terms of the contract. In connection with such purchases, the Portfolios may segregate liquid assets as collateral that is deemed to be sufficient to cover the purchase price.
Borrowing and Securities Lending
Certain Portfolios of the Fund are allowed to borrow for investment purposes. Borrowings would generally be unsecured, except to the extent the Portfolios enter into reverse repurchase agreements. The 1940 Act requires the Portfolios to maintain continuous asset coverage equal to three times the amount borrowed. No borrowings were conducted by any of the Fund’s Portfolios during the year ended December 31, 2009.
All Portfolios, with the exception of the Money Market Portfolio, are able to lend securities if the loan is adequately secured, is immediately callable and allows for all interest and dividend payments; and the aggregate value of securities loaned does not exceed one third of the total assets. There were no securities lent by any of the Portfolios during the year ended December 31, 2009.
Investment Transactions and Related Income
For financial reporting purposes, investment transactions are accounted for on a trade date basis. For purposes of executing separate account shareholder transactions in the normal course of business, however, the Fund’s investment transactions are recorded no later than the first calculation on the first business day following the trade date in accordance with Rule 2a-4 of the 1940 Act. Accordingly, differences between the net asset values for financial reporting and for executing separate account shareholder transactions may arise. Dividend income is recognized on the ex-dividend date, except in the case of those Portfolios holding foreign securities, in which dividends are recorded as soon after the ex-dividend date as the Fund’s information agents
(continued)
184
Ohio National Fund, Inc.
| Notes to Financial Statements (Continued) | December 31, 2009 |
become aware of such dividends. Interest income is accrued daily as earned and includes the amortization of premium and accretion of discount. Net realized gain or loss on investments and foreign exchange transactions are determined using the specific identification method.
Distributions to Shareholders and Federal Taxes
Net investment income of the Money Market Portfolio is declared and paid daily as a dividend to shareholders immediately before the computation of the net asset value of Money Market Portfolio shares. Dividends are automatically reinvested in additional Money Market Portfolio shares at the net asset value immediately following such computation. Distributions arising from net investment income and net capital gains from the remaining Portfolios are declared and paid to shareholders periodically as required for each of the Portfolios to continue to qualify as a regulated investment company pursuant to Subchapter M of the Internal Revenue Code. The Fund, excluding the Money Market Portfolio, may also satisfy its distribution requirements by using consent dividends rather than cash dividends. The Fund has the intent to continue to comply with tax provisions pertaining to regulated investment companies and make distributions of taxable income sufficient to relieve it from substantially all Federal income and excise taxes. As such, no provisions for Federal income or excise taxes have been recorded.
The character of income and realized capital gains distributions are determined in accordance with Federal income tax regulations and may differ from net investment income and realized gains for financial reporting purposes. These “book/tax” differences are either considered temporary or permanent in nature. To the extent these differences are permanent in nature they are reclassified within the composition of net assets; temporary differences do not require such reclassification. Distributions to shareholders that exceed taxable income and net taxable realized gains are reported as return of capital distributions.
The Fund’s management and its tax agent, U.S. Bancorp Fund Services, LLC, perform an affirmative evaluation of tax positions taken or expected to be taken in the course of preparing the Fund’s tax returns to determine whether it is more-likely-than-not (i.e. greater than 50-percent) that each tax position will be sustained upon examination by a taxing authority based on the technical merits of the position. A tax position that meets the more-likely-than-not recognition threshold is measured to determine the amount of benefit to recognize in the financial statements. Differences between tax positions taken in a tax return and amounts recognized in the financial statements will generally result in an increase in a liability for taxes payable (or a reduction of a tax refund receivable), including the recognition of any related interest and penalties as an operating expense. Implementation of the evaluation included a review of tax positions taken in tax years that remain subject to examination by all major tax jurisdictions, including federal tax and the state of Maryland (i.e. the last four tax year ends and the interim tax period since then). The determination has been made that there are no uncertain tax positions that would require the Portfolios to record a tax liability and, therefore, there is no impact to the Portfolios’ financial statements.
Expense Allocation
Expenses directly attributable to a Portfolio are charged to that Portfolio. Expenses that cannot be directly attributed to a Portfolio are allocated among all the benefited Portfolios on a basis of relative net assets or other appropriate method.
Foreign Withholding Taxes
Certain Portfolios in the Fund may be subject to taxes imposed by countries in which they invest with respect to their investments in issuers existing or operating in such countries. Such taxes are generally based on income earned. These Portfolios accrue such taxes as the related income is earned.
Subsequent Events
The Fund has evaluated subsequent events through February 18, 2010, which is the date these financial statements were issued and there are no subsequent events to report.
(continued)
185
Ohio National Fund, Inc.
| Notes to Financial Statements (Continued) | December 31, 2009 |
| (3) | Related Party and Other Transactions |
The Fund has an Investment Advisory Agreement with Ohio National Investments, Inc. (“ONI”), a wholly-owned subsidiary of ONLIC. Under the terms of this agreement, ONI provides portfolio management and investment advice to the Fund and administers its operations, subject to the supervision of the Fund’s Board. This agreement is renewed annually upon the approval by the Board. As compensation for its services, ONI receives advisory fees from the Fund calculated on the basis of each Portfolio’s average daily net assets and the following current schedule of Board-approved annualized fee breakpoints.
| Equity 0.79% of first $200 million 0.74% of next $800 million 0.70% over $1 billion Bond 0.60% of first $100 million 0.50% of next $150 million 0.45% of next $250 million 0.40% of next $500 million 0.30% of next $1 billion 0.25% over $2 billion International 0.85% of first $100 million 0.80% of next $100 million 0.70% over $200 million Millennium 0.80% of first $150 million 0.75% of next $150 million 0.70% of next $300 million 0.65% over $600 million Aggressive Growth 0.80% of first $100 million 0.75% of next $400 million 0.70% over $500 million Mid Cap Opportunity 0.85% of first $100 million 0.80% of next $100 million 0.75% of next $300 million 0.70% over $500 million Strategic Value 0.75% of first $100 million 0.70% of next $400 million 0.65% over $500 million Capital Growth 0.90% of first $100 million 0.85% of next $100 million 0.80% of next $300 million 0.75% over $500 million Bristol 0.80% of first $100 million 0.70% of next $400 million 0.65% over $500 million | Money Market 0.30% of first $100 million(1) 0.25% of next $150 million 0.23% of next $250 million 0.20% of next $500 million 0.15% over $1 billion Omni 0.60% of first $100 million 0.50% of next $150 million 0.45% of next $250 million 0.40% of next $500 million 0.30% of next $1 billion 0.25% over $2 billion Capital Appreciation 0.80% of first $100 million 0.75% of next $300 million 0.65% of next $600 million 0.60% over $1 billion International Small-Mid Company 1.00% of first $100 million 0.90% of next $100 million 0.85% over $200 million Small Cap Growth(2) 0.90% of first $150 million 0.80% of next $150 million 0.75% over $300 million S&P 500® Index 0.40% of first $100 million 0.35% of next $150 million 0.33% over $250 million High Income Bond 0.75% of first $75 million 0.70% of next $75 million 0.65% of next $75 million 0.60% over $225 million Nasdaq-100® Index 0.40% of first $100 million 0.35% of next $150 million 0.33% over $250 million Bryton Growth 0.85% of first $100 million 0.75% of next $400 million 0.70% over $500 million |
(continued)
186
Ohio National Fund, Inc.
| Notes to Financial Statements (Continued) | December 31, 2009 |
| U.S. Equity 0.75% of first $200 million 0.70% of next $300 million 0.65% over $500 million Balanced(2) 0.65% of first $200 million 0.60% of next $300 million 0.55% over $500 million Target VIP 0.60% of first $100 million 0.55% of next $400 million 0.50% over $500 million | Income Opportunity 0.80% of first $200 million 0.75% of next $300 million 0.70% over $500 million Target Equity/Income 0.60% of first $100 million 0.55% of next $400 million 0.50% over $500 million Bristol Growth 0.80% of first $100 million 0.70% of next $400 million 0.65% over $500 million |
| (1) | For the year ended December 31, 2009, ONI waived advisory fees in excess of 0.25% of the first $100 million of average daily net assets in the Money Market Portfolio. Waivers related to the Money Market Portfolio are voluntary and are not subject to recoupment in subsequent fiscal periods. The amount of the waiver for the year ended December 31, 2009 was $50,000. If ONI did not agree to reimburse these expenses, the total expenses incurred by the Money Market Portfolio for the year ended December 31, 2009 would have been higher than the net expenses reflected in the financial statements. | |
| (2) | At a meeting held August 20, 2009, amended advisory fee schedules for these Portfolios were approved by the Board. The annualized fee breakpoints prior to the effective date of the amended advisory fee schedules (September 1, 2009) were: |
| Small Cap Growth 0.95% of first $100 million 0.90% of next $50 million 0.80% of next $150 million 0.75% over $300 million | Balanced 0.75% of first $200 million 0.70% of next $300 million 0.65% over $500 million |
Under the Investment Advisory Agreement, the Fund authorizes ONI to retain sub-advisers (“the Sub-advisers”) for the Equity, Omni, International, Capital Appreciation, Millennium, International Small-Mid Company, Aggressive Growth, Small Cap Growth, Mid Cap Opportunity, Strategic Value, High Income Bond, Capital Growth, Bristol, Bryton Growth, U.S. Equity, Balanced, Income Opportunity, Target VIP, Target Equity/Income, and Bristol Growth Portfolios subject to the approval of the Board. ONI has entered into sub-advisory agreements with Legg Mason Capital Management, Inc. (“Legg Mason”), Suffolk Capital Management, LLC (“Suffolk”), Federated Global Investment Management Corp. (“Federated Global”), Jennison Associates LLC (“Jennison”), Neuberger Berman Management LLC (“Neuberger Berman”), Janus Capital Management LLC (“Janus”), Goldman Sachs Asset Management, L.P. (“Goldman Sachs”), Federated Equity Management Company of Pennsylvania (“Federated Equity”), Federated Investment Management Company (“Federated Investment”), Eagle Asset Management, Inc. (“Eagle”), ICON Advisers, Inc. (“ICON”), and First Trust Advisors L.P. (“First Trust”), to manage the investment of those Portfolios’ assets, subject to the supervision of ONI. As compensation for their services, the Sub-advisers receive from ONI a sub-advisory fee calculated on the basis of each of the aforementioned Portfolio’s average daily net assets and the following current Board - approved schedule of annualized fee breakpoints.
(continued)
187
Ohio National Fund, Inc.
| Notes to Financial Statements (Continued) | December 31, 2009 |
| Equity (Legg Mason) 0.40% of first $200 million 0.38% over $200 million International (Federated Global) 0.40% of first $200 million 0.35% over $200 million Capital Appreciation (Jennison) 0.75% of first $10 million 0.50% of next $30 million 0.35% of next $25 million 0.25% of next $335 million 0.22% of next $600 million 0.20% over $1 billion Aggressive Growth (Janus) 0.55% of first $100 million 0.50% of next $400 million 0.45% over $500 million Mid Cap Opportunity (GSAM)2 0.60% of first $100 million 0.55% of next $100 million 0.50% over $200 million High Income Bond (Federated Investment) 0.50% of first $30 million 0.40% of next $20 million 0.30% of next $25 million 0.25% over $75 million | Omni (Suffolk) 0.30% of first $100 million 0.25% of next $150 million 0.225% of next $250 million 0.20% of next $500 million 0.15% of next $1 billion 0.125% over $2 billion Millennium (Neuberger Berman) 0.55% of first $150 million 0.50% of next $150 million 0.40% over $300 million International Small-Mid Company (Federated Global) 0.75% of first $100 million 0.65% over $100 million Small Cap Growth (Janus) 1 0.60% of next $150 million 0.50% over $150 million Strategic Value (Federated Equity) 0.50% of first $35 million 0.35% of next $65 million 0.25% over $100 million Capital Growth (Eagle) 0.59% of first $100 million 0.55% of next $100 million 0.50% over $200 million | |
| Bristol (Suffolk) 0.45% of first $100 million 0.40% of next $400 million 0.35% over $500 million U.S. Equity (ICON) 0.50% of first $200 million 0.45% of next $300 million 0.40% over $500 million Income Opportunity (ICON) 0.55% of first $200 million 0.50% of next $300 million 0.45% over $500 million Bristol Growth (Suffolk) 0.45% of first $100 million 0.40% of next $400 million 0.35% over $500 million | Bryton Growth (Suffolk) 0.50% of first $100 million 0.45% of next $400 million 0.40% over $500 million Balanced (ICON)1 0.40% of first $200 million 0.35% of next $300 million 0.30% over $500 million Target VIP and Target Equity/Income (First Trust) 0.35% of first $500 million 0.25% over $500 million |
| 1 | At a meeting held August 20, 2009, amended sub-advisory fee schedules for these Portfolios were approved by the Board. The annualized fee breakpoints prior to the effective date of the amended sub-advisory fee schedules (September 1, 2009) were: |
| Small Cap Growth 0.65% of first $50 million 0.60% of next $100 million 0.50% over $150 million | Balanced 0.50% of first $200 million 0.45% of next $300 million 0.40% over $500 million |
| 2 | At a meeting held November 19, 2009, the Board approved GSAM as sub-adviser for the Mid Cap Opportunity Portfolio. GSAM replaced the Portfolio’s previous sub-adviser, RS Investment Management Co. LLC effective December 18, 2009. |
(continued)
188
Ohio National Fund, Inc.
| Notes to Financial Statements (Continued) | December 31, 2009 |
Suffolk, the sub-adviser for the Omni, Bristol, Bryton Growth, and Bristol Growth Portfolios has an affiliation with ONI. Ohio National Financial Services, Inc. (ONFS) owns 100% of ONLIC, the parent company of ONI, and also owns 83% of the voting securities of Suffolk. There were no Fund liabilities payable to Suffolk at December 31, 2009 and fees paid to Suffolk are an expense of ONI, not of the Fund.
Pursuant to a service agreement among ONI, ONLIC and the Fund, ONLIC has agreed to provide personnel and facilities to ONI on a cost-reimbursement basis. These personnel members include officers of the Fund. ONLIC also provides clerical and administrative services and such supplies and equipment as may be reasonably required in order for ONI to properly perform its advisory function pursuant to the Investment Advisory Agreement. ONLIC further performs duties to fulfill the transfer agent function on behalf of the Fund. Performance of these duties by ONLIC and availability of facilities, personnel, supplies, and equipment does not represent an expense to the Fund in excess of the advisory fees paid to ONI.
Pursuant to the Investment Advisory Agreement, if the total expenses applicable to any Portfolio during any calendar quarter (excluding taxes, brokerage commissions, interest expense and management fees) exceed 1%, on an annualized basis, evaluated quarterly, of such Portfolio’s average daily net asset value, ONI will reimburse the Portfolio for such excess expenses. There were no resulting contractual expense reimbursements for the year ended December 31, 2009.
During the year ended December 31, 2009, ONI voluntarily reimbursed the amount of daily gross expenses of the Money Market Portfolio in excess of daily income earned by the Portfolio. The amount reimbursed to the Portfolio for the year ended December 31, 2009 was $574,437. This reimbursement is not subject to recoupment in subsequent fiscal periods.
The Investment Advisory Agreement allows for a portion of the expenses related to the Fund’s Chief Compliance Officer and staff to be incurred by the Fund and paid from the Fund to the Fund’s adviser, ONI. Pursuant to the service agreement among ONI, ONLIC and the Fund, ONLIC has provided the personnel, services, and equipment necessary to perform the Fund’s regulation-mandated compliance function and ONI has reimbursed ONLIC for such costs. For the year ended December 31, 2009, the Fund incurred compliance expenses totaling $153,024, equally allocated to the Portfolios. Expenses incurred by the Portfolios are reflected on the Statements of Operations as “Compliance expense”.
Each director of the Board who is not an officer of the Fund nor an employee of ONI or its corporate affiliates is currently paid a quarterly retainer fee of $7,500, $2,000 for each Board meeting attended, $1,000 for each Audit Committee meeting attended, and $500 for each other Board committee or independent directors meetings attended. The lead independent director of the Board receives an additional quarterly retainer fee of $3,125 and the Audit Committee chair receives an additional quarterly retainer fee of $1,250. For the year ended December 31, 2009, compensation of these directors by the Fund totaled $192,500.
U.S. Bancorp Fund Services, LLC, 615 East Michigan Street, Milwaukee, Wisconsin, serves as the accounting agent for all but the International and International Small-Mid Company Portfolios. U.S. Bank Institutional Trust & Custody, 425 Walnut Street, Cincinnati, Ohio serves as the custodian for all but the International and International Small-Mid Company Portfolios. The accounting agent and custodian for the International and International Small-Mid Company Portfolios is State Street Bank-Kansas City, 801 Pennsylvania Ave., Kansas City, Missouri. For assets held outside the United States, U.S. Bank and State Street Bank-Kansas City enter into sub-custodial agreements, subject to approval by the Board.
(continued)
189
Ohio National Fund, Inc.
| Notes to Financial Statements (Continued) | December 31, 2009 |
| (4) | Capital Share Transactions |
Capital share transactions for the years ended December 31, 2009 and 2008 were as follows:
| Equity | Money Market | Bond | ||||||||||||||||||||||
| Year Ended | Year Ended | Year Ended | Year Ended | Year Ended | Year Ended | |||||||||||||||||||
| 12/31/2009 | 12/31/2008 | 12/31/2009 | 12/31/2008 | 12/31/2009 | 12/31/2008 | |||||||||||||||||||
| Capital shares issued on sales | 1,691,434 | 4,134,758 | 41,782,044 | 87,727,402 | 4,061,330 | 3,099,909 | ||||||||||||||||||
| Capital shares issued on reinvested dividends | 25,660 | 211,054 | — | 663,868 | — | — | ||||||||||||||||||
| Capital shares redeemed | (3,558,752 | ) | (7,168,214 | ) | (47,912,691 | ) | (81,757,541 | ) | (3,440,642 | ) | (7,989,964 | ) | ||||||||||||
| Net increase/(decrease) | (1,841,658 | ) | (2,822,402 | ) | (6,130,647 | ) | 6,633,729 | 620,688 | (4,890,055 | ) | ||||||||||||||
| Omni | International | Capital Appreciation | ||||||||||||||||||||||
| Year Ended | Year Ended | Year Ended | Year Ended | Year Ended | Year Ended | |||||||||||||||||||
| 12/31/2009 | 12/31/2008 | 12/31/2009 | 12/31/2008 | 12/31/2009 | 12/31/2008 | |||||||||||||||||||
| Capital shares issued on sales | 312,835 | 421,723 | 2,665,036 | 7,833,032 | 902,182 | 1,255,285 | ||||||||||||||||||
| Capital shares issued on reinvested dividends | 49,851 | 99,786 | — | — | 78,247 | 80,282 | ||||||||||||||||||
| Capital shares redeemed | (650,890 | ) | (1,078,713 | ) | (6,334,979 | ) | (11,805,937 | ) | (2,140,885 | ) | (2,604,708 | ) | ||||||||||||
| Net increase/(decrease) | (288,204 | ) | (557,204 | ) | (3,669,943 | ) | (3,972,905 | ) | (1,160,456 | ) | (1,269,141 | ) | ||||||||||||
| Millennium | International Small-Mid Company | Aggressive Growth | ||||||||||||||||||||||
| Year Ended | Year Ended | Year Ended | Year Ended | Year Ended | Year Ended | |||||||||||||||||||
| 12/31/2009 | 12/31/2008 | 12/31/2009 | 12/31/2008 | 12/31/2009 | 12/31/2008 | |||||||||||||||||||
| Capital shares issued on sales | 4,908,391 | 612,449 | 1,073,744 | 1,566,704 | 1,433,447 | 1,924,740 | ||||||||||||||||||
| Capital shares issued on reinvested dividends | — | — | — | — | — | — | ||||||||||||||||||
| Capital shares redeemed | (954,166 | ) | (1,070,957 | ) | (1,376,880 | ) | (1,742,571 | ) | (1,230,364 | ) | (1,582,602 | ) | ||||||||||||
| Net increase/(decrease) | 3,954,225 | (458,508 | ) | (303,136 | ) | (175,867 | ) | 203,083 | 342,138 | |||||||||||||||
| Small Cap Growth | Mid Cap Opportunity | S&P 500® Index | ||||||||||||||||||||||
| Year Ended | Year Ended | Year Ended | Year Ended | Year Ended | Year Ended | |||||||||||||||||||
| 12/31/2009 | 12/31/2008 | 12/31/2009 | 12/31/2008 | 12/31/2009 | 12/31/2008 | |||||||||||||||||||
| Capital shares issued on sales | 980,778 | 734,032 | 3,108,764 | 4,178,560 | 6,377,628 | 3,164,333 | ||||||||||||||||||
| Capital shares issued on reinvested dividends | — | — | — | — | 174,417 | 257,996 | ||||||||||||||||||
| Capital shares redeemed | (689,601 | ) | (874,270 | ) | (6,253,894 | ) | (2,040,368 | ) | (4,084,406 | ) | (3,820,480 | ) | ||||||||||||
| Net increase/(decrease) | 291,177 | (140,238 | ) | (3,145,130 | ) | 2,138,192 | 2,467,639 | (398,151 | ) | |||||||||||||||
| Strategic Value | High Income Bond | Capital Growth | ||||||||||||||||||||||
| Year Ended | Year Ended | Year Ended | Year Ended | Year Ended | Year Ended | |||||||||||||||||||
| 12/31/2009 | 12/31/2008 | 12/31/2009 | 12/31/2008 | 12/31/2009 | 12/31/2008 | |||||||||||||||||||
| Capital shares issued on sales | 1,173,335 | 357,815 | 9,882,540 | 5,290,215 | 672,335 | 798,530 | ||||||||||||||||||
| Capital shares issued on reinvested dividends | 63,845 | 99,459 | — | — | — | — | ||||||||||||||||||
| Capital shares redeemed | (624,258 | ) | (1,187,546 | ) | (4,957,356 | ) | (4,584,159 | ) | (665,264 | ) | (613,810 | ) | ||||||||||||
| Net increase/(decrease) | 612,922 | (730,272 | ) | 4,925,184 | 706,056 | 7,071 | 184,720 | |||||||||||||||||
(continued)
190
Ohio National Fund, Inc.
| Notes to Financial Statements (Continued) | December 31, 2009 |
| Nasdaq-100® Index | Bristol | Bryton Growth | ||||||||||||||||||||||
| Year Ended | Year Ended | Year Ended | Year Ended | Year Ended | Year Ended | |||||||||||||||||||
| 12/31/2009 | 12/31/2008 | 12/31/2009 | 12/31/2008 | 12/31/2009 | 12/31/2008 | |||||||||||||||||||
| Capital shares issued on sales | 4,867,867 | 4,154,173 | 5,644,552 | 4,903,913 | 5,342,762 | 4,446,981 | ||||||||||||||||||
| Capital shares issued on reinvested dividends | — | — | 67,319 | 114,606 | — | — | ||||||||||||||||||
| Capital shares redeemed | (3,951,131 | ) | (4,197,643 | ) | (2,776,615 | ) | (2,027,717 | ) | (2,297,640 | ) | (2,018,949 | ) | ||||||||||||
| Net increase/(decrease) | 916,736 | (43,470 | ) | 2,935,256 | 2,990,802 | 3,045,122 | 2,428,032 | |||||||||||||||||
| U.S. Equity | Balanced | Income Opportunity | ||||||||||||||||||||||
| Year Ended | Year Ended | Year Ended | Year Ended | Year Ended | Year Ended | |||||||||||||||||||
| 12/31/2009 | 12/31/2008 | 12/31/2009 | 12/31/2008 | 12/31/2009 | 12/31/2008 | |||||||||||||||||||
| Capital shares issued on sales | 394,400 | 464,056 | 385,966 | 455,908 | 346,594 | 145,839 | ||||||||||||||||||
| Capital shares issued on reinvested dividends | 10,552 | 26,044 | 21,991 | — | — | — | ||||||||||||||||||
| Capital shares redeemed | (454,184 | ) | (446,366 | ) | (269,350 | ) | (305,499 | ) | (204,725 | ) | (104,661 | ) | ||||||||||||
| Net increase/(decrease) | (49,232 | ) | 43,734 | 138,607 | 150,409 | 141,869 | 41,178 | |||||||||||||||||
| Target VIP | Target Equity/Income | Bristol Growth | ||||||||||||||||||||||
| Year Ended | Year Ended | Year Ended | Year Ended | Year Ended | Year Ended | |||||||||||||||||||
| 12/31/2009 | 12/31/2008 | 12/31/2009 | 12/31/2008 | 12/31/2009 | 12/31/2008 | |||||||||||||||||||
| Capital shares issued on sales | 937,153 | 1,365,372 | 1,049,533 | 1,490,104 | 537,735 | 117,062 | ||||||||||||||||||
| Capital shares issued on reinvested dividends | 32,609 | 46,221 | 58,040 | 103,259 | — | — | ||||||||||||||||||
| Capital shares redeemed | (976,438 | ) | (629,173 | ) | (1,662,506 | ) | (1,206,350 | ) | (125,964 | ) | (38,489 | ) | ||||||||||||
| Net increase/(decrease) | (6,676 | ) | 782,420 | (554,933 | ) | 387,013 | 411,771 | 78,573 | ||||||||||||||||
| (5) | Investment Transactions |
Purchases and sales of investments (excluding short-term and government securities) for the year ended December 31, 2009 were as follows:
| Equity | Bond | Omni | International | Capital Appreciation | ||||||||||||||||
| Stocks and Bonds: | ||||||||||||||||||||
| Purchases | $ | 46,672,042 | $ | 18,216,806 | $ | 55,043,347 | $ | 304,477,749 | $ | 87,280,656 | ||||||||||
| Sales | $ | 61,068,725 | $ | 24,483,847 | $ | 57,676,620 | $ | 326,617,704 | $ | 100,025,288 | ||||||||||
| International | ||||||||||||||||||||
| Millennium | Small-Mid Company | Aggressive Growth | Small Cap Growth | Mid Cap Opportunity | ||||||||||||||||
| Stocks and Bonds: | ||||||||||||||||||||
| Purchases | $ | 201,991,378 | $ | 68,445,603 | $ | 6,496,493 | $ | 10,674,627 | $ | 174,739,514 | ||||||||||
| Sales | $ | 145,850,677 | $ | 69,266,467 | $ | 5,595,755 | $ | 8,121,807 | $ | 205,950,282 | ||||||||||
| Nasdaq-100® | ||||||||||||||||||||
| S&P 500® Index | Strategic Value | High Income Bond | Capital Growth | Index | ||||||||||||||||
| Stocks and Bonds: | ||||||||||||||||||||
| Purchases | $ | 52,539,406 | $ | 11,059,244 | $ | 81,313,419 | $ | 20,455,509 | $ | 15,423,546 | ||||||||||
| Sales | $ | 27,100,489 | $ | 6,038,619 | $ | 22,281,349 | $ | 20,124,816 | $ | 10,488,618 | ||||||||||
(continued)
191
Ohio National Fund, Inc.
| Notes to Financial Statements (Continued) | December 31, 2009 |
| Bristol | Bryton Growth | U.S. Equity | Balanced | Income Opportunity | ||||||||||||||||
| Stocks and Bonds: | ||||||||||||||||||||
| Purchases | $ | 264,576,891 | $ | 93,686,888 | $ | 21,217,020 | $ | 9,435,179 | $ | 11,171,434 | ||||||||||
| Sales | $ | 231,503,782 | $ | 63,407,257 | $ | 22,083,687 | $ | 7,608,749 | $ | 10,162,000 | ||||||||||
| Target VIP | Target Equity/Income | Bristol Growth | ||||||||||||||||||
| Stocks and Bonds: | ||||||||||||||||||||
| Purchase | $ | 16,692,916 | $ | 20,685,802 | $ | 18,649,681 | ||||||||||||||
| Sales | $ | 16,593,161 | $ | 24,239,778 | $ | 15,829,657 | ||||||||||||||
Purchases and sales of government securities for the year ended December 31, 2009 were as follows:
| Bond | Balanced | |||||||
| Purchases | $ | 11,644,375 | $ | — | ||||
| Sales | $ | 9,882,297 | $ | 185,000 | ||||
| (6) | Financial Instruments |
The Fund’s Portfolios may trade in financial instruments with off-balance sheet risk for hedging purposes or, otherwise, in accordance with stated investing objectives. These financial instruments may include options, futures, and foreign currency contracts that may involve, to a varying degree, elements of risk in excess of the amounts recognized on financial statements.
Options
Each Portfolio, other than the Money Market Portfolio, for hedging purposes, may (a) write call options traded on a registered national securities exchange if such Portfolio owns the underlying securities subject to such options, and purchase call options for the purpose of closing out positions it has written, (b) purchase put options on securities owned, and sell such options in order to close its positions in put options, (c) purchase and sell financial futures and options thereon, and (d) purchase and sell financial index options; provided, however, that no option or futures contract shall be purchased or sold if, as a result, more than one-third of the total assets of the Portfolio would be hedged by options or futures contracts, and no more than 5% of any Portfolio’s total assets, at fair value, may be used for premiums on open options and initial margin deposits on futures contracts. The Small Cap Growth Portfolio may also participate in the above activities to protect against adverse changes in security prices or interest rates and may, for these purposes or hedging purposes, sell put options or purchase call options at any time. The S&P 500® Index and Income Opportunity Portfolios are not subject to the above limitations, as these Portfolios may engage in the purchase or selling of put or call options in accordance with those Portfolios’ stated investment objectives. The Portfolios making use of options bear the market risk of an unfavorable change in the price of securities or indices underlying the options and, for purchase options, are subject to the risk that the options will expire before being exercised. A further risk associated with investing in options is that there may not be enough buyers and sellers in the market to permit a Portfolio to close a position. To limit the risk, a Portfolio will invest only where there is an established market.
When a Portfolio writes a put or call option, an amount equal to the premium received is included on the Statement of Assets and Liabilities as a liability. The amount of the liability is subsequently marked-to-market to reflect the current market value of the option. Such liability is subject to off balance sheet risks to the extent of any future increases in market value of the written options. If an option expires on its stipulated expiration date or if the Portfolio enters into a closing purchase transaction, a gain or loss is realized. If a written call option on an individual security is exercised, a gain or loss is realized for the sale of the underlying security, and the proceeds from the sale are increased by the premium originally received. If a written call option on a securities index is exercised, a gain or loss is realized as determined by the premium originally received, the exercise price and the market value of the index. If a written put option on an individual security is exercised, the cost of the security acquired is decreased by the premium originally received. When a Portfolio purchases a put or call option, an amount equal to the premium paid is included on the Portfolio’s Statement of Assets and Liabilities as an investment, and is subsequently marked-to-market to reflect the
(continued)
192
Ohio National Fund, Inc.
| Notes to Financial Statements (Continued) | December 31, 2009 |
current market value of the option. If an option expires on the stipulated expiration date or if the Portfolio enters into a closing sale transaction, a gain or loss is realized. If a Portfolio exercises a call option on an individual security, the cost of the security acquired is increased by the premium paid for the call. If the Portfolio exercises a put option on an individual security, a gain or loss is realized from the sale of the underlying security, and the proceeds from such a sale are decreased by the premium originally paid. If the Portfolio exercises a put option on a security index, a gain or loss is realized as determined by the premium originally paid, the exercise price and the market value of the index.
The Income Opportunity Portfolio’s written options are collateralized by cash and/or securities held with the Portfolio’s prime broker and in a segregated account at the Portfolio’s custodian. Such collateral for the Portfolio is restricted from use. The cash collateral or borrowings from the prime broker, if necessary, are included on the Statement of Assets and Liabilities. The securities pledged as collateral are noted as such on the Portfolio’s Schedule of Investments. Written and purchased options are non-income producing securities.
The activity in the option contracts written and the premiums received by the Income Opportunity Portfolio for year ended December 31, 2009 is detailed as follows:
| Number of | Premiums | |||||||
| Contracts | Received | |||||||
| Options outstanding, beginning of year | 45 | $ | 117,749 | |||||
| Options written | 3,009 | 7,831,827 | ||||||
| Options exercised | — | — | ||||||
| Options expired | (62 | ) | (71,772 | ) | ||||
| Options closed | (2,930 | ) | (7,757,112 | ) | ||||
| Options outstanding, end of year | 62 | $ | 120,692 | |||||
Transactions involving purchased options by the Income Opportunity Portfolio for year ended December 31, 2009 were: Purchases: $864,486, Sales: $710,535, Expirations: $30,438.
Futures Contracts
Each Portfolio, other than the Money Market Portfolio may, for hedging purposes, purchase and sell financial futures contracts. Futures contracts are used for the purpose of hedging its existing Portfolio securities, or securities that the Portfolio intends to purchase, against fluctuations in fair value caused by changes in prevailing market interest rates. Upon entering into a financial futures contract, a Portfolio is required to pledge to the broker an amount of cash, commercial paper, or receivables for securities sold equal to a percentage of the contract amount, known as the initial margin deposit. Subsequent payments, known as “variation margin”, are made or received by the Portfolios each day, depending on the daily fluctuations in the fair value of the underlying security. The Portfolios recognize unrealized appreciation/depreciation equal to the daily variation margin. When the contracts are closed, a Portfolio records a realized gain or loss equal to the difference between the value of the contracts at the time they were opened and the value at the time they were closed.
Should market conditions move unexpectedly, the Portfolios may not achieve the anticipated benefits of the futures contracts and may realize a loss. The use of futures transactions involves the risk of imperfect correlation in movements in the price of futures contracts interest rates, and the underlying hedged assets. A further risk associated with investing in futures contracts is that there may not be enough buyers and sellers in the market to permit a Portfolio to close a position when it wants to do so. To limit the risk, a Portfolio will invest only where there is an established market. The S&P 500® Index Portfolio may purchase or sell stock index futures contracts and the Nasdaq-100® Index Portfolio may purchase or sell derivative securities designed to replicate the Nasdaq-100® Index in accordance with their stated investment objectives.
For the year ended December 31, 2009, there were no futures contracts executed in the Fund’s Portfolios.
(continued)
193
Ohio National Fund, Inc.
| Notes to Financial Statements (Continued) | December 31, 2009 |
Foreign Currency Contracts
In order to hedge against changes in the exchange rates of foreign currencies in relation to the U.S. dollar, each Portfolio, other than the Money Market Portfolio, may engage in forward foreign currency contracts. A forward foreign currency contract involves an obligation to purchase or sell a foreign currency at a future date, at a negotiated rate. The market value of a foreign currency contract fluctuates with changes in forward currency exchange rates. All commitments are marked to market daily at the applicable exchange rates and any resulting unrealized appreciation or depreciation is recorded. With respect to sales of currency exchange contracts, a Portfolio would incur a realized loss if the value of the contract increases between the date the forward contract is opened and the date the forward contract is closed. A Portfolio incurs a realized gain if the value of the contract decreases between those dates. With respect to purchases of currency exchange contracts, a Portfolio would incur a realized loss if the value of the contract decreases between the date the forward contract is opened and the date the forward contract is closed.
The use of foreign currency contracts might not successfully protect a Portfolio against a loss resulting from the movements of foreign currency in relation to the U.S. dollar and does not eliminate fluctuations in the prices of other currencies or securities. A Portfolio is also exposed to credit risk associated with counterparty nonperformance on these currency exchange contracts, which is typically limited to the unrealized gain on each open contract.
The International Portfolio had open foreign currency contract commitments at December 31, 2009 and executed other similar contracts during 2009. These contracts were executed specifically to reduce the risk of a significant increase in the currency of a country that was under-weighted in investment by the Portfolio relative to the Portfolio’s benchmark index.
When the June 29, 2009 contract experienced a significant unrealized gain, inverse contracts were executed in order to offset the impact of the June 29, 2009 contract and thereby, lock in the gain. Details of the contracts outstanding at December 31, 2009 are as follows:
Contracts to buy foreign currency: (AUD-Australian Dollar)
| Unrealized | ||||||||||||||||||||
| Currency to | Currency to | Contract at | Appreciation/ | |||||||||||||||||
Date of contract | Exchange date | receive | deliver | value | Depreciation | |||||||||||||||
| June 29, 2009 | January 11, 2010 | 11,421,477 AUD | $ | 9,101,318 | $ | 10,251,461 | $ | 1,150,143 | ||||||||||||
Contracts to sell foreign currency: (AUD-Australian Dollar)
| Unrealized | ||||||||||||||||||||
| Currency to | Currency to | Contract at | Appreciation/ | |||||||||||||||||
Date of contract | Exchange date | receive | deliver | value | Depreciation | |||||||||||||||
| October 28, 2009 | January 11, 2010 | $ | 5,086,680 | 5,700,000 AUD | $ | 5,116,092 | $ | (29,412 | ) | |||||||||||
| December 16, 2009 | January 11, 2010 | 5,139,889 | 5,721,477 AUD | $ | 5,135,369 | $ | 4,520 | |||||||||||||
For year ended December 31, 2009, the notional value of foreign currency contracts opened and closed by the International Portfolio was approximately $6.65 million for currency bought and approximately $3.64 million for currency sold.
For year ended December 31, 2009, the notional value of foreign currency contracts opened and closed by the International Small-Mid Company Portfolio was approximately $0.75 million for currency bought and approximately $0.76 million for currency sold.
(continued)
194
Ohio National Fund, Inc.
| Notes to Financial Statements (Continued) | December 31, 2009 |
The values and financial statement effects of derivative instruments that were not accounted for as hedging instruments as of, and for the year ended, December 31, 2009 were as follows:
| Location on | ||||||||||||||||
| Value of | Value of | Statement of | ||||||||||||||
| Asset | Liability | Assets and | ||||||||||||||
Portfolio | Instrument | Primary Risk Type | Derivatives | Derivatives | Liabilities | |||||||||||
| International | Contracts to buy foreign currency | Currency exchange rate | $ | 10,251,461 | $ | (9,101,318 | ) | (1 | ) | |||||||
| International | Contracts to sell foreign currency | Currency exchange rate | $ | 10,226,569 | $ | (10,251,461 | ) | (1 | ) | |||||||
| Income Opportunity | Purchased options | Equity price | $ | 6,555 | — | (2 | ) | |||||||||
| Income Opportunity | Written options | Equity price | — | $ | 141,112 | (3 | ) | |||||||||
(1) Net unrealized appreciation on foreign currency contacts
(2) Investments in securities, at value
(3) Options written, at value
| Change in | ||||||||||||||||
| Unrealized | ||||||||||||||||
| Realized Gain | Appreciation | |||||||||||||||
| (Loss) on | (Depreciation) on | |||||||||||||||
| Derivatives | Derivatives | Location on | ||||||||||||||
| Recognized in | Recognized in | on Statement | ||||||||||||||
Portfolio | Instrument | Primary Risk Type | Income | Income | of Operations | |||||||||||
| International | Currency contracts | Currency exchange rate | $ | (77,667 | ) | $ | 1,125,251 | (1), (2) | ||||||||
| International Small-Mid Company | Currency contracts | Currency exchange rate | $ | 11,798 | $ | — | (1), (2) | |||||||||
| Income Opportunity | Purchased options | Equity price | $ | (131,163 | ) | $ | 4,124 | (3), (4) | ||||||||
| Written options | Equity price | (421,067 | ) | 5,831 | (5), (6) | |||||||||||
(1) Net realized gain (loss) on foreign currency contracts
(2) Change in unrealized appreciation/depreciation on foreign currency contracts
(3) Net realized gain (loss) on investments
(4) Change in unrealized appreciation/depreciation on investments
(5) Net realized gain (loss) on written options
(6) Change in unrealized appreciation/depreciation on written options
| (7) | Temporary Guarantee Program |
On October 9, 2008, the Board approved the participation of the Money Market Portfolio in the U.S. Department of the Treasury’s Temporary Guarantee Program for Money Market Funds (the “Program”). Participation in the initial three months of the Program required a payment to the U.S. Department of the Treasury (the “Treasury”) in the amount of 0.01% of the net asset value of the Money Market Portfolio as of the close of business on September 19, 2008.
On November 24, 2008, the Treasury announced that the Secretary of the Treasury elected to extend the Program until April 30, 2009 (the “Program Extension”) to support ongoing stability in the market. On December 4, 2008, the Board approved the participation of the Money Market Portfolio in the Program Extension. Continued participation in the Program required a payment to the Treasury in the amount of 0.015% of the net asset value of the Money Market Portfolio as of the close of business on September 19, 2008. As with the payment for the initial term of the Program, the Program Extension payment was borne by the Money Market Portfolio. The pro-rated portion of the payment for the period from January 1, 2009 to April 30, 2009 is included in the Statement of Operations of the Money Market Portfolio. The remainder of the payment was included in the Statement of Operations in the prior fiscal year.
On April 2, 2009, the Board decided that the Fund should not participate in a further extension of the Program beyond April 30, 2009.
(continued)
195
Ohio National Fund, Inc.
| Notes to Financial Statements (Continued) | December 31, 2009 |
| (8) | Federal Income Tax Information |
At December 31, 2009, the components of accumulated earnings (deficit) on a tax basis were as follows:
| Undistributed | Total | |||||||||||||||||||||||
| Undistributed | Long-Term | Accumulated | Unrealized | Accumulated | ||||||||||||||||||||
| Ordinary | Capital Gains | Accumulated | Capital and | Appreciation | Earnings | |||||||||||||||||||
Portfolio | Income | (Losses) | Earnings | Other Losses | (Depreciation)(1) | (Deficit) | ||||||||||||||||||
| Equity | $ | 52,010 | $ | — | $ | 52,010 | $ | (116,170,176 | ) | $ | (1,728,916 | ) | $ | (117,847,082 | ) | |||||||||
| Money Market | — | — | — | — | — | — | ||||||||||||||||||
| Bond | 6,041,762 | — | 6,041,762 | (17,312,362 | ) | 3,827,515 | (7,443,085 | ) | ||||||||||||||||
| Omni | 96,307 | — | 96,307 | (10,269,375 | ) | 2,115,978 | (8,057,090 | ) | ||||||||||||||||
| International | 2,464,879 | — | 2,464,879 | (125,152,323 | ) | 43,676,346 | (79,011,098 | ) | ||||||||||||||||
| Capital Appreciation | 160,402 | — | 160,402 | (41,236,635 | ) | 8,754,288 | (32,321,945 | ) | ||||||||||||||||
| Millennium | — | — | — | (34,620,720 | ) | 17,150,421 | (17,470,299 | ) | ||||||||||||||||
| International Small-Mid Company | 85,568 | — | 85,568 | (27,125,848 | ) | 17,941,039 | (9,099,241 | ) | ||||||||||||||||
| Aggressive Growth | — | — | — | (7,356,638 | ) | 3,088,823 | (4,267,815 | ) | ||||||||||||||||
| Small Cap Growth | — | — | — | (7,281,231 | ) | 1,587,752 | (5,693,479 | ) | ||||||||||||||||
| Mid Cap Opportunity | — | — | — | (40,356,198 | ) | 3,407,752 | (36,948,446 | ) | ||||||||||||||||
S&P 500® Index | 286,436 | — | 286,436 | (16,601,420 | ) | 3,156,023 | (13,158,961 | ) | ||||||||||||||||
| Strategic Value | 39,369 | — | 39,369 | (9,351,338 | ) | 254,881 | (9,057,088 | ) | ||||||||||||||||
| High Income Bond | 10,496,614 | — | 10,496,614 | (3,330,556 | ) | 2,241,777 | 9,407,835 | |||||||||||||||||
| Capital Growth | 3,532 | — | 3,532 | (14,732,557 | ) | 6,732,551 | (7,996,474 | ) | ||||||||||||||||
Nasdaq-100® Index | 67,713 | — | 67,713 | (4,780,502 | ) | 8,003,377 | 3,290,588 | |||||||||||||||||
| Bristol | 107,371 | — | 107,371 | (21,958,222 | ) | 10,046,734 | (11,804,117 | ) | ||||||||||||||||
| Bryton Growth | — | — | — | (13,623,623 | ) | 14,920,208 | 1,296,585 | |||||||||||||||||
| U.S. Equity | 19,083 | — | 19,083 | (8,538,048 | ) | 1,853,224 | (6,665,741 | ) | ||||||||||||||||
| Balanced | 46,186 | — | 46,186 | (1,720,803 | ) | 1,199,301 | (475,316 | ) | ||||||||||||||||
| Income Opportunity | 20,040 | — | 20,040 | (577,479 | ) | 806,862 | 249,423 | |||||||||||||||||
| Target VIP | 32,199 | — | 32,199 | (11,151,541 | ) | 1,394,652 | (9,724,690 | ) | ||||||||||||||||
| Target Equity/Income | 38,355 | — | 38,355 | (18,046,200 | ) | 889,262 | (17,118,583 | ) | ||||||||||||||||
| Bristol Growth | 19,274 | — | 19,274 | (1,445,176 | ) | 871,559 | (554,343 | ) | ||||||||||||||||
| (1) | The differences between book-basis and tax-basis unrealized appreciation/(depreciation) are attributed primarily to tax deferral of losses on wash sales and the realization for tax purposes of unrealized gains/(losses) on certain instruments. |
Under current tax regulations, capital losses realized after October 31 of a Portfolio’s fiscal year may be deferred and treated as occurring on the first business day of the following fiscal year. The following Portfolios had deferred post-October capital losses, which will be treated as arising on the first business day of the fiscal year ending December 31, 2010:
| Post-October | Post-October | |||||||
Portfolio | Losses | Currency Losses | ||||||
| Capital Appreciation | $ | — | $ | 3,802 | ||||
| Millennium | 855,988 | — | ||||||
| International Small-Mid Company | 443,449 | 6,312 | ||||||
| Aggressive Growth | 230,463 | 3 | ||||||
| Small Cap Growth | 100,701 | — | ||||||
S&P 500® Index | 1,111,876 | — | ||||||
| Strategic Value | 64,688 | 2,660 | ||||||
Nasdaq-100® Index | 6,090 | — | ||||||
| Bryton Growth | 204,860 | — | ||||||
| U.S. Equity | 49,801 | — | ||||||
| Income Opportunity | 100,508 | — | ||||||
| Target Equity/Income | 87,769 | — | ||||||
| Bristol Growth | 16,804 | — | ||||||
196
Ohio National Fund, Inc.
| Notes to Financial Statements (Continued) | December 31, 2009 |
For Federal income tax purposes, the following Portfolios had capital loss carry forwards as of December 31, 2009 that are available to offset future realized gains, if any:
| Total Loss | Expiration Amount by Year | |||||||||||||||||||||||||||||||||||
Portfolio | Carryforward | 2010 | 2011 | 2012 | 2013 | 2014 | 2015 | 2016 | 2017 | |||||||||||||||||||||||||||
| Equity | $ | 116,170,176 | $ | — | $ | — | $ | — | $ | — | $ | — | $ | — | $ | 68,747,789 | $ | 47,422,387 | ||||||||||||||||||
| Bond | 17,312,362 | — | 1,386,670 | — | 560,097 | 733,695 | — | 5,109,146 | 9,522,754 | |||||||||||||||||||||||||||
| Omni | 10,269,375 | — | — | — | — | — | — | 4,973,650 | 5,295,725 | |||||||||||||||||||||||||||
| International | 125,152,323 | — | — | — | — | — | — | 59,360,193 | 65,792,130 | |||||||||||||||||||||||||||
| Capital Appreciation | 41,232,833 | — | — | — | — | — | — | 10,389,692 | 30,843,141 | |||||||||||||||||||||||||||
| Millennium | 33,764,732 | 17,131,037 | 1,610,585 | — | — | — | — | 7,511,040 | 7,512,070 | |||||||||||||||||||||||||||
| International Small-Mid Company | 26,676,087 | — | — | — | — | — | — | 15,783,654 | 10,892,433 | |||||||||||||||||||||||||||
| Aggressive Growth | 7,126,172 | 4,415,159 | — | — | — | — | — | 694,915 | 2,016,098 | |||||||||||||||||||||||||||
| Small Cap Growth | 7,180,530 | 3,671,938 | — | — | — | — | — | 785,300 | 2,723,292 | |||||||||||||||||||||||||||
| Mid Cap Opportunity | 40,356,198 | — | — | — | — | — | — | 26,704,738 | 13,651,460 | |||||||||||||||||||||||||||
S&P 500® Index | 15,489,544 | 13,544,388 | — | 134,482 | — | — | — | 1,597,902 | 212,772 | |||||||||||||||||||||||||||
| Strategic Value | 9,283,990 | 1,170,471 | 75,015 | — | — | — | — | 5,765,741 | 2,272,763 | |||||||||||||||||||||||||||
| High Income Bond | 3,330,556 | 1,284,828 | 563,088 | 508,108 | 974,532 | |||||||||||||||||||||||||||||||
| Capital Growth | 14,732,557 | 9,318,782 | — | — | — | — | — | — | 5,413,775 | |||||||||||||||||||||||||||
Nasdaq-100® Index | 4,774,412 | 915,546 | 1,110,252 | 701,524 | 531,984 | 215,042 | 30,818 | — | 1,269,246 | |||||||||||||||||||||||||||
| Bristol | 21,958,222 | — | — | — | — | — | — | 11,896,631 | 10,061,591 | |||||||||||||||||||||||||||
| Bryton Growth | 13,418,763 | — | — | — | — | — | — | 3,419,820 | 9,998,943 | |||||||||||||||||||||||||||
| U.S. Equity | 8,488,247 | — | — | — | — | — | — | 4,481,829 | 4,006,418 | |||||||||||||||||||||||||||
| Balanced | 1,720,803 | — | — | — | — | — | — | 1,179,209 | 541,594 | |||||||||||||||||||||||||||
| Income Opportunity | 476,971 | — | — | — | — | — | — | — | 476,971 | |||||||||||||||||||||||||||
| Target VIP | 11,151,541 | — | — | — | — | — | — | — | 11,151,541 | |||||||||||||||||||||||||||
| Target Equity/Income | 17,958,431 | — | — | — | — | — | — | — | 17,958,431 | |||||||||||||||||||||||||||
| Bristol Growth | 1,428,372 | — | — | — | — | — | — | 836,472 | 591,900 | |||||||||||||||||||||||||||
The Board does not intend to authorize a distribution of any realized gain for a Portfolio until the capital loss carry over has been offset or expires.
During the year ended December 31, 2009, the Fund recorded reclassifications within the composition of net assets for permanent book/tax differences. These classifications were due principally to net operating losses, which for tax purposes cannot be used to offset future taxable income, and consent dividends. Consent dividends are constructive dividends in which distributions are deemed, for tax purposes, to be passed through from the Fund to shareholders upon written consent from all shareholders of the Fund. These classifications have no impact on the net asset values of the Fund and are designed to present the Fund’s accumulated net realized income and gain (loss) accounts on a tax basis.
197
Ohio National Fund, Inc.
| Notes to Financial Statements (Continued) | December 31, 2009 |
The tax characteristics of dividends paid to shareholders for the year ended December 31, 2009, were as follows:
| Net | Net | Total | ||||||||||||||
| Ordinary | Short-Term | Long-Term | Distribution | |||||||||||||
Portfolio | Income | Capital Gains | Capital Gains | Paid | ||||||||||||
| Equity | $ | 474,966 | $ | — | $ | — | $ | 474,966 | ||||||||
| Omni | 722,837 | — | — | 722,837 | ||||||||||||
| Capital Appreciation | 1,371,677 | — | — | 1,371,677 | ||||||||||||
S&P 500® Index | 2,047,655 | — | — | 2,047,655 | ||||||||||||
| Strategic Value | 553,534 | — | — | 553,534 | ||||||||||||
| Bristol | 753,303 | — | — | 753,303 | ||||||||||||
| U.S. Equity | 97,286 | — | — | 97,286 | ||||||||||||
| Balanced | 289,620 | — | — | 289,620 | ||||||||||||
| Target VIP | 253,696 | — | — | 253,696 | ||||||||||||
| Target Equity/Income | 416,144 | — | — | 416,144 | ||||||||||||
Cost basis for Federal income tax purposes may differ from the cost basis for financial reporting purposes. The table below details the unrealized appreciation (depreciation) and aggregate cost of securities at December 31, 2009 for Federal income tax purposes.
| Capital | ||||||||||||||||||||||||
| Equity | Bond | Omni | International | Appreciation | Millennium | |||||||||||||||||||
| Gross unrealized: | ||||||||||||||||||||||||
| Appreciation | $ | 50,990,759 | $ | 5,072,309 | $ | 3,854,235 | $ | 48,896,227 | $ | 17,671,533 | $ | 18,165,939 | ||||||||||||
| Depreciation | (52,719,675 | ) | (1,244,794 | ) | (1,738,257 | ) | (5,219,881 | ) | (8,917,245 | ) | (1,015,518 | ) | ||||||||||||
| Net unrealized appreciation (depreciation) | $ | (1,728,916 | ) | $ | 3,827,515 | $ | 2,115,978 | $ | 43,676,346 | $ | 8,754,288 | $ | 17,150,421 | |||||||||||
| Aggregate cost of securities: | $ | 226,312,543 | $ | 131,124,545 | $ | 39,204,427 | $ | 165,743,959 | $ | 118,746,825 | $ | 92,278,665 | ||||||||||||
| International | ||||||||||||||||||||||||
| Small-Mid Company | Aggressive Growth | Small Cap Growth | Mid Cap Opportunity | S&P 500® Index | Strategic Value | |||||||||||||||||||
| Gross unrealized: | ||||||||||||||||||||||||
| Appreciation | $ | 19,745,178 | $ | 4,882,077 | $ | 4,831,964 | $ | 3,736,006 | $ | 36,260,158 | $ | 1,355,397 | ||||||||||||
| Depreciation | (1,804,139 | ) | (1,793,254 | ) | (3,244,212 | ) | (328,254 | ) | (33,104,135 | ) | (1,100,516 | ) | ||||||||||||
| Net unrealized appreciation | $ | 17,941,039 | $ | 3,088,823 | $ | 1,587,752 | $ | 3,407,752 | $ | 3,156,023 | $ | 254,881 | ||||||||||||
| Aggregate cost of securities: | $ | 53,141,548 | $ | 24,207,703 | $ | 21,215,886 | $ | 60,393,872 | $ | 157,376,369 | $ | 19,452,331 | ||||||||||||
198
Ohio National Fund, Inc.
| Notes to Financial Statements (Continued) | December 31, 2009 |
| High Income Bond | Capital Growth | Nasdaq-100® Index | Bristol | Bryton Growth | U.S. Equity | |||||||||||||||||||
| Gross unrealized: | ||||||||||||||||||||||||
| Appreciation | $ | 10,945,374 | $ | 9,019,903 | $ | 12,708,747 | $ | 16,517,644 | $ | 20,299,781 | $ | 2,109,276 | ||||||||||||
| Depreciation | (8,703,597 | ) | (2,287,352 | ) | (4,705,370 | ) | (6,470,910 | ) | (5,379,573 | ) | (256,052 | ) | ||||||||||||
| Net unrealized appreciation | $ | 2,241,777 | $ | 6,732,551 | $ | 8,003,377 | $ | 10,046,734 | $ | 14,920,208 | $ | 1,853,224 | ||||||||||||
| Aggregate cost of securities: | $ | 155,709,563 | $ | 30,110,781 | $ | 40,078,650 | $ | 133,737,567 | $ | 98,753,014 | $ | 12,731,863 | ||||||||||||
| Balanced | Income Opportunity | Target VIP | Target Equity/Income | Bristol Growth | ||||||||||||||||||||
| Gross unrealized: | ||||||||||||||||||||||||
| Appreciation | $ | 1,474,498 | $ | 863,961 | $ | 2,881,980 | $ | 2,989,562 | $ | 1,171,019 | ||||||||||||||
| Depreciation | (275,197 | ) | (57,099 | ) | (1,487,328 | ) | (2,100,300 | ) | (299,460 | ) | ||||||||||||||
| Net unrealized appreciation | $ | 1,199,301 | $ | 806,862 | $ | 1,394,652 | $ | 889,262 | $ | 871,559 | ||||||||||||||
| Aggregate cost of securities: | $ | 12,327,987 | $ | 6,702,478 | $ | 19,183,415 | $ | 21,745,677 | $ | 9,551,806 | ||||||||||||||
199
Ohio National Fund, Inc.
Report of Independent Registered Public Accounting Firm
To the Shareholders and Board of Directors of
Ohio National Fund, Inc.:
We have audited the accompanying statements of assets and liabilities, including the schedules of investments, of Ohio National Fund, Inc., comprising the Equity Portfolio, Money Market Portfolio, Bond Portfolio, Omni Portfolio, International Portfolio, Capital Appreciation Portfolio, Millennium Portfolio, International Small-Mid Company Portfolio, Aggressive Growth Portfolio, Small Cap Growth Portfolio, Mid Cap Opportunity Portfolio, S&P 500 Index Portfolio, Strategic Value Portfolio, High Income Bond Portfolio, Capital Growth Portfolio, Nasdaq–100 Index Portfolio, Bristol Portfolio, Bryton Growth Portfolio, U.S. Equity Portfolio, Balanced Portfolio, Income Opportunity Portfolio, Target VIP Portfolio, Target Equity/Income Portfolio and Bristol Growth Portfolio (each a Portfolio and collectively, the Portfolios), as of December 31, 2009, and the related statements of operations for the year then ended, the statements of changes in net assets for each year in the two-year period then ended, and the financial highlights for each period in the five-year period then ended. These financial statements and financial highlights are the responsibility of the Portfolios’ management. Our responsibility is to express an opinion on these financial statements and financial highlights based on our audits.
We conducted our audits in accordance with the standards of the Public Company Accounting Oversight Board (United States). Those standards require that we plan and perform the audits to obtain reasonable assurance about whether the financial statements and financial highlights are free of material misstatement. An audit includes examining, on a test basis, evidence supporting the amounts and disclosures in the financial statements. Our procedures included confirmation of securities owned as of December 31, 2009, by correspondence with custodians and brokers. An audit also includes assessing the accounting principles used and significant estimates made by management, as well as evaluating the overall financial statement presentation. We believe that our audits provide a reasonable basis for our opinion.
In our opinion, the financial statements and financial highlights referred to above present fairly, in all material respects, the financial position of the Portfolios as of December 31, 2009, the results of their operations for the year then ended, the changes in their net assets for each year in the two-year period then ended, and the financial highlights for each period in the five-year period then ended, in conformity with U.S. generally accepted accounting principles.
KPMG LLP
Columbus, Ohio
February 18, 2010
200
Ohio National Fund, Inc.
| Additional Information | December 31, 2009 (Unaudited) |
| (1) | Review and Approval of Advisory and Subadvisory Agreements |
The Board of Directors, including a majority of the Directors who are not “interested persons” of the Fund (the “Independent Directors”), approved the continuation of the Investment Advisory Agreement with ONI (the “Adviser”) and, as applicable and except as noted below, the Sub-Advisory Agreement with the Sub-Adviser (each a “Sub-Adviser,” and together the “Sub-Advisers”) for each of the Portfolios identified below twice during the year ended December 31, 2009 — first at a meeting on August 20, 2009 (the “August Meeting”) and again at a meeting on November 19, 2009 (the “November Meeting”). The approvals at the November Meeting were undertaken to adjust the timing of the annual review process for the convenience of the Board and the Adviser. The Independent Directors were separately represented by independent legal counsel in connection with their consideration of the approvals of the continuation of these agreements at each meeting.
For purposes of the discussion below, the Directors considered the same data and sources of information and undertook the same review process, as described below, at each meeting, except that the Directors considered portfolio performance information for the periods ended July 31, 2009 at the August meeting and the periods ended October 31, 2009 at the November Meeting.
At each meeting the Directors noted that the Adviser is responsible for monitoring the investment performance and other responsibilities of the various Sub-Advisers that have day-to-day responsibility for the decisions made for certain of the Fund’s investment portfolios. They also noted that the Adviser reports to the Fund’s Board on its analysis of each Sub-Adviser’s performance at the regular meetings of the Board, which are held at least quarterly. Where warranted, the Adviser will add or remove a particular Sub-Adviser from a watchlist that it maintains. Watchlist criteria include, for example: (a) fund performance over various time periods; (b) the fund risk issues, such as changes in key personnel involved with fund management or changes in investment philosophy or process; and (c) organizational risk issues, such as regulatory, compliance or legal concerns, or changes in the ownership of the Sub-Adviser.
In considering the Investment Advisory and Sub-Advisory Agreements, the Board requested and reviewed a significant amount of information relating to each Portfolio, the Adviser and the Sub-Advisers, including the following: (1) performance data for each Portfolio for various time periods, including year-to-date through July 31, 2009 (October 31, 2009 for the November Meeting), (2) comparative performance, advisory fee and expense information for each Portfolio’s Morningstar Peer Group; (3) comparable performance information for each Portfolio’s relevant benchmark index or indices; (4) comparative data regarding advisory fees, including data regarding the fees charged by the Adviser and Sub-Advisers for managing other institutional funds and institutional accounts using investment strategies and techniques similar to those used in managing the Portfolios; (5) comparative data regarding the total expenses of each Portfolio; (6) profitability analyses for the Adviser with respect to each Portfolio; and (7) other information regarding the nature, extent and quality of services provided by the Adviser and the Sub-Advisers, as applicable. The Directors also took into account information on the services provided by the Adviser and each Sub-Adviser and performance, fee and expense information regarding each Portfolio provided to them periodically throughout the year. They also met with an independent consultant at each meeting to review the relative performance of each Portfolio, as compared with its benchmark(s) and peers, and in particular discussed those Portfolios that were on the watchlist.
The Independent Directors were assisted by experienced independent legal counsel throughout the contract review process. They discussed the proposed continuances in private session with such counsel at which no representatives of management, the Adviser or any Sub-Adviser were present. The Independent Directors relied upon the advice of independent legal counsel and their own business judgment in determining the material factors to be considered in evaluating each Advisory and Sub-Advisory Agreement and the weight to be given to each such factor. The conclusions reached by the Independent Directors were based on a comprehensive evaluation of all of the information provided and were not the result of any one factor. Moreover, each Independent Director may have afforded different weight to the various factors in reaching his conclusions with respect to each Advisory and Sub-Advisory Agreement.
Nature, Extent and Quality of Services
The Board evaluated the nature, extent and quality of the advisory services provided to the Portfolios by the Adviser. As part of its review, the Board reviewed information regarding the Adviser’s operations, procedures and personnel. The Directors took into account information they received during the previous year at Board meetings and other discussions and through periodic reports regarding the Adviser’s performance of its duties. The Directors considered the capabilities and resources that the Adviser has dedicated to performing services on behalf of the Fund and its Portfolios. The quality of administrative and other services, including the Adviser’s role in monitoring the performance of the Sub-Advisers, also was considered. The Directors also considered the quality of the compliance programs of the Adviser and its responsiveness to inquiries and requests from the Board.
For each Portfolio subject to a Sub-Advisory Agreement (all Portfolios other than the Money Market Portfolio, Bond Portfolio, S&P 500 Index Portfolio, Nasdaq-100 Index Portfolio and the fixed income portion of the Omni Portfolio), the Board considered similar criteria as applied to each Sub-Adviser, including the nature, extent and quality of the sub-advisory services provided by each Sub-Adviser. In addition to the criteria used to review the Adviser, the Directors reviewed biographical information on each Sub-Adviser’s portfolio management and other professional
(continued)
201
Ohio National Fund, Inc.
| Additional Information (Continued) | December 31, 2009 (Unaudited) |
staff, and each Sub-Adviser’s brokerage practices. The Directors also reviewed the performance record of each Portfolio or portion of a Portfolio managed by the applicable Sub-Adviser. The Board also considered the quality of each Sub-Adviser’s compliance program as it relates to the applicable Portfolio. It was the Directors’ conclusion that overall, they were satisfied with the nature, extent and quality of services provided to the Fund and each of the Portfolios.
Investment Performance
A representative of the Adviser reviewed with the Directors each Portfolio’s performance year-to-date and for the 1-, 3- and 5-year periods ended July 31, 2009 (October 31, 2009 for the November Meeting), as compared to the Portfolio’s Morningstar Peer Group and benchmark(s). The Board noted that on a quarterly basis it receives a report from an independent consultant with detailed information about each Portfolio’s performance results and investment strategies. The Board also receives a report from the consultant on those portfolios that the consultant has identified as underperforming. The Board also considered the Adviser’s effectiveness in monitoring the performance of each Sub-Adviser and the Adviser’s timeliness in responding to performance issues. A Portfolio-by-Portfolio discussion of each Portfolio’s performance and the Board’s conclusions regarding that performance is set forth below.
Fees and Expenses
The Board considered the advisory fee for each Portfolio, as well as the fee’s difference from the average advisory fee for the Portfolio’s Morningstar Peer Group and the fee’s percentile ranking within the peer group. The Board also considered the difference between each Portfolio’s overall expense ratio and that of its Morningstar Peer Group, as well as the expense ratio’s percentile ranking within the peer group.
Additionally, the Board considered certain adjusted statistics for Portfolios whose Morningstar Peer Group’s average advisory fee was likely to be skewed by the inclusion of index funds and funds of funds. The Board looked at the average assets for each fund in the respective peer group, excluding index funds and funds of funds (the “Adjusted Peer Group”) and then compared the advisory fee that would have been paid by the Portfolio if the Portfolio had had assets equal to the adjusted peer group’s average assets. The Board considered that comparison on an absolute and percentile ranking basis.
The Board also considered the fees paid to Sub-Advisers. With respect to the Portfolios sub-advised by Suffolk, an affiliate of the Adviser, the Board evaluated the reasonableness of the total fees received by the Adviser. With respect to those Portfolios sub-advised by a Sub-Adviser that is not affiliated with the Adviser, the Board relied to a degree on the Adviser’s negotiation of each Sub-Advisory Agreement on an arm’s-length basis, noting in particular that the Adviser had recently negotiated a decrease in the sub-advisory fee (and advisory fee) for certain Portfolios. Additionally, the Board considered the fees charged by the Adviser and Sub-Advisers to their separately managed accounts and other accounts other than the Portfolios and had no concerns with those rates relative to the fees charged to the Portfolio. The Directors also recognized that it is difficult to make comparisons of advisory fees because there are variations in the services that are included in the fees paid by other funds.
Profitability
The Board considered the advisory fee paid to the Adviser for each Portfolio and noted the pre-tax profit margins reported by the Adviser for each Portfolio. The Directors noted that the Adviser, and not the Portfolios, is responsible for paying sub-advisory fees to the Portfolio Sub-Advisers. The Directors took into account the fact that the Adviser is contractually obligated to reimburse each Portfolio certain of its expenses should they exceed a specified amount. Additionally, the Directors acknowledged that calculating the Adviser’s profitability related to a specific Portfolio can be challenging and imprecise because of the difficulties in appropriately allocating the Adviser’s expenses across the Portfolios.
The Board also considered the reasonableness of the sub-advisory fees paid by the Adviser to each Sub-Adviser. The Directors relied on the ability of the Adviser to negotiate the terms of each Sub-Advisory Agreement, including the sub-advisory fee, at arm’s-length, noting that the Adviser is not affiliated with any Portfolio Sub-Adviser other than Suffolk. Accordingly, the cost of services provided by each unaffiliated Sub-Adviser and the profitability to the Sub-Adviser of its relationship with the applicable Portfolio were not material factors in the Board’s deliberations. For similar reasons, the Board concluded that the potential realization of economies of scale by the Portfolios from the sub-advisory arrangements with the unaffiliated Sub-Advisers was not a material factor in the Board’s deliberations.
In considering the reasonableness of the sub-advisory fees payable by the Adviser to Suffolk, the Directors noted that the Adviser, not the Portfolios, is responsible for paying sub-advisory fees to Suffolk and therefore concluded that the profitability to Suffolk of its relationship to the applicable Portfolios was not a material factor in the Board’s deliberations. For similar reasons, the Board concluded that the potential realization of economies of scale by the applicable Portfolios from its sub-advisory arrangement with Suffolk was not a material factor in the Board’s deliberations.
(continued)
202
Ohio National Fund, Inc.
| Additional Information (Continued) | December 31, 2009 (Unaudited) |
Economies of Scale
The Directors noted that all of the advisory and sub-advisory fee schedules contain breakpoints that would reduce the applicable advisory or sub-advisory fees on assets above a specified level as the applicable Portfolio’s assets increase. The Directors also noted that a Portfolio would realize additional economies of scale if the Portfolio’s assets increase over time proportionately more than certain other expenses. The Directors took into account that many of the Portfolios had relatively few assets under management. After considering each Portfolio’s current size and potential for growth, the Board concluded that each Portfolio is likely to benefit from economies of scale as the Portfolio’s assets increase.
Portfolio-by-Portfolio Analysis
In addition to the foregoing, the Directors considered the specific factors and related conclusions set forth below with respect to each Portfolio’s performance and fees and expenses. Except as specifically indicated, the performance data described below for each Portfolio is for periods ended July 31, 2009 (“July Periods”) and October 31, 2009 (“October Periods”) and the advisory fee and expense data described below is through May 31, 2009 for a Portfolio’s Morningstar peer group and its Adjusted Peer Group.
Equity Portfolio (Adviser — ONI, Sub-Adviser — Legg Mason)
The Portfolio significantly outperformed its benchmark index and peer group average year-to-date for the July and October Periods and for the 1-year October Period, although it has underperformed for the 3- and 5-year July and October Periods. At the August Meeting, the Directors indicated that more time was necessary to determine whether the recent positive relative performance was indicative that the Portfolio had turned the corner, and agreed with the Adviser’s decision to keep the Portfolio on its watchlist. At the November meeting, the Adviser reported that it had removed the Portfolio from its watchlist due to the recent outstanding relative performance. The Directors agreed with the Adviser’s decision to remove the Portfolio from the watchlist, and noted the Adviser’s close monitoring of performance. At both meetings, the Directors noted that the Portfolio’s advisory fee is higher than the peer group average, but recognized that the Portfolio’s excellent performance for periods beyond five years was some justification for the fee. Based upon its review, the Board concluded that appropriate action was being taken to address performance and that the advisory and sub-advisory fees were reasonable.
Money Market Portfolio (Adviser — ONI)
The Portfolio underperformed its peer group average for the year-to-date and trailing 1-year July and October Periods. The Adviser reported that the Portfolio’s underperformance was expected because the portfolio manager had moved the Portfolio in a more conservative direction to protect its value. The Directors noted that the Adviser has agreed to waive 5 basis points of the advisory fee below the first fee breakpoint, that the Portfolio’s expense ratio is well below average relative to its peer group and that the Adviser has a low profit margin for the Portfolio. Overall, the Board concluded that the Portfolio’s performance was satisfactory and that the advisory fees were reasonable.
Bond Portfolio (Adviser — ONI)
Although the Portfolio underperformed its benchmark index for the 1-, 3- and 5-year July and October Periods and its peer group average for the 3- and 5-year July and October Periods, its recent performance has improved. It has outperformed its benchmark index and peer group average for the year-to-date July and October Periods and its peer group average for the 1-year October Period. The Board acknowledged that the widening of credit spreads at the end of 2008 had hurt the Portfolio’s performance, but the year-to-date market has been more favorable. The Directors noted that the Portfolio’s advisory fee would be 1 basis point below the Adjusted Peer Group’s average if its average net assets were the same as the peer group’s.
The Board considered the Advisor’s profitability for the Portfolio to be a reasonable amount. The Board credited the Portfolio’s stronger performance on the manager’s shift to investing in higher quality bonds and noted that the Portfolio’s relatively short average security duration had enabled the manager to take better advantage of increasing interest rates than many of the Portfolio’s peers. Overall, the Board concluded that the Portfolio’s performance was satisfactory and that the advisory fees were reasonable.
Omni Portfolio (Adviser — ONI, Sub-Adviser — Suffolk)
The Omni Portfolio significantly outperformed both its benchmark index and its peer group average for all July and October Periods. The Portfolio’s advisory fee was above its peer group average, but compared to the Adjusted Peer Group, the advisory fee was below the 50th percentile. Overall, the Board concluded that the Portfolio’s performance was satisfactory and that the advisory and sub-advisory fees were reasonable.
International Portfolio (Adviser — ONI, Sub-Adviser — Federated Global)
The International Portfolio underperformed its benchmark index for the July and October Periods and slightly underperformed its peer group average for the year-to-date October Period. The Board considered that the Portfolio has a new portfolio manager who started in January 2009,
(continued)
203
Ohio National Fund, Inc.
| Additional Information (Continued) | December 31, 2009 (Unaudited) |
and as a result, concluded that the Board should focus on performance under the new portfolio manager. The Board noted that the Portfolio’s country allocation is model-driven and that the Sub-Adviser has made recent changes to the model that have benefited the Portfolio’s recent performance. The Board also noted that the Portfolio’s advisory fee and expense ratio were below average. Overall, the Board concluded that the Portfolio’s performance was satisfactory and that the advisory and sub-advisory fees were reasonable.
Capital Appreciation Portfolio (Adviser — ONI, Sub-Adviser — Jennison)
The Portfolio significantly outperformed its benchmark index and peer group average for all July and October Periods. The Portfolio’s advisory fee was higher than the peer group average, but the Directors noted that compared to the Adjusted Peer Group, the advisory fee was only slightly above the average. They also noted that the Portfolio’s expense ratio was below average. Overall, the Board concluded that the Portfolio’s performance was satisfactory and that the advisory and sub-advisory fees were reasonable.
Millennium Portfolio (Adviser — ONI, Sub-Adviser — Neuberger Berman)
At the August meeting, the Adviser reported that the Portfolio’s performance has been poor historically and worse in the year-to-date period, as well as very volatile. The Portfolio’s performance was substantially below that of its benchmark index and peer group average year-to-date and for the 1-year period. The Board noted that the Portfolio has been on the Adviser’s watchlist due to recent ownership changes to the Sub-Adviser. The Adviser recommended that the Board approve the Sub-Advisory Agreement with a shorter, probationary duration. The Board considered the Adviser’s recommendation, noting the Adviser’s commitment to visit the Sub-Adviser in the near future, and, based upon its review, concluded that approval of the continuation of the Sub-Advisory Agreement for a six-month period was appropriate.
At the November meeting, the Adviser reported that the Portfolio’s performance continued to be poor relative to that of its benchmark index and peer group average. The Adviser reminded the Directors that at the August meeting they had approved the continuation of the Sub-Advisory Agreement for a 6-month period in order to communicate the Board’s concern about performance. After indicating that the Sub-Adviser was aware of the Board’s concerns, the Adviser recommended that the Sub-Advisory Agreement be renewed for an additional year, emphasizing that the Adviser would continue to monitor the Sub-Adviser’s performance closely. The Directors remarked that the advisory fee for the Portfolio is below average and that a change of the Sub-Adviser might require a higher fee. Based upon its review, the Board determined to follow the Adviser’s recommendation, noting that the Portfolio would remain on the watchlist for performance reasons. They concluded that appropriate action was being taken to address performance and that the advisory and sub-advisory fees were reasonable.
International Small-Mid Company Portfolio (Adviser — ONI, Sub-Adviser — Federated Global)
At the August meeting, the Board noted that the Portfolio had strong 3- and 5-year performance, but recently had been underperforming against its benchmark index and peer group average. At the November meeting, the Board noted that the Portfolio had slightly underperformed its benchmark index for the 3-year period and its peer group average for the 3- and 5-year periods. The Board also noted that its relative performance has been worse year-to-date and for the 1-year period. At both meetings, the Board considered that the Adviser is closely monitoring the Portfolio and that the Adviser noted that the small to mid cap market frequently is volatile. The Board noted that the Portfolio’s low allocation to emerging markets had hurt its performance year-to-date relative to its benchmark index and peer group, but that the Portfolio’s absolute returns were still significantly positive. The benchmarks for the Portfolio also vary widely. The Portfolio’s advisory fee and expense ratio were both below average relative to the peer group. Overall, the Board concluded that the Portfolio’s performance was satisfactory and that the advisory and sub-advisory fees were reasonable.
Aggressive Growth Portfolio (Adviser — ONI, Sub-Adviser — Janus)
The Portfolio substantially outperformed its benchmark index and peer group for all periods. The Portfolio’s advisory fee was above average compared to its peer group, but it is closer to the average when compared to the Adjusted Peer Group. The Portfolio’s overall expense ratio was slightly above the peer group average. Overall, the Board concluded that the Portfolio’s performance was satisfactory and that the advisory and sub-advisory fees were reasonable.
Small Cap Growth Portfolio (Adviser — ONI, Sub-Adviser — Janus)
The Portfolio has significantly outperformed its benchmark and peer group average for all July and October Periods. The Adviser indicated that the sub-advisory fee is higher than the peer group average and is the highest of the Fund’s four small cap strategy Portfolios. At the August meeting, the Adviser reported that it had requested, and the Sub-Adviser had agreed, to reduce its sub-advisory fee, which reduction would be passed through to the Portfolio shareholders by a similar reduction in the advisory fee. At the November meeting, the Adviser reminded the Directors of the reduction. At both meetings, the Board commended the Adviser for the reduction and, based on its review, concluded that the Portfolio’s performance was satisfactory and that the advisory and sub-advisory fees were reasonable.
(continued)
204
Ohio National Fund, Inc.
| Additional Information (Continued) | December 31, 2009 (Unaudited) |
Mid Cap Opportunity Portfolio (Adviser — ONI, Sub-Adviser (prior to December 18, 2009) — RS Investment Management Co. LLC)
At the August Meeting, the Adviser recommended that the Board select a new Sub-Adviser for the Portfolio because the Portfolio’s performance has been poor for several years and approved the continuation of the current Sub-Advisory Agreement until a new Sub-Adviser would be selected and approved by the Board. At the November Meeting, the Adviser noted that a new Sub-Adviser had been selected and approved by the Board earlier in the meeting. The Adviser also recommended that the Board approve the continuance of the current Sub-Advisory Agreement until the new Sub-Adviser begins managing the Portfolio, expected to be January 1, 2010. Based on its review of the information provided, the Directors agreed with the Adviser’s recommendation and determined to approve the continuation of the Sub-Advisory Agreement until the new Sub-Adviser begins managing the Portfolio.
S&P 500® Index Portfolio (Adviser — ONI)
While the Portfolio underperformed its benchmark year-to-date for the July and October Periods, the Board noted that its performance generally was in line with the S&P 500 Index when expenses were excluded. The Board did not rely on peer group comparison figures for the Portfolio because the Board considers peer groups for index funds to be generally irrelevant. The Board noted that the overall expense ratio is the statistic most important to index fund shareholders, and the Portfolio’s expense ratio is only slightly above average for the peer group. Overall, the Board concluded that the Portfolio’s performance was satisfactory and that the advisory fees were reasonable.
Strategic Value Portfolio (Adviser — ONI, Sub-Adviser — Federated Equity)
The Portfolio outperformed its benchmark index for all July and October Periods, but trailed its peer group average. The Board considered that the portfolio manager has been consistent with his dividend-based approach, which included a significant number of financial services investments. The Directors noted that the peer group is difficult to compile for this Portfolio and that they believed the benchmark index is a more appropriate comparison. The Directors also noted that the Portfolio’s advisory fee is close to the peer group average and that the expense ratio is close to the peer group average. Overall, the Board concluded that the Portfolio’s performance was satisfactory and that the advisory and sub-advisory fees were reasonable.
High Income Bond Portfolio (Adviser — ONI, Sub-Adviser — Federated Investment)
The Portfolio’s manager has been the manager for several years and has maintained a strong track record, with performance significantly higher than the peer group average for all July and October Periods. However, the Portfolio’s performance trailed its benchmark index for the year-to-date and trailing 1-, 3- and 5-year July and October Periods. The Adviser noted that the bond market has been very volatile, which makes comparing the Portfolio to a benchmark more difficult. The Directors indicated that they were less concerned about the underperformance relative to the benchmark. They noted that the advisory fee was slightly above the peer group average and that the Portfolio’s overall expense ratio was equal to the peer group average. Overall, the Board concluded that the Portfolio’s performance was satisfactory and that the advisory and sub-advisory fees were reasonable.
Capital Growth Portfolio (Adviser — ONI, Sub-Adviser — Eagle)
At the August meeting, the Adviser pointed out that the Portfolio had above-average performance for its 3- and 5-year periods, but had been underperforming its benchmark index for 2009. The Adviser indicated that the relative performance had improved in August and emphasized that the Directors should focus on the longer term performance. The Directors indicated that they were not significantly concerned about the recent underperformance. At the November meeting, the Directors noted that the Portfolio had above-average performance for its 1-, 3- and 5-year periods, and had been slightly outperforming its benchmark index and slightly underperforming its peer group average for 2009. The Directors noted at both meetings that although the advisory fee is above average for the peer group, the expenses are below average. Overall, the Board concluded that the Portfolio’s performance was satisfactory and that the advisory and sub-advisory fees were reasonable.
Nasdaq-100® Index Portfolio (Adviser — ONI)
While the Portfolio underperformed its benchmark year-to-date for the July and October Periods, the Board noted that its performance generally was in line with the Nasdaq-100 Index when expenses were excluded. The Board did not rely on peer group comparison figures for the Portfolio because the Board considers peer groups for index funds to be generally irrelevant. The Board noted that the overall expense ratio is the statistic most important to index fund shareholders, and the Portfolio’s expense ratio is significantly below average for the peer group. Overall, the Board concluded that the Portfolio’s performance was satisfactory and that the advisory fees were reasonable.
Bristol Portfolio (Adviser — ONI, Sub-Adviser — Suffolk)
The Portfolio significantly outperformed its benchmark and peer group average for year-to-date July and October Periods, and had good performance for the other trailing periods. The Directors noted that the Portfolio’s advisory fee is above average and that the Portfolio’s expense
(continued)
205
Ohio National Fund, Inc.
| Additional Information (Continued) | December 31, 2009 (Unaudited) |
ratio is also above average. Overall, the Board concluded that the Portfolio’s performance was satisfactory and that the advisory and sub-advisory fees were reasonable.
Bryton Growth Portfolio (Adviser — ONI, Sub-Adviser — Suffolk)
The Portfolio outperformed its benchmark index and peer group average year-to-date and for the 3- and 5-year July and October Periods, but underperformed for the trailing 1-year July and October Periods. The Board considered that the Portfolio’s advisory fee is close to the peer group average and the expense ratio is below the peer group average. Overall, the Board concluded that the Portfolio’s performance was satisfactory and that the advisory and sub-advisory fees were reasonable.
U.S. Equity Portfolio (Adviser — ONI, Sub-Adviser — ICON)
The Portfolio has significantly underperformed its benchmark index and peer group average for all July and October Periods. The Adviser noted that there had been some improvement in relative performance after the portfolio manager made changes to its model. The Adviser indicated that the Portfolio remains on its watchlist. The Board considered that the Adviser continues to monitor the Portfolio’s performance closely. Based upon its review, the Directors also noted that advisory fees and expenses were slightly above average. The Board concluded that appropriate action was being taken to address performance and that the advisory and sub-advisory fees were reasonable.
Balanced Portfolio (Adviser — ONI, Sub-Adviser — ICON)
The Portfolio significantly outperformed its benchmark index for the year-to-date July and October Periods and has good relative performance for the 3- and 5-year periods. The Directors noted that the Portfolio’s advisory fee is higher than average. At the August meeting, the Adviser reported that it had requested, and the Sub-Adviser had agreed, to reduce its sub-advisory fee, and that the reduction would be passed through to Portfolio shareholders by a similar reduction in the advisory fee. At the November meeting, the Adviser reminded the Directors of the reduction. At both meetings, the Board commended the Adviser for the reduction and, based on its review, concluded that the Portfolio’s performance was satisfactory and that the advisory and sub-advisory fees were reasonable.
Income Opportunity Portfolio (Adviser — ONI, Sub-Adviser — ICON)
While the Portfolio significantly underperformed its benchmark index and peer group average for the year-to-date July and October Periods and the 1-year October Period, the Adviser pointed out that it would expect the Portfolio to trail in rising markets and outperform in falling markets. The Board considered that the Portfolio’s strategy is to provide downside protection at the expense of upside returns and noted that the Portfolio had significantly outperformed its benchmark index for the periods when the market was generally down. The Board did not rely on peer group comparisons for the Portfolio because of the difficulty in finding comparable funds. While the Portfolio’s advisory fees and expenses were above average, the Adviser pointed out that the size of the Portfolio has resulted in higher expenses. Overall, the Board concluded that the Portfolio’s performance was satisfactory and that the advisory and sub- advisory fees were reasonable.
Target VIP Portfolio (Adviser — ONI, Sub-Adviser — First Trust)
The Portfolio has performed poorly year-to-date and for the 1- and 3-year July and October Periods. The Board considered that the Portfolio is based on a quantitative model that has fallen out of favor with the market. The Board noted that, because the Portfolio is not actively managed, its performance does not reflect poorly on the Adviser, but is a function of the effectiveness of the model. The Directors also noted that the advisory fees and expense ratio for the Portfolio were below average. Based upon its review, the Board concluded that the performance of the Portfolio was satisfactory and that the advisory and sub-advisory fees were reasonable.
Target Equity/Income Portfolio (Adviser — ONI, Sub-Adviser — First Trust)
The Portfolio has performed poorly year-to-date and for the 1- and 3-year July and October Periods. The Board considered that the Portfolio is based on a quantitative model that has fallen out of favor with the market. The Board noted that, because the Portfolio is not actively managed, its performance does not reflect poorly on the Adviser, but is a function of the effectiveness of the model. The Directors also noted that the advisory fees for the Portfolio were in the 56th percentile and the expense ratio was in the 50th percentile. Based upon its review, the Board concluded that the performance of the Portfolio was satisfactory and that the advisory and sub-advisory fees were reasonable.
Bristol Growth Portfolio (Adviser — ONI, Sub-Adviser — Suffolk)
The Portfolio significantly outperformed its benchmark and peer group average for the year-to-date July and October Periods and the 1-year October Period, and has performed well since inception. The Directors noted that the Portfolio’s advisory fee is above its peer group average and that its overall expense ratio is significantly above the peer group average, which the Board attributed largely to the Portfolio’s size. Overall, the Board concluded that the Portfolio’s performance was satisfactory and that the advisory and sub-advisory fees were reasonable.
(continued)
206
Ohio National Fund, Inc.
| Additional Information (Continued) | December 31, 2009 (Unaudited) |
After consideration of the foregoing, the Board reached the following conclusions regarding the Investment Advisory Agreement and, as applicable, the Sub-Advisory Agreement with respect to each Portfolio (except as noted above with respect to the Mid Cap Opportunity Portfolio), in addition to the conclusions set forth above: (a) ONI and the Sub-Adviser had demonstrated that they possessed the capability and resources to perform the duties required of them under the Investment Advisory Agreement and applicable Sub-Advisory Agreement, respectively; (b) the investment philosophy, strategies and techniques of ONI (with respect to the Portfolios without a Sub-Adviser) and the Sub-Adviser were appropriate for pursuing the applicable Portfolio’s investment objective; (c) ONI (with respect to the Portfolios without a Sub-Adviser) and the Sub-Adviser were likely to execute their investment philosophy, strategies and techniques consistently over time; and (d) ONI and the Sub-Adviser maintained appropriate compliance programs. Based on all of the above-mentioned factors and their related conclusions, with no single factor or conclusion being determinative and with each Director not necessarily attributing the same weight to each factor, the Directors unanimously concluded that approval of the continuation of the Investment Advisory Agreement and, as applicable, the Sub-Advisory Agreement was in the best interests of each Portfolio and its shareholders. Accordingly, the Board, including a majority of the Independent Directors, voted to approve the continuation of the Investment Advisory Agreement and, as applicable, the Sub-Advisory Agreement for each Portfolio.
Approval of New Sub-Adviser for Mid Cap Opportunity Portfolio.
At the November meeting, the Board of Directors met for the specific purpose of considering the approval of a sub-advisory agreement for the Mid Cap Opportunity Portfolio with a new Sub-Adviser. A representative of the Adviser reminded the Directors that at the August meeting they had asked the Adviser to make a recommendation of a successor Sub-Adviser for the Portfolio, and indicated that the Adviser was recommending that Goldman Sachs Asset Management L. P. (“GSAM”) be the replacement. He then referred the Directors to a spreadsheet comparing the composite returns through June 30, 2009 for a number of potential sub-advisers for the Portfolio, noting that GSAM’s composite returns and ranking as compared to the other potential sub-advisers made it the clear best choice to be the Sub-Adviser for the Portfolio. He pointed out that a copy of the proposed Sub-Advisory Agreement was included in the Board materials, noting that it reflected no changes in the fees payable to the Sub-Adviser.
A representative of the Adviser then introduced representatives of GSAM, who distributed background information regarding the firm and its investment team, as well as a description of its strategy for mid cap growth investing and information comparing the returns of its mid cap growth composite to the returns of the Russell Midcap Growth Index for the 1-year, 3-year, 5-year, 10-year and since inception (6/1/99) periods ended October 31, 2009. One of the representatives, a senior client portfolio manager for GSAM’s growth equity team, described the firm’s growth investment philosophy and strategy, its portfolio construction process and its approach to risk management. He then reviewed the firm’s composite performance as compared to the Russell Midcap Growth Index with the Directors. The Directors noted that the GSAM composite had outperformed the Index for all periods, ranging from 316 basis points in outperformance for the trailing 5-year period to 1,058 basis points for the year-to-date period ended October 31, 2009.
The Fund’s Chief Compliance Officer then reported that he had reviewed the compliance policies and procedures of GSAM as they would relate to the Portfolio and reported that, based on his review and certifications received from GSAM, he believes that the policies and procedures of GSAM are reasonably designed to prevent violations of the federal securities laws. He also reported that based on his review of GSAM’s Code of Ethics, he believes that GSAM has established a Code of Ethics containing provisions reasonably necessary to prevent its access persons from engaging in prohibited activities.
After discussion, the Directors indicated that they were very impressed by the performance and presentation of GSAM, noting in particular that GSAM’s composite performance relative to the Russell Midcap Growth Index and relative to other potential sub-advisers made it the obvious choice. They also noted that the new Sub-Advisory Agreement would be the same in all material respects as the existing Sub-Advisory Agreement and that the advisory and sub-advisory fees, including breakpoints, would remain the same. In unanimously determining to approve the proposed new Sub-Advisory Agreement, the Directors concluded that the terms of the Agreement were fair and reasonable and that approval was in the best interests of the Portfolio and its shareholders. They made the approval effective January 1, 2010, or such other day as may be mutually agreed upon by the Fund and GSAM.
| (2) | Expense Disclosure |
An individual may not buy or own shares of the Fund directly. An individual acquires an indirect interest in the Fund by purchasing a variable annuity contract or variable insurance policy and allocating premiums or purchase payments to Fund Portfolios available through the separate accounts of ONLIC, ONLAC, and NSLA. Separate accounts of these entities are the shareholders of the Fund.
(continued)
207
Ohio National Fund, Inc.
| Additional Information (Continued) | December 31, 2009 (Unaudited) |
As a shareholder of the Fund, a separate account incurs ongoing costs, including management fees and other Fund expenses. This example is intended to help a policy/contract owner understand ongoing costs (in dollars) associated with the underlying investment in the Fund’s Portfolios by the separate account shareholder and to compare these costs with the ongoing costs associated with investing in other mutual funds.
The example is based on an investment of $1,000 invested at July 1, 2009 and held through December 31, 2009.
Actual Expenses
The table below provides information about investment values and actual expenses associated with each Portfolio of the Fund. The information below, together with the amount of an underlying investment, can be used to estimate expenses paid over the period. An estimate can be obtained by simply dividing an underlying investment value by $1,000 (for example, an $8,600 investment value divided by $1,000 = 8.6), then multiplying the result by the number in the table under the heading entitled “Expenses Paid During Period”.
| Beginning | Ending | Expense Paid | Expense Ratio | |||||||||||||
| Investment | Investment | During | During Period (net) | |||||||||||||
| Value | Value | Period* | 7/1/09 – 12/31/09 | |||||||||||||
Portfolio | 7/1/09 | 12/31/09 | 7/1/09 – 12/31/09 | (Annualized) | ||||||||||||
| Equity | $ | 1,000.00 | $ | 1,235.56 | $ | 4.92 | 0.87 | % | ||||||||
| Money Market | 1,000.00 | 1,000.00 | 0.79 | 0.16 | % | |||||||||||
| Bond | 1,000.00 | 1,085.03 | 3.61 | 0.69 | % | |||||||||||
| Omni | 1,000.00 | 1,165.48 | 4.28 | 0.78 | % | |||||||||||
| International | 1,000.00 | 1,290.12 | 6.14 | 1.06 | % | |||||||||||
| Capital Appreciation | 1,000.00 | 1,227.57 | 5.01 | 0.89 | % | |||||||||||
| Millennium | 1,000.00 | 1,175.88 | 5.00 | 0.91 | % | |||||||||||
| International Small-Mid Company | 1,000.00 | 1,283.73 | 7.38 | 1.28 | % | |||||||||||
| Aggressive Growth | 1,000.00 | 1,212.07 | 5.85 | 1.05 | % | |||||||||||
| Small Cap Growth | 1,000.00 | 1,225.53 | 6.69 | 1.19 | % | |||||||||||
| Mid Cap Opportunity | 1,000.00 | 1,278.84 | 5.69 | 0.99 | % | |||||||||||
S&P 500® Index | 1,000.00 | 1,221.92 | 2.80 | 0.50 | % | |||||||||||
| Strategic Value | 1,000.00 | 1,196.28 | 5.61 | 1.01 | % | |||||||||||
| High Income Bond | 1,000.00 | 1,183.11 | 4.76 | 0.86 | % | |||||||||||
| Capital Growth | 1,000.00 | 1,247.85 | 6.01 | 1.06 | % | |||||||||||
Nasdaq-100® Index | 1,000.00 | 1,257.89 | 3.12 | 0.55 | % | |||||||||||
| Bristol | 1,000.00 | 1,200.71 | 4.87 | 0.88 | % | |||||||||||
| Bryton Growth | 1,000.00 | 1,180.15 | 5.24 | 0.95 | % | |||||||||||
| U.S. Equity | 1,000.00 | 1,219.72 | 5.76 | 1.03 | % | |||||||||||
| Balanced | 1,000.00 | 1,176.85 | 5.81 | 1.06 | % | |||||||||||
| Income Opportunity | 1,000.00 | 1,146.52 | 8.31 | 1.54 | % | |||||||||||
| Target VIP | 1,000.00 | 1,191.40 | 4.53 | 0.82 | % | |||||||||||
| Target Equity/Income | 1,000.00 | 1,239.31 | 4.49 | 0.80 | % | |||||||||||
| Bristol Growth | 1,000.00 | 1,220.36 | 6.85 | 1.22 | % | |||||||||||
Hypothetical Example for Comparison Purposes
The table below provides information about hypothetical investment values and hypothetical expenses based on each respective Portfolio’s actual expense ratio and an assumed rate of return of 5% per year before expenses, which is not an actual return. The hypothetical investment values and expenses may not be used to estimate the actual ending investment balance or expenses
(continued)
208
Ohio National Fund, Inc.
| Additional Information (Continued) | December 31, 2009 (Unaudited) |
actually paid for the period by the shareholders. A policy/contract holder may use this information to compare this 5% hypothetical example with the 5% hypothetical examples that appear in the shareholder reports of other funds.
| Beginning | Ending | Expense Paid | Expense Ratio | |||||||||||||
| Investment | Investment | During | During Period (net) | |||||||||||||
| Value | Value | Period* | 7/1/09 – 12/31/09 | |||||||||||||
Portfolio | 7/1/09 | 12/31/09 | 7/1/09 – 12/31/09 | (Annualized) | ||||||||||||
| Equity | $ | 1,000.00 | $ | 1,020.81 | $ | 4.44 | 0.87% | |||||||||
| Money Market | 1,000.00 | 1,024.41 | 0.80 | 0.16% | ||||||||||||
| Bond | 1,000.00 | 1,021.74 | 3.50 | 0.69% | ||||||||||||
| Omni | 1,000.00 | 1,021.25 | 4.00 | 0.78% | ||||||||||||
| International | 1,000.00 | 1,019.84 | 5.42 | 1.06% | ||||||||||||
| Capital Appreciation | 1,000.00 | 1,020.71 | 4.54 | 0.89% | ||||||||||||
| Millennium | 1,000.00 | 1,020.61 | 4.64 | 0.91% | ||||||||||||
| International Small-Mid Company | 1,000.00 | 1,018.74 | 6.53 | 1.28% | ||||||||||||
| Aggressive Growth | 1,000.00 | 1,019.91 | 5.34 | 1.05% | ||||||||||||
| Small Cap Growth | 1,000.00 | 1,019.19 | 6.07 | 1.19% | ||||||||||||
| Mid Cap Opportunity | 1,000.00 | 1,020.21 | 5.04 | 0.99% | ||||||||||||
S&P 500® Index | 1,000.00 | 1,022.69 | 2.55 | 0.50% | ||||||||||||
| Strategic Value | 1,000.00 | 1,020.09 | 5.16 | 1.01% | ||||||||||||
| High Income Bond | 1,000.00 | 1,020.85 | 4.41 | 0.86% | ||||||||||||
| Capital Growth | 1,000.00 | 1,019.86 | 5.40 | 1.06% | ||||||||||||
Nasdaq-100® Index | 1,000.00 | 1,022.45 | 2.79 | 0.55% | ||||||||||||
| Bristol | 1,000.00 | 1,020.78 | 4.47 | 0.88% | ||||||||||||
| Bryton Growth | 1,000.00 | 1,020.40 | 4.86 | 0.95% | ||||||||||||
| U.S. Equity | 1,000.00 | 1,020.02 | 5.24 | 1.03% | ||||||||||||
| Balanced | 1,000.00 | 1,019.87 | 5.39 | 1.06% | ||||||||||||
| Income Opportunity | 1,000.00 | 1,017.46 | 7.81 | 1.54% | ||||||||||||
| Target VIP | 1,000.00 | 1,021.07 | 4.17 | 0.82% | ||||||||||||
| Target Equity/Income | 1,000.00 | 1,021.19 | 4.06 | 0.80% | ||||||||||||
| Bristol Growth | 1,000.00 | 1,019.03 | 6.23 | 1.22% | ||||||||||||
| * | Expenses are equal to the average account value times the Fund’s annualized expense ratio multiplied by the number of days in the most recent fiscal half-year divided by the number of days in the fiscal year. Please note that the expenses shown in these tables are meant to highlight ongoing Fund costs only and do not reflect any contract-level expenses or Fund transactional costs, such as sales charges (loads), or exchange fees (if any). Therefore, these tables are useful in comparing ongoing fund costs only, and will not fully assist a policy/contract owner in determining the relative total expenses of different funds. In addition, if transactional costs were included, costs may be higher for these Portfolios as well as for a fund being compared. |
| (3) | Other Federal Tax Information |
For corporate shareholders, the percentages of the total ordinary income dividends paid in 2009, and ordinary income consent dividends that were incurred in the 2009 tax year, that qualify for the corporate dividends received deduction are as follows:
| Equity | 100.0% | Strategic Value | 90.3% | |||||||
| Money Market | 0.0% | High Income Bond | 0.21% | |||||||
| Bond | 0.0% | Capital Growth | 100.0% | |||||||
| Omni | 47.1% | Nasdaq-100® Index | 100.0% | |||||||
| International | 0.0% | Bristol | 100.0% | |||||||
| Capital Appreciation | 100.0% | Bryton Growth | 0.0% | |||||||
| Millennium | 0.0% | U.S. Equity | 39.4% | |||||||
| International Small-Mid Company | 0.0% | Balanced | 47.7% | |||||||
| Aggressive Growth | 0.0% | Income Opportunity | 100.0% | |||||||
| Small Cap Growth | 0.0% | Target VIP | 100.0% | |||||||
| Mid Cap Opportunity | 0.0% | Target Equity/Income | 100.0% | |||||||
S&P 500® Index | 100.0% | Bristol Growth | 0.0% |
(continued)
209
Ohio National Fund, Inc.
| Additional Information (Continued) | December 31, 2009 (Unaudited) |
Pursuant to Section 853 of the Internal Revenue Code, the Fund designates the following amounts as foreign taxes paid for the year ended December 31, 2009:
| Portion of Ordinary | ||||||||||||
| Creditable Foreign | Per Share | Income Distribution Derived | ||||||||||
| Taxes Paid | Amount | from Foreign Sourced Income | ||||||||||
| International | $ | 641,335 | 0.0319 | 100.00% | ||||||||
| International Small-Mid Company | $ | 111,447 | 0.0304 | 100.00% | ||||||||
Foreign taxes paid for purposes of Section 853 may be less than actual foreign taxes paid for financial statement purposes. None of the Portfolios listed above derived any income from ineligible foreign sources, as defined under Section 901(j) of the Internal Revenue Code.
210
Ohio National Fund, Inc.
| Information about Directors and Officers | December 31, 2009 (Unaudited) |
| Term served | Number of | |||||||||
| as Officer | Portfolios in | Principal Occupation and Other | ||||||||
Name and Address | Age | Position with the Fund | or Director | Fund Complex* | Directorships During Past Five Years | |||||
| Independent Directors | ||||||||||
| James E. Bushman 100 W. Rivercenter Boulevard, 2C Covington, Kentucky | 65 | Director, Chairman of Audit Committee and Member of Independent Directors Committee | Since March 2000 | 32 | Director, Chairman and CEO: Cast-Fab Technologies, Inc. (a manufacturing company); Director: The Midland Company (1998-2008), Air Transport Services Group, Inc., The Littleford Group, Inc., Hilltop Basic Resources, Inc., The Elizabeth Gamble Deaconess Home Association, The Christ Hospital and The University of Cincinnati Foundation. | |||||
| L. Ross Love 2121 Alpine Place Cincinnati, Ohio | 63 | Director, Member of Audit and Independent Directors Committee | Since March 1997 | 32 | Director, President and CEO: Blue Chip Enterprises LLC (a company with holdings in the communications and medical equipment industries.); Director: The VQ Company; Trustee: Syracuse University, Greater Cincinnati Chamber of Commerce. | |||||
| George M. Vredeveld University of Cincinnati Economics Center for Education & Research 90 West Daniels Cincinnati, Ohio | 67 | Lead Independent Director, Member of Audit and Independent Directors Committee | Since March 1996 | 32 | Alpaugh Professor of Economics: University of Cincinnati; President: Economics Center for Education & Research. | |||||
| John I. Von Lehman 10 Creek Side Drive Cincinnati, Ohio | 57 | Director, Member of Audit and Independent Directors Committee | Since August 2007 | 32 | Former Executive Vice President, CFO, Secretary, and Director: The Midland Company (1988-2007); Director and Audit Committee Member: American Financial Group, Inc.; Director: Life Enriching Communities; Audit Committee Member: Health Alliance of Cincinnati, Red Cross Cincinnati Chapter; Investment Committee: Xavier University Foundation. | |||||
| Interested Director and Officers | ||||||||||
| John J. Palmer One Financial Way Cincinnati, Ohio | 70 | President, Chairman of the Board and Director | Since July 1997 | 32 | Director and Vice Chairman: ONLIC; President, CEO and Director: NSLA; Director: ONI and various other Ohio National-affiliated companies; Director: Cincinnati Symphony Orchestra; Trustee: Cincinnati Opera. | |||||
| Thomas A. Barefield One Financial Way Cincinnnati, Ohio | 56 | Vice President | Since February 1998 | 32 | Executive Vice President and Chief Marketing Officer — Institutional Sales: ONLIC; Director and Vice President — Marketing: NSLA; Director: ONI; Senior Vice President: Ohio National Equities, Inc.; Recent graduate of class XXIX of Leadership Cincinnati. | |||||
| Christopher A. Carlson One Financial Way Cincinnnati, Ohio | 50 | Vice President | Since March 2000 | 32 | Senior Vice President and Chief Investment Officer: ONLIC; President and Director: ONI; Chief Investment Officer: NSLA; Officer and Director of various other Ohio National-affiliated companies. | |||||
| Dennis R. Taney One Financial Way Cincinnnati, Ohio | 62 | Chief Compliance Officer | Since August 2004 | 32 | Second Vice President: ONLIC, Chief Compliance Officer: ONLIC, ONI, NSLA, and other Ohio National-affiliated companies. | |||||
| R. Todd Brockman One Financial Way Cincinnati, Ohio | 41 | Treasurer | Since August 2004 | 32 | Second Vice President, Mutual Fund Operations: ONLIC and NSLA; Treasurer: ONI. | |||||
(continued)
211
Ohio National Fund, Inc.
| Information about Directors and Officers (Continued) | December 31, 2009 (Unaudited) |
| Term served | Number of | |||||||||
| as Officer | Portfolios in | Principal Occupation and Other | ||||||||
Name and Address | Age | Position with the Fund | or Director | Fund Complex* | Directorships During Past Five Years | |||||
| Kimberly A. Plante One Financial Way Cincinnnati, Ohio | 35 | Secretary | Since March 2005 | 32 | Prior to August 2007 was Assistant Secretary, Associate Counsel: ONLIC; Secretary: ONI; Officer of various other Ohio National-affiliated companies. | |||||
| Catherine E. Gehr One Financial Way Cincinnnati, Ohio | 37 | Assistant Treasurer | Since March 2005 | 32 | Manager, Mutual Fund Operations: ONLIC; Assistant Treasurer: ONI. | |||||
| Katherine L. Carter One Financial Way Cincinnnati, Ohio | 30 | Assistant Secretary | Since August 2007 | 32 | Assistant Counsel: ONLIC; Prior to July 2007 was Compliance Officer with Fifth Third Securities, Inc. |
| * | The Fund Complex is defined as Ohio National Fund, Inc. and The Dow® Target Variable Fund LLC. |
212
[THIS PAGE INTENTIONALLY LEFT BLANK]
213
[THIS PAGE INTENTIONALLY LEFT BLANK]
214

Item 2. Code Of Ethics.
| As of the end of the period covered by this report, Ohio National Fund, Inc. (the “Fund”) has adopted a code of ethics that applies to the Fund’s principal executive officer and principal financial officer. There were no substantive amendments or waivers to the Code of Ethics during the period covered by this report. |
| A copy of this Code of Ethics is filed as Exhibit EX-99.CODE to this Form N-CSR and is also available, without charge, upon request, by calling 877-781-6392 toll free. |
Item 3. Audit Committee Financial Expert.
| The Fund’s Board of Directors has determined that the Fund has an audit committee financial expert serving on its Audit Committee. The Audit Committee financial expert is Mr. James E. Bushman. Mr. Bushman is independent for purposes of Item 3 of Form N-CSR. |
Item 4. Principal Accountant Fees And Services.
| The aggregate fees for each of the last two fiscal years for professional services rendered by the principal accountant for the audit of the Fund’s annual financial statements or services that are normally provided by the accountant in connection with statutory and regulatory filings or engagements for those fiscal years are listed below. |
| (a) | Audit Fees. |
| Fiscal year ended December 31, 2009: $276,000 |
| Fiscal year ended December 31, 2008: $275,800 |
| (b) | Audit-Related Fees. | ||
| Professional services rendered in connection with the consent on the Fund’s N1A filing. | |||
| Fiscal year ended December 31, 2009: $4,600 | |||
| Fiscal year ended December 31, 2008: $4,600 | |||
| (c) | Tax Fees. None. | ||
| (d) | All Other Fees. None. | ||
| (e) | (1) Audit Committee Pre-Approval Policies and Procedures: | ||
| The Fund’s Audit Committee has adopted an Audit Committee Charter that requires that the Audit Committee oversee the quality and appropriateness of the accounting methods used in the preparation of the Fund’s financial statements, and the independent audit thereof; approve the selection and compensation of the independent auditors; and pre-approve the performance, by the independent auditors, of non-audit services for the Fund, its investment adviser, or any affiliated entity controlling, controlled by or under common control with the investment adviser that provides ongoing services to the Fund. | |||
| (e) | (2) Services Approved Pursuant to Paragraph (c)(7)(i)(C) of Rule 2-01 of Regulation S-X: | ||
| During the fiscal years ended December 31, 2009 and 2008, there were no non-audit services provided by the Fund’s principal accountant that would have required pre-approval by the Fund’s Audit Committee. The audit related fees aforementioned were pre-approved by the Fund’s Audit Committee, although not required by paragraph (c) (7) (ii) of Regulation S-X as the audit-related fees were less than five percent of the total amount of revenues paid to the Fund’s principal accountant. | |||
| (f) | Not applicable. | ||
| (g) | There were no non-audit services provided by the Fund’s principal accountant, other than items disclosed in item (b) above, in which a fee was billed to the Fund, the Fund’s adviser, and any entity controlling, controlled |
| by, or under common control with the adviser that provides ongoing services to the registrant for the last two fiscal years. | |||
| (h) | Not applicable, as there were no non-audit services performed by the Fund’s principal accountant that were rendered to the Fund, the Fund’s adviser, or any entity controlling, controlled by, or under common control with the adviser that provided ongoing services to the registrant that were not pre-approved for the last two fiscal years. |
Item 5. Audit Committee Of Listed Registrants.
| Not applicable. |
Item 6. Schedule of Investments.
| Not applicable. |
Item 7. Disclosure Of Proxy Voting Policies And Procedures For Closed-End Management Investment Companies.
| Not Applicable. |
Item 8. Portfolio Managers of Closed-End Management Investment Companies.
| Not Applicable. |
Item 9. Purchases of Equity Securities by Closed-End Management Investment Company and Affiliated Purchasers.
| Not Applicable. |
Item 10. Submission of Matters to a Vote of Security Holders.
| There were no material changes to the procedures by which shareholders may recommend nominees to the Fund’s Board of Directors. |
Item 11. Controls and Procedures.
| (a) | The Fund’s principal executive officer and principal financial officer have concluded, based on their evaluation conducted as of a date within 90 days of the filing of this report, that the Fund’s disclosure controls and procedures are adequately designed and are operating effectively to ensure (i) that material information relating to the Fund, including its consolidated subsidiaries, is made known to them by others within those entities, particularly during the period in which this report is being prepared; and (ii) that information required to be disclosed by the Fund on Form N-CSR is recorded, processed, summarized and reported within the time periods specified in the Securities and Exchange Commission’s rules and forms. | ||
| (b) | There were no changes in the Fund’s internal control over financial reporting that occurred during the second fiscal quarter of the period covered by this report that have materially affected, or are reasonably likely to materially affect, the Fund’s internal control over financial reporting. |
Item 12. Exhibits.
| (a)(1) | The Fund’s Code of Ethics pursuant to Item 2 of Form N-CSR is filed and attached hereto as EX-99.CODE. | ||
| (a)(2) | A separate certification for each principal executive officer and principal financial officer of the Fund as required by Rule 30a-2(a) under the Investment Company Act of 1940 (17 CFR 270.30a-2(a)) is attached hereto as EX-99.CERT. | ||
| The certifications required by Section 906 of the Sarbanes-Oxley Act of 2002 are attached hereto as EX-99.906CERT. |
SIGNATURES
Pursuant to the requirements of the Securities Exchange Act of 1934 and the Investment Company Act of 1940, the registrant has duly caused this report to be signed on its behalf by the undersigned, thereunto duly authorized.
| Ohio National Fund, Inc. | ||||
| By: | /s/ John J. Palmer | |||
| President and Director | ||||
| March 8, 2010 | ||||
Pursuant to the requirements of the Securities Exchange Act of 1934 and the Investment Company Act of 1940, this report has been signed below by the following persons on behalf of the registrant and in the capacities and on the dates indicated.
| Ohio National Fund, Inc. | ||||
| By: | /s/ John J. Palmer | |||
| President and Director | ||||
| March 8, 2010 | ||||
| By: | /s/ R. Todd Brockman | |||
| R. Todd Brockman | ||||
| Treasurer | ||||
| March 8, 2010 | ||||